Zip Codes with the Highest Percentage of Households Heated by Bottled Gas / Liquid Propane in El Paso, TX
RELATED REPORTS & OPTIONS
Bottled Gas / LP Heating
El Paso
Compare Zip Codes
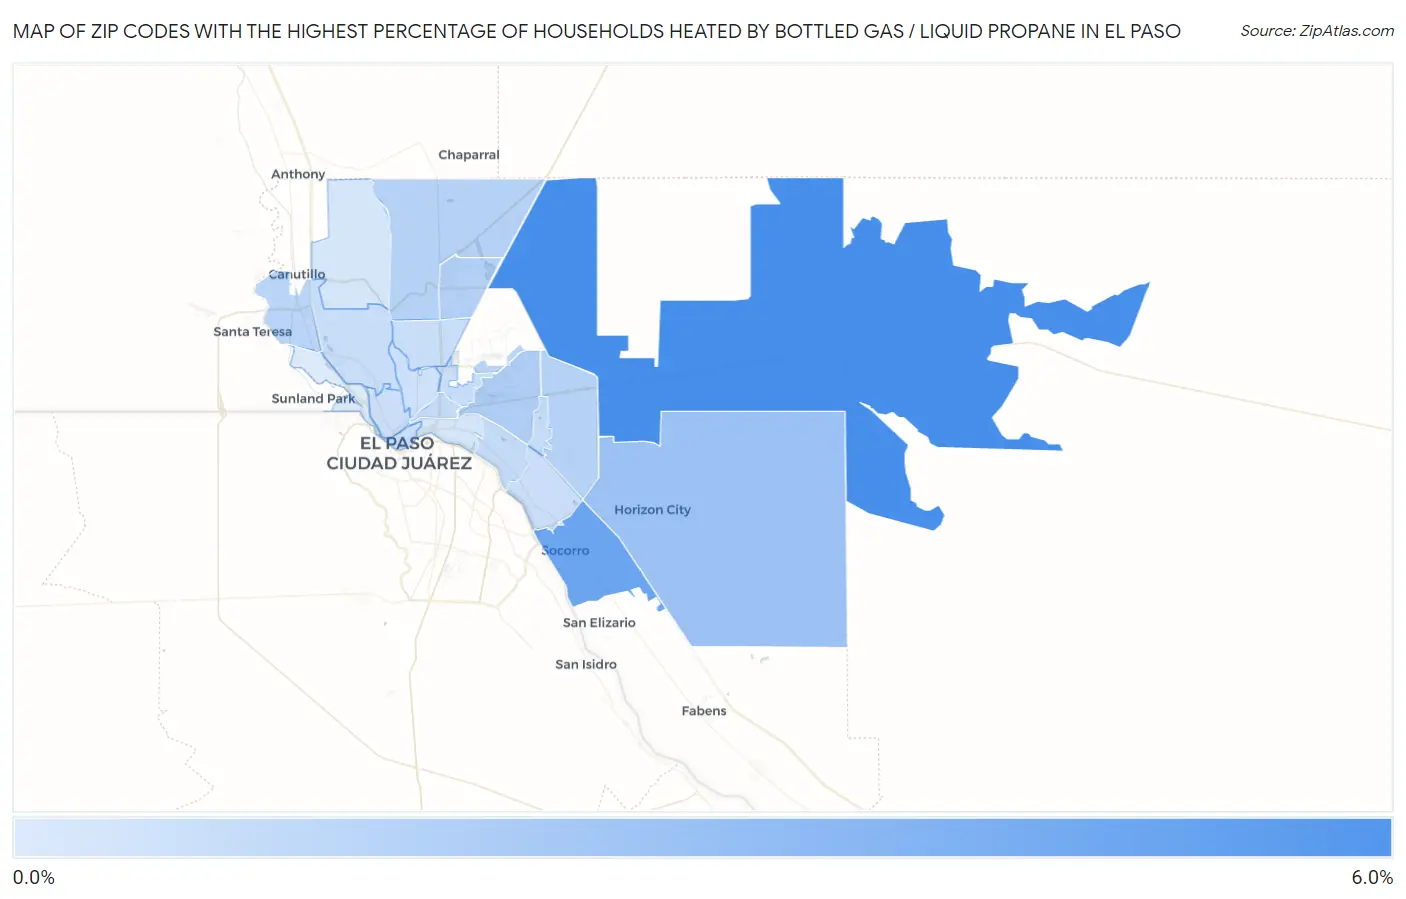
Map of Zip Codes with the Highest Percentage of Households Heated by Bottled Gas / Liquid Propane in El Paso
0.0%
6.0%
Zip Codes with the Highest Percentage of Households Heated by Bottled Gas / Liquid Propane in El Paso, TX
| Zip Code | Bottled Gas / LP Heating | vs State | vs National | |
| 1. | 79938 | 5.5% | 2.9%(+2.60)#801 | 4.9%(+0.600)#18,009 |
| 2. | 79927 | 4.2% | 2.9%(+1.30)#927 | 4.9%(-0.700)#19,401 |
| 3. | 79928 | 2.6% | 2.9%(-0.300)#1,068 | 4.9%(-2.30)#21,678 |
| 4. | 79925 | 1.9% | 2.9%(-1.000)#1,169 | 4.9%(-3.00)#23,416 |
| 5. | 79924 | 1.7% | 2.9%(-1.20)#1,192 | 4.9%(-3.20)#23,938 |
| 6. | 79936 | 1.6% | 2.9%(-1.30)#1,205 | 4.9%(-3.30)#24,240 |
| 7. | 79934 | 1.6% | 2.9%(-1.30)#1,218 | 4.9%(-3.30)#24,404 |
| 8. | 79932 | 1.5% | 2.9%(-1.40)#1,242 | 4.9%(-3.40)#24,739 |
| 9. | 79908 | 1.5% | 2.9%(-1.40)#1,249 | 4.9%(-3.40)#24,903 |
| 10. | 79915 | 1.2% | 2.9%(-1.70)#1,308 | 4.9%(-3.70)#25,816 |
| 11. | 79903 | 1.2% | 2.9%(-1.70)#1,321 | 4.9%(-3.70)#25,992 |
| 12. | 79935 | 1.1% | 2.9%(-1.80)#1,350 | 4.9%(-3.80)#26,333 |
| 13. | 79912 | 1.0% | 2.9%(-1.90)#1,365 | 4.9%(-3.90)#26,512 |
| 14. | 79904 | 1.0% | 2.9%(-1.90)#1,376 | 4.9%(-3.90)#26,643 |
| 15. | 79906 | 1.0% | 2.9%(-1.90)#1,389 | 4.9%(-3.90)#26,862 |
| 16. | 79907 | 0.90% | 2.9%(-2.00)#1,403 | 4.9%(-4.00)#26,971 |
| 17. | 79902 | 0.90% | 2.9%(-2.00)#1,429 | 4.9%(-4.00)#27,183 |
| 18. | 79901 | 0.90% | 2.9%(-2.00)#1,430 | 4.9%(-4.00)#27,268 |
| 19. | 79930 | 0.80% | 2.9%(-2.10)#1,452 | 4.9%(-4.10)#27,520 |
| 20. | 79905 | 0.60% | 2.9%(-2.30)#1,532 | 4.9%(-4.30)#28,302 |
| 21. | 79911 | 0.50% | 2.9%(-2.40)#1,586 | 4.9%(-4.40)#28,731 |
| 22. | 79922 | 0.30% | 2.9%(-2.60)#1,661 | 4.9%(-4.60)#29,284 |
1
Common Questions
What are the Top 10 Zip Codes with the Highest Percentage of Households Heated by Bottled Gas / Liquid Propane in El Paso, TX?
Top 10 Zip Codes with the Highest Percentage of Households Heated by Bottled Gas / Liquid Propane in El Paso, TX are:
What zip code has the Highest Percentage of Households Heated by Bottled Gas / Liquid Propane in El Paso, TX?
79938 has the Highest Percentage of Households Heated by Bottled Gas / Liquid Propane in El Paso, TX with 5.5%.
What is the Percentage of Households Heated by Bottled Gas / Liquid Propane in El Paso, TX?
Percentage of Households Heated by Bottled Gas / Liquid Propane in El Paso is 1.3%.
What is the Percentage of Households Heated by Bottled Gas / Liquid Propane in Texas?
Percentage of Households Heated by Bottled Gas / Liquid Propane in Texas is 2.9%.
What is the Percentage of Households Heated by Bottled Gas / Liquid Propane in the United States?
Percentage of Households Heated by Bottled Gas / Liquid Propane in the United States is 4.9%.