Zip Codes with the Highest Percentage of Population Employed in Mining, Quarrying, & Extraction in Brownsville, TX
RELATED REPORTS & OPTIONS
Mining, Quarrying, & Extraction
Brownsville
Compare Zip Codes
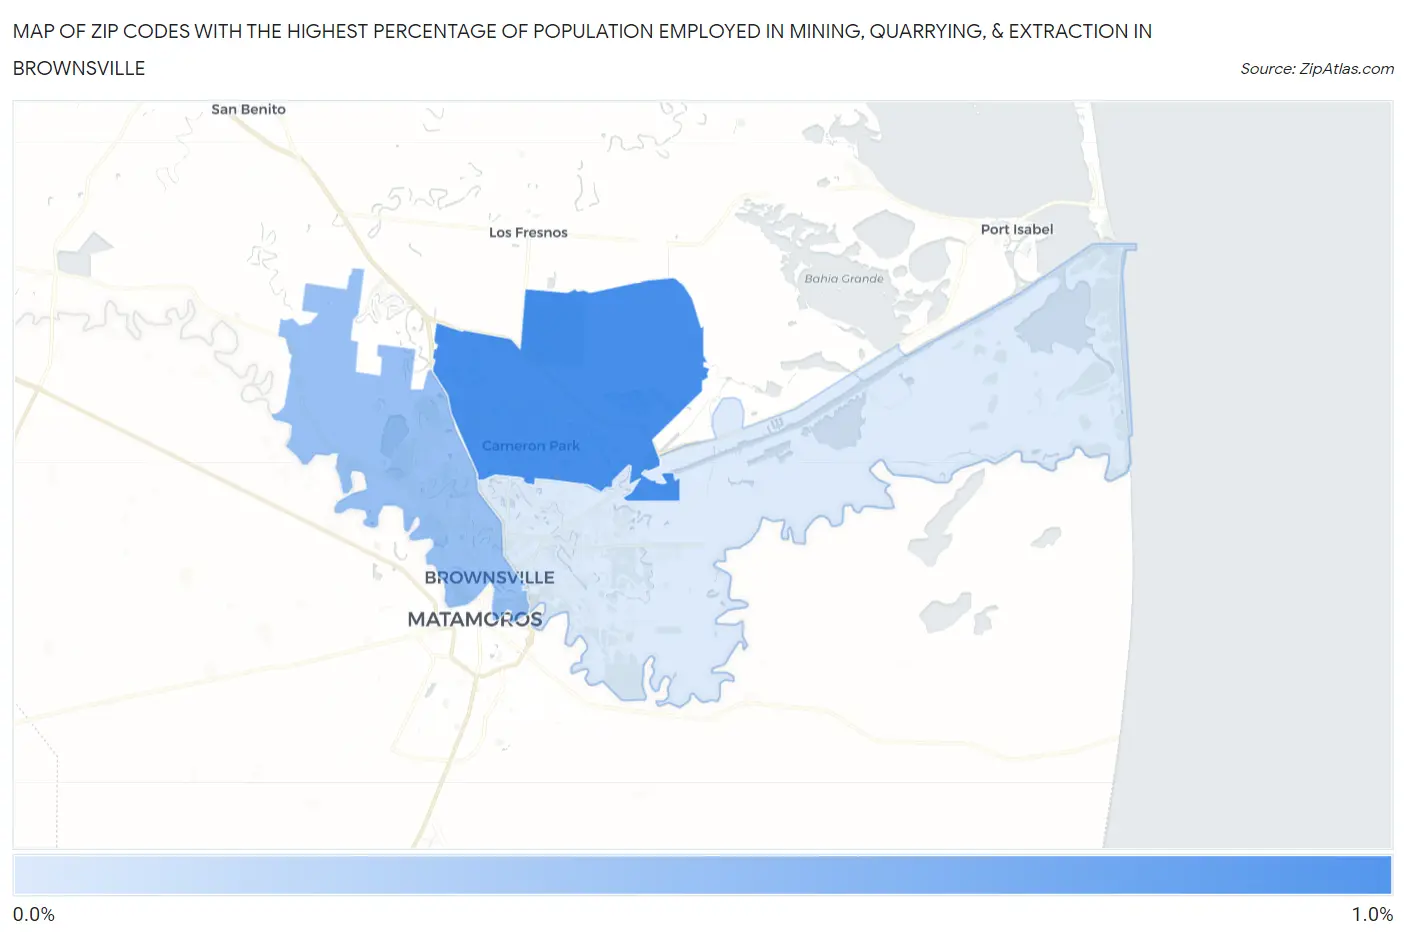
Map of Zip Codes with the Highest Percentage of Population Employed in Mining, Quarrying, & Extraction in Brownsville
0.0%
1.0%
Zip Codes with the Highest Percentage of Population Employed in Mining, Quarrying, & Extraction in Brownsville, TX
| Zip Code | % Employed | vs State | vs National | |
| 1. | 78526 | 0.85% | 1.9%(-1.01)#1,013 | 0.44%(+0.407)#5,823 |
| 2. | 78520 | 0.49% | 1.9%(-1.36)#1,214 | 0.44%(+0.053)#7,226 |
| 3. | 78521 | 0.18% | 1.9%(-1.67)#1,418 | 0.44%(-0.256)#9,689 |
1
Common Questions
What are the Top Zip Codes with the Highest Percentage of Population Employed in Mining, Quarrying, & Extraction in Brownsville, TX?
Top Zip Codes with the Highest Percentage of Population Employed in Mining, Quarrying, & Extraction in Brownsville, TX are:
What zip code has the Highest Percentage of Population Employed in Mining, Quarrying, & Extraction in Brownsville, TX?
78526 has the Highest Percentage of Population Employed in Mining, Quarrying, & Extraction in Brownsville, TX with 0.85%.
What is the Percentage of Population Employed in Mining, Quarrying, & Extraction in Brownsville, TX?
Percentage of Population Employed in Mining, Quarrying, & Extraction in Brownsville is 0.51%.
What is the Percentage of Population Employed in Mining, Quarrying, & Extraction in Texas?
Percentage of Population Employed in Mining, Quarrying, & Extraction in Texas is 1.9%.
What is the Percentage of Population Employed in Mining, Quarrying, & Extraction in the United States?
Percentage of Population Employed in Mining, Quarrying, & Extraction in the United States is 0.44%.