Zip Codes with the Highest Percentage of Population Employed in Mining, Quarrying, & Extraction in Garland, TX
RELATED REPORTS & OPTIONS
Mining, Quarrying, & Extraction
Garland
Compare Zip Codes
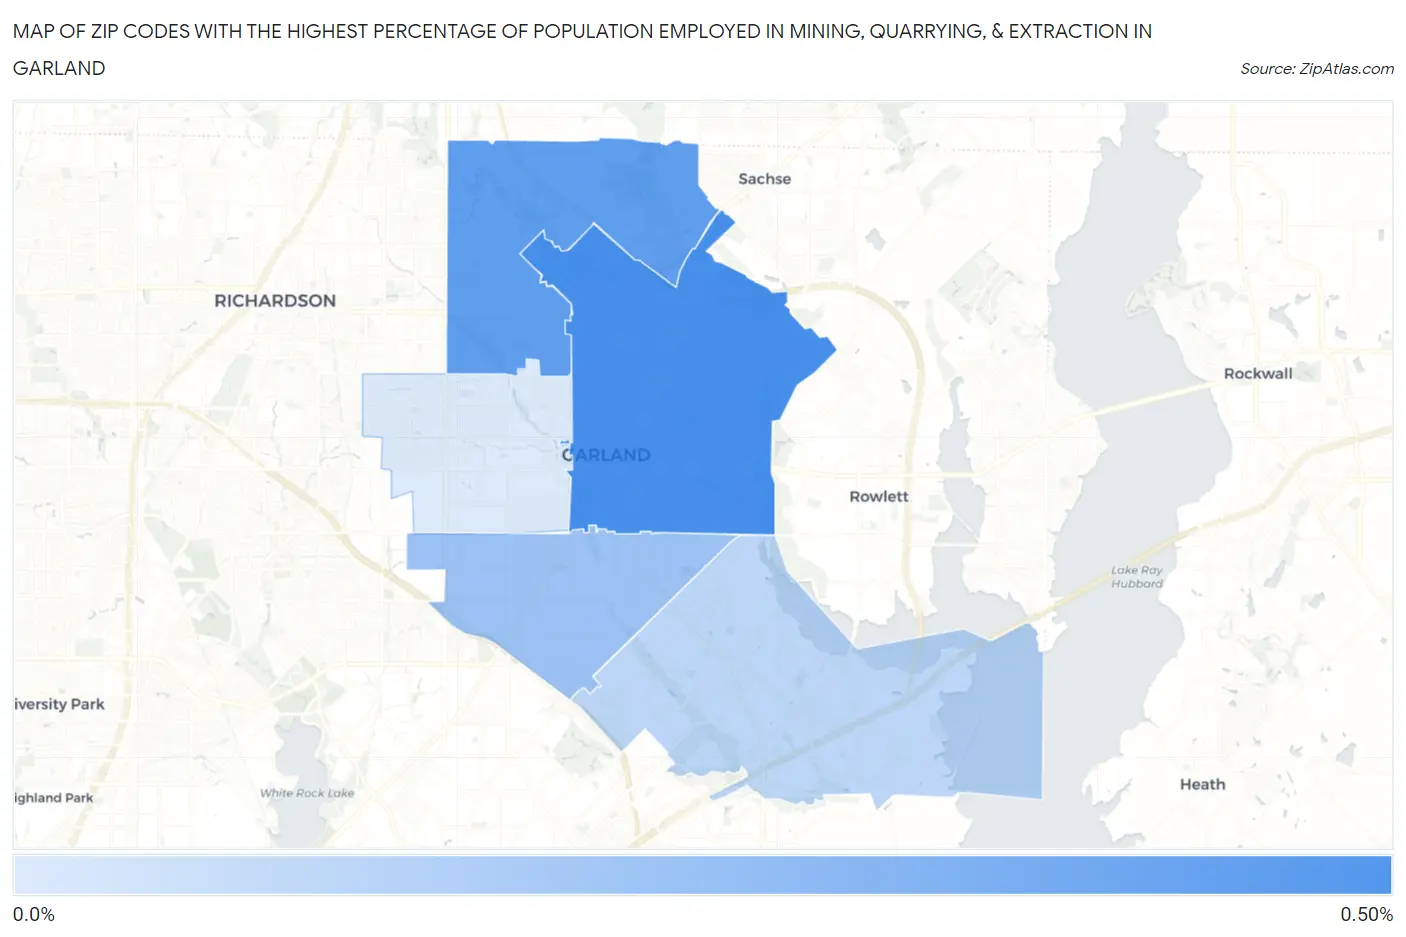
Map of Zip Codes with the Highest Percentage of Population Employed in Mining, Quarrying, & Extraction in Garland
0.0%
0.50%
Zip Codes with the Highest Percentage of Population Employed in Mining, Quarrying, & Extraction in Garland, TX
| Zip Code | % Employed | vs State | vs National | |
| 1. | 75040 | 0.46% | 1.9%(-1.40)#1,237 | 0.44%(+0.018)#7,426 |
| 2. | 75044 | 0.39% | 1.9%(-1.47)#1,284 | 0.44%(-0.055)#7,871 |
| 3. | 75041 | 0.22% | 1.9%(-1.63)#1,396 | 0.44%(-0.220)#9,282 |
| 4. | 75043 | 0.13% | 1.9%(-1.72)#1,440 | 0.44%(-0.310)#10,369 |
| 5. | 75042 | 0.038% | 1.9%(-1.82)#1,473 | 0.44%(-0.402)#11,842 |
1
Common Questions
What are the Top 3 Zip Codes with the Highest Percentage of Population Employed in Mining, Quarrying, & Extraction in Garland, TX?
Top 3 Zip Codes with the Highest Percentage of Population Employed in Mining, Quarrying, & Extraction in Garland, TX are:
What zip code has the Highest Percentage of Population Employed in Mining, Quarrying, & Extraction in Garland, TX?
75040 has the Highest Percentage of Population Employed in Mining, Quarrying, & Extraction in Garland, TX with 0.46%.
What is the Percentage of Population Employed in Mining, Quarrying, & Extraction in Garland, TX?
Percentage of Population Employed in Mining, Quarrying, & Extraction in Garland is 0.26%.
What is the Percentage of Population Employed in Mining, Quarrying, & Extraction in Texas?
Percentage of Population Employed in Mining, Quarrying, & Extraction in Texas is 1.9%.
What is the Percentage of Population Employed in Mining, Quarrying, & Extraction in the United States?
Percentage of Population Employed in Mining, Quarrying, & Extraction in the United States is 0.44%.