Zip Codes with the Highest Percentage of Population Employed in Security & Protection in Edinburg, TX
RELATED REPORTS & OPTIONS
Security & Protection
Edinburg
Compare Zip Codes
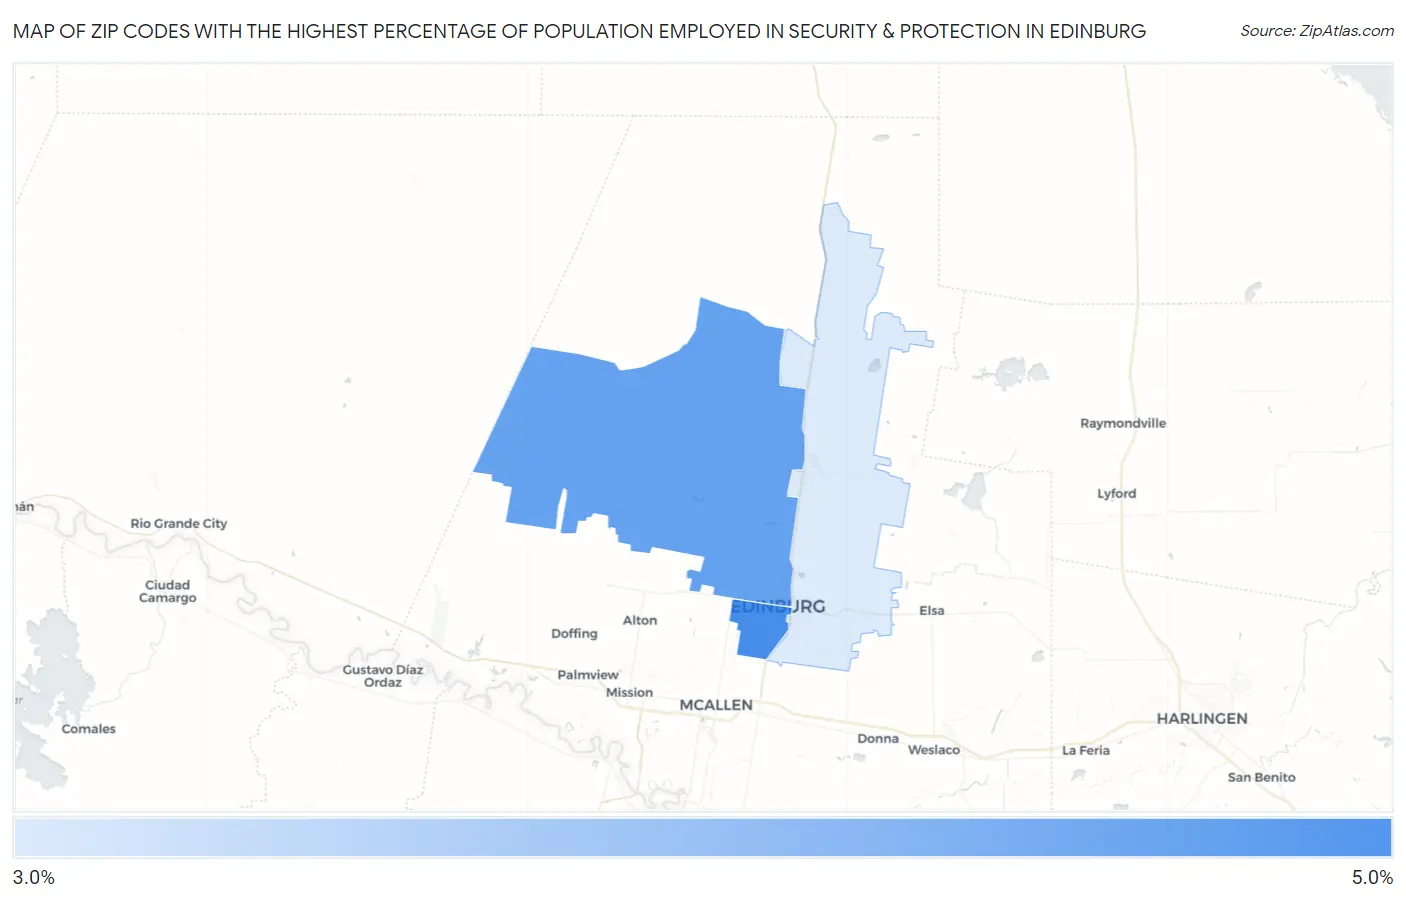
Map of Zip Codes with the Highest Percentage of Population Employed in Security & Protection in Edinburg
0.0%
5.0%
Zip Codes with the Highest Percentage of Population Employed in Security & Protection in Edinburg, TX
| Zip Code | % Employed | vs State | vs National | |
| 1. | 78539 | 4.2% | 2.2%(+1.94)#312 | 2.1%(+2.02)#4,181 |
| 2. | 78541 | 4.0% | 2.2%(+1.74)#332 | 2.1%(+1.82)#4,559 |
| 3. | 78542 | 3.2% | 2.2%(+0.939)#481 | 2.1%(+1.01)#6,654 |
1
Common Questions
What are the Top Zip Codes with the Highest Percentage of Population Employed in Security & Protection in Edinburg, TX?
Top Zip Codes with the Highest Percentage of Population Employed in Security & Protection in Edinburg, TX are:
What zip code has the Highest Percentage of Population Employed in Security & Protection in Edinburg, TX?
78539 has the Highest Percentage of Population Employed in Security & Protection in Edinburg, TX with 4.2%.
What is the Percentage of Population Employed in Security & Protection in Edinburg, TX?
Percentage of Population Employed in Security & Protection in Edinburg is 4.4%.
What is the Percentage of Population Employed in Security & Protection in Texas?
Percentage of Population Employed in Security & Protection in Texas is 2.2%.
What is the Percentage of Population Employed in Security & Protection in the United States?
Percentage of Population Employed in Security & Protection in the United States is 2.1%.