Zip Codes with the Highest Percentage of Households Residing in Condos/Apartments in Brownsville, TX
RELATED REPORTS & OPTIONS
Condo/Apartment Residency
Brownsville
Compare Zip Codes
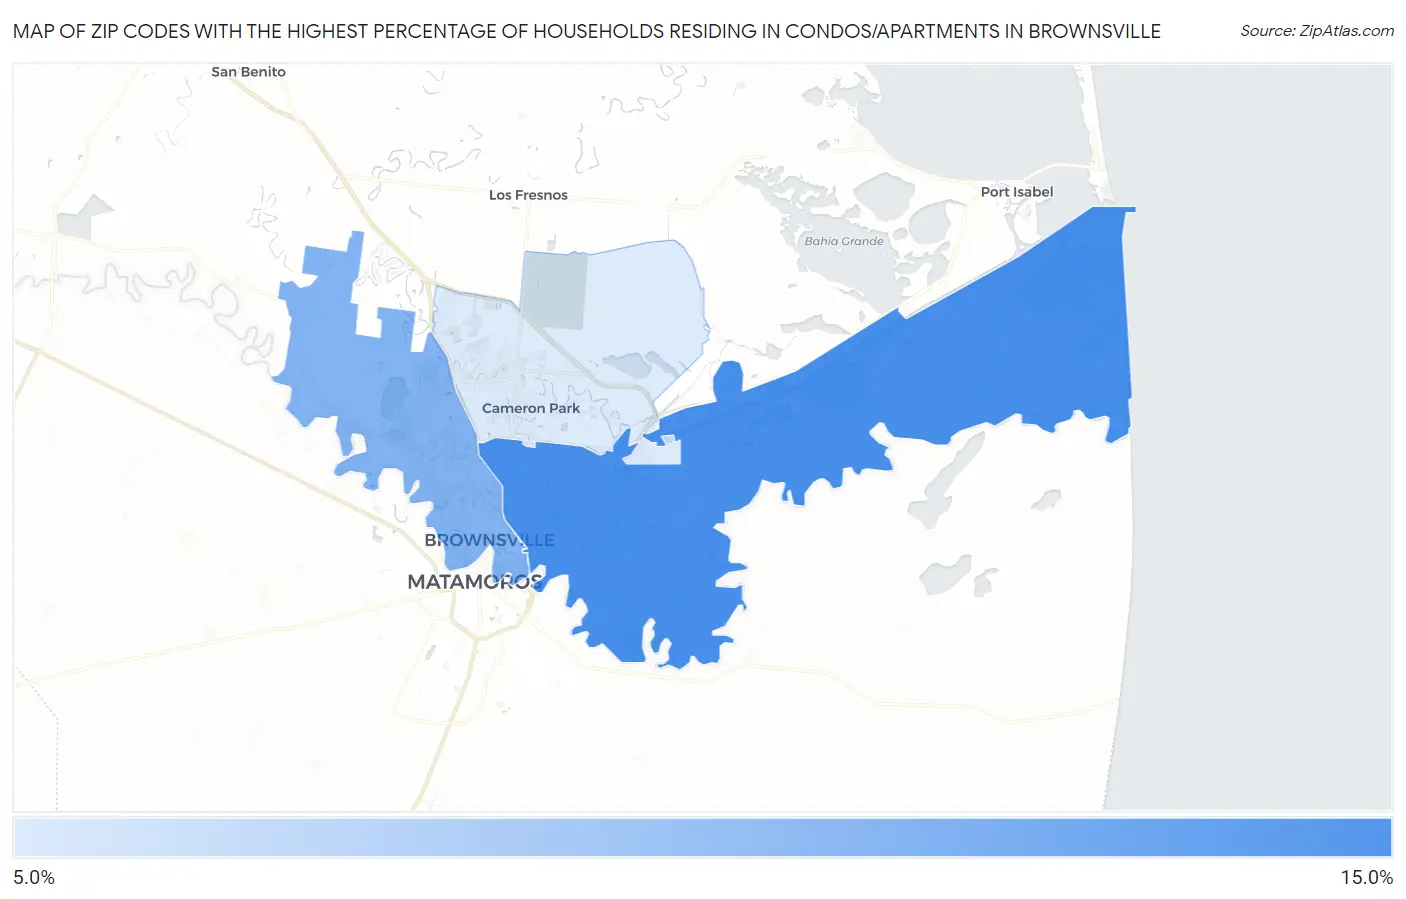
Map of Zip Codes with the Highest Percentage of Households Residing in Condos/Apartments in Brownsville
0.0%
15.0%
Zip Codes with the Highest Percentage of Households Residing in Condos/Apartments in Brownsville, TX
| Zip Code | Detached Home Residency | vs State | vs National | |
| 1. | 78521 | 11.8% | 15.2%(-3.40)#369 | 13.8%(-2.00)#4,661 |
| 2. | 78520 | 10.7% | 15.2%(-4.50)#403 | 13.8%(-3.10)#5,153 |
| 3. | 78526 | 9.0% | 15.2%(-6.20)#453 | 13.8%(-4.80)#5,990 |
1
Common Questions
What are the Top Zip Codes with the Highest Percentage of Households Residing in Condos/Apartments in Brownsville, TX?
Top Zip Codes with the Highest Percentage of Households Residing in Condos/Apartments in Brownsville, TX are:
What zip code has the Highest Percentage of Households Residing in Condos/Apartments in Brownsville, TX?
78521 has the Highest Percentage of Households Residing in Condos/Apartments in Brownsville, TX with 11.8%.
What is the Percentage of Households Residing in Condos/Apartments in Brownsville, TX?
Percentage of Households Residing in Condos/Apartments in Brownsville is 12.0%.
What is the Percentage of Households Residing in Condos/Apartments in Texas?
Percentage of Households Residing in Condos/Apartments in Texas is 15.2%.
What is the Percentage of Households Residing in Condos/Apartments in the United States?
Percentage of Households Residing in Condos/Apartments in the United States is 13.8%.