Zip Codes with the Highest Percentage of Population Employed in Education Instruction & Library in Brownsville, TX
RELATED REPORTS & OPTIONS
Education Instruction & Library
Brownsville
Compare Zip Codes
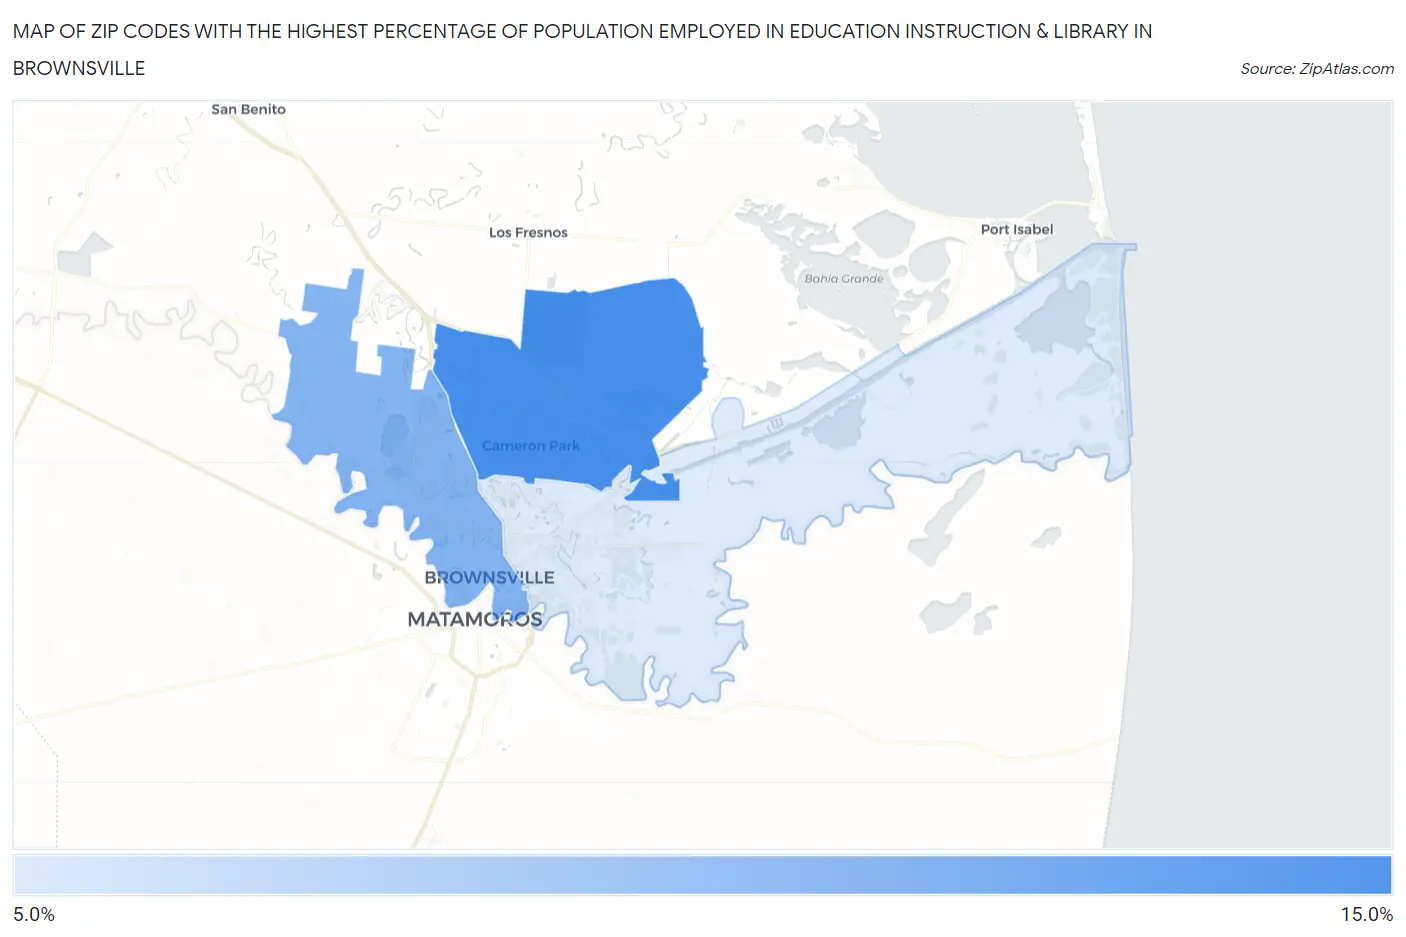
Map of Zip Codes with the Highest Percentage of Population Employed in Education Instruction & Library in Brownsville
0.0%
15.0%
Zip Codes with the Highest Percentage of Population Employed in Education Instruction & Library in Brownsville, TX
| Zip Code | % Employed | vs State | vs National | |
| 1. | 78526 | 11.4% | 6.4%(+5.07)#179 | 6.2%(+5.25)#2,749 |
| 2. | 78520 | 9.9% | 6.4%(+3.55)#265 | 6.2%(+3.73)#4,032 |
| 3. | 78521 | 7.6% | 6.4%(+1.28)#532 | 6.2%(+1.46)#8,055 |
1
Common Questions
What are the Top Zip Codes with the Highest Percentage of Population Employed in Education Instruction & Library in Brownsville, TX?
Top Zip Codes with the Highest Percentage of Population Employed in Education Instruction & Library in Brownsville, TX are:
What zip code has the Highest Percentage of Population Employed in Education Instruction & Library in Brownsville, TX?
78526 has the Highest Percentage of Population Employed in Education Instruction & Library in Brownsville, TX with 11.4%.
What is the Percentage of Population Employed in Education Instruction & Library in Brownsville, TX?
Percentage of Population Employed in Education Instruction & Library in Brownsville is 10.0%.
What is the Percentage of Population Employed in Education Instruction & Library in Texas?
Percentage of Population Employed in Education Instruction & Library in Texas is 6.4%.
What is the Percentage of Population Employed in Education Instruction & Library in the United States?
Percentage of Population Employed in Education Instruction & Library in the United States is 6.2%.