Hillsboro, TN
Hillsboro Map
Hillsboro Overview
311
TOTAL POPULATION
189
MALE POPULATION
122
FEMALE POPULATION
154.92
MALES / 100 FEMALES
64.55
FEMALES / 100 MALES
57.5
MEDIAN AGE
3.0
AVG FAMILY SIZE
2.1
AVG HOUSEHOLD SIZE
$26,380
PER CAPITA INCOME
$90,208
AVG FAMILY INCOME
0.41
INEQUALITY / GINI INDEX
85
LABOR FORCE [ PEOPLE ]
29.1%
PERCENT IN LABOR FORCE
37.6%
UNEMPLOYMENT RATE
Hillsboro Zip Codes
Hillsboro Area Codes
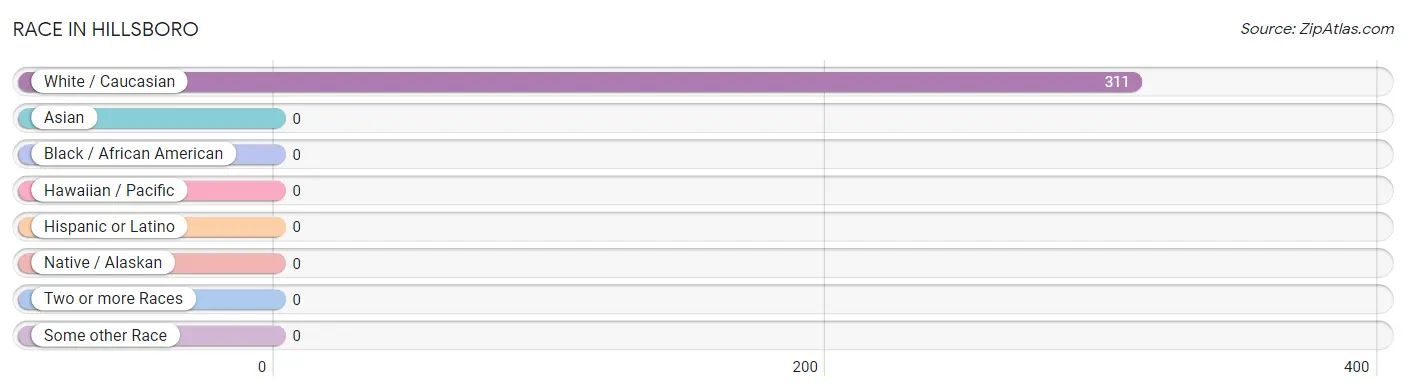
Race in Hillsboro
The most populous races in Hillsboro are , and White / Caucasian (311 | 100.0%).
| Race | # Population | % Population |
| Asian | 0 | 0.0% |
| Black / African American | 0 | 0.0% |
| Hawaiian / Pacific | 0 | 0.0% |
| Hispanic or Latino | 0 | 0.0% |
| Native / Alaskan | 0 | 0.0% |
| White / Caucasian | 311 | 100.0% |
| Two or more Races | 0 | 0.0% |
| Some other Race | 0 | 0.0% |
| Total | 311 | 100.0% |
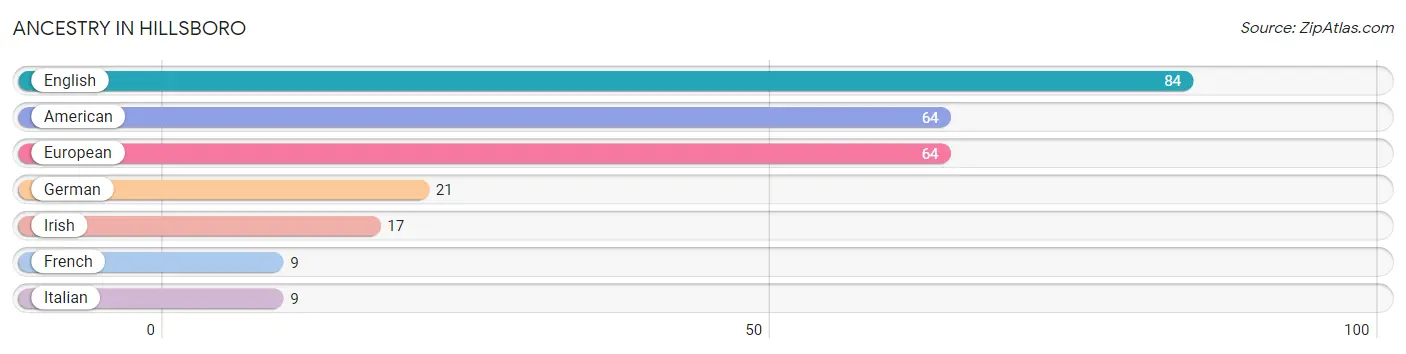
Ancestry in Hillsboro
The most populous ancestries reported in Hillsboro are English (84 | 27.0%), American (64 | 20.6%), European (64 | 20.6%), German (21 | 6.8%), and Irish (17 | 5.5%), together accounting for 80.4% of all Hillsboro residents.
| Ancestry | # Population | % Population |
| American | 64 | 20.6% |
| English | 84 | 27.0% |
| European | 64 | 20.6% |
| French | 9 | 2.9% |
| German | 21 | 6.8% |
| Irish | 17 | 5.5% |
| Italian | 9 | 2.9% | View All 7 Rows |
Immigrants in Hillsboro

| Immigration Origin | # Population | % Population | View All 0 Rows |
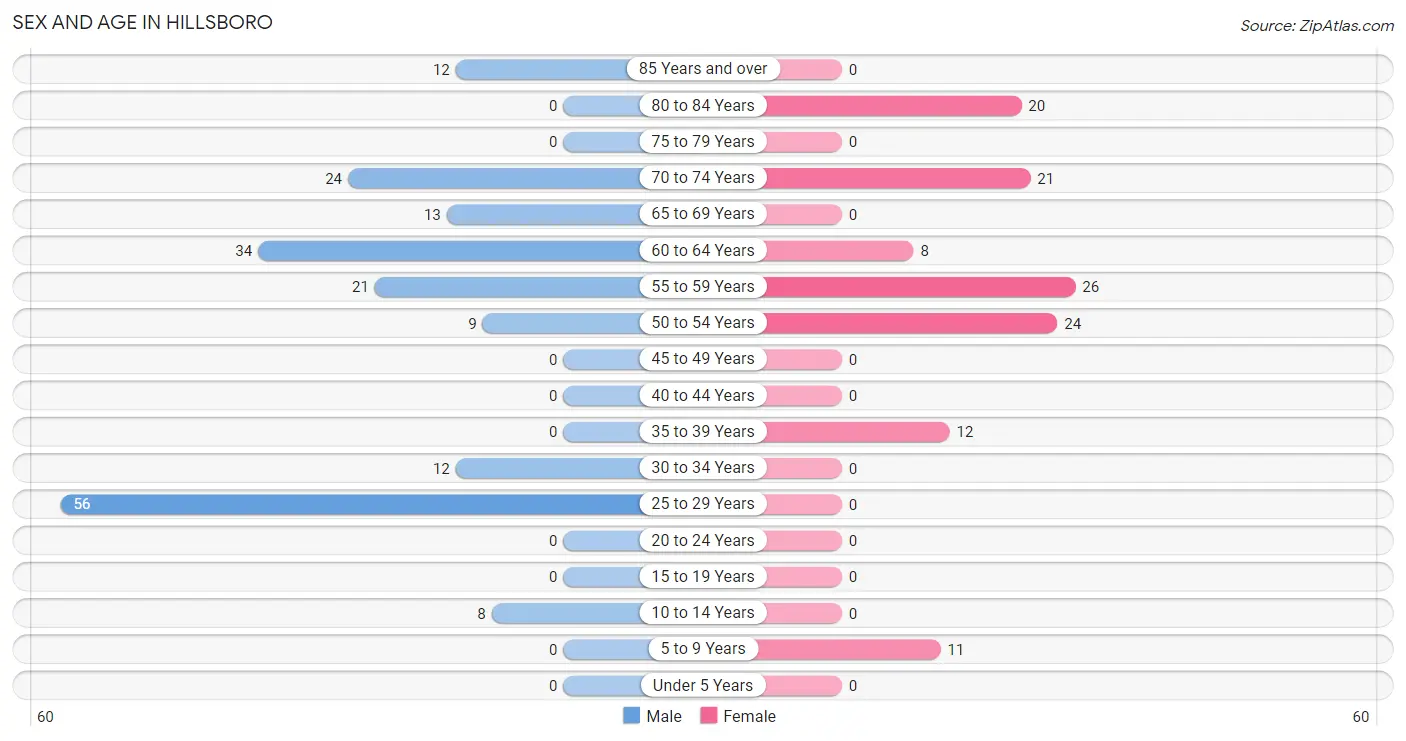
Sex and Age in Hillsboro
Sex and Age in Hillsboro
The most populous age groups in Hillsboro are 25 to 29 Years (56 | 29.6%) for men and 55 to 59 Years (26 | 21.3%) for women.
| Age Bracket | Male | Female |
| Under 5 Years | 0 (0.0%) | 0 (0.0%) |
| 5 to 9 Years | 0 (0.0%) | 11 (9.0%) |
| 10 to 14 Years | 8 (4.2%) | 0 (0.0%) |
| 15 to 19 Years | 0 (0.0%) | 0 (0.0%) |
| 20 to 24 Years | 0 (0.0%) | 0 (0.0%) |
| 25 to 29 Years | 56 (29.6%) | 0 (0.0%) |
| 30 to 34 Years | 12 (6.4%) | 0 (0.0%) |
| 35 to 39 Years | 0 (0.0%) | 12 (9.8%) |
| 40 to 44 Years | 0 (0.0%) | 0 (0.0%) |
| 45 to 49 Years | 0 (0.0%) | 0 (0.0%) |
| 50 to 54 Years | 9 (4.8%) | 24 (19.7%) |
| 55 to 59 Years | 21 (11.1%) | 26 (21.3%) |
| 60 to 64 Years | 34 (18.0%) | 8 (6.6%) |
| 65 to 69 Years | 13 (6.9%) | 0 (0.0%) |
| 70 to 74 Years | 24 (12.7%) | 21 (17.2%) |
| 75 to 79 Years | 0 (0.0%) | 0 (0.0%) |
| 80 to 84 Years | 0 (0.0%) | 20 (16.4%) |
| 85 Years and over | 12 (6.4%) | 0 (0.0%) |
| Total | 189 (100.0%) | 122 (100.0%) |
Families and Households in Hillsboro
Median Family Size in Hillsboro
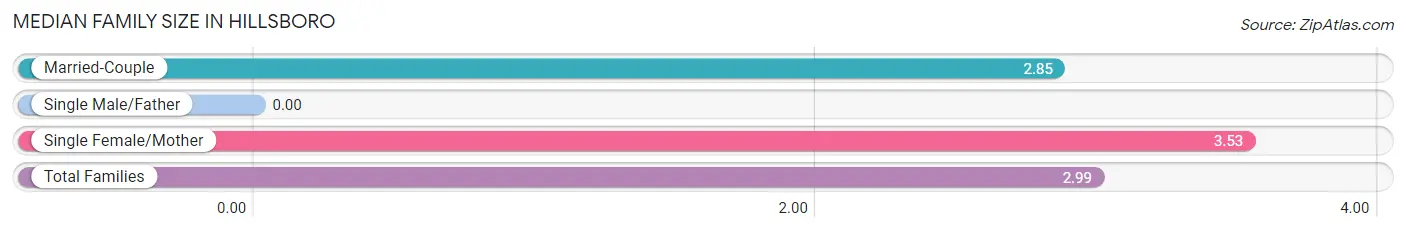
| Family Type | # Families | Family Size |
| Married-Couple | 65 (79.3%) | 2.85 |
| Single Male/Father | 0 (0.0%) | - |
| Single Female/Mother | 17 (20.7%) | 3.53 |
| Total Families | 82 (100.0%) | 2.99 |
Median Household Size in Hillsboro
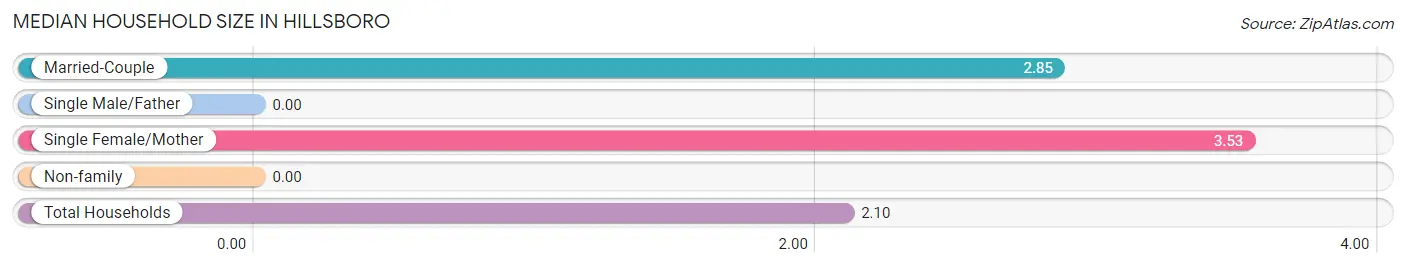
| Household Type | # Households | Household Size |
| Married-Couple | 65 (43.9%) | 2.85 |
| Single Male/Father | 0 (0.0%) | - |
| Single Female/Mother | 17 (11.5%) | 3.53 |
| Non-family | 66 (44.6%) | - |
| Total Households | 148 (100.0%) | 2.10 |
Household Size by Marriage Status in Hillsboro
Out of a total of 148 households in Hillsboro, 82 (55.4%) are family households, while 66 (44.6%) are nonfamily households. The most numerous type of family households are 2-person households, comprising 53, and the most common type of nonfamily households are 1-person households, comprising 66.
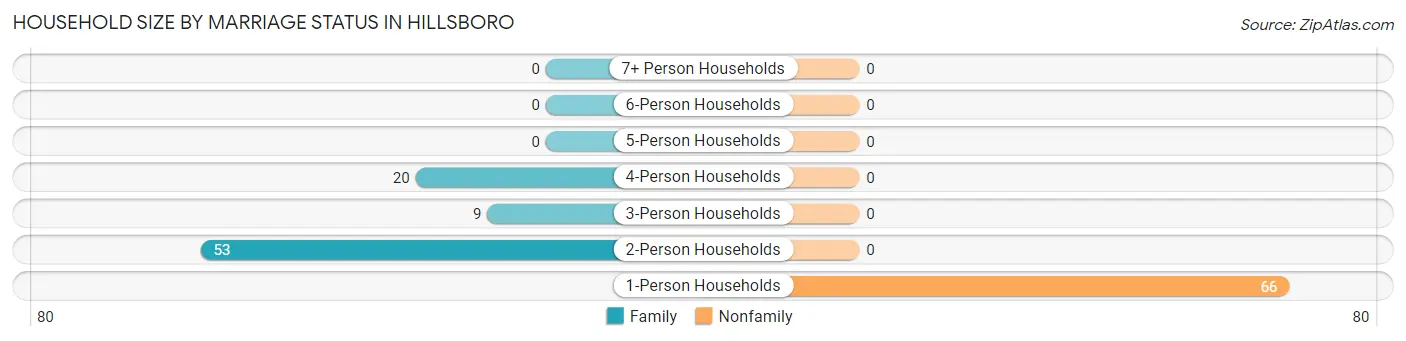
| Household Size | Family Households | Nonfamily Households |
| 1-Person Households | - | 66 (44.6%) |
| 2-Person Households | 53 (35.8%) | 0 (0.0%) |
| 3-Person Households | 9 (6.1%) | 0 (0.0%) |
| 4-Person Households | 20 (13.5%) | 0 (0.0%) |
| 5-Person Households | 0 (0.0%) | 0 (0.0%) |
| 6-Person Households | 0 (0.0%) | 0 (0.0%) |
| 7+ Person Households | 0 (0.0%) | 0 (0.0%) |
| Total | 82 (55.4%) | 66 (44.6%) |
Female Fertility in Hillsboro
Fertility by Age in Hillsboro
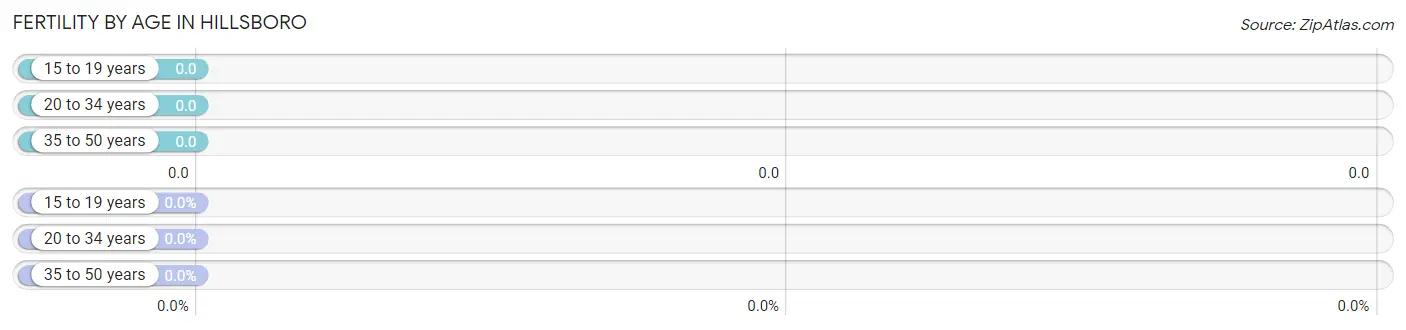
| Age Bracket | Women with Births | Births / 1,000 Women |
| 15 to 19 years | 0 (0.0%) | 0.0 |
| 20 to 34 years | 0 (0.0%) | 0.0 |
| 35 to 50 years | 0 (0.0%) | 0.0 |
| Total | 0 (0.0%) | 0.0 |
Fertility by Age by Marriage Status in Hillsboro
| Age Bracket | Married | Unmarried |
| 15 to 19 years | 0 (0.0%) | 0 (0.0%) |
| 20 to 34 years | 0 (0.0%) | 0 (0.0%) |
| 35 to 50 years | 0 (0.0%) | 0 (0.0%) |
| Total | 0 (0.0%) | 0 (0.0%) |
Fertility by Education in Hillsboro
| Educational Attainment | Women with Births | Births / 1,000 Women |
| Less than High School | 0 (0.0%) | 0.0 |
| High School Diploma | 0 (0.0%) | 0.0 |
| College or Associate's Degree | 0 (0.0%) | 0.0 |
| Bachelor's Degree | 0 (0.0%) | 0.0 |
| Graduate Degree | 0 (0.0%) | 0.0 |
| Total | 0 (0.0%) | 0.0 |
Fertility by Education by Marriage Status in Hillsboro
| Educational Attainment | Married | Unmarried |
| Less than High School | 0 (0.0%) | 0 (0.0%) |
| High School Diploma | 0 (0.0%) | 0 (0.0%) |
| College or Associate's Degree | 0 (0.0%) | 0 (0.0%) |
| Bachelor's Degree | 0 (0.0%) | 0 (0.0%) |
| Graduate Degree | 0 (0.0%) | 0 (0.0%) |
| Total | 0 (0.0%) | 0 (0.0%) |
Income in Hillsboro
Income Overview in Hillsboro
| Characteristic | Number | Measure |
| Per Capita Income | 311 | $26,380 |
| Median Family Income | 82 | $90,208 |
| Mean Family Income | 82 | $80,856 |
| Median Household Income | 148 | $0 |
| Mean Household Income | 148 | $53,379 |
| Income Deficit | 82 | $0 |
| Wage / Income Gap (%) | 311 | 0.00% |
| Wage / Income Gap ($) | 311 | 100.00¢ per $1 |
| Gini / Inequality Index | 311 | 0.41 |
Earnings by Sex in Hillsboro
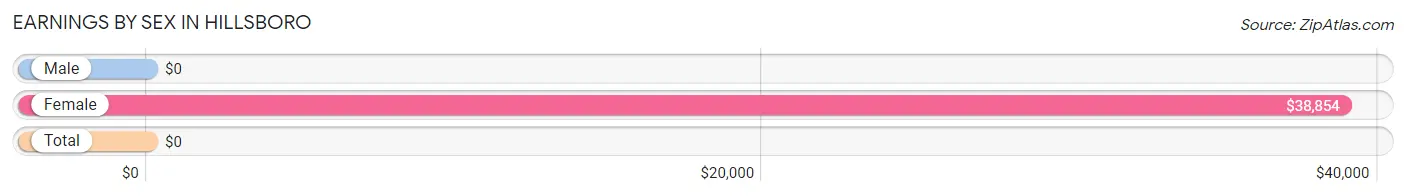
| Sex | Number | Average Earnings |
| Male | 40 (43.0%) | $0 |
| Female | 53 (57.0%) | $38,854 |
| Total | 93 (100.0%) | $0 |
Earnings by Sex by Income Bracket in Hillsboro
The most common earnings brackets in Hillsboro are $2,499 or less for men (20 | 50.0%) and $10,000 to $12,499 for women (12 | 22.6%).
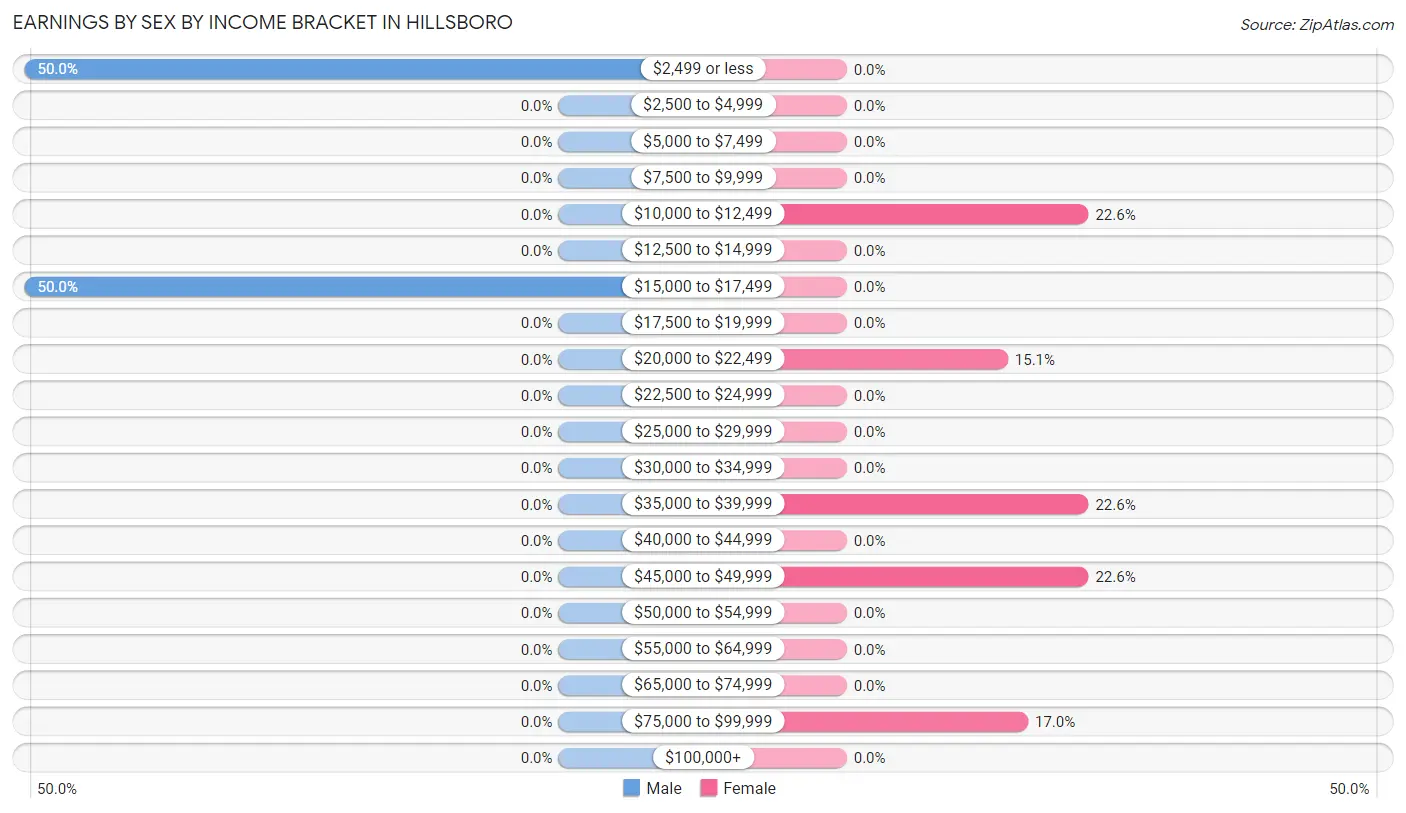
| Income | Male | Female |
| $2,499 or less | 20 (50.0%) | 0 (0.0%) |
| $2,500 to $4,999 | 0 (0.0%) | 0 (0.0%) |
| $5,000 to $7,499 | 0 (0.0%) | 0 (0.0%) |
| $7,500 to $9,999 | 0 (0.0%) | 0 (0.0%) |
| $10,000 to $12,499 | 0 (0.0%) | 12 (22.6%) |
| $12,500 to $14,999 | 0 (0.0%) | 0 (0.0%) |
| $15,000 to $17,499 | 20 (50.0%) | 0 (0.0%) |
| $17,500 to $19,999 | 0 (0.0%) | 0 (0.0%) |
| $20,000 to $22,499 | 0 (0.0%) | 8 (15.1%) |
| $22,500 to $24,999 | 0 (0.0%) | 0 (0.0%) |
| $25,000 to $29,999 | 0 (0.0%) | 0 (0.0%) |
| $30,000 to $34,999 | 0 (0.0%) | 0 (0.0%) |
| $35,000 to $39,999 | 0 (0.0%) | 12 (22.6%) |
| $40,000 to $44,999 | 0 (0.0%) | 0 (0.0%) |
| $45,000 to $49,999 | 0 (0.0%) | 12 (22.6%) |
| $50,000 to $54,999 | 0 (0.0%) | 0 (0.0%) |
| $55,000 to $64,999 | 0 (0.0%) | 0 (0.0%) |
| $65,000 to $74,999 | 0 (0.0%) | 0 (0.0%) |
| $75,000 to $99,999 | 0 (0.0%) | 9 (17.0%) |
| $100,000+ | 0 (0.0%) | 0 (0.0%) |
| Total | 40 (100.0%) | 53 (100.0%) |
Earnings by Sex by Educational Attainment in Hillsboro
| Educational Attainment | Male Income | Female Income |
| Less than High School | - | - |
| High School Diploma | - | - |
| College or Associate's Degree | - | - |
| Bachelor's Degree | - | - |
| Graduate Degree | - | - |
| Total | - | - |
Family Income in Hillsboro
Family Income Brackets in Hillsboro
According to the Hillsboro family income data, there are 35 families falling into the $75,000 to $99,999 income range, which is the most common income bracket and makes up 42.7% of all families.
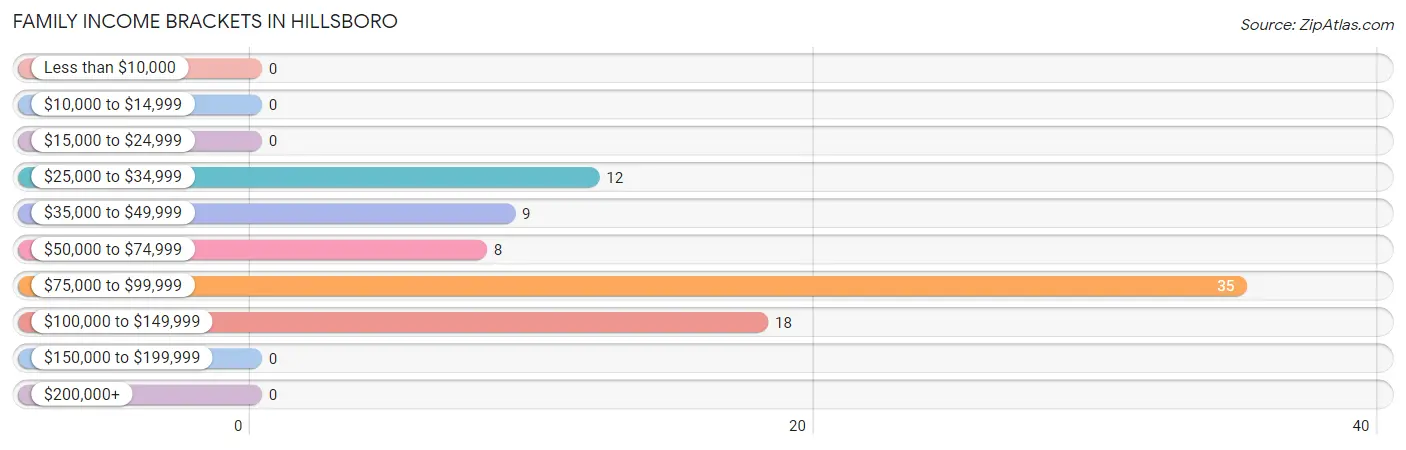
| Income Bracket | # Families | % Families |
| Less than $10,000 | 0 | 0.0% |
| $10,000 to $14,999 | 0 | 0.0% |
| $15,000 to $24,999 | 0 | 0.0% |
| $25,000 to $34,999 | 12 | 14.6% |
| $35,000 to $49,999 | 9 | 11.0% |
| $50,000 to $74,999 | 8 | 9.8% |
| $75,000 to $99,999 | 35 | 42.7% |
| $100,000 to $149,999 | 18 | 22.0% |
| $150,000 to $199,999 | 0 | 0.0% |
| $200,000+ | 0 | 0.0% |
Family Income by Famaliy Size in Hillsboro
2-person families (53 | 64.6%) account for the highest median family income in Hillsboro with $83,750 per family, while 2-person families (53 | 64.6%) have the highest median income of $41,875 per family member.
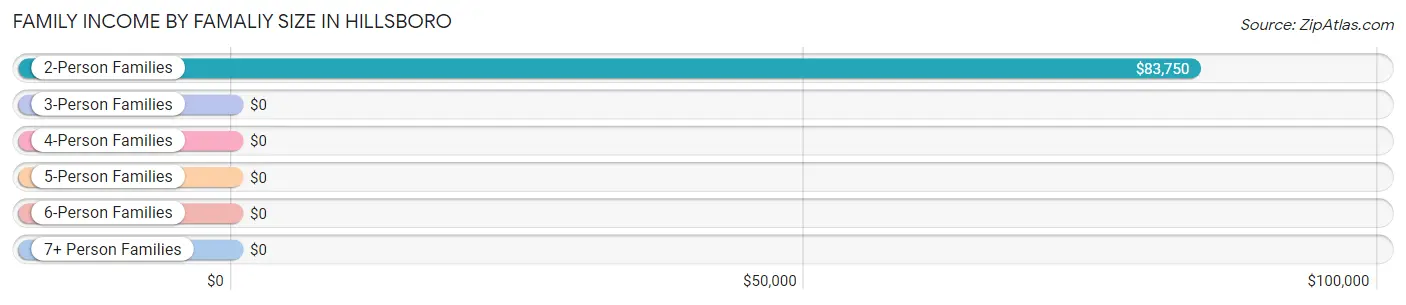
| Income Bracket | # Families | Median Income |
| 2-Person Families | 53 (64.6%) | $83,750 |
| 3-Person Families | 9 (11.0%) | $0 |
| 4-Person Families | 20 (24.4%) | $0 |
| 5-Person Families | 0 (0.0%) | $0 |
| 6-Person Families | 0 (0.0%) | $0 |
| 7+ Person Families | 0 (0.0%) | $0 |
| Total | 82 (100.0%) | $90,208 |
Family Income by Number of Earners in Hillsboro
| Number of Earners | # Families | Median Income |
| No Earners | 41 (50.0%) | $0 |
| 1 Earner | 21 (25.6%) | $0 |
| 2 Earners | 8 (9.8%) | $0 |
| 3+ Earners | 12 (14.6%) | $0 |
| Total | 82 (100.0%) | $90,208 |
Household Income in Hillsboro
Household Income Brackets in Hillsboro
With 44 households falling in the category, the $15,000 to $24,999 income range is the most frequent in Hillsboro, accounting for 29.7% of all households.
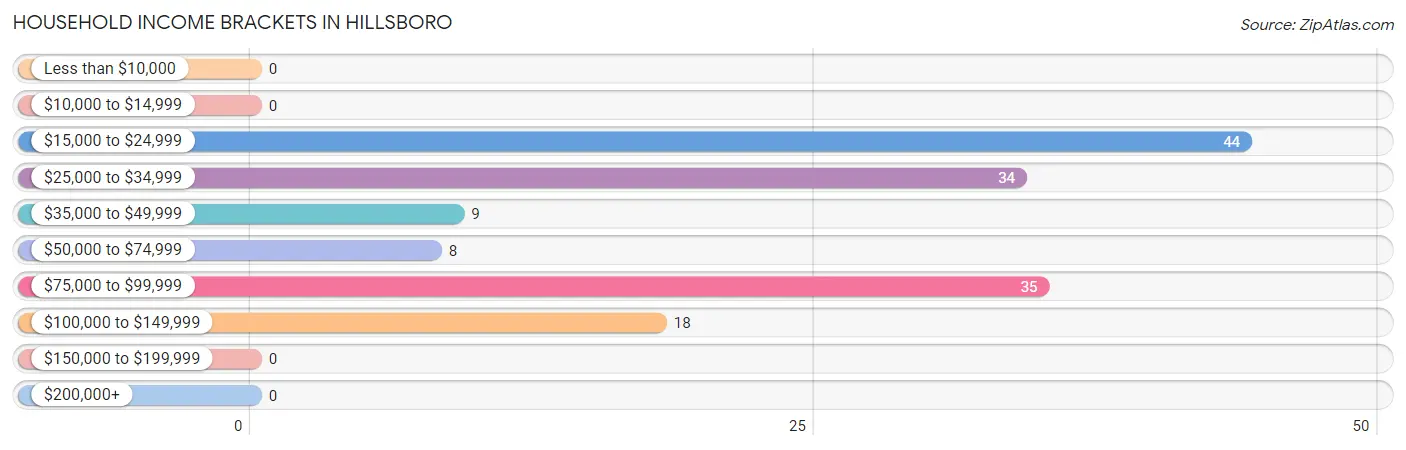
| Income Bracket | # Households | % Households |
| Less than $10,000 | 0 | 0.0% |
| $10,000 to $14,999 | 0 | 0.0% |
| $15,000 to $24,999 | 44 | 29.7% |
| $25,000 to $34,999 | 34 | 23.0% |
| $35,000 to $49,999 | 9 | 6.1% |
| $50,000 to $74,999 | 8 | 5.4% |
| $75,000 to $99,999 | 35 | 23.6% |
| $100,000 to $149,999 | 18 | 12.2% |
| $150,000 to $199,999 | 0 | 0.0% |
| $200,000+ | 0 | 0.0% |
Household Income by Householder Age in Hillsboro
The median household income in Hillsboro is $0, with the highest median household income of $26,287 found in the 65+ years age bracket for the primary householder. A total of 55 households (37.2%) fall into this category.
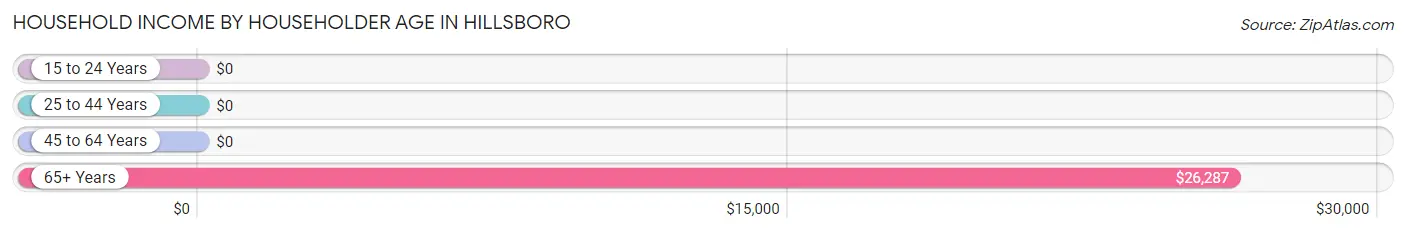
| Income Bracket | # Households | Median Income |
| 15 to 24 Years | 0 (0.0%) | $0 |
| 25 to 44 Years | 0 (0.0%) | $0 |
| 45 to 64 Years | 93 (62.8%) | $0 |
| 65+ Years | 55 (37.2%) | $26,287 |
| Total | 148 (100.0%) | $0 |
Poverty in Hillsboro
Income Below Poverty by Sex and Age in Hillsboro
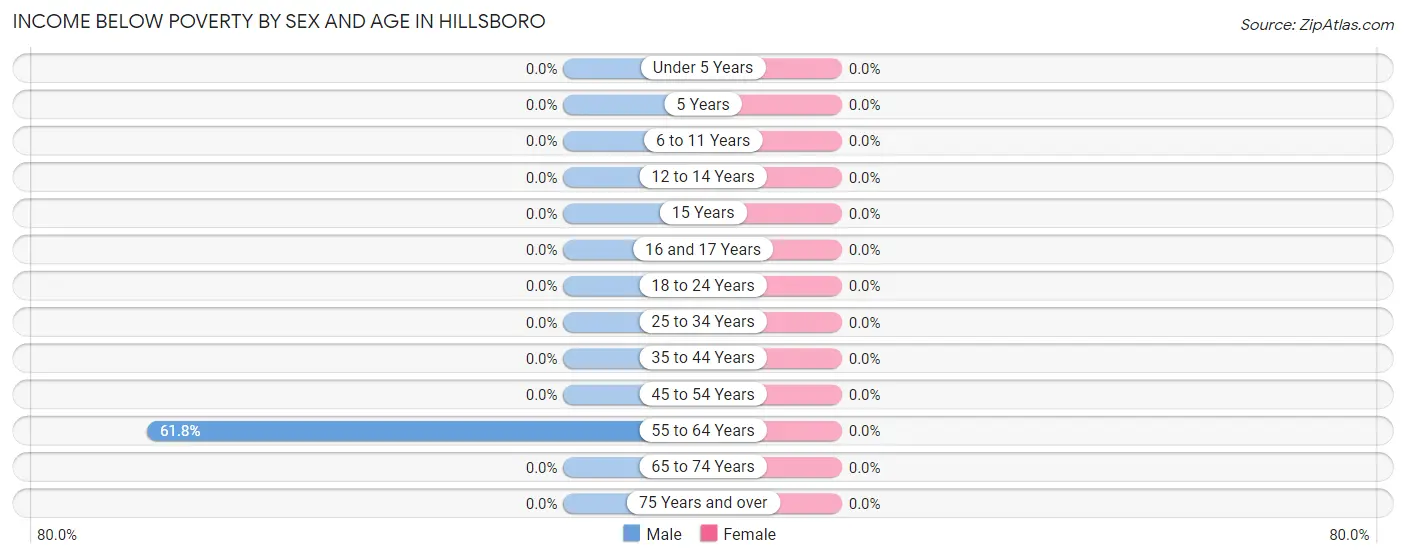
| Age Bracket | Male | Female |
| Under 5 Years | 0 (0.0%) | 0 (0.0%) |
| 5 Years | 0 (0.0%) | 0 (0.0%) |
| 6 to 11 Years | 0 (0.0%) | 0 (0.0%) |
| 12 to 14 Years | 0 (0.0%) | 0 (0.0%) |
| 15 Years | 0 (0.0%) | 0 (0.0%) |
| 16 and 17 Years | 0 (0.0%) | 0 (0.0%) |
| 18 to 24 Years | 0 (0.0%) | 0 (0.0%) |
| 25 to 34 Years | 0 (0.0%) | 0 (0.0%) |
| 35 to 44 Years | 0 (0.0%) | 0 (0.0%) |
| 45 to 54 Years | 0 (0.0%) | 0 (0.0%) |
| 55 to 64 Years | 34 (61.8%) | 0 (0.0%) |
| 65 to 74 Years | 0 (0.0%) | 0 (0.0%) |
| 75 Years and over | 0 (0.0%) | 0 (0.0%) |
| Total | 34 (18.0%) | 0 (0.0%) |
Income Above Poverty by Sex and Age in Hillsboro
According to the poverty statistics in Hillsboro, males aged 12 to 14 years and females aged 6 to 11 years are the age groups that are most secure financially, with 100.0% of males and 100.0% of females in these age groups living above the poverty line.
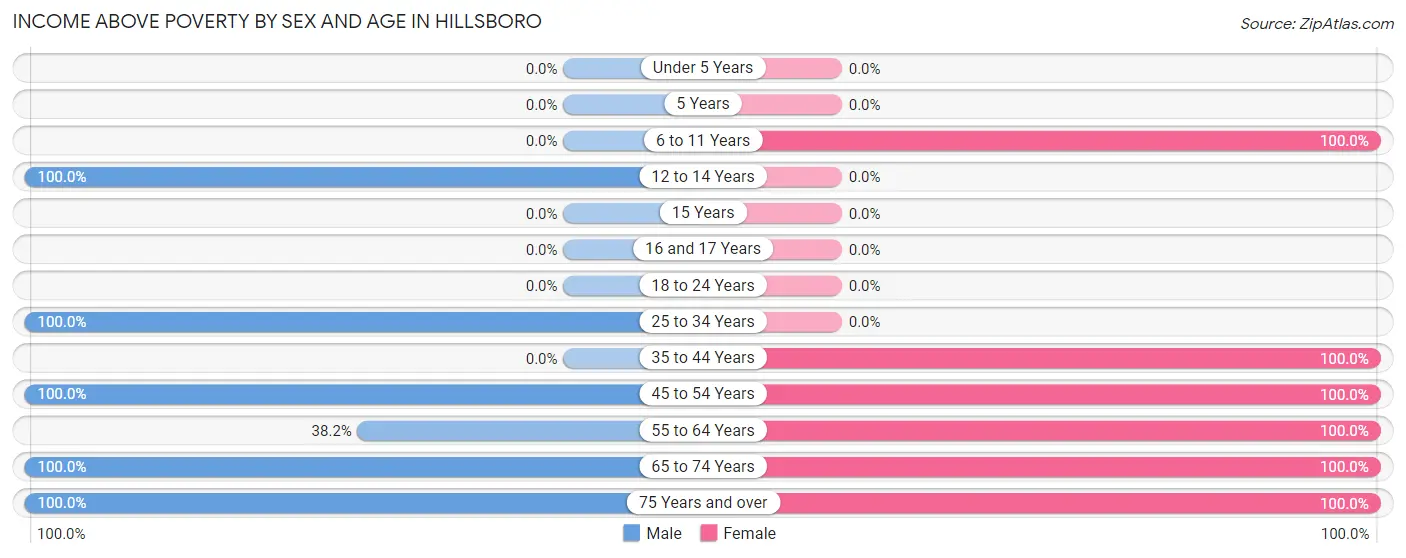
| Age Bracket | Male | Female |
| Under 5 Years | 0 (0.0%) | 0 (0.0%) |
| 5 Years | 0 (0.0%) | 0 (0.0%) |
| 6 to 11 Years | 0 (0.0%) | 11 (100.0%) |
| 12 to 14 Years | 8 (100.0%) | 0 (0.0%) |
| 15 Years | 0 (0.0%) | 0 (0.0%) |
| 16 and 17 Years | 0 (0.0%) | 0 (0.0%) |
| 18 to 24 Years | 0 (0.0%) | 0 (0.0%) |
| 25 to 34 Years | 68 (100.0%) | 0 (0.0%) |
| 35 to 44 Years | 0 (0.0%) | 12 (100.0%) |
| 45 to 54 Years | 9 (100.0%) | 24 (100.0%) |
| 55 to 64 Years | 21 (38.2%) | 34 (100.0%) |
| 65 to 74 Years | 37 (100.0%) | 21 (100.0%) |
| 75 Years and over | 12 (100.0%) | 20 (100.0%) |
| Total | 155 (82.0%) | 122 (100.0%) |
Income Below Poverty Among Married-Couple Families in Hillsboro
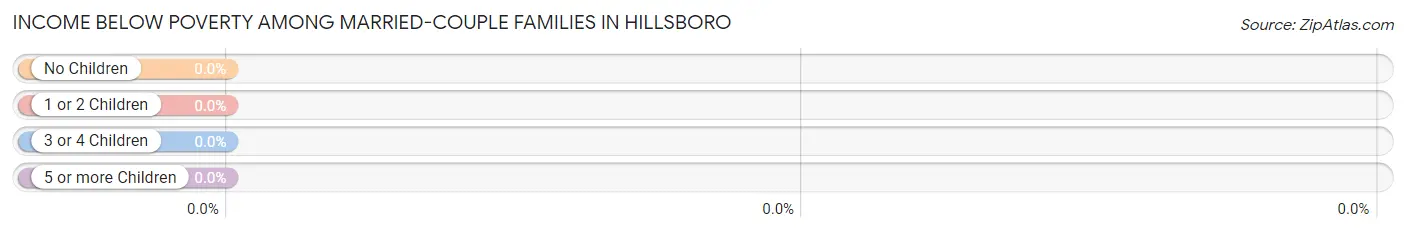
| Children | Above Poverty | Below Poverty |
| No Children | 65 (100.0%) | 0 (0.0%) |
| 1 or 2 Children | 0 (0.0%) | 0 (0.0%) |
| 3 or 4 Children | 0 (0.0%) | 0 (0.0%) |
| 5 or more Children | 0 (0.0%) | 0 (0.0%) |
| Total | 65 (100.0%) | 0 (0.0%) |
Income Below Poverty Among Single-Parent Households in Hillsboro
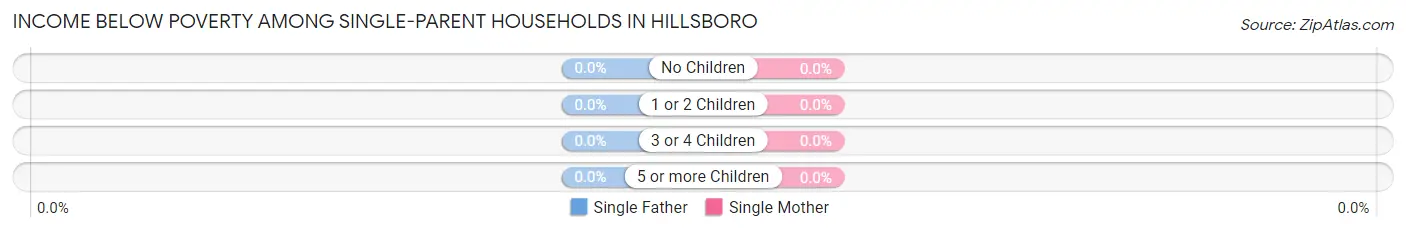
| Children | Single Father | Single Mother |
| No Children | 0 (0.0%) | 0 (0.0%) |
| 1 or 2 Children | 0 (0.0%) | 0 (0.0%) |
| 3 or 4 Children | 0 (0.0%) | 0 (0.0%) |
| 5 or more Children | 0 (0.0%) | 0 (0.0%) |
| Total | 0 (0.0%) | 0 (0.0%) |
Income Below Poverty Among Married-Couple vs Single-Parent Households in Hillsboro
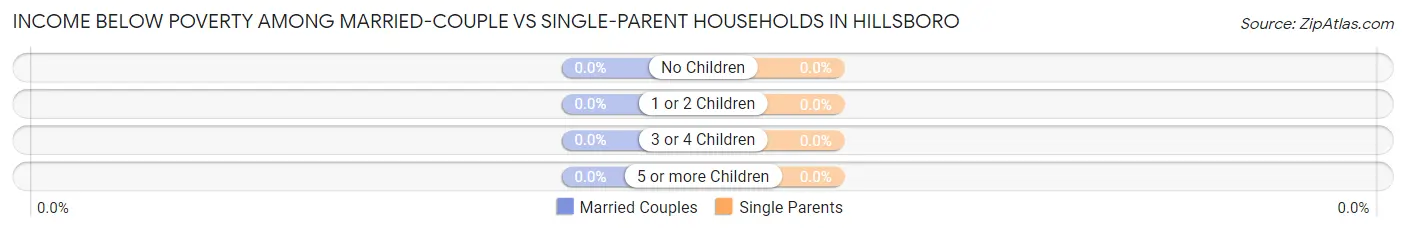
| Children | Married-Couple Families | Single-Parent Households |
| No Children | 0 (0.0%) | 0 (0.0%) |
| 1 or 2 Children | 0 (0.0%) | 0 (0.0%) |
| 3 or 4 Children | 0 (0.0%) | 0 (0.0%) |
| 5 or more Children | 0 (0.0%) | 0 (0.0%) |
| Total | 0 (0.0%) | 0 (0.0%) |
Employment Characteristics in Hillsboro
Employment by Class of Employer in Hillsboro
Among the 53 employed individuals in Hillsboro, private company employees (32 | 60.4%), self-employed (incorporated) (12 | 22.6%), and federal government employees (9 | 17.0%) make up the most common classes of employment.
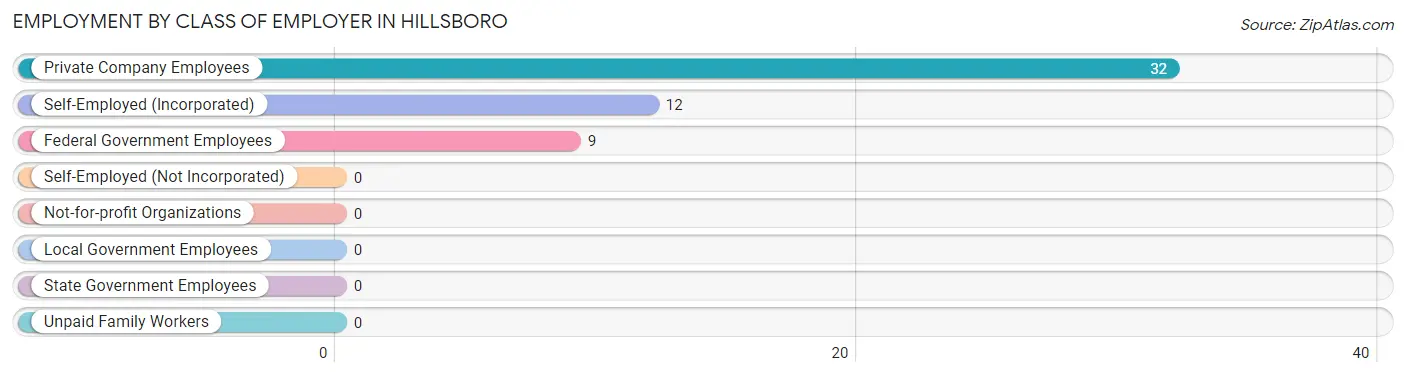
| Employer Class | # Employees | % Employees |
| Private Company Employees | 32 | 60.4% |
| Self-Employed (Incorporated) | 12 | 22.6% |
| Self-Employed (Not Incorporated) | 0 | 0.0% |
| Not-for-profit Organizations | 0 | 0.0% |
| Local Government Employees | 0 | 0.0% |
| State Government Employees | 0 | 0.0% |
| Federal Government Employees | 9 | 17.0% |
| Unpaid Family Workers | 0 | 0.0% |
| Total | 53 | 100.0% |
Employment Status by Age in Hillsboro
According to the labor force statistics for Hillsboro, out of the total population over 16 years of age (292), 29.1% or 85 individuals are in the labor force, with 37.6% or 32 of them unemployed. The age group with the highest labor force participation rate is 35 to 44 years, with 100.0% or 12 individuals in the labor force. Within the labor force, the 35 to 44 years age range has the highest percentage of unemployed individuals, with 100.0% or 12 of them being unemployed.
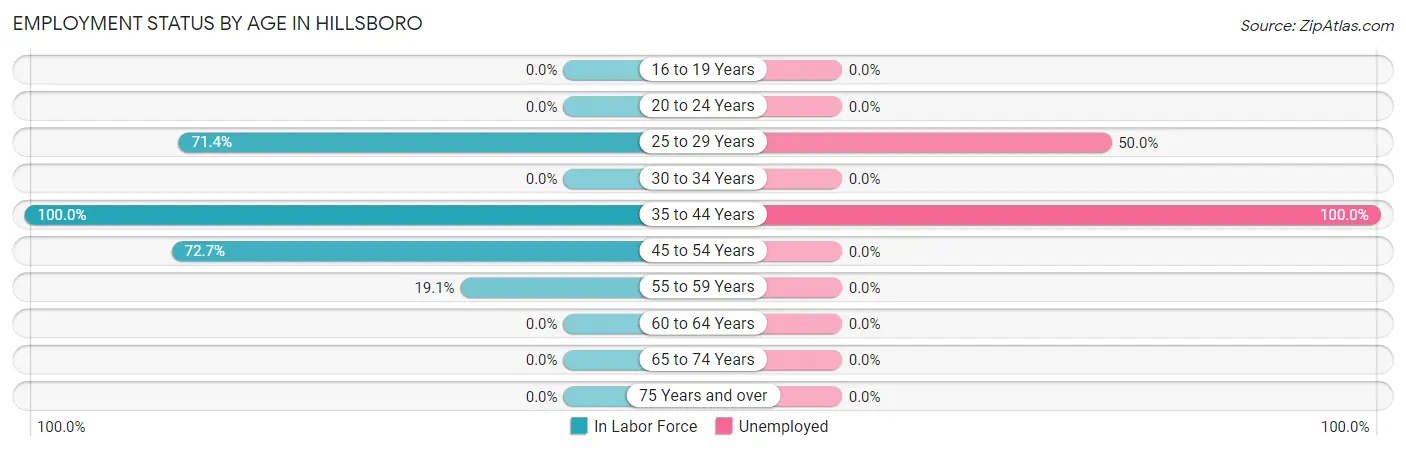
| Age Bracket | In Labor Force | Unemployed |
| 16 to 19 Years | 0 (0.0%) | 0 (0.0%) |
| 20 to 24 Years | 0 (0.0%) | 0 (0.0%) |
| 25 to 29 Years | 40 (71.4%) | 20 (50.0%) |
| 30 to 34 Years | 0 (0.0%) | 0 (0.0%) |
| 35 to 44 Years | 12 (100.0%) | 12 (100.0%) |
| 45 to 54 Years | 24 (72.7%) | 0 (0.0%) |
| 55 to 59 Years | 9 (19.1%) | 0 (0.0%) |
| 60 to 64 Years | 0 (0.0%) | 0 (0.0%) |
| 65 to 74 Years | 0 (0.0%) | 0 (0.0%) |
| 75 Years and over | 0 (0.0%) | 0 (0.0%) |
| Total | 85 (29.1%) | 32 (37.6%) |
Employment Status by Educational Attainment in Hillsboro
According to labor force statistics for Hillsboro, 42.1% of individuals (85) out of the total population between 25 and 64 years of age (202) are in the labor force, with 37.6% or 32 of them being unemployed. The group with the highest labor force participation rate are those with the educational attainment of college / associate degree, with 78.6% or 44 individuals in the labor force. Within the labor force, individuals with college / associate degree education have the highest percentage of unemployment, with 45.5% or 20 of them being unemployed.
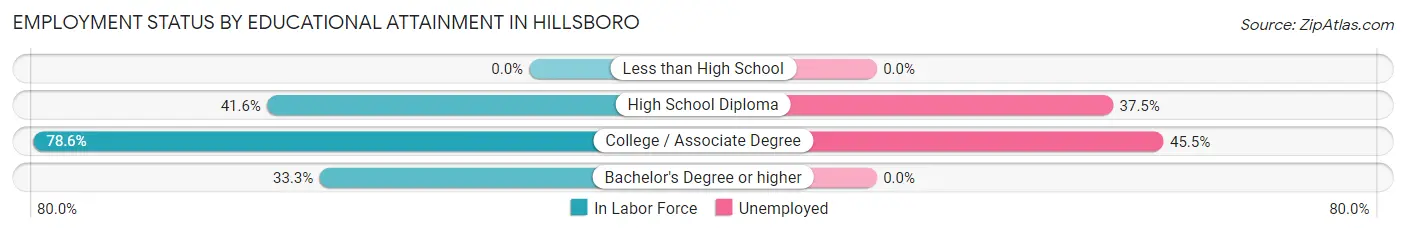
| Educational Attainment | In Labor Force | Unemployed |
| Less than High School | 0 (0.0%) | 0 (0.0%) |
| High School Diploma | 32 (41.6%) | 29 (37.5%) |
| College / Associate Degree | 44 (78.6%) | 25 (45.5%) |
| Bachelor's Degree or higher | 9 (33.3%) | 0 (0.0%) |
| Total | 85 (42.1%) | 76 (37.6%) |
Employment Occupations by Sex in Hillsboro
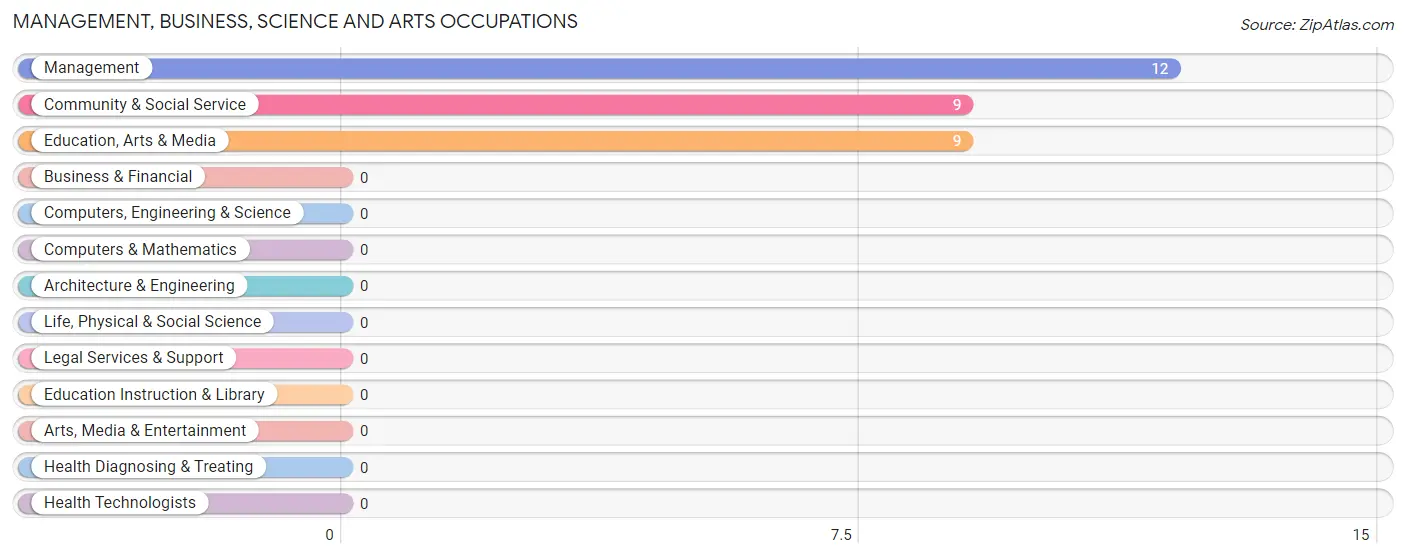
Management, Business, Science and Arts Occupations
The most common Management, Business, Science and Arts occupations in Hillsboro are Management (12 | 22.6%), Community & Social Service (9 | 17.0%), and Education, Arts & Media (9 | 17.0%).
Management, Business, Science and Arts Occupations by Sex
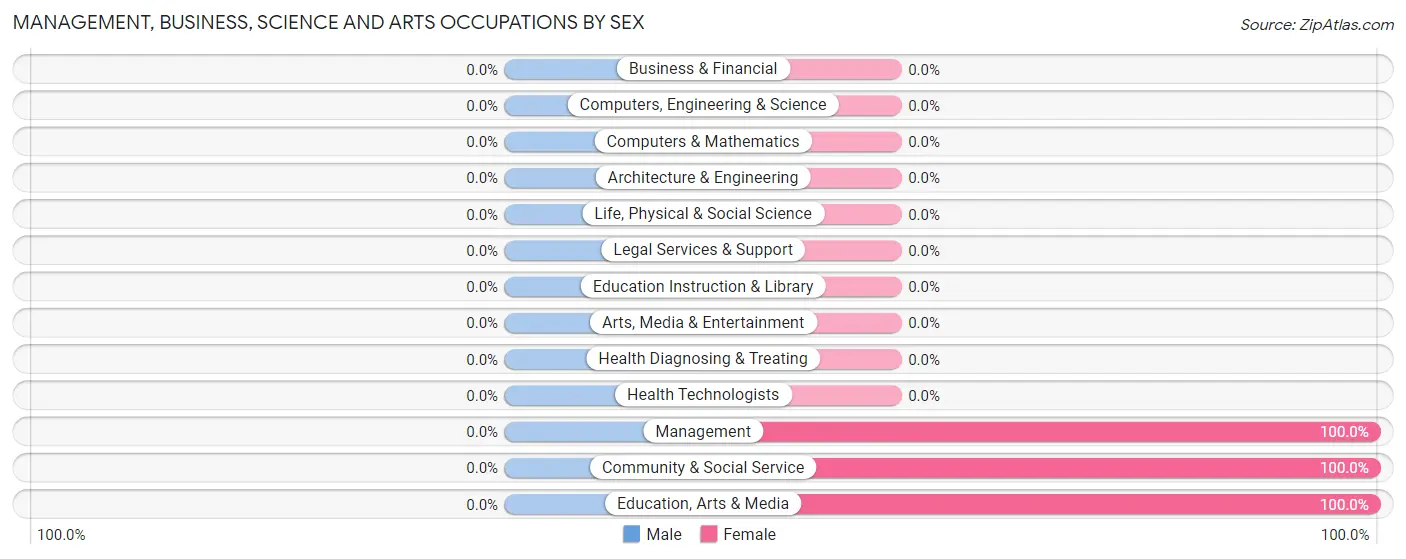
| Occupation | Male | Female |
| Management | 0 (0.0%) | 12 (100.0%) |
| Business & Financial | 0 (0.0%) | 0 (0.0%) |
| Computers, Engineering & Science | 0 (0.0%) | 0 (0.0%) |
| Computers & Mathematics | 0 (0.0%) | 0 (0.0%) |
| Architecture & Engineering | 0 (0.0%) | 0 (0.0%) |
| Life, Physical & Social Science | 0 (0.0%) | 0 (0.0%) |
| Community & Social Service | 0 (0.0%) | 9 (100.0%) |
| Education, Arts & Media | 0 (0.0%) | 9 (100.0%) |
| Legal Services & Support | 0 (0.0%) | 0 (0.0%) |
| Education Instruction & Library | 0 (0.0%) | 0 (0.0%) |
| Arts, Media & Entertainment | 0 (0.0%) | 0 (0.0%) |
| Health Diagnosing & Treating | 0 (0.0%) | 0 (0.0%) |
| Health Technologists | 0 (0.0%) | 0 (0.0%) |
| Total (Category) | 0 (0.0%) | 21 (100.0%) |
| Total (Overall) | 20 (37.7%) | 33 (62.3%) |
Services Occupations
The most common Services occupations in Hillsboro are , and Healthcare Support (12 | 22.6%).
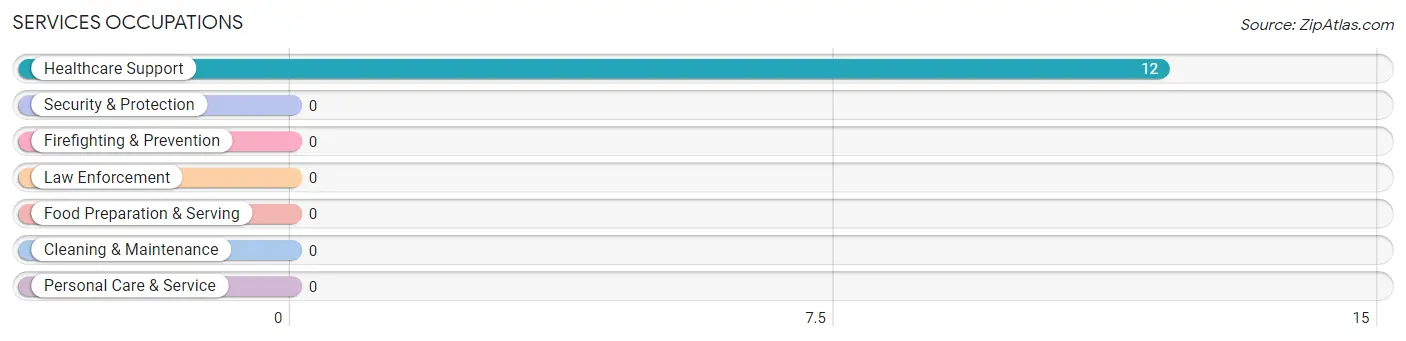
Services Occupations by Sex
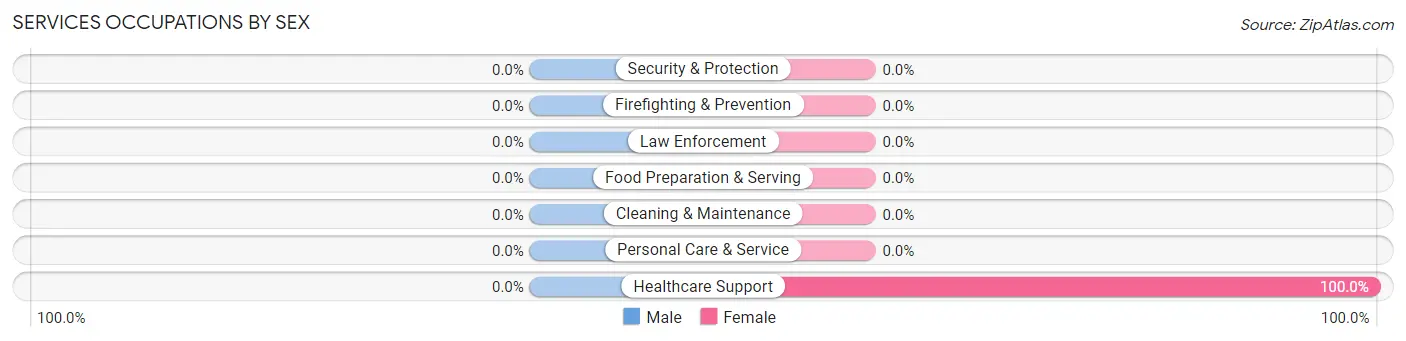
| Occupation | Male | Female |
| Healthcare Support | 0 (0.0%) | 12 (100.0%) |
| Security & Protection | 0 (0.0%) | 0 (0.0%) |
| Firefighting & Prevention | 0 (0.0%) | 0 (0.0%) |
| Law Enforcement | 0 (0.0%) | 0 (0.0%) |
| Food Preparation & Serving | 0 (0.0%) | 0 (0.0%) |
| Cleaning & Maintenance | 0 (0.0%) | 0 (0.0%) |
| Personal Care & Service | 0 (0.0%) | 0 (0.0%) |
| Total (Category) | 0 (0.0%) | 12 (100.0%) |
| Total (Overall) | 20 (37.7%) | 33 (62.3%) |
Sales and Office Occupations
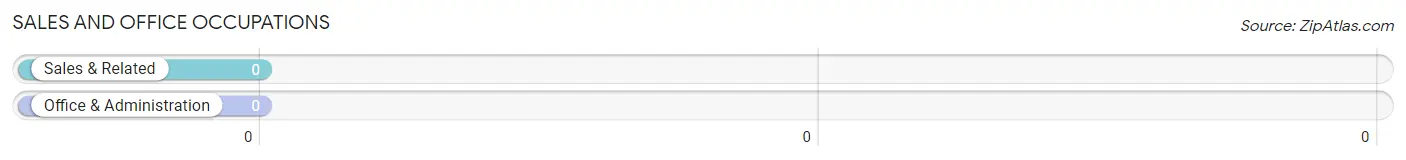
Sales and Office Occupations by Sex
| Occupation | Male | Female |
| Sales & Related | 0 (0.0%) | 0 (0.0%) |
| Office & Administration | 0 (0.0%) | 0 (0.0%) |
| Total (Category) | 0 (0.0%) | 0 (0.0%) |
| Total (Overall) | 20 (37.7%) | 33 (62.3%) |
Natural Resources, Construction and Maintenance Occupations
Natural Resources, Construction and Maintenance Occupations by Sex
| Occupation | Male | Female |
| Farming, Fishing & Forestry | 0 (0.0%) | 0 (0.0%) |
| Construction & Extraction | 0 (0.0%) | 0 (0.0%) |
| Installation, Maintenance & Repair | 0 (0.0%) | 0 (0.0%) |
| Total (Category) | 0 (0.0%) | 0 (0.0%) |
| Total (Overall) | 20 (37.7%) | 33 (62.3%) |
Production, Transportation and Moving Occupations
The most common Production, Transportation and Moving occupations in Hillsboro are , and Material Moving (20 | 37.7%).
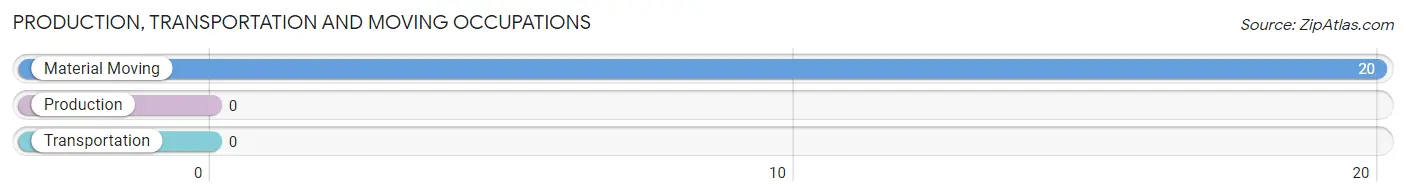
Production, Transportation and Moving Occupations by Sex
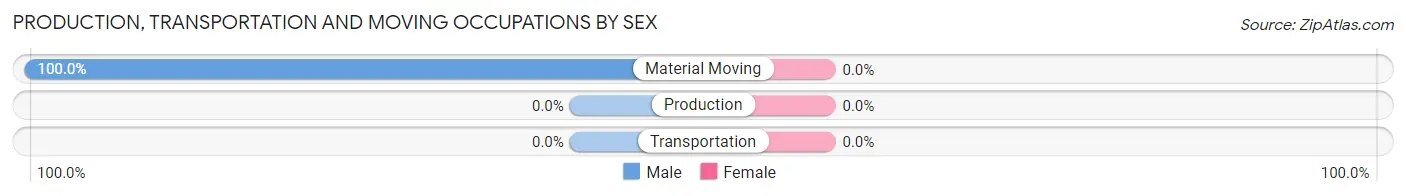
| Occupation | Male | Female |
| Production | 0 (0.0%) | 0 (0.0%) |
| Transportation | 0 (0.0%) | 0 (0.0%) |
| Material Moving | 20 (100.0%) | 0 (0.0%) |
| Total (Category) | 20 (100.0%) | 0 (0.0%) |
| Total (Overall) | 20 (37.7%) | 33 (62.3%) |
Employment Industries by Sex in Hillsboro
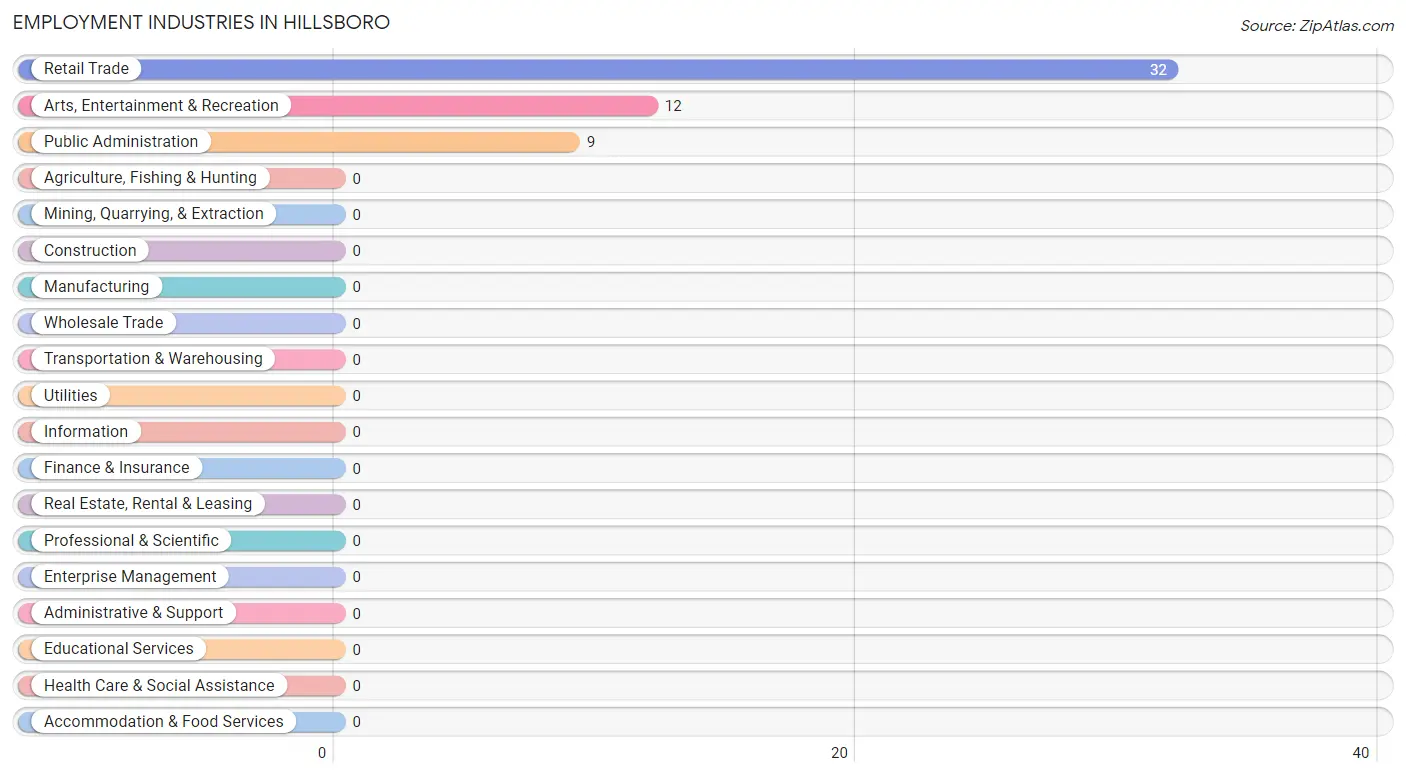
Employment Industries in Hillsboro
The major employment industries in Hillsboro include Retail Trade (32 | 60.4%), Arts, Entertainment & Recreation (12 | 22.6%), and Public Administration (9 | 17.0%).
Employment Industries by Sex in Hillsboro
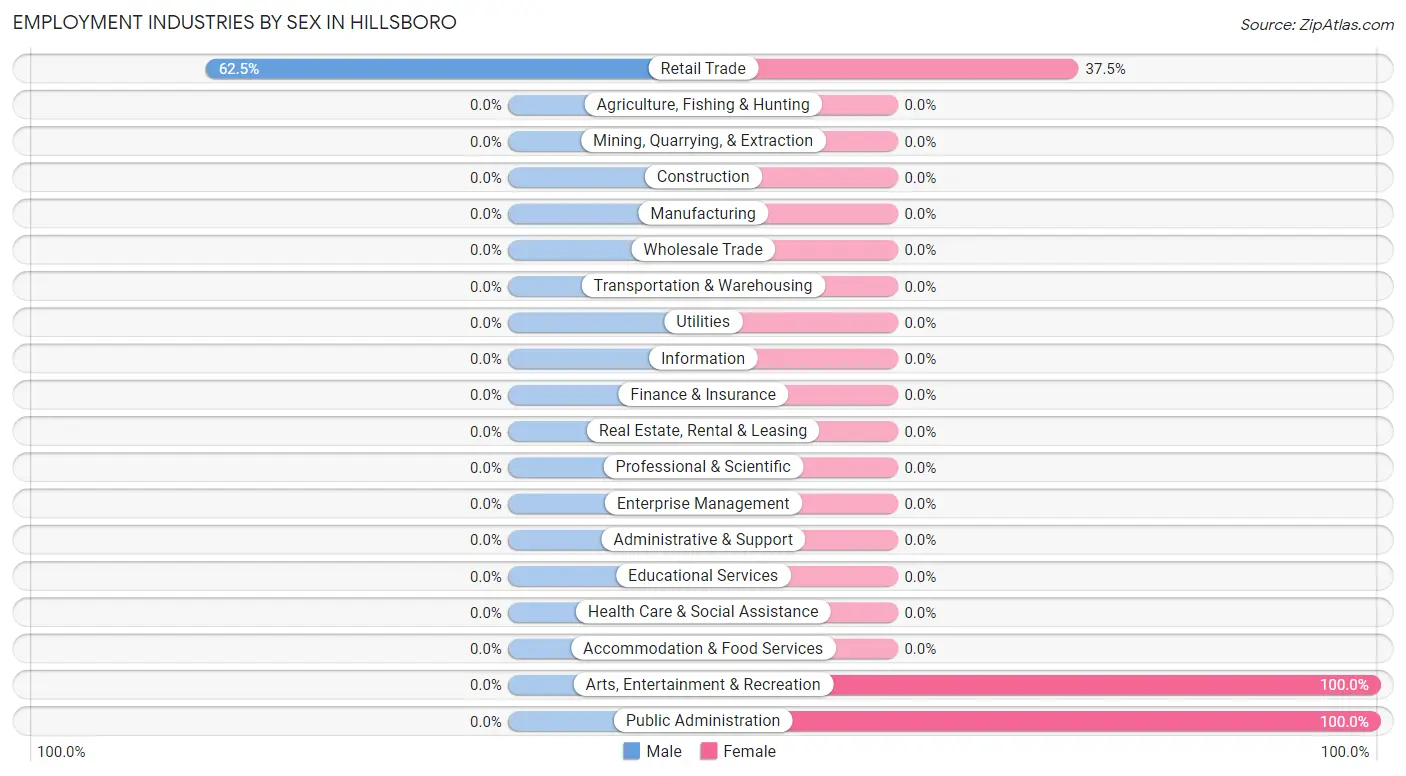
| Industry | Male | Female |
| Agriculture, Fishing & Hunting | 0 (0.0%) | 0 (0.0%) |
| Mining, Quarrying, & Extraction | 0 (0.0%) | 0 (0.0%) |
| Construction | 0 (0.0%) | 0 (0.0%) |
| Manufacturing | 0 (0.0%) | 0 (0.0%) |
| Wholesale Trade | 0 (0.0%) | 0 (0.0%) |
| Retail Trade | 20 (62.5%) | 12 (37.5%) |
| Transportation & Warehousing | 0 (0.0%) | 0 (0.0%) |
| Utilities | 0 (0.0%) | 0 (0.0%) |
| Information | 0 (0.0%) | 0 (0.0%) |
| Finance & Insurance | 0 (0.0%) | 0 (0.0%) |
| Real Estate, Rental & Leasing | 0 (0.0%) | 0 (0.0%) |
| Professional & Scientific | 0 (0.0%) | 0 (0.0%) |
| Enterprise Management | 0 (0.0%) | 0 (0.0%) |
| Administrative & Support | 0 (0.0%) | 0 (0.0%) |
| Educational Services | 0 (0.0%) | 0 (0.0%) |
| Health Care & Social Assistance | 0 (0.0%) | 0 (0.0%) |
| Arts, Entertainment & Recreation | 0 (0.0%) | 12 (100.0%) |
| Accommodation & Food Services | 0 (0.0%) | 0 (0.0%) |
| Public Administration | 0 (0.0%) | 9 (100.0%) |
| Total | 20 (37.7%) | 33 (62.3%) |
Education in Hillsboro
School Enrollment in Hillsboro
The most common levels of schooling among the 24 students in Hillsboro are high school (16 | 66.7%), and middle school (8 | 33.3%).
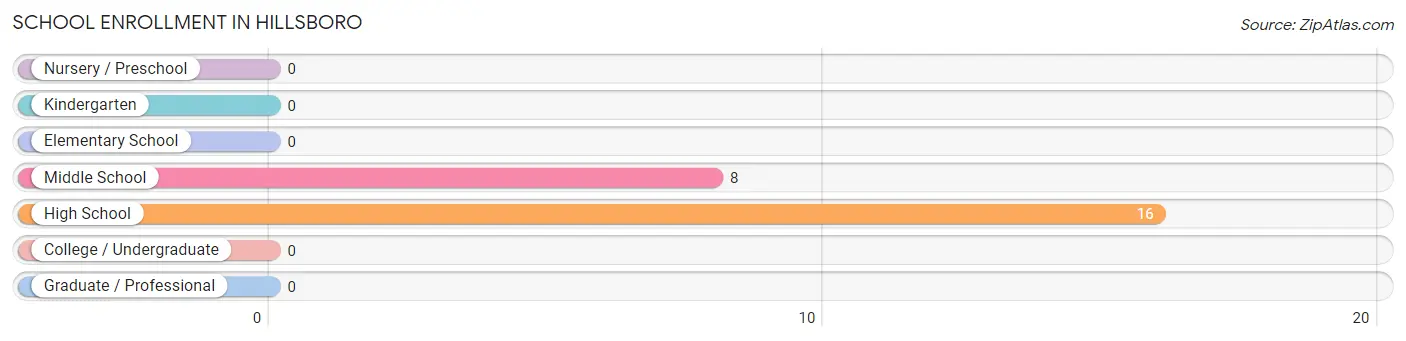
| School Level | # Students | % Students |
| Nursery / Preschool | 0 | 0.0% |
| Kindergarten | 0 | 0.0% |
| Elementary School | 0 | 0.0% |
| Middle School | 8 | 33.3% |
| High School | 16 | 66.7% |
| College / Undergraduate | 0 | 0.0% |
| Graduate / Professional | 0 | 0.0% |
| Total | 24 | 100.0% |
School Enrollment by Age by Funding Source in Hillsboro
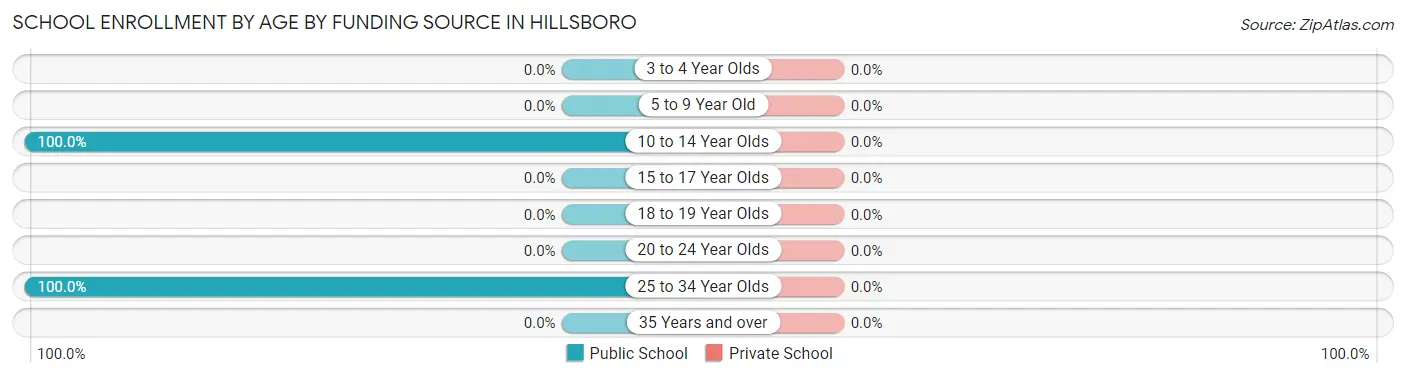
| Age Bracket | Public School | Private School |
| 3 to 4 Year Olds | 0 (0.0%) | 0 (0.0%) |
| 5 to 9 Year Old | 0 (0.0%) | 0 (0.0%) |
| 10 to 14 Year Olds | 8 (100.0%) | 0 (0.0%) |
| 15 to 17 Year Olds | 0 (0.0%) | 0 (0.0%) |
| 18 to 19 Year Olds | 0 (0.0%) | 0 (0.0%) |
| 20 to 24 Year Olds | 0 (0.0%) | 0 (0.0%) |
| 25 to 34 Year Olds | 16 (100.0%) | 0 (0.0%) |
| 35 Years and over | 0 (0.0%) | 0 (0.0%) |
| Total | 24 (100.0%) | 0 (0.0%) |
Educational Attainment by Field of Study in Hillsboro
Liberal arts & history (18 | 30.0%), business (12 | 20.0%), education (12 | 20.0%), psychology (9 | 15.0%), and arts & humanities (9 | 15.0%) are the most common fields of study among 60 individuals in Hillsboro who have obtained a bachelor's degree or higher.
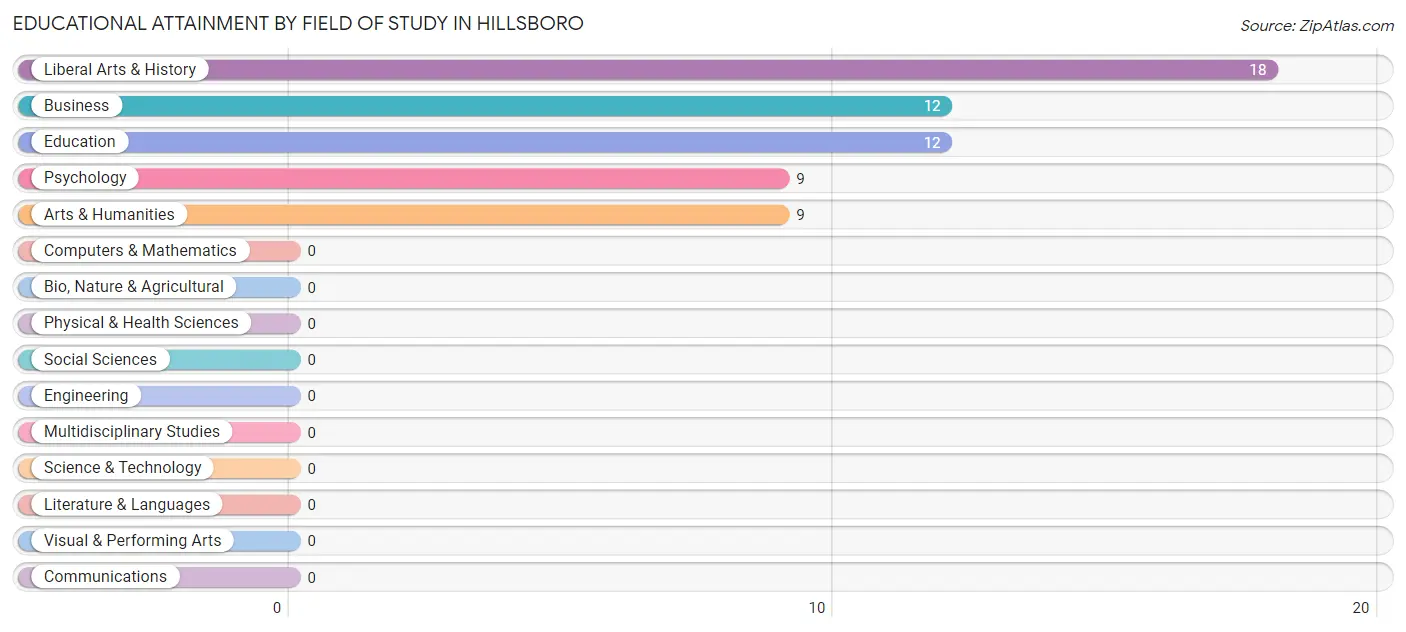
| Field of Study | # Graduates | % Graduates |
| Computers & Mathematics | 0 | 0.0% |
| Bio, Nature & Agricultural | 0 | 0.0% |
| Physical & Health Sciences | 0 | 0.0% |
| Psychology | 9 | 15.0% |
| Social Sciences | 0 | 0.0% |
| Engineering | 0 | 0.0% |
| Multidisciplinary Studies | 0 | 0.0% |
| Science & Technology | 0 | 0.0% |
| Business | 12 | 20.0% |
| Education | 12 | 20.0% |
| Literature & Languages | 0 | 0.0% |
| Liberal Arts & History | 18 | 30.0% |
| Visual & Performing Arts | 0 | 0.0% |
| Communications | 0 | 0.0% |
| Arts & Humanities | 9 | 15.0% |
| Total | 60 | 100.0% |
Transportation & Commute in Hillsboro
Vehicle Availability by Sex in Hillsboro
The most prevalent vehicle ownership categories in Hillsboro are males with 5 or more vehicles (20, accounting for 100.0%) and females with 5 or more vehicles (12, making up 60.6%).
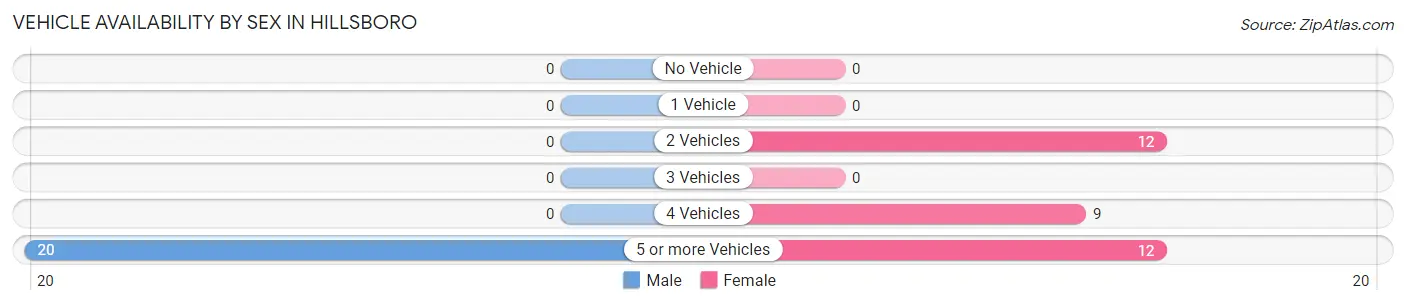
| Vehicles Available | Male | Female |
| No Vehicle | 0 (0.0%) | 0 (0.0%) |
| 1 Vehicle | 0 (0.0%) | 0 (0.0%) |
| 2 Vehicles | 0 (0.0%) | 12 (36.4%) |
| 3 Vehicles | 0 (0.0%) | 0 (0.0%) |
| 4 Vehicles | 0 (0.0%) | 9 (27.3%) |
| 5 or more Vehicles | 20 (100.0%) | 12 (36.4%) |
| Total | 20 (100.0%) | 33 (100.0%) |
Commute Time in Hillsboro
The most frequently occuring commute durations in Hillsboro are 20 to 24 minutes (41 commuters, 77.4%), 25 to 29 minutes (12 commuters, 22.6%), and less than 5 minutes (0 commuters, 0.0%).
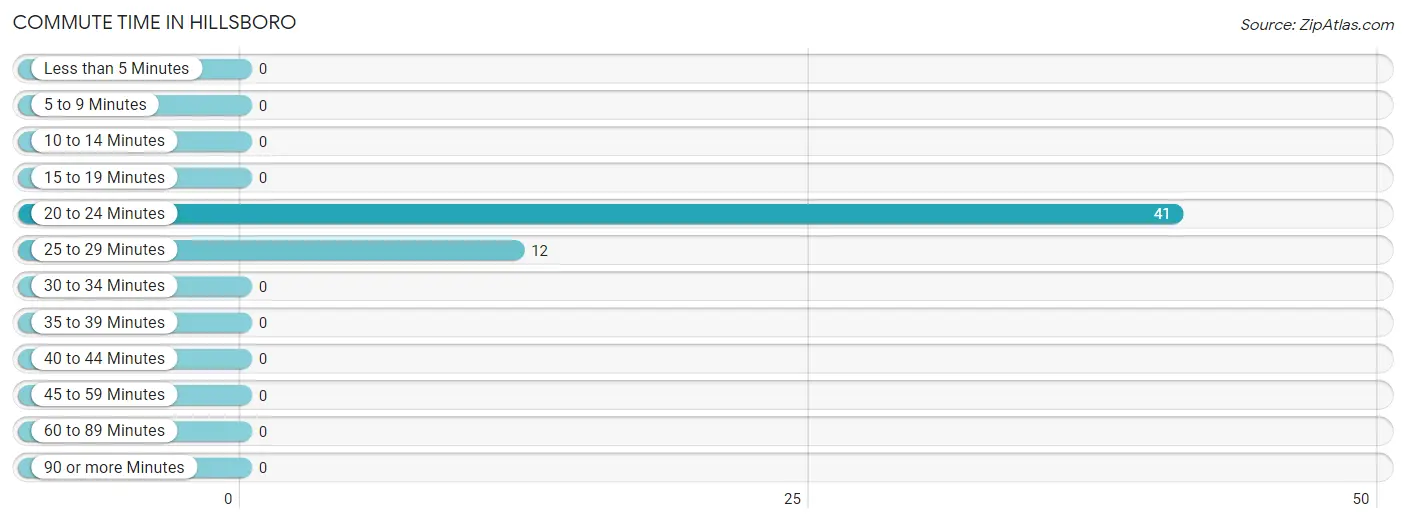
| Commute Time | # Commuters | % Commuters |
| Less than 5 Minutes | 0 | 0.0% |
| 5 to 9 Minutes | 0 | 0.0% |
| 10 to 14 Minutes | 0 | 0.0% |
| 15 to 19 Minutes | 0 | 0.0% |
| 20 to 24 Minutes | 41 | 77.4% |
| 25 to 29 Minutes | 12 | 22.6% |
| 30 to 34 Minutes | 0 | 0.0% |
| 35 to 39 Minutes | 0 | 0.0% |
| 40 to 44 Minutes | 0 | 0.0% |
| 45 to 59 Minutes | 0 | 0.0% |
| 60 to 89 Minutes | 0 | 0.0% |
| 90 or more Minutes | 0 | 0.0% |
Commute Time by Sex in Hillsboro
The most common commute times in Hillsboro are 20 to 24 minutes (20 commuters, 100.0%) for males and 20 to 24 minutes (21 commuters, 63.6%) for females.
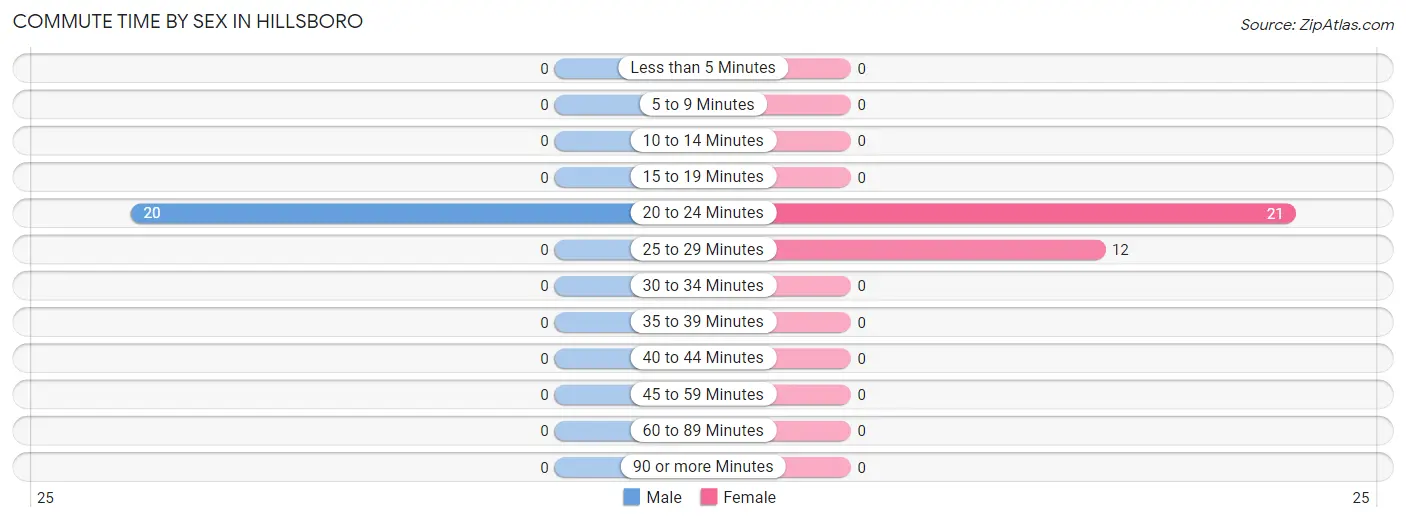
| Commute Time | Male | Female |
| Less than 5 Minutes | 0 (0.0%) | 0 (0.0%) |
| 5 to 9 Minutes | 0 (0.0%) | 0 (0.0%) |
| 10 to 14 Minutes | 0 (0.0%) | 0 (0.0%) |
| 15 to 19 Minutes | 0 (0.0%) | 0 (0.0%) |
| 20 to 24 Minutes | 20 (100.0%) | 21 (63.6%) |
| 25 to 29 Minutes | 0 (0.0%) | 12 (36.4%) |
| 30 to 34 Minutes | 0 (0.0%) | 0 (0.0%) |
| 35 to 39 Minutes | 0 (0.0%) | 0 (0.0%) |
| 40 to 44 Minutes | 0 (0.0%) | 0 (0.0%) |
| 45 to 59 Minutes | 0 (0.0%) | 0 (0.0%) |
| 60 to 89 Minutes | 0 (0.0%) | 0 (0.0%) |
| 90 or more Minutes | 0 (0.0%) | 0 (0.0%) |
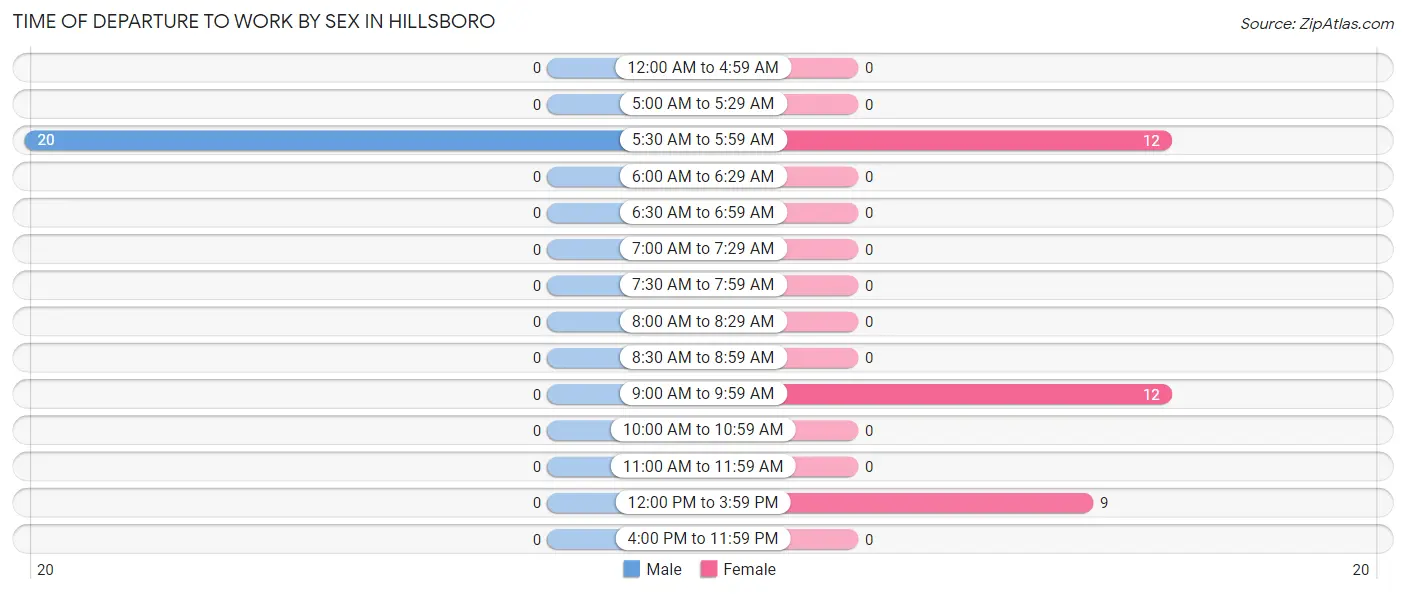
Time of Departure to Work by Sex in Hillsboro
The most frequent times of departure to work in Hillsboro are 5:30 AM to 5:59 AM (20, 100.0%) for males and 5:30 AM to 5:59 AM (12, 36.4%) for females.
| Time of Departure | Male | Female |
| 12:00 AM to 4:59 AM | 0 (0.0%) | 0 (0.0%) |
| 5:00 AM to 5:29 AM | 0 (0.0%) | 0 (0.0%) |
| 5:30 AM to 5:59 AM | 20 (100.0%) | 12 (36.4%) |
| 6:00 AM to 6:29 AM | 0 (0.0%) | 0 (0.0%) |
| 6:30 AM to 6:59 AM | 0 (0.0%) | 0 (0.0%) |
| 7:00 AM to 7:29 AM | 0 (0.0%) | 0 (0.0%) |
| 7:30 AM to 7:59 AM | 0 (0.0%) | 0 (0.0%) |
| 8:00 AM to 8:29 AM | 0 (0.0%) | 0 (0.0%) |
| 8:30 AM to 8:59 AM | 0 (0.0%) | 0 (0.0%) |
| 9:00 AM to 9:59 AM | 0 (0.0%) | 12 (36.4%) |
| 10:00 AM to 10:59 AM | 0 (0.0%) | 0 (0.0%) |
| 11:00 AM to 11:59 AM | 0 (0.0%) | 0 (0.0%) |
| 12:00 PM to 3:59 PM | 0 (0.0%) | 9 (27.3%) |
| 4:00 PM to 11:59 PM | 0 (0.0%) | 0 (0.0%) |
| Total | 20 (100.0%) | 33 (100.0%) |
Housing Occupancy in Hillsboro
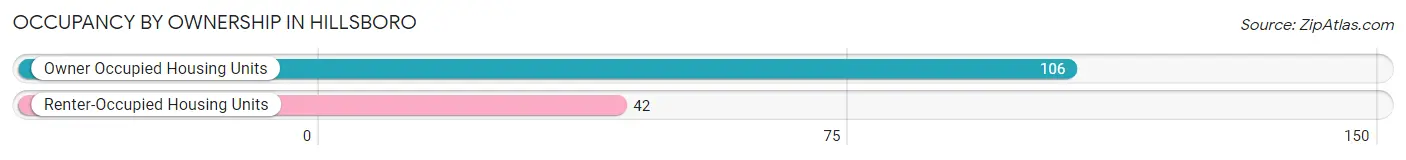
Occupancy by Ownership in Hillsboro
Of the total 148 dwellings in Hillsboro, owner-occupied units account for 106 (71.6%), while renter-occupied units make up 42 (28.4%).
| Occupancy | # Housing Units | % Housing Units |
| Owner Occupied Housing Units | 106 | 71.6% |
| Renter-Occupied Housing Units | 42 | 28.4% |
| Total Occupied Housing Units | 148 | 100.0% |
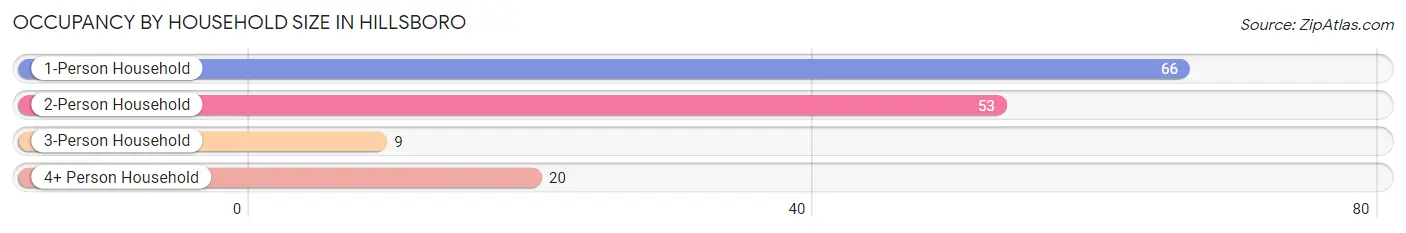
Occupancy by Household Size in Hillsboro
| Household Size | # Housing Units | % Housing Units |
| 1-Person Household | 66 | 44.6% |
| 2-Person Household | 53 | 35.8% |
| 3-Person Household | 9 | 6.1% |
| 4+ Person Household | 20 | 13.5% |
| Total Housing Units | 148 | 100.0% |
Occupancy by Ownership by Household Size in Hillsboro
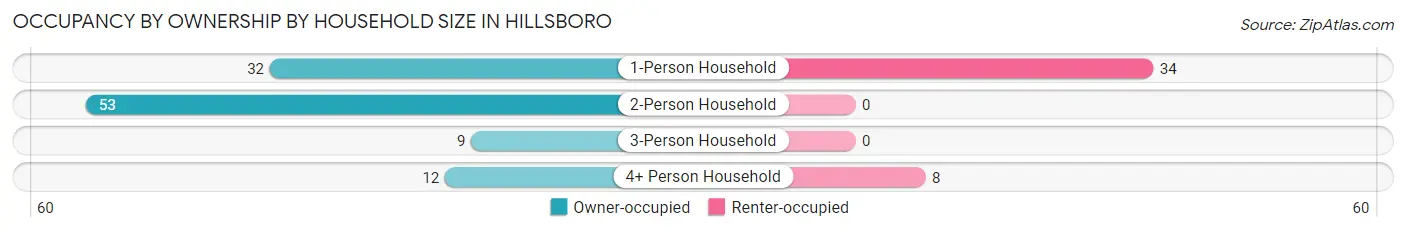
| Household Size | Owner-occupied | Renter-occupied |
| 1-Person Household | 32 (48.5%) | 34 (51.5%) |
| 2-Person Household | 53 (100.0%) | 0 (0.0%) |
| 3-Person Household | 9 (100.0%) | 0 (0.0%) |
| 4+ Person Household | 12 (60.0%) | 8 (40.0%) |
| Total Housing Units | 106 (71.6%) | 42 (28.4%) |
Occupancy by Educational Attainment in Hillsboro
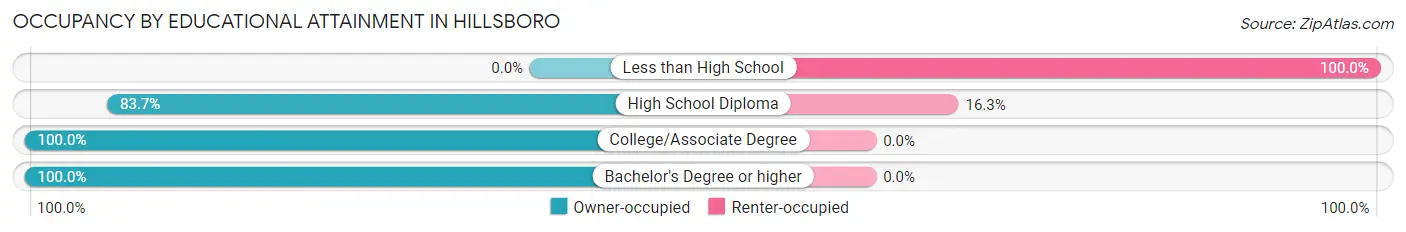
| Household Size | Owner-occupied | Renter-occupied |
| Less than High School | 0 (0.0%) | 34 (100.0%) |
| High School Diploma | 41 (83.7%) | 8 (16.3%) |
| College/Associate Degree | 35 (100.0%) | 0 (0.0%) |
| Bachelor's Degree or higher | 30 (100.0%) | 0 (0.0%) |
Occupancy by Age of Householder in Hillsboro
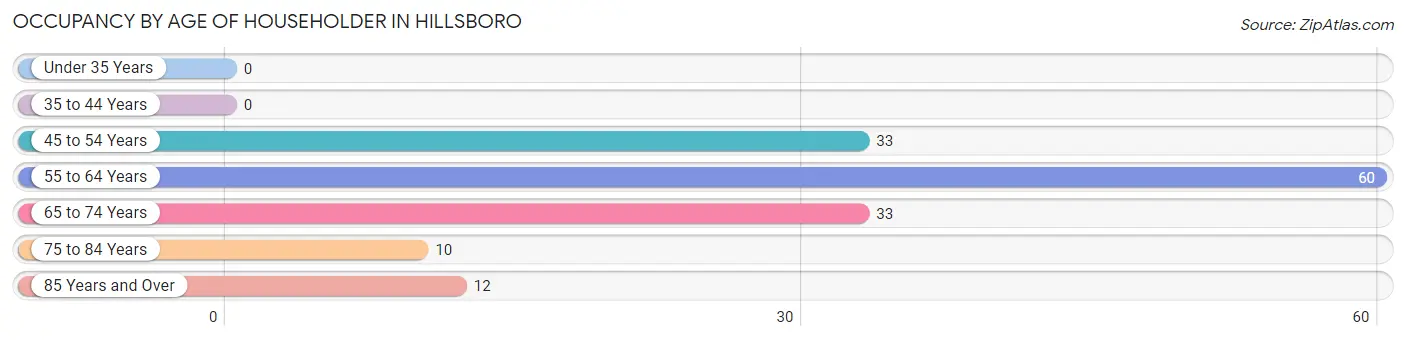
| Age Bracket | # Households | % Households |
| Under 35 Years | 0 | 0.0% |
| 35 to 44 Years | 0 | 0.0% |
| 45 to 54 Years | 33 | 22.3% |
| 55 to 64 Years | 60 | 40.5% |
| 65 to 74 Years | 33 | 22.3% |
| 75 to 84 Years | 10 | 6.8% |
| 85 Years and Over | 12 | 8.1% |
| Total | 148 | 100.0% |
Housing Finances in Hillsboro
Median Income by Occupancy in Hillsboro
| Occupancy Type | # Households | Median Income |
| Owner-Occupied | 106 (71.6%) | $0 |
| Renter-Occupied | 42 (28.4%) | $0 |
| Average | 148 (100.0%) | $0 |
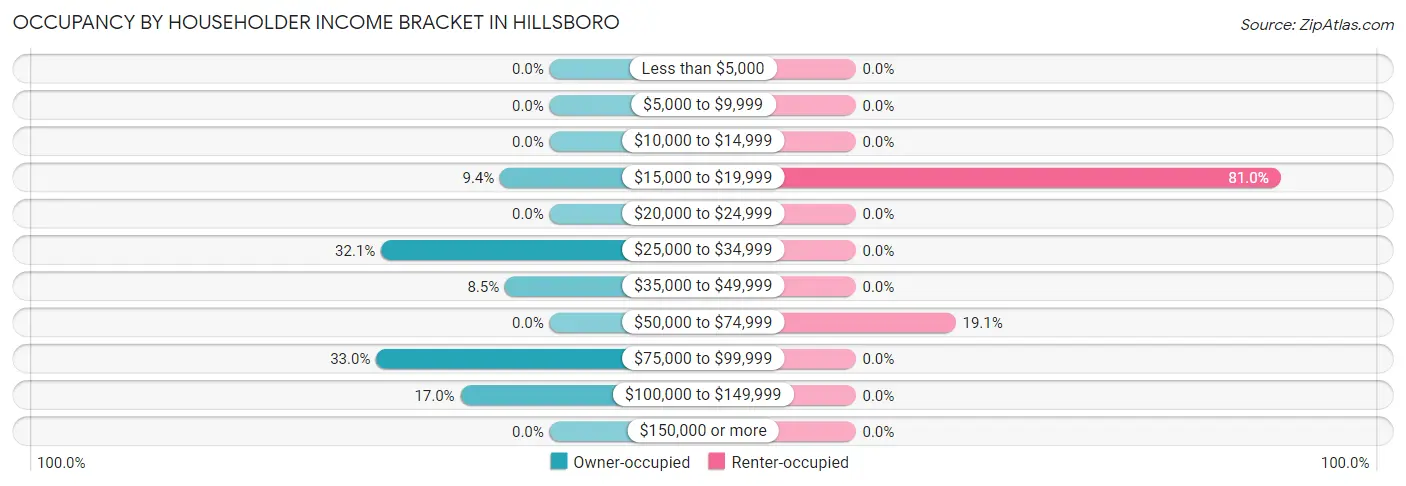
Occupancy by Householder Income Bracket in Hillsboro
| Income Bracket | Owner-occupied | Renter-occupied |
| Less than $5,000 | 0 (0.0%) | 0 (0.0%) |
| $5,000 to $9,999 | 0 (0.0%) | 0 (0.0%) |
| $10,000 to $14,999 | 0 (0.0%) | 0 (0.0%) |
| $15,000 to $19,999 | 10 (9.4%) | 34 (80.9%) |
| $20,000 to $24,999 | 0 (0.0%) | 0 (0.0%) |
| $25,000 to $34,999 | 34 (32.1%) | 0 (0.0%) |
| $35,000 to $49,999 | 9 (8.5%) | 0 (0.0%) |
| $50,000 to $74,999 | 0 (0.0%) | 8 (19.1%) |
| $75,000 to $99,999 | 35 (33.0%) | 0 (0.0%) |
| $100,000 to $149,999 | 18 (17.0%) | 0 (0.0%) |
| $150,000 or more | 0 (0.0%) | 0 (0.0%) |
| Total | 106 (100.0%) | 42 (100.0%) |
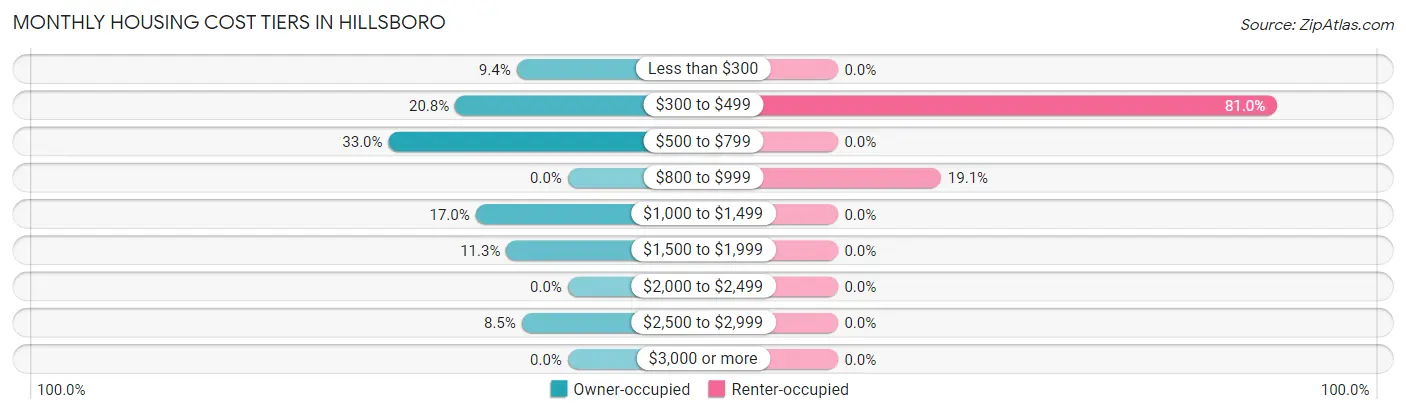
Monthly Housing Cost Tiers in Hillsboro
| Monthly Cost | Owner-occupied | Renter-occupied |
| Less than $300 | 10 (9.4%) | 0 (0.0%) |
| $300 to $499 | 22 (20.7%) | 34 (80.9%) |
| $500 to $799 | 35 (33.0%) | 0 (0.0%) |
| $800 to $999 | 0 (0.0%) | 8 (19.1%) |
| $1,000 to $1,499 | 18 (17.0%) | 0 (0.0%) |
| $1,500 to $1,999 | 12 (11.3%) | 0 (0.0%) |
| $2,000 to $2,499 | 0 (0.0%) | 0 (0.0%) |
| $2,500 to $2,999 | 9 (8.5%) | 0 (0.0%) |
| $3,000 or more | 0 (0.0%) | 0 (0.0%) |
| Total | 106 (100.0%) | 42 (100.0%) |
Physical Housing Characteristics in Hillsboro
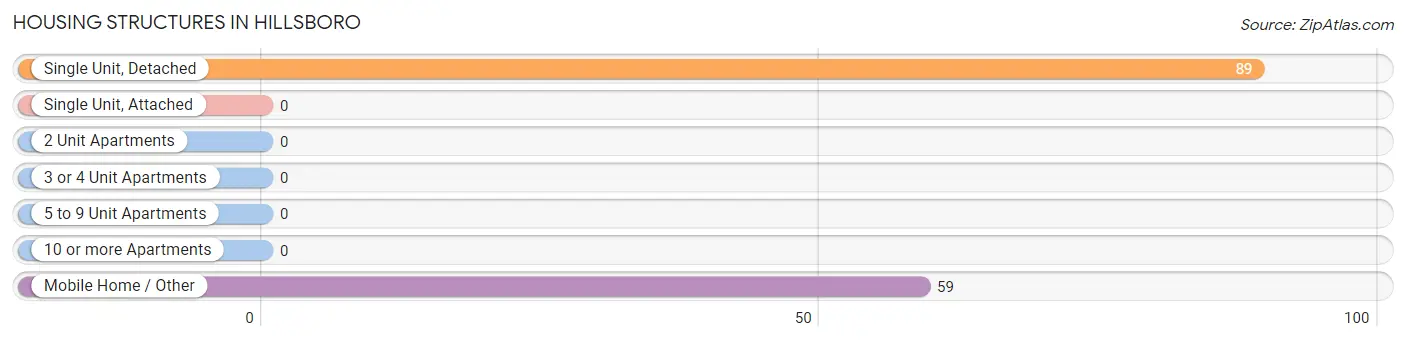
Housing Structures in Hillsboro
| Structure Type | # Housing Units | % Housing Units |
| Single Unit, Detached | 89 | 60.1% |
| Single Unit, Attached | 0 | 0.0% |
| 2 Unit Apartments | 0 | 0.0% |
| 3 or 4 Unit Apartments | 0 | 0.0% |
| 5 to 9 Unit Apartments | 0 | 0.0% |
| 10 or more Apartments | 0 | 0.0% |
| Mobile Home / Other | 59 | 39.9% |
| Total | 148 | 100.0% |
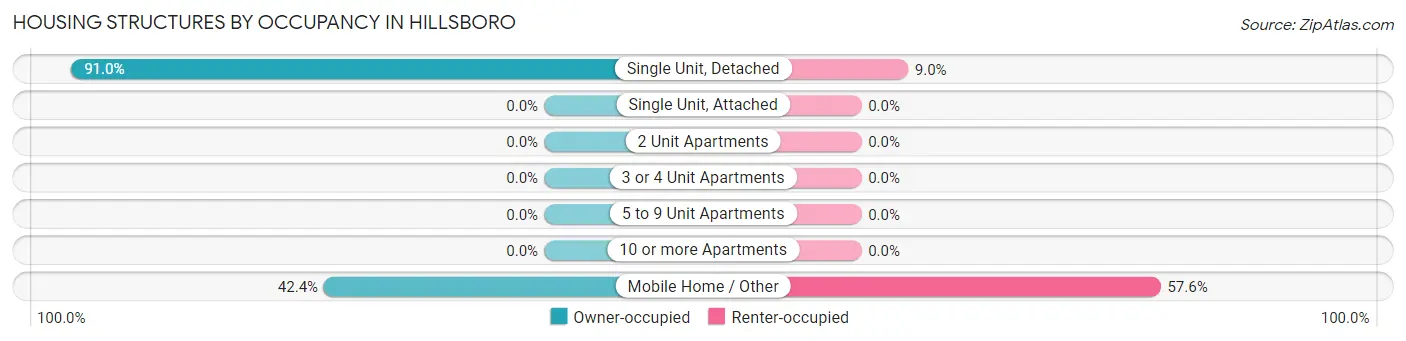
Housing Structures by Occupancy in Hillsboro
| Structure Type | Owner-occupied | Renter-occupied |
| Single Unit, Detached | 81 (91.0%) | 8 (9.0%) |
| Single Unit, Attached | 0 (0.0%) | 0 (0.0%) |
| 2 Unit Apartments | 0 (0.0%) | 0 (0.0%) |
| 3 or 4 Unit Apartments | 0 (0.0%) | 0 (0.0%) |
| 5 to 9 Unit Apartments | 0 (0.0%) | 0 (0.0%) |
| 10 or more Apartments | 0 (0.0%) | 0 (0.0%) |
| Mobile Home / Other | 25 (42.4%) | 34 (57.6%) |
| Total | 106 (71.6%) | 42 (28.4%) |
Housing Structures by Number of Rooms in Hillsboro
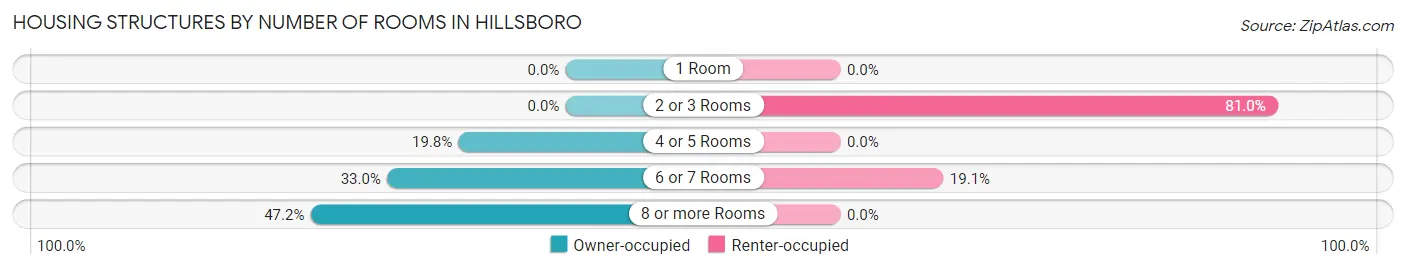
| Number of Rooms | Owner-occupied | Renter-occupied |
| 1 Room | 0 (0.0%) | 0 (0.0%) |
| 2 or 3 Rooms | 0 (0.0%) | 34 (80.9%) |
| 4 or 5 Rooms | 21 (19.8%) | 0 (0.0%) |
| 6 or 7 Rooms | 35 (33.0%) | 8 (19.1%) |
| 8 or more Rooms | 50 (47.2%) | 0 (0.0%) |
| Total | 106 (100.0%) | 42 (100.0%) |
Housing Structure by Heating Type in Hillsboro
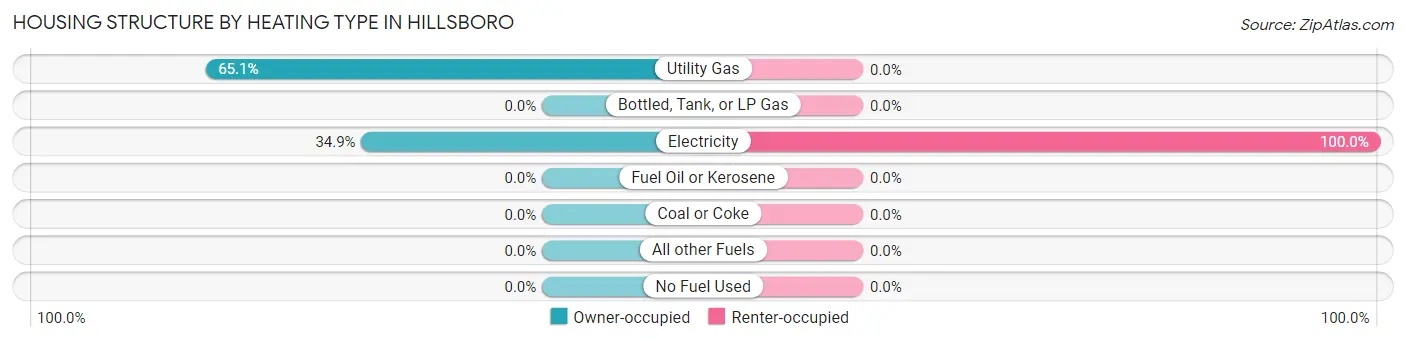
| Heating Type | Owner-occupied | Renter-occupied |
| Utility Gas | 69 (65.1%) | 0 (0.0%) |
| Bottled, Tank, or LP Gas | 0 (0.0%) | 0 (0.0%) |
| Electricity | 37 (34.9%) | 42 (100.0%) |
| Fuel Oil or Kerosene | 0 (0.0%) | 0 (0.0%) |
| Coal or Coke | 0 (0.0%) | 0 (0.0%) |
| All other Fuels | 0 (0.0%) | 0 (0.0%) |
| No Fuel Used | 0 (0.0%) | 0 (0.0%) |
| Total | 106 (100.0%) | 42 (100.0%) |
Household Vehicle Usage in Hillsboro
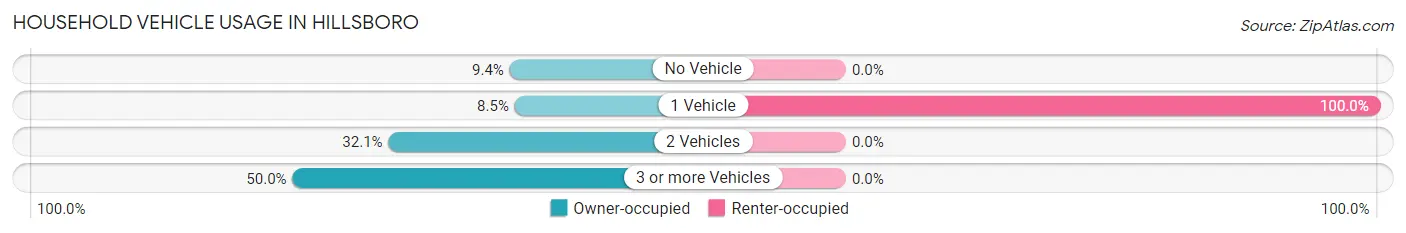
| Vehicles per Household | Owner-occupied | Renter-occupied |
| No Vehicle | 10 (9.4%) | 0 (0.0%) |
| 1 Vehicle | 9 (8.5%) | 42 (100.0%) |
| 2 Vehicles | 34 (32.1%) | 0 (0.0%) |
| 3 or more Vehicles | 53 (50.0%) | 0 (0.0%) |
| Total | 106 (100.0%) | 42 (100.0%) |
Real Estate & Mortgages in Hillsboro
Real Estate and Mortgage Overview in Hillsboro
| Characteristic | Without Mortgage | With Mortgage |
| Housing Units | 67 | 39 |
| Median Property Value | $198,600 | $0 |
| Median Household Income | - | - |
| Monthly Housing Costs | $504 | $0 |
| Real Estate Taxes | $1,255 | $0 |
Property Value by Mortgage Status in Hillsboro
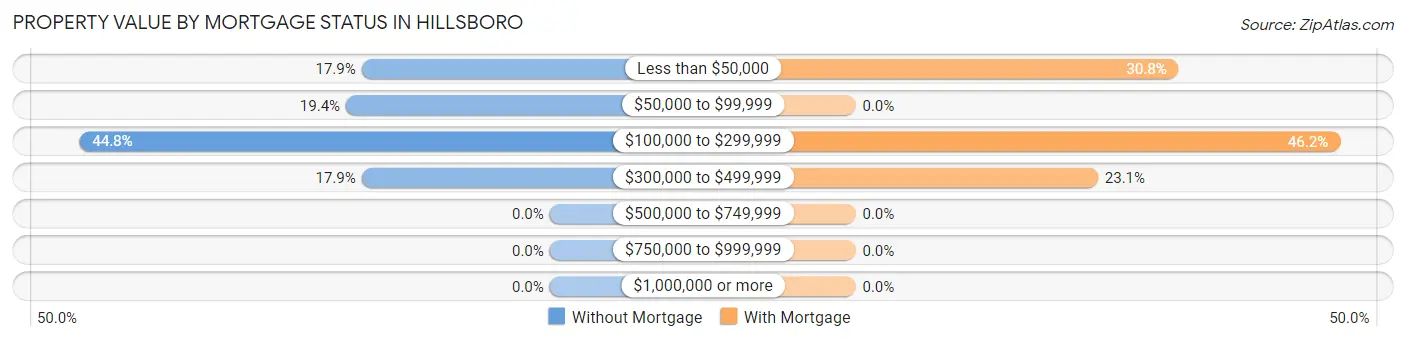
| Property Value | Without Mortgage | With Mortgage |
| Less than $50,000 | 12 (17.9%) | 12 (30.8%) |
| $50,000 to $99,999 | 13 (19.4%) | 0 (0.0%) |
| $100,000 to $299,999 | 30 (44.8%) | 18 (46.2%) |
| $300,000 to $499,999 | 12 (17.9%) | 9 (23.1%) |
| $500,000 to $749,999 | 0 (0.0%) | 0 (0.0%) |
| $750,000 to $999,999 | 0 (0.0%) | 0 (0.0%) |
| $1,000,000 or more | 0 (0.0%) | 0 (0.0%) |
| Total | 67 (100.0%) | 39 (100.0%) |
Household Income by Mortgage Status in Hillsboro
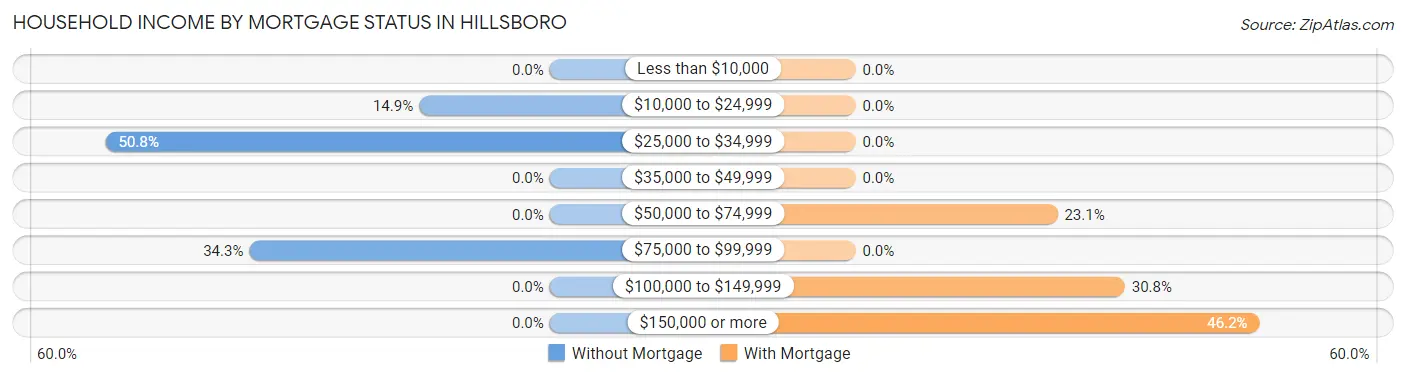
| Household Income | Without Mortgage | With Mortgage |
| Less than $10,000 | 0 (0.0%) | 0 (0.0%) |
| $10,000 to $24,999 | 10 (14.9%) | 0 (0.0%) |
| $25,000 to $34,999 | 34 (50.7%) | 0 (0.0%) |
| $35,000 to $49,999 | 0 (0.0%) | 0 (0.0%) |
| $50,000 to $74,999 | 0 (0.0%) | 9 (23.1%) |
| $75,000 to $99,999 | 23 (34.3%) | 0 (0.0%) |
| $100,000 to $149,999 | 0 (0.0%) | 12 (30.8%) |
| $150,000 or more | 0 (0.0%) | 18 (46.2%) |
| Total | 67 (100.0%) | 39 (100.0%) |
Property Value to Household Income Ratio in Hillsboro
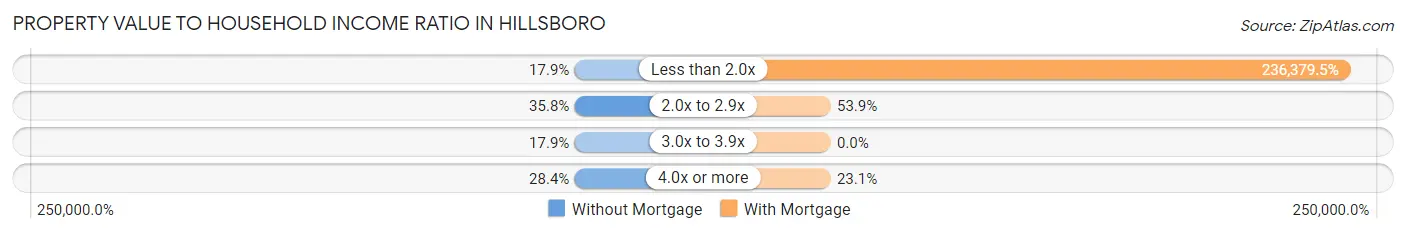
| Value-to-Income Ratio | Without Mortgage | With Mortgage |
| Less than 2.0x | 12 (17.9%) | 92,188 (236,379.5%) |
| 2.0x to 2.9x | 24 (35.8%) | 21 (53.8%) |
| 3.0x to 3.9x | 12 (17.9%) | 0 (0.0%) |
| 4.0x or more | 19 (28.4%) | 9 (23.1%) |
| Total | 67 (100.0%) | 39 (100.0%) |
Real Estate Taxes by Mortgage Status in Hillsboro
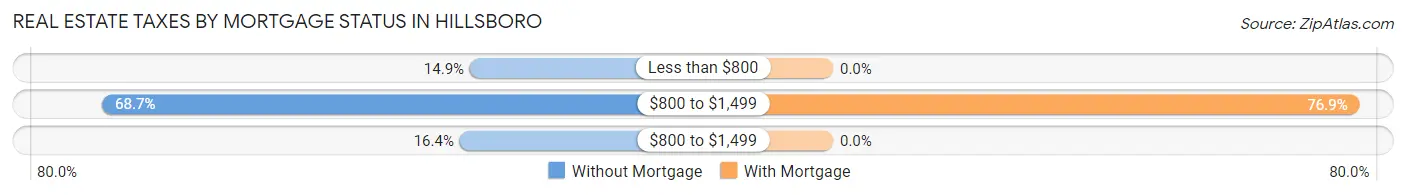
| Property Taxes | Without Mortgage | With Mortgage |
| Less than $800 | 10 (14.9%) | 0 (0.0%) |
| $800 to $1,499 | 46 (68.7%) | 30 (76.9%) |
| $800 to $1,499 | 11 (16.4%) | 0 (0.0%) |
| Total | 67 (100.0%) | 39 (100.0%) |
Health & Disability in Hillsboro
Health Insurance Coverage by Age in Hillsboro
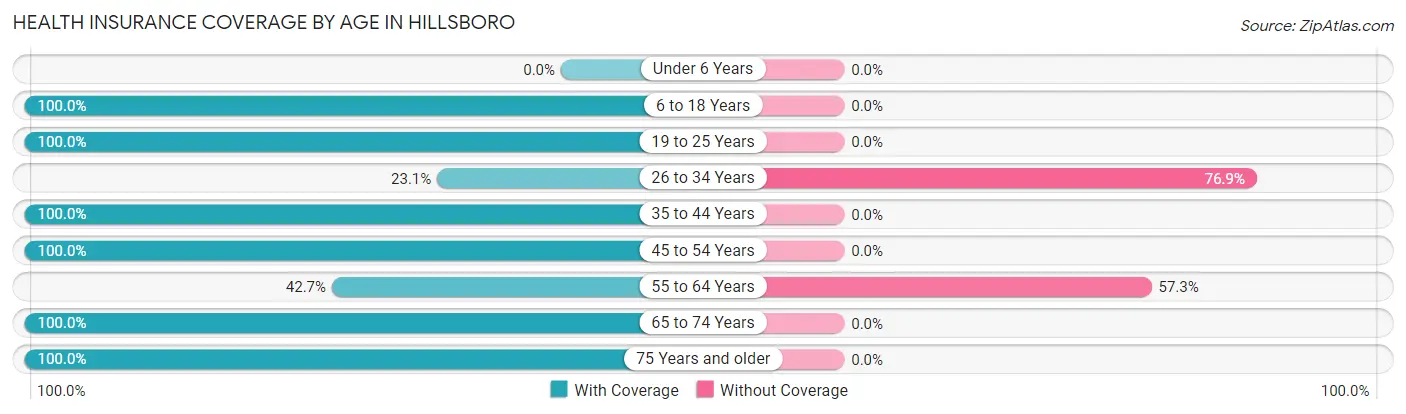
| Age Bracket | With Coverage | Without Coverage |
| Under 6 Years | 0 (0.0%) | 0 (0.0%) |
| 6 to 18 Years | 19 (100.0%) | 0 (0.0%) |
| 19 to 25 Years | 16 (100.0%) | 0 (0.0%) |
| 26 to 34 Years | 12 (23.1%) | 40 (76.9%) |
| 35 to 44 Years | 12 (100.0%) | 0 (0.0%) |
| 45 to 54 Years | 33 (100.0%) | 0 (0.0%) |
| 55 to 64 Years | 38 (42.7%) | 51 (57.3%) |
| 65 to 74 Years | 58 (100.0%) | 0 (0.0%) |
| 75 Years and older | 32 (100.0%) | 0 (0.0%) |
| Total | 220 (70.7%) | 91 (29.3%) |
Health Insurance Coverage by Citizenship Status in Hillsboro
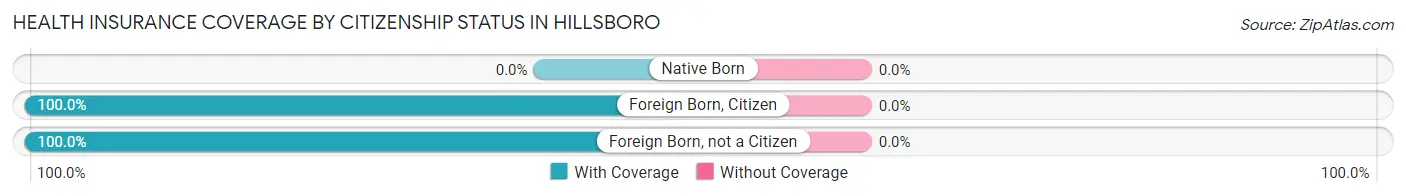
| Citizenship Status | With Coverage | Without Coverage |
| Native Born | 0 (0.0%) | 0 (0.0%) |
| Foreign Born, Citizen | 19 (100.0%) | 0 (0.0%) |
| Foreign Born, not a Citizen | 16 (100.0%) | 0 (0.0%) |
Health Insurance Coverage by Household Income in Hillsboro
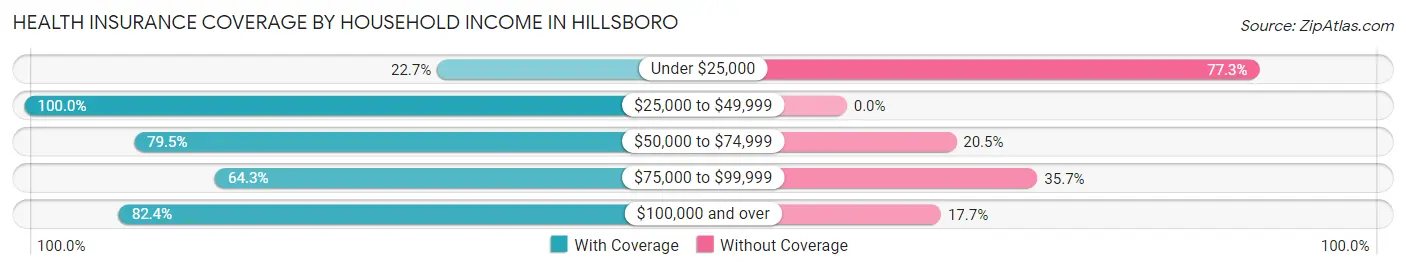
| Household Income | With Coverage | Without Coverage |
| Under $25,000 | 10 (22.7%) | 34 (77.3%) |
| $25,000 to $49,999 | 65 (100.0%) | 0 (0.0%) |
| $50,000 to $74,999 | 31 (79.5%) | 8 (20.5%) |
| $75,000 to $99,999 | 72 (64.3%) | 40 (35.7%) |
| $100,000 and over | 42 (82.4%) | 9 (17.6%) |
Public vs Private Health Insurance Coverage by Age in Hillsboro
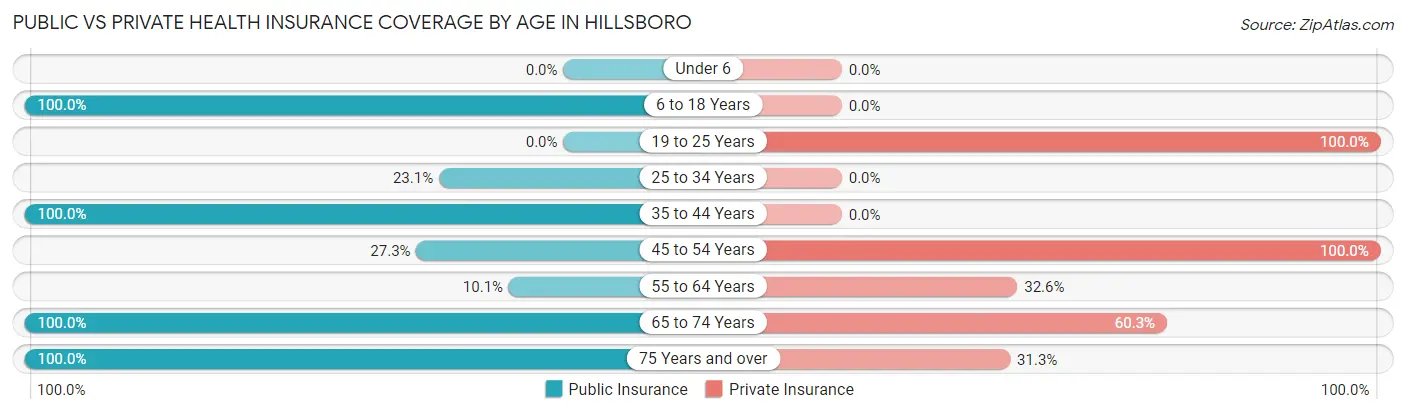
| Age Bracket | Public Insurance | Private Insurance |
| Under 6 | 0 (0.0%) | 0 (0.0%) |
| 6 to 18 Years | 19 (100.0%) | 0 (0.0%) |
| 19 to 25 Years | 0 (0.0%) | 16 (100.0%) |
| 25 to 34 Years | 12 (23.1%) | 0 (0.0%) |
| 35 to 44 Years | 12 (100.0%) | 0 (0.0%) |
| 45 to 54 Years | 9 (27.3%) | 33 (100.0%) |
| 55 to 64 Years | 9 (10.1%) | 29 (32.6%) |
| 65 to 74 Years | 58 (100.0%) | 35 (60.3%) |
| 75 Years and over | 32 (100.0%) | 10 (31.2%) |
| Total | 151 (48.5%) | 123 (39.6%) |
Disability Status by Sex by Age in Hillsboro
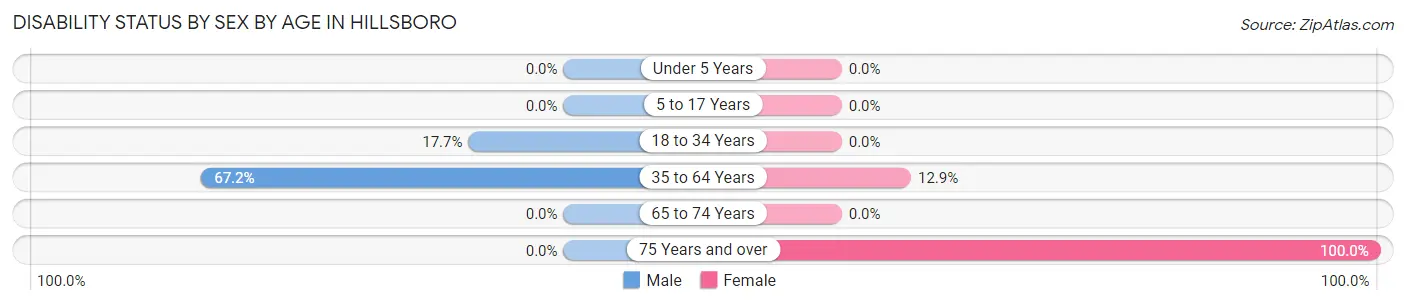
| Age Bracket | Male | Female |
| Under 5 Years | 0 (0.0%) | 0 (0.0%) |
| 5 to 17 Years | 0 (0.0%) | 0 (0.0%) |
| 18 to 34 Years | 12 (17.6%) | 0 (0.0%) |
| 35 to 64 Years | 43 (67.2%) | 9 (12.9%) |
| 65 to 74 Years | 0 (0.0%) | 0 (0.0%) |
| 75 Years and over | 0 (0.0%) | 20 (100.0%) |
Disability Class by Sex by Age in Hillsboro
Disability Class: Hearing Difficulty
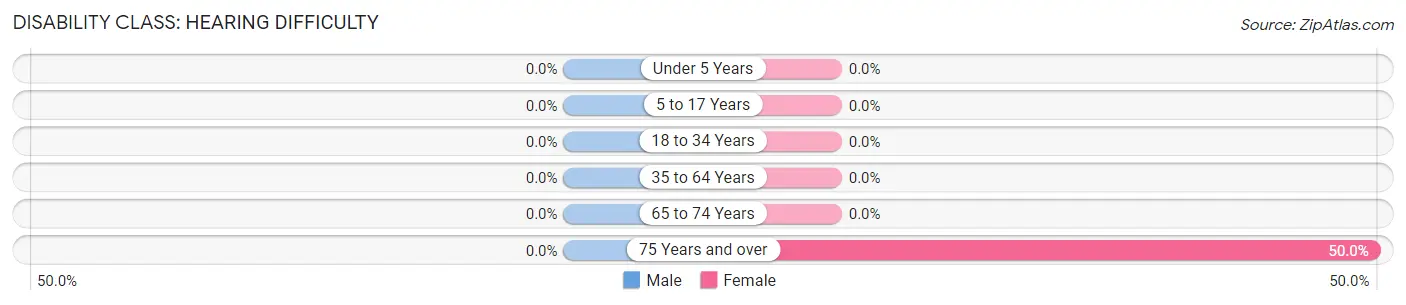
| Age Bracket | Male | Female |
| Under 5 Years | 0 (0.0%) | 0 (0.0%) |
| 5 to 17 Years | 0 (0.0%) | 0 (0.0%) |
| 18 to 34 Years | 0 (0.0%) | 0 (0.0%) |
| 35 to 64 Years | 0 (0.0%) | 0 (0.0%) |
| 65 to 74 Years | 0 (0.0%) | 0 (0.0%) |
| 75 Years and over | 0 (0.0%) | 10 (50.0%) |
Disability Class: Vision Difficulty
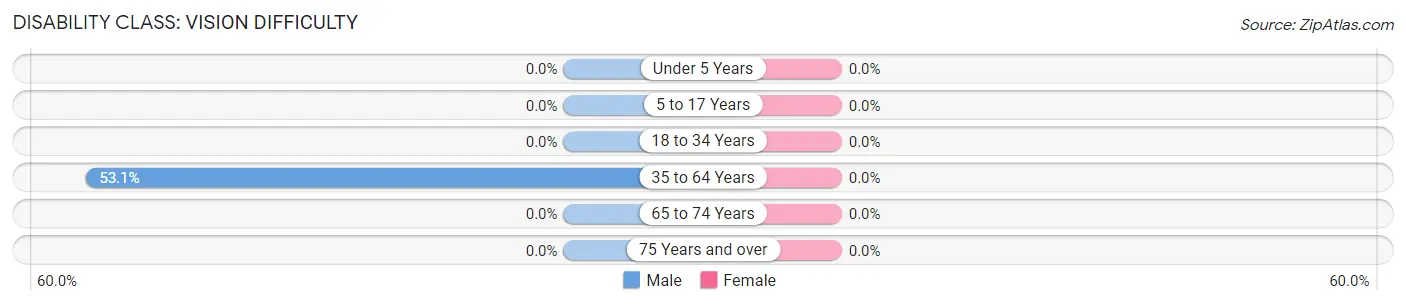
| Age Bracket | Male | Female |
| Under 5 Years | 0 (0.0%) | 0 (0.0%) |
| 5 to 17 Years | 0 (0.0%) | 0 (0.0%) |
| 18 to 34 Years | 0 (0.0%) | 0 (0.0%) |
| 35 to 64 Years | 34 (53.1%) | 0 (0.0%) |
| 65 to 74 Years | 0 (0.0%) | 0 (0.0%) |
| 75 Years and over | 0 (0.0%) | 0 (0.0%) |
Disability Class: Cognitive Difficulty
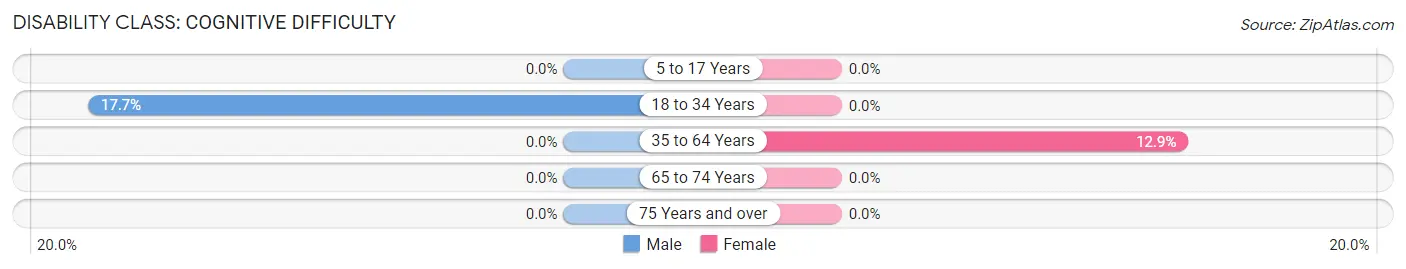
| Age Bracket | Male | Female |
| 5 to 17 Years | 0 (0.0%) | 0 (0.0%) |
| 18 to 34 Years | 12 (17.6%) | 0 (0.0%) |
| 35 to 64 Years | 0 (0.0%) | 9 (12.9%) |
| 65 to 74 Years | 0 (0.0%) | 0 (0.0%) |
| 75 Years and over | 0 (0.0%) | 0 (0.0%) |
Disability Class: Ambulatory Difficulty
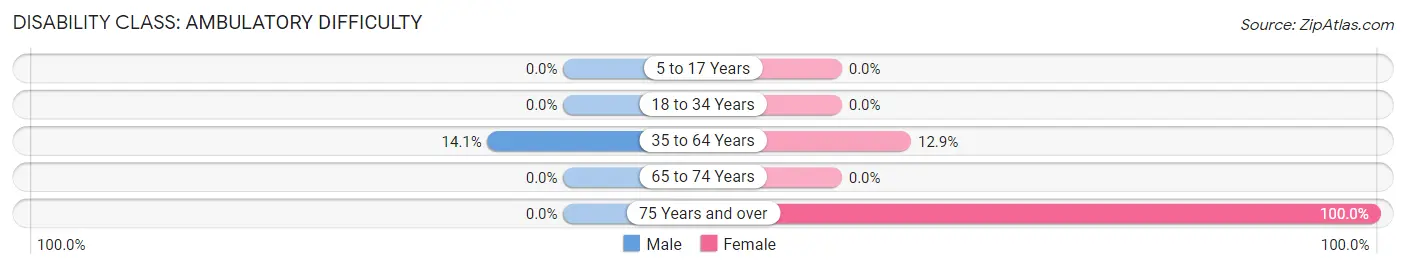
| Age Bracket | Male | Female |
| 5 to 17 Years | 0 (0.0%) | 0 (0.0%) |
| 18 to 34 Years | 0 (0.0%) | 0 (0.0%) |
| 35 to 64 Years | 9 (14.1%) | 9 (12.9%) |
| 65 to 74 Years | 0 (0.0%) | 0 (0.0%) |
| 75 Years and over | 0 (0.0%) | 20 (100.0%) |
Disability Class: Self-Care Difficulty
| Age Bracket | Male | Female |
| 5 to 17 Years | 0 (0.0%) | 0 (0.0%) |
| 18 to 34 Years | 0 (0.0%) | 0 (0.0%) |
| 35 to 64 Years | 0 (0.0%) | 0 (0.0%) |
| 65 to 74 Years | 0 (0.0%) | 0 (0.0%) |
| 75 Years and over | 0 (0.0%) | 0 (0.0%) |
Technology Access in Hillsboro
Computing Device Access in Hillsboro
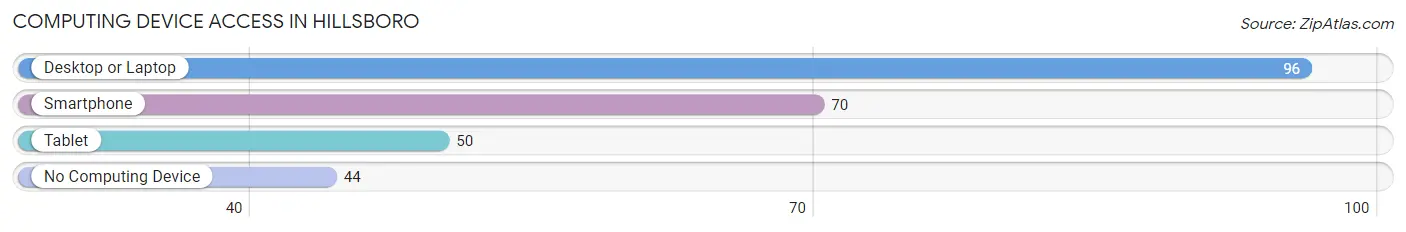
| Device Type | # Households | % Households |
| Desktop or Laptop | 96 | 64.9% |
| Smartphone | 70 | 47.3% |
| Tablet | 50 | 33.8% |
| No Computing Device | 44 | 29.7% |
| Total | 148 | 100.0% |
Internet Access in Hillsboro
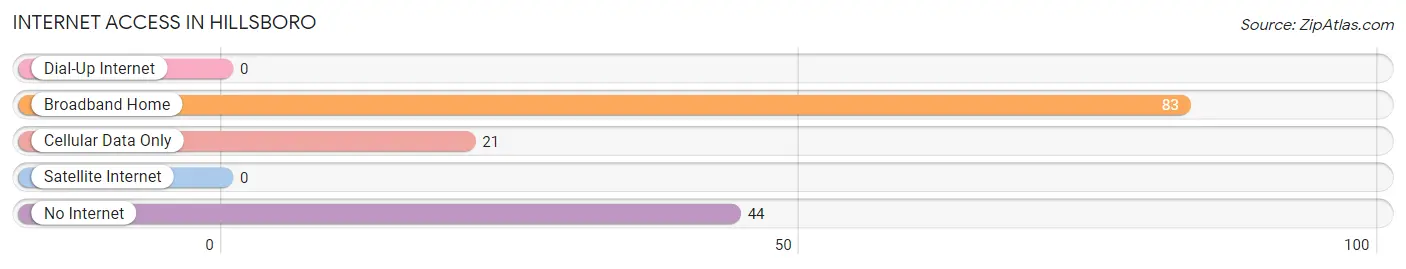
| Internet Type | # Households | % Households |
| Dial-Up Internet | 0 | 0.0% |
| Broadband Home | 83 | 56.1% |
| Cellular Data Only | 21 | 14.2% |
| Satellite Internet | 0 | 0.0% |
| No Internet | 44 | 29.7% |
| Total | 148 | 100.0% |
Hillsboro Summary
Hillsboro is a small town located in Coffee County, Tennessee. It is situated in the foothills of the Cumberland Plateau, approximately 30 miles south of Nashville. The town was founded in 1836 and has a population of approximately 1,500 people.
History
Hillsboro was founded in 1836 by a group of settlers from North Carolina. The town was named after the nearby hills, which were named after the Revolutionary War hero, General William Hill. The town was originally a farming community, but it soon became a center for the production of cotton and tobacco. The town was also home to several mills, including a grist mill, a saw mill, and a cotton gin.
In the late 19th century, Hillsboro became a popular tourist destination due to its proximity to the Cumberland Plateau. The town was also home to several resorts, including the Hillsboro Hotel, which was built in 1891.
In the early 20th century, Hillsboro experienced a period of growth and prosperity. The town was home to several businesses, including a bank, a newspaper, a movie theater, and a variety of stores. The town also had a thriving music scene, with several local bands performing in the area.
Geography
Hillsboro is located in Coffee County, Tennessee. It is situated in the foothills of the Cumberland Plateau, approximately 30 miles south of Nashville. The town is located on the banks of the Duck River, which flows through the town. The town is surrounded by rolling hills and forests, and is home to several parks and recreational areas.
Economy
Hillsboro’s economy is largely based on agriculture and tourism. The town is home to several farms, which produce a variety of crops, including corn, soybeans, and tobacco. The town is also home to several tourist attractions, including the Hillsboro Hotel, the Hillsboro Museum, and the Hillsboro Music Festival.
Demographics
As of the 2010 census, Hillsboro had a population of 1,500 people. The town is predominantly white, with approximately 95% of the population being Caucasian. The median household income is $35,000, and the median home value is $90,000. The town has a low unemployment rate, with only 4.5% of the population being unemployed.
Conclusion
Hillsboro is a small town located in Coffee County, Tennessee. It was founded in 1836 and has a population of approximately 1,500 people. The town is situated in the foothills of the Cumberland Plateau, and is home to several farms and tourist attractions. The town’s economy is largely based on agriculture and tourism, and the median household income is $35,000. Hillsboro is predominantly white, with approximately 95% of the population being Caucasian.
Common Questions
What is the Total Population of Hillsboro?
Total Population of Hillsboro is 311.
What is the Total Male Population of Hillsboro?
Total Male Population of Hillsboro is 189.
What is the Total Female Population of Hillsboro?
Total Female Population of Hillsboro is 122.
What is the Ratio of Males per 100 Females in Hillsboro?
There are 154.92 Males per 100 Females in Hillsboro.
What is the Ratio of Females per 100 Males in Hillsboro?
There are 64.55 Females per 100 Males in Hillsboro.
What is the Median Population Age in Hillsboro?
Median Population Age in Hillsboro is 57.5 Years.
What is the Average Family Size in Hillsboro
Average Family Size in Hillsboro is 3.0 People.
What is the Average Household Size in Hillsboro
Average Household Size in Hillsboro is 2.1 People.
What is Per Capita Income in Hillsboro?
Per Capita income in Hillsboro is $26,380.
What is the Median Family Income in Hillsboro?
Median Family Income in Hillsboro is $90,208.
What is Inequality or Gini Index in Hillsboro?
Inequality or Gini Index in Hillsboro is 0.41.
How Large is the Labor Force in Hillsboro?
There are 85 People in the Labor Forcein in Hillsboro.
What is the Percentage of People in the Labor Force in Hillsboro?
29.1% of People are in the Labor Force in Hillsboro.
What is the Unemployment Rate in Hillsboro?
Unemployment Rate in Hillsboro is 37.6%.