Flat Top Mountain, TN
Flat Top Mountain Map
Flat Top Mountain Overview
891
TOTAL POPULATION
226
MALE POPULATION
665
FEMALE POPULATION
33.98
MALES / 100 FEMALES
294.25
FEMALES / 100 MALES
16.8
MEDIAN AGE
3.3
AVG FAMILY SIZE
3.9
AVG HOUSEHOLD SIZE
$22,963
PER CAPITA INCOME
$113,487
AVG FAMILY INCOME
$112,549
AVG HOUSEHOLD INCOME
73.9%
WAGE / INCOME GAP [ % ]
26.1¢/ $1
WAGE / INCOME GAP [ $ ]
0.26
INEQUALITY / GINI INDEX
233
LABOR FORCE [ PEOPLE ]
43.1%
PERCENT IN LABOR FORCE
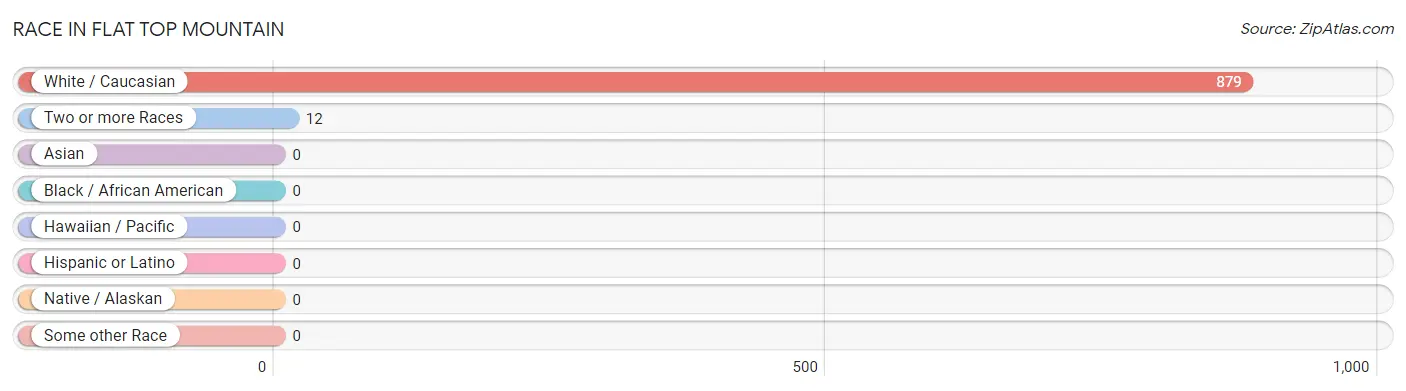
Race in Flat Top Mountain
The most populous races in Flat Top Mountain are White / Caucasian (879 | 98.7%), and Two or more Races (12 | 1.3%).
| Race | # Population | % Population |
| Asian | 0 | 0.0% |
| Black / African American | 0 | 0.0% |
| Hawaiian / Pacific | 0 | 0.0% |
| Hispanic or Latino | 0 | 0.0% |
| Native / Alaskan | 0 | 0.0% |
| White / Caucasian | 879 | 98.7% |
| Two or more Races | 12 | 1.3% |
| Some other Race | 0 | 0.0% |
| Total | 891 | 100.0% |
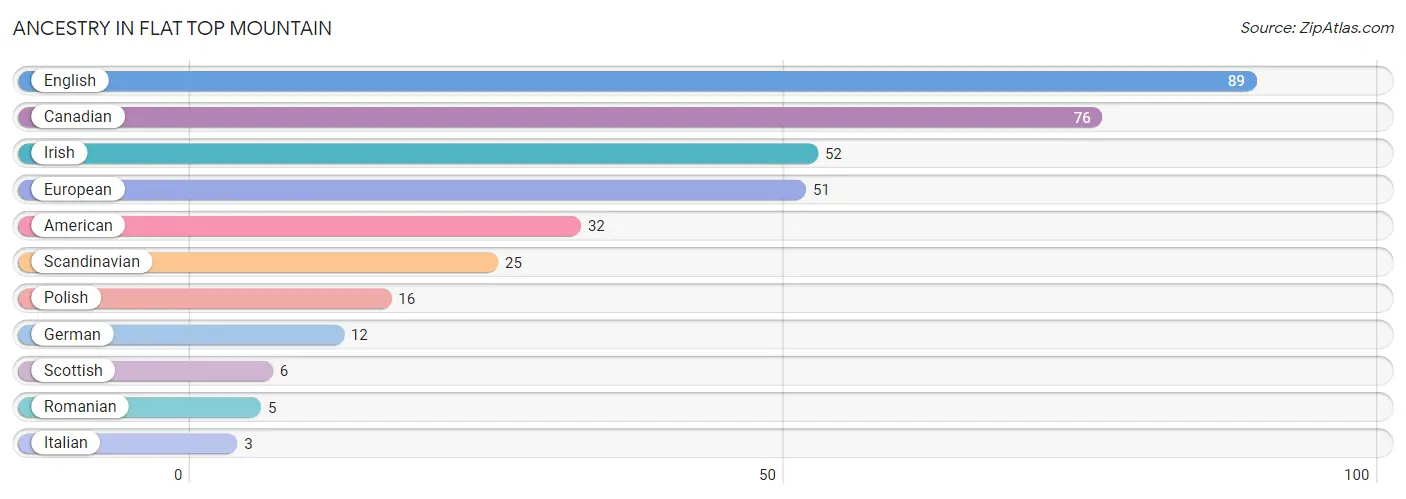
Ancestry in Flat Top Mountain
The most populous ancestries reported in Flat Top Mountain are English (89 | 10.0%), Canadian (76 | 8.5%), Irish (52 | 5.8%), European (51 | 5.7%), and American (32 | 3.6%), together accounting for 33.7% of all Flat Top Mountain residents.
| Ancestry | # Population | % Population |
| American | 32 | 3.6% |
| Canadian | 76 | 8.5% |
| English | 89 | 10.0% |
| European | 51 | 5.7% |
| German | 12 | 1.3% |
| Irish | 52 | 5.8% |
| Italian | 3 | 0.3% |
| Polish | 16 | 1.8% |
| Romanian | 5 | 0.6% |
| Scandinavian | 25 | 2.8% |
| Scottish | 6 | 0.7% | View All 11 Rows |
Immigrants in Flat Top Mountain

| Immigration Origin | # Population | % Population | View All 0 Rows |
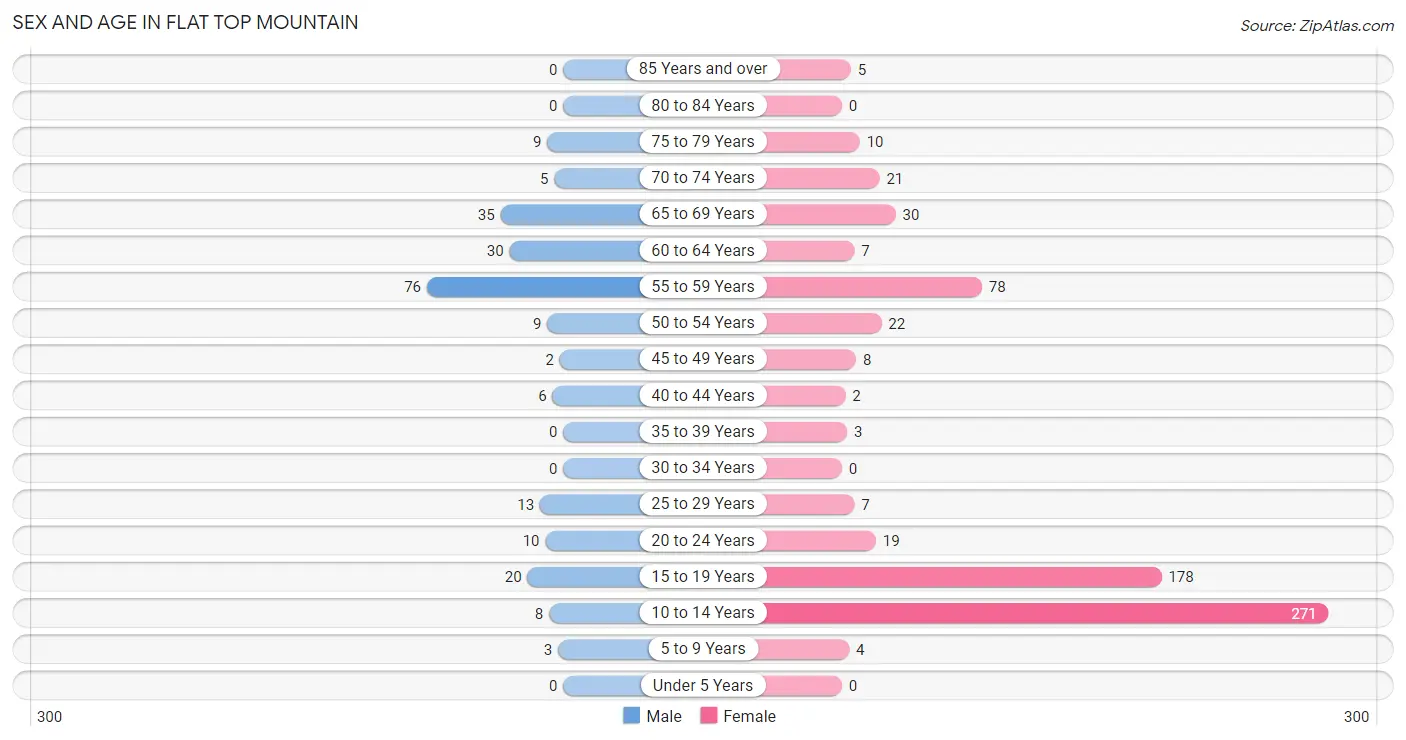
Sex and Age in Flat Top Mountain
Sex and Age in Flat Top Mountain
The most populous age groups in Flat Top Mountain are 55 to 59 Years (76 | 33.6%) for men and 10 to 14 Years (271 | 40.7%) for women.
| Age Bracket | Male | Female |
| Under 5 Years | 0 (0.0%) | 0 (0.0%) |
| 5 to 9 Years | 3 (1.3%) | 4 (0.6%) |
| 10 to 14 Years | 8 (3.5%) | 271 (40.7%) |
| 15 to 19 Years | 20 (8.8%) | 178 (26.8%) |
| 20 to 24 Years | 10 (4.4%) | 19 (2.9%) |
| 25 to 29 Years | 13 (5.8%) | 7 (1.1%) |
| 30 to 34 Years | 0 (0.0%) | 0 (0.0%) |
| 35 to 39 Years | 0 (0.0%) | 3 (0.4%) |
| 40 to 44 Years | 6 (2.6%) | 2 (0.3%) |
| 45 to 49 Years | 2 (0.9%) | 8 (1.2%) |
| 50 to 54 Years | 9 (4.0%) | 22 (3.3%) |
| 55 to 59 Years | 76 (33.6%) | 78 (11.7%) |
| 60 to 64 Years | 30 (13.3%) | 7 (1.1%) |
| 65 to 69 Years | 35 (15.5%) | 30 (4.5%) |
| 70 to 74 Years | 5 (2.2%) | 21 (3.2%) |
| 75 to 79 Years | 9 (4.0%) | 10 (1.5%) |
| 80 to 84 Years | 0 (0.0%) | 0 (0.0%) |
| 85 Years and over | 0 (0.0%) | 5 (0.7%) |
| Total | 226 (100.0%) | 665 (100.0%) |
Families and Households in Flat Top Mountain
Median Family Size in Flat Top Mountain
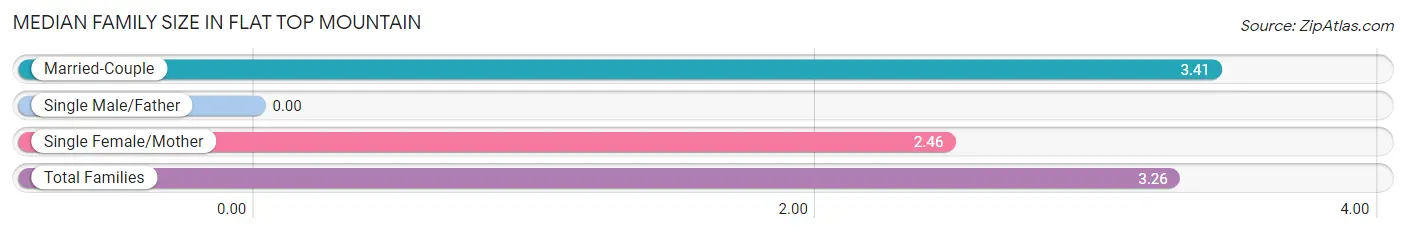
| Family Type | # Families | Family Size |
| Married-Couple | 144 (83.7%) | 3.41 |
| Single Male/Father | 0 (0.0%) | - |
| Single Female/Mother | 28 (16.3%) | 2.46 |
| Total Families | 172 (100.0%) | 3.26 |
Median Household Size in Flat Top Mountain
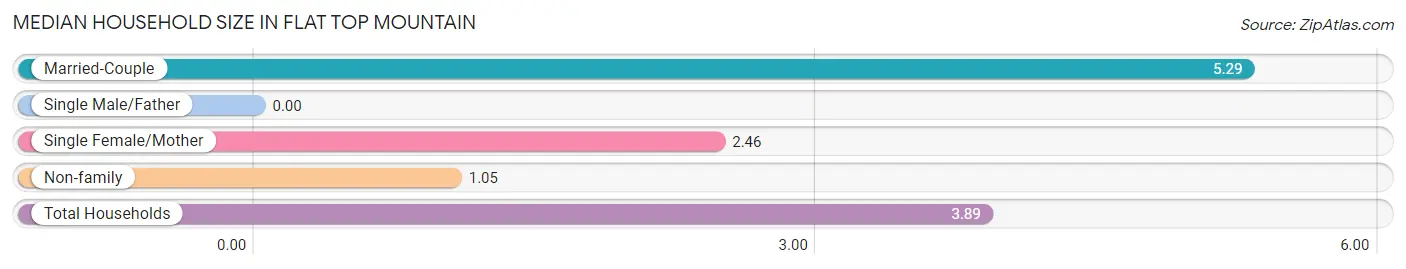
| Household Type | # Households | Household Size |
| Married-Couple | 144 (62.9%) | 5.29 |
| Single Male/Father | 0 (0.0%) | - |
| Single Female/Mother | 28 (12.2%) | 2.46 |
| Non-family | 57 (24.9%) | 1.05 |
| Total Households | 229 (100.0%) | 3.89 |
Household Size by Marriage Status in Flat Top Mountain
Out of a total of 229 households in Flat Top Mountain, 172 (75.1%) are family households, while 57 (24.9%) are nonfamily households. The most numerous type of family households are 7+ person households, comprising 76, and the most common type of nonfamily households are 1-person households, comprising 54.
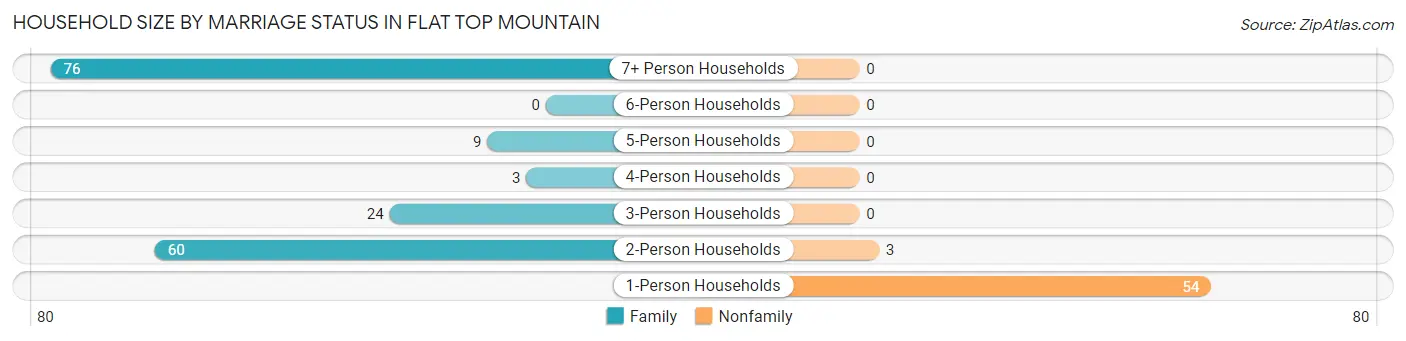
| Household Size | Family Households | Nonfamily Households |
| 1-Person Households | - | 54 (23.6%) |
| 2-Person Households | 60 (26.2%) | 3 (1.3%) |
| 3-Person Households | 24 (10.5%) | 0 (0.0%) |
| 4-Person Households | 3 (1.3%) | 0 (0.0%) |
| 5-Person Households | 9 (3.9%) | 0 (0.0%) |
| 6-Person Households | 0 (0.0%) | 0 (0.0%) |
| 7+ Person Households | 76 (33.2%) | 0 (0.0%) |
| Total | 172 (75.1%) | 57 (24.9%) |
Female Fertility in Flat Top Mountain
Fertility by Age in Flat Top Mountain
| Age Bracket | Women with Births | Births / 1,000 Women |
| 15 to 19 years | 0 (0.0%) | 0.0 |
| 20 to 34 years | 0 (0.0%) | 0.0 |
| 35 to 50 years | 0 (0.0%) | 0.0 |
| Total | 0 (0.0%) | 0.0 |
Fertility by Age by Marriage Status in Flat Top Mountain
| Age Bracket | Married | Unmarried |
| 15 to 19 years | 0 (0.0%) | 0 (0.0%) |
| 20 to 34 years | 0 (0.0%) | 0 (0.0%) |
| 35 to 50 years | 0 (0.0%) | 0 (0.0%) |
| Total | 0 (0.0%) | 0 (0.0%) |
Fertility by Education in Flat Top Mountain
| Educational Attainment | Women with Births | Births / 1,000 Women |
| Less than High School | 0 (0.0%) | 0.0 |
| High School Diploma | 0 (0.0%) | 0.0 |
| College or Associate's Degree | 0 (0.0%) | 0.0 |
| Bachelor's Degree | 0 (0.0%) | 0.0 |
| Graduate Degree | 0 (0.0%) | 0.0 |
| Total | 0 (0.0%) | 0.0 |
Fertility by Education by Marriage Status in Flat Top Mountain
| Educational Attainment | Married | Unmarried |
| Less than High School | 0 (0.0%) | 0 (0.0%) |
| High School Diploma | 0 (0.0%) | 0 (0.0%) |
| College or Associate's Degree | 0 (0.0%) | 0 (0.0%) |
| Bachelor's Degree | 0 (0.0%) | 0 (0.0%) |
| Graduate Degree | 0 (0.0%) | 0 (0.0%) |
| Total | 0 (0.0%) | 0 (0.0%) |
Income in Flat Top Mountain
Income Overview in Flat Top Mountain
Per Capita Income in Flat Top Mountain is $22,963, while median incomes of families and households are $113,487 and $112,549 respectively.
| Characteristic | Number | Measure |
| Per Capita Income | 891 | $22,963 |
| Median Family Income | 172 | $113,487 |
| Mean Family Income | 172 | $100,794 |
| Median Household Income | 229 | $112,549 |
| Mean Household Income | 229 | $88,663 |
| Income Deficit | 172 | $0 |
| Wage / Income Gap (%) | 891 | 73.88% |
| Wage / Income Gap ($) | 891 | 26.12¢ per $1 |
| Gini / Inequality Index | 891 | 0.26 |
Earnings by Sex in Flat Top Mountain
Average Earnings in Flat Top Mountain are $52,755, $53,641 for men and $14,013 for women, a difference of 73.9%.
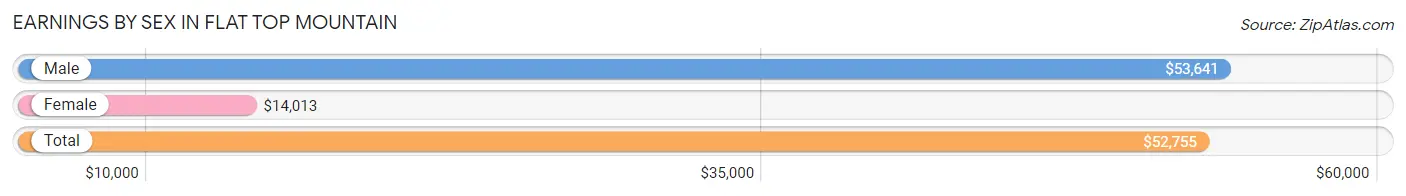
| Sex | Number | Average Earnings |
| Male | 174 (65.7%) | $53,641 |
| Female | 91 (34.3%) | $14,013 |
| Total | 265 (100.0%) | $52,755 |
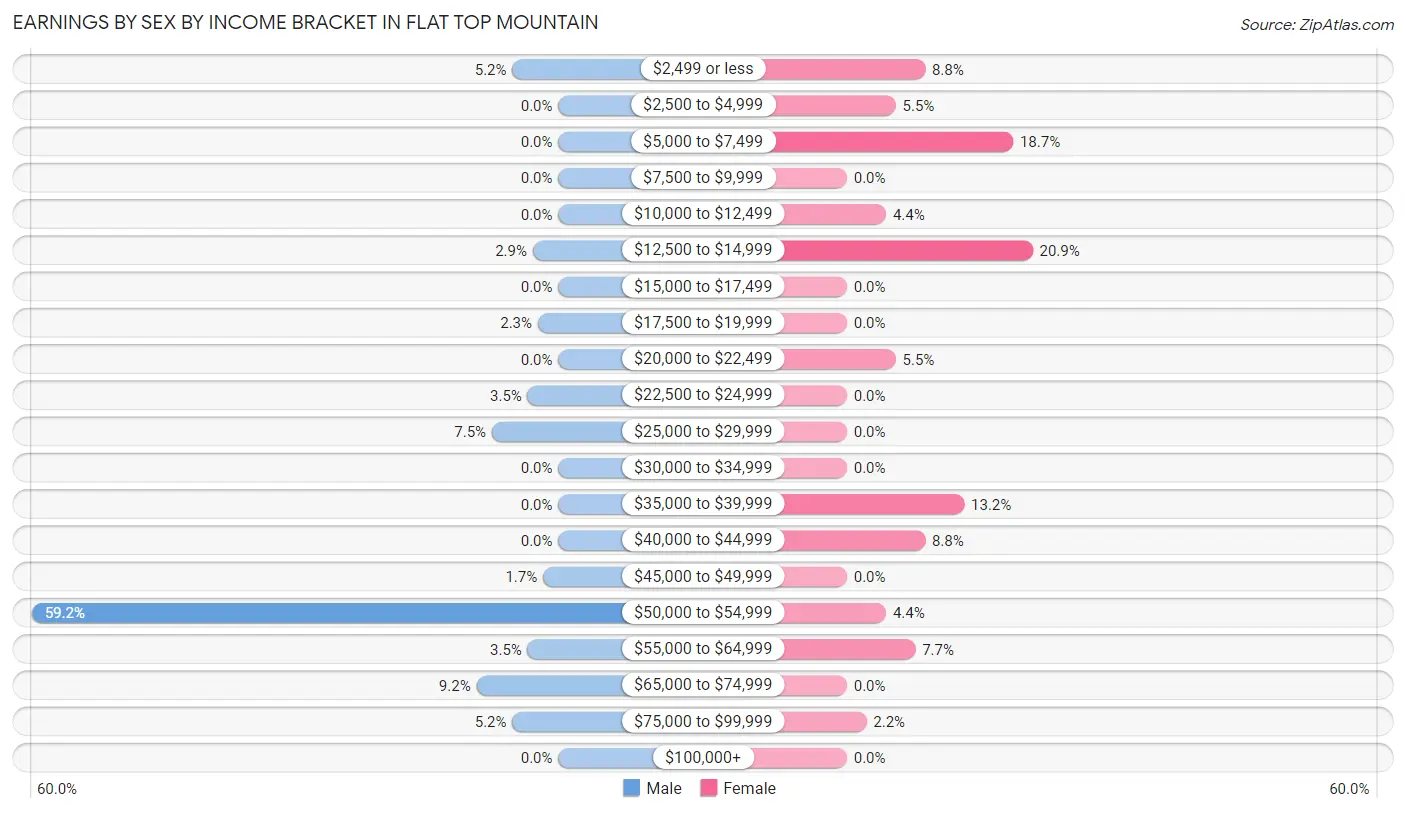
Earnings by Sex by Income Bracket in Flat Top Mountain
The most common earnings brackets in Flat Top Mountain are $50,000 to $54,999 for men (103 | 59.2%) and $12,500 to $14,999 for women (19 | 20.9%).
| Income | Male | Female |
| $2,499 or less | 9 (5.2%) | 8 (8.8%) |
| $2,500 to $4,999 | 0 (0.0%) | 5 (5.5%) |
| $5,000 to $7,499 | 0 (0.0%) | 17 (18.7%) |
| $7,500 to $9,999 | 0 (0.0%) | 0 (0.0%) |
| $10,000 to $12,499 | 0 (0.0%) | 4 (4.4%) |
| $12,500 to $14,999 | 5 (2.9%) | 19 (20.9%) |
| $15,000 to $17,499 | 0 (0.0%) | 0 (0.0%) |
| $17,500 to $19,999 | 4 (2.3%) | 0 (0.0%) |
| $20,000 to $22,499 | 0 (0.0%) | 5 (5.5%) |
| $22,500 to $24,999 | 6 (3.5%) | 0 (0.0%) |
| $25,000 to $29,999 | 13 (7.5%) | 0 (0.0%) |
| $30,000 to $34,999 | 0 (0.0%) | 0 (0.0%) |
| $35,000 to $39,999 | 0 (0.0%) | 12 (13.2%) |
| $40,000 to $44,999 | 0 (0.0%) | 8 (8.8%) |
| $45,000 to $49,999 | 3 (1.7%) | 0 (0.0%) |
| $50,000 to $54,999 | 103 (59.2%) | 4 (4.4%) |
| $55,000 to $64,999 | 6 (3.5%) | 7 (7.7%) |
| $65,000 to $74,999 | 16 (9.2%) | 0 (0.0%) |
| $75,000 to $99,999 | 9 (5.2%) | 2 (2.2%) |
| $100,000+ | 0 (0.0%) | 0 (0.0%) |
| Total | 174 (100.0%) | 91 (100.0%) |
Earnings by Sex by Educational Attainment in Flat Top Mountain
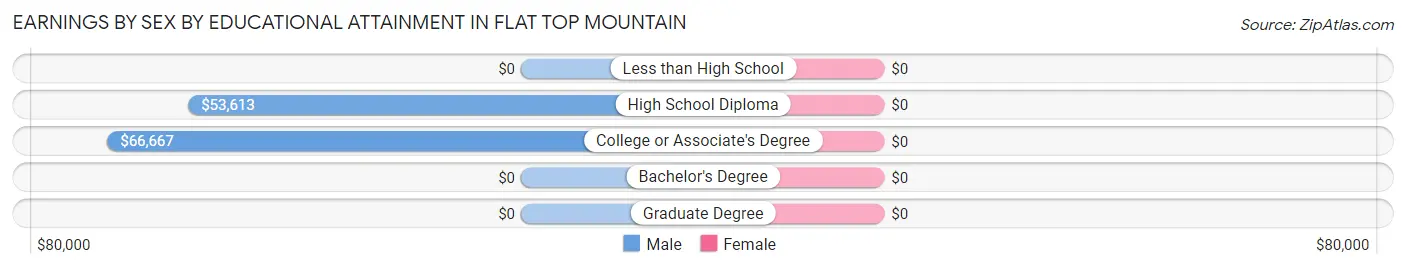
| Educational Attainment | Male Income | Female Income |
| Less than High School | - | - |
| High School Diploma | $53,613 | $0 |
| College or Associate's Degree | $66,667 | $0 |
| Bachelor's Degree | - | - |
| Graduate Degree | - | - |
| Total | $53,838 | $0 |
Family Income in Flat Top Mountain
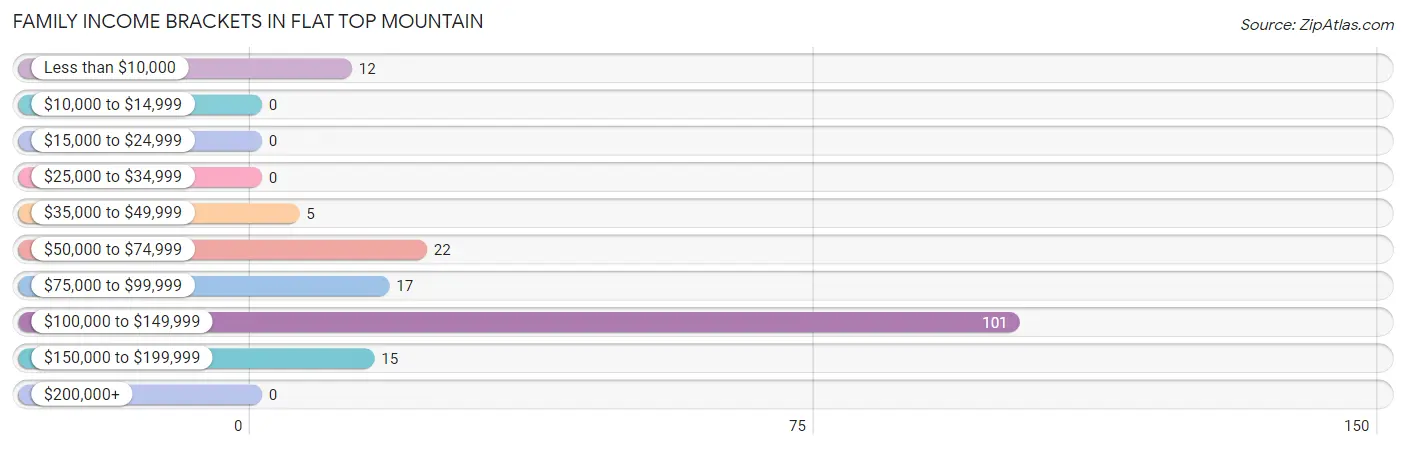
Family Income Brackets in Flat Top Mountain
According to the Flat Top Mountain family income data, there are 101 families falling into the $100,000 to $149,999 income range, which is the most common income bracket and makes up 58.7% of all families.
| Income Bracket | # Families | % Families |
| Less than $10,000 | 12 | 7.0% |
| $10,000 to $14,999 | 0 | 0.0% |
| $15,000 to $24,999 | 0 | 0.0% |
| $25,000 to $34,999 | 0 | 0.0% |
| $35,000 to $49,999 | 5 | 2.9% |
| $50,000 to $74,999 | 22 | 12.8% |
| $75,000 to $99,999 | 17 | 9.9% |
| $100,000 to $149,999 | 101 | 58.7% |
| $150,000 to $199,999 | 15 | 8.7% |
| $200,000+ | 0 | 0.0% |
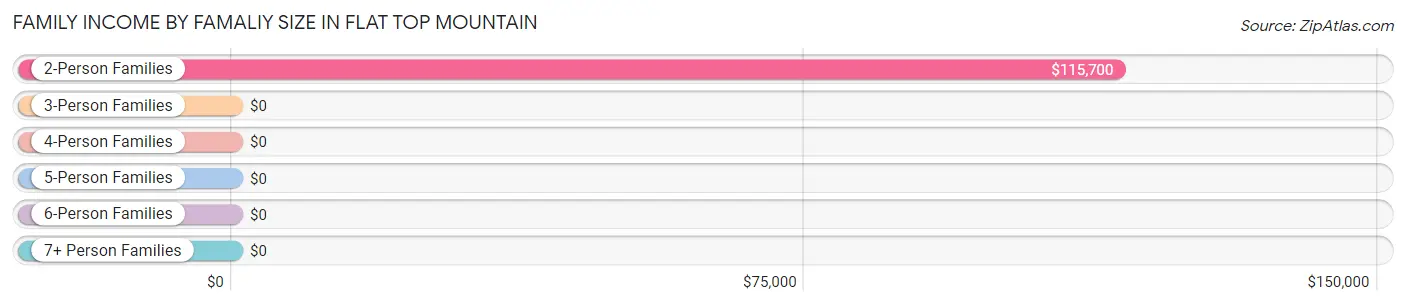
Family Income by Famaliy Size in Flat Top Mountain
2-person families (60 | 34.9%) account for the highest median family income in Flat Top Mountain with $115,700 per family, while 2-person families (60 | 34.9%) have the highest median income of $57,850 per family member.
| Income Bracket | # Families | Median Income |
| 2-Person Families | 60 (34.9%) | $115,700 |
| 3-Person Families | 24 (14.0%) | $0 |
| 4-Person Families | 79 (45.9%) | $0 |
| 5-Person Families | 9 (5.2%) | $0 |
| 6-Person Families | 0 (0.0%) | $0 |
| 7+ Person Families | 0 (0.0%) | $0 |
| Total | 172 (100.0%) | $113,487 |
Family Income by Number of Earners in Flat Top Mountain
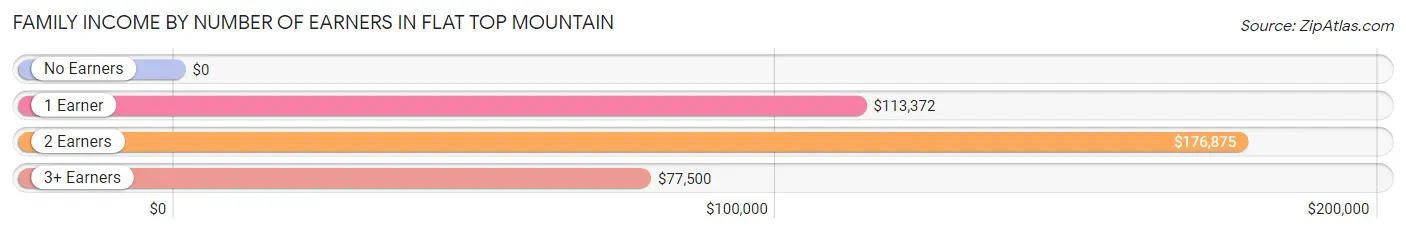
| Number of Earners | # Families | Median Income |
| No Earners | 28 (16.3%) | $0 |
| 1 Earner | 107 (62.2%) | $113,372 |
| 2 Earners | 13 (7.6%) | $176,875 |
| 3+ Earners | 24 (14.0%) | $77,500 |
| Total | 172 (100.0%) | $113,487 |
Household Income in Flat Top Mountain
Household Income Brackets in Flat Top Mountain
With 104 households falling in the category, the $100,000 to $149,999 income range is the most frequent in Flat Top Mountain, accounting for 45.4% of all households.
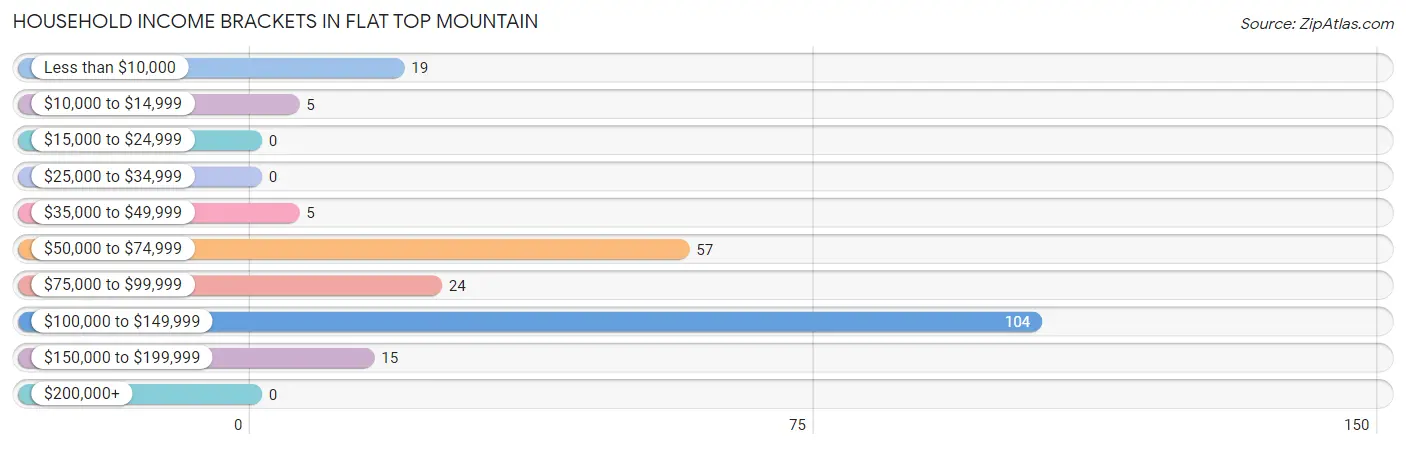
| Income Bracket | # Households | % Households |
| Less than $10,000 | 19 | 8.3% |
| $10,000 to $14,999 | 5 | 2.2% |
| $15,000 to $24,999 | 0 | 0.0% |
| $25,000 to $34,999 | 0 | 0.0% |
| $35,000 to $49,999 | 5 | 2.2% |
| $50,000 to $74,999 | 57 | 24.9% |
| $75,000 to $99,999 | 24 | 10.5% |
| $100,000 to $149,999 | 104 | 45.4% |
| $150,000 to $199,999 | 15 | 6.6% |
| $200,000+ | 0 | 0.0% |
Household Income by Householder Age in Flat Top Mountain
The median household income in Flat Top Mountain is $112,549, with the highest median household income of $112,977 found in the 45 to 64 years age bracket for the primary householder. A total of 135 households (59.0%) fall into this category. Meanwhile, the 15 to 24 years age bracket for the primary householder has the lowest median household income of $0, with 12 households (5.2%) in this group.
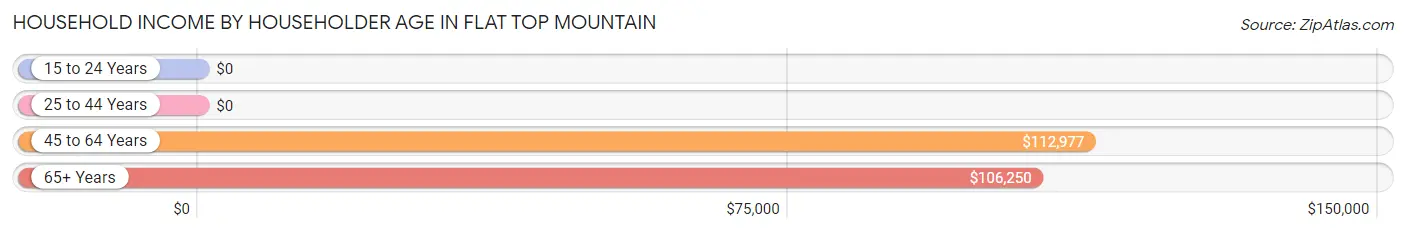
| Income Bracket | # Households | Median Income |
| 15 to 24 Years | 12 (5.2%) | $0 |
| 25 to 44 Years | 18 (7.9%) | $0 |
| 45 to 64 Years | 135 (59.0%) | $112,977 |
| 65+ Years | 64 (28.0%) | $106,250 |
| Total | 229 (100.0%) | $112,549 |
Poverty in Flat Top Mountain
Income Below Poverty by Sex and Age in Flat Top Mountain
With 10.2% poverty level for males and 25.2% for females among the residents of Flat Top Mountain, 16 and 17 year old males and 16 and 17 year old females are the most vulnerable to poverty, with 20 males (100.0%) and 105 females (100.0%) in their respective age groups living below the poverty level.
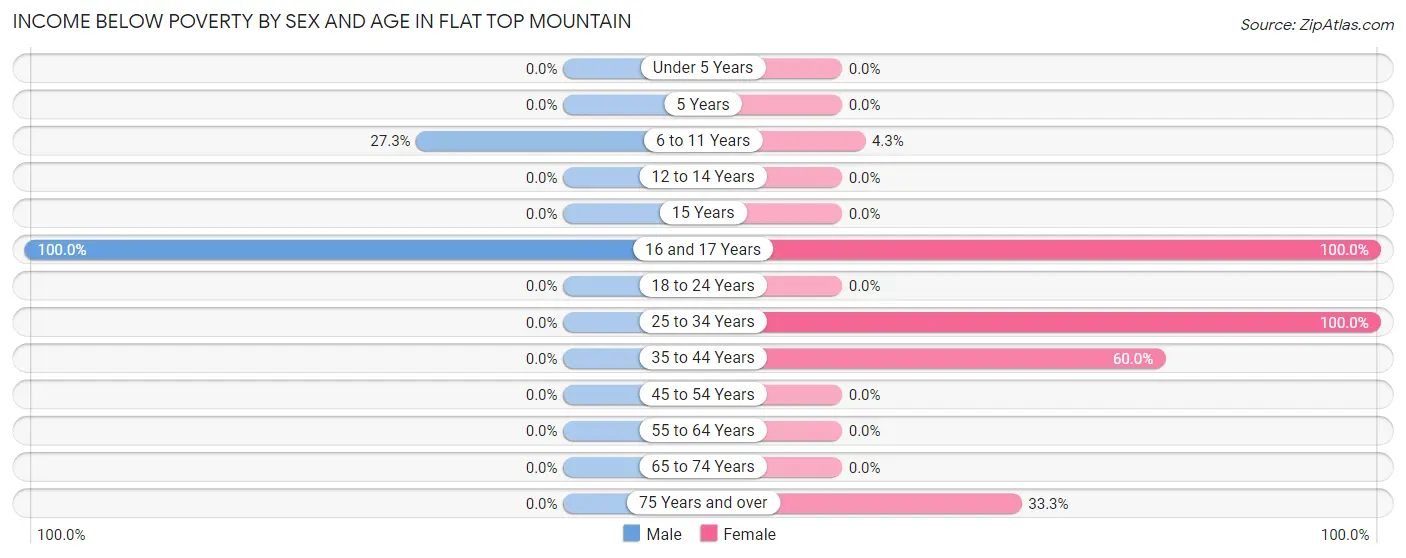
| Age Bracket | Male | Female |
| Under 5 Years | 0 (0.0%) | 0 (0.0%) |
| 5 Years | 0 (0.0%) | 0 (0.0%) |
| 6 to 11 Years | 3 (27.3%) | 4 (4.3%) |
| 12 to 14 Years | 0 (0.0%) | 0 (0.0%) |
| 15 Years | 0 (0.0%) | 0 (0.0%) |
| 16 and 17 Years | 20 (100.0%) | 105 (100.0%) |
| 18 to 24 Years | 0 (0.0%) | 0 (0.0%) |
| 25 to 34 Years | 0 (0.0%) | 7 (100.0%) |
| 35 to 44 Years | 0 (0.0%) | 3 (60.0%) |
| 45 to 54 Years | 0 (0.0%) | 0 (0.0%) |
| 55 to 64 Years | 0 (0.0%) | 0 (0.0%) |
| 65 to 74 Years | 0 (0.0%) | 0 (0.0%) |
| 75 Years and over | 0 (0.0%) | 5 (33.3%) |
| Total | 23 (10.2%) | 124 (25.2%) |
Income Above Poverty by Sex and Age in Flat Top Mountain
According to the poverty statistics in Flat Top Mountain, males aged 18 to 24 years and females aged 12 to 14 years are the age groups that are most secure financially, with 100.0% of males and 100.0% of females in these age groups living above the poverty line.
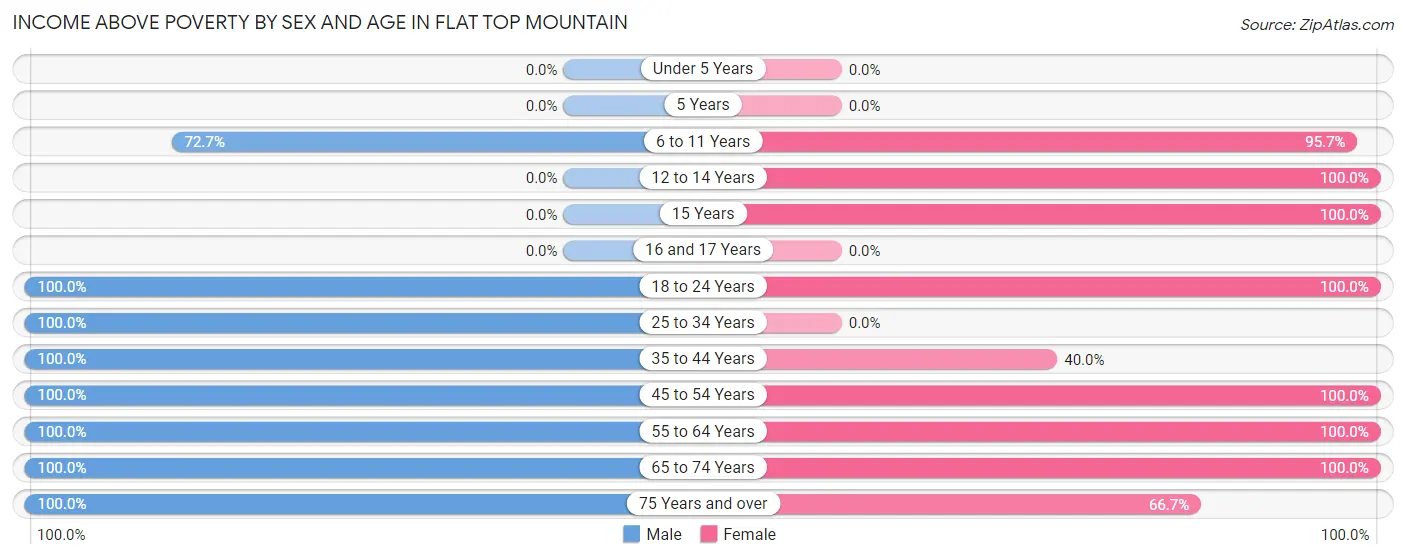
| Age Bracket | Male | Female |
| Under 5 Years | 0 (0.0%) | 0 (0.0%) |
| 5 Years | 0 (0.0%) | 0 (0.0%) |
| 6 to 11 Years | 8 (72.7%) | 89 (95.7%) |
| 12 to 14 Years | 0 (0.0%) | 9 (100.0%) |
| 15 Years | 0 (0.0%) | 65 (100.0%) |
| 16 and 17 Years | 0 (0.0%) | 0 (0.0%) |
| 18 to 24 Years | 10 (100.0%) | 27 (100.0%) |
| 25 to 34 Years | 13 (100.0%) | 0 (0.0%) |
| 35 to 44 Years | 6 (100.0%) | 2 (40.0%) |
| 45 to 54 Years | 11 (100.0%) | 30 (100.0%) |
| 55 to 64 Years | 106 (100.0%) | 85 (100.0%) |
| 65 to 74 Years | 40 (100.0%) | 51 (100.0%) |
| 75 Years and over | 9 (100.0%) | 10 (66.7%) |
| Total | 203 (89.8%) | 368 (74.8%) |
Income Below Poverty Among Married-Couple Families in Flat Top Mountain
The poverty statistics for married-couple families in Flat Top Mountain show that 6.2% or 9 of the total 144 families live below the poverty line. Families with 1 or 2 children have the highest poverty rate of 9.6%, comprising of 9 families. On the other hand, families with no children have the lowest poverty rate of 0.0%, which includes 0 families.
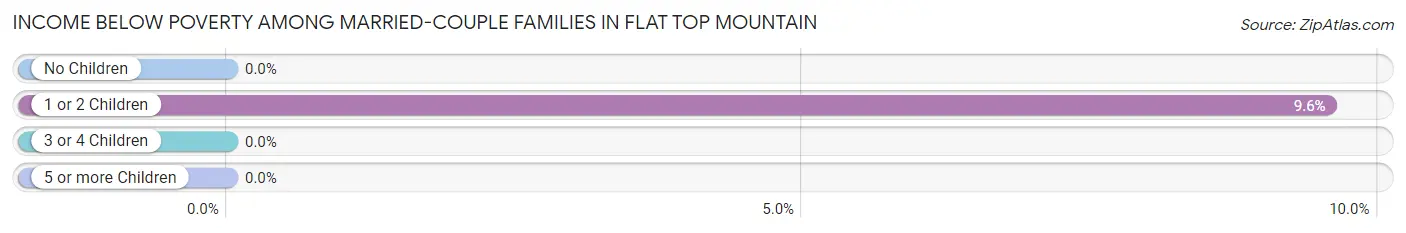
| Children | Above Poverty | Below Poverty |
| No Children | 50 (100.0%) | 0 (0.0%) |
| 1 or 2 Children | 85 (90.4%) | 9 (9.6%) |
| 3 or 4 Children | 0 (0.0%) | 0 (0.0%) |
| 5 or more Children | 0 (0.0%) | 0 (0.0%) |
| Total | 135 (93.8%) | 9 (6.2%) |
Income Below Poverty Among Single-Parent Households in Flat Top Mountain
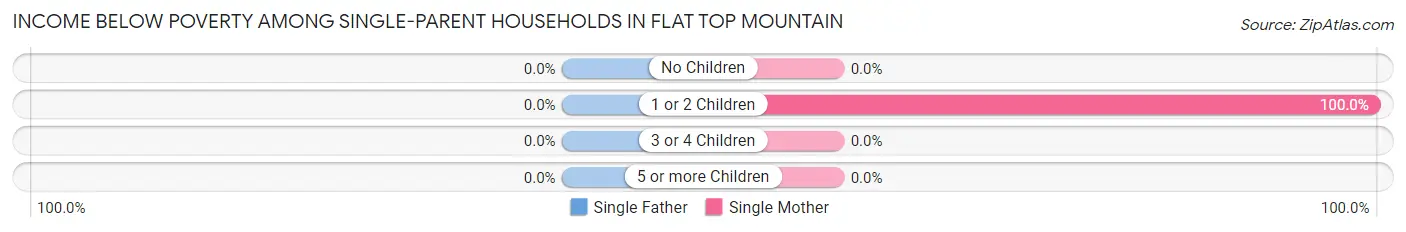
| Children | Single Father | Single Mother |
| No Children | 0 (0.0%) | 0 (0.0%) |
| 1 or 2 Children | 0 (0.0%) | 3 (100.0%) |
| 3 or 4 Children | 0 (0.0%) | 0 (0.0%) |
| 5 or more Children | 0 (0.0%) | 0 (0.0%) |
| Total | 0 (0.0%) | 3 (10.7%) |
Income Below Poverty Among Married-Couple vs Single-Parent Households in Flat Top Mountain
The poverty data for Flat Top Mountain shows that 9 of the married-couple family households (6.2%) and 3 of the single-parent households (10.7%) are living below the poverty level. Within the married-couple family households, those with 1 or 2 children have the highest poverty rate, with 9 households (9.6%) falling below the poverty line. Among the single-parent households, those with 1 or 2 children have the highest poverty rate, with 3 household (100.0%) living below poverty.
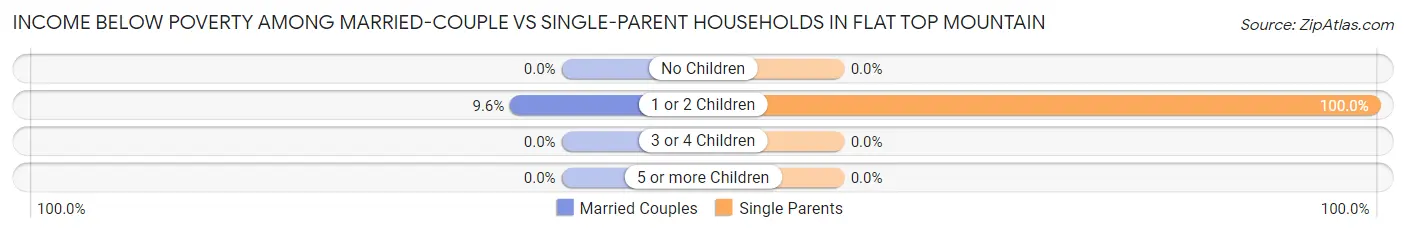
| Children | Married-Couple Families | Single-Parent Households |
| No Children | 0 (0.0%) | 0 (0.0%) |
| 1 or 2 Children | 9 (9.6%) | 3 (100.0%) |
| 3 or 4 Children | 0 (0.0%) | 0 (0.0%) |
| 5 or more Children | 0 (0.0%) | 0 (0.0%) |
| Total | 9 (6.2%) | 3 (10.7%) |
Employment Characteristics in Flat Top Mountain
Employment by Class of Employer in Flat Top Mountain
Among the 228 employed individuals in Flat Top Mountain, private company employees (190 | 83.3%), not-for-profit organizations (21 | 9.2%), and self-employed (not incorporated) (9 | 4.0%) make up the most common classes of employment.
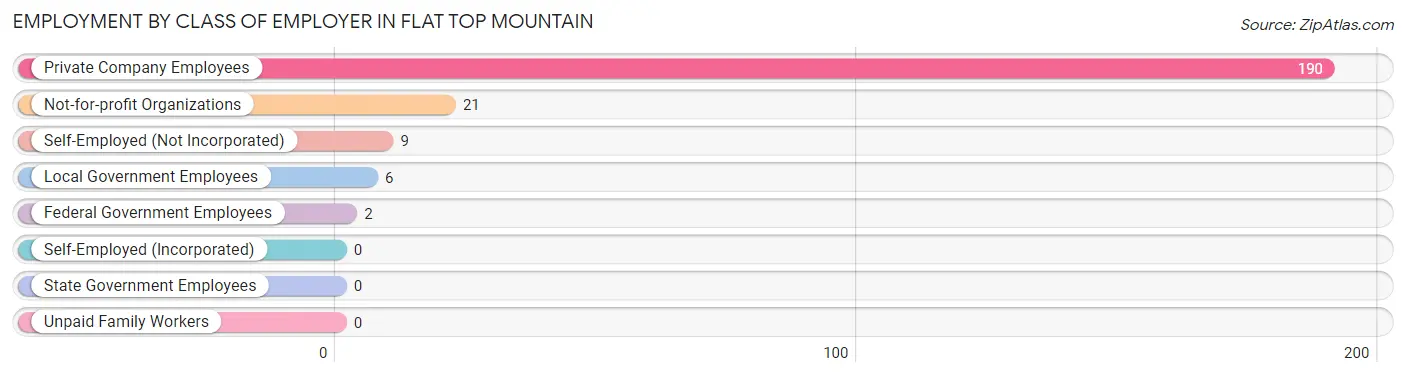
| Employer Class | # Employees | % Employees |
| Private Company Employees | 190 | 83.3% |
| Self-Employed (Incorporated) | 0 | 0.0% |
| Self-Employed (Not Incorporated) | 9 | 4.0% |
| Not-for-profit Organizations | 21 | 9.2% |
| Local Government Employees | 6 | 2.6% |
| State Government Employees | 0 | 0.0% |
| Federal Government Employees | 2 | 0.9% |
| Unpaid Family Workers | 0 | 0.0% |
| Total | 228 | 100.0% |
Employment Status by Age in Flat Top Mountain
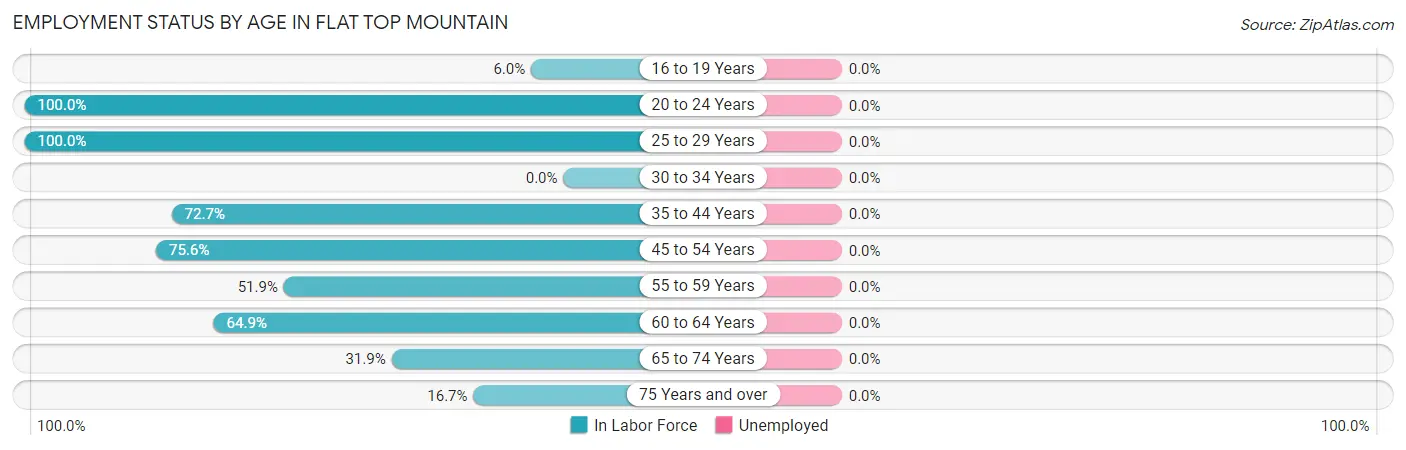
| Age Bracket | In Labor Force | Unemployed |
| 16 to 19 Years | 8 (6.0%) | 0 (0.0%) |
| 20 to 24 Years | 29 (100.0%) | 0 (0.0%) |
| 25 to 29 Years | 20 (100.0%) | 0 (0.0%) |
| 30 to 34 Years | 0 (0.0%) | 0 (0.0%) |
| 35 to 44 Years | 8 (72.7%) | 0 (0.0%) |
| 45 to 54 Years | 31 (75.6%) | 0 (0.0%) |
| 55 to 59 Years | 80 (51.9%) | 0 (0.0%) |
| 60 to 64 Years | 24 (64.9%) | 0 (0.0%) |
| 65 to 74 Years | 29 (31.9%) | 0 (0.0%) |
| 75 Years and over | 4 (16.7%) | 0 (0.0%) |
| Total | 233 (43.1%) | 0 (0.0%) |
Employment Status by Educational Attainment in Flat Top Mountain
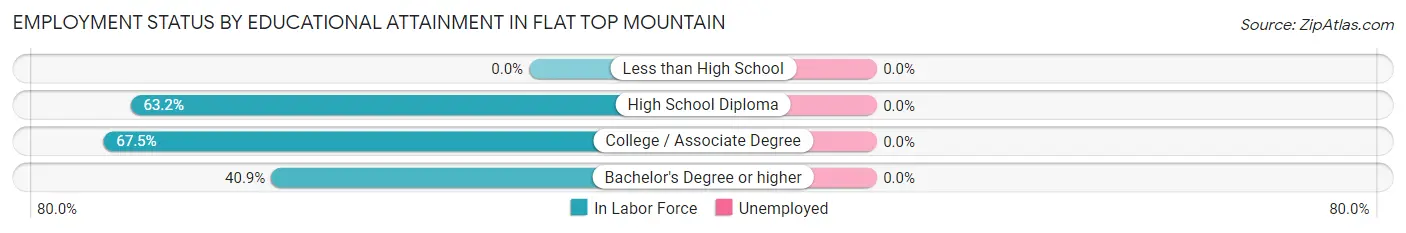
| Educational Attainment | In Labor Force | Unemployed |
| Less than High School | 0 (0.0%) | 0 (0.0%) |
| High School Diploma | 127 (63.2%) | 0 (0.0%) |
| College / Associate Degree | 27 (67.5%) | 0 (0.0%) |
| Bachelor's Degree or higher | 9 (40.9%) | 0 (0.0%) |
| Total | 163 (62.0%) | 0 (0.0%) |
Employment Occupations by Sex in Flat Top Mountain
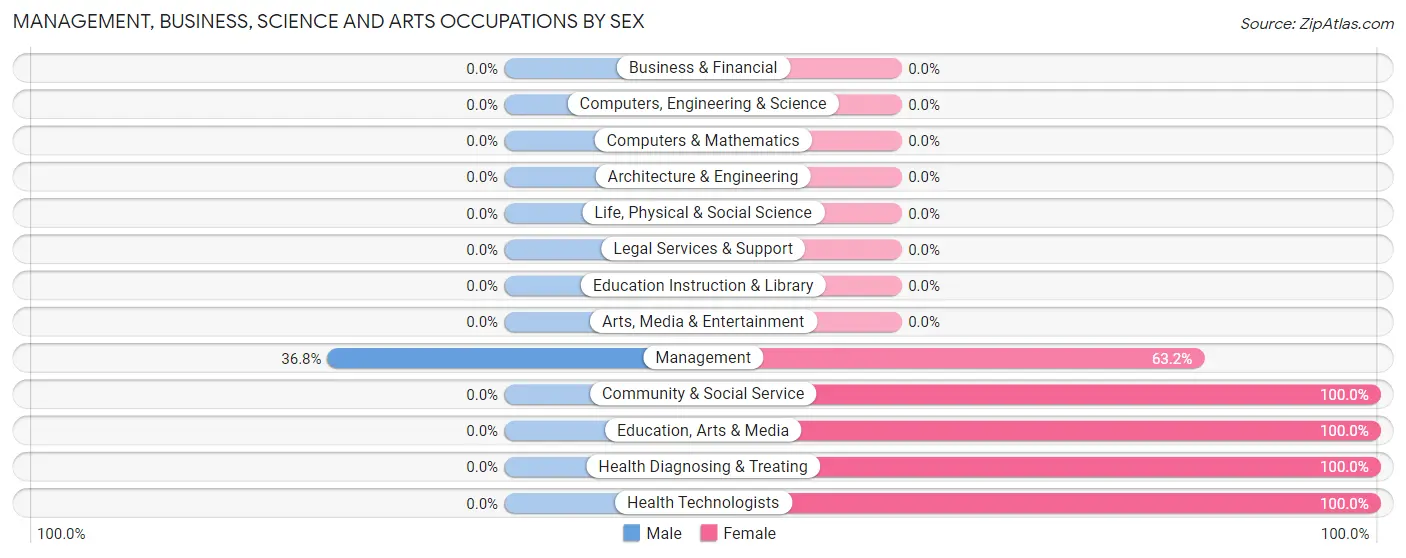
Management, Business, Science and Arts Occupations
The most common Management, Business, Science and Arts occupations in Flat Top Mountain are Management (19 | 8.2%), Health Diagnosing & Treating (9 | 3.9%), Health Technologists (9 | 3.9%), Community & Social Service (5 | 2.1%), and Education, Arts & Media (5 | 2.1%).
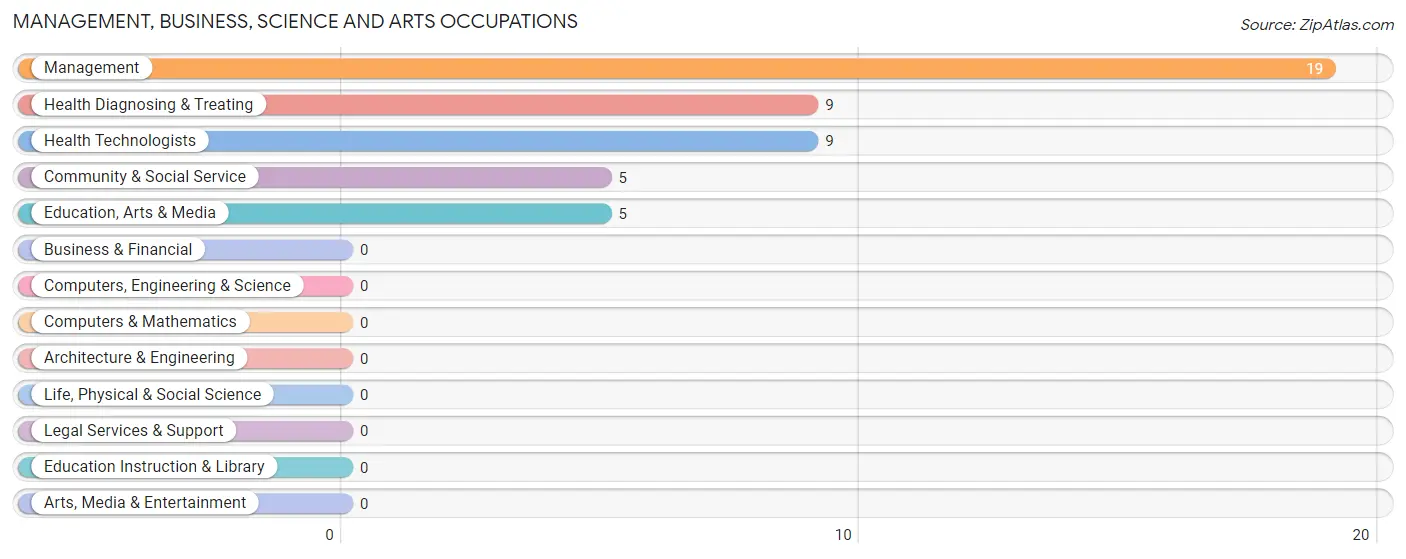
Management, Business, Science and Arts Occupations by Sex
| Occupation | Male | Female |
| Management | 7 (36.8%) | 12 (63.2%) |
| Business & Financial | 0 (0.0%) | 0 (0.0%) |
| Computers, Engineering & Science | 0 (0.0%) | 0 (0.0%) |
| Computers & Mathematics | 0 (0.0%) | 0 (0.0%) |
| Architecture & Engineering | 0 (0.0%) | 0 (0.0%) |
| Life, Physical & Social Science | 0 (0.0%) | 0 (0.0%) |
| Community & Social Service | 0 (0.0%) | 5 (100.0%) |
| Education, Arts & Media | 0 (0.0%) | 5 (100.0%) |
| Legal Services & Support | 0 (0.0%) | 0 (0.0%) |
| Education Instruction & Library | 0 (0.0%) | 0 (0.0%) |
| Arts, Media & Entertainment | 0 (0.0%) | 0 (0.0%) |
| Health Diagnosing & Treating | 0 (0.0%) | 9 (100.0%) |
| Health Technologists | 0 (0.0%) | 9 (100.0%) |
| Total (Category) | 7 (21.2%) | 26 (78.8%) |
| Total (Overall) | 159 (68.2%) | 74 (31.8%) |
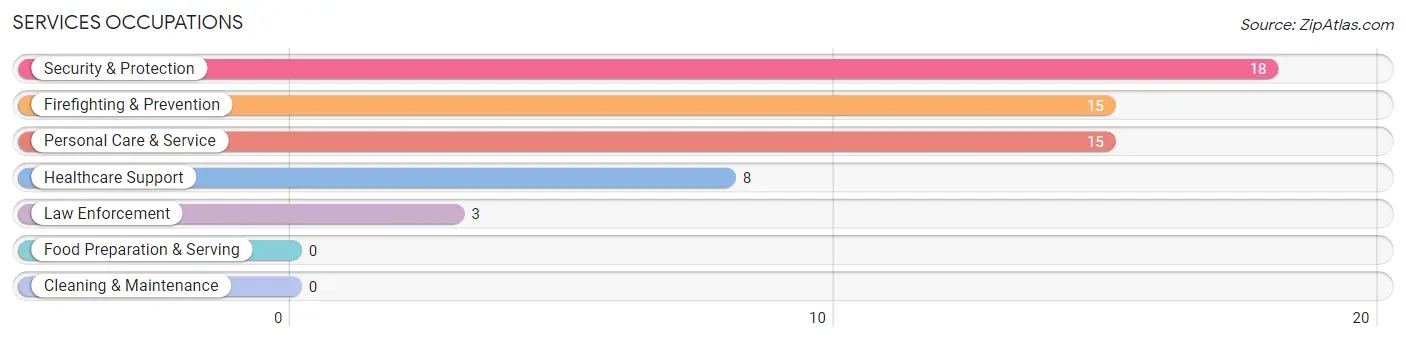
Services Occupations
The most common Services occupations in Flat Top Mountain are Security & Protection (18 | 7.7%), Firefighting & Prevention (15 | 6.4%), Personal Care & Service (15 | 6.4%), Healthcare Support (8 | 3.4%), and Law Enforcement (3 | 1.3%).
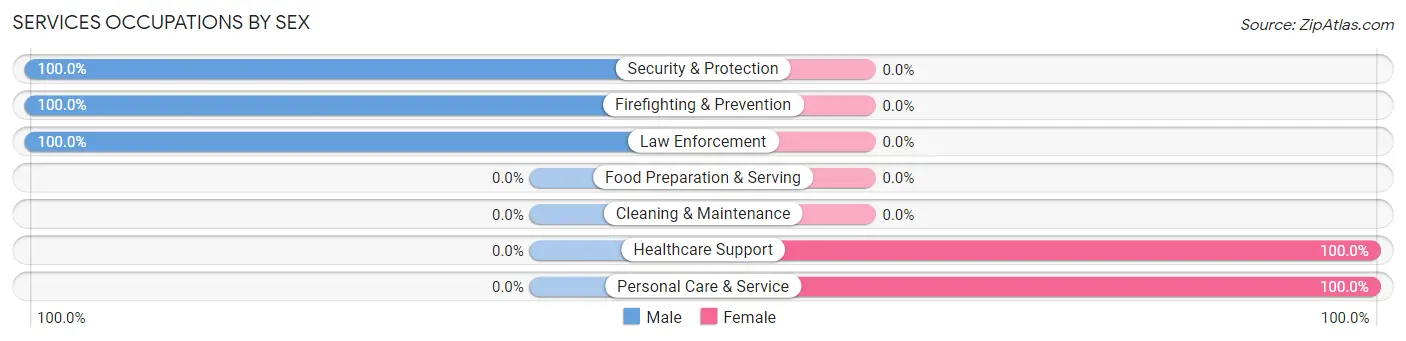
Services Occupations by Sex
Within the Services occupations in Flat Top Mountain, the most male-oriented occupations are Security & Protection (100.0%), Firefighting & Prevention (100.0%), and Law Enforcement (100.0%), while the most female-oriented occupations are Healthcare Support (100.0%), and Personal Care & Service (100.0%).
| Occupation | Male | Female |
| Healthcare Support | 0 (0.0%) | 8 (100.0%) |
| Security & Protection | 18 (100.0%) | 0 (0.0%) |
| Firefighting & Prevention | 15 (100.0%) | 0 (0.0%) |
| Law Enforcement | 3 (100.0%) | 0 (0.0%) |
| Food Preparation & Serving | 0 (0.0%) | 0 (0.0%) |
| Cleaning & Maintenance | 0 (0.0%) | 0 (0.0%) |
| Personal Care & Service | 0 (0.0%) | 15 (100.0%) |
| Total (Category) | 18 (43.9%) | 23 (56.1%) |
| Total (Overall) | 159 (68.2%) | 74 (31.8%) |
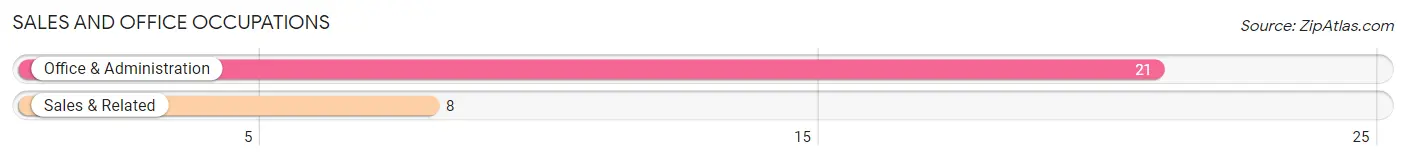
Sales and Office Occupations
The most common Sales and Office occupations in Flat Top Mountain are Office & Administration (21 | 9.0%), and Sales & Related (8 | 3.4%).
Sales and Office Occupations by Sex
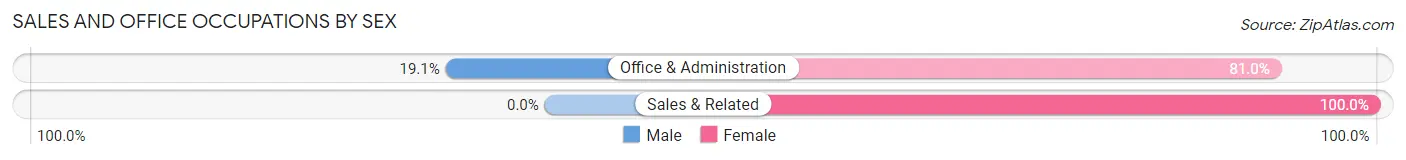
| Occupation | Male | Female |
| Sales & Related | 0 (0.0%) | 8 (100.0%) |
| Office & Administration | 4 (19.1%) | 17 (80.9%) |
| Total (Category) | 4 (13.8%) | 25 (86.2%) |
| Total (Overall) | 159 (68.2%) | 74 (31.8%) |
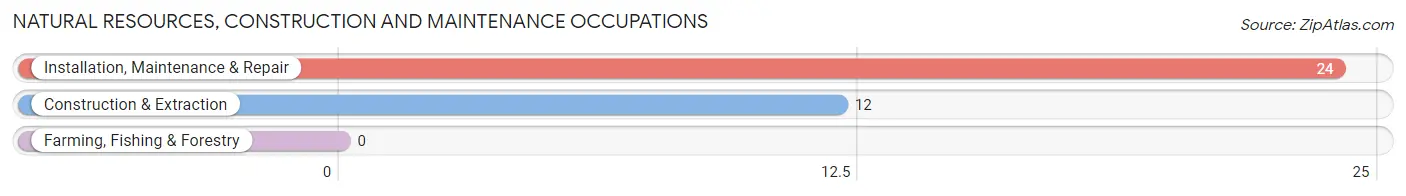
Natural Resources, Construction and Maintenance Occupations
The most common Natural Resources, Construction and Maintenance occupations in Flat Top Mountain are Installation, Maintenance & Repair (24 | 10.3%), and Construction & Extraction (12 | 5.1%).
Natural Resources, Construction and Maintenance Occupations by Sex
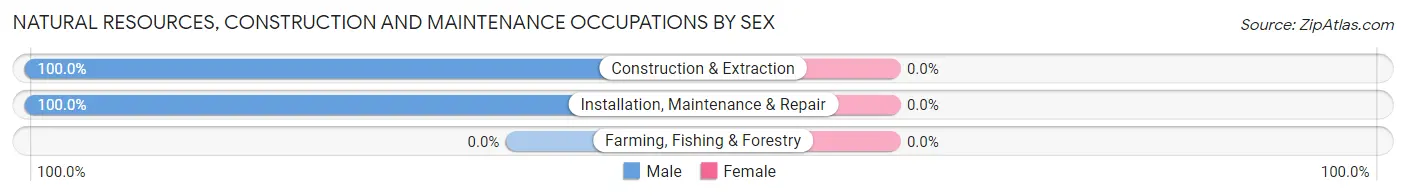
| Occupation | Male | Female |
| Farming, Fishing & Forestry | 0 (0.0%) | 0 (0.0%) |
| Construction & Extraction | 12 (100.0%) | 0 (0.0%) |
| Installation, Maintenance & Repair | 24 (100.0%) | 0 (0.0%) |
| Total (Category) | 36 (100.0%) | 0 (0.0%) |
| Total (Overall) | 159 (68.2%) | 74 (31.8%) |
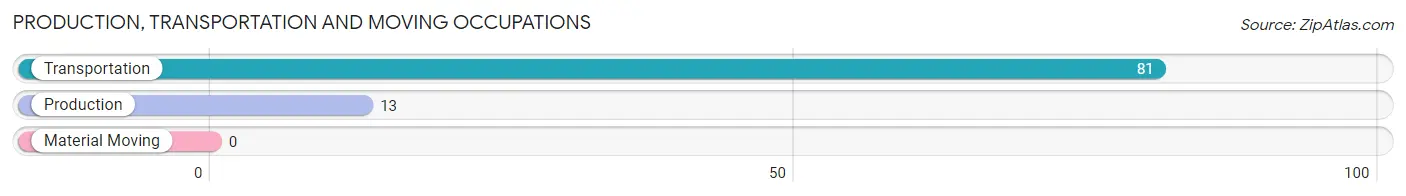
Production, Transportation and Moving Occupations
The most common Production, Transportation and Moving occupations in Flat Top Mountain are Transportation (81 | 34.8%), and Production (13 | 5.6%).
Production, Transportation and Moving Occupations by Sex
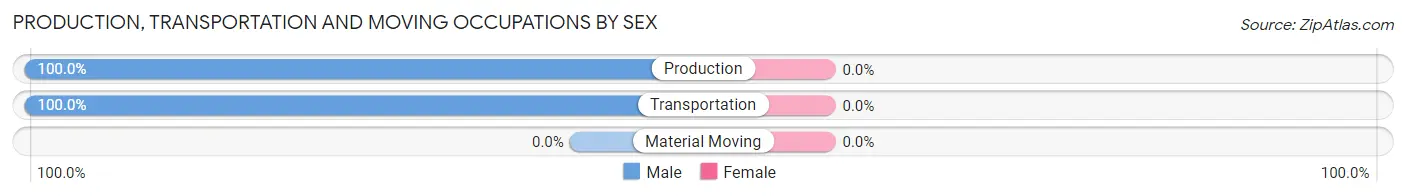
| Occupation | Male | Female |
| Production | 13 (100.0%) | 0 (0.0%) |
| Transportation | 81 (100.0%) | 0 (0.0%) |
| Material Moving | 0 (0.0%) | 0 (0.0%) |
| Total (Category) | 94 (100.0%) | 0 (0.0%) |
| Total (Overall) | 159 (68.2%) | 74 (31.8%) |
Employment Industries by Sex in Flat Top Mountain
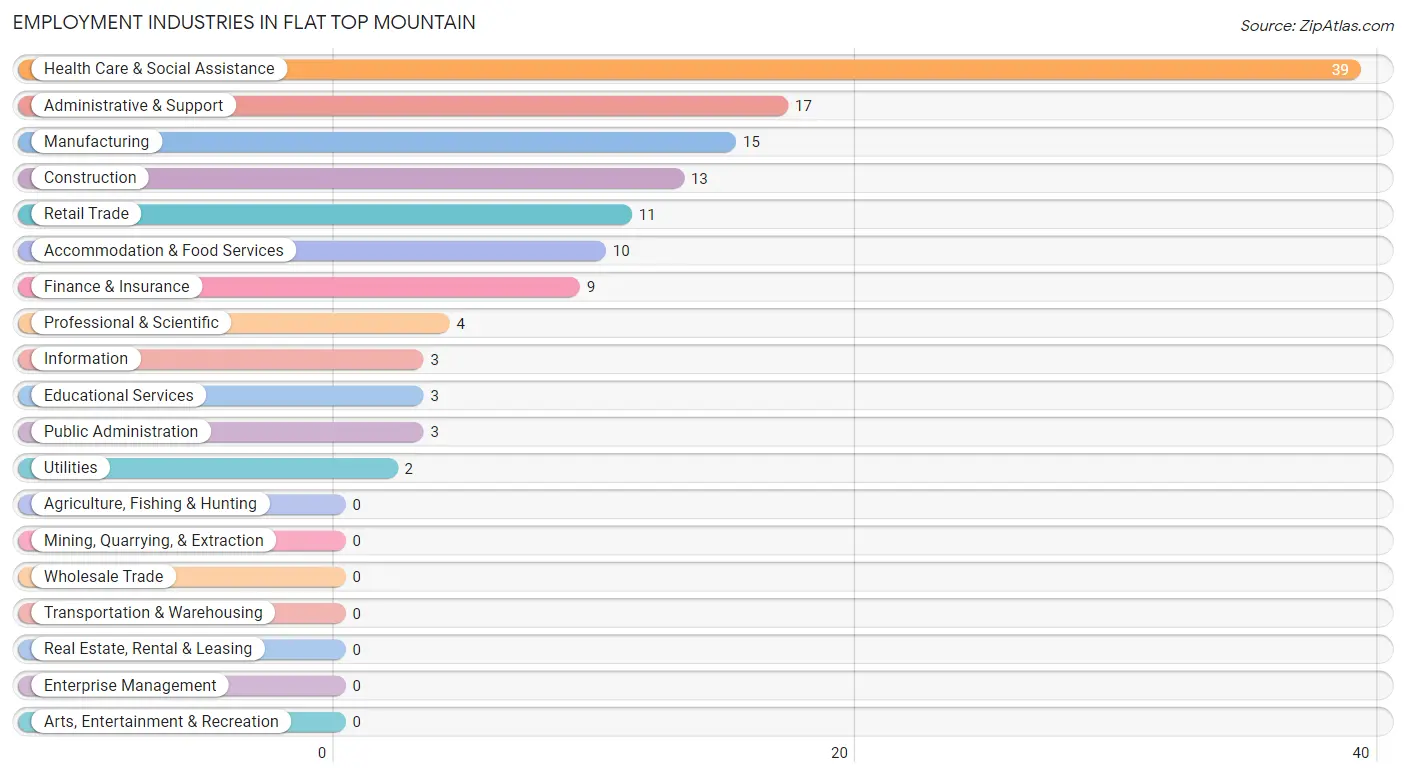
Employment Industries in Flat Top Mountain
The major employment industries in Flat Top Mountain include Health Care & Social Assistance (39 | 16.7%), Administrative & Support (17 | 7.3%), Manufacturing (15 | 6.4%), Construction (13 | 5.6%), and Retail Trade (11 | 4.7%).
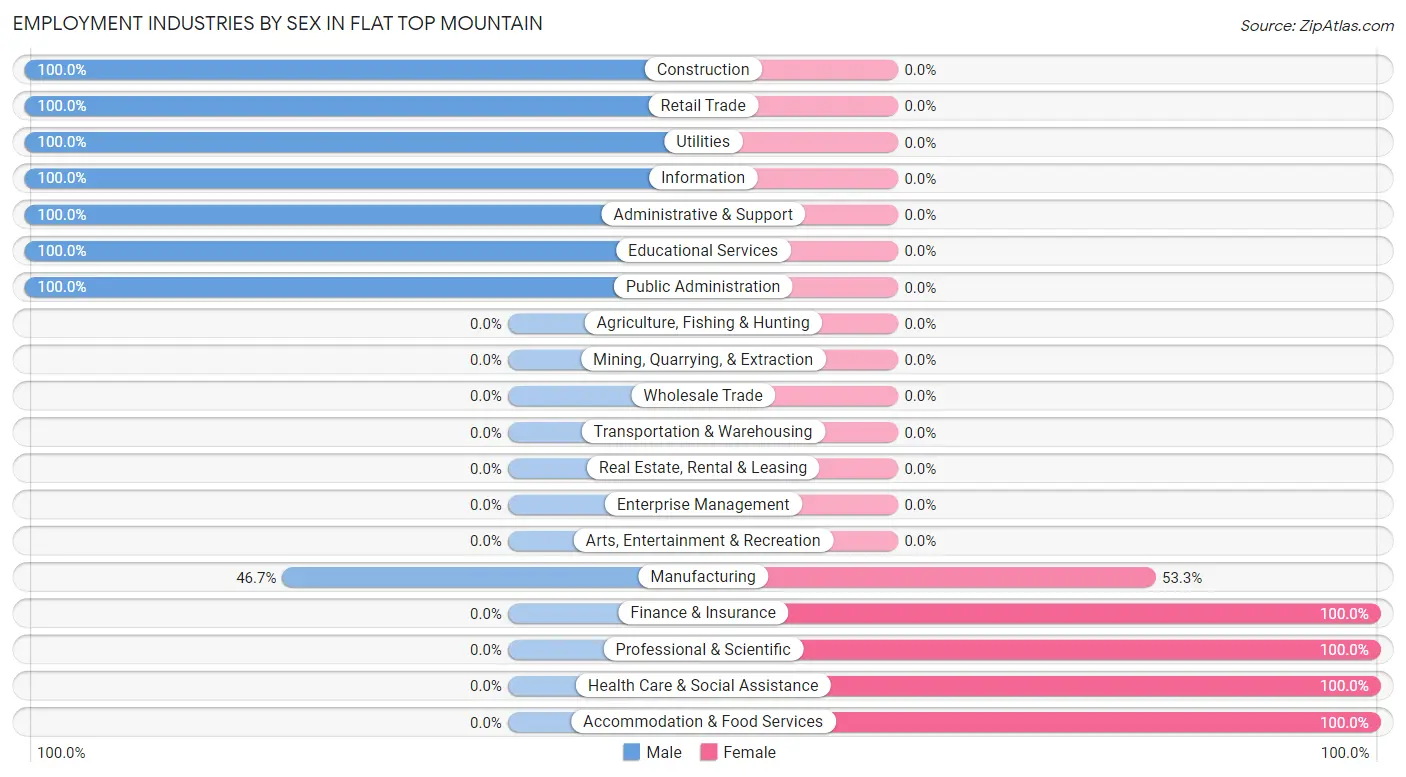
Employment Industries by Sex in Flat Top Mountain
The Flat Top Mountain industries that see more men than women are Construction (100.0%), Retail Trade (100.0%), and Utilities (100.0%), whereas the industries that tend to have a higher number of women are Finance & Insurance (100.0%), Professional & Scientific (100.0%), and Health Care & Social Assistance (100.0%).
| Industry | Male | Female |
| Agriculture, Fishing & Hunting | 0 (0.0%) | 0 (0.0%) |
| Mining, Quarrying, & Extraction | 0 (0.0%) | 0 (0.0%) |
| Construction | 13 (100.0%) | 0 (0.0%) |
| Manufacturing | 7 (46.7%) | 8 (53.3%) |
| Wholesale Trade | 0 (0.0%) | 0 (0.0%) |
| Retail Trade | 11 (100.0%) | 0 (0.0%) |
| Transportation & Warehousing | 0 (0.0%) | 0 (0.0%) |
| Utilities | 2 (100.0%) | 0 (0.0%) |
| Information | 3 (100.0%) | 0 (0.0%) |
| Finance & Insurance | 0 (0.0%) | 9 (100.0%) |
| Real Estate, Rental & Leasing | 0 (0.0%) | 0 (0.0%) |
| Professional & Scientific | 0 (0.0%) | 4 (100.0%) |
| Enterprise Management | 0 (0.0%) | 0 (0.0%) |
| Administrative & Support | 17 (100.0%) | 0 (0.0%) |
| Educational Services | 3 (100.0%) | 0 (0.0%) |
| Health Care & Social Assistance | 0 (0.0%) | 39 (100.0%) |
| Arts, Entertainment & Recreation | 0 (0.0%) | 0 (0.0%) |
| Accommodation & Food Services | 0 (0.0%) | 10 (100.0%) |
| Public Administration | 3 (100.0%) | 0 (0.0%) |
| Total | 159 (68.2%) | 74 (31.8%) |
Education in Flat Top Mountain
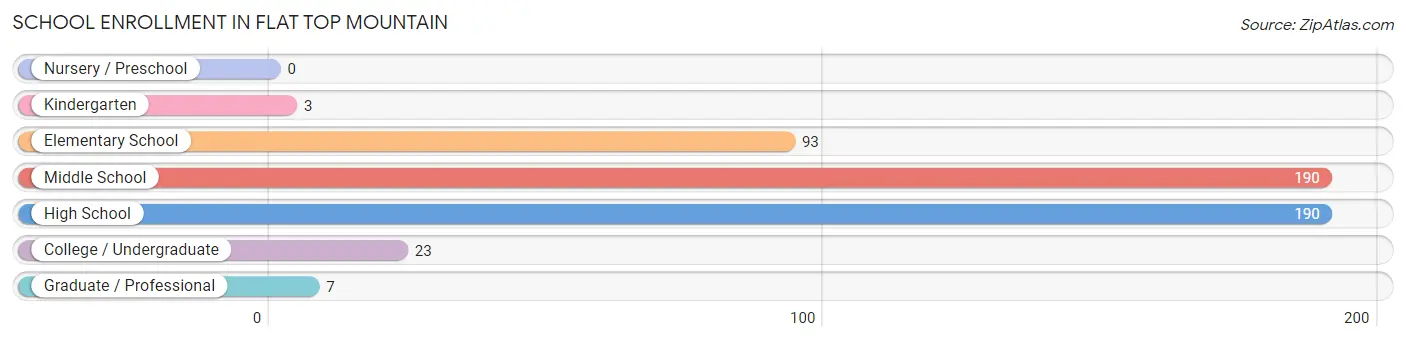
School Enrollment in Flat Top Mountain
The most common levels of schooling among the 506 students in Flat Top Mountain are middle school (190 | 37.6%), high school (190 | 37.6%), and elementary school (93 | 18.4%).
| School Level | # Students | % Students |
| Nursery / Preschool | 0 | 0.0% |
| Kindergarten | 3 | 0.6% |
| Elementary School | 93 | 18.4% |
| Middle School | 190 | 37.6% |
| High School | 190 | 37.6% |
| College / Undergraduate | 23 | 4.5% |
| Graduate / Professional | 7 | 1.4% |
| Total | 506 | 100.0% |
School Enrollment by Age by Funding Source in Flat Top Mountain
Out of a total of 506 students who are enrolled in schools in Flat Top Mountain, 24 (4.7%) attend a private institution, while the remaining 482 (95.3%) are enrolled in public schools. The age group of 5 to 9 year old has the highest likelihood of being enrolled in private schools, with 7 (100.0% in the age bracket) enrolled. Conversely, the age group of 15 to 17 year olds has the lowest likelihood of being enrolled in a private school, with 190 (100.0% in the age bracket) attending a public institution.
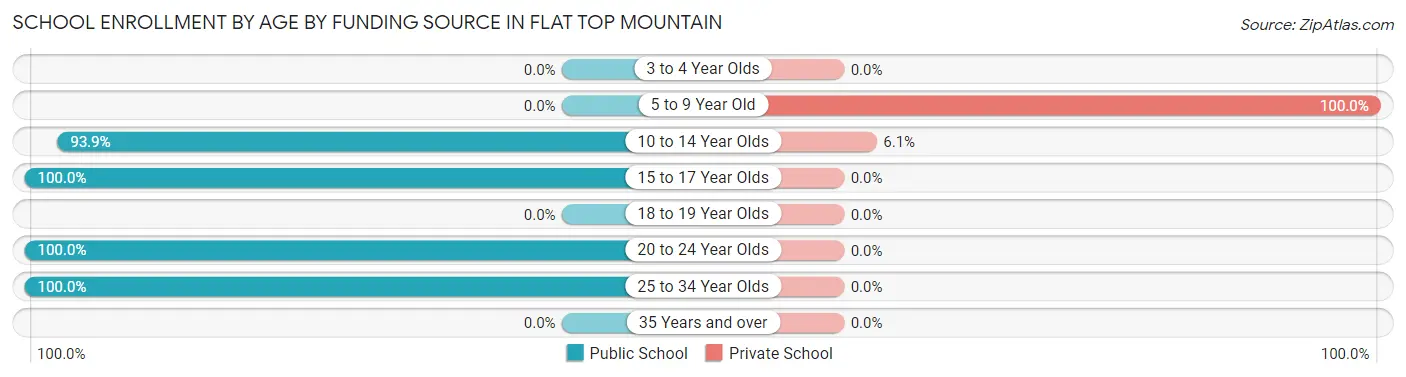
| Age Bracket | Public School | Private School |
| 3 to 4 Year Olds | 0 (0.0%) | 0 (0.0%) |
| 5 to 9 Year Old | 0 (0.0%) | 7 (100.0%) |
| 10 to 14 Year Olds | 262 (93.9%) | 17 (6.1%) |
| 15 to 17 Year Olds | 190 (100.0%) | 0 (0.0%) |
| 18 to 19 Year Olds | 0 (0.0%) | 0 (0.0%) |
| 20 to 24 Year Olds | 23 (100.0%) | 0 (0.0%) |
| 25 to 34 Year Olds | 7 (100.0%) | 0 (0.0%) |
| 35 Years and over | 0 (0.0%) | 0 (0.0%) |
| Total | 482 (95.3%) | 24 (4.7%) |
Educational Attainment by Field of Study in Flat Top Mountain
Psychology (10 | 31.2%), science & technology (9 | 28.1%), bio, nature & agricultural (7 | 21.9%), and business (6 | 18.8%) are the most common fields of study among 32 individuals in Flat Top Mountain who have obtained a bachelor's degree or higher.
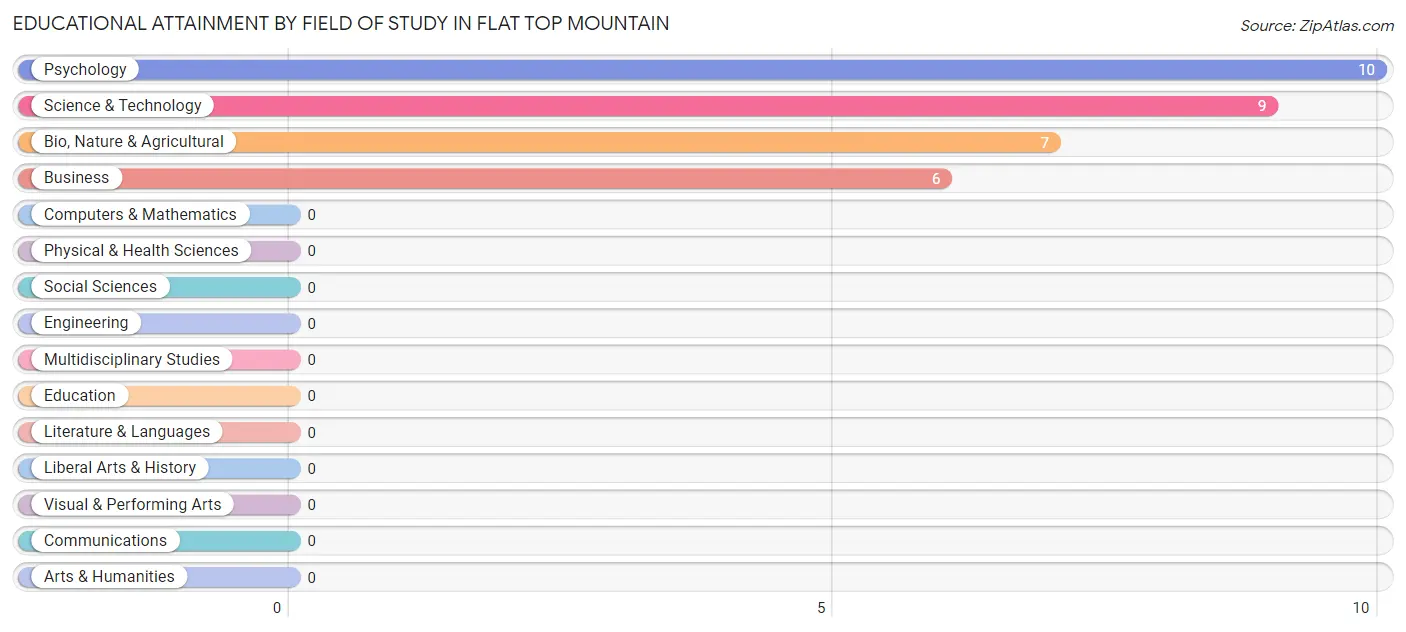
| Field of Study | # Graduates | % Graduates |
| Computers & Mathematics | 0 | 0.0% |
| Bio, Nature & Agricultural | 7 | 21.9% |
| Physical & Health Sciences | 0 | 0.0% |
| Psychology | 10 | 31.2% |
| Social Sciences | 0 | 0.0% |
| Engineering | 0 | 0.0% |
| Multidisciplinary Studies | 0 | 0.0% |
| Science & Technology | 9 | 28.1% |
| Business | 6 | 18.8% |
| Education | 0 | 0.0% |
| Literature & Languages | 0 | 0.0% |
| Liberal Arts & History | 0 | 0.0% |
| Visual & Performing Arts | 0 | 0.0% |
| Communications | 0 | 0.0% |
| Arts & Humanities | 0 | 0.0% |
| Total | 32 | 100.0% |
Transportation & Commute in Flat Top Mountain
Vehicle Availability by Sex in Flat Top Mountain
The most prevalent vehicle ownership categories in Flat Top Mountain are males with 2 vehicles (89, accounting for 56.0%) and females with 2 vehicles (10, making up 129.0%).
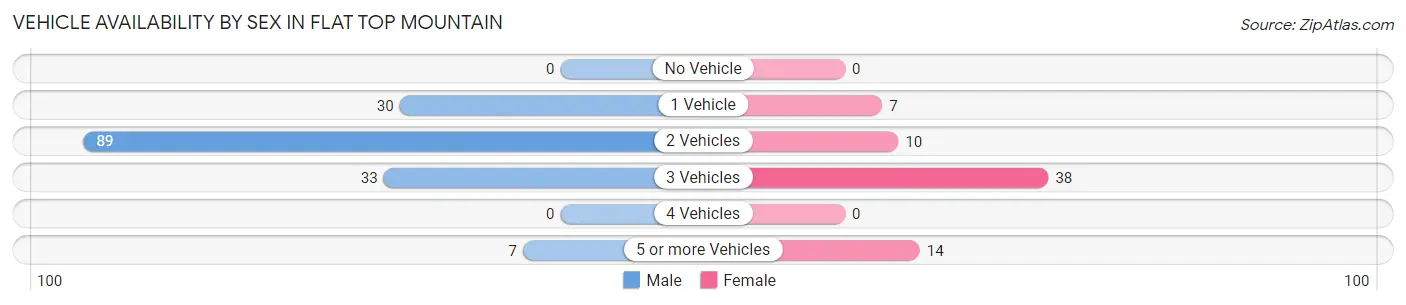
| Vehicles Available | Male | Female |
| No Vehicle | 0 (0.0%) | 0 (0.0%) |
| 1 Vehicle | 30 (18.9%) | 7 (10.1%) |
| 2 Vehicles | 89 (56.0%) | 10 (14.5%) |
| 3 Vehicles | 33 (20.7%) | 38 (55.1%) |
| 4 Vehicles | 0 (0.0%) | 0 (0.0%) |
| 5 or more Vehicles | 7 (4.4%) | 14 (20.3%) |
| Total | 159 (100.0%) | 69 (100.0%) |
Commute Time in Flat Top Mountain
The most frequently occuring commute durations in Flat Top Mountain are 35 to 39 minutes (88 commuters, 38.6%), 45 to 59 minutes (61 commuters, 26.8%), and 30 to 34 minutes (30 commuters, 13.2%).
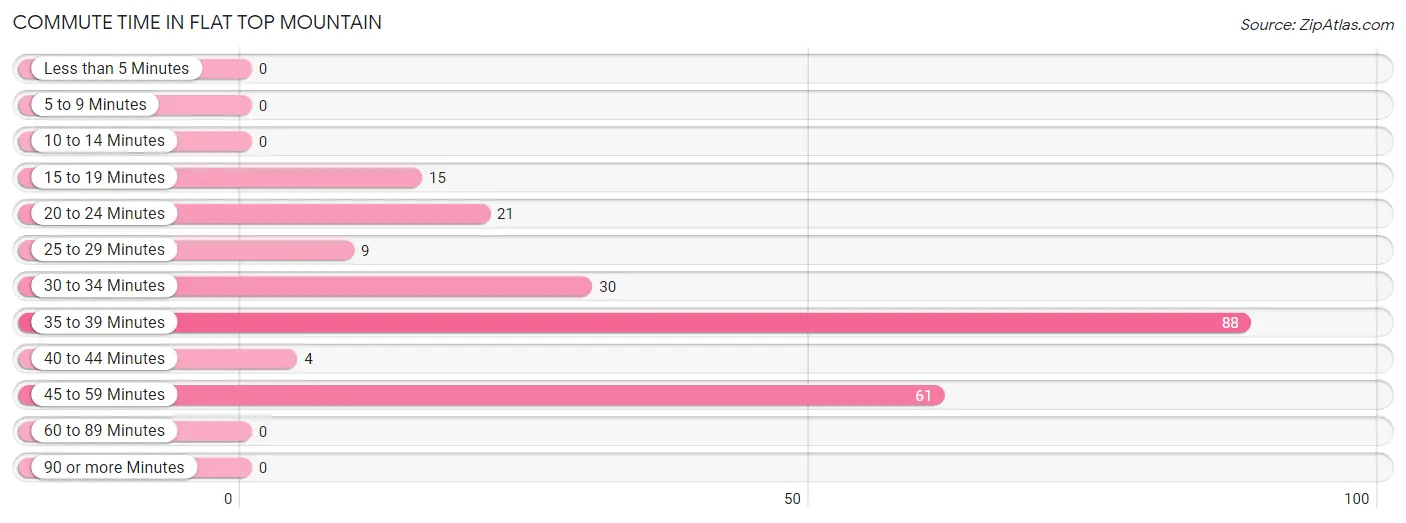
| Commute Time | # Commuters | % Commuters |
| Less than 5 Minutes | 0 | 0.0% |
| 5 to 9 Minutes | 0 | 0.0% |
| 10 to 14 Minutes | 0 | 0.0% |
| 15 to 19 Minutes | 15 | 6.6% |
| 20 to 24 Minutes | 21 | 9.2% |
| 25 to 29 Minutes | 9 | 4.0% |
| 30 to 34 Minutes | 30 | 13.2% |
| 35 to 39 Minutes | 88 | 38.6% |
| 40 to 44 Minutes | 4 | 1.8% |
| 45 to 59 Minutes | 61 | 26.8% |
| 60 to 89 Minutes | 0 | 0.0% |
| 90 or more Minutes | 0 | 0.0% |
Commute Time by Sex in Flat Top Mountain
The most common commute times in Flat Top Mountain are 35 to 39 minutes (79 commuters, 49.7%) for males and 45 to 59 minutes (22 commuters, 31.9%) for females.
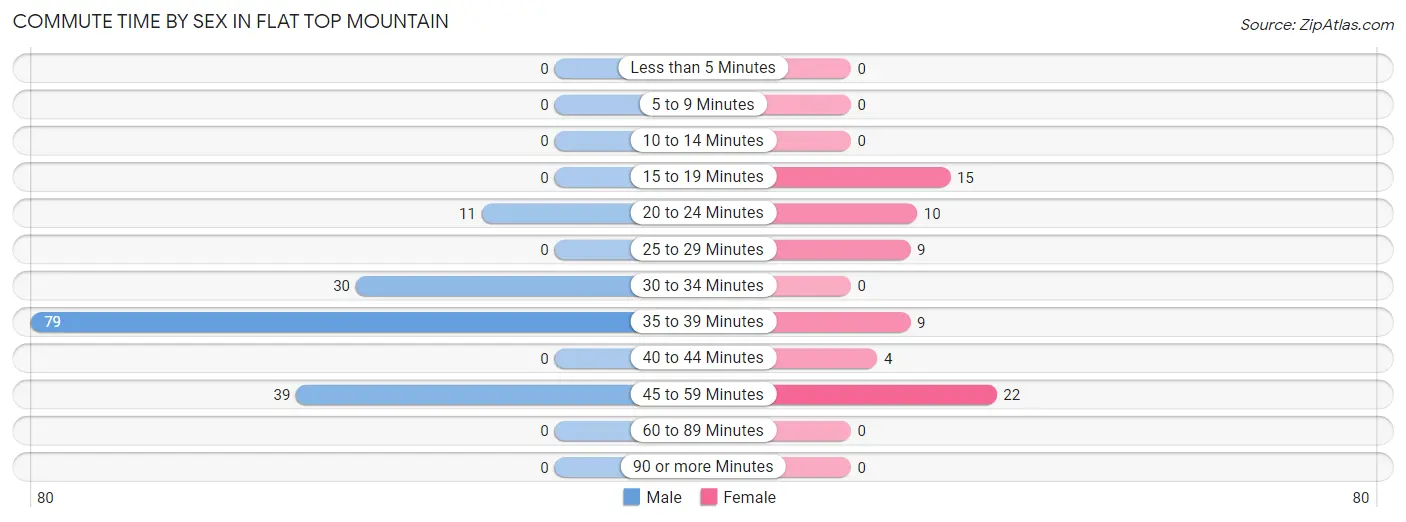
| Commute Time | Male | Female |
| Less than 5 Minutes | 0 (0.0%) | 0 (0.0%) |
| 5 to 9 Minutes | 0 (0.0%) | 0 (0.0%) |
| 10 to 14 Minutes | 0 (0.0%) | 0 (0.0%) |
| 15 to 19 Minutes | 0 (0.0%) | 15 (21.7%) |
| 20 to 24 Minutes | 11 (6.9%) | 10 (14.5%) |
| 25 to 29 Minutes | 0 (0.0%) | 9 (13.0%) |
| 30 to 34 Minutes | 30 (18.9%) | 0 (0.0%) |
| 35 to 39 Minutes | 79 (49.7%) | 9 (13.0%) |
| 40 to 44 Minutes | 0 (0.0%) | 4 (5.8%) |
| 45 to 59 Minutes | 39 (24.5%) | 22 (31.9%) |
| 60 to 89 Minutes | 0 (0.0%) | 0 (0.0%) |
| 90 or more Minutes | 0 (0.0%) | 0 (0.0%) |
Time of Departure to Work by Sex in Flat Top Mountain
The most frequent times of departure to work in Flat Top Mountain are 6:30 AM to 6:59 AM (100, 62.9%) for males and 7:00 AM to 7:29 AM (25, 36.2%) for females.
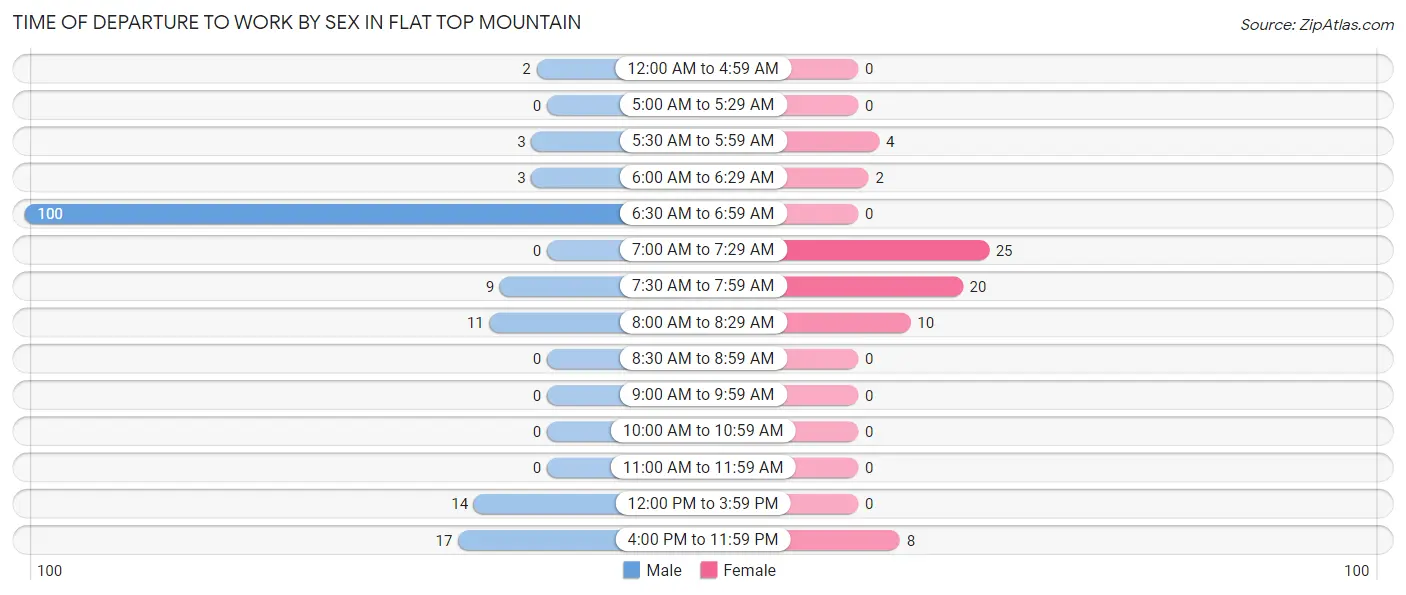
| Time of Departure | Male | Female |
| 12:00 AM to 4:59 AM | 2 (1.3%) | 0 (0.0%) |
| 5:00 AM to 5:29 AM | 0 (0.0%) | 0 (0.0%) |
| 5:30 AM to 5:59 AM | 3 (1.9%) | 4 (5.8%) |
| 6:00 AM to 6:29 AM | 3 (1.9%) | 2 (2.9%) |
| 6:30 AM to 6:59 AM | 100 (62.9%) | 0 (0.0%) |
| 7:00 AM to 7:29 AM | 0 (0.0%) | 25 (36.2%) |
| 7:30 AM to 7:59 AM | 9 (5.7%) | 20 (29.0%) |
| 8:00 AM to 8:29 AM | 11 (6.9%) | 10 (14.5%) |
| 8:30 AM to 8:59 AM | 0 (0.0%) | 0 (0.0%) |
| 9:00 AM to 9:59 AM | 0 (0.0%) | 0 (0.0%) |
| 10:00 AM to 10:59 AM | 0 (0.0%) | 0 (0.0%) |
| 11:00 AM to 11:59 AM | 0 (0.0%) | 0 (0.0%) |
| 12:00 PM to 3:59 PM | 14 (8.8%) | 0 (0.0%) |
| 4:00 PM to 11:59 PM | 17 (10.7%) | 8 (11.6%) |
| Total | 159 (100.0%) | 69 (100.0%) |
Housing Occupancy in Flat Top Mountain
Occupancy by Ownership in Flat Top Mountain
Of the total 229 dwellings in Flat Top Mountain, owner-occupied units account for 210 (91.7%), while renter-occupied units make up 19 (8.3%).
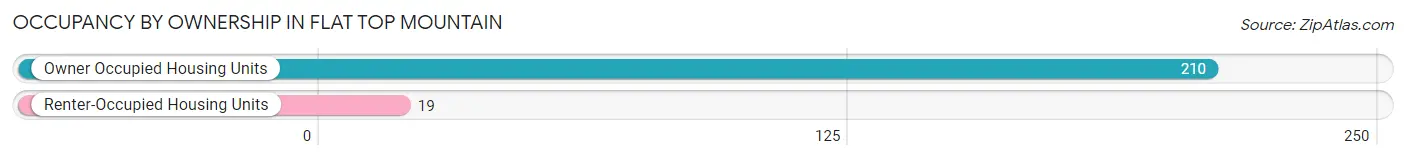
| Occupancy | # Housing Units | % Housing Units |
| Owner Occupied Housing Units | 210 | 91.7% |
| Renter-Occupied Housing Units | 19 | 8.3% |
| Total Occupied Housing Units | 229 | 100.0% |
Occupancy by Household Size in Flat Top Mountain
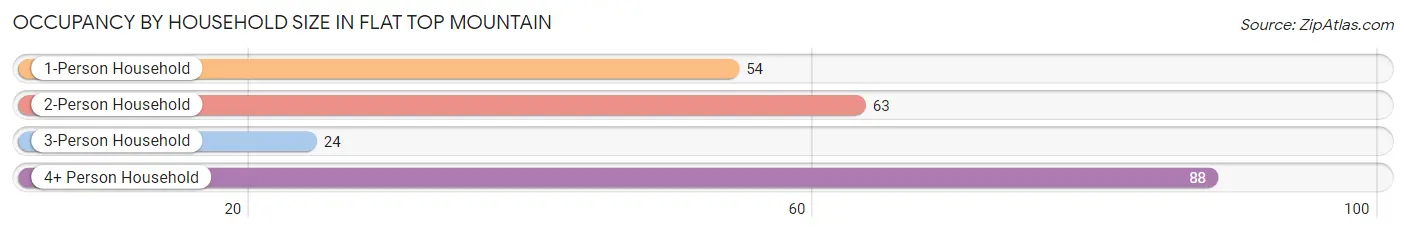
| Household Size | # Housing Units | % Housing Units |
| 1-Person Household | 54 | 23.6% |
| 2-Person Household | 63 | 27.5% |
| 3-Person Household | 24 | 10.5% |
| 4+ Person Household | 88 | 38.4% |
| Total Housing Units | 229 | 100.0% |
Occupancy by Ownership by Household Size in Flat Top Mountain
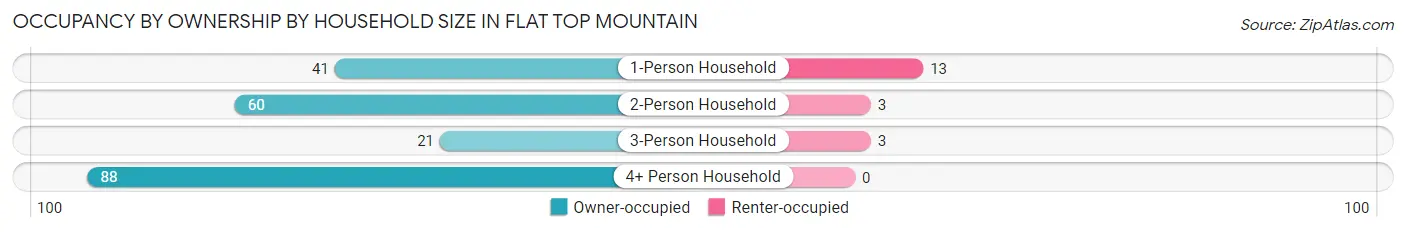
| Household Size | Owner-occupied | Renter-occupied |
| 1-Person Household | 41 (75.9%) | 13 (24.1%) |
| 2-Person Household | 60 (95.2%) | 3 (4.8%) |
| 3-Person Household | 21 (87.5%) | 3 (12.5%) |
| 4+ Person Household | 88 (100.0%) | 0 (0.0%) |
| Total Housing Units | 210 (91.7%) | 19 (8.3%) |
Occupancy by Educational Attainment in Flat Top Mountain
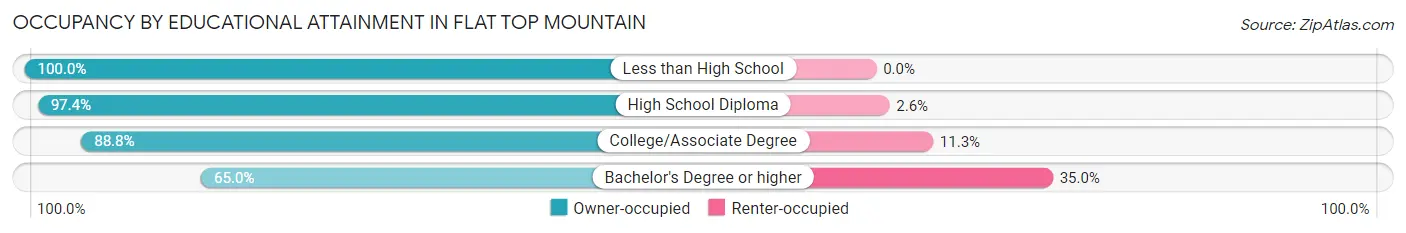
| Household Size | Owner-occupied | Renter-occupied |
| Less than High School | 14 (100.0%) | 0 (0.0%) |
| High School Diploma | 112 (97.4%) | 3 (2.6%) |
| College/Associate Degree | 71 (88.7%) | 9 (11.3%) |
| Bachelor's Degree or higher | 13 (65.0%) | 7 (35.0%) |
Occupancy by Age of Householder in Flat Top Mountain
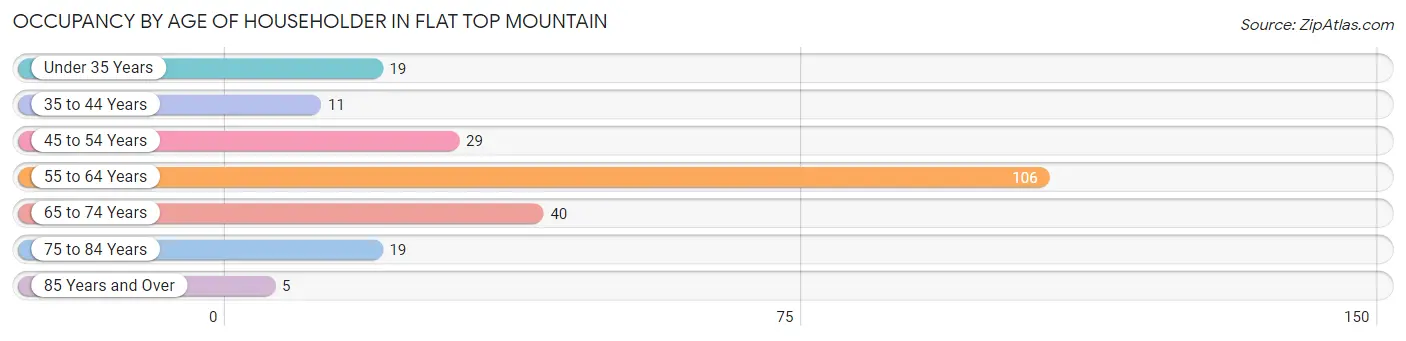
| Age Bracket | # Households | % Households |
| Under 35 Years | 19 | 8.3% |
| 35 to 44 Years | 11 | 4.8% |
| 45 to 54 Years | 29 | 12.7% |
| 55 to 64 Years | 106 | 46.3% |
| 65 to 74 Years | 40 | 17.5% |
| 75 to 84 Years | 19 | 8.3% |
| 85 Years and Over | 5 | 2.2% |
| Total | 229 | 100.0% |
Housing Finances in Flat Top Mountain
Median Income by Occupancy in Flat Top Mountain
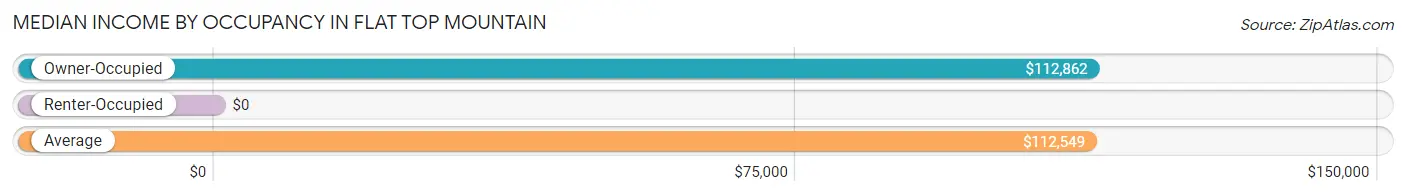
| Occupancy Type | # Households | Median Income |
| Owner-Occupied | 210 (91.7%) | $112,862 |
| Renter-Occupied | 19 (8.3%) | $0 |
| Average | 229 (100.0%) | $112,549 |
Occupancy by Householder Income Bracket in Flat Top Mountain
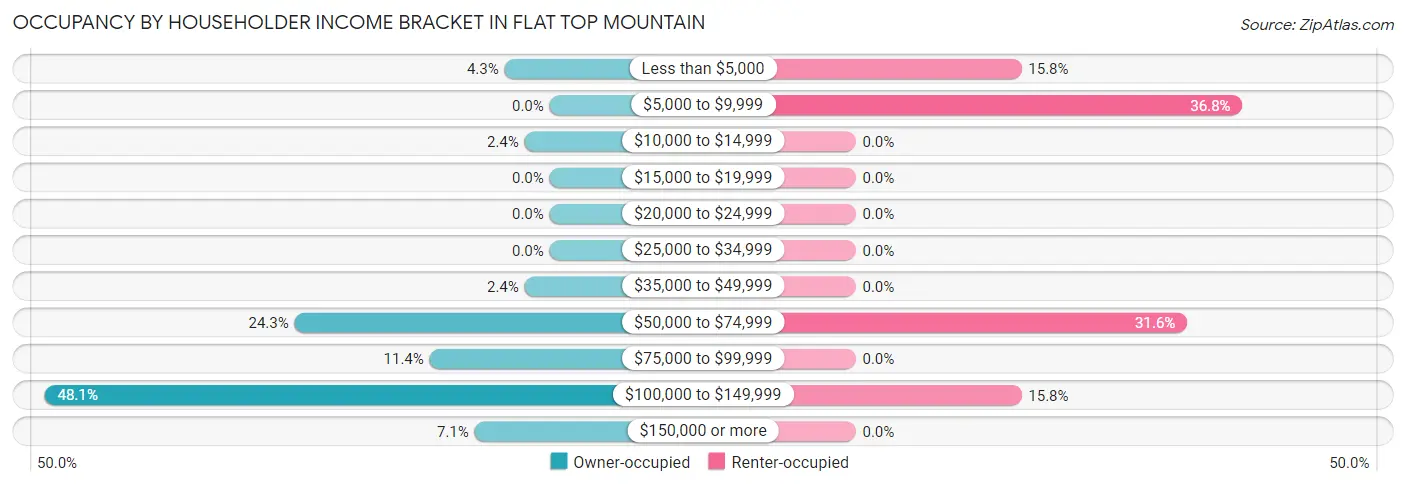
| Income Bracket | Owner-occupied | Renter-occupied |
| Less than $5,000 | 9 (4.3%) | 3 (15.8%) |
| $5,000 to $9,999 | 0 (0.0%) | 7 (36.8%) |
| $10,000 to $14,999 | 5 (2.4%) | 0 (0.0%) |
| $15,000 to $19,999 | 0 (0.0%) | 0 (0.0%) |
| $20,000 to $24,999 | 0 (0.0%) | 0 (0.0%) |
| $25,000 to $34,999 | 0 (0.0%) | 0 (0.0%) |
| $35,000 to $49,999 | 5 (2.4%) | 0 (0.0%) |
| $50,000 to $74,999 | 51 (24.3%) | 6 (31.6%) |
| $75,000 to $99,999 | 24 (11.4%) | 0 (0.0%) |
| $100,000 to $149,999 | 101 (48.1%) | 3 (15.8%) |
| $150,000 or more | 15 (7.1%) | 0 (0.0%) |
| Total | 210 (100.0%) | 19 (100.0%) |
Monthly Housing Cost Tiers in Flat Top Mountain
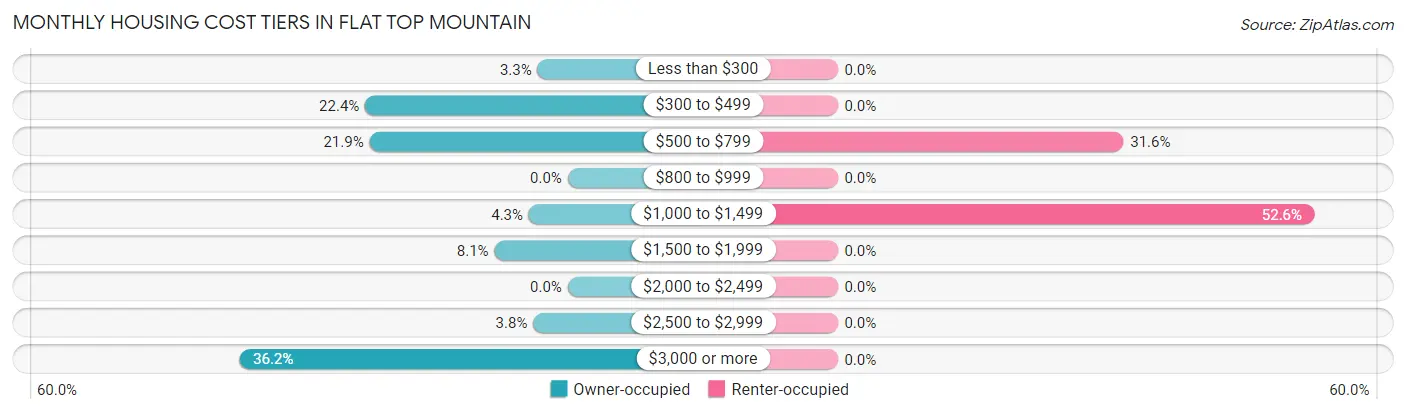
| Monthly Cost | Owner-occupied | Renter-occupied |
| Less than $300 | 7 (3.3%) | 0 (0.0%) |
| $300 to $499 | 47 (22.4%) | 0 (0.0%) |
| $500 to $799 | 46 (21.9%) | 6 (31.6%) |
| $800 to $999 | 0 (0.0%) | 0 (0.0%) |
| $1,000 to $1,499 | 9 (4.3%) | 10 (52.6%) |
| $1,500 to $1,999 | 17 (8.1%) | 0 (0.0%) |
| $2,000 to $2,499 | 0 (0.0%) | 0 (0.0%) |
| $2,500 to $2,999 | 8 (3.8%) | 0 (0.0%) |
| $3,000 or more | 76 (36.2%) | 0 (0.0%) |
| Total | 210 (100.0%) | 19 (100.0%) |
Physical Housing Characteristics in Flat Top Mountain
Housing Structures in Flat Top Mountain
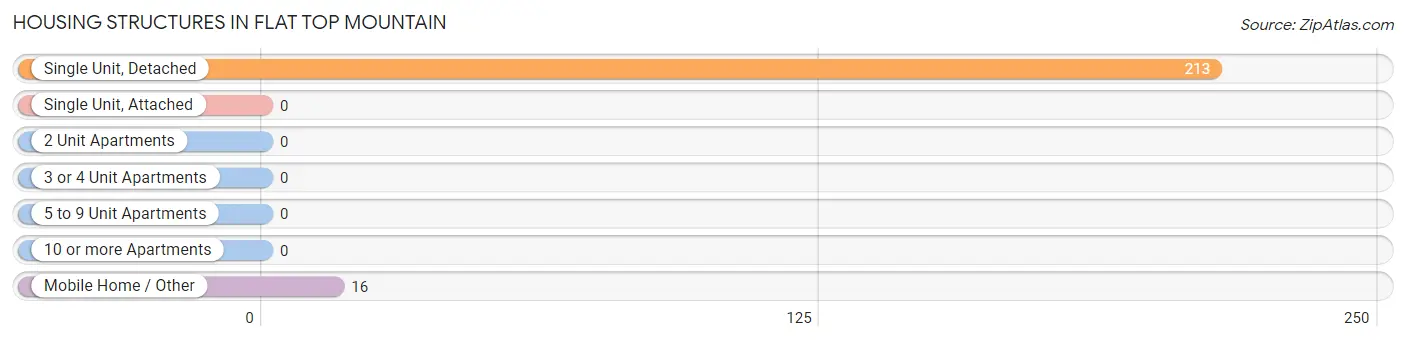
| Structure Type | # Housing Units | % Housing Units |
| Single Unit, Detached | 213 | 93.0% |
| Single Unit, Attached | 0 | 0.0% |
| 2 Unit Apartments | 0 | 0.0% |
| 3 or 4 Unit Apartments | 0 | 0.0% |
| 5 to 9 Unit Apartments | 0 | 0.0% |
| 10 or more Apartments | 0 | 0.0% |
| Mobile Home / Other | 16 | 7.0% |
| Total | 229 | 100.0% |
Housing Structures by Occupancy in Flat Top Mountain
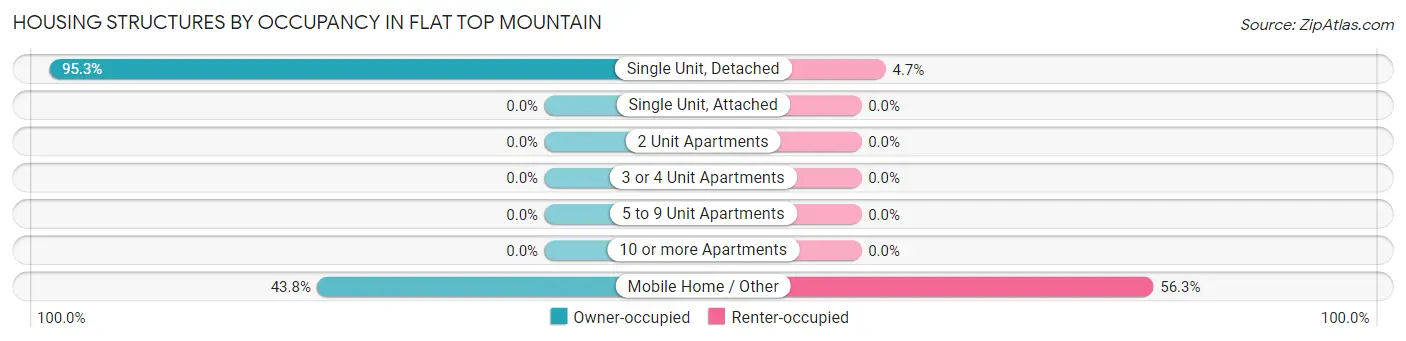
| Structure Type | Owner-occupied | Renter-occupied |
| Single Unit, Detached | 203 (95.3%) | 10 (4.7%) |
| Single Unit, Attached | 0 (0.0%) | 0 (0.0%) |
| 2 Unit Apartments | 0 (0.0%) | 0 (0.0%) |
| 3 or 4 Unit Apartments | 0 (0.0%) | 0 (0.0%) |
| 5 to 9 Unit Apartments | 0 (0.0%) | 0 (0.0%) |
| 10 or more Apartments | 0 (0.0%) | 0 (0.0%) |
| Mobile Home / Other | 7 (43.8%) | 9 (56.2%) |
| Total | 210 (91.7%) | 19 (8.3%) |
Housing Structures by Number of Rooms in Flat Top Mountain
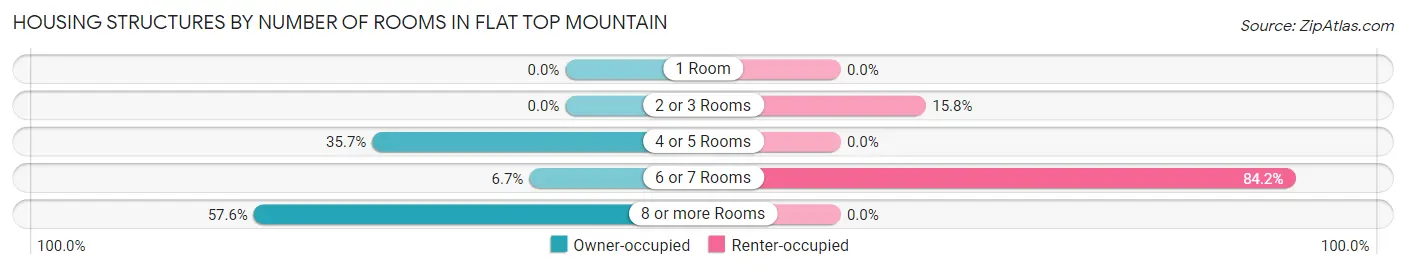
| Number of Rooms | Owner-occupied | Renter-occupied |
| 1 Room | 0 (0.0%) | 0 (0.0%) |
| 2 or 3 Rooms | 0 (0.0%) | 3 (15.8%) |
| 4 or 5 Rooms | 75 (35.7%) | 0 (0.0%) |
| 6 or 7 Rooms | 14 (6.7%) | 16 (84.2%) |
| 8 or more Rooms | 121 (57.6%) | 0 (0.0%) |
| Total | 210 (100.0%) | 19 (100.0%) |
Housing Structure by Heating Type in Flat Top Mountain
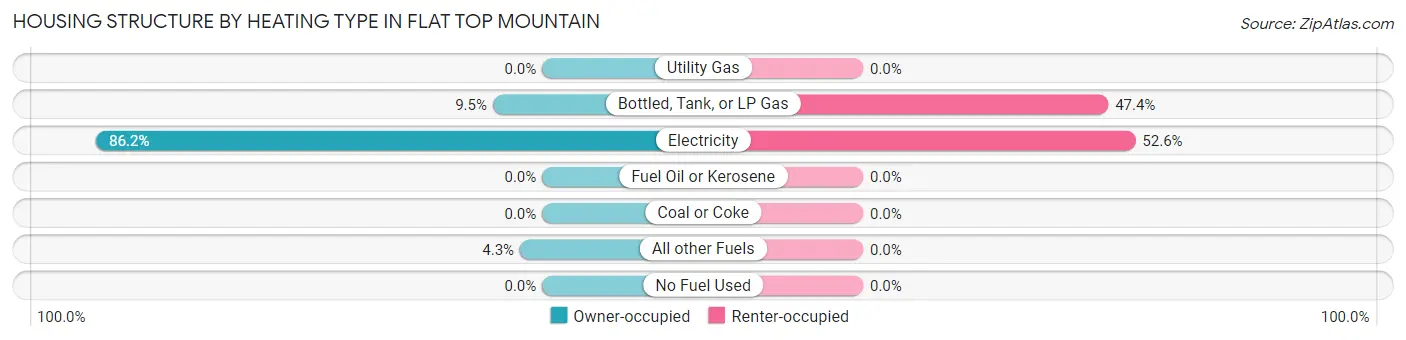
| Heating Type | Owner-occupied | Renter-occupied |
| Utility Gas | 0 (0.0%) | 0 (0.0%) |
| Bottled, Tank, or LP Gas | 20 (9.5%) | 9 (47.4%) |
| Electricity | 181 (86.2%) | 10 (52.6%) |
| Fuel Oil or Kerosene | 0 (0.0%) | 0 (0.0%) |
| Coal or Coke | 0 (0.0%) | 0 (0.0%) |
| All other Fuels | 9 (4.3%) | 0 (0.0%) |
| No Fuel Used | 0 (0.0%) | 0 (0.0%) |
| Total | 210 (100.0%) | 19 (100.0%) |
Household Vehicle Usage in Flat Top Mountain
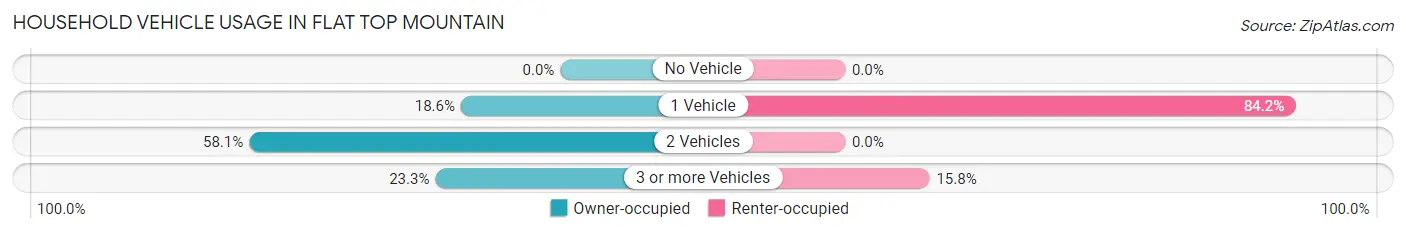
| Vehicles per Household | Owner-occupied | Renter-occupied |
| No Vehicle | 0 (0.0%) | 0 (0.0%) |
| 1 Vehicle | 39 (18.6%) | 16 (84.2%) |
| 2 Vehicles | 122 (58.1%) | 0 (0.0%) |
| 3 or more Vehicles | 49 (23.3%) | 3 (15.8%) |
| Total | 210 (100.0%) | 19 (100.0%) |
Real Estate & Mortgages in Flat Top Mountain
Real Estate and Mortgage Overview in Flat Top Mountain
| Characteristic | Without Mortgage | With Mortgage |
| Housing Units | 100 | 110 |
| Median Property Value | - | - |
| Median Household Income | $69,118 | $11 |
| Monthly Housing Costs | $478 | $76 |
| Real Estate Taxes | $1,100 | $0 |
Property Value by Mortgage Status in Flat Top Mountain
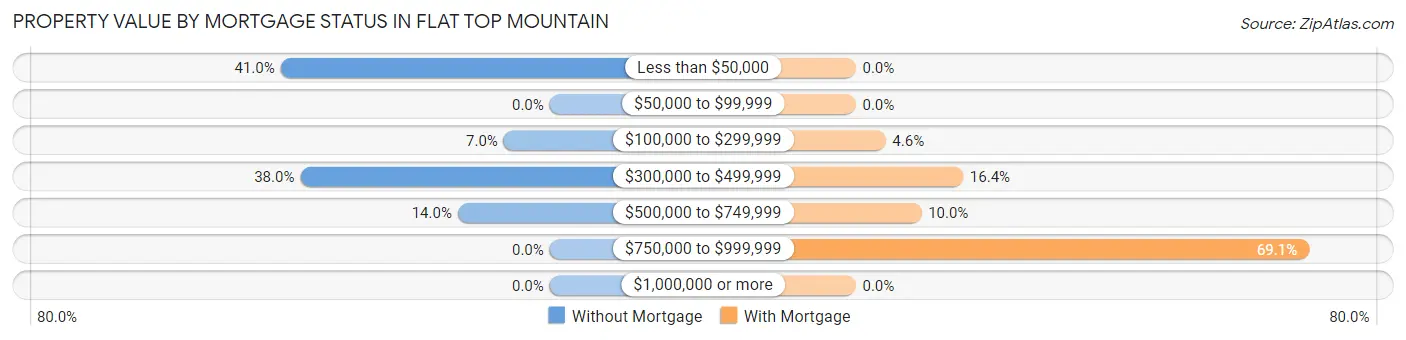
| Property Value | Without Mortgage | With Mortgage |
| Less than $50,000 | 41 (41.0%) | 0 (0.0%) |
| $50,000 to $99,999 | 0 (0.0%) | 0 (0.0%) |
| $100,000 to $299,999 | 7 (7.0%) | 5 (4.5%) |
| $300,000 to $499,999 | 38 (38.0%) | 18 (16.4%) |
| $500,000 to $749,999 | 14 (14.0%) | 11 (10.0%) |
| $750,000 to $999,999 | 0 (0.0%) | 76 (69.1%) |
| $1,000,000 or more | 0 (0.0%) | 0 (0.0%) |
| Total | 100 (100.0%) | 110 (100.0%) |
Household Income by Mortgage Status in Flat Top Mountain
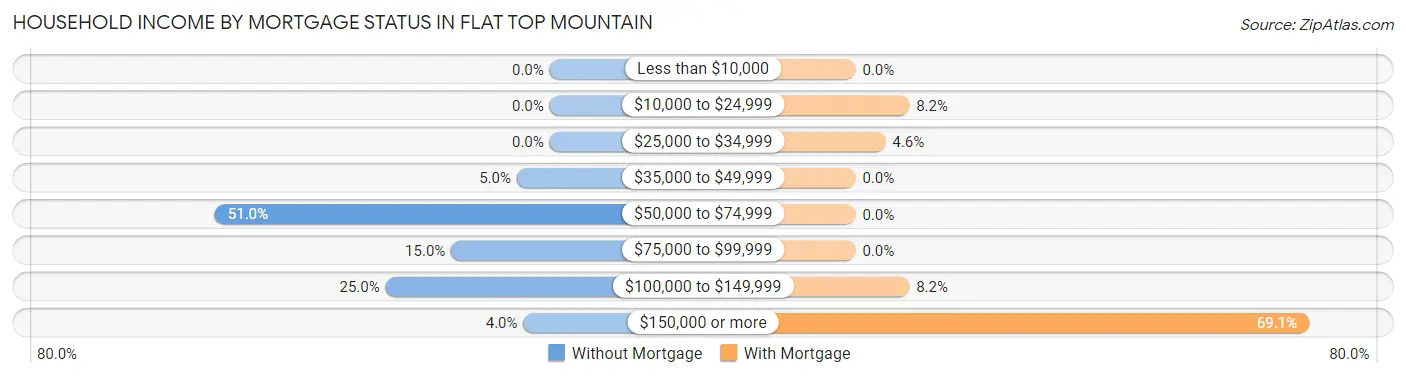
| Household Income | Without Mortgage | With Mortgage |
| Less than $10,000 | 0 (0.0%) | 0 (0.0%) |
| $10,000 to $24,999 | 0 (0.0%) | 9 (8.2%) |
| $25,000 to $34,999 | 0 (0.0%) | 5 (4.5%) |
| $35,000 to $49,999 | 5 (5.0%) | 0 (0.0%) |
| $50,000 to $74,999 | 51 (51.0%) | 0 (0.0%) |
| $75,000 to $99,999 | 15 (15.0%) | 0 (0.0%) |
| $100,000 to $149,999 | 25 (25.0%) | 9 (8.2%) |
| $150,000 or more | 4 (4.0%) | 76 (69.1%) |
| Total | 100 (100.0%) | 110 (100.0%) |
Property Value to Household Income Ratio in Flat Top Mountain
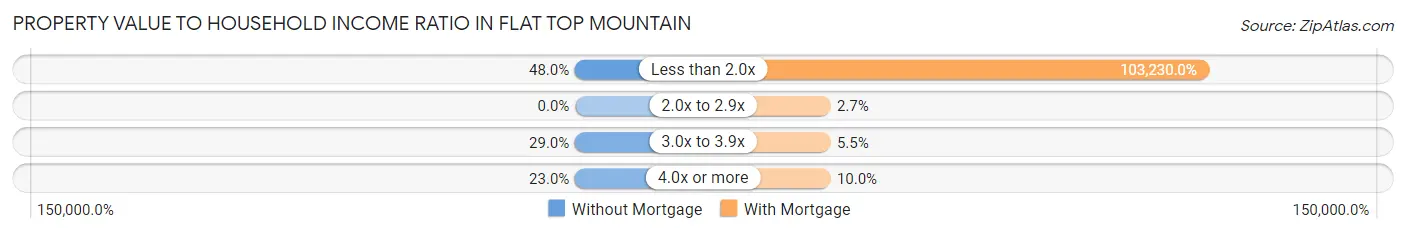
| Value-to-Income Ratio | Without Mortgage | With Mortgage |
| Less than 2.0x | 48 (48.0%) | 113,553 (103,230.0%) |
| 2.0x to 2.9x | 0 (0.0%) | 3 (2.7%) |
| 3.0x to 3.9x | 29 (29.0%) | 6 (5.4%) |
| 4.0x or more | 23 (23.0%) | 11 (10.0%) |
| Total | 100 (100.0%) | 110 (100.0%) |
Real Estate Taxes by Mortgage Status in Flat Top Mountain
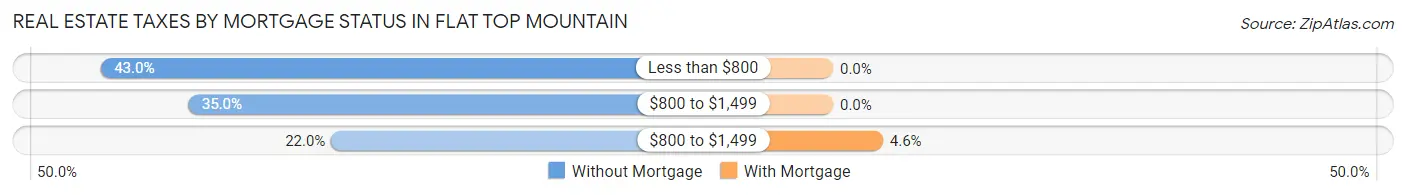
| Property Taxes | Without Mortgage | With Mortgage |
| Less than $800 | 43 (43.0%) | 0 (0.0%) |
| $800 to $1,499 | 35 (35.0%) | 0 (0.0%) |
| $800 to $1,499 | 22 (22.0%) | 5 (4.5%) |
| Total | 100 (100.0%) | 110 (100.0%) |
Health & Disability in Flat Top Mountain
Health Insurance Coverage by Age in Flat Top Mountain
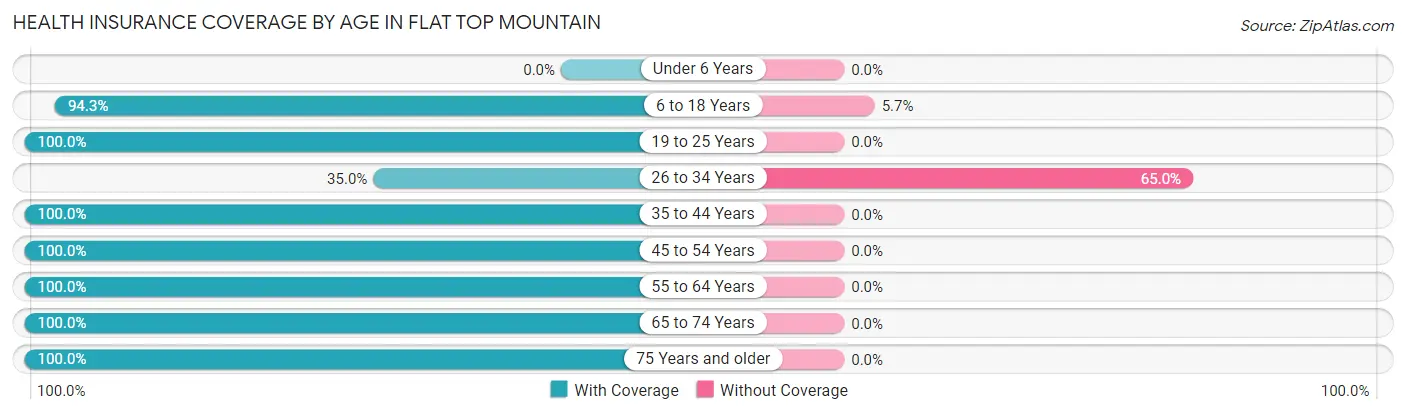
| Age Bracket | With Coverage | Without Coverage |
| Under 6 Years | 0 (0.0%) | 0 (0.0%) |
| 6 to 18 Years | 449 (94.3%) | 27 (5.7%) |
| 19 to 25 Years | 37 (100.0%) | 0 (0.0%) |
| 26 to 34 Years | 7 (35.0%) | 13 (65.0%) |
| 35 to 44 Years | 11 (100.0%) | 0 (0.0%) |
| 45 to 54 Years | 41 (100.0%) | 0 (0.0%) |
| 55 to 64 Years | 191 (100.0%) | 0 (0.0%) |
| 65 to 74 Years | 91 (100.0%) | 0 (0.0%) |
| 75 Years and older | 24 (100.0%) | 0 (0.0%) |
| Total | 851 (95.5%) | 40 (4.5%) |
Health Insurance Coverage by Citizenship Status in Flat Top Mountain
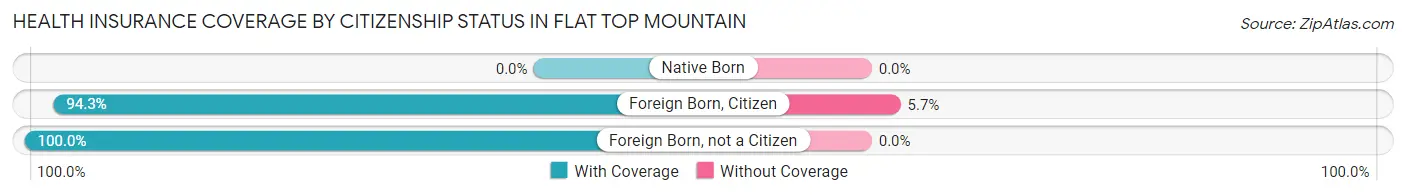
| Citizenship Status | With Coverage | Without Coverage |
| Native Born | 0 (0.0%) | 0 (0.0%) |
| Foreign Born, Citizen | 449 (94.3%) | 27 (5.7%) |
| Foreign Born, not a Citizen | 37 (100.0%) | 0 (0.0%) |
Health Insurance Coverage by Household Income in Flat Top Mountain
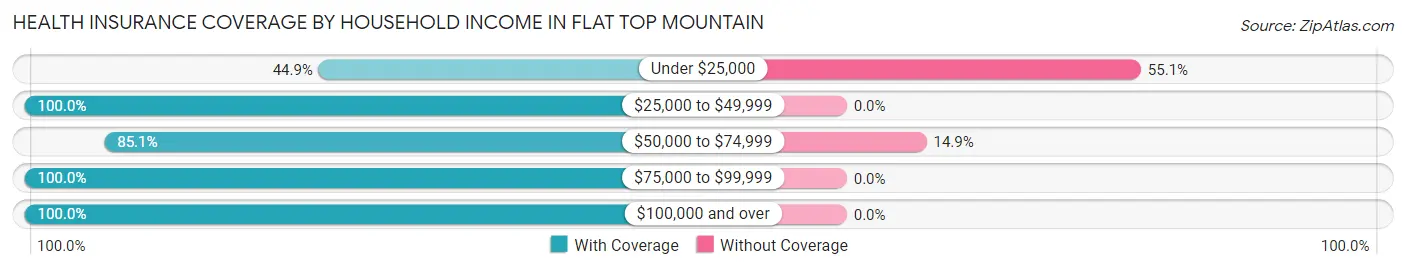
| Household Income | With Coverage | Without Coverage |
| Under $25,000 | 22 (44.9%) | 27 (55.1%) |
| $25,000 to $49,999 | 10 (100.0%) | 0 (0.0%) |
| $50,000 to $74,999 | 74 (85.1%) | 13 (14.9%) |
| $75,000 to $99,999 | 68 (100.0%) | 0 (0.0%) |
| $100,000 and over | 677 (100.0%) | 0 (0.0%) |
Public vs Private Health Insurance Coverage by Age in Flat Top Mountain
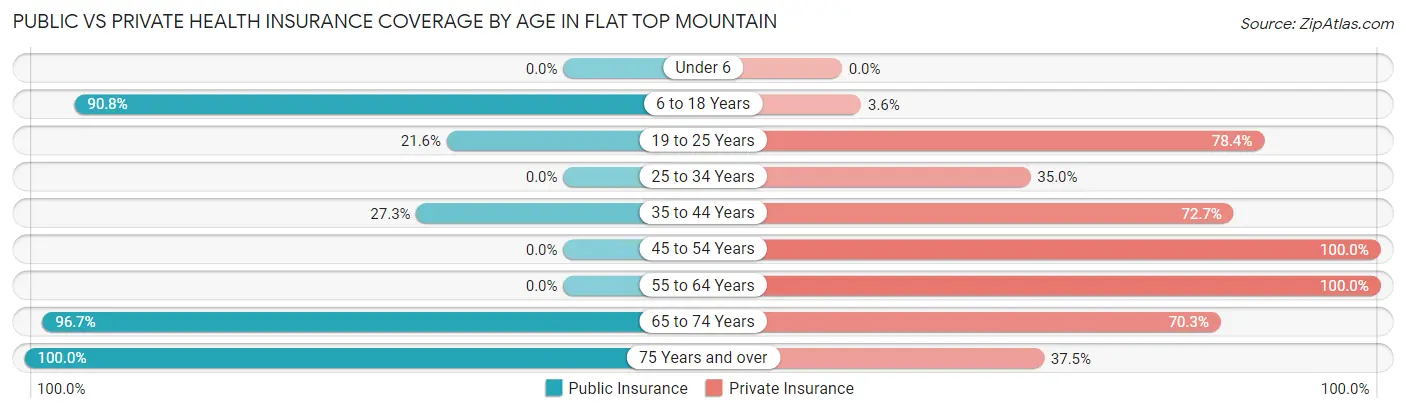
| Age Bracket | Public Insurance | Private Insurance |
| Under 6 | 0 (0.0%) | 0 (0.0%) |
| 6 to 18 Years | 432 (90.8%) | 17 (3.6%) |
| 19 to 25 Years | 8 (21.6%) | 29 (78.4%) |
| 25 to 34 Years | 0 (0.0%) | 7 (35.0%) |
| 35 to 44 Years | 3 (27.3%) | 8 (72.7%) |
| 45 to 54 Years | 0 (0.0%) | 41 (100.0%) |
| 55 to 64 Years | 0 (0.0%) | 191 (100.0%) |
| 65 to 74 Years | 88 (96.7%) | 64 (70.3%) |
| 75 Years and over | 24 (100.0%) | 9 (37.5%) |
| Total | 555 (62.3%) | 366 (41.1%) |
Disability Status by Sex by Age in Flat Top Mountain
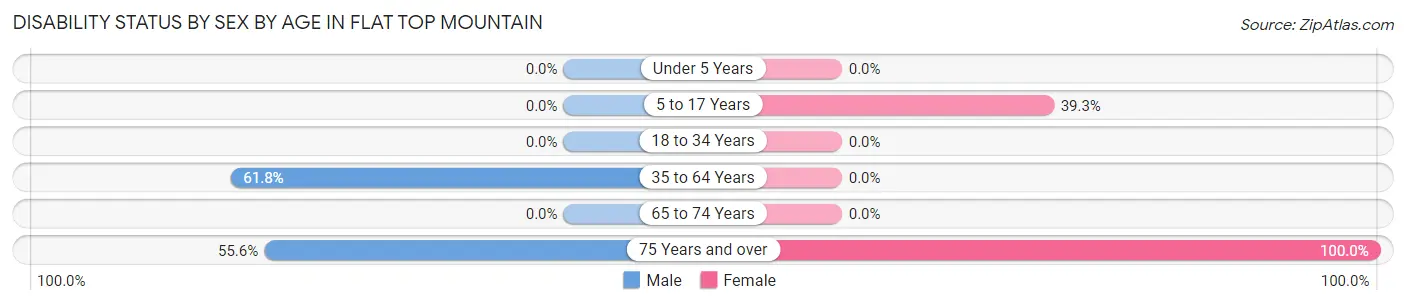
| Age Bracket | Male | Female |
| Under 5 Years | 0 (0.0%) | 0 (0.0%) |
| 5 to 17 Years | 0 (0.0%) | 175 (39.3%) |
| 18 to 34 Years | 0 (0.0%) | 0 (0.0%) |
| 35 to 64 Years | 76 (61.8%) | 0 (0.0%) |
| 65 to 74 Years | 0 (0.0%) | 0 (0.0%) |
| 75 Years and over | 5 (55.6%) | 15 (100.0%) |
Disability Class by Sex by Age in Flat Top Mountain
Disability Class: Hearing Difficulty
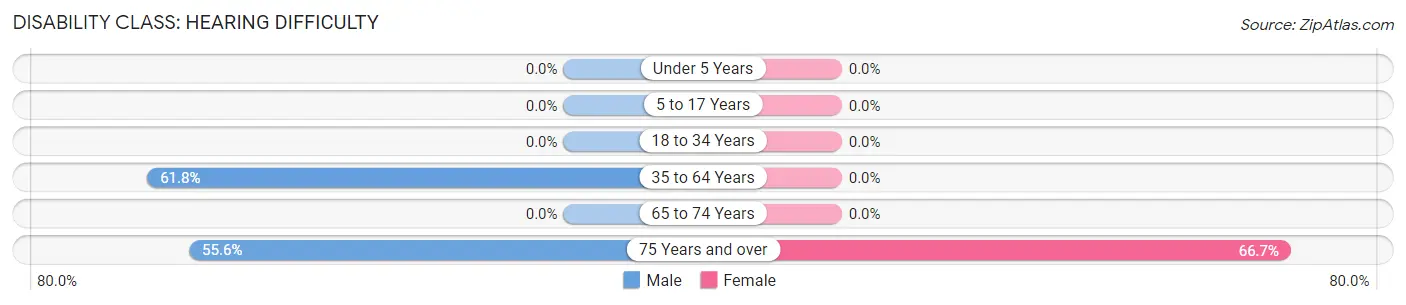
| Age Bracket | Male | Female |
| Under 5 Years | 0 (0.0%) | 0 (0.0%) |
| 5 to 17 Years | 0 (0.0%) | 0 (0.0%) |
| 18 to 34 Years | 0 (0.0%) | 0 (0.0%) |
| 35 to 64 Years | 76 (61.8%) | 0 (0.0%) |
| 65 to 74 Years | 0 (0.0%) | 0 (0.0%) |
| 75 Years and over | 5 (55.6%) | 10 (66.7%) |
Disability Class: Vision Difficulty
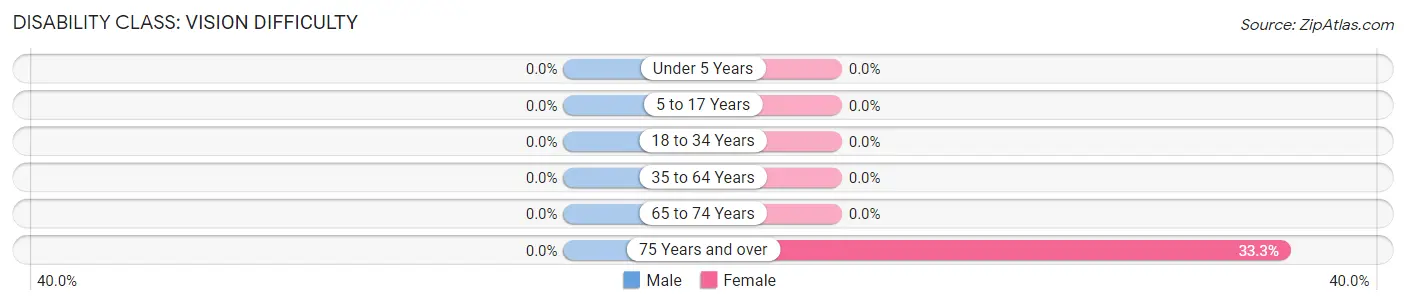
| Age Bracket | Male | Female |
| Under 5 Years | 0 (0.0%) | 0 (0.0%) |
| 5 to 17 Years | 0 (0.0%) | 0 (0.0%) |
| 18 to 34 Years | 0 (0.0%) | 0 (0.0%) |
| 35 to 64 Years | 0 (0.0%) | 0 (0.0%) |
| 65 to 74 Years | 0 (0.0%) | 0 (0.0%) |
| 75 Years and over | 0 (0.0%) | 5 (33.3%) |
Disability Class: Cognitive Difficulty
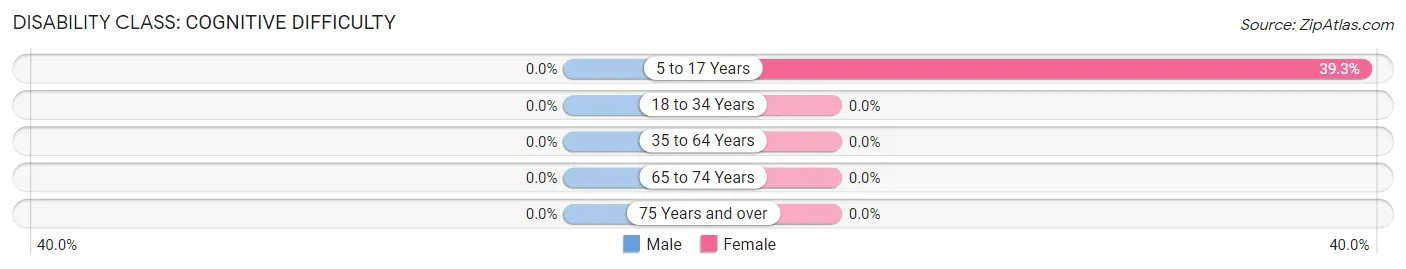
| Age Bracket | Male | Female |
| 5 to 17 Years | 0 (0.0%) | 175 (39.3%) |
| 18 to 34 Years | 0 (0.0%) | 0 (0.0%) |
| 35 to 64 Years | 0 (0.0%) | 0 (0.0%) |
| 65 to 74 Years | 0 (0.0%) | 0 (0.0%) |
| 75 Years and over | 0 (0.0%) | 0 (0.0%) |
Disability Class: Ambulatory Difficulty
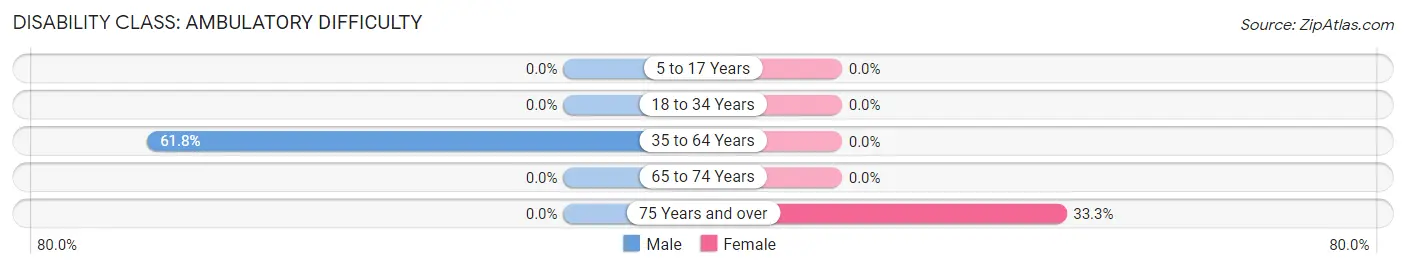
| Age Bracket | Male | Female |
| 5 to 17 Years | 0 (0.0%) | 0 (0.0%) |
| 18 to 34 Years | 0 (0.0%) | 0 (0.0%) |
| 35 to 64 Years | 76 (61.8%) | 0 (0.0%) |
| 65 to 74 Years | 0 (0.0%) | 0 (0.0%) |
| 75 Years and over | 0 (0.0%) | 5 (33.3%) |
Disability Class: Self-Care Difficulty

| Age Bracket | Male | Female |
| 5 to 17 Years | 0 (0.0%) | 89 (20.0%) |
| 18 to 34 Years | 0 (0.0%) | 0 (0.0%) |
| 35 to 64 Years | 0 (0.0%) | 0 (0.0%) |
| 65 to 74 Years | 0 (0.0%) | 0 (0.0%) |
| 75 Years and over | 0 (0.0%) | 0 (0.0%) |
Technology Access in Flat Top Mountain
Computing Device Access in Flat Top Mountain
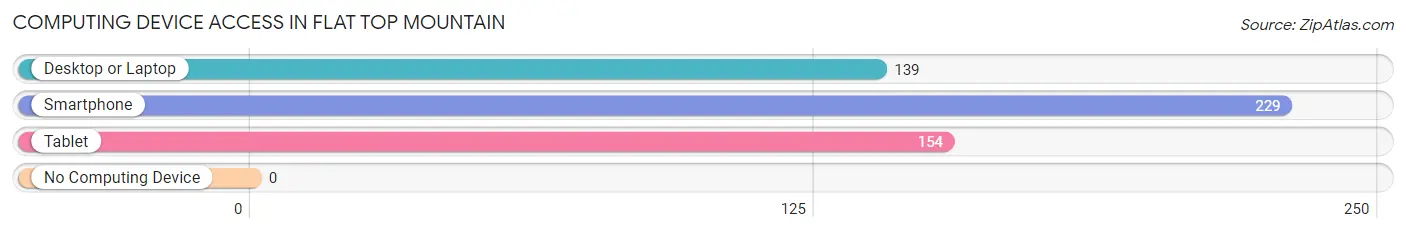
| Device Type | # Households | % Households |
| Desktop or Laptop | 139 | 60.7% |
| Smartphone | 229 | 100.0% |
| Tablet | 154 | 67.2% |
| No Computing Device | 0 | 0.0% |
| Total | 229 | 100.0% |
Internet Access in Flat Top Mountain
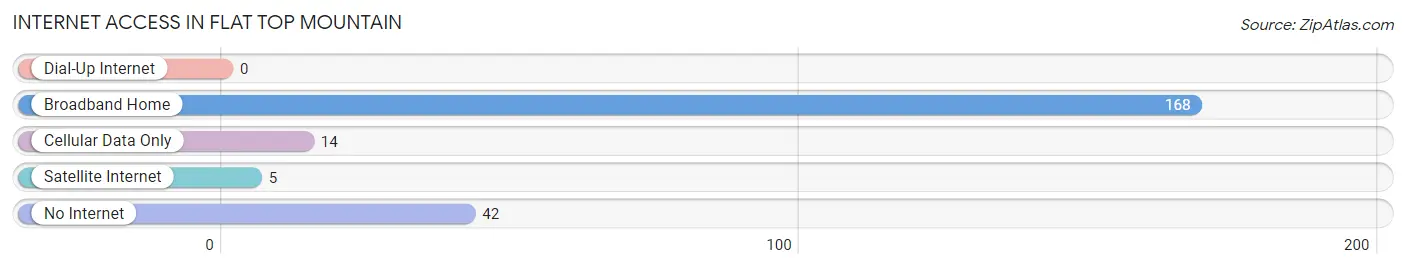
| Internet Type | # Households | % Households |
| Dial-Up Internet | 0 | 0.0% |
| Broadband Home | 168 | 73.4% |
| Cellular Data Only | 14 | 6.1% |
| Satellite Internet | 5 | 2.2% |
| No Internet | 42 | 18.3% |
| Total | 229 | 100.0% |
Flat Top Mountain Summary
Flat Top Mountain is a small mountain located in the Appalachian Mountains of East Tennessee. It is located in the Cherokee National Forest and is part of the Unaka Range. The mountain is approximately 2,400 feet in elevation and is the highest point in Unicoi County.
Geography
Flat Top Mountain is located in the Appalachian Mountains of East Tennessee. It is located in the Cherokee National Forest and is part of the Unaka Range. The mountain is approximately 2,400 feet in elevation and is the highest point in Unicoi County. The mountain is surrounded by the Nolichucky River to the north, the Unicoi Mountains to the east, and the Bald Mountains to the south. The mountain is accessible by a gravel road that winds up the mountain from the Nolichucky River.
History
Flat Top Mountain has a long and varied history. The mountain was first inhabited by the Cherokee Indians, who used the mountain as a hunting ground. The mountain was also used as a refuge during the Cherokee Removal of the 1830s. After the removal, the mountain was used for timber harvesting and mining. In the early 1900s, the mountain was used as a summer retreat for wealthy families from Knoxville and Chattanooga. The mountain was also used as a lookout point during World War II.
Economy
The economy of Flat Top Mountain is largely based on tourism. The mountain is a popular destination for hikers, campers, and nature lovers. The mountain is also home to several small businesses, including a general store, a restaurant, and a bed and breakfast. The mountain is also home to a small ski resort, which attracts visitors from all over the region.
Demographics
The population of Flat Top Mountain is small and largely rural. According to the 2010 census, the population of the mountain was just over 500 people. The majority of the population is white, with a small minority of African Americans. The median household income is just over $30,000, and the median age is 44.
Conclusion
Flat Top Mountain is a small mountain located in the Appalachian Mountains of East Tennessee. It is home to a small population of rural residents and is a popular destination for hikers, campers, and nature lovers. The mountain is surrounded by the Nolichucky River to the north, the Unicoi Mountains to the east, and the Bald Mountains to the south. The mountain is home to several small businesses, including a general store, a restaurant, and a bed and breakfast. The mountain is also home to a small ski resort, which attracts visitors from all over the region. The population of Flat Top Mountain is small and largely rural, and the median household income is just over $30,000.
Common Questions
What is the Total Population of Flat Top Mountain?
Total Population of Flat Top Mountain is 891.
What is the Total Male Population of Flat Top Mountain?
Total Male Population of Flat Top Mountain is 226.
What is the Total Female Population of Flat Top Mountain?
Total Female Population of Flat Top Mountain is 665.
What is the Ratio of Males per 100 Females in Flat Top Mountain?
There are 33.98 Males per 100 Females in Flat Top Mountain.
What is the Ratio of Females per 100 Males in Flat Top Mountain?
There are 294.25 Females per 100 Males in Flat Top Mountain.
What is the Median Population Age in Flat Top Mountain?
Median Population Age in Flat Top Mountain is 16.8 Years.
What is the Average Family Size in Flat Top Mountain
Average Family Size in Flat Top Mountain is 3.3 People.
What is the Average Household Size in Flat Top Mountain
Average Household Size in Flat Top Mountain is 3.9 People.
What is Per Capita Income in Flat Top Mountain?
Per Capita income in Flat Top Mountain is $22,963.
What is the Median Family Income in Flat Top Mountain?
Median Family Income in Flat Top Mountain is $113,487.
What is the Median Household income in Flat Top Mountain?
Median Household Income in Flat Top Mountain is $112,549.
What is Income or Wage Gap in Flat Top Mountain?
Income or Wage Gap in Flat Top Mountain is 73.9%.
Women in Flat Top Mountain earn 26.1 cents for every dollar earned by a man.
What is Inequality or Gini Index in Flat Top Mountain?
Inequality or Gini Index in Flat Top Mountain is 0.26.
How Large is the Labor Force in Flat Top Mountain?
There are 233 People in the Labor Forcein in Flat Top Mountain.
What is the Percentage of People in the Labor Force in Flat Top Mountain?
43.1% of People are in the Labor Force in Flat Top Mountain.