Wilson County, TN
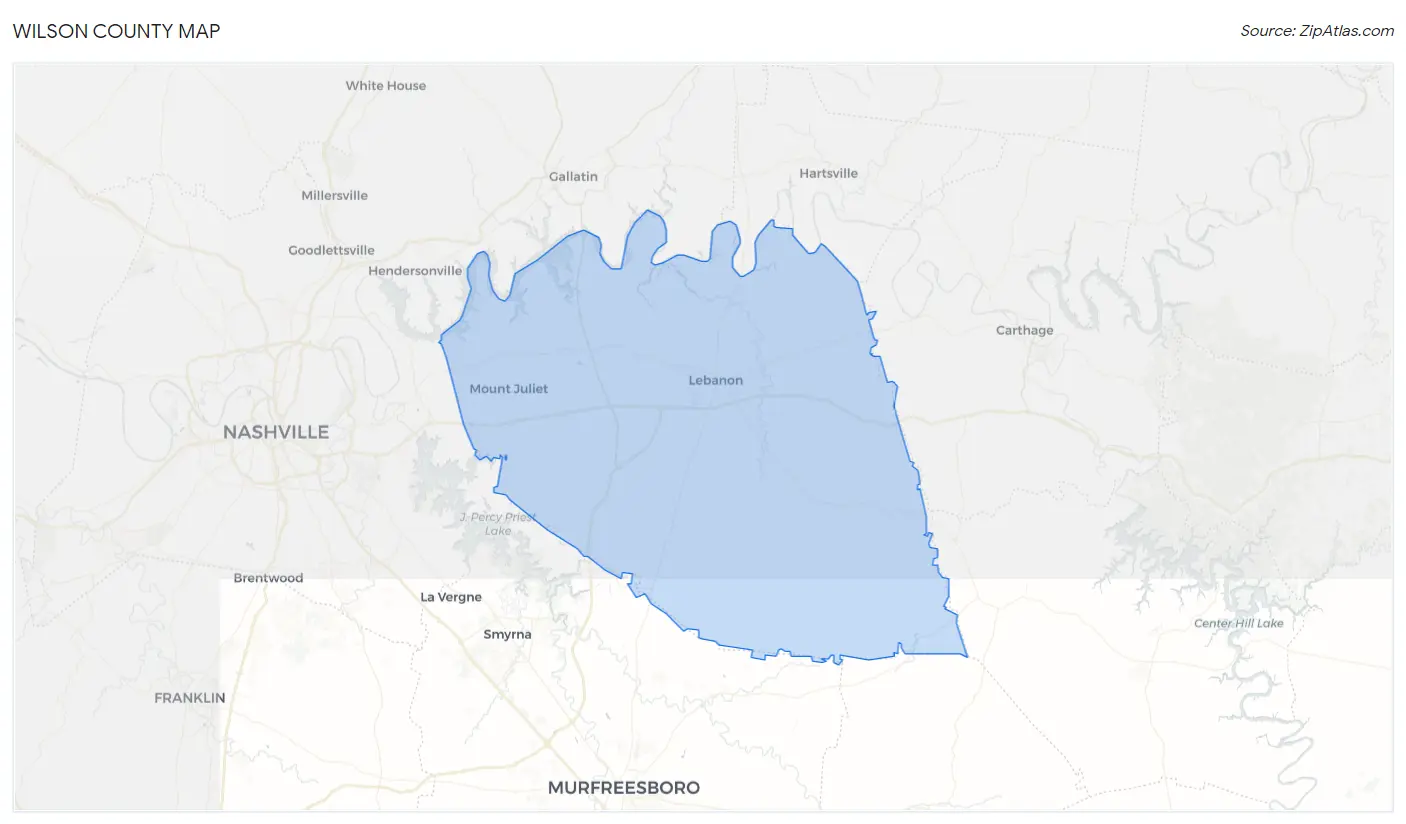
Wilson County Map
Wilson County Overview
149,096
TOTAL POPULATION
73,809
MALE POPULATION
75,287
FEMALE POPULATION
98.04
MALES / 100 FEMALES
102.00
FEMALES / 100 MALES
40.0
MEDIAN AGE
3.1
AVG FAMILY SIZE
2.7
AVG HOUSEHOLD SIZE
$42,978
PER CAPITA INCOME
$105,191
AVG FAMILY INCOME
$89,462
AVG HOUSEHOLD INCOME
31.3%
WAGE / INCOME GAP [ % ]
68.7¢/ $1
WAGE / INCOME GAP [ $ ]
$12,201
FAMILY INCOME DEFICIT
0.43
INEQUALITY / GINI INDEX
77,598
LABOR FORCE [ PEOPLE ]
65.5%
PERCENT IN LABOR FORCE
3.7%
UNEMPLOYMENT RATE
Wilson County Area Codes
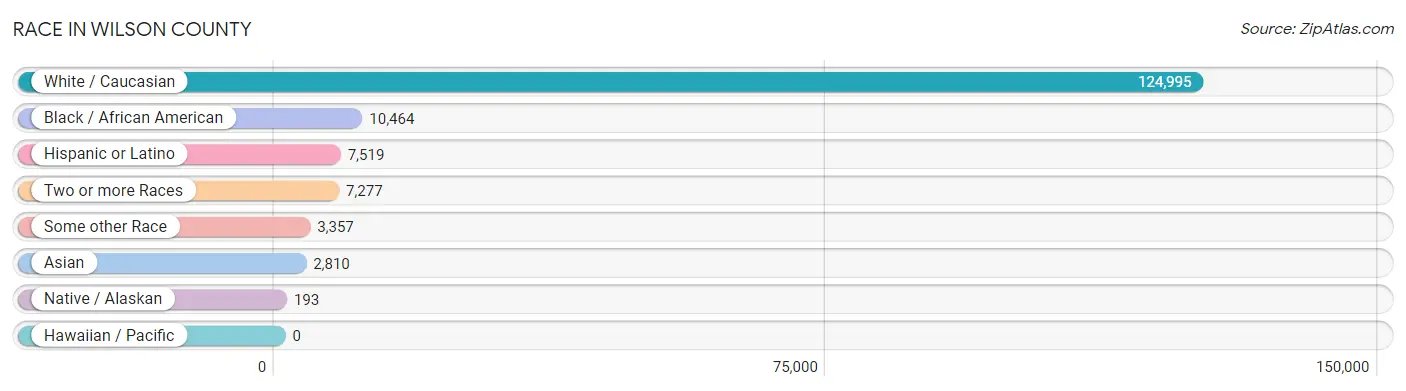
Race in Wilson County
The most populous races in Wilson County are White / Caucasian (124,995 | 83.8%), Black / African American (10,464 | 7.0%), and Hispanic or Latino (7,519 | 5.0%).
| Race | # Population | % Population |
| Asian | 2,810 | 1.9% |
| Black / African American | 10,464 | 7.0% |
| Hawaiian / Pacific | 0 | 0.0% |
| Hispanic or Latino | 7,519 | 5.0% |
| Native / Alaskan | 193 | 0.1% |
| White / Caucasian | 124,995 | 83.8% |
| Two or more Races | 7,277 | 4.9% |
| Some other Race | 3,357 | 2.2% |
| Total | 149,096 | 100.0% |
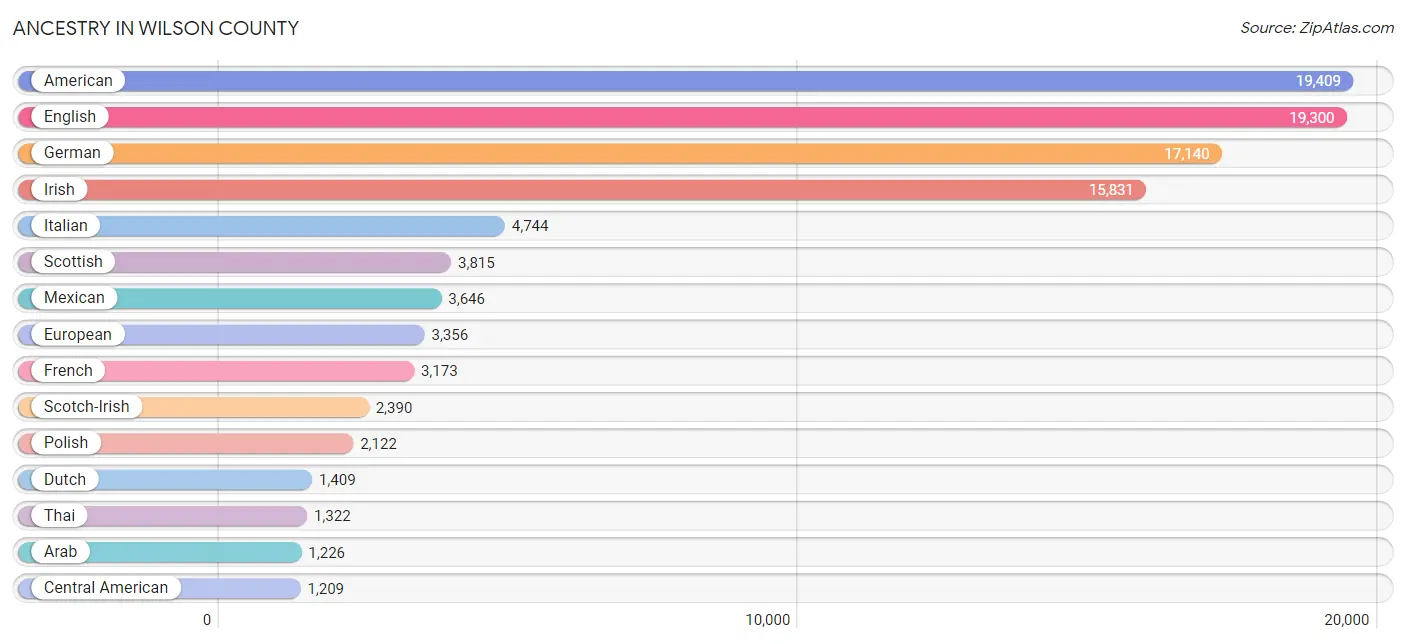
Ancestry in Wilson County
The most populous ancestries reported in Wilson County are American (19,409 | 13.0%), English (19,300 | 12.9%), German (17,140 | 11.5%), Irish (15,831 | 10.6%), and Italian (4,744 | 3.2%), together accounting for 51.3% of all Wilson County residents.
| Ancestry | # Population | % Population |
| African | 509 | 0.3% |
| Alsatian | 11 | 0.0% |
| American | 19,409 | 13.0% |
| Arab | 1,226 | 0.8% |
| Argentinean | 19 | 0.0% |
| Austrian | 45 | 0.0% |
| Bahamian | 20 | 0.0% |
| Bangladeshi | 47 | 0.0% |
| Belgian | 53 | 0.0% |
| Bhutanese | 154 | 0.1% |
| Blackfeet | 85 | 0.1% |
| Bolivian | 18 | 0.0% |
| Brazilian | 168 | 0.1% |
| British | 997 | 0.7% |
| Bulgarian | 300 | 0.2% |
| Burmese | 273 | 0.2% |
| Canadian | 140 | 0.1% |
| Central American | 1,209 | 0.8% |
| Central American Indian | 13 | 0.0% |
| Cherokee | 758 | 0.5% |
| Chilean | 45 | 0.0% |
| Chippewa | 7 | 0.0% |
| Choctaw | 46 | 0.0% |
| Colombian | 385 | 0.3% |
| Creek | 24 | 0.0% |
| Croatian | 122 | 0.1% |
| Cuban | 125 | 0.1% |
| Czech | 165 | 0.1% |
| Danish | 336 | 0.2% |
| Dominican | 131 | 0.1% |
| Dutch | 1,409 | 0.9% |
| Dutch West Indian | 16 | 0.0% |
| Eastern European | 238 | 0.2% |
| Egyptian | 1,009 | 0.7% |
| English | 19,300 | 12.9% |
| Estonian | 10 | 0.0% |
| Ethiopian | 59 | 0.0% |
| European | 3,356 | 2.2% |
| Filipino | 1 | 0.0% |
| Finnish | 88 | 0.1% |
| French | 3,173 | 2.1% |
| French Canadian | 253 | 0.2% |
| German | 17,140 | 11.5% |
| Ghanaian | 35 | 0.0% |
| Greek | 527 | 0.4% |
| Guatemalan | 454 | 0.3% |
| Guyanese | 2 | 0.0% |
| Haitian | 185 | 0.1% |
| Honduran | 357 | 0.2% |
| Hungarian | 373 | 0.3% |
| Icelander | 17 | 0.0% |
| Indian (Asian) | 328 | 0.2% |
| Indonesian | 23 | 0.0% |
| Iranian | 103 | 0.1% |
| Irish | 15,831 | 10.6% |
| Iroquois | 19 | 0.0% |
| Israeli | 11 | 0.0% |
| Italian | 4,744 | 3.2% |
| Jamaican | 223 | 0.2% |
| Korean | 942 | 0.6% |
| Latvian | 11 | 0.0% |
| Lebanese | 162 | 0.1% |
| Lithuanian | 28 | 0.0% |
| Malaysian | 152 | 0.1% |
| Mexican | 3,646 | 2.5% |
| Mexican American Indian | 102 | 0.1% |
| Navajo | 17 | 0.0% |
| Nicaraguan | 59 | 0.0% |
| Nigerian | 23 | 0.0% |
| Northern European | 145 | 0.1% |
| Norwegian | 398 | 0.3% |
| Pakistani | 109 | 0.1% |
| Panamanian | 27 | 0.0% |
| Peruvian | 101 | 0.1% |
| Polish | 2,122 | 1.4% |
| Portuguese | 240 | 0.2% |
| Potawatomi | 6 | 0.0% |
| Puerto Rican | 738 | 0.5% |
| Romanian | 35 | 0.0% |
| Russian | 404 | 0.3% |
| Salvadoran | 312 | 0.2% |
| Samoan | 24 | 0.0% |
| Scandinavian | 343 | 0.2% |
| Scotch-Irish | 2,390 | 1.6% |
| Scottish | 3,815 | 2.6% |
| Seminole | 30 | 0.0% |
| Serbian | 43 | 0.0% |
| Sioux | 9 | 0.0% |
| Slavic | 6 | 0.0% |
| Slovak | 62 | 0.0% |
| Somali | 10 | 0.0% |
| South African | 33 | 0.0% |
| South American | 770 | 0.5% |
| Spaniard | 185 | 0.1% |
| Spanish | 124 | 0.1% |
| Spanish American | 67 | 0.0% |
| Sri Lankan | 72 | 0.1% |
| Subsaharan African | 739 | 0.5% |
| Swedish | 892 | 0.6% |
| Swiss | 203 | 0.1% |
| Thai | 1,322 | 0.9% |
| Tlingit-Haida | 71 | 0.1% |
| Trinidadian and Tobagonian | 9 | 0.0% |
| Turkish | 56 | 0.0% |
| Ukrainian | 96 | 0.1% |
| Venezuelan | 202 | 0.1% |
| Welsh | 652 | 0.4% |
| West Indian | 2 | 0.0% |
| Yugoslavian | 93 | 0.1% | View All 109 Rows |
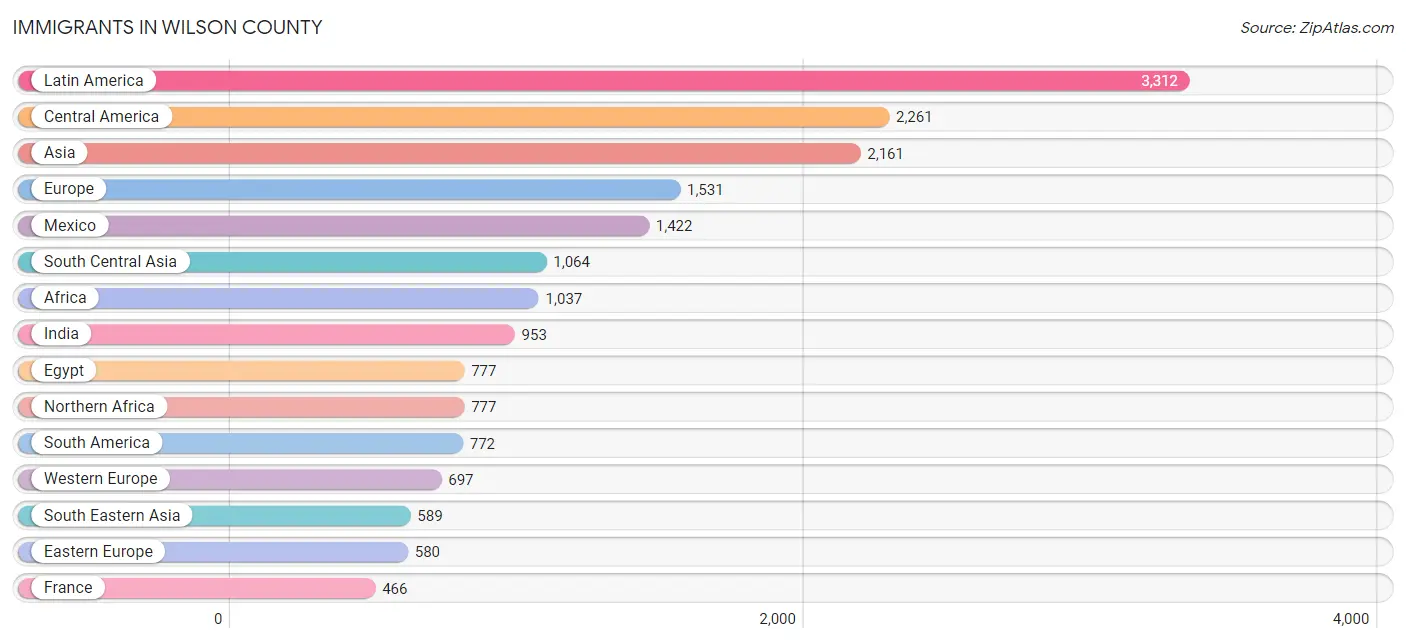
Immigrants in Wilson County
The most numerous immigrant groups reported in Wilson County came from Latin America (3,312 | 2.2%), Central America (2,261 | 1.5%), Asia (2,161 | 1.5%), Europe (1,531 | 1.0%), and Mexico (1,422 | 0.9%), together accounting for 7.2% of all Wilson County residents.
| Immigration Origin | # Population | % Population |
| Africa | 1,037 | 0.7% |
| Argentina | 2 | 0.0% |
| Asia | 2,161 | 1.5% |
| Austria | 21 | 0.0% |
| Bosnia and Herzegovina | 35 | 0.0% |
| Brazil | 81 | 0.1% |
| Bulgaria | 300 | 0.2% |
| Canada | 340 | 0.2% |
| Caribbean | 279 | 0.2% |
| Central America | 2,261 | 1.5% |
| China | 163 | 0.1% |
| Colombia | 213 | 0.1% |
| Cuba | 18 | 0.0% |
| Dominican Republic | 56 | 0.0% |
| Eastern Africa | 124 | 0.1% |
| Eastern Asia | 313 | 0.2% |
| Eastern Europe | 580 | 0.4% |
| Egypt | 777 | 0.5% |
| El Salvador | 214 | 0.1% |
| England | 60 | 0.0% |
| Ethiopia | 71 | 0.1% |
| Europe | 1,531 | 1.0% |
| France | 466 | 0.3% |
| Germany | 210 | 0.1% |
| Ghana | 3 | 0.0% |
| Greece | 111 | 0.1% |
| Guatemala | 334 | 0.2% |
| Guyana | 60 | 0.0% |
| Haiti | 78 | 0.1% |
| Honduras | 202 | 0.1% |
| India | 953 | 0.6% |
| Iran | 39 | 0.0% |
| Iraq | 71 | 0.1% |
| Italy | 16 | 0.0% |
| Jamaica | 92 | 0.1% |
| Japan | 27 | 0.0% |
| Kenya | 2 | 0.0% |
| Korea | 123 | 0.1% |
| Laos | 26 | 0.0% |
| Latin America | 3,312 | 2.2% |
| Lebanon | 65 | 0.0% |
| Mexico | 1,422 | 0.9% |
| Nepal | 13 | 0.0% |
| Nicaragua | 39 | 0.0% |
| Nigeria | 59 | 0.0% |
| Northern Africa | 777 | 0.5% |
| Northern Europe | 114 | 0.1% |
| Pakistan | 59 | 0.0% |
| Panama | 50 | 0.0% |
| Peru | 130 | 0.1% |
| Philippines | 300 | 0.2% |
| Poland | 50 | 0.0% |
| Romania | 35 | 0.0% |
| Russia | 66 | 0.0% |
| Scotland | 8 | 0.0% |
| Serbia | 9 | 0.0% |
| Singapore | 33 | 0.0% |
| South Africa | 74 | 0.1% |
| South America | 772 | 0.5% |
| South Central Asia | 1,064 | 0.7% |
| South Eastern Asia | 589 | 0.4% |
| Southern Europe | 140 | 0.1% |
| Spain | 13 | 0.0% |
| Sweden | 17 | 0.0% |
| Taiwan | 1 | 0.0% |
| Thailand | 109 | 0.1% |
| Turkey | 59 | 0.0% |
| Ukraine | 12 | 0.0% |
| Venezuela | 286 | 0.2% |
| Vietnam | 98 | 0.1% |
| Western Africa | 62 | 0.0% |
| Western Asia | 195 | 0.1% |
| Western Europe | 697 | 0.5% | View All 73 Rows |
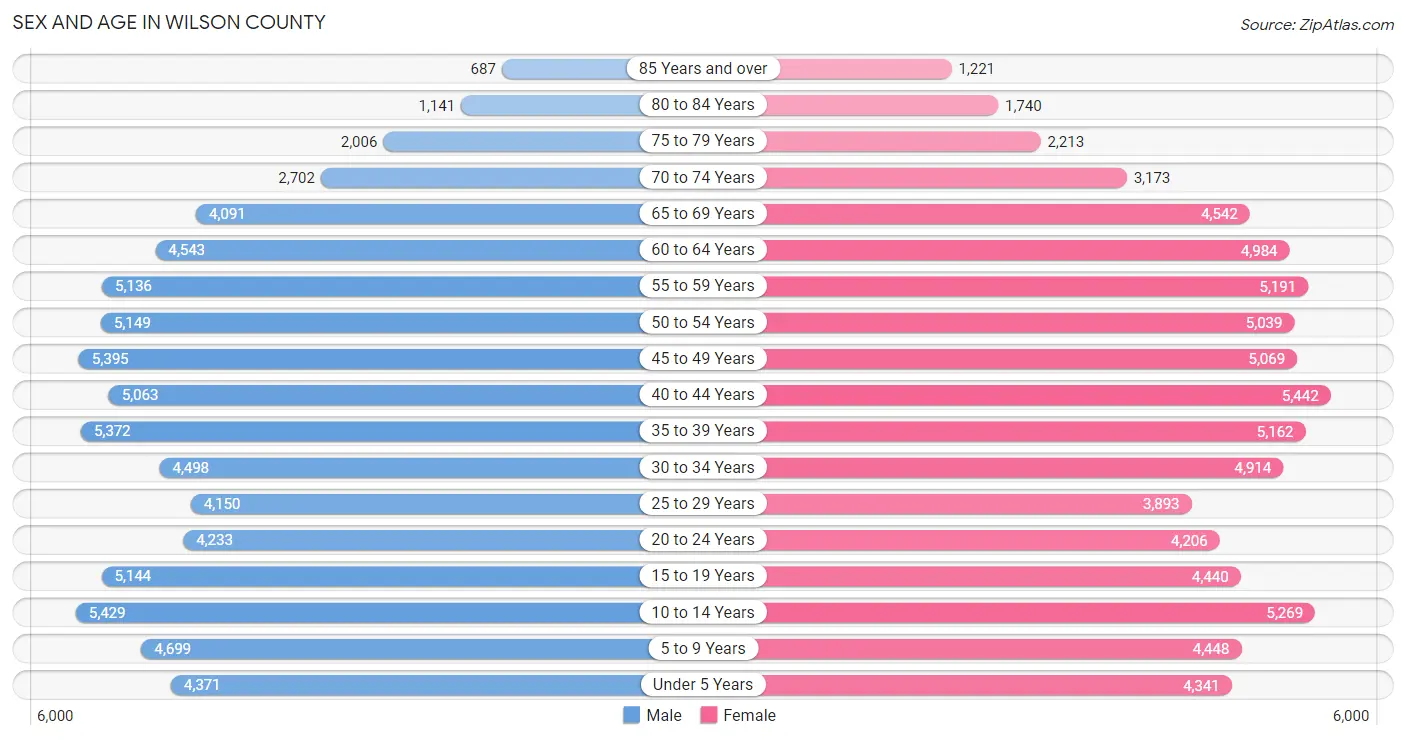
Sex and Age in Wilson County
Sex and Age in Wilson County
The most populous age groups in Wilson County are 10 to 14 Years (5,429 | 7.4%) for men and 40 to 44 Years (5,442 | 7.2%) for women.
| Age Bracket | Male | Female |
| Under 5 Years | 4,371 (5.9%) | 4,341 (5.8%) |
| 5 to 9 Years | 4,699 (6.4%) | 4,448 (5.9%) |
| 10 to 14 Years | 5,429 (7.4%) | 5,269 (7.0%) |
| 15 to 19 Years | 5,144 (7.0%) | 4,440 (5.9%) |
| 20 to 24 Years | 4,233 (5.7%) | 4,206 (5.6%) |
| 25 to 29 Years | 4,150 (5.6%) | 3,893 (5.2%) |
| 30 to 34 Years | 4,498 (6.1%) | 4,914 (6.5%) |
| 35 to 39 Years | 5,372 (7.3%) | 5,162 (6.9%) |
| 40 to 44 Years | 5,063 (6.9%) | 5,442 (7.2%) |
| 45 to 49 Years | 5,395 (7.3%) | 5,069 (6.7%) |
| 50 to 54 Years | 5,149 (7.0%) | 5,039 (6.7%) |
| 55 to 59 Years | 5,136 (7.0%) | 5,191 (6.9%) |
| 60 to 64 Years | 4,543 (6.2%) | 4,984 (6.6%) |
| 65 to 69 Years | 4,091 (5.5%) | 4,542 (6.0%) |
| 70 to 74 Years | 2,702 (3.7%) | 3,173 (4.2%) |
| 75 to 79 Years | 2,006 (2.7%) | 2,213 (2.9%) |
| 80 to 84 Years | 1,141 (1.5%) | 1,740 (2.3%) |
| 85 Years and over | 687 (0.9%) | 1,221 (1.6%) |
| Total | 73,809 (100.0%) | 75,287 (100.0%) |
Families and Households in Wilson County
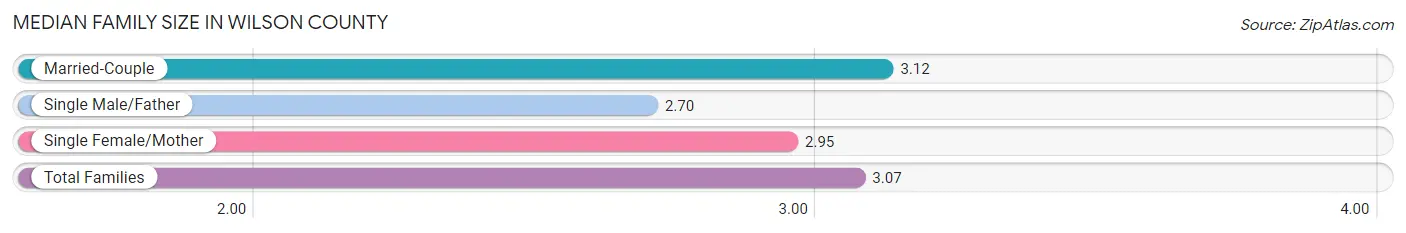
Median Family Size in Wilson County
The median family size in Wilson County is 3.07 persons per family, with married-couple families (32,891 | 80.9%) accounting for the largest median family size of 3.12 persons per family. On the other hand, single male/father families (2,609 | 6.4%) represent the smallest median family size with 2.70 persons per family.
| Family Type | # Families | Family Size |
| Married-Couple | 32,891 (80.9%) | 3.12 |
| Single Male/Father | 2,609 (6.4%) | 2.70 |
| Single Female/Mother | 5,172 (12.7%) | 2.95 |
| Total Families | 40,672 (100.0%) | 3.07 |
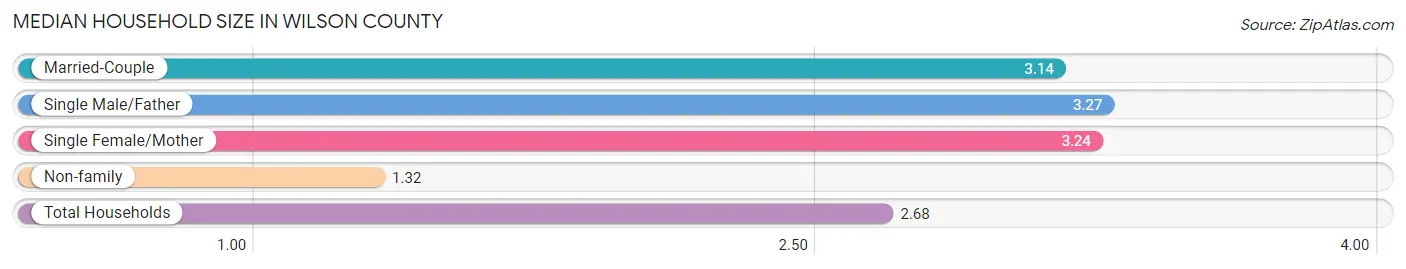
Median Household Size in Wilson County
The median household size in Wilson County is 2.68 persons per household, with single male/father households (2,609 | 4.7%) accounting for the largest median household size of 3.27 persons per household. non-family households (14,365 | 26.1%) represent the smallest median household size with 1.32 persons per household.
| Household Type | # Households | Household Size |
| Married-Couple | 32,891 (59.8%) | 3.14 |
| Single Male/Father | 2,609 (4.7%) | 3.27 |
| Single Female/Mother | 5,172 (9.4%) | 3.24 |
| Non-family | 14,365 (26.1%) | 1.32 |
| Total Households | 55,037 (100.0%) | 2.68 |
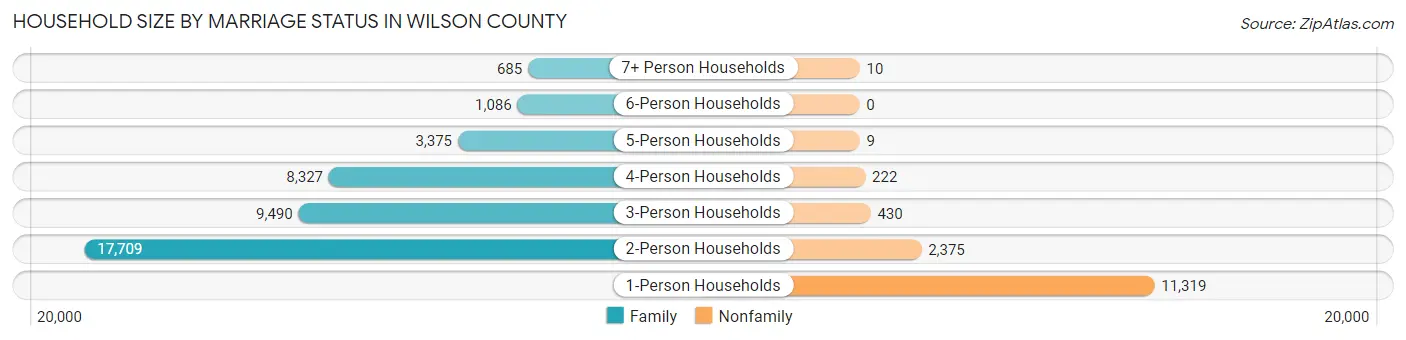
Household Size by Marriage Status in Wilson County
Out of a total of 55,037 households in Wilson County, 40,672 (73.9%) are family households, while 14,365 (26.1%) are nonfamily households. The most numerous type of family households are 2-person households, comprising 17,709, and the most common type of nonfamily households are 1-person households, comprising 11,319.
| Household Size | Family Households | Nonfamily Households |
| 1-Person Households | - | 11,319 (20.6%) |
| 2-Person Households | 17,709 (32.2%) | 2,375 (4.3%) |
| 3-Person Households | 9,490 (17.2%) | 430 (0.8%) |
| 4-Person Households | 8,327 (15.1%) | 222 (0.4%) |
| 5-Person Households | 3,375 (6.1%) | 9 (0.0%) |
| 6-Person Households | 1,086 (2.0%) | 0 (0.0%) |
| 7+ Person Households | 685 (1.2%) | 10 (0.0%) |
| Total | 40,672 (73.9%) | 14,365 (26.1%) |
Female Fertility in Wilson County
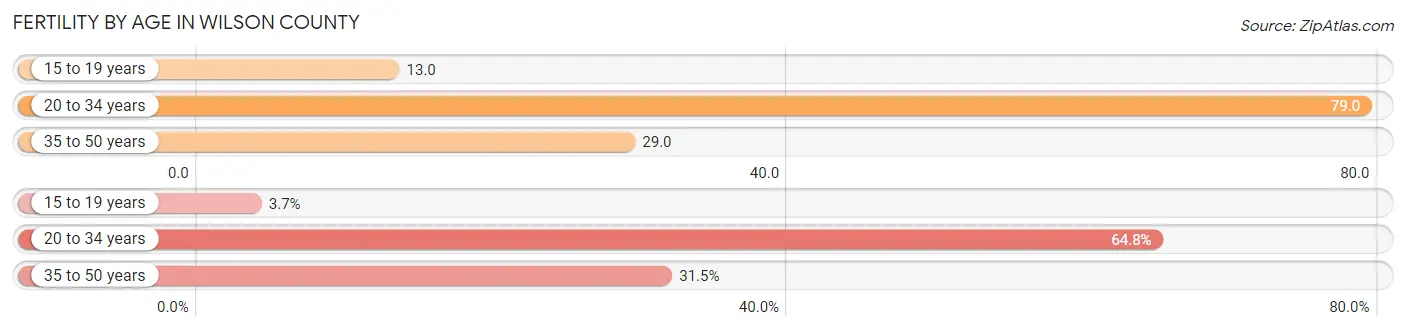
Fertility by Age in Wilson County
Average fertility rate in Wilson County is 46.0 births per 1,000 women. Women in the age bracket of 20 to 34 years have the highest fertility rate with 79.0 births per 1,000 women. Women in the age bracket of 20 to 34 years acount for 64.8% of all women with births.
| Age Bracket | Women with Births | Births / 1,000 Women |
| 15 to 19 years | 58 (3.6%) | 13.0 |
| 20 to 34 years | 1,029 (64.8%) | 79.0 |
| 35 to 50 years | 500 (31.5%) | 29.0 |
| Total | 1,587 (100.0%) | 46.0 |
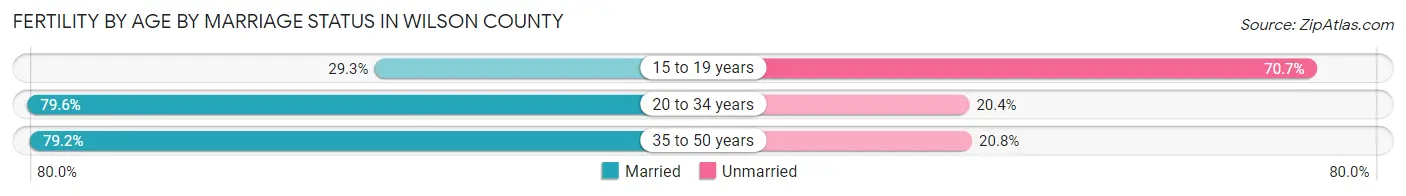
Fertility by Age by Marriage Status in Wilson County
77.6% of women with births (1,587) in Wilson County are married. The highest percentage of unmarried women with births falls into 15 to 19 years age bracket with 70.7% of them unmarried at the time of birth, while the lowest percentage of unmarried women with births belong to 20 to 34 years age bracket with 20.4% of them unmarried.
| Age Bracket | Married | Unmarried |
| 15 to 19 years | 17 (29.3%) | 41 (70.7%) |
| 20 to 34 years | 819 (79.6%) | 210 (20.4%) |
| 35 to 50 years | 396 (79.2%) | 104 (20.8%) |
| Total | 1,232 (77.6%) | 355 (22.4%) |
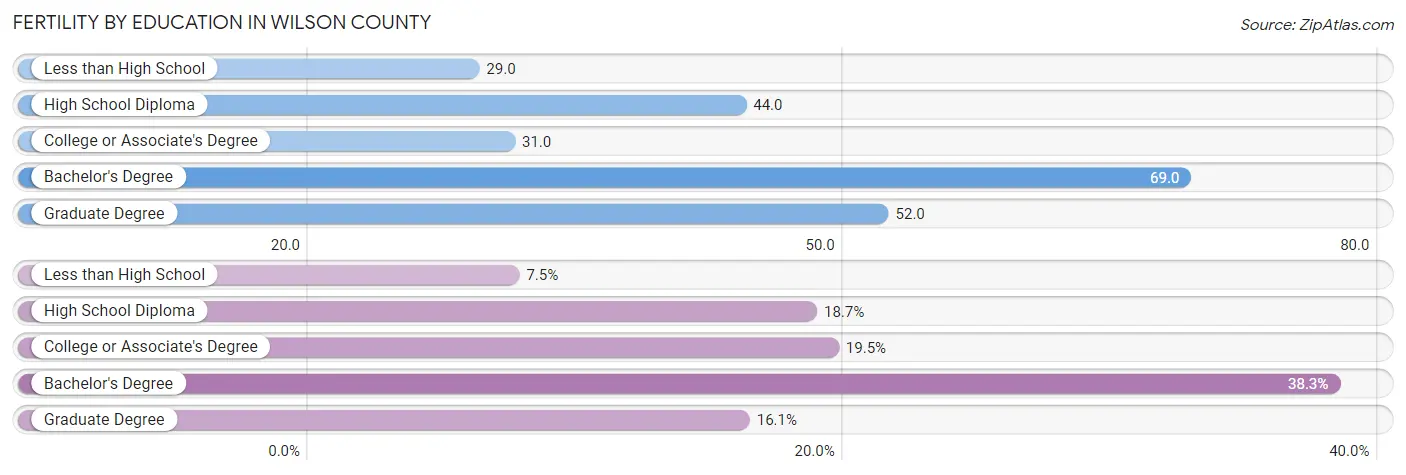
Fertility by Education in Wilson County
Average fertility rate in Wilson County is 46.0 births per 1,000 women. Women with the education attainment of bachelor's degree have the highest fertility rate of 69.0 births per 1,000 women, while women with the education attainment of less than high school have the lowest fertility at 29.0 births per 1,000 women. Women with the education attainment of bachelor's degree represent 38.3% of all women with births.
| Educational Attainment | Women with Births | Births / 1,000 Women |
| Less than High School | 119 (7.5%) | 29.0 |
| High School Diploma | 296 (18.6%) | 44.0 |
| College or Associate's Degree | 309 (19.5%) | 31.0 |
| Bachelor's Degree | 607 (38.3%) | 69.0 |
| Graduate Degree | 256 (16.1%) | 52.0 |
| Total | 1,587 (100.0%) | 46.0 |
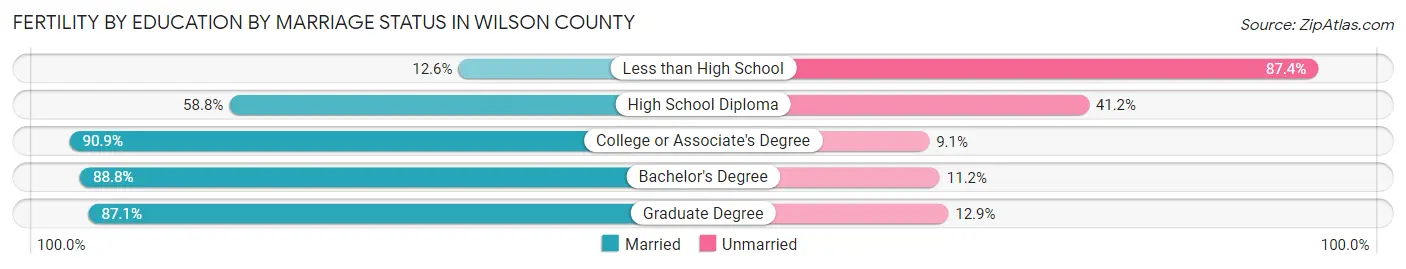
Fertility by Education by Marriage Status in Wilson County
22.4% of women with births in Wilson County are unmarried. Women with the educational attainment of college or associate's degree are most likely to be married with 90.9% of them married at childbirth, while women with the educational attainment of less than high school are least likely to be married with 87.4% of them unmarried at childbirth.
| Educational Attainment | Married | Unmarried |
| Less than High School | 15 (12.6%) | 104 (87.4%) |
| High School Diploma | 174 (58.8%) | 122 (41.2%) |
| College or Associate's Degree | 281 (90.9%) | 28 (9.1%) |
| Bachelor's Degree | 539 (88.8%) | 68 (11.2%) |
| Graduate Degree | 223 (87.1%) | 33 (12.9%) |
| Total | 1,232 (77.6%) | 355 (22.4%) |
Income in Wilson County
Income Overview in Wilson County
Per Capita Income in Wilson County is $42,978, while median incomes of families and households are $105,191 and $89,462 respectively.
| Characteristic | Number | Measure |
| Per Capita Income | 149,096 | $42,978 |
| Median Family Income | 40,672 | $105,191 |
| Mean Family Income | 40,672 | $122,978 |
| Median Household Income | 55,037 | $89,462 |
| Mean Household Income | 55,037 | $114,341 |
| Income Deficit | 40,672 | $12,201 |
| Wage / Income Gap (%) | 149,096 | 31.25% |
| Wage / Income Gap ($) | 149,096 | 68.75¢ per $1 |
| Gini / Inequality Index | 149,096 | 0.43 |
Earnings by Sex in Wilson County
Average Earnings in Wilson County are $47,130, $56,542 for men and $38,870 for women, a difference of 31.2%.
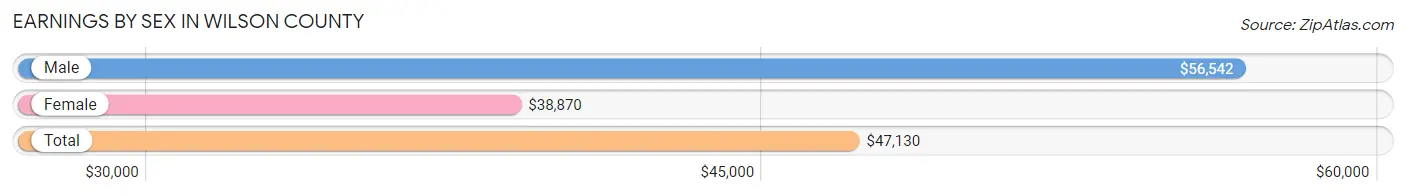
| Sex | Number | Average Earnings |
| Male | 43,499 (53.4%) | $56,542 |
| Female | 38,017 (46.6%) | $38,870 |
| Total | 81,516 (100.0%) | $47,130 |
Earnings by Sex by Income Bracket in Wilson County
The most common earnings brackets in Wilson County are $100,000+ for men (9,924 | 22.8%) and $100,000+ for women (3,625 | 9.5%).
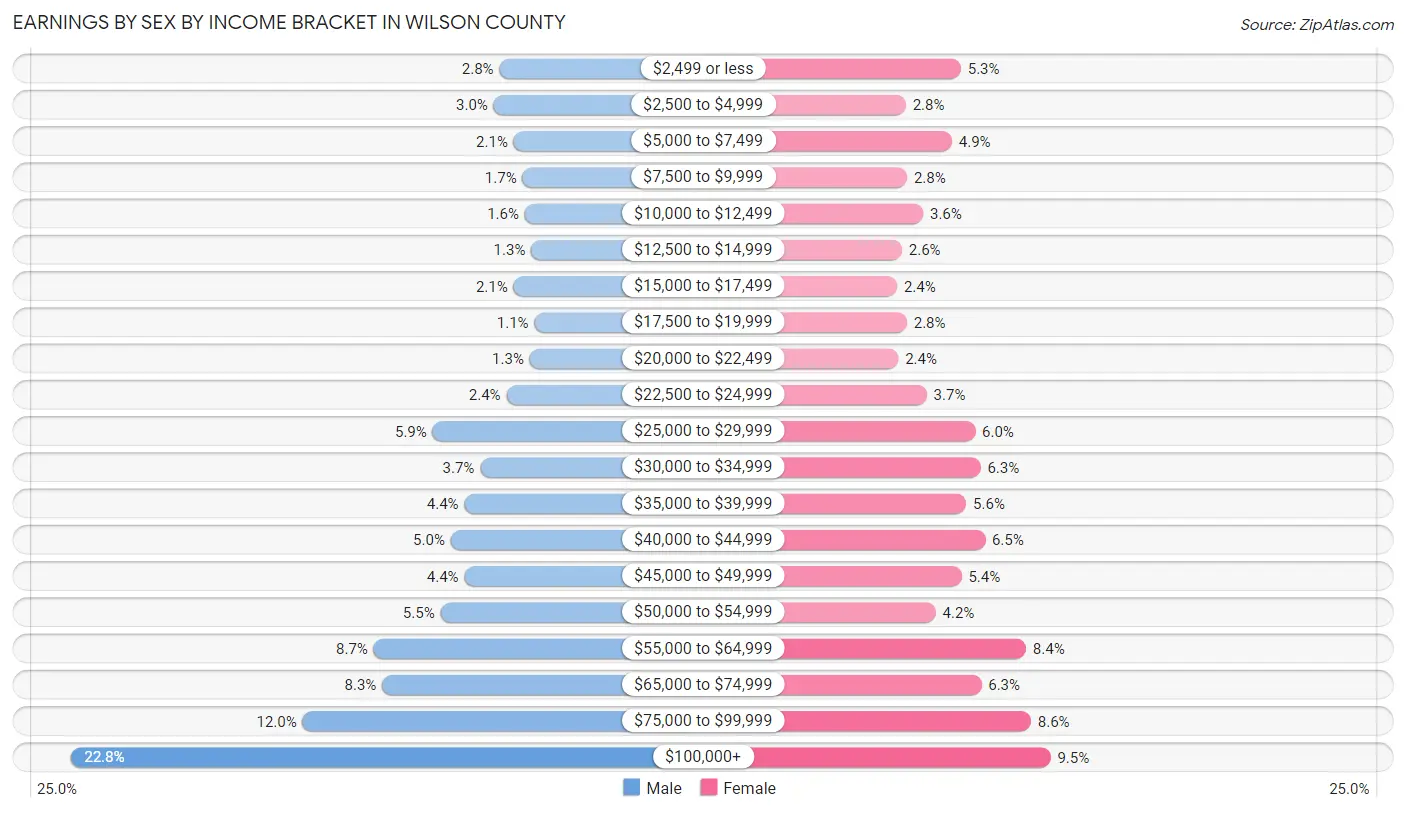
| Income | Male | Female |
| $2,499 or less | 1,199 (2.8%) | 2,030 (5.3%) |
| $2,500 to $4,999 | 1,316 (3.0%) | 1,048 (2.8%) |
| $5,000 to $7,499 | 907 (2.1%) | 1,872 (4.9%) |
| $7,500 to $9,999 | 731 (1.7%) | 1,072 (2.8%) |
| $10,000 to $12,499 | 685 (1.6%) | 1,356 (3.6%) |
| $12,500 to $14,999 | 554 (1.3%) | 980 (2.6%) |
| $15,000 to $17,499 | 912 (2.1%) | 893 (2.4%) |
| $17,500 to $19,999 | 486 (1.1%) | 1,069 (2.8%) |
| $20,000 to $22,499 | 584 (1.3%) | 918 (2.4%) |
| $22,500 to $24,999 | 1,058 (2.4%) | 1,421 (3.7%) |
| $25,000 to $29,999 | 2,562 (5.9%) | 2,285 (6.0%) |
| $30,000 to $34,999 | 1,594 (3.7%) | 2,378 (6.3%) |
| $35,000 to $39,999 | 1,916 (4.4%) | 2,124 (5.6%) |
| $40,000 to $44,999 | 2,193 (5.0%) | 2,459 (6.5%) |
| $45,000 to $49,999 | 1,915 (4.4%) | 2,043 (5.4%) |
| $50,000 to $54,999 | 2,400 (5.5%) | 1,583 (4.2%) |
| $55,000 to $64,999 | 3,764 (8.6%) | 3,189 (8.4%) |
| $65,000 to $74,999 | 3,587 (8.3%) | 2,394 (6.3%) |
| $75,000 to $99,999 | 5,212 (12.0%) | 3,278 (8.6%) |
| $100,000+ | 9,924 (22.8%) | 3,625 (9.5%) |
| Total | 43,499 (100.0%) | 38,017 (100.0%) |
Earnings by Sex by Educational Attainment in Wilson County
Average earnings in Wilson County are $63,995 for men and $42,575 for women, a difference of 33.5%. Men with an educational attainment of graduate degree enjoy the highest average annual earnings of $113,092, while those with less than high school education earn the least with $41,897. Women with an educational attainment of graduate degree earn the most with the average annual earnings of $63,648, while those with less than high school education have the smallest earnings of $17,034.
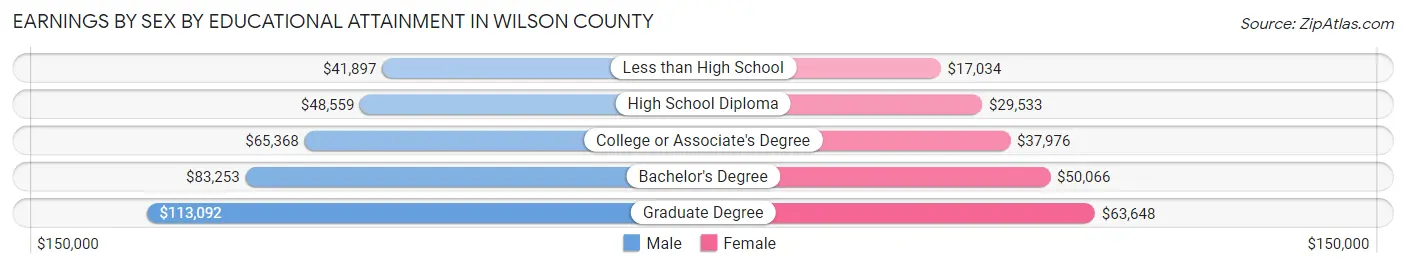
| Educational Attainment | Male Income | Female Income |
| Less than High School | $41,897 | $17,034 |
| High School Diploma | $48,559 | $29,533 |
| College or Associate's Degree | $65,368 | $37,976 |
| Bachelor's Degree | $83,253 | $50,066 |
| Graduate Degree | $113,092 | $63,648 |
| Total | $63,995 | $42,575 |
Family Income in Wilson County
Family Income Brackets in Wilson County
According to the Wilson County family income data, there are 10,493 families falling into the $100,000 to $149,999 income range, which is the most common income bracket and makes up 25.8% of all families. Conversely, the $10,000 to $14,999 income bracket is the least frequent group with only 529 families (1.3%) belonging to this category.
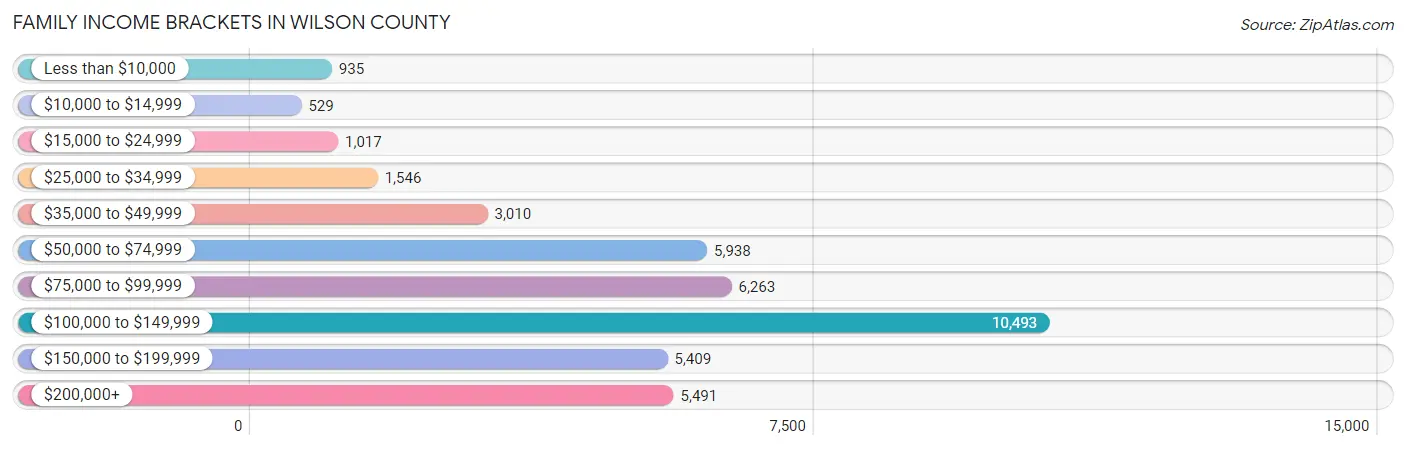
| Income Bracket | # Families | % Families |
| Less than $10,000 | 935 | 2.3% |
| $10,000 to $14,999 | 529 | 1.3% |
| $15,000 to $24,999 | 1,017 | 2.5% |
| $25,000 to $34,999 | 1,546 | 3.8% |
| $35,000 to $49,999 | 3,010 | 7.4% |
| $50,000 to $74,999 | 5,938 | 14.6% |
| $75,000 to $99,999 | 6,263 | 15.4% |
| $100,000 to $149,999 | 10,493 | 25.8% |
| $150,000 to $199,999 | 5,409 | 13.3% |
| $200,000+ | 5,491 | 13.5% |
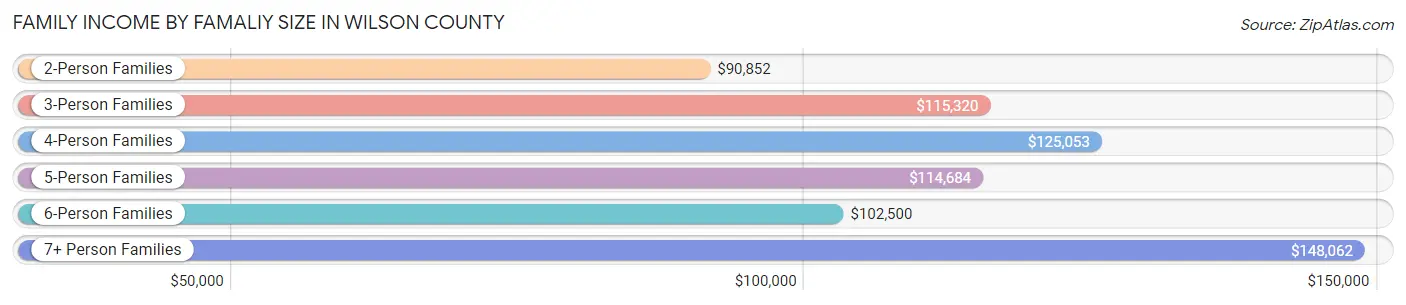
Family Income by Famaliy Size in Wilson County
7+ person families (597 | 1.5%) account for the highest median family income in Wilson County with $148,062 per family, while 2-person families (19,061 | 46.9%) have the highest median income of $45,426 per family member.
| Income Bracket | # Families | Median Income |
| 2-Person Families | 19,061 (46.9%) | $90,852 |
| 3-Person Families | 9,003 (22.1%) | $115,320 |
| 4-Person Families | 8,018 (19.7%) | $125,053 |
| 5-Person Families | 3,091 (7.6%) | $114,684 |
| 6-Person Families | 902 (2.2%) | $102,500 |
| 7+ Person Families | 597 (1.5%) | $148,062 |
| Total | 40,672 (100.0%) | $105,191 |
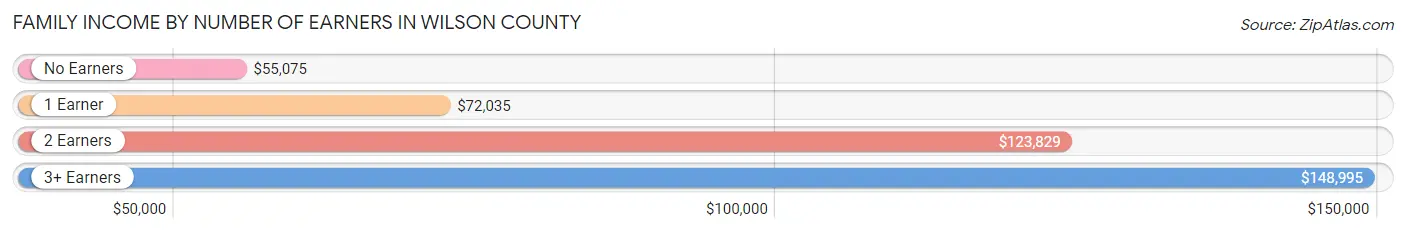
Family Income by Number of Earners in Wilson County
The median family income in Wilson County is $105,191, with families comprising 3+ earners (4,573) having the highest median family income of $148,995, while families with no earners (5,782) have the lowest median family income of $55,075, accounting for 11.2% and 14.2% of families, respectively.
| Number of Earners | # Families | Median Income |
| No Earners | 5,782 (14.2%) | $55,075 |
| 1 Earner | 11,811 (29.0%) | $72,035 |
| 2 Earners | 18,506 (45.5%) | $123,829 |
| 3+ Earners | 4,573 (11.2%) | $148,995 |
| Total | 40,672 (100.0%) | $105,191 |
Household Income in Wilson County
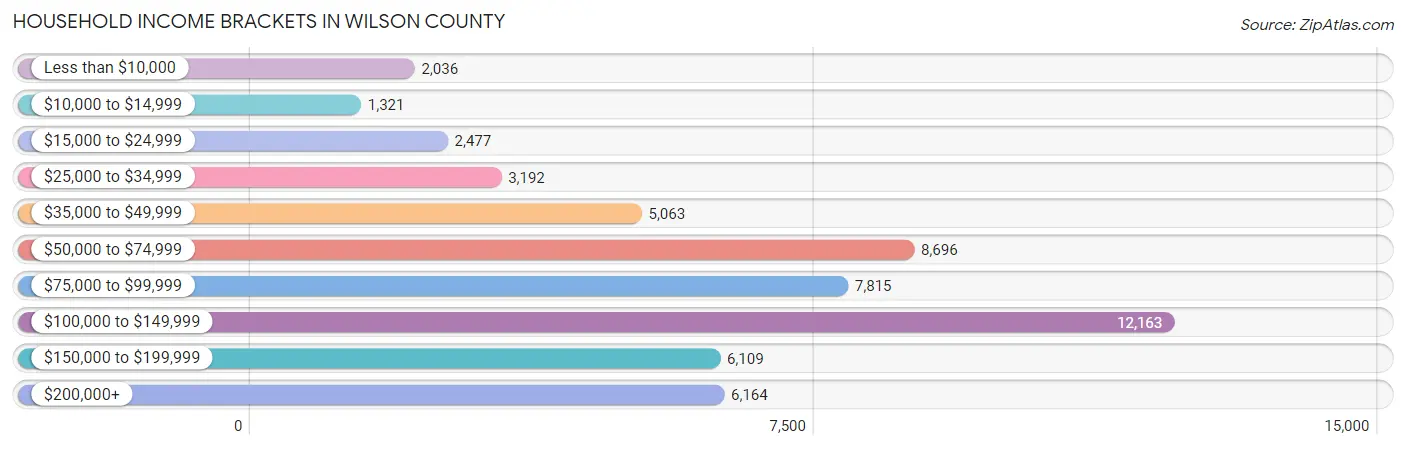
Household Income Brackets in Wilson County
With 12,163 households falling in the category, the $100,000 to $149,999 income range is the most frequent in Wilson County, accounting for 22.1% of all households. In contrast, only 1,321 households (2.4%) fall into the $10,000 to $14,999 income bracket, making it the least populous group.
| Income Bracket | # Households | % Households |
| Less than $10,000 | 2,036 | 3.7% |
| $10,000 to $14,999 | 1,321 | 2.4% |
| $15,000 to $24,999 | 2,477 | 4.5% |
| $25,000 to $34,999 | 3,192 | 5.8% |
| $35,000 to $49,999 | 5,063 | 9.2% |
| $50,000 to $74,999 | 8,696 | 15.8% |
| $75,000 to $99,999 | 7,815 | 14.2% |
| $100,000 to $149,999 | 12,163 | 22.1% |
| $150,000 to $199,999 | 6,109 | 11.1% |
| $200,000+ | 6,164 | 11.2% |
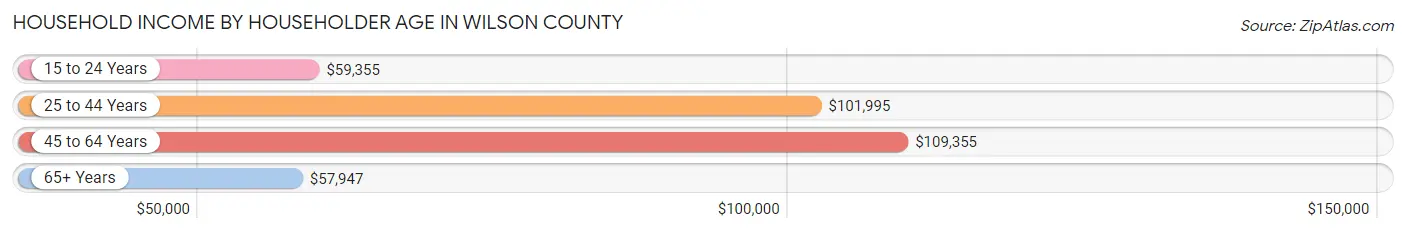
Household Income by Householder Age in Wilson County
The median household income in Wilson County is $89,462, with the highest median household income of $109,355 found in the 45 to 64 years age bracket for the primary householder. A total of 21,566 households (39.2%) fall into this category. Meanwhile, the 65+ years age bracket for the primary householder has the lowest median household income of $57,947, with 13,971 households (25.4%) in this group.
| Income Bracket | # Households | Median Income |
| 15 to 24 Years | 1,558 (2.8%) | $59,355 |
| 25 to 44 Years | 17,942 (32.6%) | $101,995 |
| 45 to 64 Years | 21,566 (39.2%) | $109,355 |
| 65+ Years | 13,971 (25.4%) | $57,947 |
| Total | 55,037 (100.0%) | $89,462 |
Poverty in Wilson County
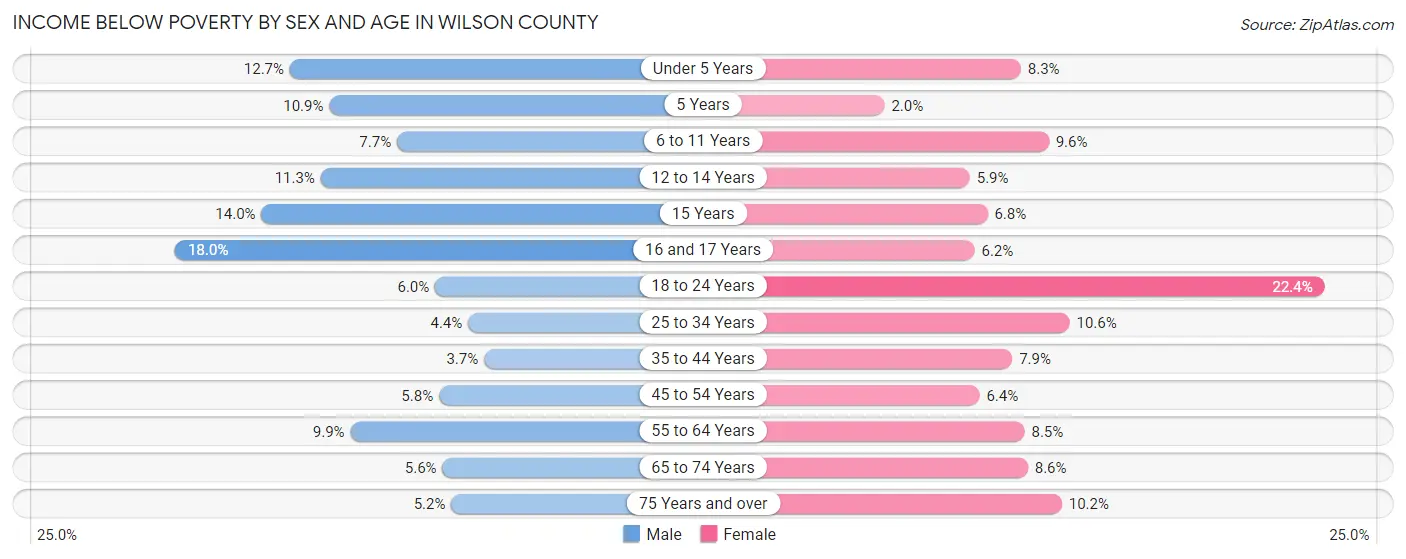
Income Below Poverty by Sex and Age in Wilson County
With 7.2% poverty level for males and 9.4% for females among the residents of Wilson County, 16 and 17 year old males and 18 to 24 year old females are the most vulnerable to poverty, with 394 males (18.0%) and 1,247 females (22.4%) in their respective age groups living below the poverty level.
| Age Bracket | Male | Female |
| Under 5 Years | 538 (12.7%) | 355 (8.3%) |
| 5 Years | 104 (10.9%) | 14 (2.0%) |
| 6 to 11 Years | 414 (7.7%) | 540 (9.6%) |
| 12 to 14 Years | 383 (11.3%) | 189 (5.9%) |
| 15 Years | 151 (14.0%) | 67 (6.8%) |
| 16 and 17 Years | 394 (18.0%) | 114 (6.2%) |
| 18 to 24 Years | 348 (5.9%) | 1,247 (22.4%) |
| 25 to 34 Years | 378 (4.4%) | 928 (10.6%) |
| 35 to 44 Years | 380 (3.7%) | 837 (7.9%) |
| 45 to 54 Years | 602 (5.8%) | 645 (6.4%) |
| 55 to 64 Years | 952 (9.9%) | 861 (8.5%) |
| 65 to 74 Years | 376 (5.6%) | 661 (8.6%) |
| 75 Years and over | 195 (5.2%) | 499 (10.2%) |
| Total | 5,215 (7.2%) | 6,957 (9.4%) |
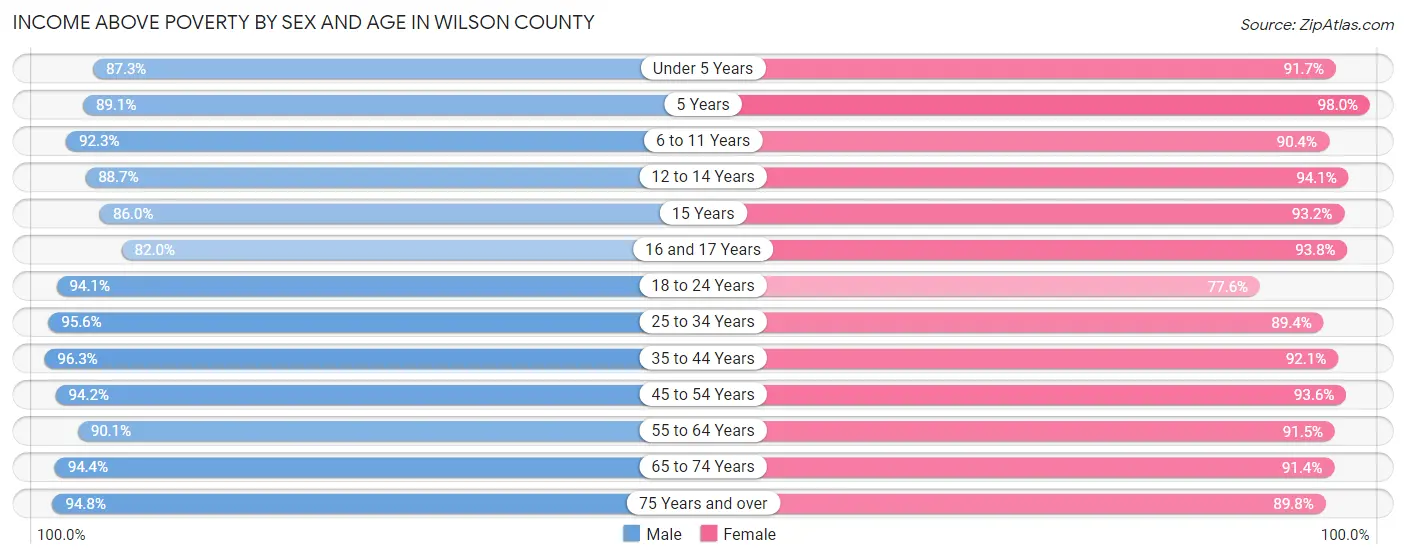
Income Above Poverty by Sex and Age in Wilson County
According to the poverty statistics in Wilson County, males aged 35 to 44 years and females aged 5 years are the age groups that are most secure financially, with 96.3% of males and 98.0% of females in these age groups living above the poverty line.
| Age Bracket | Male | Female |
| Under 5 Years | 3,702 (87.3%) | 3,919 (91.7%) |
| 5 Years | 854 (89.1%) | 694 (98.0%) |
| 6 to 11 Years | 4,946 (92.3%) | 5,087 (90.4%) |
| 12 to 14 Years | 3,017 (88.7%) | 2,994 (94.1%) |
| 15 Years | 927 (86.0%) | 924 (93.2%) |
| 16 and 17 Years | 1,792 (82.0%) | 1,737 (93.8%) |
| 18 to 24 Years | 5,501 (94.1%) | 4,320 (77.6%) |
| 25 to 34 Years | 8,175 (95.6%) | 7,854 (89.4%) |
| 35 to 44 Years | 9,955 (96.3%) | 9,738 (92.1%) |
| 45 to 54 Years | 9,824 (94.2%) | 9,445 (93.6%) |
| 55 to 64 Years | 8,682 (90.1%) | 9,293 (91.5%) |
| 65 to 74 Years | 6,323 (94.4%) | 7,000 (91.4%) |
| 75 Years and over | 3,555 (94.8%) | 4,387 (89.8%) |
| Total | 67,253 (92.8%) | 67,392 (90.6%) |
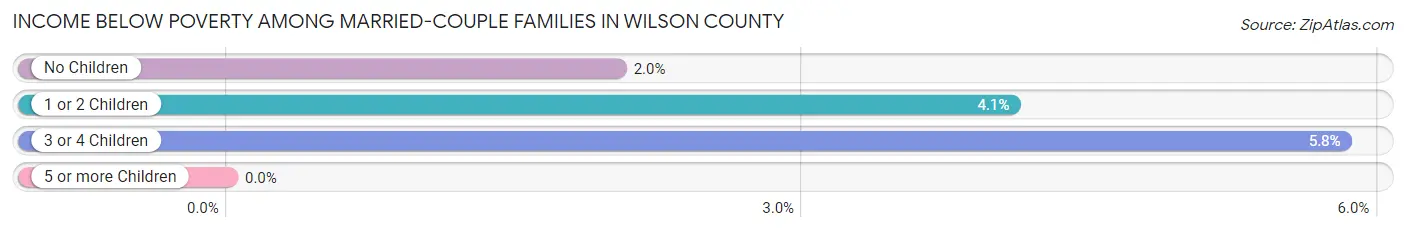
Income Below Poverty Among Married-Couple Families in Wilson County
The poverty statistics for married-couple families in Wilson County show that 3.0% or 1,000 of the total 32,891 families live below the poverty line. Families with 3 or 4 children have the highest poverty rate of 5.8%, comprising of 139 families. On the other hand, families with 5 or more children have the lowest poverty rate of 0.0%, which includes 0 families.
| Children | Above Poverty | Below Poverty |
| No Children | 17,895 (98.0%) | 371 (2.0%) |
| 1 or 2 Children | 11,487 (95.9%) | 490 (4.1%) |
| 3 or 4 Children | 2,250 (94.2%) | 139 (5.8%) |
| 5 or more Children | 259 (100.0%) | 0 (0.0%) |
| Total | 31,891 (97.0%) | 1,000 (3.0%) |
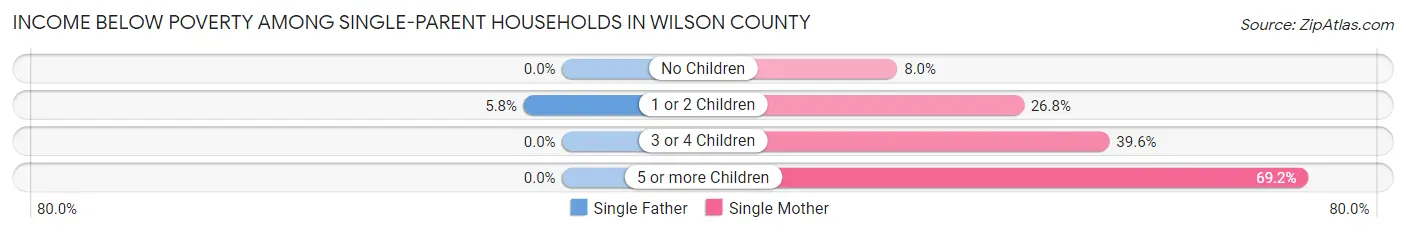
Income Below Poverty Among Single-Parent Households in Wilson County
According to the poverty data in Wilson County, 3.0% or 79 single-father households and 23.0% or 1,190 single-mother households are living below the poverty line. Among single-father households, those with 1 or 2 children have the highest poverty rate, with 79 households (5.8%) experiencing poverty. Likewise, among single-mother households, those with 5 or more children have the highest poverty rate, with 36 households (69.2%) falling below the poverty line.
| Children | Single Father | Single Mother |
| No Children | 0 (0.0%) | 123 (8.0%) |
| 1 or 2 Children | 79 (5.8%) | 812 (26.8%) |
| 3 or 4 Children | 0 (0.0%) | 219 (39.6%) |
| 5 or more Children | 0 (0.0%) | 36 (69.2%) |
| Total | 79 (3.0%) | 1,190 (23.0%) |
Income Below Poverty Among Married-Couple vs Single-Parent Households in Wilson County
The poverty data for Wilson County shows that 1,000 of the married-couple family households (3.0%) and 1,269 of the single-parent households (16.3%) are living below the poverty level. Within the married-couple family households, those with 3 or 4 children have the highest poverty rate, with 139 households (5.8%) falling below the poverty line. Among the single-parent households, those with 5 or more children have the highest poverty rate, with 36 household (51.4%) living below poverty.
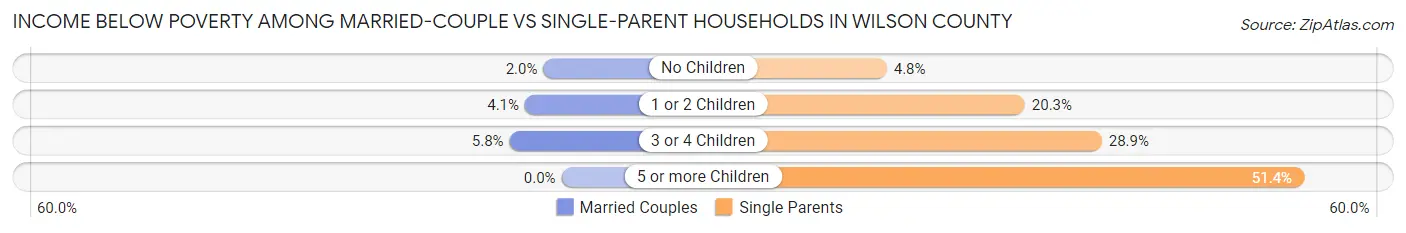
| Children | Married-Couple Families | Single-Parent Households |
| No Children | 371 (2.0%) | 123 (4.8%) |
| 1 or 2 Children | 490 (4.1%) | 891 (20.3%) |
| 3 or 4 Children | 139 (5.8%) | 219 (28.8%) |
| 5 or more Children | 0 (0.0%) | 36 (51.4%) |
| Total | 1,000 (3.0%) | 1,269 (16.3%) |
Employment Characteristics in Wilson County
Employment by Class of Employer in Wilson County
Among the 73,588 employed individuals in Wilson County, private company employees (52,177 | 70.9%), not-for-profit organizations (5,108 | 6.9%), and local government employees (5,080 | 6.9%) make up the most common classes of employment.
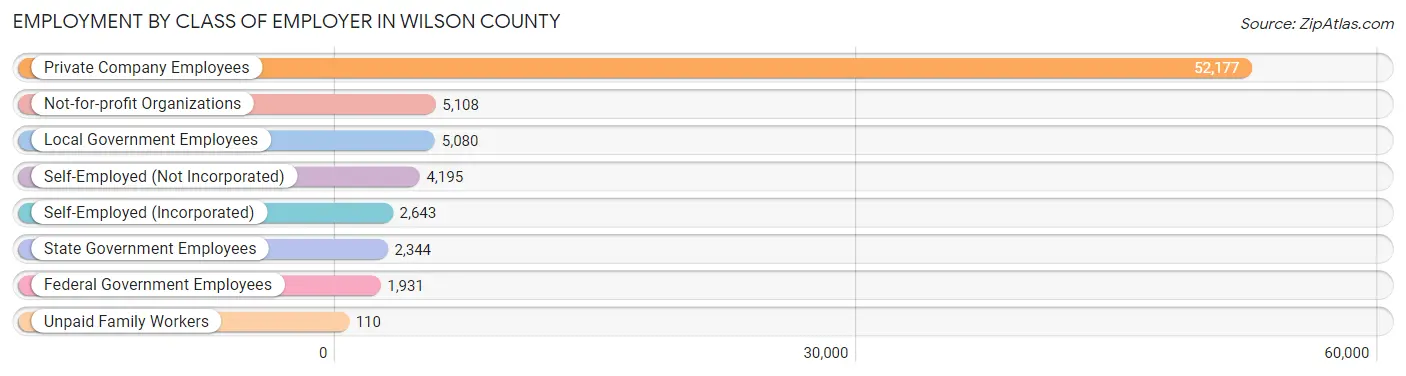
| Employer Class | # Employees | % Employees |
| Private Company Employees | 52,177 | 70.9% |
| Self-Employed (Incorporated) | 2,643 | 3.6% |
| Self-Employed (Not Incorporated) | 4,195 | 5.7% |
| Not-for-profit Organizations | 5,108 | 6.9% |
| Local Government Employees | 5,080 | 6.9% |
| State Government Employees | 2,344 | 3.2% |
| Federal Government Employees | 1,931 | 2.6% |
| Unpaid Family Workers | 110 | 0.2% |
| Total | 73,588 | 100.0% |
Employment Status by Age in Wilson County
According to the labor force statistics for Wilson County, out of the total population over 16 years of age (118,470), 65.5% or 77,598 individuals are in the labor force, with 3.7% or 2,871 of them unemployed. The age group with the highest labor force participation rate is 25 to 29 years, with 89.7% or 7,215 individuals in the labor force. Within the labor force, the 16 to 19 years age range has the highest percentage of unemployed individuals, with 15.1% or 460 of them being unemployed.
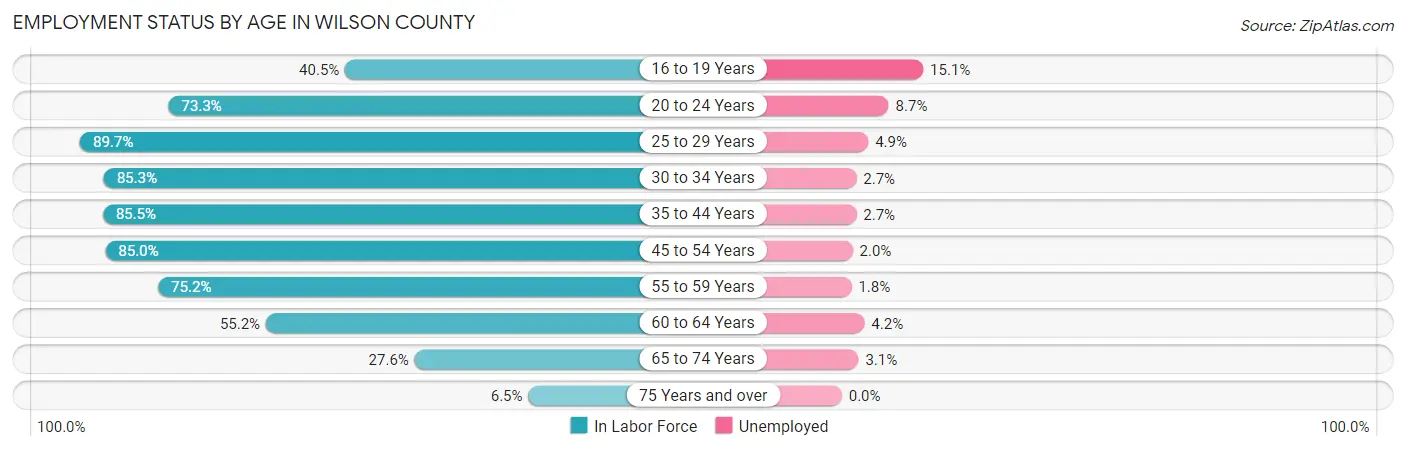
| Age Bracket | In Labor Force | Unemployed |
| 16 to 19 Years | 3,044 (40.5%) | 460 (15.1%) |
| 20 to 24 Years | 6,186 (73.3%) | 538 (8.7%) |
| 25 to 29 Years | 7,215 (89.7%) | 354 (4.9%) |
| 30 to 34 Years | 8,028 (85.3%) | 217 (2.7%) |
| 35 to 44 Years | 17,988 (85.5%) | 486 (2.7%) |
| 45 to 54 Years | 17,554 (85.0%) | 351 (2.0%) |
| 55 to 59 Years | 7,766 (75.2%) | 140 (1.8%) |
| 60 to 64 Years | 5,259 (55.2%) | 221 (4.2%) |
| 65 to 74 Years | 4,004 (27.6%) | 124 (3.1%) |
| 75 Years and over | 586 (6.5%) | 0 (0.0%) |
| Total | 77,598 (65.5%) | 2,871 (3.7%) |
Employment Status by Educational Attainment in Wilson County
According to labor force statistics for Wilson County, 80.8% of individuals (63,832) out of the total population between 25 and 64 years of age (79,000) are in the labor force, with 2.8% or 1,787 of them being unemployed. The group with the highest labor force participation rate are those with the educational attainment of bachelor's degree or higher, with 88.8% or 27,698 individuals in the labor force. Within the labor force, individuals with less than high school education have the highest percentage of unemployment, with 11.8% or 369 of them being unemployed.
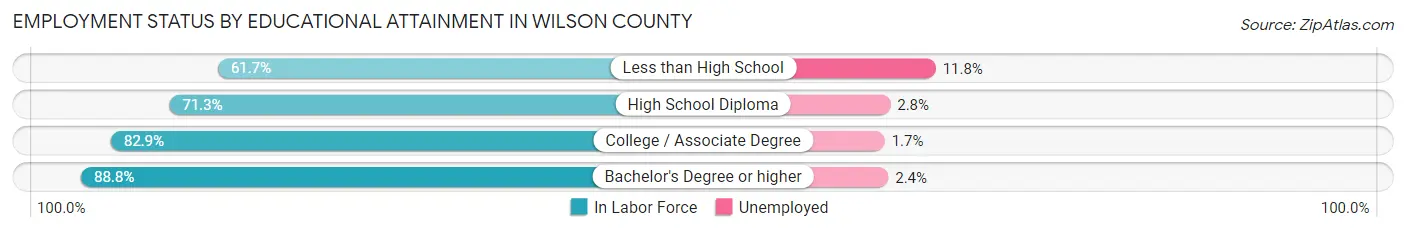
| Educational Attainment | In Labor Force | Unemployed |
| Less than High School | 3,128 (61.7%) | 598 (11.8%) |
| High School Diploma | 15,071 (71.3%) | 592 (2.8%) |
| College / Associate Degree | 17,906 (82.9%) | 367 (1.7%) |
| Bachelor's Degree or higher | 27,698 (88.8%) | 749 (2.4%) |
| Total | 63,832 (80.8%) | 2,212 (2.8%) |
Employment Occupations by Sex in Wilson County
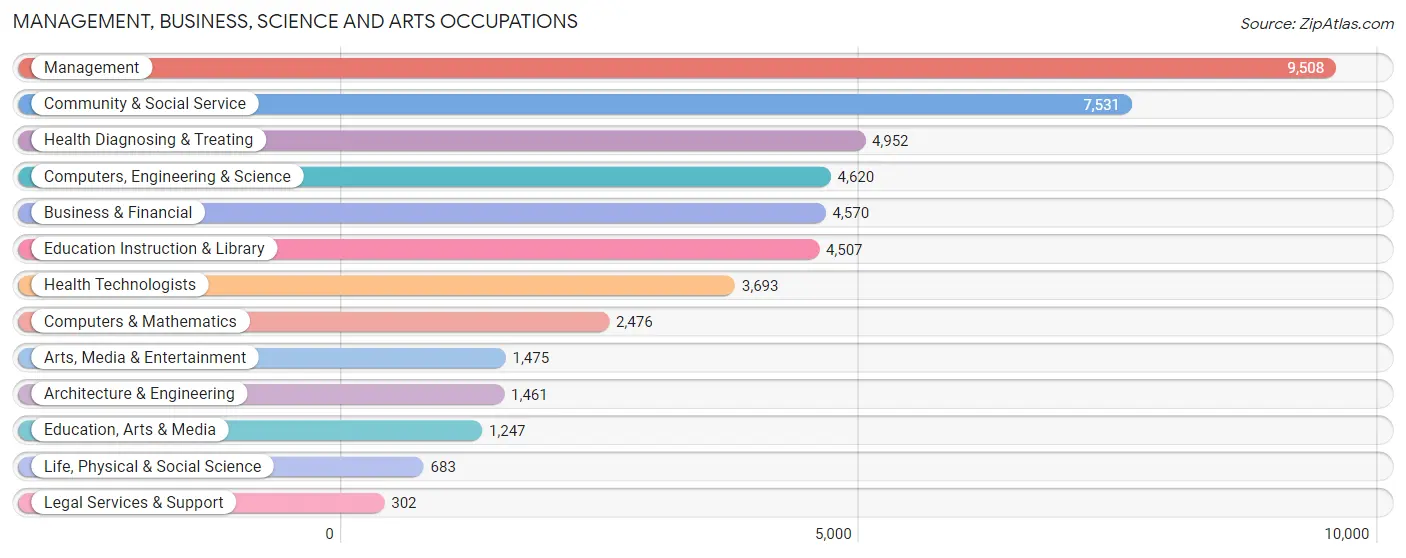
Management, Business, Science and Arts Occupations
The most common Management, Business, Science and Arts occupations in Wilson County are Management (9,508 | 12.7%), Community & Social Service (7,531 | 10.1%), Health Diagnosing & Treating (4,952 | 6.6%), Computers, Engineering & Science (4,620 | 6.2%), and Business & Financial (4,570 | 6.1%).
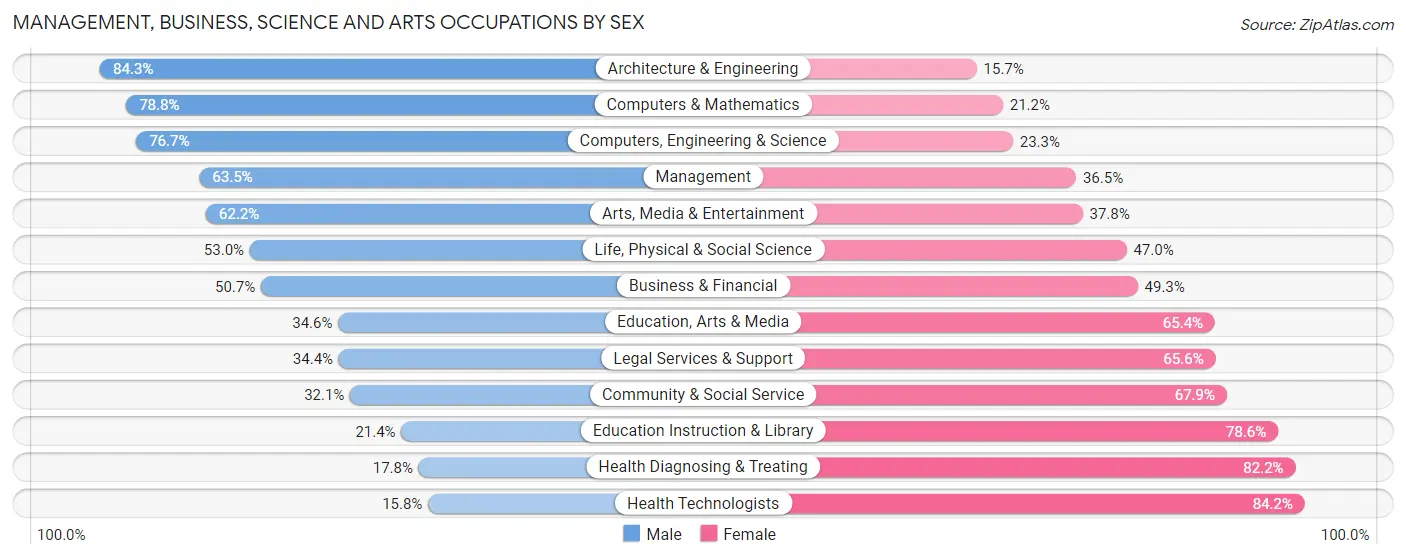
Management, Business, Science and Arts Occupations by Sex
Within the Management, Business, Science and Arts occupations in Wilson County, the most male-oriented occupations are Architecture & Engineering (84.3%), Computers & Mathematics (78.8%), and Computers, Engineering & Science (76.7%), while the most female-oriented occupations are Health Technologists (84.2%), Health Diagnosing & Treating (82.2%), and Education Instruction & Library (78.6%).
| Occupation | Male | Female |
| Management | 6,040 (63.5%) | 3,468 (36.5%) |
| Business & Financial | 2,316 (50.7%) | 2,254 (49.3%) |
| Computers, Engineering & Science | 3,544 (76.7%) | 1,076 (23.3%) |
| Computers & Mathematics | 1,951 (78.8%) | 525 (21.2%) |
| Architecture & Engineering | 1,231 (84.3%) | 230 (15.7%) |
| Life, Physical & Social Science | 362 (53.0%) | 321 (47.0%) |
| Community & Social Service | 2,416 (32.1%) | 5,115 (67.9%) |
| Education, Arts & Media | 431 (34.6%) | 816 (65.4%) |
| Legal Services & Support | 104 (34.4%) | 198 (65.6%) |
| Education Instruction & Library | 964 (21.4%) | 3,543 (78.6%) |
| Arts, Media & Entertainment | 917 (62.2%) | 558 (37.8%) |
| Health Diagnosing & Treating | 880 (17.8%) | 4,072 (82.2%) |
| Health Technologists | 584 (15.8%) | 3,109 (84.2%) |
| Total (Category) | 15,196 (48.7%) | 15,985 (51.3%) |
| Total (Overall) | 40,457 (54.2%) | 34,225 (45.8%) |
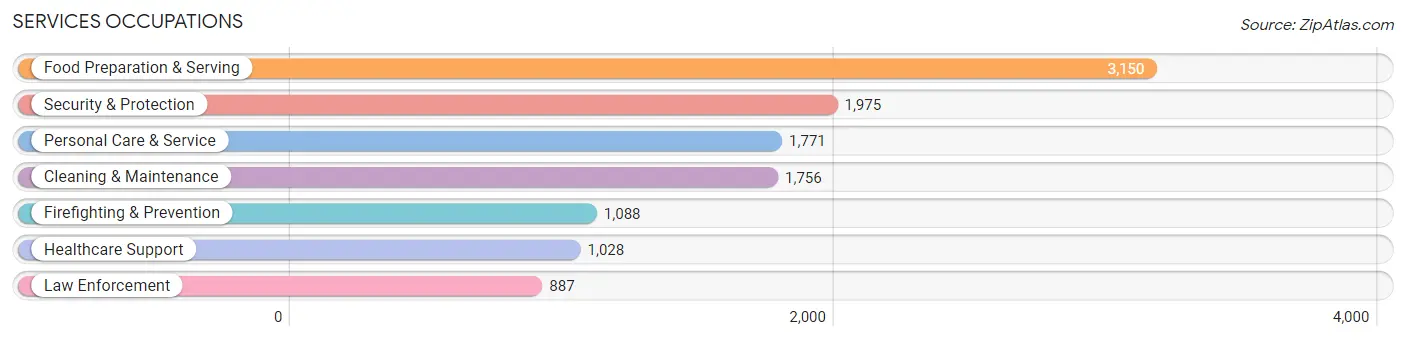
Services Occupations
The most common Services occupations in Wilson County are Food Preparation & Serving (3,150 | 4.2%), Security & Protection (1,975 | 2.6%), Personal Care & Service (1,771 | 2.4%), Cleaning & Maintenance (1,756 | 2.4%), and Firefighting & Prevention (1,088 | 1.5%).
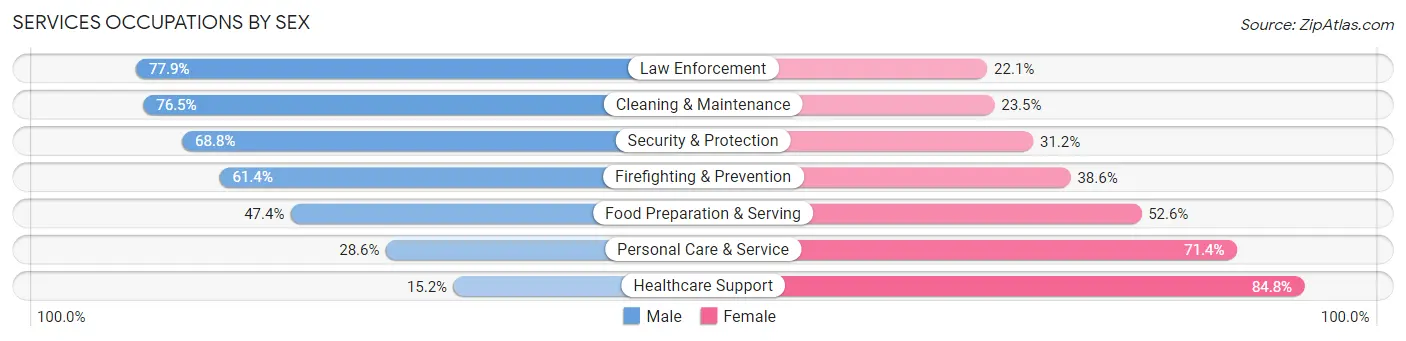
Services Occupations by Sex
Within the Services occupations in Wilson County, the most male-oriented occupations are Law Enforcement (77.9%), Cleaning & Maintenance (76.5%), and Security & Protection (68.8%), while the most female-oriented occupations are Healthcare Support (84.8%), Personal Care & Service (71.4%), and Food Preparation & Serving (52.6%).
| Occupation | Male | Female |
| Healthcare Support | 156 (15.2%) | 872 (84.8%) |
| Security & Protection | 1,359 (68.8%) | 616 (31.2%) |
| Firefighting & Prevention | 668 (61.4%) | 420 (38.6%) |
| Law Enforcement | 691 (77.9%) | 196 (22.1%) |
| Food Preparation & Serving | 1,493 (47.4%) | 1,657 (52.6%) |
| Cleaning & Maintenance | 1,343 (76.5%) | 413 (23.5%) |
| Personal Care & Service | 506 (28.6%) | 1,265 (71.4%) |
| Total (Category) | 4,857 (50.2%) | 4,823 (49.8%) |
| Total (Overall) | 40,457 (54.2%) | 34,225 (45.8%) |
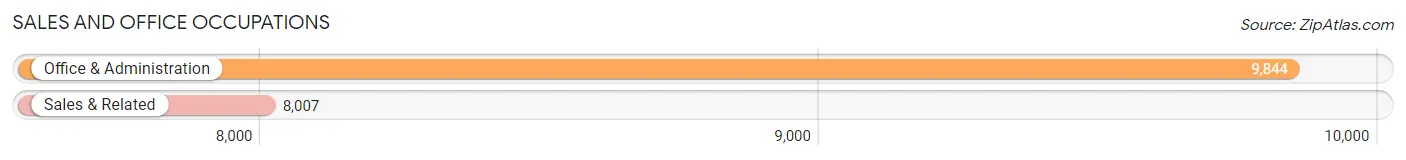
Sales and Office Occupations
The most common Sales and Office occupations in Wilson County are Office & Administration (9,844 | 13.2%), and Sales & Related (8,007 | 10.7%).
Sales and Office Occupations by Sex
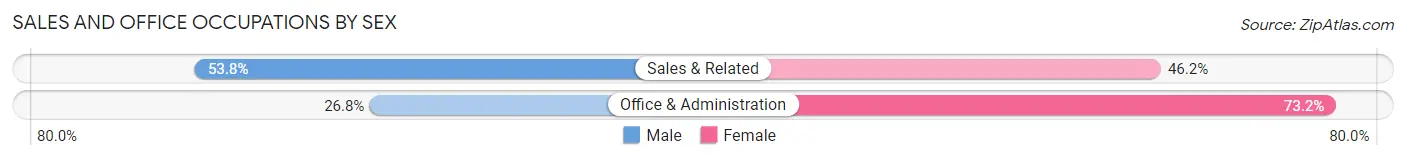
| Occupation | Male | Female |
| Sales & Related | 4,306 (53.8%) | 3,701 (46.2%) |
| Office & Administration | 2,641 (26.8%) | 7,203 (73.2%) |
| Total (Category) | 6,947 (38.9%) | 10,904 (61.1%) |
| Total (Overall) | 40,457 (54.2%) | 34,225 (45.8%) |
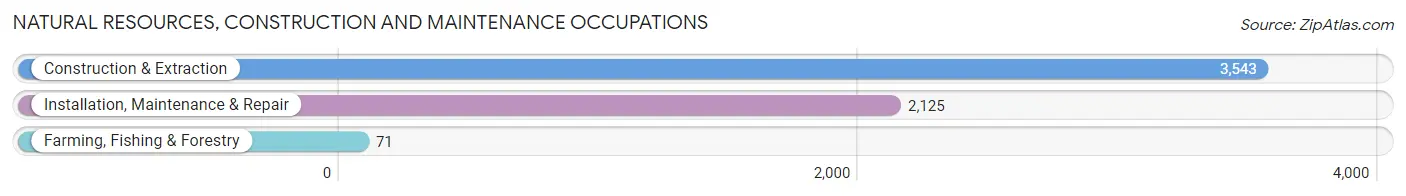
Natural Resources, Construction and Maintenance Occupations
The most common Natural Resources, Construction and Maintenance occupations in Wilson County are Construction & Extraction (3,543 | 4.7%), Installation, Maintenance & Repair (2,125 | 2.9%), and Farming, Fishing & Forestry (71 | 0.1%).
Natural Resources, Construction and Maintenance Occupations by Sex
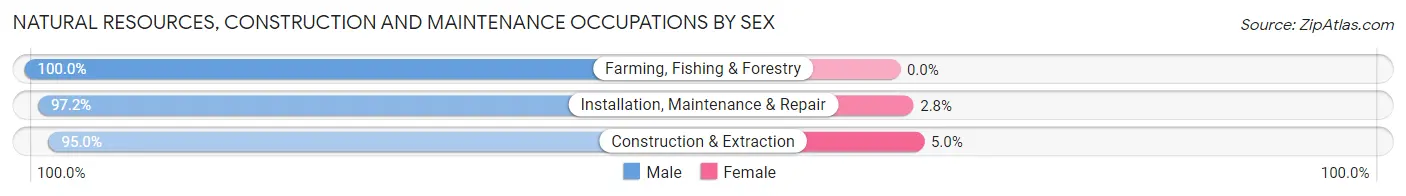
| Occupation | Male | Female |
| Farming, Fishing & Forestry | 71 (100.0%) | 0 (0.0%) |
| Construction & Extraction | 3,366 (95.0%) | 177 (5.0%) |
| Installation, Maintenance & Repair | 2,066 (97.2%) | 59 (2.8%) |
| Total (Category) | 5,503 (95.9%) | 236 (4.1%) |
| Total (Overall) | 40,457 (54.2%) | 34,225 (45.8%) |
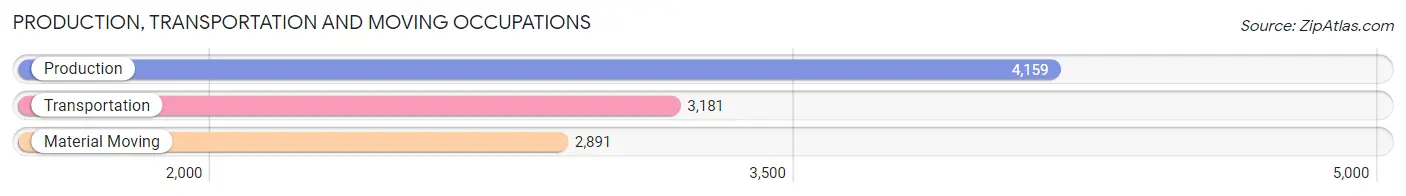
Production, Transportation and Moving Occupations
The most common Production, Transportation and Moving occupations in Wilson County are Production (4,159 | 5.6%), Transportation (3,181 | 4.3%), and Material Moving (2,891 | 3.9%).
Production, Transportation and Moving Occupations by Sex
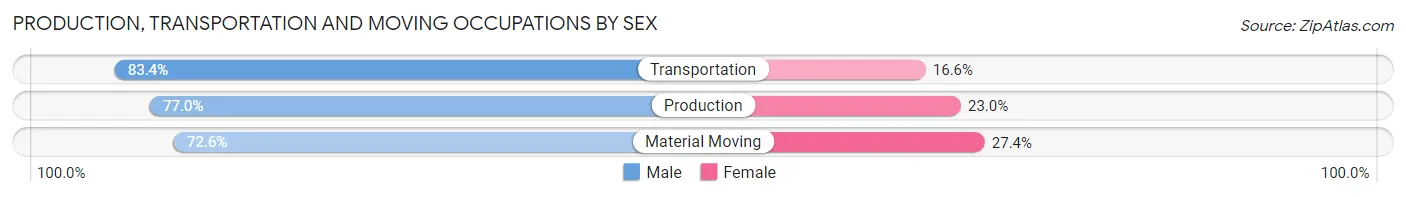
| Occupation | Male | Female |
| Production | 3,201 (77.0%) | 958 (23.0%) |
| Transportation | 2,654 (83.4%) | 527 (16.6%) |
| Material Moving | 2,099 (72.6%) | 792 (27.4%) |
| Total (Category) | 7,954 (77.7%) | 2,277 (22.3%) |
| Total (Overall) | 40,457 (54.2%) | 34,225 (45.8%) |
Employment Industries by Sex in Wilson County
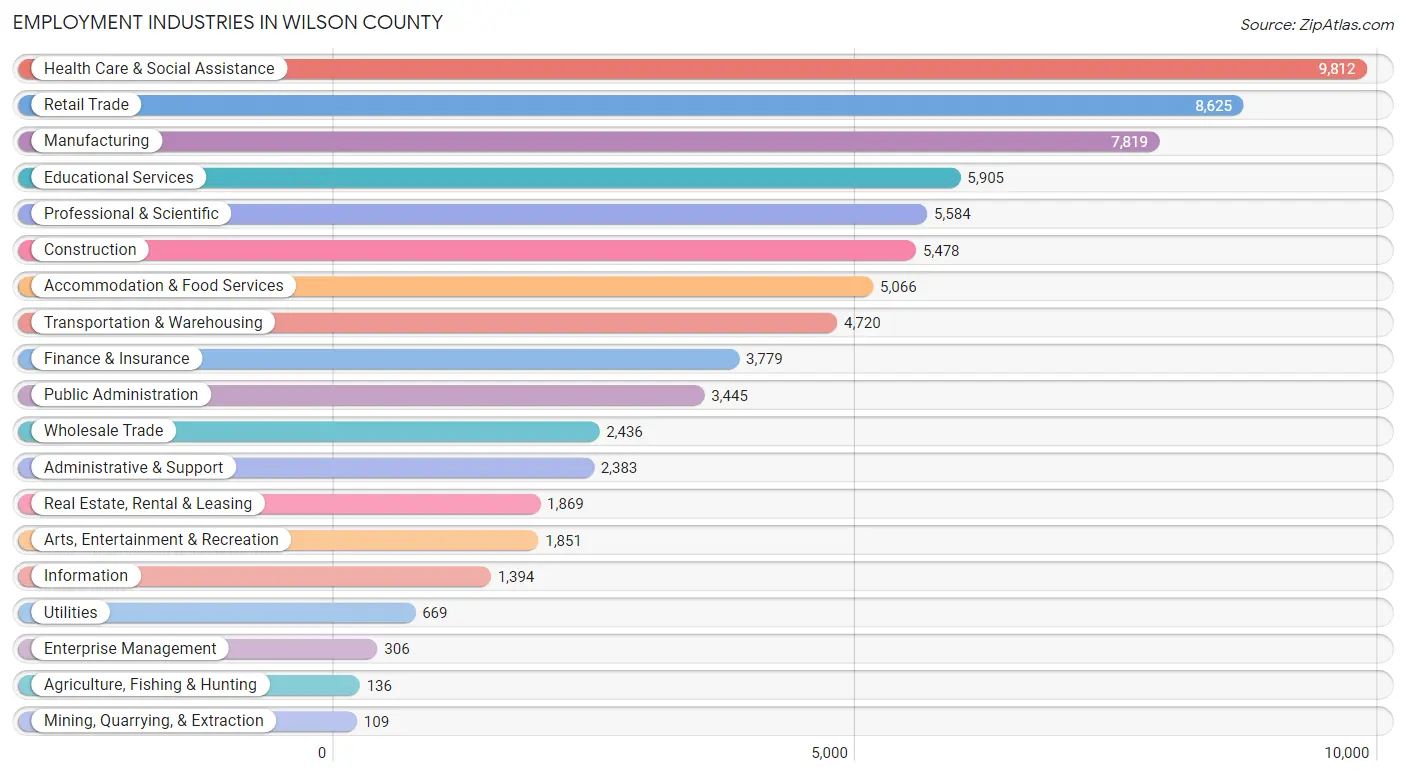
Employment Industries in Wilson County
The major employment industries in Wilson County include Health Care & Social Assistance (9,812 | 13.1%), Retail Trade (8,625 | 11.6%), Manufacturing (7,819 | 10.5%), Educational Services (5,905 | 7.9%), and Professional & Scientific (5,584 | 7.5%).
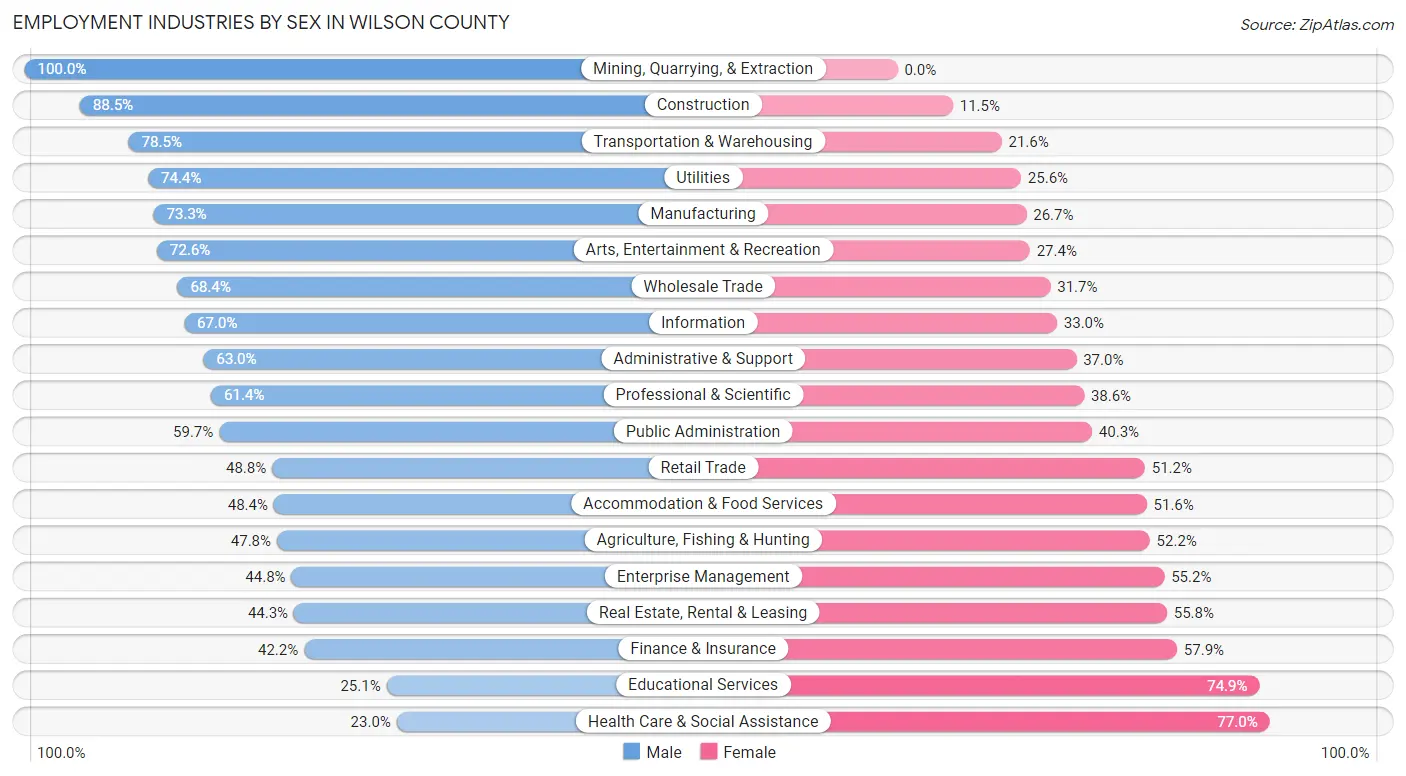
Employment Industries by Sex in Wilson County
The Wilson County industries that see more men than women are Mining, Quarrying, & Extraction (100.0%), Construction (88.5%), and Transportation & Warehousing (78.4%), whereas the industries that tend to have a higher number of women are Health Care & Social Assistance (77.0%), Educational Services (74.9%), and Finance & Insurance (57.9%).
| Industry | Male | Female |
| Agriculture, Fishing & Hunting | 65 (47.8%) | 71 (52.2%) |
| Mining, Quarrying, & Extraction | 109 (100.0%) | 0 (0.0%) |
| Construction | 4,850 (88.5%) | 628 (11.5%) |
| Manufacturing | 5,733 (73.3%) | 2,086 (26.7%) |
| Wholesale Trade | 1,665 (68.3%) | 771 (31.7%) |
| Retail Trade | 4,208 (48.8%) | 4,417 (51.2%) |
| Transportation & Warehousing | 3,703 (78.4%) | 1,017 (21.5%) |
| Utilities | 498 (74.4%) | 171 (25.6%) |
| Information | 934 (67.0%) | 460 (33.0%) |
| Finance & Insurance | 1,593 (42.1%) | 2,186 (57.9%) |
| Real Estate, Rental & Leasing | 827 (44.3%) | 1,042 (55.7%) |
| Professional & Scientific | 3,428 (61.4%) | 2,156 (38.6%) |
| Enterprise Management | 137 (44.8%) | 169 (55.2%) |
| Administrative & Support | 1,501 (63.0%) | 882 (37.0%) |
| Educational Services | 1,482 (25.1%) | 4,423 (74.9%) |
| Health Care & Social Assistance | 2,256 (23.0%) | 7,556 (77.0%) |
| Arts, Entertainment & Recreation | 1,344 (72.6%) | 507 (27.4%) |
| Accommodation & Food Services | 2,453 (48.4%) | 2,613 (51.6%) |
| Public Administration | 2,058 (59.7%) | 1,387 (40.3%) |
| Total | 40,457 (54.2%) | 34,225 (45.8%) |
Education in Wilson County
School Enrollment in Wilson County
The most common levels of schooling among the 35,583 students in Wilson County are high school (8,992 | 25.3%), middle school (7,881 | 22.2%), and elementary school (7,594 | 21.3%).
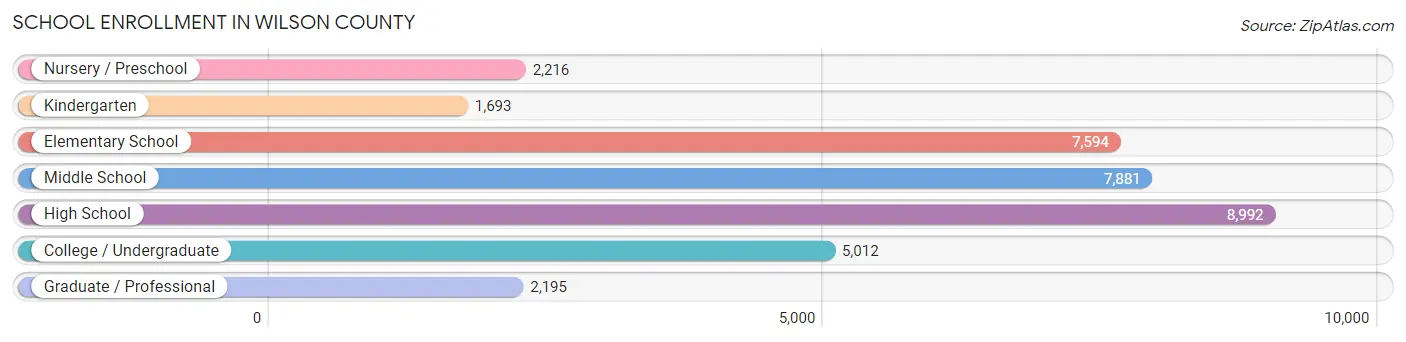
| School Level | # Students | % Students |
| Nursery / Preschool | 2,216 | 6.2% |
| Kindergarten | 1,693 | 4.8% |
| Elementary School | 7,594 | 21.3% |
| Middle School | 7,881 | 22.2% |
| High School | 8,992 | 25.3% |
| College / Undergraduate | 5,012 | 14.1% |
| Graduate / Professional | 2,195 | 6.2% |
| Total | 35,583 | 100.0% |
School Enrollment by Age by Funding Source in Wilson County
Out of a total of 35,583 students who are enrolled in schools in Wilson County, 6,227 (17.5%) attend a private institution, while the remaining 29,356 (82.5%) are enrolled in public schools. The age group of 3 to 4 year olds has the highest likelihood of being enrolled in private schools, with 914 (52.5% in the age bracket) enrolled. Conversely, the age group of 15 to 17 year olds has the lowest likelihood of being enrolled in a private school, with 5,560 (92.0% in the age bracket) attending a public institution.
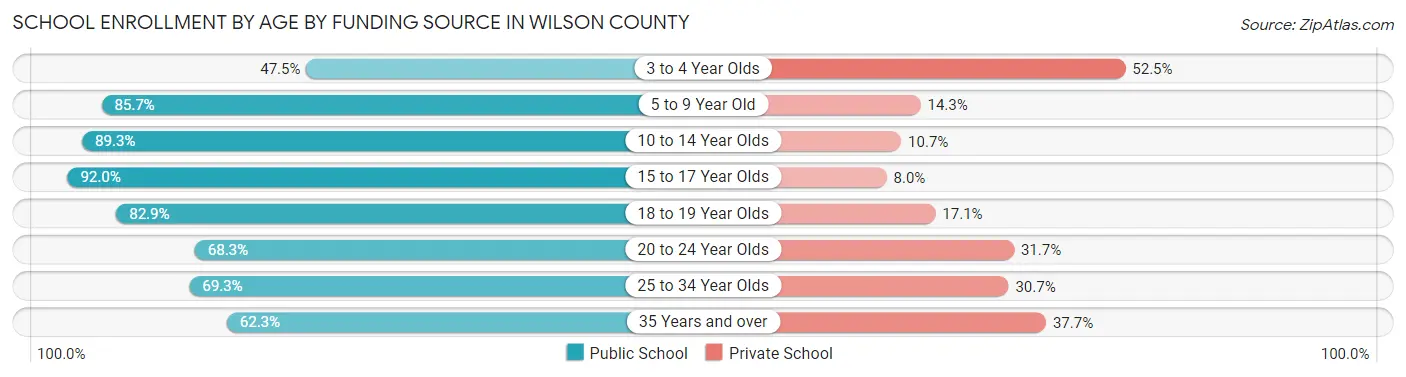
| Age Bracket | Public School | Private School |
| 3 to 4 Year Olds | 828 (47.5%) | 914 (52.5%) |
| 5 to 9 Year Old | 7,512 (85.7%) | 1,255 (14.3%) |
| 10 to 14 Year Olds | 9,106 (89.3%) | 1,092 (10.7%) |
| 15 to 17 Year Olds | 5,560 (92.0%) | 483 (8.0%) |
| 18 to 19 Year Olds | 2,231 (82.9%) | 460 (17.1%) |
| 20 to 24 Year Olds | 1,980 (68.3%) | 920 (31.7%) |
| 25 to 34 Year Olds | 1,009 (69.3%) | 447 (30.7%) |
| 35 Years and over | 1,113 (62.3%) | 673 (37.7%) |
| Total | 29,356 (82.5%) | 6,227 (17.5%) |
Educational Attainment by Field of Study in Wilson County
Business (9,268 | 22.9%), education (4,925 | 12.2%), science & technology (4,688 | 11.6%), arts & humanities (2,966 | 7.3%), and bio, nature & agricultural (2,294 | 5.7%) are the most common fields of study among 40,423 individuals in Wilson County who have obtained a bachelor's degree or higher.
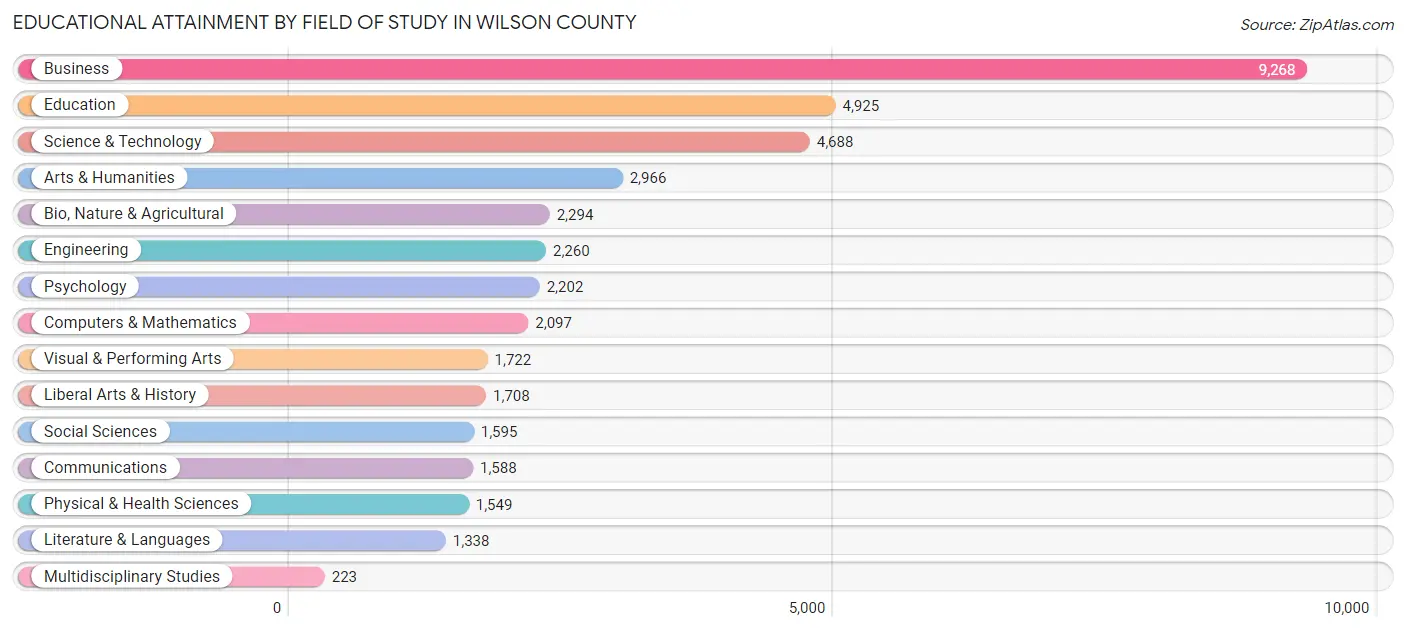
| Field of Study | # Graduates | % Graduates |
| Computers & Mathematics | 2,097 | 5.2% |
| Bio, Nature & Agricultural | 2,294 | 5.7% |
| Physical & Health Sciences | 1,549 | 3.8% |
| Psychology | 2,202 | 5.4% |
| Social Sciences | 1,595 | 4.0% |
| Engineering | 2,260 | 5.6% |
| Multidisciplinary Studies | 223 | 0.5% |
| Science & Technology | 4,688 | 11.6% |
| Business | 9,268 | 22.9% |
| Education | 4,925 | 12.2% |
| Literature & Languages | 1,338 | 3.3% |
| Liberal Arts & History | 1,708 | 4.2% |
| Visual & Performing Arts | 1,722 | 4.3% |
| Communications | 1,588 | 3.9% |
| Arts & Humanities | 2,966 | 7.3% |
| Total | 40,423 | 100.0% |
Transportation & Commute in Wilson County
Vehicle Availability by Sex in Wilson County
The most prevalent vehicle ownership categories in Wilson County are males with 2 vehicles (16,687, accounting for 41.8%) and females with 2 vehicles (13,884, making up 50.0%).
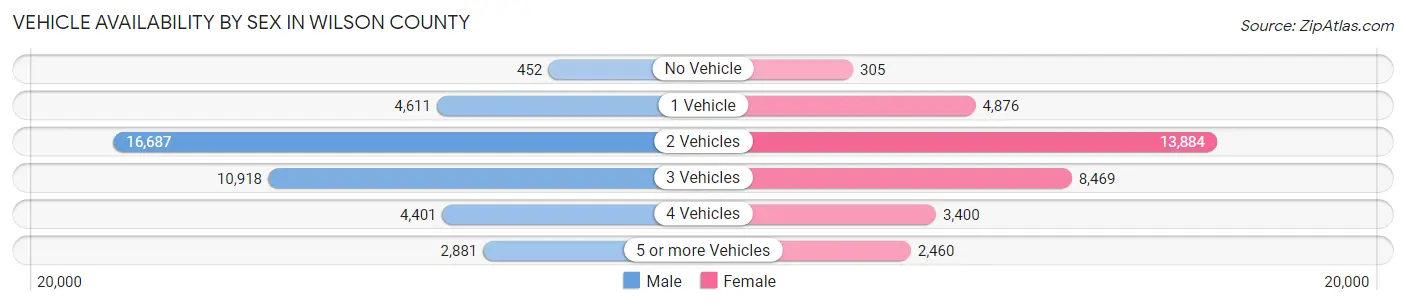
| Vehicles Available | Male | Female |
| No Vehicle | 452 (1.1%) | 305 (0.9%) |
| 1 Vehicle | 4,611 (11.5%) | 4,876 (14.6%) |
| 2 Vehicles | 16,687 (41.8%) | 13,884 (41.6%) |
| 3 Vehicles | 10,918 (27.3%) | 8,469 (25.4%) |
| 4 Vehicles | 4,401 (11.0%) | 3,400 (10.2%) |
| 5 or more Vehicles | 2,881 (7.2%) | 2,460 (7.4%) |
| Total | 39,950 (100.0%) | 33,394 (100.0%) |
Commute Time in Wilson County
The most frequently occuring commute durations in Wilson County are 30 to 34 minutes (11,649 commuters, 18.2%), 45 to 59 minutes (9,376 commuters, 14.6%), and 15 to 19 minutes (7,963 commuters, 12.4%).
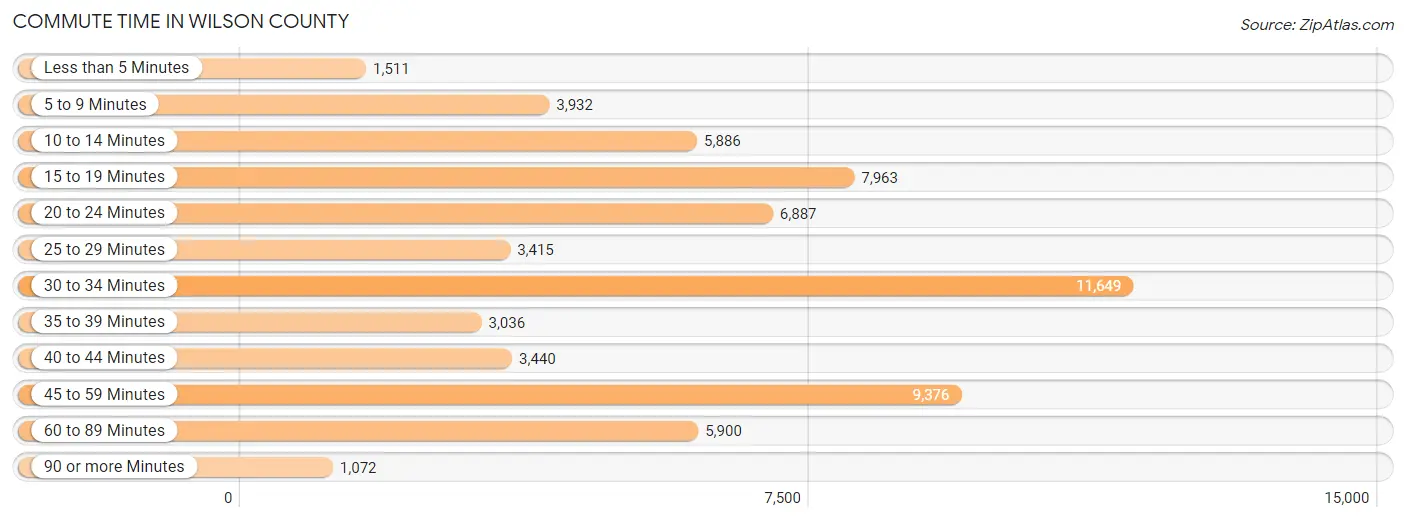
| Commute Time | # Commuters | % Commuters |
| Less than 5 Minutes | 1,511 | 2.4% |
| 5 to 9 Minutes | 3,932 | 6.1% |
| 10 to 14 Minutes | 5,886 | 9.2% |
| 15 to 19 Minutes | 7,963 | 12.4% |
| 20 to 24 Minutes | 6,887 | 10.7% |
| 25 to 29 Minutes | 3,415 | 5.3% |
| 30 to 34 Minutes | 11,649 | 18.2% |
| 35 to 39 Minutes | 3,036 | 4.7% |
| 40 to 44 Minutes | 3,440 | 5.4% |
| 45 to 59 Minutes | 9,376 | 14.6% |
| 60 to 89 Minutes | 5,900 | 9.2% |
| 90 or more Minutes | 1,072 | 1.7% |
Commute Time by Sex in Wilson County
The most common commute times in Wilson County are 30 to 34 minutes (6,812 commuters, 19.2%) for males and 30 to 34 minutes (4,837 commuters, 16.9%) for females.
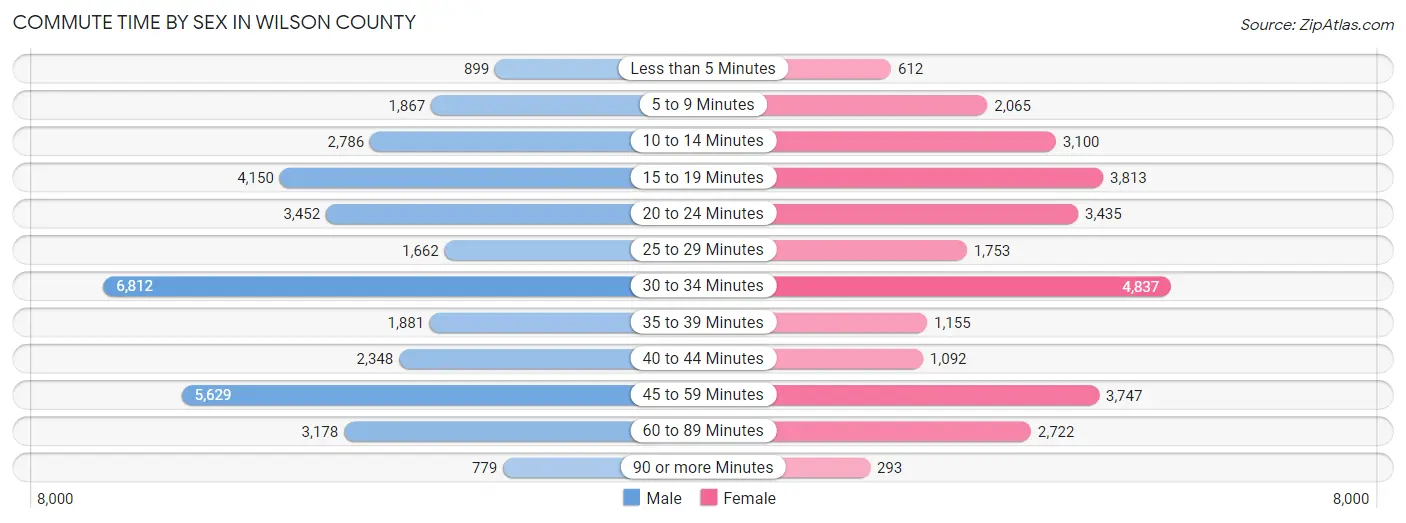
| Commute Time | Male | Female |
| Less than 5 Minutes | 899 (2.5%) | 612 (2.1%) |
| 5 to 9 Minutes | 1,867 (5.3%) | 2,065 (7.2%) |
| 10 to 14 Minutes | 2,786 (7.9%) | 3,100 (10.8%) |
| 15 to 19 Minutes | 4,150 (11.7%) | 3,813 (13.3%) |
| 20 to 24 Minutes | 3,452 (9.7%) | 3,435 (12.0%) |
| 25 to 29 Minutes | 1,662 (4.7%) | 1,753 (6.1%) |
| 30 to 34 Minutes | 6,812 (19.2%) | 4,837 (16.9%) |
| 35 to 39 Minutes | 1,881 (5.3%) | 1,155 (4.0%) |
| 40 to 44 Minutes | 2,348 (6.6%) | 1,092 (3.8%) |
| 45 to 59 Minutes | 5,629 (15.9%) | 3,747 (13.1%) |
| 60 to 89 Minutes | 3,178 (9.0%) | 2,722 (9.5%) |
| 90 or more Minutes | 779 (2.2%) | 293 (1.0%) |
Time of Departure to Work by Sex in Wilson County
The most frequent times of departure to work in Wilson County are 6:00 AM to 6:29 AM (5,116, 14.4%) for males and 7:00 AM to 7:29 AM (5,406, 18.9%) for females.
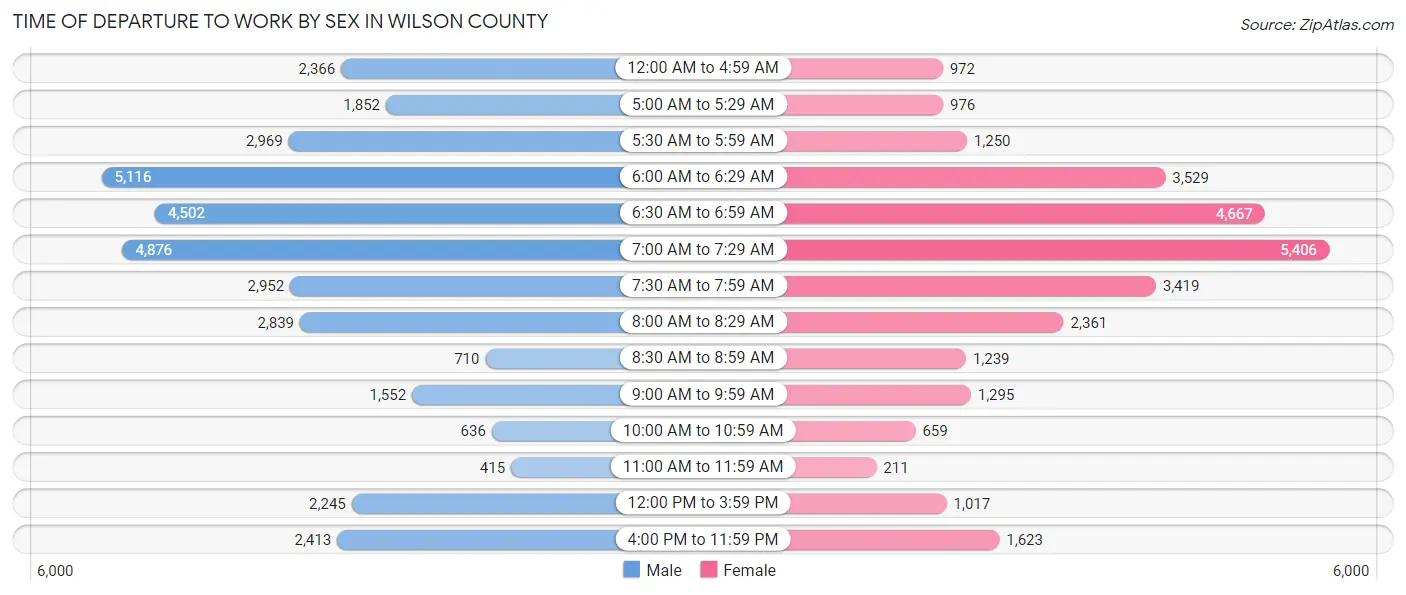
| Time of Departure | Male | Female |
| 12:00 AM to 4:59 AM | 2,366 (6.7%) | 972 (3.4%) |
| 5:00 AM to 5:29 AM | 1,852 (5.2%) | 976 (3.4%) |
| 5:30 AM to 5:59 AM | 2,969 (8.4%) | 1,250 (4.4%) |
| 6:00 AM to 6:29 AM | 5,116 (14.4%) | 3,529 (12.3%) |
| 6:30 AM to 6:59 AM | 4,502 (12.7%) | 4,667 (16.3%) |
| 7:00 AM to 7:29 AM | 4,876 (13.8%) | 5,406 (18.9%) |
| 7:30 AM to 7:59 AM | 2,952 (8.3%) | 3,419 (11.9%) |
| 8:00 AM to 8:29 AM | 2,839 (8.0%) | 2,361 (8.3%) |
| 8:30 AM to 8:59 AM | 710 (2.0%) | 1,239 (4.3%) |
| 9:00 AM to 9:59 AM | 1,552 (4.4%) | 1,295 (4.5%) |
| 10:00 AM to 10:59 AM | 636 (1.8%) | 659 (2.3%) |
| 11:00 AM to 11:59 AM | 415 (1.2%) | 211 (0.7%) |
| 12:00 PM to 3:59 PM | 2,245 (6.3%) | 1,017 (3.5%) |
| 4:00 PM to 11:59 PM | 2,413 (6.8%) | 1,623 (5.7%) |
| Total | 35,443 (100.0%) | 28,624 (100.0%) |
Housing Occupancy in Wilson County
Occupancy by Ownership in Wilson County
Of the total 55,037 dwellings in Wilson County, owner-occupied units account for 42,410 (77.1%), while renter-occupied units make up 12,627 (22.9%).
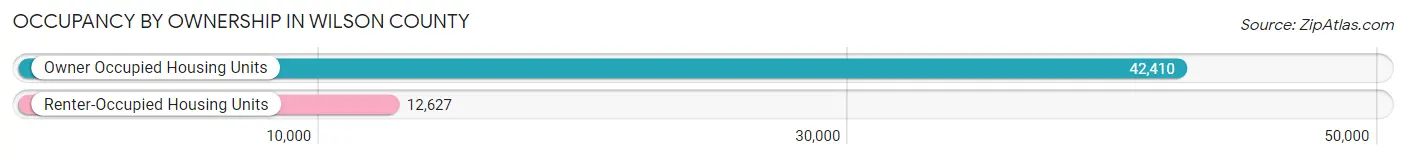
| Occupancy | # Housing Units | % Housing Units |
| Owner Occupied Housing Units | 42,410 | 77.1% |
| Renter-Occupied Housing Units | 12,627 | 22.9% |
| Total Occupied Housing Units | 55,037 | 100.0% |
Occupancy by Household Size in Wilson County
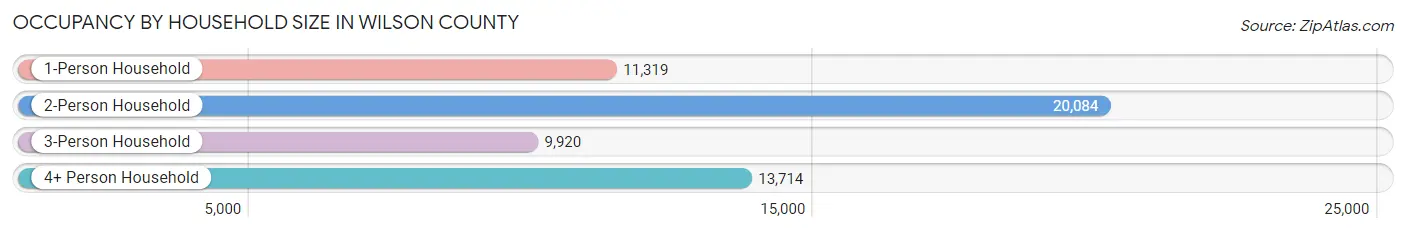
| Household Size | # Housing Units | % Housing Units |
| 1-Person Household | 11,319 | 20.6% |
| 2-Person Household | 20,084 | 36.5% |
| 3-Person Household | 9,920 | 18.0% |
| 4+ Person Household | 13,714 | 24.9% |
| Total Housing Units | 55,037 | 100.0% |
Occupancy by Ownership by Household Size in Wilson County
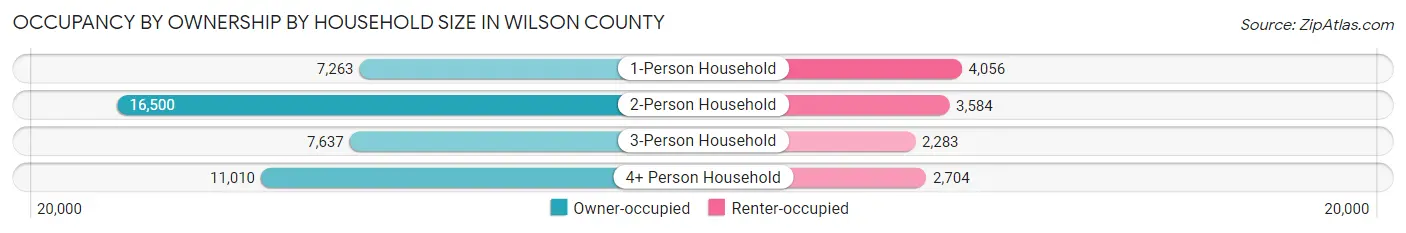
| Household Size | Owner-occupied | Renter-occupied |
| 1-Person Household | 7,263 (64.2%) | 4,056 (35.8%) |
| 2-Person Household | 16,500 (82.2%) | 3,584 (17.8%) |
| 3-Person Household | 7,637 (77.0%) | 2,283 (23.0%) |
| 4+ Person Household | 11,010 (80.3%) | 2,704 (19.7%) |
| Total Housing Units | 42,410 (77.1%) | 12,627 (22.9%) |
Occupancy by Educational Attainment in Wilson County
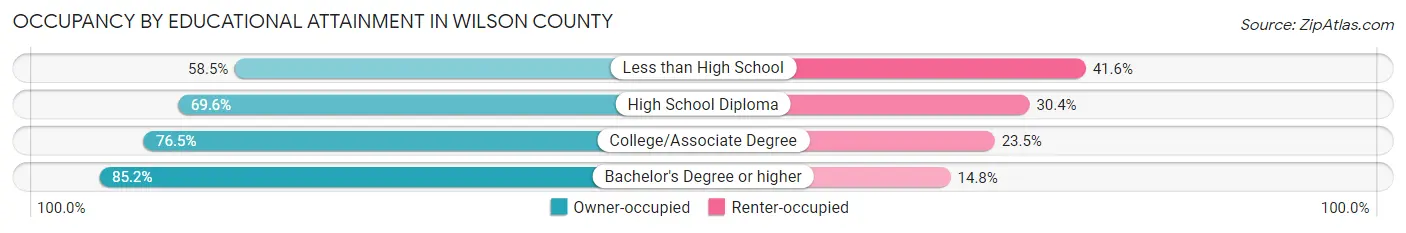
| Household Size | Owner-occupied | Renter-occupied |
| Less than High School | 1,909 (58.5%) | 1,357 (41.5%) |
| High School Diploma | 9,996 (69.6%) | 4,364 (30.4%) |
| College/Associate Degree | 12,117 (76.5%) | 3,723 (23.5%) |
| Bachelor's Degree or higher | 18,388 (85.2%) | 3,183 (14.8%) |
Occupancy by Age of Householder in Wilson County
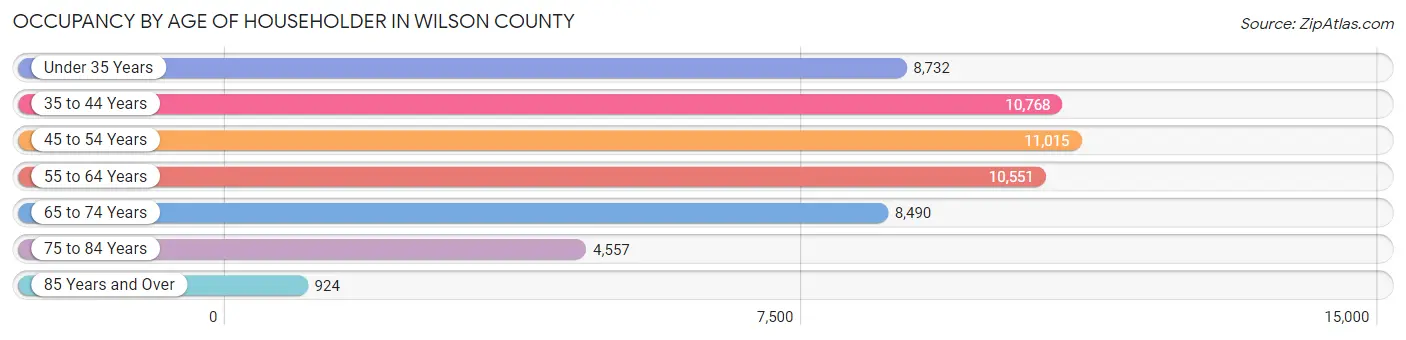
| Age Bracket | # Households | % Households |
| Under 35 Years | 8,732 | 15.9% |
| 35 to 44 Years | 10,768 | 19.6% |
| 45 to 54 Years | 11,015 | 20.0% |
| 55 to 64 Years | 10,551 | 19.2% |
| 65 to 74 Years | 8,490 | 15.4% |
| 75 to 84 Years | 4,557 | 8.3% |
| 85 Years and Over | 924 | 1.7% |
| Total | 55,037 | 100.0% |
Housing Finances in Wilson County
Median Income by Occupancy in Wilson County
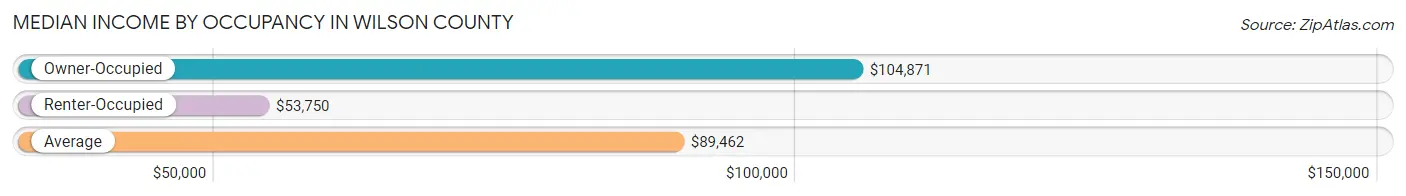
| Occupancy Type | # Households | Median Income |
| Owner-Occupied | 42,410 (77.1%) | $104,871 |
| Renter-Occupied | 12,627 (22.9%) | $53,750 |
| Average | 55,037 (100.0%) | $89,462 |
Occupancy by Householder Income Bracket in Wilson County
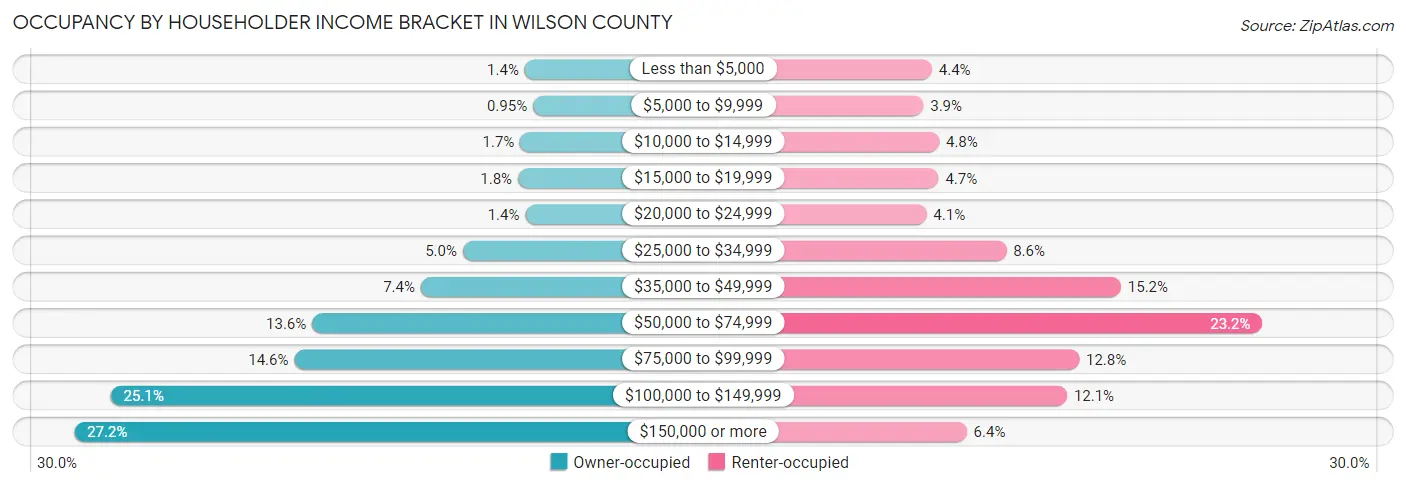
| Income Bracket | Owner-occupied | Renter-occupied |
| Less than $5,000 | 601 (1.4%) | 551 (4.4%) |
| $5,000 to $9,999 | 402 (0.9%) | 489 (3.9%) |
| $10,000 to $14,999 | 714 (1.7%) | 602 (4.8%) |
| $15,000 to $19,999 | 768 (1.8%) | 599 (4.7%) |
| $20,000 to $24,999 | 590 (1.4%) | 511 (4.1%) |
| $25,000 to $34,999 | 2,105 (5.0%) | 1,087 (8.6%) |
| $35,000 to $49,999 | 3,123 (7.4%) | 1,914 (15.2%) |
| $50,000 to $74,999 | 5,754 (13.6%) | 2,934 (23.2%) |
| $75,000 to $99,999 | 6,189 (14.6%) | 1,613 (12.8%) |
| $100,000 to $149,999 | 10,641 (25.1%) | 1,525 (12.1%) |
| $150,000 or more | 11,523 (27.2%) | 802 (6.4%) |
| Total | 42,410 (100.0%) | 12,627 (100.0%) |
Monthly Housing Cost Tiers in Wilson County
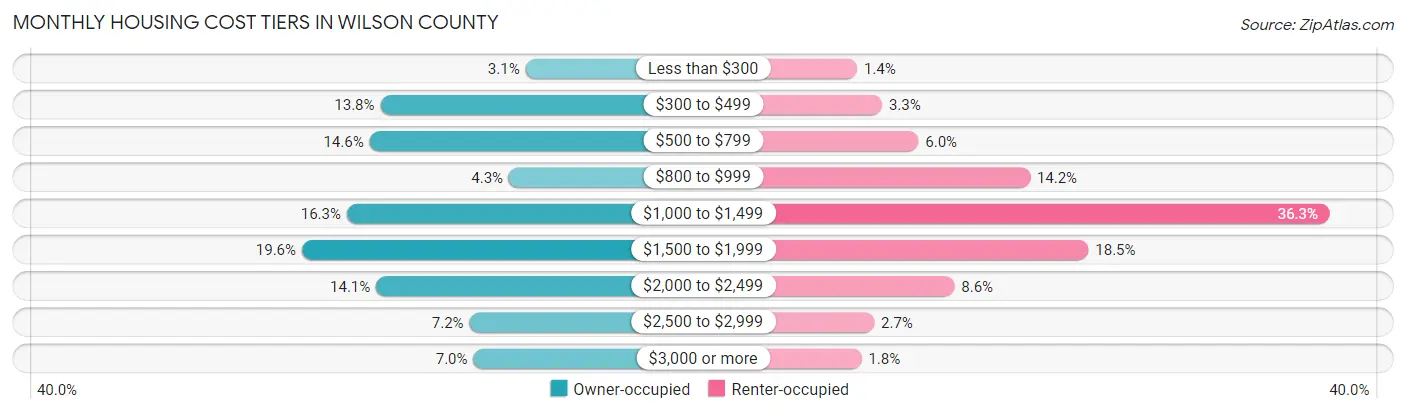
| Monthly Cost | Owner-occupied | Renter-occupied |
| Less than $300 | 1,319 (3.1%) | 182 (1.4%) |
| $300 to $499 | 5,854 (13.8%) | 414 (3.3%) |
| $500 to $799 | 6,193 (14.6%) | 753 (6.0%) |
| $800 to $999 | 1,836 (4.3%) | 1,791 (14.2%) |
| $1,000 to $1,499 | 6,902 (16.3%) | 4,578 (36.3%) |
| $1,500 to $1,999 | 8,305 (19.6%) | 2,334 (18.5%) |
| $2,000 to $2,499 | 5,983 (14.1%) | 1,087 (8.6%) |
| $2,500 to $2,999 | 3,072 (7.2%) | 341 (2.7%) |
| $3,000 or more | 2,946 (7.0%) | 223 (1.8%) |
| Total | 42,410 (100.0%) | 12,627 (100.0%) |
Physical Housing Characteristics in Wilson County
Housing Structures in Wilson County
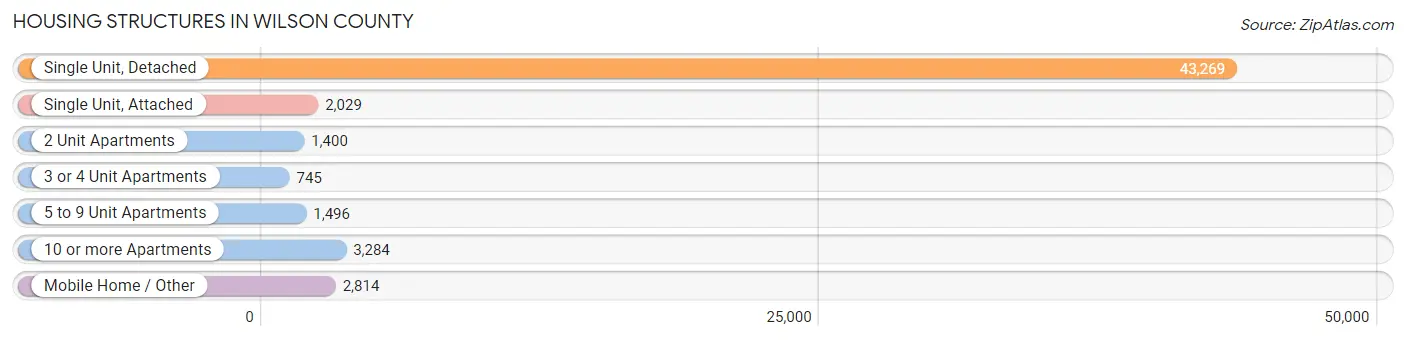
| Structure Type | # Housing Units | % Housing Units |
| Single Unit, Detached | 43,269 | 78.6% |
| Single Unit, Attached | 2,029 | 3.7% |
| 2 Unit Apartments | 1,400 | 2.5% |
| 3 or 4 Unit Apartments | 745 | 1.3% |
| 5 to 9 Unit Apartments | 1,496 | 2.7% |
| 10 or more Apartments | 3,284 | 6.0% |
| Mobile Home / Other | 2,814 | 5.1% |
| Total | 55,037 | 100.0% |
Housing Structures by Occupancy in Wilson County
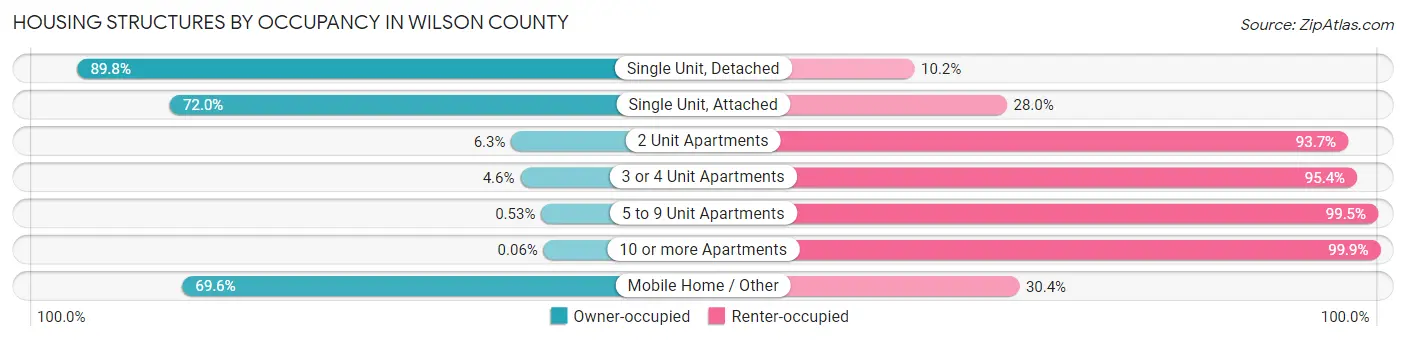
| Structure Type | Owner-occupied | Renter-occupied |
| Single Unit, Detached | 38,858 (89.8%) | 4,411 (10.2%) |
| Single Unit, Attached | 1,461 (72.0%) | 568 (28.0%) |
| 2 Unit Apartments | 88 (6.3%) | 1,312 (93.7%) |
| 3 or 4 Unit Apartments | 34 (4.6%) | 711 (95.4%) |
| 5 to 9 Unit Apartments | 8 (0.5%) | 1,488 (99.5%) |
| 10 or more Apartments | 2 (0.1%) | 3,282 (99.9%) |
| Mobile Home / Other | 1,959 (69.6%) | 855 (30.4%) |
| Total | 42,410 (77.1%) | 12,627 (22.9%) |
Housing Structures by Number of Rooms in Wilson County
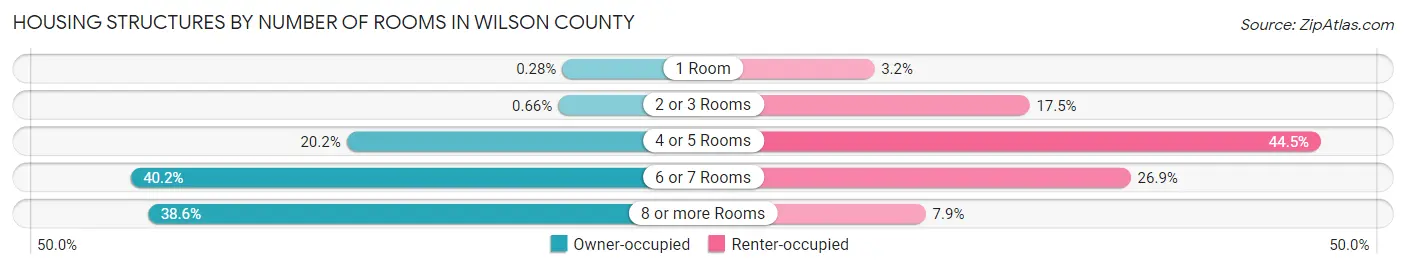
| Number of Rooms | Owner-occupied | Renter-occupied |
| 1 Room | 117 (0.3%) | 400 (3.2%) |
| 2 or 3 Rooms | 278 (0.7%) | 2,213 (17.5%) |
| 4 or 5 Rooms | 8,578 (20.2%) | 5,617 (44.5%) |
| 6 or 7 Rooms | 17,063 (40.2%) | 3,396 (26.9%) |
| 8 or more Rooms | 16,374 (38.6%) | 1,001 (7.9%) |
| Total | 42,410 (100.0%) | 12,627 (100.0%) |
Housing Structure by Heating Type in Wilson County
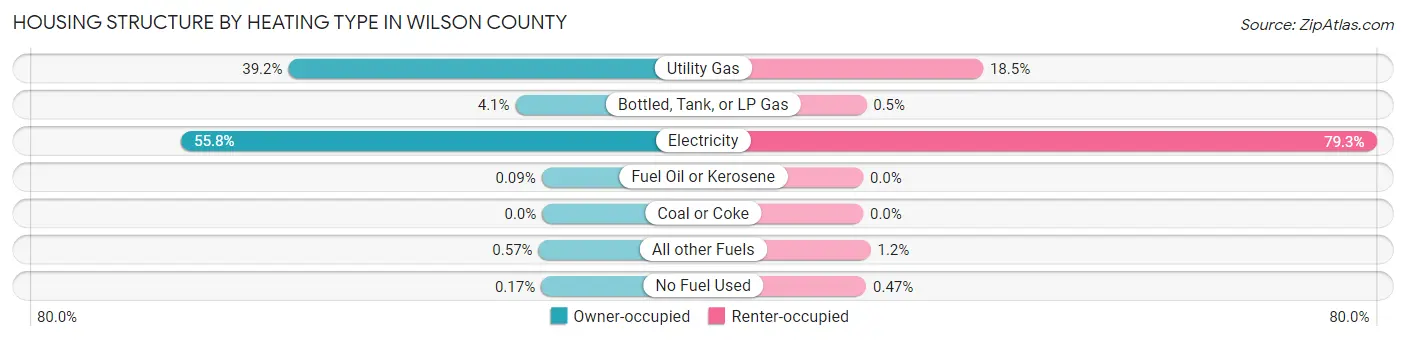
| Heating Type | Owner-occupied | Renter-occupied |
| Utility Gas | 16,642 (39.2%) | 2,341 (18.5%) |
| Bottled, Tank, or LP Gas | 1,752 (4.1%) | 63 (0.5%) |
| Electricity | 23,662 (55.8%) | 10,018 (79.3%) |
| Fuel Oil or Kerosene | 39 (0.1%) | 0 (0.0%) |
| Coal or Coke | 0 (0.0%) | 0 (0.0%) |
| All other Fuels | 242 (0.6%) | 146 (1.2%) |
| No Fuel Used | 73 (0.2%) | 59 (0.5%) |
| Total | 42,410 (100.0%) | 12,627 (100.0%) |
Household Vehicle Usage in Wilson County
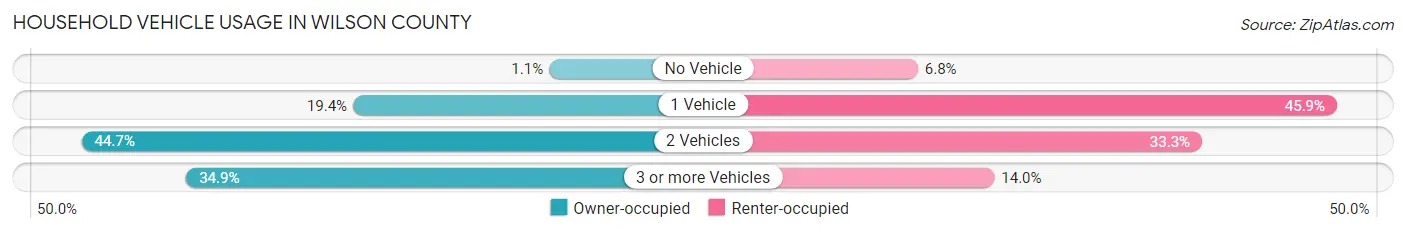
| Vehicles per Household | Owner-occupied | Renter-occupied |
| No Vehicle | 446 (1.1%) | 860 (6.8%) |
| 1 Vehicle | 8,208 (19.4%) | 5,798 (45.9%) |
| 2 Vehicles | 18,949 (44.7%) | 4,207 (33.3%) |
| 3 or more Vehicles | 14,807 (34.9%) | 1,762 (14.0%) |
| Total | 42,410 (100.0%) | 12,627 (100.0%) |
Real Estate & Mortgages in Wilson County
Real Estate and Mortgage Overview in Wilson County
| Characteristic | Without Mortgage | With Mortgage |
| Housing Units | 13,506 | 28,904 |
| Median Property Value | $332,200 | $371,100 |
| Median Household Income | $72,619 | $8,996 |
| Monthly Housing Costs | $493 | $2,938 |
| Real Estate Taxes | $1,573 | $590 |
Property Value by Mortgage Status in Wilson County
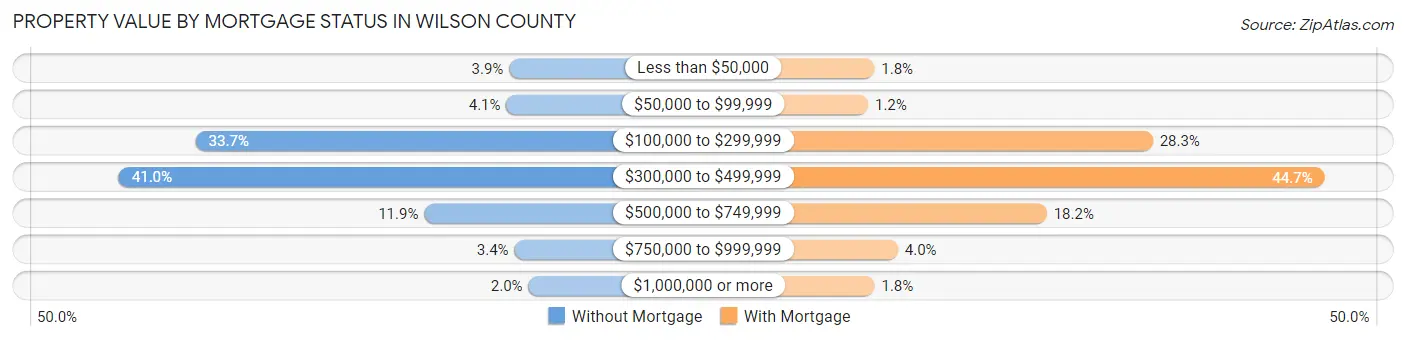
| Property Value | Without Mortgage | With Mortgage |
| Less than $50,000 | 520 (3.8%) | 518 (1.8%) |
| $50,000 to $99,999 | 556 (4.1%) | 344 (1.2%) |
| $100,000 to $299,999 | 4,553 (33.7%) | 8,181 (28.3%) |
| $300,000 to $499,999 | 5,540 (41.0%) | 12,908 (44.7%) |
| $500,000 to $749,999 | 1,612 (11.9%) | 5,264 (18.2%) |
| $750,000 to $999,999 | 452 (3.4%) | 1,166 (4.0%) |
| $1,000,000 or more | 273 (2.0%) | 523 (1.8%) |
| Total | 13,506 (100.0%) | 28,904 (100.0%) |
Household Income by Mortgage Status in Wilson County
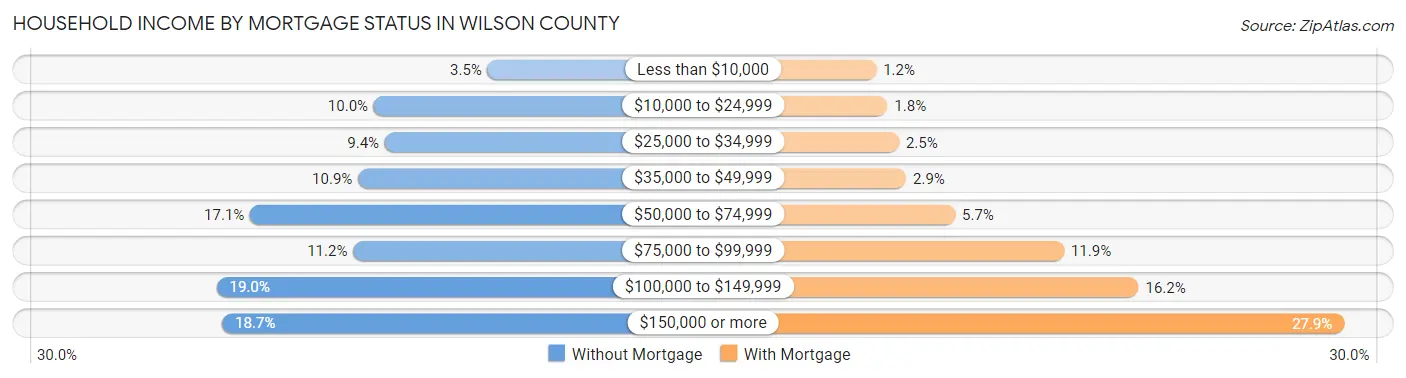
| Household Income | Without Mortgage | With Mortgage |
| Less than $10,000 | 478 (3.5%) | 340 (1.2%) |
| $10,000 to $24,999 | 1,356 (10.0%) | 525 (1.8%) |
| $25,000 to $34,999 | 1,271 (9.4%) | 716 (2.5%) |
| $35,000 to $49,999 | 1,477 (10.9%) | 834 (2.9%) |
| $50,000 to $74,999 | 2,311 (17.1%) | 1,646 (5.7%) |
| $75,000 to $99,999 | 1,516 (11.2%) | 3,443 (11.9%) |
| $100,000 to $149,999 | 2,570 (19.0%) | 4,673 (16.2%) |
| $150,000 or more | 2,527 (18.7%) | 8,071 (27.9%) |
| Total | 13,506 (100.0%) | 28,904 (100.0%) |
Property Value to Household Income Ratio in Wilson County
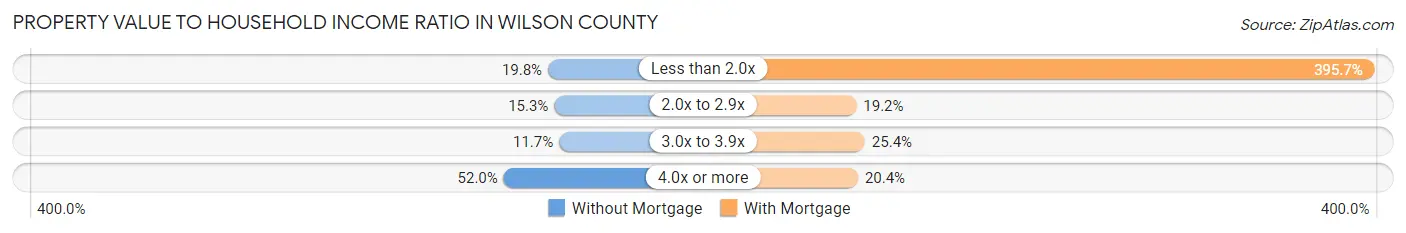
| Value-to-Income Ratio | Without Mortgage | With Mortgage |
| Less than 2.0x | 2,677 (19.8%) | 114,372 (395.7%) |
| 2.0x to 2.9x | 2,062 (15.3%) | 5,546 (19.2%) |
| 3.0x to 3.9x | 1,584 (11.7%) | 7,347 (25.4%) |
| 4.0x or more | 7,027 (52.0%) | 5,885 (20.4%) |
| Total | 13,506 (100.0%) | 28,904 (100.0%) |
Real Estate Taxes by Mortgage Status in Wilson County
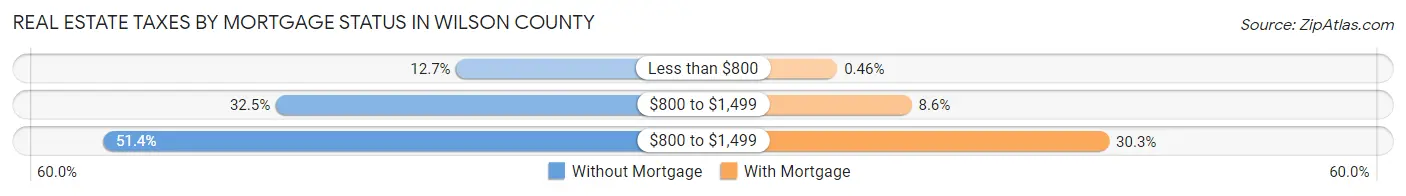
| Property Taxes | Without Mortgage | With Mortgage |
| Less than $800 | 1,713 (12.7%) | 134 (0.5%) |
| $800 to $1,499 | 4,383 (32.5%) | 2,487 (8.6%) |
| $800 to $1,499 | 6,941 (51.4%) | 8,746 (30.3%) |
| Total | 13,506 (100.0%) | 28,904 (100.0%) |
Health & Disability in Wilson County
Health Insurance Coverage by Age in Wilson County
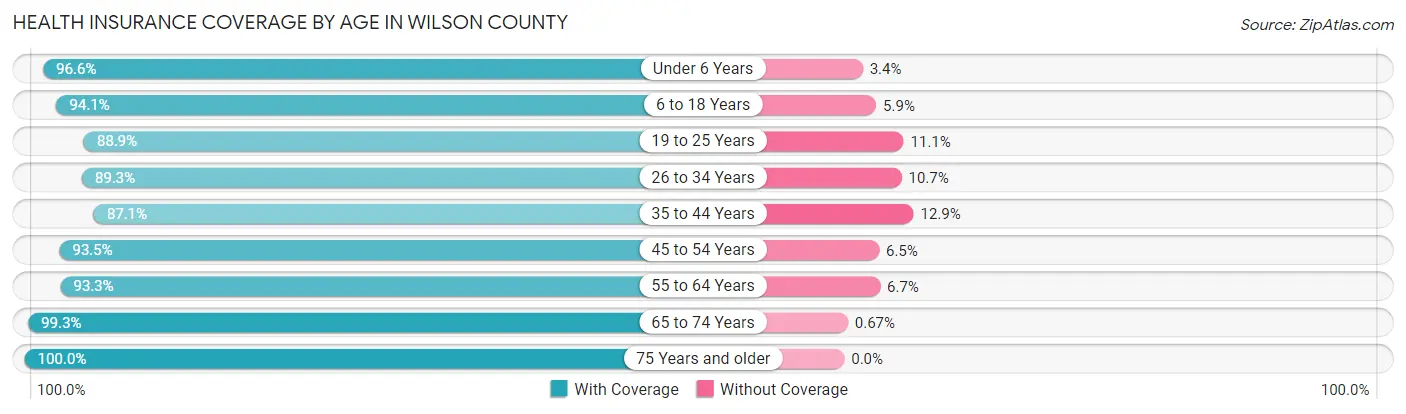
| Age Bracket | With Coverage | Without Coverage |
| Under 6 Years | 10,023 (96.6%) | 357 (3.4%) |
| 6 to 18 Years | 24,513 (94.1%) | 1,549 (5.9%) |
| 19 to 25 Years | 10,192 (88.9%) | 1,268 (11.1%) |
| 26 to 34 Years | 14,212 (89.3%) | 1,699 (10.7%) |
| 35 to 44 Years | 18,205 (87.1%) | 2,698 (12.9%) |
| 45 to 54 Years | 19,166 (93.5%) | 1,329 (6.5%) |
| 55 to 64 Years | 18,468 (93.3%) | 1,320 (6.7%) |
| 65 to 74 Years | 14,264 (99.3%) | 96 (0.7%) |
| 75 Years and older | 8,636 (100.0%) | 0 (0.0%) |
| Total | 137,679 (93.0%) | 10,316 (7.0%) |
Health Insurance Coverage by Citizenship Status in Wilson County
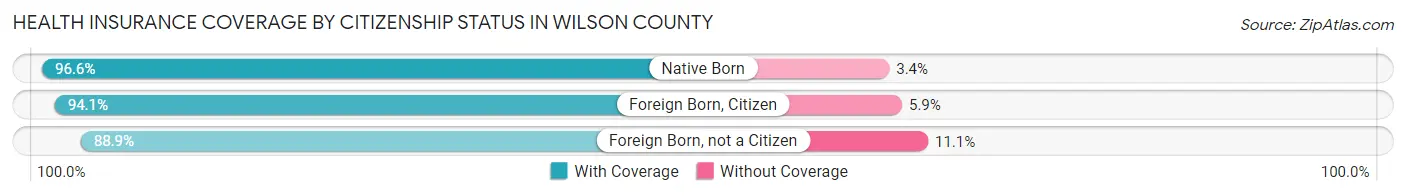
| Citizenship Status | With Coverage | Without Coverage |
| Native Born | 10,023 (96.6%) | 357 (3.4%) |
| Foreign Born, Citizen | 24,513 (94.1%) | 1,549 (5.9%) |
| Foreign Born, not a Citizen | 10,192 (88.9%) | 1,268 (11.1%) |
Health Insurance Coverage by Household Income in Wilson County
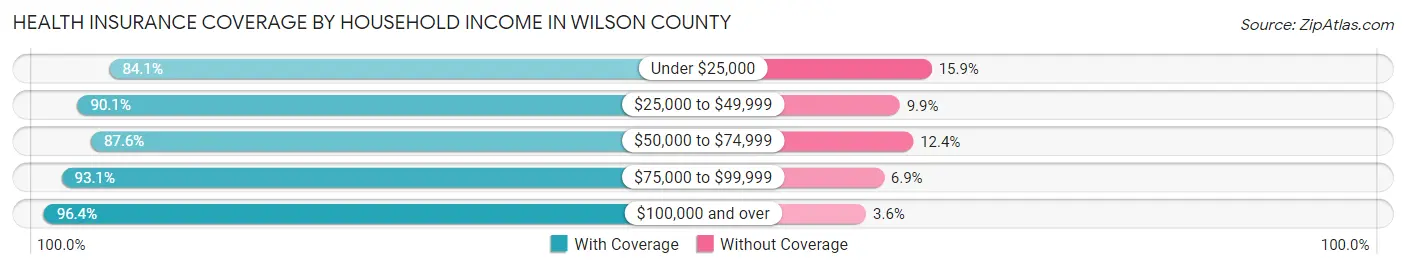
| Household Income | With Coverage | Without Coverage |
| Under $25,000 | 9,075 (84.1%) | 1,717 (15.9%) |
| $25,000 to $49,999 | 14,533 (90.1%) | 1,600 (9.9%) |
| $50,000 to $74,999 | 18,864 (87.6%) | 2,679 (12.4%) |
| $75,000 to $99,999 | 20,155 (93.1%) | 1,502 (6.9%) |
| $100,000 and over | 74,365 (96.4%) | 2,786 (3.6%) |
Public vs Private Health Insurance Coverage by Age in Wilson County
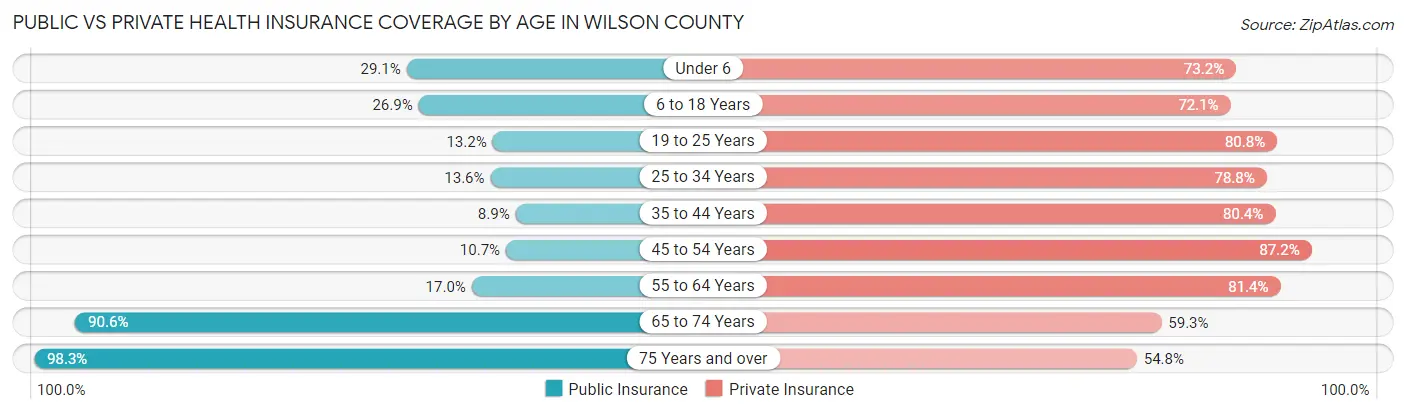
| Age Bracket | Public Insurance | Private Insurance |
| Under 6 | 3,022 (29.1%) | 7,594 (73.2%) |
| 6 to 18 Years | 7,009 (26.9%) | 18,799 (72.1%) |
| 19 to 25 Years | 1,507 (13.2%) | 9,256 (80.8%) |
| 25 to 34 Years | 2,156 (13.6%) | 12,545 (78.8%) |
| 35 to 44 Years | 1,857 (8.9%) | 16,813 (80.4%) |
| 45 to 54 Years | 2,184 (10.7%) | 17,870 (87.2%) |
| 55 to 64 Years | 3,368 (17.0%) | 16,107 (81.4%) |
| 65 to 74 Years | 13,012 (90.6%) | 8,518 (59.3%) |
| 75 Years and over | 8,486 (98.3%) | 4,728 (54.7%) |
| Total | 42,601 (28.8%) | 112,230 (75.8%) |
Disability Status by Sex by Age in Wilson County
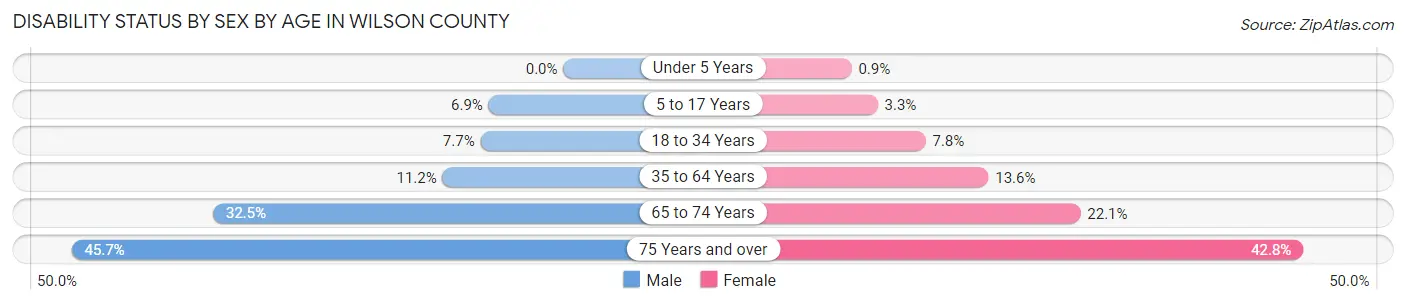
| Age Bracket | Male | Female |
| Under 5 Years | 0 (0.0%) | 39 (0.9%) |
| 5 to 17 Years | 928 (6.9%) | 417 (3.3%) |
| 18 to 34 Years | 1,120 (7.7%) | 1,133 (7.8%) |
| 35 to 64 Years | 3,405 (11.2%) | 4,190 (13.6%) |
| 65 to 74 Years | 2,179 (32.5%) | 1,696 (22.1%) |
| 75 Years and over | 1,712 (45.7%) | 2,092 (42.8%) |
Disability Class by Sex by Age in Wilson County
Disability Class: Hearing Difficulty
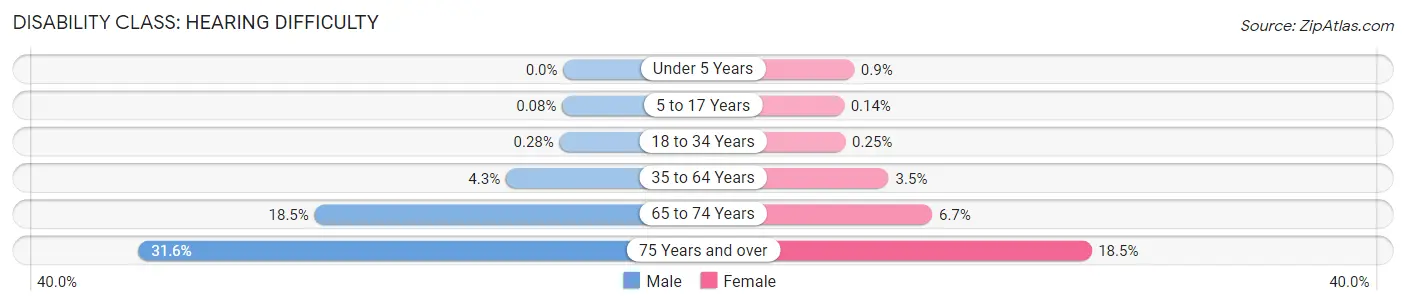
| Age Bracket | Male | Female |
| Under 5 Years | 0 (0.0%) | 39 (0.9%) |
| 5 to 17 Years | 11 (0.1%) | 18 (0.1%) |
| 18 to 34 Years | 41 (0.3%) | 37 (0.3%) |
| 35 to 64 Years | 1,295 (4.3%) | 1,072 (3.5%) |
| 65 to 74 Years | 1,237 (18.5%) | 513 (6.7%) |
| 75 Years and over | 1,183 (31.6%) | 905 (18.5%) |
Disability Class: Vision Difficulty
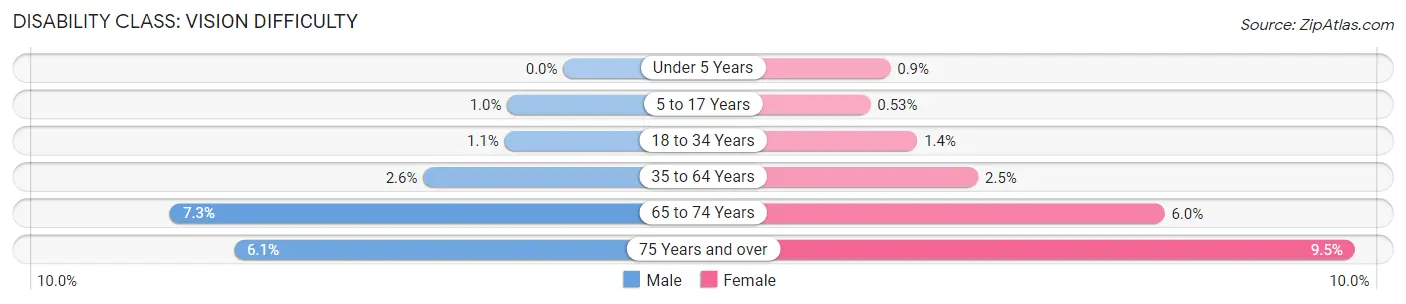
| Age Bracket | Male | Female |
| Under 5 Years | 0 (0.0%) | 39 (0.9%) |
| 5 to 17 Years | 139 (1.0%) | 67 (0.5%) |
| 18 to 34 Years | 159 (1.1%) | 204 (1.4%) |
| 35 to 64 Years | 791 (2.6%) | 779 (2.5%) |
| 65 to 74 Years | 489 (7.3%) | 459 (6.0%) |
| 75 Years and over | 229 (6.1%) | 465 (9.5%) |
Disability Class: Cognitive Difficulty
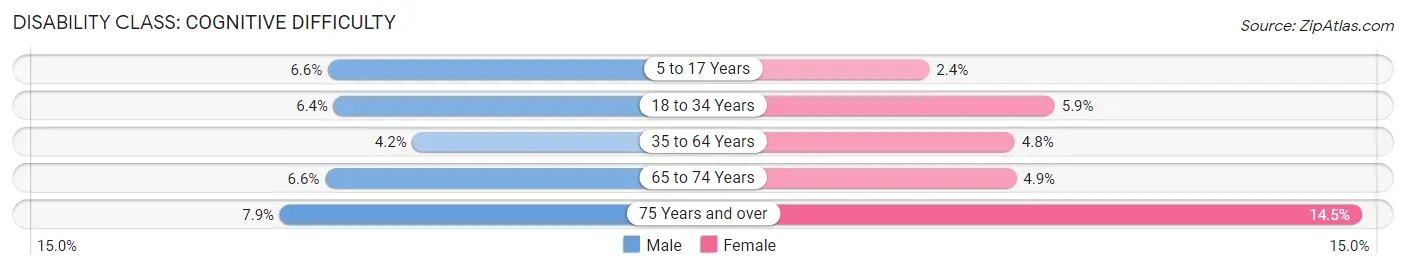
| Age Bracket | Male | Female |
| 5 to 17 Years | 878 (6.6%) | 307 (2.4%) |
| 18 to 34 Years | 930 (6.4%) | 864 (5.9%) |
| 35 to 64 Years | 1,276 (4.2%) | 1,485 (4.8%) |
| 65 to 74 Years | 444 (6.6%) | 372 (4.9%) |
| 75 Years and over | 296 (7.9%) | 707 (14.5%) |
Disability Class: Ambulatory Difficulty
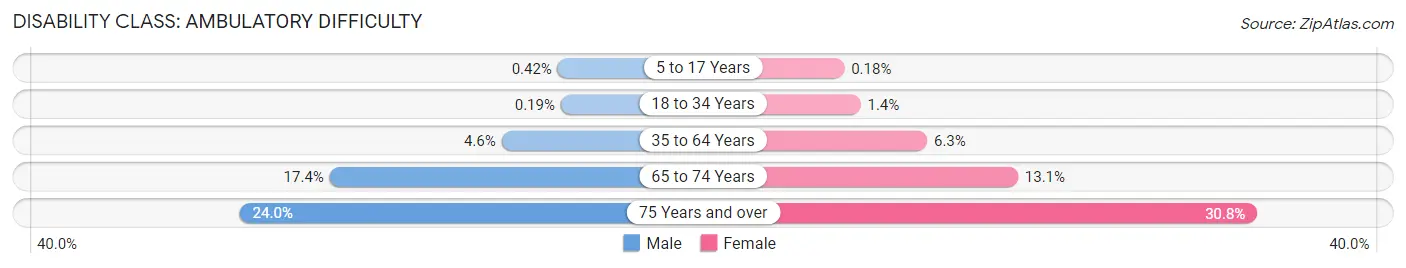
| Age Bracket | Male | Female |
| 5 to 17 Years | 56 (0.4%) | 22 (0.2%) |
| 18 to 34 Years | 28 (0.2%) | 202 (1.4%) |
| 35 to 64 Years | 1,393 (4.6%) | 1,951 (6.3%) |
| 65 to 74 Years | 1,162 (17.3%) | 1,001 (13.1%) |
| 75 Years and over | 901 (24.0%) | 1,507 (30.8%) |
Disability Class: Self-Care Difficulty
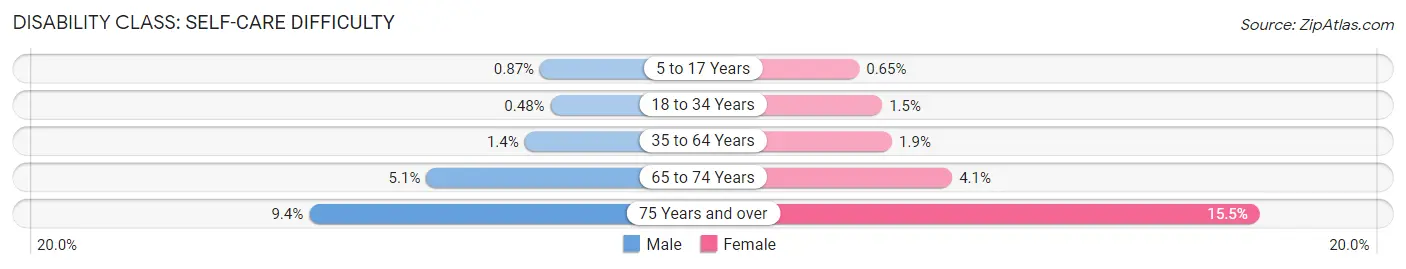
| Age Bracket | Male | Female |
| 5 to 17 Years | 116 (0.9%) | 82 (0.6%) |
| 18 to 34 Years | 70 (0.5%) | 218 (1.5%) |
| 35 to 64 Years | 436 (1.4%) | 576 (1.9%) |
| 65 to 74 Years | 341 (5.1%) | 314 (4.1%) |
| 75 Years and over | 354 (9.4%) | 758 (15.5%) |
Technology Access in Wilson County
Computing Device Access in Wilson County
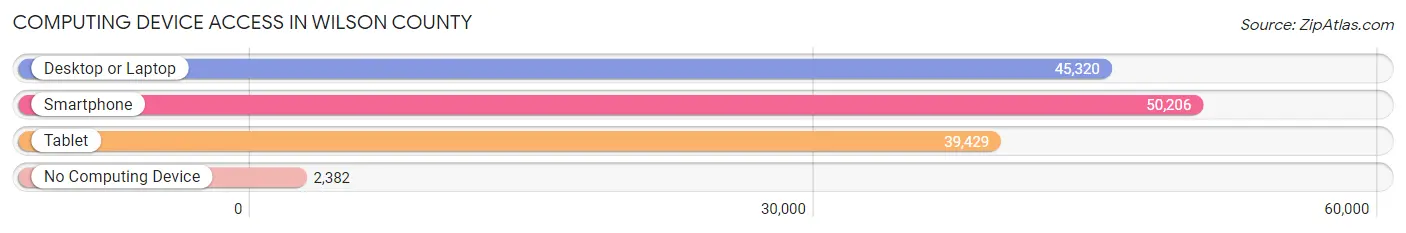
| Device Type | # Households | % Households |
| Desktop or Laptop | 45,320 | 82.3% |
| Smartphone | 50,206 | 91.2% |
| Tablet | 39,429 | 71.6% |
| No Computing Device | 2,382 | 4.3% |
| Total | 55,037 | 100.0% |
Internet Access in Wilson County
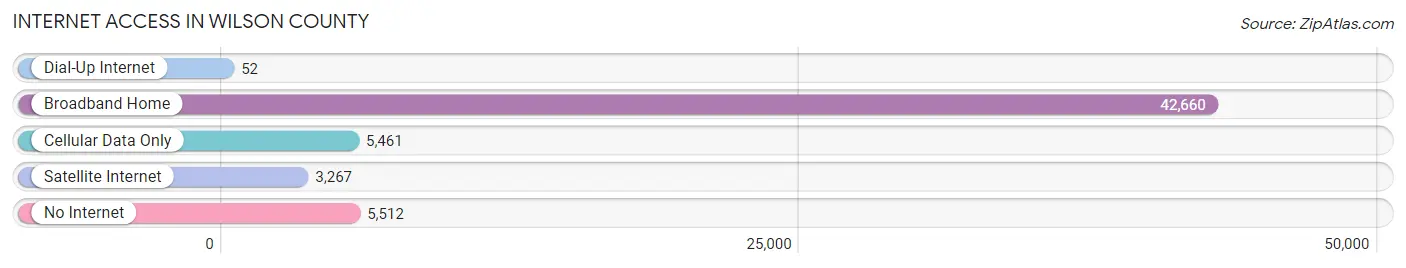
| Internet Type | # Households | % Households |
| Dial-Up Internet | 52 | 0.1% |
| Broadband Home | 42,660 | 77.5% |
| Cellular Data Only | 5,461 | 9.9% |
| Satellite Internet | 3,267 | 5.9% |
| No Internet | 5,512 | 10.0% |
| Total | 55,037 | 100.0% |
Wilson County Summary
Wilson County is located in the state of Tennessee in the United States. It is located in the central part of the state and is bordered by Davidson, Rutherford, Smith, Trousdale, Sumner, and Williamson counties. The county seat is Lebanon, and the largest city is Mt. Juliet. The county was established in 1799 and named for Major David Wilson, a Revolutionary War veteran.
Geography
Wilson County is located in the central part of Tennessee and is bordered by Davidson, Rutherford, Smith, Trousdale, Sumner, and Williamson counties. The county has a total area of 517 square miles, of which 514 square miles is land and 3 square miles is water. The county is located in the Nashville Metropolitan Statistical Area. The terrain is mostly rolling hills and valleys, with some flat areas in the northern part of the county. The Cumberland River forms the northern border of the county.
Demographics
As of the 2010 census, the population of Wilson County was 113,993, an increase of 17.3% since 2000. The population density was 221 people per square mile. The racial makeup of the county was 87.3% White, 8.2% African American, 0.5% Native American, 1.7% Asian, 0.1% Pacific Islander, 1.2% from other races, and 1.1% from two or more races. Hispanic or Latino of any race were 3.2% of the population.
The median income for a household in the county was $50,837, and the median income for a family was $60,817. The per capita income for the county was $25,845. About 8.2% of families and 10.7% of the population were below the poverty line, including 14.2% of those under age 18 and 8.2% of those age 65 or over.
Economy
Wilson County has a diverse economy, with a mix of manufacturing, retail, and service industries. The largest employers in the county are the Wilson County School System, Cracker Barrel Old Country Store, and Wilson County Government. Other major employers include Wilson Bank & Trust, Wilson Medical Center, and Wilson County Motors.
Agriculture is also an important part of the economy, with corn, soybeans, and hay being the main crops. Livestock production is also important, with beef cattle, dairy cattle, and poultry being the main types of livestock.
The county is also home to several tourist attractions, including the Cedars of Lebanon State Park, the Wilson County Fairgrounds, and the Wilson County Museum.
History
Wilson County was established in 1799 and named for Major David Wilson, a Revolutionary War veteran. The county was originally part of Sumner County, but was split off in 1802. The county seat was originally located in Watertown, but was moved to Lebanon in 1810.
The county was largely rural until the late 19th century, when the railroad was built through the county. This led to the development of several small towns, including Mt. Juliet, Watertown, and Lebanon. The county continued to grow in the 20th century, with the population increasing from around 10,000 in 1900 to over 100,000 in 2010.
Conclusion
Wilson County is a diverse county located in the central part of Tennessee. It has a mix of manufacturing, retail, and service industries, as well as a strong agricultural sector. The county has a rich history, dating back to its establishment in 1799, and has seen significant population growth in the last century. Wilson County is a great place to live, work, and visit.
Common Questions
What is the Total Population of Wilson County?
Total Population of Wilson County is 149,096.
What is the Total Male Population of Wilson County?
Total Male Population of Wilson County is 73,809.
What is the Total Female Population of Wilson County?
Total Female Population of Wilson County is 75,287.
What is the Ratio of Males per 100 Females in Wilson County?
There are 98.04 Males per 100 Females in Wilson County.
What is the Ratio of Females per 100 Males in Wilson County?
There are 102.00 Females per 100 Males in Wilson County.
What is the Median Population Age in Wilson County?
Median Population Age in Wilson County is 40.0 Years.
What is the Average Family Size in Wilson County
Average Family Size in Wilson County is 3.1 People.
What is the Average Household Size in Wilson County
Average Household Size in Wilson County is 2.7 People.
What is Per Capita Income in Wilson County?
Per Capita income in Wilson County is $42,978.
What is the Median Family Income in Wilson County?
Median Family Income in Wilson County is $105,191.
What is the Median Household income in Wilson County?
Median Household Income in Wilson County is $89,462.
What is Income or Wage Gap in Wilson County?
Income or Wage Gap in Wilson County is 31.3%.
Women in Wilson County earn 68.7 cents for every dollar earned by a man.
What is Family Income Deficit in Wilson County?
Family Income Deficit in Wilson County is $12,201.
Families that are below poverty line in Wilson County earn $12,201 less on average than the poverty threshold level.
What is Inequality or Gini Index in Wilson County?
Inequality or Gini Index in Wilson County is 0.43.
How Large is the Labor Force in Wilson County?
There are 77,598 People in the Labor Forcein in Wilson County.
What is the Percentage of People in the Labor Force in Wilson County?
65.5% of People are in the Labor Force in Wilson County.
What is the Unemployment Rate in Wilson County?
Unemployment Rate in Wilson County is 3.7%.