Williamson County, TN
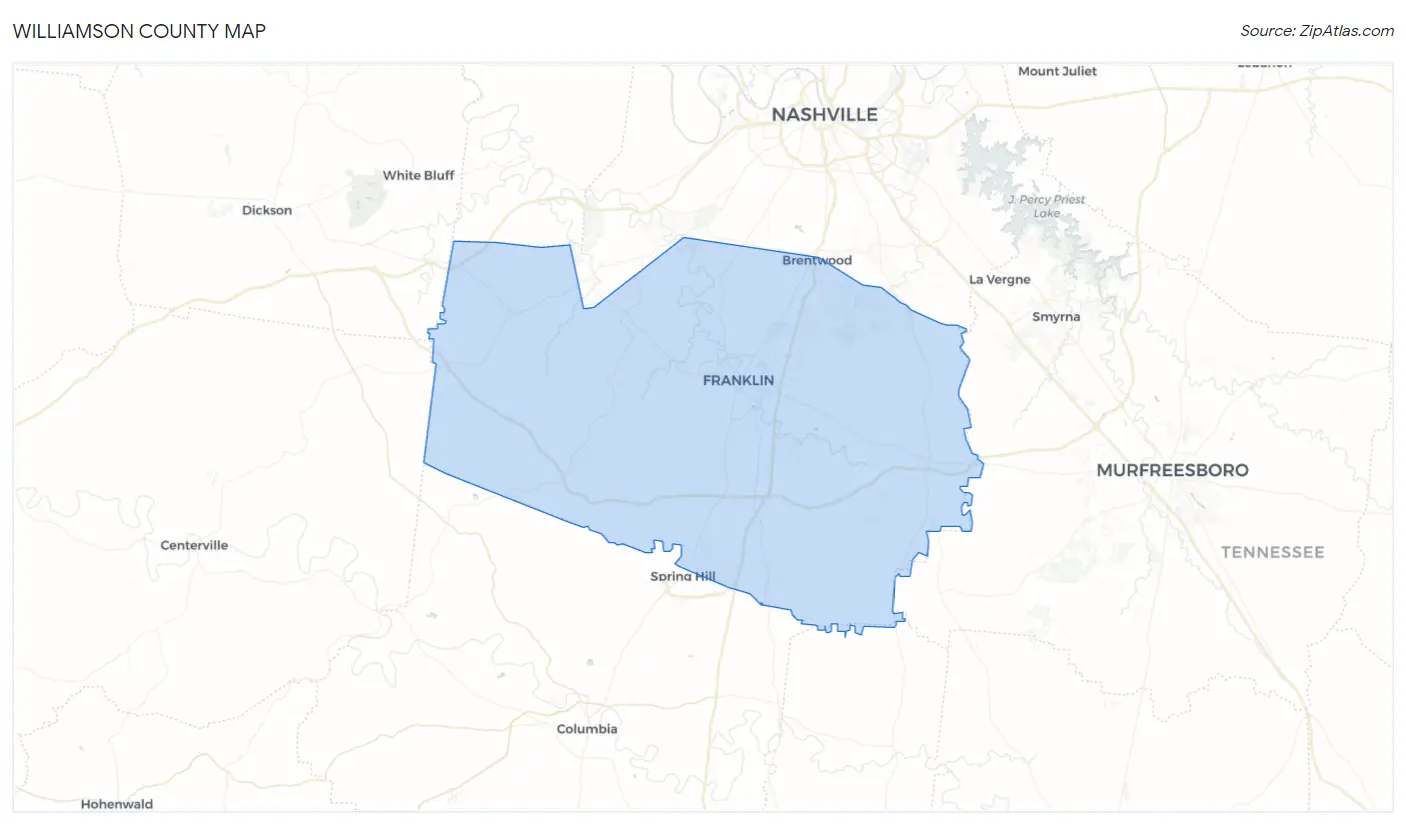
Williamson County Map
Williamson County Overview
248,897
TOTAL POPULATION
123,066
MALE POPULATION
125,831
FEMALE POPULATION
97.80
MALES / 100 FEMALES
102.25
FEMALES / 100 MALES
40.0
MEDIAN AGE
3.2
AVG FAMILY SIZE
2.8
AVG HOUSEHOLD SIZE
$61,451
PER CAPITA INCOME
$145,896
AVG FAMILY INCOME
$125,943
AVG HOUSEHOLD INCOME
47.9%
WAGE / INCOME GAP [ % ]
52.1¢/ $1
WAGE / INCOME GAP [ $ ]
0.45
INEQUALITY / GINI INDEX
130,307
LABOR FORCE [ PEOPLE ]
67.8%
PERCENT IN LABOR FORCE
2.1%
UNEMPLOYMENT RATE
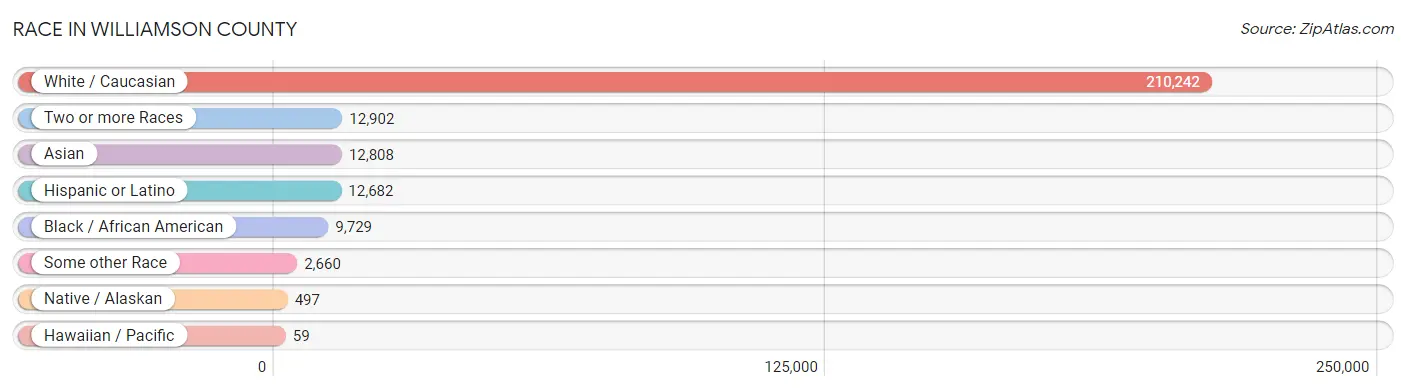
Race in Williamson County
The most populous races in Williamson County are White / Caucasian (210,242 | 84.5%), Two or more Races (12,902 | 5.2%), and Asian (12,808 | 5.1%).
| Race | # Population | % Population |
| Asian | 12,808 | 5.1% |
| Black / African American | 9,729 | 3.9% |
| Hawaiian / Pacific | 59 | 0.0% |
| Hispanic or Latino | 12,682 | 5.1% |
| Native / Alaskan | 497 | 0.2% |
| White / Caucasian | 210,242 | 84.5% |
| Two or more Races | 12,902 | 5.2% |
| Some other Race | 2,660 | 1.1% |
| Total | 248,897 | 100.0% |
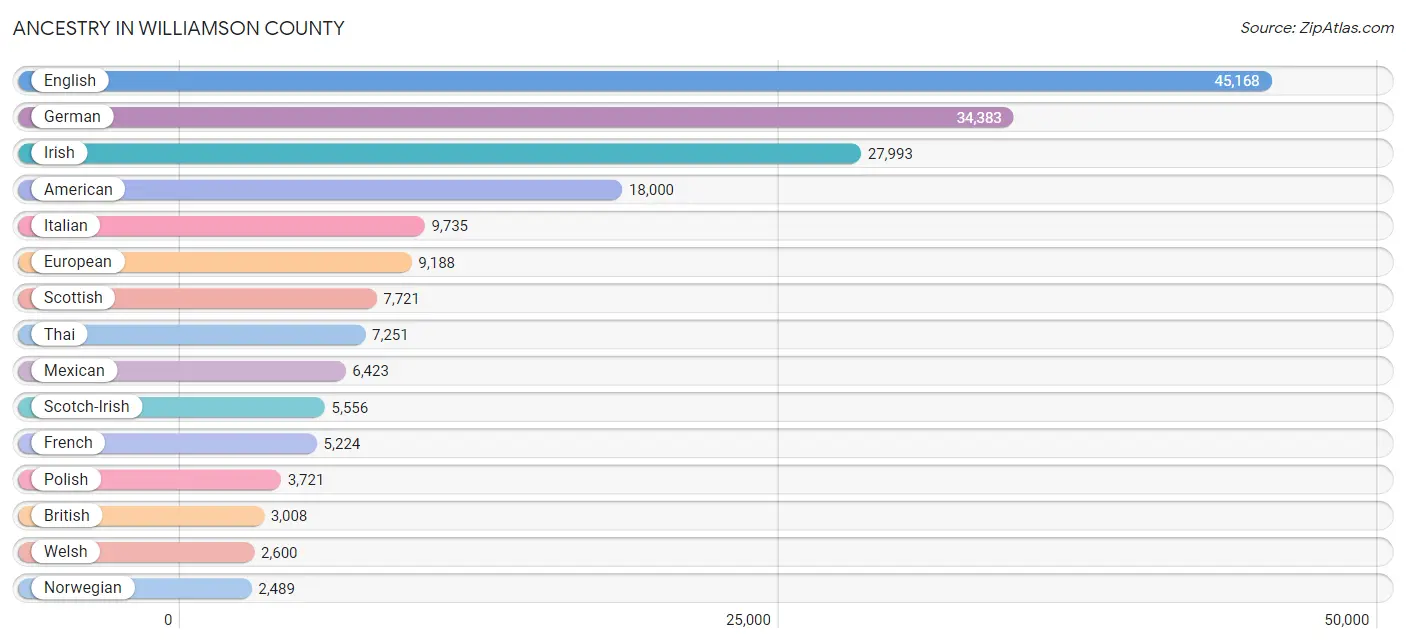
Ancestry in Williamson County
The most populous ancestries reported in Williamson County are English (45,168 | 18.1%), German (34,383 | 13.8%), Irish (27,993 | 11.3%), American (18,000 | 7.2%), and Italian (9,735 | 3.9%), together accounting for 54.3% of all Williamson County residents.
| Ancestry | # Population | % Population |
| Afghan | 47 | 0.0% |
| African | 416 | 0.2% |
| Albanian | 71 | 0.0% |
| Aleut | 20 | 0.0% |
| American | 18,000 | 7.2% |
| Apache | 1 | 0.0% |
| Arab | 1,408 | 0.6% |
| Argentinean | 27 | 0.0% |
| Armenian | 210 | 0.1% |
| Australian | 51 | 0.0% |
| Austrian | 287 | 0.1% |
| Belgian | 372 | 0.2% |
| Bhutanese | 694 | 0.3% |
| Blackfeet | 19 | 0.0% |
| Bolivian | 32 | 0.0% |
| Brazilian | 217 | 0.1% |
| British | 3,008 | 1.2% |
| British West Indian | 56 | 0.0% |
| Bulgarian | 55 | 0.0% |
| Burmese | 1,570 | 0.6% |
| Cajun | 54 | 0.0% |
| Cambodian | 113 | 0.1% |
| Canadian | 768 | 0.3% |
| Cape Verdean | 49 | 0.0% |
| Celtic | 14 | 0.0% |
| Central American | 1,760 | 0.7% |
| Central American Indian | 57 | 0.0% |
| Cherokee | 861 | 0.4% |
| Chilean | 156 | 0.1% |
| Chippewa | 21 | 0.0% |
| Choctaw | 39 | 0.0% |
| Colombian | 488 | 0.2% |
| Costa Rican | 134 | 0.1% |
| Croatian | 255 | 0.1% |
| Cuban | 694 | 0.3% |
| Czech | 848 | 0.3% |
| Czechoslovakian | 274 | 0.1% |
| Danish | 817 | 0.3% |
| Dominican | 81 | 0.0% |
| Dutch | 2,314 | 0.9% |
| Dutch West Indian | 35 | 0.0% |
| Eastern European | 624 | 0.3% |
| Ecuadorian | 24 | 0.0% |
| Egyptian | 196 | 0.1% |
| English | 45,168 | 18.1% |
| Estonian | 34 | 0.0% |
| Ethiopian | 298 | 0.1% |
| European | 9,188 | 3.7% |
| Filipino | 117 | 0.1% |
| Finnish | 380 | 0.2% |
| French | 5,224 | 2.1% |
| French American Indian | 29 | 0.0% |
| French Canadian | 593 | 0.2% |
| German | 34,383 | 13.8% |
| Ghanaian | 10 | 0.0% |
| Greek | 808 | 0.3% |
| Guamanian / Chamorro | 32 | 0.0% |
| Guatemalan | 178 | 0.1% |
| Haitian | 56 | 0.0% |
| Honduran | 968 | 0.4% |
| Hungarian | 716 | 0.3% |
| Icelander | 149 | 0.1% |
| Indian (Asian) | 2,402 | 1.0% |
| Iranian | 616 | 0.3% |
| Iraqi | 272 | 0.1% |
| Irish | 27,993 | 11.3% |
| Iroquois | 2 | 0.0% |
| Italian | 9,735 | 3.9% |
| Jamaican | 23 | 0.0% |
| Korean | 1,262 | 0.5% |
| Laotian | 28 | 0.0% |
| Latvian | 245 | 0.1% |
| Lebanese | 685 | 0.3% |
| Lithuanian | 798 | 0.3% |
| Luxembourger | 15 | 0.0% |
| Macedonian | 71 | 0.0% |
| Malaysian | 162 | 0.1% |
| Maltese | 43 | 0.0% |
| Mexican | 6,423 | 2.6% |
| Mexican American Indian | 115 | 0.1% |
| Mongolian | 191 | 0.1% |
| Native Hawaiian | 40 | 0.0% |
| New Zealander | 26 | 0.0% |
| Nicaraguan | 188 | 0.1% |
| Nigerian | 109 | 0.0% |
| Northern European | 525 | 0.2% |
| Norwegian | 2,489 | 1.0% |
| Okinawan | 5 | 0.0% |
| Pakistani | 45 | 0.0% |
| Palestinian | 66 | 0.0% |
| Panamanian | 141 | 0.1% |
| Paraguayan | 85 | 0.0% |
| Pennsylvania German | 7 | 0.0% |
| Peruvian | 129 | 0.1% |
| Polish | 3,721 | 1.5% |
| Portuguese | 371 | 0.2% |
| Potawatomi | 13 | 0.0% |
| Puerto Rican | 1,065 | 0.4% |
| Romanian | 281 | 0.1% |
| Russian | 1,298 | 0.5% |
| Salvadoran | 143 | 0.1% |
| Samoan | 41 | 0.0% |
| Scandinavian | 872 | 0.4% |
| Scotch-Irish | 5,556 | 2.2% |
| Scottish | 7,721 | 3.1% |
| Serbian | 74 | 0.0% |
| Sioux | 2 | 0.0% |
| Slavic | 10 | 0.0% |
| Slovak | 322 | 0.1% |
| Slovene | 97 | 0.0% |
| South African | 270 | 0.1% |
| South American | 1,527 | 0.6% |
| South American Indian | 80 | 0.0% |
| Spaniard | 307 | 0.1% |
| Spanish | 388 | 0.2% |
| Sri Lankan | 720 | 0.3% |
| Subsaharan African | 1,183 | 0.5% |
| Swedish | 2,293 | 0.9% |
| Swiss | 738 | 0.3% |
| Syrian | 49 | 0.0% |
| Thai | 7,251 | 2.9% |
| Tlingit-Haida | 8 | 0.0% |
| Turkish | 105 | 0.0% |
| Ukrainian | 488 | 0.2% |
| Venezuelan | 586 | 0.2% |
| Welsh | 2,600 | 1.0% |
| Yugoslavian | 40 | 0.0% | View All 127 Rows |
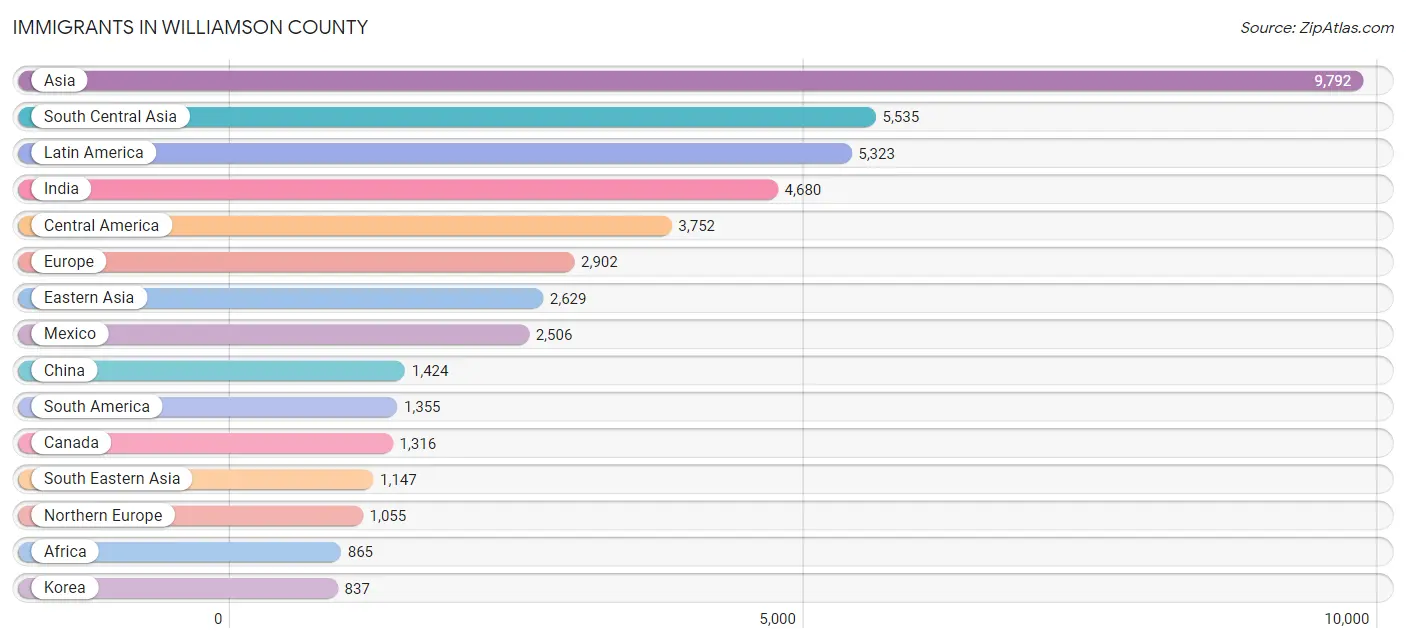
Immigrants in Williamson County
The most numerous immigrant groups reported in Williamson County came from Asia (9,792 | 3.9%), South Central Asia (5,535 | 2.2%), Latin America (5,323 | 2.1%), India (4,680 | 1.9%), and Central America (3,752 | 1.5%), together accounting for 11.7% of all Williamson County residents.
| Immigration Origin | # Population | % Population |
| Afghanistan | 42 | 0.0% |
| Africa | 865 | 0.4% |
| Albania | 25 | 0.0% |
| Asia | 9,792 | 3.9% |
| Australia | 77 | 0.0% |
| Austria | 31 | 0.0% |
| Belgium | 96 | 0.0% |
| Bosnia and Herzegovina | 19 | 0.0% |
| Brazil | 317 | 0.1% |
| Bulgaria | 31 | 0.0% |
| Canada | 1,316 | 0.5% |
| Caribbean | 216 | 0.1% |
| Central America | 3,752 | 1.5% |
| Chile | 155 | 0.1% |
| China | 1,424 | 0.6% |
| Colombia | 220 | 0.1% |
| Costa Rica | 145 | 0.1% |
| Cuba | 71 | 0.0% |
| Czechoslovakia | 17 | 0.0% |
| Dominican Republic | 23 | 0.0% |
| Eastern Africa | 270 | 0.1% |
| Eastern Asia | 2,629 | 1.1% |
| Eastern Europe | 799 | 0.3% |
| Egypt | 145 | 0.1% |
| El Salvador | 154 | 0.1% |
| England | 458 | 0.2% |
| Eritrea | 7 | 0.0% |
| Ethiopia | 198 | 0.1% |
| Europe | 2,902 | 1.2% |
| France | 159 | 0.1% |
| Germany | 477 | 0.2% |
| Ghana | 10 | 0.0% |
| Greece | 27 | 0.0% |
| Guatemala | 212 | 0.1% |
| Haiti | 56 | 0.0% |
| Honduras | 692 | 0.3% |
| Hong Kong | 12 | 0.0% |
| Hungary | 29 | 0.0% |
| India | 4,680 | 1.9% |
| Indonesia | 81 | 0.0% |
| Iran | 520 | 0.2% |
| Iraq | 261 | 0.1% |
| Ireland | 36 | 0.0% |
| Israel | 13 | 0.0% |
| Italy | 150 | 0.1% |
| Jamaica | 10 | 0.0% |
| Japan | 310 | 0.1% |
| Kazakhstan | 16 | 0.0% |
| Kenya | 37 | 0.0% |
| Korea | 837 | 0.3% |
| Kuwait | 35 | 0.0% |
| Laos | 52 | 0.0% |
| Latin America | 5,323 | 2.1% |
| Latvia | 44 | 0.0% |
| Lebanon | 44 | 0.0% |
| Lithuania | 7 | 0.0% |
| Malaysia | 39 | 0.0% |
| Mexico | 2,506 | 1.0% |
| Middle Africa | 8 | 0.0% |
| Moldova | 59 | 0.0% |
| Nepal | 165 | 0.1% |
| Netherlands | 17 | 0.0% |
| Nicaragua | 10 | 0.0% |
| Nigeria | 84 | 0.0% |
| Northern Africa | 145 | 0.1% |
| Northern Europe | 1,055 | 0.4% |
| Oceania | 138 | 0.1% |
| Pakistan | 94 | 0.0% |
| Panama | 33 | 0.0% |
| Peru | 113 | 0.1% |
| Philippines | 527 | 0.2% |
| Poland | 119 | 0.1% |
| Portugal | 48 | 0.0% |
| Romania | 76 | 0.0% |
| Russia | 223 | 0.1% |
| Scotland | 23 | 0.0% |
| Serbia | 32 | 0.0% |
| Singapore | 5 | 0.0% |
| South Africa | 247 | 0.1% |
| South America | 1,355 | 0.5% |
| South Central Asia | 5,535 | 2.2% |
| South Eastern Asia | 1,147 | 0.5% |
| Southern Europe | 248 | 0.1% |
| Spain | 23 | 0.0% |
| Sri Lanka | 18 | 0.0% |
| Sweden | 46 | 0.0% |
| Switzerland | 20 | 0.0% |
| Taiwan | 155 | 0.1% |
| Thailand | 24 | 0.0% |
| Turkey | 71 | 0.0% |
| Ukraine | 36 | 0.0% |
| Venezuela | 530 | 0.2% |
| Vietnam | 419 | 0.2% |
| Western Africa | 195 | 0.1% |
| Western Asia | 461 | 0.2% |
| Western Europe | 800 | 0.3% |
| Zaire | 8 | 0.0% | View All 97 Rows |
Sex and Age in Williamson County
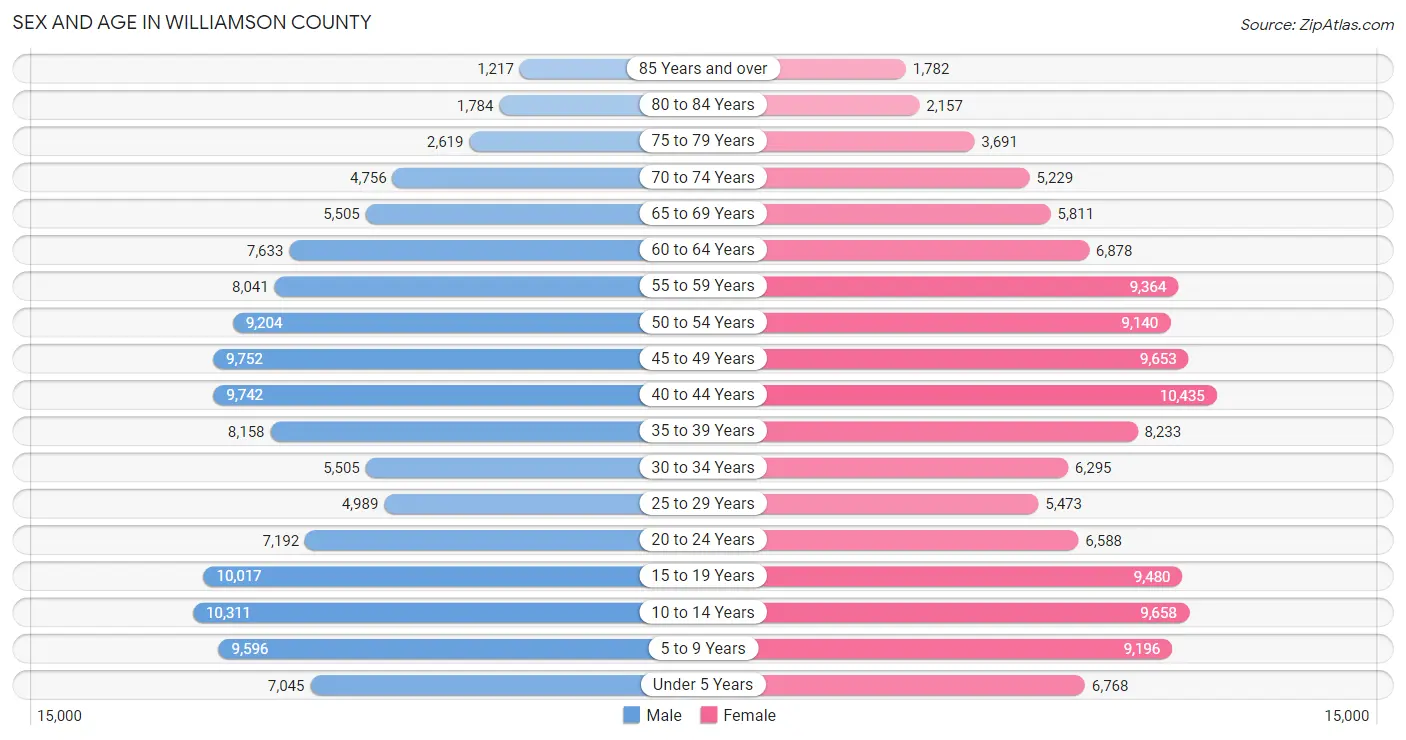
Sex and Age in Williamson County
The most populous age groups in Williamson County are 10 to 14 Years (10,311 | 8.4%) for men and 40 to 44 Years (10,435 | 8.3%) for women.
| Age Bracket | Male | Female |
| Under 5 Years | 7,045 (5.7%) | 6,768 (5.4%) |
| 5 to 9 Years | 9,596 (7.8%) | 9,196 (7.3%) |
| 10 to 14 Years | 10,311 (8.4%) | 9,658 (7.7%) |
| 15 to 19 Years | 10,017 (8.1%) | 9,480 (7.5%) |
| 20 to 24 Years | 7,192 (5.8%) | 6,588 (5.2%) |
| 25 to 29 Years | 4,989 (4.1%) | 5,473 (4.3%) |
| 30 to 34 Years | 5,505 (4.5%) | 6,295 (5.0%) |
| 35 to 39 Years | 8,158 (6.6%) | 8,233 (6.5%) |
| 40 to 44 Years | 9,742 (7.9%) | 10,435 (8.3%) |
| 45 to 49 Years | 9,752 (7.9%) | 9,653 (7.7%) |
| 50 to 54 Years | 9,204 (7.5%) | 9,140 (7.3%) |
| 55 to 59 Years | 8,041 (6.5%) | 9,364 (7.4%) |
| 60 to 64 Years | 7,633 (6.2%) | 6,878 (5.5%) |
| 65 to 69 Years | 5,505 (4.5%) | 5,811 (4.6%) |
| 70 to 74 Years | 4,756 (3.9%) | 5,229 (4.2%) |
| 75 to 79 Years | 2,619 (2.1%) | 3,691 (2.9%) |
| 80 to 84 Years | 1,784 (1.5%) | 2,157 (1.7%) |
| 85 Years and over | 1,217 (1.0%) | 1,782 (1.4%) |
| Total | 123,066 (100.0%) | 125,831 (100.0%) |
Families and Households in Williamson County
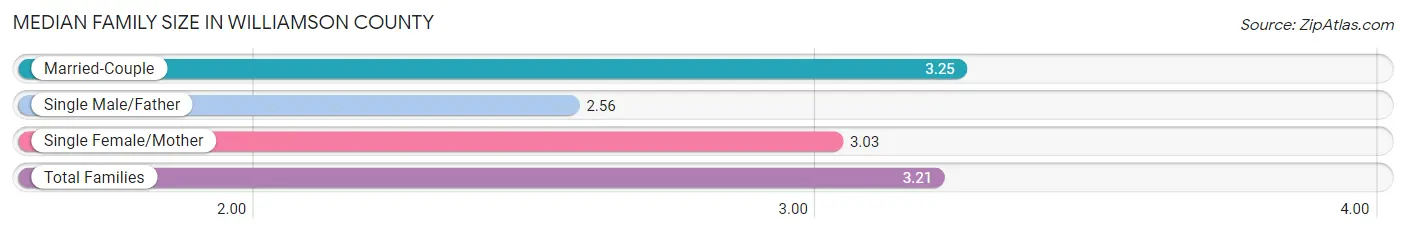
Median Family Size in Williamson County
The median family size in Williamson County is 3.21 persons per family, with married-couple families (60,432 | 87.4%) accounting for the largest median family size of 3.25 persons per family. On the other hand, single male/father families (2,001 | 2.9%) represent the smallest median family size with 2.56 persons per family.
| Family Type | # Families | Family Size |
| Married-Couple | 60,432 (87.4%) | 3.25 |
| Single Male/Father | 2,001 (2.9%) | 2.56 |
| Single Female/Mother | 6,730 (9.7%) | 3.03 |
| Total Families | 69,163 (100.0%) | 3.21 |
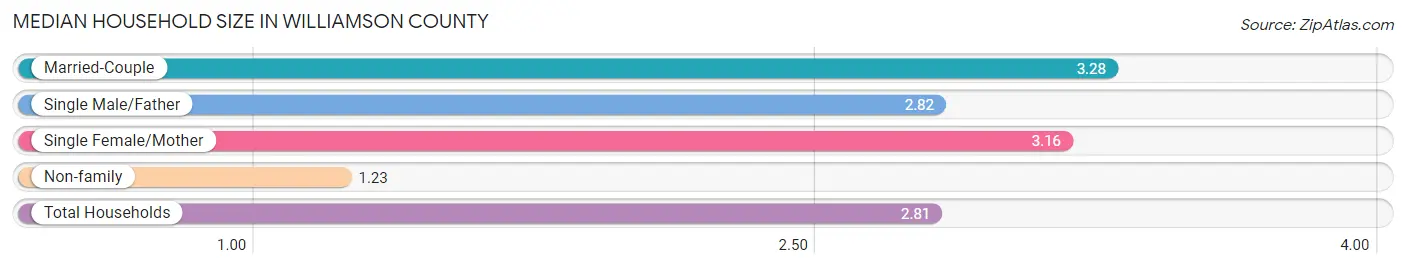
Median Household Size in Williamson County
The median household size in Williamson County is 2.81 persons per household, with married-couple households (60,432 | 68.5%) accounting for the largest median household size of 3.28 persons per household. non-family households (19,075 | 21.6%) represent the smallest median household size with 1.23 persons per household.
| Household Type | # Households | Household Size |
| Married-Couple | 60,432 (68.5%) | 3.28 |
| Single Male/Father | 2,001 (2.3%) | 2.82 |
| Single Female/Mother | 6,730 (7.6%) | 3.16 |
| Non-family | 19,075 (21.6%) | 1.23 |
| Total Households | 88,238 (100.0%) | 2.81 |
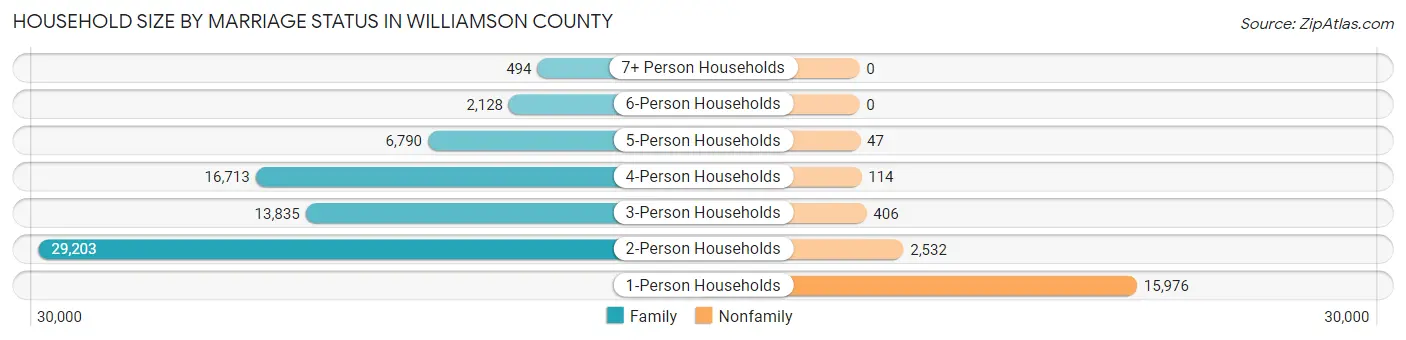
Household Size by Marriage Status in Williamson County
Out of a total of 88,238 households in Williamson County, 69,163 (78.4%) are family households, while 19,075 (21.6%) are nonfamily households. The most numerous type of family households are 2-person households, comprising 29,203, and the most common type of nonfamily households are 1-person households, comprising 15,976.
| Household Size | Family Households | Nonfamily Households |
| 1-Person Households | - | 15,976 (18.1%) |
| 2-Person Households | 29,203 (33.1%) | 2,532 (2.9%) |
| 3-Person Households | 13,835 (15.7%) | 406 (0.5%) |
| 4-Person Households | 16,713 (18.9%) | 114 (0.1%) |
| 5-Person Households | 6,790 (7.7%) | 47 (0.1%) |
| 6-Person Households | 2,128 (2.4%) | 0 (0.0%) |
| 7+ Person Households | 494 (0.6%) | 0 (0.0%) |
| Total | 69,163 (78.4%) | 19,075 (21.6%) |
Female Fertility in Williamson County
Fertility by Age in Williamson County
Average fertility rate in Williamson County is 50.0 births per 1,000 women. Women in the age bracket of 20 to 34 years have the highest fertility rate with 102.0 births per 1,000 women. Women in the age bracket of 20 to 34 years acount for 64.5% of all women with births.
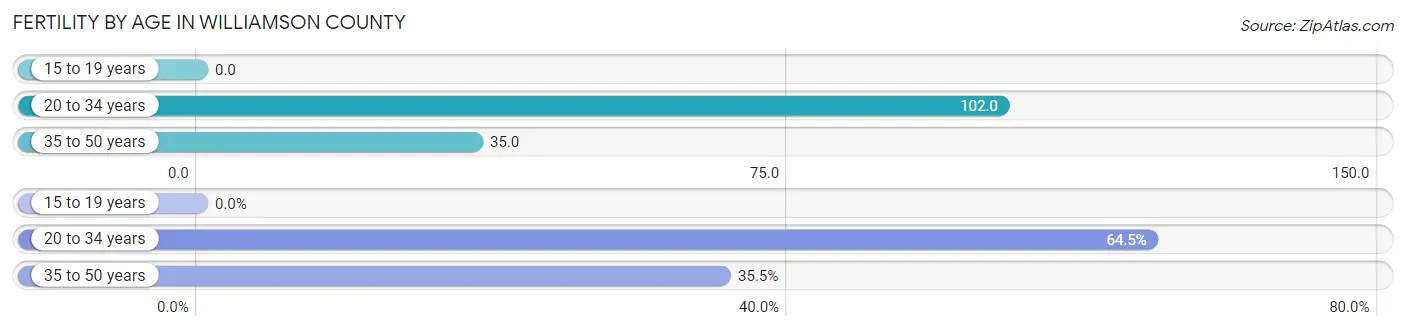
| Age Bracket | Women with Births | Births / 1,000 Women |
| 15 to 19 years | 0 (0.0%) | 0.0 |
| 20 to 34 years | 1,868 (64.5%) | 102.0 |
| 35 to 50 years | 1,028 (35.5%) | 35.0 |
| Total | 2,896 (100.0%) | 50.0 |
Fertility by Age by Marriage Status in Williamson County
89.1% of women with births (2,896) in Williamson County are married. The highest percentage of unmarried women with births falls into 20 to 34 years age bracket with 16.4% of them unmarried at the time of birth, while the lowest percentage of unmarried women with births belong to 35 to 50 years age bracket with 0.9% of them unmarried.
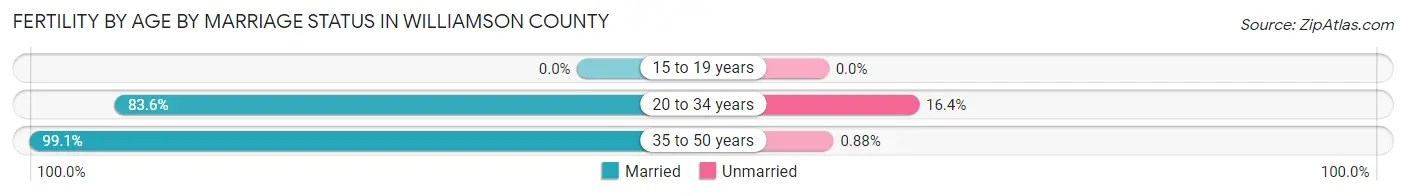
| Age Bracket | Married | Unmarried |
| 15 to 19 years | 0 (0.0%) | 0 (0.0%) |
| 20 to 34 years | 1,562 (83.6%) | 306 (16.4%) |
| 35 to 50 years | 1,019 (99.1%) | 9 (0.9%) |
| Total | 2,580 (89.1%) | 316 (10.9%) |
Fertility by Education in Williamson County
Average fertility rate in Williamson County is 50.0 births per 1,000 women. Women with the education attainment of graduate degree have the highest fertility rate of 95.0 births per 1,000 women, while women with the education attainment of less than high school have the lowest fertility at 4.0 births per 1,000 women. Women with the education attainment of bachelor's degree represent 38.2% of all women with births.
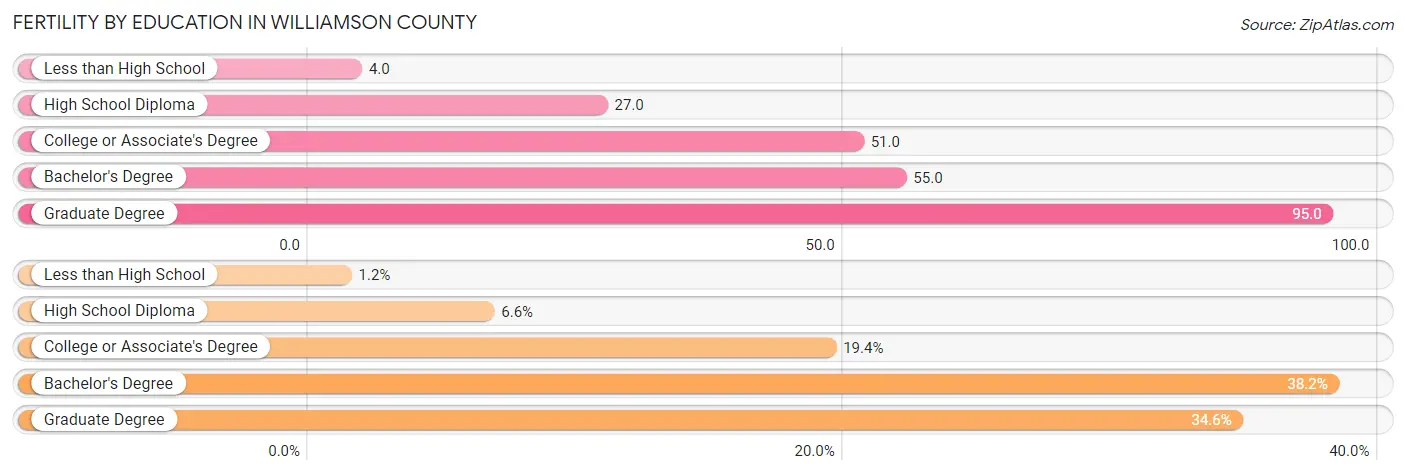
| Educational Attainment | Women with Births | Births / 1,000 Women |
| Less than High School | 35 (1.2%) | 4.0 |
| High School Diploma | 190 (6.6%) | 27.0 |
| College or Associate's Degree | 561 (19.4%) | 51.0 |
| Bachelor's Degree | 1,107 (38.2%) | 55.0 |
| Graduate Degree | 1,003 (34.6%) | 95.0 |
| Total | 2,896 (100.0%) | 50.0 |
Fertility by Education by Marriage Status in Williamson County
10.9% of women with births in Williamson County are unmarried. Women with the educational attainment of less than high school are most likely to be married with 100.0% of them married at childbirth, while women with the educational attainment of high school diploma are least likely to be married with 43.7% of them unmarried at childbirth.
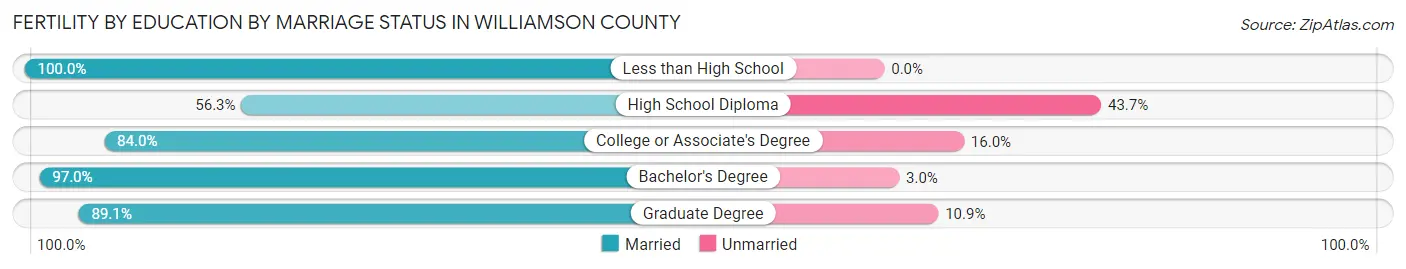
| Educational Attainment | Married | Unmarried |
| Less than High School | 35 (100.0%) | 0 (0.0%) |
| High School Diploma | 107 (56.3%) | 83 (43.7%) |
| College or Associate's Degree | 471 (84.0%) | 90 (16.0%) |
| Bachelor's Degree | 1,074 (97.0%) | 33 (3.0%) |
| Graduate Degree | 894 (89.1%) | 109 (10.9%) |
| Total | 2,580 (89.1%) | 316 (10.9%) |
Income in Williamson County
Income Overview in Williamson County
Per Capita Income in Williamson County is $61,451, while median incomes of families and households are $145,896 and $125,943 respectively.
| Characteristic | Number | Measure |
| Per Capita Income | 248,897 | $61,451 |
| Median Family Income | 69,163 | $145,896 |
| Mean Family Income | 69,163 | $191,966 |
| Median Household Income | 88,238 | $125,943 |
| Mean Household Income | 88,238 | $169,404 |
| Income Deficit | 69,163 | $0 |
| Wage / Income Gap (%) | 248,897 | 47.92% |
| Wage / Income Gap ($) | 248,897 | 52.08¢ per $1 |
| Gini / Inequality Index | 248,897 | 0.45 |
Earnings by Sex in Williamson County
Average Earnings in Williamson County are $59,178, $83,797 for men and $43,642 for women, a difference of 47.9%.
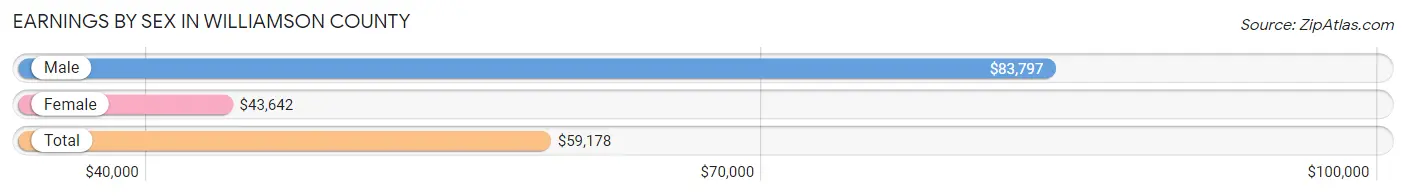
| Sex | Number | Average Earnings |
| Male | 74,672 (54.2%) | $83,797 |
| Female | 63,180 (45.8%) | $43,642 |
| Total | 137,852 (100.0%) | $59,178 |
Earnings by Sex by Income Bracket in Williamson County
The most common earnings brackets in Williamson County are $100,000+ for men (31,560 | 42.3%) and $100,000+ for women (10,968 | 17.4%).
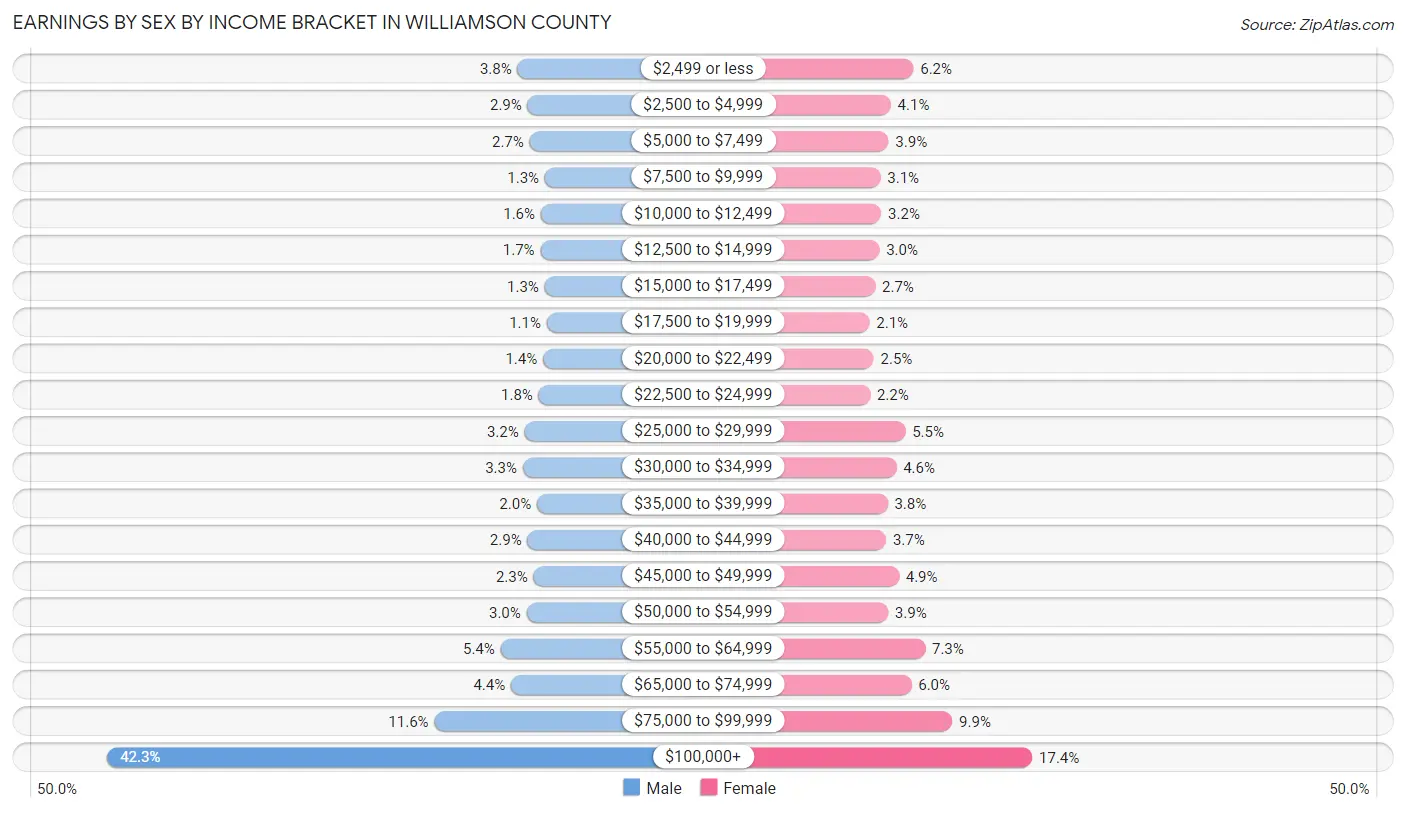
| Income | Male | Female |
| $2,499 or less | 2,854 (3.8%) | 3,935 (6.2%) |
| $2,500 to $4,999 | 2,154 (2.9%) | 2,595 (4.1%) |
| $5,000 to $7,499 | 2,011 (2.7%) | 2,463 (3.9%) |
| $7,500 to $9,999 | 939 (1.3%) | 1,983 (3.1%) |
| $10,000 to $12,499 | 1,223 (1.6%) | 2,036 (3.2%) |
| $12,500 to $14,999 | 1,251 (1.7%) | 1,921 (3.0%) |
| $15,000 to $17,499 | 953 (1.3%) | 1,677 (2.6%) |
| $17,500 to $19,999 | 807 (1.1%) | 1,335 (2.1%) |
| $20,000 to $22,499 | 1,071 (1.4%) | 1,587 (2.5%) |
| $22,500 to $24,999 | 1,371 (1.8%) | 1,372 (2.2%) |
| $25,000 to $29,999 | 2,369 (3.2%) | 3,459 (5.5%) |
| $30,000 to $34,999 | 2,488 (3.3%) | 2,927 (4.6%) |
| $35,000 to $39,999 | 1,496 (2.0%) | 2,409 (3.8%) |
| $40,000 to $44,999 | 2,156 (2.9%) | 2,318 (3.7%) |
| $45,000 to $49,999 | 1,731 (2.3%) | 3,078 (4.9%) |
| $50,000 to $54,999 | 2,220 (3.0%) | 2,435 (3.8%) |
| $55,000 to $64,999 | 4,043 (5.4%) | 4,633 (7.3%) |
| $65,000 to $74,999 | 3,308 (4.4%) | 3,816 (6.0%) |
| $75,000 to $99,999 | 8,667 (11.6%) | 6,233 (9.9%) |
| $100,000+ | 31,560 (42.3%) | 10,968 (17.4%) |
| Total | 74,672 (100.0%) | 63,180 (100.0%) |
Earnings by Sex by Educational Attainment in Williamson County
Average earnings in Williamson County are $98,193 for men and $52,185 for women, a difference of 46.9%. Men with an educational attainment of graduate degree enjoy the highest average annual earnings of $127,536, while those with less than high school education earn the least with $38,789. Women with an educational attainment of graduate degree earn the most with the average annual earnings of $74,819, while those with less than high school education have the smallest earnings of $17,384.
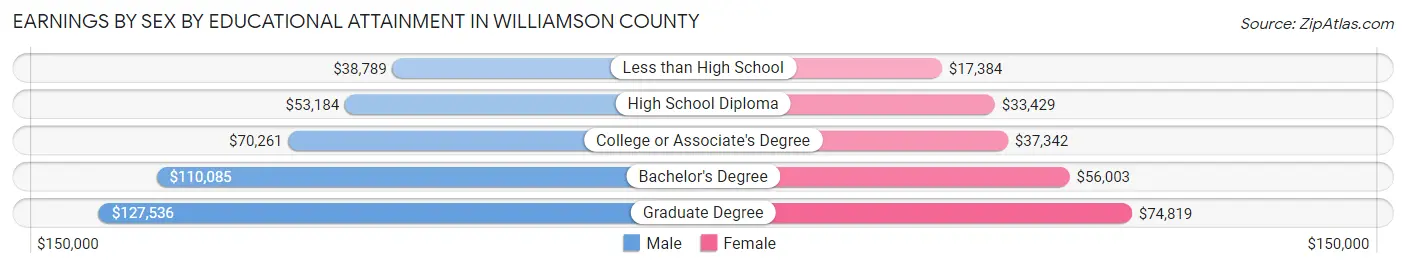
| Educational Attainment | Male Income | Female Income |
| Less than High School | $38,789 | $17,384 |
| High School Diploma | $53,184 | $33,429 |
| College or Associate's Degree | $70,261 | $37,342 |
| Bachelor's Degree | $110,085 | $56,003 |
| Graduate Degree | $127,536 | $74,819 |
| Total | $98,193 | $52,185 |
Family Income in Williamson County
Family Income Brackets in Williamson County
According to the Williamson County family income data, there are 22,547 families falling into the $200,000+ income range, which is the most common income bracket and makes up 32.6% of all families. Conversely, the less than $10,000 income bracket is the least frequent group with only 553 families (0.8%) belonging to this category.
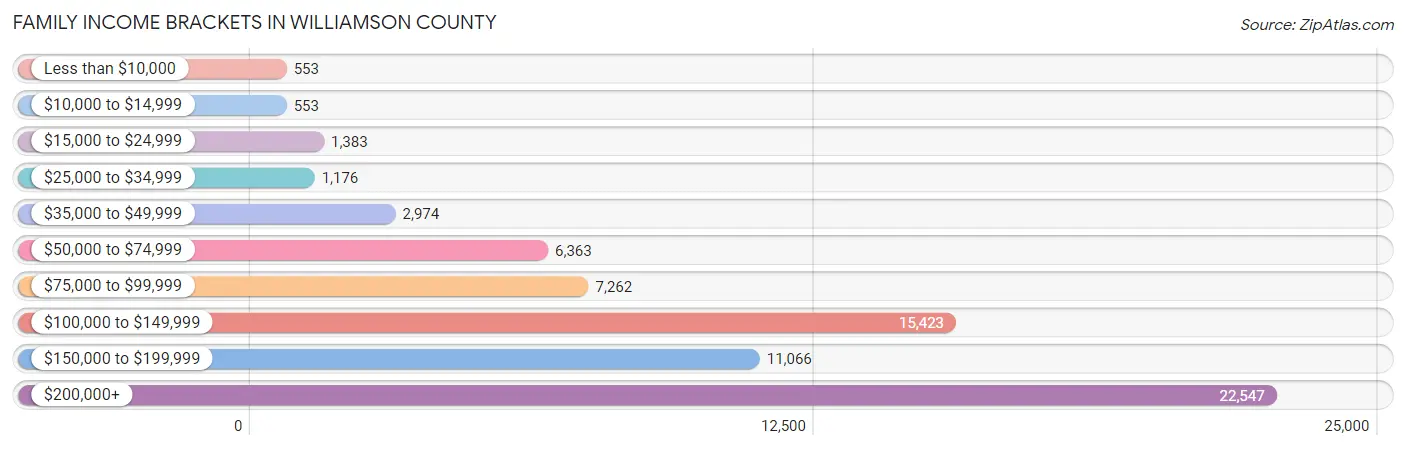
| Income Bracket | # Families | % Families |
| Less than $10,000 | 553 | 0.8% |
| $10,000 to $14,999 | 553 | 0.8% |
| $15,000 to $24,999 | 1,383 | 2.0% |
| $25,000 to $34,999 | 1,176 | 1.7% |
| $35,000 to $49,999 | 2,974 | 4.3% |
| $50,000 to $74,999 | 6,363 | 9.2% |
| $75,000 to $99,999 | 7,262 | 10.5% |
| $100,000 to $149,999 | 15,423 | 22.3% |
| $150,000 to $199,999 | 11,066 | 16.0% |
| $200,000+ | 22,547 | 32.6% |
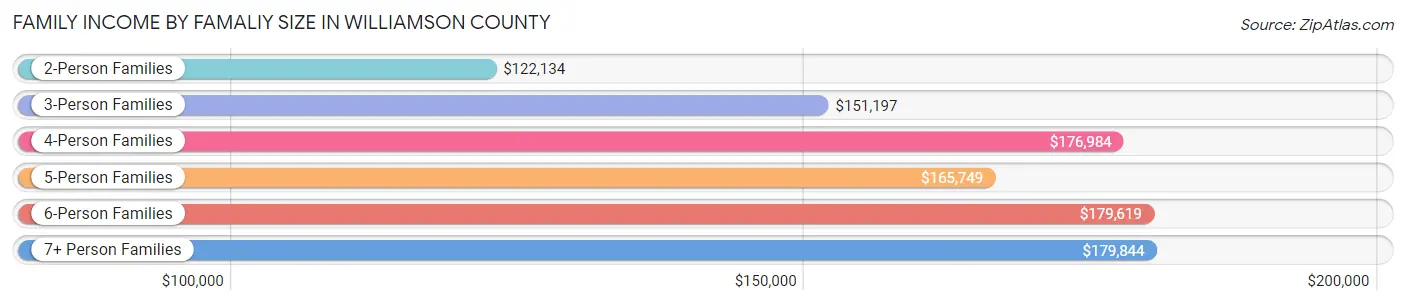
Family Income by Famaliy Size in Williamson County
7+ person families (433 | 0.6%) account for the highest median family income in Williamson County with $179,844 per family, while 2-person families (30,278 | 43.8%) have the highest median income of $61,067 per family member.
| Income Bracket | # Families | Median Income |
| 2-Person Families | 30,278 (43.8%) | $122,134 |
| 3-Person Families | 13,432 (19.4%) | $151,197 |
| 4-Person Families | 16,545 (23.9%) | $176,984 |
| 5-Person Families | 6,440 (9.3%) | $165,749 |
| 6-Person Families | 2,035 (2.9%) | $179,619 |
| 7+ Person Families | 433 (0.6%) | $179,844 |
| Total | 69,163 (100.0%) | $145,896 |
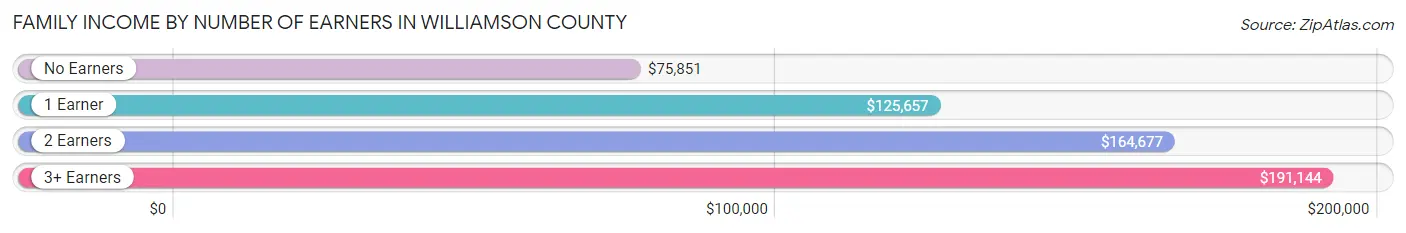
Family Income by Number of Earners in Williamson County
The median family income in Williamson County is $145,896, with families comprising 3+ earners (7,982) having the highest median family income of $191,144, while families with no earners (6,724) have the lowest median family income of $75,851, accounting for 11.5% and 9.7% of families, respectively.
| Number of Earners | # Families | Median Income |
| No Earners | 6,724 (9.7%) | $75,851 |
| 1 Earner | 20,801 (30.1%) | $125,657 |
| 2 Earners | 33,656 (48.7%) | $164,677 |
| 3+ Earners | 7,982 (11.5%) | $191,144 |
| Total | 69,163 (100.0%) | $145,896 |
Household Income in Williamson County
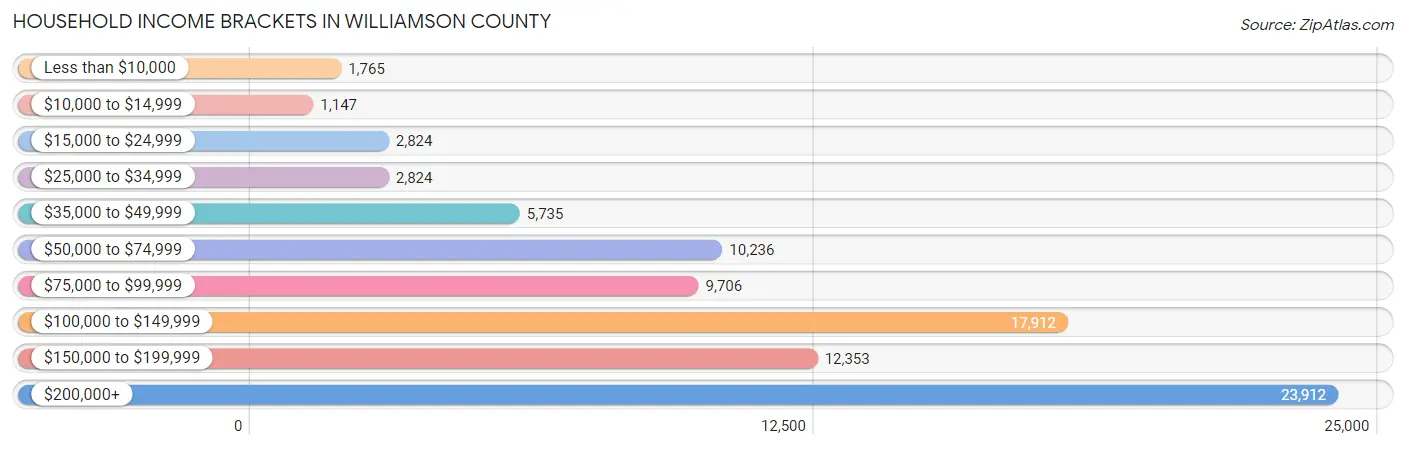
Household Income Brackets in Williamson County
With 23,912 households falling in the category, the $200,000+ income range is the most frequent in Williamson County, accounting for 27.1% of all households. In contrast, only 1,147 households (1.3%) fall into the $10,000 to $14,999 income bracket, making it the least populous group.
| Income Bracket | # Households | % Households |
| Less than $10,000 | 1,765 | 2.0% |
| $10,000 to $14,999 | 1,147 | 1.3% |
| $15,000 to $24,999 | 2,824 | 3.2% |
| $25,000 to $34,999 | 2,824 | 3.2% |
| $35,000 to $49,999 | 5,735 | 6.5% |
| $50,000 to $74,999 | 10,236 | 11.6% |
| $75,000 to $99,999 | 9,706 | 11.0% |
| $100,000 to $149,999 | 17,912 | 20.3% |
| $150,000 to $199,999 | 12,353 | 14.0% |
| $200,000+ | 23,912 | 27.1% |
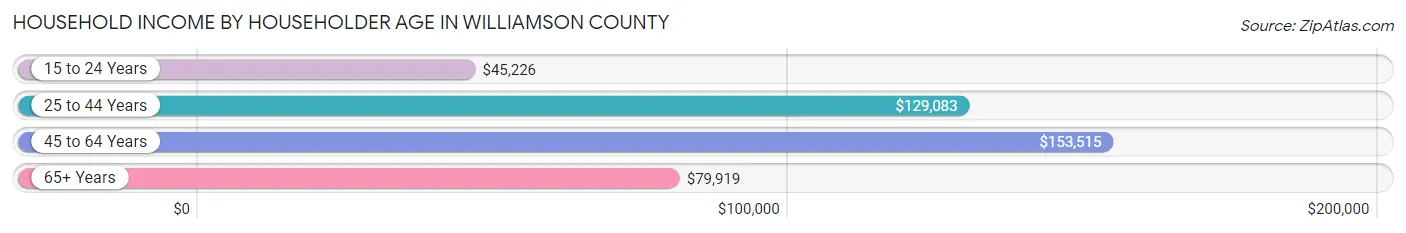
Household Income by Householder Age in Williamson County
The median household income in Williamson County is $125,943, with the highest median household income of $153,515 found in the 45 to 64 years age bracket for the primary householder. A total of 37,663 households (42.7%) fall into this category. Meanwhile, the 15 to 24 years age bracket for the primary householder has the lowest median household income of $45,226, with 1,529 households (1.7%) in this group.
| Income Bracket | # Households | Median Income |
| 15 to 24 Years | 1,529 (1.7%) | $45,226 |
| 25 to 44 Years | 28,525 (32.3%) | $129,083 |
| 45 to 64 Years | 37,663 (42.7%) | $153,515 |
| 65+ Years | 20,521 (23.3%) | $79,919 |
| Total | 88,238 (100.0%) | $125,943 |
Poverty in Williamson County
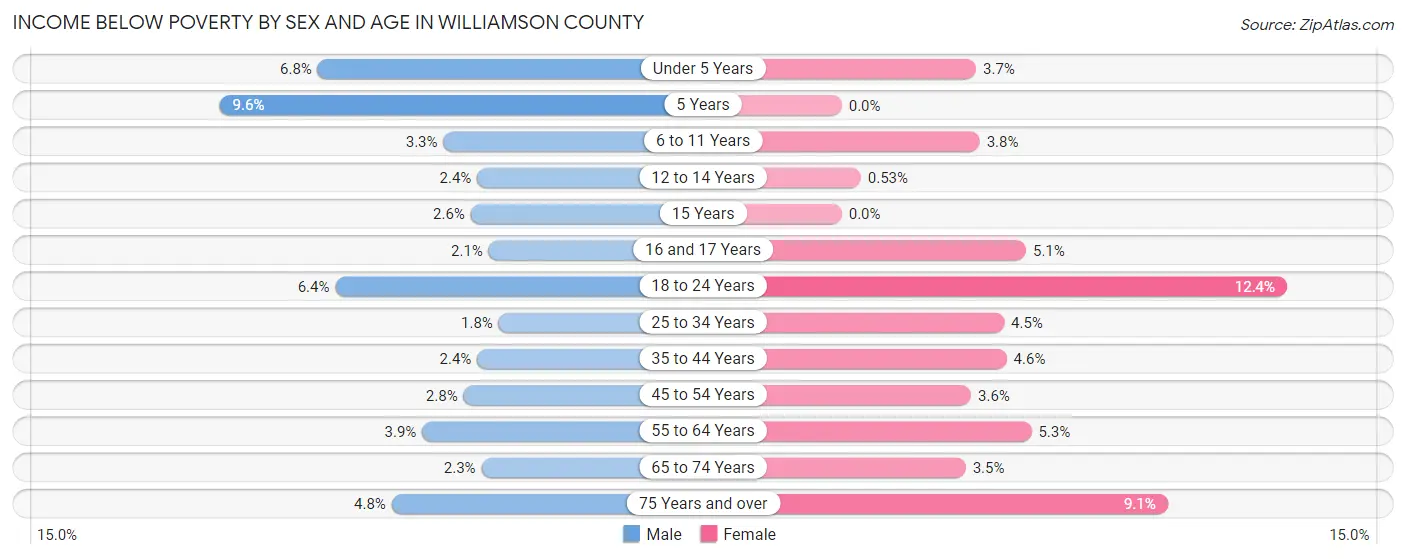
Income Below Poverty by Sex and Age in Williamson County
With 3.5% poverty level for males and 4.9% for females among the residents of Williamson County, 5 year old males and 18 to 24 year old females are the most vulnerable to poverty, with 106 males (9.6%) and 1,183 females (12.4%) in their respective age groups living below the poverty level.
| Age Bracket | Male | Female |
| Under 5 Years | 477 (6.8%) | 253 (3.7%) |
| 5 Years | 106 (9.6%) | 0 (0.0%) |
| 6 to 11 Years | 403 (3.3%) | 440 (3.8%) |
| 12 to 14 Years | 155 (2.4%) | 31 (0.5%) |
| 15 Years | 56 (2.6%) | 0 (0.0%) |
| 16 and 17 Years | 91 (2.1%) | 234 (5.1%) |
| 18 to 24 Years | 676 (6.4%) | 1,183 (12.4%) |
| 25 to 34 Years | 189 (1.8%) | 532 (4.5%) |
| 35 to 44 Years | 429 (2.4%) | 856 (4.6%) |
| 45 to 54 Years | 525 (2.8%) | 677 (3.6%) |
| 55 to 64 Years | 616 (3.9%) | 858 (5.3%) |
| 65 to 74 Years | 232 (2.3%) | 380 (3.5%) |
| 75 Years and over | 264 (4.8%) | 674 (9.1%) |
| Total | 4,219 (3.5%) | 6,118 (4.9%) |
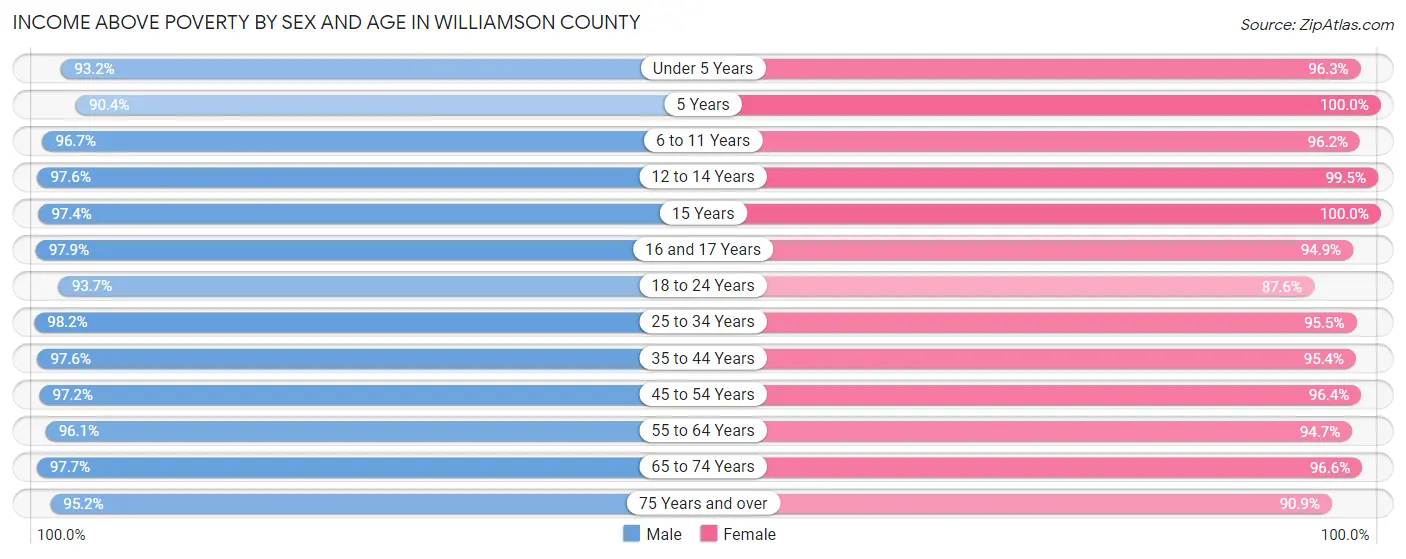
Income Above Poverty by Sex and Age in Williamson County
According to the poverty statistics in Williamson County, males aged 25 to 34 years and females aged 5 years are the age groups that are most secure financially, with 98.2% of males and 100.0% of females in these age groups living above the poverty line.
| Age Bracket | Male | Female |
| Under 5 Years | 6,492 (93.2%) | 6,504 (96.3%) |
| 5 Years | 1,002 (90.4%) | 1,391 (100.0%) |
| 6 to 11 Years | 11,651 (96.7%) | 11,006 (96.2%) |
| 12 to 14 Years | 6,294 (97.6%) | 5,832 (99.5%) |
| 15 Years | 2,114 (97.4%) | 1,949 (100.0%) |
| 16 and 17 Years | 4,293 (97.9%) | 4,328 (94.9%) |
| 18 to 24 Years | 9,962 (93.6%) | 8,367 (87.6%) |
| 25 to 34 Years | 10,285 (98.2%) | 11,236 (95.5%) |
| 35 to 44 Years | 17,470 (97.6%) | 17,790 (95.4%) |
| 45 to 54 Years | 18,387 (97.2%) | 18,113 (96.4%) |
| 55 to 64 Years | 15,042 (96.1%) | 15,384 (94.7%) |
| 65 to 74 Years | 9,941 (97.7%) | 10,625 (96.6%) |
| 75 Years and over | 5,260 (95.2%) | 6,754 (90.9%) |
| Total | 118,193 (96.6%) | 119,279 (95.1%) |
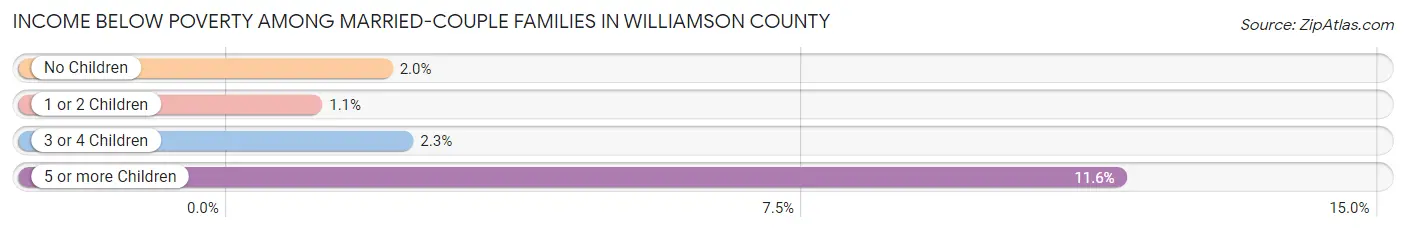
Income Below Poverty Among Married-Couple Families in Williamson County
The poverty statistics for married-couple families in Williamson County show that 1.7% or 1,041 of the total 60,432 families live below the poverty line. Families with 5 or more children have the highest poverty rate of 11.6%, comprising of 21 families. On the other hand, families with 1 or 2 children have the lowest poverty rate of 1.1%, which includes 256 families.
| Children | Above Poverty | Below Poverty |
| No Children | 30,519 (98.0%) | 628 (2.0%) |
| 1 or 2 Children | 22,922 (98.9%) | 256 (1.1%) |
| 3 or 4 Children | 5,790 (97.7%) | 136 (2.3%) |
| 5 or more Children | 160 (88.4%) | 21 (11.6%) |
| Total | 59,391 (98.3%) | 1,041 (1.7%) |
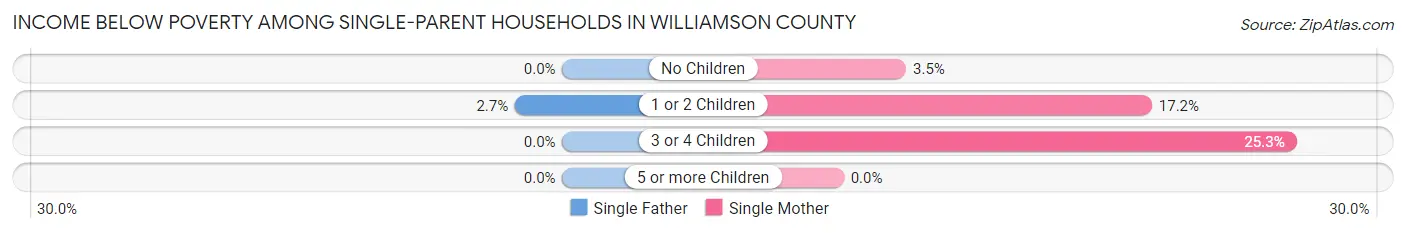
Income Below Poverty Among Single-Parent Households in Williamson County
According to the poverty data in Williamson County, 1.3% or 26 single-father households and 12.7% or 855 single-mother households are living below the poverty line. Among single-father households, those with 1 or 2 children have the highest poverty rate, with 26 households (2.6%) experiencing poverty. Likewise, among single-mother households, those with 3 or 4 children have the highest poverty rate, with 83 households (25.3%) falling below the poverty line.
| Children | Single Father | Single Mother |
| No Children | 0 (0.0%) | 84 (3.5%) |
| 1 or 2 Children | 26 (2.6%) | 688 (17.2%) |
| 3 or 4 Children | 0 (0.0%) | 83 (25.3%) |
| 5 or more Children | 0 (0.0%) | 0 (0.0%) |
| Total | 26 (1.3%) | 855 (12.7%) |
Income Below Poverty Among Married-Couple vs Single-Parent Households in Williamson County
The poverty data for Williamson County shows that 1,041 of the married-couple family households (1.7%) and 881 of the single-parent households (10.1%) are living below the poverty level. Within the married-couple family households, those with 5 or more children have the highest poverty rate, with 21 households (11.6%) falling below the poverty line. Among the single-parent households, those with 1 or 2 children have the highest poverty rate, with 714 household (14.3%) living below poverty.
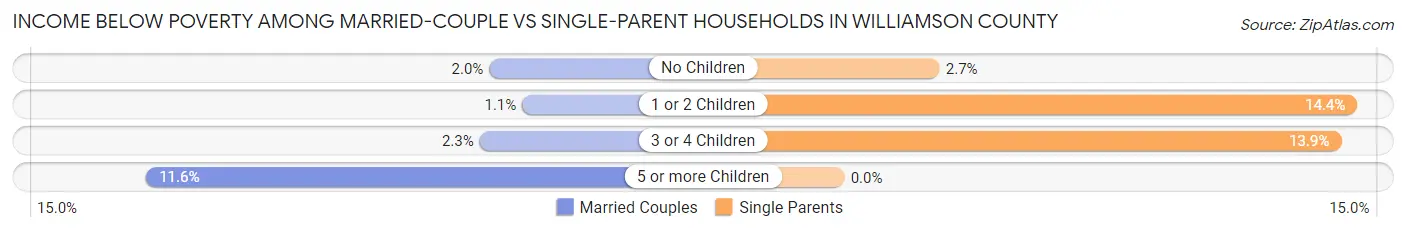
| Children | Married-Couple Families | Single-Parent Households |
| No Children | 628 (2.0%) | 84 (2.7%) |
| 1 or 2 Children | 256 (1.1%) | 714 (14.3%) |
| 3 or 4 Children | 136 (2.3%) | 83 (13.9%) |
| 5 or more Children | 21 (11.6%) | 0 (0.0%) |
| Total | 1,041 (1.7%) | 881 (10.1%) |
Employment Characteristics in Williamson County
Employment by Class of Employer in Williamson County
Among the 125,974 employed individuals in Williamson County, private company employees (85,189 | 67.6%), self-employed (not incorporated) (11,163 | 8.9%), and not-for-profit organizations (10,514 | 8.4%) make up the most common classes of employment.
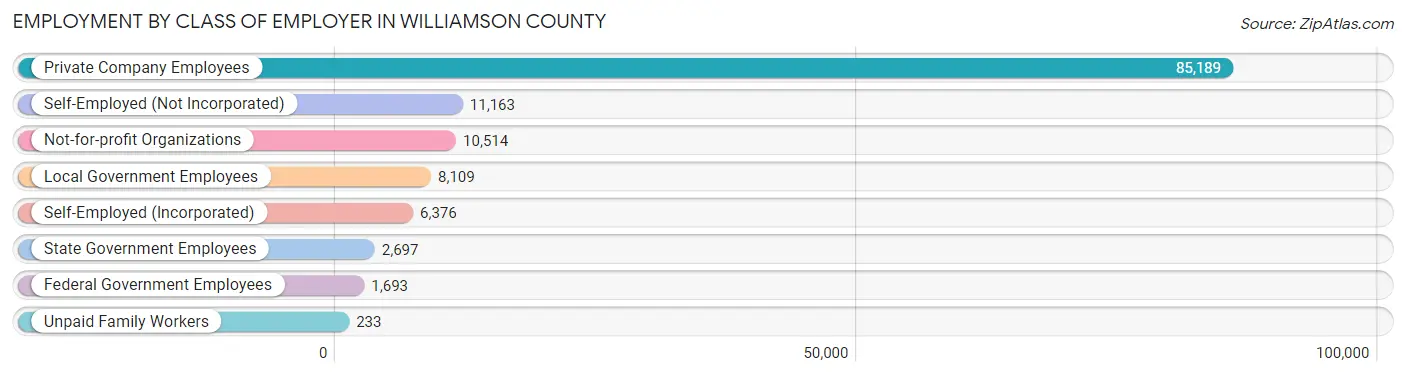
| Employer Class | # Employees | % Employees |
| Private Company Employees | 85,189 | 67.6% |
| Self-Employed (Incorporated) | 6,376 | 5.1% |
| Self-Employed (Not Incorporated) | 11,163 | 8.9% |
| Not-for-profit Organizations | 10,514 | 8.4% |
| Local Government Employees | 8,109 | 6.4% |
| State Government Employees | 2,697 | 2.1% |
| Federal Government Employees | 1,693 | 1.3% |
| Unpaid Family Workers | 233 | 0.2% |
| Total | 125,974 | 100.0% |
Employment Status by Age in Williamson County
According to the labor force statistics for Williamson County, out of the total population over 16 years of age (192,193), 67.8% or 130,307 individuals are in the labor force, with 2.1% or 2,736 of them unemployed. The age group with the highest labor force participation rate is 25 to 29 years, with 90.5% or 9,468 individuals in the labor force. Within the labor force, the 25 to 29 years age range has the highest percentage of unemployed individuals, with 5.4% or 511 of them being unemployed.
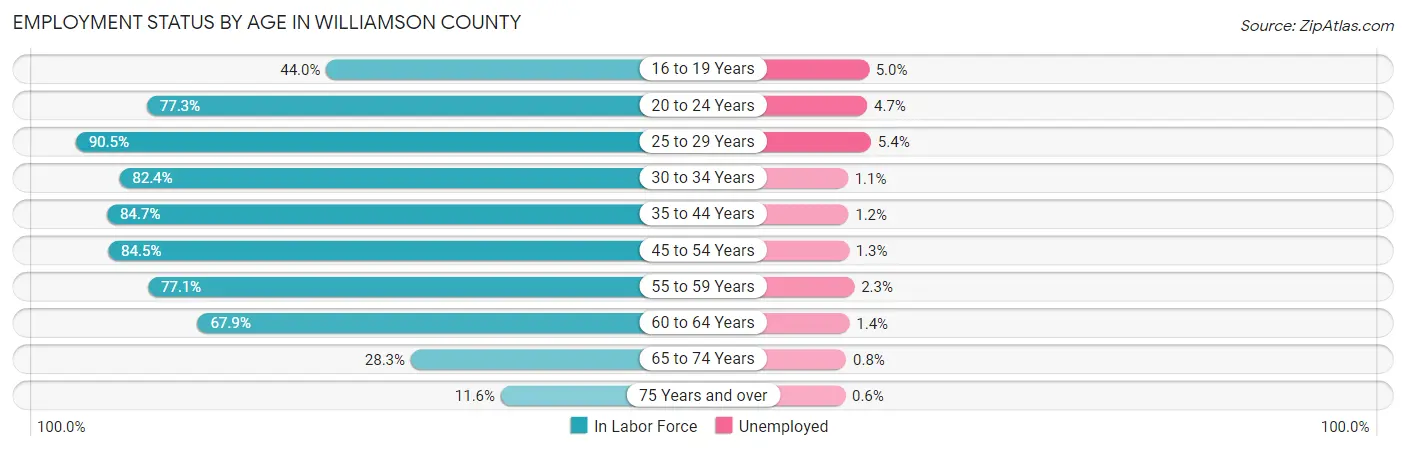
| Age Bracket | In Labor Force | Unemployed |
| 16 to 19 Years | 6,761 (44.0%) | 338 (5.0%) |
| 20 to 24 Years | 10,652 (77.3%) | 501 (4.7%) |
| 25 to 29 Years | 9,468 (90.5%) | 511 (5.4%) |
| 30 to 34 Years | 9,723 (82.4%) | 107 (1.1%) |
| 35 to 44 Years | 30,973 (84.7%) | 372 (1.2%) |
| 45 to 54 Years | 31,898 (84.5%) | 415 (1.3%) |
| 55 to 59 Years | 13,419 (77.1%) | 309 (2.3%) |
| 60 to 64 Years | 9,853 (67.9%) | 138 (1.4%) |
| 65 to 74 Years | 6,028 (28.3%) | 48 (0.8%) |
| 75 Years and over | 1,537 (11.6%) | 9 (0.6%) |
| Total | 130,307 (67.8%) | 2,736 (2.1%) |
Employment Status by Educational Attainment in Williamson County
According to labor force statistics for Williamson County, 82.0% of individuals (105,366) out of the total population between 25 and 64 years of age (128,495) are in the labor force, with 1.8% or 1,897 of them being unemployed. The group with the highest labor force participation rate are those with the educational attainment of bachelor's degree or higher, with 84.9% or 71,858 individuals in the labor force. Within the labor force, individuals with less than high school education have the highest percentage of unemployment, with 6.1% or 158 of them being unemployed.
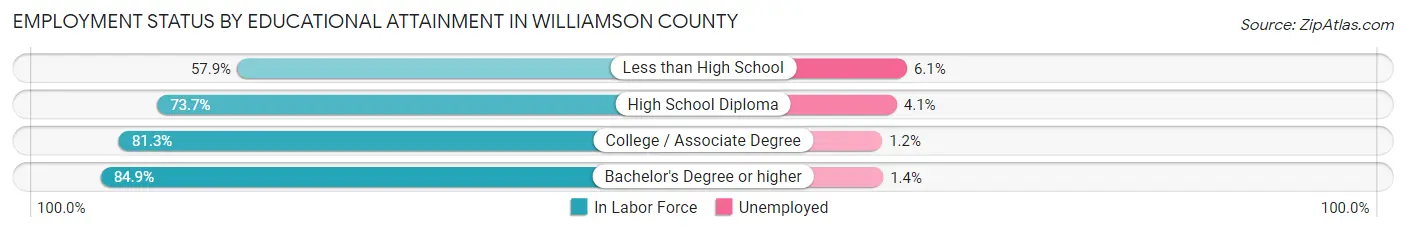
| Educational Attainment | In Labor Force | Unemployed |
| Less than High School | 2,586 (57.9%) | 272 (6.1%) |
| High School Diploma | 10,902 (73.7%) | 606 (4.1%) |
| College / Associate Degree | 19,999 (81.3%) | 295 (1.2%) |
| Bachelor's Degree or higher | 71,858 (84.9%) | 1,185 (1.4%) |
| Total | 105,366 (82.0%) | 2,313 (1.8%) |
Employment Occupations by Sex in Williamson County
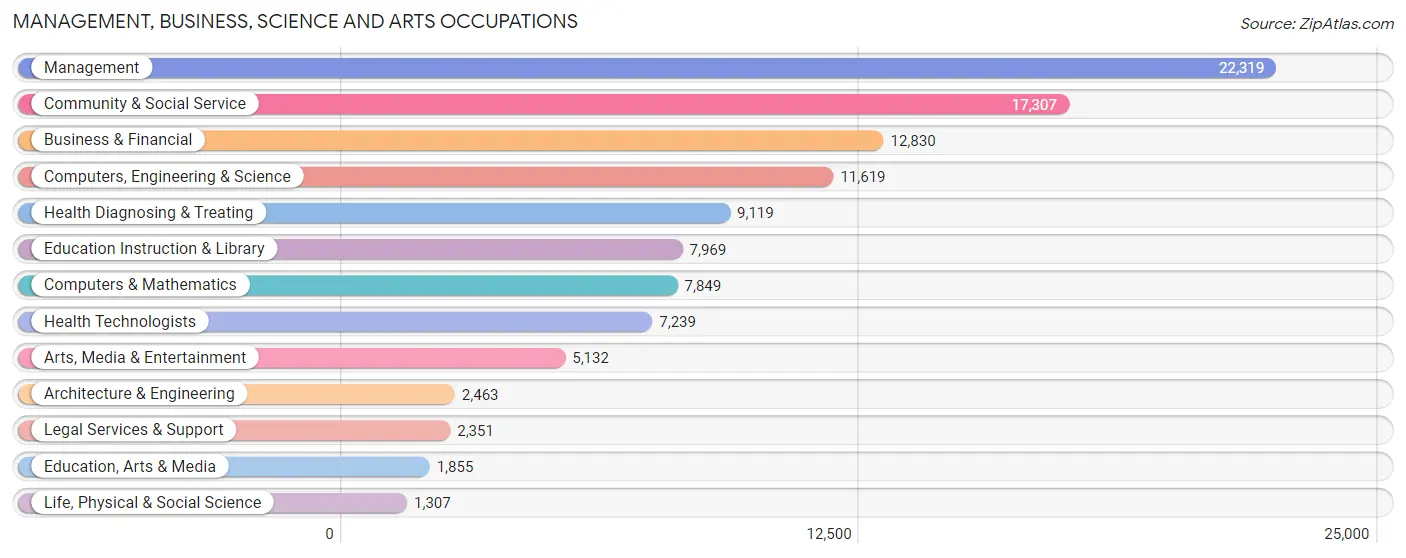
Management, Business, Science and Arts Occupations
The most common Management, Business, Science and Arts occupations in Williamson County are Management (22,319 | 17.5%), Community & Social Service (17,307 | 13.6%), Business & Financial (12,830 | 10.1%), Computers, Engineering & Science (11,619 | 9.1%), and Health Diagnosing & Treating (9,119 | 7.1%).
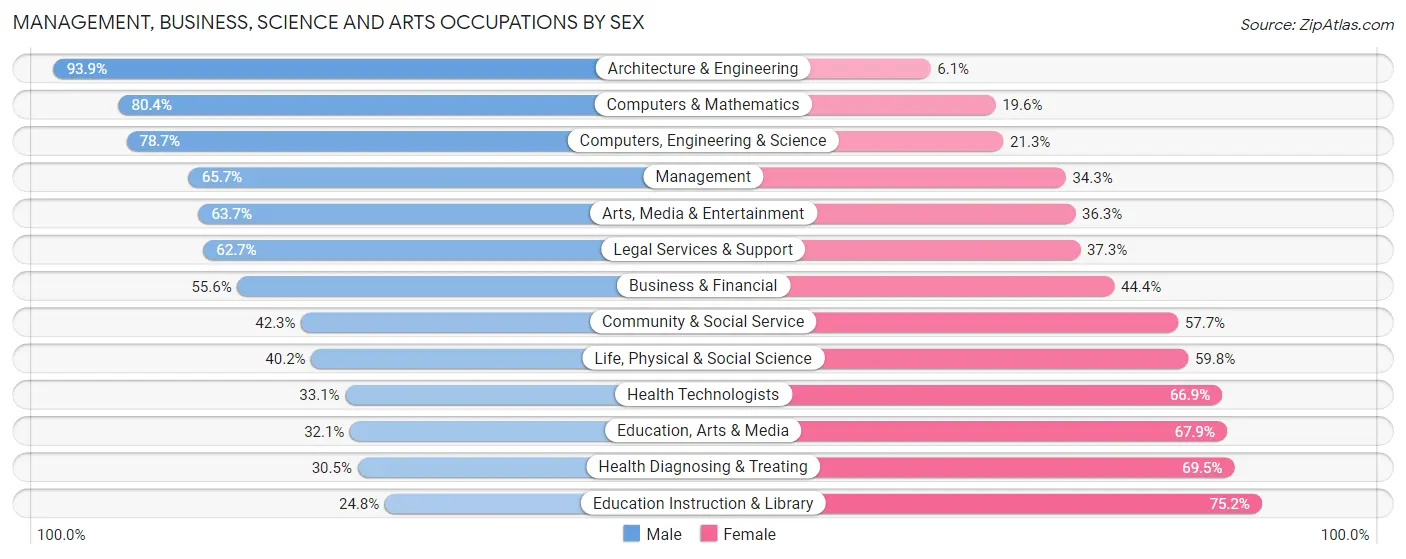
Management, Business, Science and Arts Occupations by Sex
Within the Management, Business, Science and Arts occupations in Williamson County, the most male-oriented occupations are Architecture & Engineering (93.9%), Computers & Mathematics (80.4%), and Computers, Engineering & Science (78.7%), while the most female-oriented occupations are Education Instruction & Library (75.2%), Health Diagnosing & Treating (69.5%), and Education, Arts & Media (67.9%).
| Occupation | Male | Female |
| Management | 14,668 (65.7%) | 7,651 (34.3%) |
| Business & Financial | 7,132 (55.6%) | 5,698 (44.4%) |
| Computers, Engineering & Science | 9,147 (78.7%) | 2,472 (21.3%) |
| Computers & Mathematics | 6,309 (80.4%) | 1,540 (19.6%) |
| Architecture & Engineering | 2,313 (93.9%) | 150 (6.1%) |
| Life, Physical & Social Science | 525 (40.2%) | 782 (59.8%) |
| Community & Social Service | 7,315 (42.3%) | 9,992 (57.7%) |
| Education, Arts & Media | 595 (32.1%) | 1,260 (67.9%) |
| Legal Services & Support | 1,474 (62.7%) | 877 (37.3%) |
| Education Instruction & Library | 1,976 (24.8%) | 5,993 (75.2%) |
| Arts, Media & Entertainment | 3,270 (63.7%) | 1,862 (36.3%) |
| Health Diagnosing & Treating | 2,782 (30.5%) | 6,337 (69.5%) |
| Health Technologists | 2,395 (33.1%) | 4,844 (66.9%) |
| Total (Category) | 41,044 (56.1%) | 32,150 (43.9%) |
| Total (Overall) | 70,017 (54.9%) | 57,470 (45.1%) |
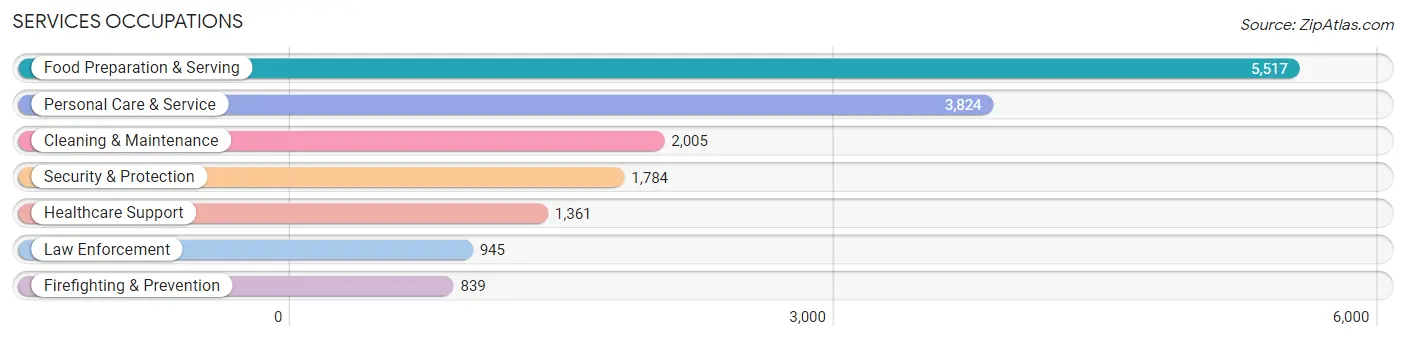
Services Occupations
The most common Services occupations in Williamson County are Food Preparation & Serving (5,517 | 4.3%), Personal Care & Service (3,824 | 3.0%), Cleaning & Maintenance (2,005 | 1.6%), Security & Protection (1,784 | 1.4%), and Healthcare Support (1,361 | 1.1%).
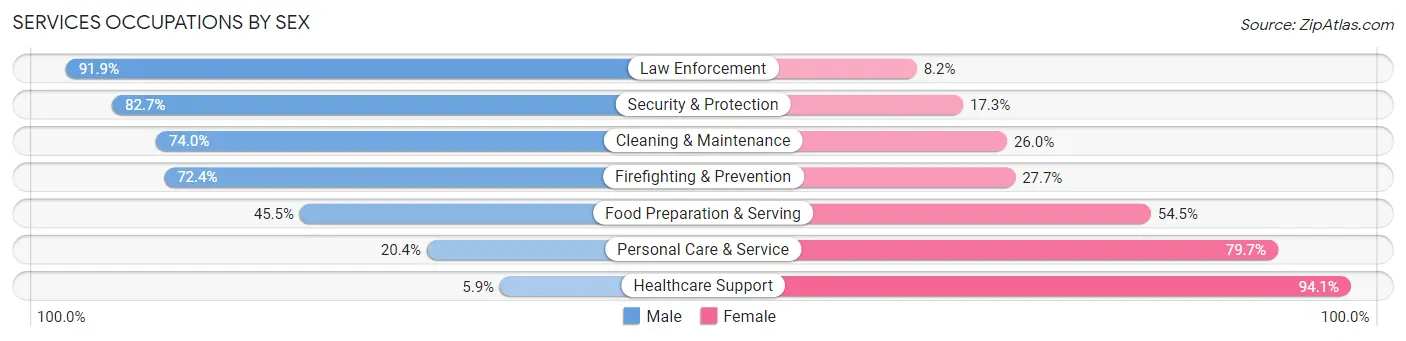
Services Occupations by Sex
Within the Services occupations in Williamson County, the most male-oriented occupations are Law Enforcement (91.8%), Security & Protection (82.7%), and Cleaning & Maintenance (74.0%), while the most female-oriented occupations are Healthcare Support (94.1%), Personal Care & Service (79.6%), and Food Preparation & Serving (54.5%).
| Occupation | Male | Female |
| Healthcare Support | 80 (5.9%) | 1,281 (94.1%) |
| Security & Protection | 1,475 (82.7%) | 309 (17.3%) |
| Firefighting & Prevention | 607 (72.4%) | 232 (27.7%) |
| Law Enforcement | 868 (91.8%) | 77 (8.2%) |
| Food Preparation & Serving | 2,510 (45.5%) | 3,007 (54.5%) |
| Cleaning & Maintenance | 1,483 (74.0%) | 522 (26.0%) |
| Personal Care & Service | 778 (20.3%) | 3,046 (79.6%) |
| Total (Category) | 6,326 (43.6%) | 8,165 (56.4%) |
| Total (Overall) | 70,017 (54.9%) | 57,470 (45.1%) |
Sales and Office Occupations
The most common Sales and Office occupations in Williamson County are Sales & Related (16,107 | 12.6%), and Office & Administration (12,007 | 9.4%).
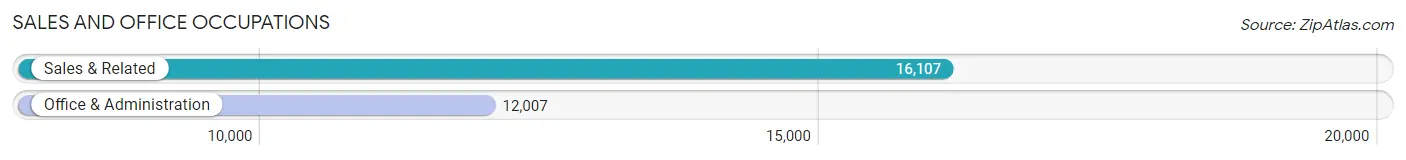
Sales and Office Occupations by Sex
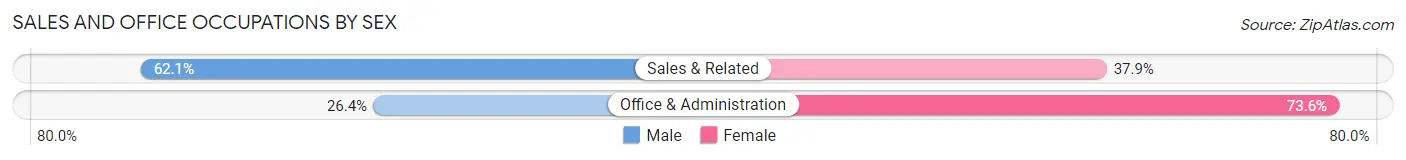
| Occupation | Male | Female |
| Sales & Related | 10,008 (62.1%) | 6,099 (37.9%) |
| Office & Administration | 3,171 (26.4%) | 8,836 (73.6%) |
| Total (Category) | 13,179 (46.9%) | 14,935 (53.1%) |
| Total (Overall) | 70,017 (54.9%) | 57,470 (45.1%) |
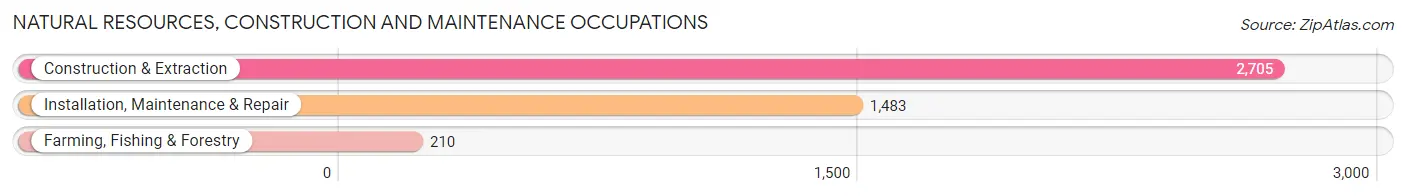
Natural Resources, Construction and Maintenance Occupations
The most common Natural Resources, Construction and Maintenance occupations in Williamson County are Construction & Extraction (2,705 | 2.1%), Installation, Maintenance & Repair (1,483 | 1.2%), and Farming, Fishing & Forestry (210 | 0.2%).
Natural Resources, Construction and Maintenance Occupations by Sex
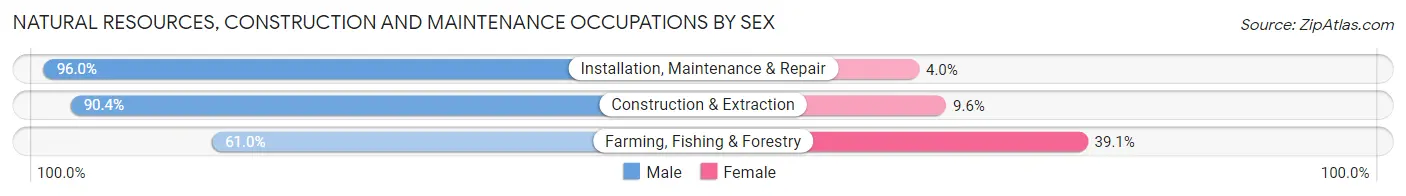
| Occupation | Male | Female |
| Farming, Fishing & Forestry | 128 (61.0%) | 82 (39.1%) |
| Construction & Extraction | 2,445 (90.4%) | 260 (9.6%) |
| Installation, Maintenance & Repair | 1,424 (96.0%) | 59 (4.0%) |
| Total (Category) | 3,997 (90.9%) | 401 (9.1%) |
| Total (Overall) | 70,017 (54.9%) | 57,470 (45.1%) |
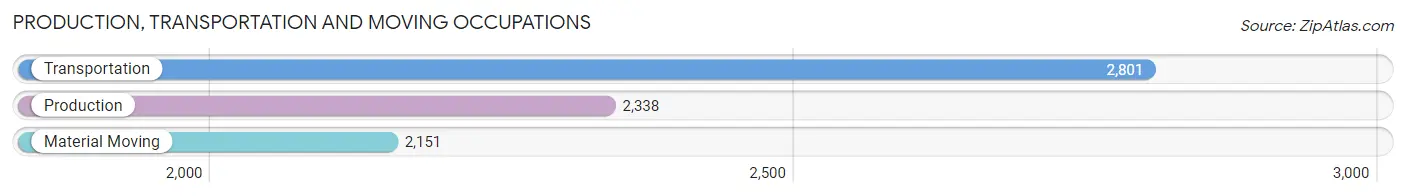
Production, Transportation and Moving Occupations
The most common Production, Transportation and Moving occupations in Williamson County are Transportation (2,801 | 2.2%), Production (2,338 | 1.8%), and Material Moving (2,151 | 1.7%).
Production, Transportation and Moving Occupations by Sex
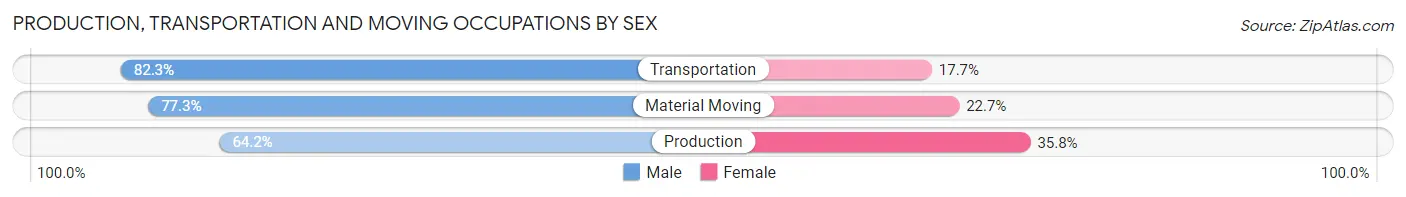
| Occupation | Male | Female |
| Production | 1,502 (64.2%) | 836 (35.8%) |
| Transportation | 2,306 (82.3%) | 495 (17.7%) |
| Material Moving | 1,663 (77.3%) | 488 (22.7%) |
| Total (Category) | 5,471 (75.0%) | 1,819 (24.9%) |
| Total (Overall) | 70,017 (54.9%) | 57,470 (45.1%) |
Employment Industries by Sex in Williamson County
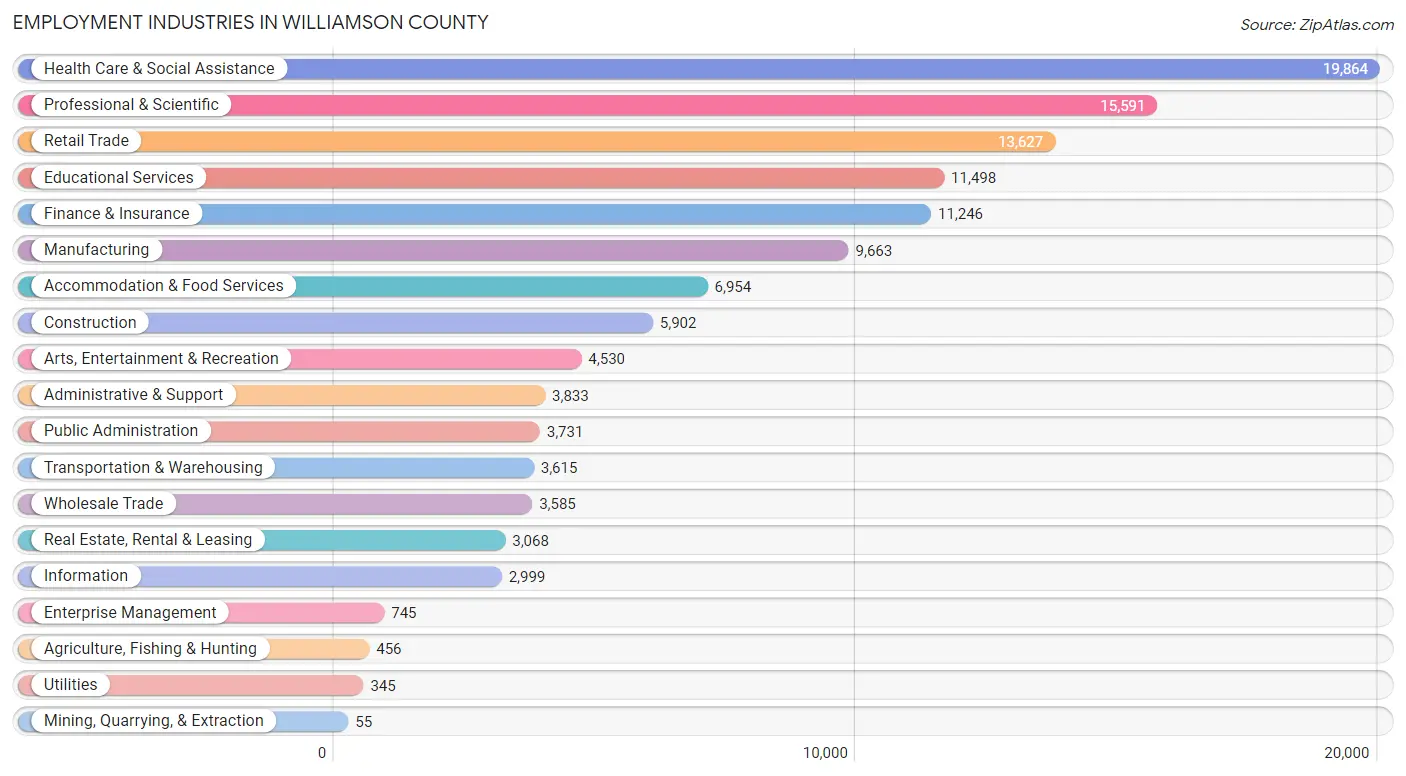
Employment Industries in Williamson County
The major employment industries in Williamson County include Health Care & Social Assistance (19,864 | 15.6%), Professional & Scientific (15,591 | 12.2%), Retail Trade (13,627 | 10.7%), Educational Services (11,498 | 9.0%), and Finance & Insurance (11,246 | 8.8%).
Employment Industries by Sex in Williamson County
The Williamson County industries that see more men than women are Construction (86.5%), Wholesale Trade (77.0%), and Manufacturing (71.4%), whereas the industries that tend to have a higher number of women are Educational Services (70.6%), Health Care & Social Assistance (64.9%), and Accommodation & Food Services (49.3%).
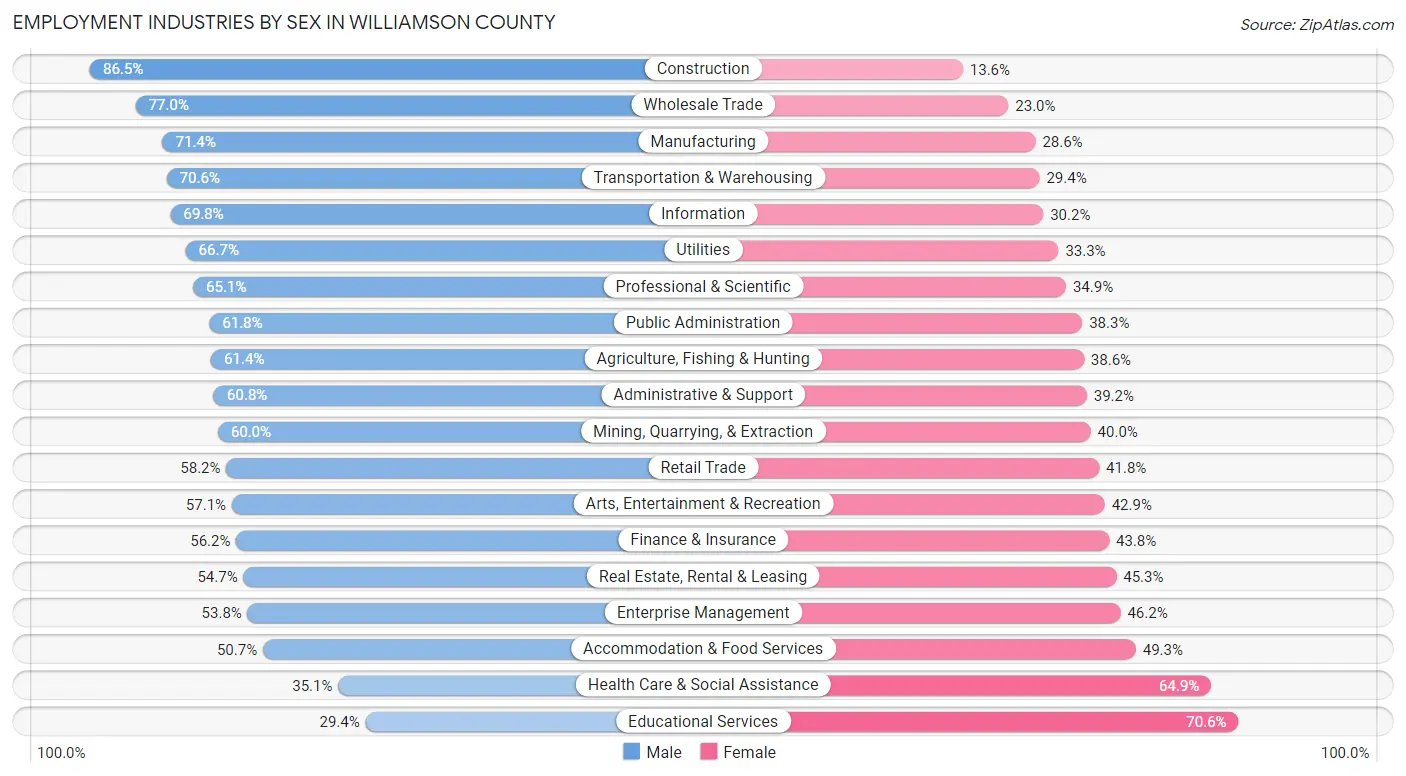
| Industry | Male | Female |
| Agriculture, Fishing & Hunting | 280 (61.4%) | 176 (38.6%) |
| Mining, Quarrying, & Extraction | 33 (60.0%) | 22 (40.0%) |
| Construction | 5,102 (86.5%) | 800 (13.6%) |
| Manufacturing | 6,902 (71.4%) | 2,761 (28.6%) |
| Wholesale Trade | 2,762 (77.0%) | 823 (23.0%) |
| Retail Trade | 7,936 (58.2%) | 5,691 (41.8%) |
| Transportation & Warehousing | 2,552 (70.6%) | 1,063 (29.4%) |
| Utilities | 230 (66.7%) | 115 (33.3%) |
| Information | 2,094 (69.8%) | 905 (30.2%) |
| Finance & Insurance | 6,318 (56.2%) | 4,928 (43.8%) |
| Real Estate, Rental & Leasing | 1,678 (54.7%) | 1,390 (45.3%) |
| Professional & Scientific | 10,152 (65.1%) | 5,439 (34.9%) |
| Enterprise Management | 401 (53.8%) | 344 (46.2%) |
| Administrative & Support | 2,331 (60.8%) | 1,502 (39.2%) |
| Educational Services | 3,384 (29.4%) | 8,114 (70.6%) |
| Health Care & Social Assistance | 6,967 (35.1%) | 12,897 (64.9%) |
| Arts, Entertainment & Recreation | 2,586 (57.1%) | 1,944 (42.9%) |
| Accommodation & Food Services | 3,523 (50.7%) | 3,431 (49.3%) |
| Public Administration | 2,304 (61.8%) | 1,427 (38.3%) |
| Total | 70,017 (54.9%) | 57,470 (45.1%) |
Education in Williamson County
School Enrollment in Williamson County
The most common levels of schooling among the 69,085 students in Williamson County are high school (17,722 | 25.7%), elementary school (15,878 | 23.0%), and middle school (15,701 | 22.7%).
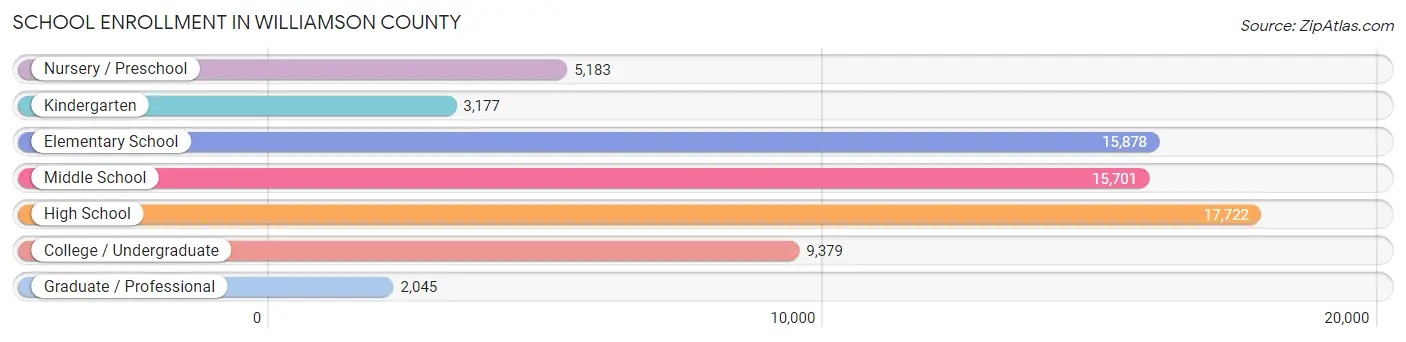
| School Level | # Students | % Students |
| Nursery / Preschool | 5,183 | 7.5% |
| Kindergarten | 3,177 | 4.6% |
| Elementary School | 15,878 | 23.0% |
| Middle School | 15,701 | 22.7% |
| High School | 17,722 | 25.7% |
| College / Undergraduate | 9,379 | 13.6% |
| Graduate / Professional | 2,045 | 3.0% |
| Total | 69,085 | 100.0% |
School Enrollment by Age by Funding Source in Williamson County
Out of a total of 69,085 students who are enrolled in schools in Williamson County, 16,028 (23.2%) attend a private institution, while the remaining 53,057 (76.8%) are enrolled in public schools. The age group of 3 to 4 year olds has the highest likelihood of being enrolled in private schools, with 2,352 (55.5% in the age bracket) enrolled. Conversely, the age group of 10 to 14 year olds has the lowest likelihood of being enrolled in a private school, with 16,366 (82.9% in the age bracket) attending a public institution.
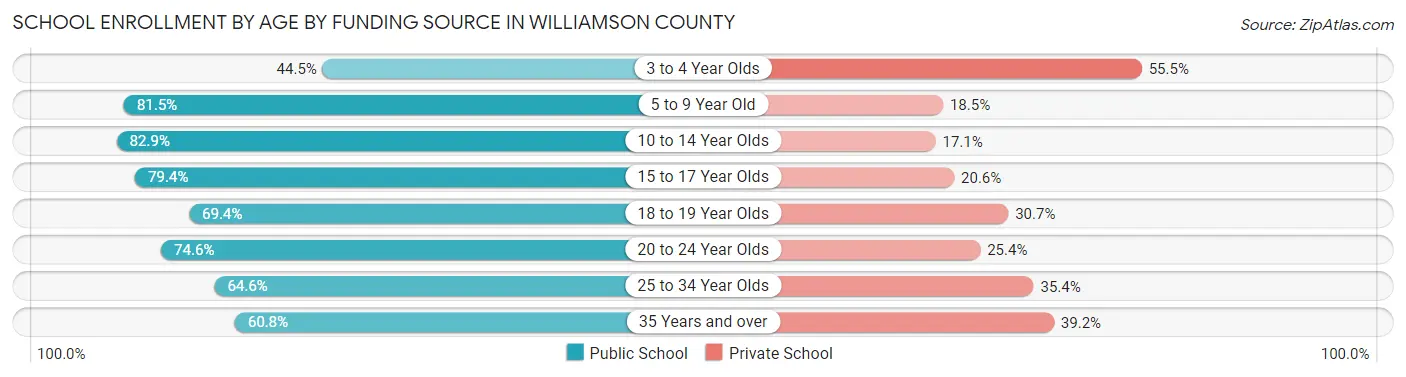
| Age Bracket | Public School | Private School |
| 3 to 4 Year Olds | 1,884 (44.5%) | 2,352 (55.5%) |
| 5 to 9 Year Old | 14,749 (81.5%) | 3,347 (18.5%) |
| 10 to 14 Year Olds | 16,366 (82.9%) | 3,380 (17.1%) |
| 15 to 17 Year Olds | 10,246 (79.4%) | 2,653 (20.6%) |
| 18 to 19 Year Olds | 3,639 (69.4%) | 1,608 (30.6%) |
| 20 to 24 Year Olds | 4,029 (74.6%) | 1,375 (25.4%) |
| 25 to 34 Year Olds | 899 (64.6%) | 492 (35.4%) |
| 35 Years and over | 1,257 (60.8%) | 809 (39.2%) |
| Total | 53,057 (76.8%) | 16,028 (23.2%) |
Educational Attainment by Field of Study in Williamson County
Business (28,291 | 26.0%), science & technology (10,386 | 9.6%), education (10,376 | 9.6%), engineering (8,668 | 8.0%), and communications (6,568 | 6.0%) are the most common fields of study among 108,624 individuals in Williamson County who have obtained a bachelor's degree or higher.
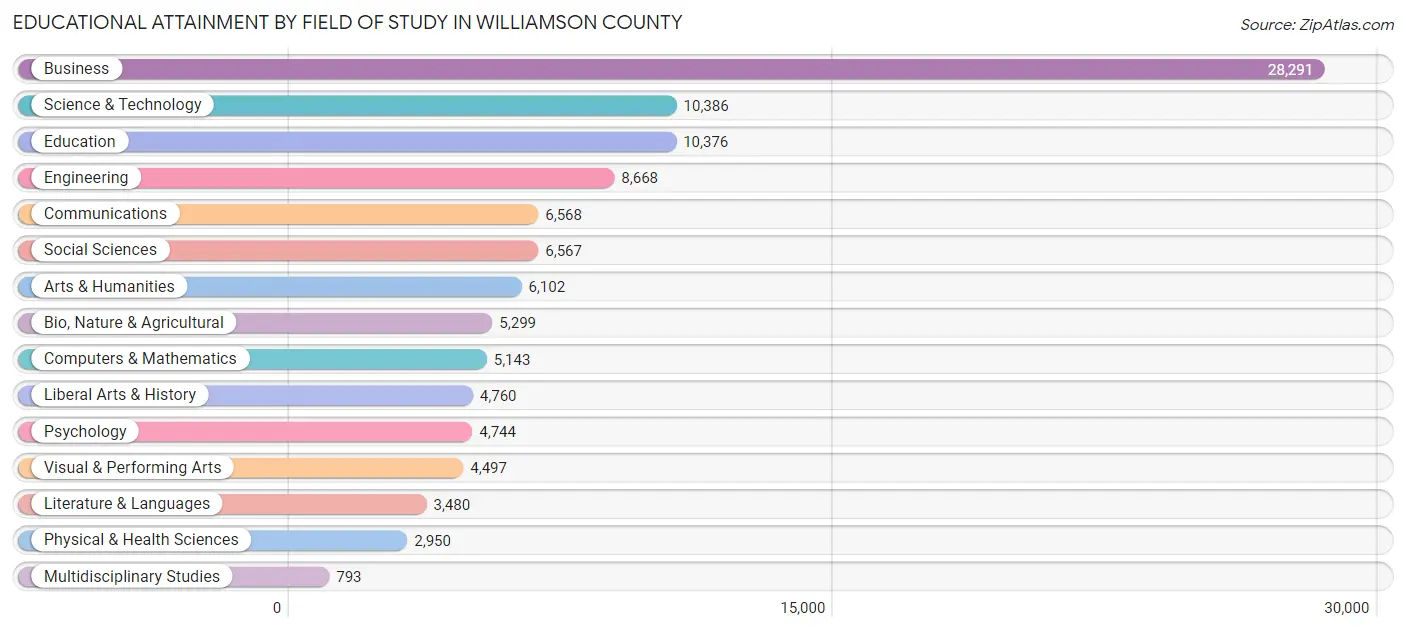
| Field of Study | # Graduates | % Graduates |
| Computers & Mathematics | 5,143 | 4.7% |
| Bio, Nature & Agricultural | 5,299 | 4.9% |
| Physical & Health Sciences | 2,950 | 2.7% |
| Psychology | 4,744 | 4.4% |
| Social Sciences | 6,567 | 6.0% |
| Engineering | 8,668 | 8.0% |
| Multidisciplinary Studies | 793 | 0.7% |
| Science & Technology | 10,386 | 9.6% |
| Business | 28,291 | 26.0% |
| Education | 10,376 | 9.6% |
| Literature & Languages | 3,480 | 3.2% |
| Liberal Arts & History | 4,760 | 4.4% |
| Visual & Performing Arts | 4,497 | 4.1% |
| Communications | 6,568 | 6.0% |
| Arts & Humanities | 6,102 | 5.6% |
| Total | 108,624 | 100.0% |
Transportation & Commute in Williamson County
Vehicle Availability by Sex in Williamson County
The most prevalent vehicle ownership categories in Williamson County are males with 2 vehicles (33,797, accounting for 48.6%) and females with 2 vehicles (25,065, making up 60.0%).
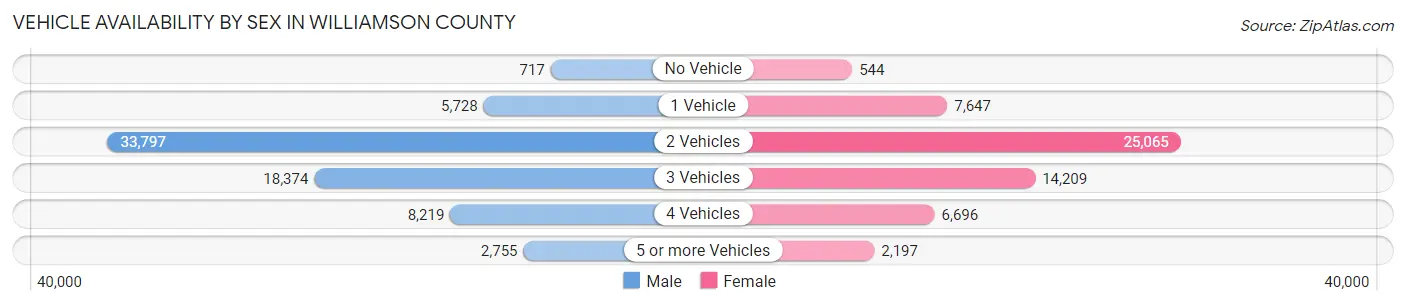
| Vehicles Available | Male | Female |
| No Vehicle | 717 (1.0%) | 544 (1.0%) |
| 1 Vehicle | 5,728 (8.2%) | 7,647 (13.6%) |
| 2 Vehicles | 33,797 (48.6%) | 25,065 (44.5%) |
| 3 Vehicles | 18,374 (26.4%) | 14,209 (25.2%) |
| 4 Vehicles | 8,219 (11.8%) | 6,696 (11.9%) |
| 5 or more Vehicles | 2,755 (4.0%) | 2,197 (3.9%) |
| Total | 69,590 (100.0%) | 56,358 (100.0%) |
Commute Time in Williamson County
The most frequently occuring commute durations in Williamson County are 30 to 34 minutes (16,334 commuters, 16.7%), 20 to 24 minutes (13,225 commuters, 13.5%), and 15 to 19 minutes (12,796 commuters, 13.1%).
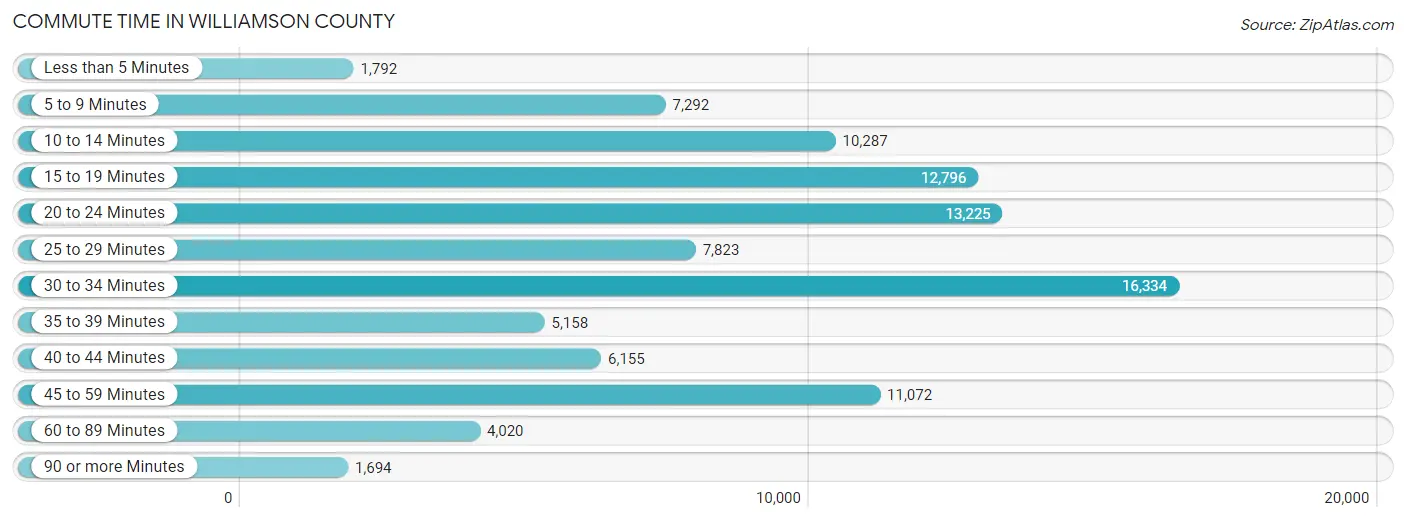
| Commute Time | # Commuters | % Commuters |
| Less than 5 Minutes | 1,792 | 1.8% |
| 5 to 9 Minutes | 7,292 | 7.5% |
| 10 to 14 Minutes | 10,287 | 10.5% |
| 15 to 19 Minutes | 12,796 | 13.1% |
| 20 to 24 Minutes | 13,225 | 13.5% |
| 25 to 29 Minutes | 7,823 | 8.0% |
| 30 to 34 Minutes | 16,334 | 16.7% |
| 35 to 39 Minutes | 5,158 | 5.3% |
| 40 to 44 Minutes | 6,155 | 6.3% |
| 45 to 59 Minutes | 11,072 | 11.3% |
| 60 to 89 Minutes | 4,020 | 4.1% |
| 90 or more Minutes | 1,694 | 1.7% |
Commute Time by Sex in Williamson County
The most common commute times in Williamson County are 30 to 34 minutes (9,724 commuters, 18.1%) for males and 30 to 34 minutes (6,610 commuters, 15.1%) for females.
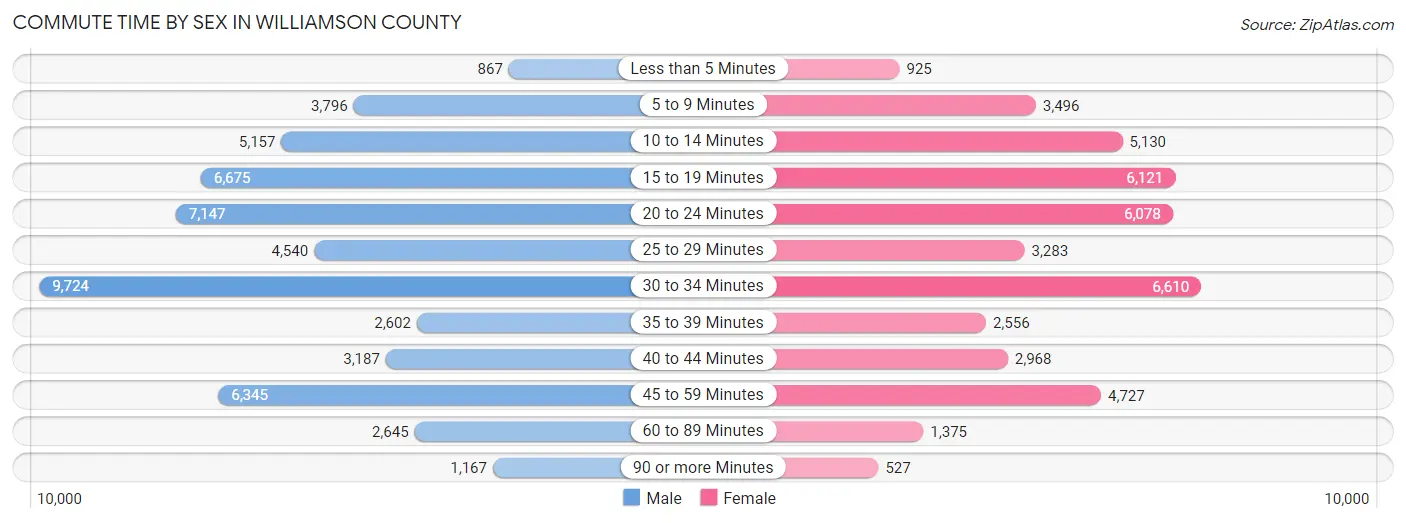
| Commute Time | Male | Female |
| Less than 5 Minutes | 867 (1.6%) | 925 (2.1%) |
| 5 to 9 Minutes | 3,796 (7.0%) | 3,496 (8.0%) |
| 10 to 14 Minutes | 5,157 (9.6%) | 5,130 (11.7%) |
| 15 to 19 Minutes | 6,675 (12.4%) | 6,121 (14.0%) |
| 20 to 24 Minutes | 7,147 (13.3%) | 6,078 (13.9%) |
| 25 to 29 Minutes | 4,540 (8.4%) | 3,283 (7.5%) |
| 30 to 34 Minutes | 9,724 (18.1%) | 6,610 (15.1%) |
| 35 to 39 Minutes | 2,602 (4.8%) | 2,556 (5.8%) |
| 40 to 44 Minutes | 3,187 (5.9%) | 2,968 (6.8%) |
| 45 to 59 Minutes | 6,345 (11.8%) | 4,727 (10.8%) |
| 60 to 89 Minutes | 2,645 (4.9%) | 1,375 (3.1%) |
| 90 or more Minutes | 1,167 (2.2%) | 527 (1.2%) |
Time of Departure to Work by Sex in Williamson County
The most frequent times of departure to work in Williamson County are 7:00 AM to 7:29 AM (8,844, 16.4%) for males and 7:00 AM to 7:29 AM (6,964, 15.9%) for females.
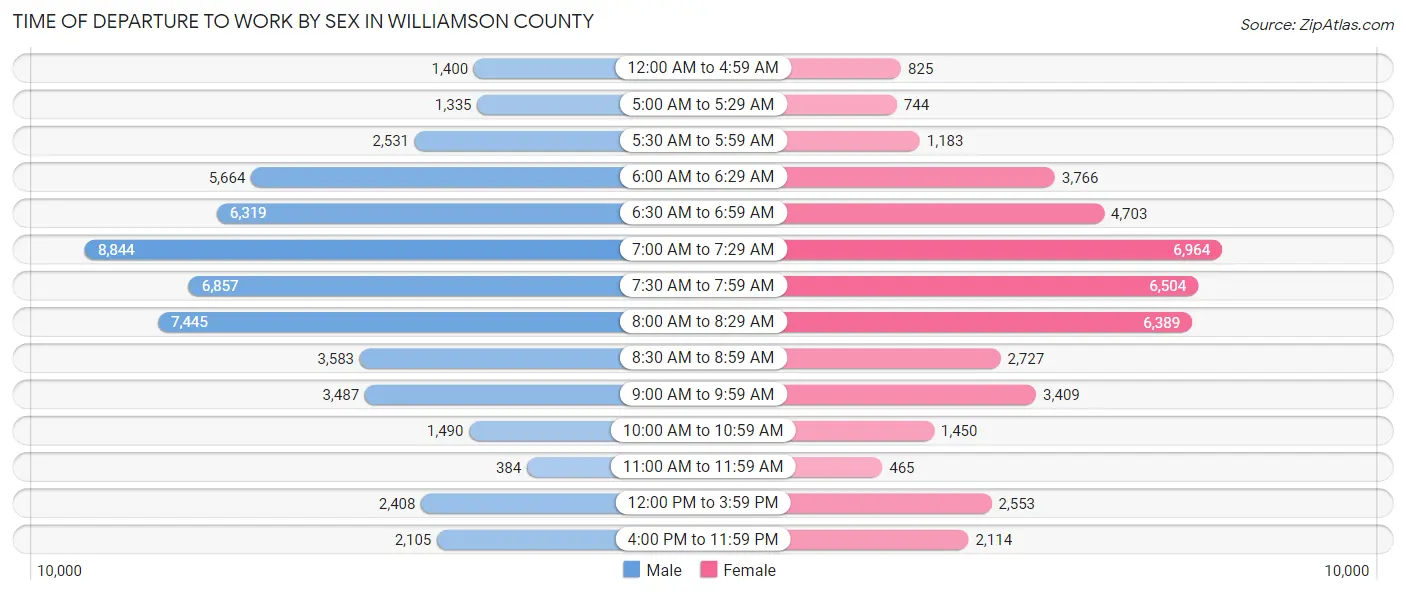
| Time of Departure | Male | Female |
| 12:00 AM to 4:59 AM | 1,400 (2.6%) | 825 (1.9%) |
| 5:00 AM to 5:29 AM | 1,335 (2.5%) | 744 (1.7%) |
| 5:30 AM to 5:59 AM | 2,531 (4.7%) | 1,183 (2.7%) |
| 6:00 AM to 6:29 AM | 5,664 (10.5%) | 3,766 (8.6%) |
| 6:30 AM to 6:59 AM | 6,319 (11.7%) | 4,703 (10.7%) |
| 7:00 AM to 7:29 AM | 8,844 (16.4%) | 6,964 (15.9%) |
| 7:30 AM to 7:59 AM | 6,857 (12.7%) | 6,504 (14.8%) |
| 8:00 AM to 8:29 AM | 7,445 (13.8%) | 6,389 (14.6%) |
| 8:30 AM to 8:59 AM | 3,583 (6.7%) | 2,727 (6.2%) |
| 9:00 AM to 9:59 AM | 3,487 (6.5%) | 3,409 (7.8%) |
| 10:00 AM to 10:59 AM | 1,490 (2.8%) | 1,450 (3.3%) |
| 11:00 AM to 11:59 AM | 384 (0.7%) | 465 (1.1%) |
| 12:00 PM to 3:59 PM | 2,408 (4.5%) | 2,553 (5.8%) |
| 4:00 PM to 11:59 PM | 2,105 (3.9%) | 2,114 (4.8%) |
| Total | 53,852 (100.0%) | 43,796 (100.0%) |
Housing Occupancy in Williamson County
Occupancy by Ownership in Williamson County
Of the total 88,238 dwellings in Williamson County, owner-occupied units account for 70,530 (79.9%), while renter-occupied units make up 17,708 (20.1%).
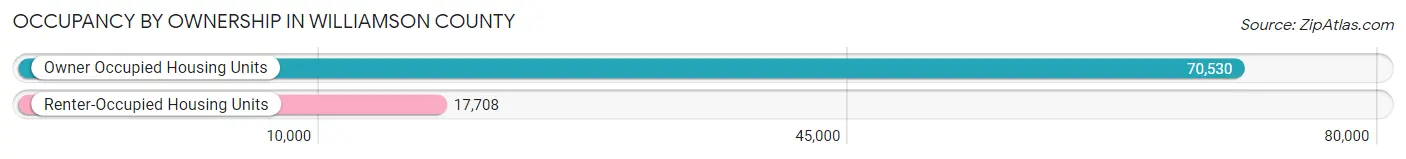
| Occupancy | # Housing Units | % Housing Units |
| Owner Occupied Housing Units | 70,530 | 79.9% |
| Renter-Occupied Housing Units | 17,708 | 20.1% |
| Total Occupied Housing Units | 88,238 | 100.0% |
Occupancy by Household Size in Williamson County
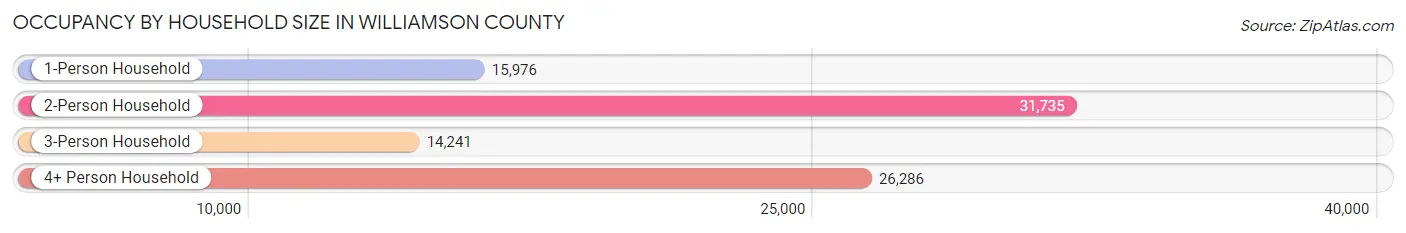
| Household Size | # Housing Units | % Housing Units |
| 1-Person Household | 15,976 | 18.1% |
| 2-Person Household | 31,735 | 36.0% |
| 3-Person Household | 14,241 | 16.1% |
| 4+ Person Household | 26,286 | 29.8% |
| Total Housing Units | 88,238 | 100.0% |
Occupancy by Ownership by Household Size in Williamson County
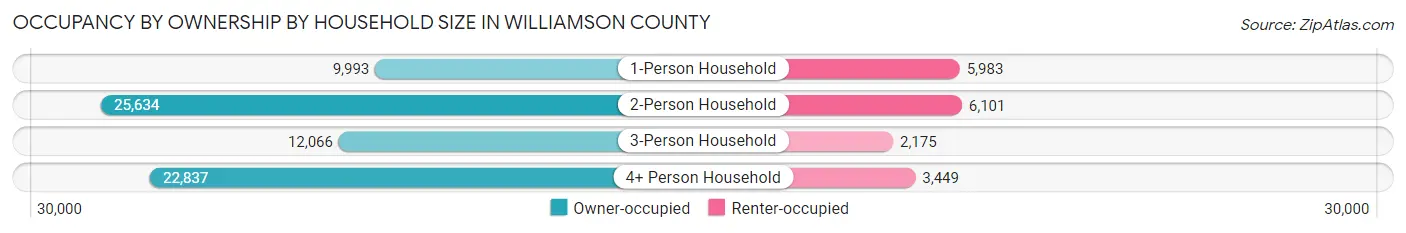
| Household Size | Owner-occupied | Renter-occupied |
| 1-Person Household | 9,993 (62.5%) | 5,983 (37.4%) |
| 2-Person Household | 25,634 (80.8%) | 6,101 (19.2%) |
| 3-Person Household | 12,066 (84.7%) | 2,175 (15.3%) |
| 4+ Person Household | 22,837 (86.9%) | 3,449 (13.1%) |
| Total Housing Units | 70,530 (79.9%) | 17,708 (20.1%) |
Occupancy by Educational Attainment in Williamson County
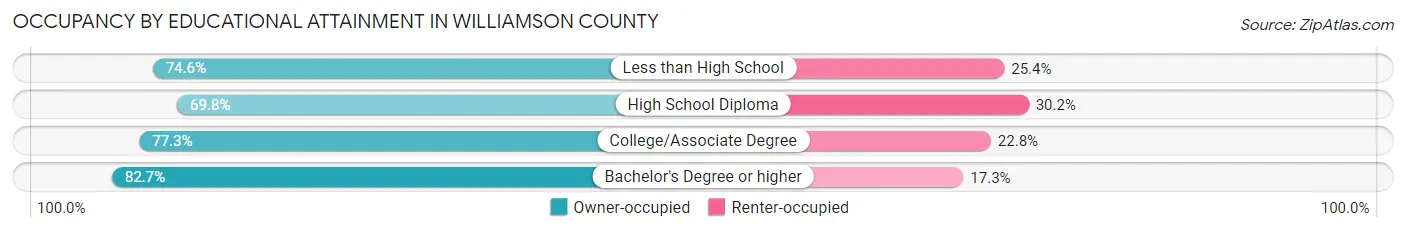
| Household Size | Owner-occupied | Renter-occupied |
| Less than High School | 1,978 (74.6%) | 674 (25.4%) |
| High School Diploma | 6,885 (69.8%) | 2,984 (30.2%) |
| College/Associate Degree | 13,524 (77.2%) | 3,982 (22.8%) |
| Bachelor's Degree or higher | 48,143 (82.7%) | 10,068 (17.3%) |
Occupancy by Age of Householder in Williamson County
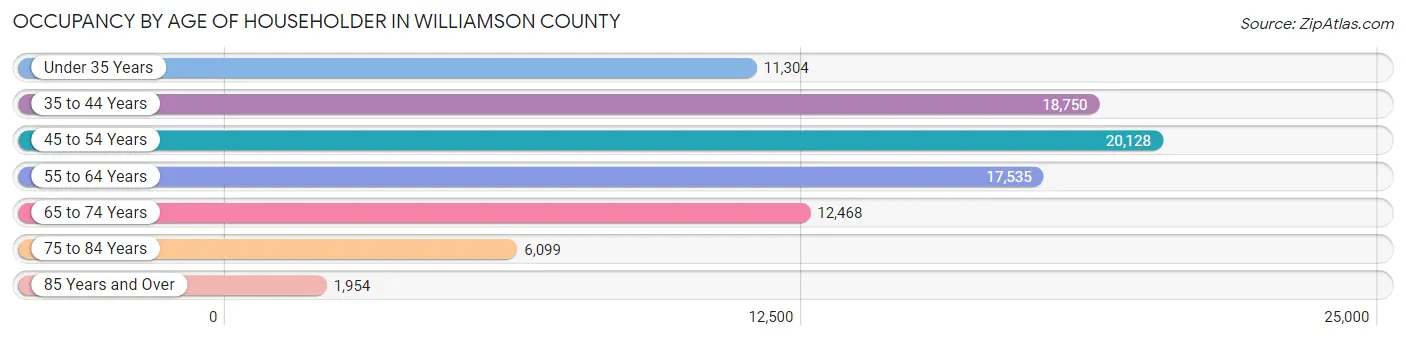
| Age Bracket | # Households | % Households |
| Under 35 Years | 11,304 | 12.8% |
| 35 to 44 Years | 18,750 | 21.2% |
| 45 to 54 Years | 20,128 | 22.8% |
| 55 to 64 Years | 17,535 | 19.9% |
| 65 to 74 Years | 12,468 | 14.1% |
| 75 to 84 Years | 6,099 | 6.9% |
| 85 Years and Over | 1,954 | 2.2% |
| Total | 88,238 | 100.0% |
Housing Finances in Williamson County
Median Income by Occupancy in Williamson County
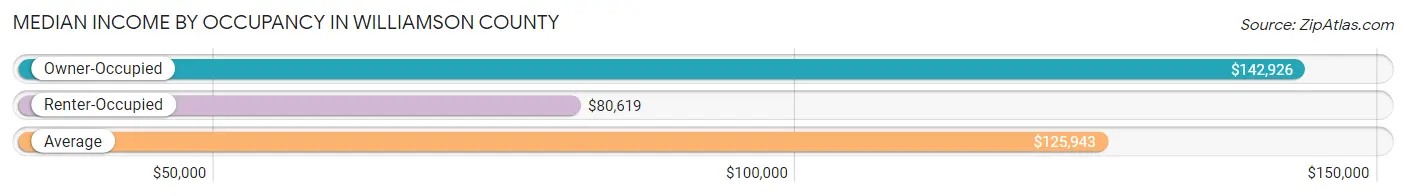
| Occupancy Type | # Households | Median Income |
| Owner-Occupied | 70,530 (79.9%) | $142,926 |
| Renter-Occupied | 17,708 (20.1%) | $80,619 |
| Average | 88,238 (100.0%) | $125,943 |
Occupancy by Householder Income Bracket in Williamson County
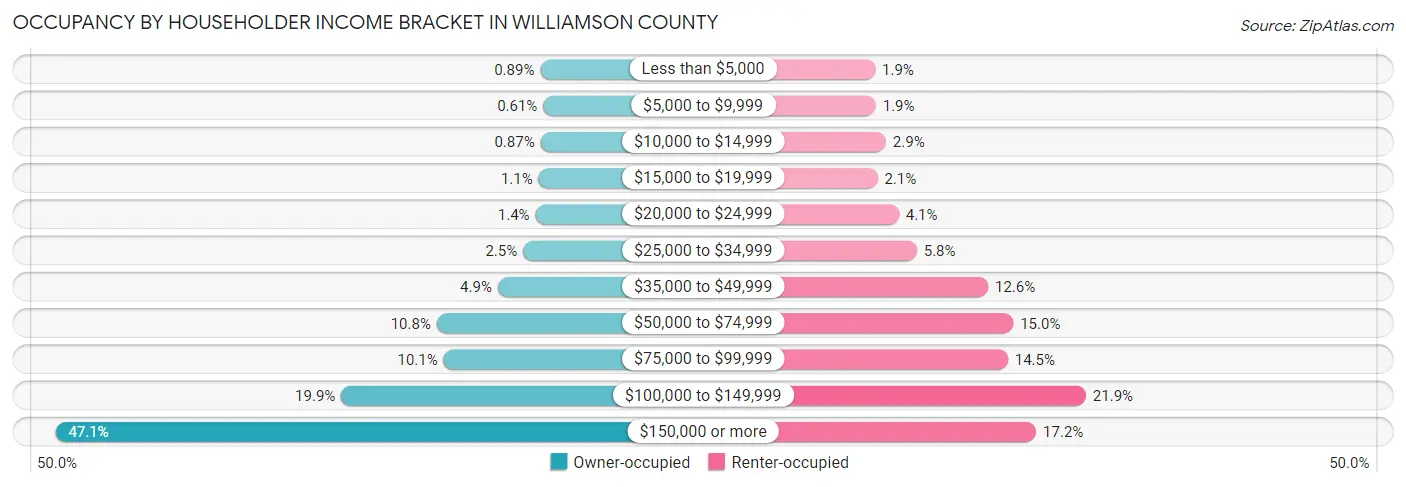
| Income Bracket | Owner-occupied | Renter-occupied |
| Less than $5,000 | 629 (0.9%) | 330 (1.9%) |
| $5,000 to $9,999 | 427 (0.6%) | 342 (1.9%) |
| $10,000 to $14,999 | 613 (0.9%) | 512 (2.9%) |
| $15,000 to $19,999 | 741 (1.1%) | 370 (2.1%) |
| $20,000 to $24,999 | 952 (1.3%) | 729 (4.1%) |
| $25,000 to $34,999 | 1,786 (2.5%) | 1,033 (5.8%) |
| $35,000 to $49,999 | 3,486 (4.9%) | 2,235 (12.6%) |
| $50,000 to $74,999 | 7,579 (10.7%) | 2,659 (15.0%) |
| $75,000 to $99,999 | 7,121 (10.1%) | 2,567 (14.5%) |
| $100,000 to $149,999 | 14,002 (19.9%) | 3,886 (21.9%) |
| $150,000 or more | 33,194 (47.1%) | 3,045 (17.2%) |
| Total | 70,530 (100.0%) | 17,708 (100.0%) |
Monthly Housing Cost Tiers in Williamson County
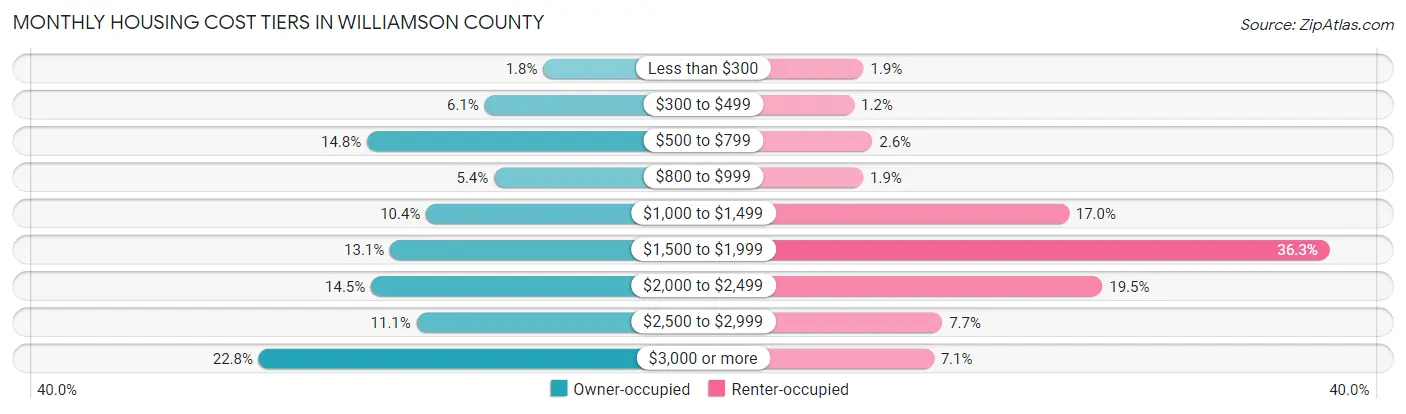
| Monthly Cost | Owner-occupied | Renter-occupied |
| Less than $300 | 1,272 (1.8%) | 340 (1.9%) |
| $300 to $499 | 4,317 (6.1%) | 218 (1.2%) |
| $500 to $799 | 10,426 (14.8%) | 455 (2.6%) |
| $800 to $999 | 3,826 (5.4%) | 335 (1.9%) |
| $1,000 to $1,499 | 7,348 (10.4%) | 3,018 (17.0%) |
| $1,500 to $1,999 | 9,227 (13.1%) | 6,420 (36.2%) |
| $2,000 to $2,499 | 10,214 (14.5%) | 3,455 (19.5%) |
| $2,500 to $2,999 | 7,853 (11.1%) | 1,367 (7.7%) |
| $3,000 or more | 16,047 (22.8%) | 1,255 (7.1%) |
| Total | 70,530 (100.0%) | 17,708 (100.0%) |
Physical Housing Characteristics in Williamson County
Housing Structures in Williamson County
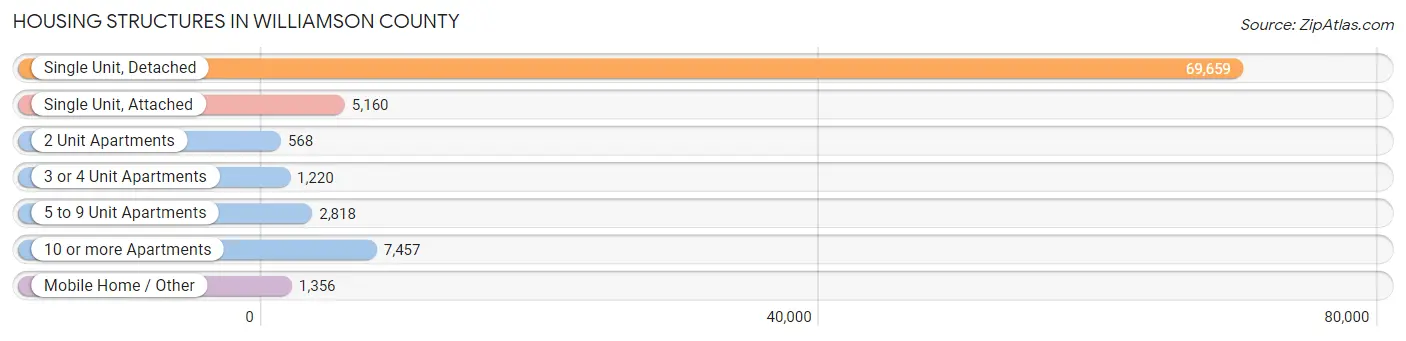
| Structure Type | # Housing Units | % Housing Units |
| Single Unit, Detached | 69,659 | 78.9% |
| Single Unit, Attached | 5,160 | 5.9% |
| 2 Unit Apartments | 568 | 0.6% |
| 3 or 4 Unit Apartments | 1,220 | 1.4% |
| 5 to 9 Unit Apartments | 2,818 | 3.2% |
| 10 or more Apartments | 7,457 | 8.5% |
| Mobile Home / Other | 1,356 | 1.5% |
| Total | 88,238 | 100.0% |
Housing Structures by Occupancy in Williamson County
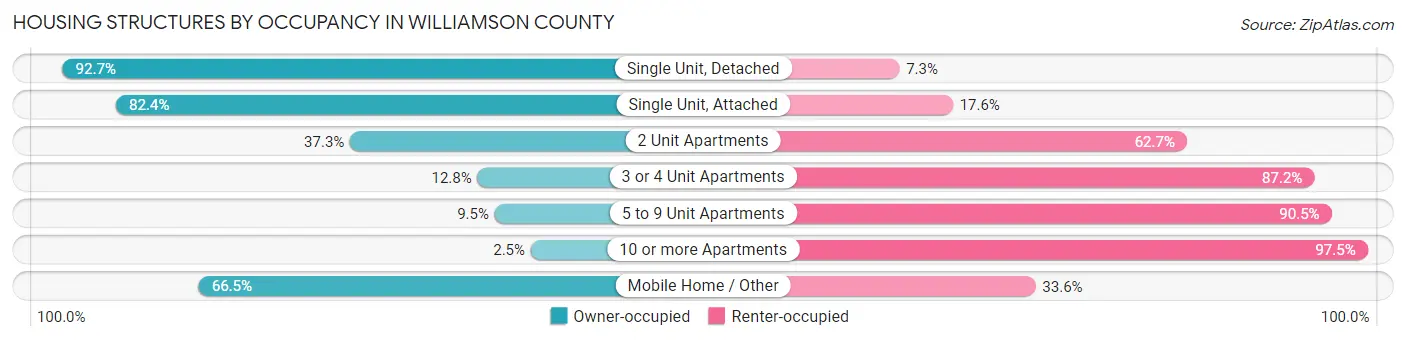
| Structure Type | Owner-occupied | Renter-occupied |
| Single Unit, Detached | 64,555 (92.7%) | 5,104 (7.3%) |
| Single Unit, Attached | 4,251 (82.4%) | 909 (17.6%) |
| 2 Unit Apartments | 212 (37.3%) | 356 (62.7%) |
| 3 or 4 Unit Apartments | 156 (12.8%) | 1,064 (87.2%) |
| 5 to 9 Unit Apartments | 267 (9.5%) | 2,551 (90.5%) |
| 10 or more Apartments | 188 (2.5%) | 7,269 (97.5%) |
| Mobile Home / Other | 901 (66.4%) | 455 (33.6%) |
| Total | 70,530 (79.9%) | 17,708 (20.1%) |
Housing Structures by Number of Rooms in Williamson County
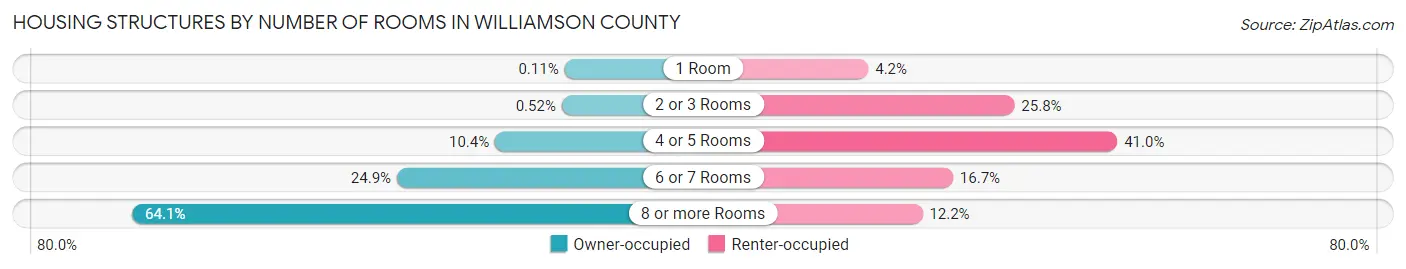
| Number of Rooms | Owner-occupied | Renter-occupied |
| 1 Room | 76 (0.1%) | 744 (4.2%) |
| 2 or 3 Rooms | 365 (0.5%) | 4,573 (25.8%) |
| 4 or 5 Rooms | 7,321 (10.4%) | 7,268 (41.0%) |
| 6 or 7 Rooms | 17,571 (24.9%) | 2,961 (16.7%) |
| 8 or more Rooms | 45,197 (64.1%) | 2,162 (12.2%) |
| Total | 70,530 (100.0%) | 17,708 (100.0%) |
Housing Structure by Heating Type in Williamson County
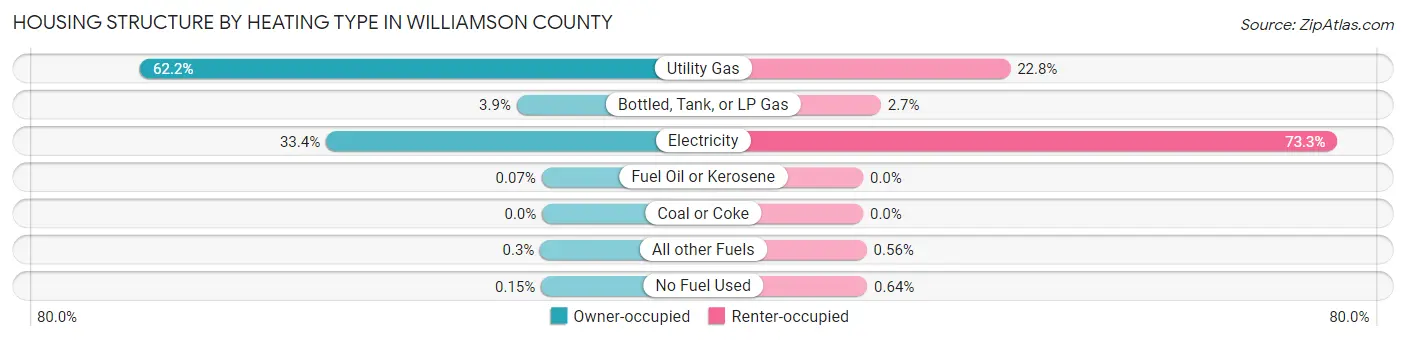
| Heating Type | Owner-occupied | Renter-occupied |
| Utility Gas | 43,839 (62.2%) | 4,029 (22.8%) |
| Bottled, Tank, or LP Gas | 2,763 (3.9%) | 485 (2.7%) |
| Electricity | 23,562 (33.4%) | 12,981 (73.3%) |
| Fuel Oil or Kerosene | 47 (0.1%) | 0 (0.0%) |
| Coal or Coke | 0 (0.0%) | 0 (0.0%) |
| All other Fuels | 214 (0.3%) | 100 (0.6%) |
| No Fuel Used | 105 (0.2%) | 113 (0.6%) |
| Total | 70,530 (100.0%) | 17,708 (100.0%) |
Household Vehicle Usage in Williamson County
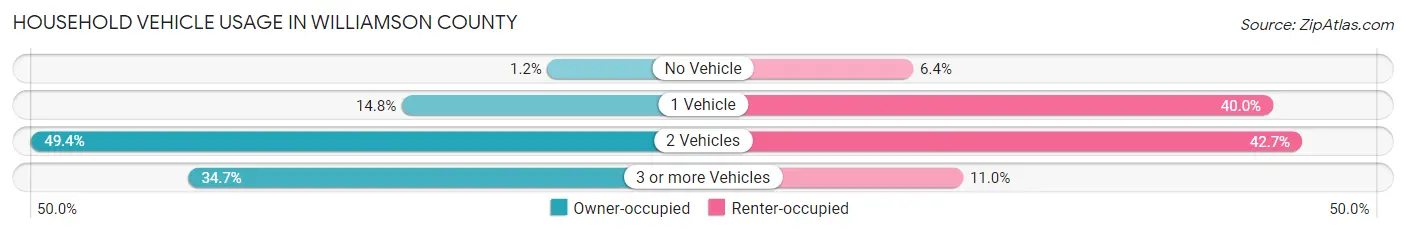
| Vehicles per Household | Owner-occupied | Renter-occupied |
| No Vehicle | 822 (1.2%) | 1,128 (6.4%) |
| 1 Vehicle | 10,417 (14.8%) | 7,074 (40.0%) |
| 2 Vehicles | 34,819 (49.4%) | 7,554 (42.7%) |
| 3 or more Vehicles | 24,472 (34.7%) | 1,952 (11.0%) |
| Total | 70,530 (100.0%) | 17,708 (100.0%) |
Real Estate & Mortgages in Williamson County
Real Estate and Mortgage Overview in Williamson County
| Characteristic | Without Mortgage | With Mortgage |
| Housing Units | 21,920 | 48,610 |
| Median Property Value | $606,500 | $612,800 |
| Median Household Income | $96,988 | $25,779 |
| Monthly Housing Costs | $669 | $15,911 |
| Real Estate Taxes | $2,746 | $448 |
Property Value by Mortgage Status in Williamson County
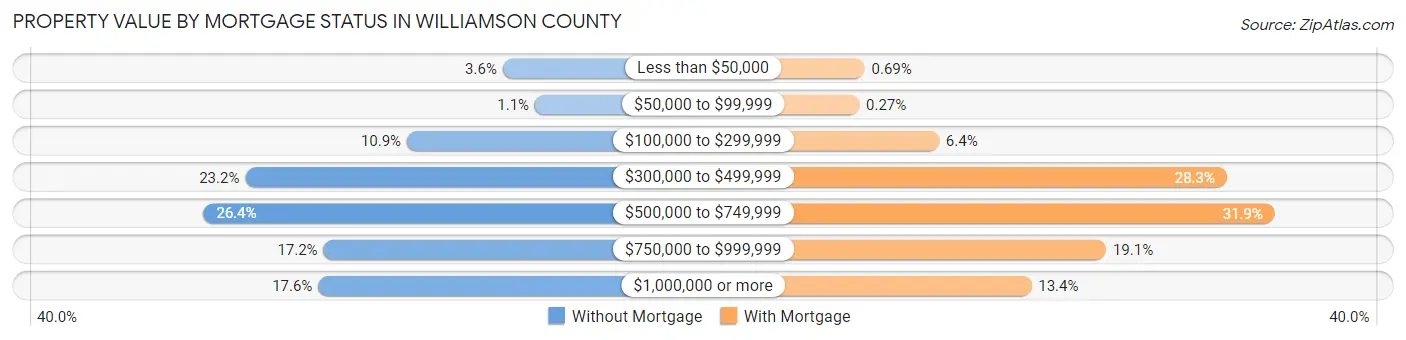
| Property Value | Without Mortgage | With Mortgage |
| Less than $50,000 | 783 (3.6%) | 336 (0.7%) |
| $50,000 to $99,999 | 246 (1.1%) | 129 (0.3%) |
| $100,000 to $299,999 | 2,383 (10.9%) | 3,087 (6.4%) |
| $300,000 to $499,999 | 5,084 (23.2%) | 13,745 (28.3%) |
| $500,000 to $749,999 | 5,783 (26.4%) | 15,527 (31.9%) |
| $750,000 to $999,999 | 3,776 (17.2%) | 9,275 (19.1%) |
| $1,000,000 or more | 3,865 (17.6%) | 6,511 (13.4%) |
| Total | 21,920 (100.0%) | 48,610 (100.0%) |
Household Income by Mortgage Status in Williamson County
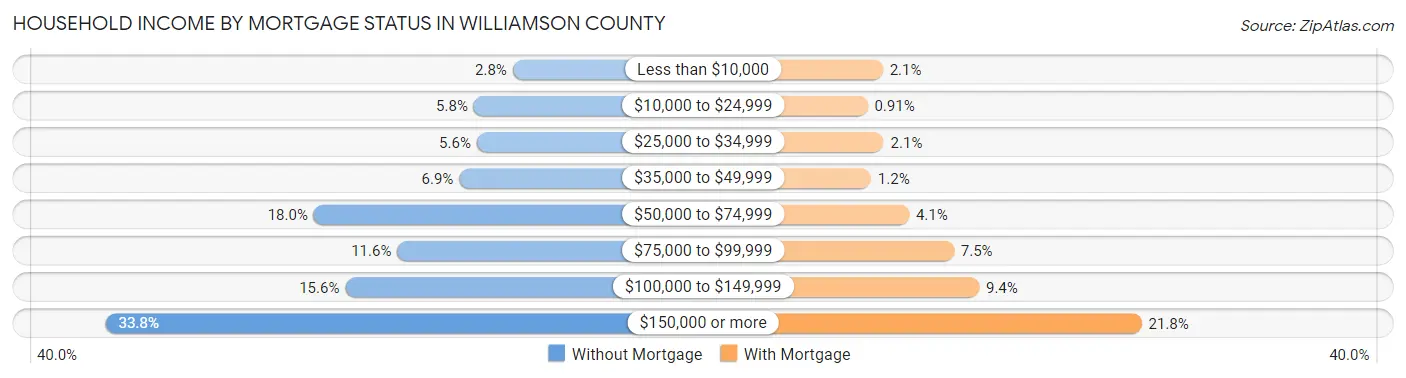
| Household Income | Without Mortgage | With Mortgage |
| Less than $10,000 | 615 (2.8%) | 1,007 (2.1%) |
| $10,000 to $24,999 | 1,268 (5.8%) | 441 (0.9%) |
| $25,000 to $34,999 | 1,216 (5.6%) | 1,038 (2.1%) |
| $35,000 to $49,999 | 1,510 (6.9%) | 570 (1.2%) |
| $50,000 to $74,999 | 3,938 (18.0%) | 1,976 (4.1%) |
| $75,000 to $99,999 | 2,546 (11.6%) | 3,641 (7.5%) |
| $100,000 to $149,999 | 3,412 (15.6%) | 4,575 (9.4%) |
| $150,000 or more | 7,415 (33.8%) | 10,590 (21.8%) |
| Total | 21,920 (100.0%) | 48,610 (100.0%) |
Property Value to Household Income Ratio in Williamson County
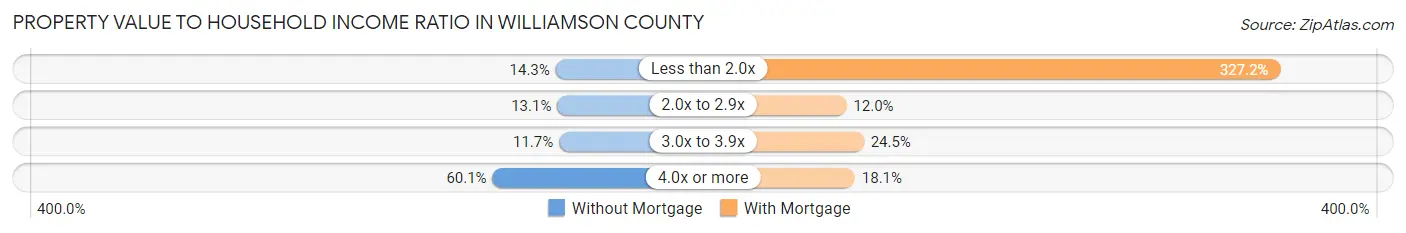
| Value-to-Income Ratio | Without Mortgage | With Mortgage |
| Less than 2.0x | 3,124 (14.2%) | 159,064 (327.2%) |
| 2.0x to 2.9x | 2,865 (13.1%) | 5,828 (12.0%) |
| 3.0x to 3.9x | 2,574 (11.7%) | 11,926 (24.5%) |
| 4.0x or more | 13,178 (60.1%) | 8,815 (18.1%) |
| Total | 21,920 (100.0%) | 48,610 (100.0%) |
Real Estate Taxes by Mortgage Status in Williamson County
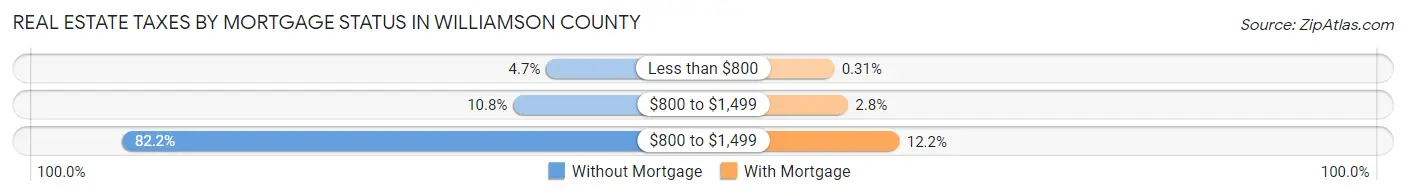
| Property Taxes | Without Mortgage | With Mortgage |
| Less than $800 | 1,035 (4.7%) | 149 (0.3%) |
| $800 to $1,499 | 2,359 (10.8%) | 1,368 (2.8%) |
| $800 to $1,499 | 18,024 (82.2%) | 5,926 (12.2%) |
| Total | 21,920 (100.0%) | 48,610 (100.0%) |
Health & Disability in Williamson County
Health Insurance Coverage by Age in Williamson County
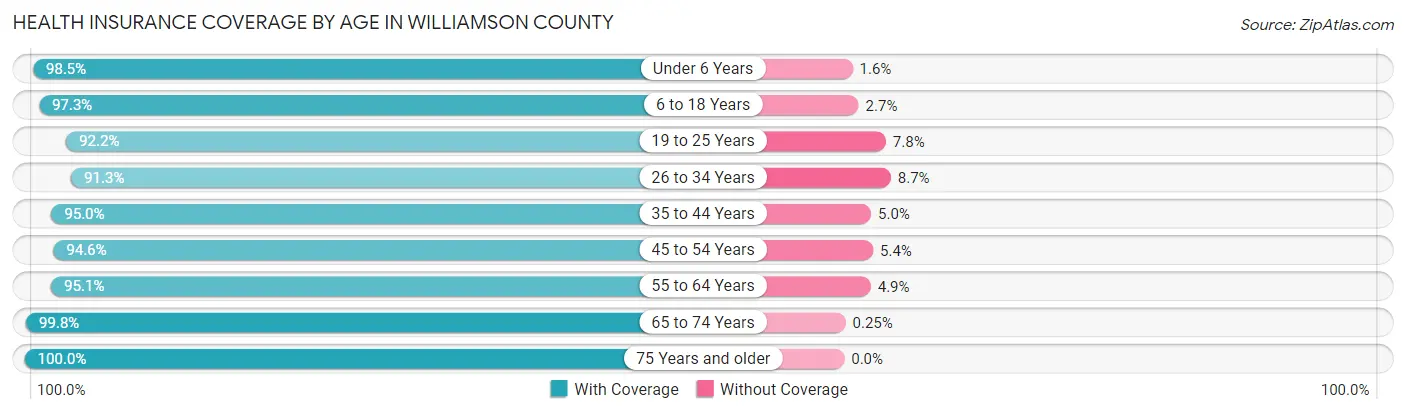
| Age Bracket | With Coverage | Without Coverage |
| Under 6 Years | 16,118 (98.5%) | 253 (1.5%) |
| 6 to 18 Years | 51,620 (97.3%) | 1,423 (2.7%) |
| 19 to 25 Years | 17,137 (92.2%) | 1,441 (7.8%) |
| 26 to 34 Years | 18,287 (91.3%) | 1,739 (8.7%) |
| 35 to 44 Years | 34,702 (95.0%) | 1,828 (5.0%) |
| 45 to 54 Years | 35,679 (94.6%) | 2,023 (5.4%) |
| 55 to 64 Years | 30,315 (95.1%) | 1,577 (4.9%) |
| 65 to 74 Years | 21,124 (99.8%) | 54 (0.3%) |
| 75 Years and older | 12,952 (100.0%) | 0 (0.0%) |
| Total | 237,934 (95.8%) | 10,338 (4.2%) |
Health Insurance Coverage by Citizenship Status in Williamson County
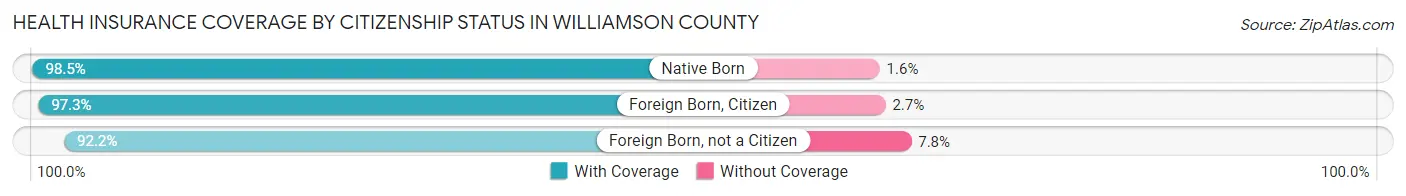
| Citizenship Status | With Coverage | Without Coverage |
| Native Born | 16,118 (98.5%) | 253 (1.5%) |
| Foreign Born, Citizen | 51,620 (97.3%) | 1,423 (2.7%) |
| Foreign Born, not a Citizen | 17,137 (92.2%) | 1,441 (7.8%) |
Health Insurance Coverage by Household Income in Williamson County
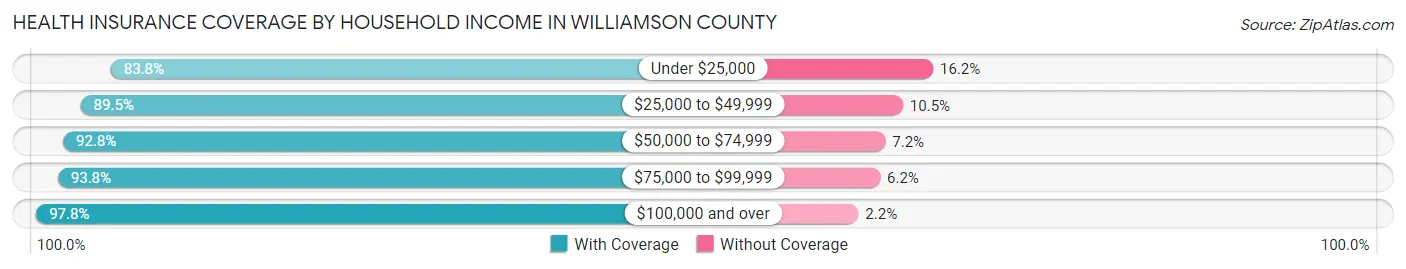
| Household Income | With Coverage | Without Coverage |
| Under $25,000 | 7,905 (83.8%) | 1,524 (16.2%) |
| $25,000 to $49,999 | 15,171 (89.5%) | 1,782 (10.5%) |
| $50,000 to $74,999 | 21,239 (92.8%) | 1,654 (7.2%) |
| $75,000 to $99,999 | 23,915 (93.8%) | 1,592 (6.2%) |
| $100,000 and over | 169,656 (97.8%) | 3,780 (2.2%) |
Public vs Private Health Insurance Coverage by Age in Williamson County
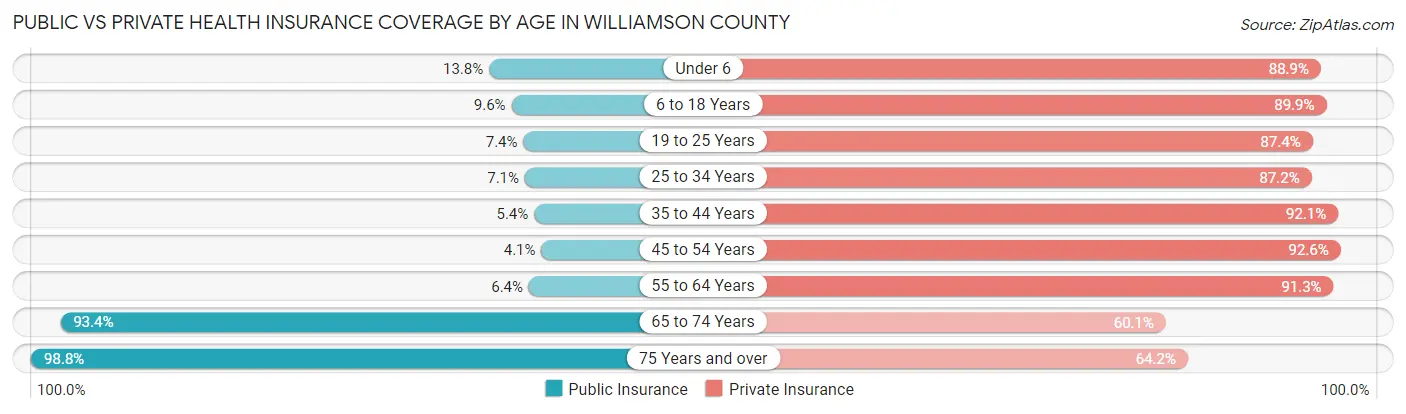
| Age Bracket | Public Insurance | Private Insurance |
| Under 6 | 2,258 (13.8%) | 14,555 (88.9%) |
| 6 to 18 Years | 5,107 (9.6%) | 47,698 (89.9%) |
| 19 to 25 Years | 1,379 (7.4%) | 16,235 (87.4%) |
| 25 to 34 Years | 1,429 (7.1%) | 17,459 (87.2%) |
| 35 to 44 Years | 1,982 (5.4%) | 33,644 (92.1%) |
| 45 to 54 Years | 1,537 (4.1%) | 34,909 (92.6%) |
| 55 to 64 Years | 2,040 (6.4%) | 29,101 (91.2%) |
| 65 to 74 Years | 19,776 (93.4%) | 12,735 (60.1%) |
| 75 Years and over | 12,799 (98.8%) | 8,316 (64.2%) |
| Total | 48,307 (19.5%) | 214,652 (86.5%) |
Disability Status by Sex by Age in Williamson County
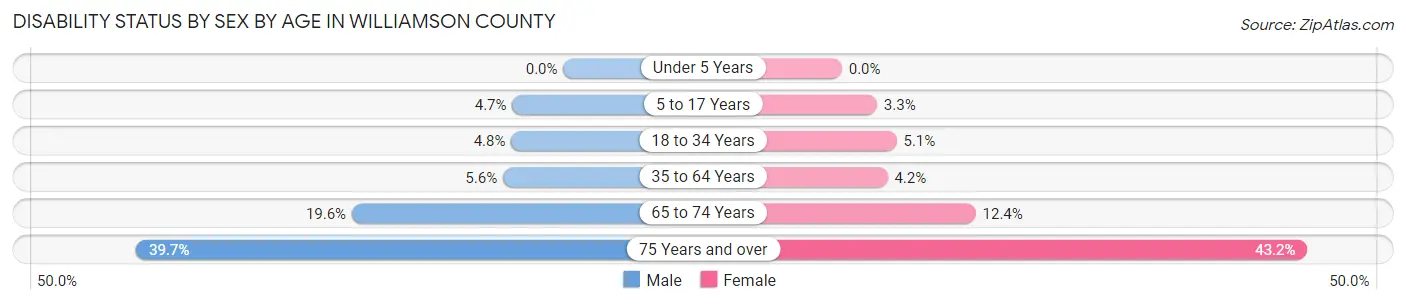
| Age Bracket | Male | Female |
| Under 5 Years | 0 (0.0%) | 0 (0.0%) |
| 5 to 17 Years | 1,251 (4.7%) | 826 (3.3%) |
| 18 to 34 Years | 1,017 (4.8%) | 1,082 (5.1%) |
| 35 to 64 Years | 2,938 (5.6%) | 2,275 (4.2%) |
| 65 to 74 Years | 1,996 (19.6%) | 1,367 (12.4%) |
| 75 Years and over | 2,190 (39.7%) | 3,209 (43.2%) |
Disability Class by Sex by Age in Williamson County
Disability Class: Hearing Difficulty
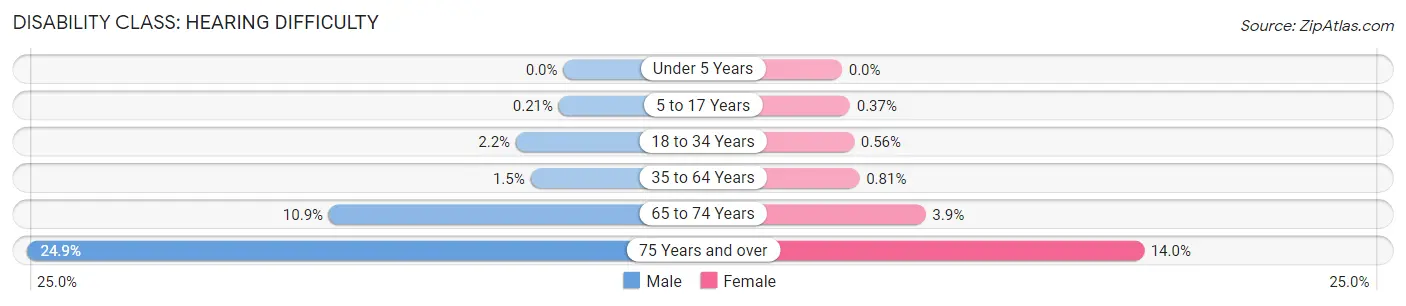
| Age Bracket | Male | Female |
| Under 5 Years | 0 (0.0%) | 0 (0.0%) |
| 5 to 17 Years | 56 (0.2%) | 95 (0.4%) |
| 18 to 34 Years | 463 (2.2%) | 119 (0.6%) |
| 35 to 64 Years | 796 (1.5%) | 437 (0.8%) |
| 65 to 74 Years | 1,107 (10.9%) | 427 (3.9%) |
| 75 Years and over | 1,373 (24.9%) | 1,041 (14.0%) |
Disability Class: Vision Difficulty
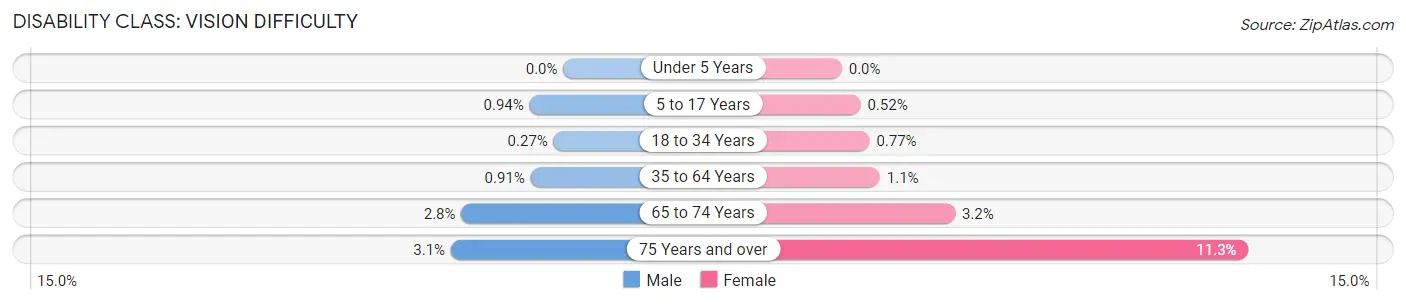
| Age Bracket | Male | Female |
| Under 5 Years | 0 (0.0%) | 0 (0.0%) |
| 5 to 17 Years | 249 (0.9%) | 132 (0.5%) |
| 18 to 34 Years | 56 (0.3%) | 164 (0.8%) |
| 35 to 64 Years | 479 (0.9%) | 570 (1.1%) |
| 65 to 74 Years | 289 (2.8%) | 347 (3.2%) |
| 75 Years and over | 173 (3.1%) | 841 (11.3%) |
Disability Class: Cognitive Difficulty
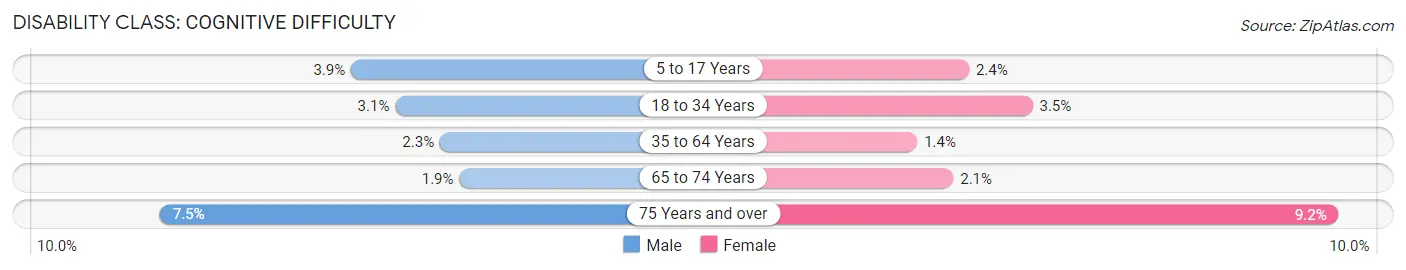
| Age Bracket | Male | Female |
| 5 to 17 Years | 1,043 (3.9%) | 599 (2.4%) |
| 18 to 34 Years | 658 (3.1%) | 755 (3.5%) |
| 35 to 64 Years | 1,202 (2.3%) | 750 (1.4%) |
| 65 to 74 Years | 196 (1.9%) | 228 (2.1%) |
| 75 Years and over | 414 (7.5%) | 685 (9.2%) |
Disability Class: Ambulatory Difficulty
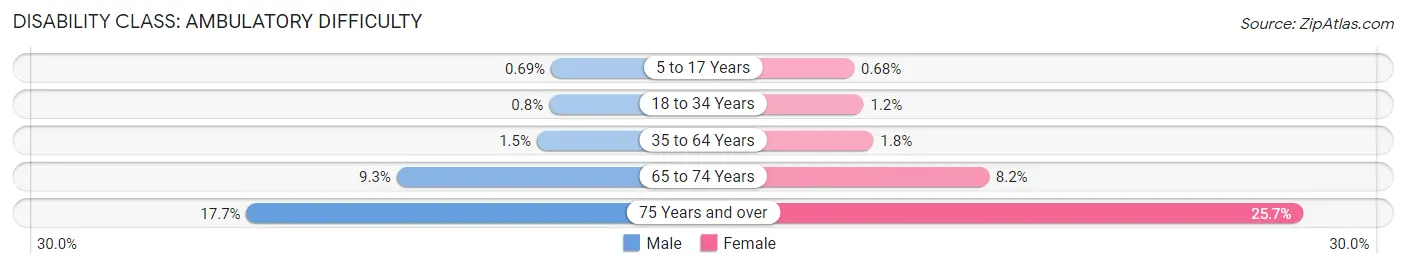
| Age Bracket | Male | Female |
| 5 to 17 Years | 183 (0.7%) | 172 (0.7%) |
| 18 to 34 Years | 168 (0.8%) | 257 (1.2%) |
| 35 to 64 Years | 776 (1.5%) | 946 (1.8%) |
| 65 to 74 Years | 944 (9.3%) | 901 (8.2%) |
| 75 Years and over | 975 (17.6%) | 1,909 (25.7%) |
Disability Class: Self-Care Difficulty
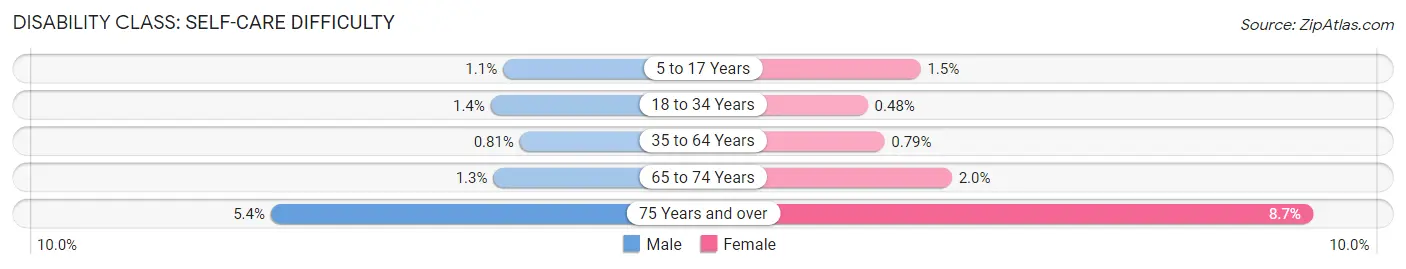
| Age Bracket | Male | Female |
| 5 to 17 Years | 297 (1.1%) | 371 (1.5%) |
| 18 to 34 Years | 285 (1.3%) | 103 (0.5%) |
| 35 to 64 Years | 424 (0.8%) | 422 (0.8%) |
| 65 to 74 Years | 132 (1.3%) | 225 (2.0%) |
| 75 Years and over | 300 (5.4%) | 649 (8.7%) |
Technology Access in Williamson County
Computing Device Access in Williamson County
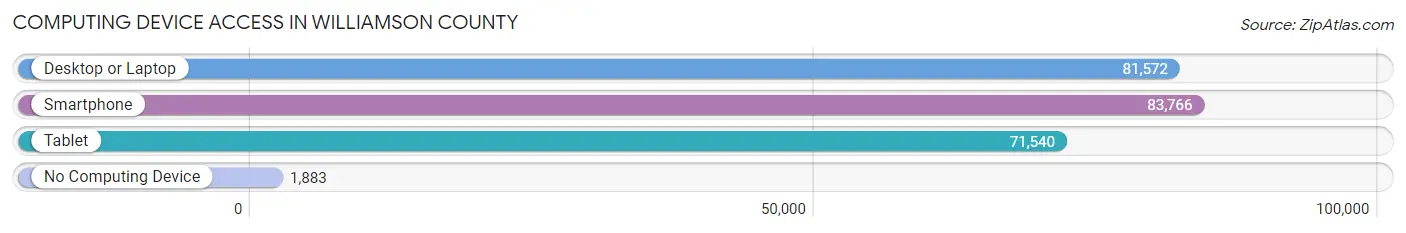
| Device Type | # Households | % Households |
| Desktop or Laptop | 81,572 | 92.4% |
| Smartphone | 83,766 | 94.9% |
| Tablet | 71,540 | 81.1% |
| No Computing Device | 1,883 | 2.1% |
| Total | 88,238 | 100.0% |
Internet Access in Williamson County
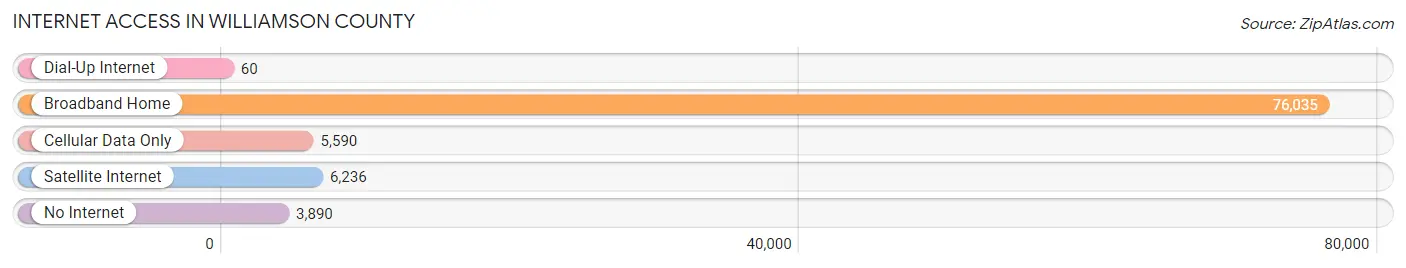
| Internet Type | # Households | % Households |
| Dial-Up Internet | 60 | 0.1% |
| Broadband Home | 76,035 | 86.2% |
| Cellular Data Only | 5,590 | 6.3% |
| Satellite Internet | 6,236 | 7.1% |
| No Internet | 3,890 | 4.4% |
| Total | 88,238 | 100.0% |
Williamson County Summary
Williamson County is located in the state of Tennessee, in the United States of America. It is located in the Middle Tennessee region, and is part of the Nashville metropolitan area. The county was established in 1799, and is named after Hugh Williamson, a North Carolina politician who signed the U.S. Constitution. The county seat is Franklin, and the population of the county was estimated to be 226,715 in 2019.
Geography
Williamson County is located in the Middle Tennessee region of the state, and is bordered by Davidson County to the north, Rutherford County to the east, Maury County to the south, and Hickman County to the west. The county covers an area of 526 square miles, and is mostly composed of rolling hills and valleys. The Harpeth River runs through the county, and there are several small lakes and ponds scattered throughout the area. The highest point in the county is located at the intersection of Franklin and Brentwood, and is 690 feet above sea level.
Economy
Williamson County has a strong and diverse economy. The county is home to several large corporations, including Nissan North America, Community Health Systems, and Mars Petcare. The county is also home to several smaller businesses, including restaurants, retail stores, and professional services. The county is also home to several educational institutions, including the University of Tennessee, Vanderbilt University, and Belmont University.
The county is also home to several tourist attractions, including the Franklin Battlefield, the Carter House, and the Lotz House. The county is also home to several wineries, and is a popular destination for wine enthusiasts.
Demographics
As of 2019, the population of Williamson County was estimated to be 226,715. The population is predominantly white (83.3%), with African Americans making up 8.7% of the population, and Hispanics making up 5.2%. The median household income in the county is $95,845, and the median home value is $420,000.
The county is home to several religious denominations, including Christianity, Judaism, and Islam. The county is also home to several cultural institutions, including the Williamson County Historical Society, the Williamson County Arts Council, and the Williamson County Public Library.
Conclusion
Williamson County is a vibrant and diverse county located in the Middle Tennessee region of the state. The county is home to several large corporations, educational institutions, and tourist attractions. The population of the county is predominantly white, with African Americans and Hispanics making up a small portion of the population. The county is home to several religious denominations, and is a popular destination for wine enthusiasts.
Common Questions
What is the Total Population of Williamson County?
Total Population of Williamson County is 248,897.
What is the Total Male Population of Williamson County?
Total Male Population of Williamson County is 123,066.
What is the Total Female Population of Williamson County?
Total Female Population of Williamson County is 125,831.
What is the Ratio of Males per 100 Females in Williamson County?
There are 97.80 Males per 100 Females in Williamson County.
What is the Ratio of Females per 100 Males in Williamson County?
There are 102.25 Females per 100 Males in Williamson County.
What is the Median Population Age in Williamson County?
Median Population Age in Williamson County is 40.0 Years.
What is the Average Family Size in Williamson County
Average Family Size in Williamson County is 3.2 People.
What is the Average Household Size in Williamson County
Average Household Size in Williamson County is 2.8 People.
What is Per Capita Income in Williamson County?
Per Capita income in Williamson County is $61,451.
What is the Median Family Income in Williamson County?
Median Family Income in Williamson County is $145,896.
What is the Median Household income in Williamson County?
Median Household Income in Williamson County is $125,943.
What is Income or Wage Gap in Williamson County?
Income or Wage Gap in Williamson County is 47.9%.
Women in Williamson County earn 52.1 cents for every dollar earned by a man.
What is Inequality or Gini Index in Williamson County?
Inequality or Gini Index in Williamson County is 0.45.
How Large is the Labor Force in Williamson County?
There are 130,307 People in the Labor Forcein in Williamson County.
What is the Percentage of People in the Labor Force in Williamson County?
67.8% of People are in the Labor Force in Williamson County.
What is the Unemployment Rate in Williamson County?
Unemployment Rate in Williamson County is 2.1%.