Washington County, TN
Washington County Map
Washington County Overview
133,282
TOTAL POPULATION
65,800
MALE POPULATION
67,482
FEMALE POPULATION
97.51
MALES / 100 FEMALES
102.56
FEMALES / 100 MALES
40.1
MEDIAN AGE
2.9
AVG FAMILY SIZE
2.3
AVG HOUSEHOLD SIZE
$35,562
PER CAPITA INCOME
$78,783
AVG FAMILY INCOME
$58,507
AVG HOUSEHOLD INCOME
29.1%
WAGE / INCOME GAP [ % ]
70.9¢/ $1
WAGE / INCOME GAP [ $ ]
$10,796
FAMILY INCOME DEFICIT
0.49
INEQUALITY / GINI INDEX
66,701
LABOR FORCE [ PEOPLE ]
59.7%
PERCENT IN LABOR FORCE
5.0%
UNEMPLOYMENT RATE
Washington County Area Codes
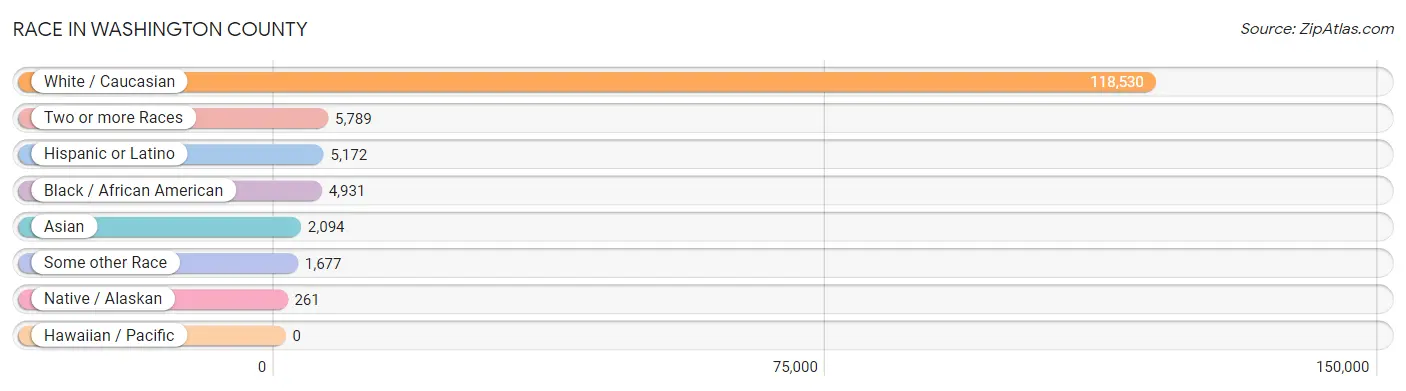
Race in Washington County
The most populous races in Washington County are White / Caucasian (118,530 | 88.9%), Two or more Races (5,789 | 4.3%), and Hispanic or Latino (5,172 | 3.9%).
| Race | # Population | % Population |
| Asian | 2,094 | 1.6% |
| Black / African American | 4,931 | 3.7% |
| Hawaiian / Pacific | 0 | 0.0% |
| Hispanic or Latino | 5,172 | 3.9% |
| Native / Alaskan | 261 | 0.2% |
| White / Caucasian | 118,530 | 88.9% |
| Two or more Races | 5,789 | 4.3% |
| Some other Race | 1,677 | 1.3% |
| Total | 133,282 | 100.0% |
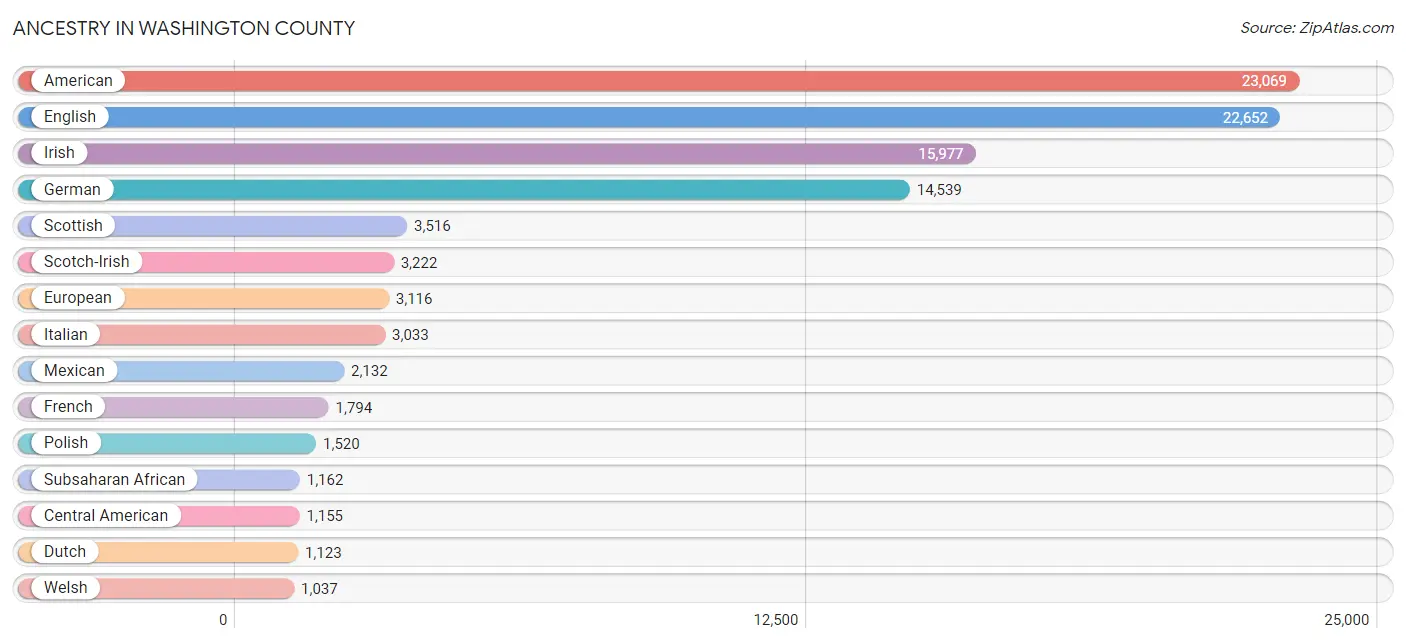
Ancestry in Washington County
The most populous ancestries reported in Washington County are American (23,069 | 17.3%), English (22,652 | 17.0%), Irish (15,977 | 12.0%), German (14,539 | 10.9%), and Scottish (3,516 | 2.6%), together accounting for 59.9% of all Washington County residents.
| Ancestry | # Population | % Population |
| African | 156 | 0.1% |
| Albanian | 13 | 0.0% |
| American | 23,069 | 17.3% |
| Arab | 596 | 0.4% |
| Armenian | 26 | 0.0% |
| Assyrian / Chaldean / Syriac | 8 | 0.0% |
| Australian | 38 | 0.0% |
| Austrian | 304 | 0.2% |
| Bahamian | 20 | 0.0% |
| Belgian | 51 | 0.0% |
| Bhutanese | 387 | 0.3% |
| Blackfeet | 15 | 0.0% |
| Bolivian | 16 | 0.0% |
| Brazilian | 30 | 0.0% |
| British | 702 | 0.5% |
| Bulgarian | 20 | 0.0% |
| Burmese | 327 | 0.3% |
| Cajun | 23 | 0.0% |
| Canadian | 69 | 0.1% |
| Celtic | 16 | 0.0% |
| Central American | 1,155 | 0.9% |
| Central American Indian | 19 | 0.0% |
| Cherokee | 459 | 0.3% |
| Chilean | 158 | 0.1% |
| Chinese | 70 | 0.1% |
| Chippewa | 44 | 0.0% |
| Choctaw | 4 | 0.0% |
| Colombian | 156 | 0.1% |
| Costa Rican | 18 | 0.0% |
| Creek | 11 | 0.0% |
| Croatian | 20 | 0.0% |
| Crow | 45 | 0.0% |
| Cuban | 371 | 0.3% |
| Czech | 123 | 0.1% |
| Czechoslovakian | 18 | 0.0% |
| Danish | 99 | 0.1% |
| Dominican | 6 | 0.0% |
| Dutch | 1,123 | 0.8% |
| Eastern European | 312 | 0.2% |
| Ecuadorian | 52 | 0.0% |
| Egyptian | 125 | 0.1% |
| English | 22,652 | 17.0% |
| Ethiopian | 65 | 0.1% |
| European | 3,116 | 2.3% |
| Filipino | 38 | 0.0% |
| Finnish | 206 | 0.2% |
| French | 1,794 | 1.3% |
| French American Indian | 7 | 0.0% |
| French Canadian | 289 | 0.2% |
| German | 14,539 | 10.9% |
| German Russian | 112 | 0.1% |
| Ghanaian | 153 | 0.1% |
| Greek | 78 | 0.1% |
| Guatemalan | 88 | 0.1% |
| Haitian | 15 | 0.0% |
| Honduran | 481 | 0.4% |
| Hungarian | 222 | 0.2% |
| Indian (Asian) | 731 | 0.5% |
| Iranian | 171 | 0.1% |
| Irish | 15,977 | 12.0% |
| Iroquois | 25 | 0.0% |
| Italian | 3,033 | 2.3% |
| Jamaican | 285 | 0.2% |
| Jordanian | 130 | 0.1% |
| Korean | 490 | 0.4% |
| Lebanese | 71 | 0.1% |
| Liberian | 349 | 0.3% |
| Lithuanian | 124 | 0.1% |
| Luxembourger | 3 | 0.0% |
| Malaysian | 9 | 0.0% |
| Mexican | 2,132 | 1.6% |
| Mexican American Indian | 176 | 0.1% |
| Mongolian | 70 | 0.1% |
| Native Hawaiian | 231 | 0.2% |
| Navajo | 3 | 0.0% |
| Nicaraguan | 12 | 0.0% |
| Nigerian | 136 | 0.1% |
| Northern European | 412 | 0.3% |
| Norwegian | 571 | 0.4% |
| Pakistani | 70 | 0.1% |
| Panamanian | 40 | 0.0% |
| Peruvian | 13 | 0.0% |
| Polish | 1,520 | 1.1% |
| Portuguese | 77 | 0.1% |
| Puerto Rican | 355 | 0.3% |
| Romanian | 156 | 0.1% |
| Russian | 221 | 0.2% |
| Salvadoran | 516 | 0.4% |
| Scandinavian | 400 | 0.3% |
| Scotch-Irish | 3,222 | 2.4% |
| Scottish | 3,516 | 2.6% |
| Seminole | 27 | 0.0% |
| Sioux | 14 | 0.0% |
| Slavic | 41 | 0.0% |
| Slovak | 39 | 0.0% |
| Slovene | 21 | 0.0% |
| South American | 684 | 0.5% |
| Spaniard | 136 | 0.1% |
| Spanish | 110 | 0.1% |
| Sri Lankan | 46 | 0.0% |
| Subsaharan African | 1,162 | 0.9% |
| Swedish | 633 | 0.5% |
| Swiss | 232 | 0.2% |
| Thai | 509 | 0.4% |
| Turkish | 59 | 0.0% |
| Ukrainian | 84 | 0.1% |
| Venezuelan | 289 | 0.2% |
| Welsh | 1,037 | 0.8% |
| West Indian | 20 | 0.0% |
| Yugoslavian | 30 | 0.0% |
| Zimbabwean | 25 | 0.0% | View All 111 Rows |
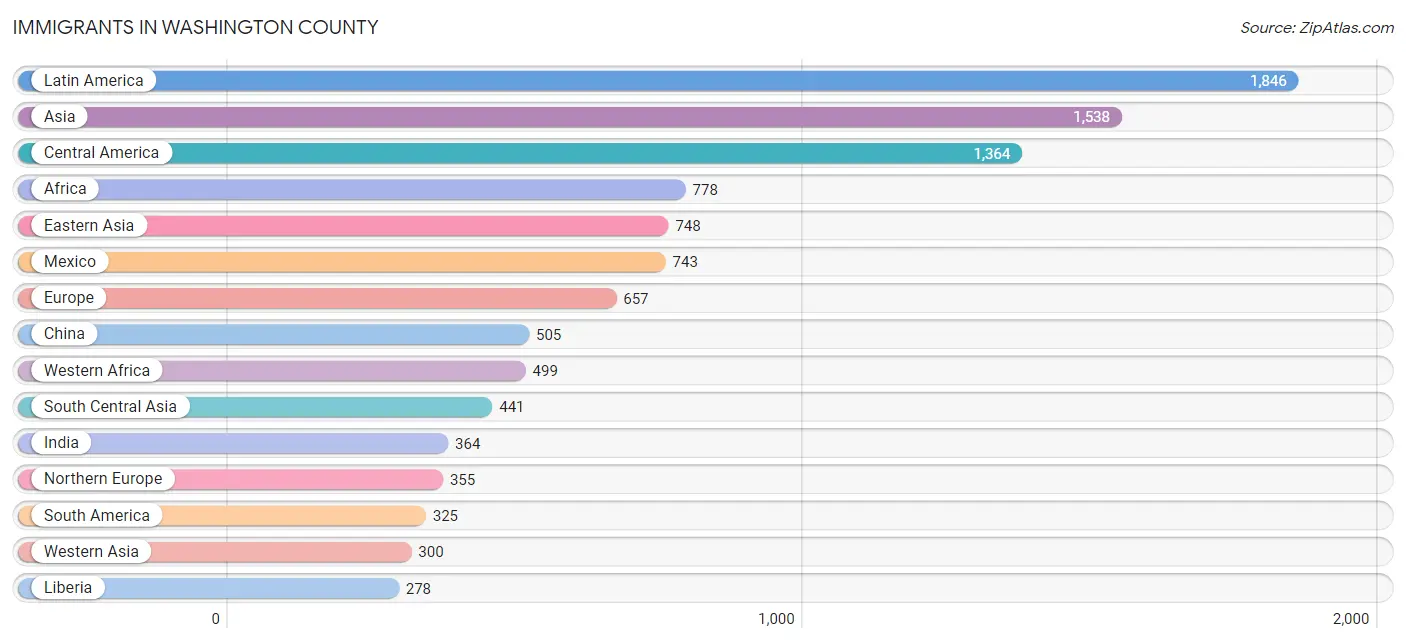
Immigrants in Washington County
The most numerous immigrant groups reported in Washington County came from Latin America (1,846 | 1.4%), Asia (1,538 | 1.1%), Central America (1,364 | 1.0%), Africa (778 | 0.6%), and Eastern Asia (748 | 0.6%), together accounting for 4.7% of all Washington County residents.
| Immigration Origin | # Population | % Population |
| Africa | 778 | 0.6% |
| Albania | 13 | 0.0% |
| Argentina | 8 | 0.0% |
| Asia | 1,538 | 1.1% |
| Australia | 48 | 0.0% |
| Austria | 18 | 0.0% |
| Bahamas | 13 | 0.0% |
| Bolivia | 7 | 0.0% |
| Bosnia and Herzegovina | 39 | 0.0% |
| Brazil | 57 | 0.0% |
| Cameroon | 61 | 0.1% |
| Canada | 164 | 0.1% |
| Caribbean | 157 | 0.1% |
| Central America | 1,364 | 1.0% |
| Chile | 158 | 0.1% |
| China | 505 | 0.4% |
| Costa Rica | 7 | 0.0% |
| Cuba | 88 | 0.1% |
| Dominican Republic | 1 | 0.0% |
| Eastern Africa | 78 | 0.1% |
| Eastern Asia | 748 | 0.6% |
| Eastern Europe | 222 | 0.2% |
| Egypt | 47 | 0.0% |
| El Salvador | 206 | 0.2% |
| England | 248 | 0.2% |
| Ethiopia | 21 | 0.0% |
| Europe | 657 | 0.5% |
| Germany | 50 | 0.0% |
| Ghana | 103 | 0.1% |
| Grenada | 20 | 0.0% |
| Guatemala | 125 | 0.1% |
| Honduras | 263 | 0.2% |
| India | 364 | 0.3% |
| Iraq | 26 | 0.0% |
| Japan | 79 | 0.1% |
| Jordan | 114 | 0.1% |
| Korea | 164 | 0.1% |
| Kuwait | 8 | 0.0% |
| Latin America | 1,846 | 1.4% |
| Latvia | 10 | 0.0% |
| Liberia | 278 | 0.2% |
| Mexico | 743 | 0.6% |
| Middle Africa | 96 | 0.1% |
| Morocco | 38 | 0.0% |
| Nigeria | 118 | 0.1% |
| Northern Africa | 97 | 0.1% |
| Northern Europe | 355 | 0.3% |
| Norway | 5 | 0.0% |
| Oceania | 64 | 0.1% |
| Pakistan | 76 | 0.1% |
| Panama | 20 | 0.0% |
| Peru | 13 | 0.0% |
| Philippines | 23 | 0.0% |
| Poland | 12 | 0.0% |
| Romania | 106 | 0.1% |
| Russia | 20 | 0.0% |
| Saudi Arabia | 79 | 0.1% |
| South America | 325 | 0.2% |
| South Central Asia | 441 | 0.3% |
| South Eastern Asia | 41 | 0.0% |
| Switzerland | 12 | 0.0% |
| Taiwan | 117 | 0.1% |
| Thailand | 5 | 0.0% |
| Trinidad and Tobago | 17 | 0.0% |
| Turkey | 73 | 0.1% |
| Ukraine | 22 | 0.0% |
| Uzbekistan | 1 | 0.0% |
| Venezuela | 82 | 0.1% |
| Vietnam | 13 | 0.0% |
| Western Africa | 499 | 0.4% |
| Western Asia | 300 | 0.2% |
| Western Europe | 80 | 0.1% |
| Zaire | 35 | 0.0% |
| Zimbabwe | 25 | 0.0% | View All 74 Rows |
Sex and Age in Washington County
Sex and Age in Washington County
The most populous age groups in Washington County are 20 to 24 Years (5,812 | 8.8%) for men and 20 to 24 Years (6,470 | 9.6%) for women.
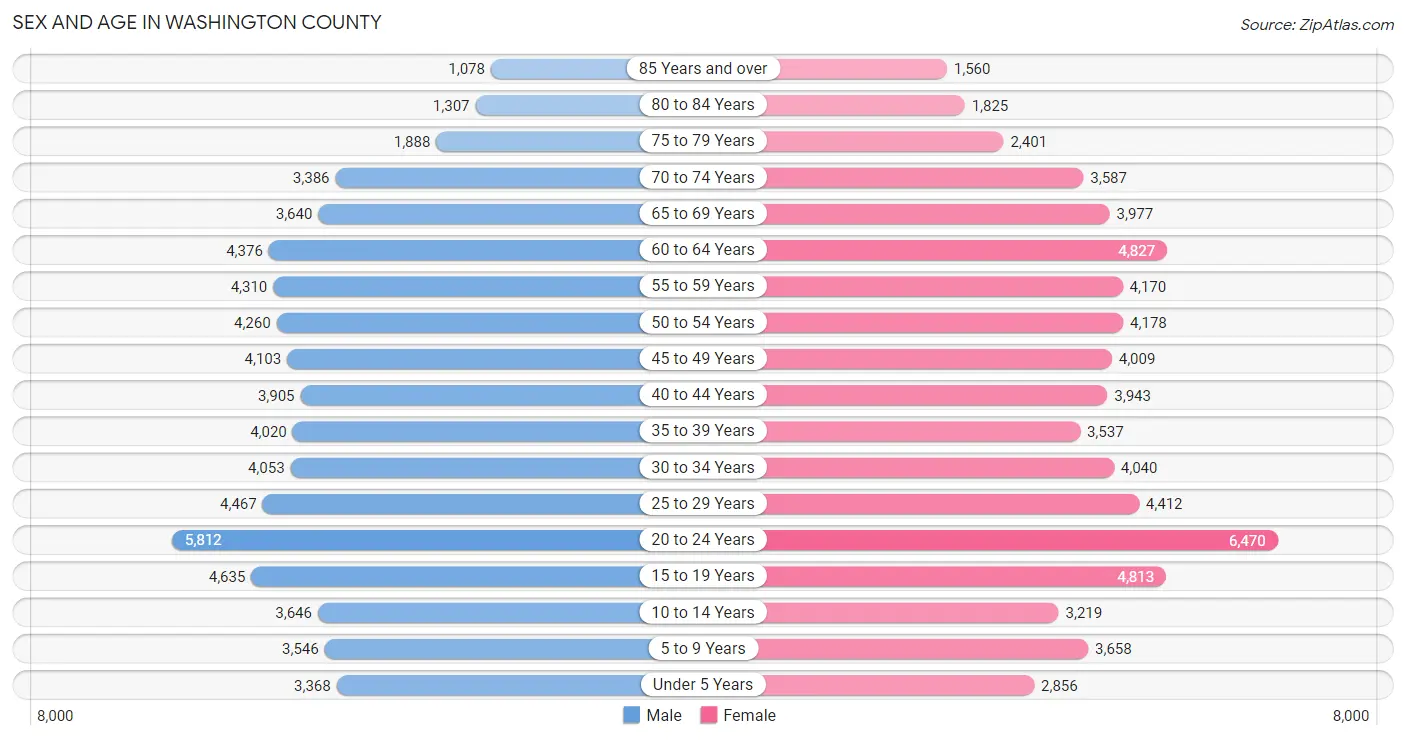
| Age Bracket | Male | Female |
| Under 5 Years | 3,368 (5.1%) | 2,856 (4.2%) |
| 5 to 9 Years | 3,546 (5.4%) | 3,658 (5.4%) |
| 10 to 14 Years | 3,646 (5.5%) | 3,219 (4.8%) |
| 15 to 19 Years | 4,635 (7.0%) | 4,813 (7.1%) |
| 20 to 24 Years | 5,812 (8.8%) | 6,470 (9.6%) |
| 25 to 29 Years | 4,467 (6.8%) | 4,412 (6.5%) |
| 30 to 34 Years | 4,053 (6.2%) | 4,040 (6.0%) |
| 35 to 39 Years | 4,020 (6.1%) | 3,537 (5.2%) |
| 40 to 44 Years | 3,905 (5.9%) | 3,943 (5.8%) |
| 45 to 49 Years | 4,103 (6.2%) | 4,009 (5.9%) |
| 50 to 54 Years | 4,260 (6.5%) | 4,178 (6.2%) |
| 55 to 59 Years | 4,310 (6.6%) | 4,170 (6.2%) |
| 60 to 64 Years | 4,376 (6.7%) | 4,827 (7.1%) |
| 65 to 69 Years | 3,640 (5.5%) | 3,977 (5.9%) |
| 70 to 74 Years | 3,386 (5.1%) | 3,587 (5.3%) |
| 75 to 79 Years | 1,888 (2.9%) | 2,401 (3.6%) |
| 80 to 84 Years | 1,307 (2.0%) | 1,825 (2.7%) |
| 85 Years and over | 1,078 (1.6%) | 1,560 (2.3%) |
| Total | 65,800 (100.0%) | 67,482 (100.0%) |
Families and Households in Washington County
Median Family Size in Washington County
The median family size in Washington County is 2.89 persons per family, with married-couple families (26,626 | 78.0%) accounting for the largest median family size of 2.91 persons per family. On the other hand, single male/father families (2,164 | 6.3%) represent the smallest median family size with 2.55 persons per family.
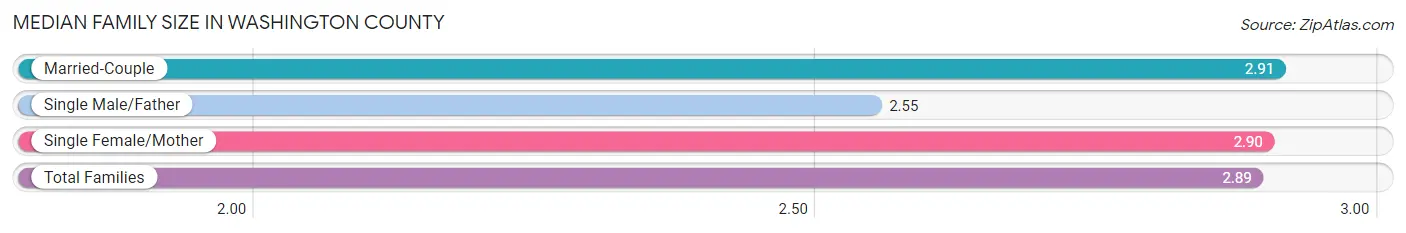
| Family Type | # Families | Family Size |
| Married-Couple | 26,626 (78.0%) | 2.91 |
| Single Male/Father | 2,164 (6.3%) | 2.55 |
| Single Female/Mother | 5,331 (15.6%) | 2.90 |
| Total Families | 34,121 (100.0%) | 2.89 |
Median Household Size in Washington County
The median household size in Washington County is 2.31 persons per household, with single female/mother households (5,331 | 9.6%) accounting for the largest median household size of 3.16 persons per household. non-family households (21,470 | 38.6%) represent the smallest median household size with 1.27 persons per household.
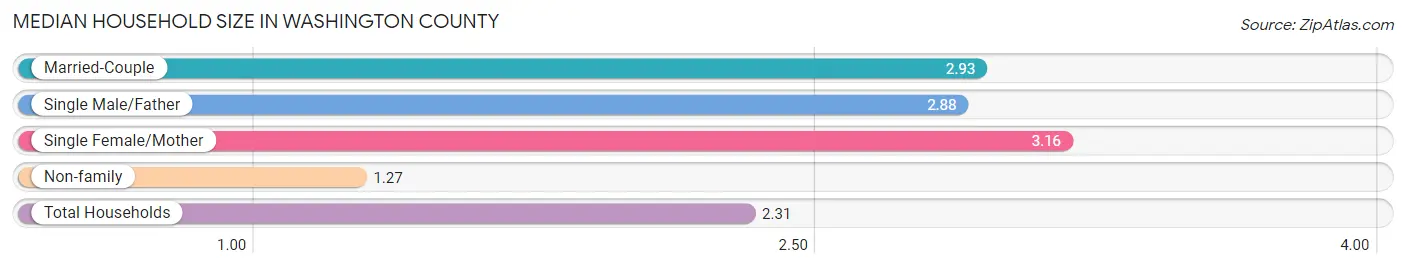
| Household Type | # Households | Household Size |
| Married-Couple | 26,626 (47.9%) | 2.93 |
| Single Male/Father | 2,164 (3.9%) | 2.88 |
| Single Female/Mother | 5,331 (9.6%) | 3.16 |
| Non-family | 21,470 (38.6%) | 1.27 |
| Total Households | 55,591 (100.0%) | 2.31 |
Household Size by Marriage Status in Washington County
Out of a total of 55,591 households in Washington County, 34,121 (61.4%) are family households, while 21,470 (38.6%) are nonfamily households. The most numerous type of family households are 2-person households, comprising 17,346, and the most common type of nonfamily households are 1-person households, comprising 17,205.
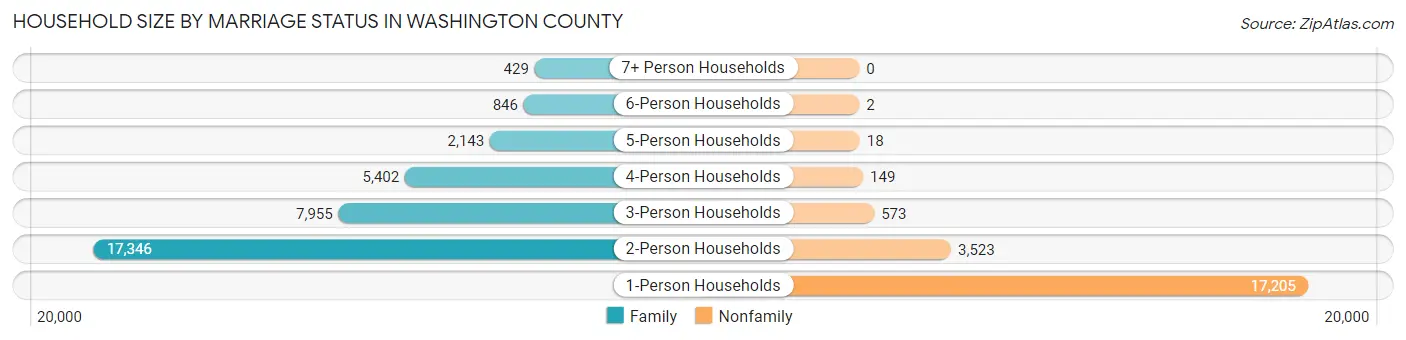
| Household Size | Family Households | Nonfamily Households |
| 1-Person Households | - | 17,205 (30.9%) |
| 2-Person Households | 17,346 (31.2%) | 3,523 (6.3%) |
| 3-Person Households | 7,955 (14.3%) | 573 (1.0%) |
| 4-Person Households | 5,402 (9.7%) | 149 (0.3%) |
| 5-Person Households | 2,143 (3.8%) | 18 (0.0%) |
| 6-Person Households | 846 (1.5%) | 2 (0.0%) |
| 7+ Person Households | 429 (0.8%) | 0 (0.0%) |
| Total | 34,121 (61.4%) | 21,470 (38.6%) |
Female Fertility in Washington County
Fertility by Age in Washington County
Average fertility rate in Washington County is 37.0 births per 1,000 women. Women in the age bracket of 20 to 34 years have the highest fertility rate with 58.0 births per 1,000 women. Women in the age bracket of 20 to 34 years acount for 73.4% of all women with births.
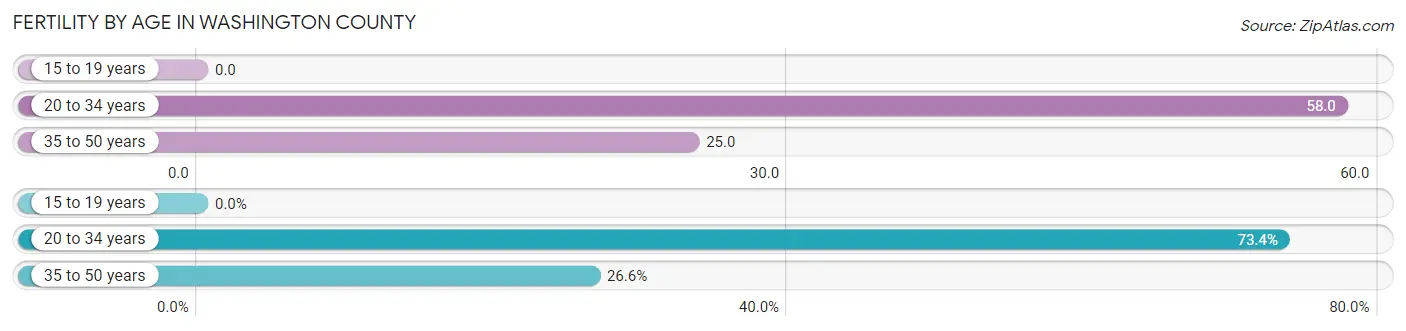
| Age Bracket | Women with Births | Births / 1,000 Women |
| 15 to 19 years | 0 (0.0%) | 0.0 |
| 20 to 34 years | 869 (73.4%) | 58.0 |
| 35 to 50 years | 315 (26.6%) | 25.0 |
| Total | 1,184 (100.0%) | 37.0 |
Fertility by Age by Marriage Status in Washington County
75.1% of women with births (1,184) in Washington County are married. The highest percentage of unmarried women with births falls into 35 to 50 years age bracket with 27.9% of them unmarried at the time of birth, while the lowest percentage of unmarried women with births belong to 20 to 34 years age bracket with 23.8% of them unmarried.
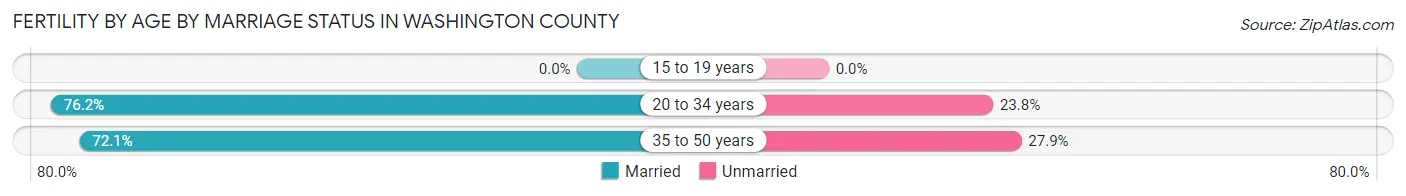
| Age Bracket | Married | Unmarried |
| 15 to 19 years | 0 (0.0%) | 0 (0.0%) |
| 20 to 34 years | 662 (76.2%) | 207 (23.8%) |
| 35 to 50 years | 227 (72.1%) | 88 (27.9%) |
| Total | 889 (75.1%) | 295 (24.9%) |
Fertility by Education in Washington County
Average fertility rate in Washington County is 37.0 births per 1,000 women. Women with the education attainment of graduate degree have the highest fertility rate of 56.0 births per 1,000 women, while women with the education attainment of less than high school have the lowest fertility at 23.0 births per 1,000 women. Women with the education attainment of college or associate's degree represent 33.5% of all women with births.
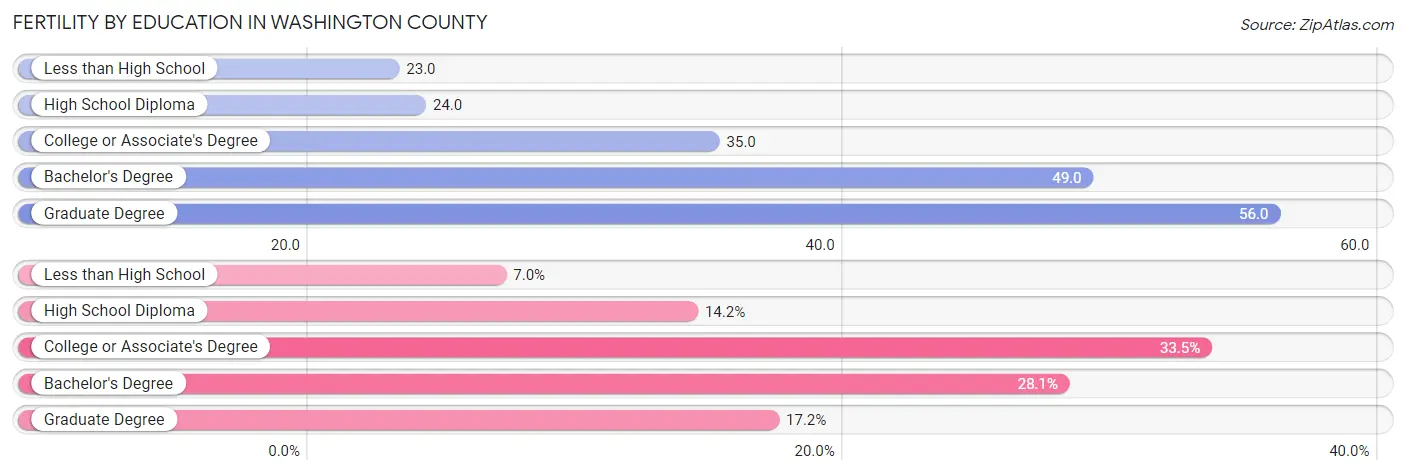
| Educational Attainment | Women with Births | Births / 1,000 Women |
| Less than High School | 83 (7.0%) | 23.0 |
| High School Diploma | 168 (14.2%) | 24.0 |
| College or Associate's Degree | 396 (33.5%) | 35.0 |
| Bachelor's Degree | 333 (28.1%) | 49.0 |
| Graduate Degree | 204 (17.2%) | 56.0 |
| Total | 1,184 (100.0%) | 37.0 |
Fertility by Education by Marriage Status in Washington County
24.9% of women with births in Washington County are unmarried. Women with the educational attainment of graduate degree are most likely to be married with 96.6% of them married at childbirth, while women with the educational attainment of less than high school are least likely to be married with 81.9% of them unmarried at childbirth.
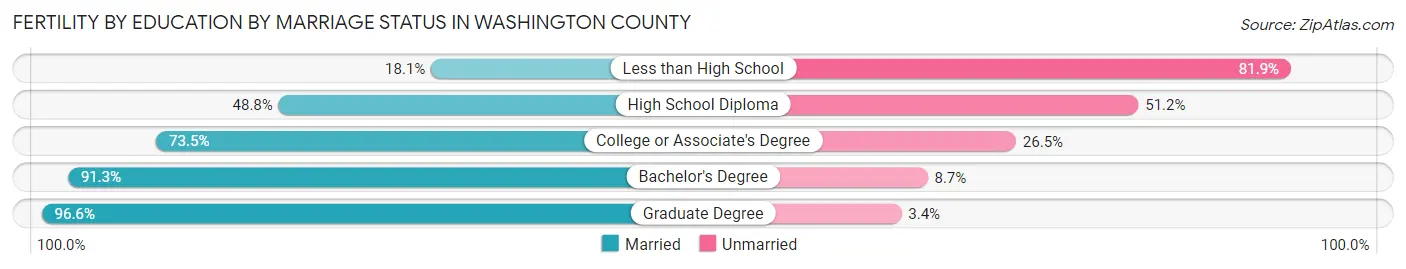
| Educational Attainment | Married | Unmarried |
| Less than High School | 15 (18.1%) | 68 (81.9%) |
| High School Diploma | 82 (48.8%) | 86 (51.2%) |
| College or Associate's Degree | 291 (73.5%) | 105 (26.5%) |
| Bachelor's Degree | 304 (91.3%) | 29 (8.7%) |
| Graduate Degree | 197 (96.6%) | 7 (3.4%) |
| Total | 889 (75.1%) | 295 (24.9%) |
Income in Washington County
Income Overview in Washington County
Per Capita Income in Washington County is $35,562, while median incomes of families and households are $78,783 and $58,507 respectively.
| Characteristic | Number | Measure |
| Per Capita Income | 133,282 | $35,562 |
| Median Family Income | 34,121 | $78,783 |
| Mean Family Income | 34,121 | $105,110 |
| Median Household Income | 55,591 | $58,507 |
| Mean Household Income | 55,591 | $83,142 |
| Income Deficit | 34,121 | $10,796 |
| Wage / Income Gap (%) | 133,282 | 29.08% |
| Wage / Income Gap ($) | 133,282 | 70.92¢ per $1 |
| Gini / Inequality Index | 133,282 | 0.49 |
Earnings by Sex in Washington County
Average Earnings in Washington County are $33,694, $39,663 for men and $28,128 for women, a difference of 29.1%.
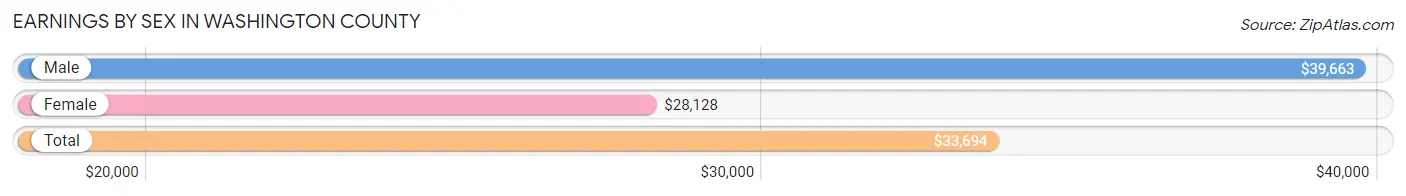
| Sex | Number | Average Earnings |
| Male | 36,290 (51.3%) | $39,663 |
| Female | 34,397 (48.7%) | $28,128 |
| Total | 70,687 (100.0%) | $33,694 |
Earnings by Sex by Income Bracket in Washington County
The most common earnings brackets in Washington County are $100,000+ for men (5,437 | 15.0%) and $2,499 or less for women (2,403 | 7.0%).
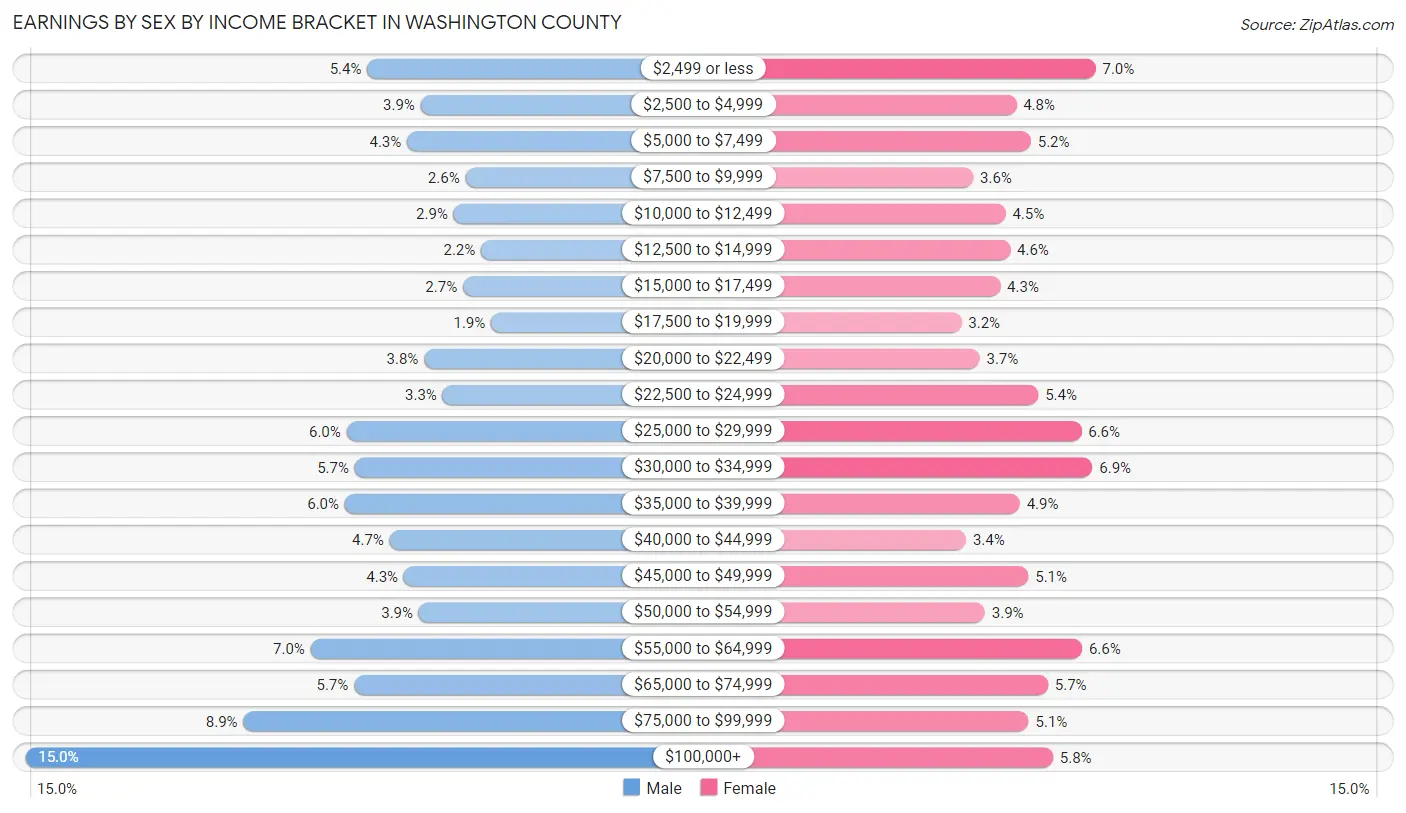
| Income | Male | Female |
| $2,499 or less | 1,947 (5.4%) | 2,403 (7.0%) |
| $2,500 to $4,999 | 1,403 (3.9%) | 1,638 (4.8%) |
| $5,000 to $7,499 | 1,541 (4.3%) | 1,778 (5.2%) |
| $7,500 to $9,999 | 947 (2.6%) | 1,222 (3.5%) |
| $10,000 to $12,499 | 1,068 (2.9%) | 1,533 (4.5%) |
| $12,500 to $14,999 | 787 (2.2%) | 1,580 (4.6%) |
| $15,000 to $17,499 | 974 (2.7%) | 1,481 (4.3%) |
| $17,500 to $19,999 | 685 (1.9%) | 1,107 (3.2%) |
| $20,000 to $22,499 | 1,367 (3.8%) | 1,284 (3.7%) |
| $22,500 to $24,999 | 1,180 (3.3%) | 1,852 (5.4%) |
| $25,000 to $29,999 | 2,161 (5.9%) | 2,267 (6.6%) |
| $30,000 to $34,999 | 2,075 (5.7%) | 2,375 (6.9%) |
| $35,000 to $39,999 | 2,178 (6.0%) | 1,672 (4.9%) |
| $40,000 to $44,999 | 1,720 (4.7%) | 1,153 (3.4%) |
| $45,000 to $49,999 | 1,576 (4.3%) | 1,753 (5.1%) |
| $50,000 to $54,999 | 1,424 (3.9%) | 1,333 (3.9%) |
| $55,000 to $64,999 | 2,524 (7.0%) | 2,272 (6.6%) |
| $65,000 to $74,999 | 2,084 (5.7%) | 1,945 (5.7%) |
| $75,000 to $99,999 | 3,212 (8.8%) | 1,757 (5.1%) |
| $100,000+ | 5,437 (15.0%) | 1,992 (5.8%) |
| Total | 36,290 (100.0%) | 34,397 (100.0%) |
Earnings by Sex by Educational Attainment in Washington County
Average earnings in Washington County are $46,894 for men and $35,425 for women, a difference of 24.5%. Men with an educational attainment of graduate degree enjoy the highest average annual earnings of $89,060, while those with less than high school education earn the least with $26,966. Women with an educational attainment of graduate degree earn the most with the average annual earnings of $61,505, while those with less than high school education have the smallest earnings of $22,071.
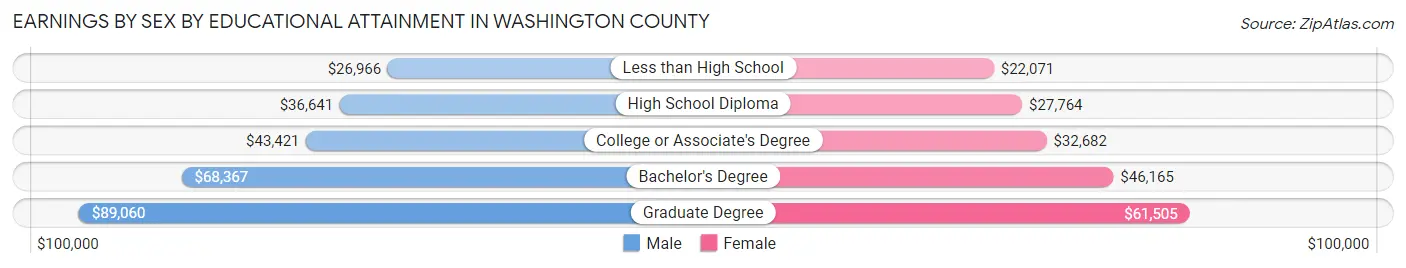
| Educational Attainment | Male Income | Female Income |
| Less than High School | $26,966 | $22,071 |
| High School Diploma | $36,641 | $27,764 |
| College or Associate's Degree | $43,421 | $32,682 |
| Bachelor's Degree | $68,367 | $46,165 |
| Graduate Degree | $89,060 | $61,505 |
| Total | $46,894 | $35,425 |
Family Income in Washington County
Family Income Brackets in Washington County
According to the Washington County family income data, there are 6,415 families falling into the $50,000 to $74,999 income range, which is the most common income bracket and makes up 18.8% of all families. Conversely, the $10,000 to $14,999 income bracket is the least frequent group with only 819 families (2.4%) belonging to this category.
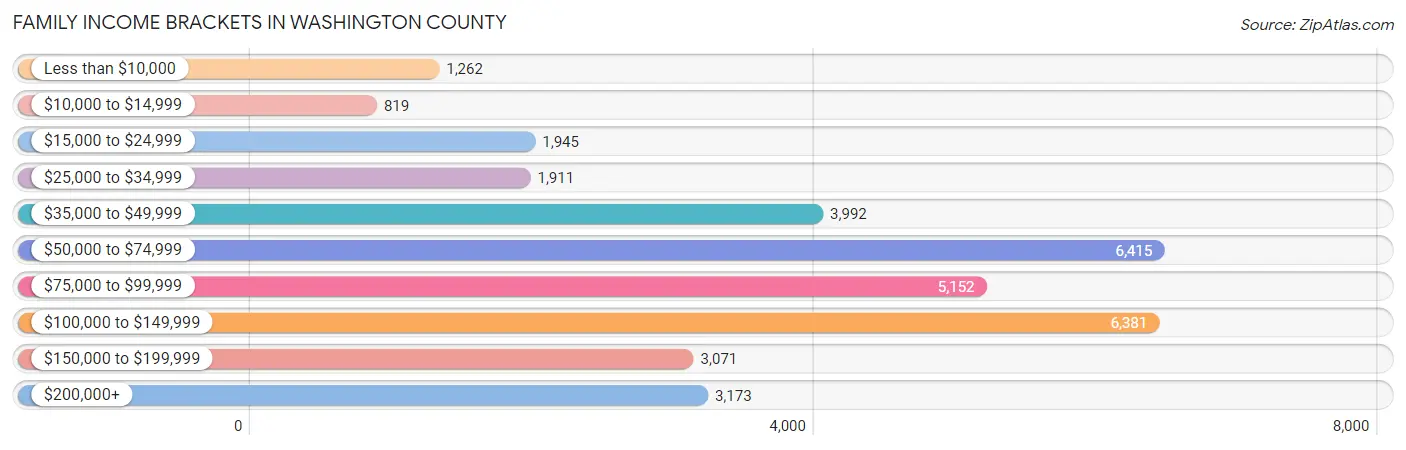
| Income Bracket | # Families | % Families |
| Less than $10,000 | 1,262 | 3.7% |
| $10,000 to $14,999 | 819 | 2.4% |
| $15,000 to $24,999 | 1,945 | 5.7% |
| $25,000 to $34,999 | 1,911 | 5.6% |
| $35,000 to $49,999 | 3,992 | 11.7% |
| $50,000 to $74,999 | 6,415 | 18.8% |
| $75,000 to $99,999 | 5,152 | 15.1% |
| $100,000 to $149,999 | 6,381 | 18.7% |
| $150,000 to $199,999 | 3,071 | 9.0% |
| $200,000+ | 3,173 | 9.3% |
Family Income by Famaliy Size in Washington County
4-person families (5,289 | 15.5%) account for the highest median family income in Washington County with $104,721 per family, while 2-person families (18,478 | 54.1%) have the highest median income of $34,650 per family member.
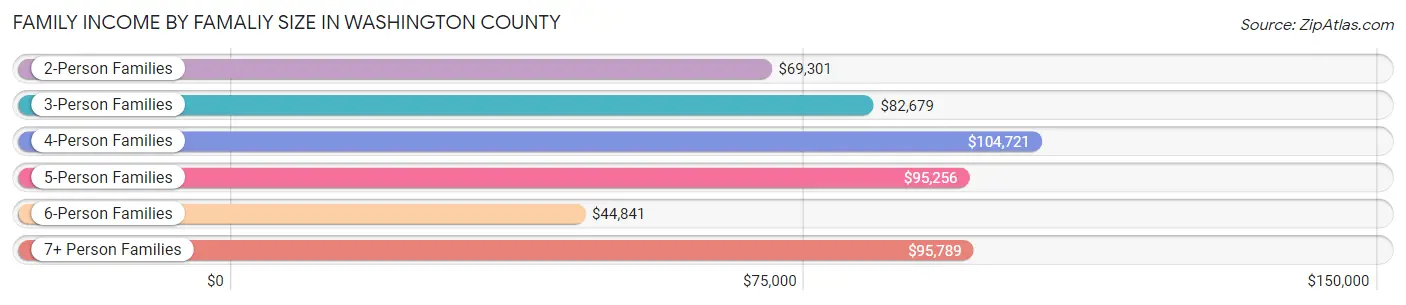
| Income Bracket | # Families | Median Income |
| 2-Person Families | 18,478 (54.1%) | $69,301 |
| 3-Person Families | 7,552 (22.1%) | $82,679 |
| 4-Person Families | 5,289 (15.5%) | $104,721 |
| 5-Person Families | 1,692 (5.0%) | $95,256 |
| 6-Person Families | 732 (2.1%) | $44,841 |
| 7+ Person Families | 378 (1.1%) | $95,789 |
| Total | 34,121 (100.0%) | $78,783 |
Family Income by Number of Earners in Washington County
The median family income in Washington County is $78,783, with families comprising 3+ earners (3,041) having the highest median family income of $134,969, while families with no earners (6,282) have the lowest median family income of $47,357, accounting for 8.9% and 18.4% of families, respectively.
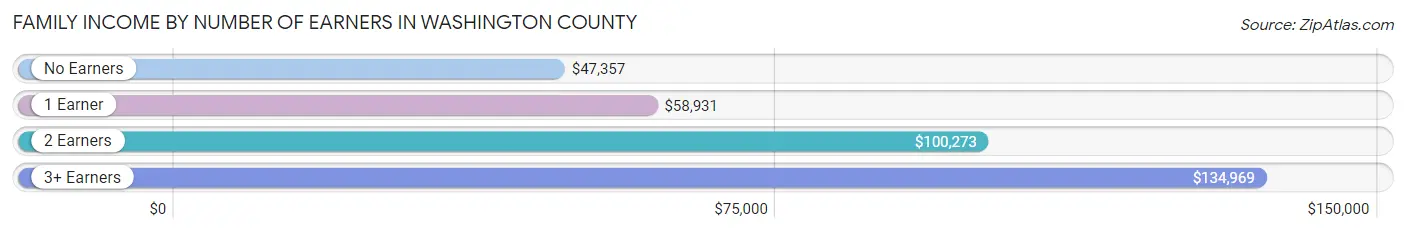
| Number of Earners | # Families | Median Income |
| No Earners | 6,282 (18.4%) | $47,357 |
| 1 Earner | 11,435 (33.5%) | $58,931 |
| 2 Earners | 13,363 (39.2%) | $100,273 |
| 3+ Earners | 3,041 (8.9%) | $134,969 |
| Total | 34,121 (100.0%) | $78,783 |
Household Income in Washington County
Household Income Brackets in Washington County
With 9,895 households falling in the category, the $50,000 to $74,999 income range is the most frequent in Washington County, accounting for 17.8% of all households. In contrast, only 3,335 households (6.0%) fall into the less than $10,000 income bracket, making it the least populous group.
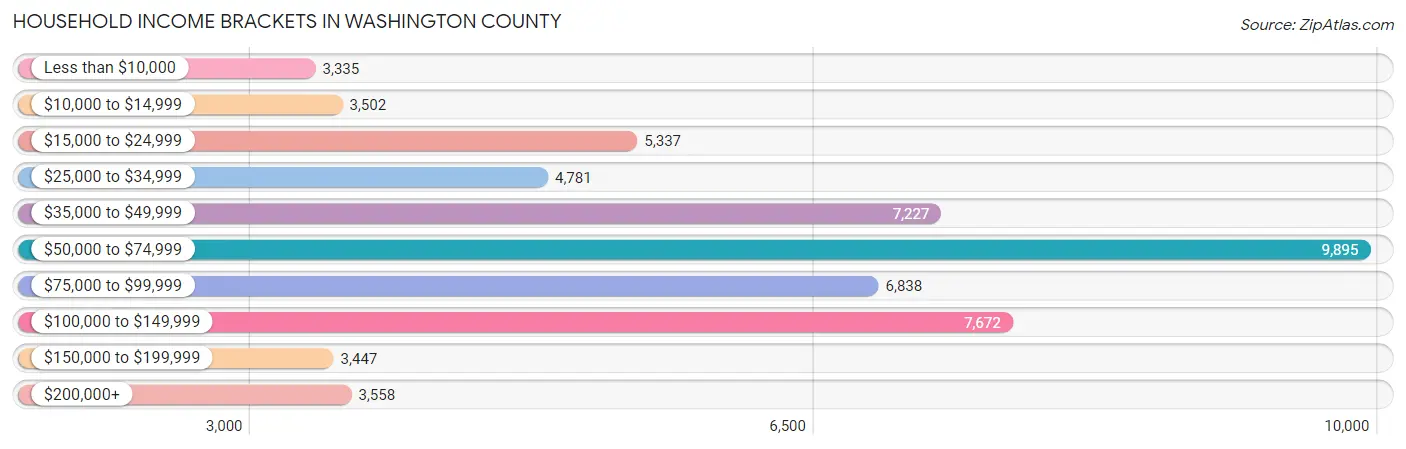
| Income Bracket | # Households | % Households |
| Less than $10,000 | 3,335 | 6.0% |
| $10,000 to $14,999 | 3,502 | 6.3% |
| $15,000 to $24,999 | 5,337 | 9.6% |
| $25,000 to $34,999 | 4,781 | 8.6% |
| $35,000 to $49,999 | 7,227 | 13.0% |
| $50,000 to $74,999 | 9,895 | 17.8% |
| $75,000 to $99,999 | 6,838 | 12.3% |
| $100,000 to $149,999 | 7,672 | 13.8% |
| $150,000 to $199,999 | 3,447 | 6.2% |
| $200,000+ | 3,558 | 6.4% |
Household Income by Householder Age in Washington County
The median household income in Washington County is $58,507, with the highest median household income of $70,671 found in the 45 to 64 years age bracket for the primary householder. A total of 19,790 households (35.6%) fall into this category. Meanwhile, the 15 to 24 years age bracket for the primary householder has the lowest median household income of $32,838, with 3,811 households (6.9%) in this group.
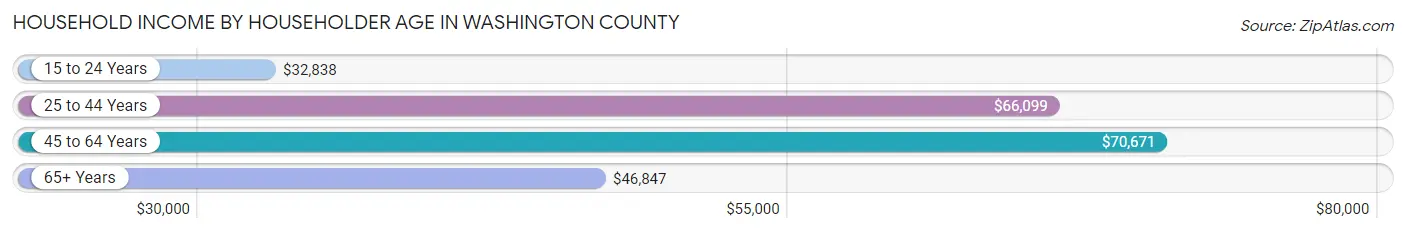
| Income Bracket | # Households | Median Income |
| 15 to 24 Years | 3,811 (6.9%) | $32,838 |
| 25 to 44 Years | 16,498 (29.7%) | $66,099 |
| 45 to 64 Years | 19,790 (35.6%) | $70,671 |
| 65+ Years | 15,492 (27.9%) | $46,847 |
| Total | 55,591 (100.0%) | $58,507 |
Poverty in Washington County
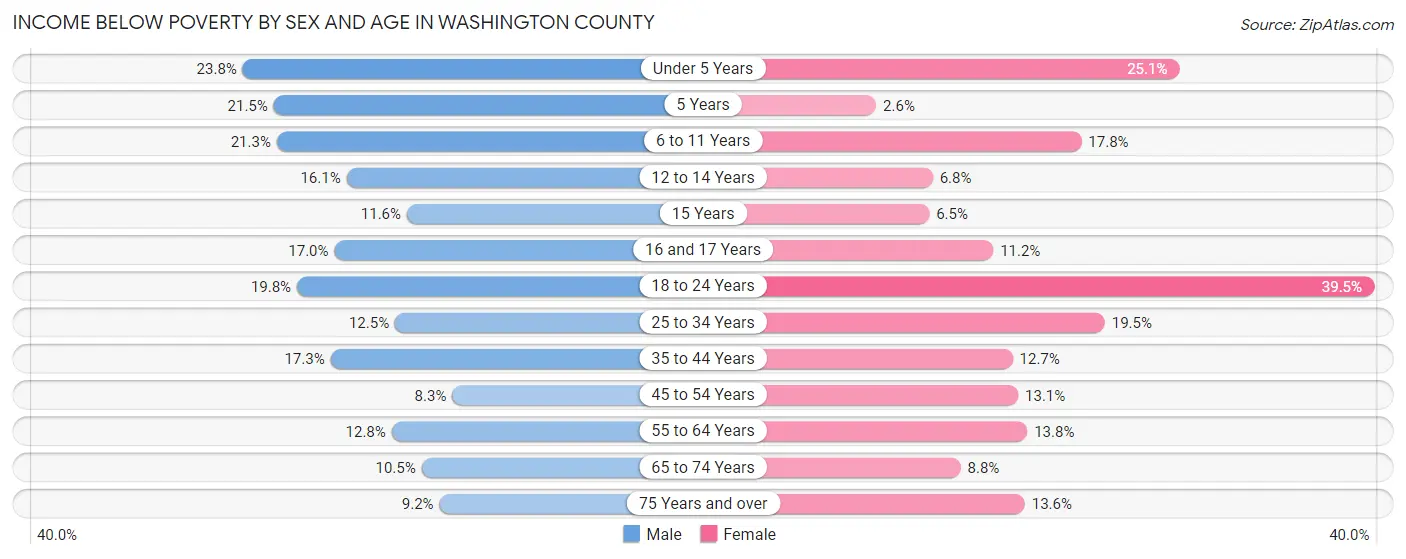
Income Below Poverty by Sex and Age in Washington County
With 14.4% poverty level for males and 17.0% for females among the residents of Washington County, under 5 year old males and 18 to 24 year old females are the most vulnerable to poverty, with 760 males (23.8%) and 2,985 females (39.5%) in their respective age groups living below the poverty level.
| Age Bracket | Male | Female |
| Under 5 Years | 760 (23.8%) | 690 (25.1%) |
| 5 Years | 174 (21.5%) | 14 (2.5%) |
| 6 to 11 Years | 867 (21.3%) | 780 (17.8%) |
| 12 to 14 Years | 359 (16.1%) | 127 (6.8%) |
| 15 Years | 81 (11.6%) | 36 (6.5%) |
| 16 and 17 Years | 275 (17.0%) | 190 (11.2%) |
| 18 to 24 Years | 1,359 (19.8%) | 2,985 (39.5%) |
| 25 to 34 Years | 1,043 (12.5%) | 1,633 (19.5%) |
| 35 to 44 Years | 1,346 (17.3%) | 938 (12.7%) |
| 45 to 54 Years | 681 (8.3%) | 1,067 (13.1%) |
| 55 to 64 Years | 1,102 (12.8%) | 1,235 (13.8%) |
| 65 to 74 Years | 729 (10.5%) | 661 (8.8%) |
| 75 Years and over | 369 (9.2%) | 736 (13.6%) |
| Total | 9,145 (14.4%) | 11,092 (17.0%) |
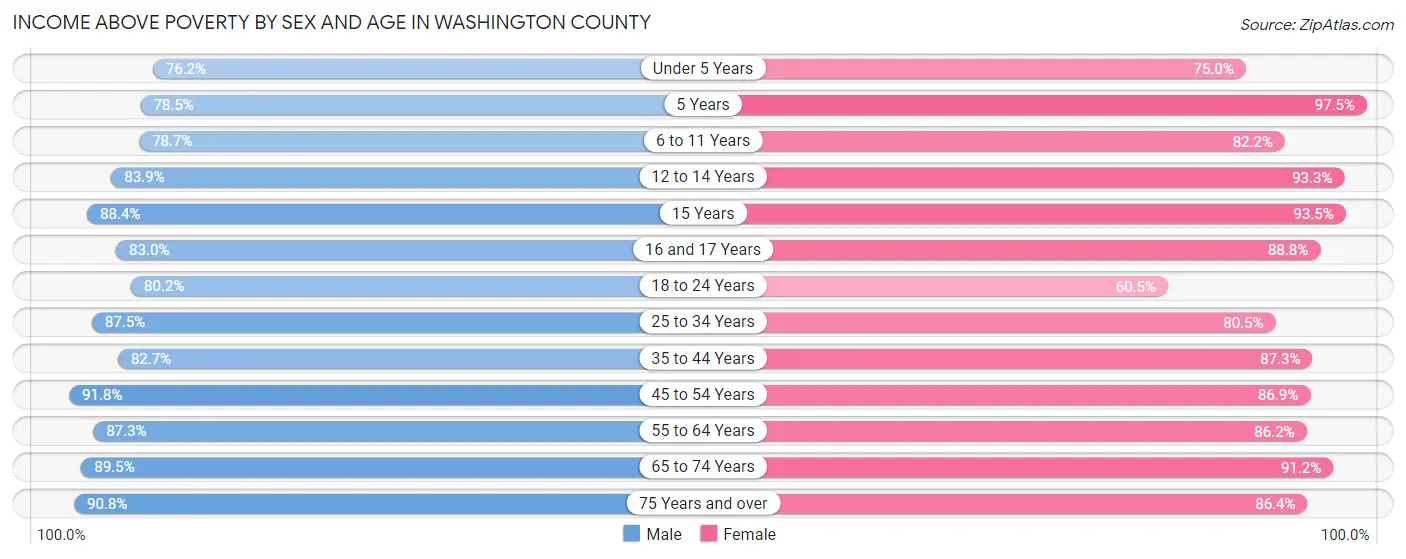
Income Above Poverty by Sex and Age in Washington County
According to the poverty statistics in Washington County, males aged 45 to 54 years and females aged 5 years are the age groups that are most secure financially, with 91.7% of males and 97.5% of females in these age groups living above the poverty line.
| Age Bracket | Male | Female |
| Under 5 Years | 2,432 (76.2%) | 2,065 (75.0%) |
| 5 Years | 635 (78.5%) | 534 (97.5%) |
| 6 to 11 Years | 3,208 (78.7%) | 3,605 (82.2%) |
| 12 to 14 Years | 1,871 (83.9%) | 1,754 (93.2%) |
| 15 Years | 616 (88.4%) | 519 (93.5%) |
| 16 and 17 Years | 1,343 (83.0%) | 1,501 (88.8%) |
| 18 to 24 Years | 5,512 (80.2%) | 4,572 (60.5%) |
| 25 to 34 Years | 7,303 (87.5%) | 6,729 (80.5%) |
| 35 to 44 Years | 6,439 (82.7%) | 6,458 (87.3%) |
| 45 to 54 Years | 7,571 (91.7%) | 7,086 (86.9%) |
| 55 to 64 Years | 7,540 (87.3%) | 7,732 (86.2%) |
| 65 to 74 Years | 6,191 (89.5%) | 6,830 (91.2%) |
| 75 Years and over | 3,641 (90.8%) | 4,679 (86.4%) |
| Total | 54,302 (85.6%) | 54,064 (83.0%) |
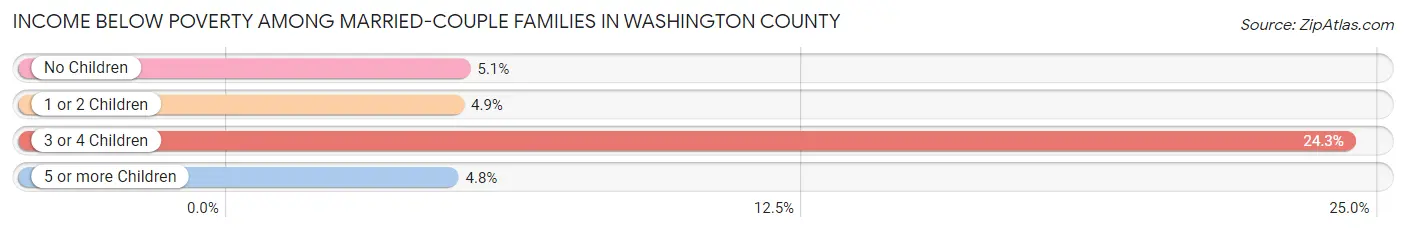
Income Below Poverty Among Married-Couple Families in Washington County
The poverty statistics for married-couple families in Washington County show that 6.1% or 1,617 of the total 26,626 families live below the poverty line. Families with 3 or 4 children have the highest poverty rate of 24.3%, comprising of 355 families. On the other hand, families with 5 or more children have the lowest poverty rate of 4.8%, which includes 6 families.
| Children | Above Poverty | Below Poverty |
| No Children | 16,823 (94.9%) | 896 (5.1%) |
| 1 or 2 Children | 6,962 (95.1%) | 360 (4.9%) |
| 3 or 4 Children | 1,105 (75.7%) | 355 (24.3%) |
| 5 or more Children | 119 (95.2%) | 6 (4.8%) |
| Total | 25,009 (93.9%) | 1,617 (6.1%) |
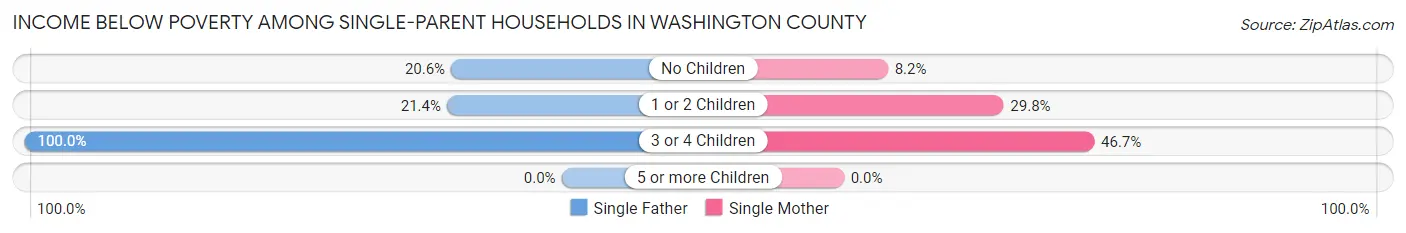
Income Below Poverty Among Single-Parent Households in Washington County
According to the poverty data in Washington County, 21.9% or 474 single-father households and 24.2% or 1,291 single-mother households are living below the poverty line. Among single-father households, those with 3 or 4 children have the highest poverty rate, with 28 households (100.0%) experiencing poverty. Likewise, among single-mother households, those with 3 or 4 children have the highest poverty rate, with 244 households (46.7%) falling below the poverty line.
| Children | Single Father | Single Mother |
| No Children | 223 (20.6%) | 146 (8.2%) |
| 1 or 2 Children | 223 (21.4%) | 901 (29.7%) |
| 3 or 4 Children | 28 (100.0%) | 244 (46.7%) |
| 5 or more Children | 0 (0.0%) | 0 (0.0%) |
| Total | 474 (21.9%) | 1,291 (24.2%) |
Income Below Poverty Among Married-Couple vs Single-Parent Households in Washington County
The poverty data for Washington County shows that 1,617 of the married-couple family households (6.1%) and 1,765 of the single-parent households (23.5%) are living below the poverty level. Within the married-couple family households, those with 3 or 4 children have the highest poverty rate, with 355 households (24.3%) falling below the poverty line. Among the single-parent households, those with 3 or 4 children have the highest poverty rate, with 272 household (49.4%) living below poverty.
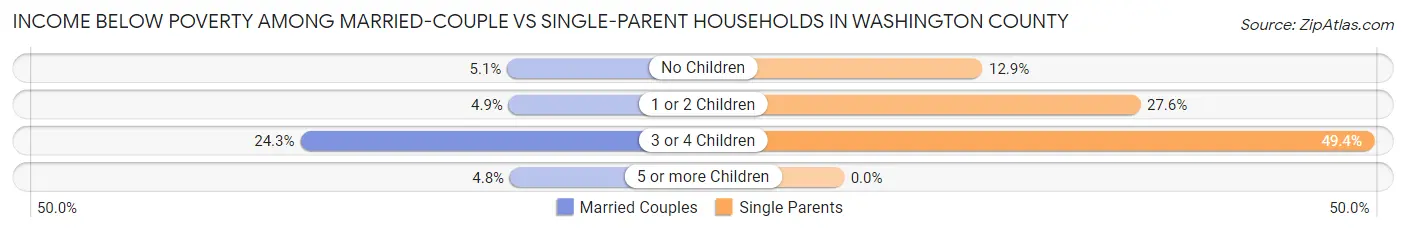
| Children | Married-Couple Families | Single-Parent Households |
| No Children | 896 (5.1%) | 369 (12.9%) |
| 1 or 2 Children | 360 (4.9%) | 1,124 (27.6%) |
| 3 or 4 Children | 355 (24.3%) | 272 (49.4%) |
| 5 or more Children | 6 (4.8%) | 0 (0.0%) |
| Total | 1,617 (6.1%) | 1,765 (23.5%) |
Employment Characteristics in Washington County
Employment by Class of Employer in Washington County
Among the 61,983 employed individuals in Washington County, private company employees (41,368 | 66.7%), not-for-profit organizations (5,947 | 9.6%), and self-employed (not incorporated) (4,346 | 7.0%) make up the most common classes of employment.
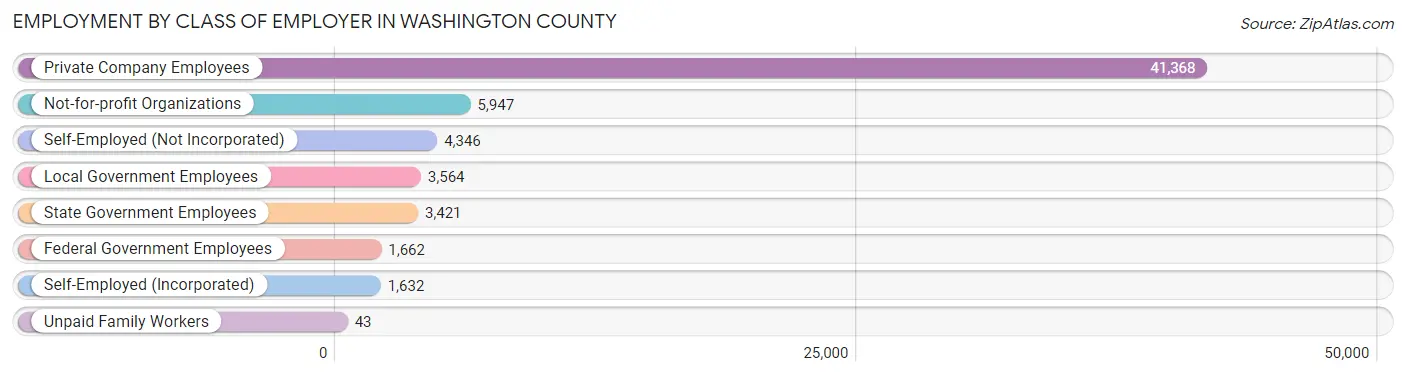
| Employer Class | # Employees | % Employees |
| Private Company Employees | 41,368 | 66.7% |
| Self-Employed (Incorporated) | 1,632 | 2.6% |
| Self-Employed (Not Incorporated) | 4,346 | 7.0% |
| Not-for-profit Organizations | 5,947 | 9.6% |
| Local Government Employees | 3,564 | 5.8% |
| State Government Employees | 3,421 | 5.5% |
| Federal Government Employees | 1,662 | 2.7% |
| Unpaid Family Workers | 43 | 0.1% |
| Total | 61,983 | 100.0% |
Employment Status by Age in Washington County
According to the labor force statistics for Washington County, out of the total population over 16 years of age (111,727), 59.7% or 66,701 individuals are in the labor force, with 5.0% or 3,335 of them unemployed. The age group with the highest labor force participation rate is 30 to 34 years, with 84.6% or 6,847 individuals in the labor force. Within the labor force, the 75 years and over age range has the highest percentage of unemployed individuals, with 13.6% or 81 of them being unemployed.
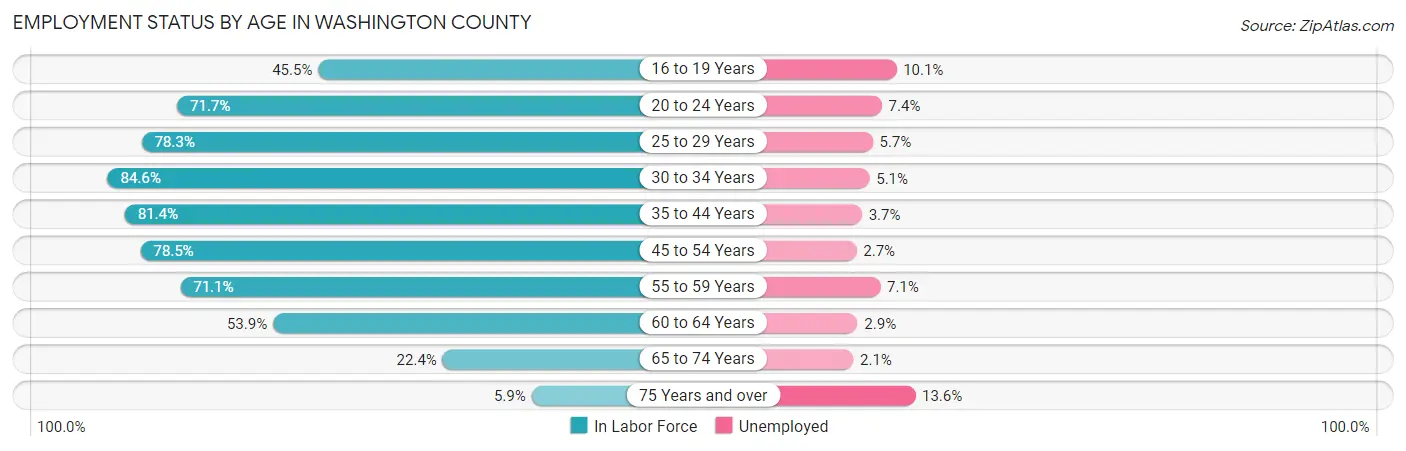
| Age Bracket | In Labor Force | Unemployed |
| 16 to 19 Years | 3,725 (45.5%) | 376 (10.1%) |
| 20 to 24 Years | 8,806 (71.7%) | 652 (7.4%) |
| 25 to 29 Years | 6,952 (78.3%) | 396 (5.7%) |
| 30 to 34 Years | 6,847 (84.6%) | 349 (5.1%) |
| 35 to 44 Years | 12,540 (81.4%) | 464 (3.7%) |
| 45 to 54 Years | 12,992 (78.5%) | 351 (2.7%) |
| 55 to 59 Years | 6,029 (71.1%) | 428 (7.1%) |
| 60 to 64 Years | 4,960 (53.9%) | 144 (2.9%) |
| 65 to 74 Years | 3,268 (22.4%) | 69 (2.1%) |
| 75 Years and over | 593 (5.9%) | 81 (13.6%) |
| Total | 66,701 (59.7%) | 3,335 (5.0%) |
Employment Status by Educational Attainment in Washington County
According to labor force statistics for Washington County, 75.6% of individuals (50,357) out of the total population between 25 and 64 years of age (66,610) are in the labor force, with 4.2% or 2,115 of them being unemployed. The group with the highest labor force participation rate are those with the educational attainment of bachelor's degree or higher, with 85.6% or 20,616 individuals in the labor force. Within the labor force, individuals with less than high school education have the highest percentage of unemployment, with 11.7% or 318 of them being unemployed.
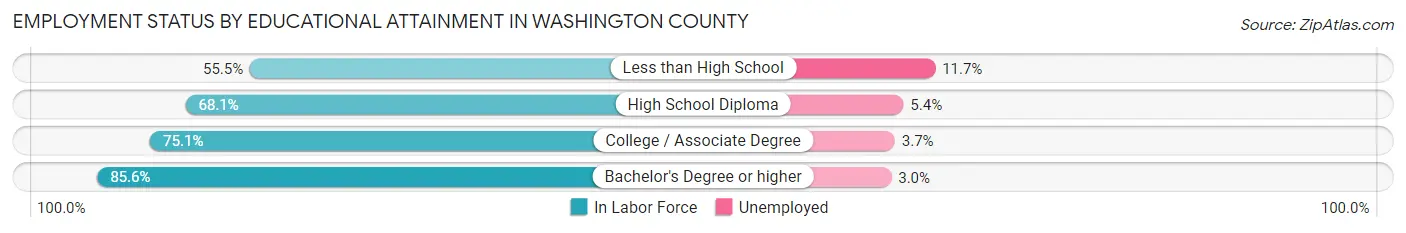
| Educational Attainment | In Labor Force | Unemployed |
| Less than High School | 2,720 (55.5%) | 573 (11.7%) |
| High School Diploma | 12,389 (68.1%) | 982 (5.4%) |
| College / Associate Degree | 14,593 (75.1%) | 719 (3.7%) |
| Bachelor's Degree or higher | 20,616 (85.6%) | 723 (3.0%) |
| Total | 50,357 (75.6%) | 2,798 (4.2%) |
Employment Occupations by Sex in Washington County
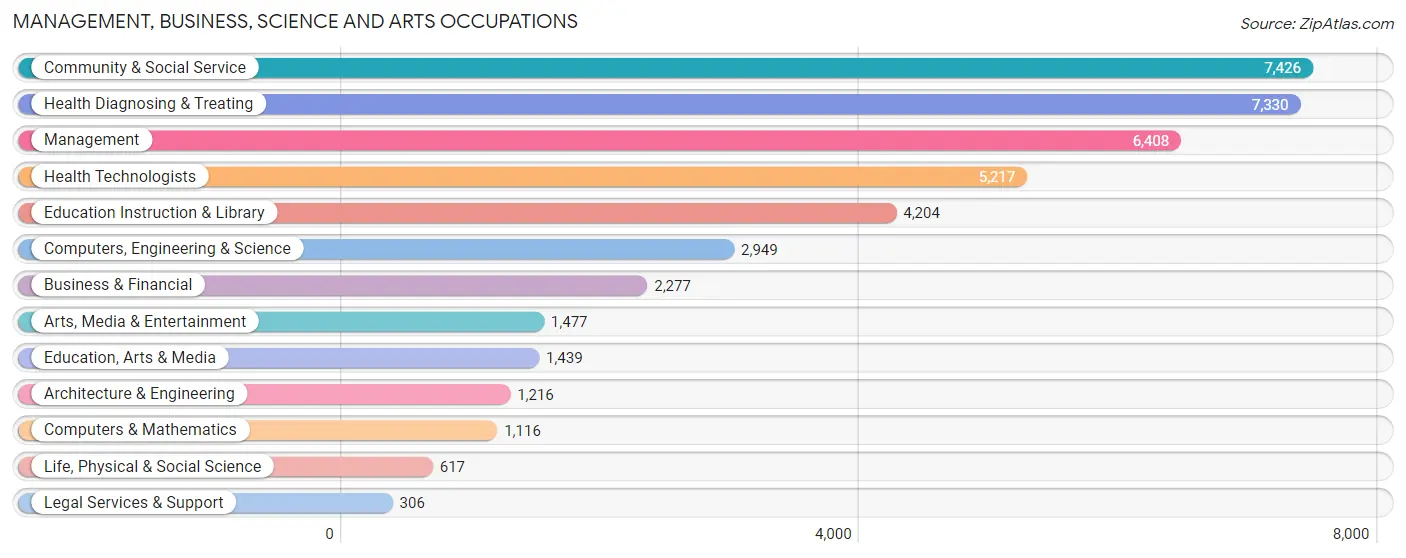
Management, Business, Science and Arts Occupations
The most common Management, Business, Science and Arts occupations in Washington County are Community & Social Service (7,426 | 11.7%), Health Diagnosing & Treating (7,330 | 11.6%), Management (6,408 | 10.1%), Health Technologists (5,217 | 8.2%), and Education Instruction & Library (4,204 | 6.6%).
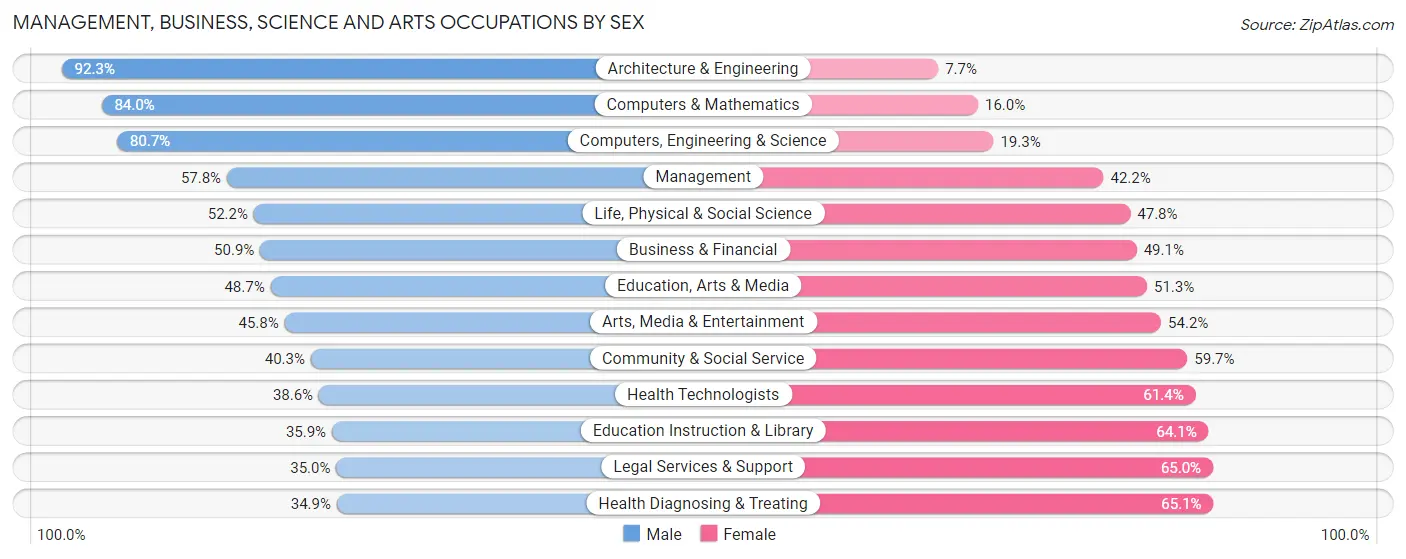
Management, Business, Science and Arts Occupations by Sex
Within the Management, Business, Science and Arts occupations in Washington County, the most male-oriented occupations are Architecture & Engineering (92.3%), Computers & Mathematics (84.0%), and Computers, Engineering & Science (80.7%), while the most female-oriented occupations are Health Diagnosing & Treating (65.1%), Legal Services & Support (65.0%), and Education Instruction & Library (64.1%).
| Occupation | Male | Female |
| Management | 3,703 (57.8%) | 2,705 (42.2%) |
| Business & Financial | 1,158 (50.9%) | 1,119 (49.1%) |
| Computers, Engineering & Science | 2,381 (80.7%) | 568 (19.3%) |
| Computers & Mathematics | 937 (84.0%) | 179 (16.0%) |
| Architecture & Engineering | 1,122 (92.3%) | 94 (7.7%) |
| Life, Physical & Social Science | 322 (52.2%) | 295 (47.8%) |
| Community & Social Service | 2,993 (40.3%) | 4,433 (59.7%) |
| Education, Arts & Media | 701 (48.7%) | 738 (51.3%) |
| Legal Services & Support | 107 (35.0%) | 199 (65.0%) |
| Education Instruction & Library | 1,509 (35.9%) | 2,695 (64.1%) |
| Arts, Media & Entertainment | 676 (45.8%) | 801 (54.2%) |
| Health Diagnosing & Treating | 2,556 (34.9%) | 4,774 (65.1%) |
| Health Technologists | 2,014 (38.6%) | 3,203 (61.4%) |
| Total (Category) | 12,791 (48.5%) | 13,599 (51.5%) |
| Total (Overall) | 32,833 (51.8%) | 30,505 (48.2%) |
Services Occupations
The most common Services occupations in Washington County are Food Preparation & Serving (4,216 | 6.7%), Healthcare Support (2,102 | 3.3%), Cleaning & Maintenance (1,640 | 2.6%), Personal Care & Service (1,249 | 2.0%), and Security & Protection (949 | 1.5%).

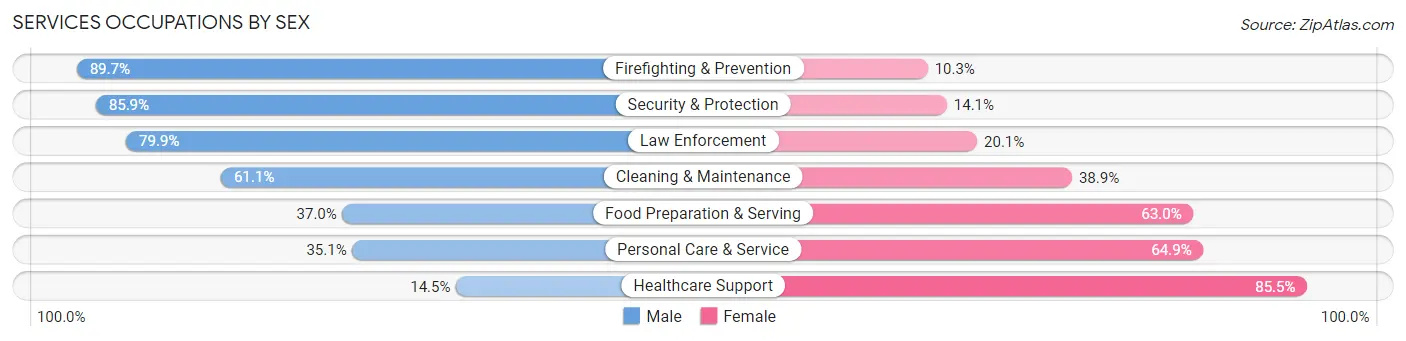
Services Occupations by Sex
Within the Services occupations in Washington County, the most male-oriented occupations are Firefighting & Prevention (89.7%), Security & Protection (85.9%), and Law Enforcement (79.9%), while the most female-oriented occupations are Healthcare Support (85.5%), Personal Care & Service (64.9%), and Food Preparation & Serving (63.0%).
| Occupation | Male | Female |
| Healthcare Support | 305 (14.5%) | 1,797 (85.5%) |
| Security & Protection | 815 (85.9%) | 134 (14.1%) |
| Firefighting & Prevention | 521 (89.7%) | 60 (10.3%) |
| Law Enforcement | 294 (79.9%) | 74 (20.1%) |
| Food Preparation & Serving | 1,561 (37.0%) | 2,655 (63.0%) |
| Cleaning & Maintenance | 1,002 (61.1%) | 638 (38.9%) |
| Personal Care & Service | 438 (35.1%) | 811 (64.9%) |
| Total (Category) | 4,121 (40.6%) | 6,035 (59.4%) |
| Total (Overall) | 32,833 (51.8%) | 30,505 (48.2%) |
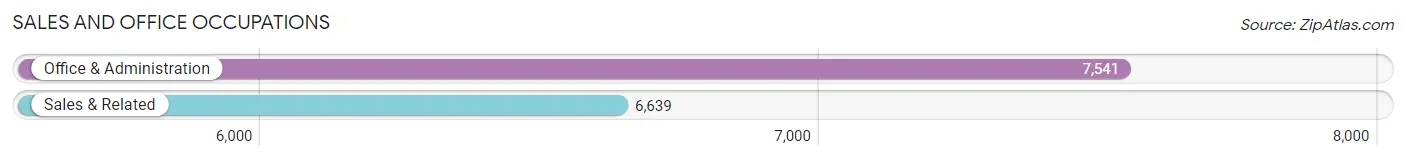
Sales and Office Occupations
The most common Sales and Office occupations in Washington County are Office & Administration (7,541 | 11.9%), and Sales & Related (6,639 | 10.5%).
Sales and Office Occupations by Sex
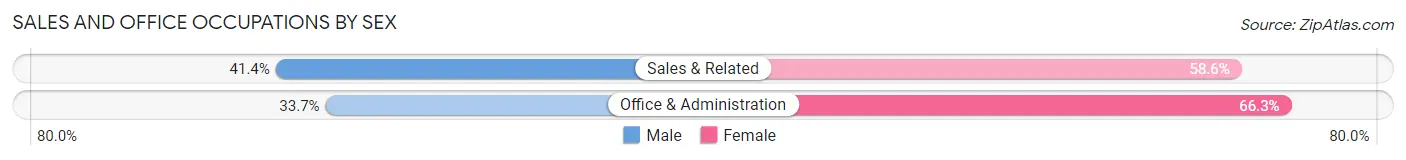
| Occupation | Male | Female |
| Sales & Related | 2,747 (41.4%) | 3,892 (58.6%) |
| Office & Administration | 2,543 (33.7%) | 4,998 (66.3%) |
| Total (Category) | 5,290 (37.3%) | 8,890 (62.7%) |
| Total (Overall) | 32,833 (51.8%) | 30,505 (48.2%) |
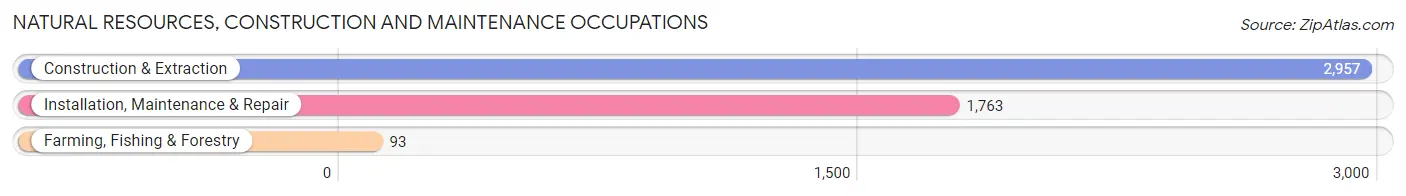
Natural Resources, Construction and Maintenance Occupations
The most common Natural Resources, Construction and Maintenance occupations in Washington County are Construction & Extraction (2,957 | 4.7%), Installation, Maintenance & Repair (1,763 | 2.8%), and Farming, Fishing & Forestry (93 | 0.2%).
Natural Resources, Construction and Maintenance Occupations by Sex
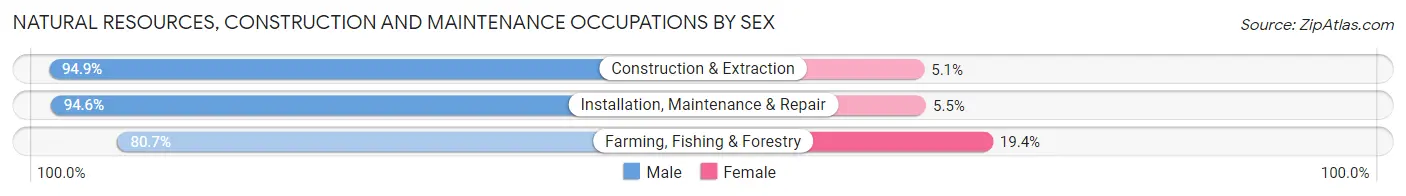
| Occupation | Male | Female |
| Farming, Fishing & Forestry | 75 (80.6%) | 18 (19.4%) |
| Construction & Extraction | 2,807 (94.9%) | 150 (5.1%) |
| Installation, Maintenance & Repair | 1,667 (94.6%) | 96 (5.4%) |
| Total (Category) | 4,549 (94.5%) | 264 (5.5%) |
| Total (Overall) | 32,833 (51.8%) | 30,505 (48.2%) |
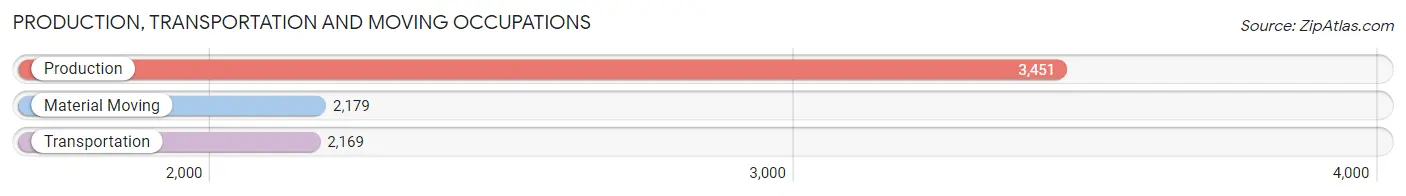
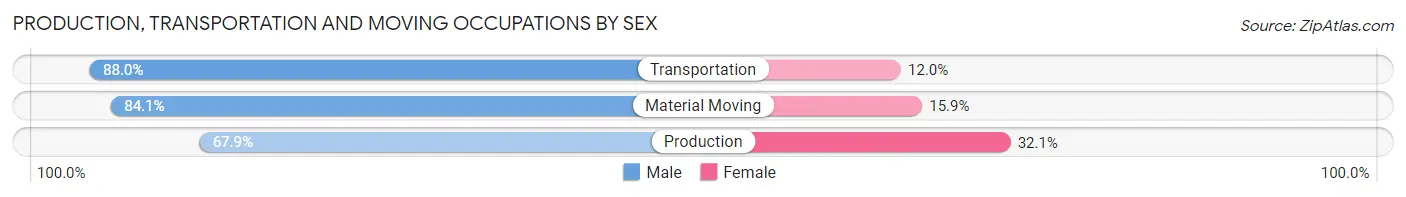
Production, Transportation and Moving Occupations
The most common Production, Transportation and Moving occupations in Washington County are Production (3,451 | 5.4%), Material Moving (2,179 | 3.4%), and Transportation (2,169 | 3.4%).
Production, Transportation and Moving Occupations by Sex
| Occupation | Male | Female |
| Production | 2,342 (67.9%) | 1,109 (32.1%) |
| Transportation | 1,908 (88.0%) | 261 (12.0%) |
| Material Moving | 1,832 (84.1%) | 347 (15.9%) |
| Total (Category) | 6,082 (78.0%) | 1,717 (22.0%) |
| Total (Overall) | 32,833 (51.8%) | 30,505 (48.2%) |
Employment Industries by Sex in Washington County
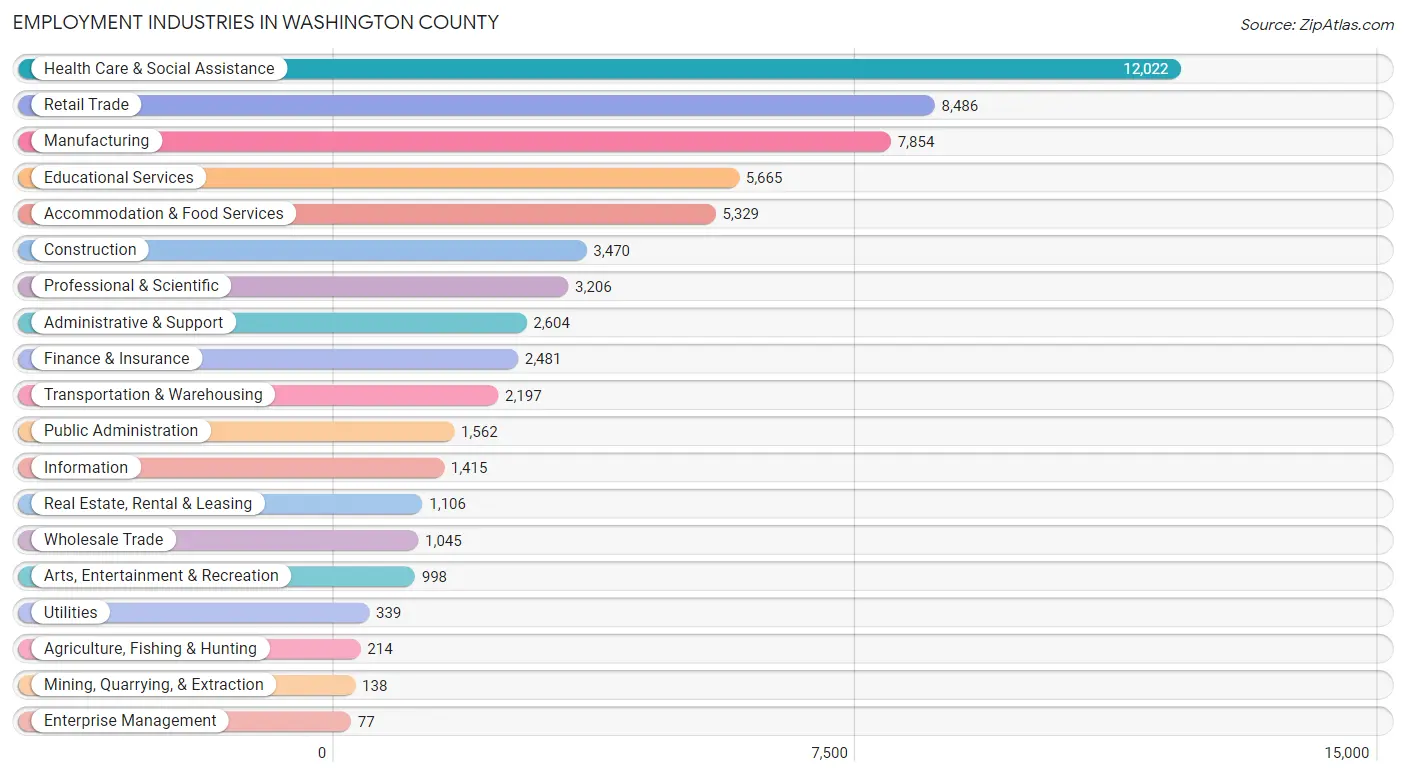
Employment Industries in Washington County
The major employment industries in Washington County include Health Care & Social Assistance (12,022 | 19.0%), Retail Trade (8,486 | 13.4%), Manufacturing (7,854 | 12.4%), Educational Services (5,665 | 8.9%), and Accommodation & Food Services (5,329 | 8.4%).
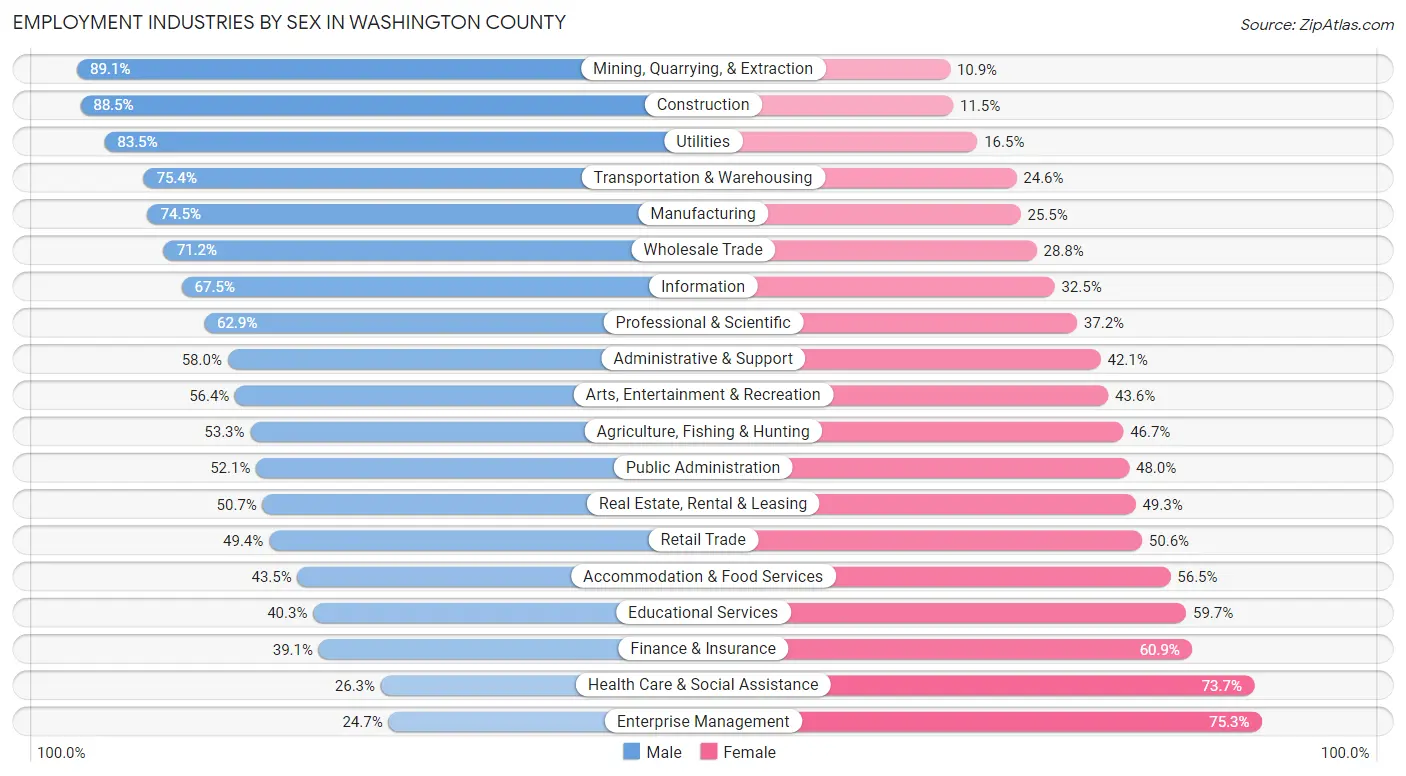
Employment Industries by Sex in Washington County
The Washington County industries that see more men than women are Mining, Quarrying, & Extraction (89.1%), Construction (88.5%), and Utilities (83.5%), whereas the industries that tend to have a higher number of women are Enterprise Management (75.3%), Health Care & Social Assistance (73.7%), and Finance & Insurance (60.9%).
| Industry | Male | Female |
| Agriculture, Fishing & Hunting | 114 (53.3%) | 100 (46.7%) |
| Mining, Quarrying, & Extraction | 123 (89.1%) | 15 (10.9%) |
| Construction | 3,070 (88.5%) | 400 (11.5%) |
| Manufacturing | 5,853 (74.5%) | 2,001 (25.5%) |
| Wholesale Trade | 744 (71.2%) | 301 (28.8%) |
| Retail Trade | 4,191 (49.4%) | 4,295 (50.6%) |
| Transportation & Warehousing | 1,656 (75.4%) | 541 (24.6%) |
| Utilities | 283 (83.5%) | 56 (16.5%) |
| Information | 955 (67.5%) | 460 (32.5%) |
| Finance & Insurance | 970 (39.1%) | 1,511 (60.9%) |
| Real Estate, Rental & Leasing | 561 (50.7%) | 545 (49.3%) |
| Professional & Scientific | 2,015 (62.8%) | 1,191 (37.1%) |
| Enterprise Management | 19 (24.7%) | 58 (75.3%) |
| Administrative & Support | 1,509 (58.0%) | 1,095 (42.0%) |
| Educational Services | 2,281 (40.3%) | 3,384 (59.7%) |
| Health Care & Social Assistance | 3,157 (26.3%) | 8,865 (73.7%) |
| Arts, Entertainment & Recreation | 563 (56.4%) | 435 (43.6%) |
| Accommodation & Food Services | 2,318 (43.5%) | 3,011 (56.5%) |
| Public Administration | 813 (52.0%) | 749 (47.9%) |
| Total | 32,833 (51.8%) | 30,505 (48.2%) |
Education in Washington County
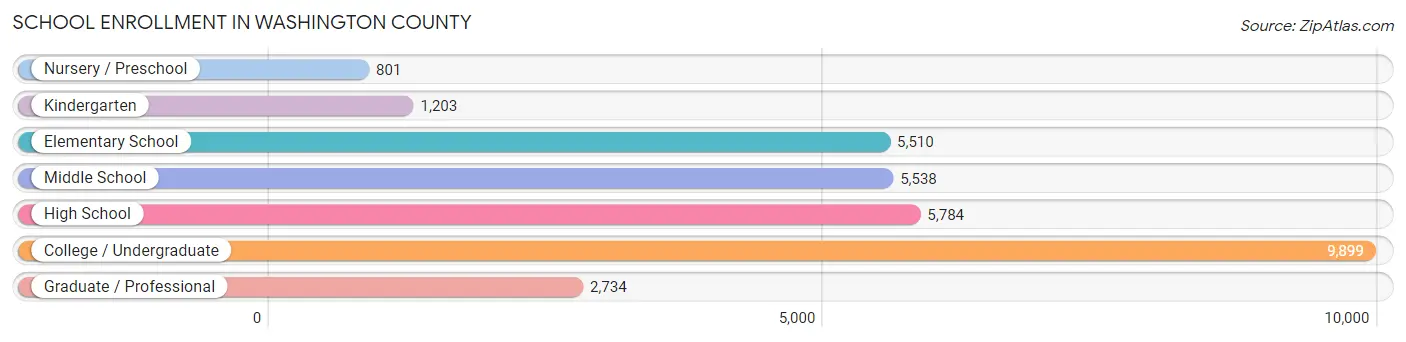
School Enrollment in Washington County
The most common levels of schooling among the 31,469 students in Washington County are college / undergraduate (9,899 | 31.5%), high school (5,784 | 18.4%), and middle school (5,538 | 17.6%).
| School Level | # Students | % Students |
| Nursery / Preschool | 801 | 2.5% |
| Kindergarten | 1,203 | 3.8% |
| Elementary School | 5,510 | 17.5% |
| Middle School | 5,538 | 17.6% |
| High School | 5,784 | 18.4% |
| College / Undergraduate | 9,899 | 31.5% |
| Graduate / Professional | 2,734 | 8.7% |
| Total | 31,469 | 100.0% |
School Enrollment by Age by Funding Source in Washington County
Out of a total of 31,469 students who are enrolled in schools in Washington County, 4,500 (14.3%) attend a private institution, while the remaining 26,969 (85.7%) are enrolled in public schools. The age group of 3 to 4 year olds has the highest likelihood of being enrolled in private schools, with 307 (53.2% in the age bracket) enrolled. Conversely, the age group of 18 to 19 year olds has the lowest likelihood of being enrolled in a private school, with 3,807 (94.6% in the age bracket) attending a public institution.
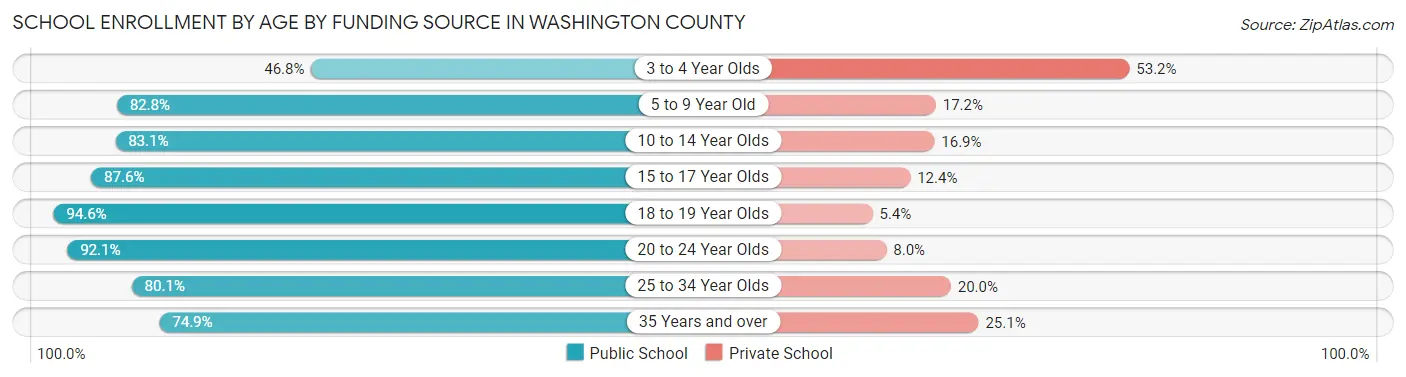
| Age Bracket | Public School | Private School |
| 3 to 4 Year Olds | 270 (46.8%) | 307 (53.2%) |
| 5 to 9 Year Old | 5,413 (82.8%) | 1,121 (17.2%) |
| 10 to 14 Year Olds | 5,493 (83.1%) | 1,116 (16.9%) |
| 15 to 17 Year Olds | 3,872 (87.6%) | 548 (12.4%) |
| 18 to 19 Year Olds | 3,807 (94.6%) | 216 (5.4%) |
| 20 to 24 Year Olds | 5,543 (92.0%) | 479 (8.0%) |
| 25 to 34 Year Olds | 1,701 (80.0%) | 424 (20.0%) |
| 35 Years and over | 868 (74.9%) | 291 (25.1%) |
| Total | 26,969 (85.7%) | 4,500 (14.3%) |
Educational Attainment by Field of Study in Washington County
Business (5,313 | 16.2%), science & technology (5,300 | 16.2%), education (4,278 | 13.1%), bio, nature & agricultural (2,893 | 8.8%), and arts & humanities (2,482 | 7.6%) are the most common fields of study among 32,764 individuals in Washington County who have obtained a bachelor's degree or higher.
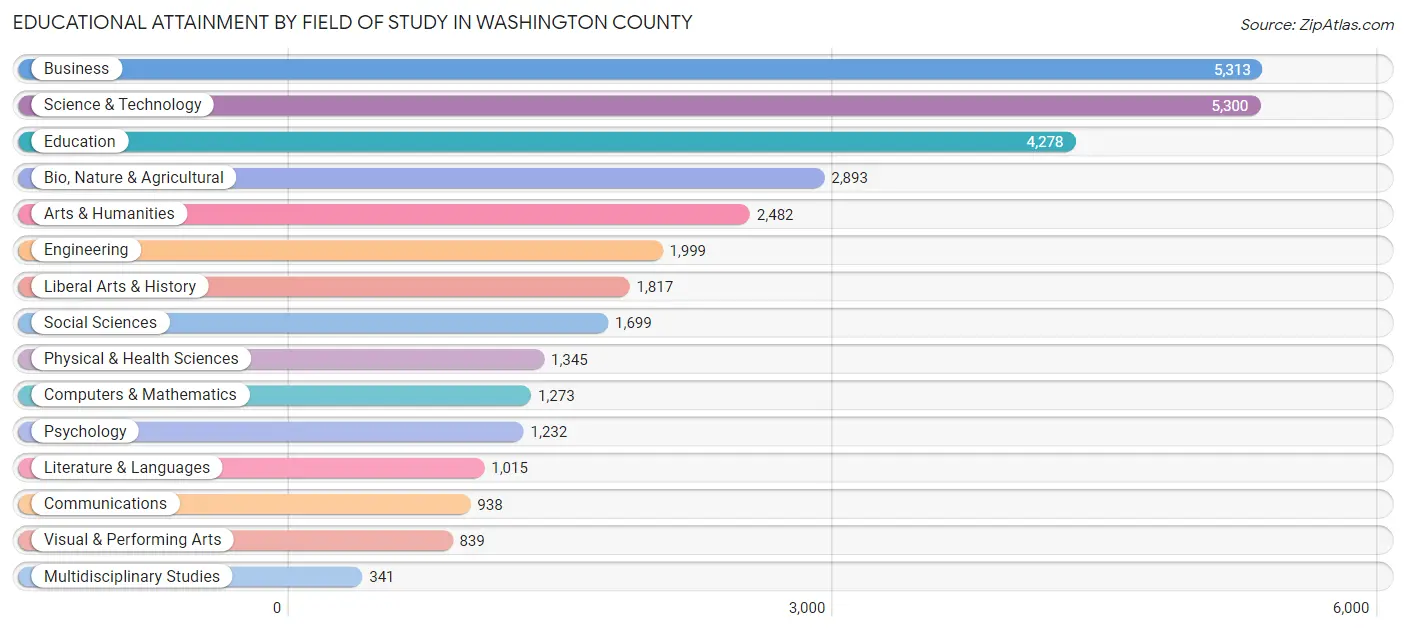
| Field of Study | # Graduates | % Graduates |
| Computers & Mathematics | 1,273 | 3.9% |
| Bio, Nature & Agricultural | 2,893 | 8.8% |
| Physical & Health Sciences | 1,345 | 4.1% |
| Psychology | 1,232 | 3.8% |
| Social Sciences | 1,699 | 5.2% |
| Engineering | 1,999 | 6.1% |
| Multidisciplinary Studies | 341 | 1.0% |
| Science & Technology | 5,300 | 16.2% |
| Business | 5,313 | 16.2% |
| Education | 4,278 | 13.1% |
| Literature & Languages | 1,015 | 3.1% |
| Liberal Arts & History | 1,817 | 5.6% |
| Visual & Performing Arts | 839 | 2.6% |
| Communications | 938 | 2.9% |
| Arts & Humanities | 2,482 | 7.6% |
| Total | 32,764 | 100.0% |
Transportation & Commute in Washington County
Vehicle Availability by Sex in Washington County
The most prevalent vehicle ownership categories in Washington County are males with 2 vehicles (13,073, accounting for 41.2%) and females with 2 vehicles (11,006, making up 44.7%).
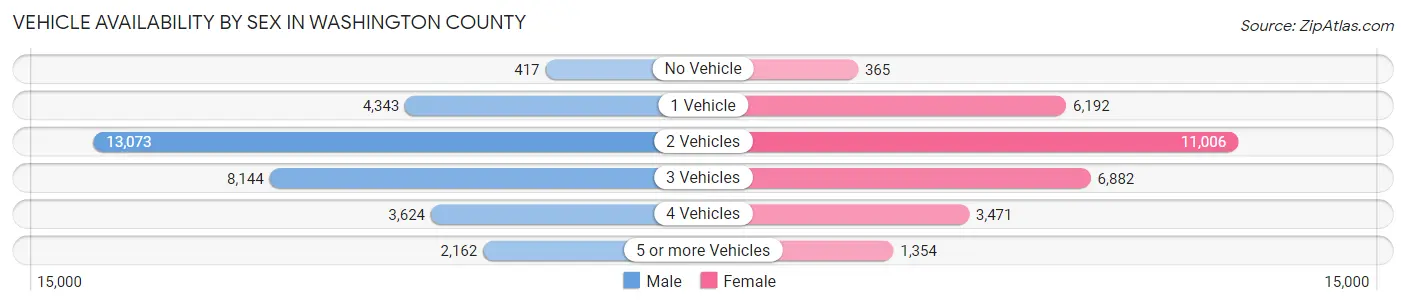
| Vehicles Available | Male | Female |
| No Vehicle | 417 (1.3%) | 365 (1.3%) |
| 1 Vehicle | 4,343 (13.7%) | 6,192 (21.1%) |
| 2 Vehicles | 13,073 (41.2%) | 11,006 (37.6%) |
| 3 Vehicles | 8,144 (25.6%) | 6,882 (23.5%) |
| 4 Vehicles | 3,624 (11.4%) | 3,471 (11.9%) |
| 5 or more Vehicles | 2,162 (6.8%) | 1,354 (4.6%) |
| Total | 31,763 (100.0%) | 29,270 (100.0%) |
Commute Time in Washington County
The most frequently occuring commute durations in Washington County are 15 to 19 minutes (11,013 commuters, 19.3%), 20 to 24 minutes (9,942 commuters, 17.4%), and 10 to 14 minutes (9,823 commuters, 17.2%).
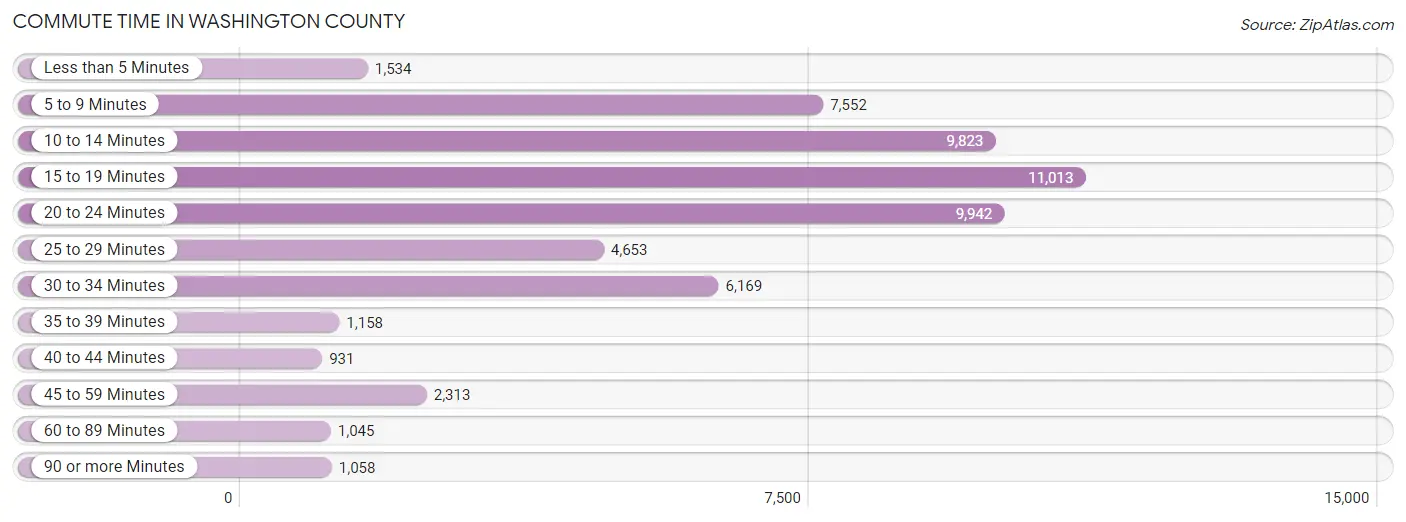
| Commute Time | # Commuters | % Commuters |
| Less than 5 Minutes | 1,534 | 2.7% |
| 5 to 9 Minutes | 7,552 | 13.2% |
| 10 to 14 Minutes | 9,823 | 17.2% |
| 15 to 19 Minutes | 11,013 | 19.3% |
| 20 to 24 Minutes | 9,942 | 17.4% |
| 25 to 29 Minutes | 4,653 | 8.1% |
| 30 to 34 Minutes | 6,169 | 10.8% |
| 35 to 39 Minutes | 1,158 | 2.0% |
| 40 to 44 Minutes | 931 | 1.6% |
| 45 to 59 Minutes | 2,313 | 4.0% |
| 60 to 89 Minutes | 1,045 | 1.8% |
| 90 or more Minutes | 1,058 | 1.8% |
Commute Time by Sex in Washington County
The most common commute times in Washington County are 15 to 19 minutes (5,775 commuters, 19.2%) for males and 15 to 19 minutes (5,238 commuters, 19.3%) for females.
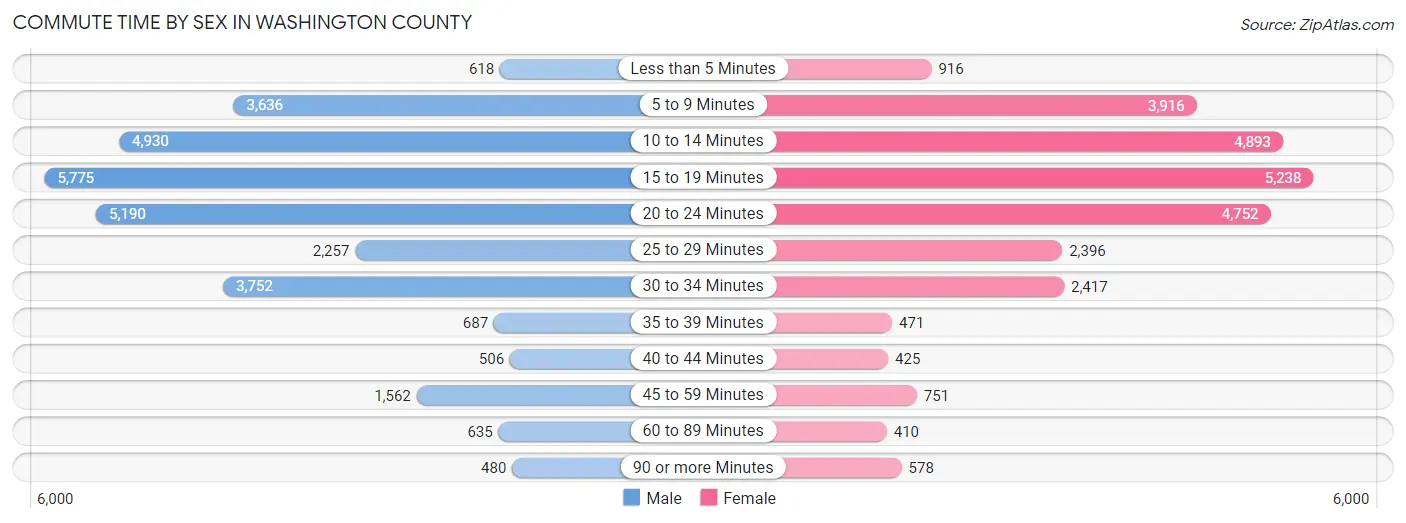
| Commute Time | Male | Female |
| Less than 5 Minutes | 618 (2.1%) | 916 (3.4%) |
| 5 to 9 Minutes | 3,636 (12.1%) | 3,916 (14.4%) |
| 10 to 14 Minutes | 4,930 (16.4%) | 4,893 (18.0%) |
| 15 to 19 Minutes | 5,775 (19.2%) | 5,238 (19.3%) |
| 20 to 24 Minutes | 5,190 (17.3%) | 4,752 (17.5%) |
| 25 to 29 Minutes | 2,257 (7.5%) | 2,396 (8.8%) |
| 30 to 34 Minutes | 3,752 (12.5%) | 2,417 (8.9%) |
| 35 to 39 Minutes | 687 (2.3%) | 471 (1.7%) |
| 40 to 44 Minutes | 506 (1.7%) | 425 (1.6%) |
| 45 to 59 Minutes | 1,562 (5.2%) | 751 (2.8%) |
| 60 to 89 Minutes | 635 (2.1%) | 410 (1.5%) |
| 90 or more Minutes | 480 (1.6%) | 578 (2.1%) |
Time of Departure to Work by Sex in Washington County
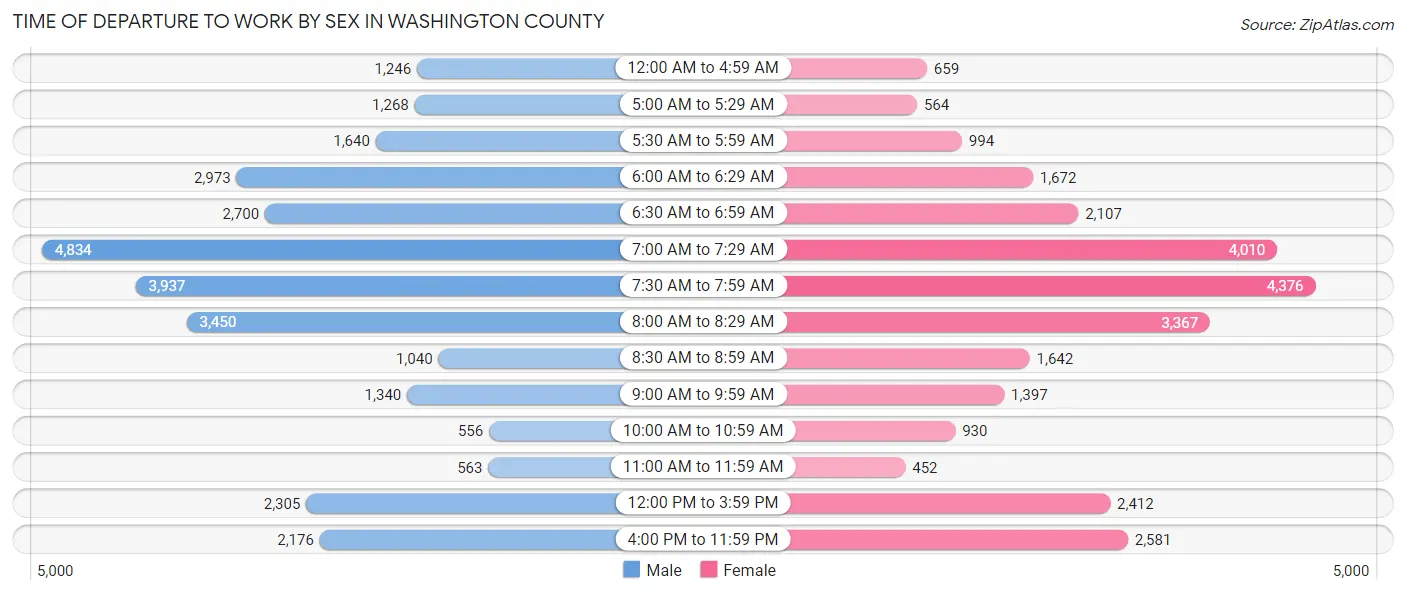
The most frequent times of departure to work in Washington County are 7:00 AM to 7:29 AM (4,834, 16.1%) for males and 7:30 AM to 7:59 AM (4,376, 16.1%) for females.
| Time of Departure | Male | Female |
| 12:00 AM to 4:59 AM | 1,246 (4.2%) | 659 (2.4%) |
| 5:00 AM to 5:29 AM | 1,268 (4.2%) | 564 (2.1%) |
| 5:30 AM to 5:59 AM | 1,640 (5.5%) | 994 (3.7%) |
| 6:00 AM to 6:29 AM | 2,973 (9.9%) | 1,672 (6.2%) |
| 6:30 AM to 6:59 AM | 2,700 (9.0%) | 2,107 (7.8%) |
| 7:00 AM to 7:29 AM | 4,834 (16.1%) | 4,010 (14.8%) |
| 7:30 AM to 7:59 AM | 3,937 (13.1%) | 4,376 (16.1%) |
| 8:00 AM to 8:29 AM | 3,450 (11.5%) | 3,367 (12.4%) |
| 8:30 AM to 8:59 AM | 1,040 (3.5%) | 1,642 (6.0%) |
| 9:00 AM to 9:59 AM | 1,340 (4.5%) | 1,397 (5.1%) |
| 10:00 AM to 10:59 AM | 556 (1.8%) | 930 (3.4%) |
| 11:00 AM to 11:59 AM | 563 (1.9%) | 452 (1.7%) |
| 12:00 PM to 3:59 PM | 2,305 (7.7%) | 2,412 (8.9%) |
| 4:00 PM to 11:59 PM | 2,176 (7.2%) | 2,581 (9.5%) |
| Total | 30,028 (100.0%) | 27,163 (100.0%) |
Housing Occupancy in Washington County
Occupancy by Ownership in Washington County
Of the total 55,591 dwellings in Washington County, owner-occupied units account for 35,735 (64.3%), while renter-occupied units make up 19,856 (35.7%).
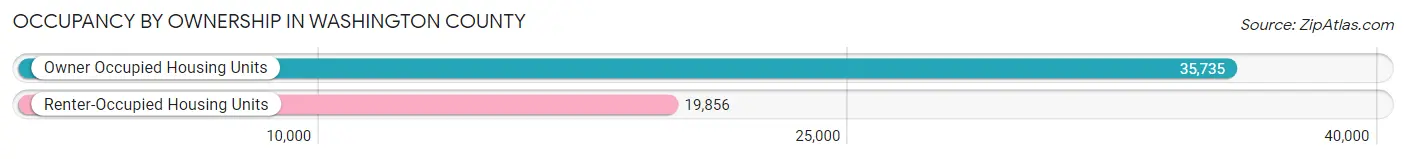
| Occupancy | # Housing Units | % Housing Units |
| Owner Occupied Housing Units | 35,735 | 64.3% |
| Renter-Occupied Housing Units | 19,856 | 35.7% |
| Total Occupied Housing Units | 55,591 | 100.0% |
Occupancy by Household Size in Washington County
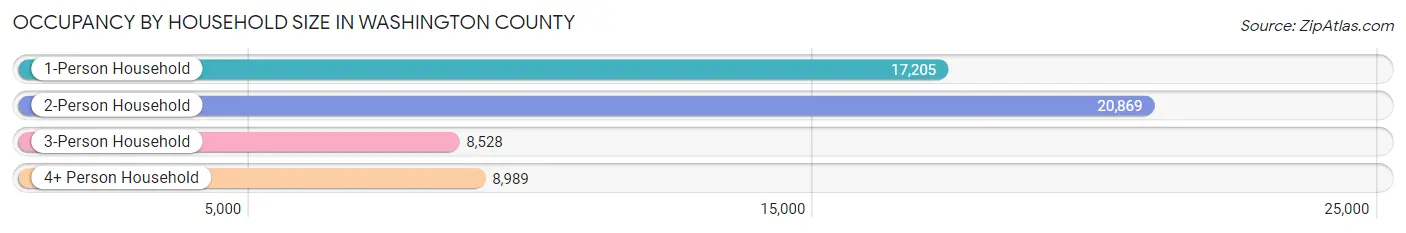
| Household Size | # Housing Units | % Housing Units |
| 1-Person Household | 17,205 | 30.9% |
| 2-Person Household | 20,869 | 37.5% |
| 3-Person Household | 8,528 | 15.3% |
| 4+ Person Household | 8,989 | 16.2% |
| Total Housing Units | 55,591 | 100.0% |
Occupancy by Ownership by Household Size in Washington County
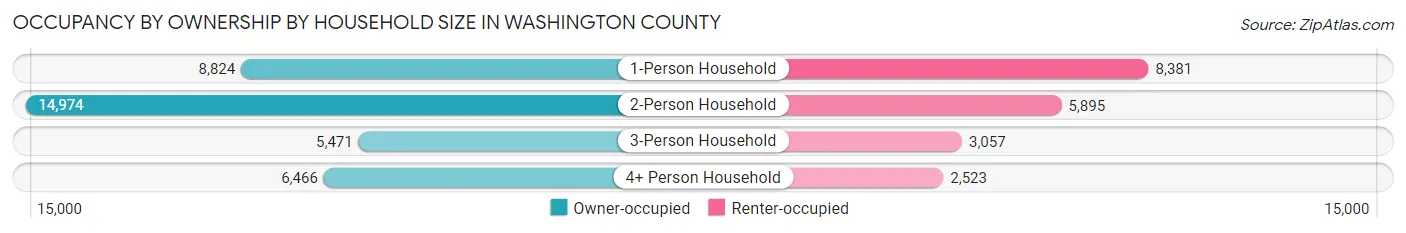
| Household Size | Owner-occupied | Renter-occupied |
| 1-Person Household | 8,824 (51.3%) | 8,381 (48.7%) |
| 2-Person Household | 14,974 (71.8%) | 5,895 (28.2%) |
| 3-Person Household | 5,471 (64.1%) | 3,057 (35.8%) |
| 4+ Person Household | 6,466 (71.9%) | 2,523 (28.1%) |
| Total Housing Units | 35,735 (64.3%) | 19,856 (35.7%) |
Occupancy by Educational Attainment in Washington County
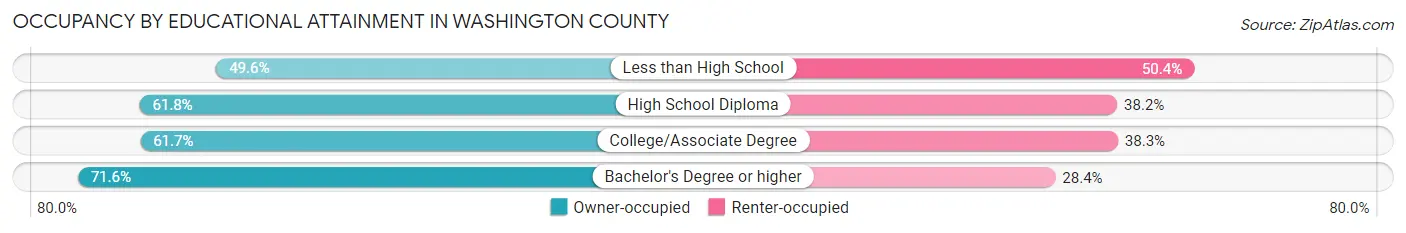
| Household Size | Owner-occupied | Renter-occupied |
| Less than High School | 2,071 (49.6%) | 2,104 (50.4%) |
| High School Diploma | 8,712 (61.8%) | 5,390 (38.2%) |
| College/Associate Degree | 10,915 (61.7%) | 6,786 (38.3%) |
| Bachelor's Degree or higher | 14,037 (71.6%) | 5,576 (28.4%) |
Occupancy by Age of Householder in Washington County
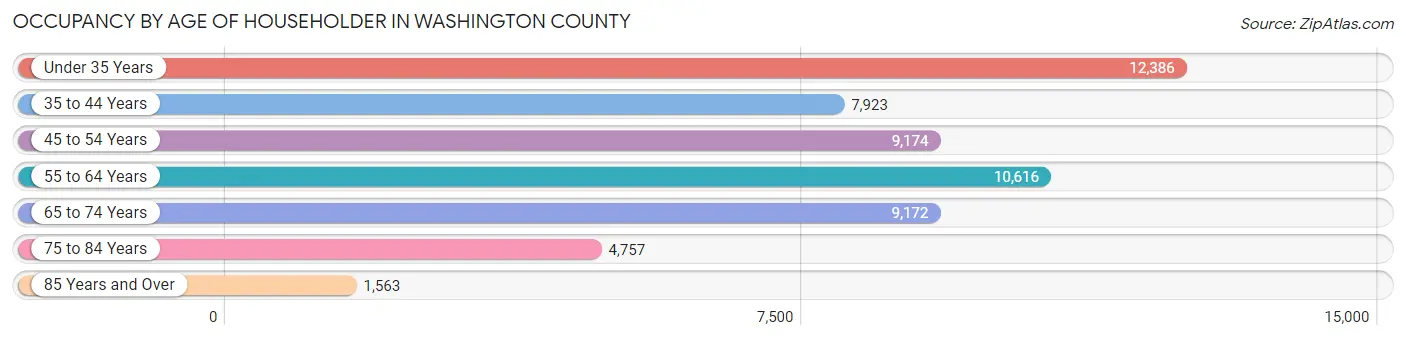
| Age Bracket | # Households | % Households |
| Under 35 Years | 12,386 | 22.3% |
| 35 to 44 Years | 7,923 | 14.2% |
| 45 to 54 Years | 9,174 | 16.5% |
| 55 to 64 Years | 10,616 | 19.1% |
| 65 to 74 Years | 9,172 | 16.5% |
| 75 to 84 Years | 4,757 | 8.6% |
| 85 Years and Over | 1,563 | 2.8% |
| Total | 55,591 | 100.0% |
Housing Finances in Washington County
Median Income by Occupancy in Washington County
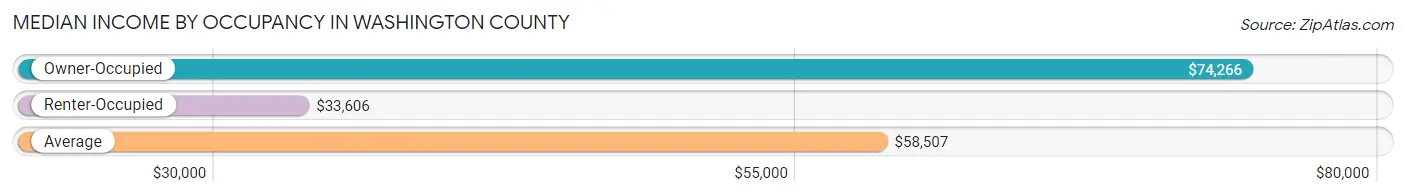
| Occupancy Type | # Households | Median Income |
| Owner-Occupied | 35,735 (64.3%) | $74,266 |
| Renter-Occupied | 19,856 (35.7%) | $33,606 |
| Average | 55,591 (100.0%) | $58,507 |
Occupancy by Householder Income Bracket in Washington County
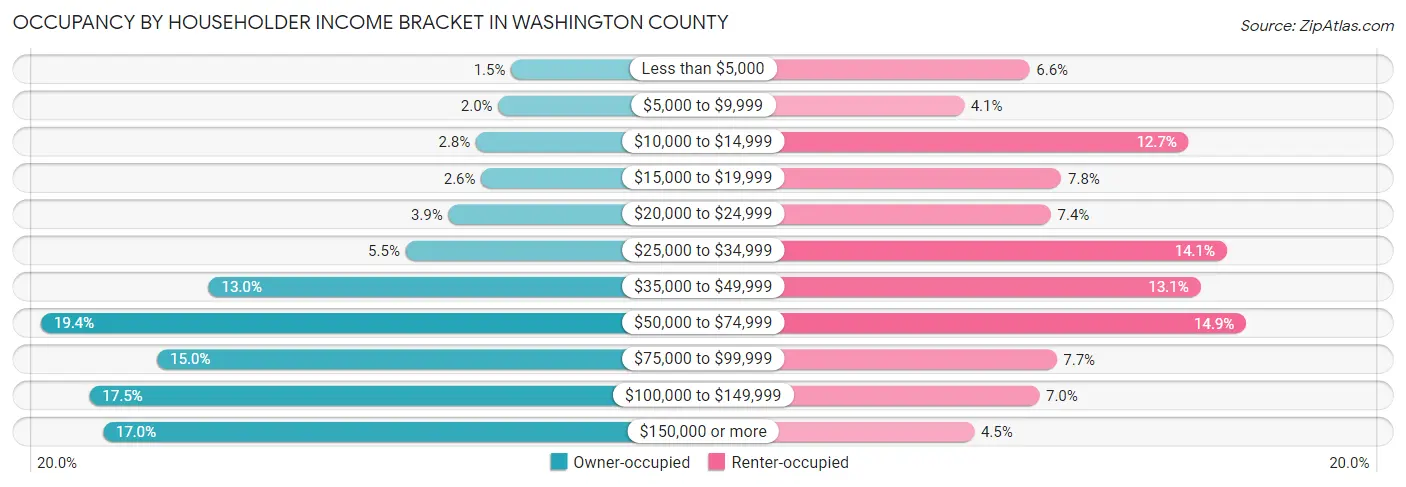
| Income Bracket | Owner-occupied | Renter-occupied |
| Less than $5,000 | 520 (1.5%) | 1,314 (6.6%) |
| $5,000 to $9,999 | 696 (1.9%) | 818 (4.1%) |
| $10,000 to $14,999 | 1,002 (2.8%) | 2,520 (12.7%) |
| $15,000 to $19,999 | 928 (2.6%) | 1,555 (7.8%) |
| $20,000 to $24,999 | 1,376 (3.8%) | 1,476 (7.4%) |
| $25,000 to $34,999 | 1,959 (5.5%) | 2,807 (14.1%) |
| $35,000 to $49,999 | 4,643 (13.0%) | 2,610 (13.1%) |
| $50,000 to $74,999 | 6,924 (19.4%) | 2,954 (14.9%) |
| $75,000 to $99,999 | 5,342 (14.9%) | 1,519 (7.6%) |
| $100,000 to $149,999 | 6,263 (17.5%) | 1,388 (7.0%) |
| $150,000 or more | 6,082 (17.0%) | 895 (4.5%) |
| Total | 35,735 (100.0%) | 19,856 (100.0%) |
Monthly Housing Cost Tiers in Washington County
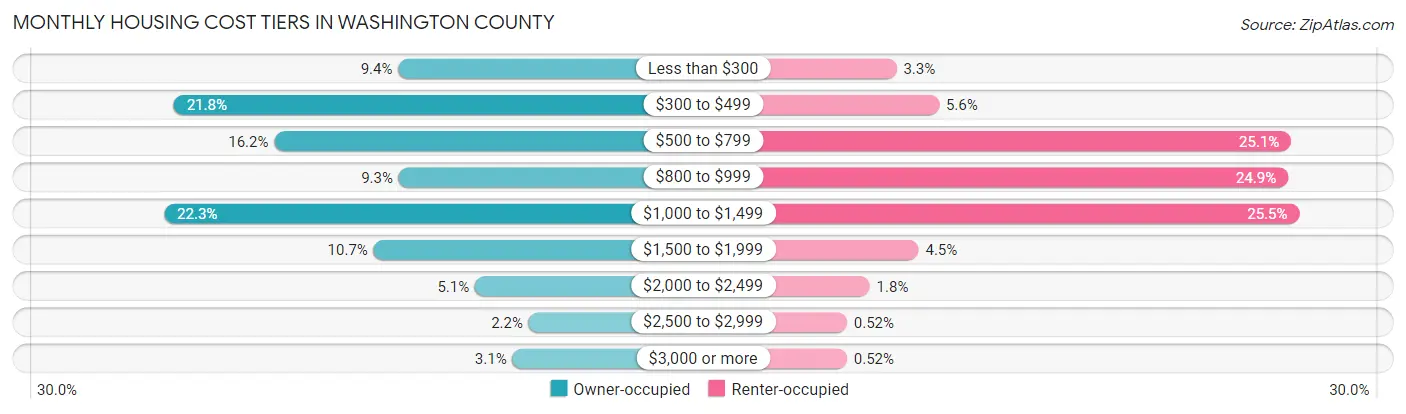
| Monthly Cost | Owner-occupied | Renter-occupied |
| Less than $300 | 3,346 (9.4%) | 647 (3.3%) |
| $300 to $499 | 7,777 (21.8%) | 1,114 (5.6%) |
| $500 to $799 | 5,791 (16.2%) | 4,976 (25.1%) |
| $800 to $999 | 3,335 (9.3%) | 4,943 (24.9%) |
| $1,000 to $1,499 | 7,966 (22.3%) | 5,066 (25.5%) |
| $1,500 to $1,999 | 3,830 (10.7%) | 889 (4.5%) |
| $2,000 to $2,499 | 1,831 (5.1%) | 354 (1.8%) |
| $2,500 to $2,999 | 769 (2.1%) | 103 (0.5%) |
| $3,000 or more | 1,090 (3.0%) | 104 (0.5%) |
| Total | 35,735 (100.0%) | 19,856 (100.0%) |
Physical Housing Characteristics in Washington County
Housing Structures in Washington County
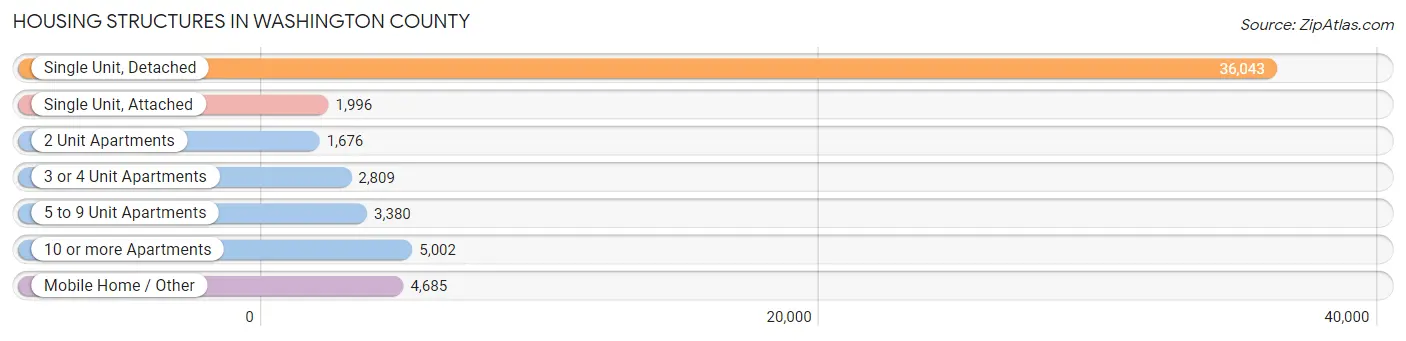
| Structure Type | # Housing Units | % Housing Units |
| Single Unit, Detached | 36,043 | 64.8% |
| Single Unit, Attached | 1,996 | 3.6% |
| 2 Unit Apartments | 1,676 | 3.0% |
| 3 or 4 Unit Apartments | 2,809 | 5.1% |
| 5 to 9 Unit Apartments | 3,380 | 6.1% |
| 10 or more Apartments | 5,002 | 9.0% |
| Mobile Home / Other | 4,685 | 8.4% |
| Total | 55,591 | 100.0% |
Housing Structures by Occupancy in Washington County
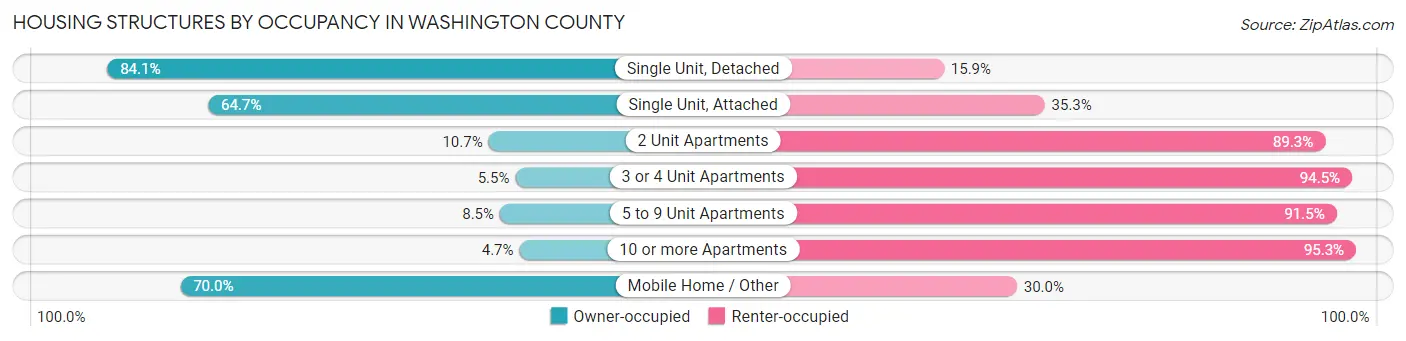
| Structure Type | Owner-occupied | Renter-occupied |
| Single Unit, Detached | 30,305 (84.1%) | 5,738 (15.9%) |
| Single Unit, Attached | 1,291 (64.7%) | 705 (35.3%) |
| 2 Unit Apartments | 179 (10.7%) | 1,497 (89.3%) |
| 3 or 4 Unit Apartments | 155 (5.5%) | 2,654 (94.5%) |
| 5 to 9 Unit Apartments | 287 (8.5%) | 3,093 (91.5%) |
| 10 or more Apartments | 237 (4.7%) | 4,765 (95.3%) |
| Mobile Home / Other | 3,281 (70.0%) | 1,404 (30.0%) |
| Total | 35,735 (64.3%) | 19,856 (35.7%) |
Housing Structures by Number of Rooms in Washington County
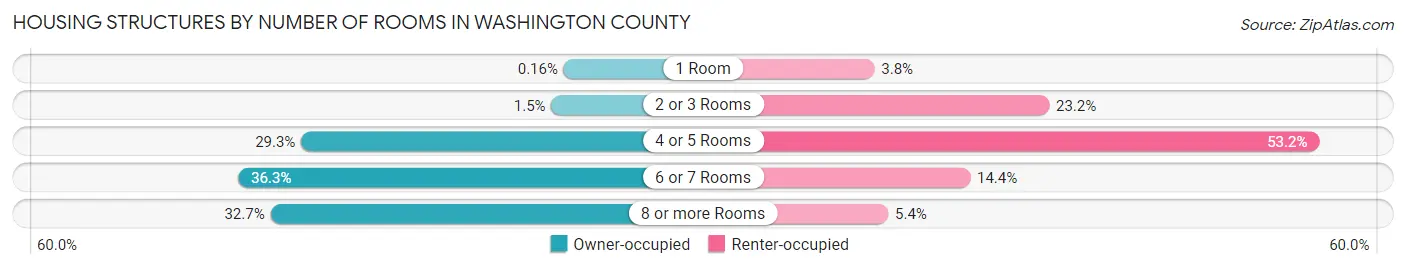
| Number of Rooms | Owner-occupied | Renter-occupied |
| 1 Room | 57 (0.2%) | 758 (3.8%) |
| 2 or 3 Rooms | 545 (1.5%) | 4,608 (23.2%) |
| 4 or 5 Rooms | 10,469 (29.3%) | 10,561 (53.2%) |
| 6 or 7 Rooms | 12,976 (36.3%) | 2,867 (14.4%) |
| 8 or more Rooms | 11,688 (32.7%) | 1,062 (5.3%) |
| Total | 35,735 (100.0%) | 19,856 (100.0%) |
Housing Structure by Heating Type in Washington County
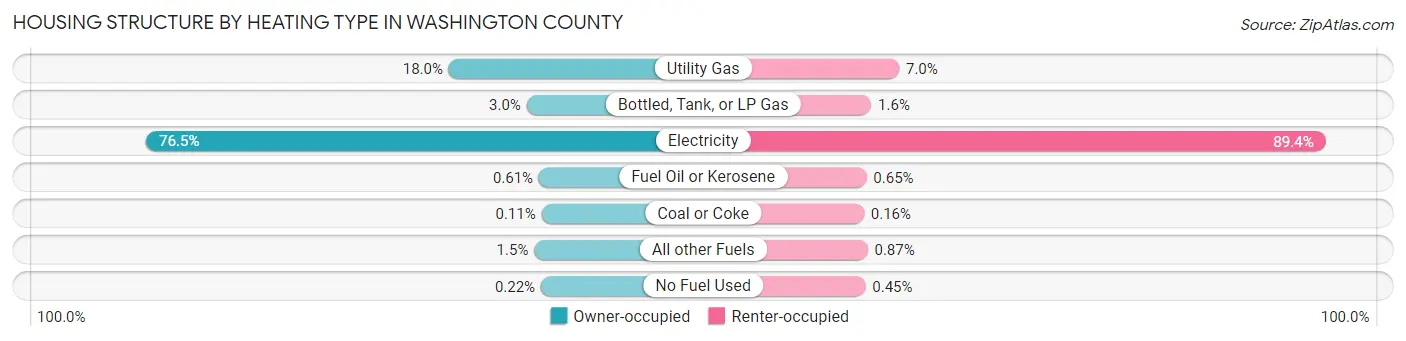
| Heating Type | Owner-occupied | Renter-occupied |
| Utility Gas | 6,442 (18.0%) | 1,379 (7.0%) |
| Bottled, Tank, or LP Gas | 1,065 (3.0%) | 312 (1.6%) |
| Electricity | 27,349 (76.5%) | 17,742 (89.3%) |
| Fuel Oil or Kerosene | 219 (0.6%) | 130 (0.6%) |
| Coal or Coke | 38 (0.1%) | 31 (0.2%) |
| All other Fuels | 544 (1.5%) | 173 (0.9%) |
| No Fuel Used | 78 (0.2%) | 89 (0.4%) |
| Total | 35,735 (100.0%) | 19,856 (100.0%) |
Household Vehicle Usage in Washington County
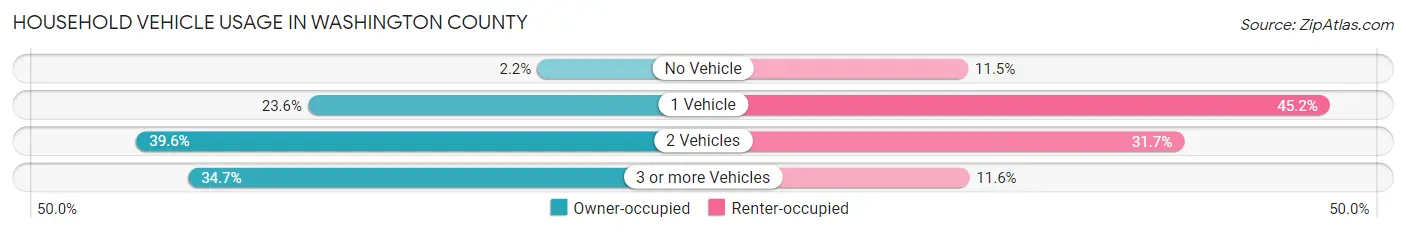
| Vehicles per Household | Owner-occupied | Renter-occupied |
| No Vehicle | 773 (2.2%) | 2,283 (11.5%) |
| 1 Vehicle | 8,420 (23.6%) | 8,981 (45.2%) |
| 2 Vehicles | 14,135 (39.6%) | 6,284 (31.7%) |
| 3 or more Vehicles | 12,407 (34.7%) | 2,308 (11.6%) |
| Total | 35,735 (100.0%) | 19,856 (100.0%) |
Real Estate & Mortgages in Washington County
Real Estate and Mortgage Overview in Washington County
| Characteristic | Without Mortgage | With Mortgage |
| Housing Units | 15,759 | 19,976 |
| Median Property Value | $192,700 | $224,900 |
| Median Household Income | $57,380 | $4,179 |
| Monthly Housing Costs | $420 | $1,056 |
| Real Estate Taxes | $1,204 | $687 |
Property Value by Mortgage Status in Washington County
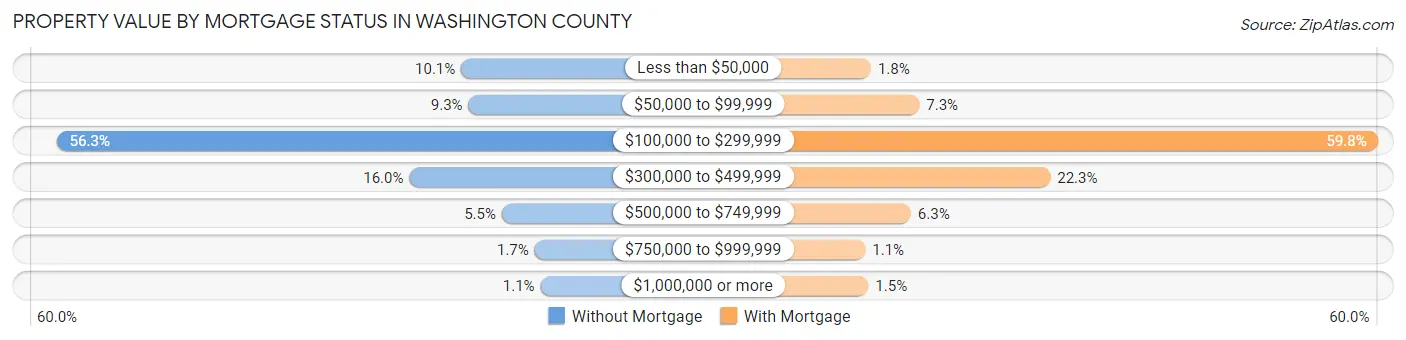
| Property Value | Without Mortgage | With Mortgage |
| Less than $50,000 | 1,594 (10.1%) | 352 (1.8%) |
| $50,000 to $99,999 | 1,463 (9.3%) | 1,457 (7.3%) |
| $100,000 to $299,999 | 8,879 (56.3%) | 11,940 (59.8%) |
| $300,000 to $499,999 | 2,527 (16.0%) | 4,446 (22.3%) |
| $500,000 to $749,999 | 860 (5.5%) | 1,265 (6.3%) |
| $750,000 to $999,999 | 270 (1.7%) | 223 (1.1%) |
| $1,000,000 or more | 166 (1.1%) | 293 (1.5%) |
| Total | 15,759 (100.0%) | 19,976 (100.0%) |
Household Income by Mortgage Status in Washington County
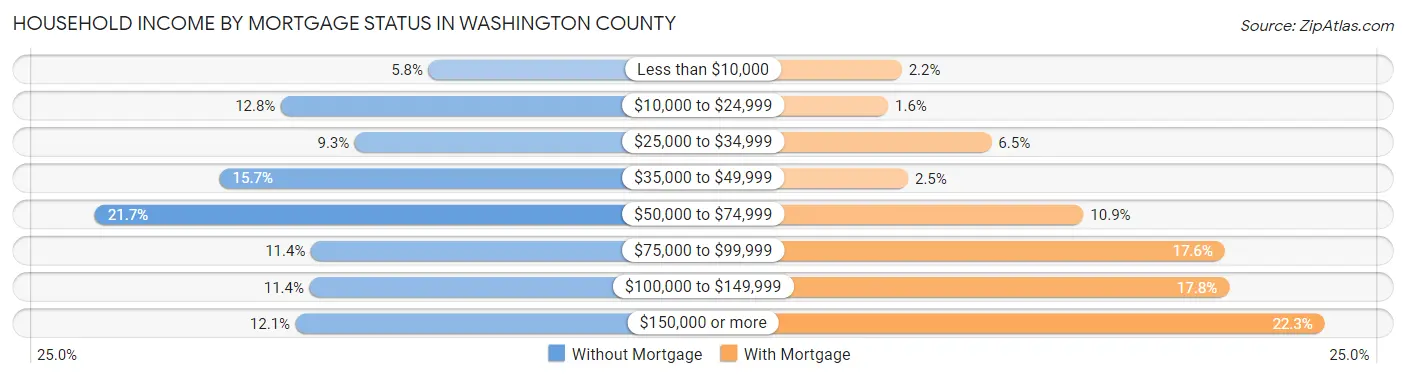
| Household Income | Without Mortgage | With Mortgage |
| Less than $10,000 | 906 (5.8%) | 439 (2.2%) |
| $10,000 to $24,999 | 2,014 (12.8%) | 310 (1.5%) |
| $25,000 to $34,999 | 1,459 (9.3%) | 1,292 (6.5%) |
| $35,000 to $49,999 | 2,476 (15.7%) | 500 (2.5%) |
| $50,000 to $74,999 | 3,412 (21.6%) | 2,167 (10.8%) |
| $75,000 to $99,999 | 1,789 (11.4%) | 3,512 (17.6%) |
| $100,000 to $149,999 | 1,800 (11.4%) | 3,553 (17.8%) |
| $150,000 or more | 1,903 (12.1%) | 4,463 (22.3%) |
| Total | 15,759 (100.0%) | 19,976 (100.0%) |
Property Value to Household Income Ratio in Washington County
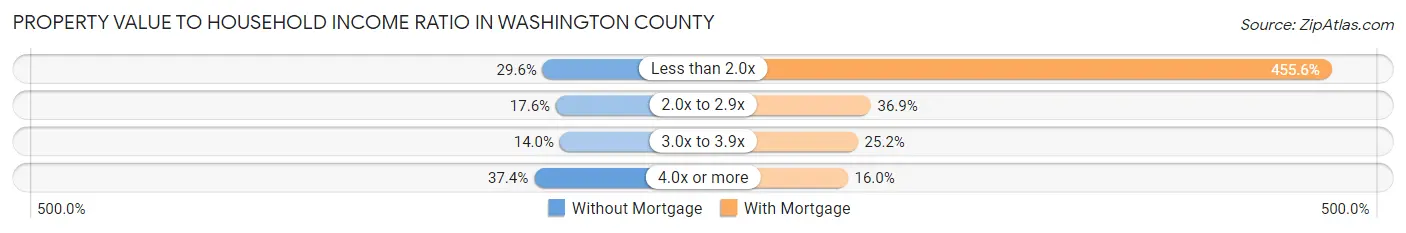
| Value-to-Income Ratio | Without Mortgage | With Mortgage |
| Less than 2.0x | 4,659 (29.6%) | 91,008 (455.6%) |
| 2.0x to 2.9x | 2,765 (17.5%) | 7,363 (36.9%) |
| 3.0x to 3.9x | 2,204 (14.0%) | 5,028 (25.2%) |
| 4.0x or more | 5,887 (37.4%) | 3,195 (16.0%) |
| Total | 15,759 (100.0%) | 19,976 (100.0%) |
Real Estate Taxes by Mortgage Status in Washington County
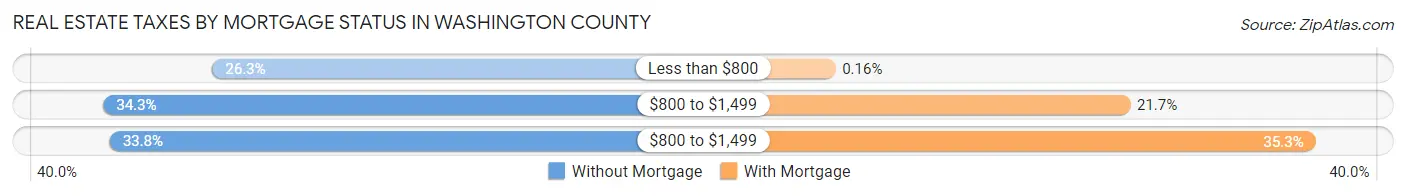
| Property Taxes | Without Mortgage | With Mortgage |
| Less than $800 | 4,142 (26.3%) | 32 (0.2%) |
| $800 to $1,499 | 5,398 (34.3%) | 4,334 (21.7%) |
| $800 to $1,499 | 5,323 (33.8%) | 7,042 (35.2%) |
| Total | 15,759 (100.0%) | 19,976 (100.0%) |
Health & Disability in Washington County
Health Insurance Coverage by Age in Washington County
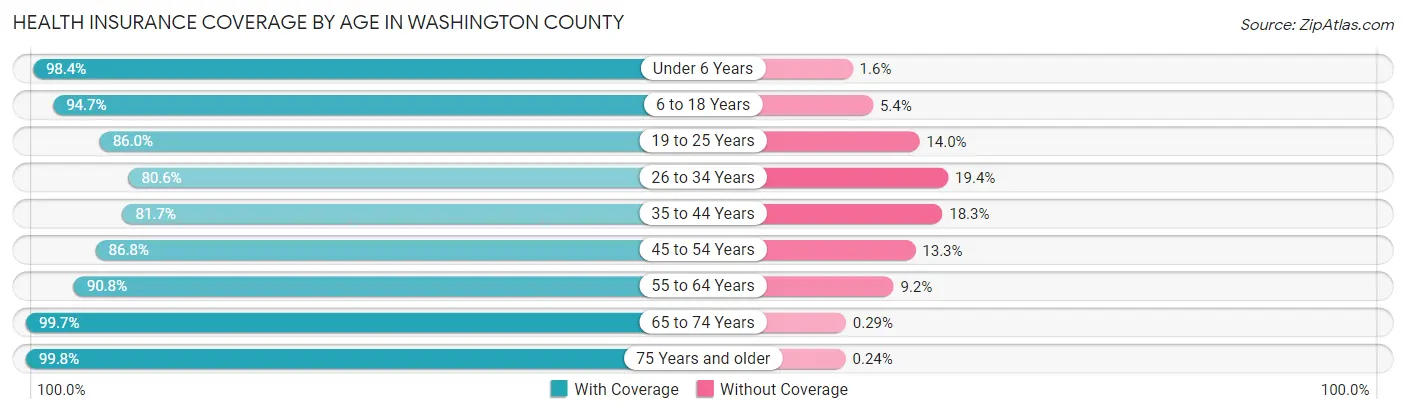
| Age Bracket | With Coverage | Without Coverage |
| Under 6 Years | 7,463 (98.4%) | 118 (1.6%) |
| 6 to 18 Years | 18,500 (94.7%) | 1,045 (5.3%) |
| 19 to 25 Years | 14,632 (86.0%) | 2,383 (14.0%) |
| 26 to 34 Years | 11,681 (80.6%) | 2,806 (19.4%) |
| 35 to 44 Years | 12,369 (81.7%) | 2,767 (18.3%) |
| 45 to 54 Years | 14,216 (86.8%) | 2,171 (13.3%) |
| 55 to 64 Years | 15,993 (90.8%) | 1,616 (9.2%) |
| 65 to 74 Years | 14,369 (99.7%) | 42 (0.3%) |
| 75 Years and older | 9,402 (99.8%) | 23 (0.2%) |
| Total | 118,625 (90.1%) | 12,971 (9.9%) |
Health Insurance Coverage by Citizenship Status in Washington County
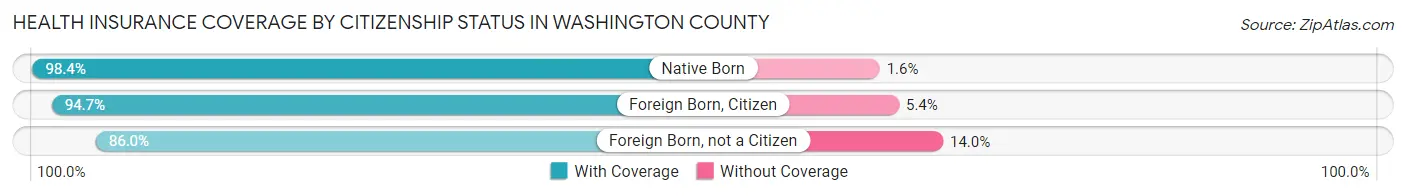
| Citizenship Status | With Coverage | Without Coverage |
| Native Born | 7,463 (98.4%) | 118 (1.6%) |
| Foreign Born, Citizen | 18,500 (94.7%) | 1,045 (5.3%) |
| Foreign Born, not a Citizen | 14,632 (86.0%) | 2,383 (14.0%) |
Health Insurance Coverage by Household Income in Washington County
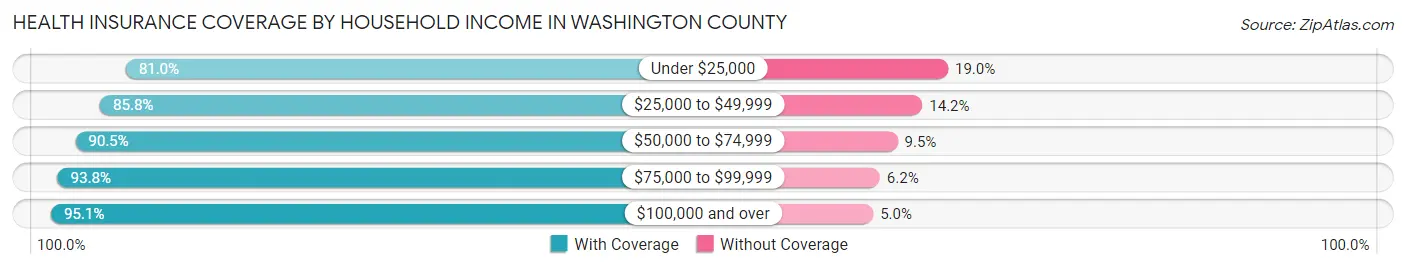
| Household Income | With Coverage | Without Coverage |
| Under $25,000 | 16,322 (81.0%) | 3,822 (19.0%) |
| $25,000 to $49,999 | 20,787 (85.8%) | 3,429 (14.2%) |
| $50,000 to $74,999 | 21,142 (90.5%) | 2,225 (9.5%) |
| $75,000 to $99,999 | 16,668 (93.8%) | 1,102 (6.2%) |
| $100,000 and over | 40,715 (95.1%) | 2,121 (5.0%) |
Public vs Private Health Insurance Coverage by Age in Washington County
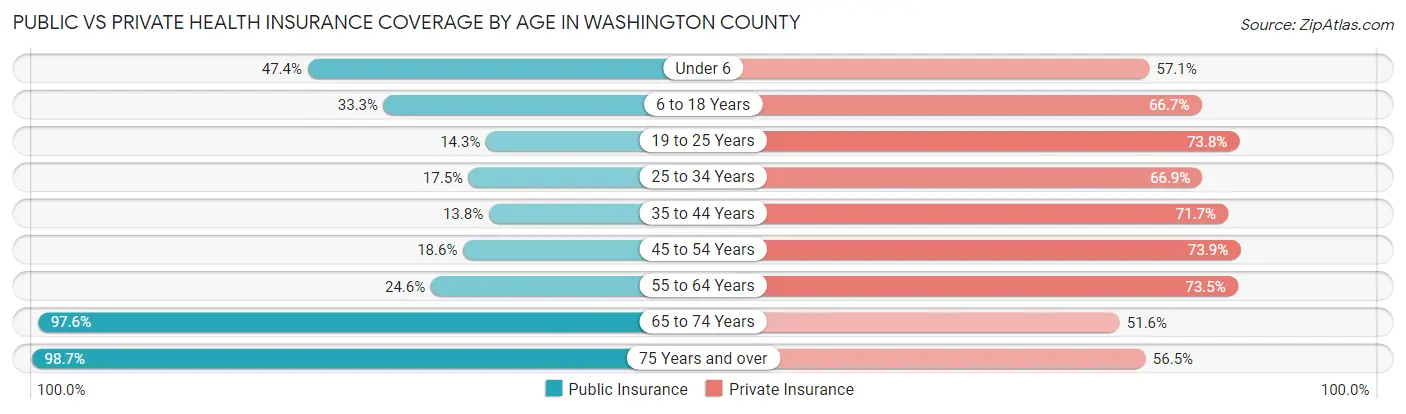
| Age Bracket | Public Insurance | Private Insurance |
| Under 6 | 3,596 (47.4%) | 4,330 (57.1%) |
| 6 to 18 Years | 6,513 (33.3%) | 13,039 (66.7%) |
| 19 to 25 Years | 2,434 (14.3%) | 12,550 (73.8%) |
| 25 to 34 Years | 2,540 (17.5%) | 9,691 (66.9%) |
| 35 to 44 Years | 2,089 (13.8%) | 10,845 (71.7%) |
| 45 to 54 Years | 3,044 (18.6%) | 12,112 (73.9%) |
| 55 to 64 Years | 4,324 (24.6%) | 12,933 (73.5%) |
| 65 to 74 Years | 14,059 (97.6%) | 7,437 (51.6%) |
| 75 Years and over | 9,302 (98.7%) | 5,320 (56.5%) |
| Total | 47,901 (36.4%) | 88,257 (67.1%) |
Disability Status by Sex by Age in Washington County
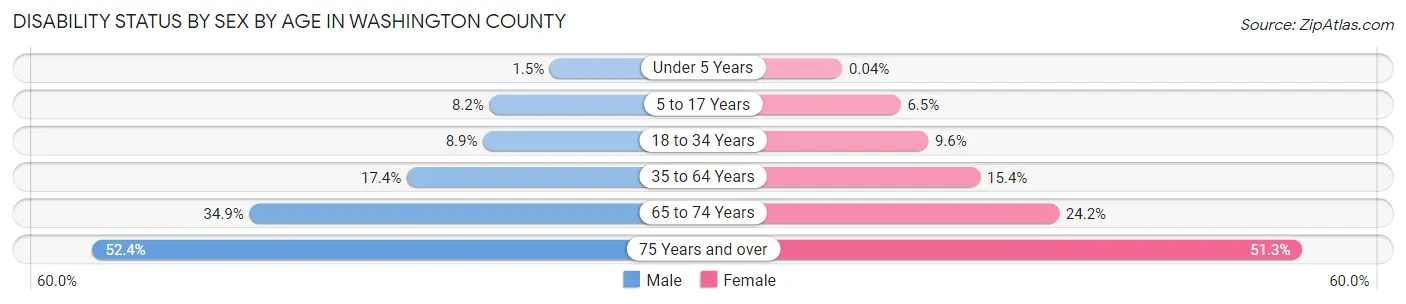
| Age Bracket | Male | Female |
| Under 5 Years | 50 (1.5%) | 1 (0.0%) |
| 5 to 17 Years | 780 (8.2%) | 596 (6.5%) |
| 18 to 34 Years | 1,463 (8.9%) | 1,671 (9.6%) |
| 35 to 64 Years | 4,288 (17.4%) | 3,775 (15.4%) |
| 65 to 74 Years | 2,418 (34.9%) | 1,811 (24.2%) |
| 75 Years and over | 2,103 (52.4%) | 2,777 (51.3%) |
Disability Class by Sex by Age in Washington County
Disability Class: Hearing Difficulty
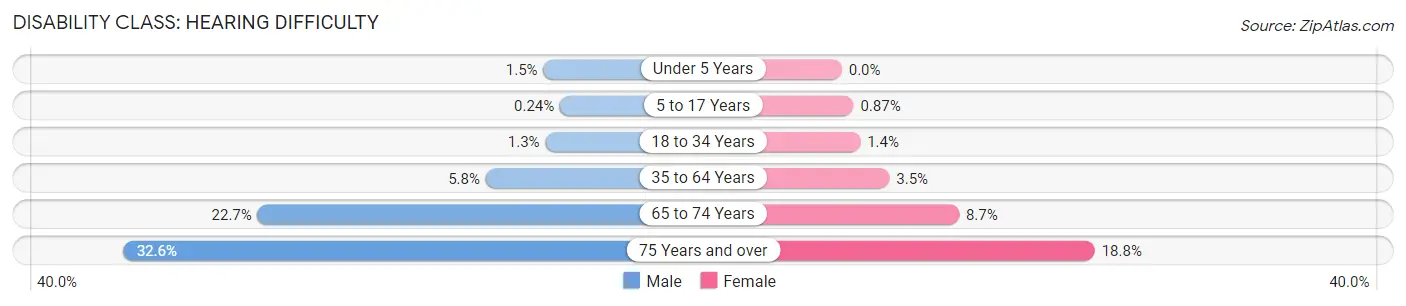
| Age Bracket | Male | Female |
| Under 5 Years | 50 (1.5%) | 0 (0.0%) |
| 5 to 17 Years | 23 (0.2%) | 79 (0.9%) |
| 18 to 34 Years | 218 (1.3%) | 238 (1.4%) |
| 35 to 64 Years | 1,418 (5.8%) | 864 (3.5%) |
| 65 to 74 Years | 1,571 (22.7%) | 652 (8.7%) |
| 75 Years and over | 1,309 (32.6%) | 1,017 (18.8%) |
Disability Class: Vision Difficulty
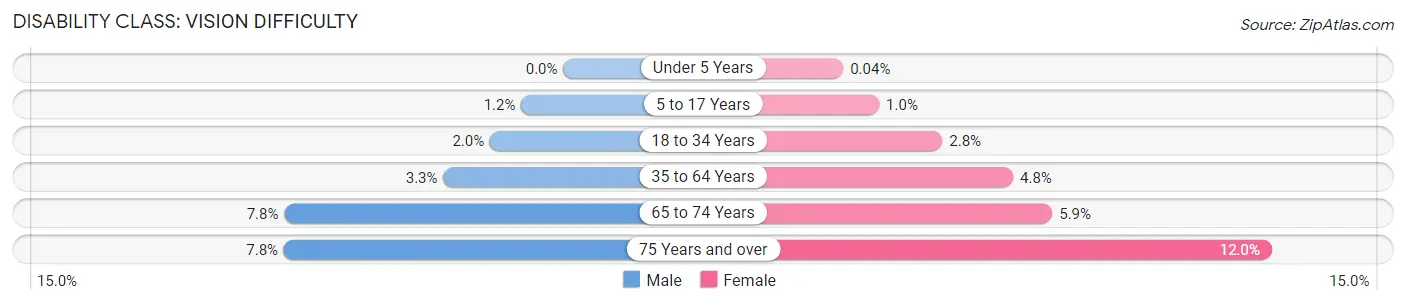
| Age Bracket | Male | Female |
| Under 5 Years | 0 (0.0%) | 1 (0.0%) |
| 5 to 17 Years | 111 (1.2%) | 95 (1.0%) |
| 18 to 34 Years | 335 (2.0%) | 487 (2.8%) |
| 35 to 64 Years | 823 (3.3%) | 1,169 (4.8%) |
| 65 to 74 Years | 538 (7.8%) | 439 (5.9%) |
| 75 Years and over | 312 (7.8%) | 648 (12.0%) |
Disability Class: Cognitive Difficulty
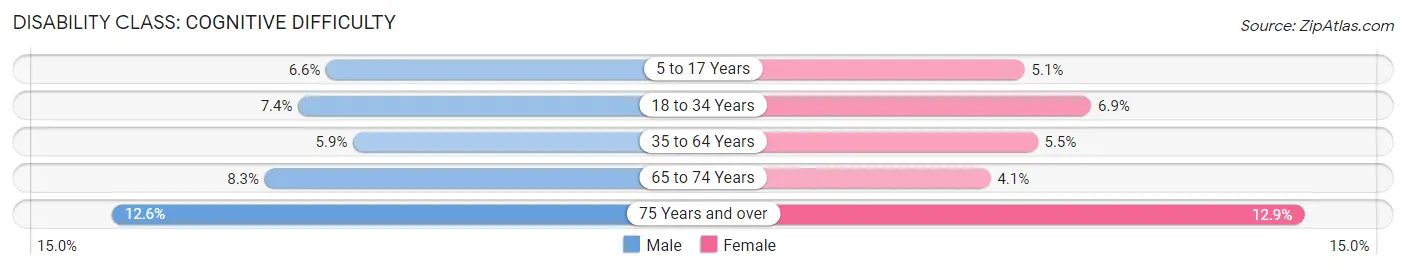
| Age Bracket | Male | Female |
| 5 to 17 Years | 626 (6.6%) | 464 (5.1%) |
| 18 to 34 Years | 1,210 (7.4%) | 1,208 (6.9%) |
| 35 to 64 Years | 1,440 (5.9%) | 1,335 (5.4%) |
| 65 to 74 Years | 575 (8.3%) | 310 (4.1%) |
| 75 Years and over | 504 (12.6%) | 697 (12.9%) |
Disability Class: Ambulatory Difficulty
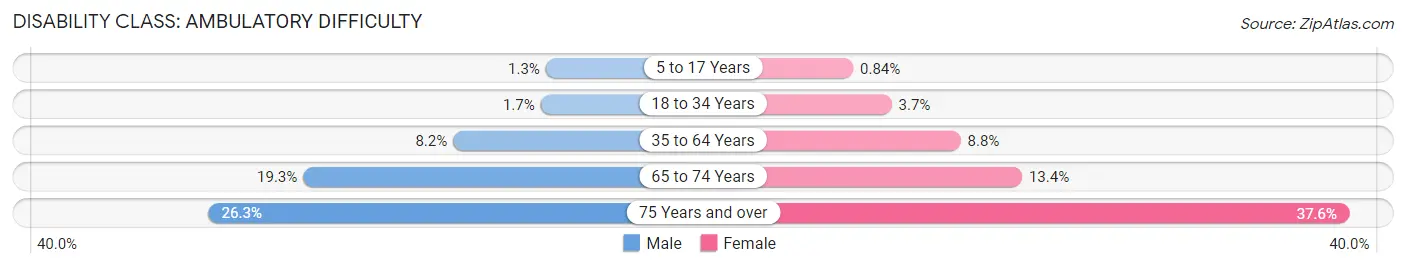
| Age Bracket | Male | Female |
| 5 to 17 Years | 124 (1.3%) | 77 (0.8%) |
| 18 to 34 Years | 277 (1.7%) | 644 (3.7%) |
| 35 to 64 Years | 2,017 (8.2%) | 2,160 (8.8%) |
| 65 to 74 Years | 1,337 (19.3%) | 1,002 (13.4%) |
| 75 Years and over | 1,056 (26.3%) | 2,038 (37.6%) |
Disability Class: Self-Care Difficulty
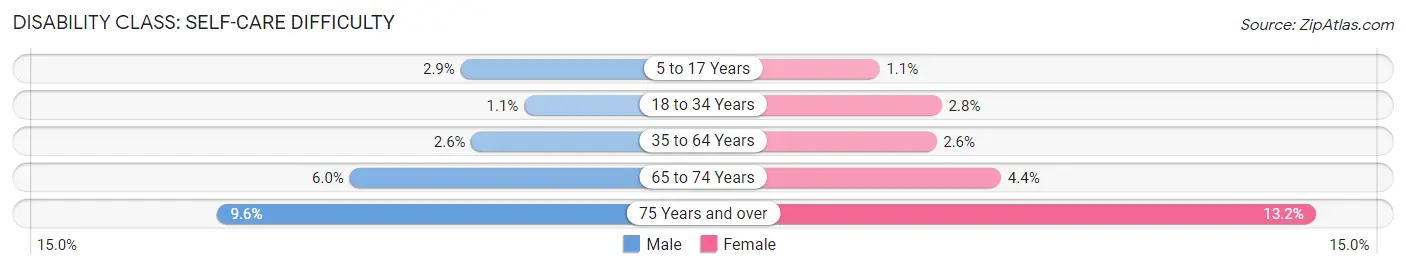
| Age Bracket | Male | Female |
| 5 to 17 Years | 271 (2.9%) | 96 (1.1%) |
| 18 to 34 Years | 179 (1.1%) | 483 (2.8%) |
| 35 to 64 Years | 631 (2.6%) | 645 (2.6%) |
| 65 to 74 Years | 412 (5.9%) | 332 (4.4%) |
| 75 Years and over | 386 (9.6%) | 714 (13.2%) |
Technology Access in Washington County
Computing Device Access in Washington County
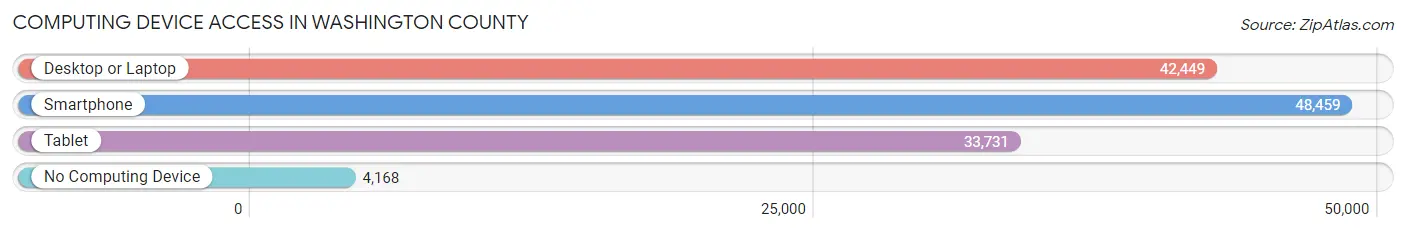
| Device Type | # Households | % Households |
| Desktop or Laptop | 42,449 | 76.4% |
| Smartphone | 48,459 | 87.2% |
| Tablet | 33,731 | 60.7% |
| No Computing Device | 4,168 | 7.5% |
| Total | 55,591 | 100.0% |
Internet Access in Washington County
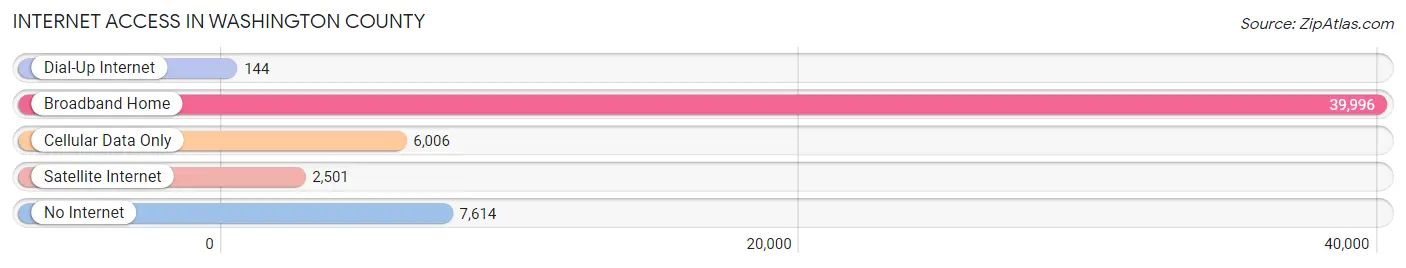
| Internet Type | # Households | % Households |
| Dial-Up Internet | 144 | 0.3% |
| Broadband Home | 39,996 | 72.0% |
| Cellular Data Only | 6,006 | 10.8% |
| Satellite Internet | 2,501 | 4.5% |
| No Internet | 7,614 | 13.7% |
| Total | 55,591 | 100.0% |
Washington County Summary
Introduction
Washington County, Tennessee is located in the northeastern corner of the state and is part of the Tri-Cities region. It is bordered by Sullivan County to the north, Greene County to the east, Carter County to the south, and Unicoi County to the west. The county seat is Jonesborough, which is also the oldest town in Tennessee. The county was established in 1777 and named after George Washington, the first president of the United States.
Geography
Washington County is located in the Appalachian Mountains and is part of the Great Appalachian Valley. The county is mostly mountainous, with elevations ranging from 1,000 to 4,000 feet. The highest point in the county is Holston Mountain, which has an elevation of 4,039 feet. The county is drained by the Nolichucky River, which flows through the county from north to south.
The county has a total area of 517 square miles, of which 514 square miles is land and 3 square miles is water. The county is home to several state parks, including Cherokee National Forest, Roan Mountain State Park, and Warriors' Path State Park.
Economy
Washington County has a diverse economy, with a mix of manufacturing, agriculture, and tourism. The county is home to several large employers, including Eastman Chemical Company, which is the largest employer in the county. Other major employers include Johnson City Medical Center, Mountain States Health Alliance, and the Johnson City Power Board.
Agriculture is an important part of the county's economy, with the main crops being corn, soybeans, hay, and tobacco. Livestock production is also important, with beef cattle, dairy cattle, and hogs being the main animals raised.
Tourism is also an important part of the county's economy, with the county being home to several popular attractions, including the Appalachian Trail, the Great Smoky Mountains National Park, and the Bays Mountain Park and Planetarium.
Demographics
As of the 2010 census, the population of Washington County was 123,979, making it the fourth most populous county in Tennessee. The population density was 241.3 people per square mile. The racial makeup of the county was 92.3% White, 4.2% African American, 0.5% Native American, 1.2% Asian, 0.1% Pacific Islander, 0.7% from other races, and 1.1% from two or more races. Hispanic or Latino of any race were 2.2% of the population.
The median income for a household in the county was $41,945, and the median income for a family was $50,945. The per capita income for the county was $21,845. About 11.2% of families and 15.2% of the population were below the poverty line, including 20.2% of those under age 18 and 11.2% of those age 65 or over.
Conclusion
Washington County, Tennessee is a diverse county with a mix of manufacturing, agriculture, and tourism. The county is home to several large employers, including Eastman Chemical Company, Johnson City Medical Center, and Mountain States Health Alliance. The county is also home to several popular attractions, including the Appalachian Trail, the Great Smoky Mountains National Park, and the Bays Mountain Park and Planetarium. The population of the county was 123,979 as of the 2010 census, with the median income for a household being $41,945 and the median income for a family being $50,945.
Common Questions
What is the Total Population of Washington County?
Total Population of Washington County is 133,282.
What is the Total Male Population of Washington County?
Total Male Population of Washington County is 65,800.
What is the Total Female Population of Washington County?
Total Female Population of Washington County is 67,482.
What is the Ratio of Males per 100 Females in Washington County?
There are 97.51 Males per 100 Females in Washington County.
What is the Ratio of Females per 100 Males in Washington County?
There are 102.56 Females per 100 Males in Washington County.
What is the Median Population Age in Washington County?
Median Population Age in Washington County is 40.1 Years.
What is the Average Family Size in Washington County
Average Family Size in Washington County is 2.9 People.
What is the Average Household Size in Washington County
Average Household Size in Washington County is 2.3 People.
What is Per Capita Income in Washington County?
Per Capita income in Washington County is $35,562.
What is the Median Family Income in Washington County?
Median Family Income in Washington County is $78,783.
What is the Median Household income in Washington County?
Median Household Income in Washington County is $58,507.
What is Income or Wage Gap in Washington County?
Income or Wage Gap in Washington County is 29.1%.
Women in Washington County earn 70.9 cents for every dollar earned by a man.
What is Family Income Deficit in Washington County?
Family Income Deficit in Washington County is $10,796.
Families that are below poverty line in Washington County earn $10,796 less on average than the poverty threshold level.
What is Inequality or Gini Index in Washington County?
Inequality or Gini Index in Washington County is 0.49.
How Large is the Labor Force in Washington County?
There are 66,701 People in the Labor Forcein in Washington County.
What is the Percentage of People in the Labor Force in Washington County?
59.7% of People are in the Labor Force in Washington County.
What is the Unemployment Rate in Washington County?
Unemployment Rate in Washington County is 5.0%.