Van Buren County, TN
Van Buren County Map
Van Buren County Overview
6,182
TOTAL POPULATION
3,113
MALE POPULATION
3,069
FEMALE POPULATION
101.43
MALES / 100 FEMALES
98.59
FEMALES / 100 MALES
47.4
MEDIAN AGE
3.0
AVG FAMILY SIZE
2.5
AVG HOUSEHOLD SIZE
$24,099
PER CAPITA INCOME
$61,563
AVG FAMILY INCOME
$44,730
AVG HOUSEHOLD INCOME
16.7%
WAGE / INCOME GAP [ % ]
83.3¢/ $1
WAGE / INCOME GAP [ $ ]
0.43
INEQUALITY / GINI INDEX
2,552
LABOR FORCE [ PEOPLE ]
49.5%
PERCENT IN LABOR FORCE
4.1%
UNEMPLOYMENT RATE
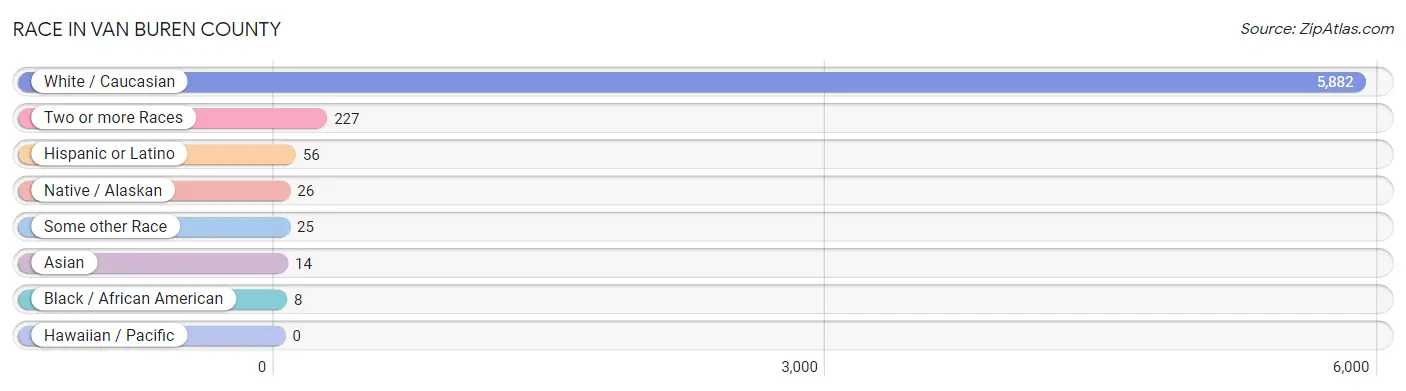
Race in Van Buren County
The most populous races in Van Buren County are White / Caucasian (5,882 | 95.2%), Two or more Races (227 | 3.7%), and Hispanic or Latino (56 | 0.9%).
| Race | # Population | % Population |
| Asian | 14 | 0.2% |
| Black / African American | 8 | 0.1% |
| Hawaiian / Pacific | 0 | 0.0% |
| Hispanic or Latino | 56 | 0.9% |
| Native / Alaskan | 26 | 0.4% |
| White / Caucasian | 5,882 | 95.2% |
| Two or more Races | 227 | 3.7% |
| Some other Race | 25 | 0.4% |
| Total | 6,182 | 100.0% |
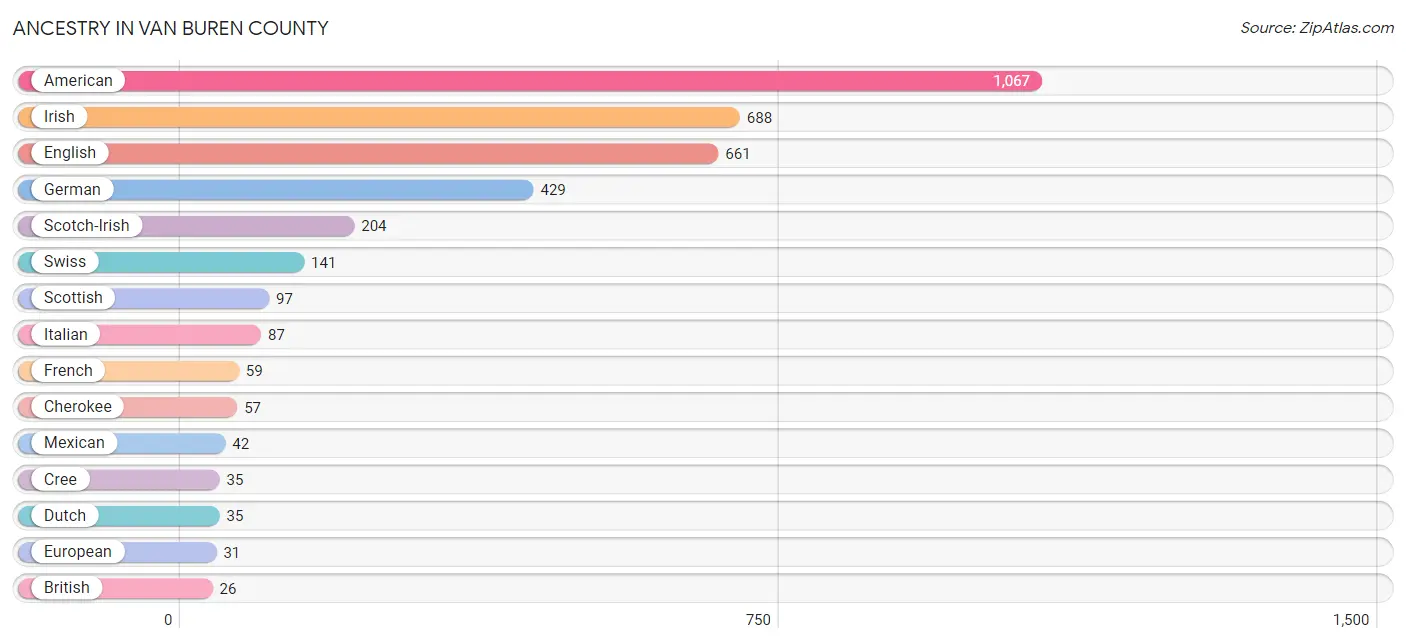
Ancestry in Van Buren County
The most populous ancestries reported in Van Buren County are American (1,067 | 17.3%), Irish (688 | 11.1%), English (661 | 10.7%), German (429 | 6.9%), and Scotch-Irish (204 | 3.3%), together accounting for 49.3% of all Van Buren County residents.
| Ancestry | # Population | % Population |
| American | 1,067 | 17.3% |
| Belgian | 8 | 0.1% |
| Blackfeet | 6 | 0.1% |
| British | 26 | 0.4% |
| Cajun | 7 | 0.1% |
| Cherokee | 57 | 0.9% |
| Cree | 35 | 0.6% |
| Creek | 12 | 0.2% |
| Dutch | 35 | 0.6% |
| English | 661 | 10.7% |
| European | 31 | 0.5% |
| French | 59 | 0.9% |
| French Canadian | 7 | 0.1% |
| German | 429 | 6.9% |
| Indian (Asian) | 14 | 0.2% |
| Irish | 688 | 11.1% |
| Italian | 87 | 1.4% |
| Lithuanian | 8 | 0.1% |
| Mexican | 42 | 0.7% |
| Norwegian | 26 | 0.4% |
| Polish | 13 | 0.2% |
| Puerto Rican | 14 | 0.2% |
| Scandinavian | 15 | 0.2% |
| Scotch-Irish | 204 | 3.3% |
| Scottish | 97 | 1.6% |
| Swedish | 7 | 0.1% |
| Swiss | 141 | 2.3% |
| Ukrainian | 10 | 0.2% |
| Welsh | 2 | 0.0% | View All 29 Rows |
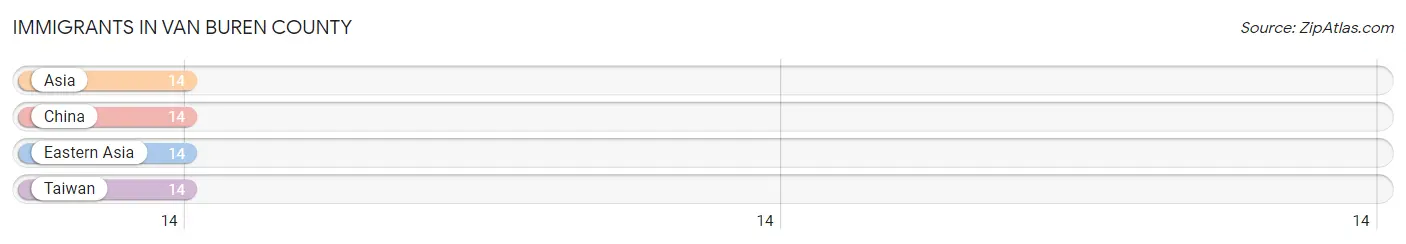
Immigrants in Van Buren County
The most numerous immigrant groups reported in Van Buren County came from Asia (14 | 0.2%), China (14 | 0.2%), Eastern Asia (14 | 0.2%), and Taiwan (14 | 0.2%), together accounting for 0.9% of all Van Buren County residents.
| Immigration Origin | # Population | % Population |
| Asia | 14 | 0.2% |
| China | 14 | 0.2% |
| Eastern Asia | 14 | 0.2% |
| Taiwan | 14 | 0.2% | View All 4 Rows |
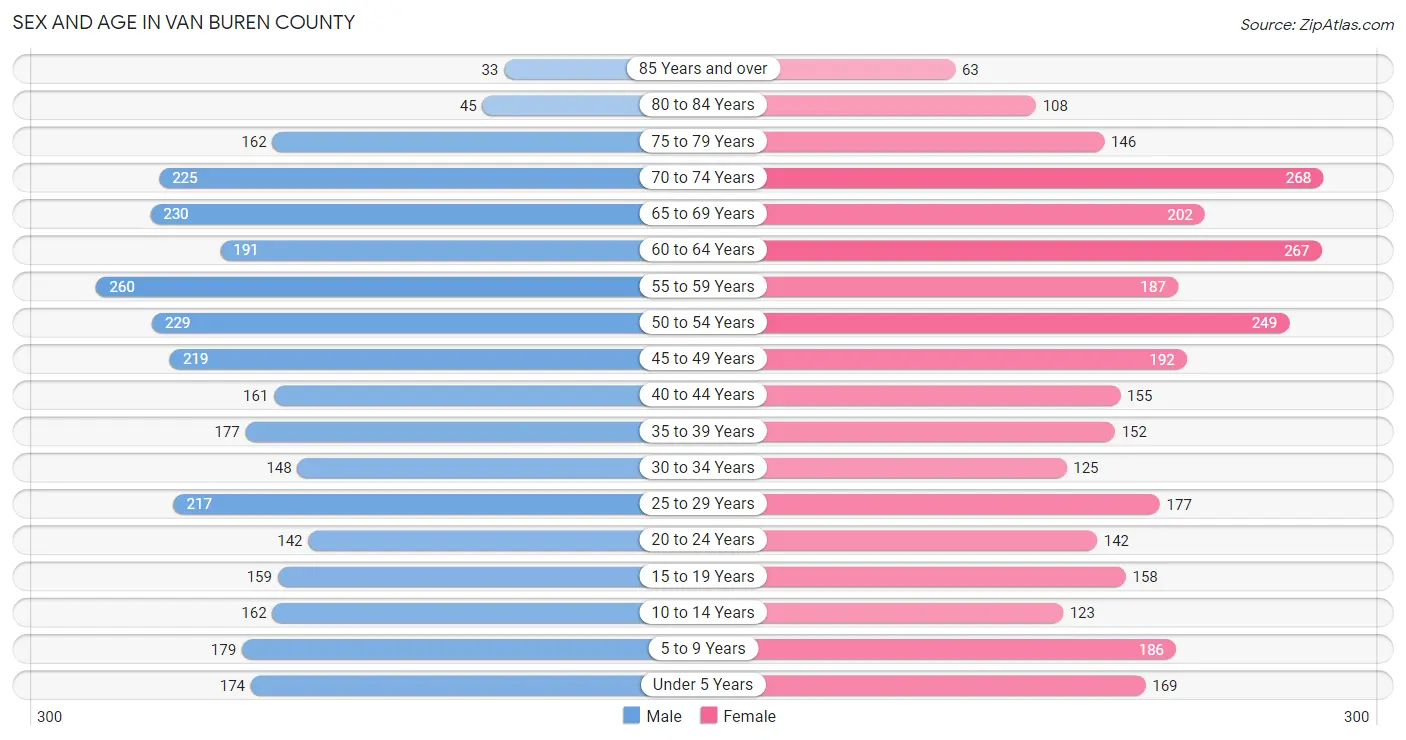
Sex and Age in Van Buren County
Sex and Age in Van Buren County
The most populous age groups in Van Buren County are 55 to 59 Years (260 | 8.4%) for men and 70 to 74 Years (268 | 8.7%) for women.
| Age Bracket | Male | Female |
| Under 5 Years | 174 (5.6%) | 169 (5.5%) |
| 5 to 9 Years | 179 (5.8%) | 186 (6.1%) |
| 10 to 14 Years | 162 (5.2%) | 123 (4.0%) |
| 15 to 19 Years | 159 (5.1%) | 158 (5.1%) |
| 20 to 24 Years | 142 (4.6%) | 142 (4.6%) |
| 25 to 29 Years | 217 (7.0%) | 177 (5.8%) |
| 30 to 34 Years | 148 (4.8%) | 125 (4.1%) |
| 35 to 39 Years | 177 (5.7%) | 152 (5.0%) |
| 40 to 44 Years | 161 (5.2%) | 155 (5.1%) |
| 45 to 49 Years | 219 (7.0%) | 192 (6.3%) |
| 50 to 54 Years | 229 (7.4%) | 249 (8.1%) |
| 55 to 59 Years | 260 (8.4%) | 187 (6.1%) |
| 60 to 64 Years | 191 (6.1%) | 267 (8.7%) |
| 65 to 69 Years | 230 (7.4%) | 202 (6.6%) |
| 70 to 74 Years | 225 (7.2%) | 268 (8.7%) |
| 75 to 79 Years | 162 (5.2%) | 146 (4.8%) |
| 80 to 84 Years | 45 (1.5%) | 108 (3.5%) |
| 85 Years and over | 33 (1.1%) | 63 (2.1%) |
| Total | 3,113 (100.0%) | 3,069 (100.0%) |
Families and Households in Van Buren County
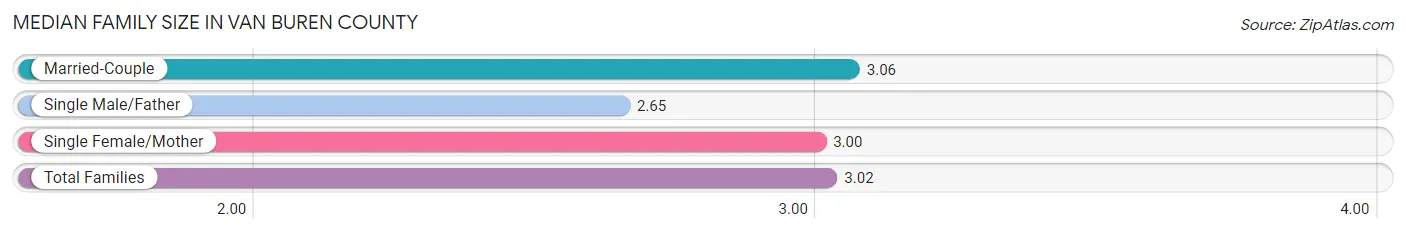
Median Family Size in Van Buren County
The median family size in Van Buren County is 3.02 persons per family, with married-couple families (1,258 | 79.3%) accounting for the largest median family size of 3.06 persons per family. On the other hand, single male/father families (124 | 7.8%) represent the smallest median family size with 2.65 persons per family.
| Family Type | # Families | Family Size |
| Married-Couple | 1,258 (79.3%) | 3.06 |
| Single Male/Father | 124 (7.8%) | 2.65 |
| Single Female/Mother | 205 (12.9%) | 3.00 |
| Total Families | 1,587 (100.0%) | 3.02 |
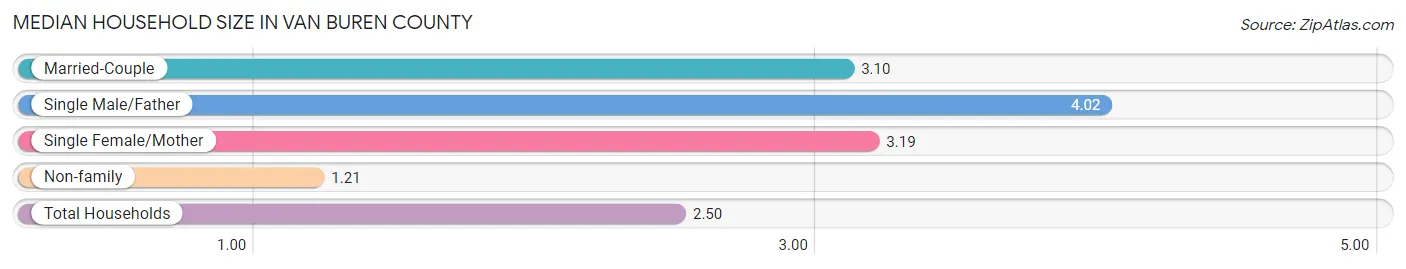
Median Household Size in Van Buren County
The median household size in Van Buren County is 2.50 persons per household, with single male/father households (124 | 5.1%) accounting for the largest median household size of 4.02 persons per household. non-family households (847 | 34.8%) represent the smallest median household size with 1.21 persons per household.
| Household Type | # Households | Household Size |
| Married-Couple | 1,258 (51.7%) | 3.10 |
| Single Male/Father | 124 (5.1%) | 4.02 |
| Single Female/Mother | 205 (8.4%) | 3.19 |
| Non-family | 847 (34.8%) | 1.21 |
| Total Households | 2,434 (100.0%) | 2.50 |
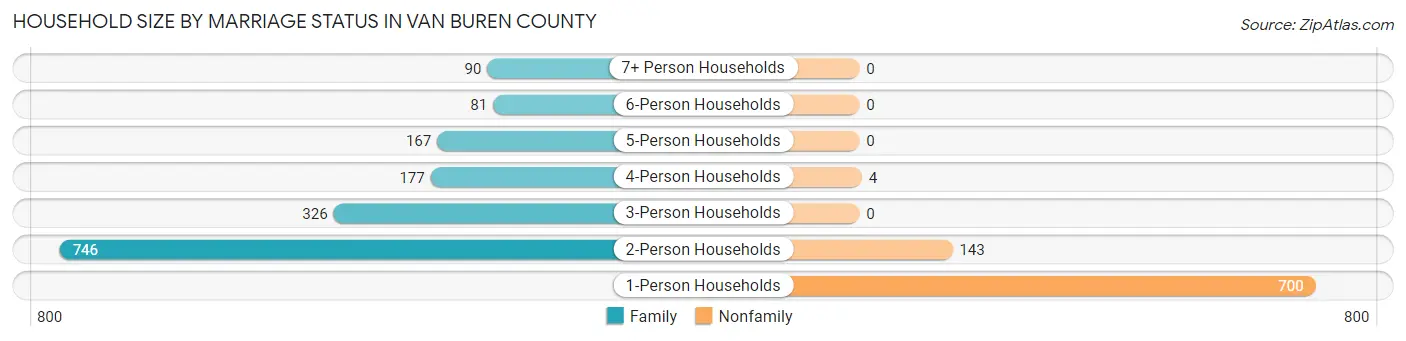
Household Size by Marriage Status in Van Buren County
Out of a total of 2,434 households in Van Buren County, 1,587 (65.2%) are family households, while 847 (34.8%) are nonfamily households. The most numerous type of family households are 2-person households, comprising 746, and the most common type of nonfamily households are 1-person households, comprising 700.
| Household Size | Family Households | Nonfamily Households |
| 1-Person Households | - | 700 (28.8%) |
| 2-Person Households | 746 (30.6%) | 143 (5.9%) |
| 3-Person Households | 326 (13.4%) | 0 (0.0%) |
| 4-Person Households | 177 (7.3%) | 4 (0.2%) |
| 5-Person Households | 167 (6.9%) | 0 (0.0%) |
| 6-Person Households | 81 (3.3%) | 0 (0.0%) |
| 7+ Person Households | 90 (3.7%) | 0 (0.0%) |
| Total | 1,587 (65.2%) | 847 (34.8%) |
Female Fertility in Van Buren County
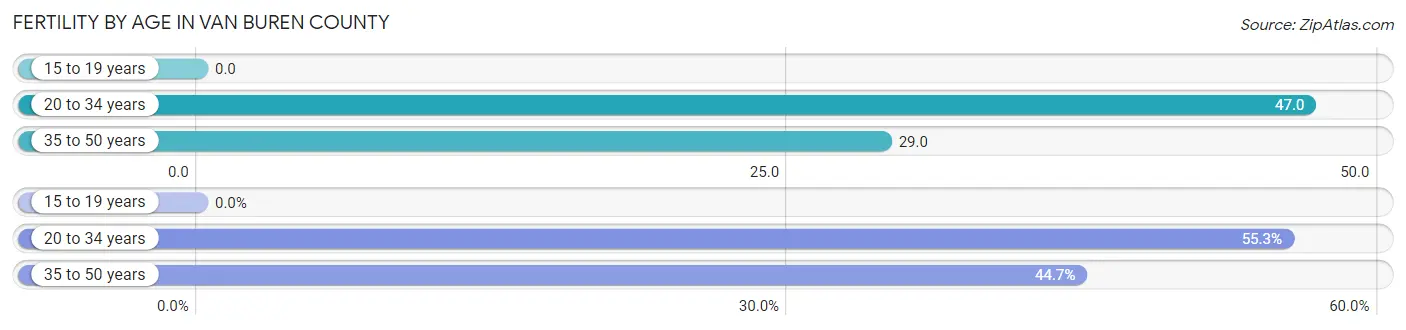
Fertility by Age in Van Buren County
Average fertility rate in Van Buren County is 32.0 births per 1,000 women. Women in the age bracket of 20 to 34 years have the highest fertility rate with 47.0 births per 1,000 women. Women in the age bracket of 20 to 34 years acount for 55.3% of all women with births.
| Age Bracket | Women with Births | Births / 1,000 Women |
| 15 to 19 years | 0 (0.0%) | 0.0 |
| 20 to 34 years | 21 (55.3%) | 47.0 |
| 35 to 50 years | 17 (44.7%) | 29.0 |
| Total | 38 (100.0%) | 32.0 |
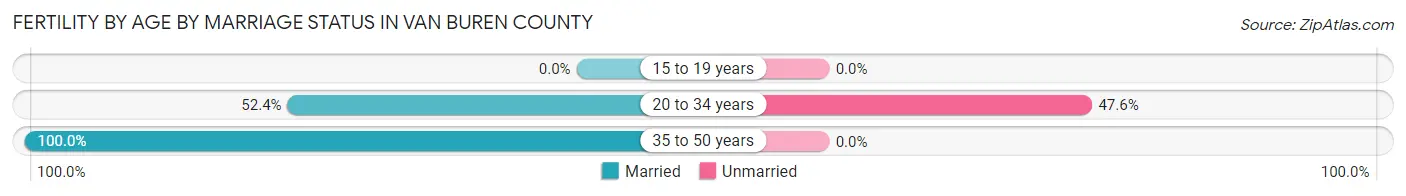
Fertility by Age by Marriage Status in Van Buren County
73.7% of women with births (38) in Van Buren County are married. The highest percentage of unmarried women with births falls into 20 to 34 years age bracket with 47.6% of them unmarried at the time of birth, while the lowest percentage of unmarried women with births belong to 35 to 50 years age bracket with 0.0% of them unmarried.
| Age Bracket | Married | Unmarried |
| 15 to 19 years | 0 (0.0%) | 0 (0.0%) |
| 20 to 34 years | 11 (52.4%) | 10 (47.6%) |
| 35 to 50 years | 17 (100.0%) | 0 (0.0%) |
| Total | 28 (73.7%) | 10 (26.3%) |
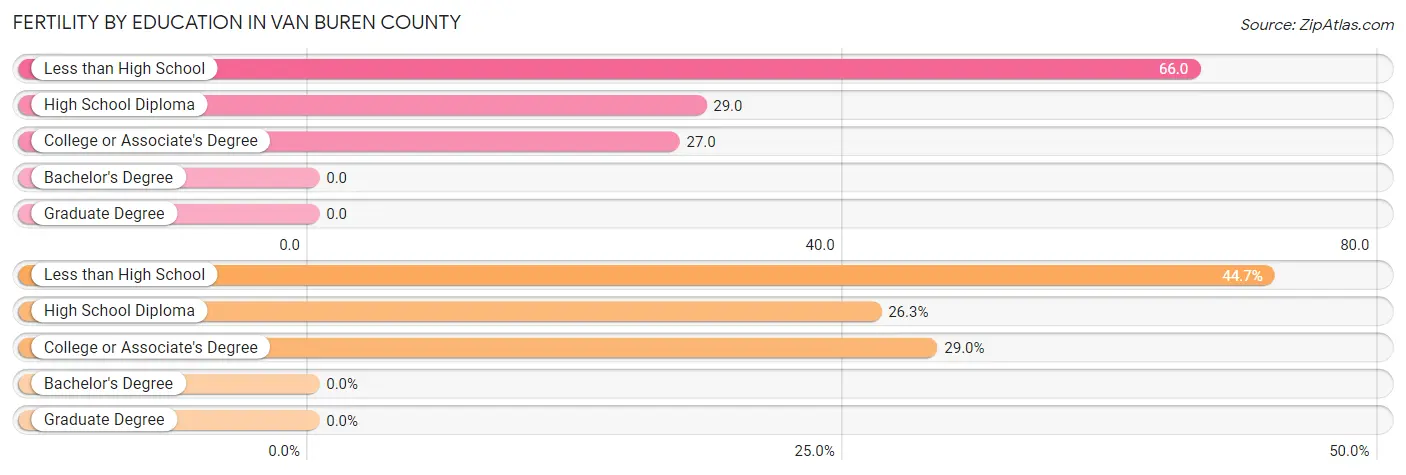
Fertility by Education in Van Buren County
| Educational Attainment | Women with Births | Births / 1,000 Women |
| Less than High School | 17 (44.7%) | 66.0 |
| High School Diploma | 10 (26.3%) | 29.0 |
| College or Associate's Degree | 11 (28.9%) | 27.0 |
| Bachelor's Degree | 0 (0.0%) | 0.0 |
| Graduate Degree | 0 (0.0%) | 0.0 |
| Total | 38 (100.0%) | 32.0 |
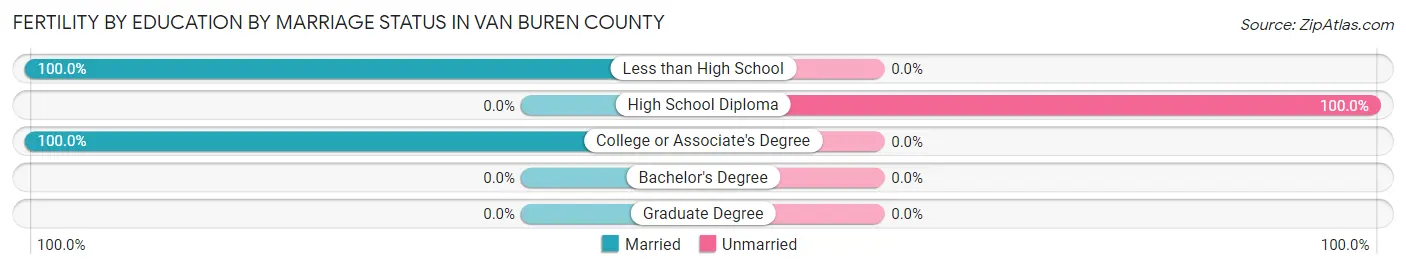
Fertility by Education by Marriage Status in Van Buren County
26.3% of women with births in Van Buren County are unmarried. Women with the educational attainment of less than high school are most likely to be married with 100.0% of them married at childbirth, while women with the educational attainment of high school diploma are least likely to be married with 100.0% of them unmarried at childbirth.
| Educational Attainment | Married | Unmarried |
| Less than High School | 17 (100.0%) | 0 (0.0%) |
| High School Diploma | 0 (0.0%) | 10 (100.0%) |
| College or Associate's Degree | 11 (100.0%) | 0 (0.0%) |
| Bachelor's Degree | 0 (0.0%) | 0 (0.0%) |
| Graduate Degree | 0 (0.0%) | 0 (0.0%) |
| Total | 28 (73.7%) | 10 (26.3%) |
Income in Van Buren County
Income Overview in Van Buren County
Per Capita Income in Van Buren County is $24,099, while median incomes of families and households are $61,563 and $44,730 respectively.
| Characteristic | Number | Measure |
| Per Capita Income | 6,182 | $24,099 |
| Median Family Income | 1,587 | $61,563 |
| Mean Family Income | 1,587 | $73,095 |
| Median Household Income | 2,434 | $44,730 |
| Mean Household Income | 2,434 | $60,231 |
| Income Deficit | 1,587 | $0 |
| Wage / Income Gap (%) | 6,182 | 16.72% |
| Wage / Income Gap ($) | 6,182 | 83.28¢ per $1 |
| Gini / Inequality Index | 6,182 | 0.43 |
Earnings by Sex in Van Buren County
Average Earnings in Van Buren County are $34,216, $36,922 for men and $30,750 for women, a difference of 16.7%.
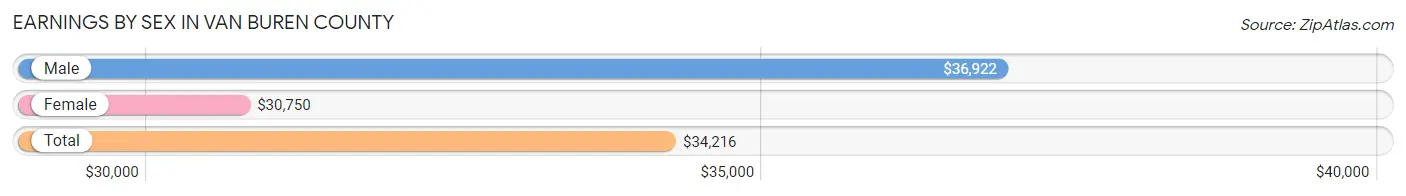
| Sex | Number | Average Earnings |
| Male | 1,451 (53.8%) | $36,922 |
| Female | 1,248 (46.2%) | $30,750 |
| Total | 2,699 (100.0%) | $34,216 |
Earnings by Sex by Income Bracket in Van Buren County
The most common earnings brackets in Van Buren County are $35,000 to $39,999 for men (195 | 13.4%) and $30,000 to $34,999 for women (151 | 12.1%).
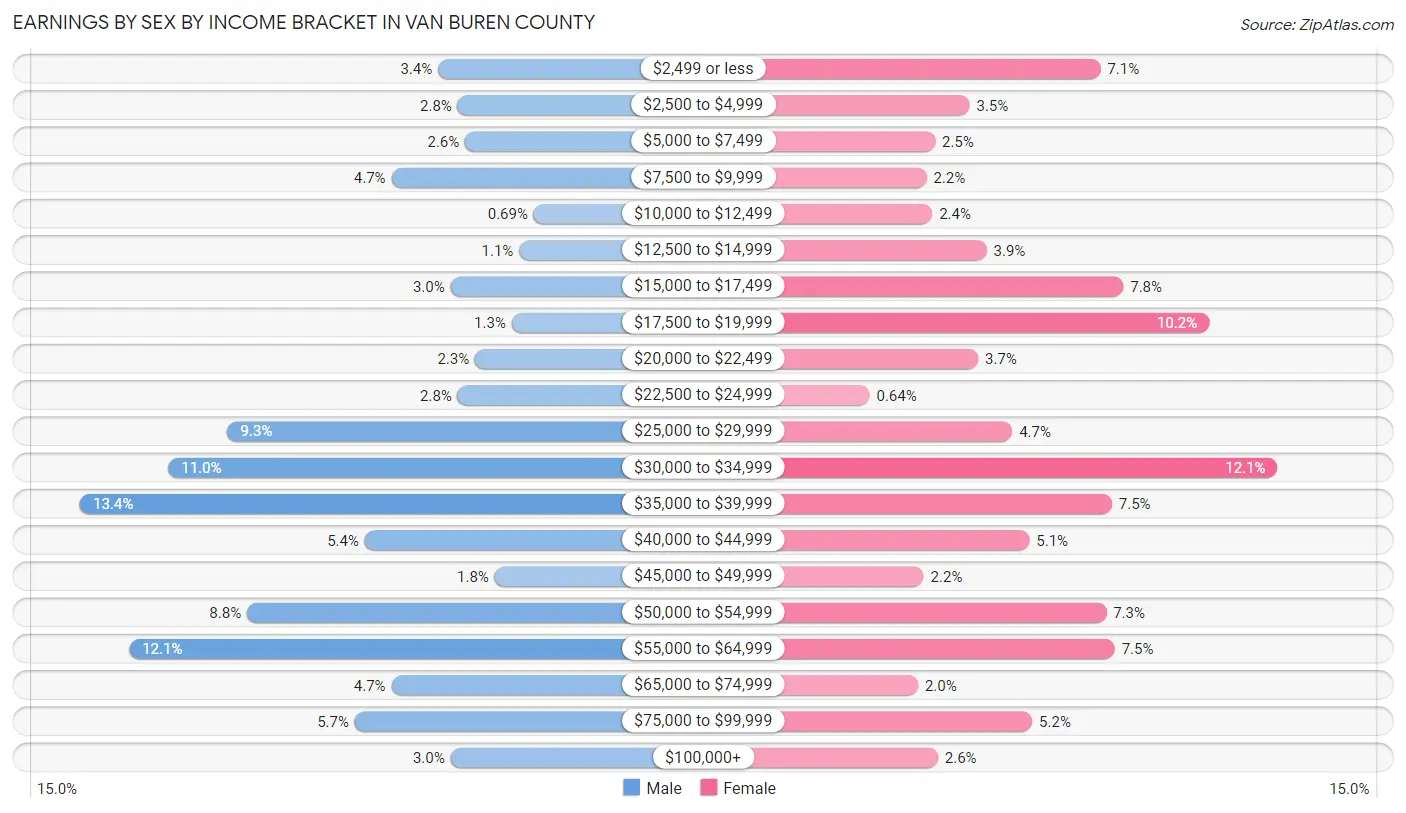
| Income | Male | Female |
| $2,499 or less | 49 (3.4%) | 89 (7.1%) |
| $2,500 to $4,999 | 41 (2.8%) | 43 (3.5%) |
| $5,000 to $7,499 | 38 (2.6%) | 31 (2.5%) |
| $7,500 to $9,999 | 68 (4.7%) | 28 (2.2%) |
| $10,000 to $12,499 | 10 (0.7%) | 30 (2.4%) |
| $12,500 to $14,999 | 16 (1.1%) | 49 (3.9%) |
| $15,000 to $17,499 | 44 (3.0%) | 97 (7.8%) |
| $17,500 to $19,999 | 19 (1.3%) | 127 (10.2%) |
| $20,000 to $22,499 | 34 (2.3%) | 46 (3.7%) |
| $22,500 to $24,999 | 41 (2.8%) | 8 (0.6%) |
| $25,000 to $29,999 | 135 (9.3%) | 58 (4.6%) |
| $30,000 to $34,999 | 159 (11.0%) | 151 (12.1%) |
| $35,000 to $39,999 | 195 (13.4%) | 93 (7.4%) |
| $40,000 to $44,999 | 79 (5.4%) | 64 (5.1%) |
| $45,000 to $49,999 | 26 (1.8%) | 27 (2.2%) |
| $50,000 to $54,999 | 127 (8.7%) | 91 (7.3%) |
| $55,000 to $64,999 | 175 (12.1%) | 94 (7.5%) |
| $65,000 to $74,999 | 68 (4.7%) | 25 (2.0%) |
| $75,000 to $99,999 | 83 (5.7%) | 65 (5.2%) |
| $100,000+ | 44 (3.0%) | 32 (2.6%) |
| Total | 1,451 (100.0%) | 1,248 (100.0%) |
Earnings by Sex by Educational Attainment in Van Buren County
Average earnings in Van Buren County are $38,848 for men and $33,063 for women, a difference of 14.9%. Men with an educational attainment of college or associate's degree enjoy the highest average annual earnings of $62,973, while those with less than high school education earn the least with $36,375. Women with an educational attainment of graduate degree earn the most with the average annual earnings of $57,847, while those with less than high school education have the smallest earnings of $18,586.
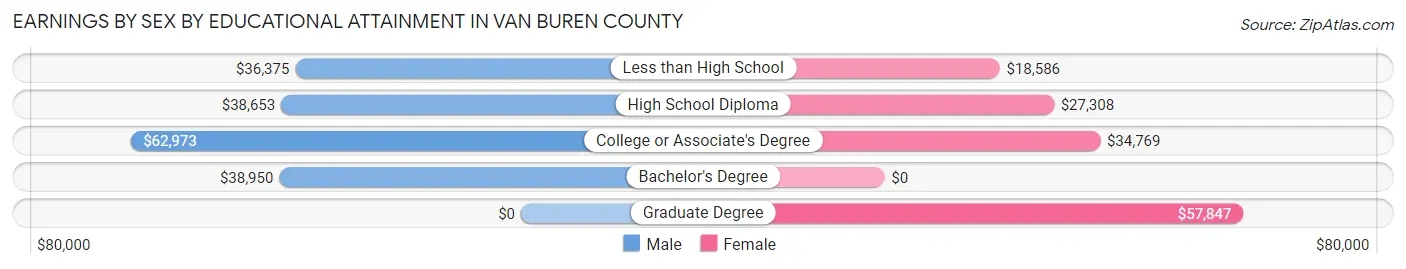
| Educational Attainment | Male Income | Female Income |
| Less than High School | $36,375 | $18,586 |
| High School Diploma | $38,653 | $27,308 |
| College or Associate's Degree | $62,973 | $34,769 |
| Bachelor's Degree | $38,950 | $0 |
| Graduate Degree | - | - |
| Total | $38,848 | $33,063 |
Family Income in Van Buren County
Family Income Brackets in Van Buren County
According to the Van Buren County family income data, there are 346 families falling into the $100,000 to $149,999 income range, which is the most common income bracket and makes up 21.8% of all families. Conversely, the $200,000+ income bracket is the least frequent group with only 22 families (1.4%) belonging to this category.
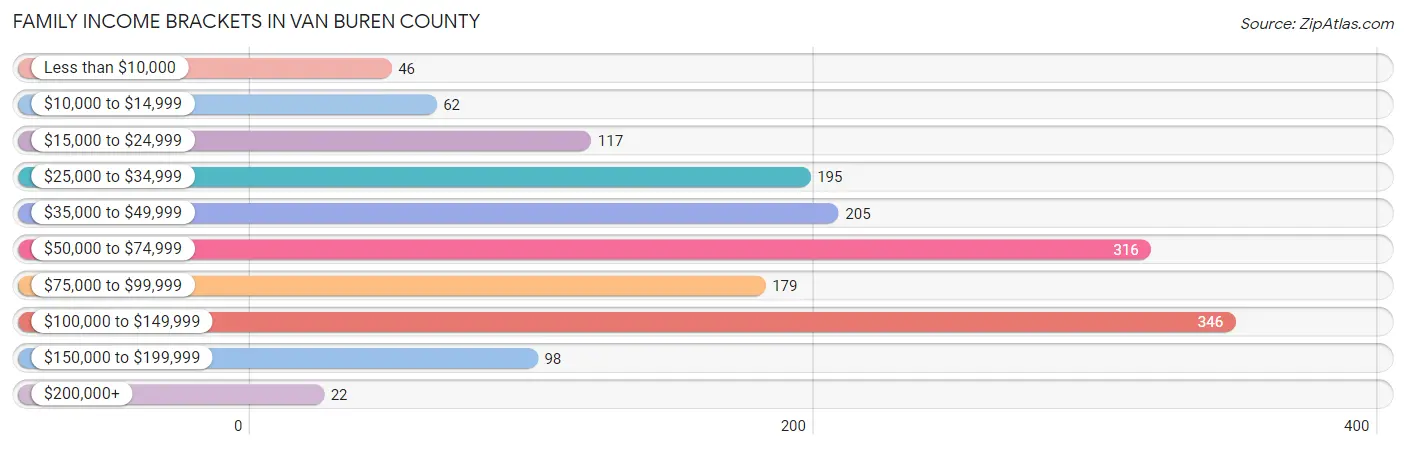
| Income Bracket | # Families | % Families |
| Less than $10,000 | 46 | 2.9% |
| $10,000 to $14,999 | 62 | 3.9% |
| $15,000 to $24,999 | 117 | 7.4% |
| $25,000 to $34,999 | 195 | 12.3% |
| $35,000 to $49,999 | 205 | 12.9% |
| $50,000 to $74,999 | 316 | 19.9% |
| $75,000 to $99,999 | 179 | 11.3% |
| $100,000 to $149,999 | 346 | 21.8% |
| $150,000 to $199,999 | 98 | 6.2% |
| $200,000+ | 22 | 1.4% |
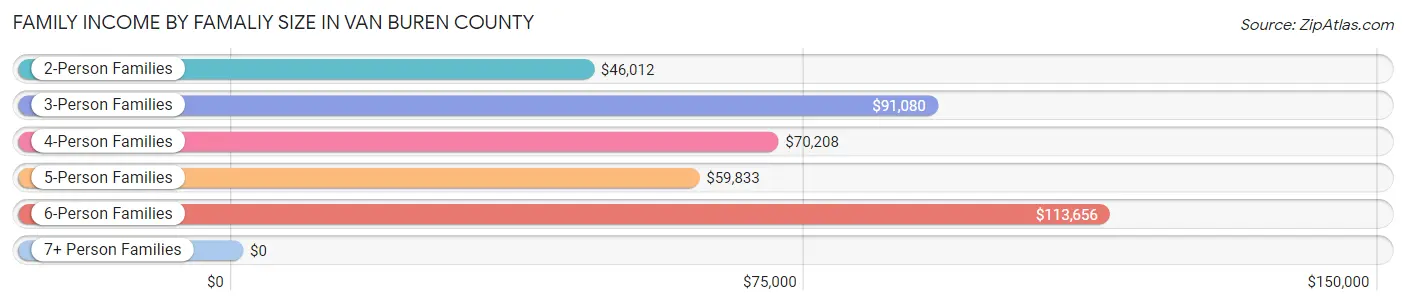
Family Income by Famaliy Size in Van Buren County
6-person families (77 | 4.9%) account for the highest median family income in Van Buren County with $113,656 per family, while 3-person families (391 | 24.6%) have the highest median income of $30,360 per family member.
| Income Bracket | # Families | Median Income |
| 2-Person Families | 759 (47.8%) | $46,012 |
| 3-Person Families | 391 (24.6%) | $91,080 |
| 4-Person Families | 174 (11.0%) | $70,208 |
| 5-Person Families | 148 (9.3%) | $59,833 |
| 6-Person Families | 77 (4.9%) | $113,656 |
| 7+ Person Families | 38 (2.4%) | $0 |
| Total | 1,587 (100.0%) | $61,563 |
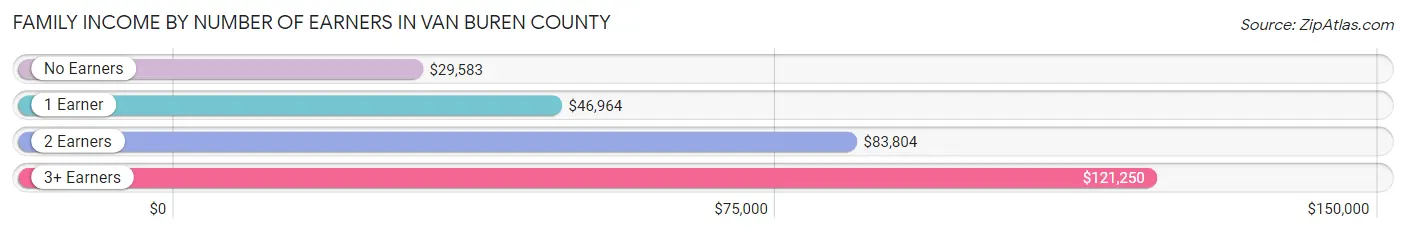
Family Income by Number of Earners in Van Buren County
The median family income in Van Buren County is $61,563, with families comprising 3+ earners (216) having the highest median family income of $121,250, while families with no earners (434) have the lowest median family income of $29,583, accounting for 13.6% and 27.4% of families, respectively.
| Number of Earners | # Families | Median Income |
| No Earners | 434 (27.4%) | $29,583 |
| 1 Earner | 451 (28.4%) | $46,964 |
| 2 Earners | 486 (30.6%) | $83,804 |
| 3+ Earners | 216 (13.6%) | $121,250 |
| Total | 1,587 (100.0%) | $61,563 |
Household Income in Van Buren County
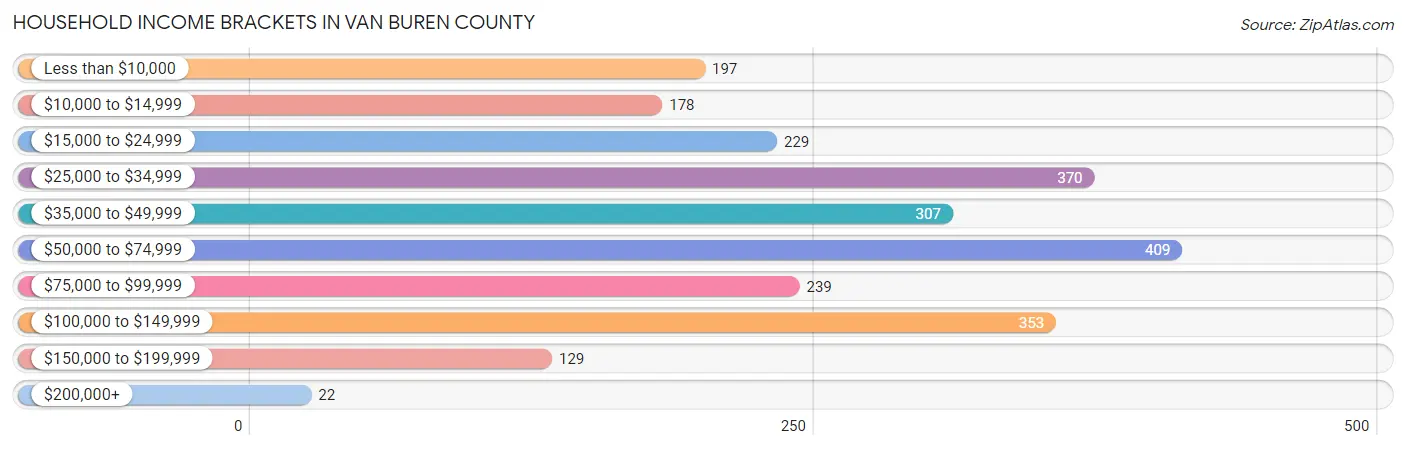
Household Income Brackets in Van Buren County
With 409 households falling in the category, the $50,000 to $74,999 income range is the most frequent in Van Buren County, accounting for 16.8% of all households. In contrast, only 22 households (0.9%) fall into the $200,000+ income bracket, making it the least populous group.
| Income Bracket | # Households | % Households |
| Less than $10,000 | 197 | 8.1% |
| $10,000 to $14,999 | 178 | 7.3% |
| $15,000 to $24,999 | 229 | 9.4% |
| $25,000 to $34,999 | 370 | 15.2% |
| $35,000 to $49,999 | 307 | 12.6% |
| $50,000 to $74,999 | 409 | 16.8% |
| $75,000 to $99,999 | 239 | 9.8% |
| $100,000 to $149,999 | 353 | 14.5% |
| $150,000 to $199,999 | 129 | 5.3% |
| $200,000+ | 22 | 0.9% |
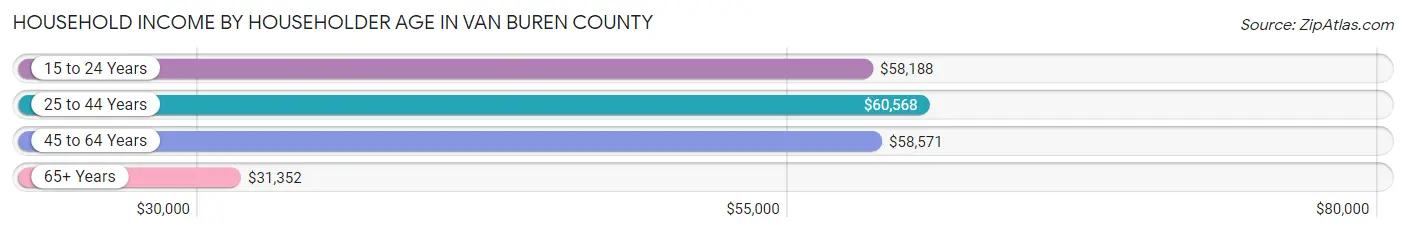
Household Income by Householder Age in Van Buren County
The median household income in Van Buren County is $44,730, with the highest median household income of $60,568 found in the 25 to 44 years age bracket for the primary householder. A total of 478 households (19.6%) fall into this category. Meanwhile, the 65+ years age bracket for the primary householder has the lowest median household income of $31,352, with 911 households (37.4%) in this group.
| Income Bracket | # Households | Median Income |
| 15 to 24 Years | 33 (1.4%) | $58,188 |
| 25 to 44 Years | 478 (19.6%) | $60,568 |
| 45 to 64 Years | 1,012 (41.6%) | $58,571 |
| 65+ Years | 911 (37.4%) | $31,352 |
| Total | 2,434 (100.0%) | $44,730 |
Poverty in Van Buren County
Income Below Poverty by Sex and Age in Van Buren County
With 15.6% poverty level for males and 18.4% for females among the residents of Van Buren County, 5 year old males and under 5 year old females are the most vulnerable to poverty, with 7 males (35.0%) and 55 females (32.5%) in their respective age groups living below the poverty level.
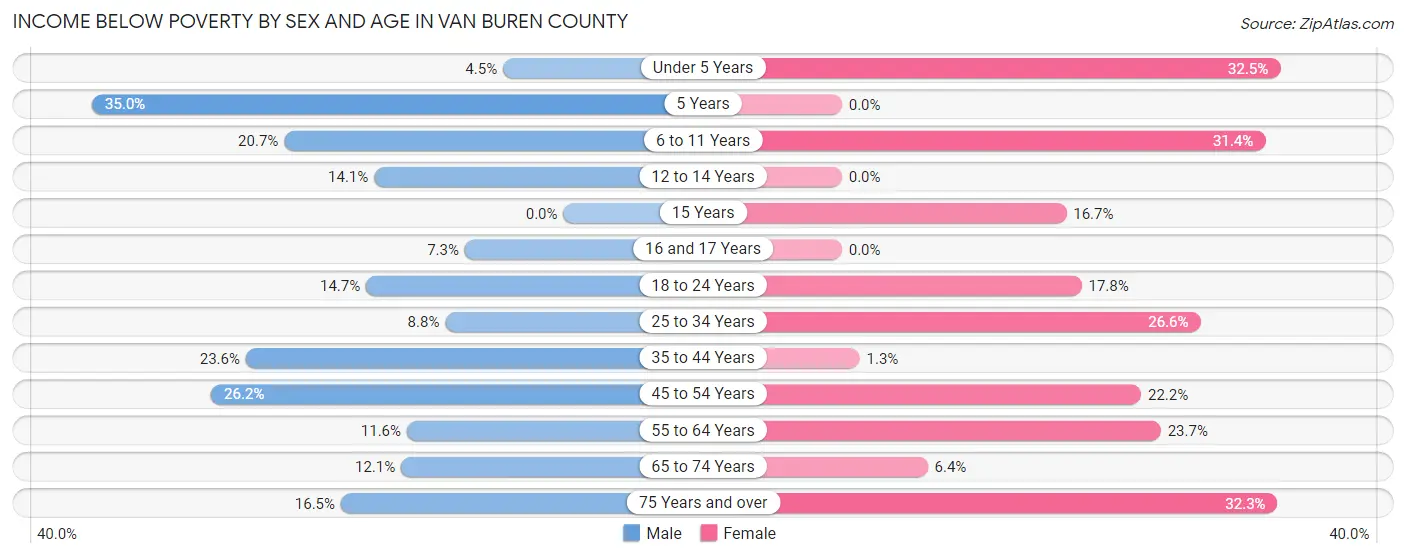
| Age Bracket | Male | Female |
| Under 5 Years | 6 (4.5%) | 55 (32.5%) |
| 5 Years | 7 (35.0%) | 0 (0.0%) |
| 6 to 11 Years | 34 (20.7%) | 44 (31.4%) |
| 12 to 14 Years | 17 (14.1%) | 0 (0.0%) |
| 15 Years | 0 (0.0%) | 2 (16.7%) |
| 16 and 17 Years | 6 (7.3%) | 0 (0.0%) |
| 18 to 24 Years | 29 (14.6%) | 34 (17.8%) |
| 25 to 34 Years | 32 (8.8%) | 78 (26.6%) |
| 35 to 44 Years | 79 (23.6%) | 4 (1.3%) |
| 45 to 54 Years | 114 (26.2%) | 98 (22.2%) |
| 55 to 64 Years | 51 (11.6%) | 103 (23.7%) |
| 65 to 74 Years | 54 (12.0%) | 29 (6.4%) |
| 75 Years and over | 38 (16.5%) | 98 (32.3%) |
| Total | 467 (15.6%) | 545 (18.4%) |
Income Above Poverty by Sex and Age in Van Buren County
According to the poverty statistics in Van Buren County, males aged 15 years and females aged 5 years are the age groups that are most secure financially, with 100.0% of males and 100.0% of females in these age groups living above the poverty line.

| Age Bracket | Male | Female |
| Under 5 Years | 128 (95.5%) | 114 (67.5%) |
| 5 Years | 13 (65.0%) | 55 (100.0%) |
| 6 to 11 Years | 130 (79.3%) | 96 (68.6%) |
| 12 to 14 Years | 104 (86.0%) | 65 (100.0%) |
| 15 Years | 21 (100.0%) | 10 (83.3%) |
| 16 and 17 Years | 76 (92.7%) | 97 (100.0%) |
| 18 to 24 Years | 169 (85.4%) | 157 (82.2%) |
| 25 to 34 Years | 333 (91.2%) | 215 (73.4%) |
| 35 to 44 Years | 256 (76.4%) | 299 (98.7%) |
| 45 to 54 Years | 322 (73.9%) | 343 (77.8%) |
| 55 to 64 Years | 388 (88.4%) | 332 (76.3%) |
| 65 to 74 Years | 394 (87.9%) | 426 (93.6%) |
| 75 Years and over | 192 (83.5%) | 205 (67.7%) |
| Total | 2,526 (84.4%) | 2,414 (81.6%) |
Income Below Poverty Among Married-Couple Families in Van Buren County
The poverty statistics for married-couple families in Van Buren County show that 9.6% or 121 of the total 1,258 families live below the poverty line. Families with 3 or 4 children have the highest poverty rate of 31.9%, comprising of 30 families. On the other hand, families with 1 or 2 children have the lowest poverty rate of 7.5%, which includes 27 families.
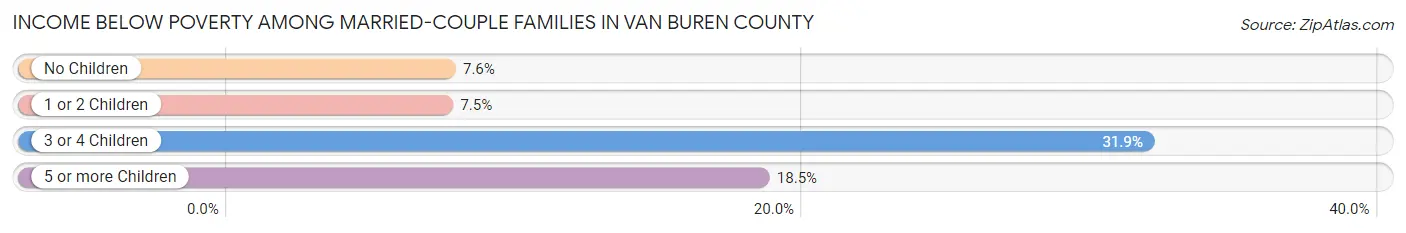
| Children | Above Poverty | Below Poverty |
| No Children | 718 (92.4%) | 59 (7.6%) |
| 1 or 2 Children | 333 (92.5%) | 27 (7.5%) |
| 3 or 4 Children | 64 (68.1%) | 30 (31.9%) |
| 5 or more Children | 22 (81.5%) | 5 (18.5%) |
| Total | 1,137 (90.4%) | 121 (9.6%) |
Income Below Poverty Among Single-Parent Households in Van Buren County
According to the poverty data in Van Buren County, 16.1% or 20 single-father households and 22.4% or 46 single-mother households are living below the poverty line. Among single-father households, those with no children have the highest poverty rate, with 12 households (16.9%) experiencing poverty. Likewise, among single-mother households, those with 3 or 4 children have the highest poverty rate, with 35 households (85.4%) falling below the poverty line.
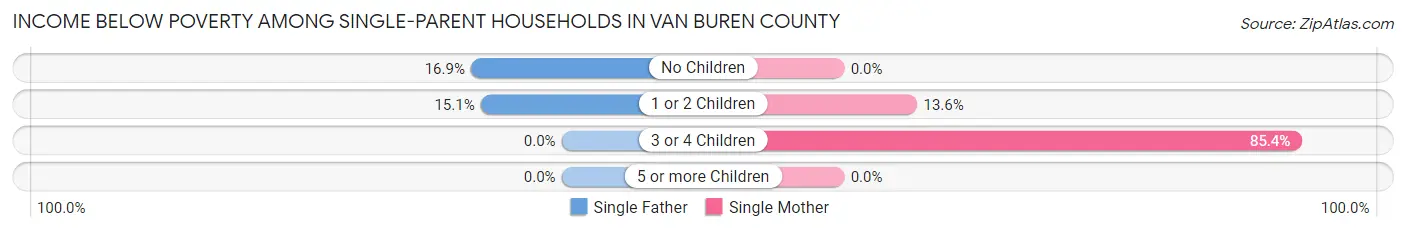
| Children | Single Father | Single Mother |
| No Children | 12 (16.9%) | 0 (0.0%) |
| 1 or 2 Children | 8 (15.1%) | 11 (13.6%) |
| 3 or 4 Children | 0 (0.0%) | 35 (85.4%) |
| 5 or more Children | 0 (0.0%) | 0 (0.0%) |
| Total | 20 (16.1%) | 46 (22.4%) |
Income Below Poverty Among Married-Couple vs Single-Parent Households in Van Buren County
The poverty data for Van Buren County shows that 121 of the married-couple family households (9.6%) and 66 of the single-parent households (20.1%) are living below the poverty level. Within the married-couple family households, those with 3 or 4 children have the highest poverty rate, with 30 households (31.9%) falling below the poverty line. Among the single-parent households, those with 3 or 4 children have the highest poverty rate, with 35 household (85.4%) living below poverty.
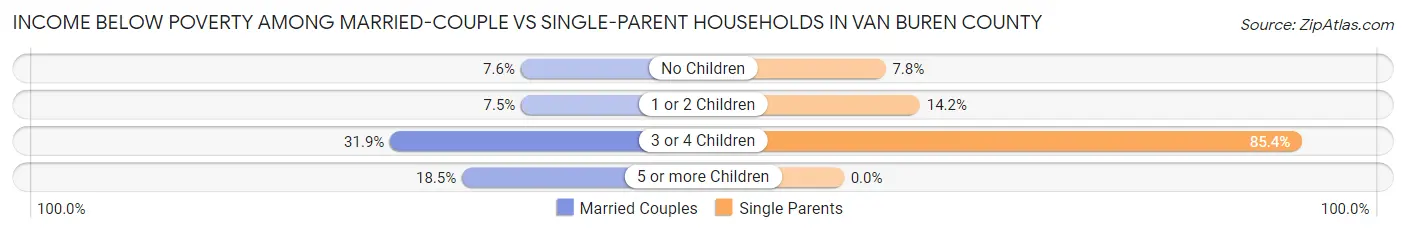
| Children | Married-Couple Families | Single-Parent Households |
| No Children | 59 (7.6%) | 12 (7.8%) |
| 1 or 2 Children | 27 (7.5%) | 19 (14.2%) |
| 3 or 4 Children | 30 (31.9%) | 35 (85.4%) |
| 5 or more Children | 5 (18.5%) | 0 (0.0%) |
| Total | 121 (9.6%) | 66 (20.1%) |
Employment Characteristics in Van Buren County
Employment by Class of Employer in Van Buren County
Among the 2,421 employed individuals in Van Buren County, private company employees (1,419 | 58.6%), local government employees (327 | 13.5%), and self-employed (not incorporated) (299 | 12.3%) make up the most common classes of employment.
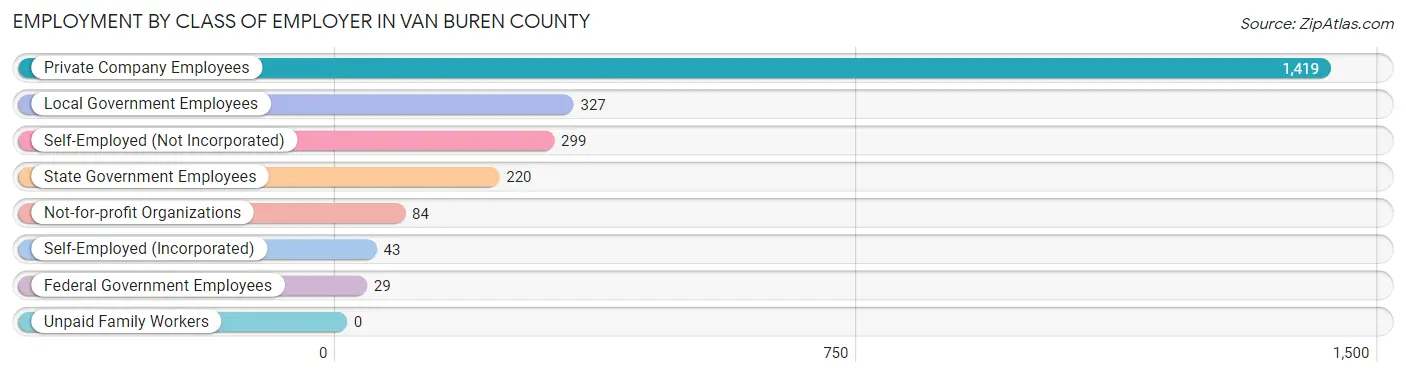
| Employer Class | # Employees | % Employees |
| Private Company Employees | 1,419 | 58.6% |
| Self-Employed (Incorporated) | 43 | 1.8% |
| Self-Employed (Not Incorporated) | 299 | 12.3% |
| Not-for-profit Organizations | 84 | 3.5% |
| Local Government Employees | 327 | 13.5% |
| State Government Employees | 220 | 9.1% |
| Federal Government Employees | 29 | 1.2% |
| Unpaid Family Workers | 0 | 0.0% |
| Total | 2,421 | 100.0% |
Employment Status by Age in Van Buren County
According to the labor force statistics for Van Buren County, out of the total population over 16 years of age (5,156), 49.5% or 2,552 individuals are in the labor force, with 4.1% or 105 of them unemployed. The age group with the highest labor force participation rate is 20 to 24 years, with 88.4% or 251 individuals in the labor force. Within the labor force, the 16 to 19 years age range has the highest percentage of unemployed individuals, with 44.7% or 51 of them being unemployed.
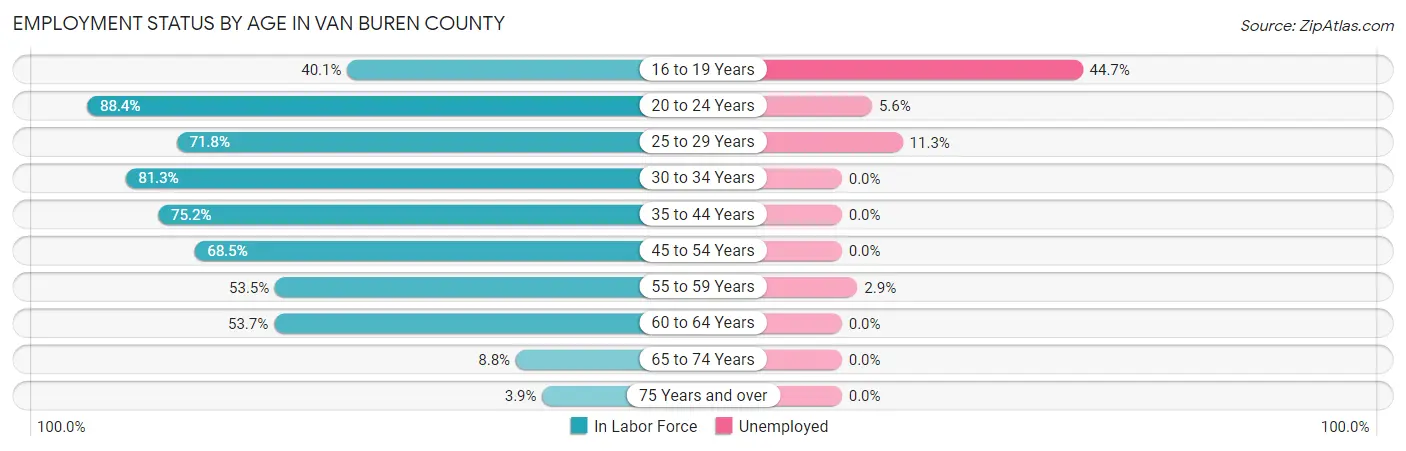
| Age Bracket | In Labor Force | Unemployed |
| 16 to 19 Years | 114 (40.1%) | 51 (44.7%) |
| 20 to 24 Years | 251 (88.4%) | 14 (5.6%) |
| 25 to 29 Years | 283 (71.8%) | 32 (11.3%) |
| 30 to 34 Years | 222 (81.3%) | 0 (0.0%) |
| 35 to 44 Years | 485 (75.2%) | 0 (0.0%) |
| 45 to 54 Years | 609 (68.5%) | 0 (0.0%) |
| 55 to 59 Years | 239 (53.5%) | 7 (2.9%) |
| 60 to 64 Years | 246 (53.7%) | 0 (0.0%) |
| 65 to 74 Years | 81 (8.8%) | 0 (0.0%) |
| 75 Years and over | 22 (3.9%) | 0 (0.0%) |
| Total | 2,552 (49.5%) | 105 (4.1%) |
Employment Status by Educational Attainment in Van Buren County
According to labor force statistics for Van Buren County, 67.1% of individuals (2,084) out of the total population between 25 and 64 years of age (3,106) are in the labor force, with 1.9% or 40 of them being unemployed. The group with the highest labor force participation rate are those with the educational attainment of bachelor's degree or higher, with 89.9% or 266 individuals in the labor force. Within the labor force, individuals with high school diploma education have the highest percentage of unemployment, with 3.8% or 39 of them being unemployed.
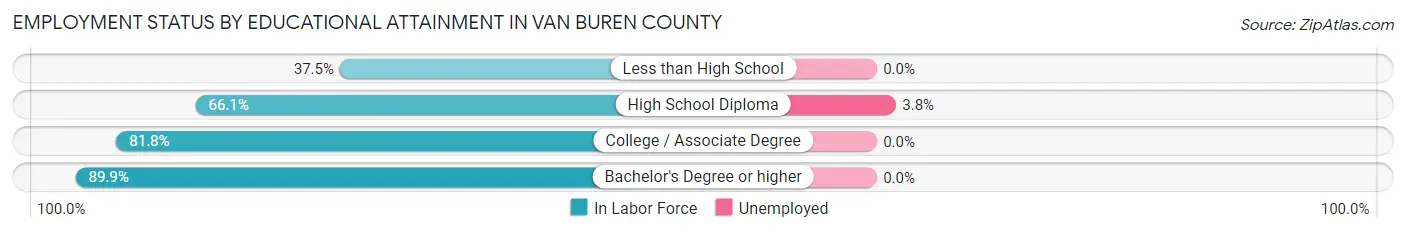
| Educational Attainment | In Labor Force | Unemployed |
| Less than High School | 202 (37.5%) | 0 (0.0%) |
| High School Diploma | 1,019 (66.1%) | 59 (3.8%) |
| College / Associate Degree | 597 (81.8%) | 0 (0.0%) |
| Bachelor's Degree or higher | 266 (89.9%) | 0 (0.0%) |
| Total | 2,084 (67.1%) | 59 (1.9%) |
Employment Occupations by Sex in Van Buren County
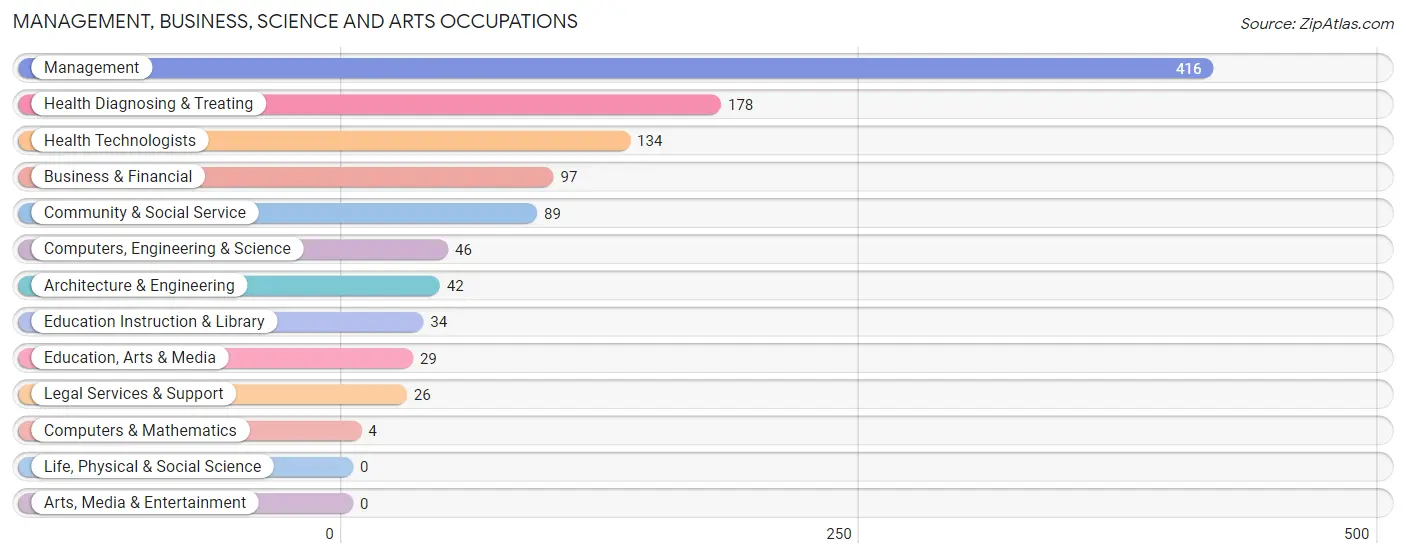
Management, Business, Science and Arts Occupations
The most common Management, Business, Science and Arts occupations in Van Buren County are Management (416 | 17.0%), Health Diagnosing & Treating (178 | 7.3%), Health Technologists (134 | 5.5%), Business & Financial (97 | 4.0%), and Community & Social Service (89 | 3.6%).
Management, Business, Science and Arts Occupations by Sex
Within the Management, Business, Science and Arts occupations in Van Buren County, the most male-oriented occupations are Computers & Mathematics (100.0%), Computers, Engineering & Science (93.5%), and Architecture & Engineering (92.9%), while the most female-oriented occupations are Education, Arts & Media (100.0%), Education Instruction & Library (100.0%), and Community & Social Service (97.8%).
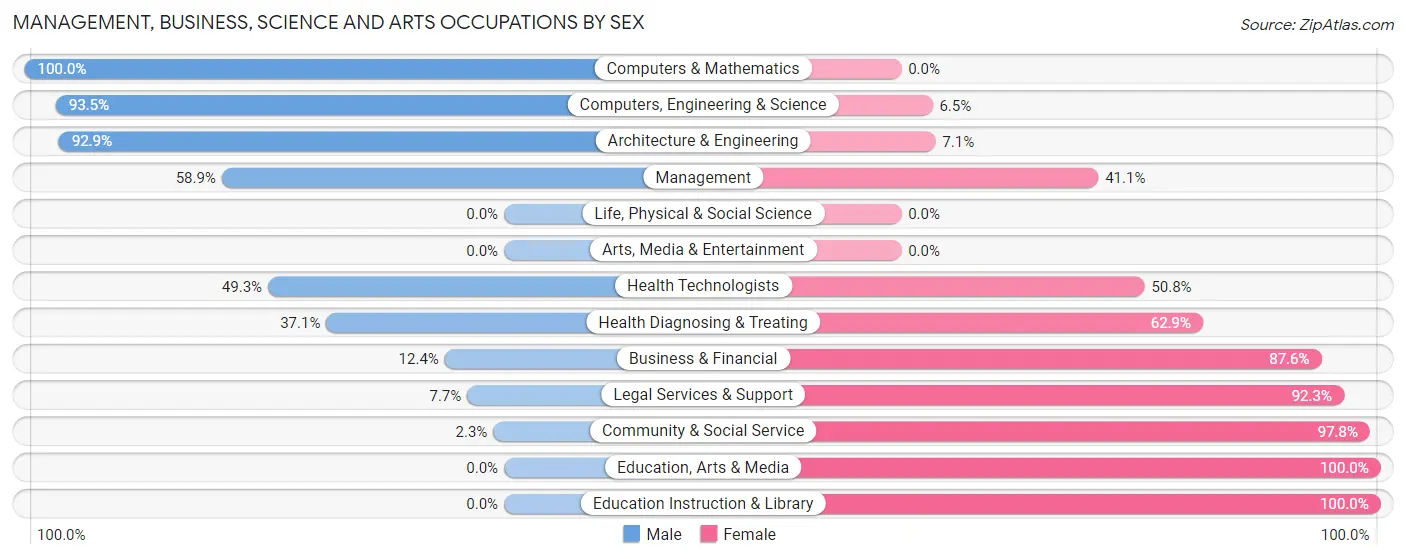
| Occupation | Male | Female |
| Management | 245 (58.9%) | 171 (41.1%) |
| Business & Financial | 12 (12.4%) | 85 (87.6%) |
| Computers, Engineering & Science | 43 (93.5%) | 3 (6.5%) |
| Computers & Mathematics | 4 (100.0%) | 0 (0.0%) |
| Architecture & Engineering | 39 (92.9%) | 3 (7.1%) |
| Life, Physical & Social Science | 0 (0.0%) | 0 (0.0%) |
| Community & Social Service | 2 (2.2%) | 87 (97.8%) |
| Education, Arts & Media | 0 (0.0%) | 29 (100.0%) |
| Legal Services & Support | 2 (7.7%) | 24 (92.3%) |
| Education Instruction & Library | 0 (0.0%) | 34 (100.0%) |
| Arts, Media & Entertainment | 0 (0.0%) | 0 (0.0%) |
| Health Diagnosing & Treating | 66 (37.1%) | 112 (62.9%) |
| Health Technologists | 66 (49.2%) | 68 (50.7%) |
| Total (Category) | 368 (44.6%) | 458 (55.4%) |
| Total (Overall) | 1,282 (52.4%) | 1,166 (47.6%) |
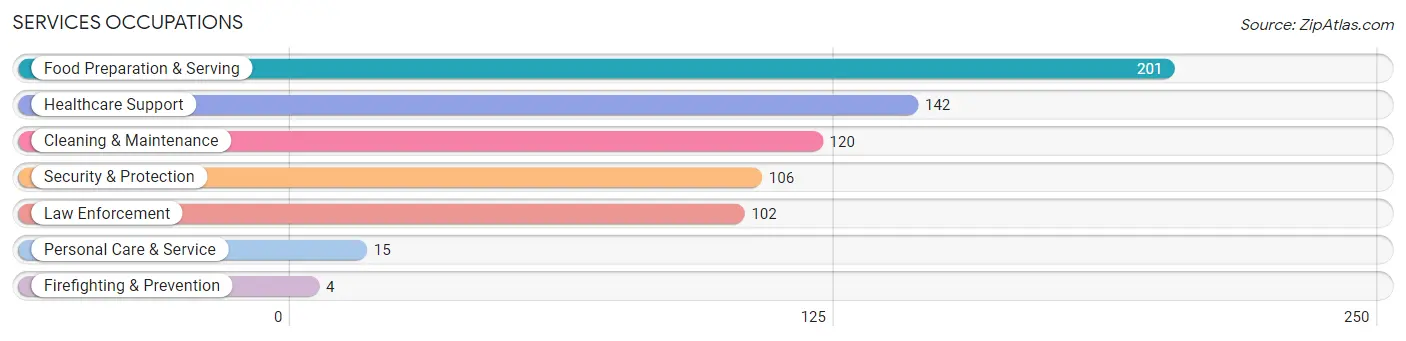
Services Occupations
The most common Services occupations in Van Buren County are Food Preparation & Serving (201 | 8.2%), Healthcare Support (142 | 5.8%), Cleaning & Maintenance (120 | 4.9%), Security & Protection (106 | 4.3%), and Law Enforcement (102 | 4.2%).
Services Occupations by Sex
Within the Services occupations in Van Buren County, the most male-oriented occupations are Firefighting & Prevention (100.0%), Security & Protection (76.4%), and Law Enforcement (75.5%), while the most female-oriented occupations are Personal Care & Service (100.0%), Healthcare Support (71.8%), and Food Preparation & Serving (64.7%).
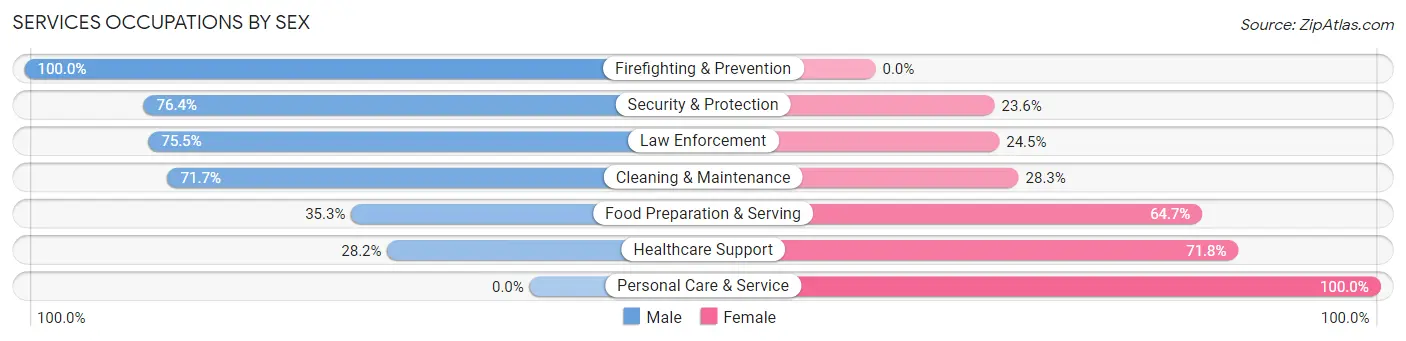
| Occupation | Male | Female |
| Healthcare Support | 40 (28.2%) | 102 (71.8%) |
| Security & Protection | 81 (76.4%) | 25 (23.6%) |
| Firefighting & Prevention | 4 (100.0%) | 0 (0.0%) |
| Law Enforcement | 77 (75.5%) | 25 (24.5%) |
| Food Preparation & Serving | 71 (35.3%) | 130 (64.7%) |
| Cleaning & Maintenance | 86 (71.7%) | 34 (28.3%) |
| Personal Care & Service | 0 (0.0%) | 15 (100.0%) |
| Total (Category) | 278 (47.6%) | 306 (52.4%) |
| Total (Overall) | 1,282 (52.4%) | 1,166 (47.6%) |
Sales and Office Occupations
The most common Sales and Office occupations in Van Buren County are Office & Administration (115 | 4.7%), and Sales & Related (111 | 4.5%).
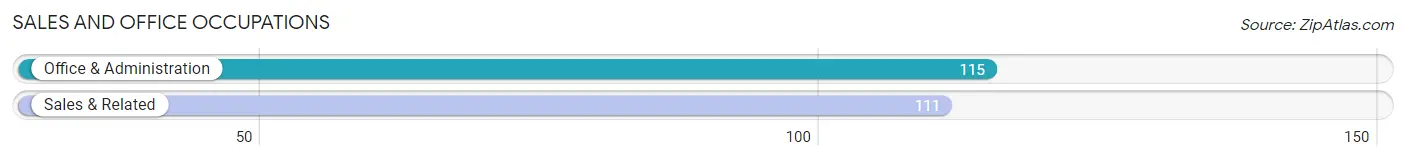
Sales and Office Occupations by Sex
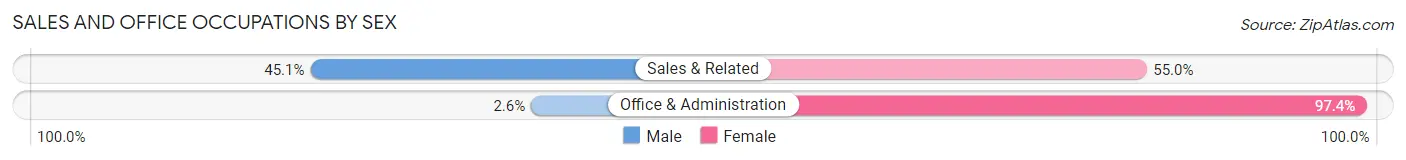
| Occupation | Male | Female |
| Sales & Related | 50 (45.1%) | 61 (54.9%) |
| Office & Administration | 3 (2.6%) | 112 (97.4%) |
| Total (Category) | 53 (23.4%) | 173 (76.5%) |
| Total (Overall) | 1,282 (52.4%) | 1,166 (47.6%) |
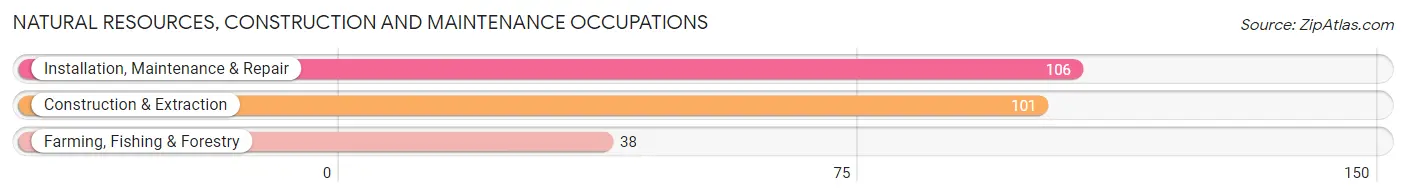
Natural Resources, Construction and Maintenance Occupations
The most common Natural Resources, Construction and Maintenance occupations in Van Buren County are Installation, Maintenance & Repair (106 | 4.3%), Construction & Extraction (101 | 4.1%), and Farming, Fishing & Forestry (38 | 1.5%).
Natural Resources, Construction and Maintenance Occupations by Sex
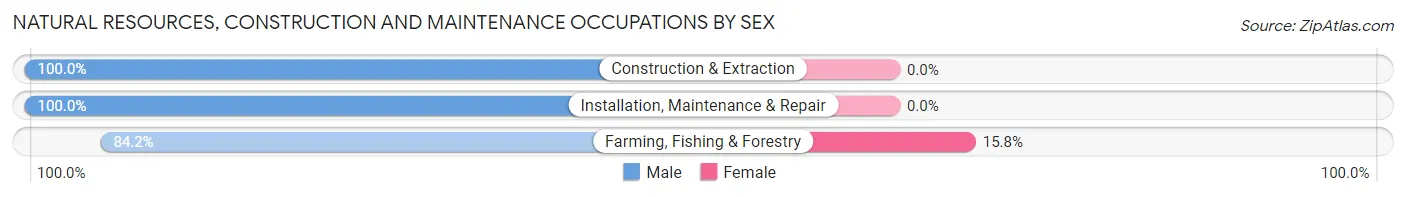
| Occupation | Male | Female |
| Farming, Fishing & Forestry | 32 (84.2%) | 6 (15.8%) |
| Construction & Extraction | 101 (100.0%) | 0 (0.0%) |
| Installation, Maintenance & Repair | 106 (100.0%) | 0 (0.0%) |
| Total (Category) | 239 (97.6%) | 6 (2.5%) |
| Total (Overall) | 1,282 (52.4%) | 1,166 (47.6%) |
Production, Transportation and Moving Occupations
The most common Production, Transportation and Moving occupations in Van Buren County are Production (391 | 16.0%), Material Moving (102 | 4.2%), and Transportation (74 | 3.0%).
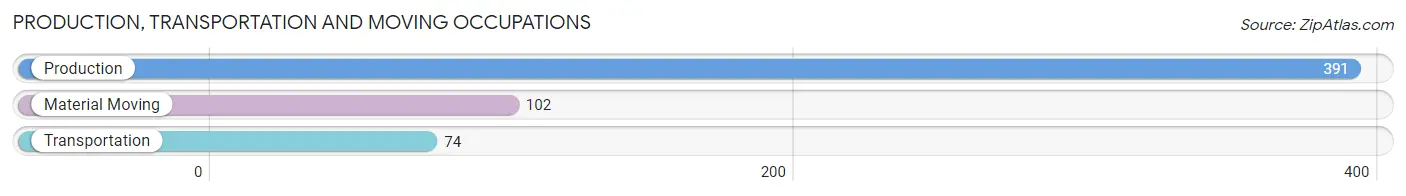
Production, Transportation and Moving Occupations by Sex
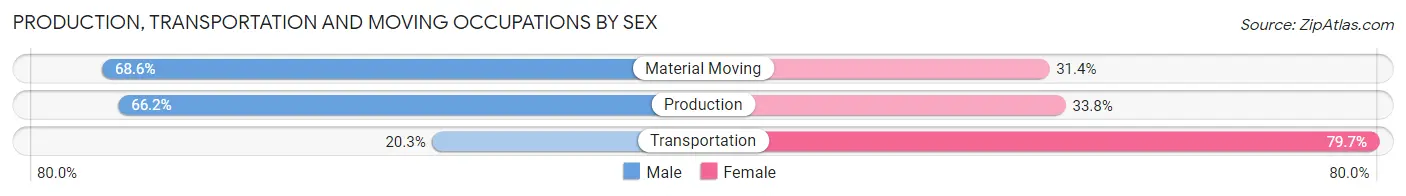
| Occupation | Male | Female |
| Production | 259 (66.2%) | 132 (33.8%) |
| Transportation | 15 (20.3%) | 59 (79.7%) |
| Material Moving | 70 (68.6%) | 32 (31.4%) |
| Total (Category) | 344 (60.7%) | 223 (39.3%) |
| Total (Overall) | 1,282 (52.4%) | 1,166 (47.6%) |
Employment Industries by Sex in Van Buren County
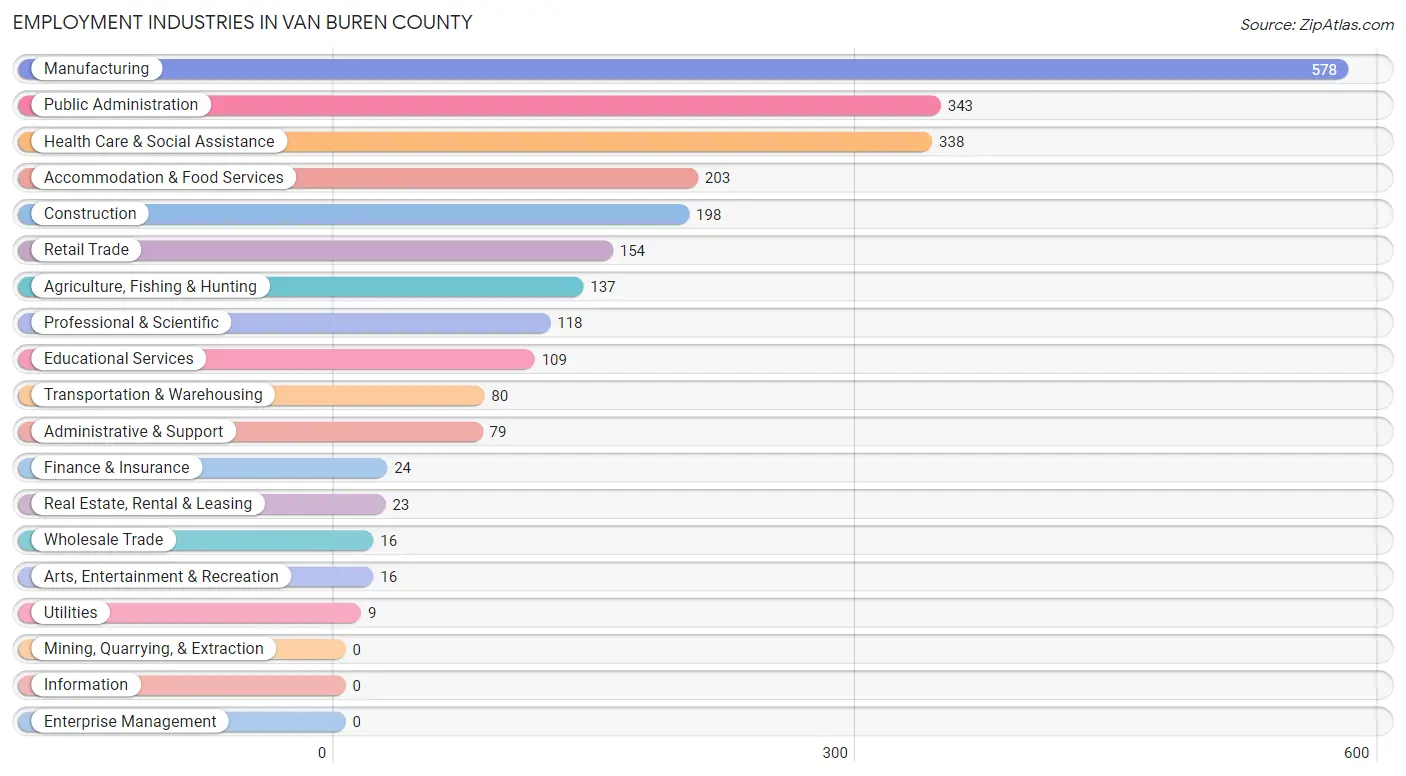
Employment Industries in Van Buren County
The major employment industries in Van Buren County include Manufacturing (578 | 23.6%), Public Administration (343 | 14.0%), Health Care & Social Assistance (338 | 13.8%), Accommodation & Food Services (203 | 8.3%), and Construction (198 | 8.1%).
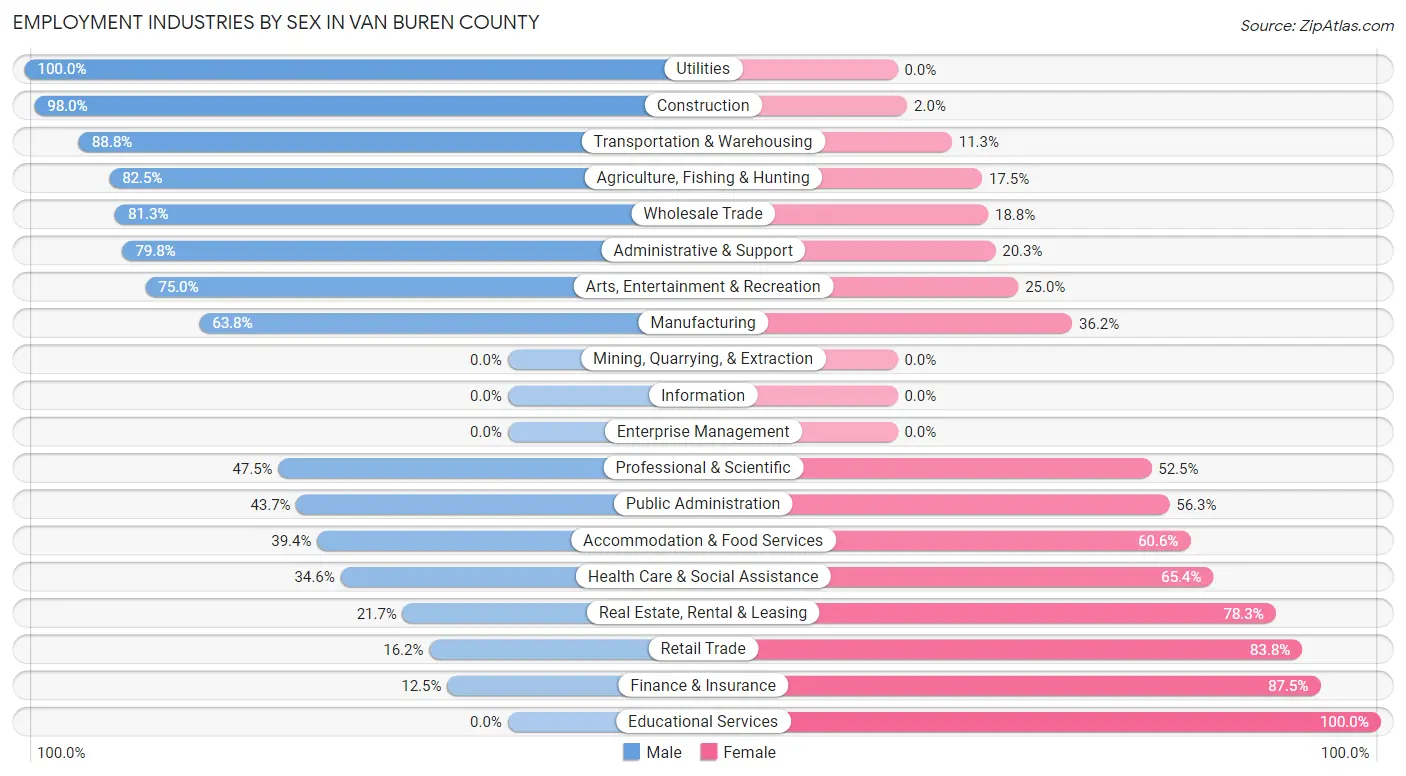
Employment Industries by Sex in Van Buren County
The Van Buren County industries that see more men than women are Utilities (100.0%), Construction (98.0%), and Transportation & Warehousing (88.7%), whereas the industries that tend to have a higher number of women are Educational Services (100.0%), Finance & Insurance (87.5%), and Retail Trade (83.8%).
| Industry | Male | Female |
| Agriculture, Fishing & Hunting | 113 (82.5%) | 24 (17.5%) |
| Mining, Quarrying, & Extraction | 0 (0.0%) | 0 (0.0%) |
| Construction | 194 (98.0%) | 4 (2.0%) |
| Manufacturing | 369 (63.8%) | 209 (36.2%) |
| Wholesale Trade | 13 (81.2%) | 3 (18.8%) |
| Retail Trade | 25 (16.2%) | 129 (83.8%) |
| Transportation & Warehousing | 71 (88.7%) | 9 (11.3%) |
| Utilities | 9 (100.0%) | 0 (0.0%) |
| Information | 0 (0.0%) | 0 (0.0%) |
| Finance & Insurance | 3 (12.5%) | 21 (87.5%) |
| Real Estate, Rental & Leasing | 5 (21.7%) | 18 (78.3%) |
| Professional & Scientific | 56 (47.5%) | 62 (52.5%) |
| Enterprise Management | 0 (0.0%) | 0 (0.0%) |
| Administrative & Support | 63 (79.7%) | 16 (20.3%) |
| Educational Services | 0 (0.0%) | 109 (100.0%) |
| Health Care & Social Assistance | 117 (34.6%) | 221 (65.4%) |
| Arts, Entertainment & Recreation | 12 (75.0%) | 4 (25.0%) |
| Accommodation & Food Services | 80 (39.4%) | 123 (60.6%) |
| Public Administration | 150 (43.7%) | 193 (56.3%) |
| Total | 1,282 (52.4%) | 1,166 (47.6%) |
Education in Van Buren County
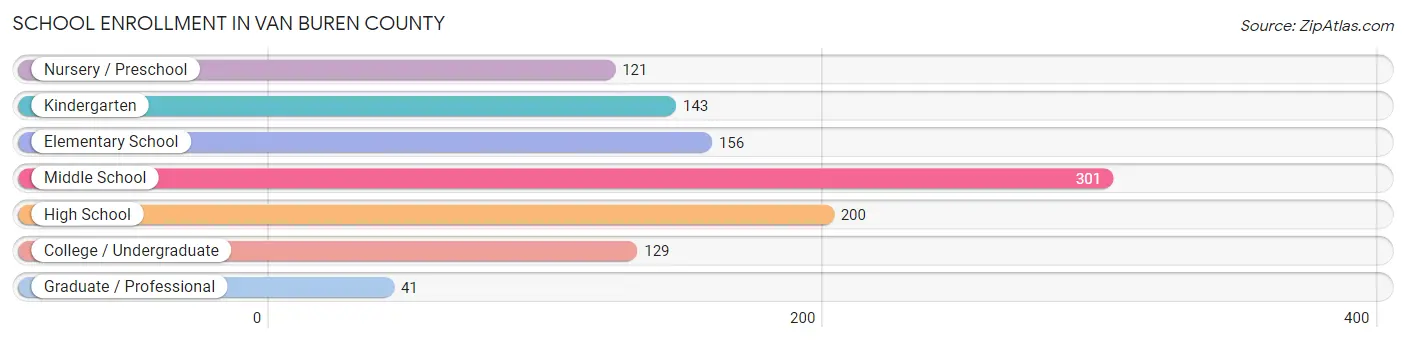
School Enrollment in Van Buren County
The most common levels of schooling among the 1,091 students in Van Buren County are middle school (301 | 27.6%), high school (200 | 18.3%), and elementary school (156 | 14.3%).
| School Level | # Students | % Students |
| Nursery / Preschool | 121 | 11.1% |
| Kindergarten | 143 | 13.1% |
| Elementary School | 156 | 14.3% |
| Middle School | 301 | 27.6% |
| High School | 200 | 18.3% |
| College / Undergraduate | 129 | 11.8% |
| Graduate / Professional | 41 | 3.8% |
| Total | 1,091 | 100.0% |
School Enrollment by Age by Funding Source in Van Buren County
Out of a total of 1,091 students who are enrolled in schools in Van Buren County, 84 (7.7%) attend a private institution, while the remaining 1,007 (92.3%) are enrolled in public schools. The age group of 10 to 14 year olds has the highest likelihood of being enrolled in private schools, with 42 (15.9% in the age bracket) enrolled. Conversely, the age group of 3 to 4 year olds has the lowest likelihood of being enrolled in a private school, with 111 (100.0% in the age bracket) attending a public institution.
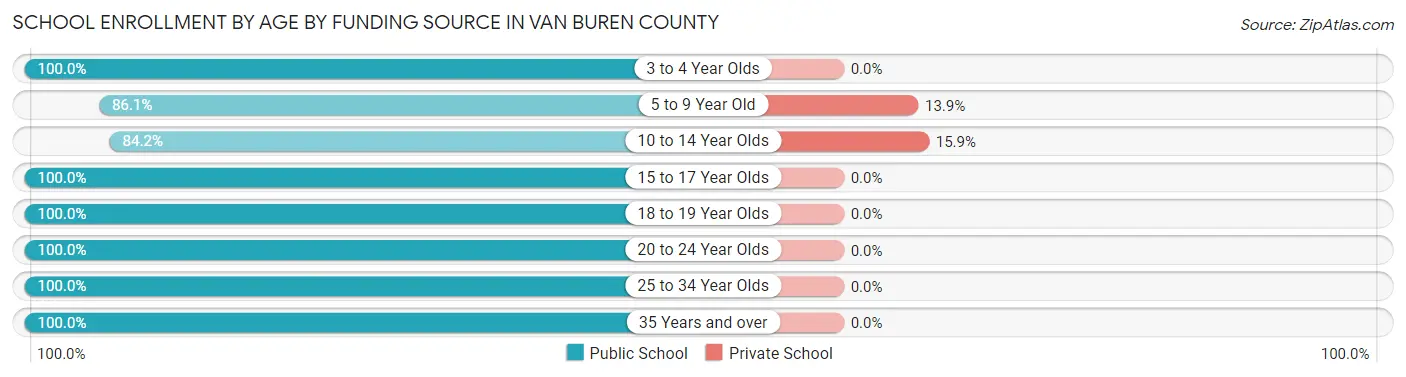
| Age Bracket | Public School | Private School |
| 3 to 4 Year Olds | 111 (100.0%) | 0 (0.0%) |
| 5 to 9 Year Old | 261 (86.1%) | 42 (13.9%) |
| 10 to 14 Year Olds | 223 (84.2%) | 42 (15.9%) |
| 15 to 17 Year Olds | 208 (100.0%) | 0 (0.0%) |
| 18 to 19 Year Olds | 46 (100.0%) | 0 (0.0%) |
| 20 to 24 Year Olds | 39 (100.0%) | 0 (0.0%) |
| 25 to 34 Year Olds | 101 (100.0%) | 0 (0.0%) |
| 35 Years and over | 18 (100.0%) | 0 (0.0%) |
| Total | 1,007 (92.3%) | 84 (7.7%) |
Educational Attainment by Field of Study in Van Buren County
Business (140 | 28.5%), education (74 | 15.0%), science & technology (66 | 13.4%), bio, nature & agricultural (51 | 10.4%), and social sciences (43 | 8.7%) are the most common fields of study among 492 individuals in Van Buren County who have obtained a bachelor's degree or higher.
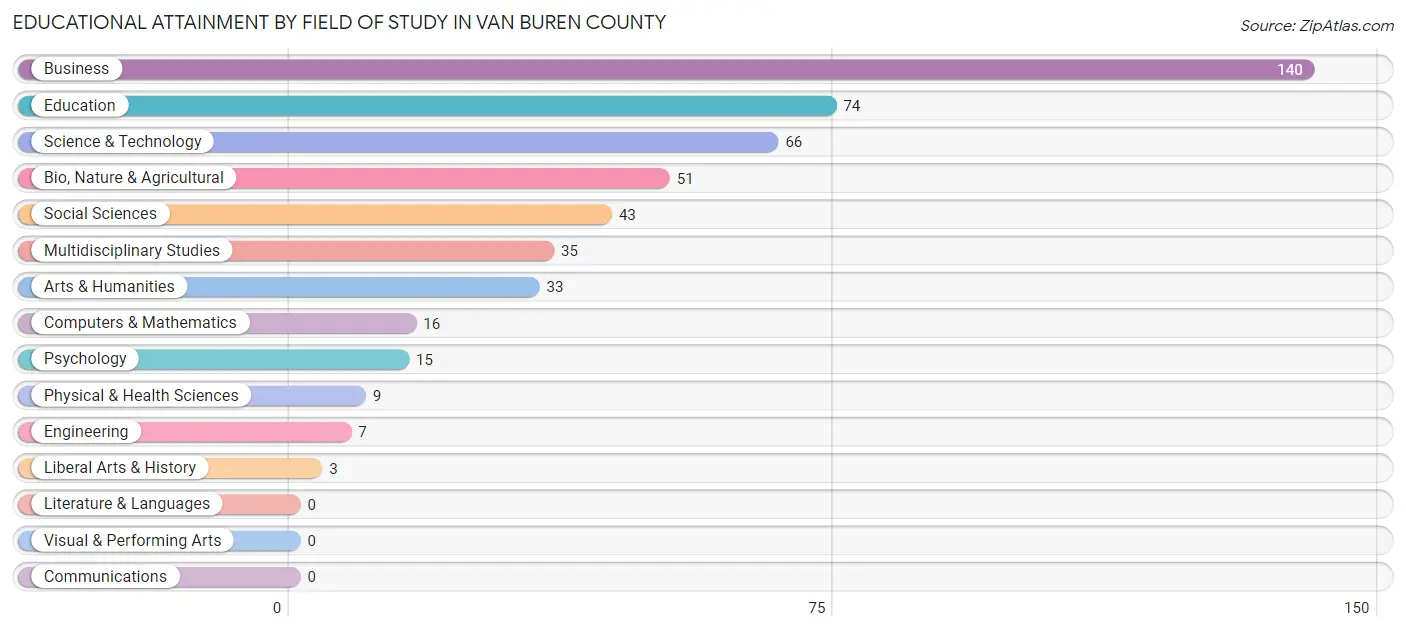
| Field of Study | # Graduates | % Graduates |
| Computers & Mathematics | 16 | 3.3% |
| Bio, Nature & Agricultural | 51 | 10.4% |
| Physical & Health Sciences | 9 | 1.8% |
| Psychology | 15 | 3.0% |
| Social Sciences | 43 | 8.7% |
| Engineering | 7 | 1.4% |
| Multidisciplinary Studies | 35 | 7.1% |
| Science & Technology | 66 | 13.4% |
| Business | 140 | 28.5% |
| Education | 74 | 15.0% |
| Literature & Languages | 0 | 0.0% |
| Liberal Arts & History | 3 | 0.6% |
| Visual & Performing Arts | 0 | 0.0% |
| Communications | 0 | 0.0% |
| Arts & Humanities | 33 | 6.7% |
| Total | 492 | 100.0% |
Transportation & Commute in Van Buren County
Vehicle Availability by Sex in Van Buren County
The most prevalent vehicle ownership categories in Van Buren County are males with 2 vehicles (464, accounting for 36.3%) and females with 2 vehicles (416, making up 40.6%).
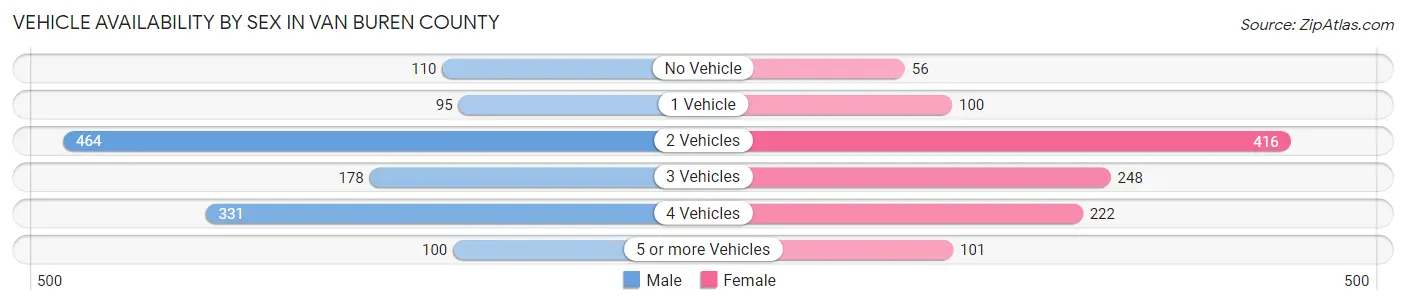
| Vehicles Available | Male | Female |
| No Vehicle | 110 (8.6%) | 56 (4.9%) |
| 1 Vehicle | 95 (7.4%) | 100 (8.7%) |
| 2 Vehicles | 464 (36.3%) | 416 (36.4%) |
| 3 Vehicles | 178 (13.9%) | 248 (21.7%) |
| 4 Vehicles | 331 (25.9%) | 222 (19.4%) |
| 5 or more Vehicles | 100 (7.8%) | 101 (8.8%) |
| Total | 1,278 (100.0%) | 1,143 (100.0%) |
Commute Time in Van Buren County
The most frequently occuring commute durations in Van Buren County are 30 to 34 minutes (564 commuters, 24.0%), 60 to 89 minutes (311 commuters, 13.3%), and 45 to 59 minutes (273 commuters, 11.6%).
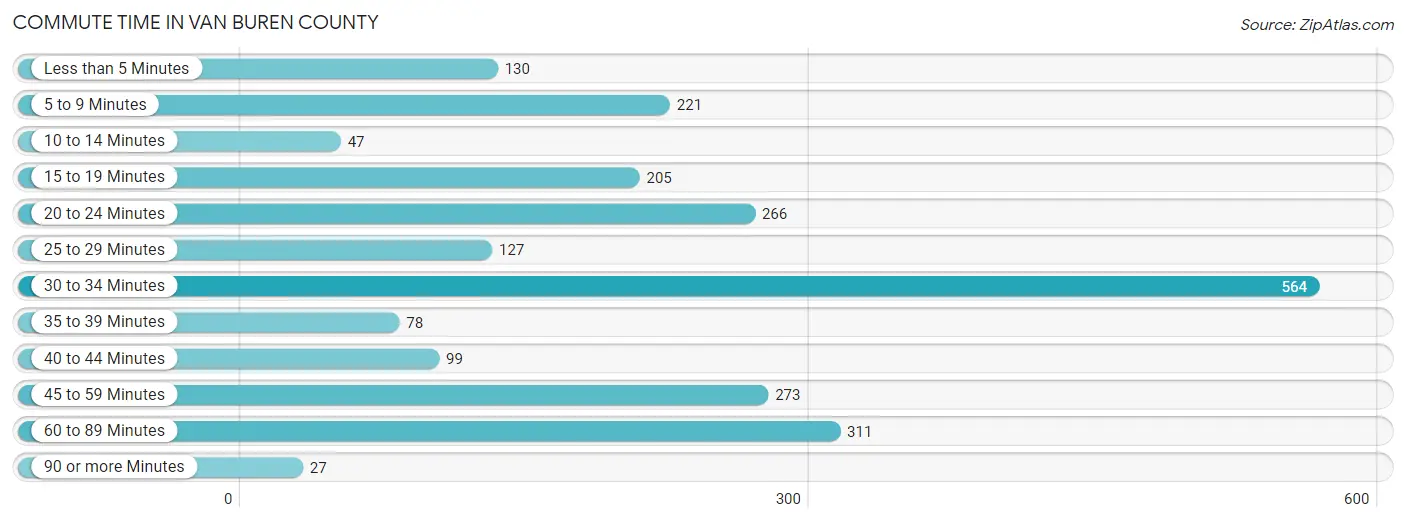
| Commute Time | # Commuters | % Commuters |
| Less than 5 Minutes | 130 | 5.5% |
| 5 to 9 Minutes | 221 | 9.4% |
| 10 to 14 Minutes | 47 | 2.0% |
| 15 to 19 Minutes | 205 | 8.7% |
| 20 to 24 Minutes | 266 | 11.3% |
| 25 to 29 Minutes | 127 | 5.4% |
| 30 to 34 Minutes | 564 | 24.0% |
| 35 to 39 Minutes | 78 | 3.3% |
| 40 to 44 Minutes | 99 | 4.2% |
| 45 to 59 Minutes | 273 | 11.6% |
| 60 to 89 Minutes | 311 | 13.3% |
| 90 or more Minutes | 27 | 1.1% |
Commute Time by Sex in Van Buren County
The most common commute times in Van Buren County are 30 to 34 minutes (270 commuters, 21.9%) for males and 30 to 34 minutes (294 commuters, 26.4%) for females.

| Commute Time | Male | Female |
| Less than 5 Minutes | 71 (5.8%) | 59 (5.3%) |
| 5 to 9 Minutes | 124 (10.1%) | 97 (8.7%) |
| 10 to 14 Minutes | 24 (1.9%) | 23 (2.1%) |
| 15 to 19 Minutes | 7 (0.6%) | 198 (17.8%) |
| 20 to 24 Minutes | 170 (13.8%) | 96 (8.6%) |
| 25 to 29 Minutes | 54 (4.4%) | 73 (6.6%) |
| 30 to 34 Minutes | 270 (21.9%) | 294 (26.4%) |
| 35 to 39 Minutes | 56 (4.5%) | 22 (2.0%) |
| 40 to 44 Minutes | 49 (4.0%) | 50 (4.5%) |
| 45 to 59 Minutes | 156 (12.7%) | 117 (10.5%) |
| 60 to 89 Minutes | 225 (18.2%) | 86 (7.7%) |
| 90 or more Minutes | 27 (2.2%) | 0 (0.0%) |
Time of Departure to Work by Sex in Van Buren County
The most frequent times of departure to work in Van Buren County are 6:00 AM to 6:29 AM (332, 26.9%) for males and 7:00 AM to 7:29 AM (237, 21.3%) for females.
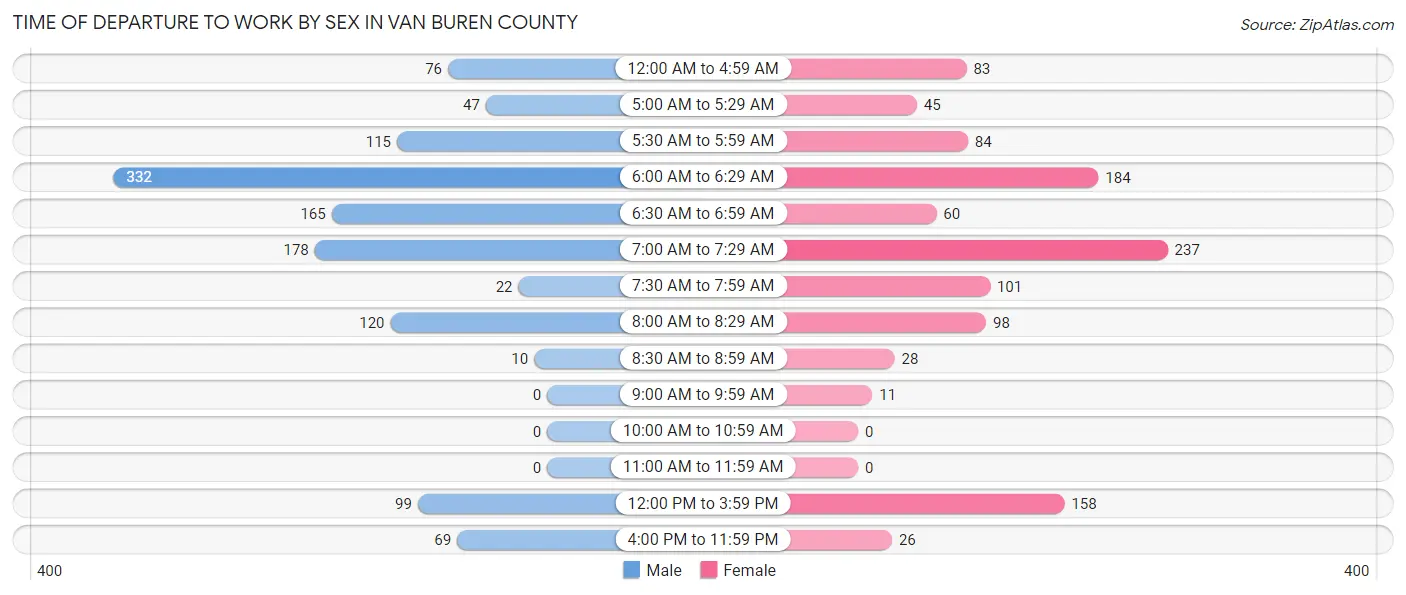
| Time of Departure | Male | Female |
| 12:00 AM to 4:59 AM | 76 (6.2%) | 83 (7.4%) |
| 5:00 AM to 5:29 AM | 47 (3.8%) | 45 (4.0%) |
| 5:30 AM to 5:59 AM | 115 (9.3%) | 84 (7.5%) |
| 6:00 AM to 6:29 AM | 332 (26.9%) | 184 (16.5%) |
| 6:30 AM to 6:59 AM | 165 (13.4%) | 60 (5.4%) |
| 7:00 AM to 7:29 AM | 178 (14.4%) | 237 (21.3%) |
| 7:30 AM to 7:59 AM | 22 (1.8%) | 101 (9.1%) |
| 8:00 AM to 8:29 AM | 120 (9.7%) | 98 (8.8%) |
| 8:30 AM to 8:59 AM | 10 (0.8%) | 28 (2.5%) |
| 9:00 AM to 9:59 AM | 0 (0.0%) | 11 (1.0%) |
| 10:00 AM to 10:59 AM | 0 (0.0%) | 0 (0.0%) |
| 11:00 AM to 11:59 AM | 0 (0.0%) | 0 (0.0%) |
| 12:00 PM to 3:59 PM | 99 (8.0%) | 158 (14.2%) |
| 4:00 PM to 11:59 PM | 69 (5.6%) | 26 (2.3%) |
| Total | 1,233 (100.0%) | 1,115 (100.0%) |
Housing Occupancy in Van Buren County
Occupancy by Ownership in Van Buren County
Of the total 2,434 dwellings in Van Buren County, owner-occupied units account for 1,956 (80.4%), while renter-occupied units make up 478 (19.6%).
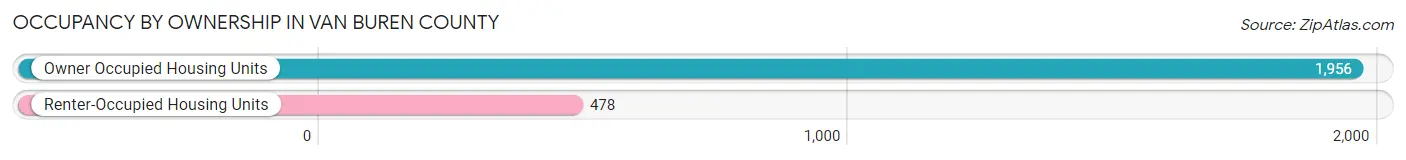
| Occupancy | # Housing Units | % Housing Units |
| Owner Occupied Housing Units | 1,956 | 80.4% |
| Renter-Occupied Housing Units | 478 | 19.6% |
| Total Occupied Housing Units | 2,434 | 100.0% |
Occupancy by Household Size in Van Buren County
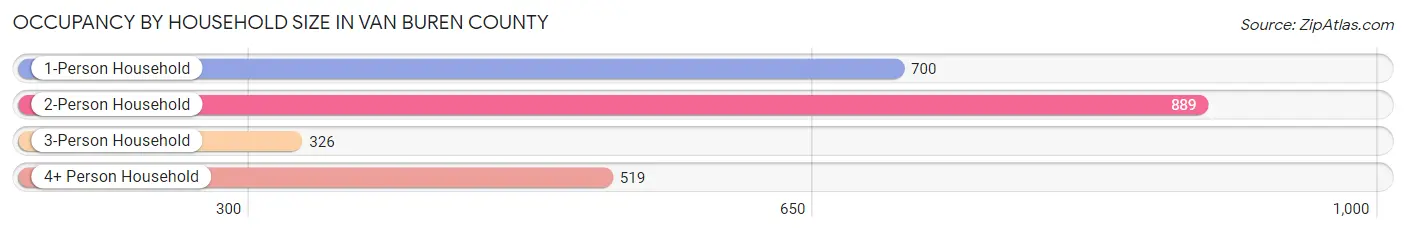
| Household Size | # Housing Units | % Housing Units |
| 1-Person Household | 700 | 28.8% |
| 2-Person Household | 889 | 36.5% |
| 3-Person Household | 326 | 13.4% |
| 4+ Person Household | 519 | 21.3% |
| Total Housing Units | 2,434 | 100.0% |
Occupancy by Ownership by Household Size in Van Buren County
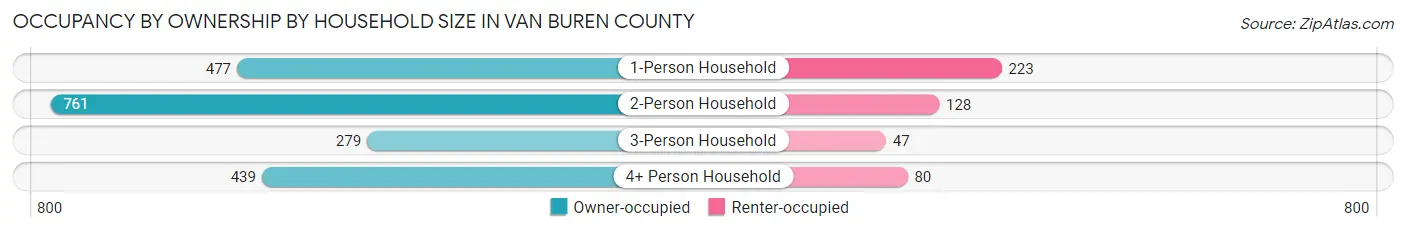
| Household Size | Owner-occupied | Renter-occupied |
| 1-Person Household | 477 (68.1%) | 223 (31.9%) |
| 2-Person Household | 761 (85.6%) | 128 (14.4%) |
| 3-Person Household | 279 (85.6%) | 47 (14.4%) |
| 4+ Person Household | 439 (84.6%) | 80 (15.4%) |
| Total Housing Units | 1,956 (80.4%) | 478 (19.6%) |
Occupancy by Educational Attainment in Van Buren County
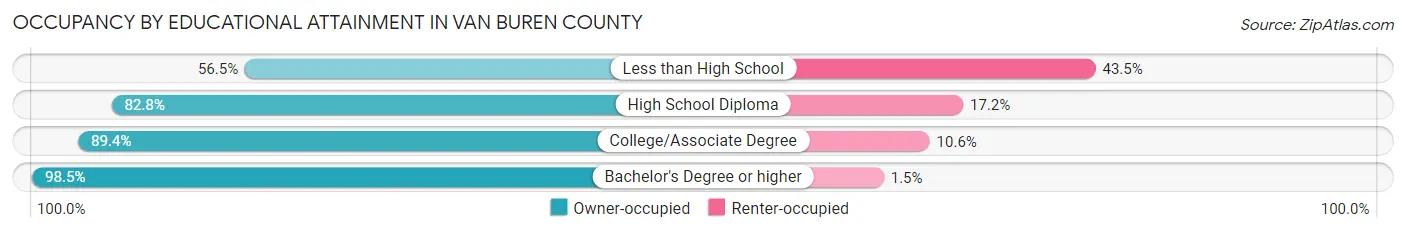
| Household Size | Owner-occupied | Renter-occupied |
| Less than High School | 291 (56.5%) | 224 (43.5%) |
| High School Diploma | 932 (82.8%) | 194 (17.2%) |
| College/Associate Degree | 472 (89.4%) | 56 (10.6%) |
| Bachelor's Degree or higher | 261 (98.5%) | 4 (1.5%) |
Occupancy by Age of Householder in Van Buren County
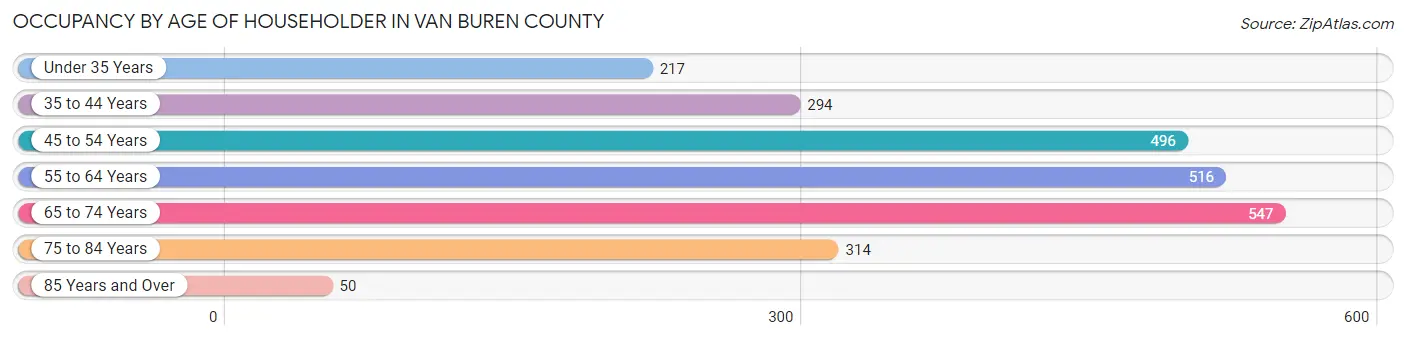
| Age Bracket | # Households | % Households |
| Under 35 Years | 217 | 8.9% |
| 35 to 44 Years | 294 | 12.1% |
| 45 to 54 Years | 496 | 20.4% |
| 55 to 64 Years | 516 | 21.2% |
| 65 to 74 Years | 547 | 22.5% |
| 75 to 84 Years | 314 | 12.9% |
| 85 Years and Over | 50 | 2.1% |
| Total | 2,434 | 100.0% |
Housing Finances in Van Buren County
Median Income by Occupancy in Van Buren County
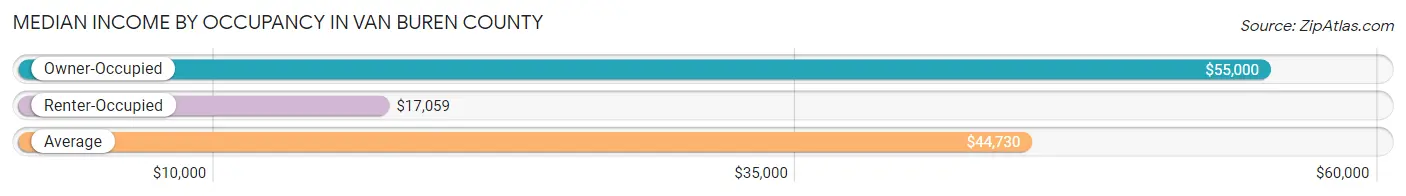
| Occupancy Type | # Households | Median Income |
| Owner-Occupied | 1,956 (80.4%) | $55,000 |
| Renter-Occupied | 478 (19.6%) | $17,059 |
| Average | 2,434 (100.0%) | $44,730 |
Occupancy by Householder Income Bracket in Van Buren County
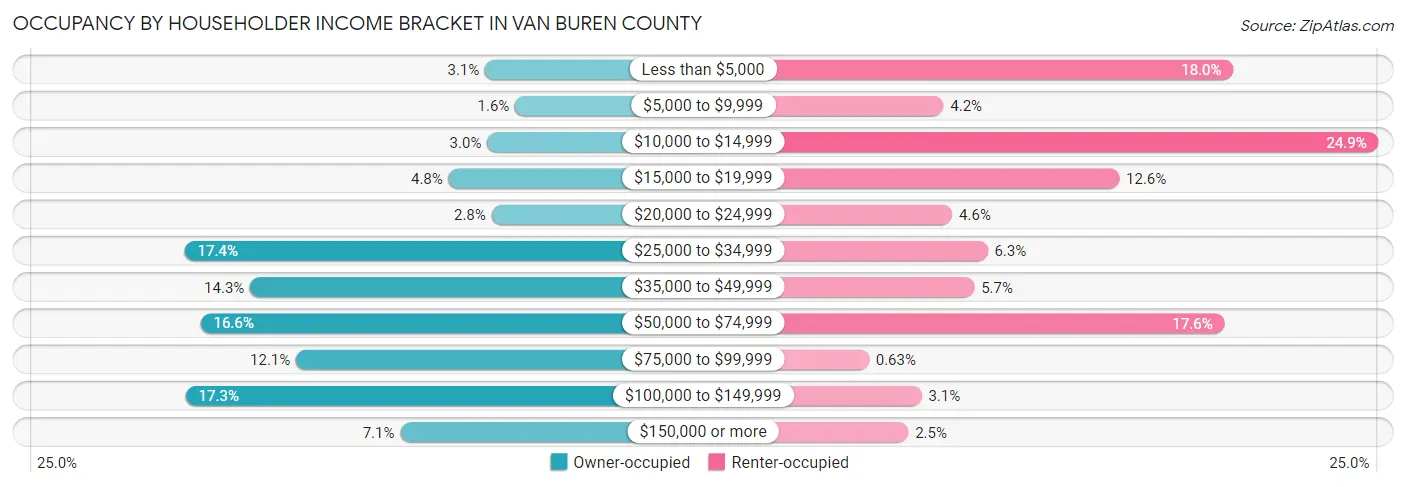
| Income Bracket | Owner-occupied | Renter-occupied |
| Less than $5,000 | 60 (3.1%) | 86 (18.0%) |
| $5,000 to $9,999 | 32 (1.6%) | 20 (4.2%) |
| $10,000 to $14,999 | 58 (3.0%) | 119 (24.9%) |
| $15,000 to $19,999 | 94 (4.8%) | 60 (12.6%) |
| $20,000 to $24,999 | 54 (2.8%) | 22 (4.6%) |
| $25,000 to $34,999 | 340 (17.4%) | 30 (6.3%) |
| $35,000 to $49,999 | 279 (14.3%) | 27 (5.7%) |
| $50,000 to $74,999 | 325 (16.6%) | 84 (17.6%) |
| $75,000 to $99,999 | 236 (12.1%) | 3 (0.6%) |
| $100,000 to $149,999 | 339 (17.3%) | 15 (3.1%) |
| $150,000 or more | 139 (7.1%) | 12 (2.5%) |
| Total | 1,956 (100.0%) | 478 (100.0%) |
Monthly Housing Cost Tiers in Van Buren County
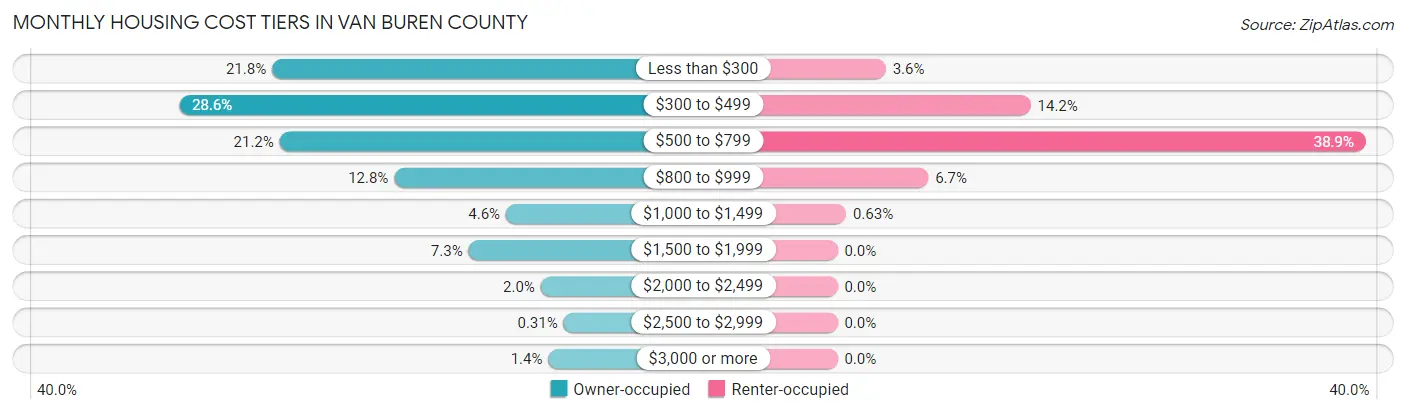
| Monthly Cost | Owner-occupied | Renter-occupied |
| Less than $300 | 426 (21.8%) | 17 (3.6%) |
| $300 to $499 | 560 (28.6%) | 68 (14.2%) |
| $500 to $799 | 415 (21.2%) | 186 (38.9%) |
| $800 to $999 | 250 (12.8%) | 32 (6.7%) |
| $1,000 to $1,499 | 89 (4.5%) | 3 (0.6%) |
| $1,500 to $1,999 | 143 (7.3%) | 0 (0.0%) |
| $2,000 to $2,499 | 39 (2.0%) | 0 (0.0%) |
| $2,500 to $2,999 | 6 (0.3%) | 0 (0.0%) |
| $3,000 or more | 28 (1.4%) | 0 (0.0%) |
| Total | 1,956 (100.0%) | 478 (100.0%) |
Physical Housing Characteristics in Van Buren County
Housing Structures in Van Buren County
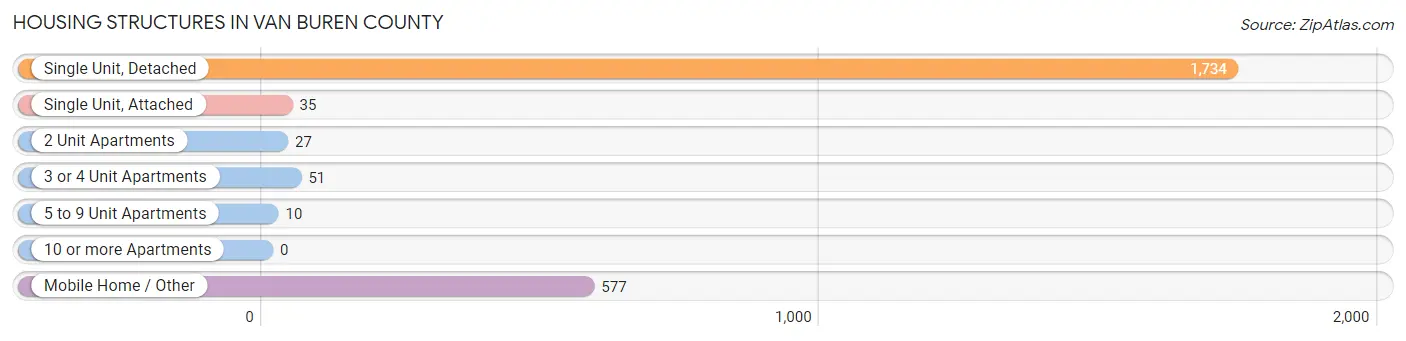
| Structure Type | # Housing Units | % Housing Units |
| Single Unit, Detached | 1,734 | 71.2% |
| Single Unit, Attached | 35 | 1.4% |
| 2 Unit Apartments | 27 | 1.1% |
| 3 or 4 Unit Apartments | 51 | 2.1% |
| 5 to 9 Unit Apartments | 10 | 0.4% |
| 10 or more Apartments | 0 | 0.0% |
| Mobile Home / Other | 577 | 23.7% |
| Total | 2,434 | 100.0% |
Housing Structures by Occupancy in Van Buren County
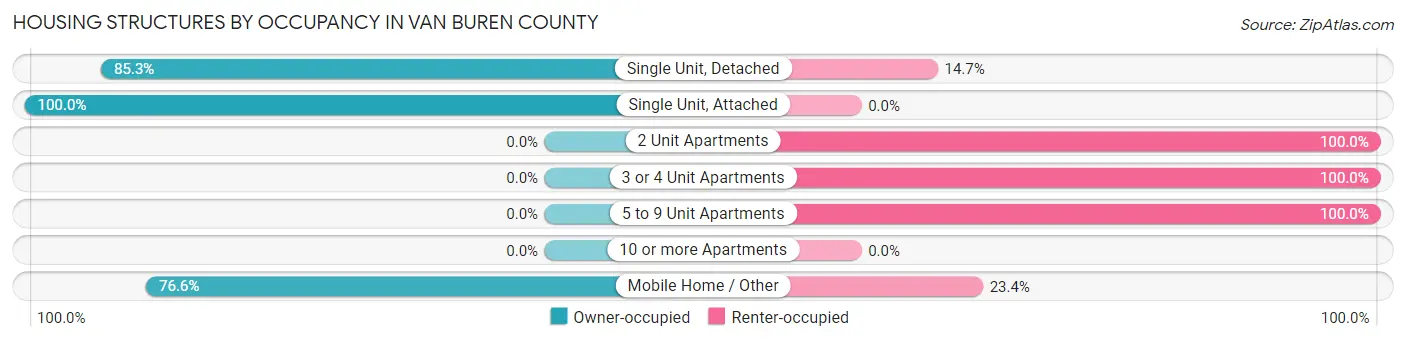
| Structure Type | Owner-occupied | Renter-occupied |
| Single Unit, Detached | 1,479 (85.3%) | 255 (14.7%) |
| Single Unit, Attached | 35 (100.0%) | 0 (0.0%) |
| 2 Unit Apartments | 0 (0.0%) | 27 (100.0%) |
| 3 or 4 Unit Apartments | 0 (0.0%) | 51 (100.0%) |
| 5 to 9 Unit Apartments | 0 (0.0%) | 10 (100.0%) |
| 10 or more Apartments | 0 (0.0%) | 0 (0.0%) |
| Mobile Home / Other | 442 (76.6%) | 135 (23.4%) |
| Total | 1,956 (80.4%) | 478 (19.6%) |
Housing Structures by Number of Rooms in Van Buren County
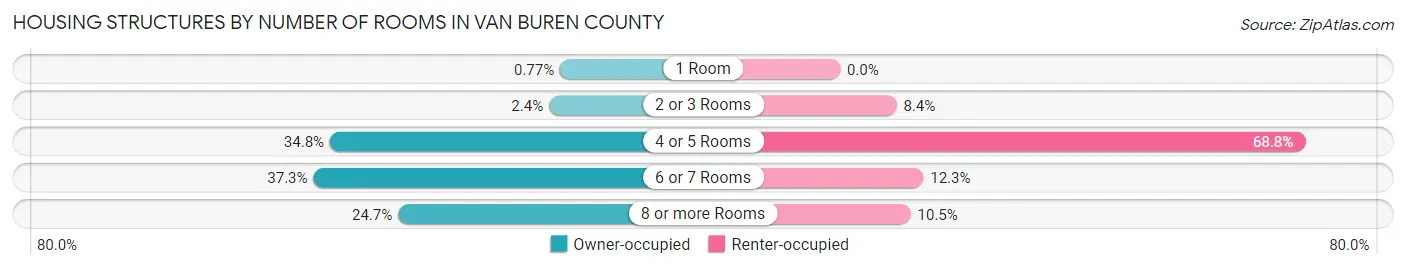
| Number of Rooms | Owner-occupied | Renter-occupied |
| 1 Room | 15 (0.8%) | 0 (0.0%) |
| 2 or 3 Rooms | 47 (2.4%) | 40 (8.4%) |
| 4 or 5 Rooms | 681 (34.8%) | 329 (68.8%) |
| 6 or 7 Rooms | 729 (37.3%) | 59 (12.3%) |
| 8 or more Rooms | 484 (24.7%) | 50 (10.5%) |
| Total | 1,956 (100.0%) | 478 (100.0%) |
Housing Structure by Heating Type in Van Buren County

| Heating Type | Owner-occupied | Renter-occupied |
| Utility Gas | 214 (10.9%) | 58 (12.1%) |
| Bottled, Tank, or LP Gas | 190 (9.7%) | 40 (8.4%) |
| Electricity | 1,196 (61.2%) | 285 (59.6%) |
| Fuel Oil or Kerosene | 103 (5.3%) | 0 (0.0%) |
| Coal or Coke | 0 (0.0%) | 0 (0.0%) |
| All other Fuels | 253 (12.9%) | 54 (11.3%) |
| No Fuel Used | 0 (0.0%) | 41 (8.6%) |
| Total | 1,956 (100.0%) | 478 (100.0%) |
Household Vehicle Usage in Van Buren County
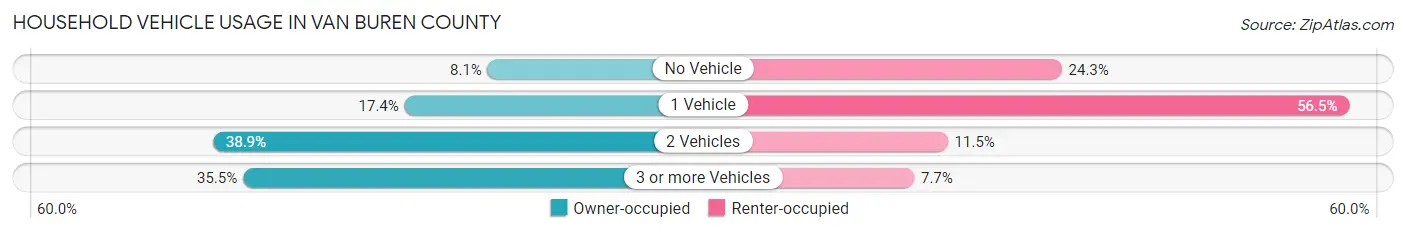
| Vehicles per Household | Owner-occupied | Renter-occupied |
| No Vehicle | 159 (8.1%) | 116 (24.3%) |
| 1 Vehicle | 341 (17.4%) | 270 (56.5%) |
| 2 Vehicles | 761 (38.9%) | 55 (11.5%) |
| 3 or more Vehicles | 695 (35.5%) | 37 (7.7%) |
| Total | 1,956 (100.0%) | 478 (100.0%) |
Real Estate & Mortgages in Van Buren County
Real Estate and Mortgage Overview in Van Buren County
| Characteristic | Without Mortgage | With Mortgage |
| Housing Units | 1,212 | 744 |
| Median Property Value | $107,400 | $155,500 |
| Median Household Income | $44,936 | $83 |
| Monthly Housing Costs | $345 | $18 |
| Real Estate Taxes | $518 | $55 |
Property Value by Mortgage Status in Van Buren County
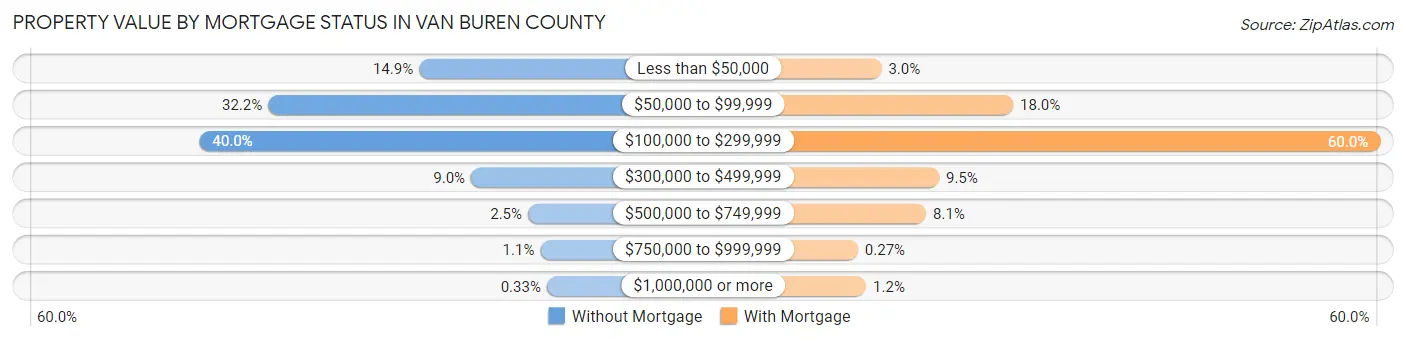
| Property Value | Without Mortgage | With Mortgage |
| Less than $50,000 | 181 (14.9%) | 22 (3.0%) |
| $50,000 to $99,999 | 390 (32.2%) | 134 (18.0%) |
| $100,000 to $299,999 | 485 (40.0%) | 446 (60.0%) |
| $300,000 to $499,999 | 109 (9.0%) | 71 (9.5%) |
| $500,000 to $749,999 | 30 (2.5%) | 60 (8.1%) |
| $750,000 to $999,999 | 13 (1.1%) | 2 (0.3%) |
| $1,000,000 or more | 4 (0.3%) | 9 (1.2%) |
| Total | 1,212 (100.0%) | 744 (100.0%) |
Household Income by Mortgage Status in Van Buren County
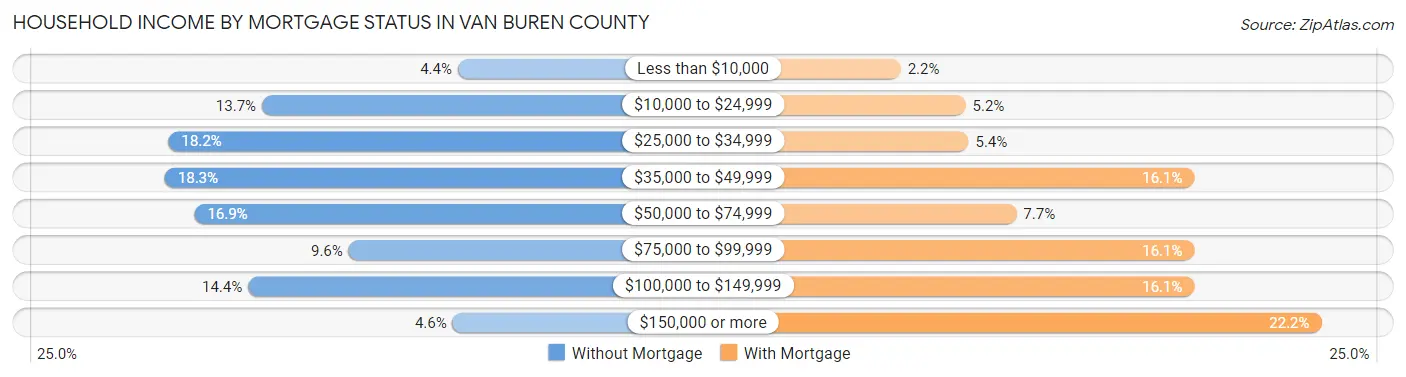
| Household Income | Without Mortgage | With Mortgage |
| Less than $10,000 | 53 (4.4%) | 16 (2.1%) |
| $10,000 to $24,999 | 166 (13.7%) | 39 (5.2%) |
| $25,000 to $34,999 | 220 (18.1%) | 40 (5.4%) |
| $35,000 to $49,999 | 222 (18.3%) | 120 (16.1%) |
| $50,000 to $74,999 | 205 (16.9%) | 57 (7.7%) |
| $75,000 to $99,999 | 116 (9.6%) | 120 (16.1%) |
| $100,000 to $149,999 | 174 (14.4%) | 120 (16.1%) |
| $150,000 or more | 56 (4.6%) | 165 (22.2%) |
| Total | 1,212 (100.0%) | 744 (100.0%) |
Property Value to Household Income Ratio in Van Buren County

| Value-to-Income Ratio | Without Mortgage | With Mortgage |
| Less than 2.0x | 509 (42.0%) | 72,321 (9,720.6%) |
| 2.0x to 2.9x | 169 (13.9%) | 298 (40.1%) |
| 3.0x to 3.9x | 181 (14.9%) | 138 (18.5%) |
| 4.0x or more | 335 (27.6%) | 33 (4.4%) |
| Total | 1,212 (100.0%) | 744 (100.0%) |
Real Estate Taxes by Mortgage Status in Van Buren County
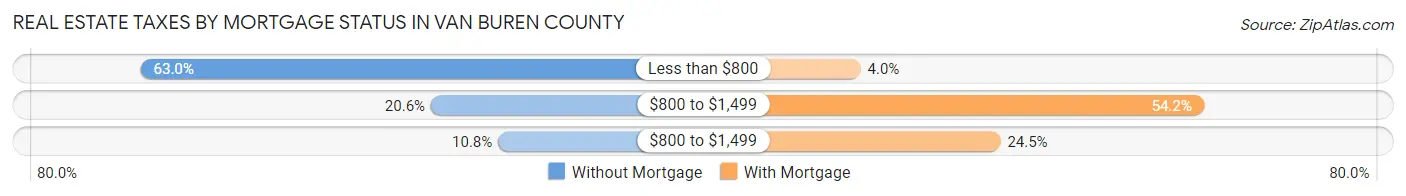
| Property Taxes | Without Mortgage | With Mortgage |
| Less than $800 | 764 (63.0%) | 30 (4.0%) |
| $800 to $1,499 | 250 (20.6%) | 403 (54.2%) |
| $800 to $1,499 | 131 (10.8%) | 182 (24.5%) |
| Total | 1,212 (100.0%) | 744 (100.0%) |
Health & Disability in Van Buren County
Health Insurance Coverage by Age in Van Buren County
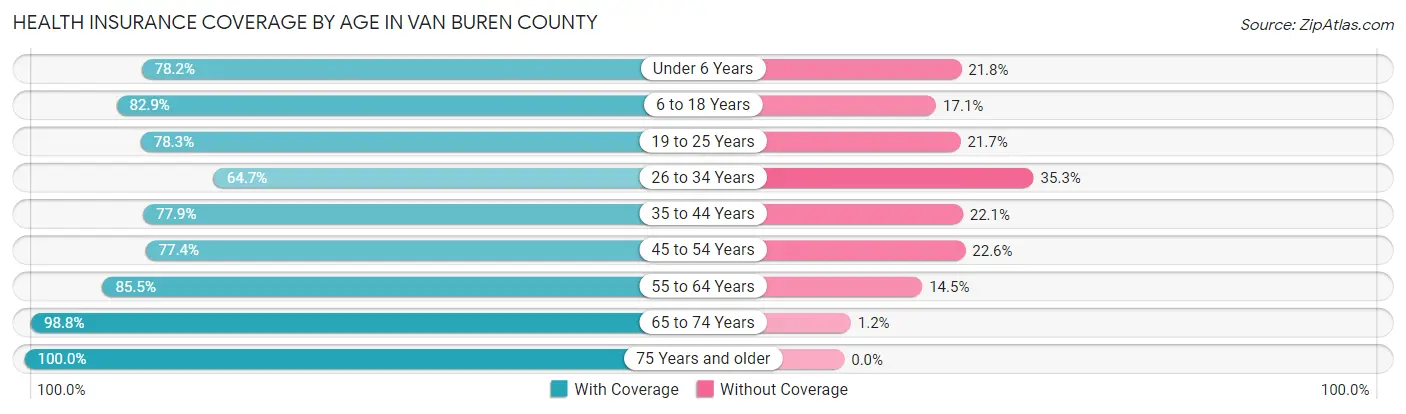
| Age Bracket | With Coverage | Without Coverage |
| Under 6 Years | 362 (78.2%) | 101 (21.8%) |
| 6 to 18 Years | 658 (82.9%) | 136 (17.1%) |
| 19 to 25 Years | 318 (78.3%) | 88 (21.7%) |
| 26 to 34 Years | 381 (64.7%) | 208 (35.3%) |
| 35 to 44 Years | 497 (77.9%) | 141 (22.1%) |
| 45 to 54 Years | 679 (77.4%) | 198 (22.6%) |
| 55 to 64 Years | 747 (85.5%) | 127 (14.5%) |
| 65 to 74 Years | 892 (98.8%) | 11 (1.2%) |
| 75 Years and older | 533 (100.0%) | 0 (0.0%) |
| Total | 5,067 (83.4%) | 1,010 (16.6%) |
Health Insurance Coverage by Citizenship Status in Van Buren County
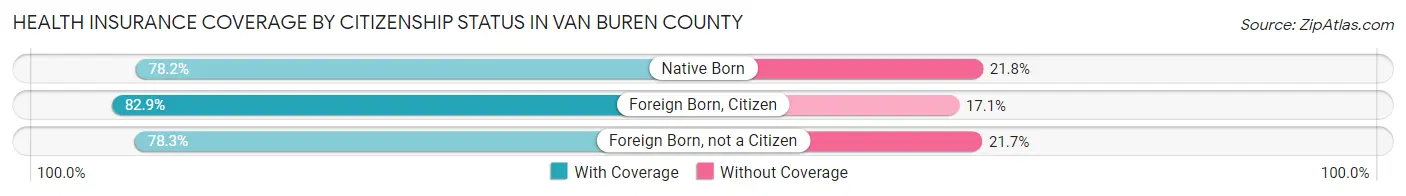
| Citizenship Status | With Coverage | Without Coverage |
| Native Born | 362 (78.2%) | 101 (21.8%) |
| Foreign Born, Citizen | 658 (82.9%) | 136 (17.1%) |
| Foreign Born, not a Citizen | 318 (78.3%) | 88 (21.7%) |
Health Insurance Coverage by Household Income in Van Buren County
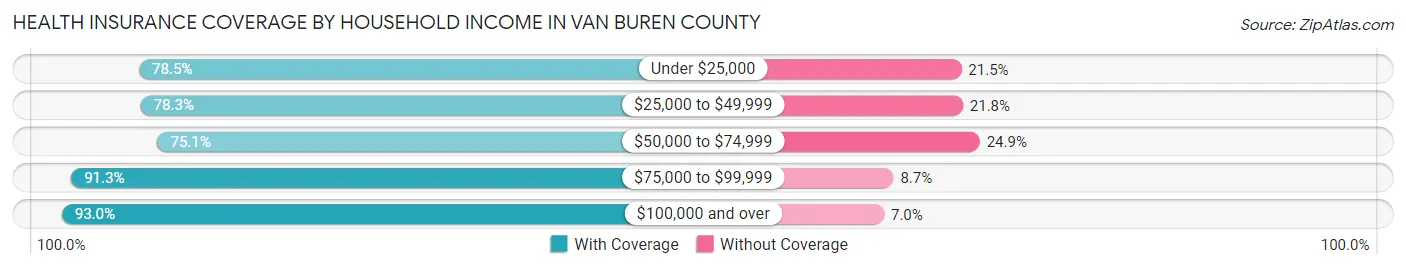
| Household Income | With Coverage | Without Coverage |
| Under $25,000 | 768 (78.5%) | 210 (21.5%) |
| $25,000 to $49,999 | 1,004 (78.2%) | 279 (21.7%) |
| $50,000 to $74,999 | 1,007 (75.1%) | 334 (24.9%) |
| $75,000 to $99,999 | 741 (91.3%) | 71 (8.7%) |
| $100,000 and over | 1,547 (93.0%) | 116 (7.0%) |
Public vs Private Health Insurance Coverage by Age in Van Buren County
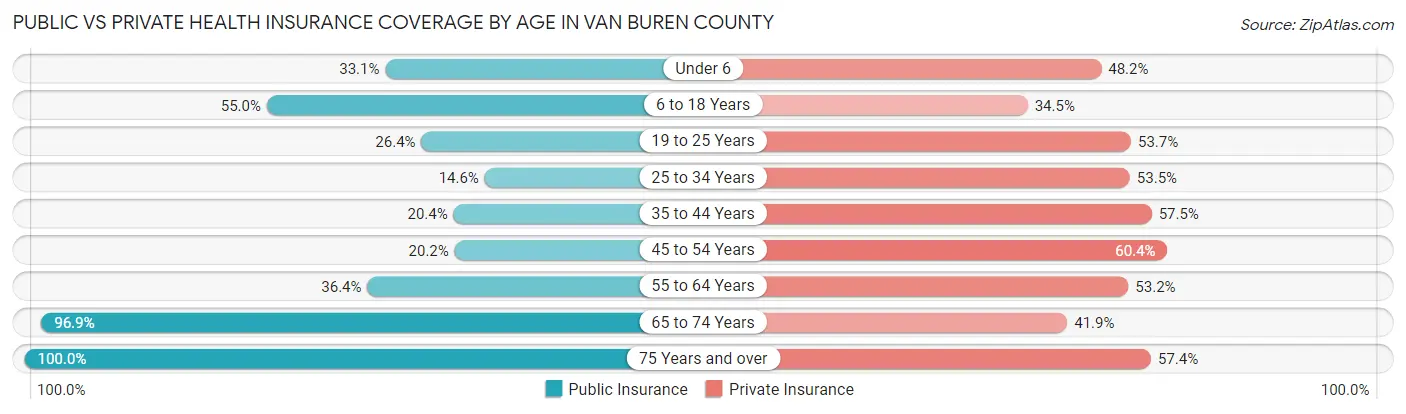
| Age Bracket | Public Insurance | Private Insurance |
| Under 6 | 153 (33.1%) | 223 (48.2%) |
| 6 to 18 Years | 437 (55.0%) | 274 (34.5%) |
| 19 to 25 Years | 107 (26.4%) | 218 (53.7%) |
| 25 to 34 Years | 86 (14.6%) | 315 (53.5%) |
| 35 to 44 Years | 130 (20.4%) | 367 (57.5%) |
| 45 to 54 Years | 177 (20.2%) | 530 (60.4%) |
| 55 to 64 Years | 318 (36.4%) | 465 (53.2%) |
| 65 to 74 Years | 875 (96.9%) | 378 (41.9%) |
| 75 Years and over | 533 (100.0%) | 306 (57.4%) |
| Total | 2,816 (46.3%) | 3,076 (50.6%) |
Disability Status by Sex by Age in Van Buren County
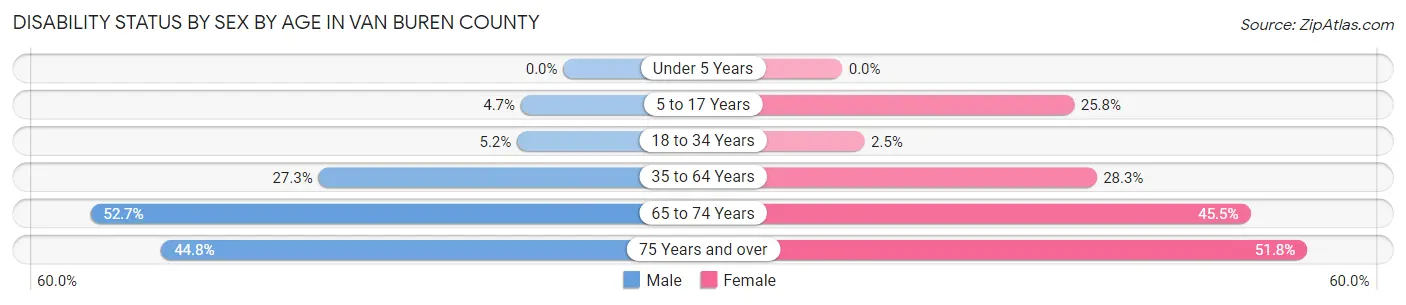
| Age Bracket | Male | Female |
| Under 5 Years | 0 (0.0%) | 0 (0.0%) |
| 5 to 17 Years | 21 (4.7%) | 108 (25.8%) |
| 18 to 34 Years | 29 (5.1%) | 12 (2.5%) |
| 35 to 64 Years | 330 (27.3%) | 334 (28.3%) |
| 65 to 74 Years | 236 (52.7%) | 207 (45.5%) |
| 75 Years and over | 103 (44.8%) | 157 (51.8%) |
Disability Class by Sex by Age in Van Buren County
Disability Class: Hearing Difficulty
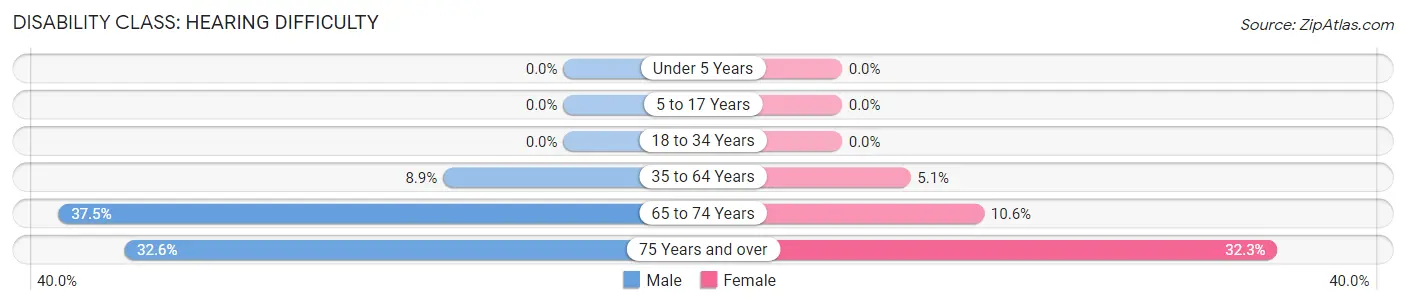
| Age Bracket | Male | Female |
| Under 5 Years | 0 (0.0%) | 0 (0.0%) |
| 5 to 17 Years | 0 (0.0%) | 0 (0.0%) |
| 18 to 34 Years | 0 (0.0%) | 0 (0.0%) |
| 35 to 64 Years | 108 (8.9%) | 60 (5.1%) |
| 65 to 74 Years | 168 (37.5%) | 48 (10.5%) |
| 75 Years and over | 75 (32.6%) | 98 (32.3%) |
Disability Class: Vision Difficulty
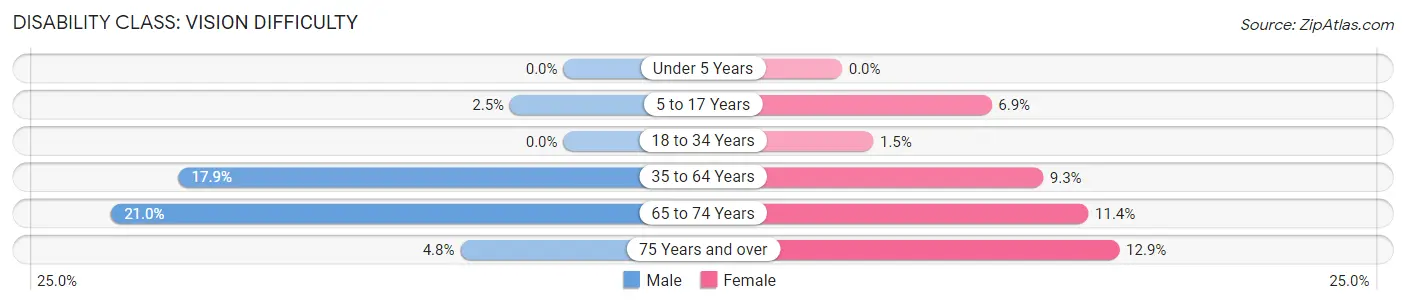
| Age Bracket | Male | Female |
| Under 5 Years | 0 (0.0%) | 0 (0.0%) |
| 5 to 17 Years | 11 (2.5%) | 29 (6.9%) |
| 18 to 34 Years | 0 (0.0%) | 7 (1.5%) |
| 35 to 64 Years | 216 (17.8%) | 110 (9.3%) |
| 65 to 74 Years | 94 (21.0%) | 52 (11.4%) |
| 75 Years and over | 11 (4.8%) | 39 (12.9%) |
Disability Class: Cognitive Difficulty
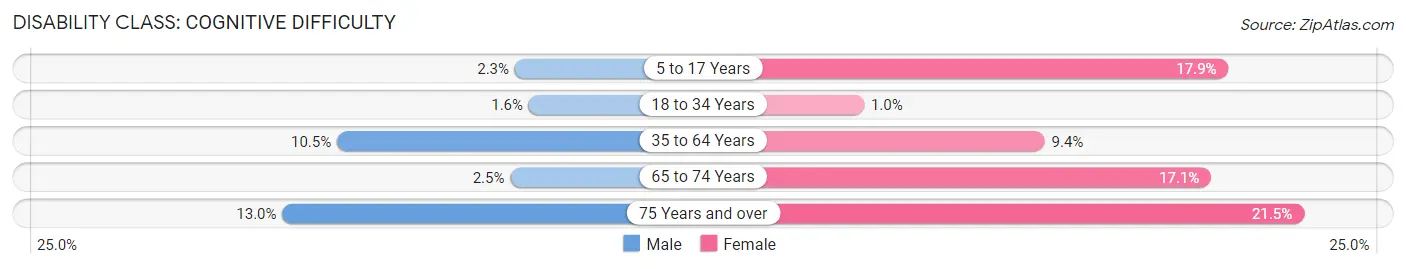
| Age Bracket | Male | Female |
| 5 to 17 Years | 10 (2.2%) | 75 (17.9%) |
| 18 to 34 Years | 9 (1.6%) | 5 (1.0%) |
| 35 to 64 Years | 127 (10.5%) | 111 (9.4%) |
| 65 to 74 Years | 11 (2.5%) | 78 (17.1%) |
| 75 Years and over | 30 (13.0%) | 65 (21.4%) |
Disability Class: Ambulatory Difficulty
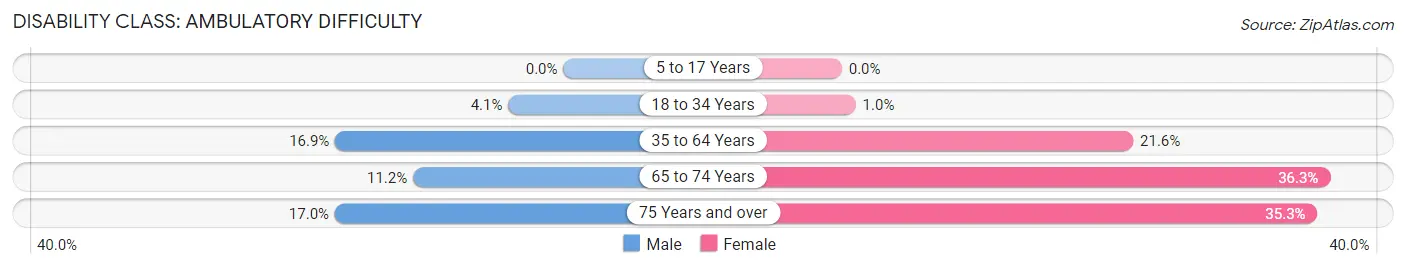
| Age Bracket | Male | Female |
| 5 to 17 Years | 0 (0.0%) | 0 (0.0%) |
| 18 to 34 Years | 23 (4.1%) | 5 (1.0%) |
| 35 to 64 Years | 205 (16.9%) | 255 (21.6%) |
| 65 to 74 Years | 50 (11.2%) | 165 (36.3%) |
| 75 Years and over | 39 (17.0%) | 107 (35.3%) |
Disability Class: Self-Care Difficulty
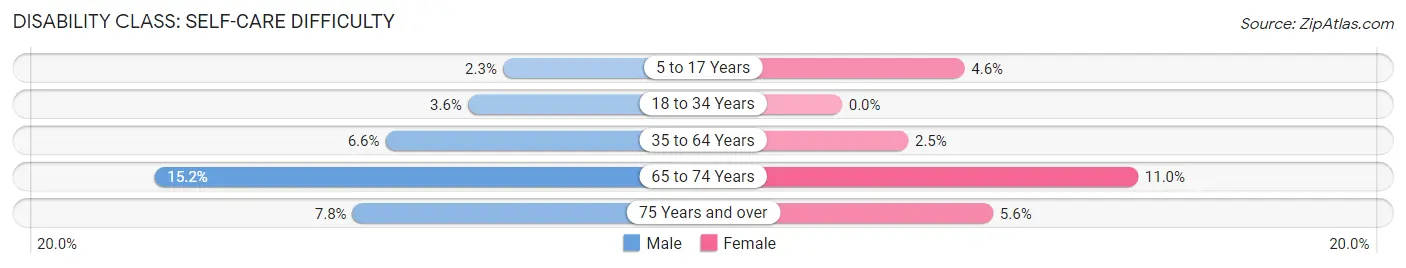
| Age Bracket | Male | Female |
| 5 to 17 Years | 10 (2.2%) | 19 (4.5%) |
| 18 to 34 Years | 20 (3.5%) | 0 (0.0%) |
| 35 to 64 Years | 80 (6.6%) | 29 (2.5%) |
| 65 to 74 Years | 68 (15.2%) | 50 (11.0%) |
| 75 Years and over | 18 (7.8%) | 17 (5.6%) |
Technology Access in Van Buren County
Computing Device Access in Van Buren County
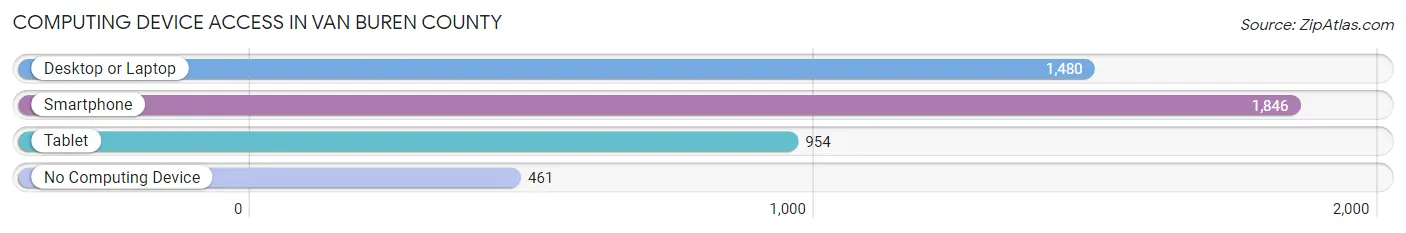
| Device Type | # Households | % Households |
| Desktop or Laptop | 1,480 | 60.8% |
| Smartphone | 1,846 | 75.8% |
| Tablet | 954 | 39.2% |
| No Computing Device | 461 | 18.9% |
| Total | 2,434 | 100.0% |
Internet Access in Van Buren County
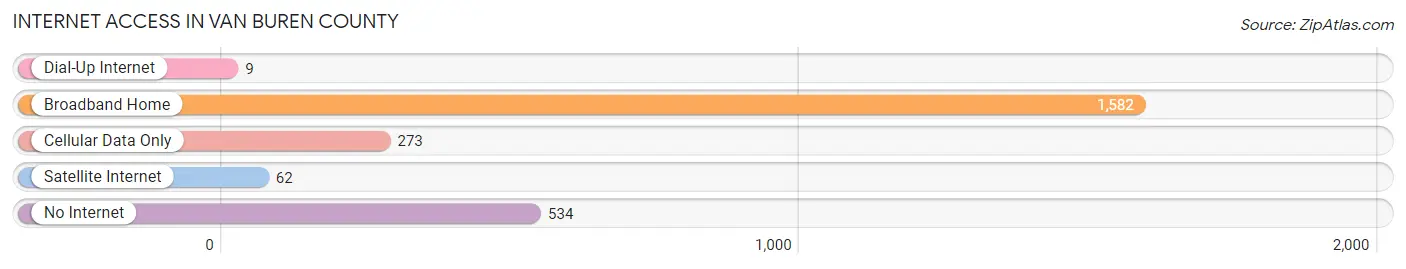
| Internet Type | # Households | % Households |
| Dial-Up Internet | 9 | 0.4% |
| Broadband Home | 1,582 | 65.0% |
| Cellular Data Only | 273 | 11.2% |
| Satellite Internet | 62 | 2.5% |
| No Internet | 534 | 21.9% |
| Total | 2,434 | 100.0% |
Van Buren County Summary
Van Buren County is located in the state of Tennessee, in the United States of America. It is situated in the Cumberland Plateau region of the state, and is bordered by White, Warren, and Putnam counties. The county seat is Spencer, and the county has a total area of 437 square miles. As of the 2010 census, the population of Van Buren County was 5,548, making it the second least populous county in Tennessee.
Van Buren County was established in 1840, and was named after Martin Van Buren, the eighth President of the United States. The county was formed from parts of White, Warren, and Putnam counties. The county was originally part of the Cherokee Nation, and was home to several Native American tribes, including the Cherokee, Chickasaw, and Choctaw.
The geography of Van Buren County is characterized by rolling hills and valleys, with the Cumberland Plateau to the east and the Sequatchie Valley to the west. The county is home to several rivers, including the Caney Fork, Collins, and Falling Water. The county is also home to several state parks, including Fall Creek Falls State Park, Rock Island State Park, and Savage Gulf State Natural Area.
The economy of Van Buren County is largely based on agriculture, with the county’s main crops being corn, soybeans, and hay. The county is also home to several manufacturing companies, including a furniture factory and a paper mill. The county is also home to several tourist attractions, including Fall Creek Falls State Park, Rock Island State Park, and Savage Gulf State Natural Area.
The demographics of Van Buren County are largely rural, with the majority of the population living in small towns and rural areas. The population is predominantly white, with a small African American population. The median household income in the county is $35,845, and the median age is 44. The county has a high rate of poverty, with 22.3% of the population living below the poverty line.
Van Buren County is a rural county with a rich history and a diverse economy. The county is home to several state parks and tourist attractions, and is a popular destination for outdoor recreation. The county is also home to several manufacturing companies, and is a major agricultural producer. The county’s demographics are largely rural, with a predominantly white population and a high rate of poverty.
Common Questions
What is the Total Population of Van Buren County?
Total Population of Van Buren County is 6,182.
What is the Total Male Population of Van Buren County?
Total Male Population of Van Buren County is 3,113.
What is the Total Female Population of Van Buren County?
Total Female Population of Van Buren County is 3,069.
What is the Ratio of Males per 100 Females in Van Buren County?
There are 101.43 Males per 100 Females in Van Buren County.
What is the Ratio of Females per 100 Males in Van Buren County?
There are 98.59 Females per 100 Males in Van Buren County.
What is the Median Population Age in Van Buren County?
Median Population Age in Van Buren County is 47.4 Years.
What is the Average Family Size in Van Buren County
Average Family Size in Van Buren County is 3.0 People.
What is the Average Household Size in Van Buren County
Average Household Size in Van Buren County is 2.5 People.
What is Per Capita Income in Van Buren County?
Per Capita income in Van Buren County is $24,099.
What is the Median Family Income in Van Buren County?
Median Family Income in Van Buren County is $61,563.
What is the Median Household income in Van Buren County?
Median Household Income in Van Buren County is $44,730.
What is Income or Wage Gap in Van Buren County?
Income or Wage Gap in Van Buren County is 16.7%.
Women in Van Buren County earn 83.3 cents for every dollar earned by a man.
What is Inequality or Gini Index in Van Buren County?
Inequality or Gini Index in Van Buren County is 0.43.
How Large is the Labor Force in Van Buren County?
There are 2,552 People in the Labor Forcein in Van Buren County.
What is the Percentage of People in the Labor Force in Van Buren County?
49.5% of People are in the Labor Force in Van Buren County.
What is the Unemployment Rate in Van Buren County?
Unemployment Rate in Van Buren County is 4.1%.