Union County, TN
Union County Map
Union County Overview
19,860
TOTAL POPULATION
9,880
MALE POPULATION
9,980
FEMALE POPULATION
99.00
MALES / 100 FEMALES
101.01
FEMALES / 100 MALES
42.6
MEDIAN AGE
2.9
AVG FAMILY SIZE
2.6
AVG HOUSEHOLD SIZE
$28,174
PER CAPITA INCOME
$63,792
AVG FAMILY INCOME
$57,094
AVG HOUSEHOLD INCOME
26.1%
WAGE / INCOME GAP [ % ]
73.9¢/ $1
WAGE / INCOME GAP [ $ ]
$9,786
FAMILY INCOME DEFICIT
0.44
INEQUALITY / GINI INDEX
8,674
LABOR FORCE [ PEOPLE ]
53.8%
PERCENT IN LABOR FORCE
5.7%
UNEMPLOYMENT RATE
Union County Area Codes
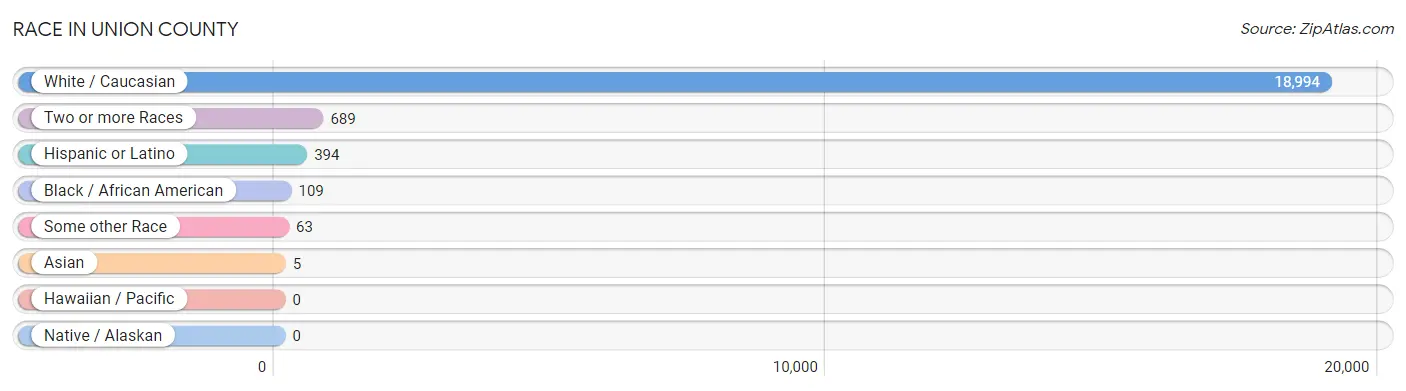
Race in Union County
The most populous races in Union County are White / Caucasian (18,994 | 95.6%), Two or more Races (689 | 3.5%), and Hispanic or Latino (394 | 2.0%).
| Race | # Population | % Population |
| Asian | 5 | 0.0% |
| Black / African American | 109 | 0.5% |
| Hawaiian / Pacific | 0 | 0.0% |
| Hispanic or Latino | 394 | 2.0% |
| Native / Alaskan | 0 | 0.0% |
| White / Caucasian | 18,994 | 95.6% |
| Two or more Races | 689 | 3.5% |
| Some other Race | 63 | 0.3% |
| Total | 19,860 | 100.0% |
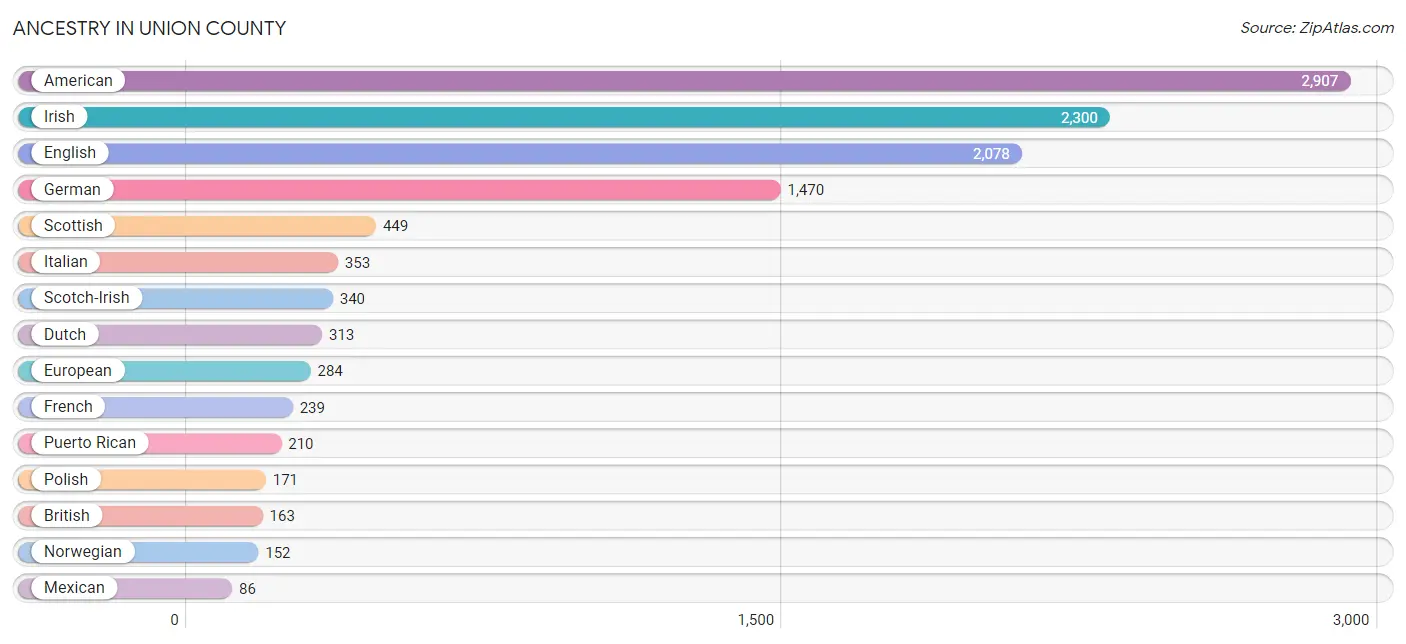
Ancestry in Union County
The most populous ancestries reported in Union County are American (2,907 | 14.6%), Irish (2,300 | 11.6%), English (2,078 | 10.5%), German (1,470 | 7.4%), and Scottish (449 | 2.3%), together accounting for 46.3% of all Union County residents.
| Ancestry | # Population | % Population |
| African | 18 | 0.1% |
| American | 2,907 | 14.6% |
| Arab | 33 | 0.2% |
| Austrian | 11 | 0.1% |
| British | 163 | 0.8% |
| Burmese | 6 | 0.0% |
| Canadian | 11 | 0.1% |
| Central American | 24 | 0.1% |
| Cherokee | 72 | 0.4% |
| Cuban | 21 | 0.1% |
| Dominican | 1 | 0.0% |
| Dutch | 313 | 1.6% |
| Dutch West Indian | 6 | 0.0% |
| Eastern European | 46 | 0.2% |
| English | 2,078 | 10.5% |
| European | 284 | 1.4% |
| Finnish | 4 | 0.0% |
| French | 239 | 1.2% |
| French Canadian | 49 | 0.3% |
| German | 1,470 | 7.4% |
| Greek | 14 | 0.1% |
| Guatemalan | 24 | 0.1% |
| Hungarian | 27 | 0.1% |
| Icelander | 6 | 0.0% |
| Irish | 2,300 | 11.6% |
| Italian | 353 | 1.8% |
| Korean | 2 | 0.0% |
| Lebanese | 33 | 0.2% |
| Mexican | 86 | 0.4% |
| Norwegian | 152 | 0.8% |
| Peruvian | 25 | 0.1% |
| Polish | 171 | 0.9% |
| Portuguese | 21 | 0.1% |
| Puerto Rican | 210 | 1.1% |
| Scandinavian | 30 | 0.2% |
| Scotch-Irish | 340 | 1.7% |
| Scottish | 449 | 2.3% |
| South American | 25 | 0.1% |
| Subsaharan African | 18 | 0.1% |
| Swedish | 32 | 0.2% |
| Thai | 1 | 0.0% |
| Turkish | 7 | 0.0% |
| Welsh | 49 | 0.3% | View All 43 Rows |
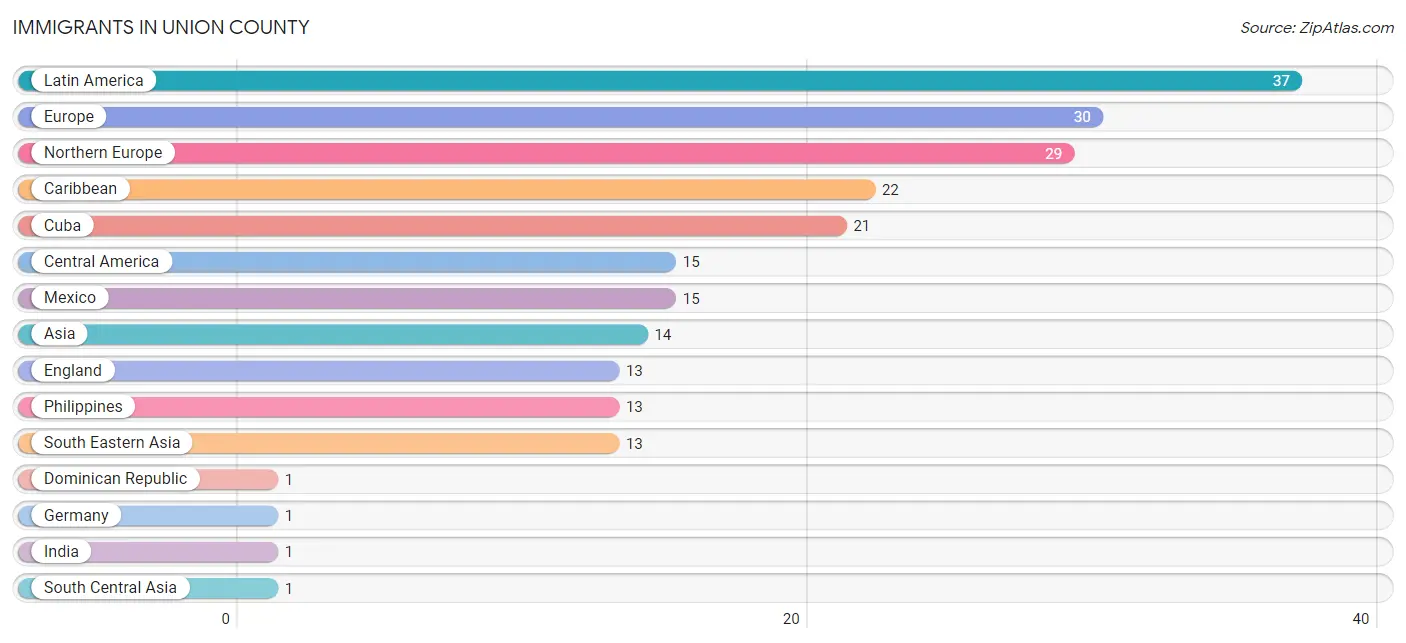
Immigrants in Union County
The most numerous immigrant groups reported in Union County came from Latin America (37 | 0.2%), Europe (30 | 0.2%), Northern Europe (29 | 0.2%), Caribbean (22 | 0.1%), and Cuba (21 | 0.1%), together accounting for 0.7% of all Union County residents.
| Immigration Origin | # Population | % Population |
| Asia | 14 | 0.1% |
| Caribbean | 22 | 0.1% |
| Central America | 15 | 0.1% |
| Cuba | 21 | 0.1% |
| Dominican Republic | 1 | 0.0% |
| England | 13 | 0.1% |
| Europe | 30 | 0.2% |
| Germany | 1 | 0.0% |
| India | 1 | 0.0% |
| Latin America | 37 | 0.2% |
| Mexico | 15 | 0.1% |
| Northern Europe | 29 | 0.2% |
| Philippines | 13 | 0.1% |
| South Central Asia | 1 | 0.0% |
| South Eastern Asia | 13 | 0.1% |
| Western Europe | 1 | 0.0% | View All 16 Rows |
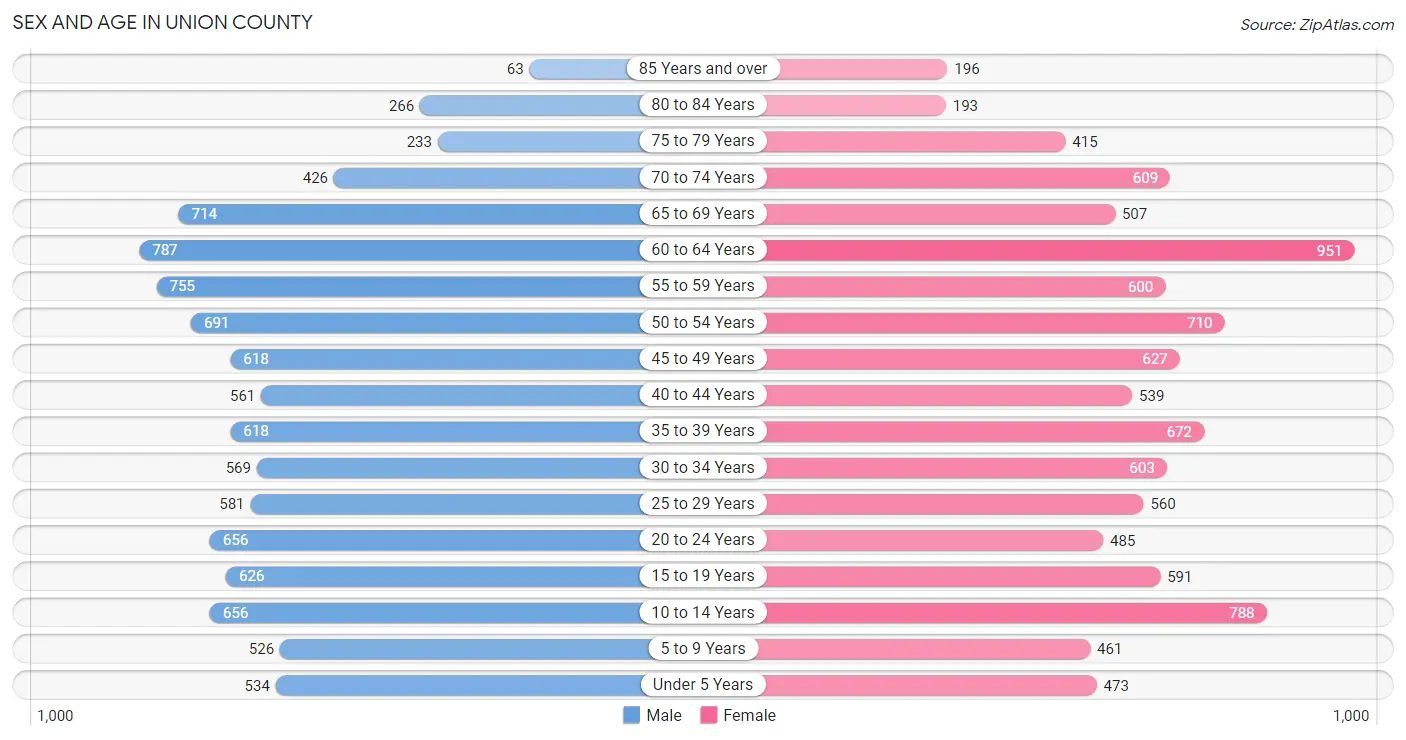
Sex and Age in Union County
Sex and Age in Union County
The most populous age groups in Union County are 60 to 64 Years (787 | 8.0%) for men and 60 to 64 Years (951 | 9.5%) for women.
| Age Bracket | Male | Female |
| Under 5 Years | 534 (5.4%) | 473 (4.7%) |
| 5 to 9 Years | 526 (5.3%) | 461 (4.6%) |
| 10 to 14 Years | 656 (6.6%) | 788 (7.9%) |
| 15 to 19 Years | 626 (6.3%) | 591 (5.9%) |
| 20 to 24 Years | 656 (6.6%) | 485 (4.9%) |
| 25 to 29 Years | 581 (5.9%) | 560 (5.6%) |
| 30 to 34 Years | 569 (5.8%) | 603 (6.0%) |
| 35 to 39 Years | 618 (6.3%) | 672 (6.7%) |
| 40 to 44 Years | 561 (5.7%) | 539 (5.4%) |
| 45 to 49 Years | 618 (6.3%) | 627 (6.3%) |
| 50 to 54 Years | 691 (7.0%) | 710 (7.1%) |
| 55 to 59 Years | 755 (7.6%) | 600 (6.0%) |
| 60 to 64 Years | 787 (8.0%) | 951 (9.5%) |
| 65 to 69 Years | 714 (7.2%) | 507 (5.1%) |
| 70 to 74 Years | 426 (4.3%) | 609 (6.1%) |
| 75 to 79 Years | 233 (2.4%) | 415 (4.2%) |
| 80 to 84 Years | 266 (2.7%) | 193 (1.9%) |
| 85 Years and over | 63 (0.6%) | 196 (2.0%) |
| Total | 9,880 (100.0%) | 9,980 (100.0%) |
Families and Households in Union County
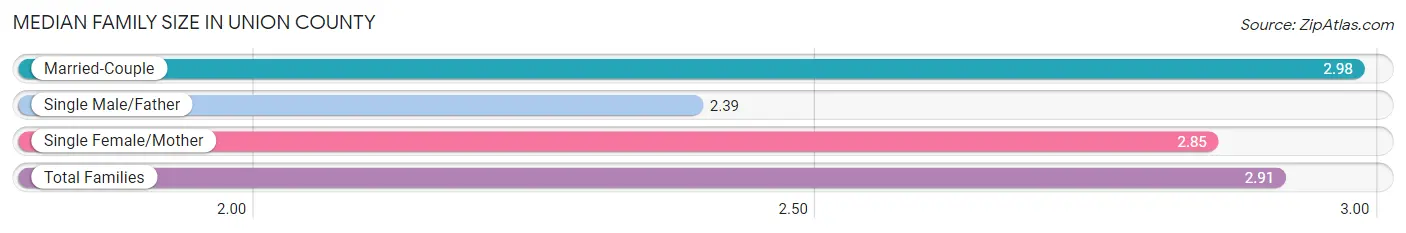
Median Family Size in Union County
The median family size in Union County is 2.91 persons per family, with married-couple families (4,289 | 74.2%) accounting for the largest median family size of 2.98 persons per family. On the other hand, single male/father families (447 | 7.7%) represent the smallest median family size with 2.39 persons per family.
| Family Type | # Families | Family Size |
| Married-Couple | 4,289 (74.2%) | 2.98 |
| Single Male/Father | 447 (7.7%) | 2.39 |
| Single Female/Mother | 1,048 (18.1%) | 2.85 |
| Total Families | 5,784 (100.0%) | 2.91 |
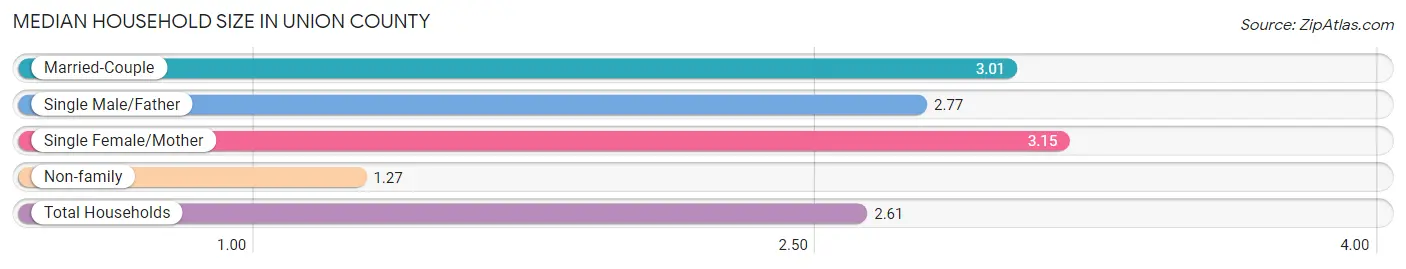
Median Household Size in Union County
The median household size in Union County is 2.61 persons per household, with single female/mother households (1,048 | 13.9%) accounting for the largest median household size of 3.15 persons per household. non-family households (1,768 | 23.4%) represent the smallest median household size with 1.27 persons per household.
| Household Type | # Households | Household Size |
| Married-Couple | 4,289 (56.8%) | 3.01 |
| Single Male/Father | 447 (5.9%) | 2.77 |
| Single Female/Mother | 1,048 (13.9%) | 3.15 |
| Non-family | 1,768 (23.4%) | 1.27 |
| Total Households | 7,552 (100.0%) | 2.61 |
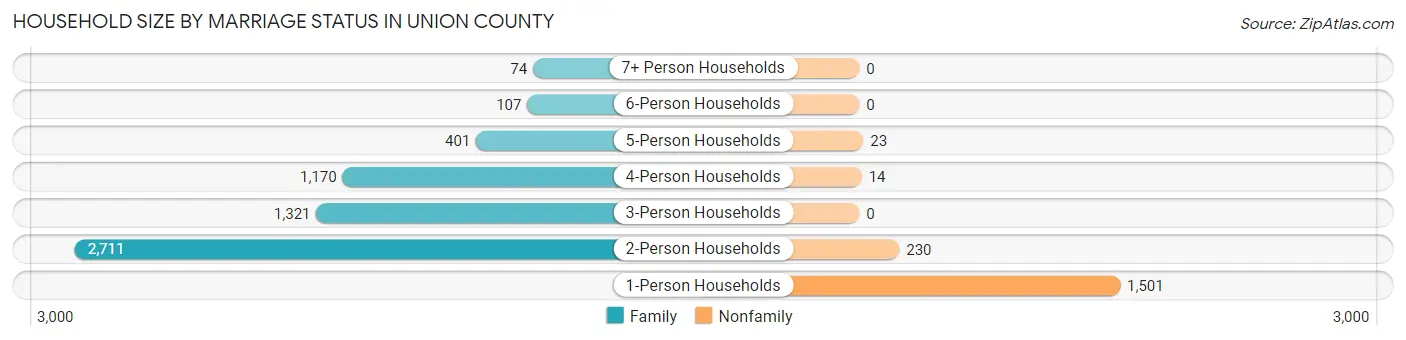
Household Size by Marriage Status in Union County
Out of a total of 7,552 households in Union County, 5,784 (76.6%) are family households, while 1,768 (23.4%) are nonfamily households. The most numerous type of family households are 2-person households, comprising 2,711, and the most common type of nonfamily households are 1-person households, comprising 1,501.
| Household Size | Family Households | Nonfamily Households |
| 1-Person Households | - | 1,501 (19.9%) |
| 2-Person Households | 2,711 (35.9%) | 230 (3.0%) |
| 3-Person Households | 1,321 (17.5%) | 0 (0.0%) |
| 4-Person Households | 1,170 (15.5%) | 14 (0.2%) |
| 5-Person Households | 401 (5.3%) | 23 (0.3%) |
| 6-Person Households | 107 (1.4%) | 0 (0.0%) |
| 7+ Person Households | 74 (1.0%) | 0 (0.0%) |
| Total | 5,784 (76.6%) | 1,768 (23.4%) |
Female Fertility in Union County
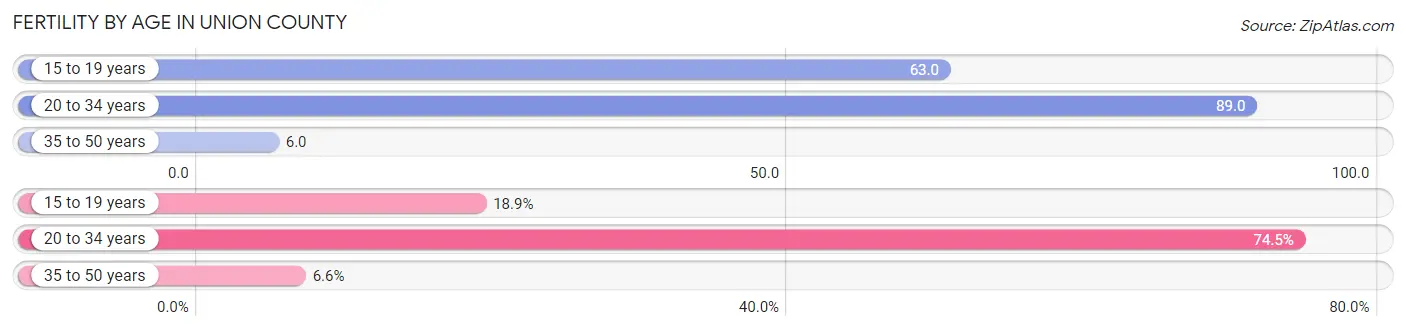
Fertility by Age in Union County
Average fertility rate in Union County is 46.0 births per 1,000 women. Women in the age bracket of 20 to 34 years have the highest fertility rate with 89.0 births per 1,000 women. Women in the age bracket of 20 to 34 years acount for 74.5% of all women with births.
| Age Bracket | Women with Births | Births / 1,000 Women |
| 15 to 19 years | 37 (18.9%) | 63.0 |
| 20 to 34 years | 146 (74.5%) | 89.0 |
| 35 to 50 years | 13 (6.6%) | 6.0 |
| Total | 196 (100.0%) | 46.0 |
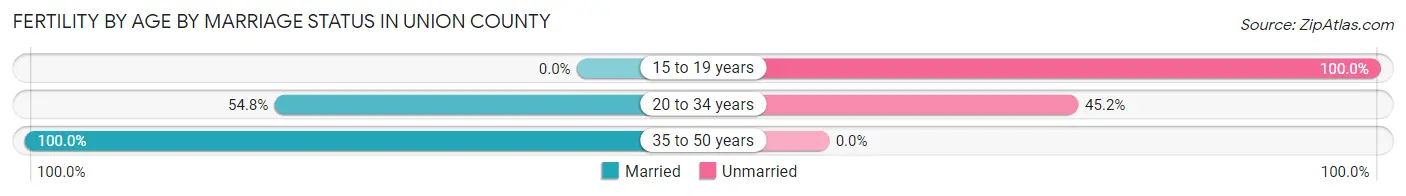
Fertility by Age by Marriage Status in Union County
47.4% of women with births (196) in Union County are married. The highest percentage of unmarried women with births falls into 15 to 19 years age bracket with 100.0% of them unmarried at the time of birth, while the lowest percentage of unmarried women with births belong to 35 to 50 years age bracket with 0.0% of them unmarried.
| Age Bracket | Married | Unmarried |
| 15 to 19 years | 0 (0.0%) | 37 (100.0%) |
| 20 to 34 years | 80 (54.8%) | 66 (45.2%) |
| 35 to 50 years | 13 (100.0%) | 0 (0.0%) |
| Total | 93 (47.4%) | 103 (52.5%) |
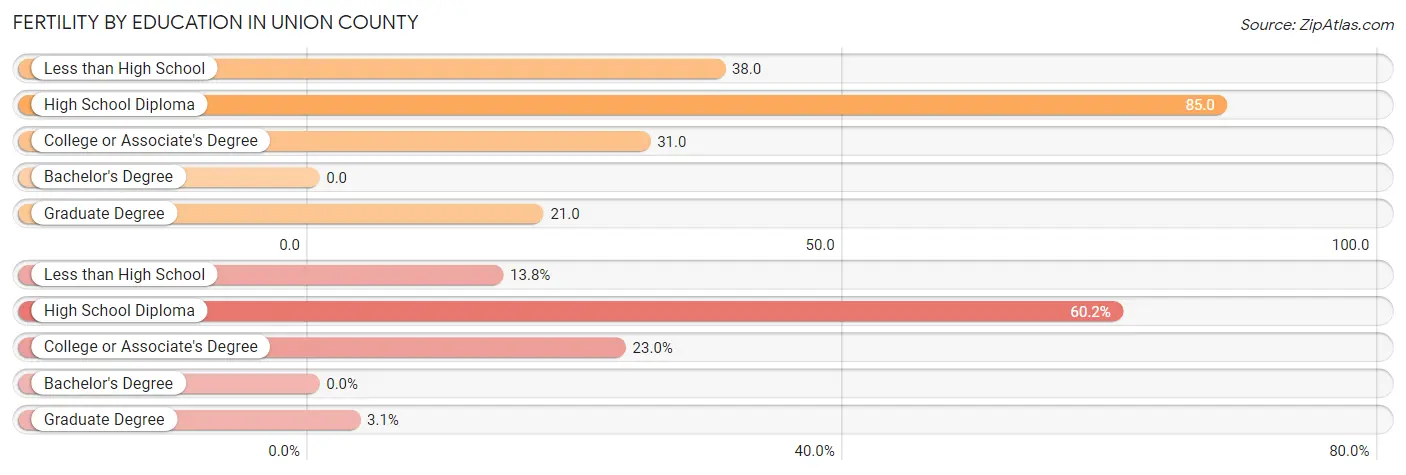
Fertility by Education in Union County
| Educational Attainment | Women with Births | Births / 1,000 Women |
| Less than High School | 27 (13.8%) | 38.0 |
| High School Diploma | 118 (60.2%) | 85.0 |
| College or Associate's Degree | 45 (23.0%) | 31.0 |
| Bachelor's Degree | 0 (0.0%) | 0.0 |
| Graduate Degree | 6 (3.1%) | 21.0 |
| Total | 196 (100.0%) | 46.0 |
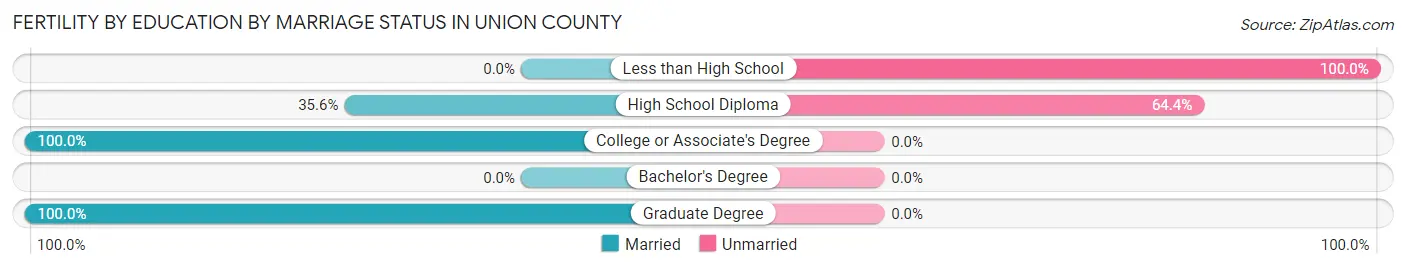
Fertility by Education by Marriage Status in Union County
52.5% of women with births in Union County are unmarried. Women with the educational attainment of college or associate's degree are most likely to be married with 100.0% of them married at childbirth, while women with the educational attainment of less than high school are least likely to be married with 100.0% of them unmarried at childbirth.
| Educational Attainment | Married | Unmarried |
| Less than High School | 0 (0.0%) | 27 (100.0%) |
| High School Diploma | 42 (35.6%) | 76 (64.4%) |
| College or Associate's Degree | 45 (100.0%) | 0 (0.0%) |
| Bachelor's Degree | 0 (0.0%) | 0 (0.0%) |
| Graduate Degree | 6 (100.0%) | 0 (0.0%) |
| Total | 93 (47.4%) | 103 (52.5%) |
Income in Union County
Income Overview in Union County
Per Capita Income in Union County is $28,174, while median incomes of families and households are $63,792 and $57,094 respectively.
| Characteristic | Number | Measure |
| Per Capita Income | 19,860 | $28,174 |
| Median Family Income | 5,784 | $63,792 |
| Mean Family Income | 5,784 | $78,103 |
| Median Household Income | 7,552 | $57,094 |
| Mean Household Income | 7,552 | $72,397 |
| Income Deficit | 5,784 | $9,786 |
| Wage / Income Gap (%) | 19,860 | 26.07% |
| Wage / Income Gap ($) | 19,860 | 73.93¢ per $1 |
| Gini / Inequality Index | 19,860 | 0.44 |
Earnings by Sex in Union County
Average Earnings in Union County are $34,610, $40,823 for men and $30,180 for women, a difference of 26.1%.
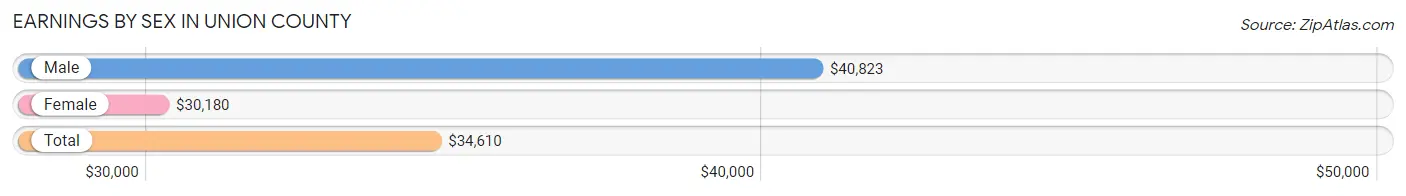
| Sex | Number | Average Earnings |
| Male | 4,894 (54.8%) | $40,823 |
| Female | 4,038 (45.2%) | $30,180 |
| Total | 8,932 (100.0%) | $34,610 |
Earnings by Sex by Income Bracket in Union County
The most common earnings brackets in Union County are $45,000 to $49,999 for men (550 | 11.2%) and $30,000 to $34,999 for women (433 | 10.7%).
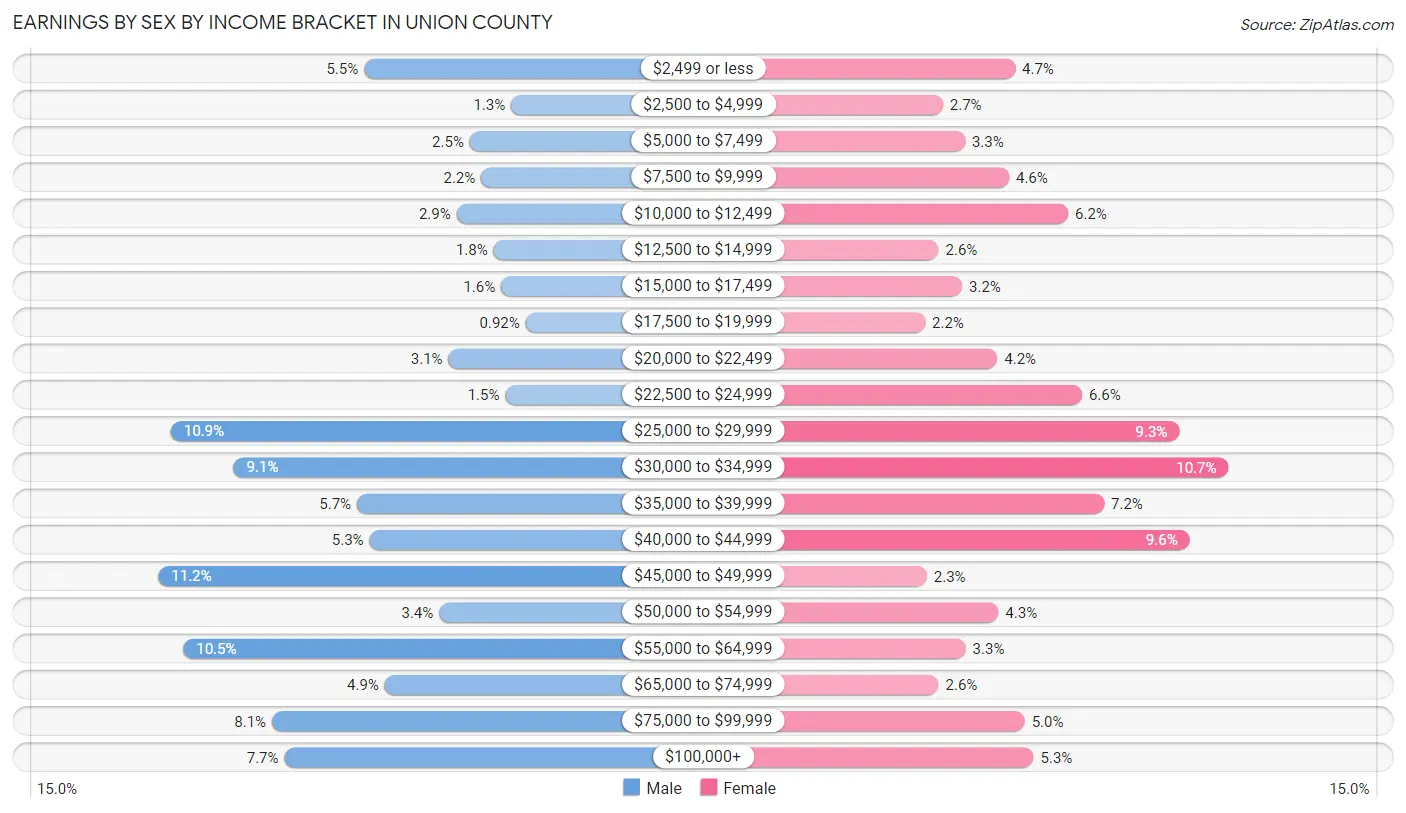
| Income | Male | Female |
| $2,499 or less | 267 (5.5%) | 191 (4.7%) |
| $2,500 to $4,999 | 65 (1.3%) | 109 (2.7%) |
| $5,000 to $7,499 | 122 (2.5%) | 134 (3.3%) |
| $7,500 to $9,999 | 106 (2.2%) | 184 (4.6%) |
| $10,000 to $12,499 | 140 (2.9%) | 251 (6.2%) |
| $12,500 to $14,999 | 89 (1.8%) | 104 (2.6%) |
| $15,000 to $17,499 | 79 (1.6%) | 131 (3.2%) |
| $17,500 to $19,999 | 45 (0.9%) | 89 (2.2%) |
| $20,000 to $22,499 | 151 (3.1%) | 171 (4.2%) |
| $22,500 to $24,999 | 73 (1.5%) | 267 (6.6%) |
| $25,000 to $29,999 | 533 (10.9%) | 377 (9.3%) |
| $30,000 to $34,999 | 447 (9.1%) | 433 (10.7%) |
| $35,000 to $39,999 | 277 (5.7%) | 292 (7.2%) |
| $40,000 to $44,999 | 260 (5.3%) | 389 (9.6%) |
| $45,000 to $49,999 | 550 (11.2%) | 91 (2.2%) |
| $50,000 to $54,999 | 164 (3.4%) | 172 (4.3%) |
| $55,000 to $64,999 | 516 (10.5%) | 135 (3.3%) |
| $65,000 to $74,999 | 239 (4.9%) | 104 (2.6%) |
| $75,000 to $99,999 | 394 (8.1%) | 202 (5.0%) |
| $100,000+ | 377 (7.7%) | 212 (5.2%) |
| Total | 4,894 (100.0%) | 4,038 (100.0%) |
Earnings by Sex by Educational Attainment in Union County
Average earnings in Union County are $45,478 for men and $33,695 for women, a difference of 25.9%. Men with an educational attainment of graduate degree enjoy the highest average annual earnings of $91,736, while those with less than high school education earn the least with $33,580. Women with an educational attainment of graduate degree earn the most with the average annual earnings of $68,833, while those with less than high school education have the smallest earnings of $23,750.
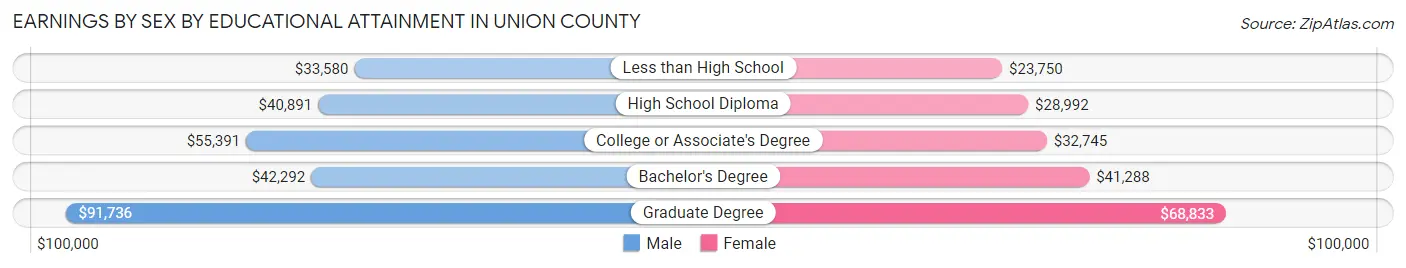
| Educational Attainment | Male Income | Female Income |
| Less than High School | $33,580 | $23,750 |
| High School Diploma | $40,891 | $28,992 |
| College or Associate's Degree | $55,391 | $32,745 |
| Bachelor's Degree | $42,292 | $41,288 |
| Graduate Degree | $91,736 | $68,833 |
| Total | $45,478 | $33,695 |
Family Income in Union County
Family Income Brackets in Union County
According to the Union County family income data, there are 1,076 families falling into the $50,000 to $74,999 income range, which is the most common income bracket and makes up 18.6% of all families. Conversely, the $200,000+ income bracket is the least frequent group with only 197 families (3.4%) belonging to this category.
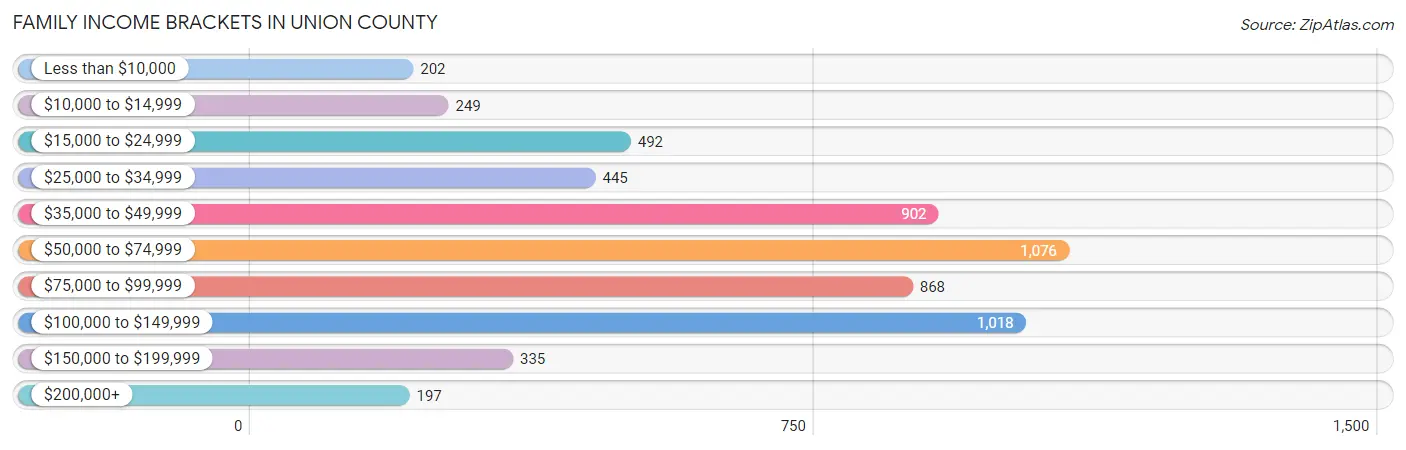
| Income Bracket | # Families | % Families |
| Less than $10,000 | 202 | 3.5% |
| $10,000 to $14,999 | 249 | 4.3% |
| $15,000 to $24,999 | 492 | 8.5% |
| $25,000 to $34,999 | 445 | 7.7% |
| $35,000 to $49,999 | 902 | 15.6% |
| $50,000 to $74,999 | 1,076 | 18.6% |
| $75,000 to $99,999 | 868 | 15.0% |
| $100,000 to $149,999 | 1,018 | 17.6% |
| $150,000 to $199,999 | 335 | 5.8% |
| $200,000+ | 197 | 3.4% |
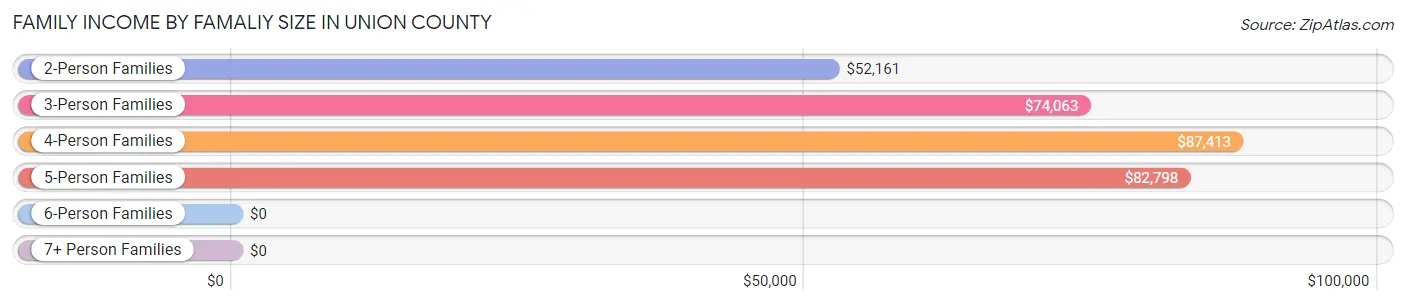
Family Income by Famaliy Size in Union County
4-person families (1,051 | 18.2%) account for the highest median family income in Union County with $87,413 per family, while 2-person families (2,941 | 50.8%) have the highest median income of $26,080 per family member.
| Income Bracket | # Families | Median Income |
| 2-Person Families | 2,941 (50.8%) | $52,161 |
| 3-Person Families | 1,242 (21.5%) | $74,063 |
| 4-Person Families | 1,051 (18.2%) | $87,413 |
| 5-Person Families | 391 (6.8%) | $82,798 |
| 6-Person Families | 146 (2.5%) | $0 |
| 7+ Person Families | 13 (0.2%) | $0 |
| Total | 5,784 (100.0%) | $63,792 |
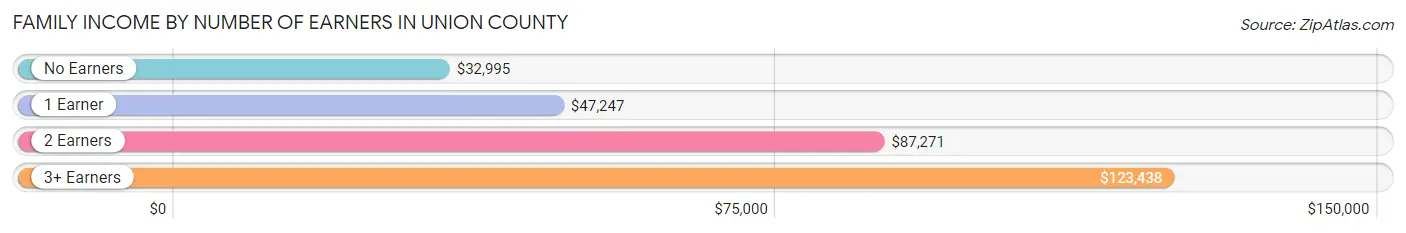
Family Income by Number of Earners in Union County
The median family income in Union County is $63,792, with families comprising 3+ earners (513) having the highest median family income of $123,438, while families with no earners (1,485) have the lowest median family income of $32,995, accounting for 8.9% and 25.7% of families, respectively.
| Number of Earners | # Families | Median Income |
| No Earners | 1,485 (25.7%) | $32,995 |
| 1 Earner | 1,965 (34.0%) | $47,247 |
| 2 Earners | 1,821 (31.5%) | $87,271 |
| 3+ Earners | 513 (8.9%) | $123,438 |
| Total | 5,784 (100.0%) | $63,792 |
Household Income in Union County
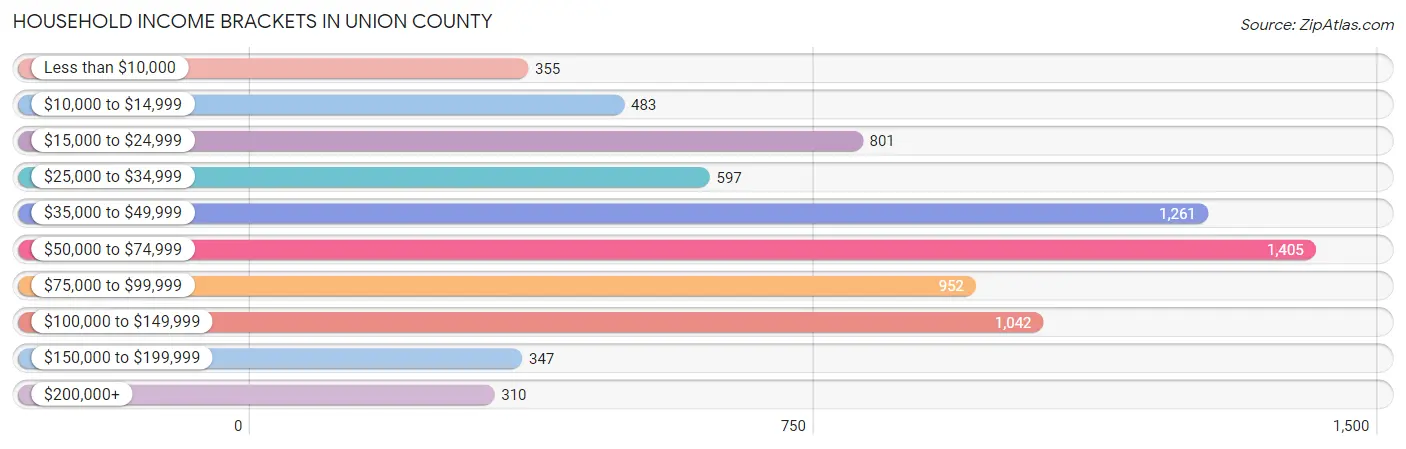
Household Income Brackets in Union County
With 1,405 households falling in the category, the $50,000 to $74,999 income range is the most frequent in Union County, accounting for 18.6% of all households. In contrast, only 310 households (4.1%) fall into the $200,000+ income bracket, making it the least populous group.
| Income Bracket | # Households | % Households |
| Less than $10,000 | 355 | 4.7% |
| $10,000 to $14,999 | 483 | 6.4% |
| $15,000 to $24,999 | 801 | 10.6% |
| $25,000 to $34,999 | 597 | 7.9% |
| $35,000 to $49,999 | 1,261 | 16.7% |
| $50,000 to $74,999 | 1,405 | 18.6% |
| $75,000 to $99,999 | 952 | 12.6% |
| $100,000 to $149,999 | 1,042 | 13.8% |
| $150,000 to $199,999 | 347 | 4.6% |
| $200,000+ | 310 | 4.1% |
Household Income by Householder Age in Union County
The median household income in Union County is $57,094, with the highest median household income of $72,721 found in the 25 to 44 years age bracket for the primary householder. A total of 2,088 households (27.7%) fall into this category. Meanwhile, the 65+ years age bracket for the primary householder has the lowest median household income of $44,063, with 2,312 households (30.6%) in this group.

| Income Bracket | # Households | Median Income |
| 15 to 24 Years | 198 (2.6%) | $46,085 |
| 25 to 44 Years | 2,088 (27.7%) | $72,721 |
| 45 to 64 Years | 2,954 (39.1%) | $57,529 |
| 65+ Years | 2,312 (30.6%) | $44,063 |
| Total | 7,552 (100.0%) | $57,094 |
Poverty in Union County
Income Below Poverty by Sex and Age in Union County
With 13.7% poverty level for males and 18.0% for females among the residents of Union County, 6 to 11 year old males and 5 year old females are the most vulnerable to poverty, with 207 males (27.2%) and 42 females (44.7%) in their respective age groups living below the poverty level.

| Age Bracket | Male | Female |
| Under 5 Years | 139 (26.4%) | 137 (29.8%) |
| 5 Years | 0 (0.0%) | 42 (44.7%) |
| 6 to 11 Years | 207 (27.2%) | 193 (23.4%) |
| 12 to 14 Years | 62 (19.0%) | 61 (19.4%) |
| 15 Years | 22 (14.3%) | 2 (1.4%) |
| 16 and 17 Years | 28 (10.7%) | 52 (19.6%) |
| 18 to 24 Years | 48 (5.6%) | 177 (26.6%) |
| 25 to 34 Years | 63 (5.6%) | 183 (15.8%) |
| 35 to 44 Years | 111 (9.6%) | 153 (12.7%) |
| 45 to 54 Years | 158 (12.2%) | 274 (20.6%) |
| 55 to 64 Years | 323 (21.3%) | 289 (18.9%) |
| 65 to 74 Years | 122 (10.8%) | 132 (11.8%) |
| 75 Years and over | 41 (7.3%) | 91 (11.6%) |
| Total | 1,324 (13.7%) | 1,786 (18.0%) |
Income Above Poverty by Sex and Age in Union County
According to the poverty statistics in Union County, males aged 5 years and females aged 15 years are the age groups that are most secure financially, with 100.0% of males and 98.6% of females in these age groups living above the poverty line.

| Age Bracket | Male | Female |
| Under 5 Years | 387 (73.6%) | 322 (70.2%) |
| 5 Years | 17 (100.0%) | 52 (55.3%) |
| 6 to 11 Years | 553 (72.8%) | 630 (76.5%) |
| 12 to 14 Years | 264 (81.0%) | 254 (80.6%) |
| 15 Years | 132 (85.7%) | 143 (98.6%) |
| 16 and 17 Years | 234 (89.3%) | 214 (80.4%) |
| 18 to 24 Years | 813 (94.4%) | 488 (73.4%) |
| 25 to 34 Years | 1,060 (94.4%) | 975 (84.2%) |
| 35 to 44 Years | 1,043 (90.4%) | 1,053 (87.3%) |
| 45 to 54 Years | 1,133 (87.8%) | 1,057 (79.4%) |
| 55 to 64 Years | 1,193 (78.7%) | 1,241 (81.1%) |
| 65 to 74 Years | 1,006 (89.2%) | 984 (88.2%) |
| 75 Years and over | 517 (92.6%) | 696 (88.4%) |
| Total | 8,352 (86.3%) | 8,109 (82.0%) |
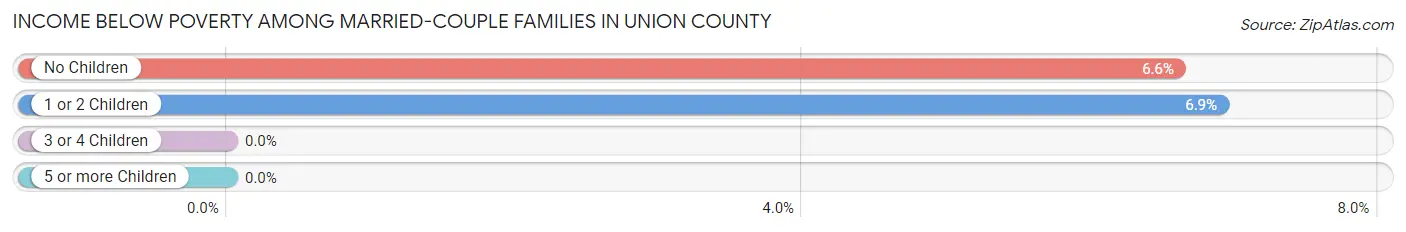
Income Below Poverty Among Married-Couple Families in Union County
The poverty statistics for married-couple families in Union County show that 6.3% or 269 of the total 4,289 families live below the poverty line. Families with 1 or 2 children have the highest poverty rate of 6.9%, comprising of 97 families. On the other hand, families with 3 or 4 children have the lowest poverty rate of 0.0%, which includes 0 families.
| Children | Above Poverty | Below Poverty |
| No Children | 2,434 (93.4%) | 172 (6.6%) |
| 1 or 2 Children | 1,309 (93.1%) | 97 (6.9%) |
| 3 or 4 Children | 277 (100.0%) | 0 (0.0%) |
| 5 or more Children | 0 (0.0%) | 0 (0.0%) |
| Total | 4,020 (93.7%) | 269 (6.3%) |
Income Below Poverty Among Single-Parent Households in Union County
According to the poverty data in Union County, 32.0% or 143 single-father households and 37.3% or 391 single-mother households are living below the poverty line. Among single-father households, those with 1 or 2 children have the highest poverty rate, with 84 households (37.2%) experiencing poverty. Likewise, among single-mother households, those with 3 or 4 children have the highest poverty rate, with 169 households (89.4%) falling below the poverty line.

| Children | Single Father | Single Mother |
| No Children | 59 (27.1%) | 39 (7.8%) |
| 1 or 2 Children | 84 (37.2%) | 183 (51.3%) |
| 3 or 4 Children | 0 (0.0%) | 169 (89.4%) |
| 5 or more Children | 0 (0.0%) | 0 (0.0%) |
| Total | 143 (32.0%) | 391 (37.3%) |
Income Below Poverty Among Married-Couple vs Single-Parent Households in Union County
The poverty data for Union County shows that 269 of the married-couple family households (6.3%) and 534 of the single-parent households (35.7%) are living below the poverty level. Within the married-couple family households, those with 1 or 2 children have the highest poverty rate, with 97 households (6.9%) falling below the poverty line. Among the single-parent households, those with 3 or 4 children have the highest poverty rate, with 169 household (88.0%) living below poverty.
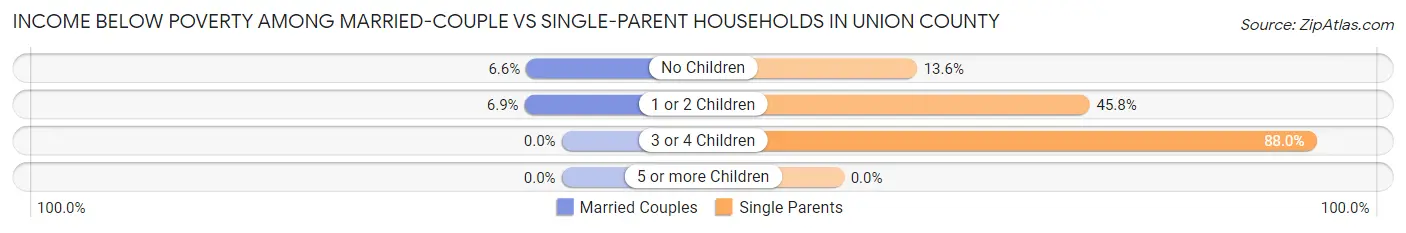
| Children | Married-Couple Families | Single-Parent Households |
| No Children | 172 (6.6%) | 98 (13.6%) |
| 1 or 2 Children | 97 (6.9%) | 267 (45.8%) |
| 3 or 4 Children | 0 (0.0%) | 169 (88.0%) |
| 5 or more Children | 0 (0.0%) | 0 (0.0%) |
| Total | 269 (6.3%) | 534 (35.7%) |
Employment Characteristics in Union County
Employment by Class of Employer in Union County
Among the 8,124 employed individuals in Union County, private company employees (5,859 | 72.1%), self-employed (not incorporated) (676 | 8.3%), and local government employees (669 | 8.2%) make up the most common classes of employment.
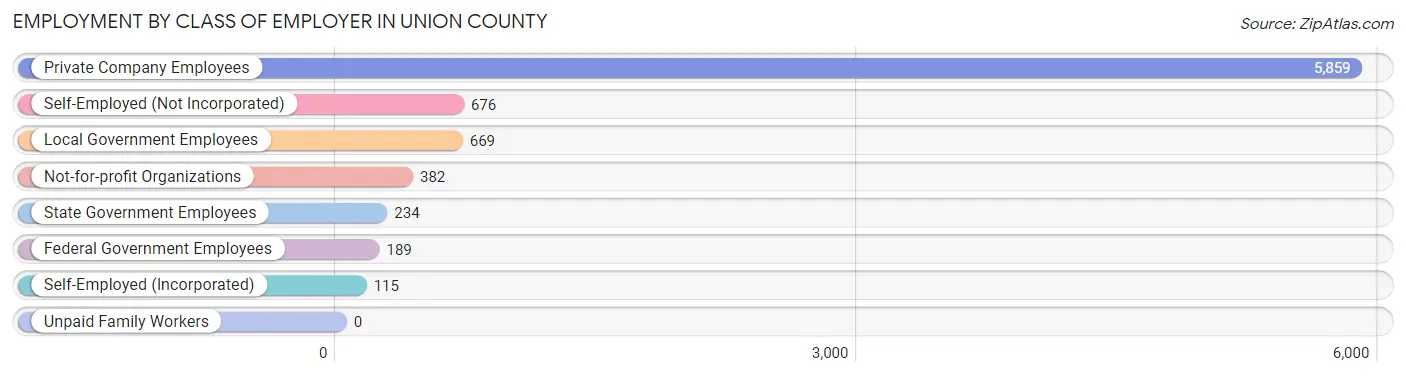
| Employer Class | # Employees | % Employees |
| Private Company Employees | 5,859 | 72.1% |
| Self-Employed (Incorporated) | 115 | 1.4% |
| Self-Employed (Not Incorporated) | 676 | 8.3% |
| Not-for-profit Organizations | 382 | 4.7% |
| Local Government Employees | 669 | 8.2% |
| State Government Employees | 234 | 2.9% |
| Federal Government Employees | 189 | 2.3% |
| Unpaid Family Workers | 0 | 0.0% |
| Total | 8,124 | 100.0% |
Employment Status by Age in Union County
According to the labor force statistics for Union County, out of the total population over 16 years of age (16,123), 53.8% or 8,674 individuals are in the labor force, with 5.7% or 494 of them unemployed. The age group with the highest labor force participation rate is 30 to 34 years, with 83.1% or 974 individuals in the labor force. Within the labor force, the 75 years and over age range has the highest percentage of unemployed individuals, with 47.0% or 54 of them being unemployed.
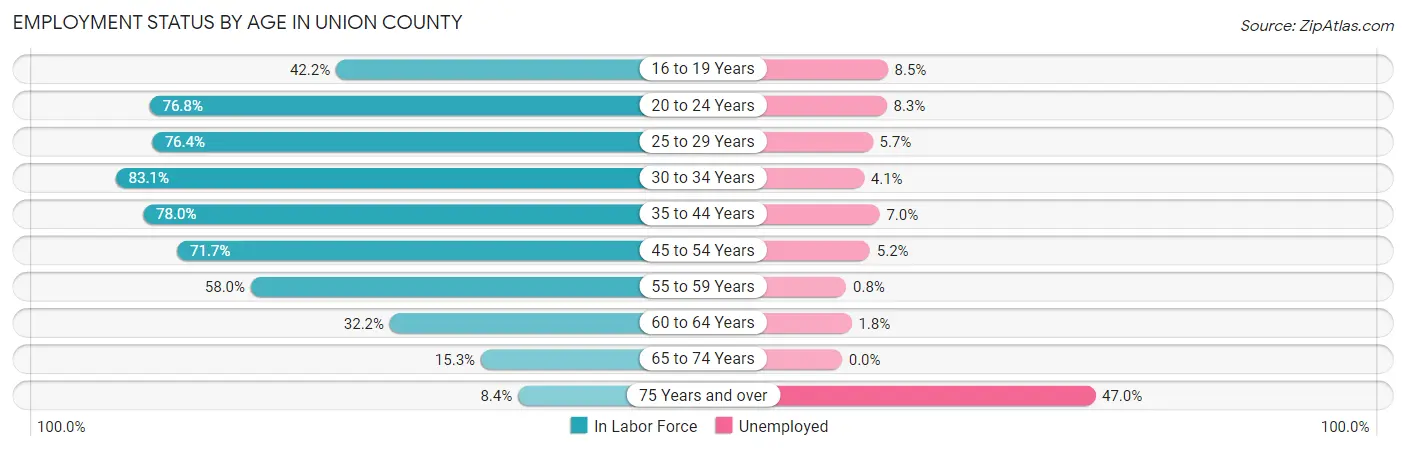
| Age Bracket | In Labor Force | Unemployed |
| 16 to 19 Years | 387 (42.2%) | 33 (8.5%) |
| 20 to 24 Years | 876 (76.8%) | 73 (8.3%) |
| 25 to 29 Years | 872 (76.4%) | 50 (5.7%) |
| 30 to 34 Years | 974 (83.1%) | 40 (4.1%) |
| 35 to 44 Years | 1,864 (78.0%) | 130 (7.0%) |
| 45 to 54 Years | 1,897 (71.7%) | 99 (5.2%) |
| 55 to 59 Years | 786 (58.0%) | 6 (0.8%) |
| 60 to 64 Years | 560 (32.2%) | 10 (1.8%) |
| 65 to 74 Years | 345 (15.3%) | 0 (0.0%) |
| 75 Years and over | 115 (8.4%) | 54 (47.0%) |
| Total | 8,674 (53.8%) | 494 (5.7%) |
Employment Status by Educational Attainment in Union County
According to labor force statistics for Union County, 66.6% of individuals (6,954) out of the total population between 25 and 64 years of age (10,442) are in the labor force, with 4.8% or 334 of them being unemployed. The group with the highest labor force participation rate are those with the educational attainment of bachelor's degree or higher, with 75.6% or 943 individuals in the labor force. Within the labor force, individuals with college / associate degree education have the highest percentage of unemployment, with 7.7% or 152 of them being unemployed.
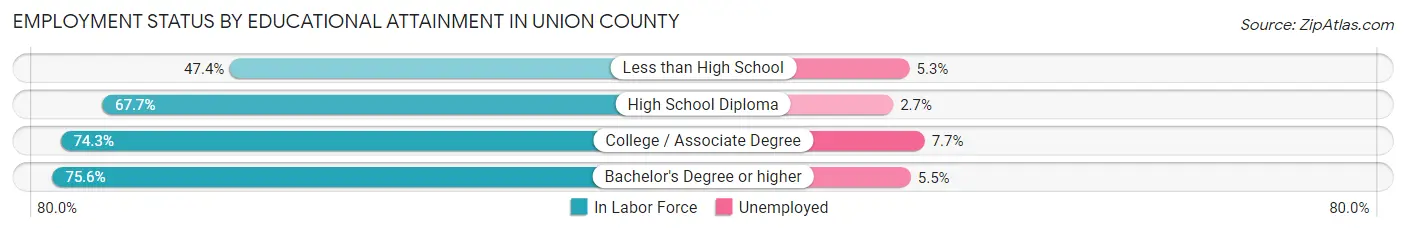
| Educational Attainment | In Labor Force | Unemployed |
| Less than High School | 913 (47.4%) | 102 (5.3%) |
| High School Diploma | 3,124 (67.7%) | 125 (2.7%) |
| College / Associate Degree | 1,971 (74.3%) | 204 (7.7%) |
| Bachelor's Degree or higher | 943 (75.6%) | 69 (5.5%) |
| Total | 6,954 (66.6%) | 501 (4.8%) |
Employment Occupations by Sex in Union County
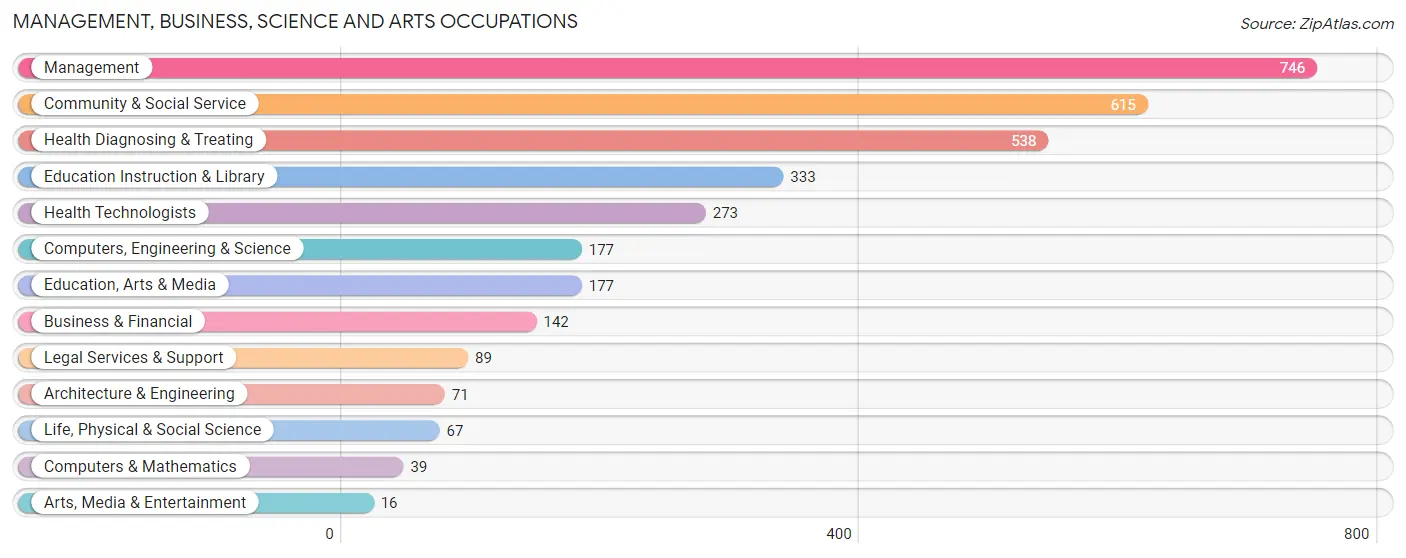
Management, Business, Science and Arts Occupations
The most common Management, Business, Science and Arts occupations in Union County are Management (746 | 9.1%), Community & Social Service (615 | 7.5%), Health Diagnosing & Treating (538 | 6.6%), Education Instruction & Library (333 | 4.1%), and Health Technologists (273 | 3.3%).
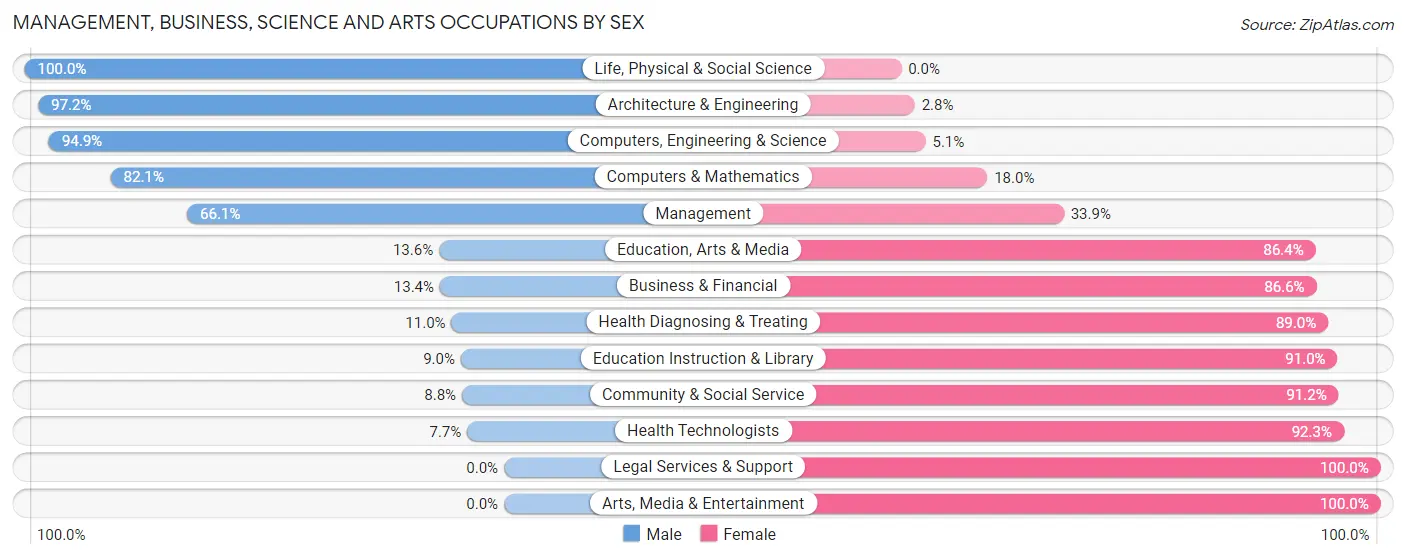
Management, Business, Science and Arts Occupations by Sex
Within the Management, Business, Science and Arts occupations in Union County, the most male-oriented occupations are Life, Physical & Social Science (100.0%), Architecture & Engineering (97.2%), and Computers, Engineering & Science (94.9%), while the most female-oriented occupations are Legal Services & Support (100.0%), Arts, Media & Entertainment (100.0%), and Health Technologists (92.3%).
| Occupation | Male | Female |
| Management | 493 (66.1%) | 253 (33.9%) |
| Business & Financial | 19 (13.4%) | 123 (86.6%) |
| Computers, Engineering & Science | 168 (94.9%) | 9 (5.1%) |
| Computers & Mathematics | 32 (82.1%) | 7 (17.9%) |
| Architecture & Engineering | 69 (97.2%) | 2 (2.8%) |
| Life, Physical & Social Science | 67 (100.0%) | 0 (0.0%) |
| Community & Social Service | 54 (8.8%) | 561 (91.2%) |
| Education, Arts & Media | 24 (13.6%) | 153 (86.4%) |
| Legal Services & Support | 0 (0.0%) | 89 (100.0%) |
| Education Instruction & Library | 30 (9.0%) | 303 (91.0%) |
| Arts, Media & Entertainment | 0 (0.0%) | 16 (100.0%) |
| Health Diagnosing & Treating | 59 (11.0%) | 479 (89.0%) |
| Health Technologists | 21 (7.7%) | 252 (92.3%) |
| Total (Category) | 793 (35.7%) | 1,425 (64.2%) |
| Total (Overall) | 4,581 (56.0%) | 3,600 (44.0%) |
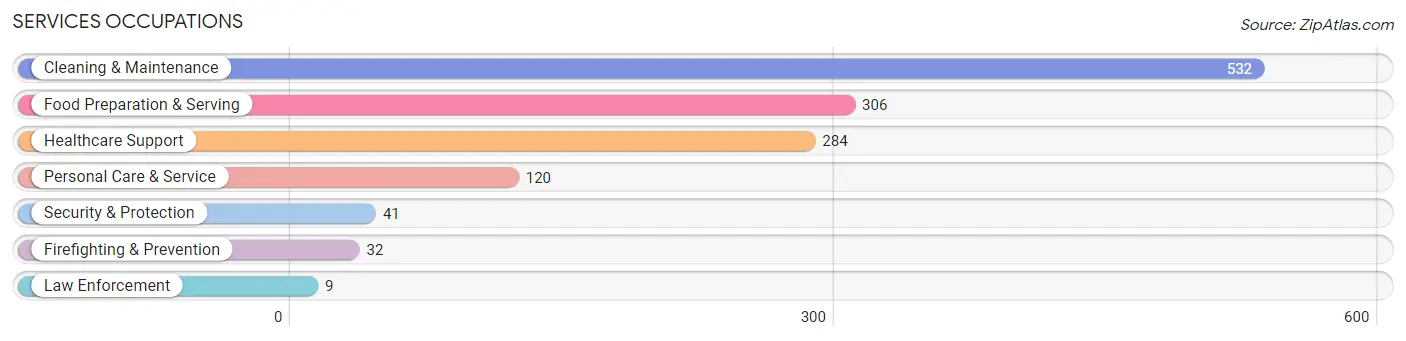
Services Occupations
The most common Services occupations in Union County are Cleaning & Maintenance (532 | 6.5%), Food Preparation & Serving (306 | 3.7%), Healthcare Support (284 | 3.5%), Personal Care & Service (120 | 1.5%), and Security & Protection (41 | 0.5%).
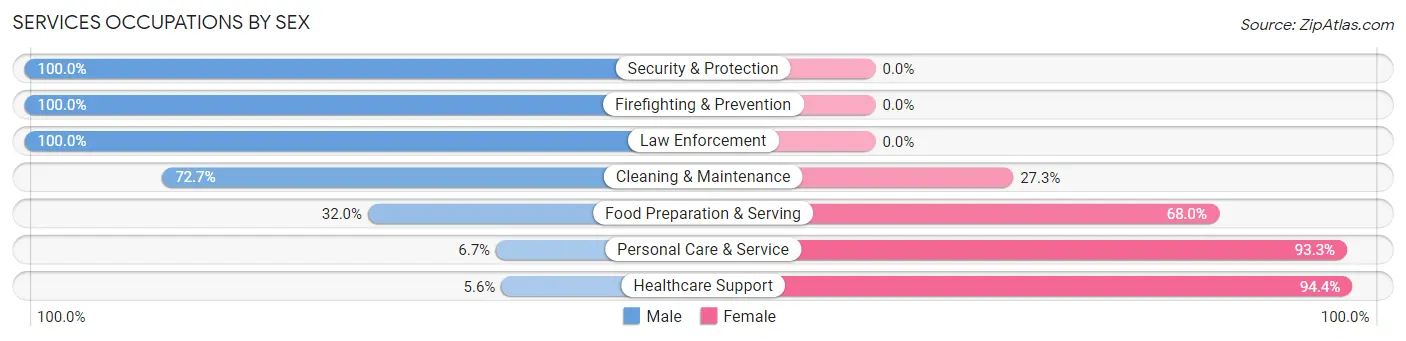
Services Occupations by Sex
Within the Services occupations in Union County, the most male-oriented occupations are Security & Protection (100.0%), Firefighting & Prevention (100.0%), and Law Enforcement (100.0%), while the most female-oriented occupations are Healthcare Support (94.4%), Personal Care & Service (93.3%), and Food Preparation & Serving (68.0%).
| Occupation | Male | Female |
| Healthcare Support | 16 (5.6%) | 268 (94.4%) |
| Security & Protection | 41 (100.0%) | 0 (0.0%) |
| Firefighting & Prevention | 32 (100.0%) | 0 (0.0%) |
| Law Enforcement | 9 (100.0%) | 0 (0.0%) |
| Food Preparation & Serving | 98 (32.0%) | 208 (68.0%) |
| Cleaning & Maintenance | 387 (72.7%) | 145 (27.3%) |
| Personal Care & Service | 8 (6.7%) | 112 (93.3%) |
| Total (Category) | 550 (42.9%) | 733 (57.1%) |
| Total (Overall) | 4,581 (56.0%) | 3,600 (44.0%) |
Sales and Office Occupations
The most common Sales and Office occupations in Union County are Office & Administration (820 | 10.0%), and Sales & Related (691 | 8.5%).
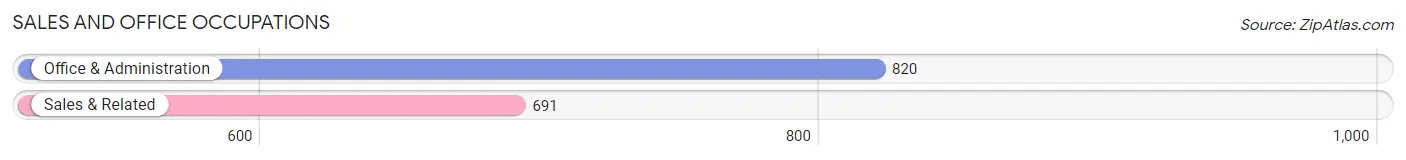
Sales and Office Occupations by Sex
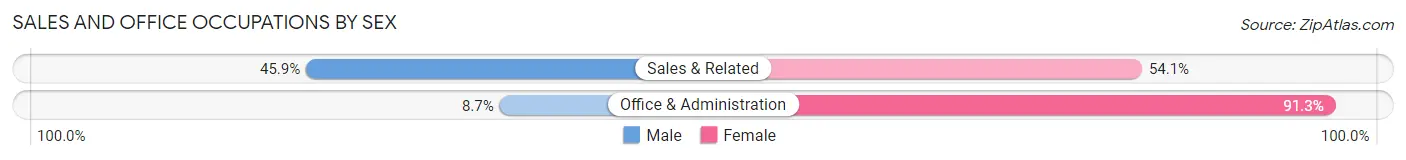
| Occupation | Male | Female |
| Sales & Related | 317 (45.9%) | 374 (54.1%) |
| Office & Administration | 71 (8.7%) | 749 (91.3%) |
| Total (Category) | 388 (25.7%) | 1,123 (74.3%) |
| Total (Overall) | 4,581 (56.0%) | 3,600 (44.0%) |
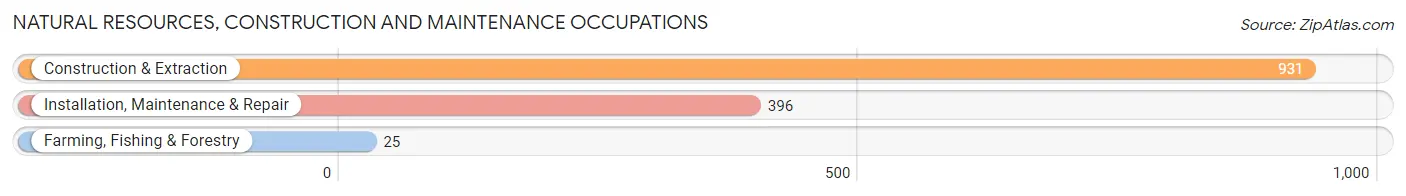
Natural Resources, Construction and Maintenance Occupations
The most common Natural Resources, Construction and Maintenance occupations in Union County are Construction & Extraction (931 | 11.4%), Installation, Maintenance & Repair (396 | 4.8%), and Farming, Fishing & Forestry (25 | 0.3%).
Natural Resources, Construction and Maintenance Occupations by Sex
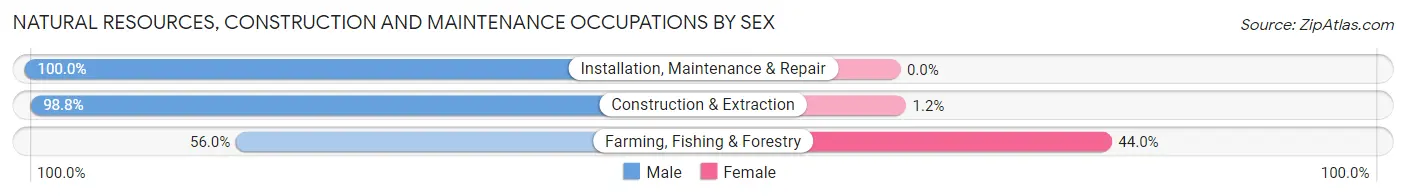
| Occupation | Male | Female |
| Farming, Fishing & Forestry | 14 (56.0%) | 11 (44.0%) |
| Construction & Extraction | 920 (98.8%) | 11 (1.2%) |
| Installation, Maintenance & Repair | 396 (100.0%) | 0 (0.0%) |
| Total (Category) | 1,330 (98.4%) | 22 (1.6%) |
| Total (Overall) | 4,581 (56.0%) | 3,600 (44.0%) |
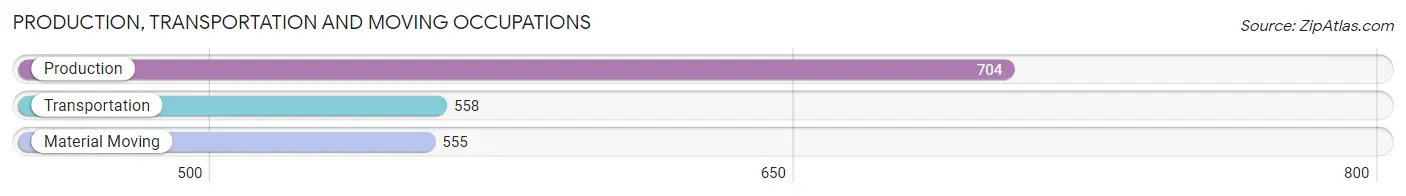
Production, Transportation and Moving Occupations
The most common Production, Transportation and Moving occupations in Union County are Production (704 | 8.6%), Transportation (558 | 6.8%), and Material Moving (555 | 6.8%).
Production, Transportation and Moving Occupations by Sex
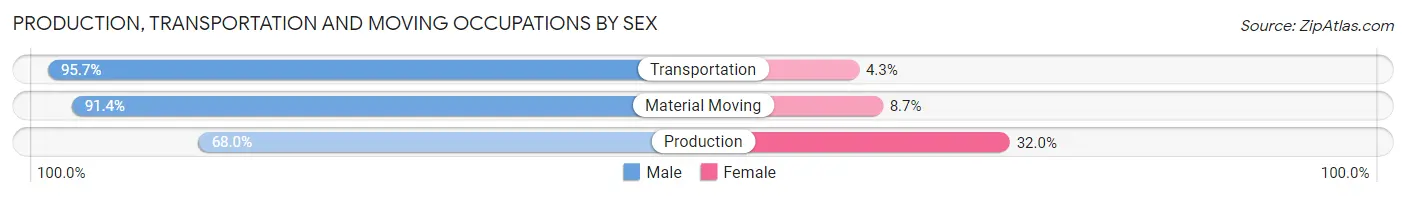
| Occupation | Male | Female |
| Production | 479 (68.0%) | 225 (32.0%) |
| Transportation | 534 (95.7%) | 24 (4.3%) |
| Material Moving | 507 (91.3%) | 48 (8.6%) |
| Total (Category) | 1,520 (83.7%) | 297 (16.4%) |
| Total (Overall) | 4,581 (56.0%) | 3,600 (44.0%) |
Employment Industries by Sex in Union County
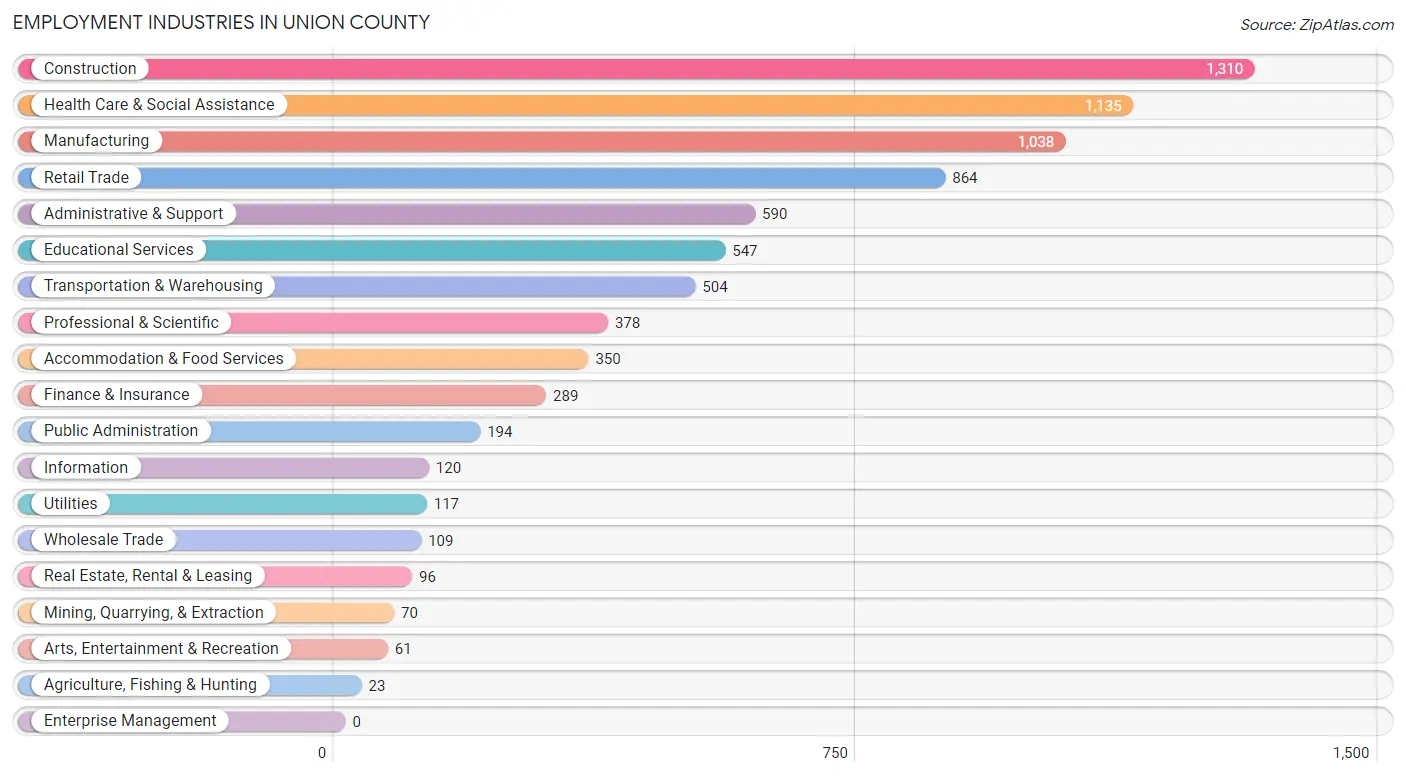
Employment Industries in Union County
The major employment industries in Union County include Construction (1,310 | 16.0%), Health Care & Social Assistance (1,135 | 13.9%), Manufacturing (1,038 | 12.7%), Retail Trade (864 | 10.6%), and Administrative & Support (590 | 7.2%).
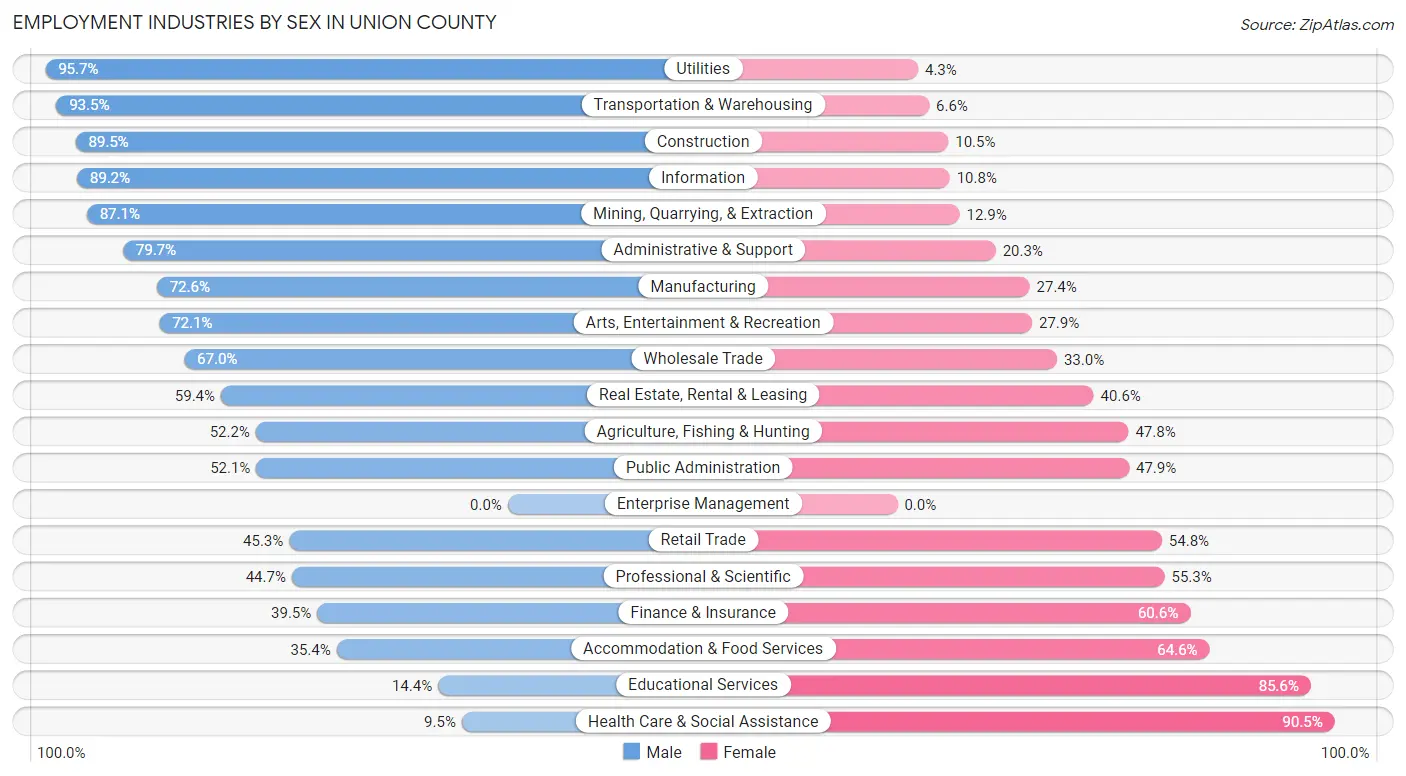
Employment Industries by Sex in Union County
The Union County industries that see more men than women are Utilities (95.7%), Transportation & Warehousing (93.4%), and Construction (89.5%), whereas the industries that tend to have a higher number of women are Health Care & Social Assistance (90.5%), Educational Services (85.6%), and Accommodation & Food Services (64.6%).
| Industry | Male | Female |
| Agriculture, Fishing & Hunting | 12 (52.2%) | 11 (47.8%) |
| Mining, Quarrying, & Extraction | 61 (87.1%) | 9 (12.9%) |
| Construction | 1,172 (89.5%) | 138 (10.5%) |
| Manufacturing | 754 (72.6%) | 284 (27.4%) |
| Wholesale Trade | 73 (67.0%) | 36 (33.0%) |
| Retail Trade | 391 (45.3%) | 473 (54.7%) |
| Transportation & Warehousing | 471 (93.4%) | 33 (6.6%) |
| Utilities | 112 (95.7%) | 5 (4.3%) |
| Information | 107 (89.2%) | 13 (10.8%) |
| Finance & Insurance | 114 (39.5%) | 175 (60.6%) |
| Real Estate, Rental & Leasing | 57 (59.4%) | 39 (40.6%) |
| Professional & Scientific | 169 (44.7%) | 209 (55.3%) |
| Enterprise Management | 0 (0.0%) | 0 (0.0%) |
| Administrative & Support | 470 (79.7%) | 120 (20.3%) |
| Educational Services | 79 (14.4%) | 468 (85.6%) |
| Health Care & Social Assistance | 108 (9.5%) | 1,027 (90.5%) |
| Arts, Entertainment & Recreation | 44 (72.1%) | 17 (27.9%) |
| Accommodation & Food Services | 124 (35.4%) | 226 (64.6%) |
| Public Administration | 101 (52.1%) | 93 (47.9%) |
| Total | 4,581 (56.0%) | 3,600 (44.0%) |
Education in Union County
School Enrollment in Union County
The most common levels of schooling among the 3,977 students in Union County are middle school (1,136 | 28.6%), high school (1,020 | 25.7%), and elementary school (883 | 22.2%).
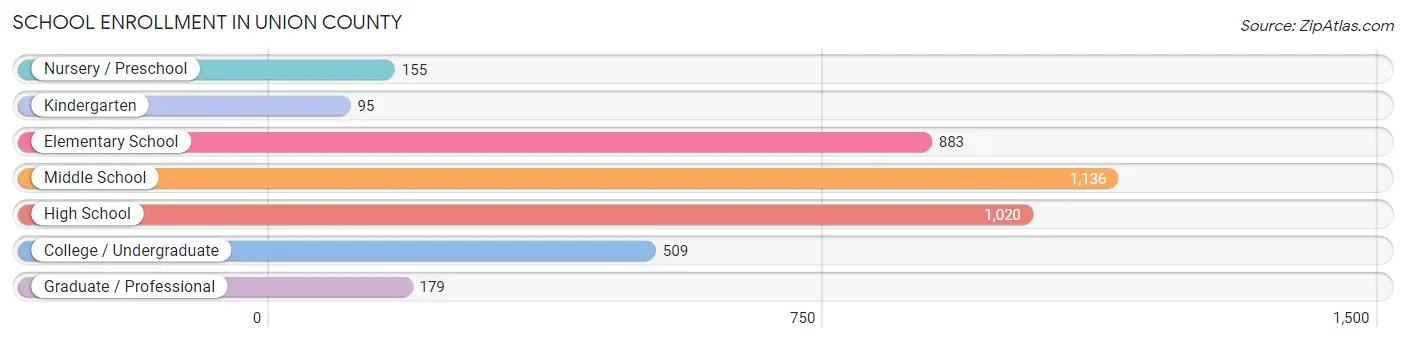
| School Level | # Students | % Students |
| Nursery / Preschool | 155 | 3.9% |
| Kindergarten | 95 | 2.4% |
| Elementary School | 883 | 22.2% |
| Middle School | 1,136 | 28.6% |
| High School | 1,020 | 25.7% |
| College / Undergraduate | 509 | 12.8% |
| Graduate / Professional | 179 | 4.5% |
| Total | 3,977 | 100.0% |
School Enrollment by Age by Funding Source in Union County
Out of a total of 3,977 students who are enrolled in schools in Union County, 481 (12.1%) attend a private institution, while the remaining 3,496 (87.9%) are enrolled in public schools. The age group of 35 years and over has the highest likelihood of being enrolled in private schools, with 99 (76.7% in the age bracket) enrolled. Conversely, the age group of 3 to 4 year olds has the lowest likelihood of being enrolled in a private school, with 126 (100.0% in the age bracket) attending a public institution.
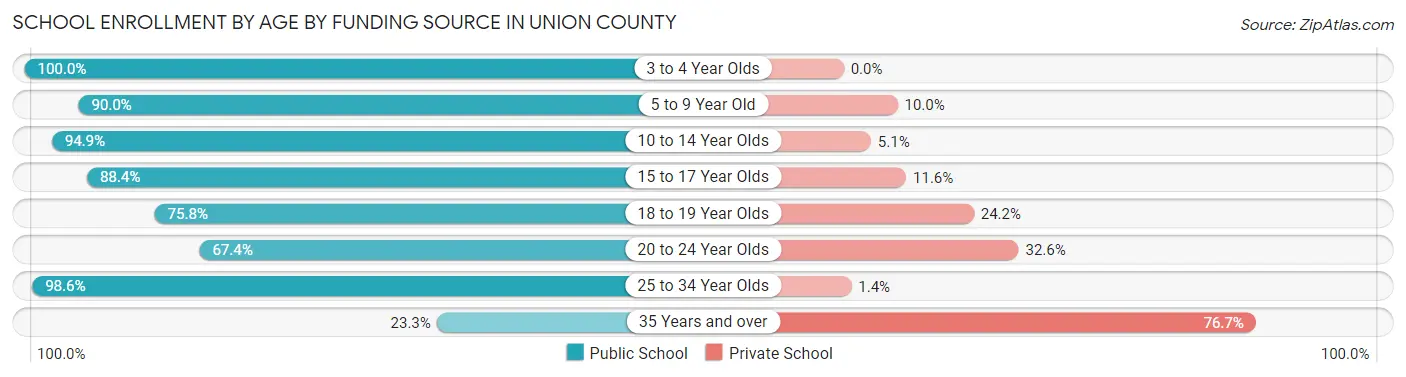
| Age Bracket | Public School | Private School |
| 3 to 4 Year Olds | 126 (100.0%) | 0 (0.0%) |
| 5 to 9 Year Old | 717 (90.0%) | 80 (10.0%) |
| 10 to 14 Year Olds | 1,367 (94.9%) | 73 (5.1%) |
| 15 to 17 Year Olds | 722 (88.4%) | 95 (11.6%) |
| 18 to 19 Year Olds | 147 (75.8%) | 47 (24.2%) |
| 20 to 24 Year Olds | 178 (67.4%) | 86 (32.6%) |
| 25 to 34 Year Olds | 207 (98.6%) | 3 (1.4%) |
| 35 Years and over | 30 (23.3%) | 99 (76.7%) |
| Total | 3,496 (87.9%) | 481 (12.1%) |
Educational Attainment by Field of Study in Union County
Education (685 | 34.9%), arts & humanities (257 | 13.1%), science & technology (208 | 10.6%), business (158 | 8.0%), and liberal arts & history (150 | 7.6%) are the most common fields of study among 1,965 individuals in Union County who have obtained a bachelor's degree or higher.

| Field of Study | # Graduates | % Graduates |
| Computers & Mathematics | 65 | 3.3% |
| Bio, Nature & Agricultural | 128 | 6.5% |
| Physical & Health Sciences | 64 | 3.3% |
| Psychology | 7 | 0.4% |
| Social Sciences | 40 | 2.0% |
| Engineering | 106 | 5.4% |
| Multidisciplinary Studies | 5 | 0.3% |
| Science & Technology | 208 | 10.6% |
| Business | 158 | 8.0% |
| Education | 685 | 34.9% |
| Literature & Languages | 47 | 2.4% |
| Liberal Arts & History | 150 | 7.6% |
| Visual & Performing Arts | 22 | 1.1% |
| Communications | 23 | 1.2% |
| Arts & Humanities | 257 | 13.1% |
| Total | 1,965 | 100.0% |
Transportation & Commute in Union County
Vehicle Availability by Sex in Union County
The most prevalent vehicle ownership categories in Union County are males with 2 vehicles (1,801, accounting for 39.6%) and females with 2 vehicles (1,339, making up 50.3%).
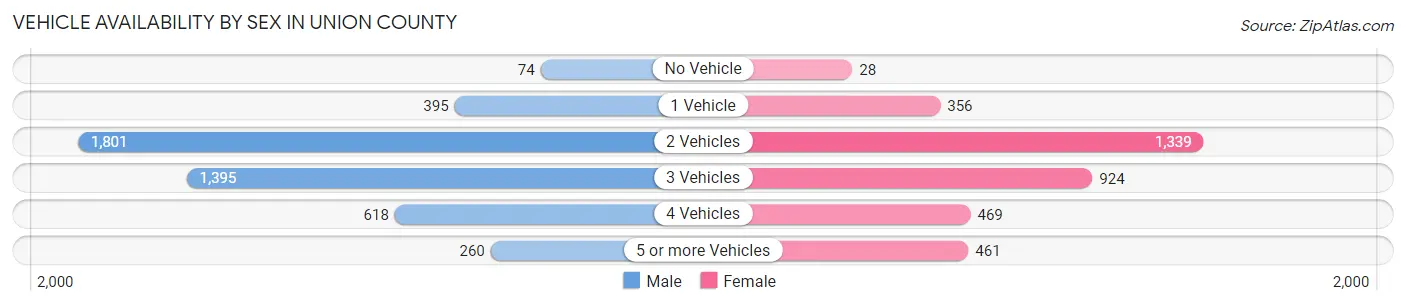
| Vehicles Available | Male | Female |
| No Vehicle | 74 (1.6%) | 28 (0.8%) |
| 1 Vehicle | 395 (8.7%) | 356 (10.0%) |
| 2 Vehicles | 1,801 (39.6%) | 1,339 (37.4%) |
| 3 Vehicles | 1,395 (30.7%) | 924 (25.8%) |
| 4 Vehicles | 618 (13.6%) | 469 (13.1%) |
| 5 or more Vehicles | 260 (5.7%) | 461 (12.9%) |
| Total | 4,543 (100.0%) | 3,577 (100.0%) |
Commute Time in Union County
The most frequently occuring commute durations in Union County are 45 to 59 minutes (1,280 commuters, 17.3%), 30 to 34 minutes (1,076 commuters, 14.6%), and 5 to 9 minutes (800 commuters, 10.8%).
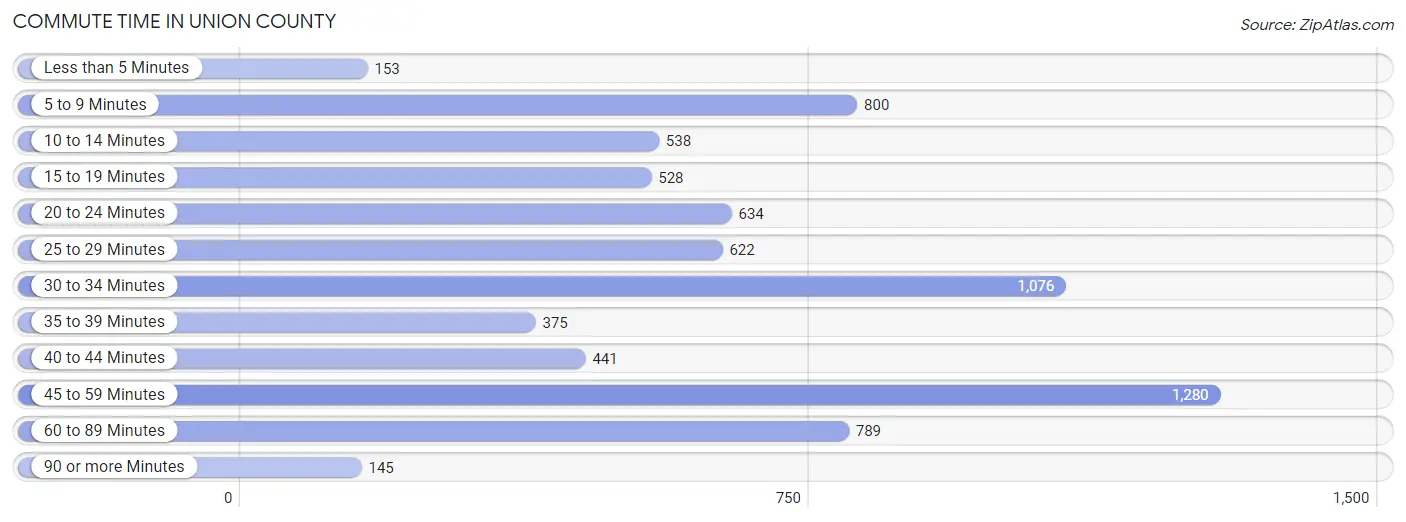
| Commute Time | # Commuters | % Commuters |
| Less than 5 Minutes | 153 | 2.1% |
| 5 to 9 Minutes | 800 | 10.8% |
| 10 to 14 Minutes | 538 | 7.3% |
| 15 to 19 Minutes | 528 | 7.1% |
| 20 to 24 Minutes | 634 | 8.6% |
| 25 to 29 Minutes | 622 | 8.4% |
| 30 to 34 Minutes | 1,076 | 14.6% |
| 35 to 39 Minutes | 375 | 5.1% |
| 40 to 44 Minutes | 441 | 6.0% |
| 45 to 59 Minutes | 1,280 | 17.3% |
| 60 to 89 Minutes | 789 | 10.7% |
| 90 or more Minutes | 145 | 2.0% |
Commute Time by Sex in Union County
The most common commute times in Union County are 45 to 59 minutes (789 commuters, 18.9%) for males and 45 to 59 minutes (491 commuters, 15.3%) for females.
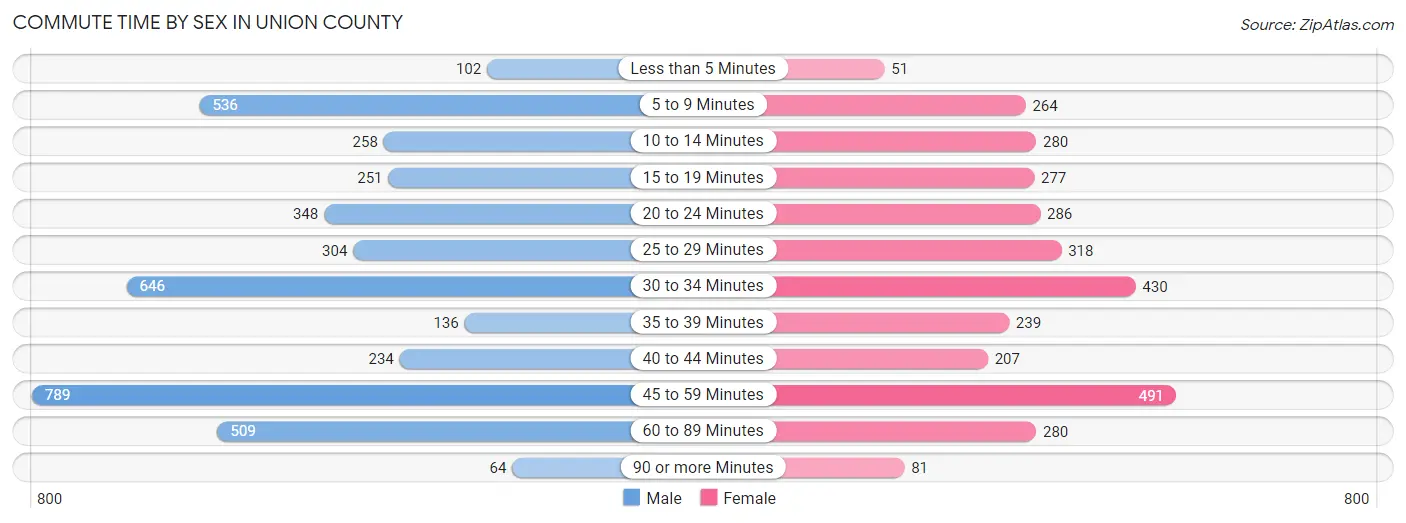
| Commute Time | Male | Female |
| Less than 5 Minutes | 102 (2.4%) | 51 (1.6%) |
| 5 to 9 Minutes | 536 (12.8%) | 264 (8.2%) |
| 10 to 14 Minutes | 258 (6.2%) | 280 (8.7%) |
| 15 to 19 Minutes | 251 (6.0%) | 277 (8.6%) |
| 20 to 24 Minutes | 348 (8.3%) | 286 (8.9%) |
| 25 to 29 Minutes | 304 (7.3%) | 318 (9.9%) |
| 30 to 34 Minutes | 646 (15.5%) | 430 (13.4%) |
| 35 to 39 Minutes | 136 (3.3%) | 239 (7.5%) |
| 40 to 44 Minutes | 234 (5.6%) | 207 (6.5%) |
| 45 to 59 Minutes | 789 (18.9%) | 491 (15.3%) |
| 60 to 89 Minutes | 509 (12.2%) | 280 (8.7%) |
| 90 or more Minutes | 64 (1.5%) | 81 (2.5%) |
Time of Departure to Work by Sex in Union County
The most frequent times of departure to work in Union County are 6:00 AM to 6:29 AM (880, 21.1%) for males and 7:00 AM to 7:29 AM (616, 19.2%) for females.
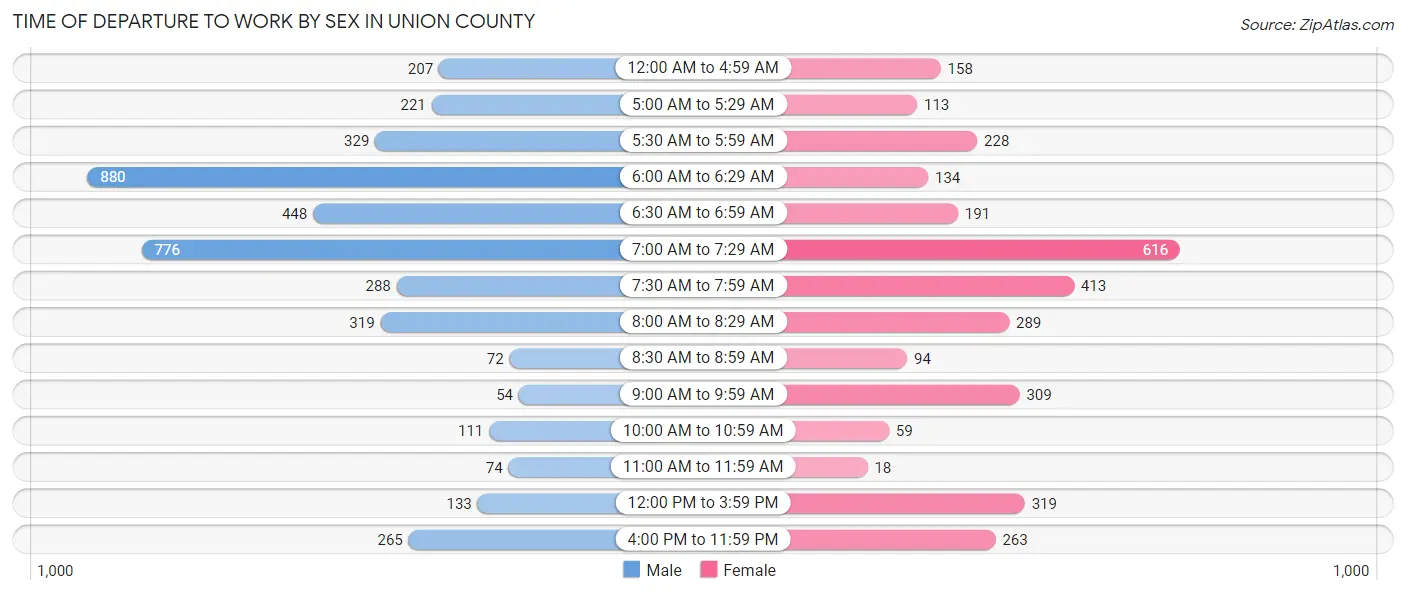
| Time of Departure | Male | Female |
| 12:00 AM to 4:59 AM | 207 (5.0%) | 158 (4.9%) |
| 5:00 AM to 5:29 AM | 221 (5.3%) | 113 (3.5%) |
| 5:30 AM to 5:59 AM | 329 (7.9%) | 228 (7.1%) |
| 6:00 AM to 6:29 AM | 880 (21.1%) | 134 (4.2%) |
| 6:30 AM to 6:59 AM | 448 (10.7%) | 191 (6.0%) |
| 7:00 AM to 7:29 AM | 776 (18.6%) | 616 (19.2%) |
| 7:30 AM to 7:59 AM | 288 (6.9%) | 413 (12.9%) |
| 8:00 AM to 8:29 AM | 319 (7.6%) | 289 (9.0%) |
| 8:30 AM to 8:59 AM | 72 (1.7%) | 94 (2.9%) |
| 9:00 AM to 9:59 AM | 54 (1.3%) | 309 (9.6%) |
| 10:00 AM to 10:59 AM | 111 (2.7%) | 59 (1.8%) |
| 11:00 AM to 11:59 AM | 74 (1.8%) | 18 (0.6%) |
| 12:00 PM to 3:59 PM | 133 (3.2%) | 319 (10.0%) |
| 4:00 PM to 11:59 PM | 265 (6.3%) | 263 (8.2%) |
| Total | 4,177 (100.0%) | 3,204 (100.0%) |
Housing Occupancy in Union County
Occupancy by Ownership in Union County
Of the total 7,552 dwellings in Union County, owner-occupied units account for 6,083 (80.5%), while renter-occupied units make up 1,469 (19.5%).
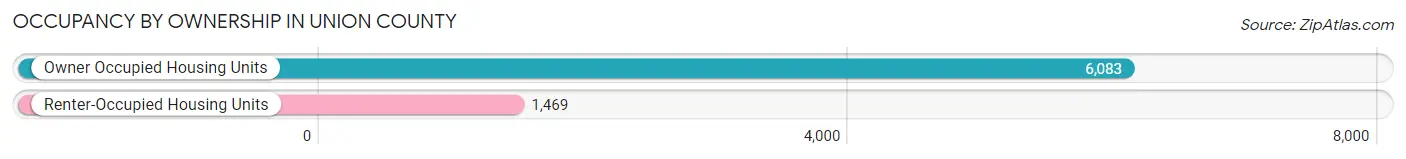
| Occupancy | # Housing Units | % Housing Units |
| Owner Occupied Housing Units | 6,083 | 80.5% |
| Renter-Occupied Housing Units | 1,469 | 19.5% |
| Total Occupied Housing Units | 7,552 | 100.0% |
Occupancy by Household Size in Union County

| Household Size | # Housing Units | % Housing Units |
| 1-Person Household | 1,501 | 19.9% |
| 2-Person Household | 2,941 | 38.9% |
| 3-Person Household | 1,321 | 17.5% |
| 4+ Person Household | 1,789 | 23.7% |
| Total Housing Units | 7,552 | 100.0% |
Occupancy by Ownership by Household Size in Union County
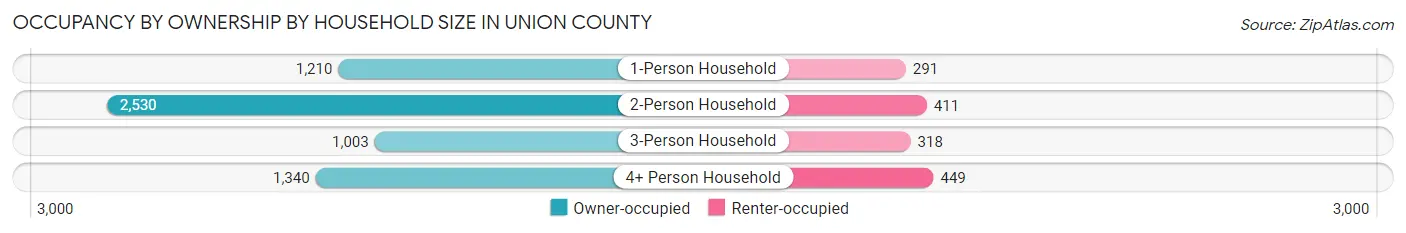
| Household Size | Owner-occupied | Renter-occupied |
| 1-Person Household | 1,210 (80.6%) | 291 (19.4%) |
| 2-Person Household | 2,530 (86.0%) | 411 (14.0%) |
| 3-Person Household | 1,003 (75.9%) | 318 (24.1%) |
| 4+ Person Household | 1,340 (74.9%) | 449 (25.1%) |
| Total Housing Units | 6,083 (80.5%) | 1,469 (19.5%) |
Occupancy by Educational Attainment in Union County
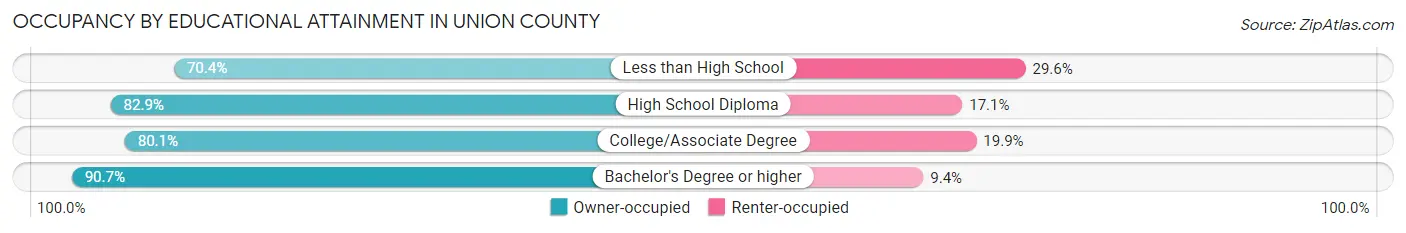
| Household Size | Owner-occupied | Renter-occupied |
| Less than High School | 1,069 (70.4%) | 450 (29.6%) |
| High School Diploma | 2,352 (82.9%) | 484 (17.1%) |
| College/Associate Degree | 1,799 (80.1%) | 446 (19.9%) |
| Bachelor's Degree or higher | 863 (90.6%) | 89 (9.3%) |
Occupancy by Age of Householder in Union County

| Age Bracket | # Households | % Households |
| Under 35 Years | 1,275 | 16.9% |
| 35 to 44 Years | 1,011 | 13.4% |
| 45 to 54 Years | 1,322 | 17.5% |
| 55 to 64 Years | 1,632 | 21.6% |
| 65 to 74 Years | 1,447 | 19.2% |
| 75 to 84 Years | 709 | 9.4% |
| 85 Years and Over | 156 | 2.1% |
| Total | 7,552 | 100.0% |
Housing Finances in Union County
Median Income by Occupancy in Union County
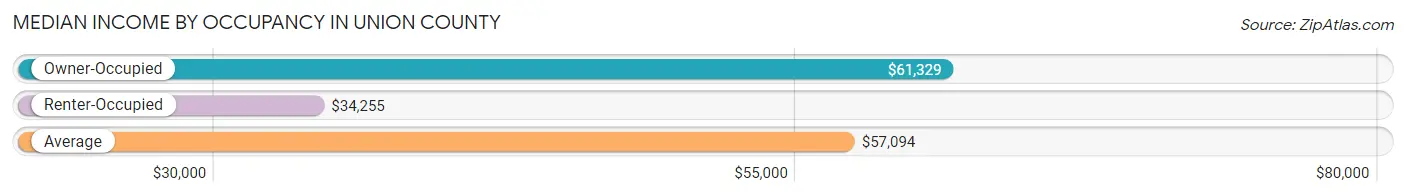
| Occupancy Type | # Households | Median Income |
| Owner-Occupied | 6,083 (80.5%) | $61,329 |
| Renter-Occupied | 1,469 (19.5%) | $34,255 |
| Average | 7,552 (100.0%) | $57,094 |
Occupancy by Householder Income Bracket in Union County
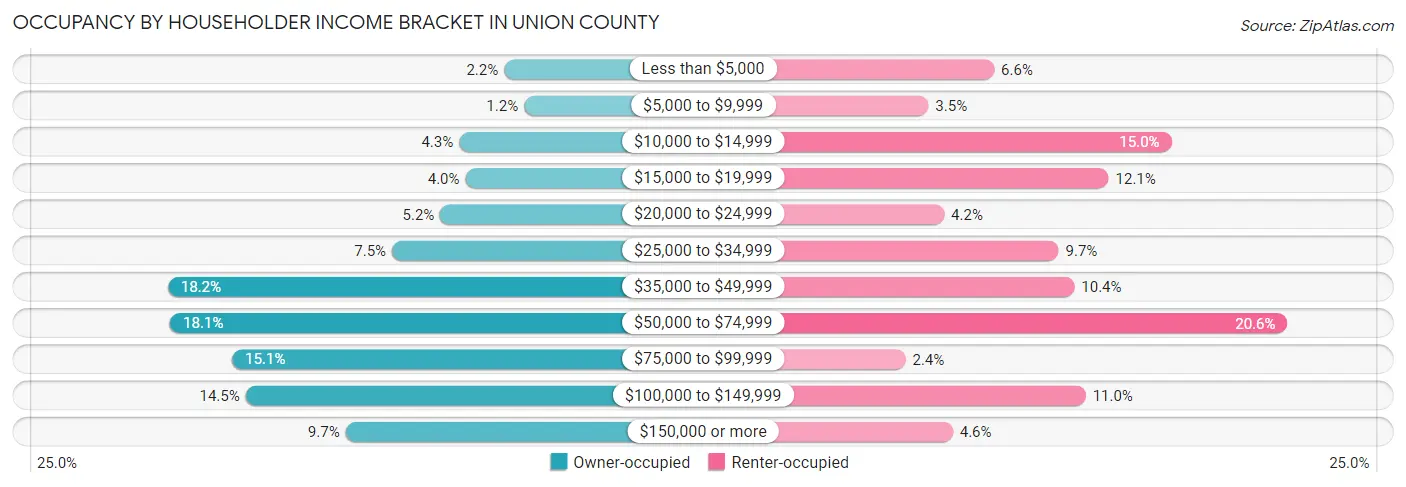
| Income Bracket | Owner-occupied | Renter-occupied |
| Less than $5,000 | 132 (2.2%) | 97 (6.6%) |
| $5,000 to $9,999 | 74 (1.2%) | 51 (3.5%) |
| $10,000 to $14,999 | 262 (4.3%) | 221 (15.0%) |
| $15,000 to $19,999 | 244 (4.0%) | 177 (12.0%) |
| $20,000 to $24,999 | 317 (5.2%) | 62 (4.2%) |
| $25,000 to $34,999 | 457 (7.5%) | 142 (9.7%) |
| $35,000 to $49,999 | 1,106 (18.2%) | 153 (10.4%) |
| $50,000 to $74,999 | 1,099 (18.1%) | 302 (20.6%) |
| $75,000 to $99,999 | 920 (15.1%) | 35 (2.4%) |
| $100,000 to $149,999 | 881 (14.5%) | 161 (11.0%) |
| $150,000 or more | 591 (9.7%) | 68 (4.6%) |
| Total | 6,083 (100.0%) | 1,469 (100.0%) |
Monthly Housing Cost Tiers in Union County
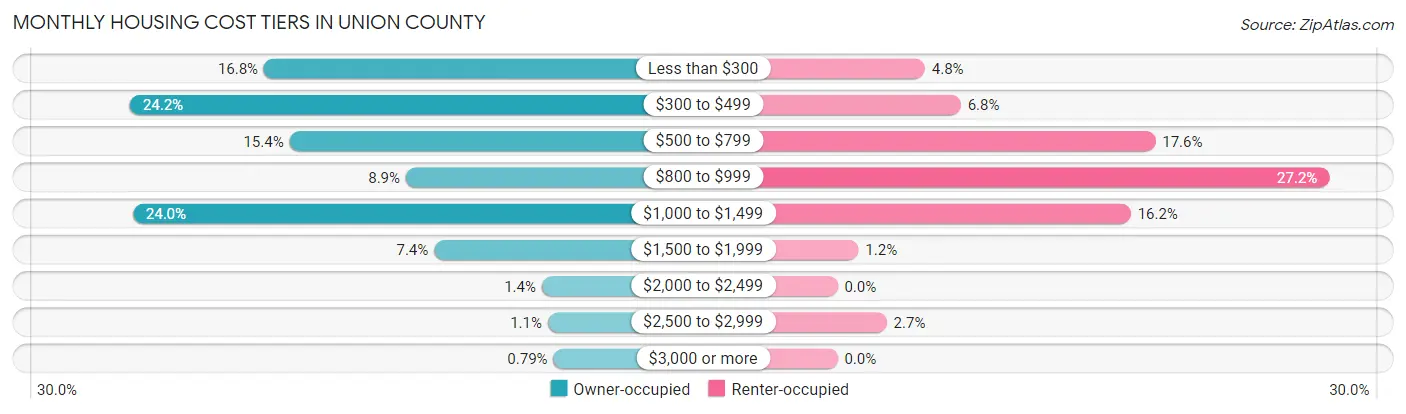
| Monthly Cost | Owner-occupied | Renter-occupied |
| Less than $300 | 1,021 (16.8%) | 71 (4.8%) |
| $300 to $499 | 1,471 (24.2%) | 100 (6.8%) |
| $500 to $799 | 935 (15.4%) | 258 (17.6%) |
| $800 to $999 | 544 (8.9%) | 399 (27.2%) |
| $1,000 to $1,499 | 1,461 (24.0%) | 238 (16.2%) |
| $1,500 to $1,999 | 449 (7.4%) | 17 (1.2%) |
| $2,000 to $2,499 | 87 (1.4%) | 0 (0.0%) |
| $2,500 to $2,999 | 67 (1.1%) | 40 (2.7%) |
| $3,000 or more | 48 (0.8%) | 0 (0.0%) |
| Total | 6,083 (100.0%) | 1,469 (100.0%) |
Physical Housing Characteristics in Union County
Housing Structures in Union County
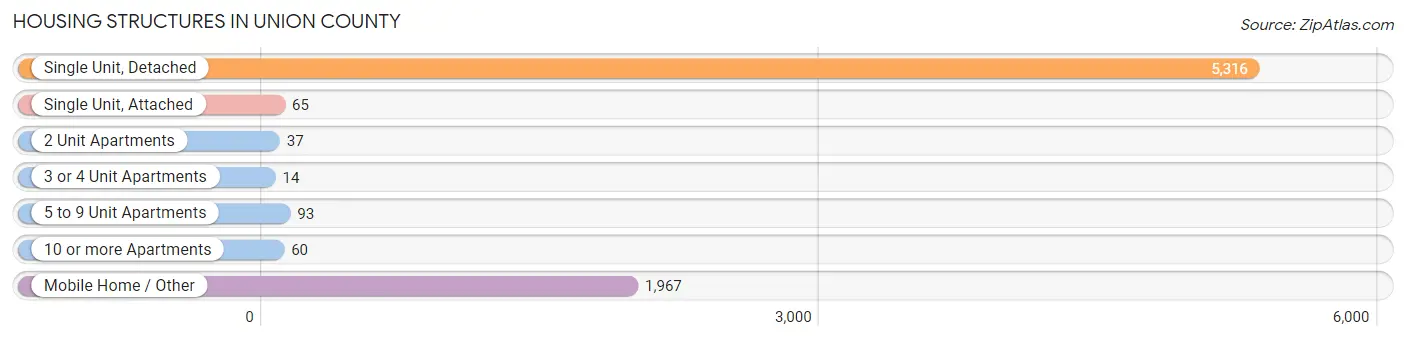
| Structure Type | # Housing Units | % Housing Units |
| Single Unit, Detached | 5,316 | 70.4% |
| Single Unit, Attached | 65 | 0.9% |
| 2 Unit Apartments | 37 | 0.5% |
| 3 or 4 Unit Apartments | 14 | 0.2% |
| 5 to 9 Unit Apartments | 93 | 1.2% |
| 10 or more Apartments | 60 | 0.8% |
| Mobile Home / Other | 1,967 | 26.1% |
| Total | 7,552 | 100.0% |
Housing Structures by Occupancy in Union County
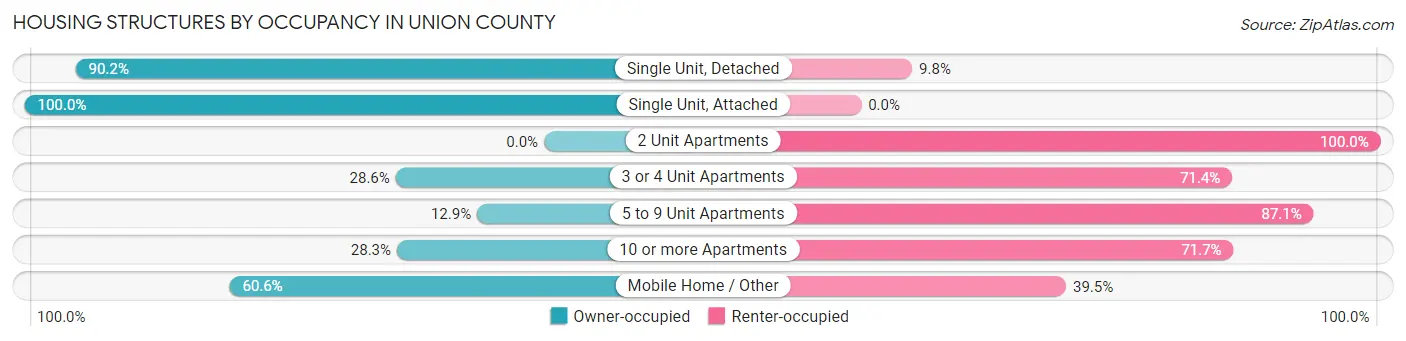
| Structure Type | Owner-occupied | Renter-occupied |
| Single Unit, Detached | 4,794 (90.2%) | 522 (9.8%) |
| Single Unit, Attached | 65 (100.0%) | 0 (0.0%) |
| 2 Unit Apartments | 0 (0.0%) | 37 (100.0%) |
| 3 or 4 Unit Apartments | 4 (28.6%) | 10 (71.4%) |
| 5 to 9 Unit Apartments | 12 (12.9%) | 81 (87.1%) |
| 10 or more Apartments | 17 (28.3%) | 43 (71.7%) |
| Mobile Home / Other | 1,191 (60.6%) | 776 (39.5%) |
| Total | 6,083 (80.5%) | 1,469 (19.5%) |
Housing Structures by Number of Rooms in Union County

| Number of Rooms | Owner-occupied | Renter-occupied |
| 1 Room | 100 (1.6%) | 0 (0.0%) |
| 2 or 3 Rooms | 101 (1.7%) | 137 (9.3%) |
| 4 or 5 Rooms | 2,240 (36.8%) | 781 (53.2%) |
| 6 or 7 Rooms | 2,341 (38.5%) | 389 (26.5%) |
| 8 or more Rooms | 1,301 (21.4%) | 162 (11.0%) |
| Total | 6,083 (100.0%) | 1,469 (100.0%) |
Housing Structure by Heating Type in Union County
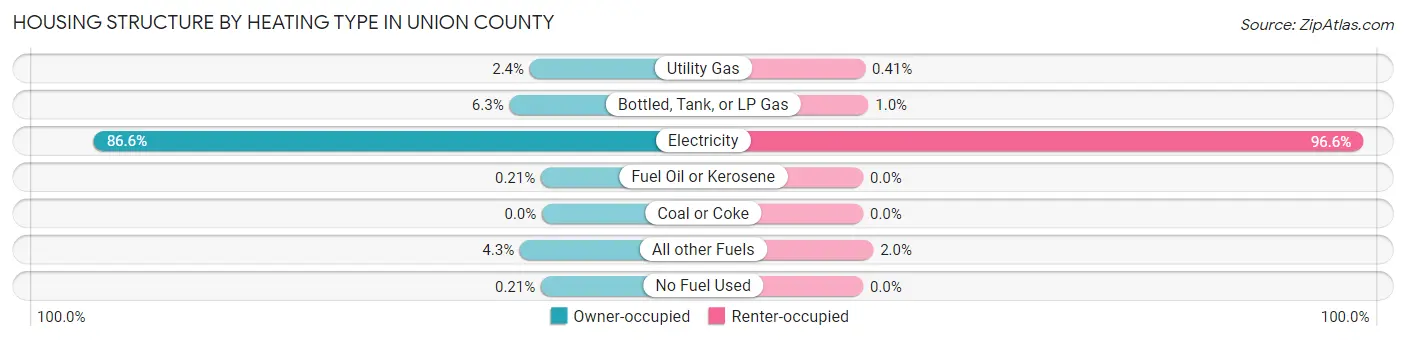
| Heating Type | Owner-occupied | Renter-occupied |
| Utility Gas | 144 (2.4%) | 6 (0.4%) |
| Bottled, Tank, or LP Gas | 383 (6.3%) | 15 (1.0%) |
| Electricity | 5,270 (86.6%) | 1,419 (96.6%) |
| Fuel Oil or Kerosene | 13 (0.2%) | 0 (0.0%) |
| Coal or Coke | 0 (0.0%) | 0 (0.0%) |
| All other Fuels | 260 (4.3%) | 29 (2.0%) |
| No Fuel Used | 13 (0.2%) | 0 (0.0%) |
| Total | 6,083 (100.0%) | 1,469 (100.0%) |
Household Vehicle Usage in Union County
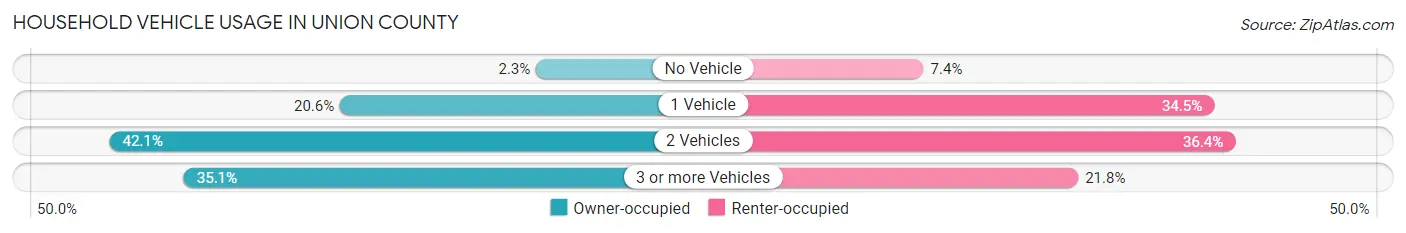
| Vehicles per Household | Owner-occupied | Renter-occupied |
| No Vehicle | 137 (2.2%) | 108 (7.3%) |
| 1 Vehicle | 1,250 (20.5%) | 506 (34.4%) |
| 2 Vehicles | 2,559 (42.1%) | 535 (36.4%) |
| 3 or more Vehicles | 2,137 (35.1%) | 320 (21.8%) |
| Total | 6,083 (100.0%) | 1,469 (100.0%) |
Real Estate & Mortgages in Union County
Real Estate and Mortgage Overview in Union County
| Characteristic | Without Mortgage | With Mortgage |
| Housing Units | 2,926 | 3,157 |
| Median Property Value | $158,400 | $169,600 |
| Median Household Income | $45,278 | $444 |
| Monthly Housing Costs | $343 | $48 |
| Real Estate Taxes | $681 | $150 |
Property Value by Mortgage Status in Union County
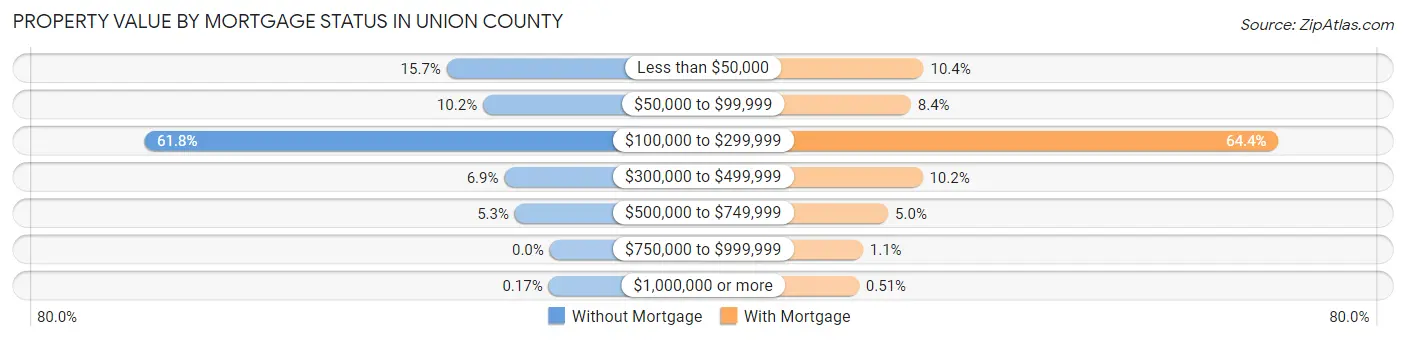
| Property Value | Without Mortgage | With Mortgage |
| Less than $50,000 | 459 (15.7%) | 327 (10.4%) |
| $50,000 to $99,999 | 297 (10.2%) | 266 (8.4%) |
| $100,000 to $299,999 | 1,808 (61.8%) | 2,034 (64.4%) |
| $300,000 to $499,999 | 202 (6.9%) | 322 (10.2%) |
| $500,000 to $749,999 | 155 (5.3%) | 157 (5.0%) |
| $750,000 to $999,999 | 0 (0.0%) | 35 (1.1%) |
| $1,000,000 or more | 5 (0.2%) | 16 (0.5%) |
| Total | 2,926 (100.0%) | 3,157 (100.0%) |
Household Income by Mortgage Status in Union County
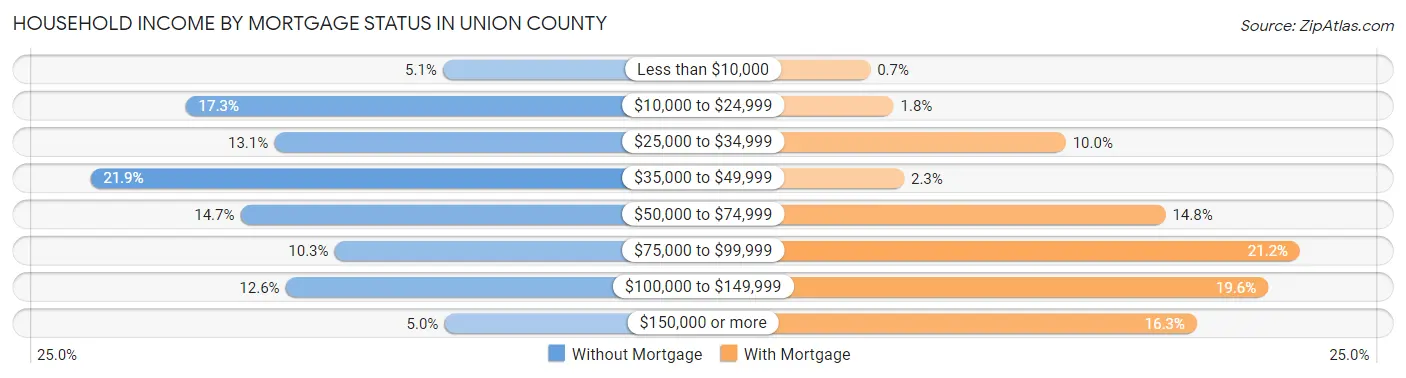
| Household Income | Without Mortgage | With Mortgage |
| Less than $10,000 | 149 (5.1%) | 22 (0.7%) |
| $10,000 to $24,999 | 507 (17.3%) | 57 (1.8%) |
| $25,000 to $34,999 | 384 (13.1%) | 316 (10.0%) |
| $35,000 to $49,999 | 640 (21.9%) | 73 (2.3%) |
| $50,000 to $74,999 | 431 (14.7%) | 466 (14.8%) |
| $75,000 to $99,999 | 300 (10.2%) | 668 (21.2%) |
| $100,000 to $149,999 | 368 (12.6%) | 620 (19.6%) |
| $150,000 or more | 147 (5.0%) | 513 (16.3%) |
| Total | 2,926 (100.0%) | 3,157 (100.0%) |
Property Value to Household Income Ratio in Union County

| Value-to-Income Ratio | Without Mortgage | With Mortgage |
| Less than 2.0x | 953 (32.6%) | 74,978 (2,375.0%) |
| 2.0x to 2.9x | 670 (22.9%) | 1,344 (42.6%) |
| 3.0x to 3.9x | 285 (9.7%) | 614 (19.5%) |
| 4.0x or more | 953 (32.6%) | 528 (16.7%) |
| Total | 2,926 (100.0%) | 3,157 (100.0%) |
Real Estate Taxes by Mortgage Status in Union County
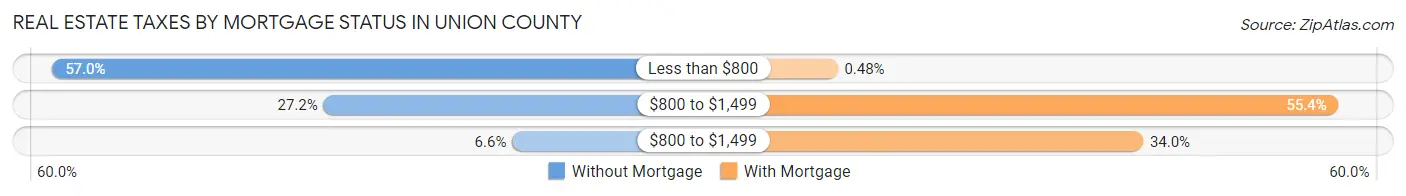
| Property Taxes | Without Mortgage | With Mortgage |
| Less than $800 | 1,667 (57.0%) | 15 (0.5%) |
| $800 to $1,499 | 797 (27.2%) | 1,749 (55.4%) |
| $800 to $1,499 | 192 (6.6%) | 1,072 (34.0%) |
| Total | 2,926 (100.0%) | 3,157 (100.0%) |
Health & Disability in Union County
Health Insurance Coverage by Age in Union County
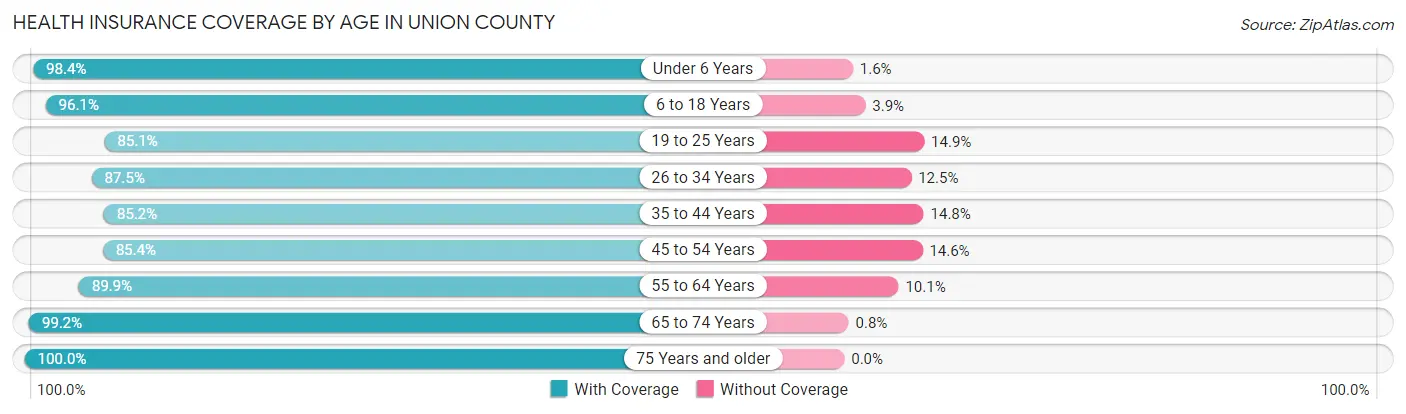
| Age Bracket | With Coverage | Without Coverage |
| Under 6 Years | 1,105 (98.4%) | 18 (1.6%) |
| 6 to 18 Years | 3,215 (96.1%) | 131 (3.9%) |
| 19 to 25 Years | 1,286 (85.1%) | 225 (14.9%) |
| 26 to 34 Years | 1,831 (87.5%) | 261 (12.5%) |
| 35 to 44 Years | 2,011 (85.2%) | 349 (14.8%) |
| 45 to 54 Years | 2,240 (85.4%) | 382 (14.6%) |
| 55 to 64 Years | 2,738 (89.9%) | 308 (10.1%) |
| 65 to 74 Years | 2,226 (99.2%) | 18 (0.8%) |
| 75 Years and older | 1,345 (100.0%) | 0 (0.0%) |
| Total | 17,997 (91.4%) | 1,692 (8.6%) |
Health Insurance Coverage by Citizenship Status in Union County
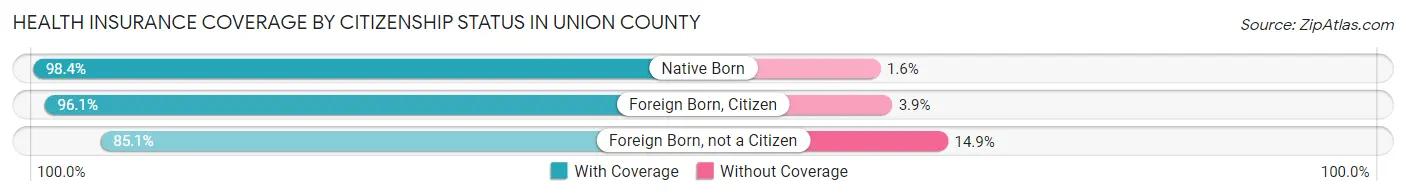
| Citizenship Status | With Coverage | Without Coverage |
| Native Born | 1,105 (98.4%) | 18 (1.6%) |
| Foreign Born, Citizen | 3,215 (96.1%) | 131 (3.9%) |
| Foreign Born, not a Citizen | 1,286 (85.1%) | 225 (14.9%) |
Health Insurance Coverage by Household Income in Union County

| Household Income | With Coverage | Without Coverage |
| Under $25,000 | 2,357 (84.3%) | 438 (15.7%) |
| $25,000 to $49,999 | 4,025 (92.2%) | 339 (7.8%) |
| $50,000 to $74,999 | 3,498 (89.1%) | 426 (10.9%) |
| $75,000 to $99,999 | 2,810 (95.6%) | 129 (4.4%) |
| $100,000 and over | 5,305 (93.7%) | 355 (6.3%) |
Public vs Private Health Insurance Coverage by Age in Union County
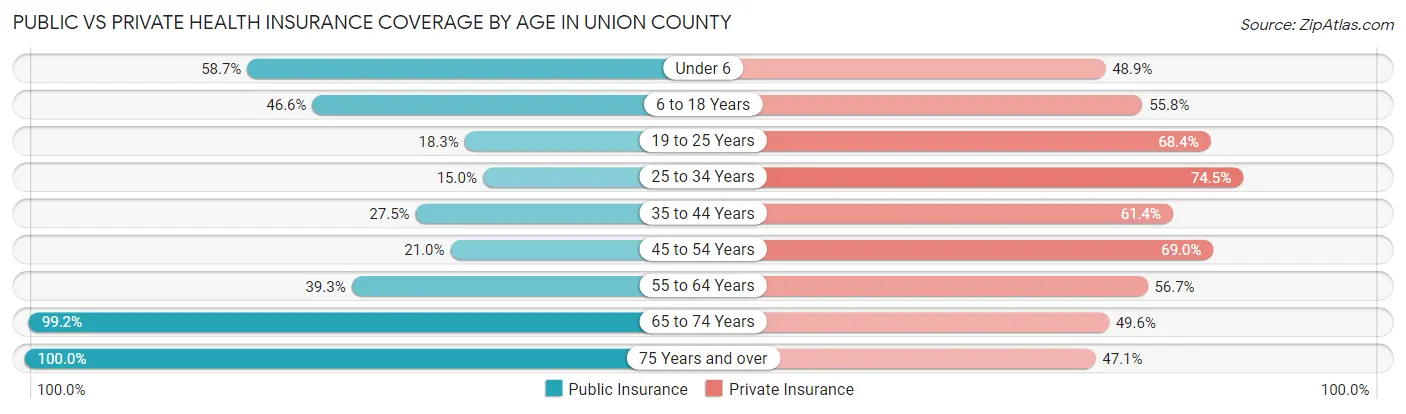
| Age Bracket | Public Insurance | Private Insurance |
| Under 6 | 659 (58.7%) | 549 (48.9%) |
| 6 to 18 Years | 1,559 (46.6%) | 1,866 (55.8%) |
| 19 to 25 Years | 277 (18.3%) | 1,034 (68.4%) |
| 25 to 34 Years | 313 (15.0%) | 1,558 (74.5%) |
| 35 to 44 Years | 648 (27.5%) | 1,450 (61.4%) |
| 45 to 54 Years | 550 (21.0%) | 1,808 (69.0%) |
| 55 to 64 Years | 1,198 (39.3%) | 1,728 (56.7%) |
| 65 to 74 Years | 2,226 (99.2%) | 1,112 (49.5%) |
| 75 Years and over | 1,345 (100.0%) | 633 (47.1%) |
| Total | 8,775 (44.6%) | 11,738 (59.6%) |
Disability Status by Sex by Age in Union County
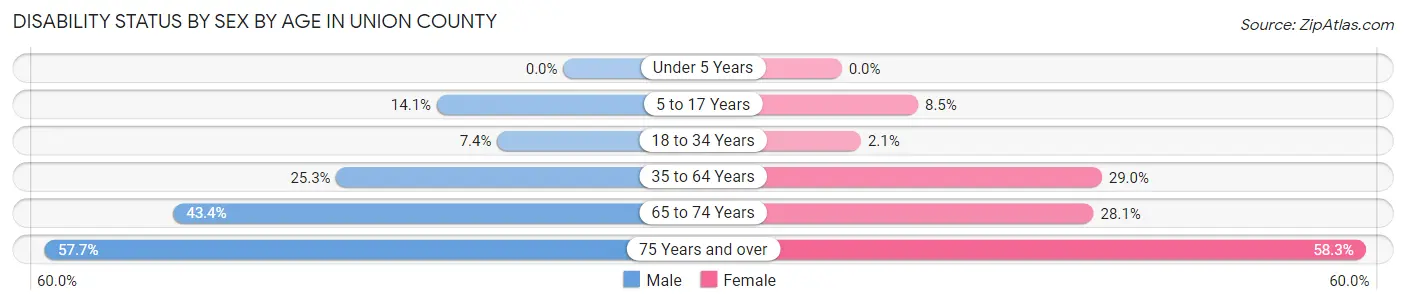
| Age Bracket | Male | Female |
| Under 5 Years | 0 (0.0%) | 0 (0.0%) |
| 5 to 17 Years | 225 (14.1%) | 141 (8.5%) |
| 18 to 34 Years | 146 (7.4%) | 39 (2.1%) |
| 35 to 64 Years | 1,001 (25.3%) | 1,178 (29.0%) |
| 65 to 74 Years | 490 (43.4%) | 313 (28.1%) |
| 75 Years and over | 322 (57.7%) | 459 (58.3%) |
Disability Class by Sex by Age in Union County
Disability Class: Hearing Difficulty

| Age Bracket | Male | Female |
| Under 5 Years | 0 (0.0%) | 0 (0.0%) |
| 5 to 17 Years | 15 (0.9%) | 5 (0.3%) |
| 18 to 34 Years | 12 (0.6%) | 0 (0.0%) |
| 35 to 64 Years | 189 (4.8%) | 90 (2.2%) |
| 65 to 74 Years | 223 (19.8%) | 58 (5.2%) |
| 75 Years and over | 148 (26.5%) | 264 (33.6%) |
Disability Class: Vision Difficulty
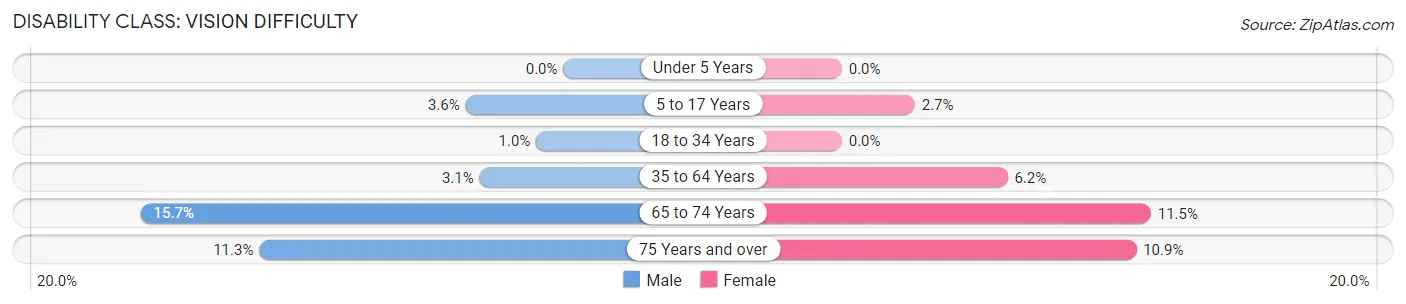
| Age Bracket | Male | Female |
| Under 5 Years | 0 (0.0%) | 0 (0.0%) |
| 5 to 17 Years | 58 (3.6%) | 45 (2.7%) |
| 18 to 34 Years | 20 (1.0%) | 0 (0.0%) |
| 35 to 64 Years | 123 (3.1%) | 250 (6.1%) |
| 65 to 74 Years | 177 (15.7%) | 128 (11.5%) |
| 75 Years and over | 63 (11.3%) | 86 (10.9%) |
Disability Class: Cognitive Difficulty
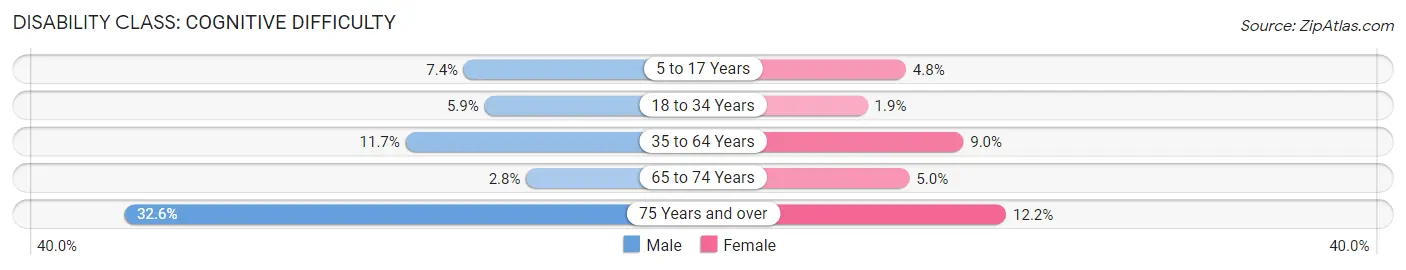
| Age Bracket | Male | Female |
| 5 to 17 Years | 118 (7.4%) | 79 (4.8%) |
| 18 to 34 Years | 116 (5.9%) | 35 (1.9%) |
| 35 to 64 Years | 464 (11.7%) | 367 (9.0%) |
| 65 to 74 Years | 31 (2.8%) | 56 (5.0%) |
| 75 Years and over | 182 (32.6%) | 96 (12.2%) |
Disability Class: Ambulatory Difficulty

| Age Bracket | Male | Female |
| 5 to 17 Years | 76 (4.8%) | 20 (1.2%) |
| 18 to 34 Years | 13 (0.7%) | 15 (0.8%) |
| 35 to 64 Years | 560 (14.1%) | 746 (18.3%) |
| 65 to 74 Years | 277 (24.6%) | 144 (12.9%) |
| 75 Years and over | 106 (19.0%) | 317 (40.3%) |
Disability Class: Self-Care Difficulty
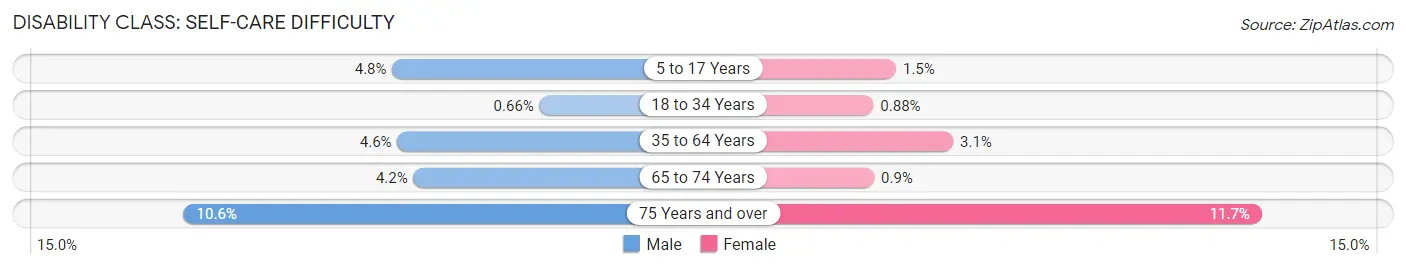
| Age Bracket | Male | Female |
| 5 to 17 Years | 76 (4.8%) | 25 (1.5%) |
| 18 to 34 Years | 13 (0.7%) | 16 (0.9%) |
| 35 to 64 Years | 183 (4.6%) | 126 (3.1%) |
| 65 to 74 Years | 47 (4.2%) | 10 (0.9%) |
| 75 Years and over | 59 (10.6%) | 92 (11.7%) |
Technology Access in Union County
Computing Device Access in Union County

| Device Type | # Households | % Households |
| Desktop or Laptop | 4,706 | 62.3% |
| Smartphone | 6,209 | 82.2% |
| Tablet | 3,688 | 48.8% |
| No Computing Device | 850 | 11.3% |
| Total | 7,552 | 100.0% |
Internet Access in Union County

| Internet Type | # Households | % Households |
| Dial-Up Internet | 52 | 0.7% |
| Broadband Home | 3,301 | 43.7% |
| Cellular Data Only | 1,541 | 20.4% |
| Satellite Internet | 782 | 10.3% |
| No Internet | 1,934 | 25.6% |
| Total | 7,552 | 100.0% |
Union County Summary
Introduction
Union County is located in the northeastern corner of Tennessee and is part of the Appalachian region. It is bordered by Kentucky to the north, Virginia to the east, and North Carolina to the south. The county seat is Maynardville, and the largest city is Luttrell. Union County is home to a diverse population of approximately 19,000 people. The county is known for its rural beauty, with rolling hills, lush forests, and abundant wildlife.
History
Union County was formed in 1856 from parts of Grainger, Claiborne, and Campbell counties. It was named for the union of the United States during the Civil War. The county was home to several Native American tribes, including the Cherokee, Chickasaw, and Shawnee. The first settlers arrived in the late 1700s, and the county was officially established in 1856.
The county was largely agricultural in the 19th century, with tobacco, corn, and wheat being the main crops. The county also had several small industries, including sawmills, gristmills, and tanneries. The county was also home to several small towns, including Maynardville, Luttrell, and Sharps Chapel.
Geography
Union County is located in the Appalachian region of Tennessee. It is bordered by Kentucky to the north, Virginia to the east, and North Carolina to the south. The county is mostly rural, with rolling hills, lush forests, and abundant wildlife. The county is home to several rivers, including the Clinch, Powell, and Emory. The county is also home to several state parks, including Big Ridge State Park and Norris Dam State Park.
Economy
Union County’s economy is largely based on agriculture and tourism. The county is home to several farms, which produce a variety of crops, including tobacco, corn, and wheat. The county is also home to several small businesses, including restaurants, retail stores, and service providers. The county is also home to several manufacturing companies, including a furniture factory and a plastics plant.
The county is also home to several tourist attractions, including Norris Dam State Park, Big Ridge State Park, and the Union County Museum. The county is also home to several festivals, including the Union County Fair and the Maynardville Music Festival.
Demographics
As of the 2010 census, Union County had a population of 19,109. The racial makeup of the county was 95.3% White, 1.7% African American, 0.3% Native American, 0.3% Asian, 0.1% Pacific Islander, 1.2% from other races, and 1.3% from two or more races. Hispanic or Latino of any race were 2.7% of the population.
The median income for a household in the county was $35,945, and the median income for a family was $41,945. The per capita income for the county was $17,845. About 15.2% of families and 18.3% of the population were below the poverty line, including 25.2% of those under age 18 and 14.2% of those age 65 or over.
Conclusion
Union County is a rural county located in the Appalachian region of Tennessee. It is home to a diverse population of approximately 19,000 people. The county is known for its rural beauty, with rolling hills, lush forests, and abundant wildlife. The county’s economy is largely based on agriculture and tourism, and it is home to several tourist attractions, including Norris Dam State Park, Big Ridge State Park, and the Union County Museum. The county has a median income of $35,945 and a poverty rate of 15.2%.
Common Questions
What is the Total Population of Union County?
Total Population of Union County is 19,860.
What is the Total Male Population of Union County?
Total Male Population of Union County is 9,880.
What is the Total Female Population of Union County?
Total Female Population of Union County is 9,980.
What is the Ratio of Males per 100 Females in Union County?
There are 99.00 Males per 100 Females in Union County.
What is the Ratio of Females per 100 Males in Union County?
There are 101.01 Females per 100 Males in Union County.
What is the Median Population Age in Union County?
Median Population Age in Union County is 42.6 Years.
What is the Average Family Size in Union County
Average Family Size in Union County is 2.9 People.
What is the Average Household Size in Union County
Average Household Size in Union County is 2.6 People.
What is Per Capita Income in Union County?
Per Capita income in Union County is $28,174.
What is the Median Family Income in Union County?
Median Family Income in Union County is $63,792.
What is the Median Household income in Union County?
Median Household Income in Union County is $57,094.
What is Income or Wage Gap in Union County?
Income or Wage Gap in Union County is 26.1%.
Women in Union County earn 73.9 cents for every dollar earned by a man.
What is Family Income Deficit in Union County?
Family Income Deficit in Union County is $9,786.
Families that are below poverty line in Union County earn $9,786 less on average than the poverty threshold level.
What is Inequality or Gini Index in Union County?
Inequality or Gini Index in Union County is 0.44.
How Large is the Labor Force in Union County?
There are 8,674 People in the Labor Forcein in Union County.
What is the Percentage of People in the Labor Force in Union County?
53.8% of People are in the Labor Force in Union County.
What is the Unemployment Rate in Union County?
Unemployment Rate in Union County is 5.7%.