Unicoi County, TN
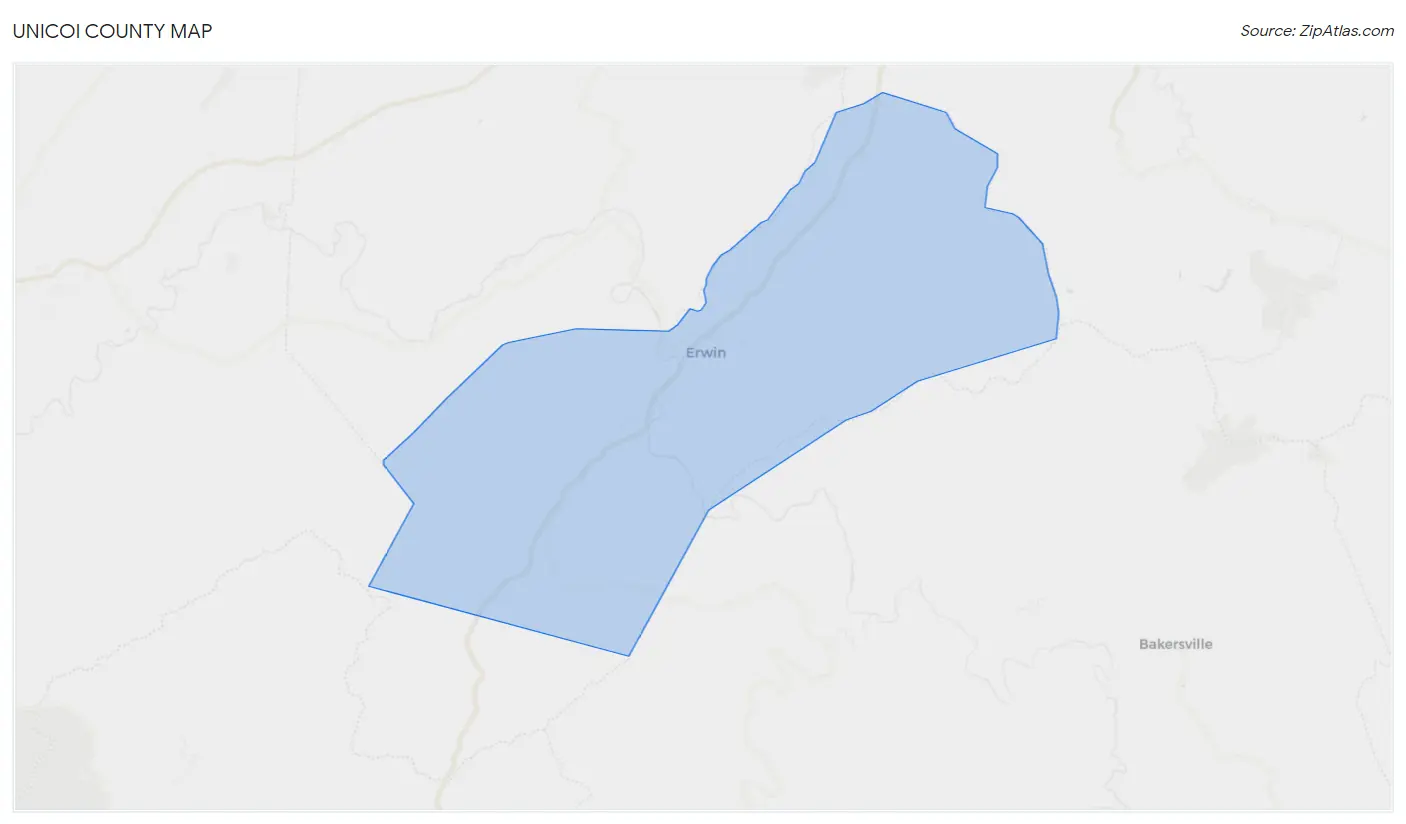
Unicoi County Map
Unicoi County Overview
17,845
TOTAL POPULATION
9,004
MALE POPULATION
8,841
FEMALE POPULATION
101.84
MALES / 100 FEMALES
98.19
FEMALES / 100 MALES
47.4
MEDIAN AGE
2.8
AVG FAMILY SIZE
2.3
AVG HOUSEHOLD SIZE
$27,930
PER CAPITA INCOME
$66,886
AVG FAMILY INCOME
$49,855
AVG HOUSEHOLD INCOME
22.7%
WAGE / INCOME GAP [ % ]
77.3¢/ $1
WAGE / INCOME GAP [ $ ]
$11,711
FAMILY INCOME DEFICIT
0.46
INEQUALITY / GINI INDEX
8,106
LABOR FORCE [ PEOPLE ]
54.2%
PERCENT IN LABOR FORCE
5.4%
UNEMPLOYMENT RATE
Unicoi County Area Codes
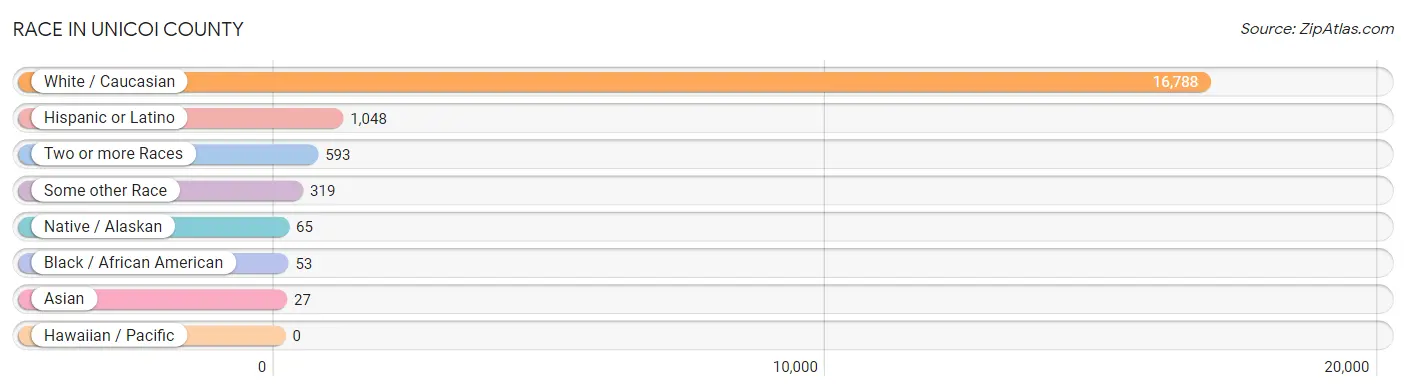
Race in Unicoi County
The most populous races in Unicoi County are White / Caucasian (16,788 | 94.1%), Hispanic or Latino (1,048 | 5.9%), and Two or more Races (593 | 3.3%).
| Race | # Population | % Population |
| Asian | 27 | 0.2% |
| Black / African American | 53 | 0.3% |
| Hawaiian / Pacific | 0 | 0.0% |
| Hispanic or Latino | 1,048 | 5.9% |
| Native / Alaskan | 65 | 0.4% |
| White / Caucasian | 16,788 | 94.1% |
| Two or more Races | 593 | 3.3% |
| Some other Race | 319 | 1.8% |
| Total | 17,845 | 100.0% |
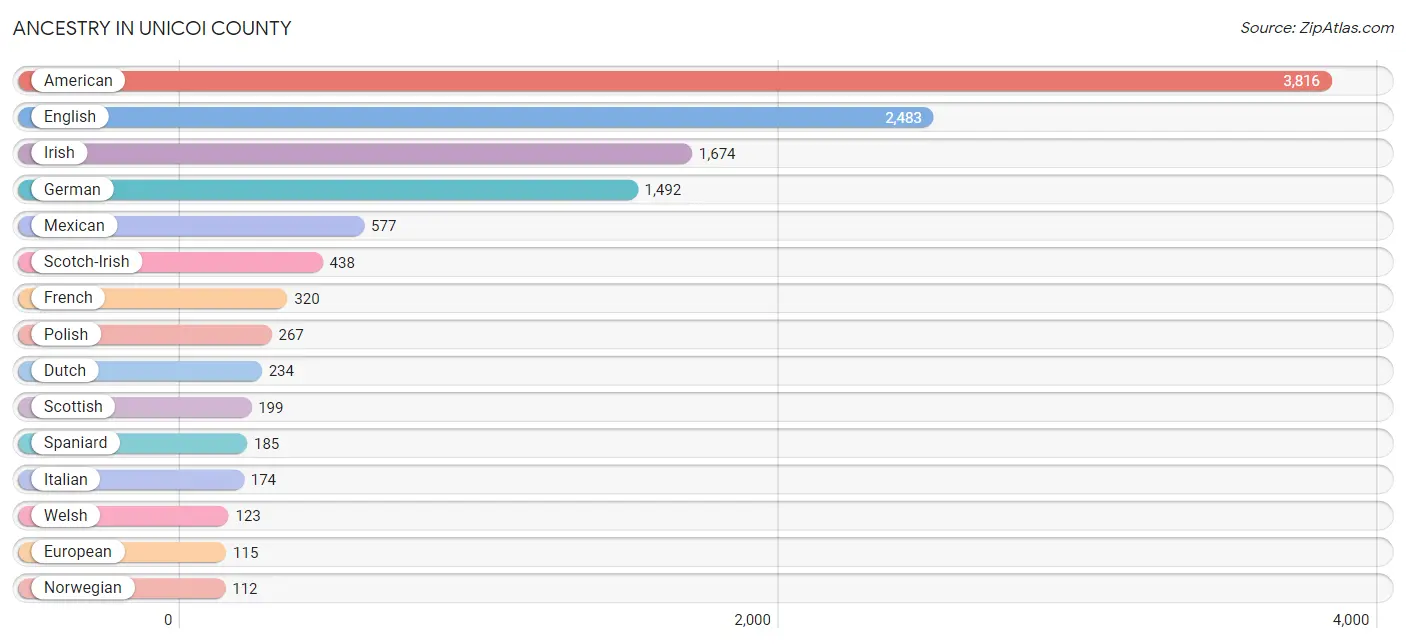
Ancestry in Unicoi County
The most populous ancestries reported in Unicoi County are American (3,816 | 21.4%), English (2,483 | 13.9%), Irish (1,674 | 9.4%), German (1,492 | 8.4%), and Mexican (577 | 3.2%), together accounting for 56.3% of all Unicoi County residents.
| Ancestry | # Population | % Population |
| American | 3,816 | 21.4% |
| Apache | 7 | 0.0% |
| British | 73 | 0.4% |
| Burmese | 9 | 0.1% |
| Central American | 74 | 0.4% |
| Cherokee | 111 | 0.6% |
| Choctaw | 16 | 0.1% |
| Cuban | 42 | 0.2% |
| Dutch | 234 | 1.3% |
| Eastern European | 49 | 0.3% |
| English | 2,483 | 13.9% |
| European | 115 | 0.6% |
| French | 320 | 1.8% |
| French Canadian | 15 | 0.1% |
| German | 1,492 | 8.4% |
| Honduran | 74 | 0.4% |
| Hungarian | 12 | 0.1% |
| Indian (Asian) | 27 | 0.2% |
| Irish | 1,674 | 9.4% |
| Italian | 174 | 1.0% |
| Jamaican | 18 | 0.1% |
| Mexican | 577 | 3.2% |
| Norwegian | 112 | 0.6% |
| Polish | 267 | 1.5% |
| Portuguese | 20 | 0.1% |
| Puerto Rican | 88 | 0.5% |
| Russian | 25 | 0.1% |
| Scandinavian | 35 | 0.2% |
| Scotch-Irish | 438 | 2.5% |
| Scottish | 199 | 1.1% |
| Slavic | 17 | 0.1% |
| Spaniard | 185 | 1.0% |
| Trinidadian and Tobagonian | 22 | 0.1% |
| Welsh | 123 | 0.7% | View All 34 Rows |
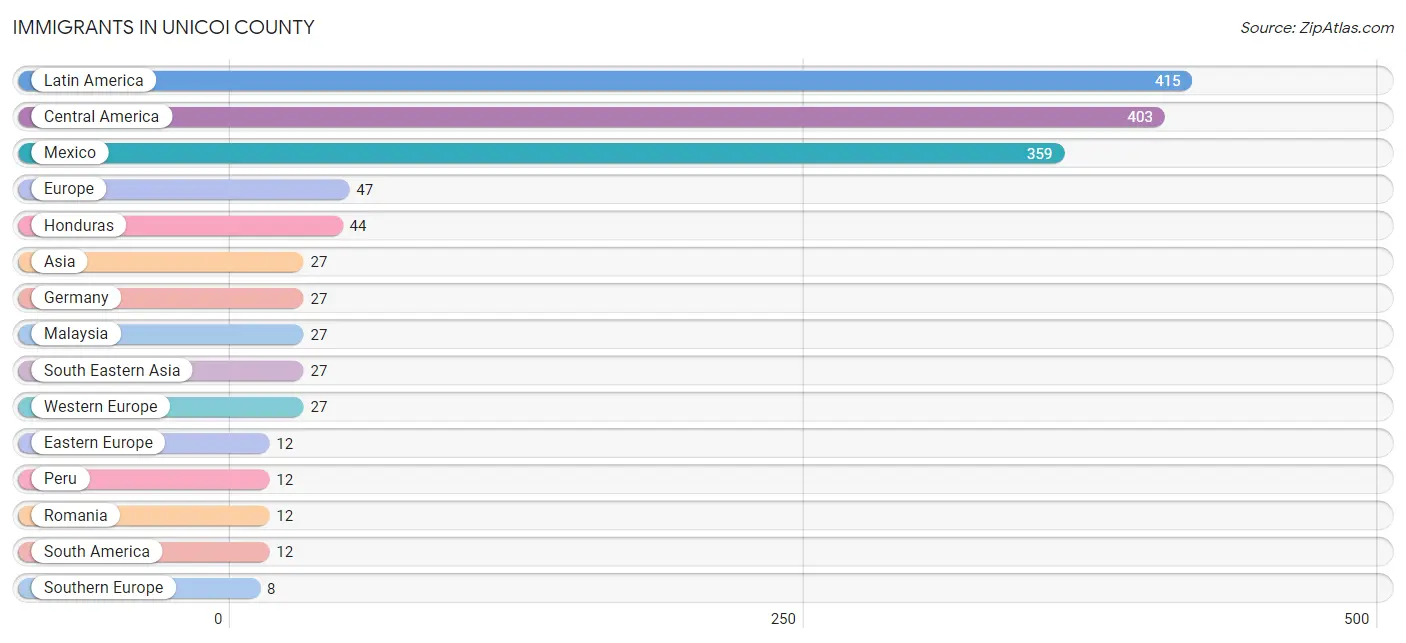
Immigrants in Unicoi County
The most numerous immigrant groups reported in Unicoi County came from Latin America (415 | 2.3%), Central America (403 | 2.3%), Mexico (359 | 2.0%), Europe (47 | 0.3%), and Honduras (44 | 0.3%), together accounting for 7.1% of all Unicoi County residents.
| Immigration Origin | # Population | % Population |
| Asia | 27 | 0.2% |
| Central America | 403 | 2.3% |
| Eastern Europe | 12 | 0.1% |
| Europe | 47 | 0.3% |
| Germany | 27 | 0.2% |
| Honduras | 44 | 0.3% |
| Latin America | 415 | 2.3% |
| Malaysia | 27 | 0.2% |
| Mexico | 359 | 2.0% |
| Peru | 12 | 0.1% |
| Romania | 12 | 0.1% |
| South America | 12 | 0.1% |
| South Eastern Asia | 27 | 0.2% |
| Southern Europe | 8 | 0.0% |
| Spain | 8 | 0.0% |
| Western Europe | 27 | 0.2% | View All 16 Rows |
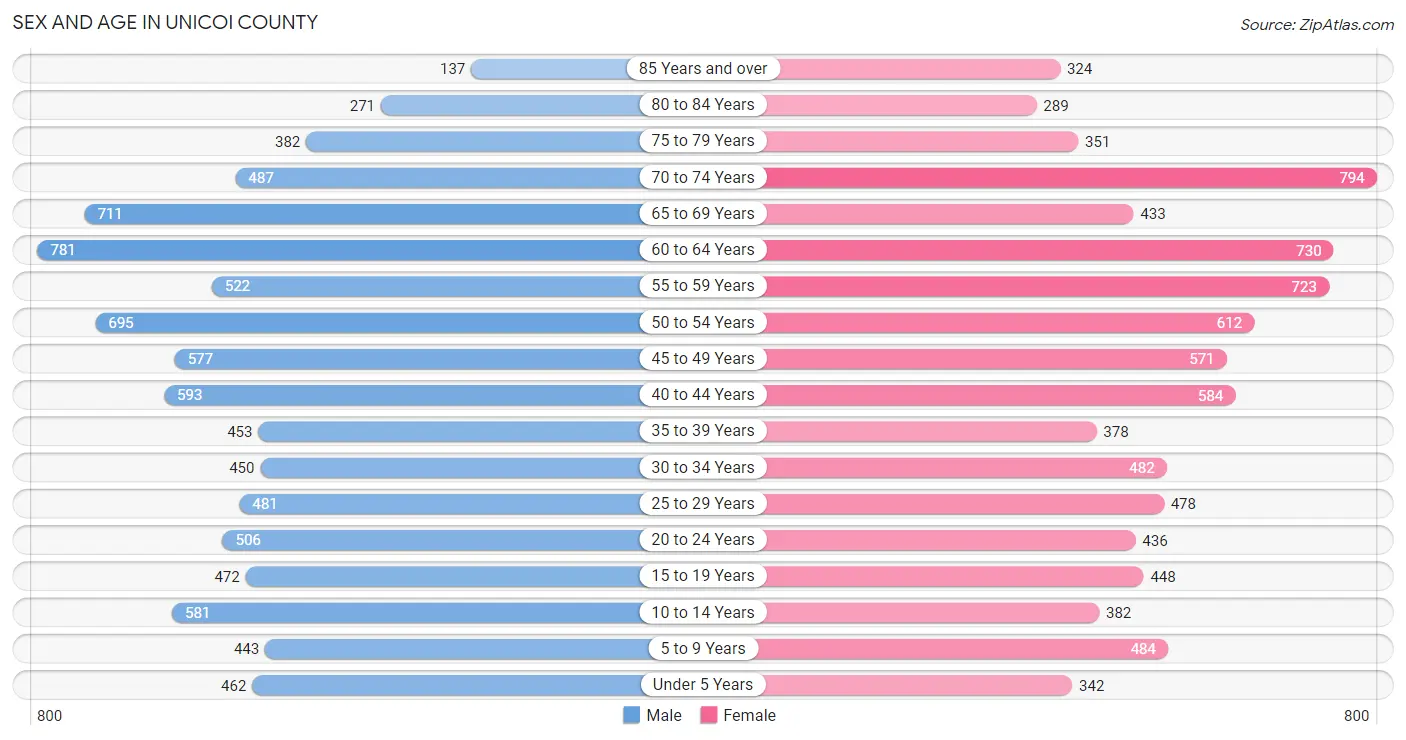
Sex and Age in Unicoi County
Sex and Age in Unicoi County
The most populous age groups in Unicoi County are 60 to 64 Years (781 | 8.7%) for men and 70 to 74 Years (794 | 9.0%) for women.
| Age Bracket | Male | Female |
| Under 5 Years | 462 (5.1%) | 342 (3.9%) |
| 5 to 9 Years | 443 (4.9%) | 484 (5.5%) |
| 10 to 14 Years | 581 (6.5%) | 382 (4.3%) |
| 15 to 19 Years | 472 (5.2%) | 448 (5.1%) |
| 20 to 24 Years | 506 (5.6%) | 436 (4.9%) |
| 25 to 29 Years | 481 (5.3%) | 478 (5.4%) |
| 30 to 34 Years | 450 (5.0%) | 482 (5.4%) |
| 35 to 39 Years | 453 (5.0%) | 378 (4.3%) |
| 40 to 44 Years | 593 (6.6%) | 584 (6.6%) |
| 45 to 49 Years | 577 (6.4%) | 571 (6.5%) |
| 50 to 54 Years | 695 (7.7%) | 612 (6.9%) |
| 55 to 59 Years | 522 (5.8%) | 723 (8.2%) |
| 60 to 64 Years | 781 (8.7%) | 730 (8.3%) |
| 65 to 69 Years | 711 (7.9%) | 433 (4.9%) |
| 70 to 74 Years | 487 (5.4%) | 794 (9.0%) |
| 75 to 79 Years | 382 (4.2%) | 351 (4.0%) |
| 80 to 84 Years | 271 (3.0%) | 289 (3.3%) |
| 85 Years and over | 137 (1.5%) | 324 (3.7%) |
| Total | 9,004 (100.0%) | 8,841 (100.0%) |
Families and Households in Unicoi County
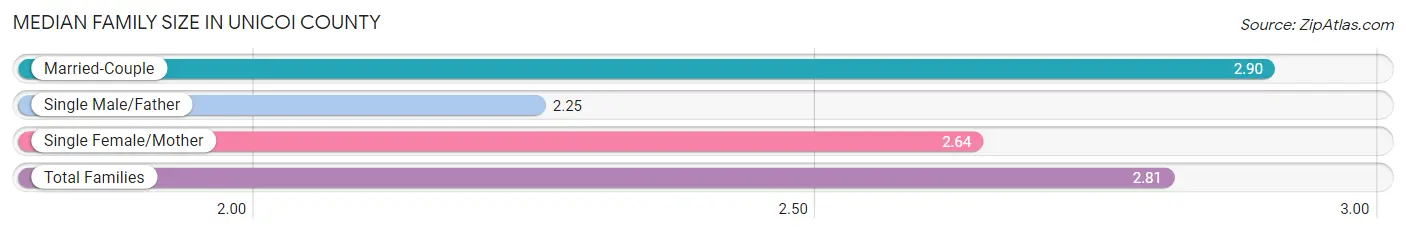
Median Family Size in Unicoi County
The median family size in Unicoi County is 2.81 persons per family, with married-couple families (3,837 | 78.4%) accounting for the largest median family size of 2.9 persons per family. On the other hand, single male/father families (353 | 7.2%) represent the smallest median family size with 2.25 persons per family.
| Family Type | # Families | Family Size |
| Married-Couple | 3,837 (78.4%) | 2.90 |
| Single Male/Father | 353 (7.2%) | 2.25 |
| Single Female/Mother | 704 (14.4%) | 2.64 |
| Total Families | 4,894 (100.0%) | 2.81 |
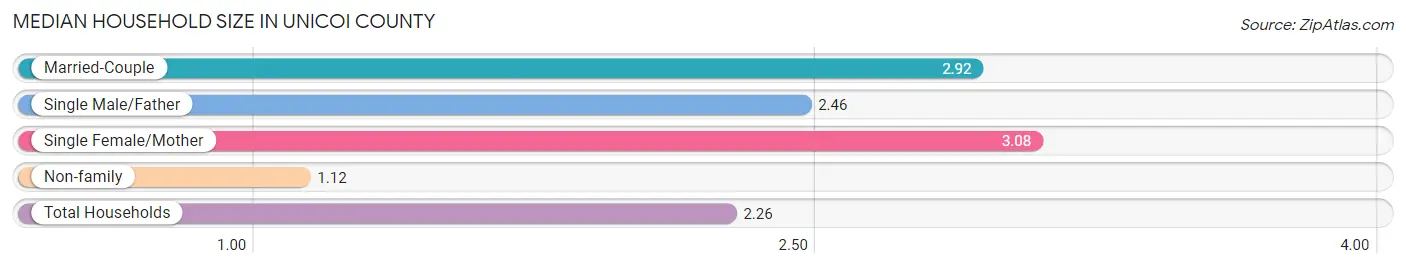
Median Household Size in Unicoi County
The median household size in Unicoi County is 2.26 persons per household, with single female/mother households (704 | 9.2%) accounting for the largest median household size of 3.08 persons per household. non-family households (2,760 | 36.1%) represent the smallest median household size with 1.12 persons per household.
| Household Type | # Households | Household Size |
| Married-Couple | 3,837 (50.1%) | 2.92 |
| Single Male/Father | 353 (4.6%) | 2.46 |
| Single Female/Mother | 704 (9.2%) | 3.08 |
| Non-family | 2,760 (36.1%) | 1.12 |
| Total Households | 7,654 (100.0%) | 2.26 |
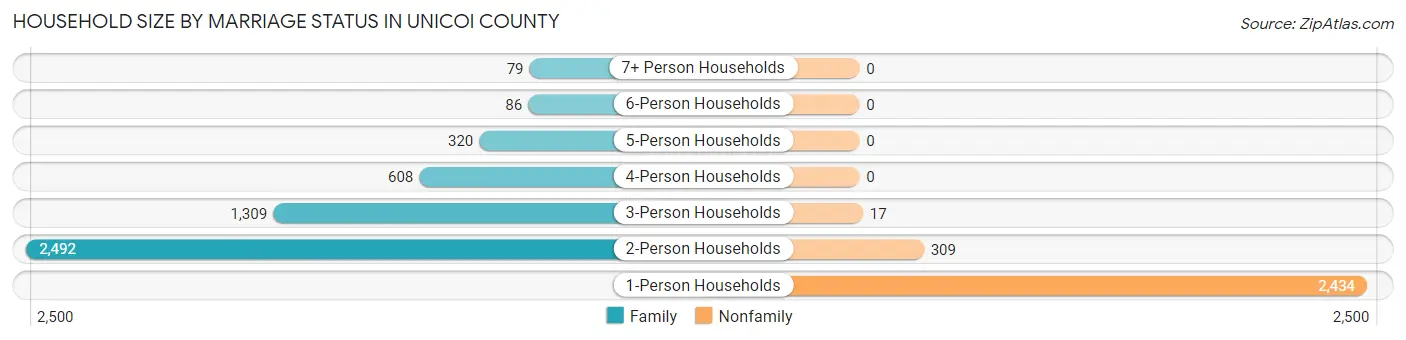
Household Size by Marriage Status in Unicoi County
Out of a total of 7,654 households in Unicoi County, 4,894 (63.9%) are family households, while 2,760 (36.1%) are nonfamily households. The most numerous type of family households are 2-person households, comprising 2,492, and the most common type of nonfamily households are 1-person households, comprising 2,434.
| Household Size | Family Households | Nonfamily Households |
| 1-Person Households | - | 2,434 (31.8%) |
| 2-Person Households | 2,492 (32.6%) | 309 (4.0%) |
| 3-Person Households | 1,309 (17.1%) | 17 (0.2%) |
| 4-Person Households | 608 (7.9%) | 0 (0.0%) |
| 5-Person Households | 320 (4.2%) | 0 (0.0%) |
| 6-Person Households | 86 (1.1%) | 0 (0.0%) |
| 7+ Person Households | 79 (1.0%) | 0 (0.0%) |
| Total | 4,894 (63.9%) | 2,760 (36.1%) |
Female Fertility in Unicoi County
Fertility by Age in Unicoi County
Average fertility rate in Unicoi County is 32.0 births per 1,000 women. Women in the age bracket of 35 to 50 years have the highest fertility rate with 57.0 births per 1,000 women. Women in the age bracket of 35 to 50 years acount for 85.2% of all women with births.
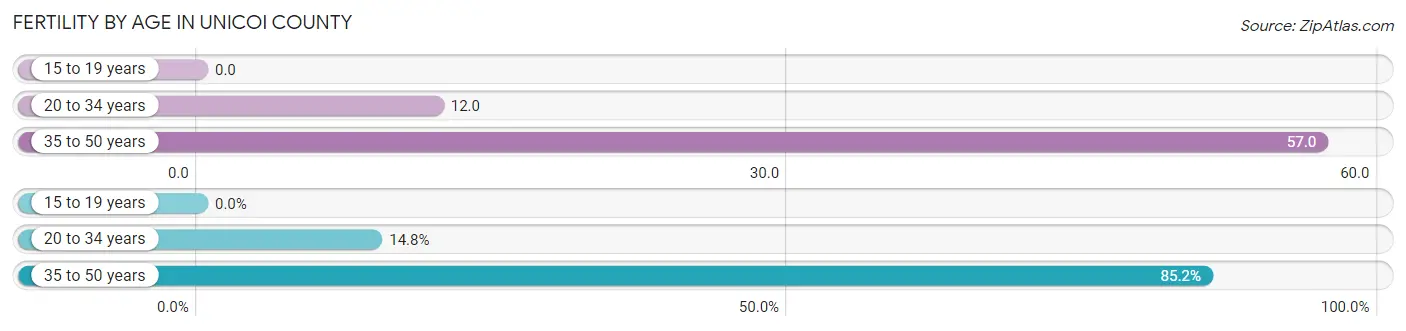
| Age Bracket | Women with Births | Births / 1,000 Women |
| 15 to 19 years | 0 (0.0%) | 0.0 |
| 20 to 34 years | 17 (14.8%) | 12.0 |
| 35 to 50 years | 98 (85.2%) | 57.0 |
| Total | 115 (100.0%) | 32.0 |
Fertility by Age by Marriage Status in Unicoi County
36.5% of women with births (115) in Unicoi County are married. The highest percentage of unmarried women with births falls into 20 to 34 years age bracket with 100.0% of them unmarried at the time of birth, while the lowest percentage of unmarried women with births belong to 35 to 50 years age bracket with 57.1% of them unmarried.
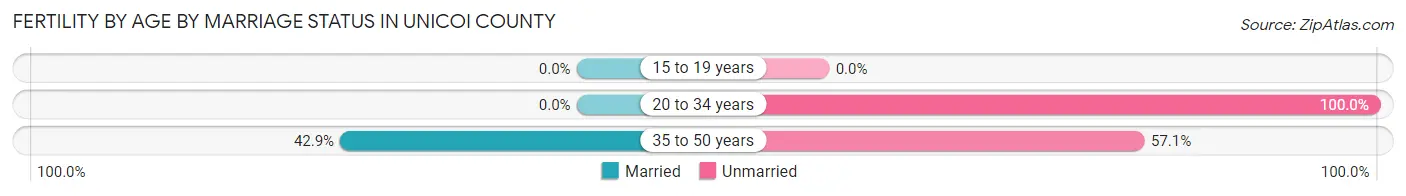
| Age Bracket | Married | Unmarried |
| 15 to 19 years | 0 (0.0%) | 0 (0.0%) |
| 20 to 34 years | 0 (0.0%) | 17 (100.0%) |
| 35 to 50 years | 42 (42.9%) | 56 (57.1%) |
| Total | 42 (36.5%) | 73 (63.5%) |
Fertility by Education in Unicoi County
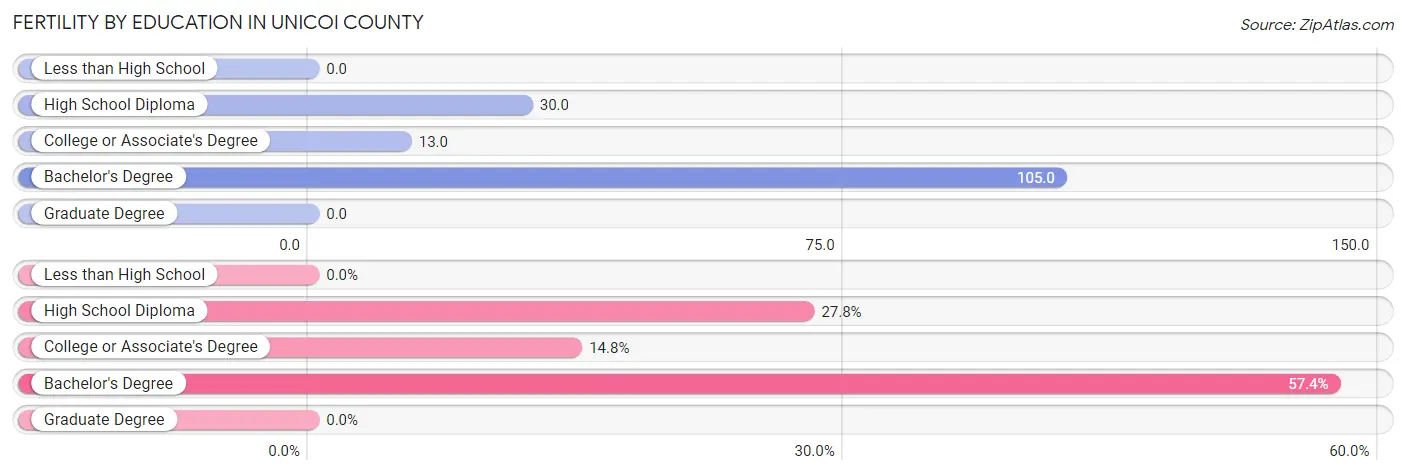
| Educational Attainment | Women with Births | Births / 1,000 Women |
| Less than High School | 0 (0.0%) | 0.0 |
| High School Diploma | 32 (27.8%) | 30.0 |
| College or Associate's Degree | 17 (14.8%) | 13.0 |
| Bachelor's Degree | 66 (57.4%) | 105.0 |
| Graduate Degree | 0 (0.0%) | 0.0 |
| Total | 115 (100.0%) | 32.0 |
Fertility by Education by Marriage Status in Unicoi County
63.5% of women with births in Unicoi County are unmarried. Women with the educational attainment of bachelor's degree are most likely to be married with 63.6% of them married at childbirth, while women with the educational attainment of high school diploma are least likely to be married with 100.0% of them unmarried at childbirth.
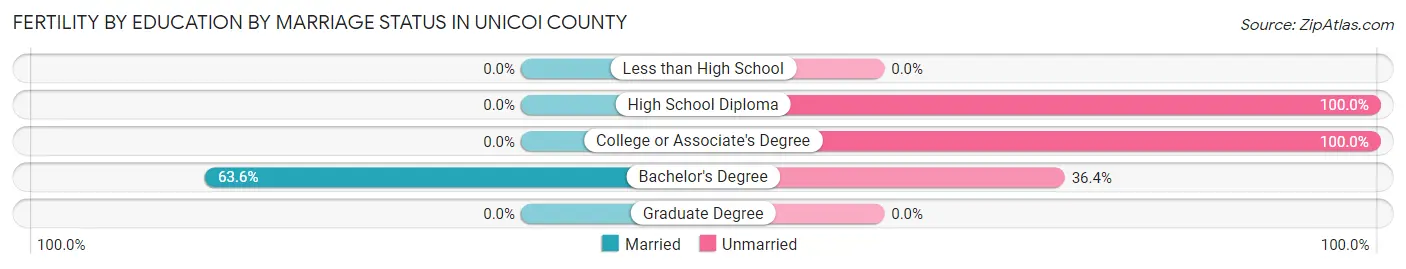
| Educational Attainment | Married | Unmarried |
| Less than High School | 0 (0.0%) | 0 (0.0%) |
| High School Diploma | 0 (0.0%) | 32 (100.0%) |
| College or Associate's Degree | 0 (0.0%) | 17 (100.0%) |
| Bachelor's Degree | 42 (63.6%) | 24 (36.4%) |
| Graduate Degree | 0 (0.0%) | 0 (0.0%) |
| Total | 42 (36.5%) | 73 (63.5%) |
Income in Unicoi County
Income Overview in Unicoi County
Per Capita Income in Unicoi County is $27,930, while median incomes of families and households are $66,886 and $49,855 respectively.
| Characteristic | Number | Measure |
| Per Capita Income | 17,845 | $27,930 |
| Median Family Income | 4,894 | $66,886 |
| Mean Family Income | 4,894 | $78,911 |
| Median Household Income | 7,654 | $49,855 |
| Mean Household Income | 7,654 | $64,470 |
| Income Deficit | 4,894 | $11,711 |
| Wage / Income Gap (%) | 17,845 | 22.72% |
| Wage / Income Gap ($) | 17,845 | 77.28¢ per $1 |
| Gini / Inequality Index | 17,845 | 0.46 |
Earnings by Sex in Unicoi County
Average Earnings in Unicoi County are $34,851, $38,899 for men and $30,061 for women, a difference of 22.7%.
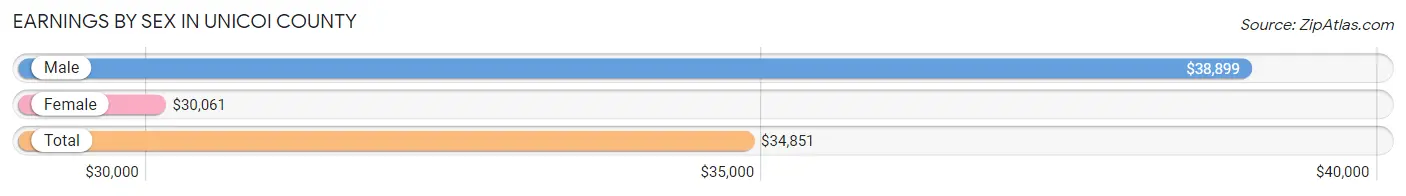
| Sex | Number | Average Earnings |
| Male | 4,532 (53.5%) | $38,899 |
| Female | 3,940 (46.5%) | $30,061 |
| Total | 8,472 (100.0%) | $34,851 |
Earnings by Sex by Income Bracket in Unicoi County
The most common earnings brackets in Unicoi County are $65,000 to $74,999 for men (564 | 12.4%) and $35,000 to $39,999 for women (327 | 8.3%).
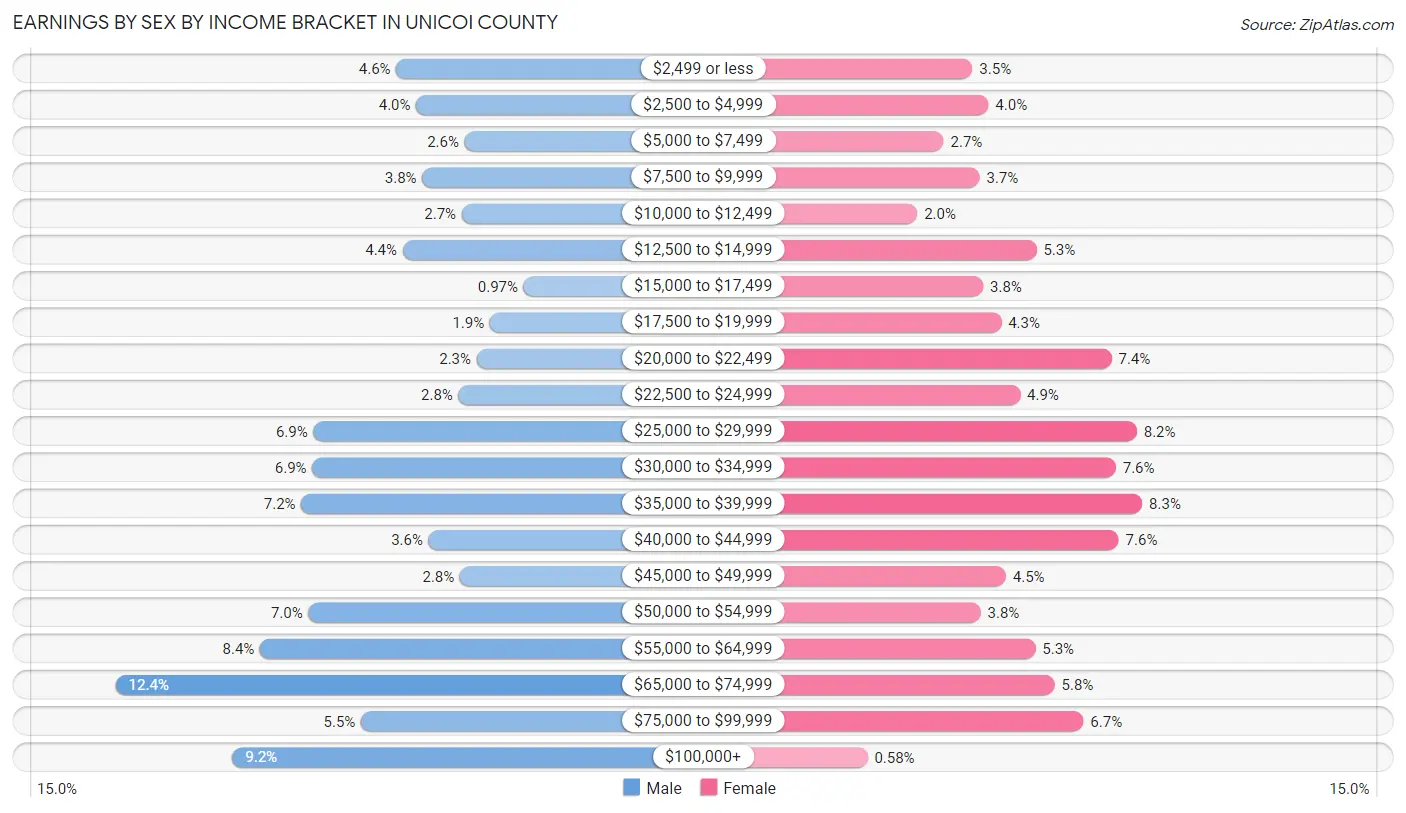
| Income | Male | Female |
| $2,499 or less | 206 (4.5%) | 139 (3.5%) |
| $2,500 to $4,999 | 181 (4.0%) | 157 (4.0%) |
| $5,000 to $7,499 | 119 (2.6%) | 107 (2.7%) |
| $7,500 to $9,999 | 173 (3.8%) | 147 (3.7%) |
| $10,000 to $12,499 | 123 (2.7%) | 78 (2.0%) |
| $12,500 to $14,999 | 198 (4.4%) | 210 (5.3%) |
| $15,000 to $17,499 | 44 (1.0%) | 151 (3.8%) |
| $17,500 to $19,999 | 87 (1.9%) | 171 (4.3%) |
| $20,000 to $22,499 | 104 (2.3%) | 293 (7.4%) |
| $22,500 to $24,999 | 127 (2.8%) | 192 (4.9%) |
| $25,000 to $29,999 | 312 (6.9%) | 321 (8.2%) |
| $30,000 to $34,999 | 313 (6.9%) | 298 (7.6%) |
| $35,000 to $39,999 | 327 (7.2%) | 327 (8.3%) |
| $40,000 to $44,999 | 165 (3.6%) | 301 (7.6%) |
| $45,000 to $49,999 | 125 (2.8%) | 176 (4.5%) |
| $50,000 to $54,999 | 318 (7.0%) | 148 (3.8%) |
| $55,000 to $64,999 | 380 (8.4%) | 209 (5.3%) |
| $65,000 to $74,999 | 564 (12.4%) | 230 (5.8%) |
| $75,000 to $99,999 | 251 (5.5%) | 262 (6.7%) |
| $100,000+ | 415 (9.2%) | 23 (0.6%) |
| Total | 4,532 (100.0%) | 3,940 (100.0%) |
Earnings by Sex by Educational Attainment in Unicoi County
Average earnings in Unicoi County are $46,165 for men and $33,487 for women, a difference of 27.5%. Men with an educational attainment of graduate degree enjoy the highest average annual earnings of $65,167, while those with high school diploma education earn the least with $36,119. Women with an educational attainment of graduate degree earn the most with the average annual earnings of $66,910, while those with high school diploma education have the smallest earnings of $24,554.
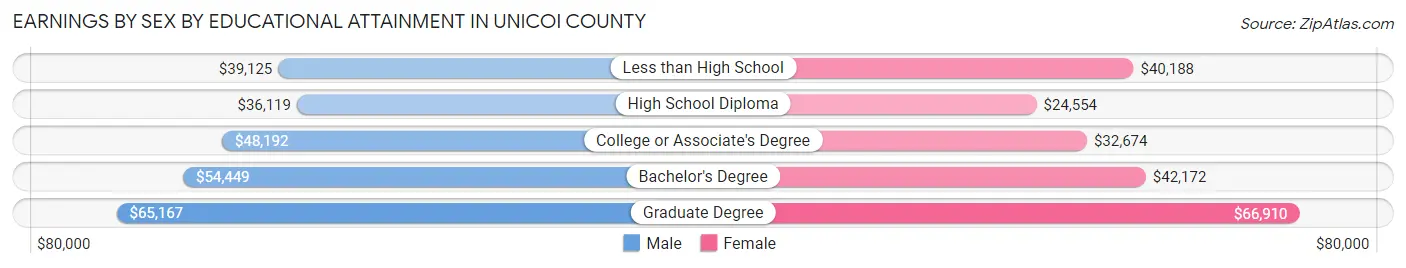
| Educational Attainment | Male Income | Female Income |
| Less than High School | $39,125 | $40,188 |
| High School Diploma | $36,119 | $24,554 |
| College or Associate's Degree | $48,192 | $32,674 |
| Bachelor's Degree | $54,449 | $42,172 |
| Graduate Degree | $65,167 | $66,910 |
| Total | $46,165 | $33,487 |
Family Income in Unicoi County
Family Income Brackets in Unicoi County
According to the Unicoi County family income data, there are 945 families falling into the $100,000 to $149,999 income range, which is the most common income bracket and makes up 19.3% of all families. Conversely, the $10,000 to $14,999 income bracket is the least frequent group with only 39 families (0.8%) belonging to this category.
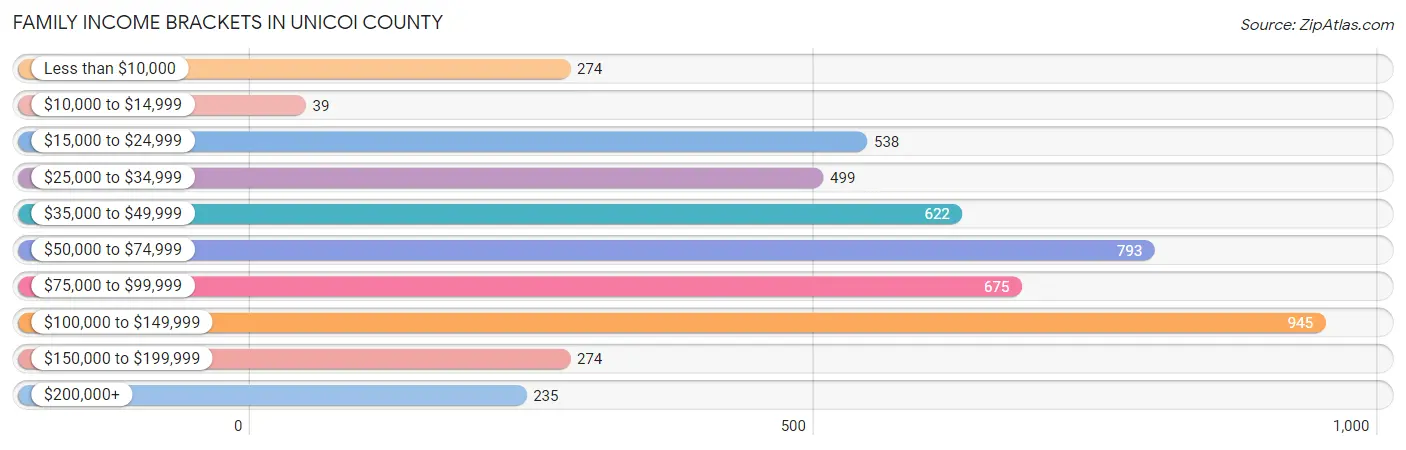
| Income Bracket | # Families | % Families |
| Less than $10,000 | 274 | 5.6% |
| $10,000 to $14,999 | 39 | 0.8% |
| $15,000 to $24,999 | 538 | 11.0% |
| $25,000 to $34,999 | 499 | 10.2% |
| $35,000 to $49,999 | 622 | 12.7% |
| $50,000 to $74,999 | 793 | 16.2% |
| $75,000 to $99,999 | 675 | 13.8% |
| $100,000 to $149,999 | 945 | 19.3% |
| $150,000 to $199,999 | 274 | 5.6% |
| $200,000+ | 235 | 4.8% |
Family Income by Famaliy Size in Unicoi County
7+ person families (79 | 1.6%) account for the highest median family income in Unicoi County with $113,188 per family, while 2-person families (2,619 | 53.5%) have the highest median income of $27,812 per family member.
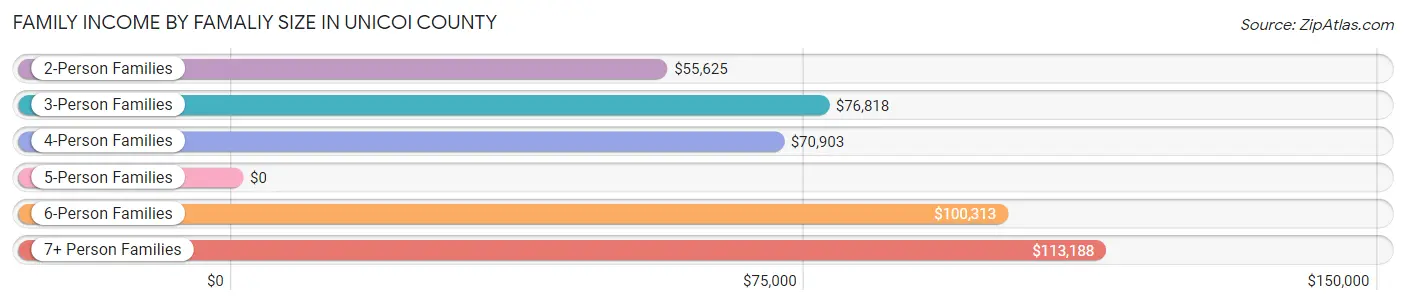
| Income Bracket | # Families | Median Income |
| 2-Person Families | 2,619 (53.5%) | $55,625 |
| 3-Person Families | 1,318 (26.9%) | $76,818 |
| 4-Person Families | 565 (11.5%) | $70,903 |
| 5-Person Families | 281 (5.7%) | $0 |
| 6-Person Families | 32 (0.6%) | $100,313 |
| 7+ Person Families | 79 (1.6%) | $113,188 |
| Total | 4,894 (100.0%) | $66,886 |
Family Income by Number of Earners in Unicoi County
The median family income in Unicoi County is $66,886, with families comprising 3+ earners (379) having the highest median family income of $141,964, while families with no earners (1,018) have the lowest median family income of $30,214, accounting for 7.7% and 20.8% of families, respectively.
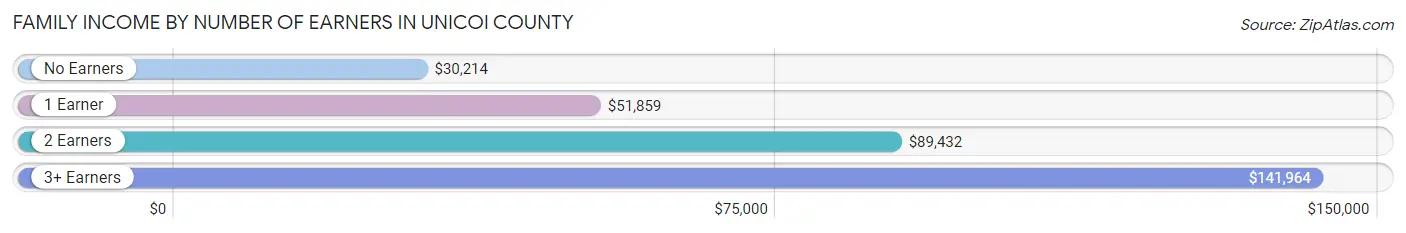
| Number of Earners | # Families | Median Income |
| No Earners | 1,018 (20.8%) | $30,214 |
| 1 Earner | 1,651 (33.7%) | $51,859 |
| 2 Earners | 1,846 (37.7%) | $89,432 |
| 3+ Earners | 379 (7.7%) | $141,964 |
| Total | 4,894 (100.0%) | $66,886 |
Household Income in Unicoi County
Household Income Brackets in Unicoi County
With 1,362 households falling in the category, the $50,000 to $74,999 income range is the most frequent in Unicoi County, accounting for 17.8% of all households. In contrast, only 253 households (3.3%) fall into the $200,000+ income bracket, making it the least populous group.
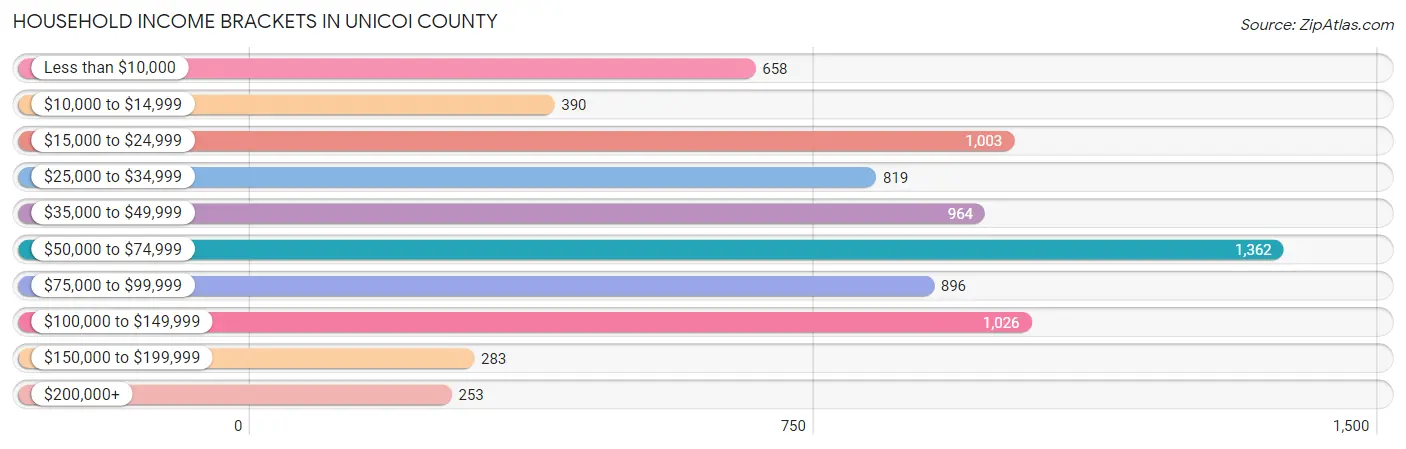
| Income Bracket | # Households | % Households |
| Less than $10,000 | 658 | 8.6% |
| $10,000 to $14,999 | 390 | 5.1% |
| $15,000 to $24,999 | 1,003 | 13.1% |
| $25,000 to $34,999 | 819 | 10.7% |
| $35,000 to $49,999 | 964 | 12.6% |
| $50,000 to $74,999 | 1,362 | 17.8% |
| $75,000 to $99,999 | 896 | 11.7% |
| $100,000 to $149,999 | 1,026 | 13.4% |
| $150,000 to $199,999 | 283 | 3.7% |
| $200,000+ | 253 | 3.3% |
Household Income by Householder Age in Unicoi County
The median household income in Unicoi County is $49,855, with the highest median household income of $63,370 found in the 25 to 44 years age bracket for the primary householder. A total of 1,840 households (24.0%) fall into this category. Meanwhile, the 15 to 24 years age bracket for the primary householder has the lowest median household income of $18,575, with 235 households (3.1%) in this group.
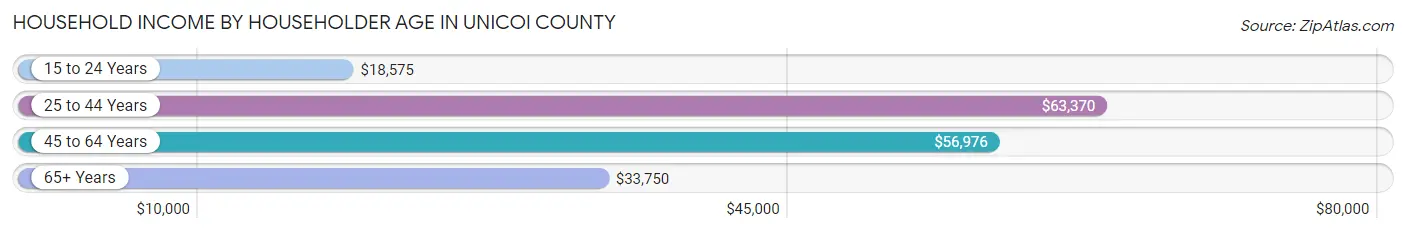
| Income Bracket | # Households | Median Income |
| 15 to 24 Years | 235 (3.1%) | $18,575 |
| 25 to 44 Years | 1,840 (24.0%) | $63,370 |
| 45 to 64 Years | 2,957 (38.6%) | $56,976 |
| 65+ Years | 2,622 (34.3%) | $33,750 |
| Total | 7,654 (100.0%) | $49,855 |
Poverty in Unicoi County
Income Below Poverty by Sex and Age in Unicoi County
With 16.5% poverty level for males and 16.8% for females among the residents of Unicoi County, 12 to 14 year old males and 15 year old females are the most vulnerable to poverty, with 140 males (46.7%) and 51 females (37.2%) in their respective age groups living below the poverty level.
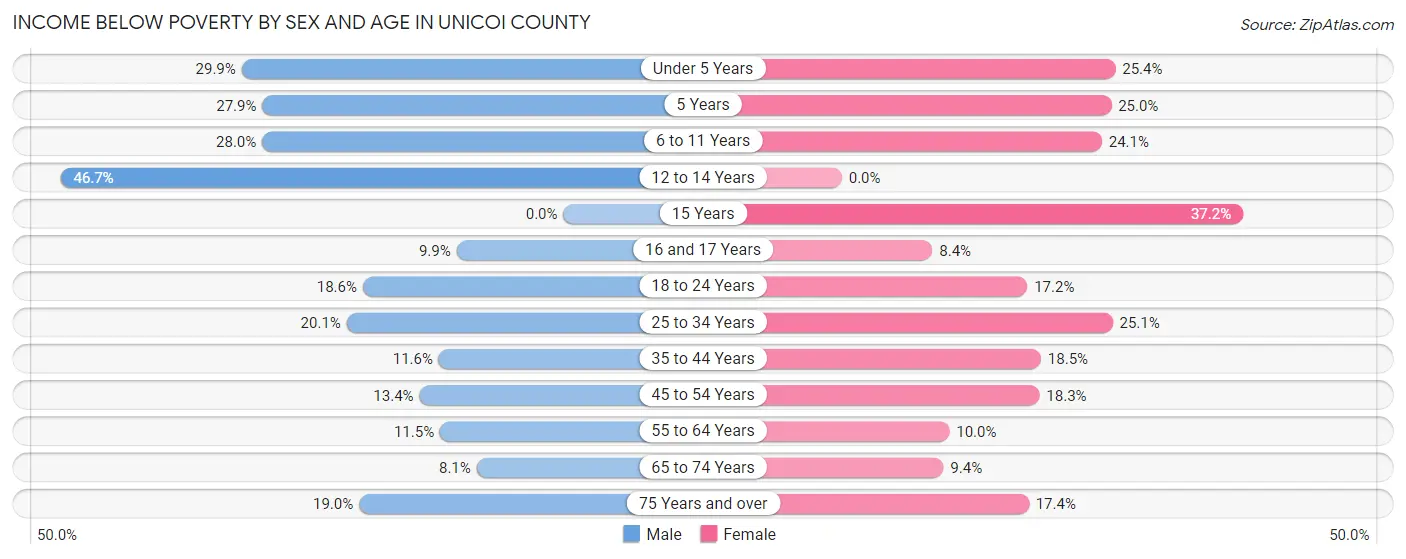
| Age Bracket | Male | Female |
| Under 5 Years | 129 (29.9%) | 83 (25.4%) |
| 5 Years | 19 (27.9%) | 15 (25.0%) |
| 6 to 11 Years | 144 (28.0%) | 145 (24.1%) |
| 12 to 14 Years | 140 (46.7%) | 0 (0.0%) |
| 15 Years | 0 (0.0%) | 51 (37.2%) |
| 16 and 17 Years | 23 (9.9%) | 11 (8.4%) |
| 18 to 24 Years | 126 (18.6%) | 106 (17.2%) |
| 25 to 34 Years | 186 (20.1%) | 239 (25.1%) |
| 35 to 44 Years | 120 (11.6%) | 175 (18.5%) |
| 45 to 54 Years | 169 (13.4%) | 217 (18.3%) |
| 55 to 64 Years | 145 (11.5%) | 145 (10.0%) |
| 65 to 74 Years | 94 (8.1%) | 112 (9.4%) |
| 75 Years and over | 142 (19.0%) | 144 (17.3%) |
| Total | 1,437 (16.5%) | 1,443 (16.8%) |
Income Above Poverty by Sex and Age in Unicoi County
According to the poverty statistics in Unicoi County, males aged 15 years and females aged 12 to 14 years are the age groups that are most secure financially, with 100.0% of males and 100.0% of females in these age groups living above the poverty line.
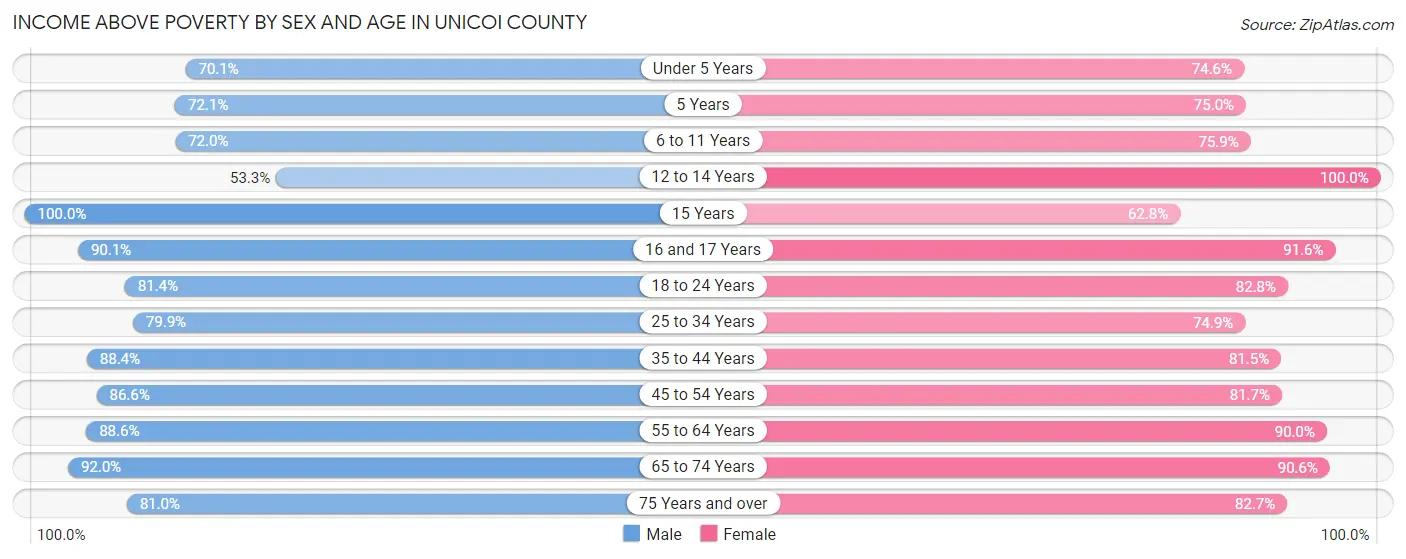
| Age Bracket | Male | Female |
| Under 5 Years | 303 (70.1%) | 244 (74.6%) |
| 5 Years | 49 (72.1%) | 45 (75.0%) |
| 6 to 11 Years | 371 (72.0%) | 456 (75.9%) |
| 12 to 14 Years | 160 (53.3%) | 161 (100.0%) |
| 15 Years | 57 (100.0%) | 86 (62.8%) |
| 16 and 17 Years | 209 (90.1%) | 120 (91.6%) |
| 18 to 24 Years | 551 (81.4%) | 510 (82.8%) |
| 25 to 34 Years | 739 (79.9%) | 712 (74.9%) |
| 35 to 44 Years | 918 (88.4%) | 772 (81.5%) |
| 45 to 54 Years | 1,096 (86.6%) | 966 (81.7%) |
| 55 to 64 Years | 1,121 (88.5%) | 1,308 (90.0%) |
| 65 to 74 Years | 1,073 (91.9%) | 1,076 (90.6%) |
| 75 Years and over | 607 (81.0%) | 686 (82.7%) |
| Total | 7,254 (83.5%) | 7,142 (83.2%) |
Income Below Poverty Among Married-Couple Families in Unicoi County
The poverty statistics for married-couple families in Unicoi County show that 8.0% or 305 of the total 3,837 families live below the poverty line. Families with 3 or 4 children have the highest poverty rate of 29.8%, comprising of 59 families. On the other hand, families with 5 or more children have the lowest poverty rate of 0.0%, which includes 0 families.
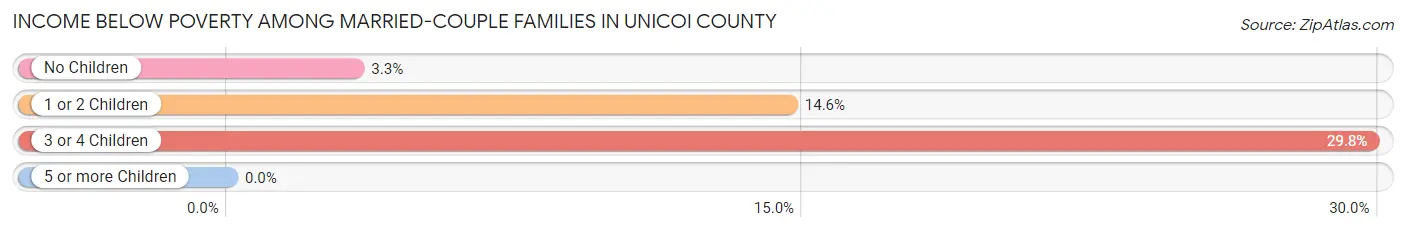
| Children | Above Poverty | Below Poverty |
| No Children | 2,401 (96.7%) | 82 (3.3%) |
| 1 or 2 Children | 958 (85.4%) | 164 (14.6%) |
| 3 or 4 Children | 139 (70.2%) | 59 (29.8%) |
| 5 or more Children | 34 (100.0%) | 0 (0.0%) |
| Total | 3,532 (92.0%) | 305 (8.0%) |
Income Below Poverty Among Single-Parent Households in Unicoi County
According to the poverty data in Unicoi County, 29.7% or 105 single-father households and 27.4% or 193 single-mother households are living below the poverty line. Among single-father households, those with 1 or 2 children have the highest poverty rate, with 94 households (43.1%) experiencing poverty. Likewise, among single-mother households, those with 3 or 4 children have the highest poverty rate, with 56 households (86.2%) falling below the poverty line.
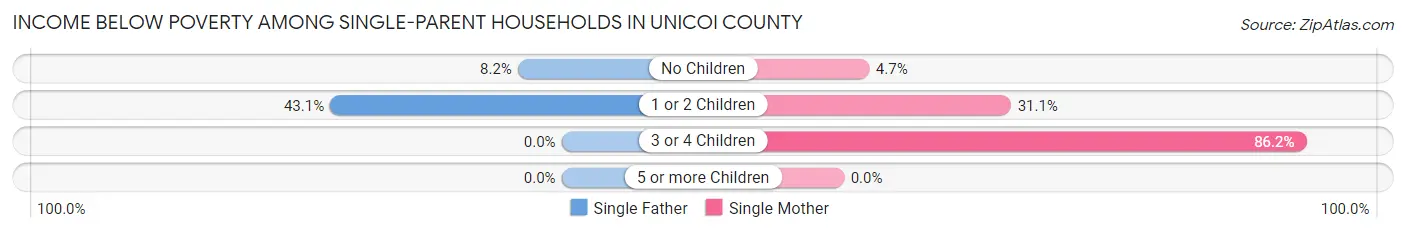
| Children | Single Father | Single Mother |
| No Children | 11 (8.2%) | 11 (4.7%) |
| 1 or 2 Children | 94 (43.1%) | 126 (31.1%) |
| 3 or 4 Children | 0 (0.0%) | 56 (86.2%) |
| 5 or more Children | 0 (0.0%) | 0 (0.0%) |
| Total | 105 (29.7%) | 193 (27.4%) |
Income Below Poverty Among Married-Couple vs Single-Parent Households in Unicoi County
The poverty data for Unicoi County shows that 305 of the married-couple family households (8.0%) and 298 of the single-parent households (28.2%) are living below the poverty level. Within the married-couple family households, those with 3 or 4 children have the highest poverty rate, with 59 households (29.8%) falling below the poverty line. Among the single-parent households, those with 3 or 4 children have the highest poverty rate, with 56 household (86.2%) living below poverty.
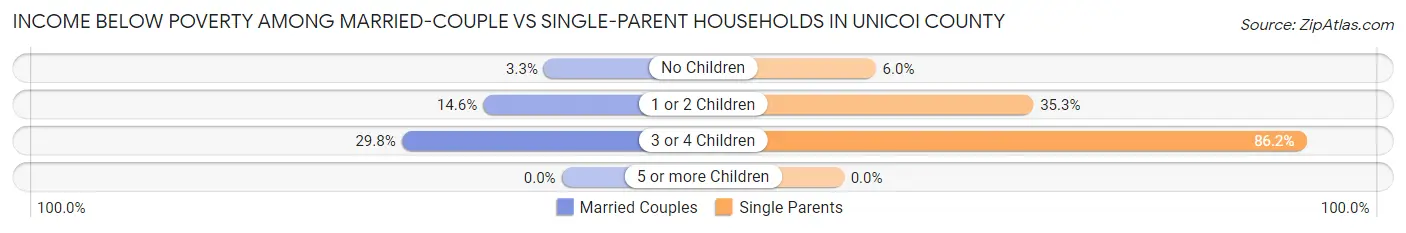
| Children | Married-Couple Families | Single-Parent Households |
| No Children | 82 (3.3%) | 22 (6.0%) |
| 1 or 2 Children | 164 (14.6%) | 220 (35.3%) |
| 3 or 4 Children | 59 (29.8%) | 56 (86.2%) |
| 5 or more Children | 0 (0.0%) | 0 (0.0%) |
| Total | 305 (8.0%) | 298 (28.2%) |
Employment Characteristics in Unicoi County
Employment by Class of Employer in Unicoi County
Among the 7,508 employed individuals in Unicoi County, private company employees (4,789 | 63.8%), local government employees (950 | 12.7%), and not-for-profit organizations (690 | 9.2%) make up the most common classes of employment.
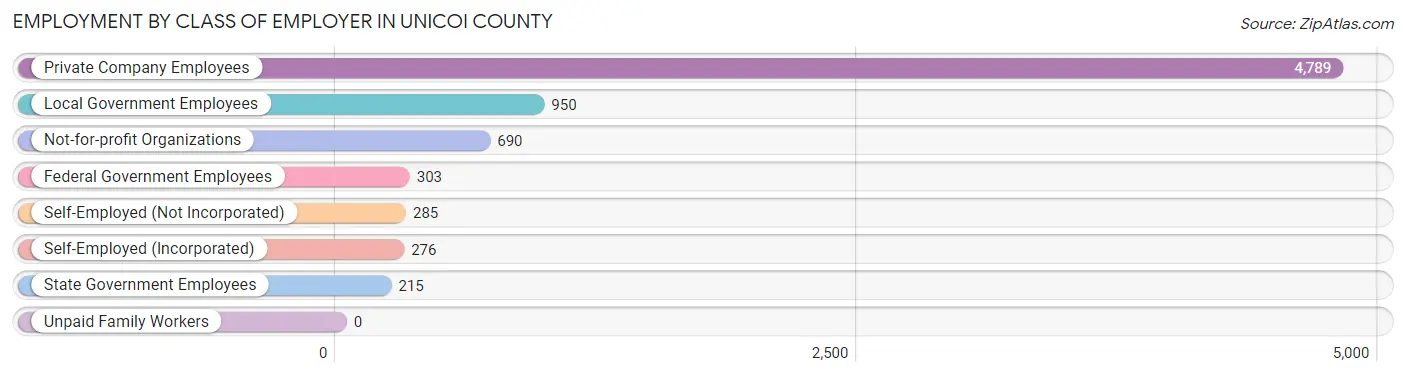
| Employer Class | # Employees | % Employees |
| Private Company Employees | 4,789 | 63.8% |
| Self-Employed (Incorporated) | 276 | 3.7% |
| Self-Employed (Not Incorporated) | 285 | 3.8% |
| Not-for-profit Organizations | 690 | 9.2% |
| Local Government Employees | 950 | 12.7% |
| State Government Employees | 215 | 2.9% |
| Federal Government Employees | 303 | 4.0% |
| Unpaid Family Workers | 0 | 0.0% |
| Total | 7,508 | 100.0% |
Employment Status by Age in Unicoi County
According to the labor force statistics for Unicoi County, out of the total population over 16 years of age (14,956), 54.2% or 8,106 individuals are in the labor force, with 5.4% or 438 of them unemployed. The age group with the highest labor force participation rate is 30 to 34 years, with 86.7% or 808 individuals in the labor force. Within the labor force, the 35 to 44 years age range has the highest percentage of unemployed individuals, with 10.6% or 162 of them being unemployed.
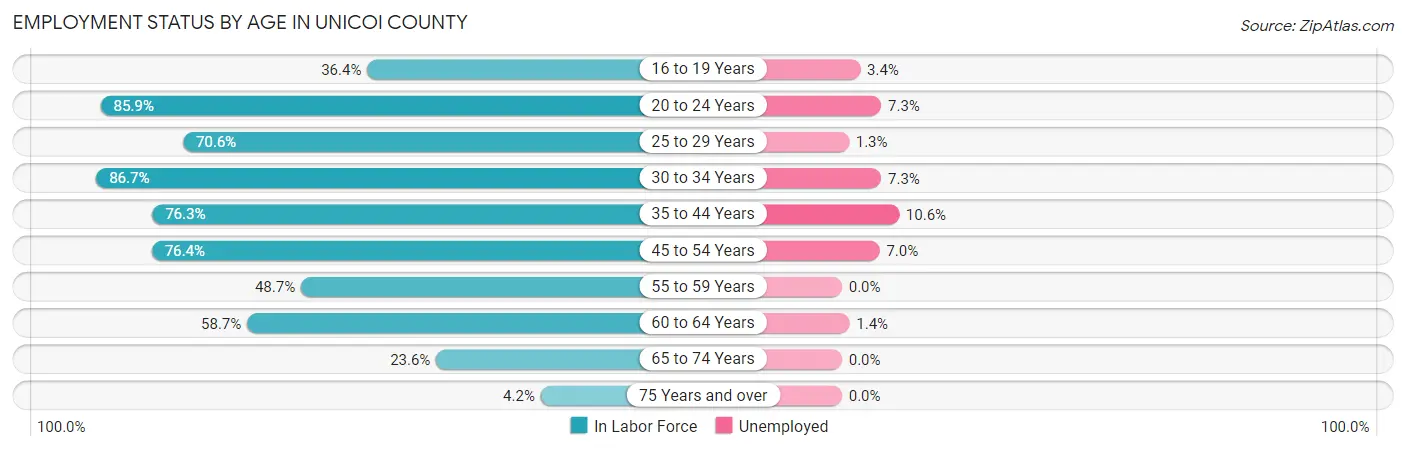
| Age Bracket | In Labor Force | Unemployed |
| 16 to 19 Years | 264 (36.4%) | 9 (3.4%) |
| 20 to 24 Years | 809 (85.9%) | 59 (7.3%) |
| 25 to 29 Years | 677 (70.6%) | 9 (1.3%) |
| 30 to 34 Years | 808 (86.7%) | 59 (7.3%) |
| 35 to 44 Years | 1,532 (76.3%) | 162 (10.6%) |
| 45 to 54 Years | 1,876 (76.4%) | 131 (7.0%) |
| 55 to 59 Years | 606 (48.7%) | 0 (0.0%) |
| 60 to 64 Years | 887 (58.7%) | 12 (1.4%) |
| 65 to 74 Years | 572 (23.6%) | 0 (0.0%) |
| 75 Years and over | 74 (4.2%) | 0 (0.0%) |
| Total | 8,106 (54.2%) | 438 (5.4%) |
Employment Status by Educational Attainment in Unicoi County
According to labor force statistics for Unicoi County, 70.1% of individuals (6,386) out of the total population between 25 and 64 years of age (9,110) are in the labor force, with 5.8% or 370 of them being unemployed. The group with the highest labor force participation rate are those with the educational attainment of bachelor's degree or higher, with 89.3% or 1,385 individuals in the labor force. Within the labor force, individuals with high school diploma education have the highest percentage of unemployment, with 10.9% or 255 of them being unemployed.
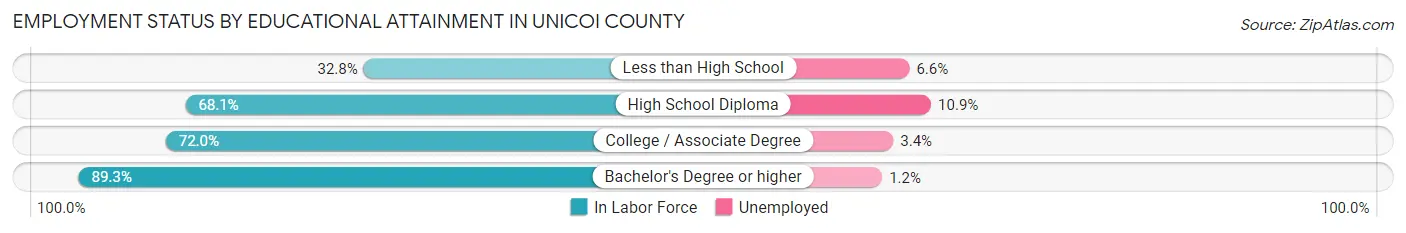
| Educational Attainment | In Labor Force | Unemployed |
| Less than High School | 256 (32.8%) | 51 (6.6%) |
| High School Diploma | 2,336 (68.1%) | 374 (10.9%) |
| College / Associate Degree | 2,411 (72.0%) | 114 (3.4%) |
| Bachelor's Degree or higher | 1,385 (89.3%) | 19 (1.2%) |
| Total | 6,386 (70.1%) | 528 (5.8%) |
Employment Occupations by Sex in Unicoi County
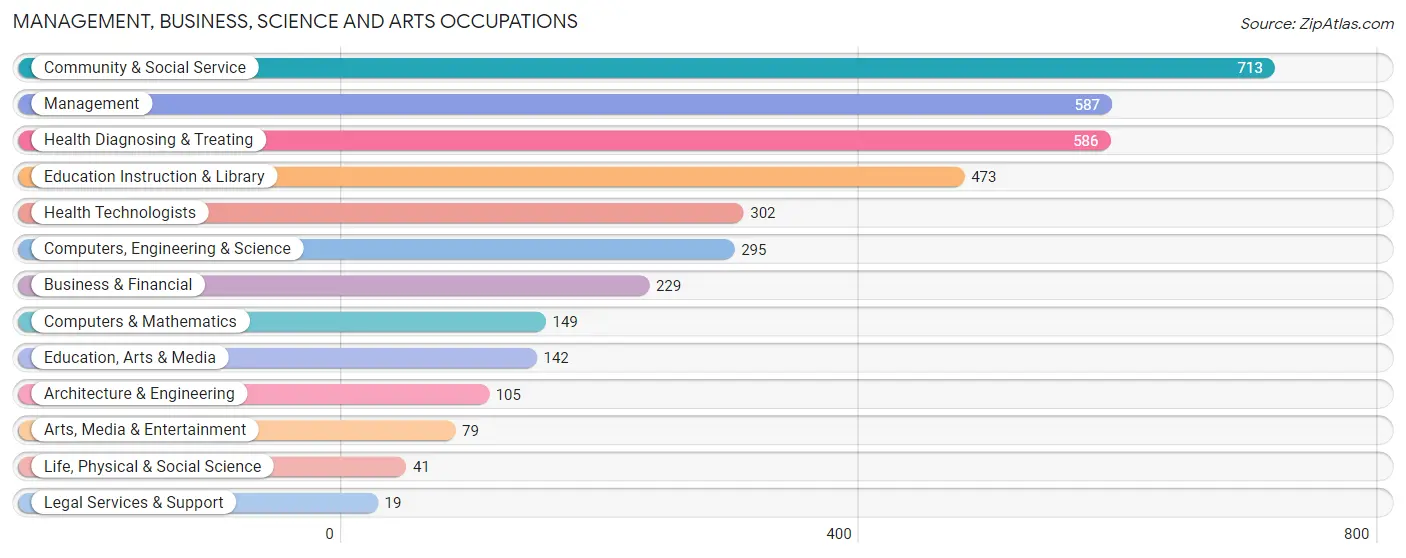
Management, Business, Science and Arts Occupations
The most common Management, Business, Science and Arts occupations in Unicoi County are Community & Social Service (713 | 9.3%), Management (587 | 7.7%), Health Diagnosing & Treating (586 | 7.7%), Education Instruction & Library (473 | 6.2%), and Health Technologists (302 | 4.0%).
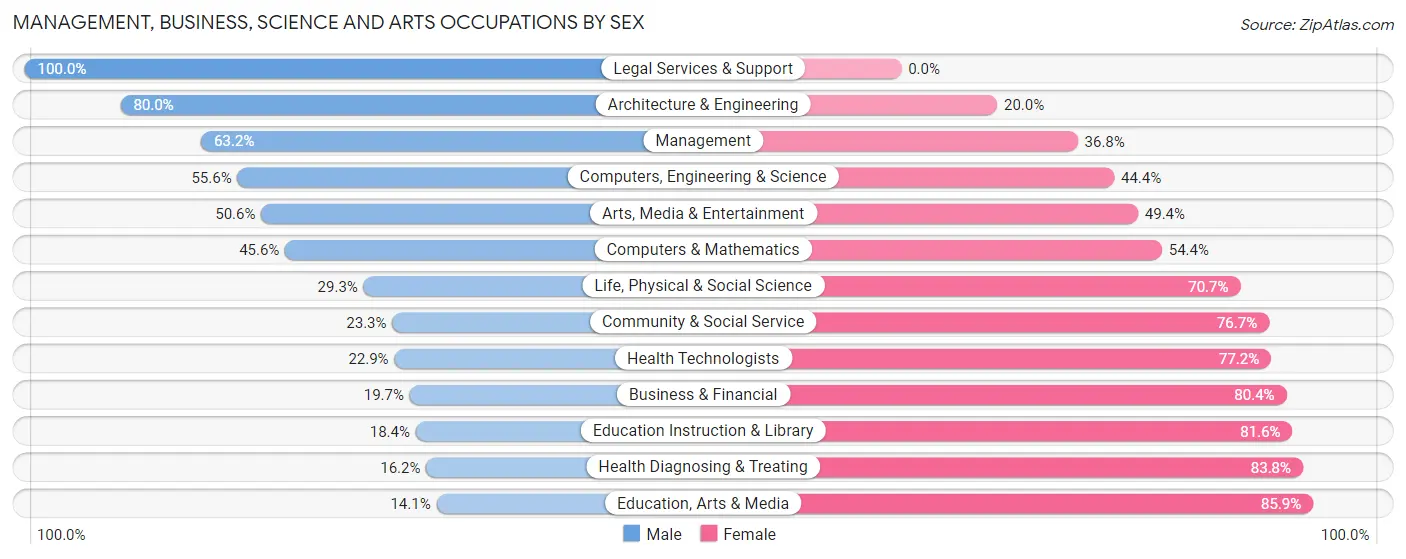
Management, Business, Science and Arts Occupations by Sex
Within the Management, Business, Science and Arts occupations in Unicoi County, the most male-oriented occupations are Legal Services & Support (100.0%), Architecture & Engineering (80.0%), and Management (63.2%), while the most female-oriented occupations are Education, Arts & Media (85.9%), Health Diagnosing & Treating (83.8%), and Education Instruction & Library (81.6%).
| Occupation | Male | Female |
| Management | 371 (63.2%) | 216 (36.8%) |
| Business & Financial | 45 (19.7%) | 184 (80.3%) |
| Computers, Engineering & Science | 164 (55.6%) | 131 (44.4%) |
| Computers & Mathematics | 68 (45.6%) | 81 (54.4%) |
| Architecture & Engineering | 84 (80.0%) | 21 (20.0%) |
| Life, Physical & Social Science | 12 (29.3%) | 29 (70.7%) |
| Community & Social Service | 166 (23.3%) | 547 (76.7%) |
| Education, Arts & Media | 20 (14.1%) | 122 (85.9%) |
| Legal Services & Support | 19 (100.0%) | 0 (0.0%) |
| Education Instruction & Library | 87 (18.4%) | 386 (81.6%) |
| Arts, Media & Entertainment | 40 (50.6%) | 39 (49.4%) |
| Health Diagnosing & Treating | 95 (16.2%) | 491 (83.8%) |
| Health Technologists | 69 (22.9%) | 233 (77.1%) |
| Total (Category) | 841 (34.9%) | 1,569 (65.1%) |
| Total (Overall) | 4,092 (53.7%) | 3,534 (46.3%) |
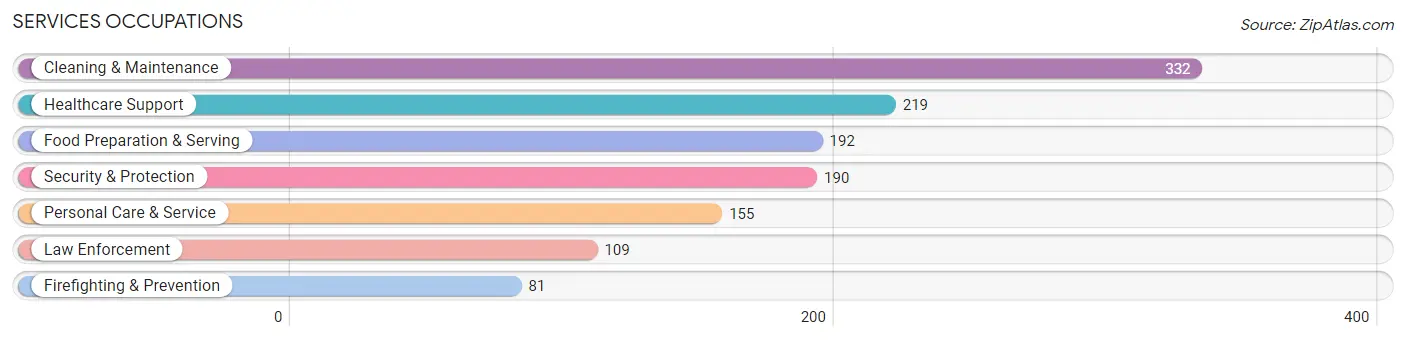
Services Occupations
The most common Services occupations in Unicoi County are Cleaning & Maintenance (332 | 4.3%), Healthcare Support (219 | 2.9%), Food Preparation & Serving (192 | 2.5%), Security & Protection (190 | 2.5%), and Personal Care & Service (155 | 2.0%).
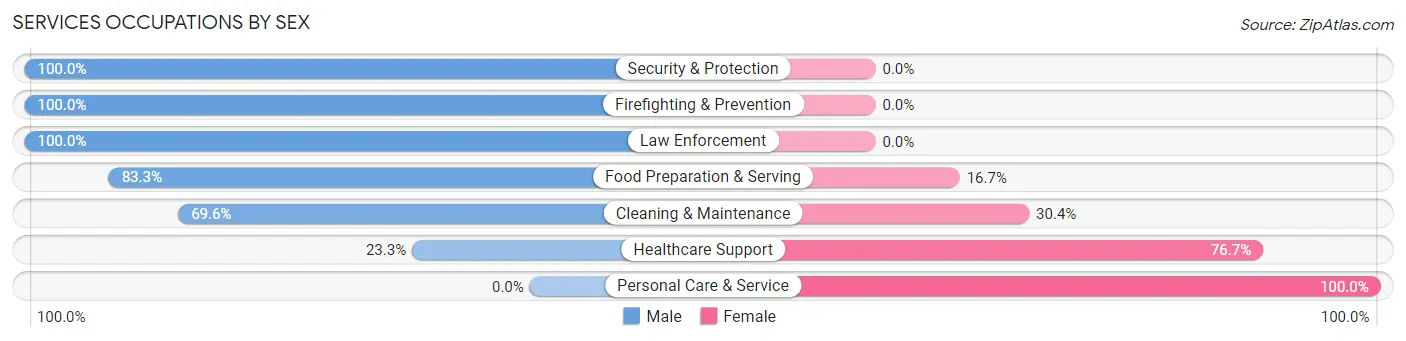
Services Occupations by Sex
Within the Services occupations in Unicoi County, the most male-oriented occupations are Security & Protection (100.0%), Firefighting & Prevention (100.0%), and Law Enforcement (100.0%), while the most female-oriented occupations are Personal Care & Service (100.0%), Healthcare Support (76.7%), and Cleaning & Maintenance (30.4%).
| Occupation | Male | Female |
| Healthcare Support | 51 (23.3%) | 168 (76.7%) |
| Security & Protection | 190 (100.0%) | 0 (0.0%) |
| Firefighting & Prevention | 81 (100.0%) | 0 (0.0%) |
| Law Enforcement | 109 (100.0%) | 0 (0.0%) |
| Food Preparation & Serving | 160 (83.3%) | 32 (16.7%) |
| Cleaning & Maintenance | 231 (69.6%) | 101 (30.4%) |
| Personal Care & Service | 0 (0.0%) | 155 (100.0%) |
| Total (Category) | 632 (58.1%) | 456 (41.9%) |
| Total (Overall) | 4,092 (53.7%) | 3,534 (46.3%) |
Sales and Office Occupations
The most common Sales and Office occupations in Unicoi County are Office & Administration (907 | 11.9%), and Sales & Related (770 | 10.1%).
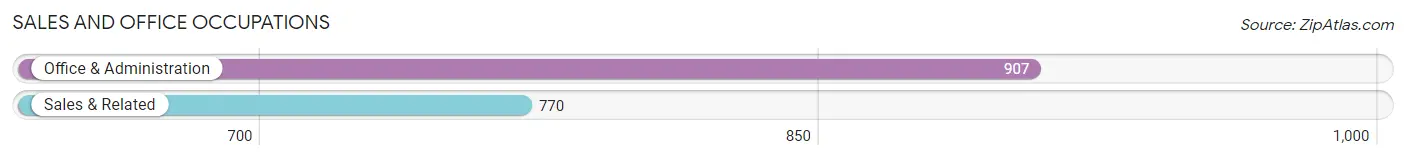
Sales and Office Occupations by Sex

| Occupation | Male | Female |
| Sales & Related | 396 (51.4%) | 374 (48.6%) |
| Office & Administration | 160 (17.6%) | 747 (82.4%) |
| Total (Category) | 556 (33.2%) | 1,121 (66.8%) |
| Total (Overall) | 4,092 (53.7%) | 3,534 (46.3%) |
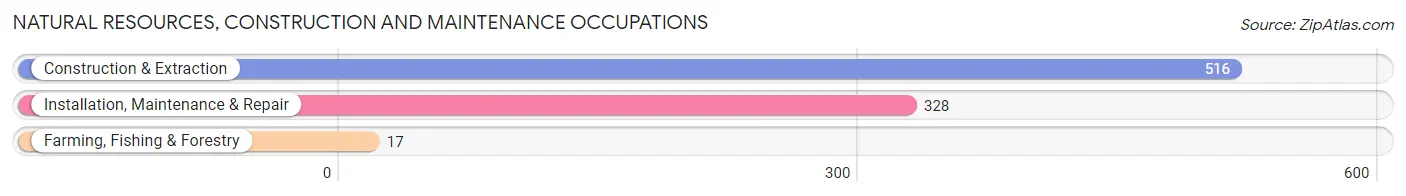
Natural Resources, Construction and Maintenance Occupations
The most common Natural Resources, Construction and Maintenance occupations in Unicoi County are Construction & Extraction (516 | 6.8%), Installation, Maintenance & Repair (328 | 4.3%), and Farming, Fishing & Forestry (17 | 0.2%).
Natural Resources, Construction and Maintenance Occupations by Sex
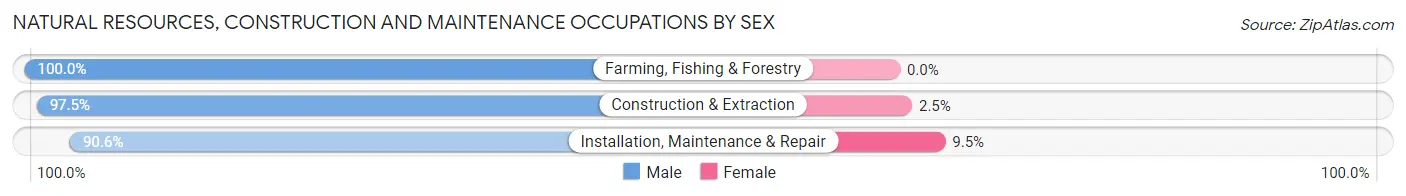
| Occupation | Male | Female |
| Farming, Fishing & Forestry | 17 (100.0%) | 0 (0.0%) |
| Construction & Extraction | 503 (97.5%) | 13 (2.5%) |
| Installation, Maintenance & Repair | 297 (90.5%) | 31 (9.5%) |
| Total (Category) | 817 (94.9%) | 44 (5.1%) |
| Total (Overall) | 4,092 (53.7%) | 3,534 (46.3%) |
Production, Transportation and Moving Occupations
The most common Production, Transportation and Moving occupations in Unicoi County are Production (949 | 12.4%), Transportation (408 | 5.3%), and Material Moving (233 | 3.1%).
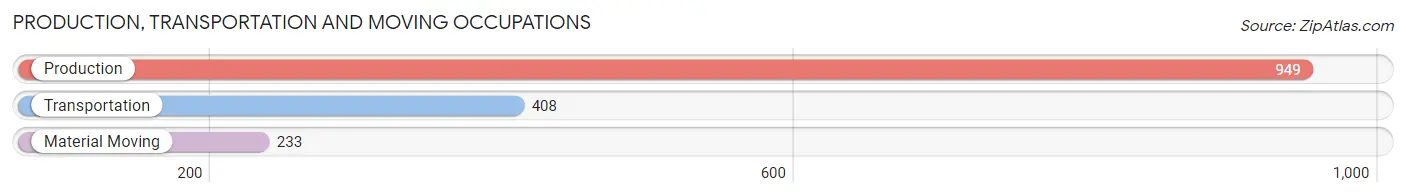
Production, Transportation and Moving Occupations by Sex
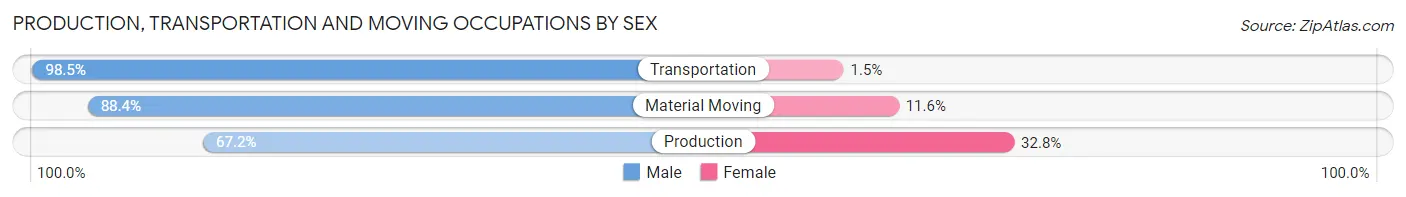
| Occupation | Male | Female |
| Production | 638 (67.2%) | 311 (32.8%) |
| Transportation | 402 (98.5%) | 6 (1.5%) |
| Material Moving | 206 (88.4%) | 27 (11.6%) |
| Total (Category) | 1,246 (78.4%) | 344 (21.6%) |
| Total (Overall) | 4,092 (53.7%) | 3,534 (46.3%) |
Employment Industries by Sex in Unicoi County
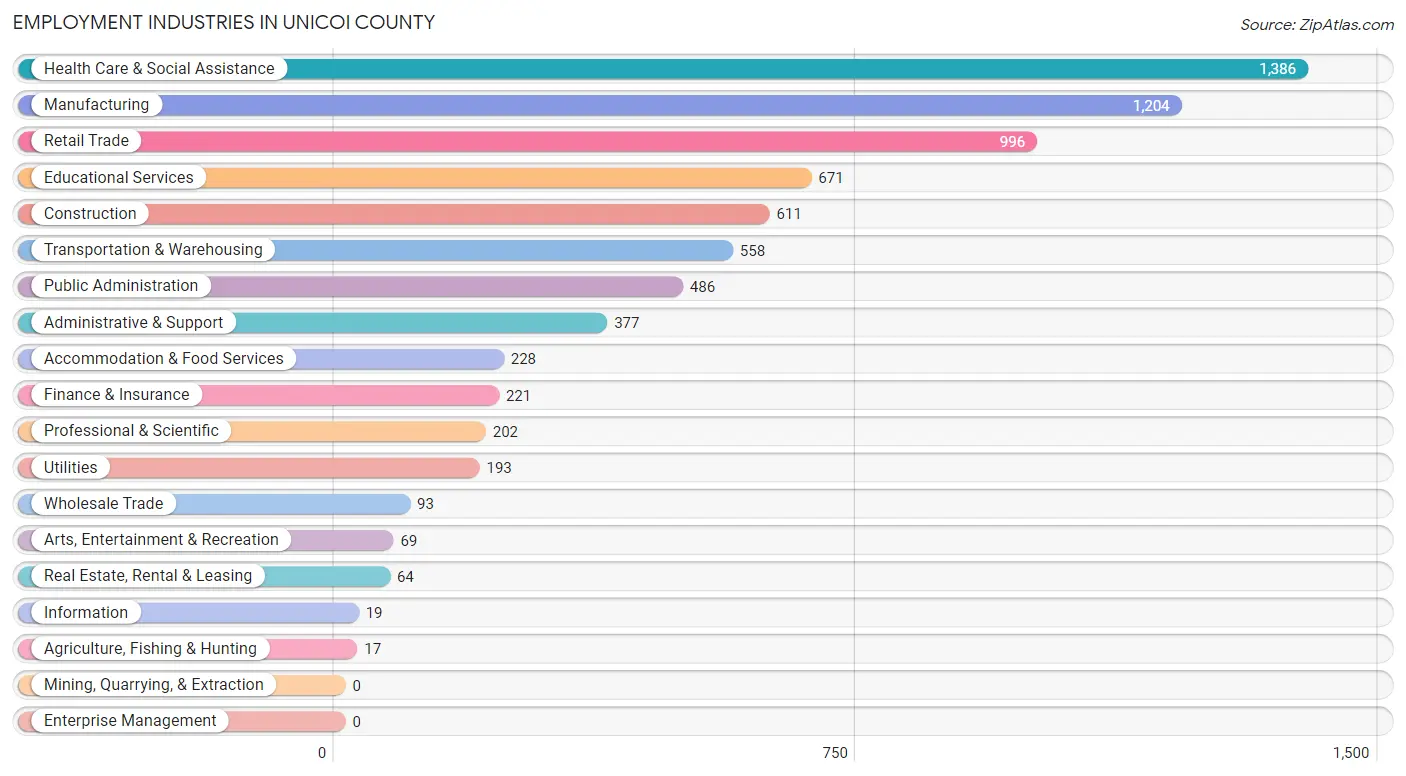
Employment Industries in Unicoi County
The major employment industries in Unicoi County include Health Care & Social Assistance (1,386 | 18.2%), Manufacturing (1,204 | 15.8%), Retail Trade (996 | 13.1%), Educational Services (671 | 8.8%), and Construction (611 | 8.0%).
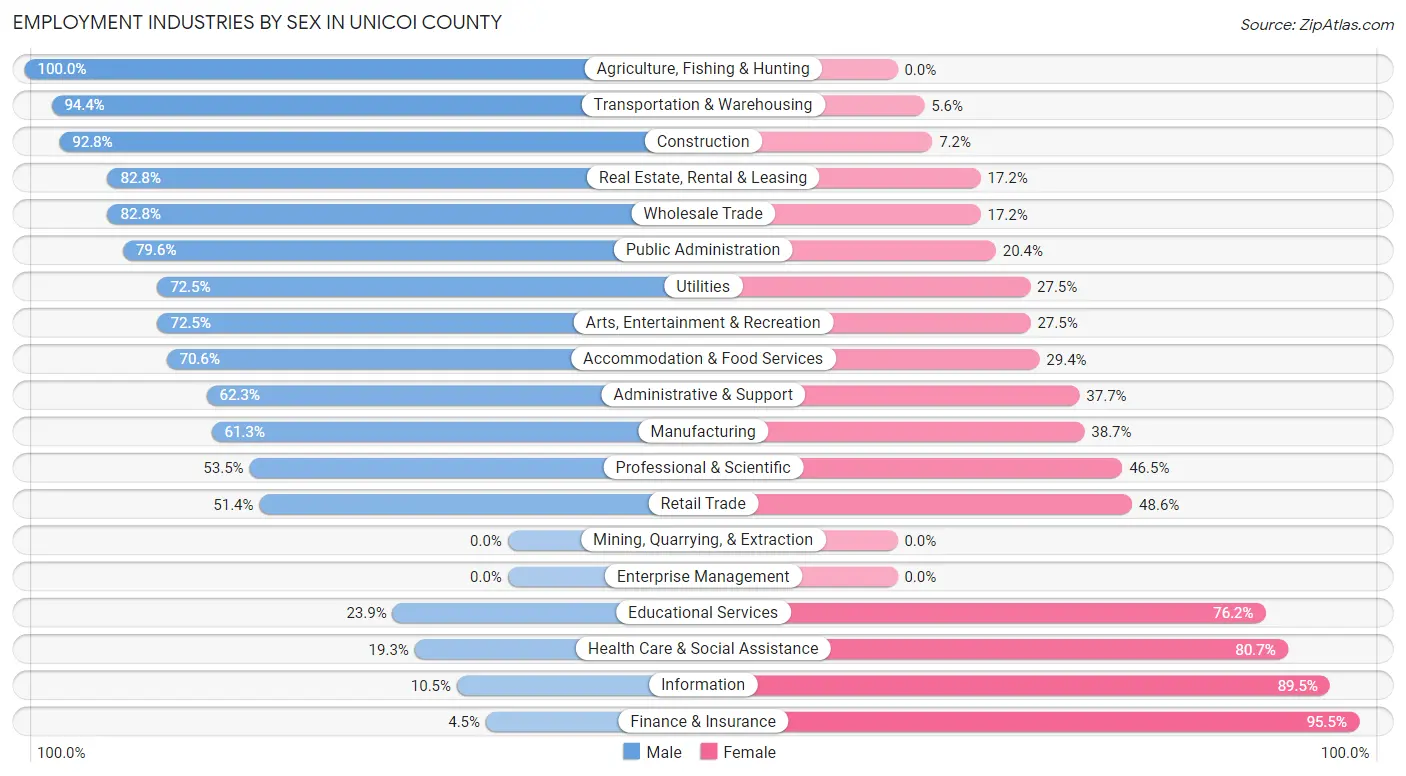
Employment Industries by Sex in Unicoi County
The Unicoi County industries that see more men than women are Agriculture, Fishing & Hunting (100.0%), Transportation & Warehousing (94.4%), and Construction (92.8%), whereas the industries that tend to have a higher number of women are Finance & Insurance (95.5%), Information (89.5%), and Health Care & Social Assistance (80.7%).
| Industry | Male | Female |
| Agriculture, Fishing & Hunting | 17 (100.0%) | 0 (0.0%) |
| Mining, Quarrying, & Extraction | 0 (0.0%) | 0 (0.0%) |
| Construction | 567 (92.8%) | 44 (7.2%) |
| Manufacturing | 738 (61.3%) | 466 (38.7%) |
| Wholesale Trade | 77 (82.8%) | 16 (17.2%) |
| Retail Trade | 512 (51.4%) | 484 (48.6%) |
| Transportation & Warehousing | 527 (94.4%) | 31 (5.6%) |
| Utilities | 140 (72.5%) | 53 (27.5%) |
| Information | 2 (10.5%) | 17 (89.5%) |
| Finance & Insurance | 10 (4.5%) | 211 (95.5%) |
| Real Estate, Rental & Leasing | 53 (82.8%) | 11 (17.2%) |
| Professional & Scientific | 108 (53.5%) | 94 (46.5%) |
| Enterprise Management | 0 (0.0%) | 0 (0.0%) |
| Administrative & Support | 235 (62.3%) | 142 (37.7%) |
| Educational Services | 160 (23.8%) | 511 (76.1%) |
| Health Care & Social Assistance | 267 (19.3%) | 1,119 (80.7%) |
| Arts, Entertainment & Recreation | 50 (72.5%) | 19 (27.5%) |
| Accommodation & Food Services | 161 (70.6%) | 67 (29.4%) |
| Public Administration | 387 (79.6%) | 99 (20.4%) |
| Total | 4,092 (53.7%) | 3,534 (46.3%) |
Education in Unicoi County
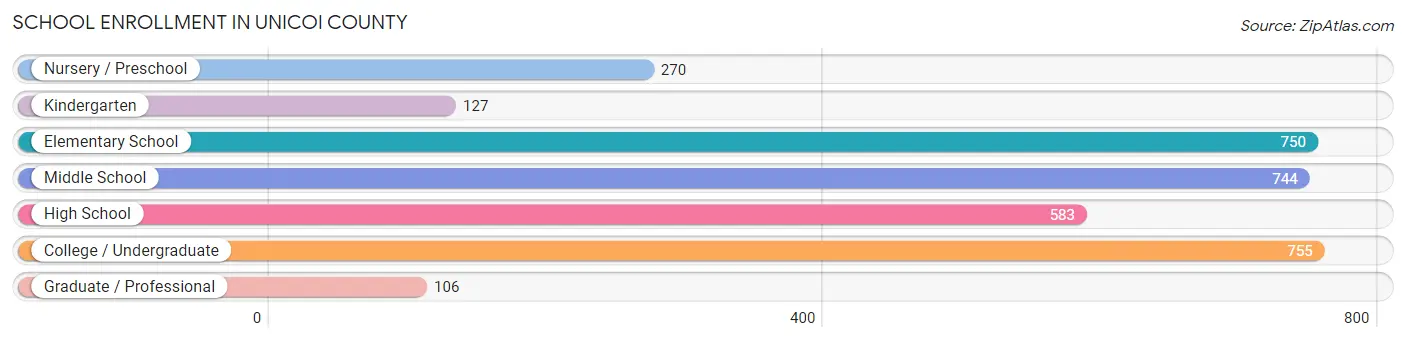
School Enrollment in Unicoi County
The most common levels of schooling among the 3,335 students in Unicoi County are college / undergraduate (755 | 22.6%), elementary school (750 | 22.5%), and middle school (744 | 22.3%).
| School Level | # Students | % Students |
| Nursery / Preschool | 270 | 8.1% |
| Kindergarten | 127 | 3.8% |
| Elementary School | 750 | 22.5% |
| Middle School | 744 | 22.3% |
| High School | 583 | 17.5% |
| College / Undergraduate | 755 | 22.6% |
| Graduate / Professional | 106 | 3.2% |
| Total | 3,335 | 100.0% |
School Enrollment by Age by Funding Source in Unicoi County
Out of a total of 3,335 students who are enrolled in schools in Unicoi County, 577 (17.3%) attend a private institution, while the remaining 2,758 (82.7%) are enrolled in public schools. The age group of 18 to 19 year olds has the highest likelihood of being enrolled in private schools, with 77 (38.5% in the age bracket) enrolled. Conversely, the age group of 20 to 24 year olds has the lowest likelihood of being enrolled in a private school, with 305 (98.4% in the age bracket) attending a public institution.
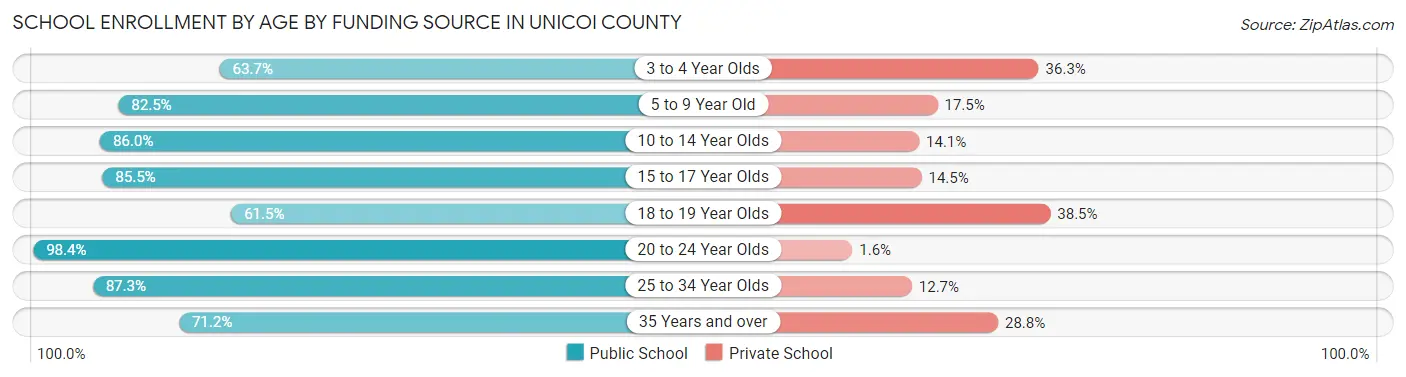
| Age Bracket | Public School | Private School |
| 3 to 4 Year Olds | 142 (63.7%) | 81 (36.3%) |
| 5 to 9 Year Old | 680 (82.5%) | 144 (17.5%) |
| 10 to 14 Year Olds | 783 (86.0%) | 128 (14.1%) |
| 15 to 17 Year Olds | 395 (85.5%) | 67 (14.5%) |
| 18 to 19 Year Olds | 123 (61.5%) | 77 (38.5%) |
| 20 to 24 Year Olds | 305 (98.4%) | 5 (1.6%) |
| 25 to 34 Year Olds | 220 (87.3%) | 32 (12.7%) |
| 35 Years and over | 109 (71.2%) | 44 (28.8%) |
| Total | 2,758 (82.7%) | 577 (17.3%) |
Educational Attainment by Field of Study in Unicoi County
Education (637 | 26.3%), business (412 | 17.0%), science & technology (339 | 14.0%), arts & humanities (176 | 7.3%), and computers & mathematics (159 | 6.6%) are the most common fields of study among 2,422 individuals in Unicoi County who have obtained a bachelor's degree or higher.
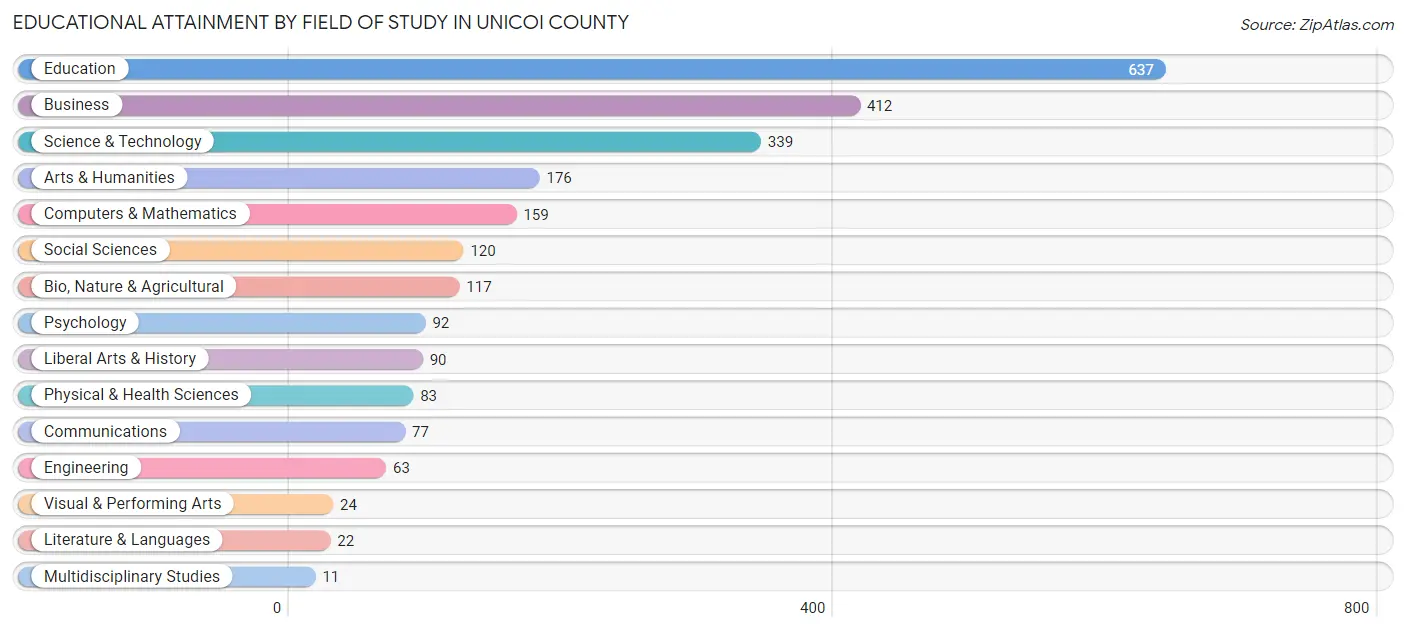
| Field of Study | # Graduates | % Graduates |
| Computers & Mathematics | 159 | 6.6% |
| Bio, Nature & Agricultural | 117 | 4.8% |
| Physical & Health Sciences | 83 | 3.4% |
| Psychology | 92 | 3.8% |
| Social Sciences | 120 | 5.0% |
| Engineering | 63 | 2.6% |
| Multidisciplinary Studies | 11 | 0.4% |
| Science & Technology | 339 | 14.0% |
| Business | 412 | 17.0% |
| Education | 637 | 26.3% |
| Literature & Languages | 22 | 0.9% |
| Liberal Arts & History | 90 | 3.7% |
| Visual & Performing Arts | 24 | 1.0% |
| Communications | 77 | 3.2% |
| Arts & Humanities | 176 | 7.3% |
| Total | 2,422 | 100.0% |
Transportation & Commute in Unicoi County
Vehicle Availability by Sex in Unicoi County
The most prevalent vehicle ownership categories in Unicoi County are males with 2 vehicles (1,731, accounting for 44.0%) and females with 2 vehicles (1,179, making up 49.5%).
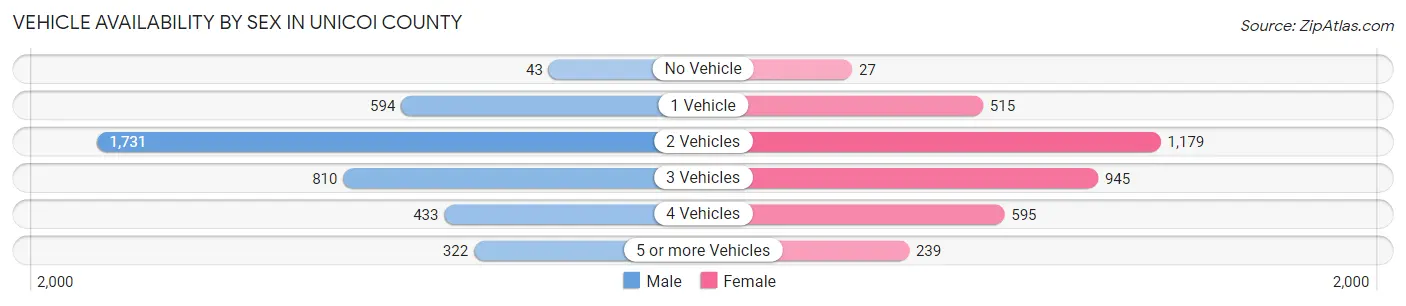
| Vehicles Available | Male | Female |
| No Vehicle | 43 (1.1%) | 27 (0.8%) |
| 1 Vehicle | 594 (15.1%) | 515 (14.7%) |
| 2 Vehicles | 1,731 (44.0%) | 1,179 (33.7%) |
| 3 Vehicles | 810 (20.6%) | 945 (27.0%) |
| 4 Vehicles | 433 (11.0%) | 595 (17.0%) |
| 5 or more Vehicles | 322 (8.2%) | 239 (6.8%) |
| Total | 3,933 (100.0%) | 3,500 (100.0%) |
Commute Time in Unicoi County
The most frequently occuring commute durations in Unicoi County are 5 to 9 minutes (1,006 commuters, 14.4%), 20 to 24 minutes (989 commuters, 14.2%), and 30 to 34 minutes (874 commuters, 12.6%).
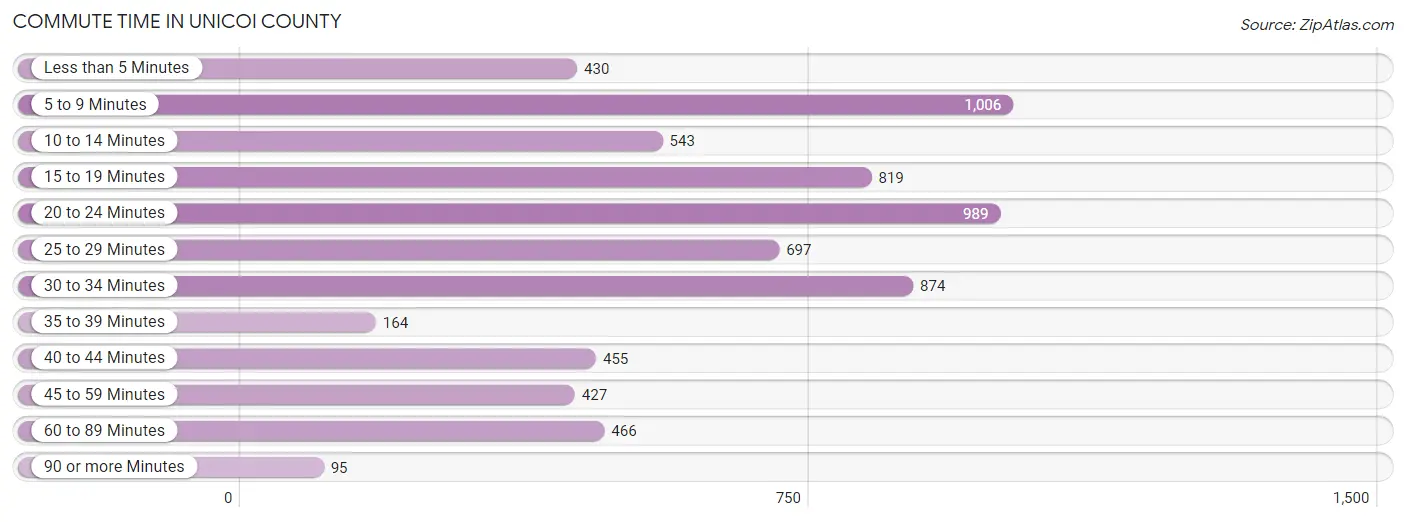
| Commute Time | # Commuters | % Commuters |
| Less than 5 Minutes | 430 | 6.2% |
| 5 to 9 Minutes | 1,006 | 14.4% |
| 10 to 14 Minutes | 543 | 7.8% |
| 15 to 19 Minutes | 819 | 11.8% |
| 20 to 24 Minutes | 989 | 14.2% |
| 25 to 29 Minutes | 697 | 10.0% |
| 30 to 34 Minutes | 874 | 12.6% |
| 35 to 39 Minutes | 164 | 2.4% |
| 40 to 44 Minutes | 455 | 6.5% |
| 45 to 59 Minutes | 427 | 6.1% |
| 60 to 89 Minutes | 466 | 6.7% |
| 90 or more Minutes | 95 | 1.4% |
Commute Time by Sex in Unicoi County
The most common commute times in Unicoi County are 20 to 24 minutes (571 commuters, 15.3%) for males and 30 to 34 minutes (585 commuters, 18.1%) for females.
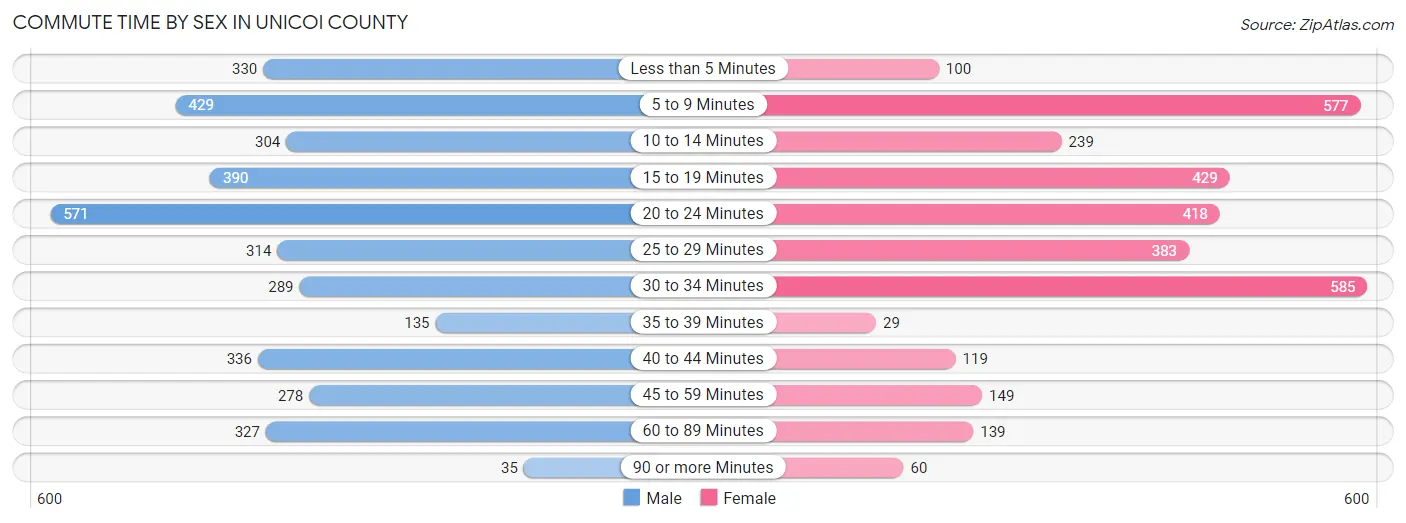
| Commute Time | Male | Female |
| Less than 5 Minutes | 330 (8.8%) | 100 (3.1%) |
| 5 to 9 Minutes | 429 (11.5%) | 577 (17.9%) |
| 10 to 14 Minutes | 304 (8.1%) | 239 (7.4%) |
| 15 to 19 Minutes | 390 (10.4%) | 429 (13.3%) |
| 20 to 24 Minutes | 571 (15.3%) | 418 (13.0%) |
| 25 to 29 Minutes | 314 (8.4%) | 383 (11.9%) |
| 30 to 34 Minutes | 289 (7.7%) | 585 (18.1%) |
| 35 to 39 Minutes | 135 (3.6%) | 29 (0.9%) |
| 40 to 44 Minutes | 336 (9.0%) | 119 (3.7%) |
| 45 to 59 Minutes | 278 (7.4%) | 149 (4.6%) |
| 60 to 89 Minutes | 327 (8.7%) | 139 (4.3%) |
| 90 or more Minutes | 35 (0.9%) | 60 (1.9%) |
Time of Departure to Work by Sex in Unicoi County
The most frequent times of departure to work in Unicoi County are 7:00 AM to 7:29 AM (737, 19.7%) for males and 7:00 AM to 7:29 AM (869, 26.9%) for females.
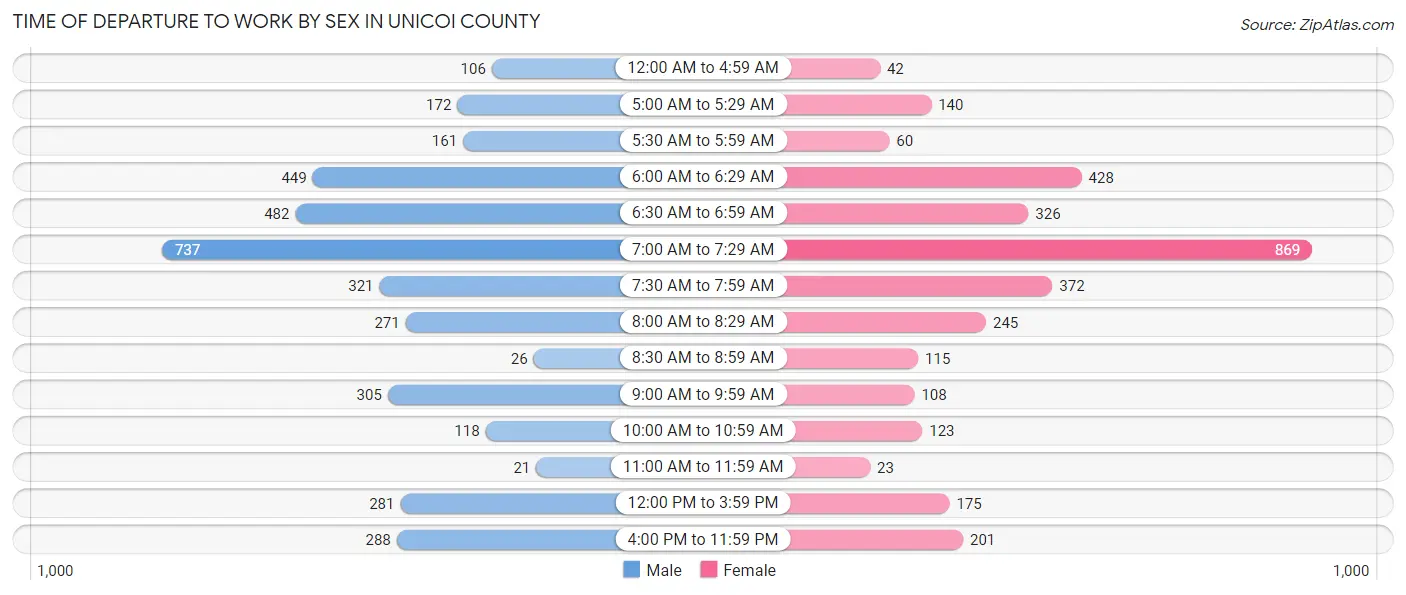
| Time of Departure | Male | Female |
| 12:00 AM to 4:59 AM | 106 (2.8%) | 42 (1.3%) |
| 5:00 AM to 5:29 AM | 172 (4.6%) | 140 (4.3%) |
| 5:30 AM to 5:59 AM | 161 (4.3%) | 60 (1.9%) |
| 6:00 AM to 6:29 AM | 449 (12.0%) | 428 (13.3%) |
| 6:30 AM to 6:59 AM | 482 (12.9%) | 326 (10.1%) |
| 7:00 AM to 7:29 AM | 737 (19.7%) | 869 (26.9%) |
| 7:30 AM to 7:59 AM | 321 (8.6%) | 372 (11.5%) |
| 8:00 AM to 8:29 AM | 271 (7.2%) | 245 (7.6%) |
| 8:30 AM to 8:59 AM | 26 (0.7%) | 115 (3.6%) |
| 9:00 AM to 9:59 AM | 305 (8.2%) | 108 (3.4%) |
| 10:00 AM to 10:59 AM | 118 (3.2%) | 123 (3.8%) |
| 11:00 AM to 11:59 AM | 21 (0.6%) | 23 (0.7%) |
| 12:00 PM to 3:59 PM | 281 (7.5%) | 175 (5.4%) |
| 4:00 PM to 11:59 PM | 288 (7.7%) | 201 (6.2%) |
| Total | 3,738 (100.0%) | 3,227 (100.0%) |
Housing Occupancy in Unicoi County
Occupancy by Ownership in Unicoi County
Of the total 7,654 dwellings in Unicoi County, owner-occupied units account for 5,612 (73.3%), while renter-occupied units make up 2,042 (26.7%).
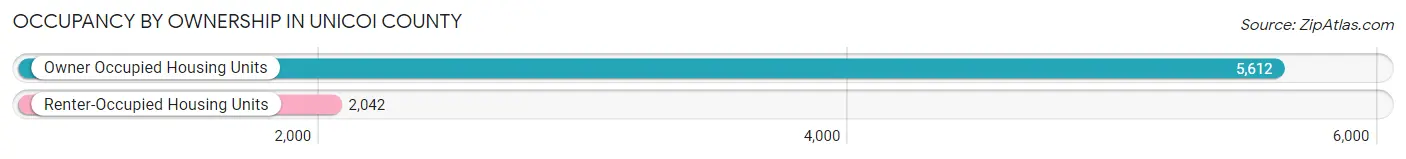
| Occupancy | # Housing Units | % Housing Units |
| Owner Occupied Housing Units | 5,612 | 73.3% |
| Renter-Occupied Housing Units | 2,042 | 26.7% |
| Total Occupied Housing Units | 7,654 | 100.0% |
Occupancy by Household Size in Unicoi County
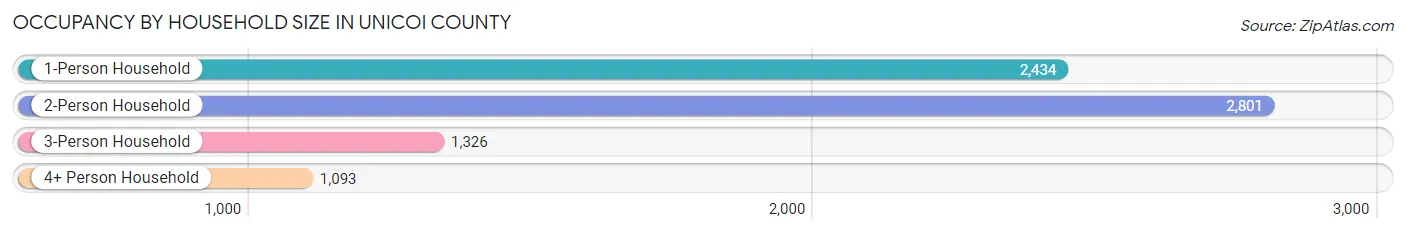
| Household Size | # Housing Units | % Housing Units |
| 1-Person Household | 2,434 | 31.8% |
| 2-Person Household | 2,801 | 36.6% |
| 3-Person Household | 1,326 | 17.3% |
| 4+ Person Household | 1,093 | 14.3% |
| Total Housing Units | 7,654 | 100.0% |
Occupancy by Ownership by Household Size in Unicoi County
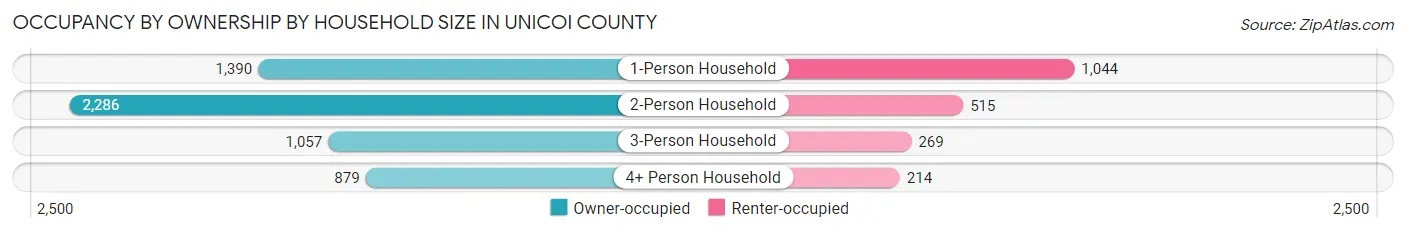
| Household Size | Owner-occupied | Renter-occupied |
| 1-Person Household | 1,390 (57.1%) | 1,044 (42.9%) |
| 2-Person Household | 2,286 (81.6%) | 515 (18.4%) |
| 3-Person Household | 1,057 (79.7%) | 269 (20.3%) |
| 4+ Person Household | 879 (80.4%) | 214 (19.6%) |
| Total Housing Units | 5,612 (73.3%) | 2,042 (26.7%) |
Occupancy by Educational Attainment in Unicoi County
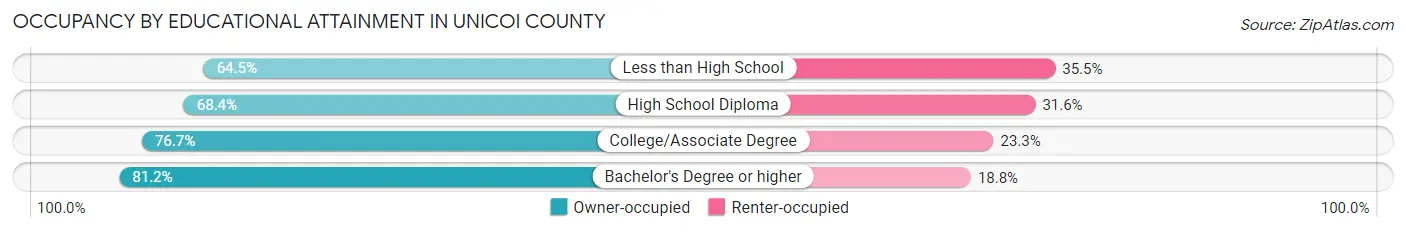
| Household Size | Owner-occupied | Renter-occupied |
| Less than High School | 581 (64.5%) | 320 (35.5%) |
| High School Diploma | 1,829 (68.4%) | 844 (31.6%) |
| College/Associate Degree | 1,905 (76.7%) | 578 (23.3%) |
| Bachelor's Degree or higher | 1,297 (81.2%) | 300 (18.8%) |
Occupancy by Age of Householder in Unicoi County
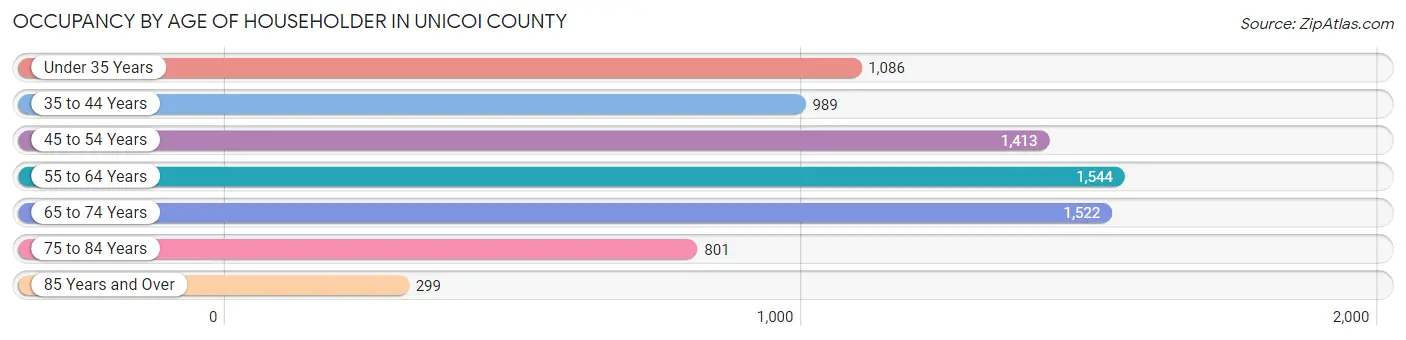
| Age Bracket | # Households | % Households |
| Under 35 Years | 1,086 | 14.2% |
| 35 to 44 Years | 989 | 12.9% |
| 45 to 54 Years | 1,413 | 18.5% |
| 55 to 64 Years | 1,544 | 20.2% |
| 65 to 74 Years | 1,522 | 19.9% |
| 75 to 84 Years | 801 | 10.5% |
| 85 Years and Over | 299 | 3.9% |
| Total | 7,654 | 100.0% |
Housing Finances in Unicoi County
Median Income by Occupancy in Unicoi County
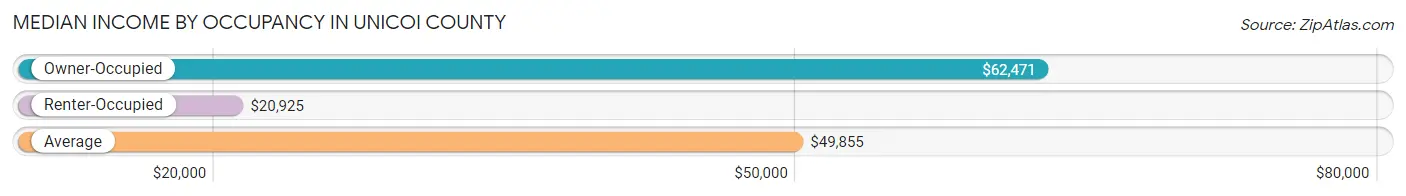
| Occupancy Type | # Households | Median Income |
| Owner-Occupied | 5,612 (73.3%) | $62,471 |
| Renter-Occupied | 2,042 (26.7%) | $20,925 |
| Average | 7,654 (100.0%) | $49,855 |
Occupancy by Householder Income Bracket in Unicoi County
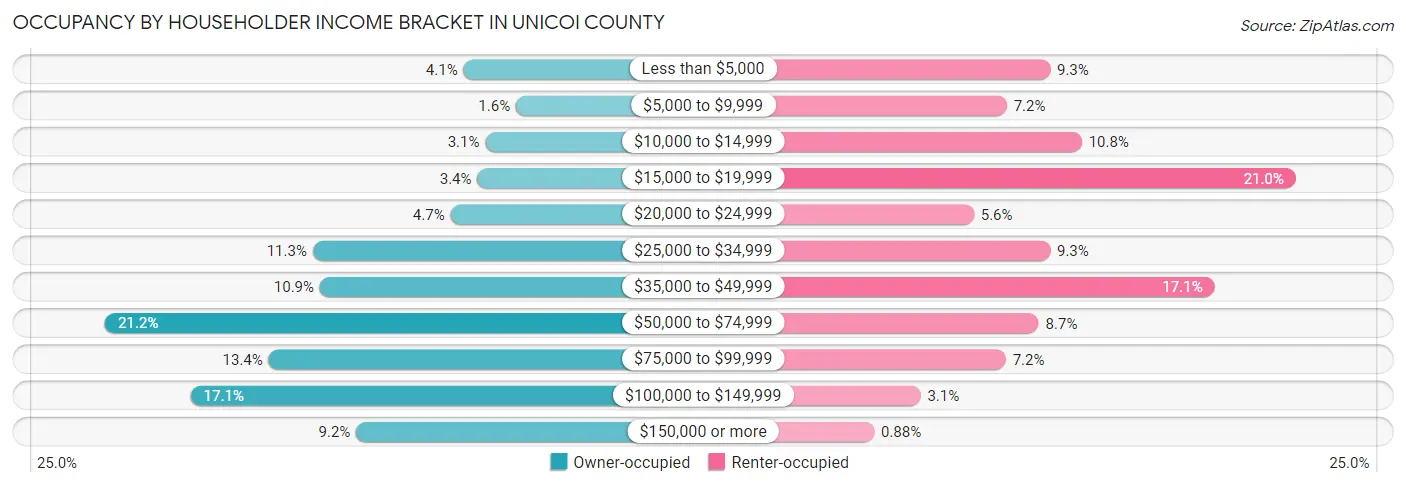
| Income Bracket | Owner-occupied | Renter-occupied |
| Less than $5,000 | 230 (4.1%) | 189 (9.3%) |
| $5,000 to $9,999 | 90 (1.6%) | 147 (7.2%) |
| $10,000 to $14,999 | 172 (3.1%) | 220 (10.8%) |
| $15,000 to $19,999 | 193 (3.4%) | 428 (21.0%) |
| $20,000 to $24,999 | 265 (4.7%) | 115 (5.6%) |
| $25,000 to $34,999 | 633 (11.3%) | 189 (9.3%) |
| $35,000 to $49,999 | 614 (10.9%) | 349 (17.1%) |
| $50,000 to $74,999 | 1,188 (21.2%) | 178 (8.7%) |
| $75,000 to $99,999 | 751 (13.4%) | 146 (7.1%) |
| $100,000 to $149,999 | 959 (17.1%) | 63 (3.1%) |
| $150,000 or more | 517 (9.2%) | 18 (0.9%) |
| Total | 5,612 (100.0%) | 2,042 (100.0%) |
Monthly Housing Cost Tiers in Unicoi County
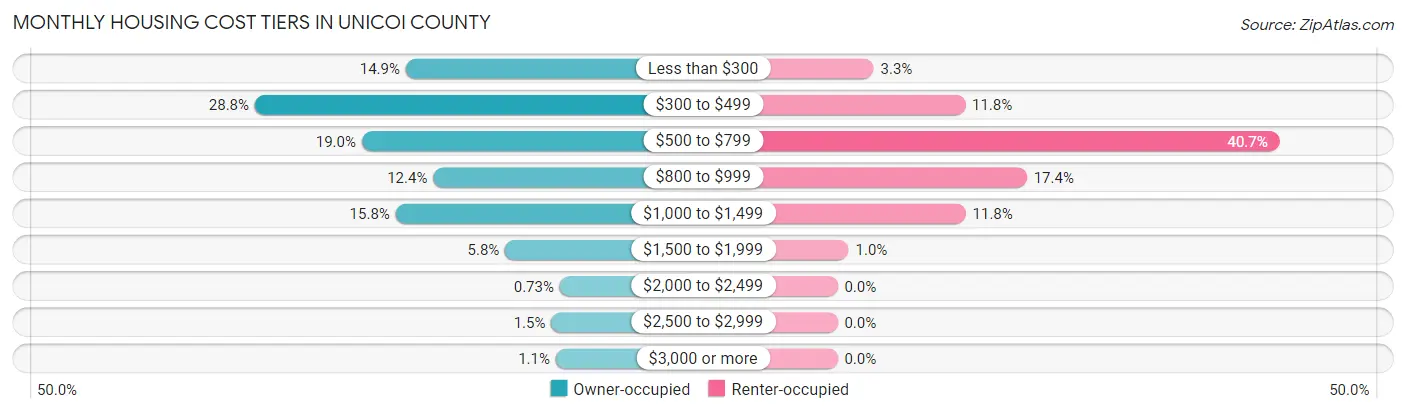
| Monthly Cost | Owner-occupied | Renter-occupied |
| Less than $300 | 837 (14.9%) | 68 (3.3%) |
| $300 to $499 | 1,616 (28.8%) | 240 (11.7%) |
| $500 to $799 | 1,064 (19.0%) | 831 (40.7%) |
| $800 to $999 | 695 (12.4%) | 356 (17.4%) |
| $1,000 to $1,499 | 889 (15.8%) | 241 (11.8%) |
| $1,500 to $1,999 | 323 (5.8%) | 21 (1.0%) |
| $2,000 to $2,499 | 41 (0.7%) | 0 (0.0%) |
| $2,500 to $2,999 | 85 (1.5%) | 0 (0.0%) |
| $3,000 or more | 62 (1.1%) | 0 (0.0%) |
| Total | 5,612 (100.0%) | 2,042 (100.0%) |
Physical Housing Characteristics in Unicoi County
Housing Structures in Unicoi County
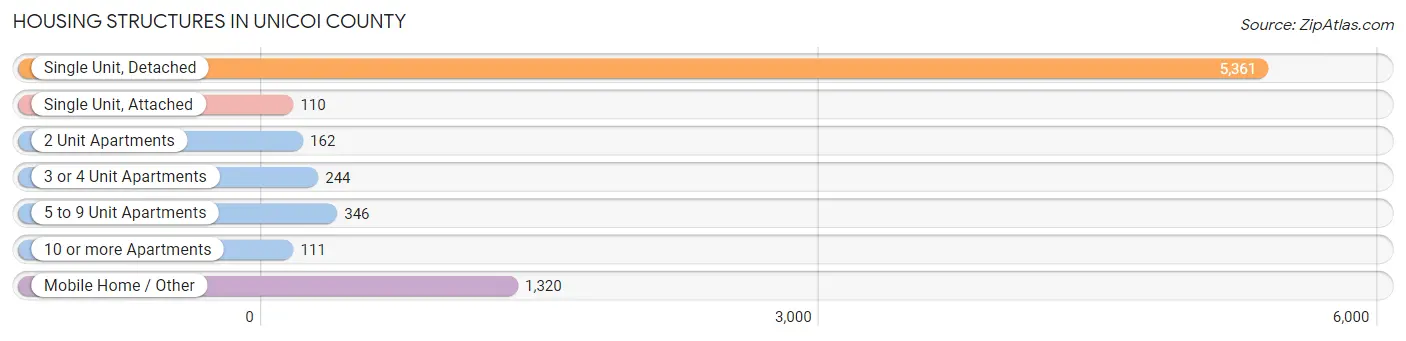
| Structure Type | # Housing Units | % Housing Units |
| Single Unit, Detached | 5,361 | 70.0% |
| Single Unit, Attached | 110 | 1.4% |
| 2 Unit Apartments | 162 | 2.1% |
| 3 or 4 Unit Apartments | 244 | 3.2% |
| 5 to 9 Unit Apartments | 346 | 4.5% |
| 10 or more Apartments | 111 | 1.5% |
| Mobile Home / Other | 1,320 | 17.2% |
| Total | 7,654 | 100.0% |
Housing Structures by Occupancy in Unicoi County
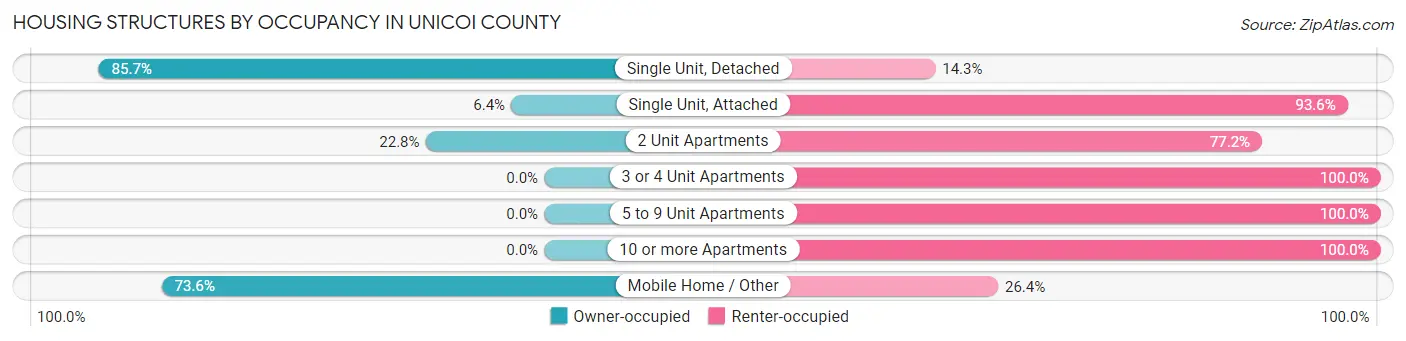
| Structure Type | Owner-occupied | Renter-occupied |
| Single Unit, Detached | 4,596 (85.7%) | 765 (14.3%) |
| Single Unit, Attached | 7 (6.4%) | 103 (93.6%) |
| 2 Unit Apartments | 37 (22.8%) | 125 (77.2%) |
| 3 or 4 Unit Apartments | 0 (0.0%) | 244 (100.0%) |
| 5 to 9 Unit Apartments | 0 (0.0%) | 346 (100.0%) |
| 10 or more Apartments | 0 (0.0%) | 111 (100.0%) |
| Mobile Home / Other | 972 (73.6%) | 348 (26.4%) |
| Total | 5,612 (73.3%) | 2,042 (26.7%) |
Housing Structures by Number of Rooms in Unicoi County
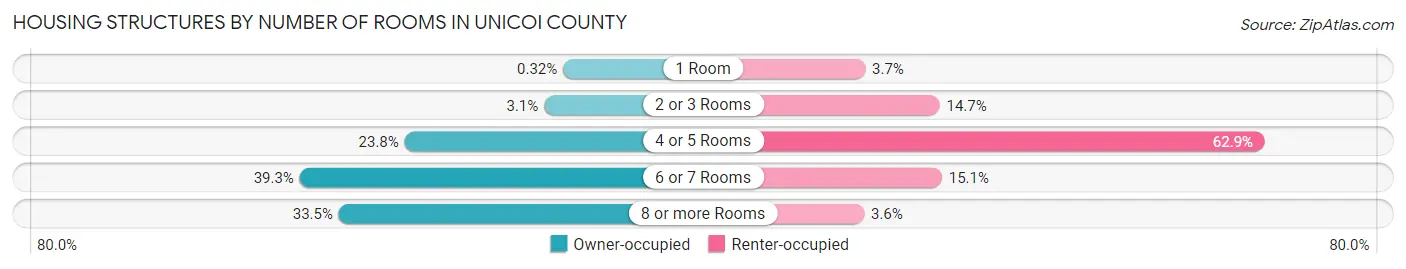
| Number of Rooms | Owner-occupied | Renter-occupied |
| 1 Room | 18 (0.3%) | 76 (3.7%) |
| 2 or 3 Rooms | 175 (3.1%) | 301 (14.7%) |
| 4 or 5 Rooms | 1,334 (23.8%) | 1,284 (62.9%) |
| 6 or 7 Rooms | 2,205 (39.3%) | 308 (15.1%) |
| 8 or more Rooms | 1,880 (33.5%) | 73 (3.6%) |
| Total | 5,612 (100.0%) | 2,042 (100.0%) |
Housing Structure by Heating Type in Unicoi County
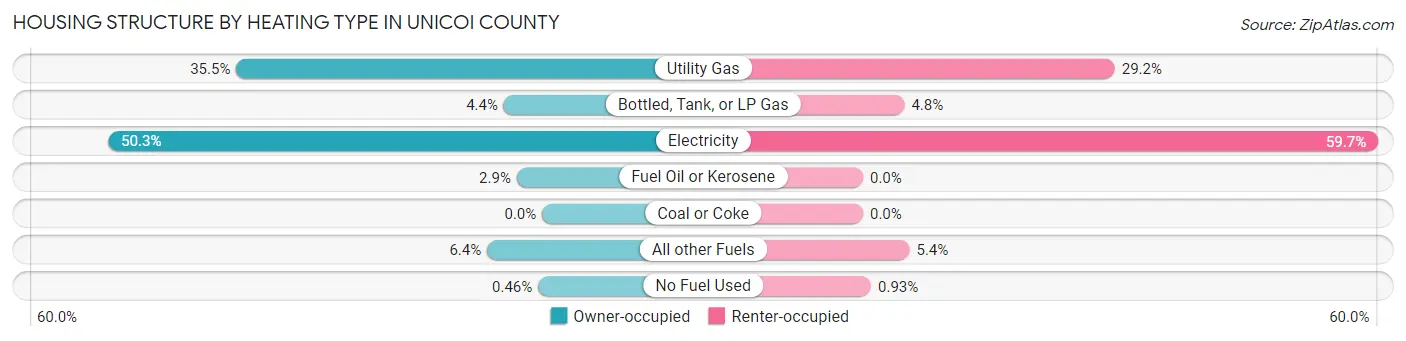
| Heating Type | Owner-occupied | Renter-occupied |
| Utility Gas | 1,990 (35.5%) | 596 (29.2%) |
| Bottled, Tank, or LP Gas | 249 (4.4%) | 98 (4.8%) |
| Electricity | 2,824 (50.3%) | 1,219 (59.7%) |
| Fuel Oil or Kerosene | 165 (2.9%) | 0 (0.0%) |
| Coal or Coke | 0 (0.0%) | 0 (0.0%) |
| All other Fuels | 358 (6.4%) | 110 (5.4%) |
| No Fuel Used | 26 (0.5%) | 19 (0.9%) |
| Total | 5,612 (100.0%) | 2,042 (100.0%) |
Household Vehicle Usage in Unicoi County
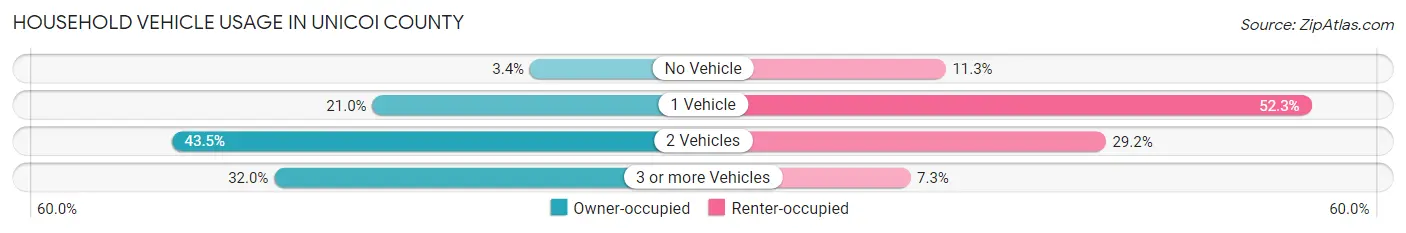
| Vehicles per Household | Owner-occupied | Renter-occupied |
| No Vehicle | 190 (3.4%) | 230 (11.3%) |
| 1 Vehicle | 1,181 (21.0%) | 1,067 (52.2%) |
| 2 Vehicles | 2,443 (43.5%) | 596 (29.2%) |
| 3 or more Vehicles | 1,798 (32.0%) | 149 (7.3%) |
| Total | 5,612 (100.0%) | 2,042 (100.0%) |
Real Estate & Mortgages in Unicoi County
Real Estate and Mortgage Overview in Unicoi County
| Characteristic | Without Mortgage | With Mortgage |
| Housing Units | 3,238 | 2,374 |
| Median Property Value | $140,400 | $170,300 |
| Median Household Income | $49,694 | $210 |
| Monthly Housing Costs | $380 | $62 |
| Real Estate Taxes | $819 | $76 |
Property Value by Mortgage Status in Unicoi County

| Property Value | Without Mortgage | With Mortgage |
| Less than $50,000 | 665 (20.5%) | 100 (4.2%) |
| $50,000 to $99,999 | 558 (17.2%) | 241 (10.2%) |
| $100,000 to $299,999 | 1,522 (47.0%) | 1,663 (70.1%) |
| $300,000 to $499,999 | 390 (12.0%) | 292 (12.3%) |
| $500,000 to $749,999 | 72 (2.2%) | 50 (2.1%) |
| $750,000 to $999,999 | 7 (0.2%) | 28 (1.2%) |
| $1,000,000 or more | 24 (0.7%) | 0 (0.0%) |
| Total | 3,238 (100.0%) | 2,374 (100.0%) |
Household Income by Mortgage Status in Unicoi County
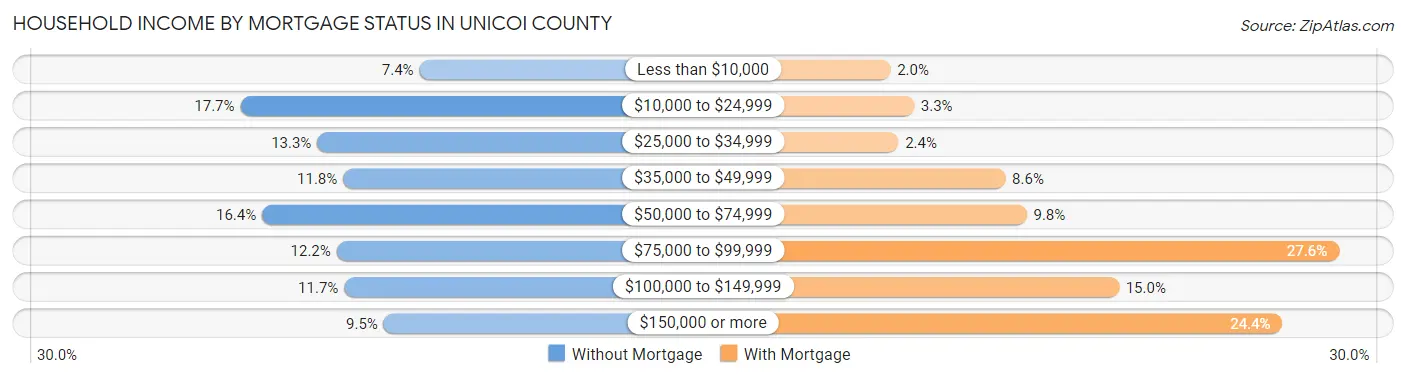
| Household Income | Without Mortgage | With Mortgage |
| Less than $10,000 | 241 (7.4%) | 47 (2.0%) |
| $10,000 to $24,999 | 572 (17.7%) | 79 (3.3%) |
| $25,000 to $34,999 | 430 (13.3%) | 58 (2.4%) |
| $35,000 to $49,999 | 382 (11.8%) | 203 (8.6%) |
| $50,000 to $74,999 | 532 (16.4%) | 232 (9.8%) |
| $75,000 to $99,999 | 394 (12.2%) | 656 (27.6%) |
| $100,000 to $149,999 | 380 (11.7%) | 357 (15.0%) |
| $150,000 or more | 307 (9.5%) | 579 (24.4%) |
| Total | 3,238 (100.0%) | 2,374 (100.0%) |
Property Value to Household Income Ratio in Unicoi County
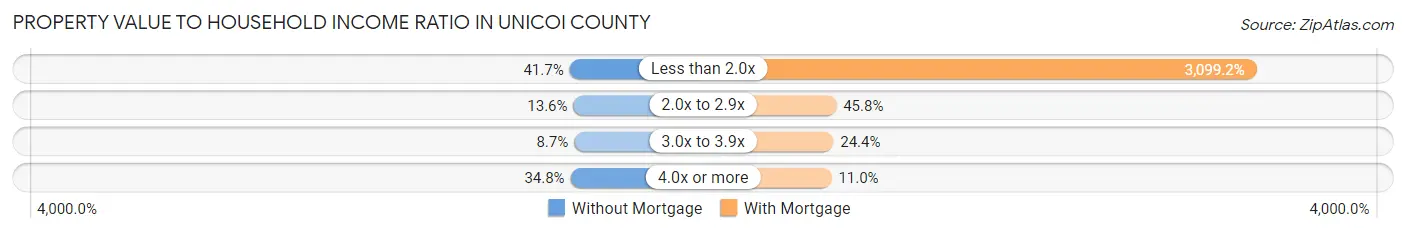
| Value-to-Income Ratio | Without Mortgage | With Mortgage |
| Less than 2.0x | 1,350 (41.7%) | 73,576 (3,099.2%) |
| 2.0x to 2.9x | 440 (13.6%) | 1,087 (45.8%) |
| 3.0x to 3.9x | 282 (8.7%) | 580 (24.4%) |
| 4.0x or more | 1,127 (34.8%) | 261 (11.0%) |
| Total | 3,238 (100.0%) | 2,374 (100.0%) |
Real Estate Taxes by Mortgage Status in Unicoi County
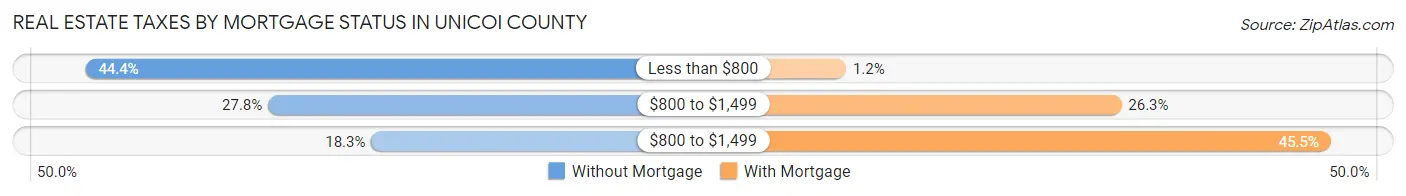
| Property Taxes | Without Mortgage | With Mortgage |
| Less than $800 | 1,439 (44.4%) | 28 (1.2%) |
| $800 to $1,499 | 899 (27.8%) | 625 (26.3%) |
| $800 to $1,499 | 594 (18.3%) | 1,079 (45.5%) |
| Total | 3,238 (100.0%) | 2,374 (100.0%) |
Health & Disability in Unicoi County
Health Insurance Coverage by Age in Unicoi County
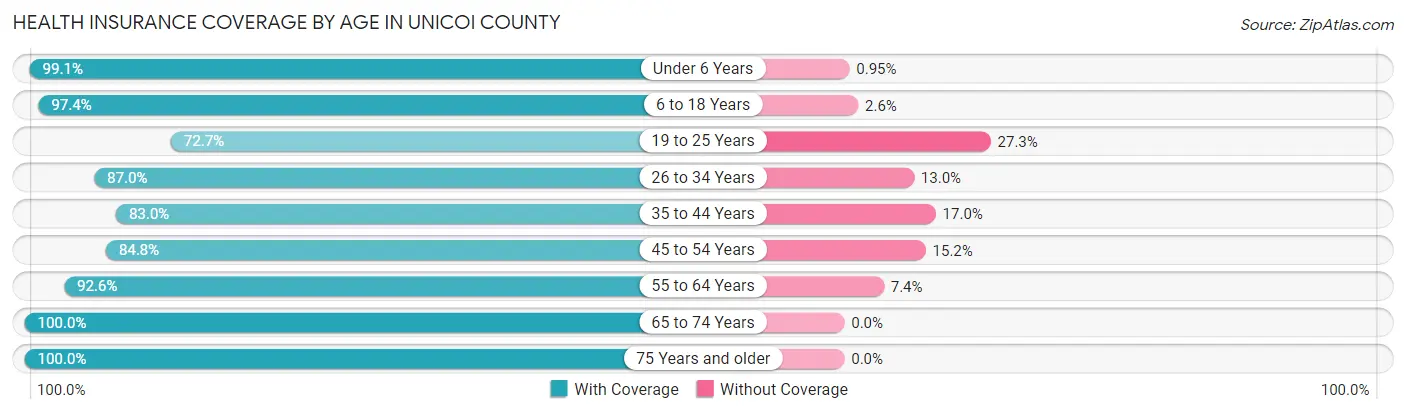
| Age Bracket | With Coverage | Without Coverage |
| Under 6 Years | 937 (99.1%) | 9 (0.9%) |
| 6 to 18 Years | 2,337 (97.4%) | 62 (2.6%) |
| 19 to 25 Years | 914 (72.7%) | 343 (27.3%) |
| 26 to 34 Years | 1,582 (87.0%) | 236 (13.0%) |
| 35 to 44 Years | 1,612 (83.0%) | 331 (17.0%) |
| 45 to 54 Years | 2,077 (84.8%) | 371 (15.2%) |
| 55 to 64 Years | 2,519 (92.6%) | 200 (7.4%) |
| 65 to 74 Years | 2,355 (100.0%) | 0 (0.0%) |
| 75 Years and older | 1,579 (100.0%) | 0 (0.0%) |
| Total | 15,912 (91.1%) | 1,552 (8.9%) |
Health Insurance Coverage by Citizenship Status in Unicoi County
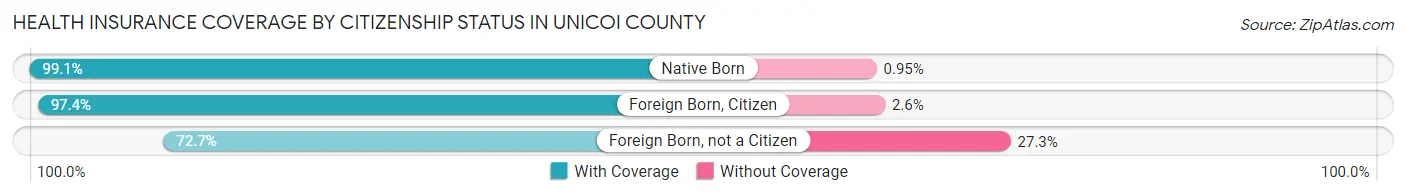
| Citizenship Status | With Coverage | Without Coverage |
| Native Born | 937 (99.1%) | 9 (0.9%) |
| Foreign Born, Citizen | 2,337 (97.4%) | 62 (2.6%) |
| Foreign Born, not a Citizen | 914 (72.7%) | 343 (27.3%) |
Health Insurance Coverage by Household Income in Unicoi County
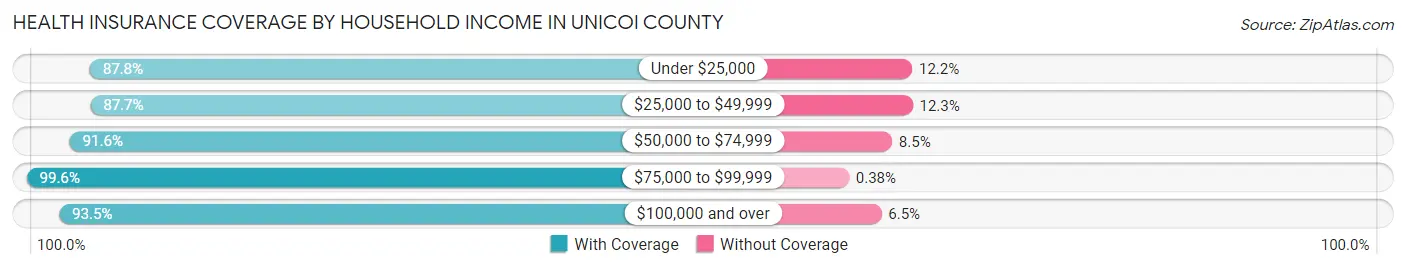
| Household Income | With Coverage | Without Coverage |
| Under $25,000 | 2,824 (87.8%) | 393 (12.2%) |
| $25,000 to $49,999 | 3,184 (87.7%) | 447 (12.3%) |
| $50,000 to $74,999 | 3,100 (91.5%) | 286 (8.5%) |
| $75,000 to $99,999 | 2,120 (99.6%) | 8 (0.4%) |
| $100,000 and over | 4,603 (93.5%) | 319 (6.5%) |
Public vs Private Health Insurance Coverage by Age in Unicoi County
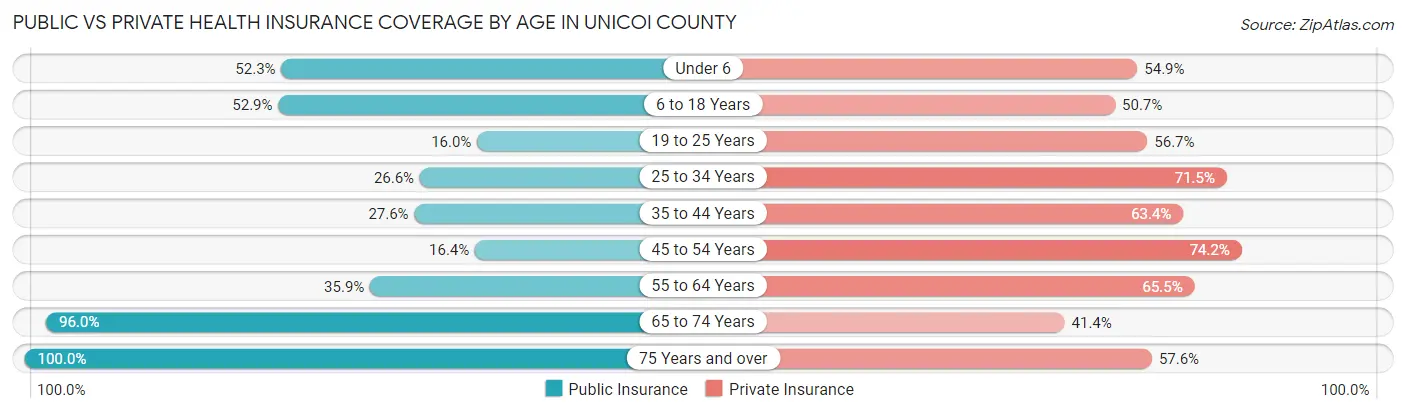
| Age Bracket | Public Insurance | Private Insurance |
| Under 6 | 495 (52.3%) | 519 (54.9%) |
| 6 to 18 Years | 1,269 (52.9%) | 1,217 (50.7%) |
| 19 to 25 Years | 201 (16.0%) | 713 (56.7%) |
| 25 to 34 Years | 484 (26.6%) | 1,299 (71.5%) |
| 35 to 44 Years | 537 (27.6%) | 1,231 (63.4%) |
| 45 to 54 Years | 401 (16.4%) | 1,817 (74.2%) |
| 55 to 64 Years | 975 (35.9%) | 1,780 (65.5%) |
| 65 to 74 Years | 2,261 (96.0%) | 974 (41.4%) |
| 75 Years and over | 1,579 (100.0%) | 909 (57.6%) |
| Total | 8,202 (47.0%) | 10,459 (59.9%) |
Disability Status by Sex by Age in Unicoi County
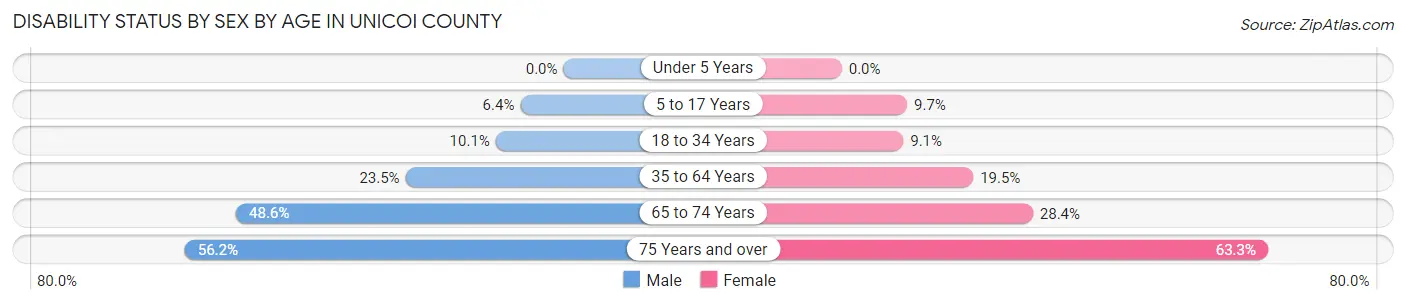
| Age Bracket | Male | Female |
| Under 5 Years | 0 (0.0%) | 0 (0.0%) |
| 5 to 17 Years | 84 (6.4%) | 110 (9.7%) |
| 18 to 34 Years | 161 (10.1%) | 143 (9.1%) |
| 35 to 64 Years | 837 (23.4%) | 691 (19.5%) |
| 65 to 74 Years | 567 (48.6%) | 337 (28.4%) |
| 75 Years and over | 421 (56.2%) | 525 (63.2%) |
Disability Class by Sex by Age in Unicoi County
Disability Class: Hearing Difficulty
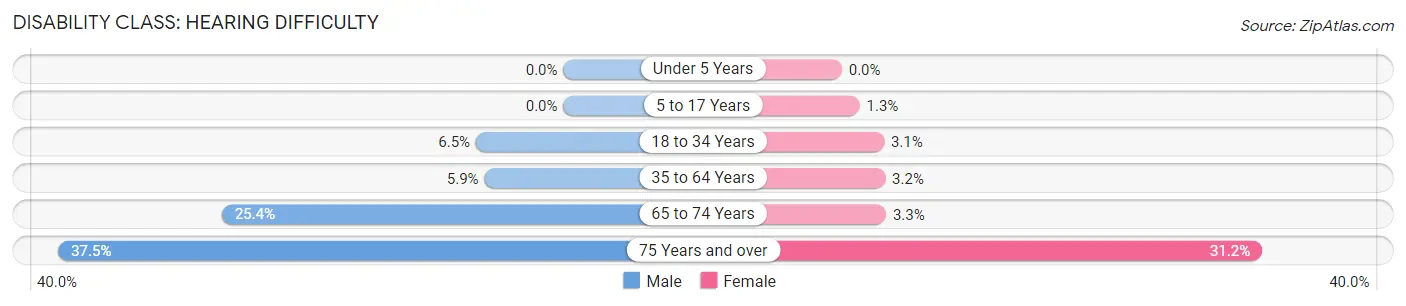
| Age Bracket | Male | Female |
| Under 5 Years | 0 (0.0%) | 0 (0.0%) |
| 5 to 17 Years | 0 (0.0%) | 15 (1.3%) |
| 18 to 34 Years | 104 (6.5%) | 49 (3.1%) |
| 35 to 64 Years | 209 (5.9%) | 114 (3.2%) |
| 65 to 74 Years | 296 (25.4%) | 39 (3.3%) |
| 75 Years and over | 281 (37.5%) | 259 (31.2%) |
Disability Class: Vision Difficulty
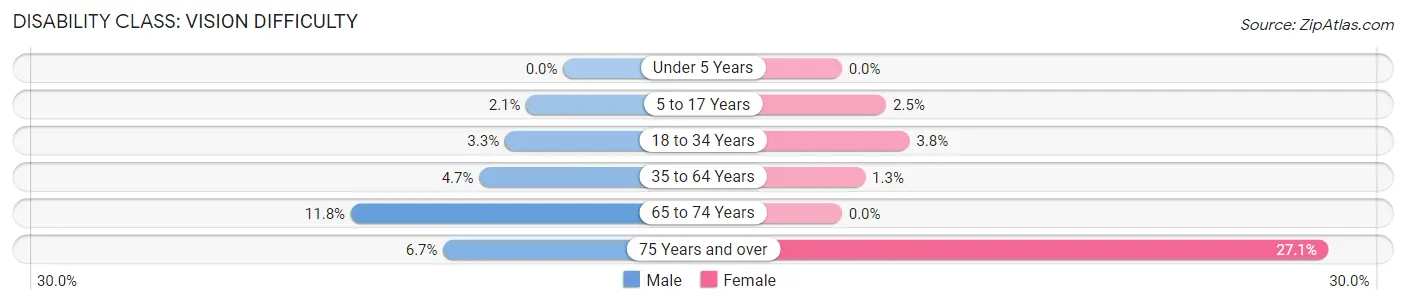
| Age Bracket | Male | Female |
| Under 5 Years | 0 (0.0%) | 0 (0.0%) |
| 5 to 17 Years | 27 (2.1%) | 28 (2.5%) |
| 18 to 34 Years | 52 (3.3%) | 59 (3.8%) |
| 35 to 64 Years | 167 (4.7%) | 46 (1.3%) |
| 65 to 74 Years | 138 (11.8%) | 0 (0.0%) |
| 75 Years and over | 50 (6.7%) | 225 (27.1%) |
Disability Class: Cognitive Difficulty
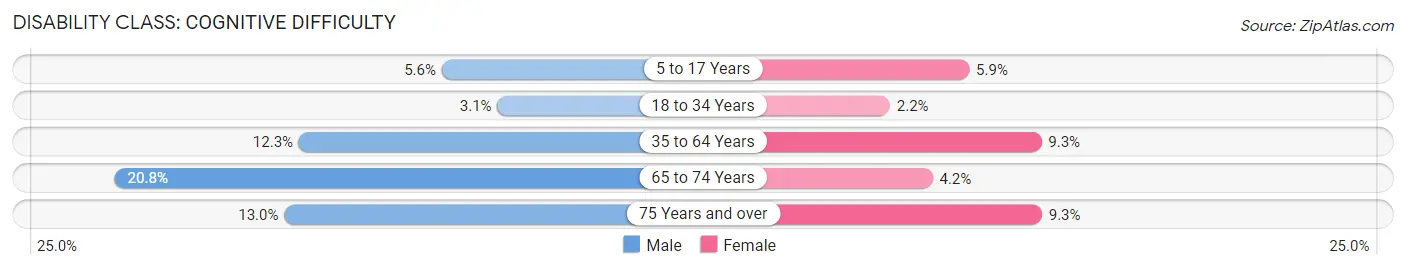
| Age Bracket | Male | Female |
| 5 to 17 Years | 74 (5.6%) | 67 (5.9%) |
| 18 to 34 Years | 49 (3.1%) | 35 (2.2%) |
| 35 to 64 Years | 438 (12.3%) | 328 (9.3%) |
| 65 to 74 Years | 243 (20.8%) | 50 (4.2%) |
| 75 Years and over | 97 (13.0%) | 77 (9.3%) |
Disability Class: Ambulatory Difficulty
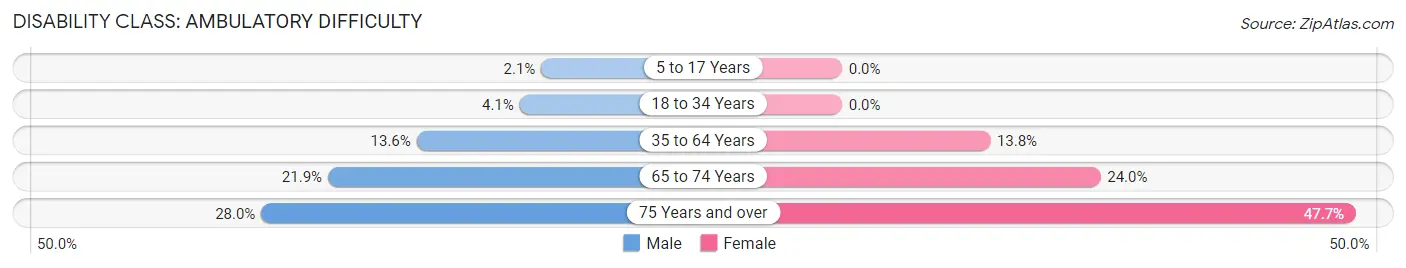
| Age Bracket | Male | Female |
| 5 to 17 Years | 27 (2.1%) | 0 (0.0%) |
| 18 to 34 Years | 65 (4.1%) | 0 (0.0%) |
| 35 to 64 Years | 486 (13.6%) | 487 (13.8%) |
| 65 to 74 Years | 255 (21.8%) | 285 (24.0%) |
| 75 Years and over | 210 (28.0%) | 396 (47.7%) |
Disability Class: Self-Care Difficulty
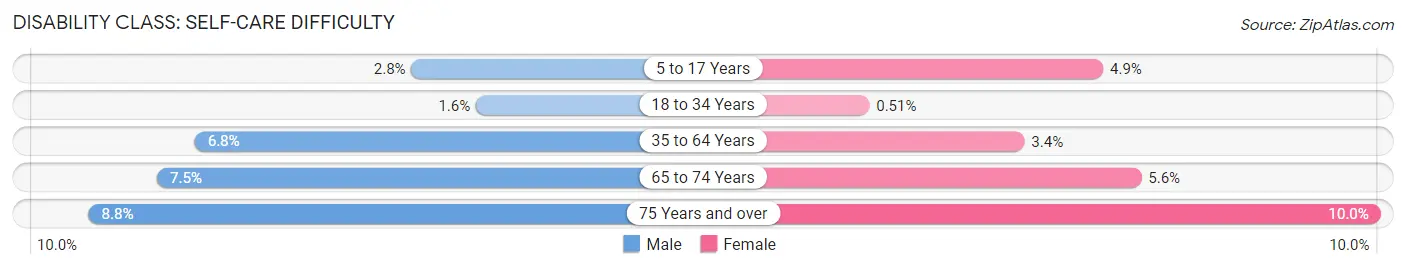
| Age Bracket | Male | Female |
| 5 to 17 Years | 37 (2.8%) | 55 (4.9%) |
| 18 to 34 Years | 26 (1.6%) | 8 (0.5%) |
| 35 to 64 Years | 244 (6.8%) | 120 (3.4%) |
| 65 to 74 Years | 88 (7.5%) | 66 (5.6%) |
| 75 Years and over | 66 (8.8%) | 83 (10.0%) |
Technology Access in Unicoi County
Computing Device Access in Unicoi County
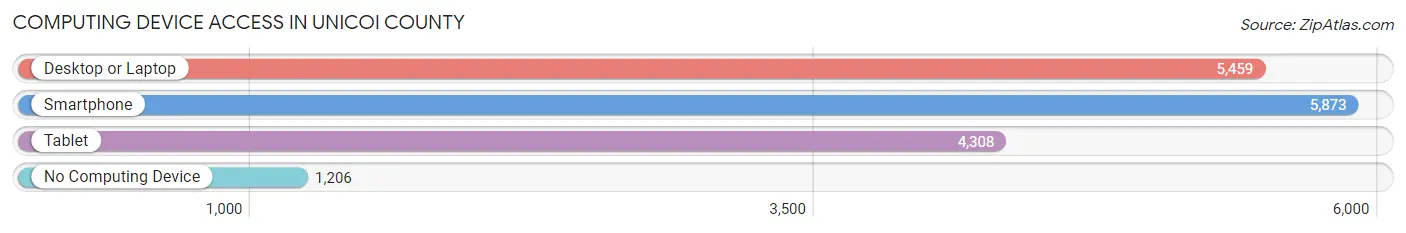
| Device Type | # Households | % Households |
| Desktop or Laptop | 5,459 | 71.3% |
| Smartphone | 5,873 | 76.7% |
| Tablet | 4,308 | 56.3% |
| No Computing Device | 1,206 | 15.8% |
| Total | 7,654 | 100.0% |
Internet Access in Unicoi County
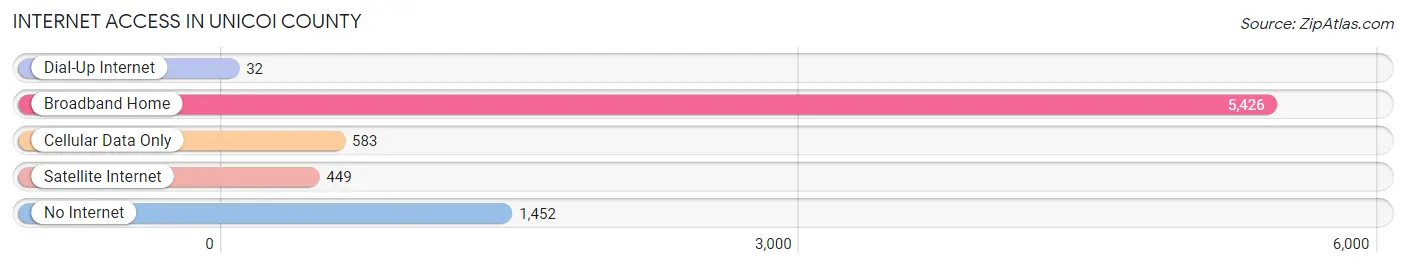
| Internet Type | # Households | % Households |
| Dial-Up Internet | 32 | 0.4% |
| Broadband Home | 5,426 | 70.9% |
| Cellular Data Only | 583 | 7.6% |
| Satellite Internet | 449 | 5.9% |
| No Internet | 1,452 | 19.0% |
| Total | 7,654 | 100.0% |
Unicoi County Summary
Unicoi County is located in the northeastern corner of Tennessee, and is part of the Appalachian region. It is bordered by Carter County to the north, Washington County to the east, Greene County to the south, and Johnson County to the west. The county seat is Erwin, and the county has a total area of 246 square miles.
Geography
Unicoi County is located in the Appalachian Mountains, and is part of the Great Smoky Mountains National Park. The county is mostly mountainous, with elevations ranging from 1,000 to 4,000 feet. The highest point in the county is Unaka Mountain, which has an elevation of 4,928 feet. The county is home to several rivers, including the Nolichucky, Doe, and Watauga. The county is also home to several state parks, including Rocky Fork State Park, Unaka Mountain State Natural Area, and Unicoi State Park.
History
Unicoi County was formed in 1875 from parts of Washington and Carter counties. The county was named after the Cherokee word for “white,” which was the color of the limestone found in the area. The county seat was originally located in Flag Pond, but was moved to Erwin in 1876.
The county was largely rural until the late 19th century, when the railroad was built through the area. This led to the development of several small towns, including Erwin, Flag Pond, and Unicoi. The county also became a popular tourist destination, as it was close to the Great Smoky Mountains National Park.
Economy
Unicoi County’s economy is largely based on tourism, as it is close to the Great Smoky Mountains National Park. The county is also home to several manufacturing companies, including Unicoi County Industries, which produces furniture and wood products. The county is also home to several farms, which produce a variety of crops, including corn, soybeans, and hay.
Demographics
As of the 2010 census, Unicoi County had a population of 18,313. The population was spread out, with 48.3% male and 51.7% female. The median age was 41.7 years. The racial makeup of the county was 95.2% White, 1.7% African American, 0.3% Native American, 0.5% Asian, 0.1% Pacific Islander, 1.2% from other races, and 1.1% from two or more races. Hispanic or Latino of any race were 2.3% of the population.
The median household income in Unicoi County was $35,945, and the median family income was $41,945. The per capita income was $18,945. About 17.2% of the population was below the poverty line.
Unicoi County is a rural county with a rich history and a diverse economy. It is home to several state parks and is close to the Great Smoky Mountains National Park, making it a popular tourist destination. The county is also home to several manufacturing companies and farms, providing employment opportunities for its residents.
Common Questions
What is the Total Population of Unicoi County?
Total Population of Unicoi County is 17,845.
What is the Total Male Population of Unicoi County?
Total Male Population of Unicoi County is 9,004.
What is the Total Female Population of Unicoi County?
Total Female Population of Unicoi County is 8,841.
What is the Ratio of Males per 100 Females in Unicoi County?
There are 101.84 Males per 100 Females in Unicoi County.
What is the Ratio of Females per 100 Males in Unicoi County?
There are 98.19 Females per 100 Males in Unicoi County.
What is the Median Population Age in Unicoi County?
Median Population Age in Unicoi County is 47.4 Years.
What is the Average Family Size in Unicoi County
Average Family Size in Unicoi County is 2.8 People.
What is the Average Household Size in Unicoi County
Average Household Size in Unicoi County is 2.3 People.
What is Per Capita Income in Unicoi County?
Per Capita income in Unicoi County is $27,930.
What is the Median Family Income in Unicoi County?
Median Family Income in Unicoi County is $66,886.
What is the Median Household income in Unicoi County?
Median Household Income in Unicoi County is $49,855.
What is Income or Wage Gap in Unicoi County?
Income or Wage Gap in Unicoi County is 22.7%.
Women in Unicoi County earn 77.3 cents for every dollar earned by a man.
What is Family Income Deficit in Unicoi County?
Family Income Deficit in Unicoi County is $11,711.
Families that are below poverty line in Unicoi County earn $11,711 less on average than the poverty threshold level.
What is Inequality or Gini Index in Unicoi County?
Inequality or Gini Index in Unicoi County is 0.46.
How Large is the Labor Force in Unicoi County?
There are 8,106 People in the Labor Forcein in Unicoi County.
What is the Percentage of People in the Labor Force in Unicoi County?
54.2% of People are in the Labor Force in Unicoi County.
What is the Unemployment Rate in Unicoi County?
Unemployment Rate in Unicoi County is 5.4%.