Tipton County, TN
Tipton County Map
Tipton County Overview
61,116
TOTAL POPULATION
30,274
MALE POPULATION
30,842
FEMALE POPULATION
98.16
MALES / 100 FEMALES
101.88
FEMALES / 100 MALES
38.4
MEDIAN AGE
3.1
AVG FAMILY SIZE
2.7
AVG HOUSEHOLD SIZE
$31,909
PER CAPITA INCOME
$79,871
AVG FAMILY INCOME
$70,674
AVG HOUSEHOLD INCOME
27.7%
WAGE / INCOME GAP [ % ]
72.3¢/ $1
WAGE / INCOME GAP [ $ ]
$12,430
FAMILY INCOME DEFICIT
0.41
INEQUALITY / GINI INDEX
29,593
LABOR FORCE [ PEOPLE ]
61.3%
PERCENT IN LABOR FORCE
5.4%
UNEMPLOYMENT RATE
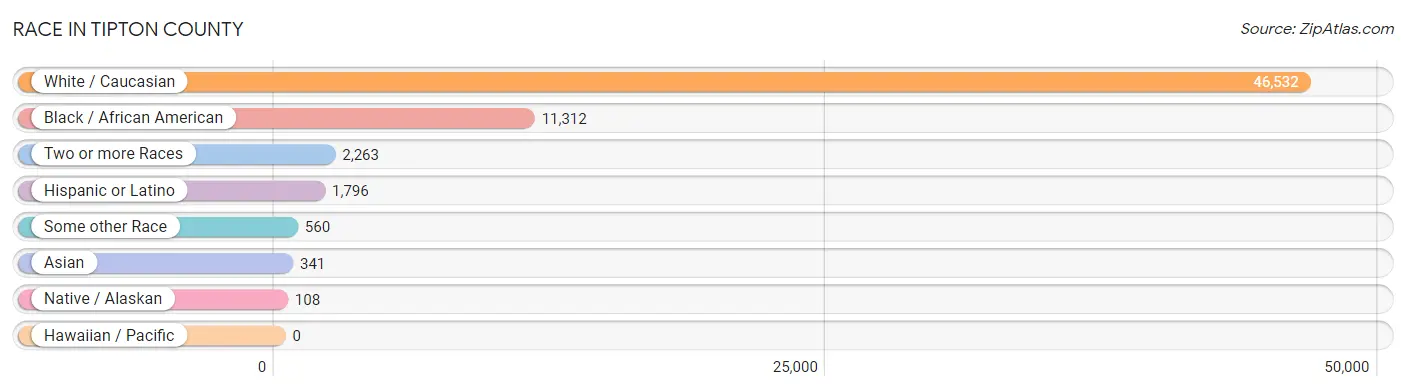
Race in Tipton County
The most populous races in Tipton County are White / Caucasian (46,532 | 76.1%), Black / African American (11,312 | 18.5%), and Two or more Races (2,263 | 3.7%).
| Race | # Population | % Population |
| Asian | 341 | 0.6% |
| Black / African American | 11,312 | 18.5% |
| Hawaiian / Pacific | 0 | 0.0% |
| Hispanic or Latino | 1,796 | 2.9% |
| Native / Alaskan | 108 | 0.2% |
| White / Caucasian | 46,532 | 76.1% |
| Two or more Races | 2,263 | 3.7% |
| Some other Race | 560 | 0.9% |
| Total | 61,116 | 100.0% |
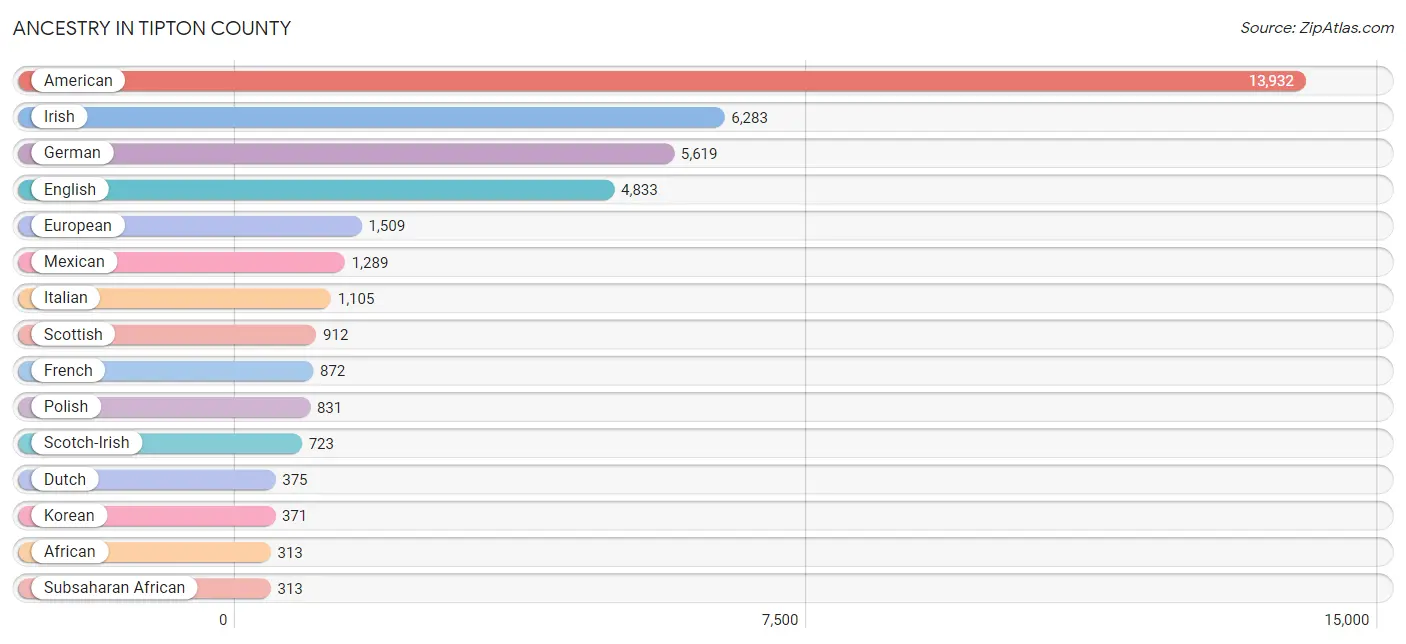
Ancestry in Tipton County
The most populous ancestries reported in Tipton County are American (13,932 | 22.8%), Irish (6,283 | 10.3%), German (5,619 | 9.2%), English (4,833 | 7.9%), and European (1,509 | 2.5%), together accounting for 52.6% of all Tipton County residents.
| Ancestry | # Population | % Population |
| African | 313 | 0.5% |
| American | 13,932 | 22.8% |
| Apache | 3 | 0.0% |
| Arab | 11 | 0.0% |
| Armenian | 17 | 0.0% |
| Austrian | 32 | 0.1% |
| Bhutanese | 70 | 0.1% |
| Blackfeet | 18 | 0.0% |
| Brazilian | 9 | 0.0% |
| British | 238 | 0.4% |
| Burmese | 75 | 0.1% |
| Cajun | 4 | 0.0% |
| Central American | 87 | 0.1% |
| Cherokee | 294 | 0.5% |
| Chickasaw | 3 | 0.0% |
| Choctaw | 17 | 0.0% |
| Comanche | 2 | 0.0% |
| Creek | 13 | 0.0% |
| Croatian | 4 | 0.0% |
| Crow | 6 | 0.0% |
| Cuban | 145 | 0.2% |
| Czech | 117 | 0.2% |
| Danish | 17 | 0.0% |
| Dutch | 375 | 0.6% |
| Eastern European | 14 | 0.0% |
| English | 4,833 | 7.9% |
| European | 1,509 | 2.5% |
| Finnish | 82 | 0.1% |
| French | 872 | 1.4% |
| French Canadian | 121 | 0.2% |
| German | 5,619 | 9.2% |
| Greek | 15 | 0.0% |
| Guatemalan | 34 | 0.1% |
| Honduran | 15 | 0.0% |
| Hungarian | 8 | 0.0% |
| Icelander | 15 | 0.0% |
| Indian (Asian) | 13 | 0.0% |
| Irish | 6,283 | 10.3% |
| Italian | 1,105 | 1.8% |
| Japanese | 19 | 0.0% |
| Korean | 371 | 0.6% |
| Lebanese | 11 | 0.0% |
| Lithuanian | 43 | 0.1% |
| Menominee | 43 | 0.1% |
| Mexican | 1,289 | 2.1% |
| Nicaraguan | 13 | 0.0% |
| Northern European | 6 | 0.0% |
| Norwegian | 283 | 0.5% |
| Panamanian | 25 | 0.0% |
| Polish | 831 | 1.4% |
| Portuguese | 76 | 0.1% |
| Pueblo | 1 | 0.0% |
| Puerto Rican | 174 | 0.3% |
| Russian | 71 | 0.1% |
| Scandinavian | 90 | 0.2% |
| Scotch-Irish | 723 | 1.2% |
| Scottish | 912 | 1.5% |
| Sioux | 2 | 0.0% |
| Slovak | 26 | 0.0% |
| Spaniard | 45 | 0.1% |
| Spanish | 13 | 0.0% |
| Sri Lankan | 128 | 0.2% |
| Subsaharan African | 313 | 0.5% |
| Swedish | 150 | 0.3% |
| Swiss | 36 | 0.1% |
| Thai | 35 | 0.1% |
| Ukrainian | 56 | 0.1% |
| Welsh | 270 | 0.4% | View All 68 Rows |
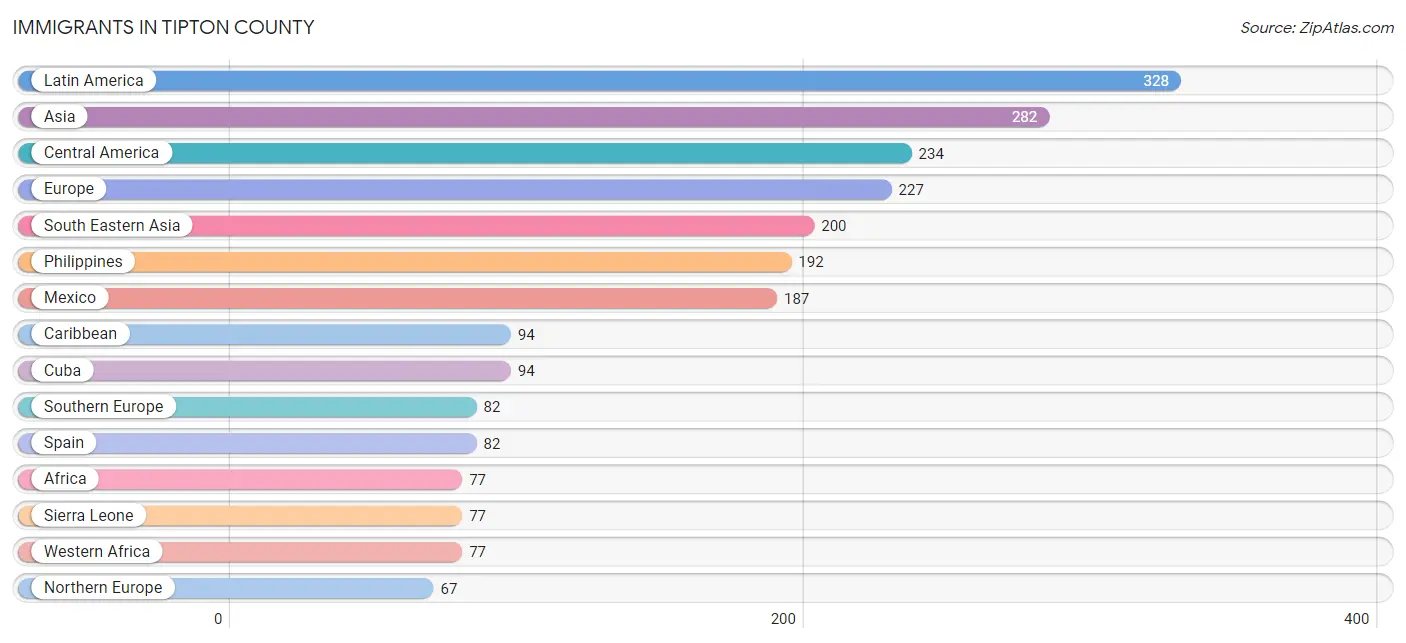
Immigrants in Tipton County
The most numerous immigrant groups reported in Tipton County came from Latin America (328 | 0.5%), Asia (282 | 0.5%), Central America (234 | 0.4%), Europe (227 | 0.4%), and South Eastern Asia (200 | 0.3%), together accounting for 2.1% of all Tipton County residents.
| Immigration Origin | # Population | % Population |
| Africa | 77 | 0.1% |
| Asia | 282 | 0.5% |
| Cambodia | 8 | 0.0% |
| Caribbean | 94 | 0.2% |
| Central America | 234 | 0.4% |
| China | 13 | 0.0% |
| Cuba | 94 | 0.2% |
| Eastern Asia | 47 | 0.1% |
| Eastern Europe | 17 | 0.0% |
| England | 3 | 0.0% |
| Europe | 227 | 0.4% |
| Germany | 51 | 0.1% |
| Guatemala | 7 | 0.0% |
| Honduras | 15 | 0.0% |
| India | 35 | 0.1% |
| Japan | 27 | 0.0% |
| Korea | 7 | 0.0% |
| Latin America | 328 | 0.5% |
| Lithuania | 17 | 0.0% |
| Mexico | 187 | 0.3% |
| Netherlands | 10 | 0.0% |
| Northern Europe | 67 | 0.1% |
| Panama | 25 | 0.0% |
| Philippines | 192 | 0.3% |
| Sierra Leone | 77 | 0.1% |
| South Central Asia | 35 | 0.1% |
| South Eastern Asia | 200 | 0.3% |
| Southern Europe | 82 | 0.1% |
| Spain | 82 | 0.1% |
| Taiwan | 13 | 0.0% |
| Western Africa | 77 | 0.1% |
| Western Europe | 61 | 0.1% | View All 32 Rows |
Sex and Age in Tipton County
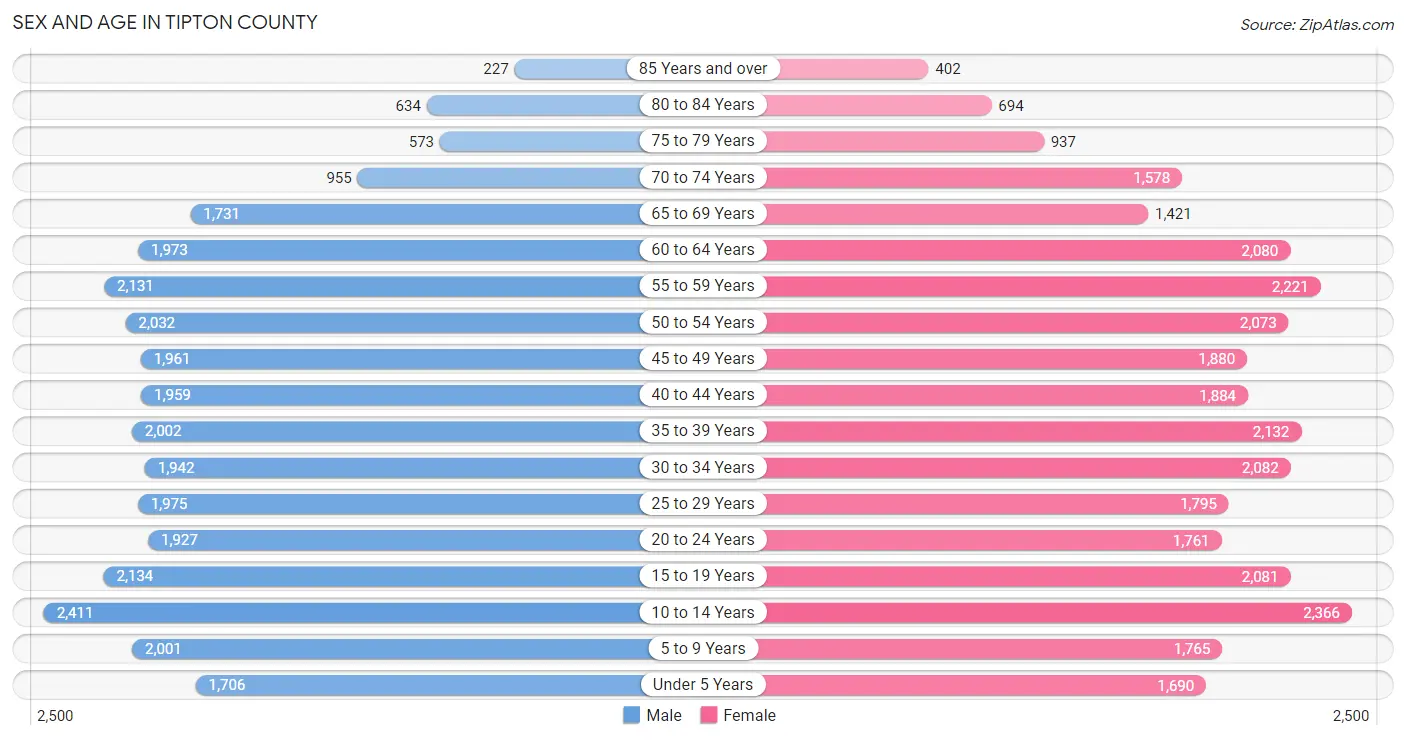
Sex and Age in Tipton County
The most populous age groups in Tipton County are 10 to 14 Years (2,411 | 8.0%) for men and 10 to 14 Years (2,366 | 7.7%) for women.
| Age Bracket | Male | Female |
| Under 5 Years | 1,706 (5.6%) | 1,690 (5.5%) |
| 5 to 9 Years | 2,001 (6.6%) | 1,765 (5.7%) |
| 10 to 14 Years | 2,411 (8.0%) | 2,366 (7.7%) |
| 15 to 19 Years | 2,134 (7.0%) | 2,081 (6.8%) |
| 20 to 24 Years | 1,927 (6.4%) | 1,761 (5.7%) |
| 25 to 29 Years | 1,975 (6.5%) | 1,795 (5.8%) |
| 30 to 34 Years | 1,942 (6.4%) | 2,082 (6.8%) |
| 35 to 39 Years | 2,002 (6.6%) | 2,132 (6.9%) |
| 40 to 44 Years | 1,959 (6.5%) | 1,884 (6.1%) |
| 45 to 49 Years | 1,961 (6.5%) | 1,880 (6.1%) |
| 50 to 54 Years | 2,032 (6.7%) | 2,073 (6.7%) |
| 55 to 59 Years | 2,131 (7.0%) | 2,221 (7.2%) |
| 60 to 64 Years | 1,973 (6.5%) | 2,080 (6.7%) |
| 65 to 69 Years | 1,731 (5.7%) | 1,421 (4.6%) |
| 70 to 74 Years | 955 (3.2%) | 1,578 (5.1%) |
| 75 to 79 Years | 573 (1.9%) | 937 (3.0%) |
| 80 to 84 Years | 634 (2.1%) | 694 (2.2%) |
| 85 Years and over | 227 (0.7%) | 402 (1.3%) |
| Total | 30,274 (100.0%) | 30,842 (100.0%) |
Families and Households in Tipton County
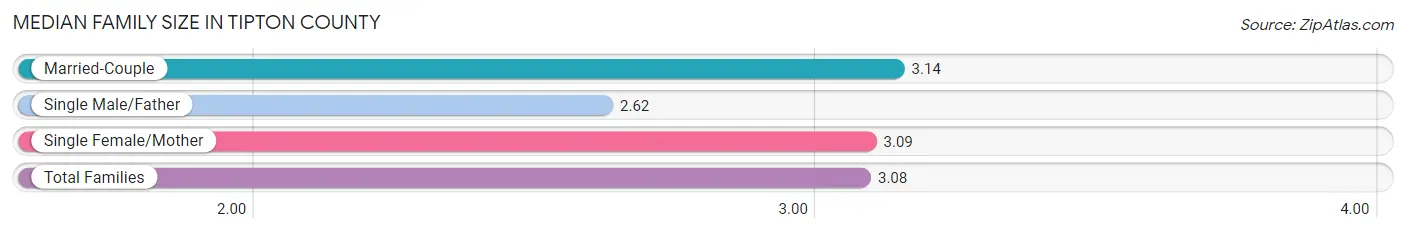
Median Family Size in Tipton County
The median family size in Tipton County is 3.08 persons per family, with married-couple families (12,319 | 71.7%) accounting for the largest median family size of 3.14 persons per family. On the other hand, single male/father families (1,575 | 9.2%) represent the smallest median family size with 2.62 persons per family.
| Family Type | # Families | Family Size |
| Married-Couple | 12,319 (71.7%) | 3.14 |
| Single Male/Father | 1,575 (9.2%) | 2.62 |
| Single Female/Mother | 3,287 (19.1%) | 3.09 |
| Total Families | 17,181 (100.0%) | 3.08 |
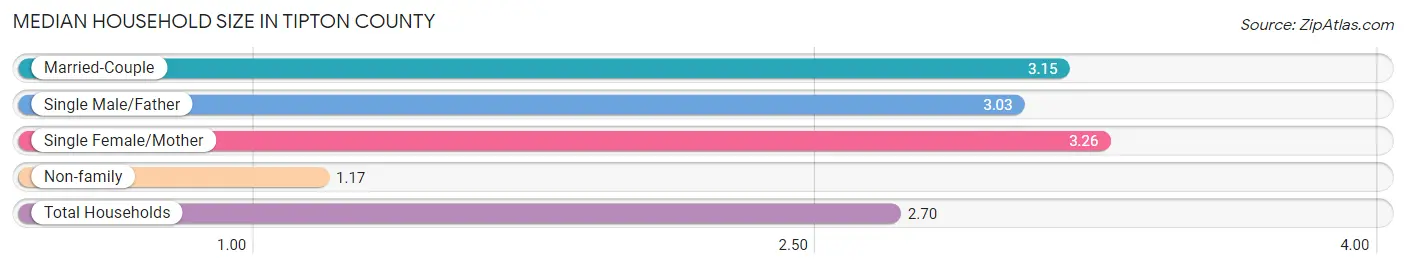
Median Household Size in Tipton County
The median household size in Tipton County is 2.70 persons per household, with single female/mother households (3,287 | 14.7%) accounting for the largest median household size of 3.26 persons per household. non-family households (5,185 | 23.2%) represent the smallest median household size with 1.17 persons per household.
| Household Type | # Households | Household Size |
| Married-Couple | 12,319 (55.1%) | 3.15 |
| Single Male/Father | 1,575 (7.0%) | 3.03 |
| Single Female/Mother | 3,287 (14.7%) | 3.26 |
| Non-family | 5,185 (23.2%) | 1.17 |
| Total Households | 22,366 (100.0%) | 2.70 |
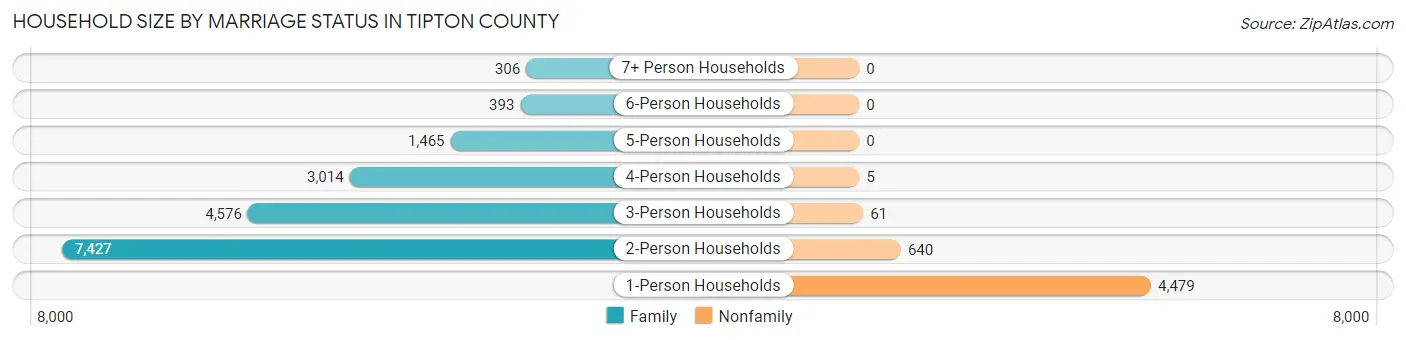
Household Size by Marriage Status in Tipton County
Out of a total of 22,366 households in Tipton County, 17,181 (76.8%) are family households, while 5,185 (23.2%) are nonfamily households. The most numerous type of family households are 2-person households, comprising 7,427, and the most common type of nonfamily households are 1-person households, comprising 4,479.
| Household Size | Family Households | Nonfamily Households |
| 1-Person Households | - | 4,479 (20.0%) |
| 2-Person Households | 7,427 (33.2%) | 640 (2.9%) |
| 3-Person Households | 4,576 (20.5%) | 61 (0.3%) |
| 4-Person Households | 3,014 (13.5%) | 5 (0.0%) |
| 5-Person Households | 1,465 (6.6%) | 0 (0.0%) |
| 6-Person Households | 393 (1.8%) | 0 (0.0%) |
| 7+ Person Households | 306 (1.4%) | 0 (0.0%) |
| Total | 17,181 (76.8%) | 5,185 (23.2%) |
Female Fertility in Tipton County
Fertility by Age in Tipton County
Average fertility rate in Tipton County is 58.0 births per 1,000 women. Women in the age bracket of 20 to 34 years have the highest fertility rate with 121.0 births per 1,000 women. Women in the age bracket of 20 to 34 years acount for 84.0% of all women with births.

| Age Bracket | Women with Births | Births / 1,000 Women |
| 15 to 19 years | 0 (0.0%) | 0.0 |
| 20 to 34 years | 683 (84.0%) | 121.0 |
| 35 to 50 years | 130 (16.0%) | 21.0 |
| Total | 813 (100.0%) | 58.0 |
Fertility by Age by Marriage Status in Tipton County
78.0% of women with births (813) in Tipton County are married. The highest percentage of unmarried women with births falls into 20 to 34 years age bracket with 22.8% of them unmarried at the time of birth, while the lowest percentage of unmarried women with births belong to 35 to 50 years age bracket with 17.7% of them unmarried.
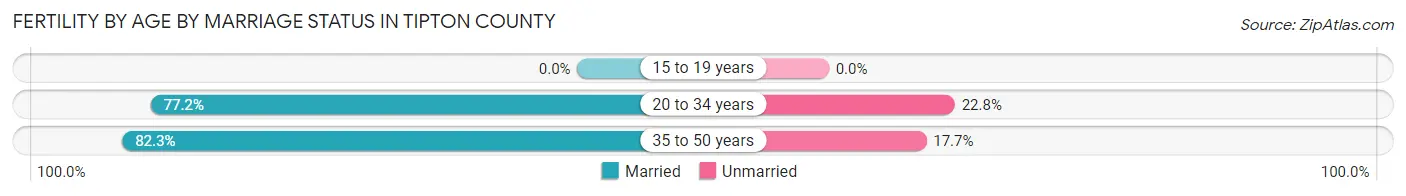
| Age Bracket | Married | Unmarried |
| 15 to 19 years | 0 (0.0%) | 0 (0.0%) |
| 20 to 34 years | 527 (77.2%) | 156 (22.8%) |
| 35 to 50 years | 107 (82.3%) | 23 (17.7%) |
| Total | 634 (78.0%) | 179 (22.0%) |
Fertility by Education in Tipton County
Average fertility rate in Tipton County is 58.0 births per 1,000 women. Women with the education attainment of college or associate's degree have the highest fertility rate of 81.0 births per 1,000 women, while women with the education attainment of less than high school have the lowest fertility at 13.0 births per 1,000 women. Women with the education attainment of college or associate's degree represent 52.0% of all women with births.
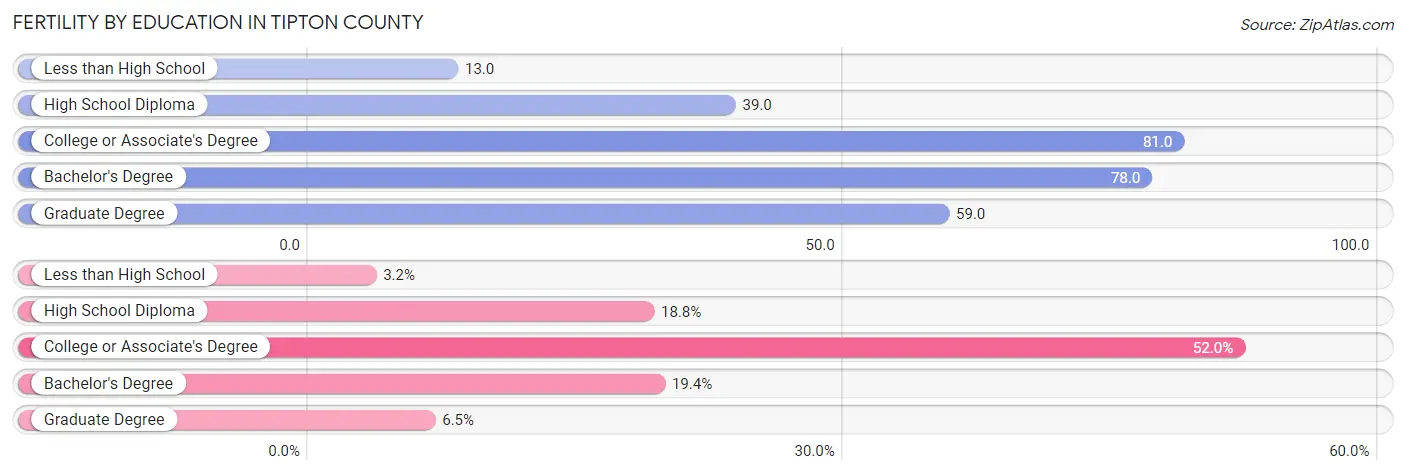
| Educational Attainment | Women with Births | Births / 1,000 Women |
| Less than High School | 26 (3.2%) | 13.0 |
| High School Diploma | 153 (18.8%) | 39.0 |
| College or Associate's Degree | 423 (52.0%) | 81.0 |
| Bachelor's Degree | 158 (19.4%) | 78.0 |
| Graduate Degree | 53 (6.5%) | 59.0 |
| Total | 813 (100.0%) | 58.0 |
Fertility by Education by Marriage Status in Tipton County
22.0% of women with births in Tipton County are unmarried. Women with the educational attainment of graduate degree are most likely to be married with 100.0% of them married at childbirth, while women with the educational attainment of less than high school are least likely to be married with 46.2% of them unmarried at childbirth.
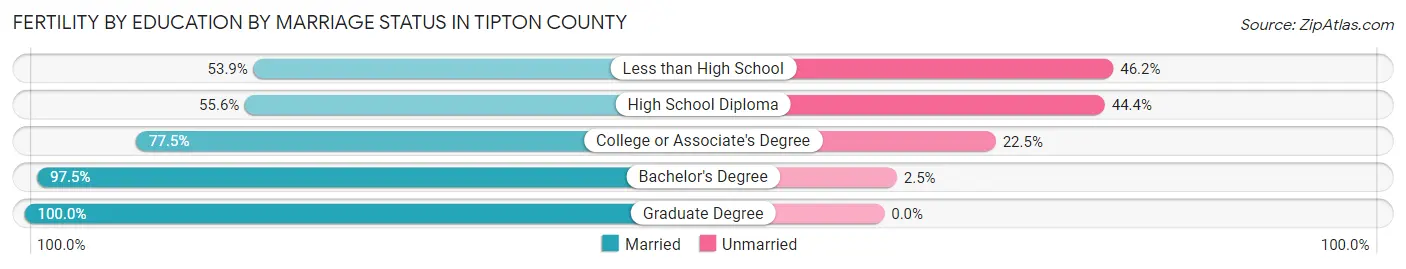
| Educational Attainment | Married | Unmarried |
| Less than High School | 14 (53.8%) | 12 (46.2%) |
| High School Diploma | 85 (55.6%) | 68 (44.4%) |
| College or Associate's Degree | 328 (77.5%) | 95 (22.5%) |
| Bachelor's Degree | 154 (97.5%) | 4 (2.5%) |
| Graduate Degree | 53 (100.0%) | 0 (0.0%) |
| Total | 634 (78.0%) | 179 (22.0%) |
Income in Tipton County
Income Overview in Tipton County
Per Capita Income in Tipton County is $31,909, while median incomes of families and households are $79,871 and $70,674 respectively.
| Characteristic | Number | Measure |
| Per Capita Income | 61,116 | $31,909 |
| Median Family Income | 17,181 | $79,871 |
| Mean Family Income | 17,181 | $95,010 |
| Median Household Income | 22,366 | $70,674 |
| Mean Household Income | 22,366 | $85,338 |
| Income Deficit | 17,181 | $12,430 |
| Wage / Income Gap (%) | 61,116 | 27.70% |
| Wage / Income Gap ($) | 61,116 | 72.30¢ per $1 |
| Gini / Inequality Index | 61,116 | 0.41 |
Earnings by Sex in Tipton County
Average Earnings in Tipton County are $41,865, $47,137 for men and $34,082 for women, a difference of 27.7%.
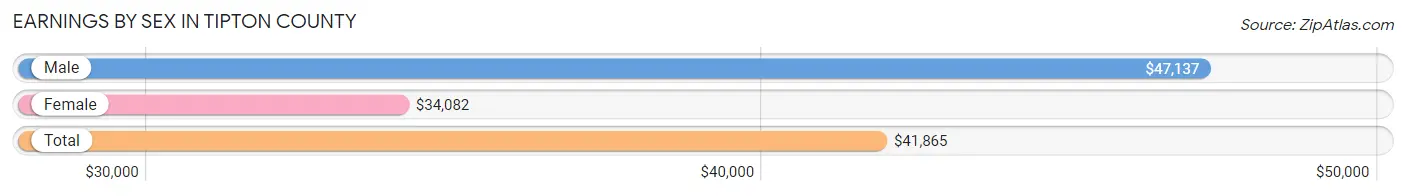
| Sex | Number | Average Earnings |
| Male | 16,416 (53.3%) | $47,137 |
| Female | 14,390 (46.7%) | $34,082 |
| Total | 30,806 (100.0%) | $41,865 |
Earnings by Sex by Income Bracket in Tipton County
The most common earnings brackets in Tipton County are $100,000+ for men (2,483 | 15.1%) and $55,000 to $64,999 for women (1,253 | 8.7%).
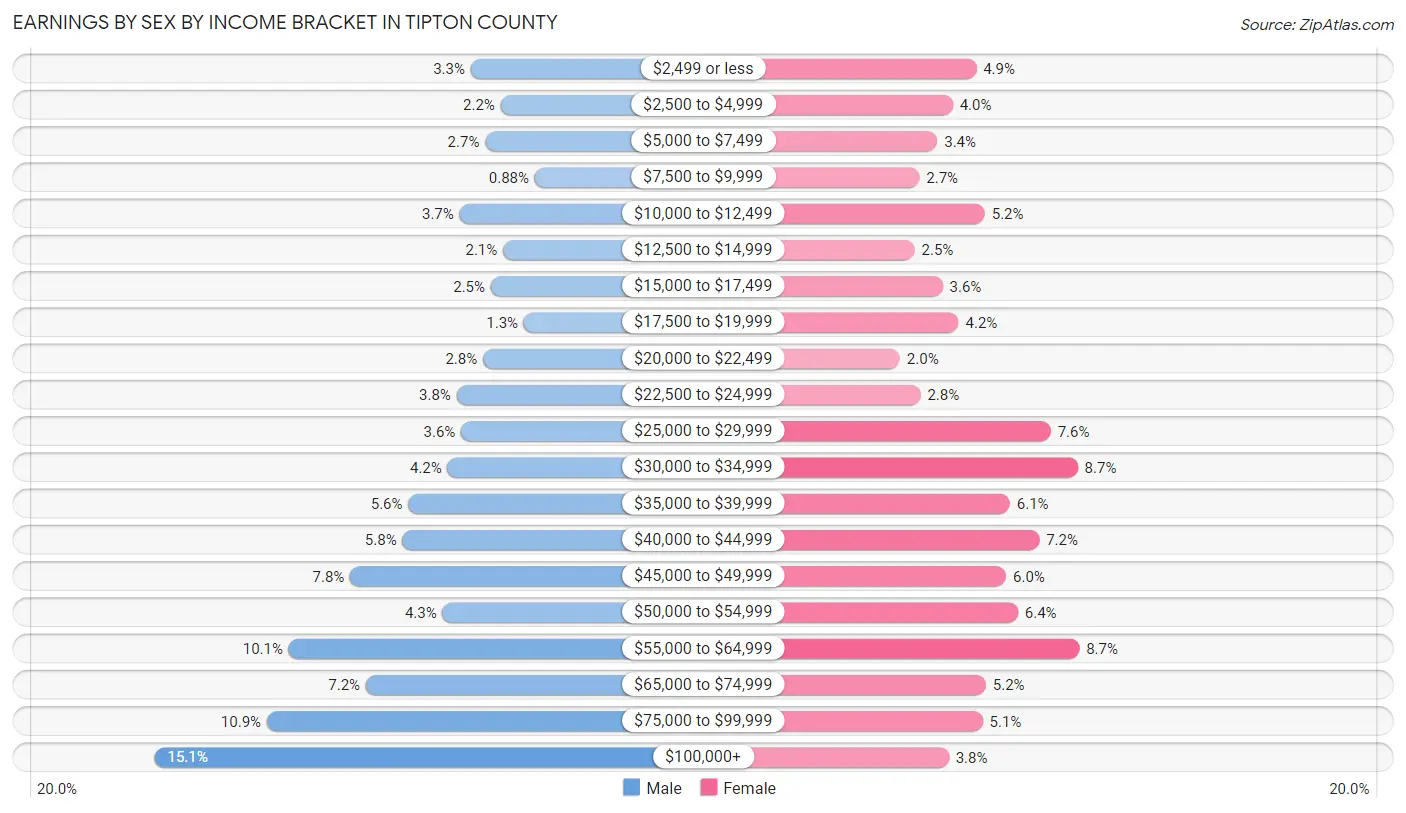
| Income | Male | Female |
| $2,499 or less | 538 (3.3%) | 698 (4.9%) |
| $2,500 to $4,999 | 354 (2.2%) | 572 (4.0%) |
| $5,000 to $7,499 | 449 (2.7%) | 488 (3.4%) |
| $7,500 to $9,999 | 145 (0.9%) | 392 (2.7%) |
| $10,000 to $12,499 | 608 (3.7%) | 744 (5.2%) |
| $12,500 to $14,999 | 339 (2.1%) | 365 (2.5%) |
| $15,000 to $17,499 | 416 (2.5%) | 517 (3.6%) |
| $17,500 to $19,999 | 211 (1.3%) | 603 (4.2%) |
| $20,000 to $22,499 | 463 (2.8%) | 287 (2.0%) |
| $22,500 to $24,999 | 625 (3.8%) | 397 (2.8%) |
| $25,000 to $29,999 | 597 (3.6%) | 1,100 (7.6%) |
| $30,000 to $34,999 | 682 (4.2%) | 1,245 (8.6%) |
| $35,000 to $39,999 | 922 (5.6%) | 879 (6.1%) |
| $40,000 to $44,999 | 959 (5.8%) | 1,038 (7.2%) |
| $45,000 to $49,999 | 1,280 (7.8%) | 859 (6.0%) |
| $50,000 to $54,999 | 712 (4.3%) | 922 (6.4%) |
| $55,000 to $64,999 | 1,658 (10.1%) | 1,253 (8.7%) |
| $65,000 to $74,999 | 1,183 (7.2%) | 749 (5.2%) |
| $75,000 to $99,999 | 1,792 (10.9%) | 732 (5.1%) |
| $100,000+ | 2,483 (15.1%) | 550 (3.8%) |
| Total | 16,416 (100.0%) | 14,390 (100.0%) |
Earnings by Sex by Educational Attainment in Tipton County
Average earnings in Tipton County are $54,233 for men and $37,276 for women, a difference of 31.3%. Men with an educational attainment of graduate degree enjoy the highest average annual earnings of $89,606, while those with less than high school education earn the least with $40,468. Women with an educational attainment of graduate degree earn the most with the average annual earnings of $51,992, while those with less than high school education have the smallest earnings of $23,125.
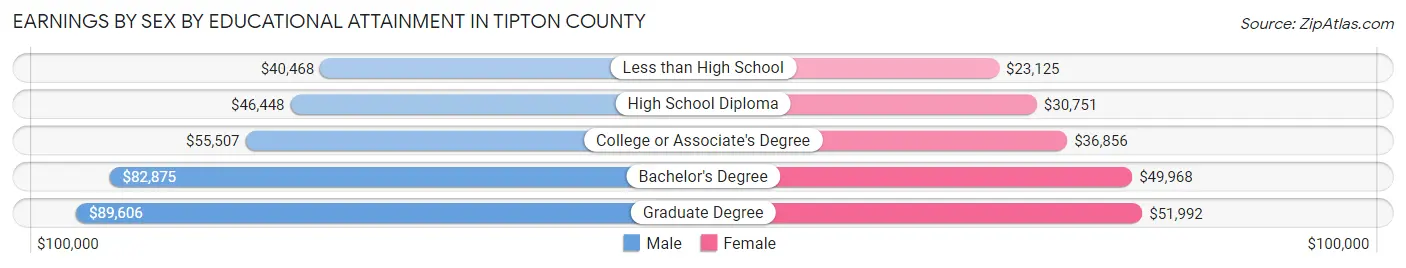
| Educational Attainment | Male Income | Female Income |
| Less than High School | $40,468 | $23,125 |
| High School Diploma | $46,448 | $30,751 |
| College or Associate's Degree | $55,507 | $36,856 |
| Bachelor's Degree | $82,875 | $49,968 |
| Graduate Degree | $89,606 | $51,992 |
| Total | $54,233 | $37,276 |
Family Income in Tipton County
Family Income Brackets in Tipton County
According to the Tipton County family income data, there are 3,711 families falling into the $100,000 to $149,999 income range, which is the most common income bracket and makes up 21.6% of all families. Conversely, the $10,000 to $14,999 income bracket is the least frequent group with only 378 families (2.2%) belonging to this category.
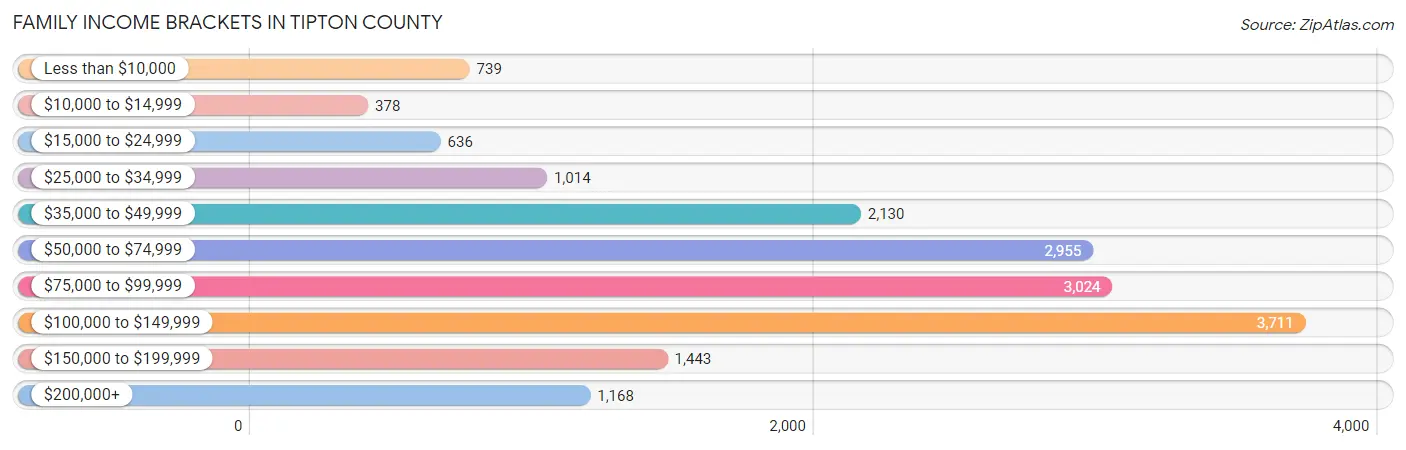
| Income Bracket | # Families | % Families |
| Less than $10,000 | 739 | 4.3% |
| $10,000 to $14,999 | 378 | 2.2% |
| $15,000 to $24,999 | 636 | 3.7% |
| $25,000 to $34,999 | 1,014 | 5.9% |
| $35,000 to $49,999 | 2,130 | 12.4% |
| $50,000 to $74,999 | 2,955 | 17.2% |
| $75,000 to $99,999 | 3,024 | 17.6% |
| $100,000 to $149,999 | 3,711 | 21.6% |
| $150,000 to $199,999 | 1,443 | 8.4% |
| $200,000+ | 1,168 | 6.8% |
Family Income by Famaliy Size in Tipton County
6-person families (285 | 1.7%) account for the highest median family income in Tipton County with $107,844 per family, while 2-person families (7,878 | 45.9%) have the highest median income of $37,347 per family member.
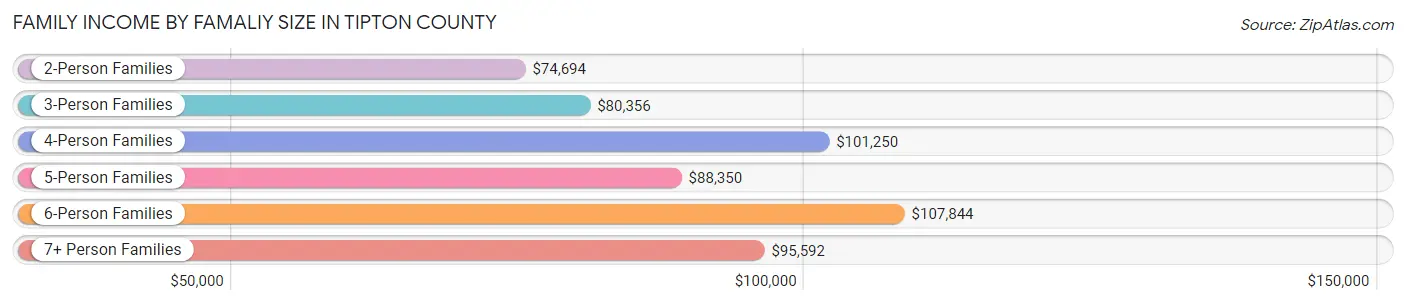
| Income Bracket | # Families | Median Income |
| 2-Person Families | 7,878 (45.9%) | $74,694 |
| 3-Person Families | 4,493 (26.2%) | $80,356 |
| 4-Person Families | 2,871 (16.7%) | $101,250 |
| 5-Person Families | 1,351 (7.9%) | $88,350 |
| 6-Person Families | 285 (1.7%) | $107,844 |
| 7+ Person Families | 303 (1.8%) | $95,592 |
| Total | 17,181 (100.0%) | $79,871 |
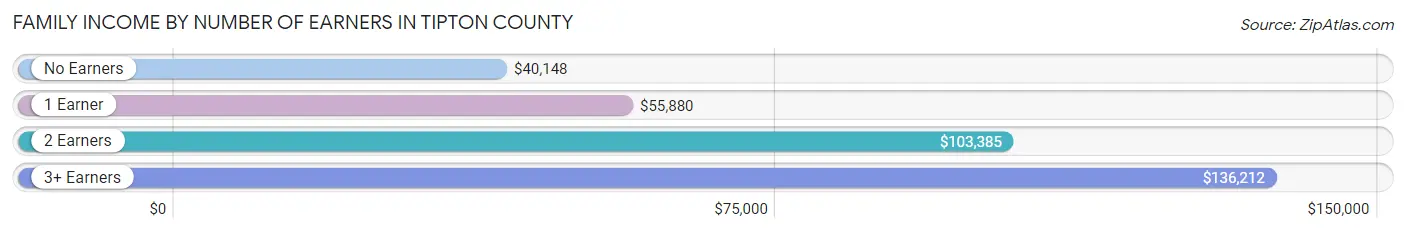
Family Income by Number of Earners in Tipton County
The median family income in Tipton County is $79,871, with families comprising 3+ earners (1,584) having the highest median family income of $136,212, while families with no earners (2,590) have the lowest median family income of $40,148, accounting for 9.2% and 15.1% of families, respectively.
| Number of Earners | # Families | Median Income |
| No Earners | 2,590 (15.1%) | $40,148 |
| 1 Earner | 5,864 (34.1%) | $55,880 |
| 2 Earners | 7,143 (41.6%) | $103,385 |
| 3+ Earners | 1,584 (9.2%) | $136,212 |
| Total | 17,181 (100.0%) | $79,871 |
Household Income in Tipton County
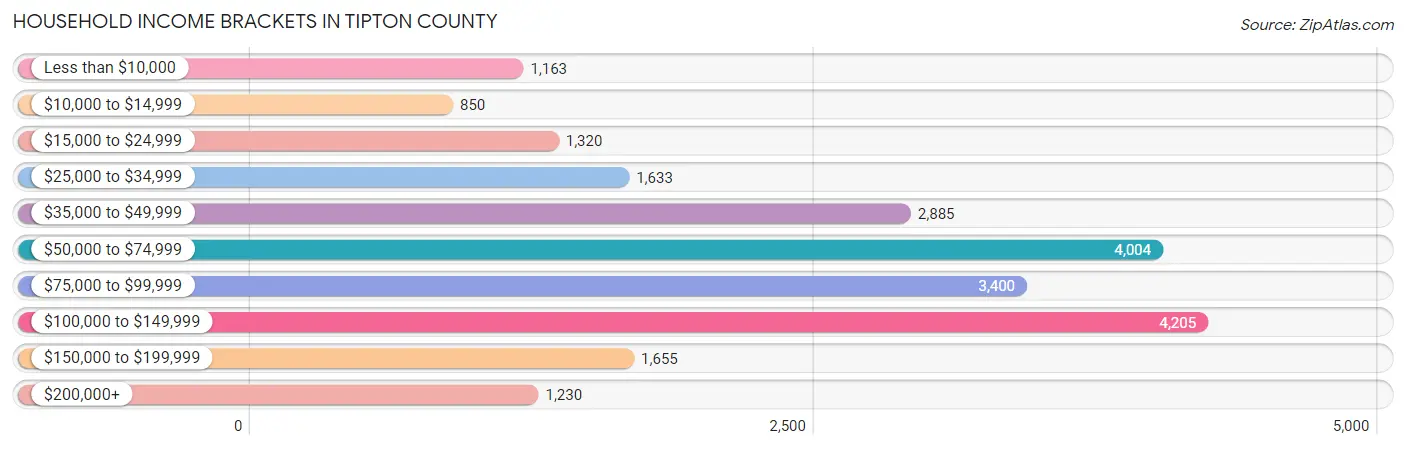
Household Income Brackets in Tipton County
With 4,205 households falling in the category, the $100,000 to $149,999 income range is the most frequent in Tipton County, accounting for 18.8% of all households. In contrast, only 850 households (3.8%) fall into the $10,000 to $14,999 income bracket, making it the least populous group.
| Income Bracket | # Households | % Households |
| Less than $10,000 | 1,163 | 5.2% |
| $10,000 to $14,999 | 850 | 3.8% |
| $15,000 to $24,999 | 1,320 | 5.9% |
| $25,000 to $34,999 | 1,633 | 7.3% |
| $35,000 to $49,999 | 2,885 | 12.9% |
| $50,000 to $74,999 | 4,004 | 17.9% |
| $75,000 to $99,999 | 3,400 | 15.2% |
| $100,000 to $149,999 | 4,205 | 18.8% |
| $150,000 to $199,999 | 1,655 | 7.4% |
| $200,000+ | 1,230 | 5.5% |
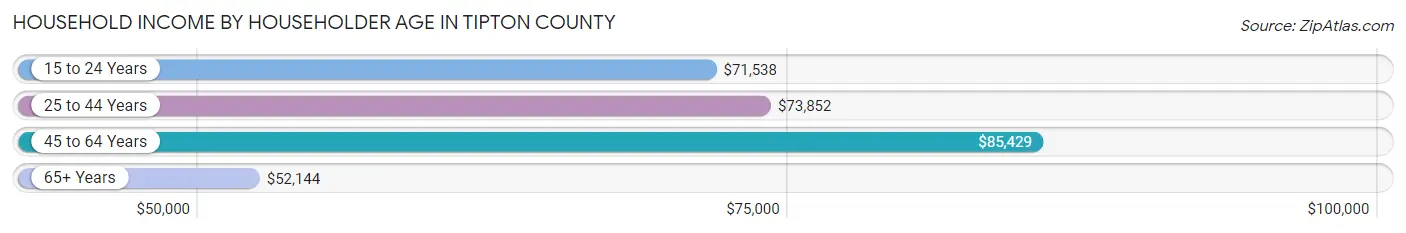
Household Income by Householder Age in Tipton County
The median household income in Tipton County is $70,674, with the highest median household income of $85,429 found in the 45 to 64 years age bracket for the primary householder. A total of 8,646 households (38.7%) fall into this category. Meanwhile, the 65+ years age bracket for the primary householder has the lowest median household income of $52,144, with 5,799 households (25.9%) in this group.
| Income Bracket | # Households | Median Income |
| 15 to 24 Years | 818 (3.7%) | $71,538 |
| 25 to 44 Years | 7,103 (31.8%) | $73,852 |
| 45 to 64 Years | 8,646 (38.7%) | $85,429 |
| 65+ Years | 5,799 (25.9%) | $52,144 |
| Total | 22,366 (100.0%) | $70,674 |
Poverty in Tipton County
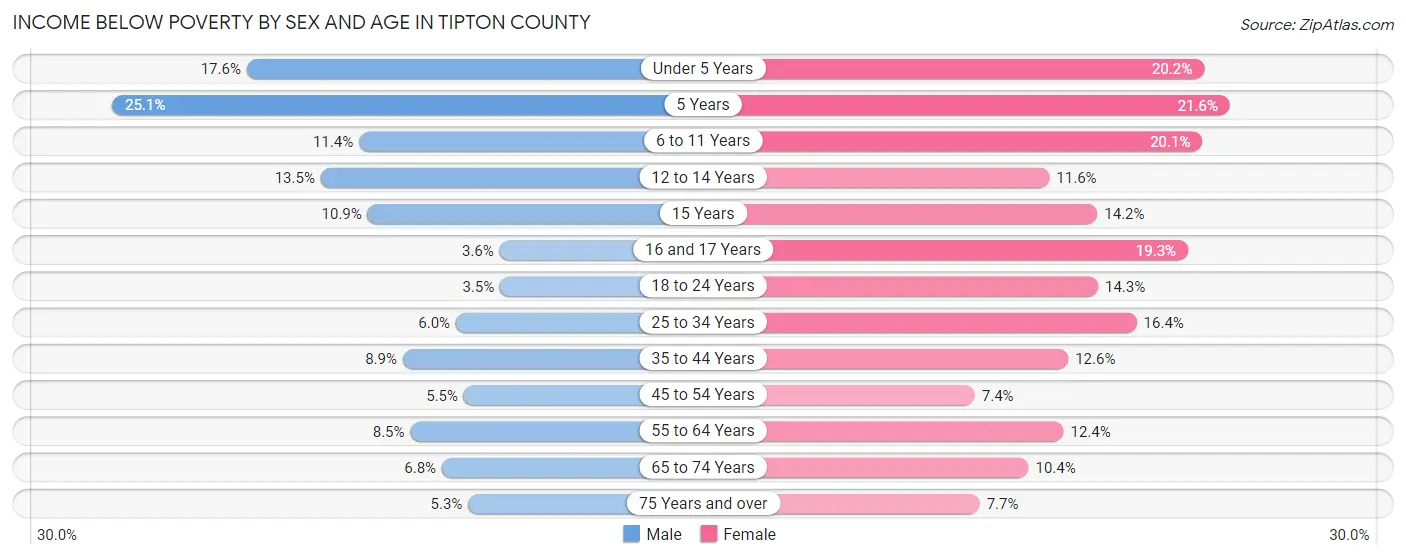
Income Below Poverty by Sex and Age in Tipton County
With 8.2% poverty level for males and 13.3% for females among the residents of Tipton County, 5 year old males and 5 year old females are the most vulnerable to poverty, with 95 males (25.1%) and 70 females (21.6%) in their respective age groups living below the poverty level.
| Age Bracket | Male | Female |
| Under 5 Years | 292 (17.6%) | 339 (20.2%) |
| 5 Years | 95 (25.1%) | 70 (21.6%) |
| 6 to 11 Years | 302 (11.4%) | 546 (20.1%) |
| 12 to 14 Years | 181 (13.5%) | 122 (11.6%) |
| 15 Years | 47 (10.9%) | 67 (14.2%) |
| 16 and 17 Years | 34 (3.5%) | 170 (19.3%) |
| 18 to 24 Years | 92 (3.5%) | 352 (14.3%) |
| 25 to 34 Years | 226 (6.0%) | 632 (16.4%) |
| 35 to 44 Years | 344 (8.9%) | 501 (12.6%) |
| 45 to 54 Years | 217 (5.5%) | 293 (7.4%) |
| 55 to 64 Years | 347 (8.5%) | 527 (12.3%) |
| 65 to 74 Years | 178 (6.8%) | 312 (10.4%) |
| 75 Years and over | 74 (5.3%) | 149 (7.7%) |
| Total | 2,429 (8.2%) | 4,080 (13.3%) |
Income Above Poverty by Sex and Age in Tipton County
According to the poverty statistics in Tipton County, males aged 18 to 24 years and females aged 45 to 54 years are the age groups that are most secure financially, with 96.5% of males and 92.6% of females in these age groups living above the poverty line.
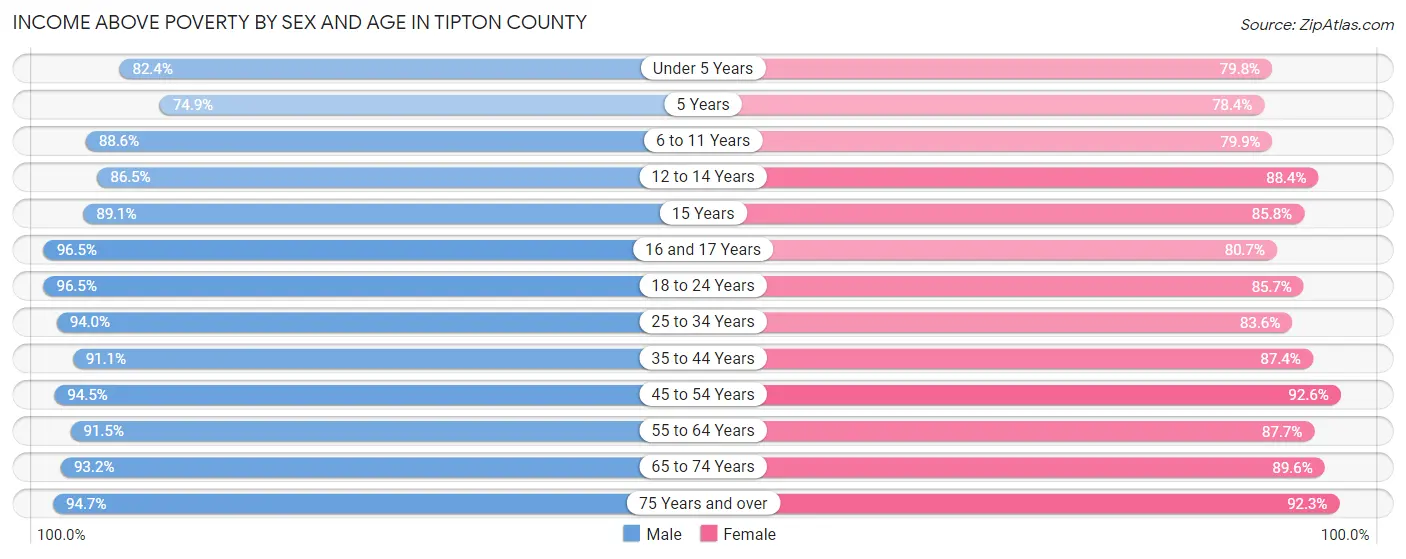
| Age Bracket | Male | Female |
| Under 5 Years | 1,364 (82.4%) | 1,342 (79.8%) |
| 5 Years | 283 (74.9%) | 254 (78.4%) |
| 6 to 11 Years | 2,351 (88.6%) | 2,175 (79.9%) |
| 12 to 14 Years | 1,159 (86.5%) | 933 (88.4%) |
| 15 Years | 384 (89.1%) | 404 (85.8%) |
| 16 and 17 Years | 923 (96.5%) | 712 (80.7%) |
| 18 to 24 Years | 2,524 (96.5%) | 2,114 (85.7%) |
| 25 to 34 Years | 3,556 (94.0%) | 3,217 (83.6%) |
| 35 to 44 Years | 3,504 (91.1%) | 3,471 (87.4%) |
| 45 to 54 Years | 3,701 (94.5%) | 3,660 (92.6%) |
| 55 to 64 Years | 3,725 (91.5%) | 3,741 (87.6%) |
| 65 to 74 Years | 2,456 (93.2%) | 2,687 (89.6%) |
| 75 Years and over | 1,323 (94.7%) | 1,791 (92.3%) |
| Total | 27,253 (91.8%) | 26,501 (86.7%) |
Income Below Poverty Among Married-Couple Families in Tipton County
The poverty statistics for married-couple families in Tipton County show that 4.1% or 509 of the total 12,319 families live below the poverty line. Families with 3 or 4 children have the highest poverty rate of 8.1%, comprising of 53 families. On the other hand, families with 1 or 2 children have the lowest poverty rate of 3.6%, which includes 155 families.
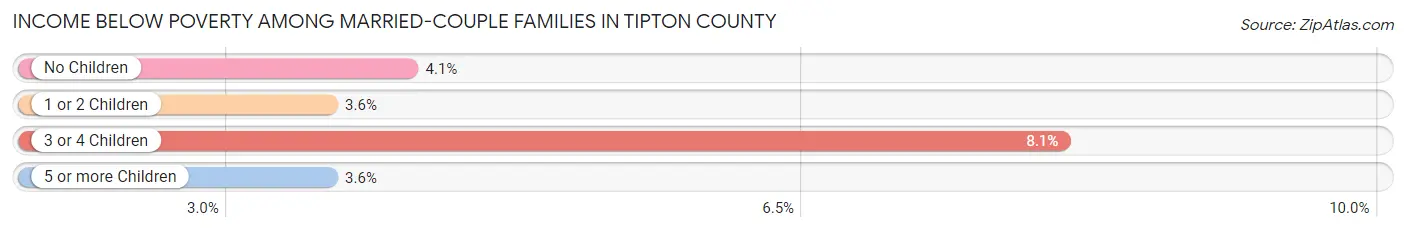
| Children | Above Poverty | Below Poverty |
| No Children | 6,884 (95.9%) | 294 (4.1%) |
| 1 or 2 Children | 4,135 (96.4%) | 155 (3.6%) |
| 3 or 4 Children | 604 (91.9%) | 53 (8.1%) |
| 5 or more Children | 187 (96.4%) | 7 (3.6%) |
| Total | 11,810 (95.9%) | 509 (4.1%) |
Income Below Poverty Among Single-Parent Households in Tipton County
According to the poverty data in Tipton County, 11.3% or 178 single-father households and 25.4% or 835 single-mother households are living below the poverty line. Among single-father households, those with 1 or 2 children have the highest poverty rate, with 136 households (19.2%) experiencing poverty. Likewise, among single-mother households, those with 5 or more children have the highest poverty rate, with 5 households (100.0%) falling below the poverty line.
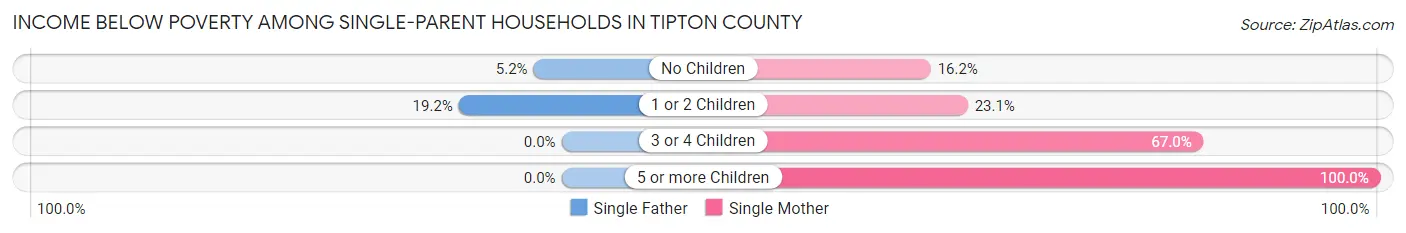
| Children | Single Father | Single Mother |
| No Children | 42 (5.2%) | 201 (16.2%) |
| 1 or 2 Children | 136 (19.2%) | 389 (23.1%) |
| 3 or 4 Children | 0 (0.0%) | 240 (67.0%) |
| 5 or more Children | 0 (0.0%) | 5 (100.0%) |
| Total | 178 (11.3%) | 835 (25.4%) |
Income Below Poverty Among Married-Couple vs Single-Parent Households in Tipton County
The poverty data for Tipton County shows that 509 of the married-couple family households (4.1%) and 1,013 of the single-parent households (20.8%) are living below the poverty level. Within the married-couple family households, those with 3 or 4 children have the highest poverty rate, with 53 households (8.1%) falling below the poverty line. Among the single-parent households, those with 5 or more children have the highest poverty rate, with 5 household (100.0%) living below poverty.
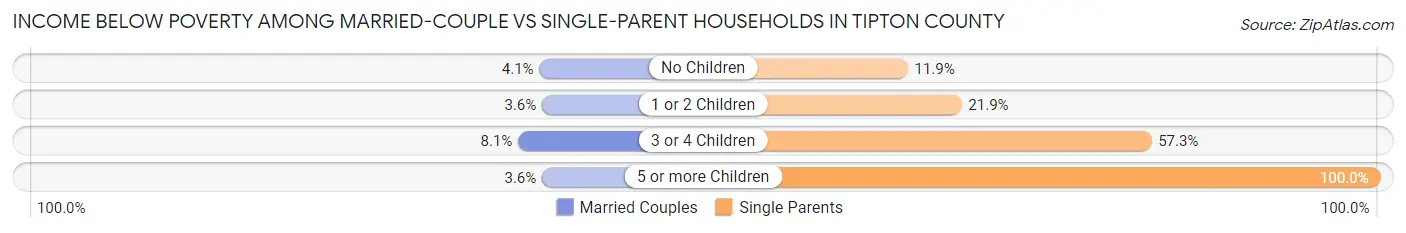
| Children | Married-Couple Families | Single-Parent Households |
| No Children | 294 (4.1%) | 243 (11.9%) |
| 1 or 2 Children | 155 (3.6%) | 525 (21.9%) |
| 3 or 4 Children | 53 (8.1%) | 240 (57.3%) |
| 5 or more Children | 7 (3.6%) | 5 (100.0%) |
| Total | 509 (4.1%) | 1,013 (20.8%) |
Employment Characteristics in Tipton County
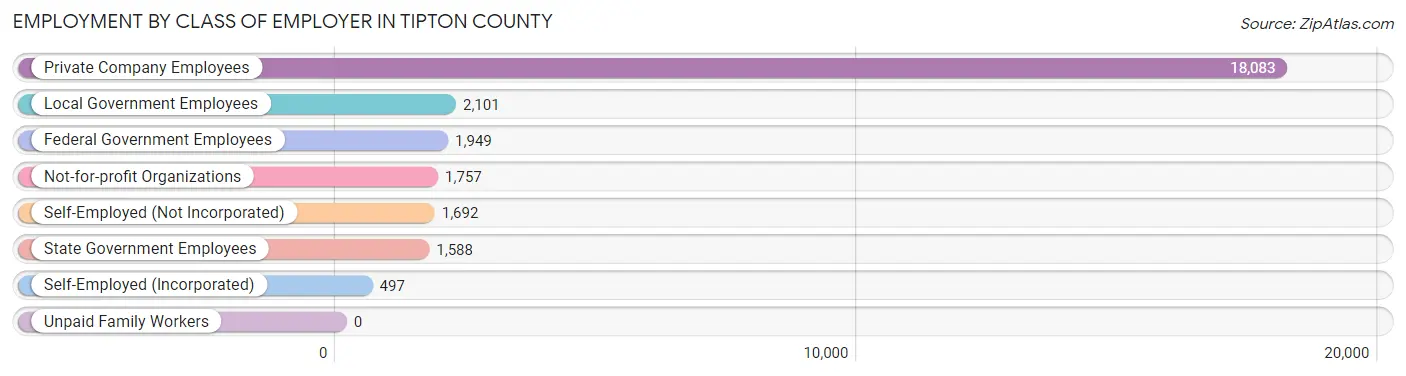
Employment by Class of Employer in Tipton County
Among the 27,667 employed individuals in Tipton County, private company employees (18,083 | 65.4%), local government employees (2,101 | 7.6%), and federal government employees (1,949 | 7.0%) make up the most common classes of employment.
| Employer Class | # Employees | % Employees |
| Private Company Employees | 18,083 | 65.4% |
| Self-Employed (Incorporated) | 497 | 1.8% |
| Self-Employed (Not Incorporated) | 1,692 | 6.1% |
| Not-for-profit Organizations | 1,757 | 6.4% |
| Local Government Employees | 2,101 | 7.6% |
| State Government Employees | 1,588 | 5.7% |
| Federal Government Employees | 1,949 | 7.0% |
| Unpaid Family Workers | 0 | 0.0% |
| Total | 27,667 | 100.0% |
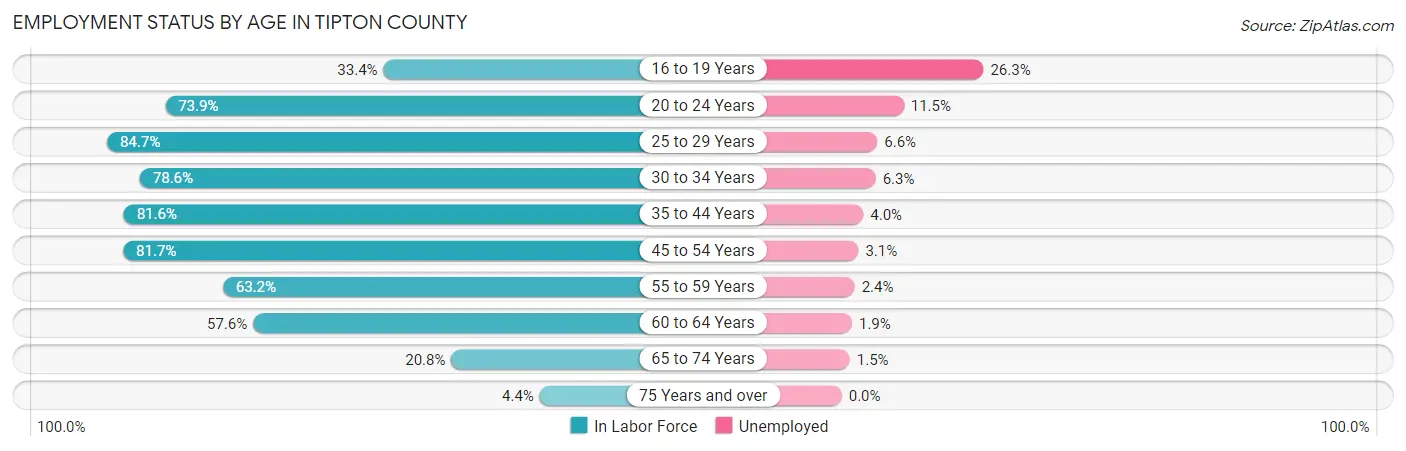
Employment Status by Age in Tipton County
According to the labor force statistics for Tipton County, out of the total population over 16 years of age (48,275), 61.3% or 29,593 individuals are in the labor force, with 5.4% or 1,598 of them unemployed. The age group with the highest labor force participation rate is 25 to 29 years, with 84.7% or 3,193 individuals in the labor force. Within the labor force, the 16 to 19 years age range has the highest percentage of unemployed individuals, with 26.3% or 291 of them being unemployed.
| Age Bracket | In Labor Force | Unemployed |
| 16 to 19 Years | 1,107 (33.4%) | 291 (26.3%) |
| 20 to 24 Years | 2,725 (73.9%) | 313 (11.5%) |
| 25 to 29 Years | 3,193 (84.7%) | 211 (6.6%) |
| 30 to 34 Years | 3,163 (78.6%) | 199 (6.3%) |
| 35 to 44 Years | 6,509 (81.6%) | 260 (4.0%) |
| 45 to 54 Years | 6,492 (81.7%) | 201 (3.1%) |
| 55 to 59 Years | 2,750 (63.2%) | 66 (2.4%) |
| 60 to 64 Years | 2,335 (57.6%) | 44 (1.9%) |
| 65 to 74 Years | 1,182 (20.8%) | 18 (1.5%) |
| 75 Years and over | 153 (4.4%) | 0 (0.0%) |
| Total | 29,593 (61.3%) | 1,598 (5.4%) |
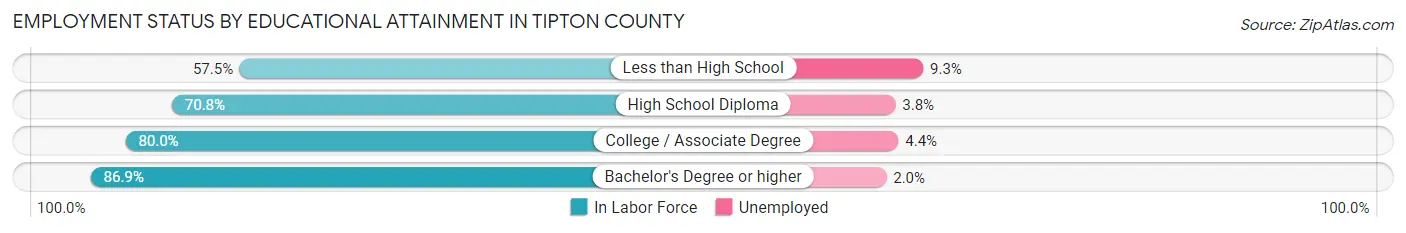
Employment Status by Educational Attainment in Tipton County
According to labor force statistics for Tipton County, 76.1% of individuals (24,445) out of the total population between 25 and 64 years of age (32,122) are in the labor force, with 4.0% or 978 of them being unemployed. The group with the highest labor force participation rate are those with the educational attainment of bachelor's degree or higher, with 86.9% or 5,745 individuals in the labor force. Within the labor force, individuals with less than high school education have the highest percentage of unemployment, with 9.3% or 158 of them being unemployed.
| Educational Attainment | In Labor Force | Unemployed |
| Less than High School | 1,696 (57.5%) | 274 (9.3%) |
| High School Diploma | 8,091 (70.8%) | 434 (3.8%) |
| College / Associate Degree | 8,906 (80.0%) | 490 (4.4%) |
| Bachelor's Degree or higher | 5,745 (86.9%) | 132 (2.0%) |
| Total | 24,445 (76.1%) | 1,285 (4.0%) |
Employment Occupations by Sex in Tipton County
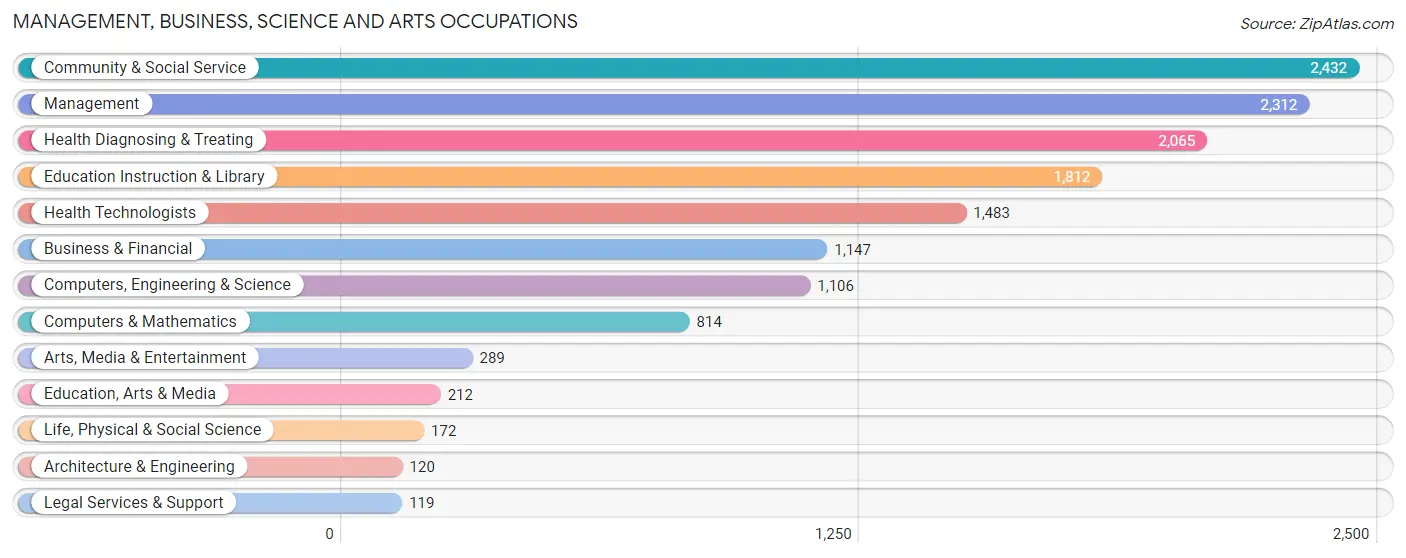
Management, Business, Science and Arts Occupations
The most common Management, Business, Science and Arts occupations in Tipton County are Community & Social Service (2,432 | 8.8%), Management (2,312 | 8.3%), Health Diagnosing & Treating (2,065 | 7.4%), Education Instruction & Library (1,812 | 6.5%), and Health Technologists (1,483 | 5.3%).
Management, Business, Science and Arts Occupations by Sex
Within the Management, Business, Science and Arts occupations in Tipton County, the most male-oriented occupations are Architecture & Engineering (100.0%), Computers, Engineering & Science (84.5%), and Life, Physical & Social Science (84.3%), while the most female-oriented occupations are Health Technologists (88.7%), Education Instruction & Library (88.5%), and Health Diagnosing & Treating (86.7%).
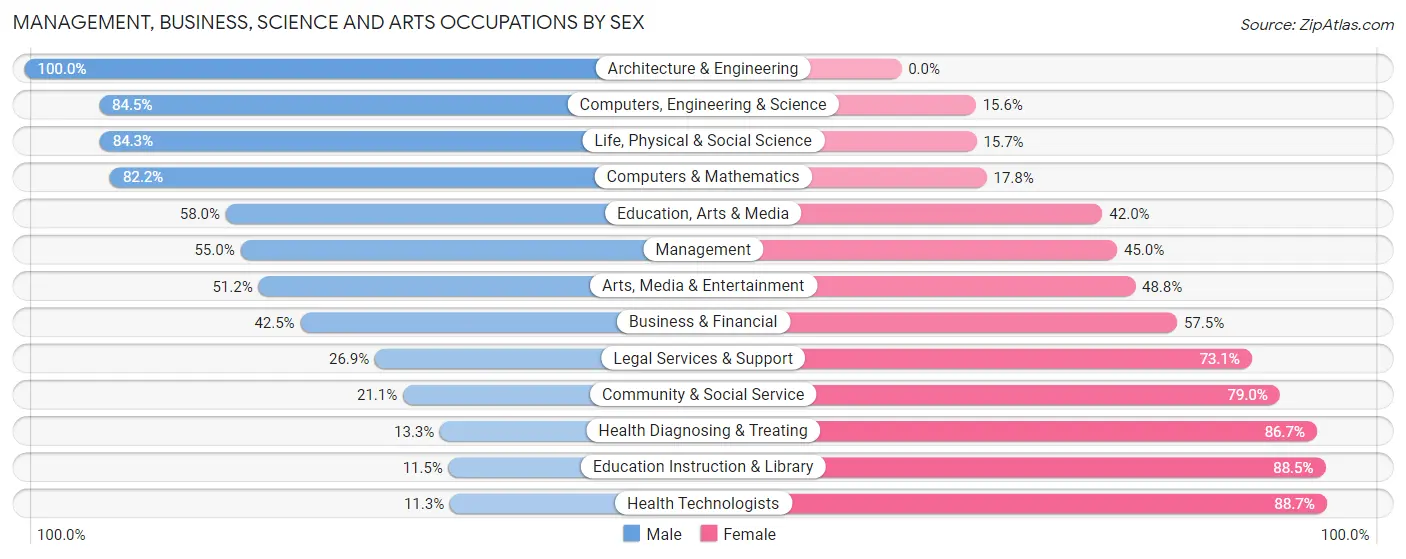
| Occupation | Male | Female |
| Management | 1,271 (55.0%) | 1,041 (45.0%) |
| Business & Financial | 487 (42.5%) | 660 (57.5%) |
| Computers, Engineering & Science | 934 (84.5%) | 172 (15.5%) |
| Computers & Mathematics | 669 (82.2%) | 145 (17.8%) |
| Architecture & Engineering | 120 (100.0%) | 0 (0.0%) |
| Life, Physical & Social Science | 145 (84.3%) | 27 (15.7%) |
| Community & Social Service | 512 (21.0%) | 1,920 (78.9%) |
| Education, Arts & Media | 123 (58.0%) | 89 (42.0%) |
| Legal Services & Support | 32 (26.9%) | 87 (73.1%) |
| Education Instruction & Library | 209 (11.5%) | 1,603 (88.5%) |
| Arts, Media & Entertainment | 148 (51.2%) | 141 (48.8%) |
| Health Diagnosing & Treating | 275 (13.3%) | 1,790 (86.7%) |
| Health Technologists | 167 (11.3%) | 1,316 (88.7%) |
| Total (Category) | 3,479 (38.4%) | 5,583 (61.6%) |
| Total (Overall) | 14,681 (52.9%) | 13,053 (47.1%) |
Services Occupations
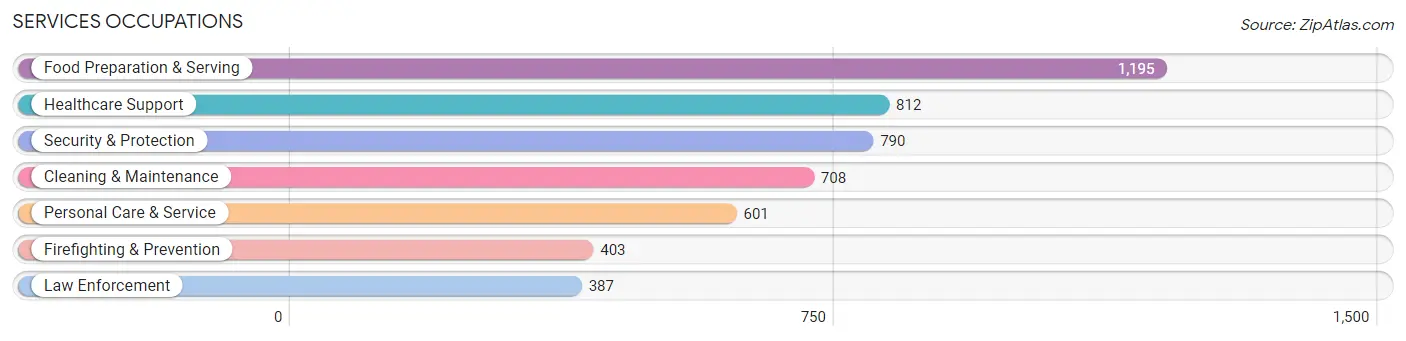
The most common Services occupations in Tipton County are Food Preparation & Serving (1,195 | 4.3%), Healthcare Support (812 | 2.9%), Security & Protection (790 | 2.9%), Cleaning & Maintenance (708 | 2.5%), and Personal Care & Service (601 | 2.2%).
Services Occupations by Sex
Within the Services occupations in Tipton County, the most male-oriented occupations are Firefighting & Prevention (98.3%), Security & Protection (94.2%), and Law Enforcement (89.9%), while the most female-oriented occupations are Healthcare Support (76.1%), Personal Care & Service (73.0%), and Food Preparation & Serving (71.8%).
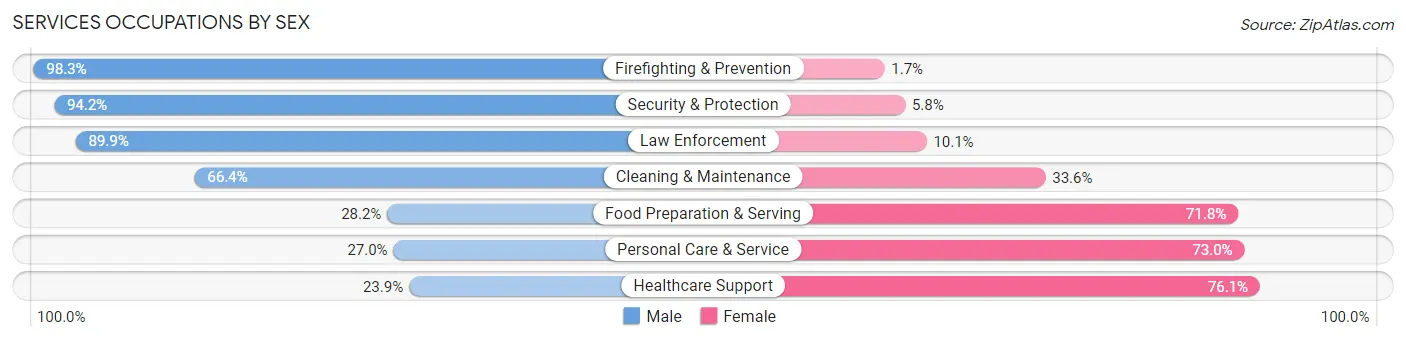
| Occupation | Male | Female |
| Healthcare Support | 194 (23.9%) | 618 (76.1%) |
| Security & Protection | 744 (94.2%) | 46 (5.8%) |
| Firefighting & Prevention | 396 (98.3%) | 7 (1.7%) |
| Law Enforcement | 348 (89.9%) | 39 (10.1%) |
| Food Preparation & Serving | 337 (28.2%) | 858 (71.8%) |
| Cleaning & Maintenance | 470 (66.4%) | 238 (33.6%) |
| Personal Care & Service | 162 (27.0%) | 439 (73.0%) |
| Total (Category) | 1,907 (46.4%) | 2,199 (53.6%) |
| Total (Overall) | 14,681 (52.9%) | 13,053 (47.1%) |
Sales and Office Occupations
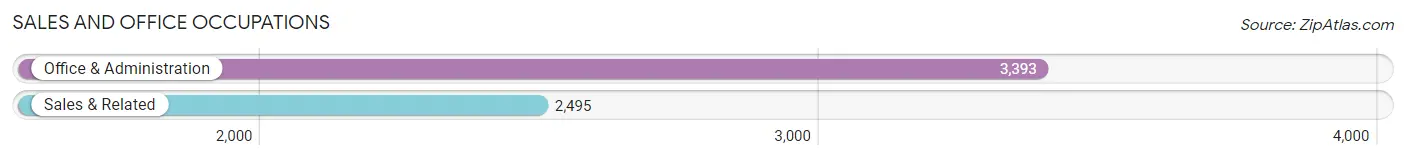
The most common Sales and Office occupations in Tipton County are Office & Administration (3,393 | 12.2%), and Sales & Related (2,495 | 9.0%).
Sales and Office Occupations by Sex

| Occupation | Male | Female |
| Sales & Related | 1,229 (49.3%) | 1,266 (50.7%) |
| Office & Administration | 608 (17.9%) | 2,785 (82.1%) |
| Total (Category) | 1,837 (31.2%) | 4,051 (68.8%) |
| Total (Overall) | 14,681 (52.9%) | 13,053 (47.1%) |
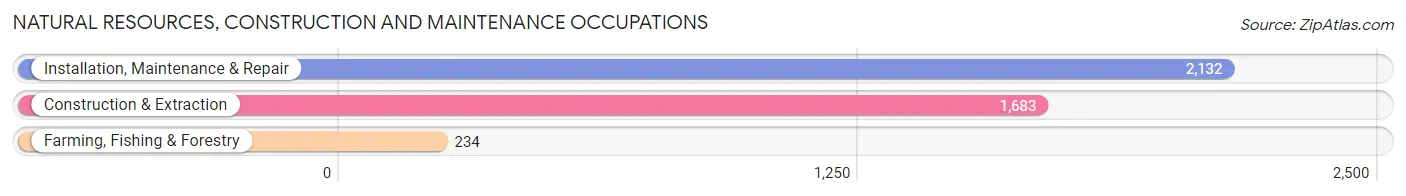
Natural Resources, Construction and Maintenance Occupations
The most common Natural Resources, Construction and Maintenance occupations in Tipton County are Installation, Maintenance & Repair (2,132 | 7.7%), Construction & Extraction (1,683 | 6.1%), and Farming, Fishing & Forestry (234 | 0.8%).
Natural Resources, Construction and Maintenance Occupations by Sex
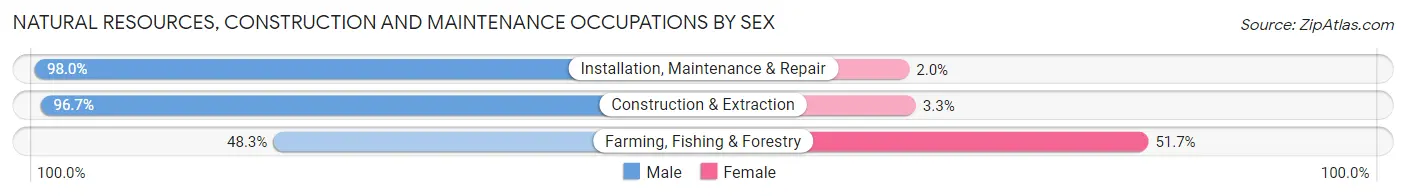
| Occupation | Male | Female |
| Farming, Fishing & Forestry | 113 (48.3%) | 121 (51.7%) |
| Construction & Extraction | 1,627 (96.7%) | 56 (3.3%) |
| Installation, Maintenance & Repair | 2,090 (98.0%) | 42 (2.0%) |
| Total (Category) | 3,830 (94.6%) | 219 (5.4%) |
| Total (Overall) | 14,681 (52.9%) | 13,053 (47.1%) |
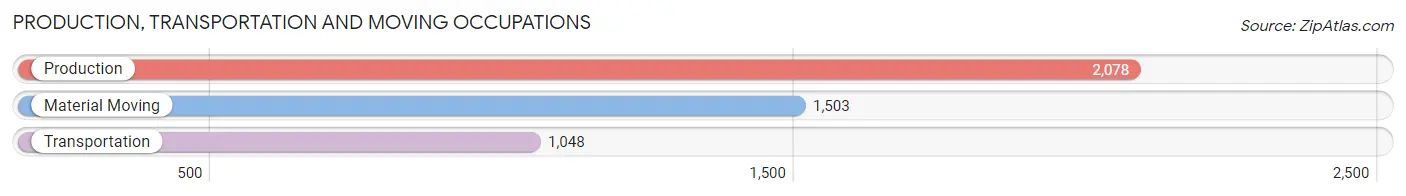
Production, Transportation and Moving Occupations
The most common Production, Transportation and Moving occupations in Tipton County are Production (2,078 | 7.5%), Material Moving (1,503 | 5.4%), and Transportation (1,048 | 3.8%).
Production, Transportation and Moving Occupations by Sex
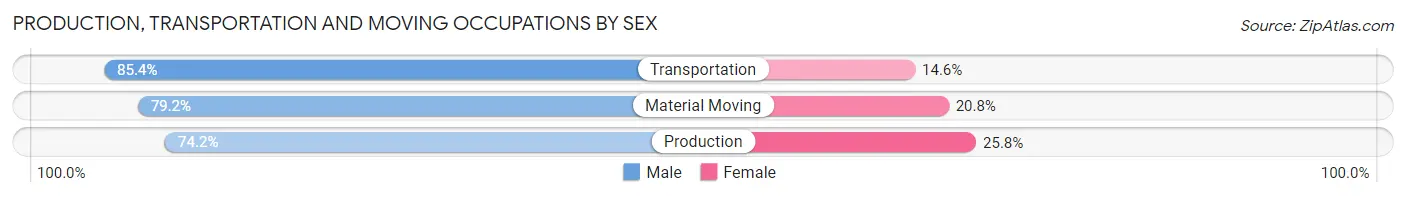
| Occupation | Male | Female |
| Production | 1,542 (74.2%) | 536 (25.8%) |
| Transportation | 895 (85.4%) | 153 (14.6%) |
| Material Moving | 1,191 (79.2%) | 312 (20.8%) |
| Total (Category) | 3,628 (78.4%) | 1,001 (21.6%) |
| Total (Overall) | 14,681 (52.9%) | 13,053 (47.1%) |
Employment Industries by Sex in Tipton County
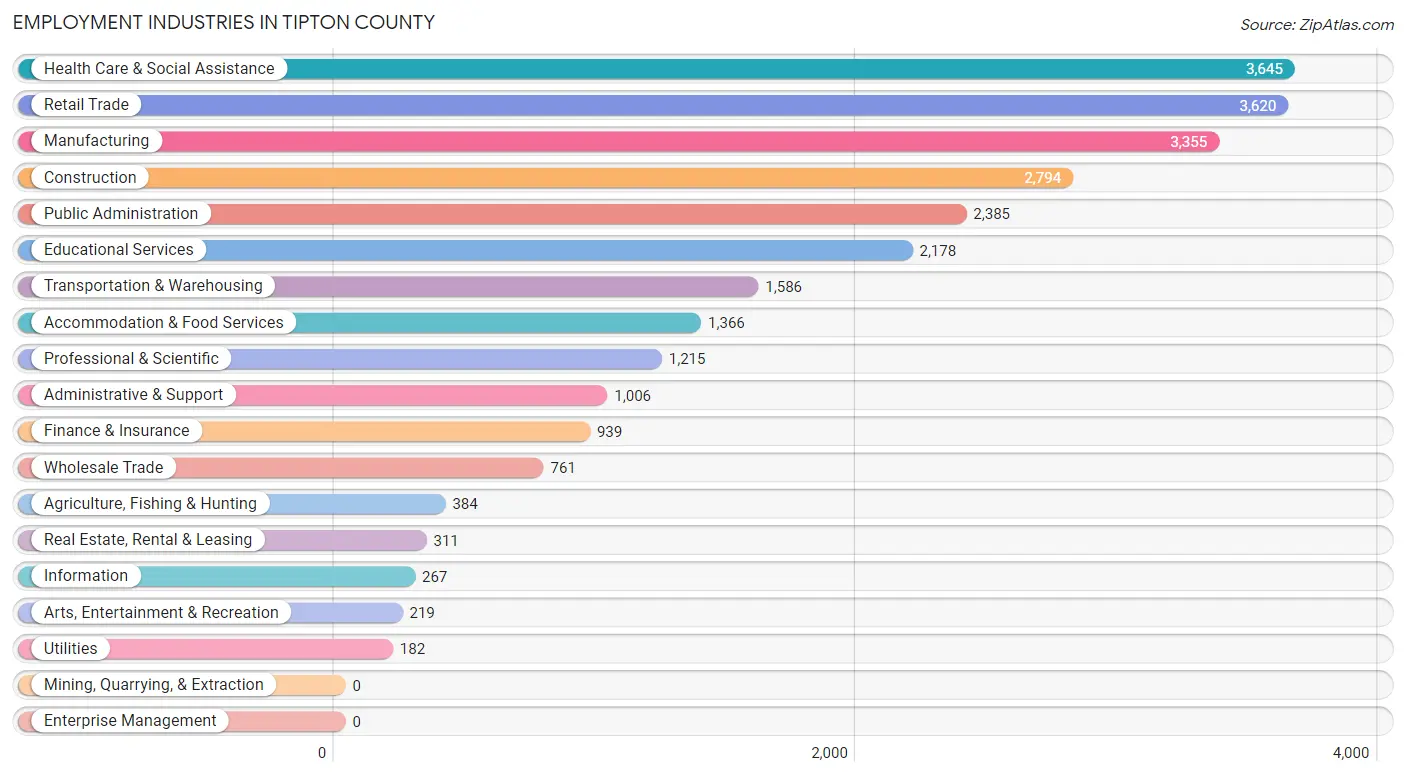
Employment Industries in Tipton County
The major employment industries in Tipton County include Health Care & Social Assistance (3,645 | 13.1%), Retail Trade (3,620 | 13.1%), Manufacturing (3,355 | 12.1%), Construction (2,794 | 10.1%), and Public Administration (2,385 | 8.6%).
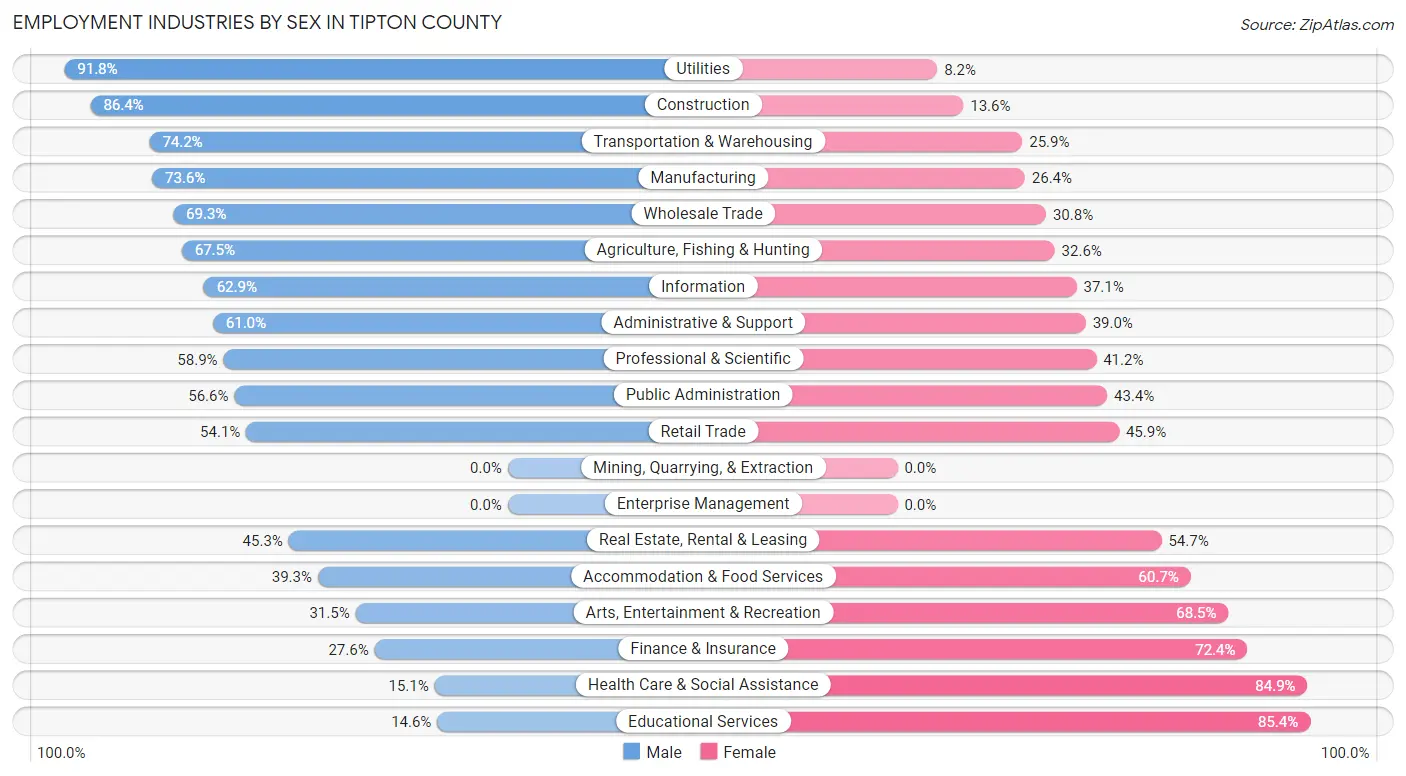
Employment Industries by Sex in Tipton County
The Tipton County industries that see more men than women are Utilities (91.8%), Construction (86.4%), and Transportation & Warehousing (74.2%), whereas the industries that tend to have a higher number of women are Educational Services (85.4%), Health Care & Social Assistance (84.9%), and Finance & Insurance (72.4%).
| Industry | Male | Female |
| Agriculture, Fishing & Hunting | 259 (67.4%) | 125 (32.6%) |
| Mining, Quarrying, & Extraction | 0 (0.0%) | 0 (0.0%) |
| Construction | 2,413 (86.4%) | 381 (13.6%) |
| Manufacturing | 2,470 (73.6%) | 885 (26.4%) |
| Wholesale Trade | 527 (69.3%) | 234 (30.7%) |
| Retail Trade | 1,960 (54.1%) | 1,660 (45.9%) |
| Transportation & Warehousing | 1,176 (74.2%) | 410 (25.9%) |
| Utilities | 167 (91.8%) | 15 (8.2%) |
| Information | 168 (62.9%) | 99 (37.1%) |
| Finance & Insurance | 259 (27.6%) | 680 (72.4%) |
| Real Estate, Rental & Leasing | 141 (45.3%) | 170 (54.7%) |
| Professional & Scientific | 715 (58.9%) | 500 (41.1%) |
| Enterprise Management | 0 (0.0%) | 0 (0.0%) |
| Administrative & Support | 614 (61.0%) | 392 (39.0%) |
| Educational Services | 318 (14.6%) | 1,860 (85.4%) |
| Health Care & Social Assistance | 552 (15.1%) | 3,093 (84.9%) |
| Arts, Entertainment & Recreation | 69 (31.5%) | 150 (68.5%) |
| Accommodation & Food Services | 537 (39.3%) | 829 (60.7%) |
| Public Administration | 1,350 (56.6%) | 1,035 (43.4%) |
| Total | 14,681 (52.9%) | 13,053 (47.1%) |
Education in Tipton County
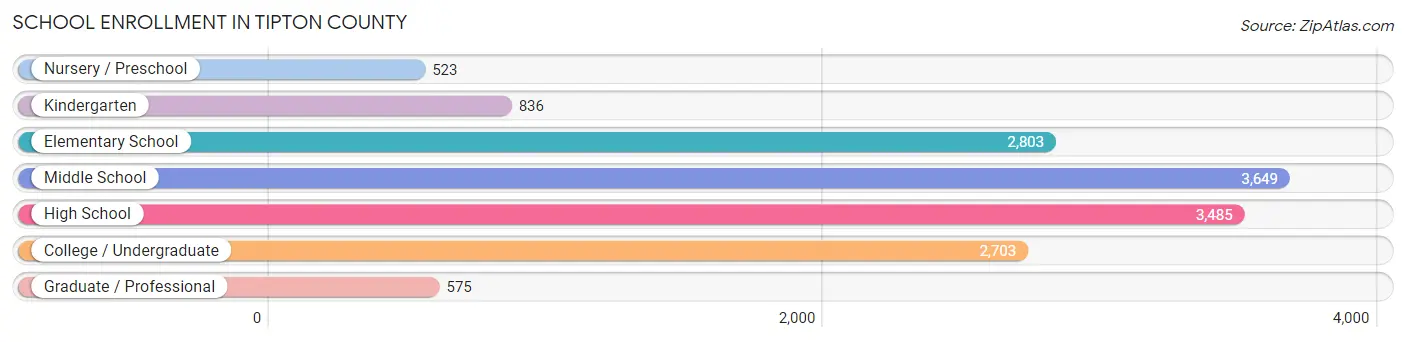
School Enrollment in Tipton County
The most common levels of schooling among the 14,574 students in Tipton County are middle school (3,649 | 25.0%), high school (3,485 | 23.9%), and elementary school (2,803 | 19.2%).
| School Level | # Students | % Students |
| Nursery / Preschool | 523 | 3.6% |
| Kindergarten | 836 | 5.7% |
| Elementary School | 2,803 | 19.2% |
| Middle School | 3,649 | 25.0% |
| High School | 3,485 | 23.9% |
| College / Undergraduate | 2,703 | 18.5% |
| Graduate / Professional | 575 | 4.0% |
| Total | 14,574 | 100.0% |
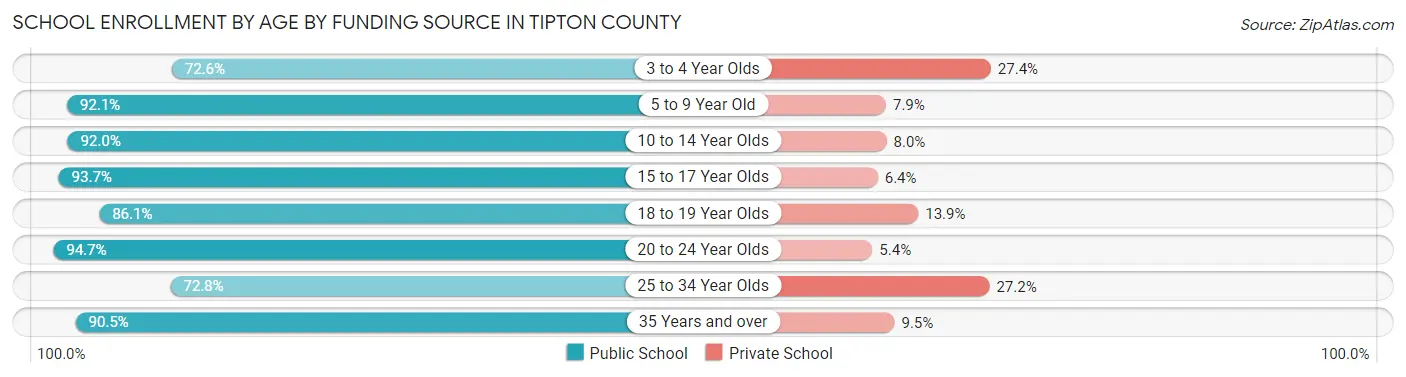
School Enrollment by Age by Funding Source in Tipton County
Out of a total of 14,574 students who are enrolled in schools in Tipton County, 1,414 (9.7%) attend a private institution, while the remaining 13,160 (90.3%) are enrolled in public schools. The age group of 3 to 4 year olds has the highest likelihood of being enrolled in private schools, with 130 (27.4% in the age bracket) enrolled. Conversely, the age group of 20 to 24 year olds has the lowest likelihood of being enrolled in a private school, with 990 (94.7% in the age bracket) attending a public institution.
| Age Bracket | Public School | Private School |
| 3 to 4 Year Olds | 344 (72.6%) | 130 (27.4%) |
| 5 to 9 Year Old | 3,071 (92.1%) | 263 (7.9%) |
| 10 to 14 Year Olds | 4,190 (92.0%) | 364 (8.0%) |
| 15 to 17 Year Olds | 2,418 (93.6%) | 164 (6.4%) |
| 18 to 19 Year Olds | 855 (86.1%) | 138 (13.9%) |
| 20 to 24 Year Olds | 990 (94.7%) | 56 (5.3%) |
| 25 to 34 Year Olds | 590 (72.8%) | 220 (27.2%) |
| 35 Years and over | 707 (90.5%) | 74 (9.5%) |
| Total | 13,160 (90.3%) | 1,414 (9.7%) |
Educational Attainment by Field of Study in Tipton County
Business (2,128 | 24.2%), education (1,630 | 18.5%), science & technology (1,211 | 13.8%), arts & humanities (528 | 6.0%), and bio, nature & agricultural (462 | 5.2%) are the most common fields of study among 8,802 individuals in Tipton County who have obtained a bachelor's degree or higher.
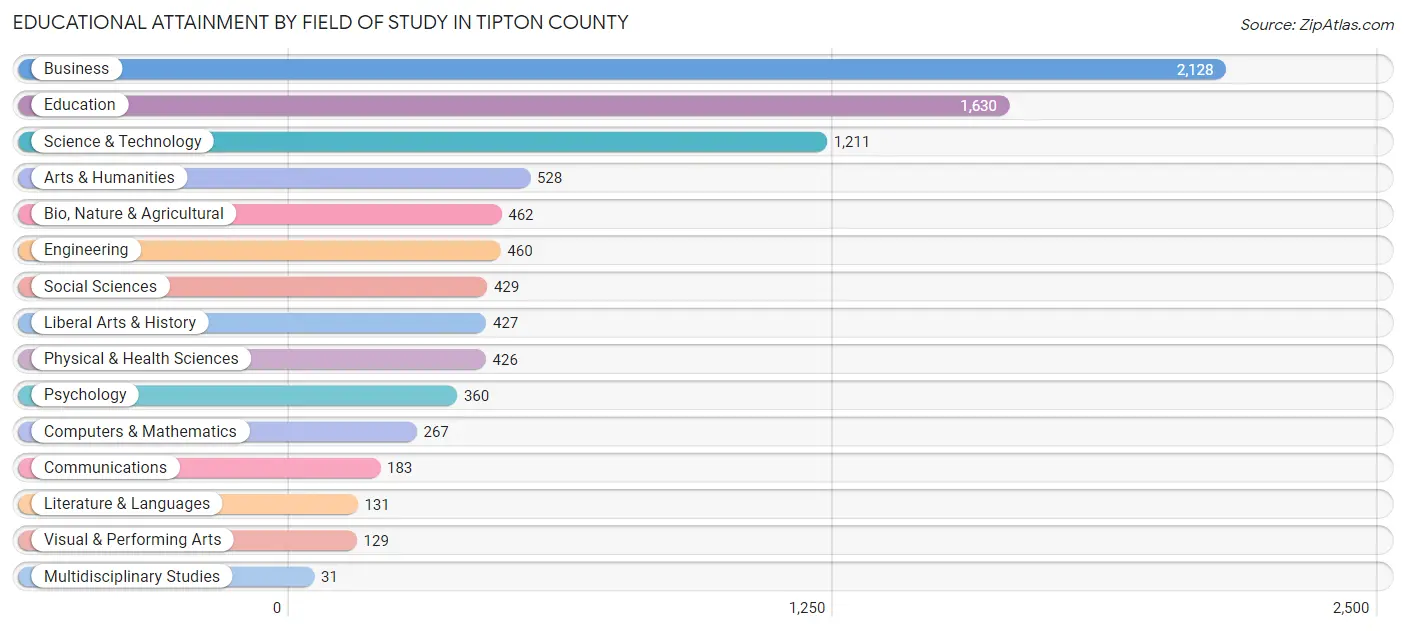
| Field of Study | # Graduates | % Graduates |
| Computers & Mathematics | 267 | 3.0% |
| Bio, Nature & Agricultural | 462 | 5.2% |
| Physical & Health Sciences | 426 | 4.8% |
| Psychology | 360 | 4.1% |
| Social Sciences | 429 | 4.9% |
| Engineering | 460 | 5.2% |
| Multidisciplinary Studies | 31 | 0.4% |
| Science & Technology | 1,211 | 13.8% |
| Business | 2,128 | 24.2% |
| Education | 1,630 | 18.5% |
| Literature & Languages | 131 | 1.5% |
| Liberal Arts & History | 427 | 4.9% |
| Visual & Performing Arts | 129 | 1.5% |
| Communications | 183 | 2.1% |
| Arts & Humanities | 528 | 6.0% |
| Total | 8,802 | 100.0% |
Transportation & Commute in Tipton County
Vehicle Availability by Sex in Tipton County
The most prevalent vehicle ownership categories in Tipton County are males with 2 vehicles (5,385, accounting for 36.3%) and females with 2 vehicles (4,561, making up 42.0%).

| Vehicles Available | Male | Female |
| No Vehicle | 190 (1.3%) | 328 (2.6%) |
| 1 Vehicle | 1,977 (13.3%) | 2,239 (17.5%) |
| 2 Vehicles | 5,385 (36.3%) | 4,561 (35.6%) |
| 3 Vehicles | 4,621 (31.2%) | 3,719 (29.0%) |
| 4 Vehicles | 1,685 (11.4%) | 1,234 (9.6%) |
| 5 or more Vehicles | 960 (6.5%) | 743 (5.8%) |
| Total | 14,818 (100.0%) | 12,824 (100.0%) |
Commute Time in Tipton County
The most frequently occuring commute durations in Tipton County are 45 to 59 minutes (5,764 commuters, 22.3%), 20 to 24 minutes (2,956 commuters, 11.4%), and 30 to 34 minutes (2,770 commuters, 10.7%).

| Commute Time | # Commuters | % Commuters |
| Less than 5 Minutes | 478 | 1.8% |
| 5 to 9 Minutes | 1,965 | 7.6% |
| 10 to 14 Minutes | 2,352 | 9.1% |
| 15 to 19 Minutes | 2,019 | 7.8% |
| 20 to 24 Minutes | 2,956 | 11.4% |
| 25 to 29 Minutes | 1,604 | 6.2% |
| 30 to 34 Minutes | 2,770 | 10.7% |
| 35 to 39 Minutes | 1,215 | 4.7% |
| 40 to 44 Minutes | 1,421 | 5.5% |
| 45 to 59 Minutes | 5,764 | 22.3% |
| 60 to 89 Minutes | 2,681 | 10.4% |
| 90 or more Minutes | 622 | 2.4% |
Commute Time by Sex in Tipton County
The most common commute times in Tipton County are 45 to 59 minutes (3,287 commuters, 23.6%) for males and 45 to 59 minutes (2,477 commuters, 20.8%) for females.
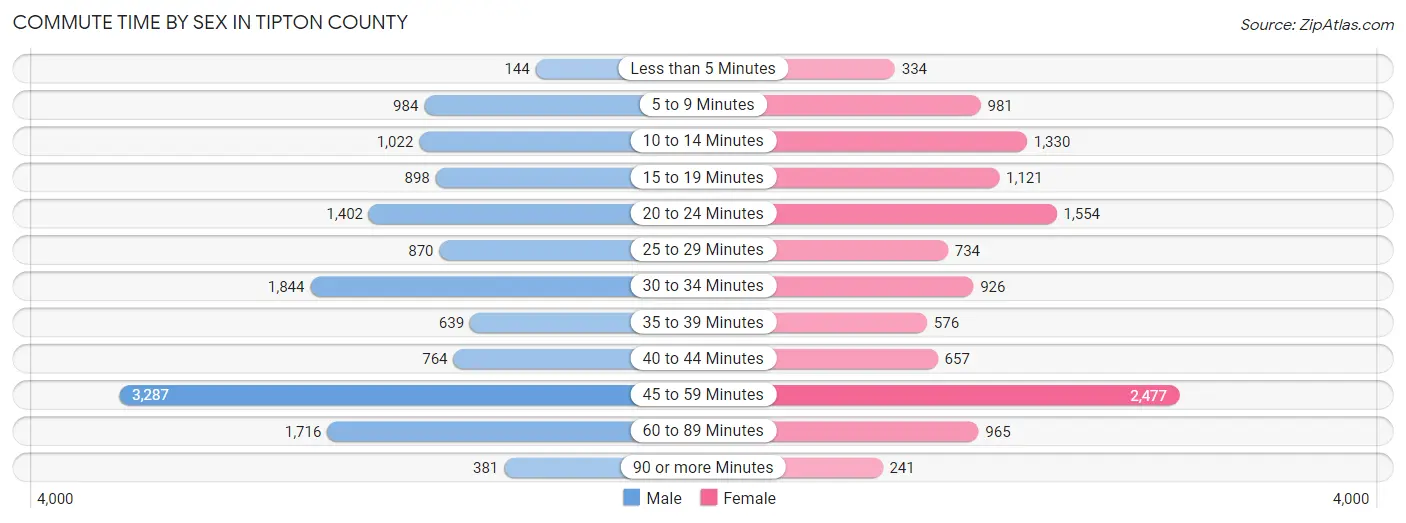
| Commute Time | Male | Female |
| Less than 5 Minutes | 144 (1.0%) | 334 (2.8%) |
| 5 to 9 Minutes | 984 (7.0%) | 981 (8.3%) |
| 10 to 14 Minutes | 1,022 (7.3%) | 1,330 (11.2%) |
| 15 to 19 Minutes | 898 (6.4%) | 1,121 (9.4%) |
| 20 to 24 Minutes | 1,402 (10.1%) | 1,554 (13.1%) |
| 25 to 29 Minutes | 870 (6.2%) | 734 (6.2%) |
| 30 to 34 Minutes | 1,844 (13.2%) | 926 (7.8%) |
| 35 to 39 Minutes | 639 (4.6%) | 576 (4.8%) |
| 40 to 44 Minutes | 764 (5.5%) | 657 (5.5%) |
| 45 to 59 Minutes | 3,287 (23.6%) | 2,477 (20.8%) |
| 60 to 89 Minutes | 1,716 (12.3%) | 965 (8.1%) |
| 90 or more Minutes | 381 (2.7%) | 241 (2.0%) |
Time of Departure to Work by Sex in Tipton County
The most frequent times of departure to work in Tipton County are 6:00 AM to 6:29 AM (2,586, 18.5%) for males and 7:00 AM to 7:29 AM (2,413, 20.3%) for females.

| Time of Departure | Male | Female |
| 12:00 AM to 4:59 AM | 925 (6.6%) | 359 (3.0%) |
| 5:00 AM to 5:29 AM | 791 (5.7%) | 455 (3.8%) |
| 5:30 AM to 5:59 AM | 1,027 (7.4%) | 646 (5.4%) |
| 6:00 AM to 6:29 AM | 2,586 (18.5%) | 977 (8.2%) |
| 6:30 AM to 6:59 AM | 1,439 (10.3%) | 1,225 (10.3%) |
| 7:00 AM to 7:29 AM | 2,566 (18.4%) | 2,413 (20.3%) |
| 7:30 AM to 7:59 AM | 711 (5.1%) | 1,683 (14.1%) |
| 8:00 AM to 8:29 AM | 1,500 (10.7%) | 1,194 (10.0%) |
| 8:30 AM to 8:59 AM | 304 (2.2%) | 329 (2.8%) |
| 9:00 AM to 9:59 AM | 449 (3.2%) | 733 (6.2%) |
| 10:00 AM to 10:59 AM | 209 (1.5%) | 412 (3.5%) |
| 11:00 AM to 11:59 AM | 95 (0.7%) | 69 (0.6%) |
| 12:00 PM to 3:59 PM | 659 (4.7%) | 613 (5.1%) |
| 4:00 PM to 11:59 PM | 690 (5.0%) | 788 (6.6%) |
| Total | 13,951 (100.0%) | 11,896 (100.0%) |
Housing Occupancy in Tipton County
Occupancy by Ownership in Tipton County
Of the total 22,366 dwellings in Tipton County, owner-occupied units account for 16,961 (75.8%), while renter-occupied units make up 5,405 (24.2%).
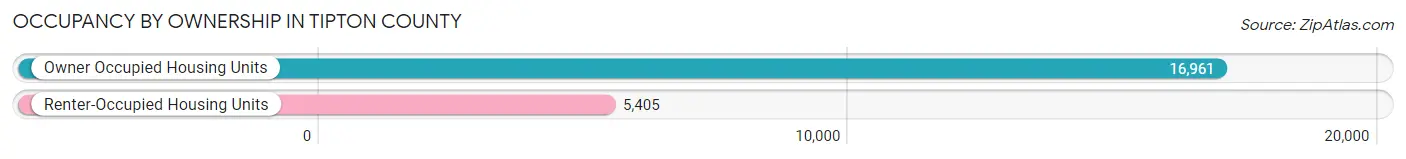
| Occupancy | # Housing Units | % Housing Units |
| Owner Occupied Housing Units | 16,961 | 75.8% |
| Renter-Occupied Housing Units | 5,405 | 24.2% |
| Total Occupied Housing Units | 22,366 | 100.0% |
Occupancy by Household Size in Tipton County
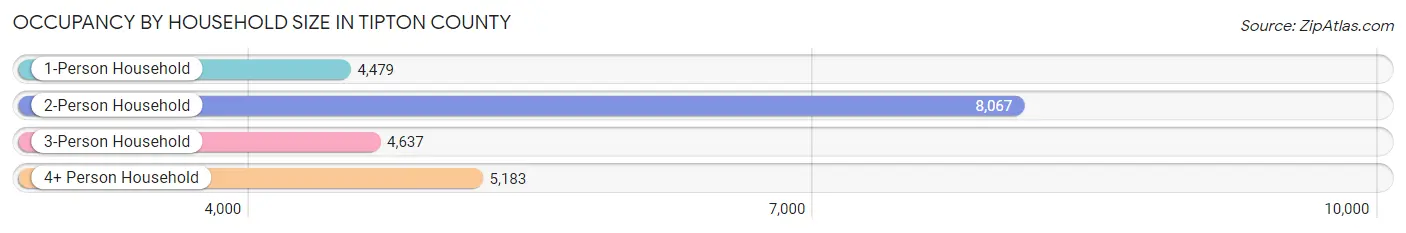
| Household Size | # Housing Units | % Housing Units |
| 1-Person Household | 4,479 | 20.0% |
| 2-Person Household | 8,067 | 36.1% |
| 3-Person Household | 4,637 | 20.7% |
| 4+ Person Household | 5,183 | 23.2% |
| Total Housing Units | 22,366 | 100.0% |
Occupancy by Ownership by Household Size in Tipton County
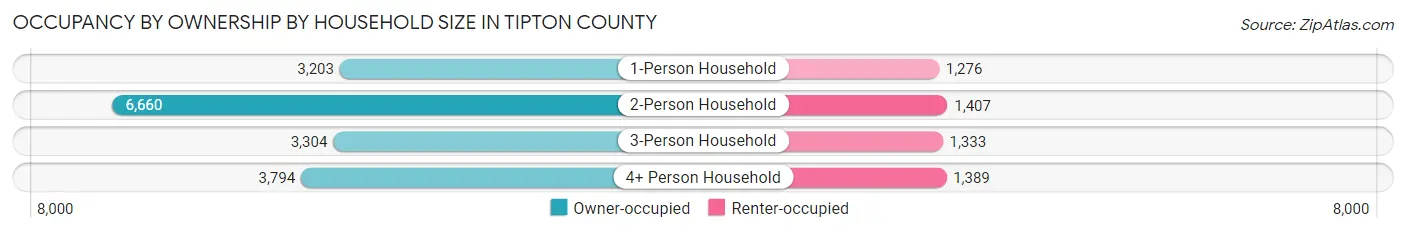
| Household Size | Owner-occupied | Renter-occupied |
| 1-Person Household | 3,203 (71.5%) | 1,276 (28.5%) |
| 2-Person Household | 6,660 (82.6%) | 1,407 (17.4%) |
| 3-Person Household | 3,304 (71.3%) | 1,333 (28.7%) |
| 4+ Person Household | 3,794 (73.2%) | 1,389 (26.8%) |
| Total Housing Units | 16,961 (75.8%) | 5,405 (24.2%) |
Occupancy by Educational Attainment in Tipton County
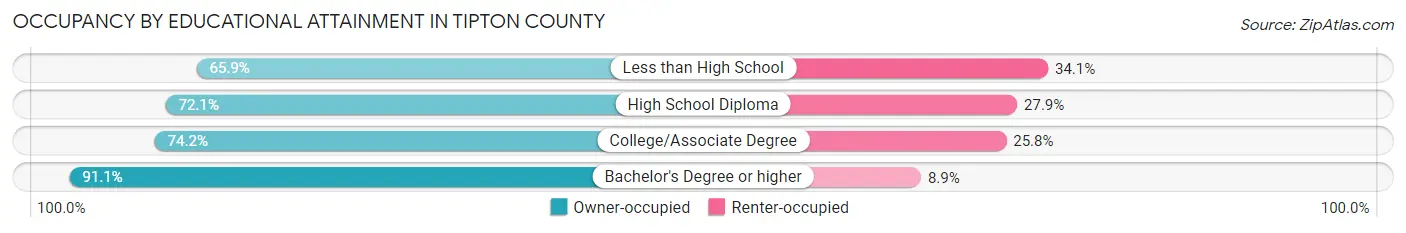
| Household Size | Owner-occupied | Renter-occupied |
| Less than High School | 1,565 (65.9%) | 809 (34.1%) |
| High School Diploma | 5,585 (72.1%) | 2,165 (27.9%) |
| College/Associate Degree | 5,897 (74.2%) | 2,049 (25.8%) |
| Bachelor's Degree or higher | 3,914 (91.1%) | 382 (8.9%) |
Occupancy by Age of Householder in Tipton County
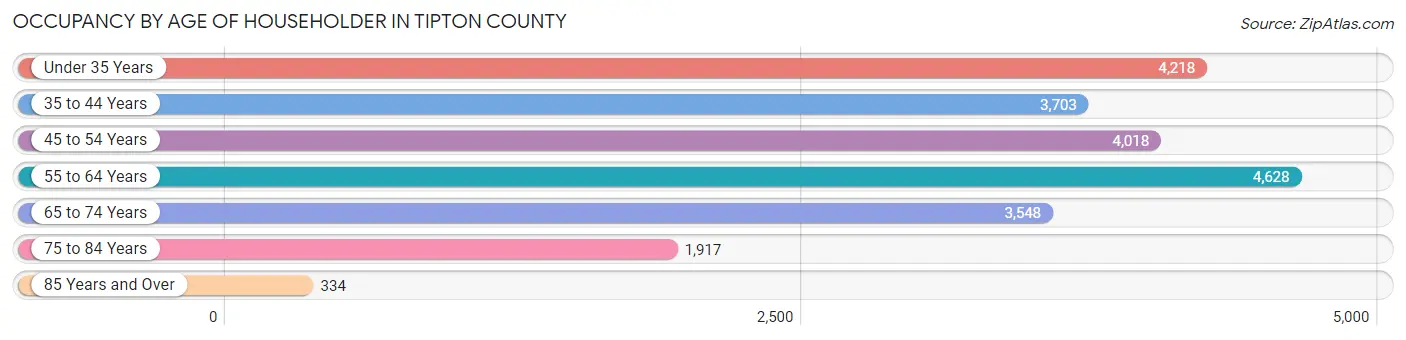
| Age Bracket | # Households | % Households |
| Under 35 Years | 4,218 | 18.9% |
| 35 to 44 Years | 3,703 | 16.6% |
| 45 to 54 Years | 4,018 | 18.0% |
| 55 to 64 Years | 4,628 | 20.7% |
| 65 to 74 Years | 3,548 | 15.9% |
| 75 to 84 Years | 1,917 | 8.6% |
| 85 Years and Over | 334 | 1.5% |
| Total | 22,366 | 100.0% |
Housing Finances in Tipton County
Median Income by Occupancy in Tipton County
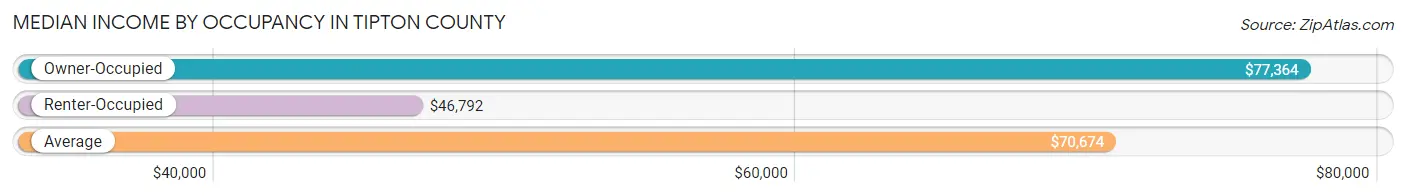
| Occupancy Type | # Households | Median Income |
| Owner-Occupied | 16,961 (75.8%) | $77,364 |
| Renter-Occupied | 5,405 (24.2%) | $46,792 |
| Average | 22,366 (100.0%) | $70,674 |
Occupancy by Householder Income Bracket in Tipton County
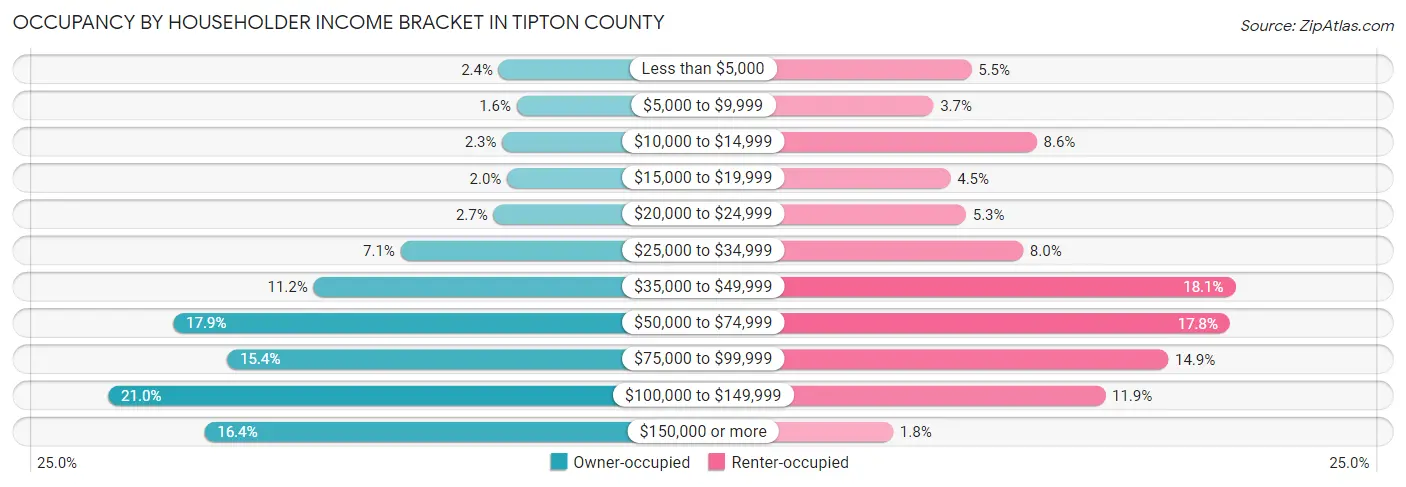
| Income Bracket | Owner-occupied | Renter-occupied |
| Less than $5,000 | 411 (2.4%) | 298 (5.5%) |
| $5,000 to $9,999 | 264 (1.6%) | 200 (3.7%) |
| $10,000 to $14,999 | 381 (2.2%) | 466 (8.6%) |
| $15,000 to $19,999 | 342 (2.0%) | 244 (4.5%) |
| $20,000 to $24,999 | 453 (2.7%) | 284 (5.2%) |
| $25,000 to $34,999 | 1,203 (7.1%) | 431 (8.0%) |
| $35,000 to $49,999 | 1,906 (11.2%) | 977 (18.1%) |
| $50,000 to $74,999 | 3,041 (17.9%) | 963 (17.8%) |
| $75,000 to $99,999 | 2,605 (15.4%) | 804 (14.9%) |
| $100,000 to $149,999 | 3,566 (21.0%) | 642 (11.9%) |
| $150,000 or more | 2,789 (16.4%) | 96 (1.8%) |
| Total | 16,961 (100.0%) | 5,405 (100.0%) |
Monthly Housing Cost Tiers in Tipton County
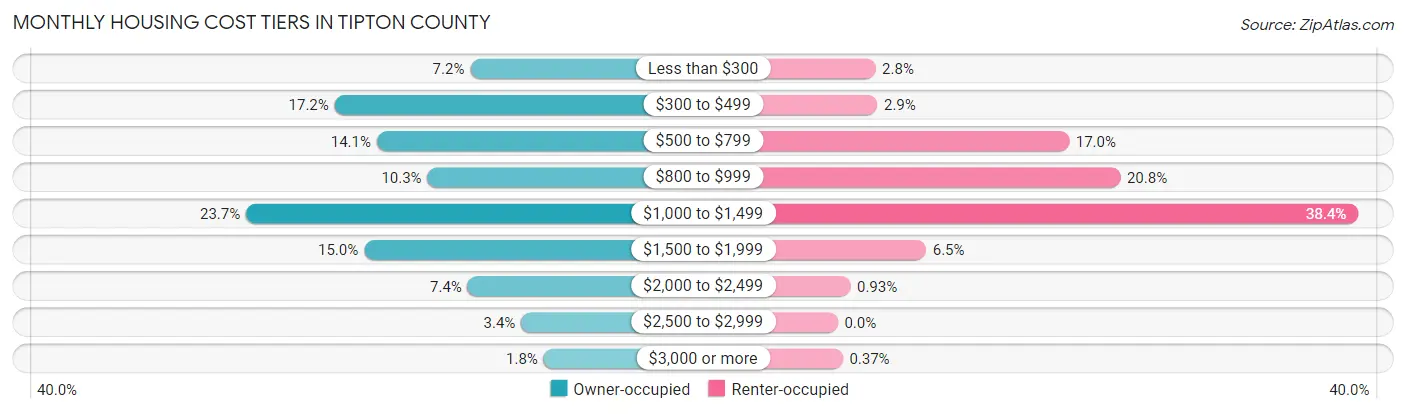
| Monthly Cost | Owner-occupied | Renter-occupied |
| Less than $300 | 1,217 (7.2%) | 150 (2.8%) |
| $300 to $499 | 2,912 (17.2%) | 158 (2.9%) |
| $500 to $799 | 2,385 (14.1%) | 921 (17.0%) |
| $800 to $999 | 1,752 (10.3%) | 1,125 (20.8%) |
| $1,000 to $1,499 | 4,018 (23.7%) | 2,073 (38.4%) |
| $1,500 to $1,999 | 2,544 (15.0%) | 352 (6.5%) |
| $2,000 to $2,499 | 1,250 (7.4%) | 50 (0.9%) |
| $2,500 to $2,999 | 582 (3.4%) | 0 (0.0%) |
| $3,000 or more | 301 (1.8%) | 20 (0.4%) |
| Total | 16,961 (100.0%) | 5,405 (100.0%) |
Physical Housing Characteristics in Tipton County
Housing Structures in Tipton County

| Structure Type | # Housing Units | % Housing Units |
| Single Unit, Detached | 18,731 | 83.8% |
| Single Unit, Attached | 196 | 0.9% |
| 2 Unit Apartments | 193 | 0.9% |
| 3 or 4 Unit Apartments | 547 | 2.5% |
| 5 to 9 Unit Apartments | 414 | 1.8% |
| 10 or more Apartments | 217 | 1.0% |
| Mobile Home / Other | 2,068 | 9.2% |
| Total | 22,366 | 100.0% |
Housing Structures by Occupancy in Tipton County
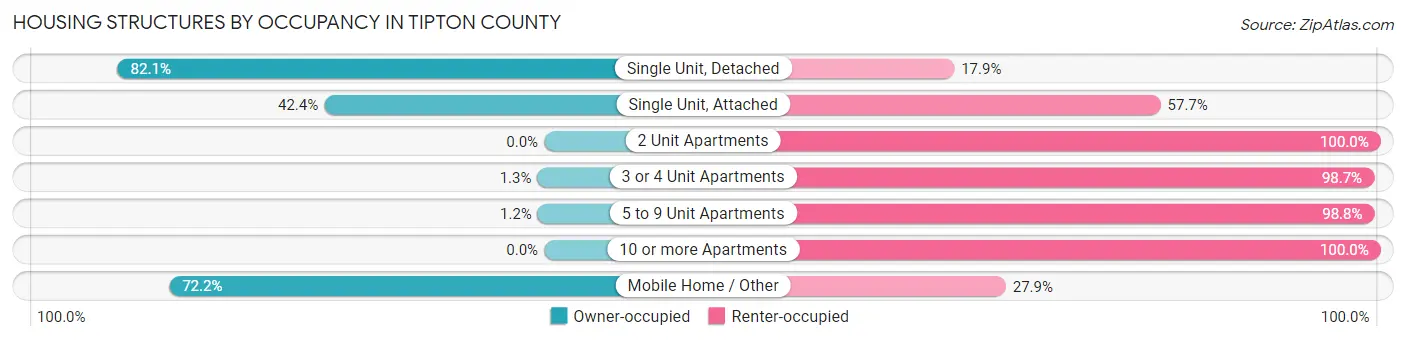
| Structure Type | Owner-occupied | Renter-occupied |
| Single Unit, Detached | 15,374 (82.1%) | 3,357 (17.9%) |
| Single Unit, Attached | 83 (42.3%) | 113 (57.7%) |
| 2 Unit Apartments | 0 (0.0%) | 193 (100.0%) |
| 3 or 4 Unit Apartments | 7 (1.3%) | 540 (98.7%) |
| 5 to 9 Unit Apartments | 5 (1.2%) | 409 (98.8%) |
| 10 or more Apartments | 0 (0.0%) | 217 (100.0%) |
| Mobile Home / Other | 1,492 (72.2%) | 576 (27.9%) |
| Total | 16,961 (75.8%) | 5,405 (24.2%) |
Housing Structures by Number of Rooms in Tipton County
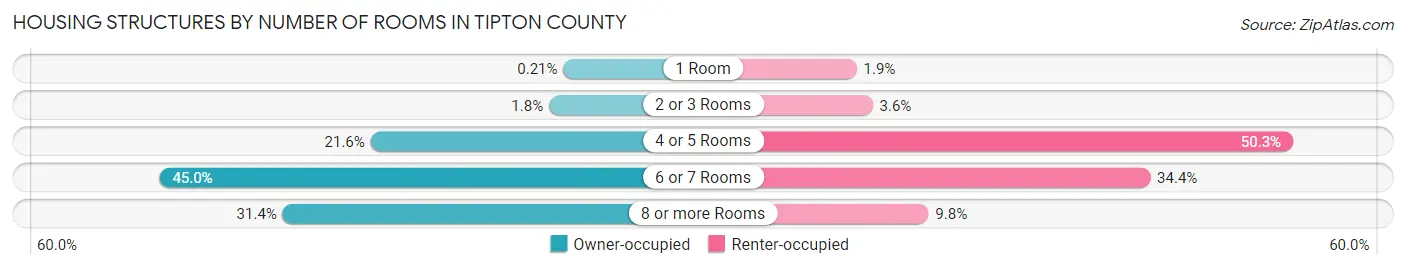
| Number of Rooms | Owner-occupied | Renter-occupied |
| 1 Room | 35 (0.2%) | 100 (1.8%) |
| 2 or 3 Rooms | 306 (1.8%) | 196 (3.6%) |
| 4 or 5 Rooms | 3,663 (21.6%) | 2,717 (50.3%) |
| 6 or 7 Rooms | 7,638 (45.0%) | 1,861 (34.4%) |
| 8 or more Rooms | 5,319 (31.4%) | 531 (9.8%) |
| Total | 16,961 (100.0%) | 5,405 (100.0%) |
Housing Structure by Heating Type in Tipton County
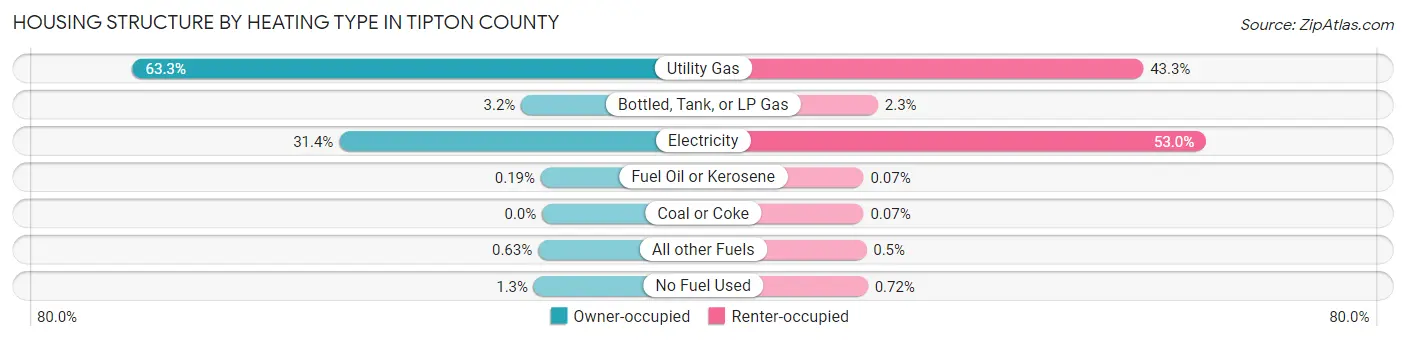
| Heating Type | Owner-occupied | Renter-occupied |
| Utility Gas | 10,736 (63.3%) | 2,341 (43.3%) |
| Bottled, Tank, or LP Gas | 548 (3.2%) | 124 (2.3%) |
| Electricity | 5,321 (31.4%) | 2,866 (53.0%) |
| Fuel Oil or Kerosene | 33 (0.2%) | 4 (0.1%) |
| Coal or Coke | 0 (0.0%) | 4 (0.1%) |
| All other Fuels | 107 (0.6%) | 27 (0.5%) |
| No Fuel Used | 216 (1.3%) | 39 (0.7%) |
| Total | 16,961 (100.0%) | 5,405 (100.0%) |
Household Vehicle Usage in Tipton County

| Vehicles per Household | Owner-occupied | Renter-occupied |
| No Vehicle | 358 (2.1%) | 614 (11.4%) |
| 1 Vehicle | 3,618 (21.3%) | 2,244 (41.5%) |
| 2 Vehicles | 6,365 (37.5%) | 1,787 (33.1%) |
| 3 or more Vehicles | 6,620 (39.0%) | 760 (14.1%) |
| Total | 16,961 (100.0%) | 5,405 (100.0%) |
Real Estate & Mortgages in Tipton County
Real Estate and Mortgage Overview in Tipton County
| Characteristic | Without Mortgage | With Mortgage |
| Housing Units | 6,089 | 10,872 |
| Median Property Value | $176,300 | $211,600 |
| Median Household Income | $53,705 | $2,201 |
| Monthly Housing Costs | $435 | $293 |
| Real Estate Taxes | $980 | $233 |
Property Value by Mortgage Status in Tipton County
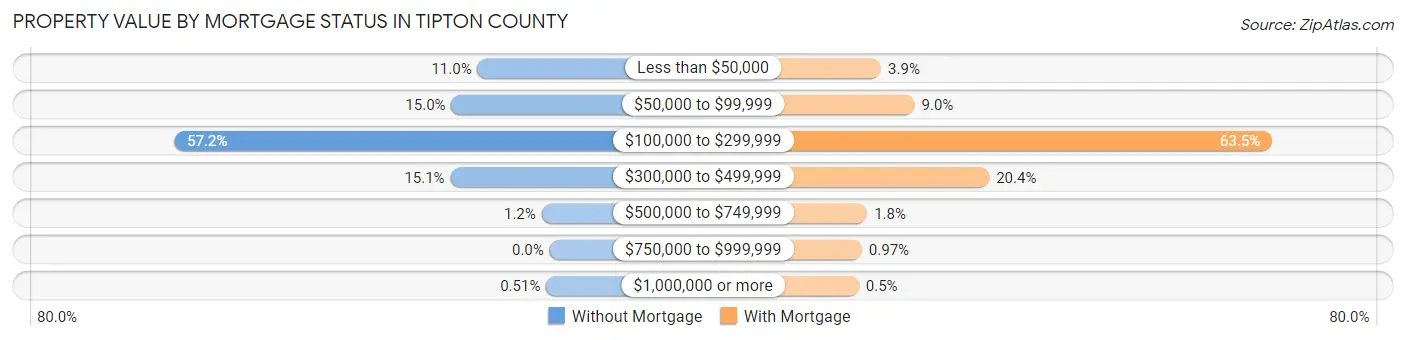
| Property Value | Without Mortgage | With Mortgage |
| Less than $50,000 | 669 (11.0%) | 424 (3.9%) |
| $50,000 to $99,999 | 911 (15.0%) | 979 (9.0%) |
| $100,000 to $299,999 | 3,484 (57.2%) | 6,902 (63.5%) |
| $300,000 to $499,999 | 920 (15.1%) | 2,215 (20.4%) |
| $500,000 to $749,999 | 74 (1.2%) | 193 (1.8%) |
| $750,000 to $999,999 | 0 (0.0%) | 105 (1.0%) |
| $1,000,000 or more | 31 (0.5%) | 54 (0.5%) |
| Total | 6,089 (100.0%) | 10,872 (100.0%) |
Household Income by Mortgage Status in Tipton County
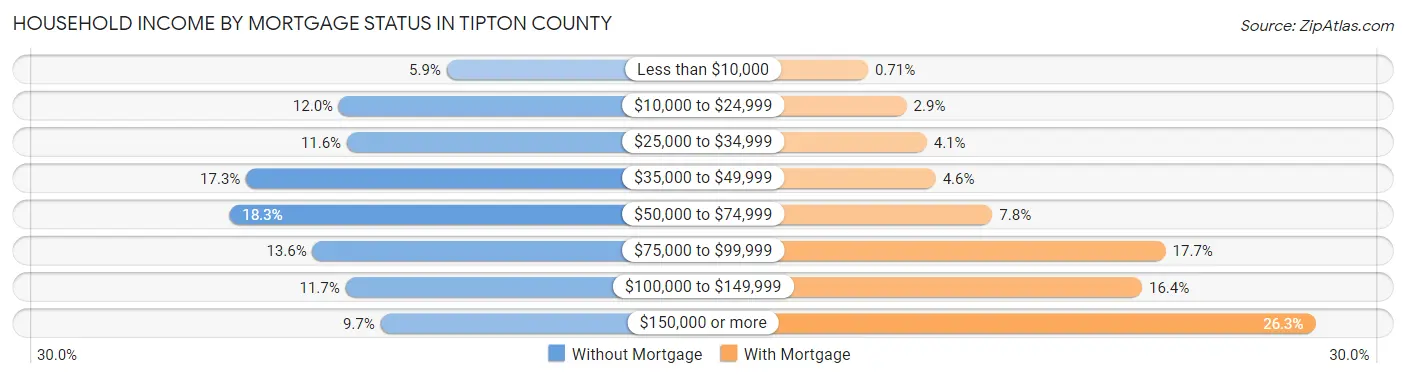
| Household Income | Without Mortgage | With Mortgage |
| Less than $10,000 | 358 (5.9%) | 77 (0.7%) |
| $10,000 to $24,999 | 733 (12.0%) | 317 (2.9%) |
| $25,000 to $34,999 | 705 (11.6%) | 443 (4.1%) |
| $35,000 to $49,999 | 1,056 (17.3%) | 498 (4.6%) |
| $50,000 to $74,999 | 1,114 (18.3%) | 850 (7.8%) |
| $75,000 to $99,999 | 825 (13.6%) | 1,927 (17.7%) |
| $100,000 to $149,999 | 710 (11.7%) | 1,780 (16.4%) |
| $150,000 or more | 588 (9.7%) | 2,856 (26.3%) |
| Total | 6,089 (100.0%) | 10,872 (100.0%) |
Property Value to Household Income Ratio in Tipton County
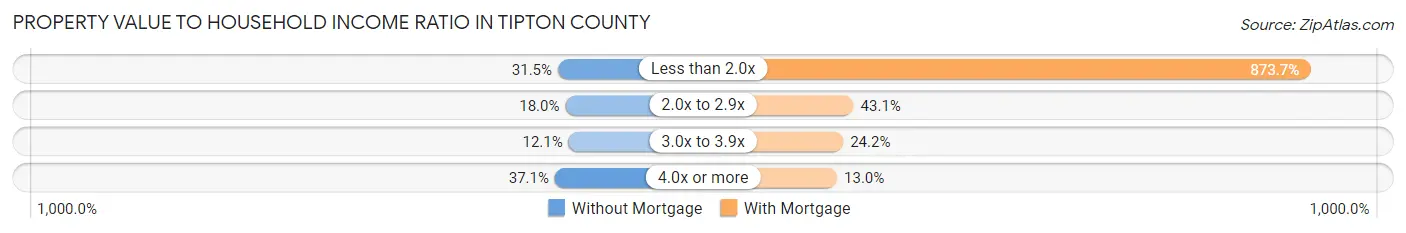
| Value-to-Income Ratio | Without Mortgage | With Mortgage |
| Less than 2.0x | 1,920 (31.5%) | 94,985 (873.7%) |
| 2.0x to 2.9x | 1,094 (18.0%) | 4,683 (43.1%) |
| 3.0x to 3.9x | 738 (12.1%) | 2,628 (24.2%) |
| 4.0x or more | 2,261 (37.1%) | 1,418 (13.0%) |
| Total | 6,089 (100.0%) | 10,872 (100.0%) |
Real Estate Taxes by Mortgage Status in Tipton County
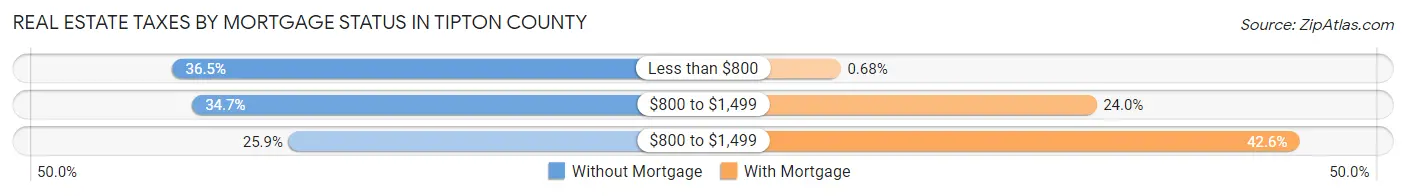
| Property Taxes | Without Mortgage | With Mortgage |
| Less than $800 | 2,221 (36.5%) | 74 (0.7%) |
| $800 to $1,499 | 2,112 (34.7%) | 2,612 (24.0%) |
| $800 to $1,499 | 1,575 (25.9%) | 4,628 (42.6%) |
| Total | 6,089 (100.0%) | 10,872 (100.0%) |
Health & Disability in Tipton County
Health Insurance Coverage by Age in Tipton County
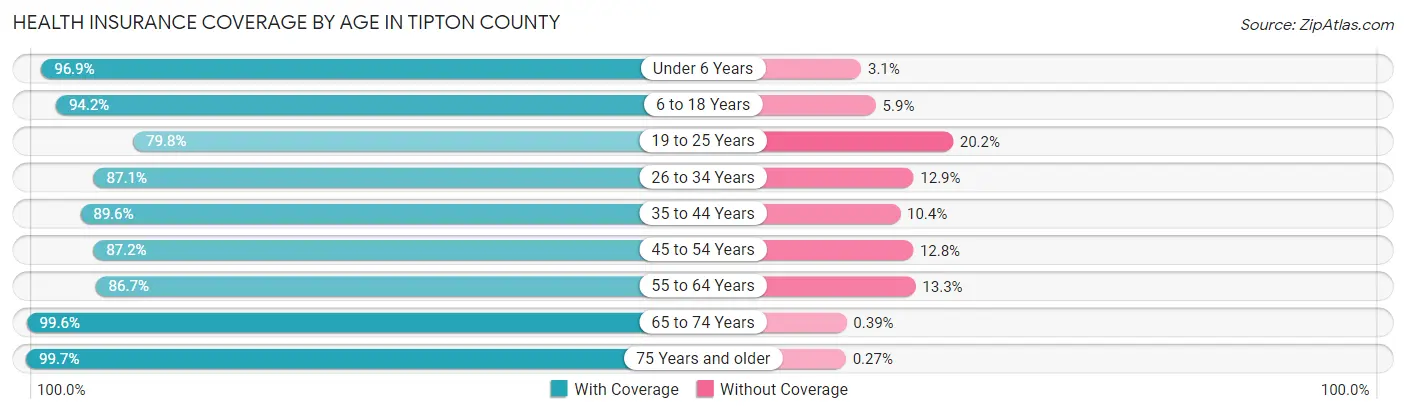
| Age Bracket | With Coverage | Without Coverage |
| Under 6 Years | 3,973 (96.9%) | 128 (3.1%) |
| 6 to 18 Years | 10,790 (94.2%) | 670 (5.9%) |
| 19 to 25 Years | 3,880 (79.8%) | 984 (20.2%) |
| 26 to 34 Years | 5,984 (87.1%) | 885 (12.9%) |
| 35 to 44 Years | 6,883 (89.6%) | 798 (10.4%) |
| 45 to 54 Years | 6,819 (87.2%) | 1,001 (12.8%) |
| 55 to 64 Years | 7,234 (86.7%) | 1,106 (13.3%) |
| 65 to 74 Years | 5,611 (99.6%) | 22 (0.4%) |
| 75 Years and older | 3,328 (99.7%) | 9 (0.3%) |
| Total | 54,502 (90.7%) | 5,603 (9.3%) |
Health Insurance Coverage by Citizenship Status in Tipton County
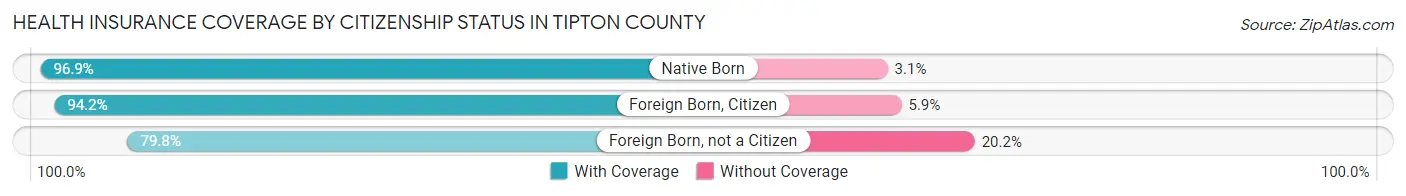
| Citizenship Status | With Coverage | Without Coverage |
| Native Born | 3,973 (96.9%) | 128 (3.1%) |
| Foreign Born, Citizen | 10,790 (94.2%) | 670 (5.9%) |
| Foreign Born, not a Citizen | 3,880 (79.8%) | 984 (20.2%) |
Health Insurance Coverage by Household Income in Tipton County
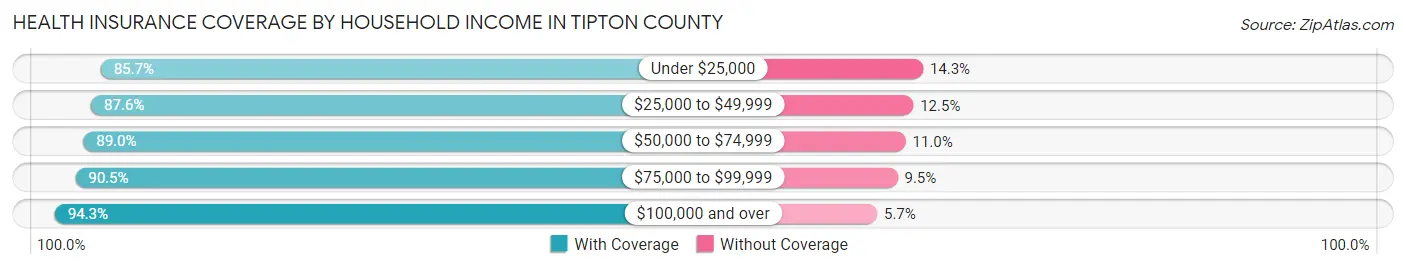
| Household Income | With Coverage | Without Coverage |
| Under $25,000 | 5,517 (85.7%) | 918 (14.3%) |
| $25,000 to $49,999 | 8,993 (87.5%) | 1,279 (12.4%) |
| $50,000 to $74,999 | 9,435 (89.0%) | 1,167 (11.0%) |
| $75,000 to $99,999 | 8,996 (90.5%) | 944 (9.5%) |
| $100,000 and over | 21,533 (94.3%) | 1,294 (5.7%) |
Public vs Private Health Insurance Coverage by Age in Tipton County
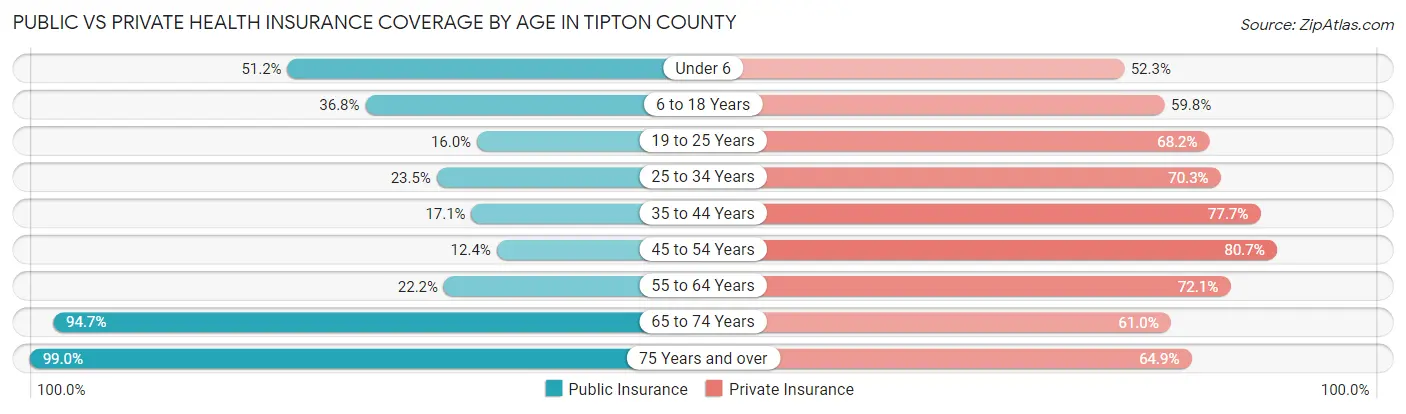
| Age Bracket | Public Insurance | Private Insurance |
| Under 6 | 2,100 (51.2%) | 2,146 (52.3%) |
| 6 to 18 Years | 4,212 (36.7%) | 6,854 (59.8%) |
| 19 to 25 Years | 780 (16.0%) | 3,318 (68.2%) |
| 25 to 34 Years | 1,615 (23.5%) | 4,827 (70.3%) |
| 35 to 44 Years | 1,310 (17.1%) | 5,964 (77.6%) |
| 45 to 54 Years | 968 (12.4%) | 6,310 (80.7%) |
| 55 to 64 Years | 1,850 (22.2%) | 6,009 (72.1%) |
| 65 to 74 Years | 5,335 (94.7%) | 3,438 (61.0%) |
| 75 Years and over | 3,305 (99.0%) | 2,164 (64.8%) |
| Total | 21,475 (35.7%) | 41,030 (68.3%) |
Disability Status by Sex by Age in Tipton County
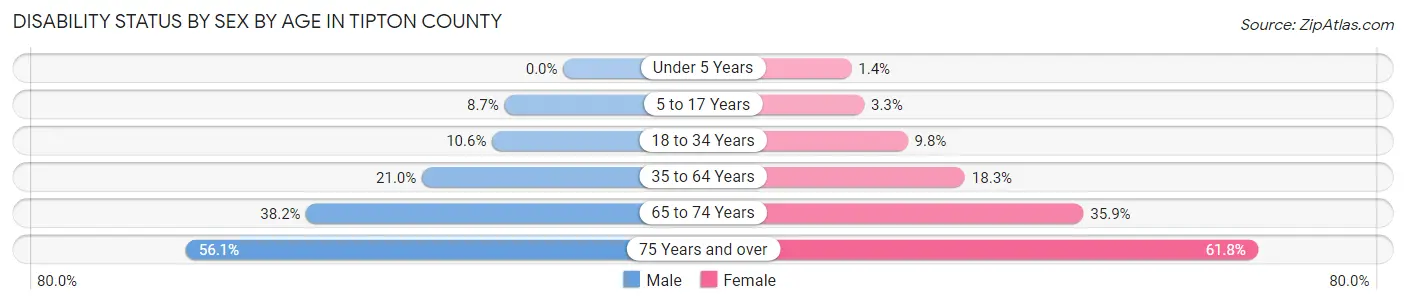
| Age Bracket | Male | Female |
| Under 5 Years | 0 (0.0%) | 24 (1.4%) |
| 5 to 17 Years | 506 (8.7%) | 181 (3.3%) |
| 18 to 34 Years | 666 (10.6%) | 616 (9.8%) |
| 35 to 64 Years | 2,450 (21.0%) | 2,223 (18.3%) |
| 65 to 74 Years | 1,005 (38.2%) | 1,076 (35.9%) |
| 75 Years and over | 783 (56.0%) | 1,198 (61.8%) |
Disability Class by Sex by Age in Tipton County
Disability Class: Hearing Difficulty
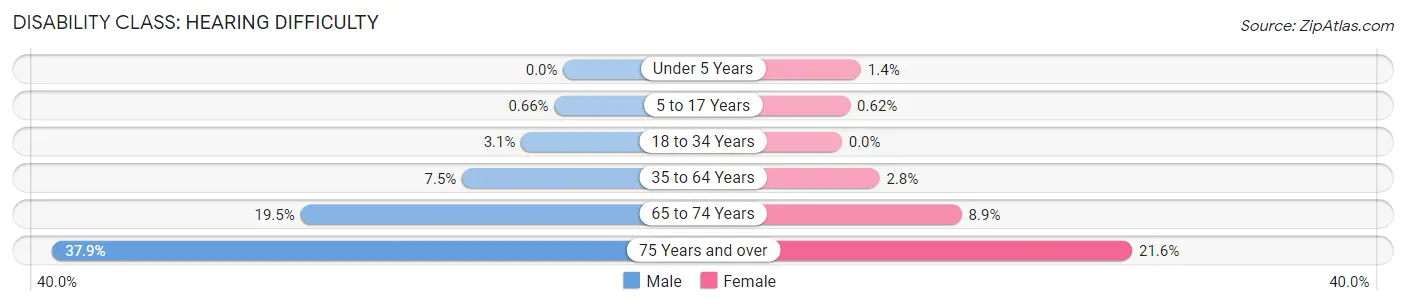
| Age Bracket | Male | Female |
| Under 5 Years | 0 (0.0%) | 24 (1.4%) |
| 5 to 17 Years | 38 (0.7%) | 34 (0.6%) |
| 18 to 34 Years | 197 (3.1%) | 0 (0.0%) |
| 35 to 64 Years | 877 (7.5%) | 341 (2.8%) |
| 65 to 74 Years | 514 (19.5%) | 267 (8.9%) |
| 75 Years and over | 530 (37.9%) | 418 (21.5%) |
Disability Class: Vision Difficulty
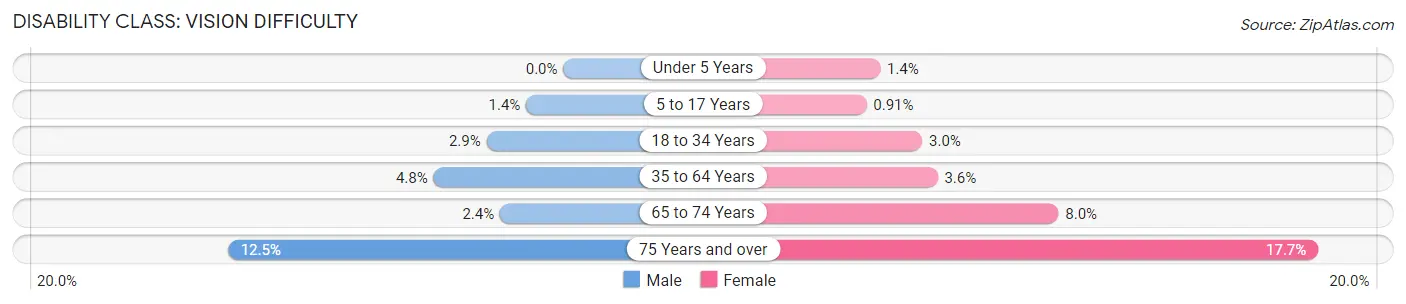
| Age Bracket | Male | Female |
| Under 5 Years | 0 (0.0%) | 24 (1.4%) |
| 5 to 17 Years | 80 (1.4%) | 50 (0.9%) |
| 18 to 34 Years | 180 (2.9%) | 188 (3.0%) |
| 35 to 64 Years | 563 (4.8%) | 432 (3.5%) |
| 65 to 74 Years | 62 (2.4%) | 241 (8.0%) |
| 75 Years and over | 174 (12.5%) | 343 (17.7%) |
Disability Class: Cognitive Difficulty
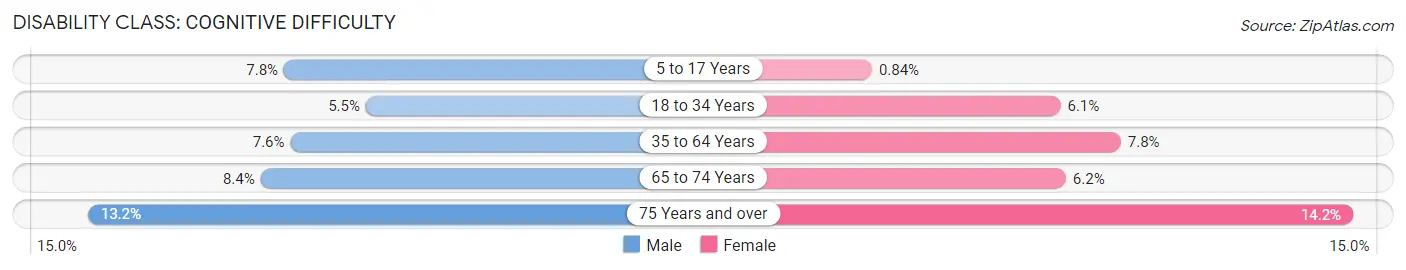
| Age Bracket | Male | Female |
| 5 to 17 Years | 451 (7.8%) | 46 (0.8%) |
| 18 to 34 Years | 347 (5.5%) | 384 (6.1%) |
| 35 to 64 Years | 888 (7.6%) | 945 (7.8%) |
| 65 to 74 Years | 222 (8.4%) | 187 (6.2%) |
| 75 Years and over | 185 (13.2%) | 276 (14.2%) |
Disability Class: Ambulatory Difficulty
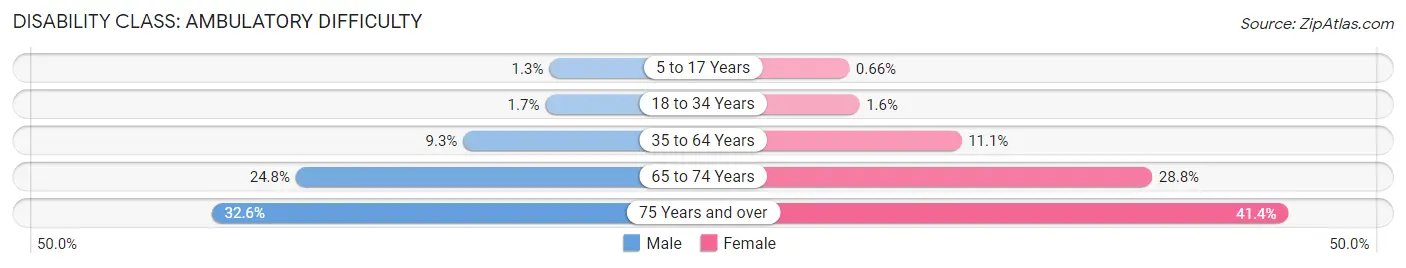
| Age Bracket | Male | Female |
| 5 to 17 Years | 76 (1.3%) | 36 (0.7%) |
| 18 to 34 Years | 106 (1.7%) | 102 (1.6%) |
| 35 to 64 Years | 1,086 (9.3%) | 1,347 (11.1%) |
| 65 to 74 Years | 654 (24.8%) | 863 (28.8%) |
| 75 Years and over | 456 (32.6%) | 804 (41.4%) |
Disability Class: Self-Care Difficulty

| Age Bracket | Male | Female |
| 5 to 17 Years | 83 (1.4%) | 39 (0.7%) |
| 18 to 34 Years | 101 (1.6%) | 144 (2.3%) |
| 35 to 64 Years | 272 (2.3%) | 324 (2.7%) |
| 65 to 74 Years | 227 (8.6%) | 241 (8.0%) |
| 75 Years and over | 163 (11.7%) | 281 (14.5%) |
Technology Access in Tipton County
Computing Device Access in Tipton County
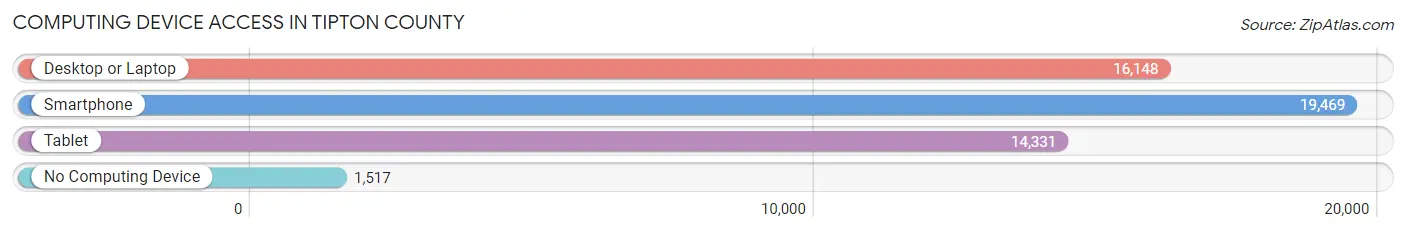
| Device Type | # Households | % Households |
| Desktop or Laptop | 16,148 | 72.2% |
| Smartphone | 19,469 | 87.1% |
| Tablet | 14,331 | 64.1% |
| No Computing Device | 1,517 | 6.8% |
| Total | 22,366 | 100.0% |
Internet Access in Tipton County

| Internet Type | # Households | % Households |
| Dial-Up Internet | 8 | 0.0% |
| Broadband Home | 14,705 | 65.7% |
| Cellular Data Only | 2,821 | 12.6% |
| Satellite Internet | 2,040 | 9.1% |
| No Internet | 3,726 | 16.7% |
| Total | 22,366 | 100.0% |
Tipton County Summary
Tipton County is located in the western part of the state of Tennessee, in the United States. It is bordered by Shelby County to the north, Fayette County to the east, Lauderdale County to the south, and Mississippi to the west. The county seat is Covington, and the largest city is Munford. As of the 2010 census, the population was 61,081.
Tipton County was established in 1823 from parts of Shelby and Lauderdale counties. It was named for Jacob Tipton, a Revolutionary War veteran and early settler of the area. The county was part of the Chickasaw Cession of 1818, in which the Chickasaw Nation ceded much of its land in West Tennessee to the United States.
The geography of Tipton County is mostly flat, with some rolling hills in the northern part of the county. The Loosahatchie River runs through the county, and the Hatchie River forms the western border. The county is part of the Mississippi Alluvial Plain, and is mostly covered in farmland.
The economy of Tipton County is largely based on agriculture. The county is home to several large farms, and is a major producer of cotton, soybeans, and other crops. The county also has a strong manufacturing sector, with several factories producing automotive parts, furniture, and other products.
The demographics of Tipton County are largely white, with a small African American population. The median household income is $45,845, and the median home value is $128,000. The unemployment rate is 4.2%, and the poverty rate is 16.3%.
Tipton County is served by several school districts, including Covington, Munford, and Brighton. The county is also home to several higher education institutions, including the University of Memphis at Covington, Dyersburg State Community College, and Southwest Tennessee Community College.
Tipton County is home to several attractions, including the Tipton County Museum, the Tipton County Fairgrounds, and the Hatchie National Wildlife Refuge. The county is also home to several parks, including the Covington City Park and the Munford City Park.
Tipton County is a great place to live, work, and play. With its rich history, diverse economy, and friendly people, it is a great place to call home.
Common Questions
What is the Total Population of Tipton County?
Total Population of Tipton County is 61,116.
What is the Total Male Population of Tipton County?
Total Male Population of Tipton County is 30,274.
What is the Total Female Population of Tipton County?
Total Female Population of Tipton County is 30,842.
What is the Ratio of Males per 100 Females in Tipton County?
There are 98.16 Males per 100 Females in Tipton County.
What is the Ratio of Females per 100 Males in Tipton County?
There are 101.88 Females per 100 Males in Tipton County.
What is the Median Population Age in Tipton County?
Median Population Age in Tipton County is 38.4 Years.
What is the Average Family Size in Tipton County
Average Family Size in Tipton County is 3.1 People.
What is the Average Household Size in Tipton County
Average Household Size in Tipton County is 2.7 People.
What is Per Capita Income in Tipton County?
Per Capita income in Tipton County is $31,909.
What is the Median Family Income in Tipton County?
Median Family Income in Tipton County is $79,871.
What is the Median Household income in Tipton County?
Median Household Income in Tipton County is $70,674.
What is Income or Wage Gap in Tipton County?
Income or Wage Gap in Tipton County is 27.7%.
Women in Tipton County earn 72.3 cents for every dollar earned by a man.
What is Family Income Deficit in Tipton County?
Family Income Deficit in Tipton County is $12,430.
Families that are below poverty line in Tipton County earn $12,430 less on average than the poverty threshold level.
What is Inequality or Gini Index in Tipton County?
Inequality or Gini Index in Tipton County is 0.41.
How Large is the Labor Force in Tipton County?
There are 29,593 People in the Labor Forcein in Tipton County.
What is the Percentage of People in the Labor Force in Tipton County?
61.3% of People are in the Labor Force in Tipton County.
What is the Unemployment Rate in Tipton County?
Unemployment Rate in Tipton County is 5.4%.