Sullivan County, TN
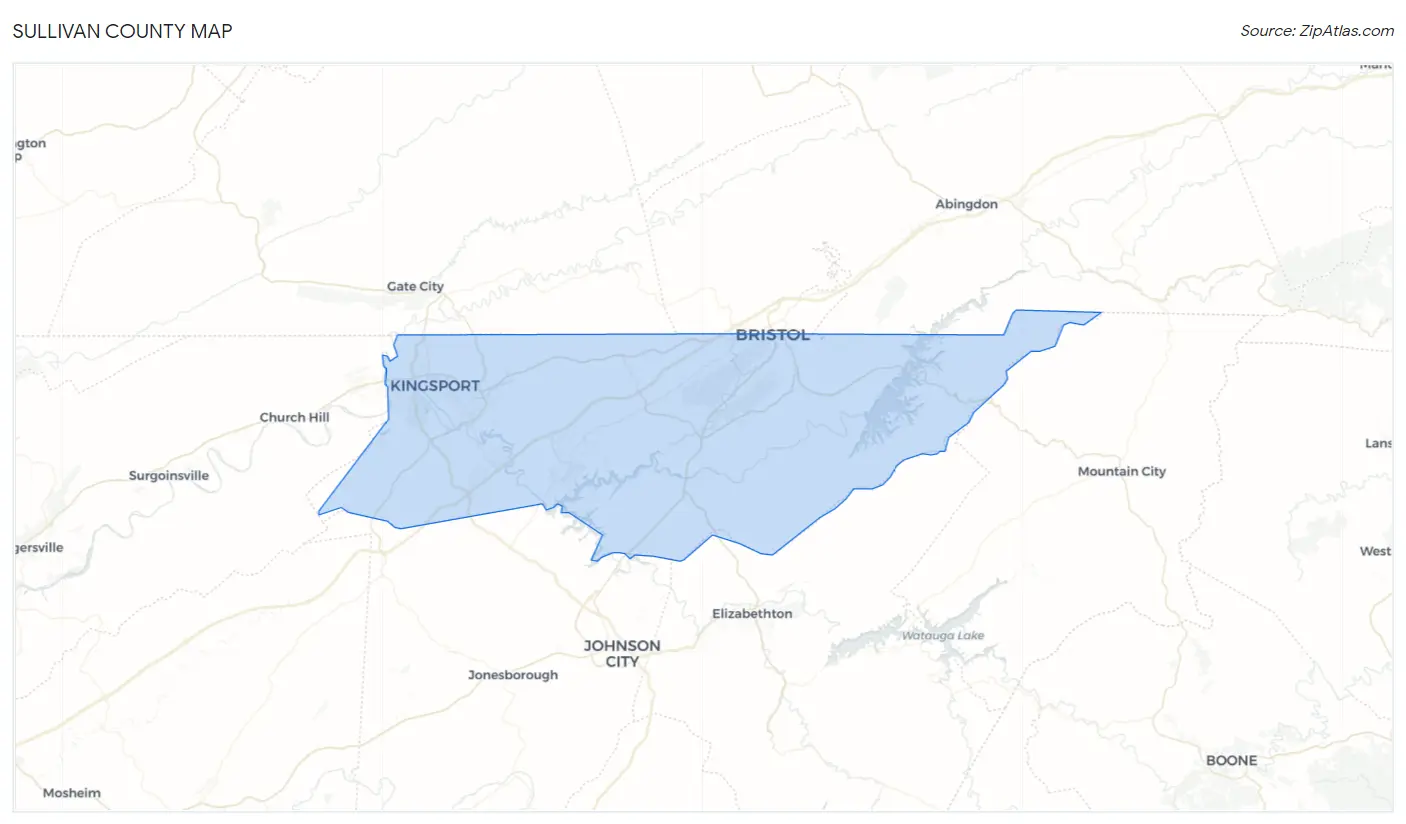
Sullivan County Map
Sullivan County Overview
158,722
TOTAL POPULATION
77,767
MALE POPULATION
80,955
FEMALE POPULATION
96.06
MALES / 100 FEMALES
104.10
FEMALES / 100 MALES
45.2
MEDIAN AGE
2.9
AVG FAMILY SIZE
2.3
AVG HOUSEHOLD SIZE
$33,934
PER CAPITA INCOME
$71,464
AVG FAMILY INCOME
$54,357
AVG HOUSEHOLD INCOME
29.1%
WAGE / INCOME GAP [ % ]
70.9¢/ $1
WAGE / INCOME GAP [ $ ]
$10,672
FAMILY INCOME DEFICIT
0.48
INEQUALITY / GINI INDEX
73,917
LABOR FORCE [ PEOPLE ]
55.9%
PERCENT IN LABOR FORCE
6.2%
UNEMPLOYMENT RATE
Sullivan County Area Codes
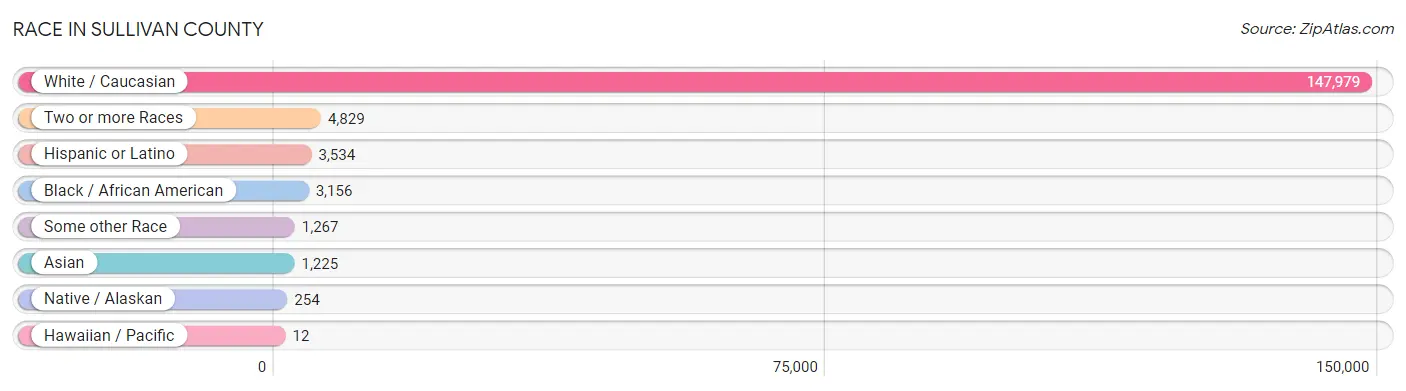
Race in Sullivan County
The most populous races in Sullivan County are White / Caucasian (147,979 | 93.2%), Two or more Races (4,829 | 3.0%), and Hispanic or Latino (3,534 | 2.2%).
| Race | # Population | % Population |
| Asian | 1,225 | 0.8% |
| Black / African American | 3,156 | 2.0% |
| Hawaiian / Pacific | 12 | 0.0% |
| Hispanic or Latino | 3,534 | 2.2% |
| Native / Alaskan | 254 | 0.2% |
| White / Caucasian | 147,979 | 93.2% |
| Two or more Races | 4,829 | 3.0% |
| Some other Race | 1,267 | 0.8% |
| Total | 158,722 | 100.0% |
Ancestry in Sullivan County
The most populous ancestries reported in Sullivan County are English (28,701 | 18.1%), American (25,699 | 16.2%), Irish (20,567 | 13.0%), German (19,359 | 12.2%), and Scotch-Irish (5,668 | 3.6%), together accounting for 63.0% of all Sullivan County residents.

| Ancestry | # Population | % Population |
| African | 111 | 0.1% |
| Albanian | 36 | 0.0% |
| American | 25,699 | 16.2% |
| Apache | 2 | 0.0% |
| Arab | 246 | 0.2% |
| Armenian | 27 | 0.0% |
| Assyrian / Chaldean / Syriac | 47 | 0.0% |
| Australian | 25 | 0.0% |
| Austrian | 111 | 0.1% |
| Belgian | 22 | 0.0% |
| Bhutanese | 103 | 0.1% |
| Blackfeet | 57 | 0.0% |
| Bolivian | 33 | 0.0% |
| Brazilian | 19 | 0.0% |
| British | 850 | 0.5% |
| Bulgarian | 55 | 0.0% |
| Burmese | 169 | 0.1% |
| Cajun | 7 | 0.0% |
| Canadian | 70 | 0.0% |
| Celtic | 23 | 0.0% |
| Central American | 347 | 0.2% |
| Central American Indian | 25 | 0.0% |
| Cherokee | 708 | 0.4% |
| Chilean | 5 | 0.0% |
| Chippewa | 13 | 0.0% |
| Choctaw | 19 | 0.0% |
| Colombian | 20 | 0.0% |
| Croatian | 141 | 0.1% |
| Cuban | 73 | 0.1% |
| Cypriot | 15 | 0.0% |
| Czech | 224 | 0.1% |
| Czechoslovakian | 47 | 0.0% |
| Danish | 124 | 0.1% |
| Dominican | 79 | 0.1% |
| Dutch | 2,002 | 1.3% |
| Eastern European | 110 | 0.1% |
| Egyptian | 70 | 0.0% |
| English | 28,701 | 18.1% |
| Ethiopian | 4 | 0.0% |
| European | 2,477 | 1.6% |
| Filipino | 12 | 0.0% |
| Finnish | 79 | 0.1% |
| French | 2,003 | 1.3% |
| French Canadian | 211 | 0.1% |
| German | 19,359 | 12.2% |
| Greek | 291 | 0.2% |
| Guatemalan | 100 | 0.1% |
| Honduran | 24 | 0.0% |
| Hungarian | 202 | 0.1% |
| Indian (Asian) | 353 | 0.2% |
| Inupiat | 10 | 0.0% |
| Iranian | 67 | 0.0% |
| Irish | 20,567 | 13.0% |
| Iroquois | 5 | 0.0% |
| Israeli | 58 | 0.0% |
| Italian | 2,902 | 1.8% |
| Jamaican | 147 | 0.1% |
| Japanese | 74 | 0.1% |
| Korean | 271 | 0.2% |
| Lebanese | 85 | 0.1% |
| Lithuanian | 15 | 0.0% |
| Lumbee | 14 | 0.0% |
| Macedonian | 5 | 0.0% |
| Malaysian | 10 | 0.0% |
| Mexican | 2,067 | 1.3% |
| Moroccan | 16 | 0.0% |
| Native Hawaiian | 38 | 0.0% |
| Navajo | 4 | 0.0% |
| Nicaraguan | 43 | 0.0% |
| Nigerian | 57 | 0.0% |
| Northern European | 238 | 0.2% |
| Norwegian | 712 | 0.4% |
| Pakistani | 14 | 0.0% |
| Panamanian | 102 | 0.1% |
| Paraguayan | 20 | 0.0% |
| Pennsylvania German | 9 | 0.0% |
| Peruvian | 149 | 0.1% |
| Polish | 1,406 | 0.9% |
| Portuguese | 101 | 0.1% |
| Puerto Rican | 596 | 0.4% |
| Romanian | 34 | 0.0% |
| Russian | 134 | 0.1% |
| Salvadoran | 59 | 0.0% |
| Scandinavian | 293 | 0.2% |
| Scotch-Irish | 5,668 | 3.6% |
| Scottish | 4,639 | 2.9% |
| Seminole | 1 | 0.0% |
| Serbian | 365 | 0.2% |
| Sioux | 27 | 0.0% |
| Slavic | 2 | 0.0% |
| Slovak | 91 | 0.1% |
| Slovene | 51 | 0.0% |
| South African | 19 | 0.0% |
| South American | 242 | 0.2% |
| Spaniard | 6 | 0.0% |
| Spanish | 63 | 0.0% |
| Sri Lankan | 79 | 0.1% |
| Subsaharan African | 238 | 0.2% |
| Sudanese | 7 | 0.0% |
| Swedish | 592 | 0.4% |
| Swiss | 233 | 0.2% |
| Thai | 588 | 0.4% |
| Trinidadian and Tobagonian | 35 | 0.0% |
| Ugandan | 16 | 0.0% |
| Ukrainian | 104 | 0.1% |
| Uruguayan | 15 | 0.0% |
| Welsh | 952 | 0.6% |
| Yugoslavian | 44 | 0.0% | View All 108 Rows |
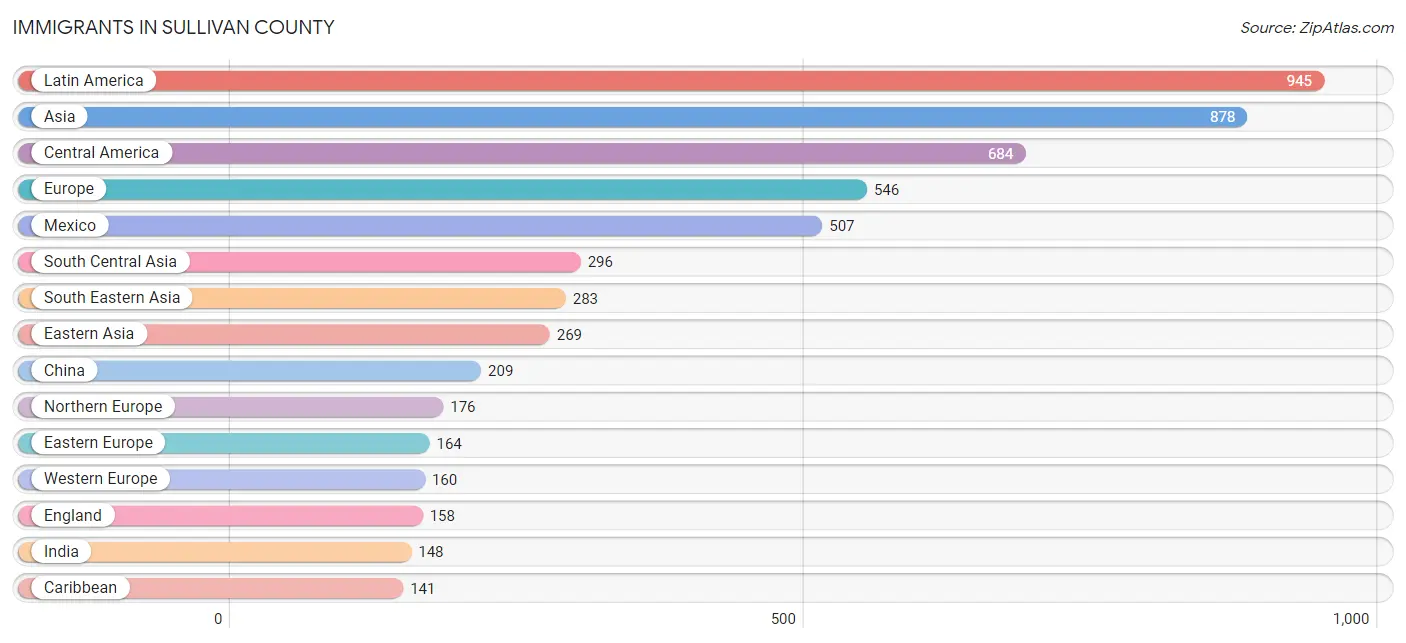
Immigrants in Sullivan County
The most numerous immigrant groups reported in Sullivan County came from Latin America (945 | 0.6%), Asia (878 | 0.5%), Central America (684 | 0.4%), Europe (546 | 0.3%), and Mexico (507 | 0.3%), together accounting for 2.2% of all Sullivan County residents.
| Immigration Origin | # Population | % Population |
| Africa | 74 | 0.1% |
| Asia | 878 | 0.5% |
| Australia | 26 | 0.0% |
| Bangladesh | 95 | 0.1% |
| Bosnia and Herzegovina | 27 | 0.0% |
| Brazil | 24 | 0.0% |
| Cambodia | 36 | 0.0% |
| Canada | 117 | 0.1% |
| Caribbean | 141 | 0.1% |
| Central America | 684 | 0.4% |
| Chile | 5 | 0.0% |
| China | 209 | 0.1% |
| Colombia | 20 | 0.0% |
| Croatia | 58 | 0.0% |
| Cuba | 35 | 0.0% |
| Dominican Republic | 65 | 0.0% |
| Eastern Asia | 269 | 0.2% |
| Eastern Europe | 164 | 0.1% |
| Egypt | 31 | 0.0% |
| El Salvador | 17 | 0.0% |
| England | 158 | 0.1% |
| Europe | 546 | 0.3% |
| France | 27 | 0.0% |
| Germany | 126 | 0.1% |
| Ghana | 13 | 0.0% |
| Guatemala | 100 | 0.1% |
| Guyana | 23 | 0.0% |
| Honduras | 17 | 0.0% |
| India | 148 | 0.1% |
| Iran | 53 | 0.0% |
| Italy | 17 | 0.0% |
| Jamaica | 11 | 0.0% |
| Japan | 47 | 0.0% |
| Korea | 13 | 0.0% |
| Latin America | 945 | 0.6% |
| Mexico | 507 | 0.3% |
| Morocco | 16 | 0.0% |
| Netherlands | 7 | 0.0% |
| Nicaragua | 43 | 0.0% |
| Nigeria | 7 | 0.0% |
| North Macedonia | 27 | 0.0% |
| Northern Africa | 47 | 0.0% |
| Northern Europe | 176 | 0.1% |
| Oceania | 37 | 0.0% |
| Peru | 29 | 0.0% |
| Philippines | 119 | 0.1% |
| Russia | 18 | 0.0% |
| Saudi Arabia | 8 | 0.0% |
| Singapore | 24 | 0.0% |
| South Africa | 7 | 0.0% |
| South America | 120 | 0.1% |
| South Central Asia | 296 | 0.2% |
| South Eastern Asia | 283 | 0.2% |
| Southern Europe | 46 | 0.0% |
| Spain | 29 | 0.0% |
| Taiwan | 20 | 0.0% |
| Thailand | 5 | 0.0% |
| Trinidad and Tobago | 30 | 0.0% |
| Vietnam | 99 | 0.1% |
| Western Africa | 20 | 0.0% |
| Western Asia | 30 | 0.0% |
| Western Europe | 160 | 0.1% | View All 62 Rows |
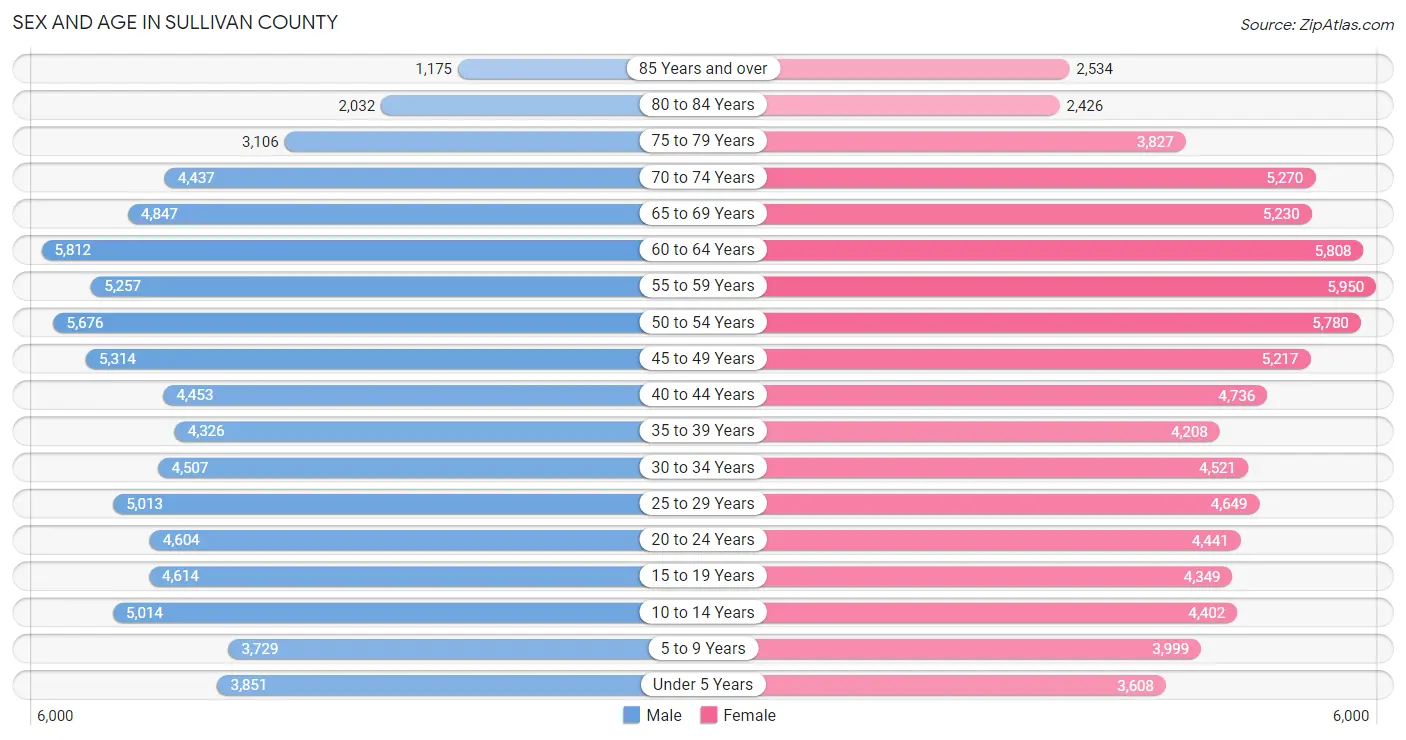
Sex and Age in Sullivan County
Sex and Age in Sullivan County
The most populous age groups in Sullivan County are 60 to 64 Years (5,812 | 7.5%) for men and 55 to 59 Years (5,950 | 7.3%) for women.
| Age Bracket | Male | Female |
| Under 5 Years | 3,851 (5.0%) | 3,608 (4.5%) |
| 5 to 9 Years | 3,729 (4.8%) | 3,999 (4.9%) |
| 10 to 14 Years | 5,014 (6.5%) | 4,402 (5.4%) |
| 15 to 19 Years | 4,614 (5.9%) | 4,349 (5.4%) |
| 20 to 24 Years | 4,604 (5.9%) | 4,441 (5.5%) |
| 25 to 29 Years | 5,013 (6.5%) | 4,649 (5.7%) |
| 30 to 34 Years | 4,507 (5.8%) | 4,521 (5.6%) |
| 35 to 39 Years | 4,326 (5.6%) | 4,208 (5.2%) |
| 40 to 44 Years | 4,453 (5.7%) | 4,736 (5.9%) |
| 45 to 49 Years | 5,314 (6.8%) | 5,217 (6.4%) |
| 50 to 54 Years | 5,676 (7.3%) | 5,780 (7.1%) |
| 55 to 59 Years | 5,257 (6.8%) | 5,950 (7.3%) |
| 60 to 64 Years | 5,812 (7.5%) | 5,808 (7.2%) |
| 65 to 69 Years | 4,847 (6.2%) | 5,230 (6.5%) |
| 70 to 74 Years | 4,437 (5.7%) | 5,270 (6.5%) |
| 75 to 79 Years | 3,106 (4.0%) | 3,827 (4.7%) |
| 80 to 84 Years | 2,032 (2.6%) | 2,426 (3.0%) |
| 85 Years and over | 1,175 (1.5%) | 2,534 (3.1%) |
| Total | 77,767 (100.0%) | 80,955 (100.0%) |
Families and Households in Sullivan County
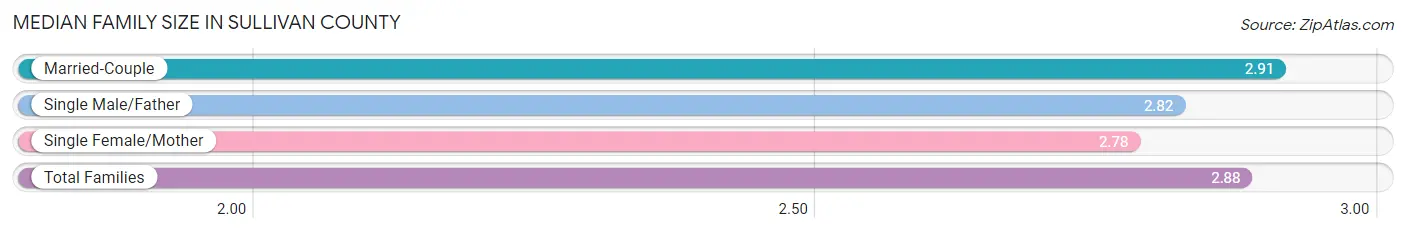
Median Family Size in Sullivan County
The median family size in Sullivan County is 2.88 persons per family, with married-couple families (31,473 | 73.2%) accounting for the largest median family size of 2.91 persons per family. On the other hand, single female/mother families (8,145 | 19.0%) represent the smallest median family size with 2.78 persons per family.
| Family Type | # Families | Family Size |
| Married-Couple | 31,473 (73.2%) | 2.91 |
| Single Male/Father | 3,357 (7.8%) | 2.82 |
| Single Female/Mother | 8,145 (19.0%) | 2.78 |
| Total Families | 42,975 (100.0%) | 2.88 |
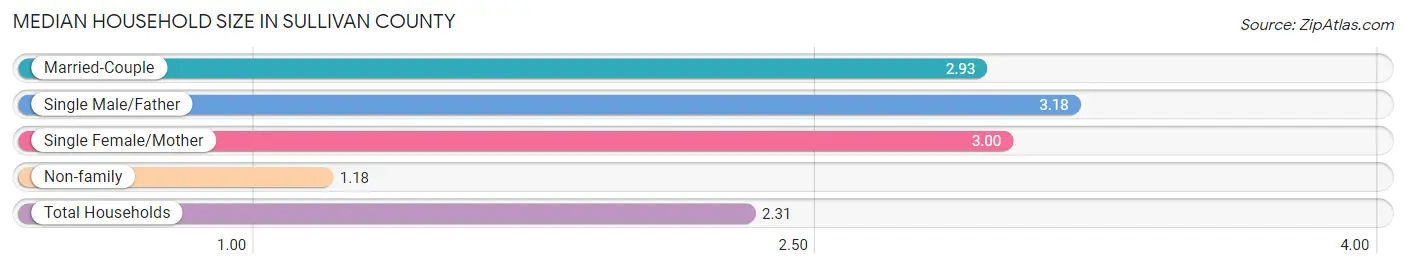
Median Household Size in Sullivan County
The median household size in Sullivan County is 2.31 persons per household, with single male/father households (3,357 | 5.0%) accounting for the largest median household size of 3.18 persons per household. non-family households (24,600 | 36.4%) represent the smallest median household size with 1.18 persons per household.
| Household Type | # Households | Household Size |
| Married-Couple | 31,473 (46.6%) | 2.93 |
| Single Male/Father | 3,357 (5.0%) | 3.18 |
| Single Female/Mother | 8,145 (12.0%) | 3.00 |
| Non-family | 24,600 (36.4%) | 1.18 |
| Total Households | 67,575 (100.0%) | 2.31 |
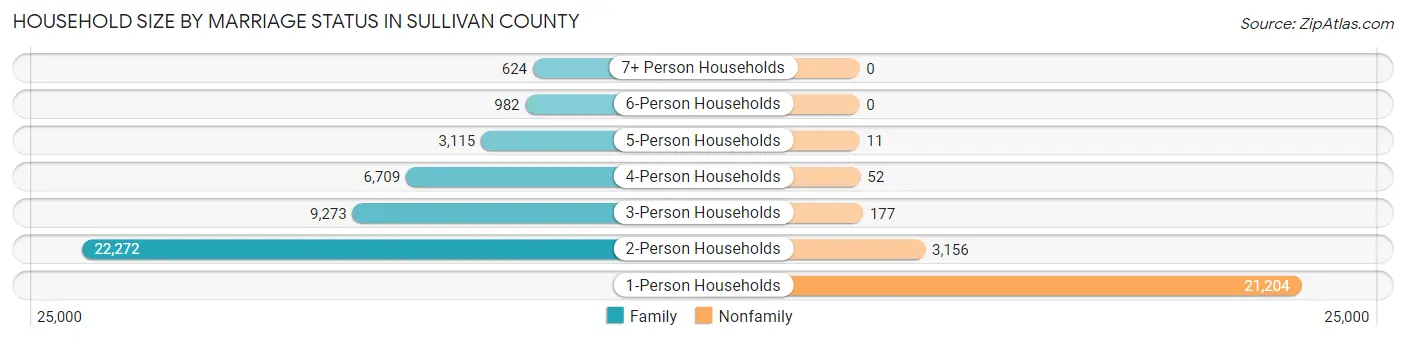
Household Size by Marriage Status in Sullivan County
Out of a total of 67,575 households in Sullivan County, 42,975 (63.6%) are family households, while 24,600 (36.4%) are nonfamily households. The most numerous type of family households are 2-person households, comprising 22,272, and the most common type of nonfamily households are 1-person households, comprising 21,204.
| Household Size | Family Households | Nonfamily Households |
| 1-Person Households | - | 21,204 (31.4%) |
| 2-Person Households | 22,272 (33.0%) | 3,156 (4.7%) |
| 3-Person Households | 9,273 (13.7%) | 177 (0.3%) |
| 4-Person Households | 6,709 (9.9%) | 52 (0.1%) |
| 5-Person Households | 3,115 (4.6%) | 11 (0.0%) |
| 6-Person Households | 982 (1.5%) | 0 (0.0%) |
| 7+ Person Households | 624 (0.9%) | 0 (0.0%) |
| Total | 42,975 (63.6%) | 24,600 (36.4%) |
Female Fertility in Sullivan County
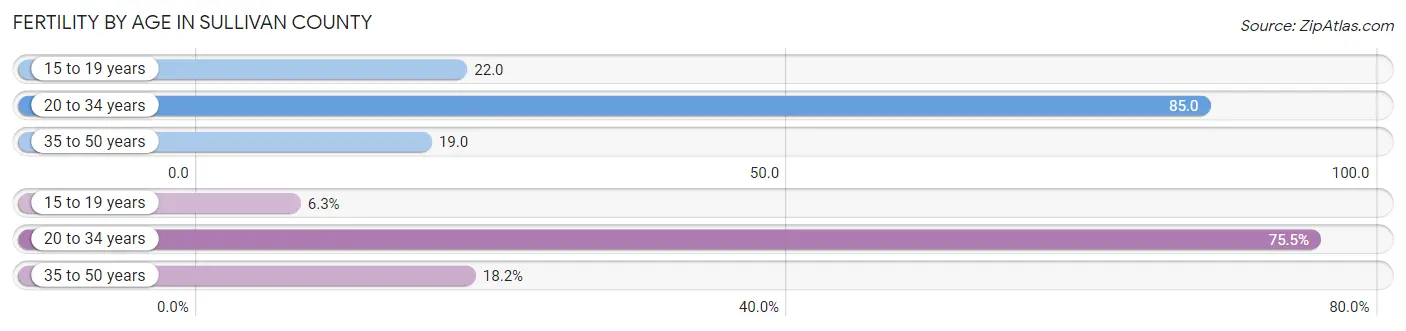
Fertility by Age in Sullivan County
Average fertility rate in Sullivan County is 47.0 births per 1,000 women. Women in the age bracket of 20 to 34 years have the highest fertility rate with 85.0 births per 1,000 women. Women in the age bracket of 20 to 34 years acount for 75.5% of all women with births.
| Age Bracket | Women with Births | Births / 1,000 Women |
| 15 to 19 years | 97 (6.3%) | 22.0 |
| 20 to 34 years | 1,163 (75.5%) | 85.0 |
| 35 to 50 years | 280 (18.2%) | 19.0 |
| Total | 1,540 (100.0%) | 47.0 |
Fertility by Age by Marriage Status in Sullivan County
61.5% of women with births (1,540) in Sullivan County are married. The highest percentage of unmarried women with births falls into 15 to 19 years age bracket with 76.3% of them unmarried at the time of birth, while the lowest percentage of unmarried women with births belong to 35 to 50 years age bracket with 33.6% of them unmarried.
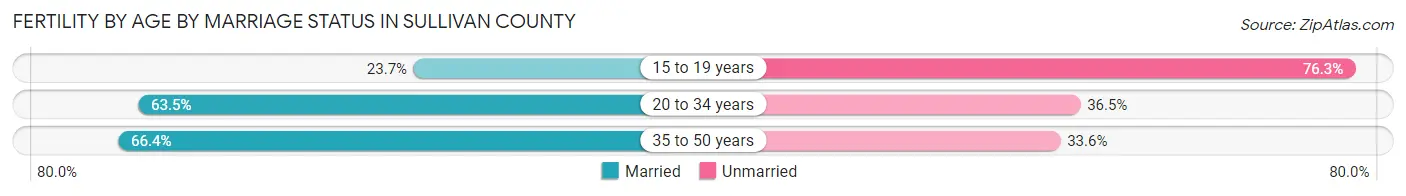
| Age Bracket | Married | Unmarried |
| 15 to 19 years | 23 (23.7%) | 74 (76.3%) |
| 20 to 34 years | 739 (63.5%) | 424 (36.5%) |
| 35 to 50 years | 186 (66.4%) | 94 (33.6%) |
| Total | 947 (61.5%) | 593 (38.5%) |
Fertility by Education in Sullivan County
Average fertility rate in Sullivan County is 47.0 births per 1,000 women. Women with the education attainment of bachelor's degree have the highest fertility rate of 61.0 births per 1,000 women, while women with the education attainment of less than high school have the lowest fertility at 25.0 births per 1,000 women. Women with the education attainment of high school diploma represent 31.2% of all women with births.
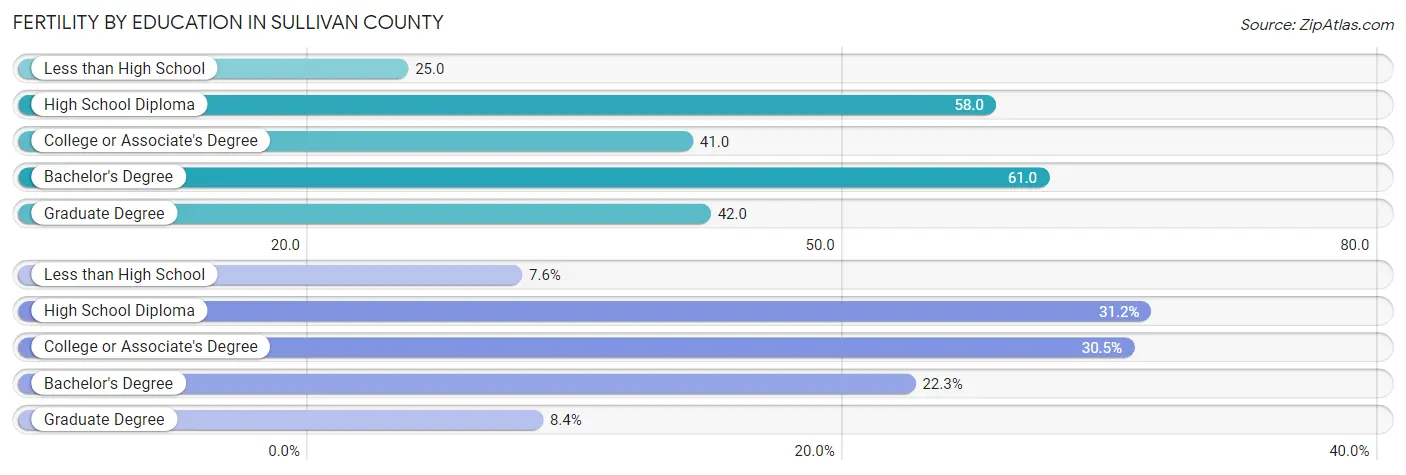
| Educational Attainment | Women with Births | Births / 1,000 Women |
| Less than High School | 117 (7.6%) | 25.0 |
| High School Diploma | 480 (31.2%) | 58.0 |
| College or Associate's Degree | 470 (30.5%) | 41.0 |
| Bachelor's Degree | 344 (22.3%) | 61.0 |
| Graduate Degree | 129 (8.4%) | 42.0 |
| Total | 1,540 (100.0%) | 47.0 |
Fertility by Education by Marriage Status in Sullivan County
38.5% of women with births in Sullivan County are unmarried. Women with the educational attainment of bachelor's degree are most likely to be married with 92.4% of them married at childbirth, while women with the educational attainment of high school diploma are least likely to be married with 70.4% of them unmarried at childbirth.
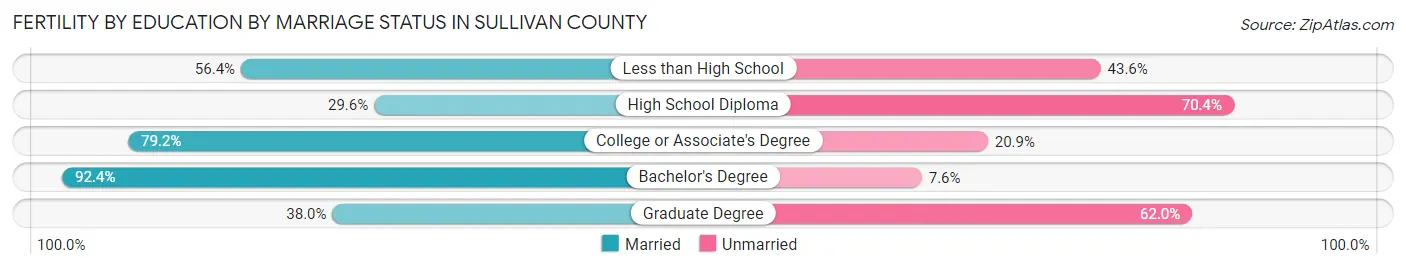
| Educational Attainment | Married | Unmarried |
| Less than High School | 66 (56.4%) | 51 (43.6%) |
| High School Diploma | 142 (29.6%) | 338 (70.4%) |
| College or Associate's Degree | 372 (79.1%) | 98 (20.8%) |
| Bachelor's Degree | 318 (92.4%) | 26 (7.6%) |
| Graduate Degree | 49 (38.0%) | 80 (62.0%) |
| Total | 947 (61.5%) | 593 (38.5%) |
Income in Sullivan County
Income Overview in Sullivan County
Per Capita Income in Sullivan County is $33,934, while median incomes of families and households are $71,464 and $54,357 respectively.
| Characteristic | Number | Measure |
| Per Capita Income | 158,722 | $33,934 |
| Median Family Income | 42,975 | $71,464 |
| Mean Family Income | 42,975 | $93,841 |
| Median Household Income | 67,575 | $54,357 |
| Mean Household Income | 67,575 | $77,959 |
| Income Deficit | 42,975 | $10,672 |
| Wage / Income Gap (%) | 158,722 | 29.09% |
| Wage / Income Gap ($) | 158,722 | 70.91¢ per $1 |
| Gini / Inequality Index | 158,722 | 0.48 |
Earnings by Sex in Sullivan County
Average Earnings in Sullivan County are $34,813, $41,306 for men and $29,290 for women, a difference of 29.1%.
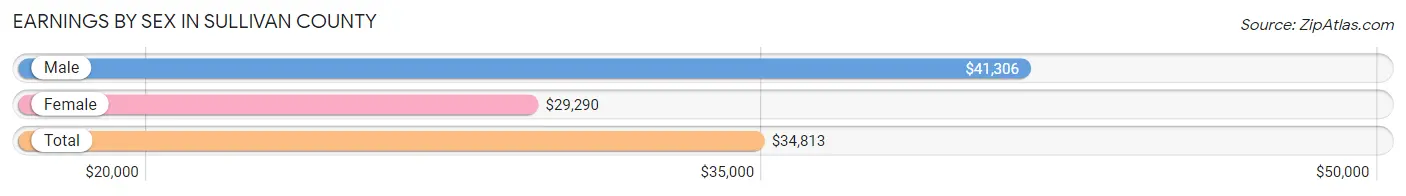
| Sex | Number | Average Earnings |
| Male | 40,741 (52.4%) | $41,306 |
| Female | 36,954 (47.6%) | $29,290 |
| Total | 77,695 (100.0%) | $34,813 |
Earnings by Sex by Income Bracket in Sullivan County
The most common earnings brackets in Sullivan County are $100,000+ for men (5,388 | 13.2%) and $25,000 to $29,999 for women (3,377 | 9.1%).
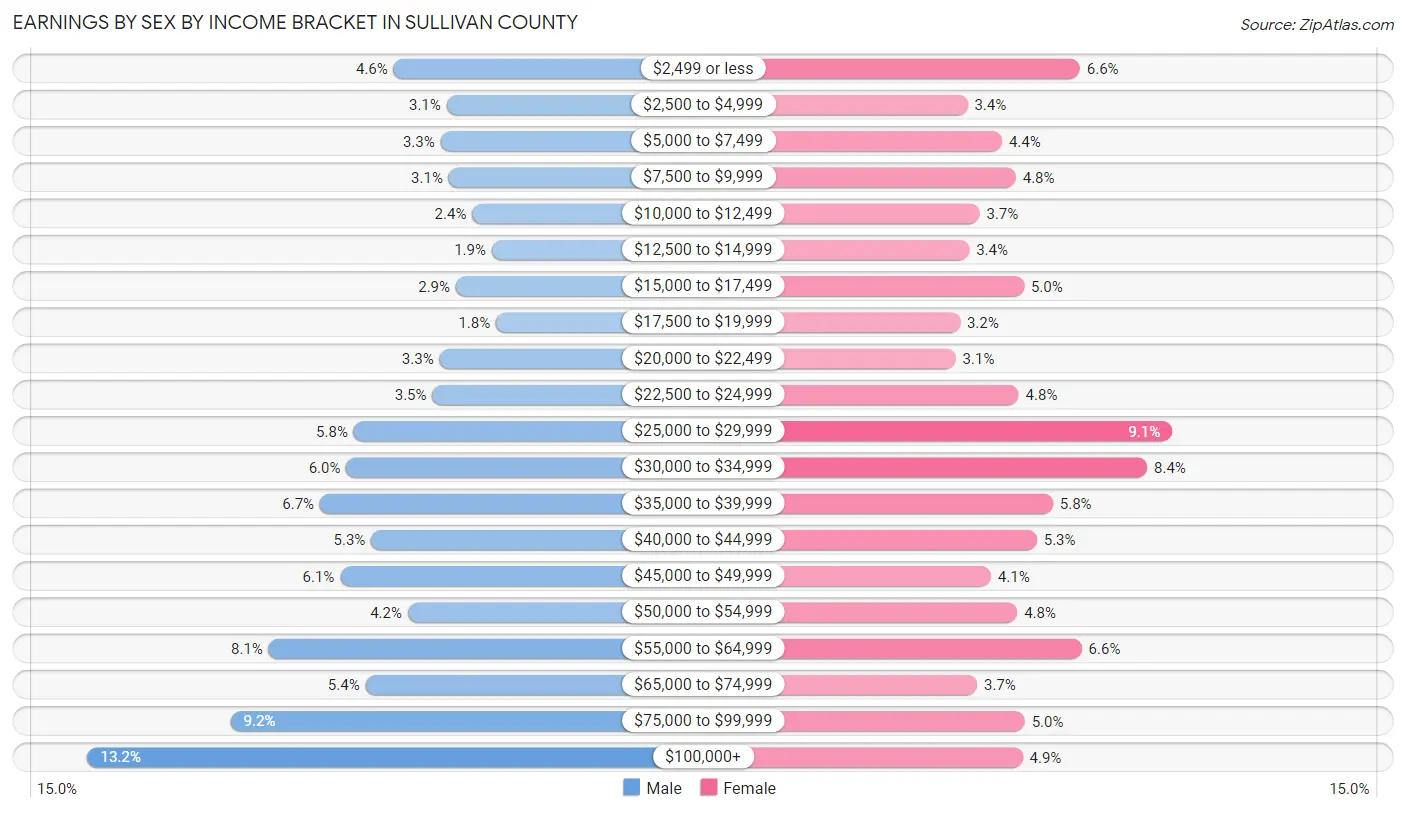
| Income | Male | Female |
| $2,499 or less | 1,887 (4.6%) | 2,420 (6.6%) |
| $2,500 to $4,999 | 1,281 (3.1%) | 1,253 (3.4%) |
| $5,000 to $7,499 | 1,347 (3.3%) | 1,610 (4.4%) |
| $7,500 to $9,999 | 1,256 (3.1%) | 1,754 (4.8%) |
| $10,000 to $12,499 | 984 (2.4%) | 1,377 (3.7%) |
| $12,500 to $14,999 | 761 (1.9%) | 1,272 (3.4%) |
| $15,000 to $17,499 | 1,174 (2.9%) | 1,840 (5.0%) |
| $17,500 to $19,999 | 713 (1.8%) | 1,174 (3.2%) |
| $20,000 to $22,499 | 1,360 (3.3%) | 1,131 (3.1%) |
| $22,500 to $24,999 | 1,443 (3.5%) | 1,785 (4.8%) |
| $25,000 to $29,999 | 2,344 (5.8%) | 3,377 (9.1%) |
| $30,000 to $34,999 | 2,430 (6.0%) | 3,118 (8.4%) |
| $35,000 to $39,999 | 2,728 (6.7%) | 2,138 (5.8%) |
| $40,000 to $44,999 | 2,145 (5.3%) | 1,974 (5.3%) |
| $45,000 to $49,999 | 2,498 (6.1%) | 1,496 (4.1%) |
| $50,000 to $54,999 | 1,724 (4.2%) | 1,770 (4.8%) |
| $55,000 to $64,999 | 3,315 (8.1%) | 2,440 (6.6%) |
| $65,000 to $74,999 | 2,209 (5.4%) | 1,352 (3.7%) |
| $75,000 to $99,999 | 3,754 (9.2%) | 1,849 (5.0%) |
| $100,000+ | 5,388 (13.2%) | 1,824 (4.9%) |
| Total | 40,741 (100.0%) | 36,954 (100.0%) |
Earnings by Sex by Educational Attainment in Sullivan County
Average earnings in Sullivan County are $46,525 for men and $32,935 for women, a difference of 29.2%. Men with an educational attainment of graduate degree enjoy the highest average annual earnings of $90,787, while those with less than high school education earn the least with $34,331. Women with an educational attainment of graduate degree earn the most with the average annual earnings of $57,820, while those with less than high school education have the smallest earnings of $23,657.
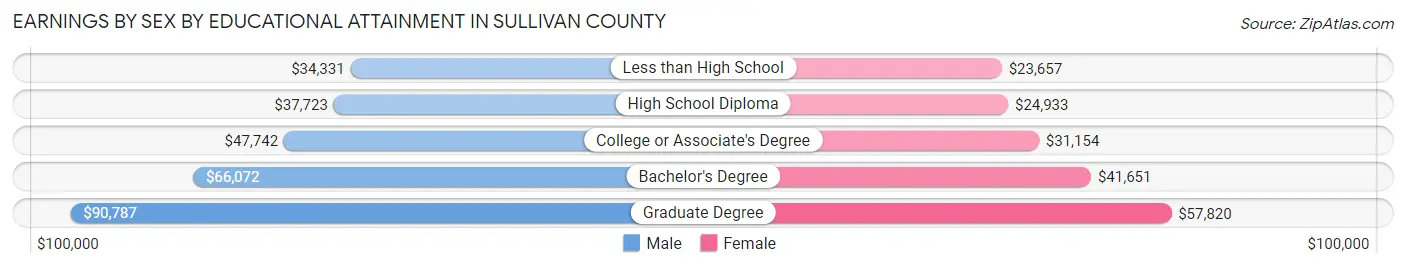
| Educational Attainment | Male Income | Female Income |
| Less than High School | $34,331 | $23,657 |
| High School Diploma | $37,723 | $24,933 |
| College or Associate's Degree | $47,742 | $31,154 |
| Bachelor's Degree | $66,072 | $41,651 |
| Graduate Degree | $90,787 | $57,820 |
| Total | $46,525 | $32,935 |
Family Income in Sullivan County
Family Income Brackets in Sullivan County
According to the Sullivan County family income data, there are 8,036 families falling into the $100,000 to $149,999 income range, which is the most common income bracket and makes up 18.7% of all families. Conversely, the $10,000 to $14,999 income bracket is the least frequent group with only 1,160 families (2.7%) belonging to this category.
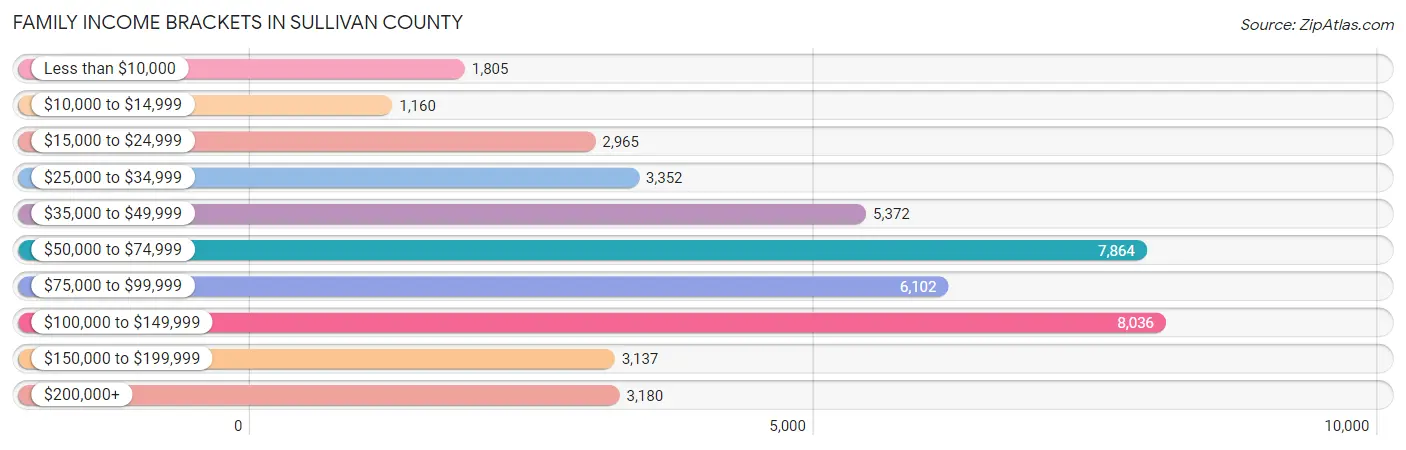
| Income Bracket | # Families | % Families |
| Less than $10,000 | 1,805 | 4.2% |
| $10,000 to $14,999 | 1,160 | 2.7% |
| $15,000 to $24,999 | 2,965 | 6.9% |
| $25,000 to $34,999 | 3,352 | 7.8% |
| $35,000 to $49,999 | 5,372 | 12.5% |
| $50,000 to $74,999 | 7,864 | 18.3% |
| $75,000 to $99,999 | 6,102 | 14.2% |
| $100,000 to $149,999 | 8,036 | 18.7% |
| $150,000 to $199,999 | 3,137 | 7.3% |
| $200,000+ | 3,180 | 7.4% |
Family Income by Famaliy Size in Sullivan County
6-person families (906 | 2.1%) account for the highest median family income in Sullivan County with $95,000 per family, while 2-person families (23,388 | 54.4%) have the highest median income of $31,312 per family member.
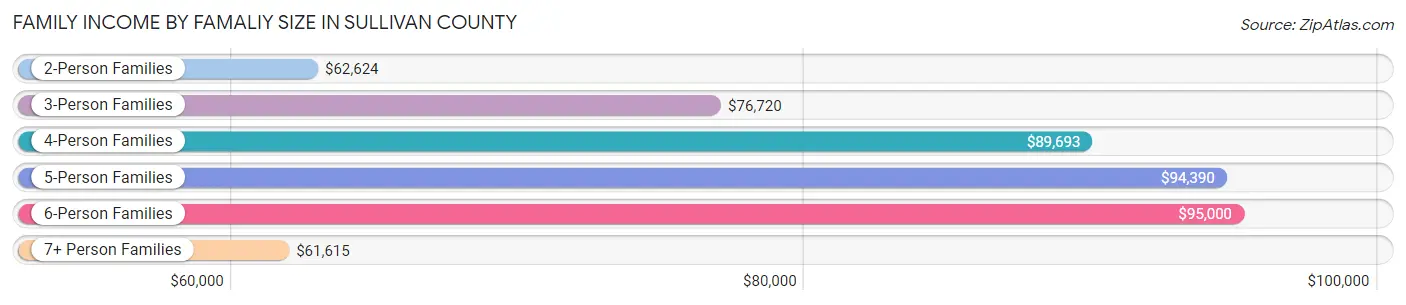
| Income Bracket | # Families | Median Income |
| 2-Person Families | 23,388 (54.4%) | $62,624 |
| 3-Person Families | 8,938 (20.8%) | $76,720 |
| 4-Person Families | 6,586 (15.3%) | $89,693 |
| 5-Person Families | 2,830 (6.6%) | $94,390 |
| 6-Person Families | 906 (2.1%) | $95,000 |
| 7+ Person Families | 327 (0.8%) | $61,615 |
| Total | 42,975 (100.0%) | $71,464 |
Family Income by Number of Earners in Sullivan County
The median family income in Sullivan County is $71,464, with families comprising 3+ earners (3,708) having the highest median family income of $132,650, while families with no earners (9,669) have the lowest median family income of $39,229, accounting for 8.6% and 22.5% of families, respectively.
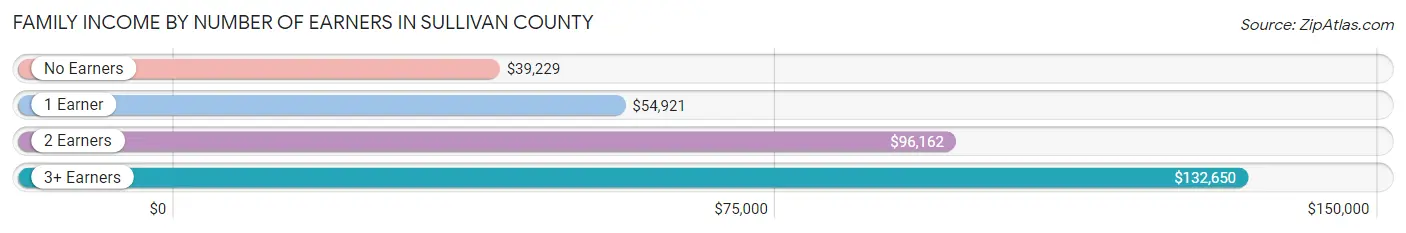
| Number of Earners | # Families | Median Income |
| No Earners | 9,669 (22.5%) | $39,229 |
| 1 Earner | 13,966 (32.5%) | $54,921 |
| 2 Earners | 15,632 (36.4%) | $96,162 |
| 3+ Earners | 3,708 (8.6%) | $132,650 |
| Total | 42,975 (100.0%) | $71,464 |
Household Income in Sullivan County
Household Income Brackets in Sullivan County
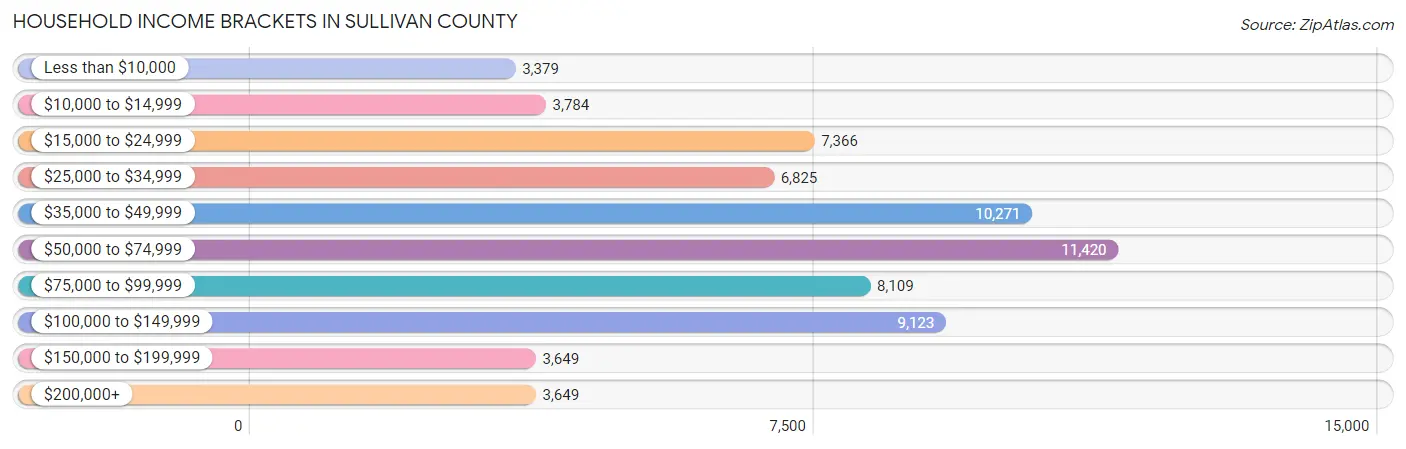
With 11,420 households falling in the category, the $50,000 to $74,999 income range is the most frequent in Sullivan County, accounting for 16.9% of all households. In contrast, only 3,379 households (5.0%) fall into the less than $10,000 income bracket, making it the least populous group.
| Income Bracket | # Households | % Households |
| Less than $10,000 | 3,379 | 5.0% |
| $10,000 to $14,999 | 3,784 | 5.6% |
| $15,000 to $24,999 | 7,366 | 10.9% |
| $25,000 to $34,999 | 6,825 | 10.1% |
| $35,000 to $49,999 | 10,271 | 15.2% |
| $50,000 to $74,999 | 11,420 | 16.9% |
| $75,000 to $99,999 | 8,109 | 12.0% |
| $100,000 to $149,999 | 9,123 | 13.5% |
| $150,000 to $199,999 | 3,649 | 5.4% |
| $200,000+ | 3,649 | 5.4% |
Household Income by Householder Age in Sullivan County
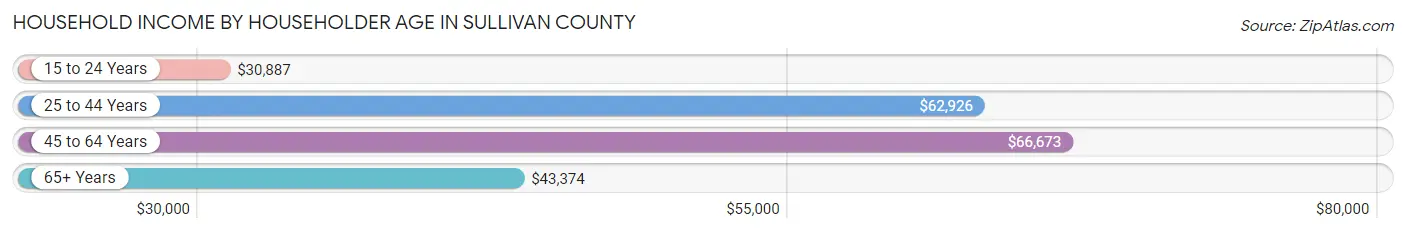
The median household income in Sullivan County is $54,357, with the highest median household income of $66,673 found in the 45 to 64 years age bracket for the primary householder. A total of 24,895 households (36.8%) fall into this category. Meanwhile, the 15 to 24 years age bracket for the primary householder has the lowest median household income of $30,887, with 2,258 households (3.3%) in this group.
| Income Bracket | # Households | Median Income |
| 15 to 24 Years | 2,258 (3.3%) | $30,887 |
| 25 to 44 Years | 17,556 (26.0%) | $62,926 |
| 45 to 64 Years | 24,895 (36.8%) | $66,673 |
| 65+ Years | 22,866 (33.8%) | $43,374 |
| Total | 67,575 (100.0%) | $54,357 |
Poverty in Sullivan County
Income Below Poverty by Sex and Age in Sullivan County
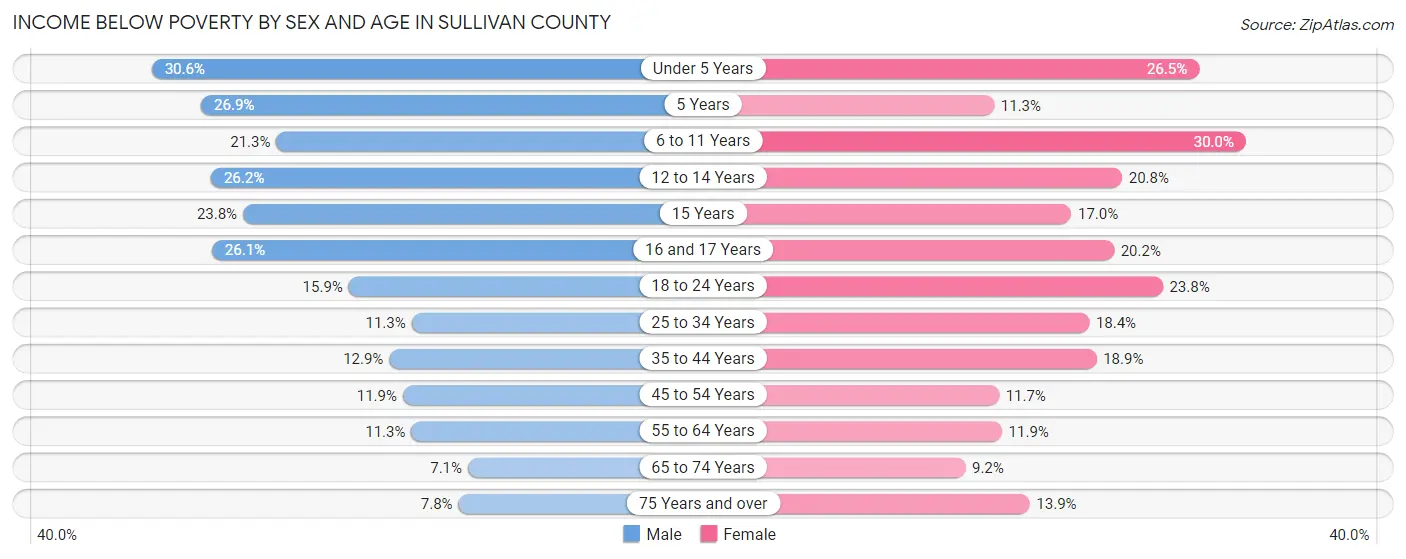
With 14.0% poverty level for males and 16.4% for females among the residents of Sullivan County, under 5 year old males and 6 to 11 year old females are the most vulnerable to poverty, with 1,157 males (30.6%) and 1,454 females (30.0%) in their respective age groups living below the poverty level.
| Age Bracket | Male | Female |
| Under 5 Years | 1,157 (30.6%) | 948 (26.5%) |
| 5 Years | 167 (26.9%) | 82 (11.3%) |
| 6 to 11 Years | 1,136 (21.3%) | 1,454 (30.0%) |
| 12 to 14 Years | 672 (26.2%) | 563 (20.8%) |
| 15 Years | 221 (23.8%) | 162 (17.0%) |
| 16 and 17 Years | 507 (26.1%) | 374 (20.2%) |
| 18 to 24 Years | 979 (15.9%) | 1,365 (23.8%) |
| 25 to 34 Years | 1,054 (11.3%) | 1,674 (18.3%) |
| 35 to 44 Years | 1,103 (12.9%) | 1,674 (18.9%) |
| 45 to 54 Years | 1,286 (11.9%) | 1,278 (11.7%) |
| 55 to 64 Years | 1,239 (11.3%) | 1,386 (11.9%) |
| 65 to 74 Years | 654 (7.1%) | 958 (9.1%) |
| 75 Years and over | 485 (7.8%) | 1,183 (13.9%) |
| Total | 10,660 (14.0%) | 13,101 (16.4%) |
Income Above Poverty by Sex and Age in Sullivan County
According to the poverty statistics in Sullivan County, males aged 65 to 74 years and females aged 65 to 74 years are the age groups that are most secure financially, with 92.9% of males and 90.8% of females in these age groups living above the poverty line.

| Age Bracket | Male | Female |
| Under 5 Years | 2,629 (69.4%) | 2,627 (73.5%) |
| 5 Years | 454 (73.1%) | 644 (88.7%) |
| 6 to 11 Years | 4,194 (78.7%) | 3,395 (70.0%) |
| 12 to 14 Years | 1,897 (73.8%) | 2,145 (79.2%) |
| 15 Years | 708 (76.2%) | 790 (83.0%) |
| 16 and 17 Years | 1,436 (73.9%) | 1,478 (79.8%) |
| 18 to 24 Years | 5,162 (84.1%) | 4,369 (76.2%) |
| 25 to 34 Years | 8,299 (88.7%) | 7,449 (81.7%) |
| 35 to 44 Years | 7,426 (87.1%) | 7,186 (81.1%) |
| 45 to 54 Years | 9,502 (88.1%) | 9,690 (88.3%) |
| 55 to 64 Years | 9,734 (88.7%) | 10,292 (88.1%) |
| 65 to 74 Years | 8,566 (92.9%) | 9,515 (90.8%) |
| 75 Years and over | 5,739 (92.2%) | 7,307 (86.1%) |
| Total | 65,746 (86.1%) | 66,887 (83.6%) |
Income Below Poverty Among Married-Couple Families in Sullivan County
The poverty statistics for married-couple families in Sullivan County show that 4.6% or 1,452 of the total 31,473 families live below the poverty line. Families with 5 or more children have the highest poverty rate of 57.1%, comprising of 89 families. On the other hand, families with no children have the lowest poverty rate of 3.9%, which includes 789 families.
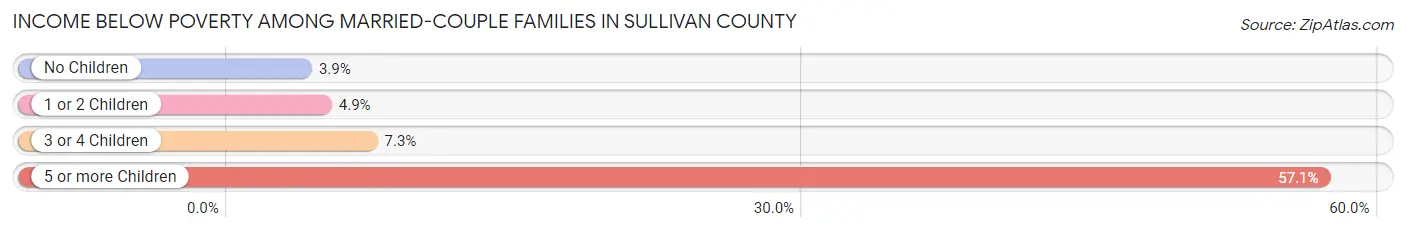
| Children | Above Poverty | Below Poverty |
| No Children | 19,637 (96.1%) | 789 (3.9%) |
| 1 or 2 Children | 8,766 (95.1%) | 452 (4.9%) |
| 3 or 4 Children | 1,551 (92.7%) | 122 (7.3%) |
| 5 or more Children | 67 (42.9%) | 89 (57.1%) |
| Total | 30,021 (95.4%) | 1,452 (4.6%) |
Income Below Poverty Among Single-Parent Households in Sullivan County
According to the poverty data in Sullivan County, 23.5% or 788 single-father households and 34.8% or 2,833 single-mother households are living below the poverty line. Among single-father households, those with 3 or 4 children have the highest poverty rate, with 96 households (46.6%) experiencing poverty. Likewise, among single-mother households, those with 5 or more children have the highest poverty rate, with 205 households (100.0%) falling below the poverty line.
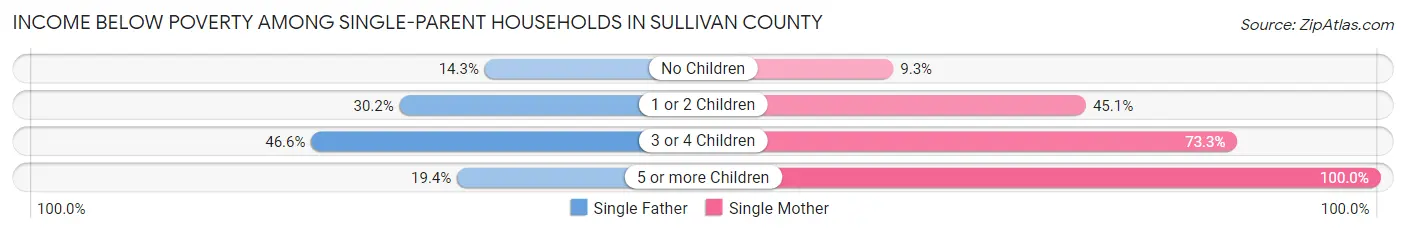
| Children | Single Father | Single Mother |
| No Children | 229 (14.3%) | 299 (9.2%) |
| 1 or 2 Children | 456 (30.2%) | 1,796 (45.1%) |
| 3 or 4 Children | 96 (46.6%) | 533 (73.3%) |
| 5 or more Children | 7 (19.4%) | 205 (100.0%) |
| Total | 788 (23.5%) | 2,833 (34.8%) |
Income Below Poverty Among Married-Couple vs Single-Parent Households in Sullivan County
The poverty data for Sullivan County shows that 1,452 of the married-couple family households (4.6%) and 3,621 of the single-parent households (31.5%) are living below the poverty level. Within the married-couple family households, those with 5 or more children have the highest poverty rate, with 89 households (57.1%) falling below the poverty line. Among the single-parent households, those with 5 or more children have the highest poverty rate, with 212 household (88.0%) living below poverty.
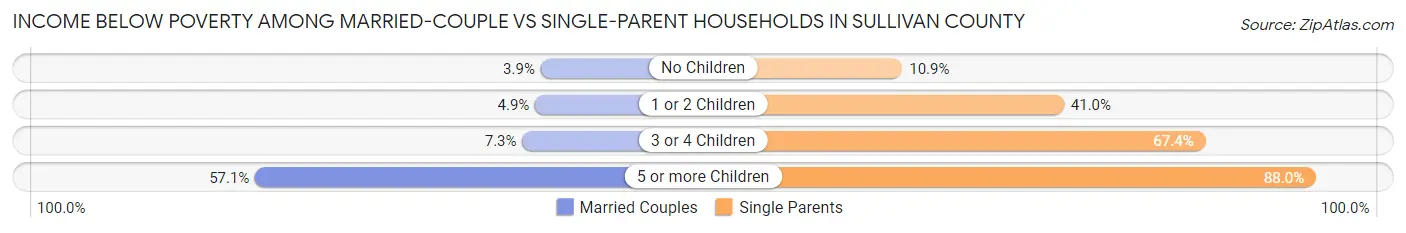
| Children | Married-Couple Families | Single-Parent Households |
| No Children | 789 (3.9%) | 528 (10.9%) |
| 1 or 2 Children | 452 (4.9%) | 2,252 (41.0%) |
| 3 or 4 Children | 122 (7.3%) | 629 (67.4%) |
| 5 or more Children | 89 (57.1%) | 212 (88.0%) |
| Total | 1,452 (4.6%) | 3,621 (31.5%) |
Employment Characteristics in Sullivan County
Employment by Class of Employer in Sullivan County
Among the 67,689 employed individuals in Sullivan County, private company employees (48,273 | 71.3%), not-for-profit organizations (5,240 | 7.7%), and self-employed (not incorporated) (4,528 | 6.7%) make up the most common classes of employment.
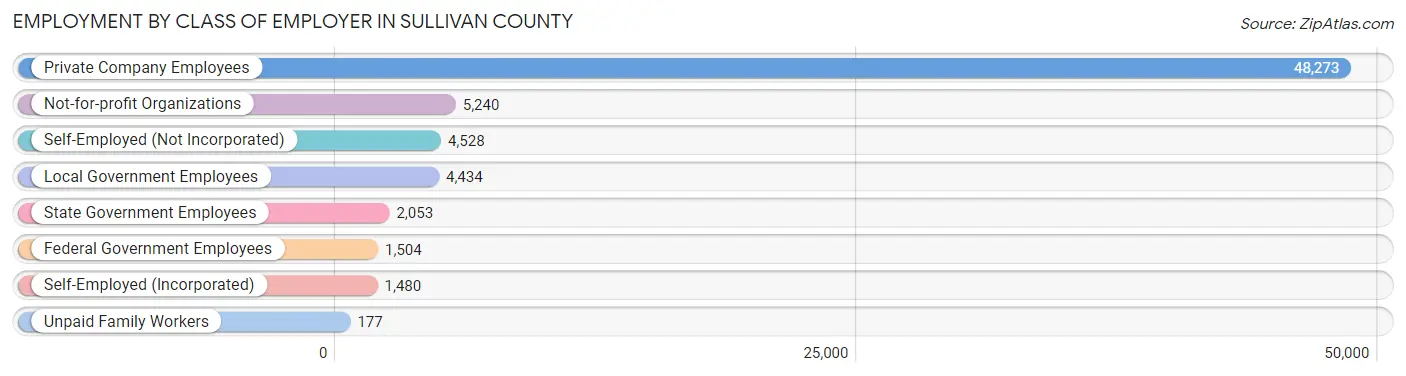
| Employer Class | # Employees | % Employees |
| Private Company Employees | 48,273 | 71.3% |
| Self-Employed (Incorporated) | 1,480 | 2.2% |
| Self-Employed (Not Incorporated) | 4,528 | 6.7% |
| Not-for-profit Organizations | 5,240 | 7.7% |
| Local Government Employees | 4,434 | 6.6% |
| State Government Employees | 2,053 | 3.0% |
| Federal Government Employees | 1,504 | 2.2% |
| Unpaid Family Workers | 177 | 0.3% |
| Total | 67,689 | 100.0% |
Employment Status by Age in Sullivan County
According to the labor force statistics for Sullivan County, out of the total population over 16 years of age (132,231), 55.9% or 73,917 individuals are in the labor force, with 6.2% or 4,583 of them unemployed. The age group with the highest labor force participation rate is 30 to 34 years, with 83.6% or 7,547 individuals in the labor force. Within the labor force, the 16 to 19 years age range has the highest percentage of unemployed individuals, with 21.0% or 718 of them being unemployed.
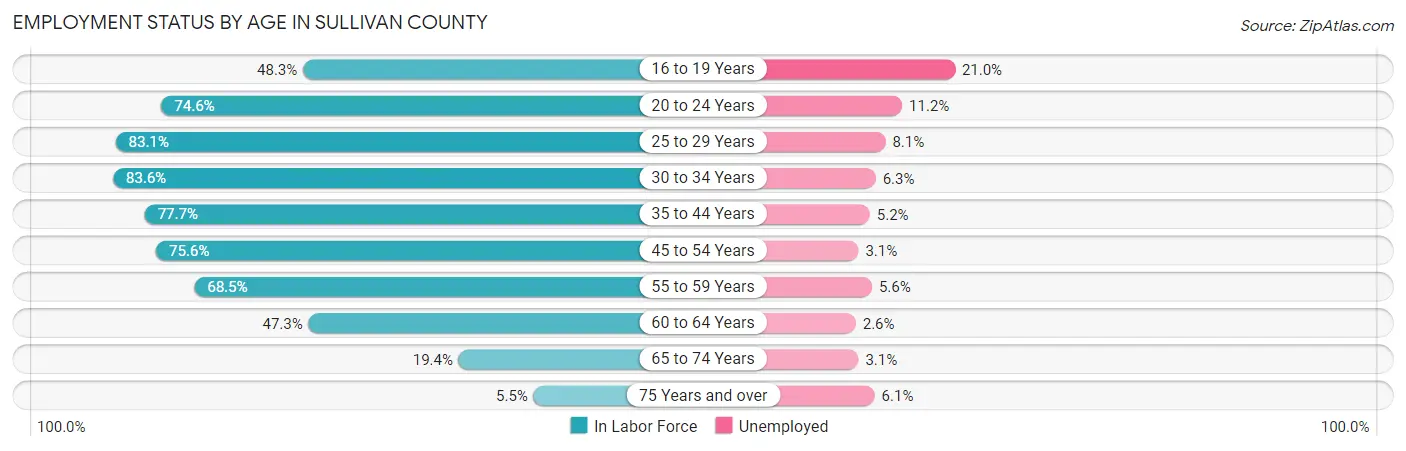
| Age Bracket | In Labor Force | Unemployed |
| 16 to 19 Years | 3,417 (48.3%) | 718 (21.0%) |
| 20 to 24 Years | 6,748 (74.6%) | 756 (11.2%) |
| 25 to 29 Years | 8,029 (83.1%) | 650 (8.1%) |
| 30 to 34 Years | 7,547 (83.6%) | 475 (6.3%) |
| 35 to 44 Years | 13,771 (77.7%) | 716 (5.2%) |
| 45 to 54 Years | 16,622 (75.6%) | 515 (3.1%) |
| 55 to 59 Years | 7,677 (68.5%) | 430 (5.6%) |
| 60 to 64 Years | 5,496 (47.3%) | 143 (2.6%) |
| 65 to 74 Years | 3,838 (19.4%) | 119 (3.1%) |
| 75 Years and over | 830 (5.5%) | 51 (6.1%) |
| Total | 73,917 (55.9%) | 4,583 (6.2%) |
Employment Status by Educational Attainment in Sullivan County
According to labor force statistics for Sullivan County, 72.8% of individuals (59,133) out of the total population between 25 and 64 years of age (81,227) are in the labor force, with 5.0% or 2,957 of them being unemployed. The group with the highest labor force participation rate are those with the educational attainment of bachelor's degree or higher, with 83.6% or 18,410 individuals in the labor force. Within the labor force, individuals with less than high school education have the highest percentage of unemployment, with 13.2% or 460 of them being unemployed.
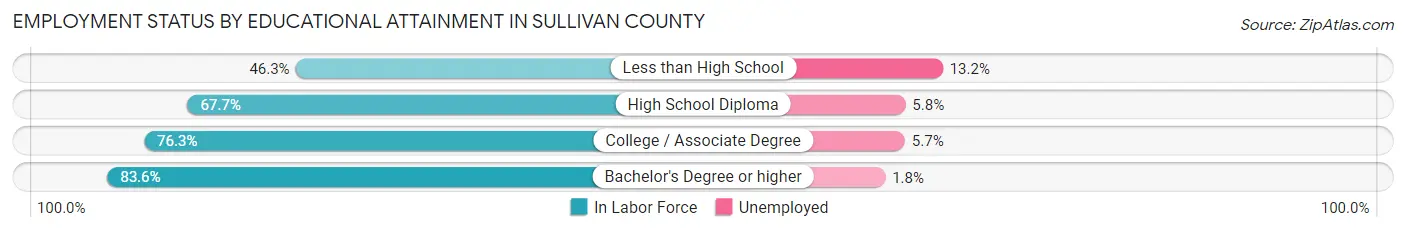
| Educational Attainment | In Labor Force | Unemployed |
| Less than High School | 3,485 (46.3%) | 994 (13.2%) |
| High School Diploma | 17,250 (67.7%) | 1,478 (5.8%) |
| College / Associate Degree | 19,988 (76.3%) | 1,493 (5.7%) |
| Bachelor's Degree or higher | 18,410 (83.6%) | 396 (1.8%) |
| Total | 59,133 (72.8%) | 4,061 (5.0%) |
Employment Occupations by Sex in Sullivan County
Management, Business, Science and Arts Occupations
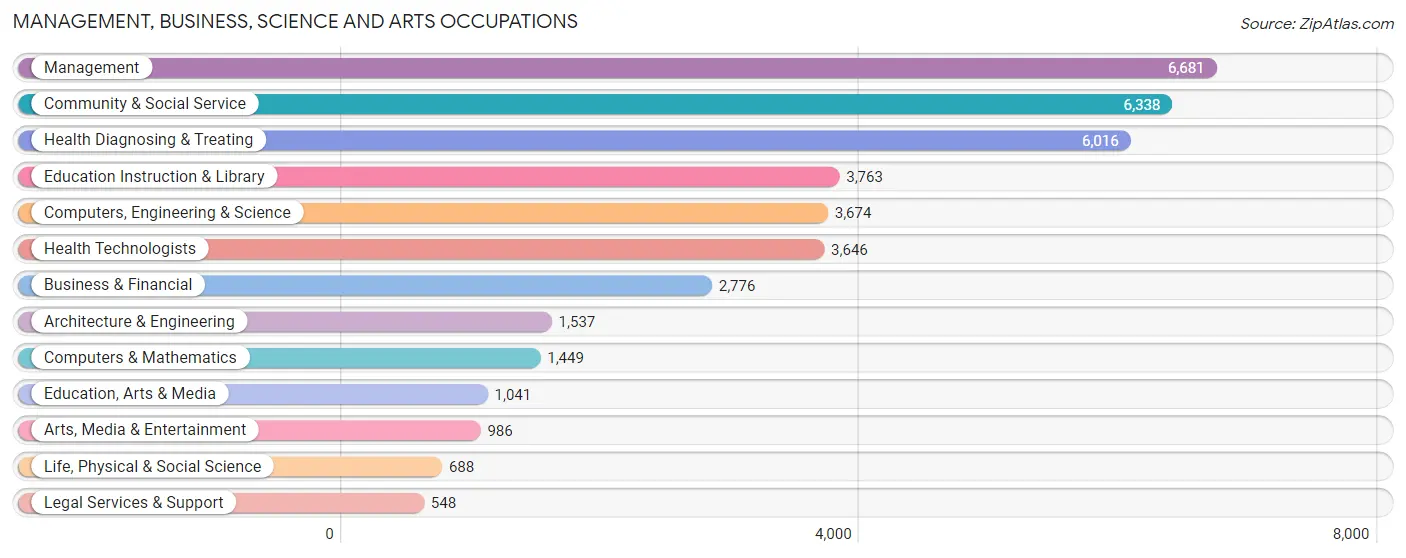
The most common Management, Business, Science and Arts occupations in Sullivan County are Management (6,681 | 9.7%), Community & Social Service (6,338 | 9.2%), Health Diagnosing & Treating (6,016 | 8.7%), Education Instruction & Library (3,763 | 5.4%), and Computers, Engineering & Science (3,674 | 5.3%).
Management, Business, Science and Arts Occupations by Sex
Within the Management, Business, Science and Arts occupations in Sullivan County, the most male-oriented occupations are Architecture & Engineering (85.3%), Computers, Engineering & Science (77.5%), and Life, Physical & Social Science (74.7%), while the most female-oriented occupations are Education Instruction & Library (79.3%), Health Diagnosing & Treating (76.0%), and Health Technologists (72.8%).
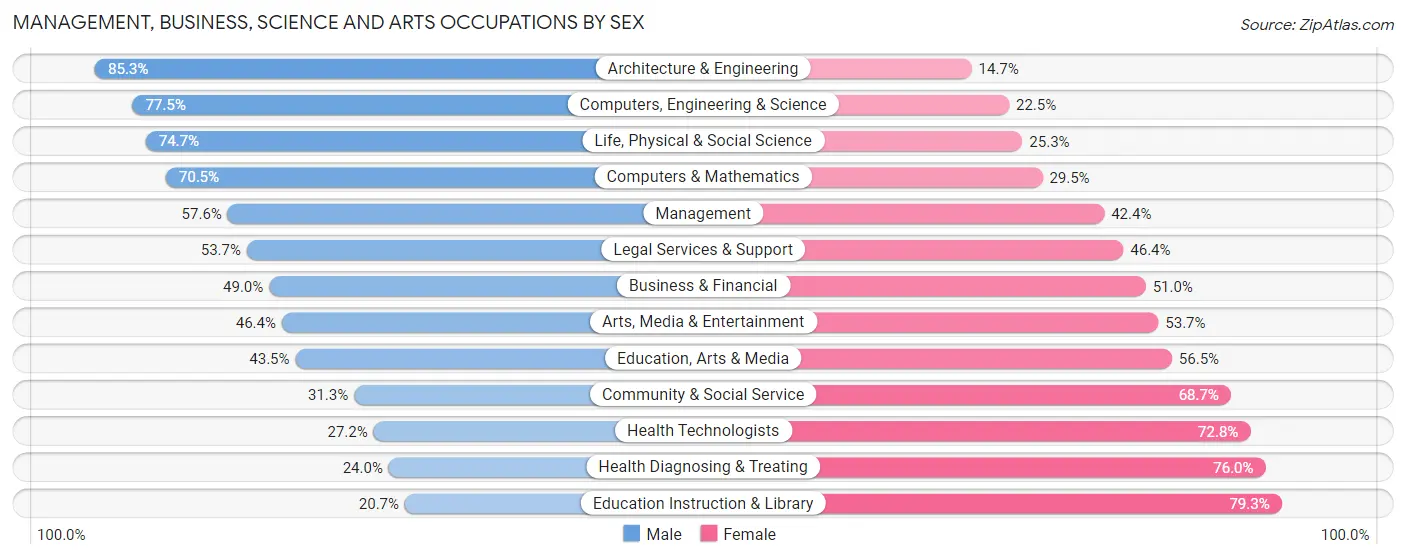
| Occupation | Male | Female |
| Management | 3,851 (57.6%) | 2,830 (42.4%) |
| Business & Financial | 1,360 (49.0%) | 1,416 (51.0%) |
| Computers, Engineering & Science | 2,847 (77.5%) | 827 (22.5%) |
| Computers & Mathematics | 1,022 (70.5%) | 427 (29.5%) |
| Architecture & Engineering | 1,311 (85.3%) | 226 (14.7%) |
| Life, Physical & Social Science | 514 (74.7%) | 174 (25.3%) |
| Community & Social Service | 1,982 (31.3%) | 4,356 (68.7%) |
| Education, Arts & Media | 453 (43.5%) | 588 (56.5%) |
| Legal Services & Support | 294 (53.6%) | 254 (46.4%) |
| Education Instruction & Library | 778 (20.7%) | 2,985 (79.3%) |
| Arts, Media & Entertainment | 457 (46.4%) | 529 (53.6%) |
| Health Diagnosing & Treating | 1,446 (24.0%) | 4,570 (76.0%) |
| Health Technologists | 992 (27.2%) | 2,654 (72.8%) |
| Total (Category) | 11,486 (45.1%) | 13,999 (54.9%) |
| Total (Overall) | 36,548 (52.8%) | 32,658 (47.2%) |
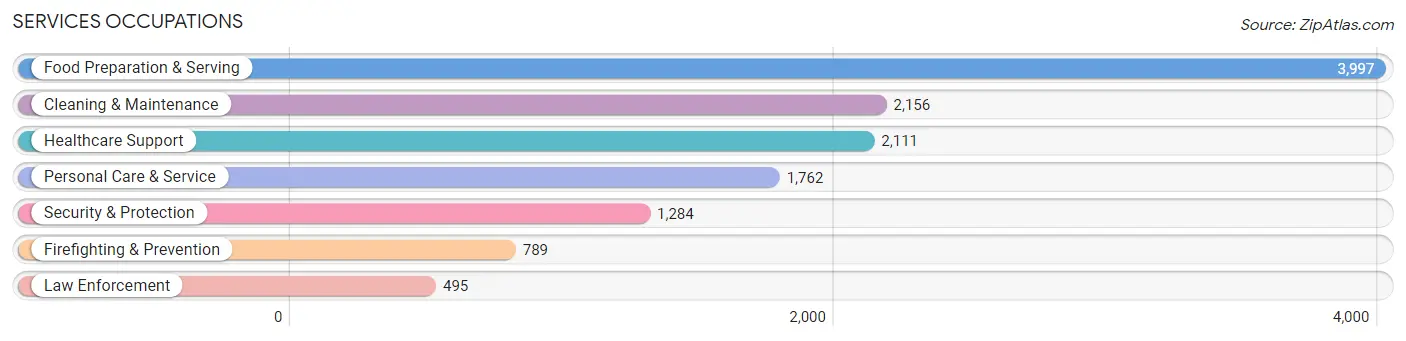
Services Occupations
The most common Services occupations in Sullivan County are Food Preparation & Serving (3,997 | 5.8%), Cleaning & Maintenance (2,156 | 3.1%), Healthcare Support (2,111 | 3.0%), Personal Care & Service (1,762 | 2.5%), and Security & Protection (1,284 | 1.9%).
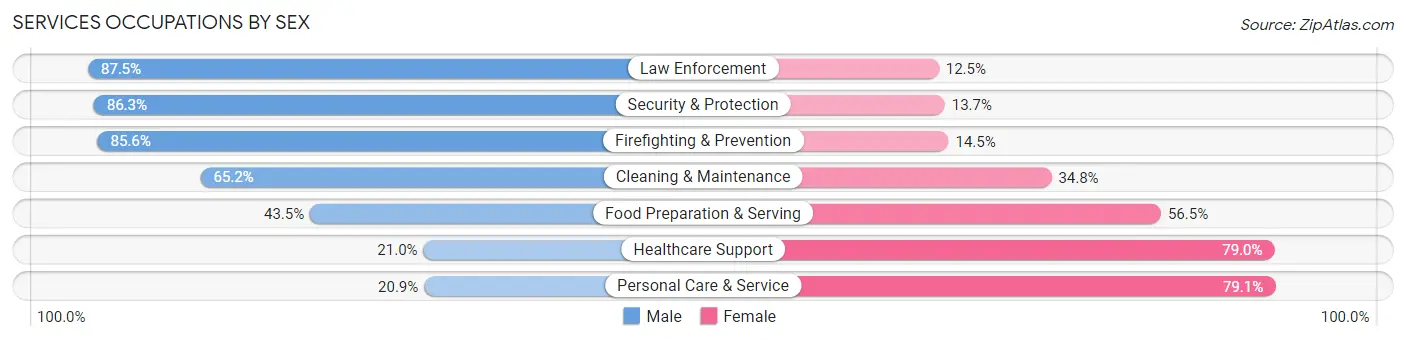
Services Occupations by Sex
Within the Services occupations in Sullivan County, the most male-oriented occupations are Law Enforcement (87.5%), Security & Protection (86.3%), and Firefighting & Prevention (85.6%), while the most female-oriented occupations are Personal Care & Service (79.1%), Healthcare Support (79.0%), and Food Preparation & Serving (56.5%).
| Occupation | Male | Female |
| Healthcare Support | 444 (21.0%) | 1,667 (79.0%) |
| Security & Protection | 1,108 (86.3%) | 176 (13.7%) |
| Firefighting & Prevention | 675 (85.6%) | 114 (14.4%) |
| Law Enforcement | 433 (87.5%) | 62 (12.5%) |
| Food Preparation & Serving | 1,738 (43.5%) | 2,259 (56.5%) |
| Cleaning & Maintenance | 1,405 (65.2%) | 751 (34.8%) |
| Personal Care & Service | 368 (20.9%) | 1,394 (79.1%) |
| Total (Category) | 5,063 (44.8%) | 6,247 (55.2%) |
| Total (Overall) | 36,548 (52.8%) | 32,658 (47.2%) |
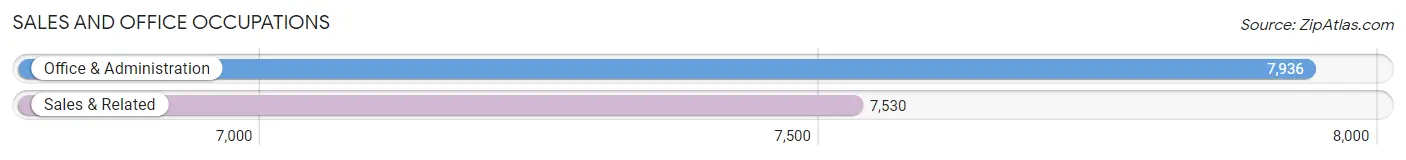
Sales and Office Occupations
The most common Sales and Office occupations in Sullivan County are Office & Administration (7,936 | 11.5%), and Sales & Related (7,530 | 10.9%).
Sales and Office Occupations by Sex
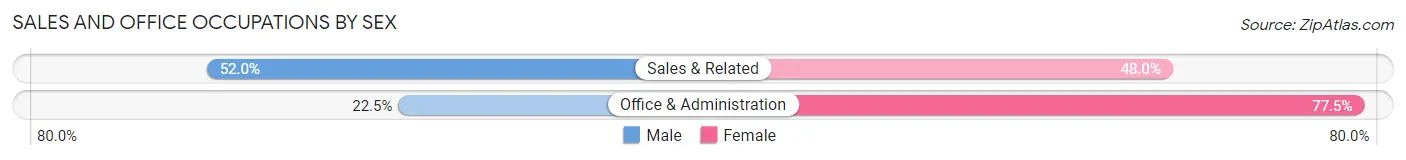
| Occupation | Male | Female |
| Sales & Related | 3,914 (52.0%) | 3,616 (48.0%) |
| Office & Administration | 1,786 (22.5%) | 6,150 (77.5%) |
| Total (Category) | 5,700 (36.9%) | 9,766 (63.1%) |
| Total (Overall) | 36,548 (52.8%) | 32,658 (47.2%) |
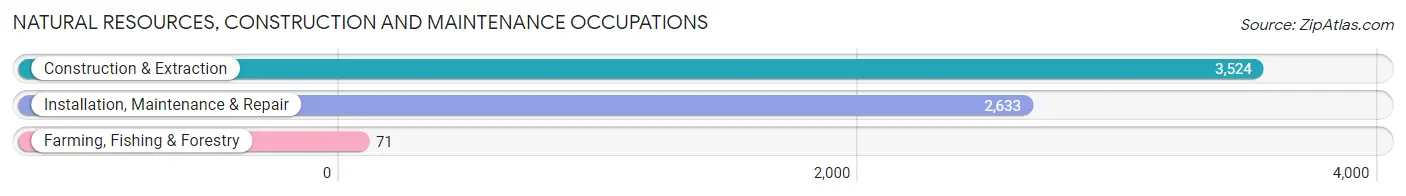
Natural Resources, Construction and Maintenance Occupations
The most common Natural Resources, Construction and Maintenance occupations in Sullivan County are Construction & Extraction (3,524 | 5.1%), Installation, Maintenance & Repair (2,633 | 3.8%), and Farming, Fishing & Forestry (71 | 0.1%).
Natural Resources, Construction and Maintenance Occupations by Sex
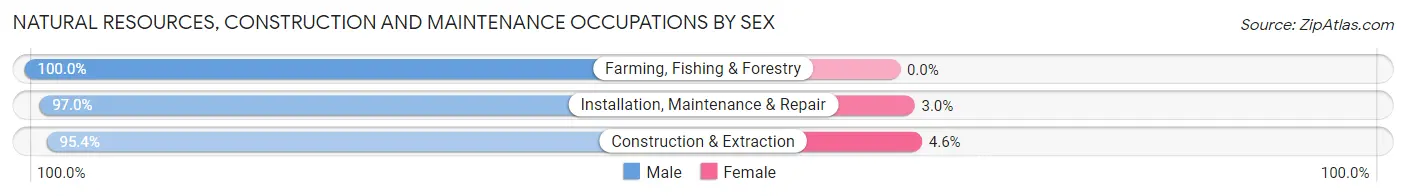
| Occupation | Male | Female |
| Farming, Fishing & Forestry | 71 (100.0%) | 0 (0.0%) |
| Construction & Extraction | 3,363 (95.4%) | 161 (4.6%) |
| Installation, Maintenance & Repair | 2,553 (97.0%) | 80 (3.0%) |
| Total (Category) | 5,987 (96.1%) | 241 (3.9%) |
| Total (Overall) | 36,548 (52.8%) | 32,658 (47.2%) |
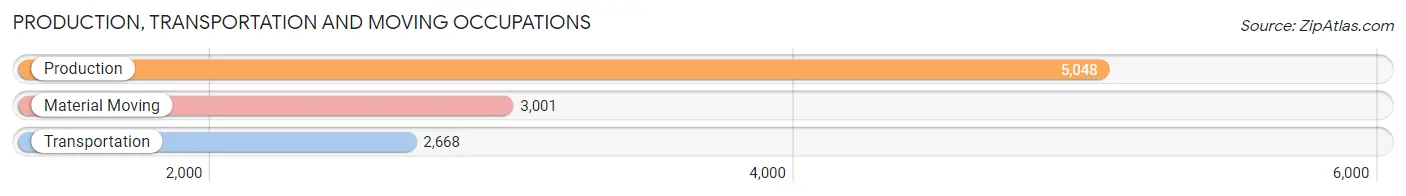
Production, Transportation and Moving Occupations
The most common Production, Transportation and Moving occupations in Sullivan County are Production (5,048 | 7.3%), Material Moving (3,001 | 4.3%), and Transportation (2,668 | 3.9%).
Production, Transportation and Moving Occupations by Sex
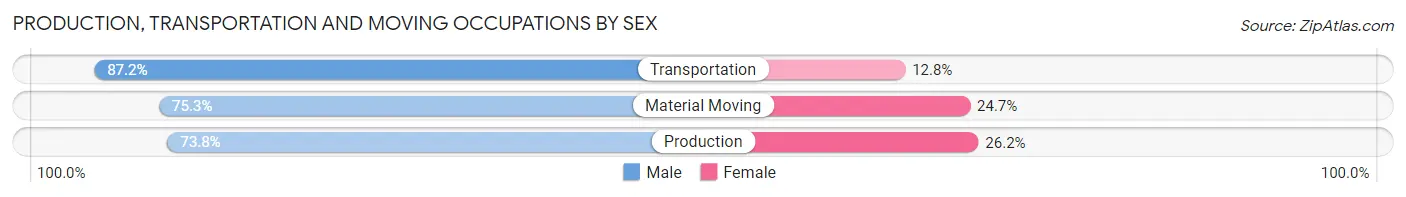
| Occupation | Male | Female |
| Production | 3,725 (73.8%) | 1,323 (26.2%) |
| Transportation | 2,327 (87.2%) | 341 (12.8%) |
| Material Moving | 2,260 (75.3%) | 741 (24.7%) |
| Total (Category) | 8,312 (77.6%) | 2,405 (22.4%) |
| Total (Overall) | 36,548 (52.8%) | 32,658 (47.2%) |
Employment Industries by Sex in Sullivan County
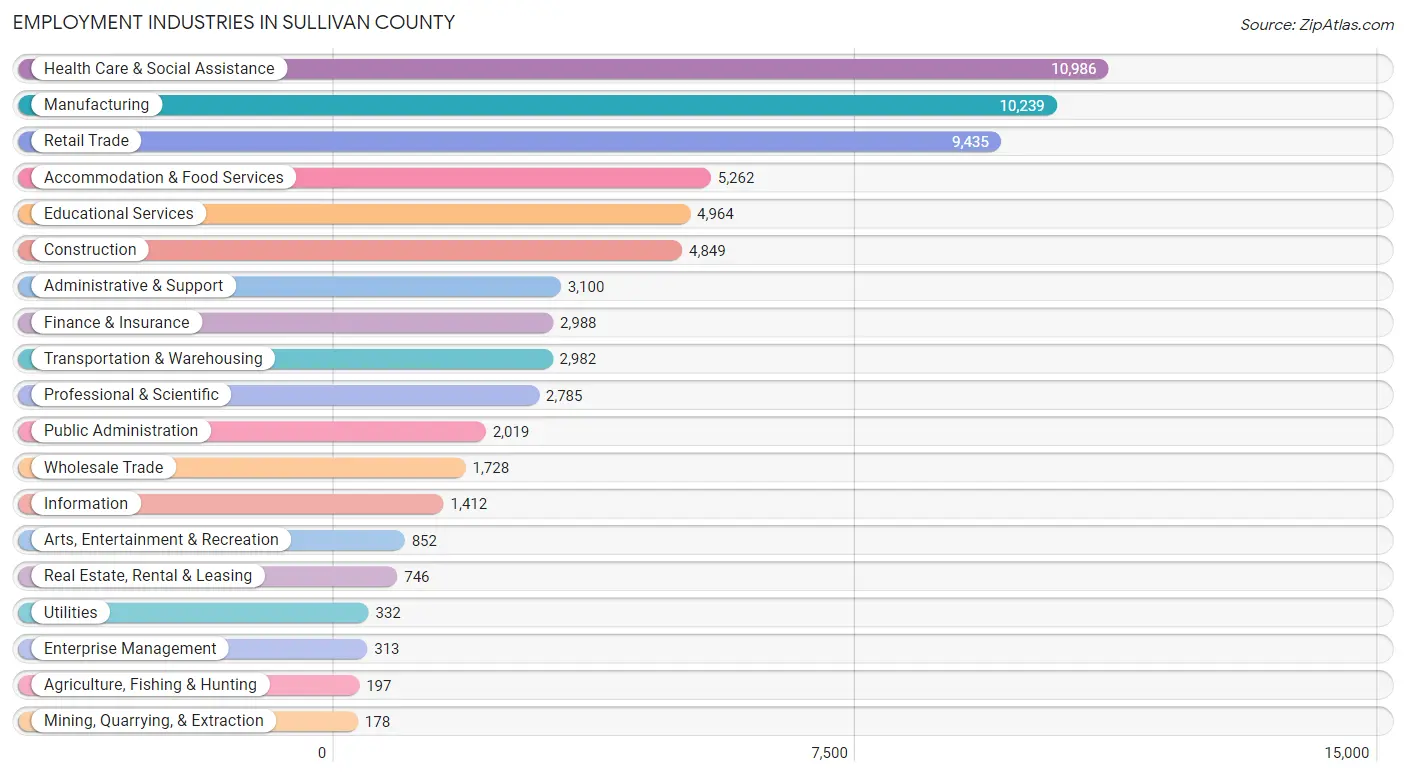
Employment Industries in Sullivan County
The major employment industries in Sullivan County include Health Care & Social Assistance (10,986 | 15.9%), Manufacturing (10,239 | 14.8%), Retail Trade (9,435 | 13.6%), Accommodation & Food Services (5,262 | 7.6%), and Educational Services (4,964 | 7.2%).
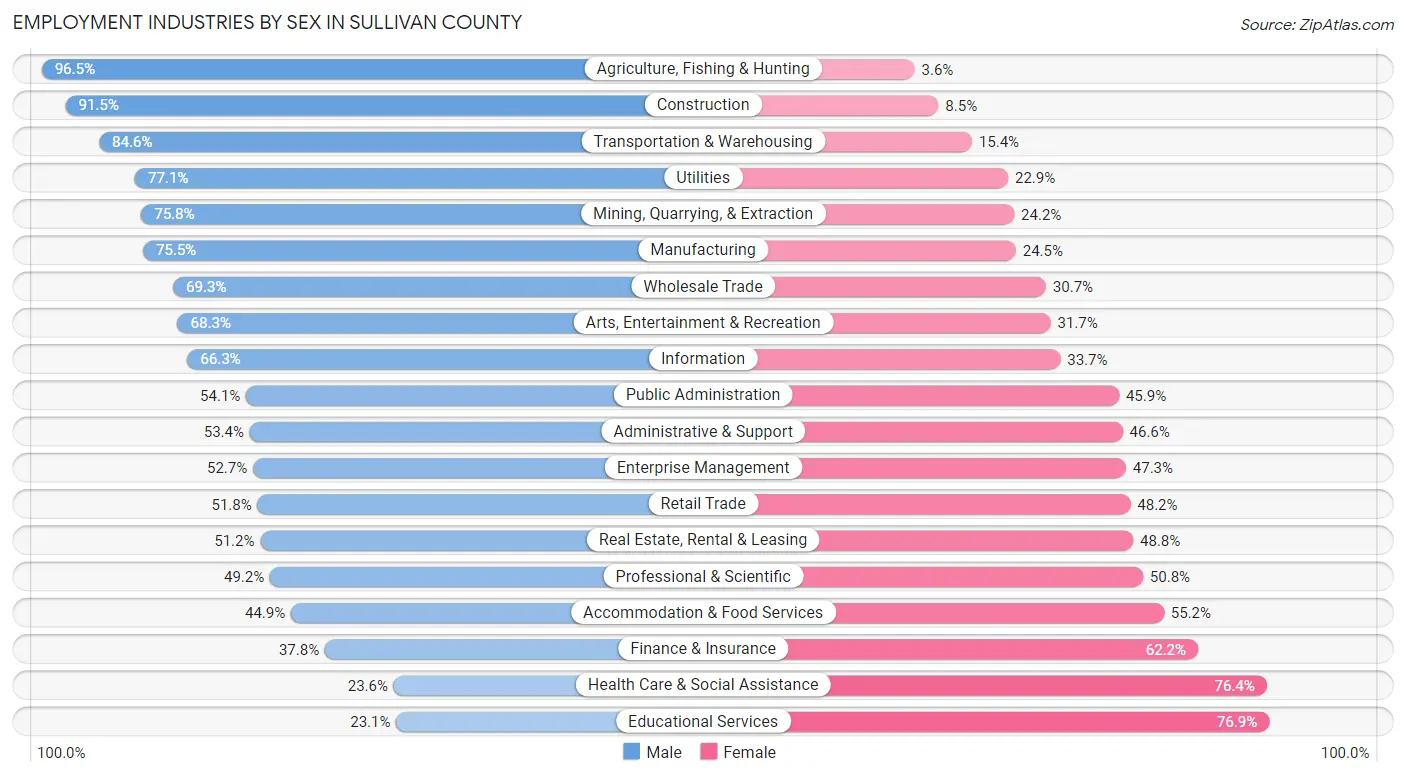
Employment Industries by Sex in Sullivan County
The Sullivan County industries that see more men than women are Agriculture, Fishing & Hunting (96.5%), Construction (91.5%), and Transportation & Warehousing (84.6%), whereas the industries that tend to have a higher number of women are Educational Services (76.9%), Health Care & Social Assistance (76.4%), and Finance & Insurance (62.2%).
| Industry | Male | Female |
| Agriculture, Fishing & Hunting | 190 (96.5%) | 7 (3.5%) |
| Mining, Quarrying, & Extraction | 135 (75.8%) | 43 (24.2%) |
| Construction | 4,438 (91.5%) | 411 (8.5%) |
| Manufacturing | 7,730 (75.5%) | 2,509 (24.5%) |
| Wholesale Trade | 1,197 (69.3%) | 531 (30.7%) |
| Retail Trade | 4,885 (51.8%) | 4,550 (48.2%) |
| Transportation & Warehousing | 2,522 (84.6%) | 460 (15.4%) |
| Utilities | 256 (77.1%) | 76 (22.9%) |
| Information | 936 (66.3%) | 476 (33.7%) |
| Finance & Insurance | 1,130 (37.8%) | 1,858 (62.2%) |
| Real Estate, Rental & Leasing | 382 (51.2%) | 364 (48.8%) |
| Professional & Scientific | 1,370 (49.2%) | 1,415 (50.8%) |
| Enterprise Management | 165 (52.7%) | 148 (47.3%) |
| Administrative & Support | 1,655 (53.4%) | 1,445 (46.6%) |
| Educational Services | 1,145 (23.1%) | 3,819 (76.9%) |
| Health Care & Social Assistance | 2,591 (23.6%) | 8,395 (76.4%) |
| Arts, Entertainment & Recreation | 582 (68.3%) | 270 (31.7%) |
| Accommodation & Food Services | 2,360 (44.9%) | 2,902 (55.1%) |
| Public Administration | 1,093 (54.1%) | 926 (45.9%) |
| Total | 36,548 (52.8%) | 32,658 (47.2%) |
Education in Sullivan County
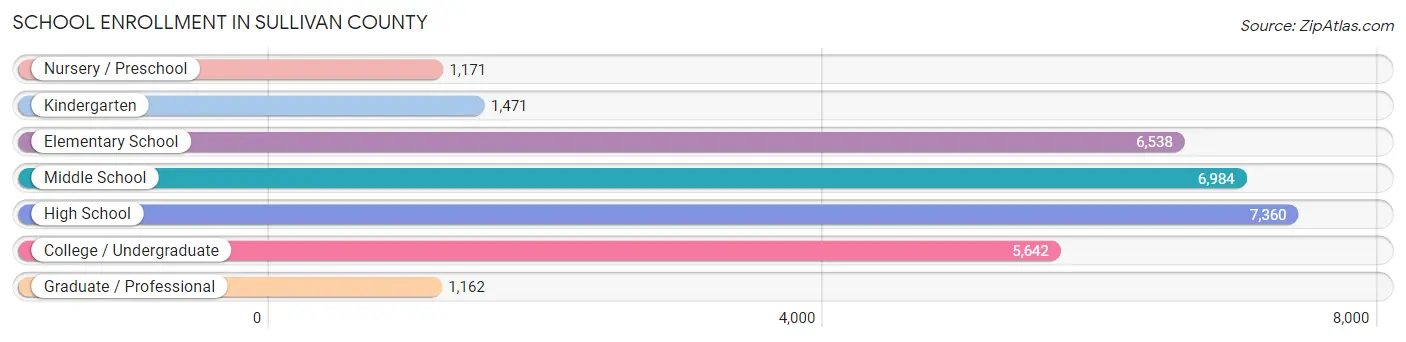
School Enrollment in Sullivan County
The most common levels of schooling among the 30,328 students in Sullivan County are high school (7,360 | 24.3%), middle school (6,984 | 23.0%), and elementary school (6,538 | 21.6%).
| School Level | # Students | % Students |
| Nursery / Preschool | 1,171 | 3.9% |
| Kindergarten | 1,471 | 4.9% |
| Elementary School | 6,538 | 21.6% |
| Middle School | 6,984 | 23.0% |
| High School | 7,360 | 24.3% |
| College / Undergraduate | 5,642 | 18.6% |
| Graduate / Professional | 1,162 | 3.8% |
| Total | 30,328 | 100.0% |
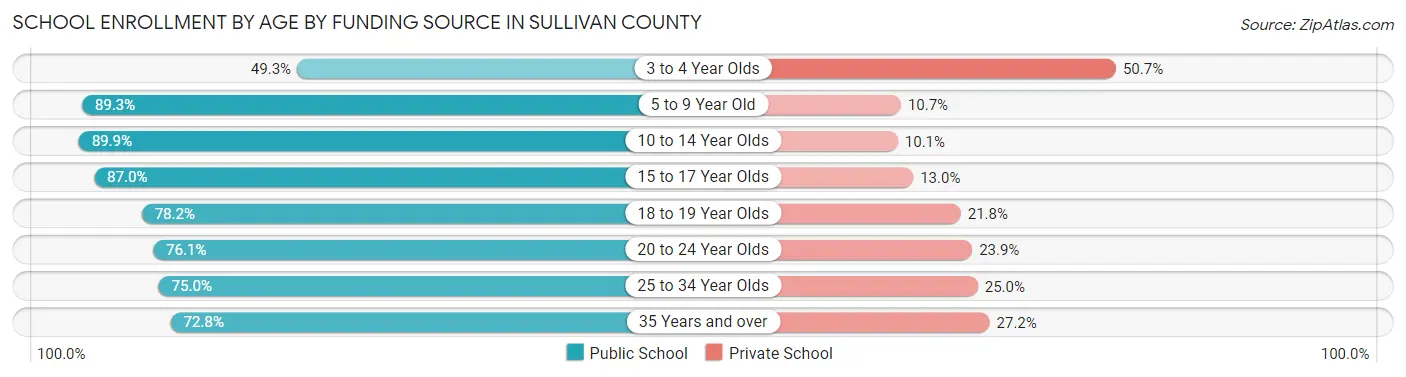
School Enrollment by Age by Funding Source in Sullivan County
Out of a total of 30,328 students who are enrolled in schools in Sullivan County, 4,701 (15.5%) attend a private institution, while the remaining 25,627 (84.5%) are enrolled in public schools. The age group of 3 to 4 year olds has the highest likelihood of being enrolled in private schools, with 459 (50.7% in the age bracket) enrolled. Conversely, the age group of 10 to 14 year olds has the lowest likelihood of being enrolled in a private school, with 8,133 (89.9% in the age bracket) attending a public institution.
| Age Bracket | Public School | Private School |
| 3 to 4 Year Olds | 446 (49.3%) | 459 (50.7%) |
| 5 to 9 Year Old | 6,460 (89.3%) | 772 (10.7%) |
| 10 to 14 Year Olds | 8,133 (89.9%) | 913 (10.1%) |
| 15 to 17 Year Olds | 4,869 (87.0%) | 725 (13.0%) |
| 18 to 19 Year Olds | 1,616 (78.2%) | 451 (21.8%) |
| 20 to 24 Year Olds | 2,195 (76.1%) | 691 (23.9%) |
| 25 to 34 Year Olds | 889 (75.0%) | 296 (25.0%) |
| 35 Years and over | 1,029 (72.8%) | 384 (27.2%) |
| Total | 25,627 (84.5%) | 4,701 (15.5%) |
Educational Attainment by Field of Study in Sullivan County
Business (6,466 | 19.8%), science & technology (4,775 | 14.6%), education (4,766 | 14.6%), engineering (2,517 | 7.7%), and bio, nature & agricultural (2,229 | 6.8%) are the most common fields of study among 32,683 individuals in Sullivan County who have obtained a bachelor's degree or higher.
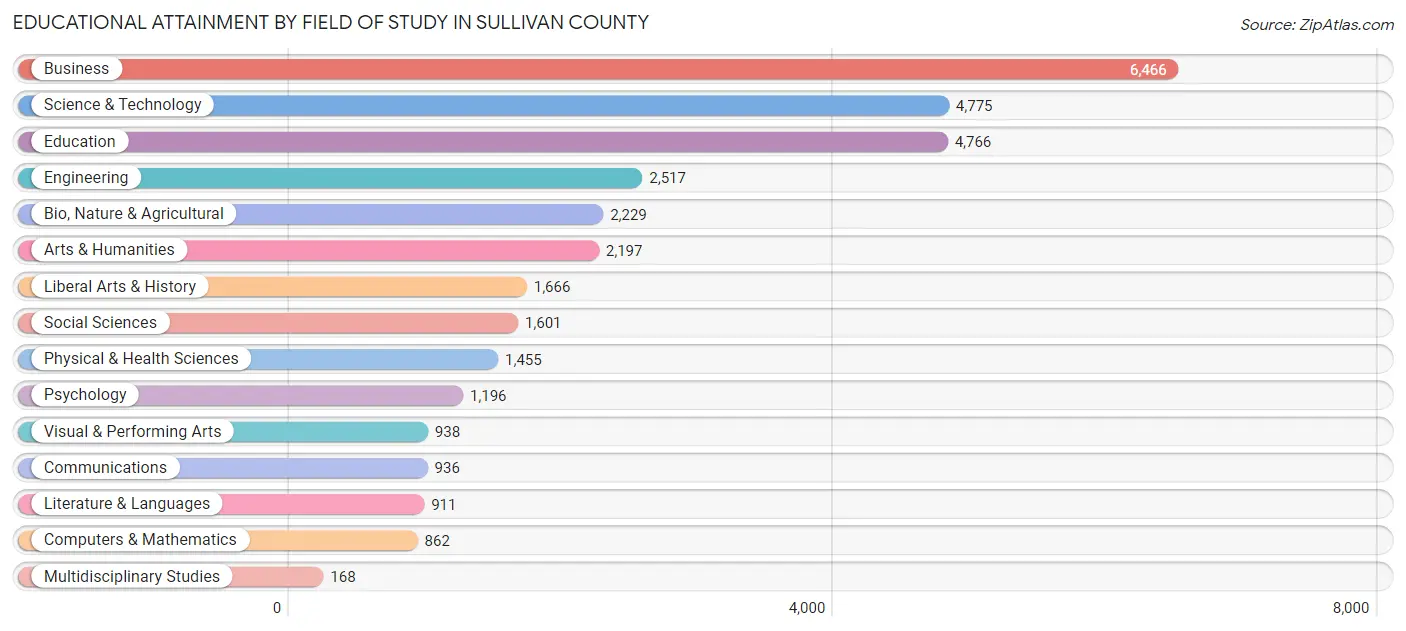
| Field of Study | # Graduates | % Graduates |
| Computers & Mathematics | 862 | 2.6% |
| Bio, Nature & Agricultural | 2,229 | 6.8% |
| Physical & Health Sciences | 1,455 | 4.4% |
| Psychology | 1,196 | 3.7% |
| Social Sciences | 1,601 | 4.9% |
| Engineering | 2,517 | 7.7% |
| Multidisciplinary Studies | 168 | 0.5% |
| Science & Technology | 4,775 | 14.6% |
| Business | 6,466 | 19.8% |
| Education | 4,766 | 14.6% |
| Literature & Languages | 911 | 2.8% |
| Liberal Arts & History | 1,666 | 5.1% |
| Visual & Performing Arts | 938 | 2.9% |
| Communications | 936 | 2.9% |
| Arts & Humanities | 2,197 | 6.7% |
| Total | 32,683 | 100.0% |
Transportation & Commute in Sullivan County
Vehicle Availability by Sex in Sullivan County
The most prevalent vehicle ownership categories in Sullivan County are males with 2 vehicles (13,997, accounting for 39.4%) and females with 2 vehicles (11,962, making up 44.0%).
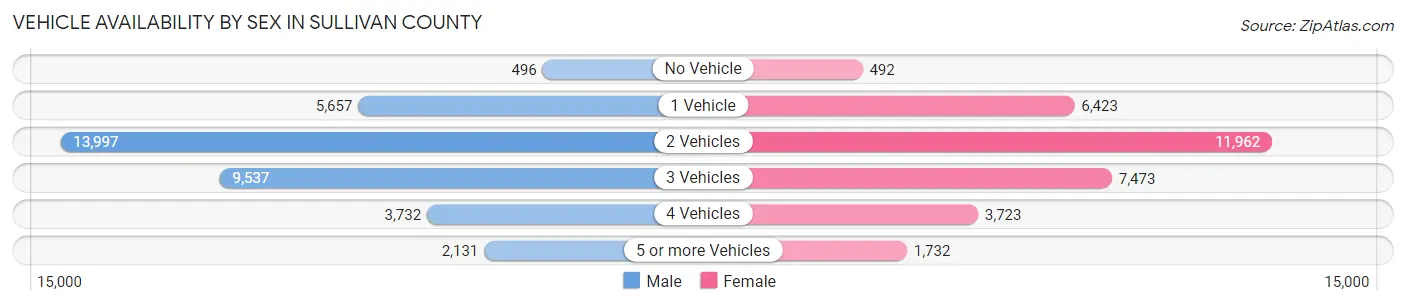
| Vehicles Available | Male | Female |
| No Vehicle | 496 (1.4%) | 492 (1.5%) |
| 1 Vehicle | 5,657 (15.9%) | 6,423 (20.2%) |
| 2 Vehicles | 13,997 (39.4%) | 11,962 (37.6%) |
| 3 Vehicles | 9,537 (26.8%) | 7,473 (23.5%) |
| 4 Vehicles | 3,732 (10.5%) | 3,723 (11.7%) |
| 5 or more Vehicles | 2,131 (6.0%) | 1,732 (5.4%) |
| Total | 35,550 (100.0%) | 31,805 (100.0%) |
Commute Time in Sullivan County
The most frequently occuring commute durations in Sullivan County are 15 to 19 minutes (12,866 commuters, 20.6%), 10 to 14 minutes (10,599 commuters, 17.0%), and 20 to 24 minutes (9,011 commuters, 14.4%).
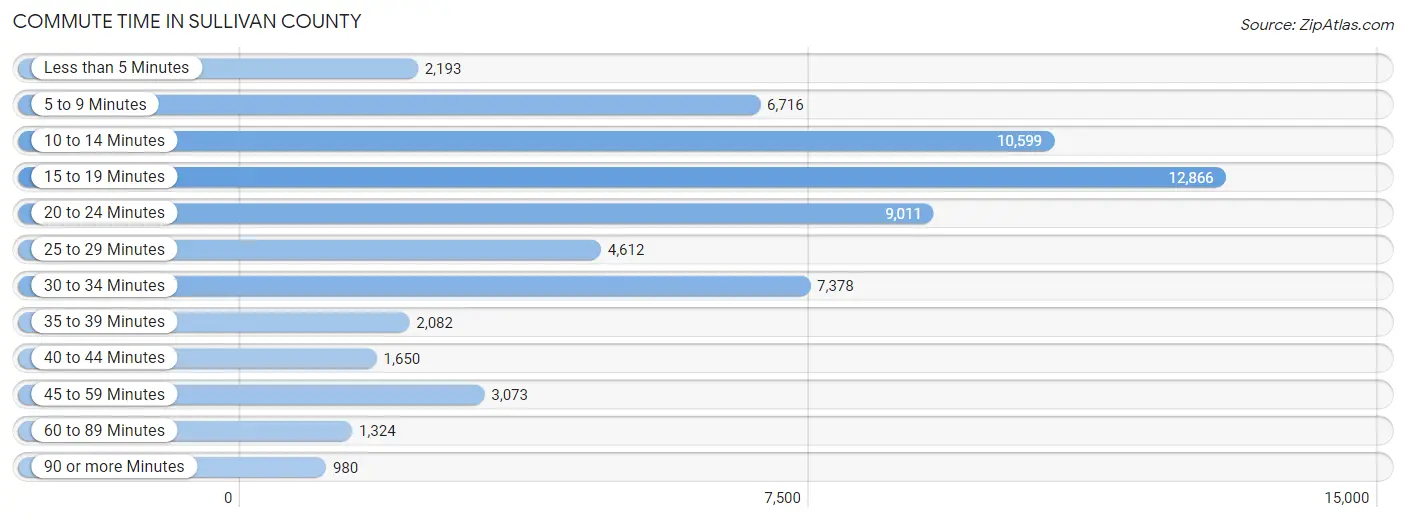
| Commute Time | # Commuters | % Commuters |
| Less than 5 Minutes | 2,193 | 3.5% |
| 5 to 9 Minutes | 6,716 | 10.7% |
| 10 to 14 Minutes | 10,599 | 17.0% |
| 15 to 19 Minutes | 12,866 | 20.6% |
| 20 to 24 Minutes | 9,011 | 14.4% |
| 25 to 29 Minutes | 4,612 | 7.4% |
| 30 to 34 Minutes | 7,378 | 11.8% |
| 35 to 39 Minutes | 2,082 | 3.3% |
| 40 to 44 Minutes | 1,650 | 2.6% |
| 45 to 59 Minutes | 3,073 | 4.9% |
| 60 to 89 Minutes | 1,324 | 2.1% |
| 90 or more Minutes | 980 | 1.6% |
Commute Time by Sex in Sullivan County
The most common commute times in Sullivan County are 15 to 19 minutes (6,509 commuters, 19.4%) for males and 15 to 19 minutes (6,357 commuters, 22.0%) for females.
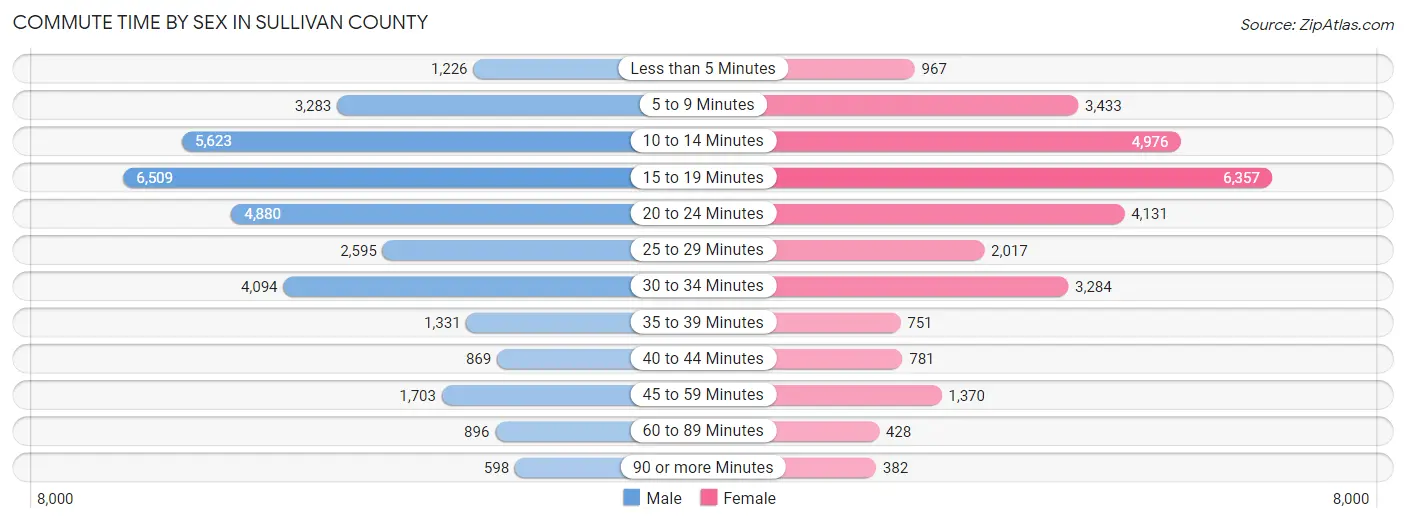
| Commute Time | Male | Female |
| Less than 5 Minutes | 1,226 (3.6%) | 967 (3.4%) |
| 5 to 9 Minutes | 3,283 (9.8%) | 3,433 (11.9%) |
| 10 to 14 Minutes | 5,623 (16.7%) | 4,976 (17.2%) |
| 15 to 19 Minutes | 6,509 (19.4%) | 6,357 (22.0%) |
| 20 to 24 Minutes | 4,880 (14.5%) | 4,131 (14.3%) |
| 25 to 29 Minutes | 2,595 (7.7%) | 2,017 (7.0%) |
| 30 to 34 Minutes | 4,094 (12.2%) | 3,284 (11.4%) |
| 35 to 39 Minutes | 1,331 (4.0%) | 751 (2.6%) |
| 40 to 44 Minutes | 869 (2.6%) | 781 (2.7%) |
| 45 to 59 Minutes | 1,703 (5.1%) | 1,370 (4.7%) |
| 60 to 89 Minutes | 896 (2.7%) | 428 (1.5%) |
| 90 or more Minutes | 598 (1.8%) | 382 (1.3%) |
Time of Departure to Work by Sex in Sullivan County
The most frequent times of departure to work in Sullivan County are 7:00 AM to 7:29 AM (5,001, 14.9%) for males and 7:30 AM to 7:59 AM (5,136, 17.8%) for females.
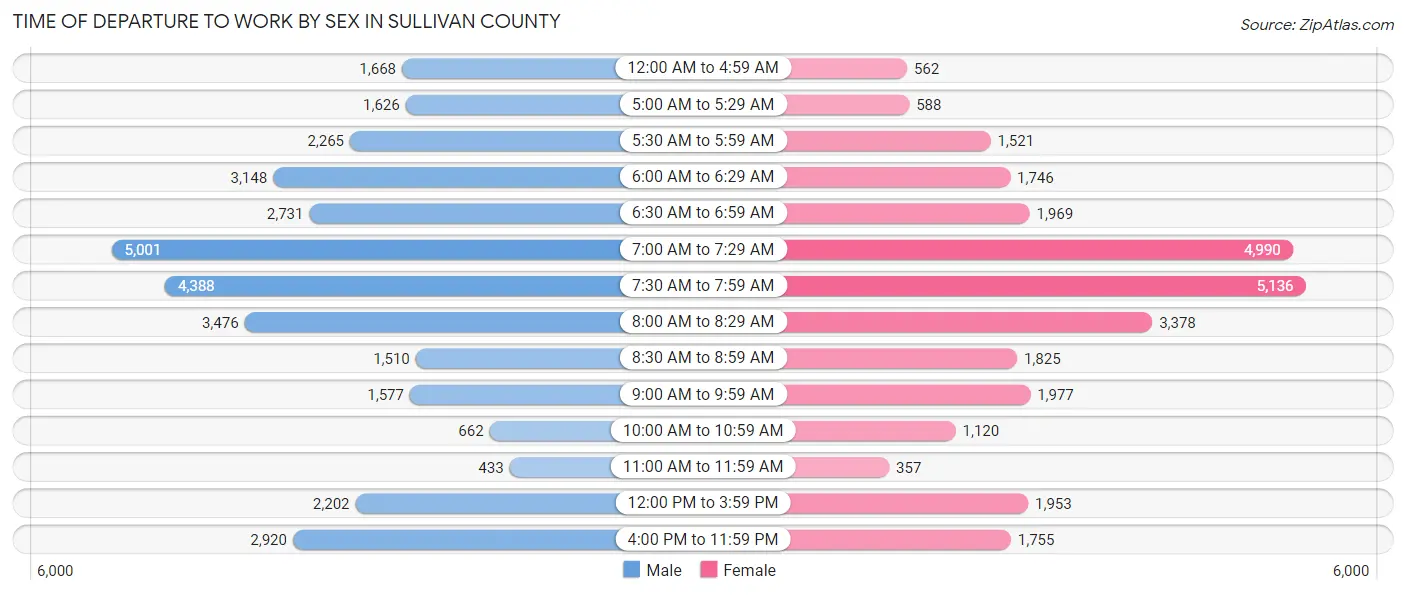
| Time of Departure | Male | Female |
| 12:00 AM to 4:59 AM | 1,668 (5.0%) | 562 (1.9%) |
| 5:00 AM to 5:29 AM | 1,626 (4.8%) | 588 (2.0%) |
| 5:30 AM to 5:59 AM | 2,265 (6.7%) | 1,521 (5.3%) |
| 6:00 AM to 6:29 AM | 3,148 (9.4%) | 1,746 (6.0%) |
| 6:30 AM to 6:59 AM | 2,731 (8.1%) | 1,969 (6.8%) |
| 7:00 AM to 7:29 AM | 5,001 (14.9%) | 4,990 (17.3%) |
| 7:30 AM to 7:59 AM | 4,388 (13.1%) | 5,136 (17.8%) |
| 8:00 AM to 8:29 AM | 3,476 (10.3%) | 3,378 (11.7%) |
| 8:30 AM to 8:59 AM | 1,510 (4.5%) | 1,825 (6.3%) |
| 9:00 AM to 9:59 AM | 1,577 (4.7%) | 1,977 (6.9%) |
| 10:00 AM to 10:59 AM | 662 (2.0%) | 1,120 (3.9%) |
| 11:00 AM to 11:59 AM | 433 (1.3%) | 357 (1.2%) |
| 12:00 PM to 3:59 PM | 2,202 (6.6%) | 1,953 (6.8%) |
| 4:00 PM to 11:59 PM | 2,920 (8.7%) | 1,755 (6.1%) |
| Total | 33,607 (100.0%) | 28,877 (100.0%) |
Housing Occupancy in Sullivan County
Occupancy by Ownership in Sullivan County
Of the total 67,575 dwellings in Sullivan County, owner-occupied units account for 49,020 (72.5%), while renter-occupied units make up 18,555 (27.5%).
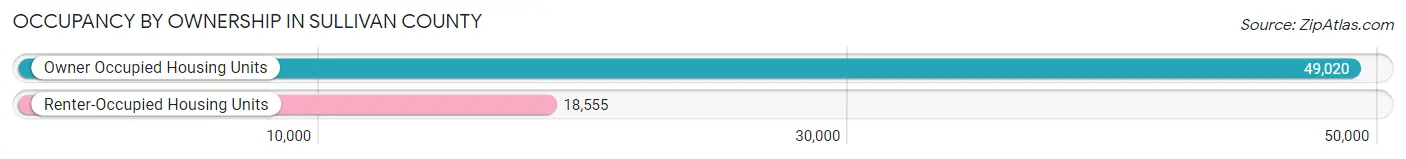
| Occupancy | # Housing Units | % Housing Units |
| Owner Occupied Housing Units | 49,020 | 72.5% |
| Renter-Occupied Housing Units | 18,555 | 27.5% |
| Total Occupied Housing Units | 67,575 | 100.0% |
Occupancy by Household Size in Sullivan County
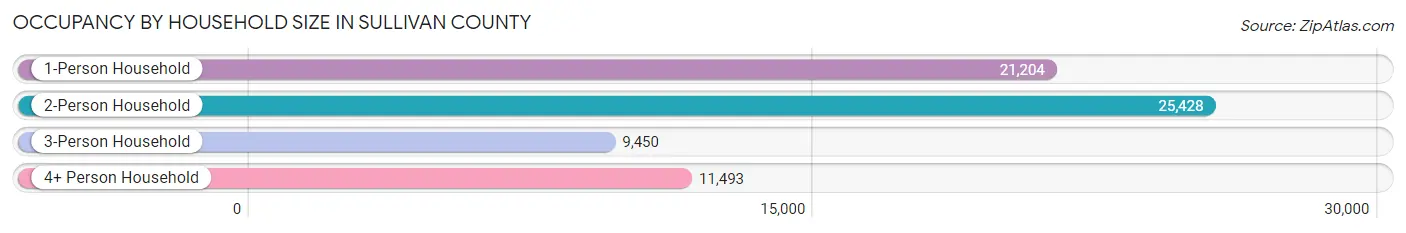
| Household Size | # Housing Units | % Housing Units |
| 1-Person Household | 21,204 | 31.4% |
| 2-Person Household | 25,428 | 37.6% |
| 3-Person Household | 9,450 | 14.0% |
| 4+ Person Household | 11,493 | 17.0% |
| Total Housing Units | 67,575 | 100.0% |
Occupancy by Ownership by Household Size in Sullivan County
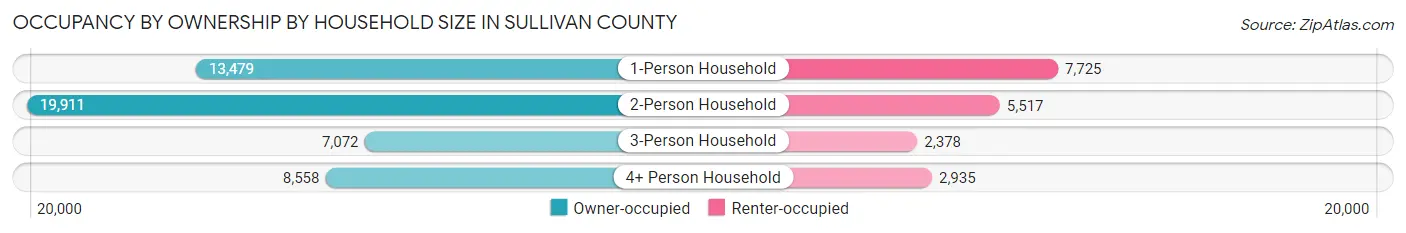
| Household Size | Owner-occupied | Renter-occupied |
| 1-Person Household | 13,479 (63.6%) | 7,725 (36.4%) |
| 2-Person Household | 19,911 (78.3%) | 5,517 (21.7%) |
| 3-Person Household | 7,072 (74.8%) | 2,378 (25.2%) |
| 4+ Person Household | 8,558 (74.5%) | 2,935 (25.5%) |
| Total Housing Units | 49,020 (72.5%) | 18,555 (27.5%) |
Occupancy by Educational Attainment in Sullivan County
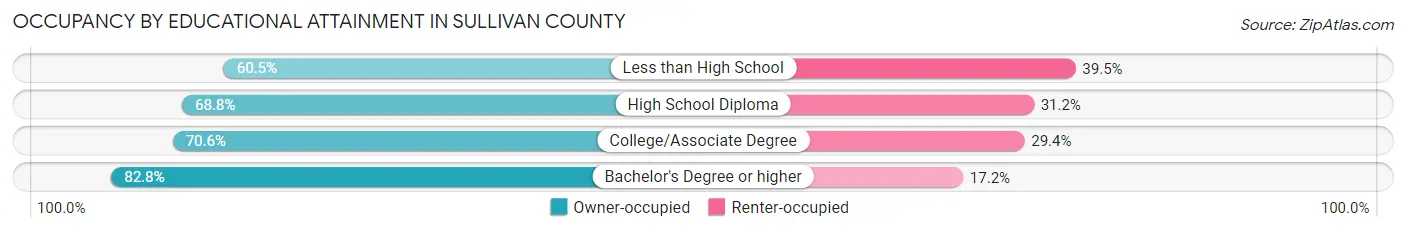
| Household Size | Owner-occupied | Renter-occupied |
| Less than High School | 4,041 (60.5%) | 2,638 (39.5%) |
| High School Diploma | 14,146 (68.8%) | 6,425 (31.2%) |
| College/Associate Degree | 14,835 (70.6%) | 6,168 (29.4%) |
| Bachelor's Degree or higher | 15,998 (82.8%) | 3,324 (17.2%) |
Occupancy by Age of Householder in Sullivan County
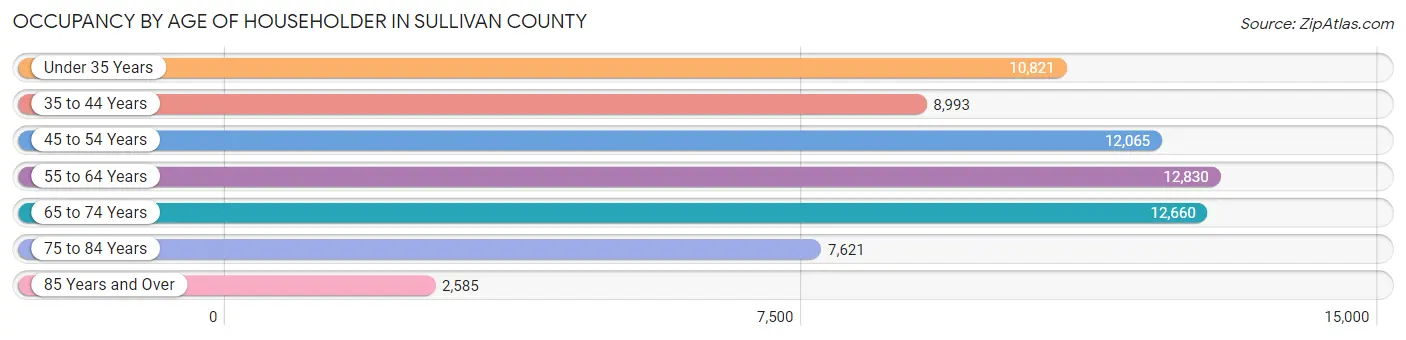
| Age Bracket | # Households | % Households |
| Under 35 Years | 10,821 | 16.0% |
| 35 to 44 Years | 8,993 | 13.3% |
| 45 to 54 Years | 12,065 | 17.8% |
| 55 to 64 Years | 12,830 | 19.0% |
| 65 to 74 Years | 12,660 | 18.7% |
| 75 to 84 Years | 7,621 | 11.3% |
| 85 Years and Over | 2,585 | 3.8% |
| Total | 67,575 | 100.0% |
Housing Finances in Sullivan County
Median Income by Occupancy in Sullivan County
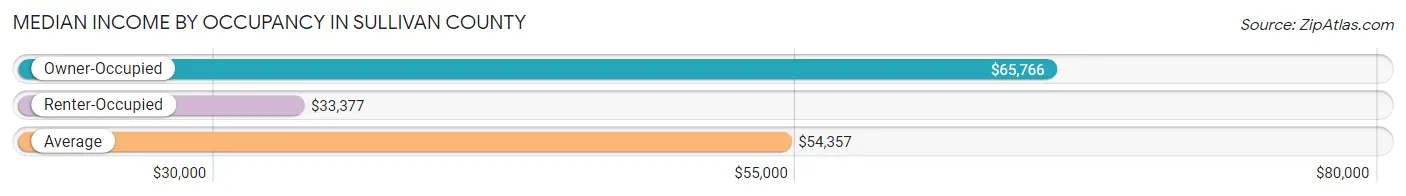
| Occupancy Type | # Households | Median Income |
| Owner-Occupied | 49,020 (72.5%) | $65,766 |
| Renter-Occupied | 18,555 (27.5%) | $33,377 |
| Average | 67,575 (100.0%) | $54,357 |
Occupancy by Householder Income Bracket in Sullivan County
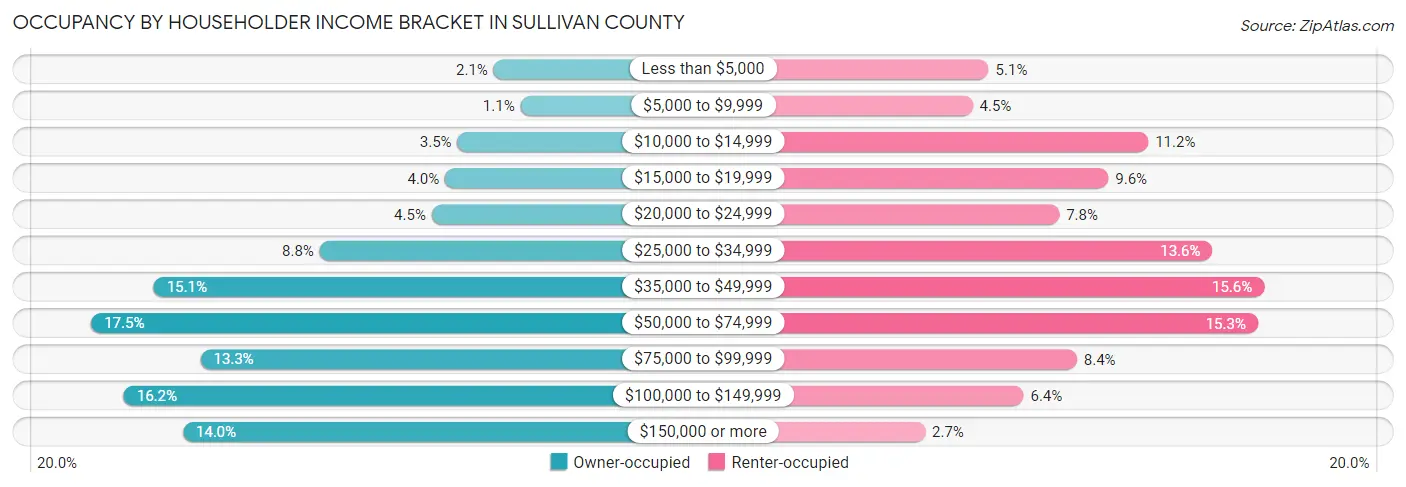
| Income Bracket | Owner-occupied | Renter-occupied |
| Less than $5,000 | 1,043 (2.1%) | 940 (5.1%) |
| $5,000 to $9,999 | 543 (1.1%) | 827 (4.5%) |
| $10,000 to $14,999 | 1,721 (3.5%) | 2,068 (11.2%) |
| $15,000 to $19,999 | 1,951 (4.0%) | 1,787 (9.6%) |
| $20,000 to $24,999 | 2,203 (4.5%) | 1,439 (7.8%) |
| $25,000 to $34,999 | 4,292 (8.8%) | 2,521 (13.6%) |
| $35,000 to $49,999 | 7,390 (15.1%) | 2,888 (15.6%) |
| $50,000 to $74,999 | 8,558 (17.5%) | 2,842 (15.3%) |
| $75,000 to $99,999 | 6,519 (13.3%) | 1,564 (8.4%) |
| $100,000 to $149,999 | 7,950 (16.2%) | 1,187 (6.4%) |
| $150,000 or more | 6,850 (14.0%) | 492 (2.6%) |
| Total | 49,020 (100.0%) | 18,555 (100.0%) |
Monthly Housing Cost Tiers in Sullivan County
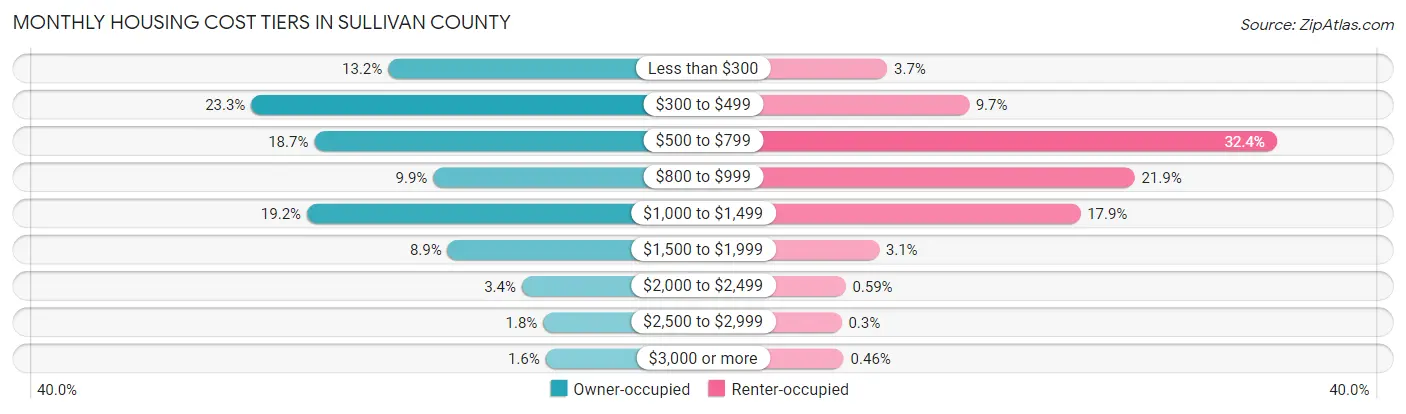
| Monthly Cost | Owner-occupied | Renter-occupied |
| Less than $300 | 6,484 (13.2%) | 680 (3.7%) |
| $300 to $499 | 11,428 (23.3%) | 1,794 (9.7%) |
| $500 to $799 | 9,151 (18.7%) | 6,003 (32.4%) |
| $800 to $999 | 4,860 (9.9%) | 4,059 (21.9%) |
| $1,000 to $1,499 | 9,415 (19.2%) | 3,317 (17.9%) |
| $1,500 to $1,999 | 4,339 (8.8%) | 566 (3.0%) |
| $2,000 to $2,499 | 1,656 (3.4%) | 109 (0.6%) |
| $2,500 to $2,999 | 887 (1.8%) | 55 (0.3%) |
| $3,000 or more | 800 (1.6%) | 86 (0.5%) |
| Total | 49,020 (100.0%) | 18,555 (100.0%) |
Physical Housing Characteristics in Sullivan County
Housing Structures in Sullivan County
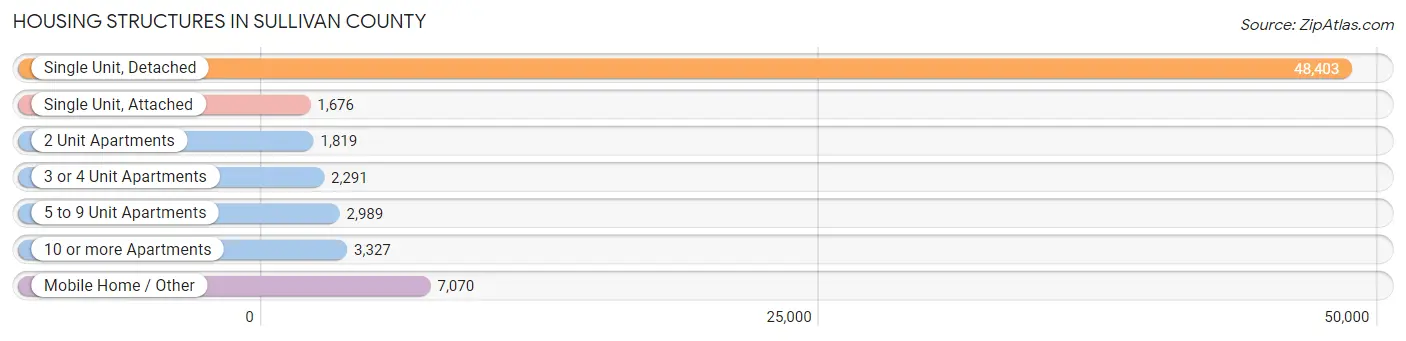
| Structure Type | # Housing Units | % Housing Units |
| Single Unit, Detached | 48,403 | 71.6% |
| Single Unit, Attached | 1,676 | 2.5% |
| 2 Unit Apartments | 1,819 | 2.7% |
| 3 or 4 Unit Apartments | 2,291 | 3.4% |
| 5 to 9 Unit Apartments | 2,989 | 4.4% |
| 10 or more Apartments | 3,327 | 4.9% |
| Mobile Home / Other | 7,070 | 10.5% |
| Total | 67,575 | 100.0% |
Housing Structures by Occupancy in Sullivan County
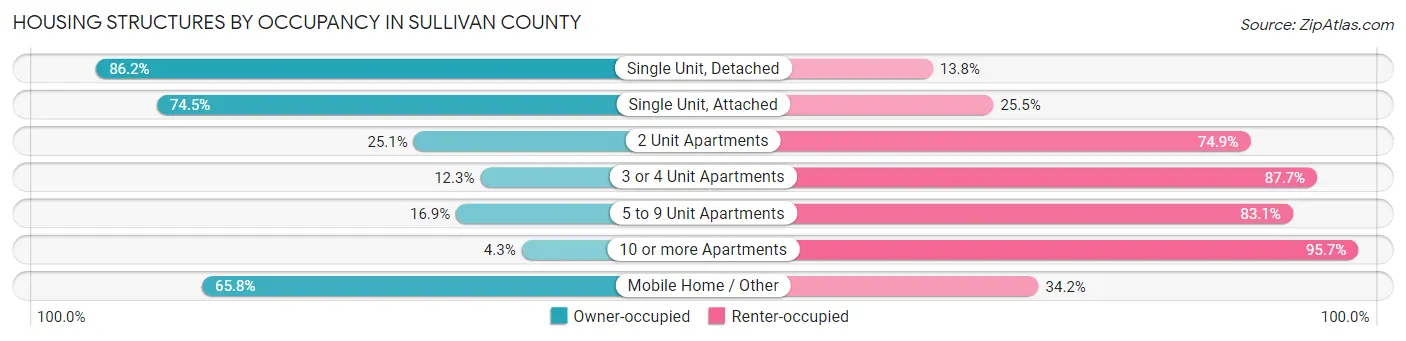
| Structure Type | Owner-occupied | Renter-occupied |
| Single Unit, Detached | 41,729 (86.2%) | 6,674 (13.8%) |
| Single Unit, Attached | 1,249 (74.5%) | 427 (25.5%) |
| 2 Unit Apartments | 457 (25.1%) | 1,362 (74.9%) |
| 3 or 4 Unit Apartments | 281 (12.3%) | 2,010 (87.7%) |
| 5 to 9 Unit Apartments | 506 (16.9%) | 2,483 (83.1%) |
| 10 or more Apartments | 144 (4.3%) | 3,183 (95.7%) |
| Mobile Home / Other | 4,654 (65.8%) | 2,416 (34.2%) |
| Total | 49,020 (72.5%) | 18,555 (27.5%) |
Housing Structures by Number of Rooms in Sullivan County
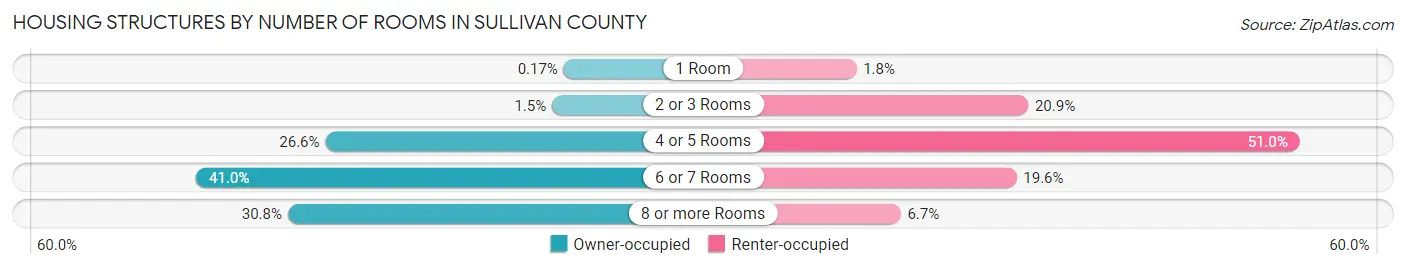
| Number of Rooms | Owner-occupied | Renter-occupied |
| 1 Room | 84 (0.2%) | 335 (1.8%) |
| 2 or 3 Rooms | 715 (1.5%) | 3,872 (20.9%) |
| 4 or 5 Rooms | 13,050 (26.6%) | 9,468 (51.0%) |
| 6 or 7 Rooms | 20,079 (41.0%) | 3,633 (19.6%) |
| 8 or more Rooms | 15,092 (30.8%) | 1,247 (6.7%) |
| Total | 49,020 (100.0%) | 18,555 (100.0%) |
Housing Structure by Heating Type in Sullivan County
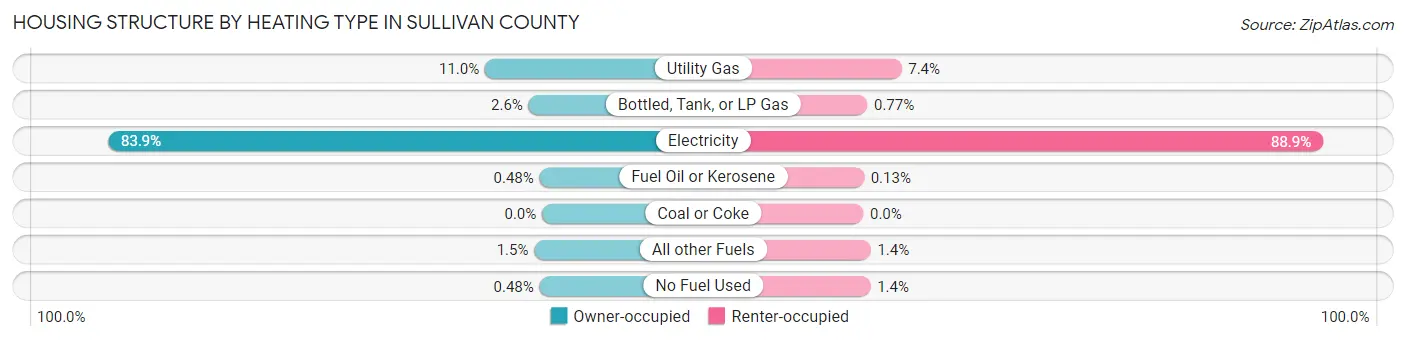
| Heating Type | Owner-occupied | Renter-occupied |
| Utility Gas | 5,404 (11.0%) | 1,371 (7.4%) |
| Bottled, Tank, or LP Gas | 1,270 (2.6%) | 142 (0.8%) |
| Electricity | 41,135 (83.9%) | 16,491 (88.9%) |
| Fuel Oil or Kerosene | 236 (0.5%) | 25 (0.1%) |
| Coal or Coke | 0 (0.0%) | 0 (0.0%) |
| All other Fuels | 739 (1.5%) | 268 (1.4%) |
| No Fuel Used | 236 (0.5%) | 258 (1.4%) |
| Total | 49,020 (100.0%) | 18,555 (100.0%) |
Household Vehicle Usage in Sullivan County
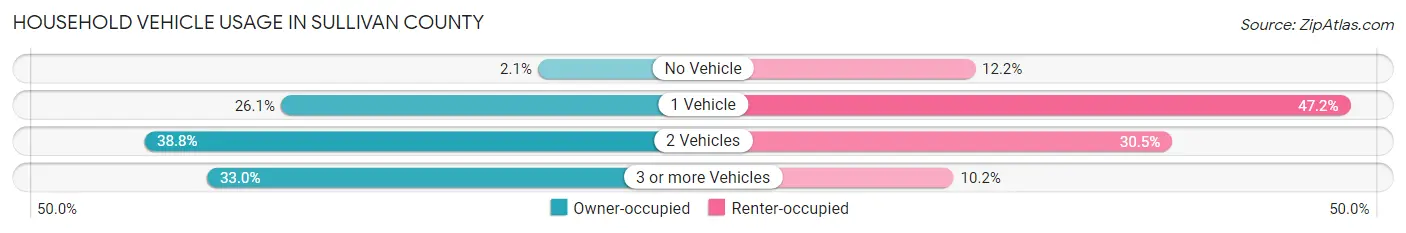
| Vehicles per Household | Owner-occupied | Renter-occupied |
| No Vehicle | 1,030 (2.1%) | 2,255 (12.1%) |
| 1 Vehicle | 12,789 (26.1%) | 8,752 (47.2%) |
| 2 Vehicles | 19,040 (38.8%) | 5,665 (30.5%) |
| 3 or more Vehicles | 16,161 (33.0%) | 1,883 (10.2%) |
| Total | 49,020 (100.0%) | 18,555 (100.0%) |
Real Estate & Mortgages in Sullivan County
Real Estate and Mortgage Overview in Sullivan County
| Characteristic | Without Mortgage | With Mortgage |
| Housing Units | 24,083 | 24,937 |
| Median Property Value | $158,800 | $187,400 |
| Median Household Income | $51,696 | $4,495 |
| Monthly Housing Costs | $391 | $780 |
| Real Estate Taxes | $1,077 | $550 |
Property Value by Mortgage Status in Sullivan County
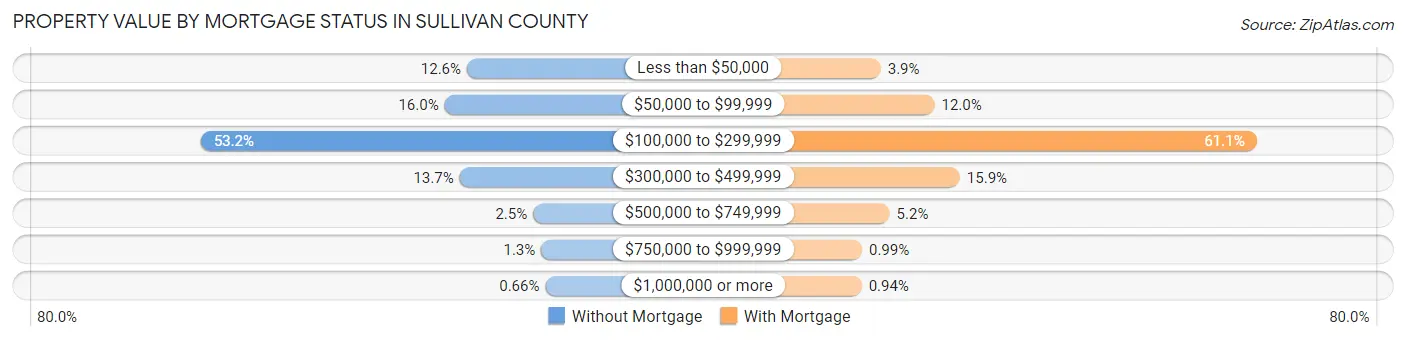
| Property Value | Without Mortgage | With Mortgage |
| Less than $50,000 | 3,037 (12.6%) | 959 (3.8%) |
| $50,000 to $99,999 | 3,858 (16.0%) | 3,002 (12.0%) |
| $100,000 to $299,999 | 12,802 (53.2%) | 15,233 (61.1%) |
| $300,000 to $499,999 | 3,307 (13.7%) | 3,965 (15.9%) |
| $500,000 to $749,999 | 608 (2.5%) | 1,297 (5.2%) |
| $750,000 to $999,999 | 311 (1.3%) | 247 (1.0%) |
| $1,000,000 or more | 160 (0.7%) | 234 (0.9%) |
| Total | 24,083 (100.0%) | 24,937 (100.0%) |
Household Income by Mortgage Status in Sullivan County
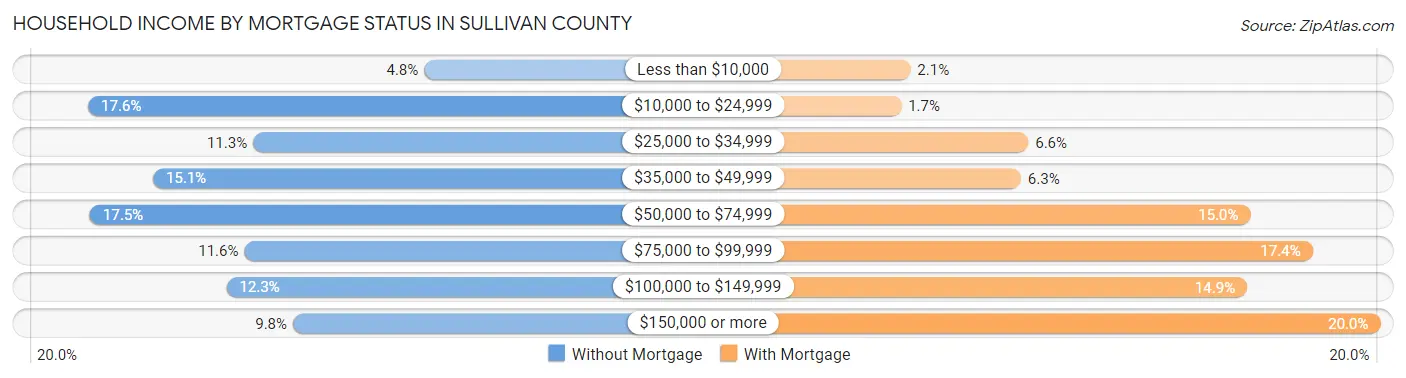
| Household Income | Without Mortgage | With Mortgage |
| Less than $10,000 | 1,152 (4.8%) | 520 (2.1%) |
| $10,000 to $24,999 | 4,234 (17.6%) | 434 (1.7%) |
| $25,000 to $34,999 | 2,722 (11.3%) | 1,641 (6.6%) |
| $35,000 to $49,999 | 3,639 (15.1%) | 1,570 (6.3%) |
| $50,000 to $74,999 | 4,217 (17.5%) | 3,751 (15.0%) |
| $75,000 to $99,999 | 2,800 (11.6%) | 4,341 (17.4%) |
| $100,000 to $149,999 | 2,964 (12.3%) | 3,719 (14.9%) |
| $150,000 or more | 2,355 (9.8%) | 4,986 (20.0%) |
| Total | 24,083 (100.0%) | 24,937 (100.0%) |
Property Value to Household Income Ratio in Sullivan County
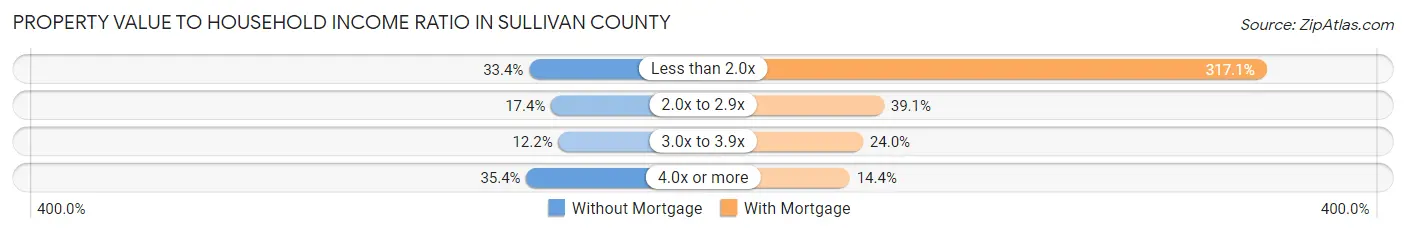
| Value-to-Income Ratio | Without Mortgage | With Mortgage |
| Less than 2.0x | 8,051 (33.4%) | 79,085 (317.1%) |
| 2.0x to 2.9x | 4,195 (17.4%) | 9,758 (39.1%) |
| 3.0x to 3.9x | 2,929 (12.2%) | 5,975 (24.0%) |
| 4.0x or more | 8,535 (35.4%) | 3,594 (14.4%) |
| Total | 24,083 (100.0%) | 24,937 (100.0%) |
Real Estate Taxes by Mortgage Status in Sullivan County
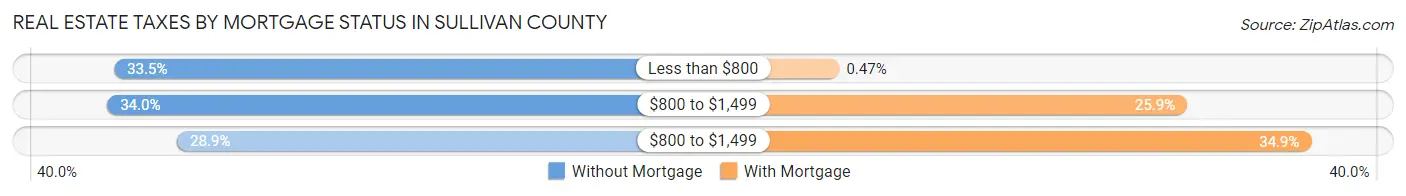
| Property Taxes | Without Mortgage | With Mortgage |
| Less than $800 | 8,057 (33.5%) | 118 (0.5%) |
| $800 to $1,499 | 8,179 (34.0%) | 6,449 (25.9%) |
| $800 to $1,499 | 6,951 (28.9%) | 8,713 (34.9%) |
| Total | 24,083 (100.0%) | 24,937 (100.0%) |
Health & Disability in Sullivan County
Health Insurance Coverage by Age in Sullivan County
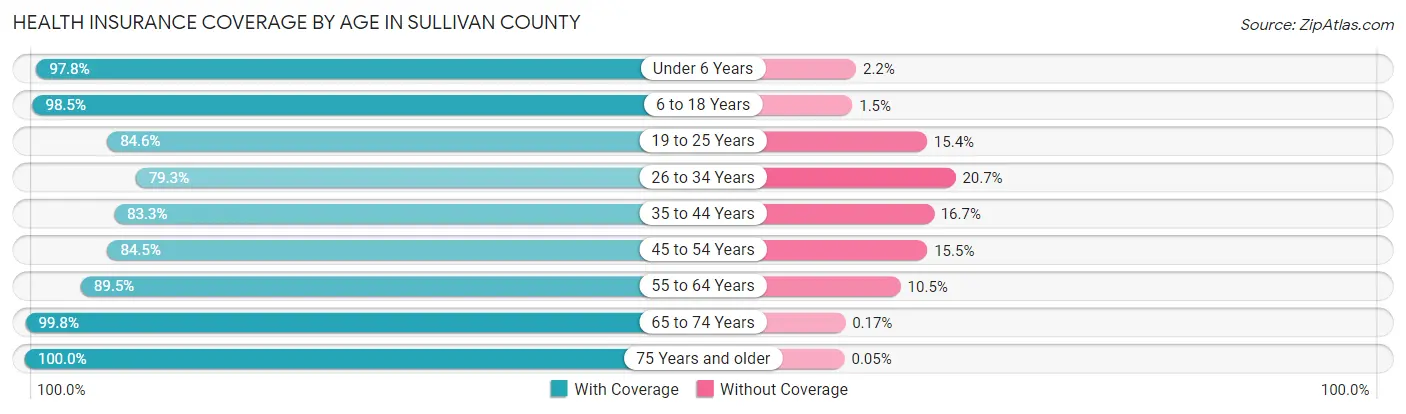
| Age Bracket | With Coverage | Without Coverage |
| Under 6 Years | 8,613 (97.8%) | 193 (2.2%) |
| 6 to 18 Years | 22,713 (98.5%) | 343 (1.5%) |
| 19 to 25 Years | 10,074 (84.6%) | 1,835 (15.4%) |
| 26 to 34 Years | 13,496 (79.3%) | 3,529 (20.7%) |
| 35 to 44 Years | 14,419 (83.3%) | 2,887 (16.7%) |
| 45 to 54 Years | 18,388 (84.5%) | 3,364 (15.5%) |
| 55 to 64 Years | 20,271 (89.5%) | 2,380 (10.5%) |
| 65 to 74 Years | 19,659 (99.8%) | 34 (0.2%) |
| 75 Years and older | 14,706 (100.0%) | 8 (0.1%) |
| Total | 142,339 (90.7%) | 14,573 (9.3%) |
Health Insurance Coverage by Citizenship Status in Sullivan County
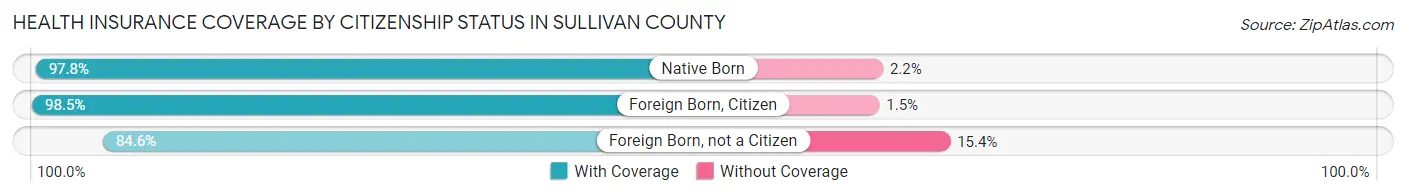
| Citizenship Status | With Coverage | Without Coverage |
| Native Born | 8,613 (97.8%) | 193 (2.2%) |
| Foreign Born, Citizen | 22,713 (98.5%) | 343 (1.5%) |
| Foreign Born, not a Citizen | 10,074 (84.6%) | 1,835 (15.4%) |
Health Insurance Coverage by Household Income in Sullivan County
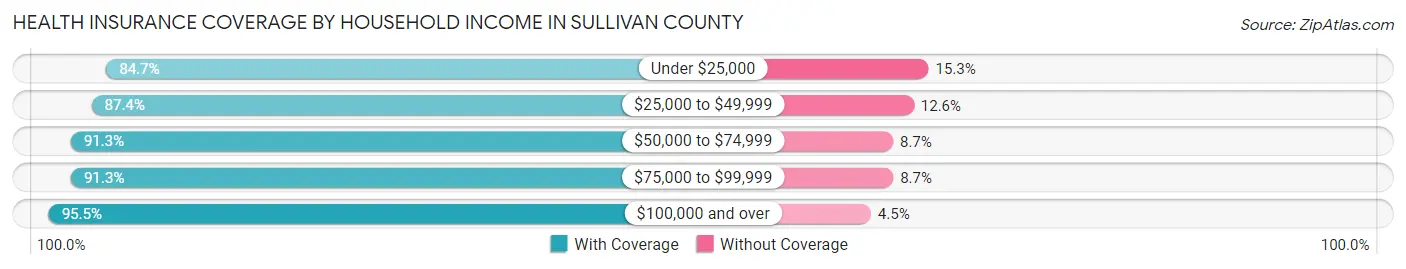
| Household Income | With Coverage | Without Coverage |
| Under $25,000 | 20,196 (84.7%) | 3,653 (15.3%) |
| $25,000 to $49,999 | 29,918 (87.4%) | 4,297 (12.6%) |
| $50,000 to $74,999 | 24,714 (91.3%) | 2,344 (8.7%) |
| $75,000 to $99,999 | 18,638 (91.3%) | 1,776 (8.7%) |
| $100,000 and over | 48,127 (95.5%) | 2,276 (4.5%) |
Public vs Private Health Insurance Coverage by Age in Sullivan County
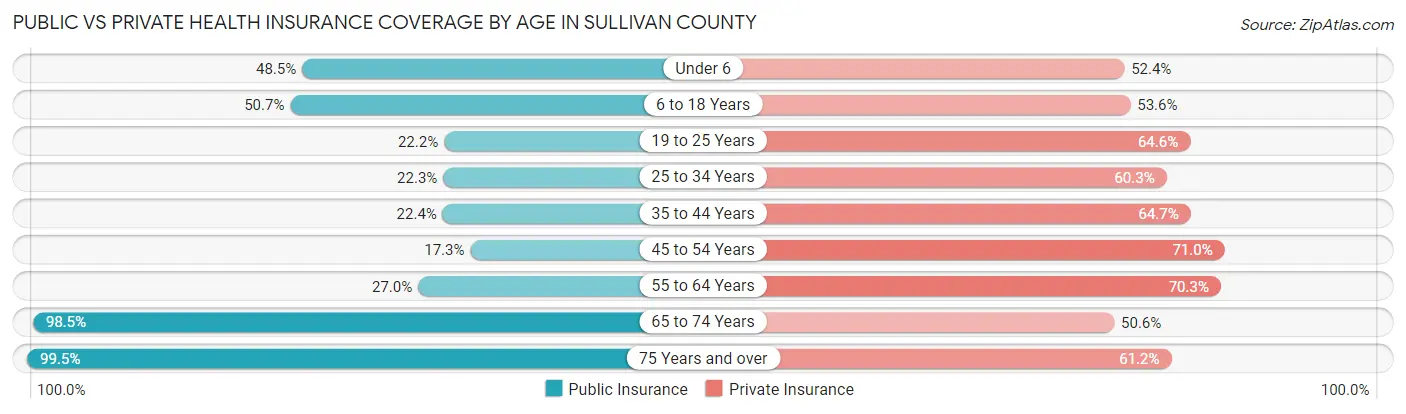
| Age Bracket | Public Insurance | Private Insurance |
| Under 6 | 4,272 (48.5%) | 4,616 (52.4%) |
| 6 to 18 Years | 11,687 (50.7%) | 12,347 (53.5%) |
| 19 to 25 Years | 2,639 (22.2%) | 7,696 (64.6%) |
| 25 to 34 Years | 3,799 (22.3%) | 10,259 (60.3%) |
| 35 to 44 Years | 3,876 (22.4%) | 11,203 (64.7%) |
| 45 to 54 Years | 3,757 (17.3%) | 15,450 (71.0%) |
| 55 to 64 Years | 6,110 (27.0%) | 15,930 (70.3%) |
| 65 to 74 Years | 19,392 (98.5%) | 9,955 (50.5%) |
| 75 Years and over | 14,646 (99.5%) | 8,997 (61.2%) |
| Total | 70,178 (44.7%) | 96,453 (61.5%) |
Disability Status by Sex by Age in Sullivan County
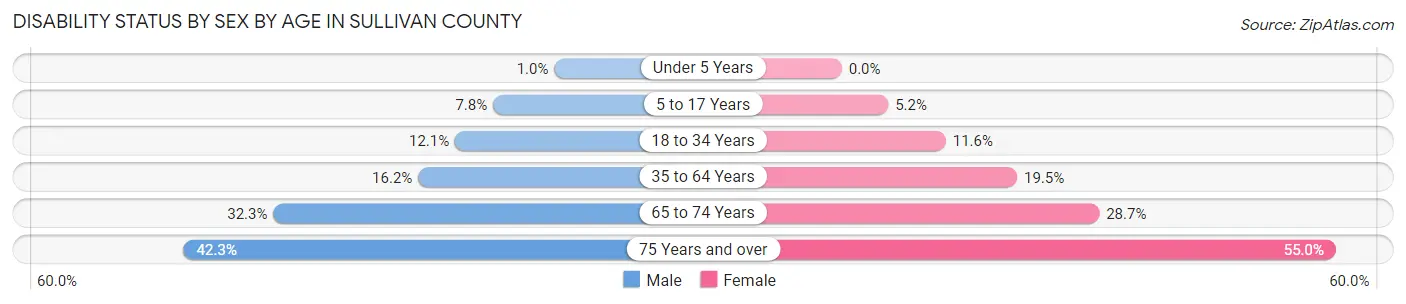
| Age Bracket | Male | Female |
| Under 5 Years | 39 (1.0%) | 0 (0.0%) |
| 5 to 17 Years | 908 (7.8%) | 579 (5.2%) |
| 18 to 34 Years | 1,871 (12.1%) | 1,740 (11.6%) |
| 35 to 64 Years | 4,894 (16.2%) | 6,137 (19.5%) |
| 65 to 74 Years | 2,978 (32.3%) | 3,003 (28.7%) |
| 75 Years and over | 2,633 (42.3%) | 4,670 (55.0%) |
Disability Class by Sex by Age in Sullivan County
Disability Class: Hearing Difficulty
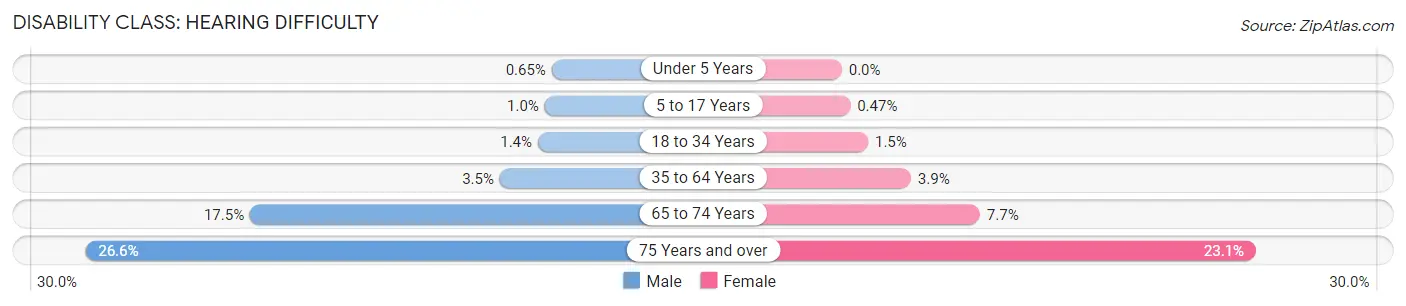
| Age Bracket | Male | Female |
| Under 5 Years | 25 (0.6%) | 0 (0.0%) |
| 5 to 17 Years | 120 (1.0%) | 53 (0.5%) |
| 18 to 34 Years | 220 (1.4%) | 219 (1.5%) |
| 35 to 64 Years | 1,070 (3.5%) | 1,209 (3.8%) |
| 65 to 74 Years | 1,609 (17.4%) | 805 (7.7%) |
| 75 Years and over | 1,657 (26.6%) | 1,958 (23.1%) |
Disability Class: Vision Difficulty
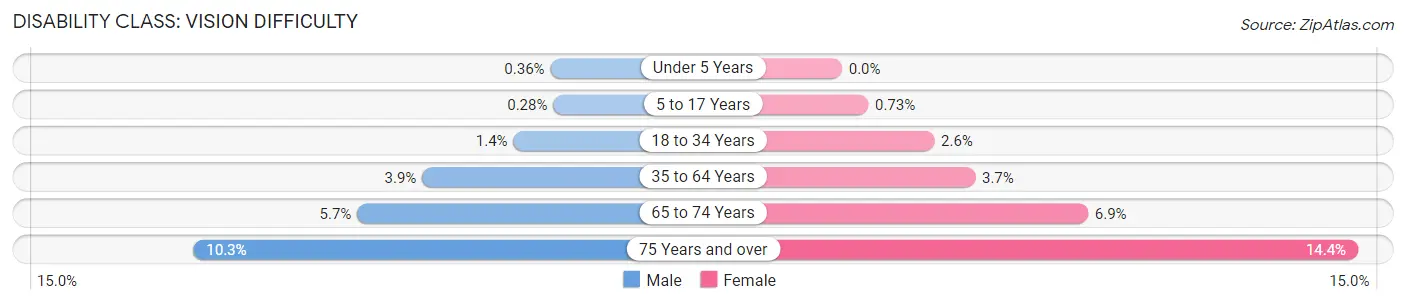
| Age Bracket | Male | Female |
| Under 5 Years | 14 (0.4%) | 0 (0.0%) |
| 5 to 17 Years | 33 (0.3%) | 82 (0.7%) |
| 18 to 34 Years | 215 (1.4%) | 386 (2.6%) |
| 35 to 64 Years | 1,191 (3.9%) | 1,166 (3.7%) |
| 65 to 74 Years | 529 (5.7%) | 717 (6.9%) |
| 75 Years and over | 641 (10.3%) | 1,220 (14.4%) |
Disability Class: Cognitive Difficulty
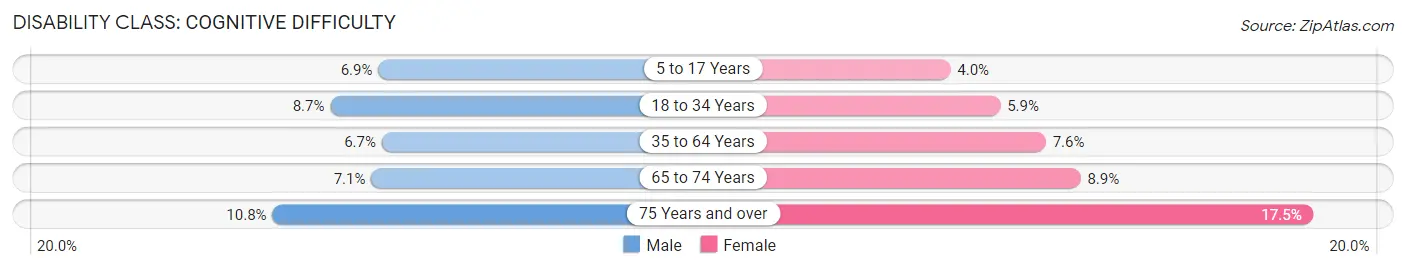
| Age Bracket | Male | Female |
| 5 to 17 Years | 796 (6.9%) | 452 (4.0%) |
| 18 to 34 Years | 1,342 (8.6%) | 884 (5.9%) |
| 35 to 64 Years | 2,039 (6.7%) | 2,380 (7.6%) |
| 65 to 74 Years | 657 (7.1%) | 928 (8.9%) |
| 75 Years and over | 672 (10.8%) | 1,487 (17.5%) |
Disability Class: Ambulatory Difficulty
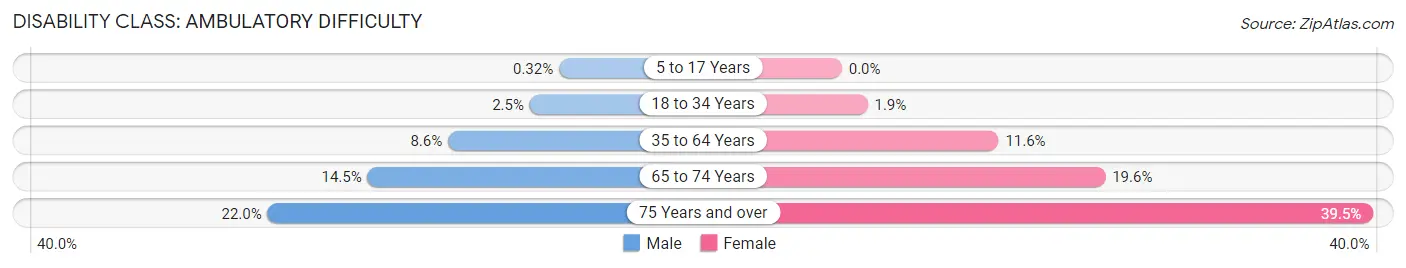
| Age Bracket | Male | Female |
| 5 to 17 Years | 37 (0.3%) | 0 (0.0%) |
| 18 to 34 Years | 386 (2.5%) | 287 (1.9%) |
| 35 to 64 Years | 2,591 (8.6%) | 3,658 (11.6%) |
| 65 to 74 Years | 1,341 (14.5%) | 2,049 (19.6%) |
| 75 Years and over | 1,367 (22.0%) | 3,349 (39.5%) |
Disability Class: Self-Care Difficulty
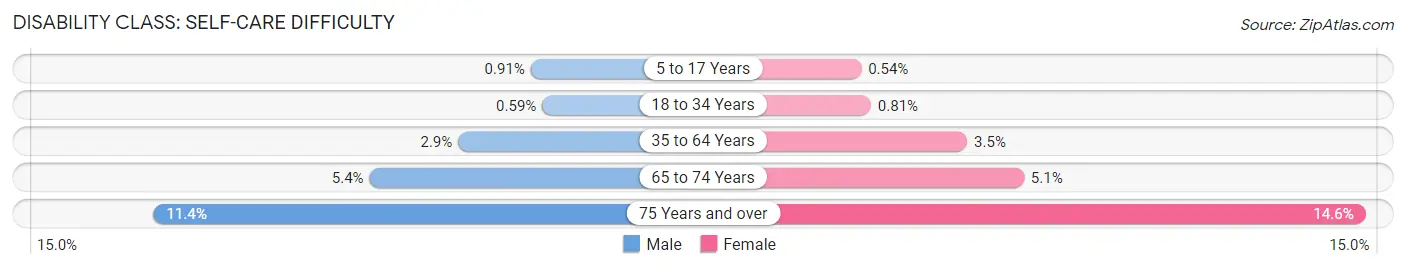
| Age Bracket | Male | Female |
| 5 to 17 Years | 105 (0.9%) | 60 (0.5%) |
| 18 to 34 Years | 91 (0.6%) | 121 (0.8%) |
| 35 to 64 Years | 887 (2.9%) | 1,098 (3.5%) |
| 65 to 74 Years | 498 (5.4%) | 531 (5.1%) |
| 75 Years and over | 710 (11.4%) | 1,238 (14.6%) |
Technology Access in Sullivan County
Computing Device Access in Sullivan County
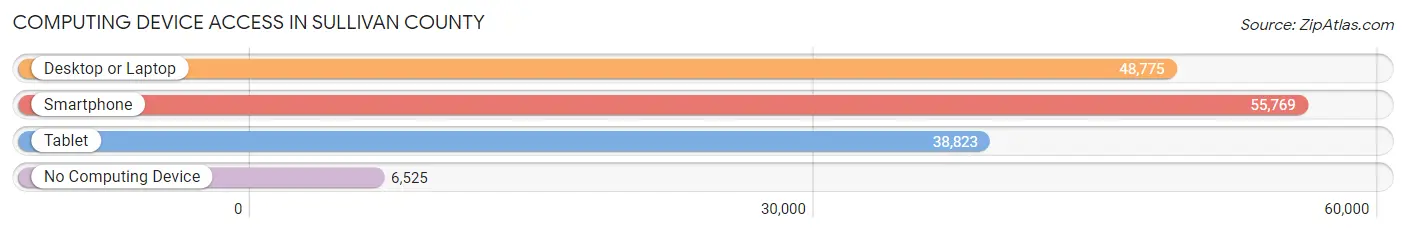
| Device Type | # Households | % Households |
| Desktop or Laptop | 48,775 | 72.2% |
| Smartphone | 55,769 | 82.5% |
| Tablet | 38,823 | 57.5% |
| No Computing Device | 6,525 | 9.7% |
| Total | 67,575 | 100.0% |
Internet Access in Sullivan County
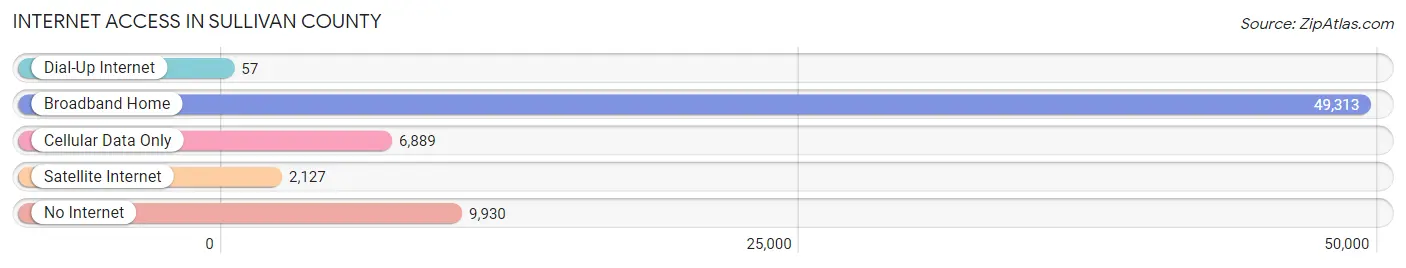
| Internet Type | # Households | % Households |
| Dial-Up Internet | 57 | 0.1% |
| Broadband Home | 49,313 | 73.0% |
| Cellular Data Only | 6,889 | 10.2% |
| Satellite Internet | 2,127 | 3.2% |
| No Internet | 9,930 | 14.7% |
| Total | 67,575 | 100.0% |
Sullivan County Summary
Sullivan County is located in the northeastern corner of Tennessee and is part of the Tri-Cities region. It is bordered by Washington County to the north, Hawkins County to the east, Johnson County to the south, and Carter County to the west. The county seat is Blountville, and the largest city is Kingsport. Sullivan County is part of the Kingsport–Bristol–Bristol, TN-VA Metropolitan Statistical Area, which is a component of the Johnson City–Kingsport–Bristol, TN-VA Combined Statistical Area – commonly known as the "Tri-Cities" region.
History
Sullivan County was formed in 1779 from a portion of Washington County. It was named for John Sullivan, a Revolutionary War general who led the Sullivan Expedition against the Iroquois in 1779. The county was part of the State of Franklin from 1784 to 1788, and was then annexed to North Carolina until 1790, when it became part of Tennessee.
The county was home to several Native American tribes, including the Cherokee, Shawnee, and Chickamauga. The first European settlers arrived in the late 1700s, and the county was officially established in 1779.
Geography
Sullivan County is located in the northeastern corner of Tennessee and is part of the Tri-Cities region. It is bordered by Washington County to the north, Hawkins County to the east, Johnson County to the south, and Carter County to the west. The county has a total area of 517 square miles, of which 514 square miles is land and 3 square miles (0.6%) is water.
The county is located in the Ridge and Valley region of the Appalachian Mountains, and is home to several mountain ranges, including the Clinch Mountains, Holston Mountains, and Bays Mountain. The Holston River runs through the county, and the Watauga River forms part of the county's western border.
Economy
Sullivan County has a diverse economy, with a mix of manufacturing, agriculture, and tourism. The county is home to several large employers, including Eastman Chemical Company, Domtar, and Eastman Kodak.
Agriculture is an important part of the county's economy, with corn, soybeans, hay, and tobacco being the main crops. The county is also home to several wineries and vineyards, as well as several apple orchards.
Tourism is also an important part of the county's economy, with several attractions, including Bays Mountain Park, Warriors' Path State Park, and the Bristol Motor Speedway.
Demographics
As of the 2010 census, Sullivan County had a population of 156,823. The racial makeup of the county was 90.2% White, 6.2% Black or African American, 0.4% Native American, 1.2% Asian, 0.1% Pacific Islander, 0.7% from other races, and 1.2% from two or more races. Hispanic or Latino of any race were 2.2% of the population.
The median income for a household in the county was $41,945, and the median income for a family was $50,945. The per capita income for the county was $21,845. About 11.2% of families and 14.7% of the population were below the poverty line, including 19.2% of those under age 18 and 10.2% of those age 65 or over.
Common Questions
What is the Total Population of Sullivan County?
Total Population of Sullivan County is 158,722.
What is the Total Male Population of Sullivan County?
Total Male Population of Sullivan County is 77,767.
What is the Total Female Population of Sullivan County?
Total Female Population of Sullivan County is 80,955.
What is the Ratio of Males per 100 Females in Sullivan County?
There are 96.06 Males per 100 Females in Sullivan County.
What is the Ratio of Females per 100 Males in Sullivan County?
There are 104.10 Females per 100 Males in Sullivan County.
What is the Median Population Age in Sullivan County?
Median Population Age in Sullivan County is 45.2 Years.
What is the Average Family Size in Sullivan County
Average Family Size in Sullivan County is 2.9 People.
What is the Average Household Size in Sullivan County
Average Household Size in Sullivan County is 2.3 People.
What is Per Capita Income in Sullivan County?
Per Capita income in Sullivan County is $33,934.
What is the Median Family Income in Sullivan County?
Median Family Income in Sullivan County is $71,464.
What is the Median Household income in Sullivan County?
Median Household Income in Sullivan County is $54,357.
What is Income or Wage Gap in Sullivan County?
Income or Wage Gap in Sullivan County is 29.1%.
Women in Sullivan County earn 70.9 cents for every dollar earned by a man.
What is Family Income Deficit in Sullivan County?
Family Income Deficit in Sullivan County is $10,672.
Families that are below poverty line in Sullivan County earn $10,672 less on average than the poverty threshold level.
What is Inequality or Gini Index in Sullivan County?
Inequality or Gini Index in Sullivan County is 0.48.
How Large is the Labor Force in Sullivan County?
There are 73,917 People in the Labor Forcein in Sullivan County.
What is the Percentage of People in the Labor Force in Sullivan County?
55.9% of People are in the Labor Force in Sullivan County.
What is the Unemployment Rate in Sullivan County?
Unemployment Rate in Sullivan County is 6.2%.