Shelby County, TN
Shelby County Map
Shelby County Overview
926,440
TOTAL POPULATION
441,579
MALE POPULATION
484,861
FEMALE POPULATION
91.07
MALES / 100 FEMALES
109.80
FEMALES / 100 MALES
35.9
MEDIAN AGE
3.3
AVG FAMILY SIZE
2.5
AVG HOUSEHOLD SIZE
$36,230
PER CAPITA INCOME
$77,264
AVG FAMILY INCOME
$59,621
AVG HOUSEHOLD INCOME
19.0%
WAGE / INCOME GAP [ % ]
81.0¢/ $1
WAGE / INCOME GAP [ $ ]
$12,200
FAMILY INCOME DEFICIT
0.51
INEQUALITY / GINI INDEX
465,460
LABOR FORCE [ PEOPLE ]
64.5%
PERCENT IN LABOR FORCE
7.3%
UNEMPLOYMENT RATE
Shelby County Area Codes
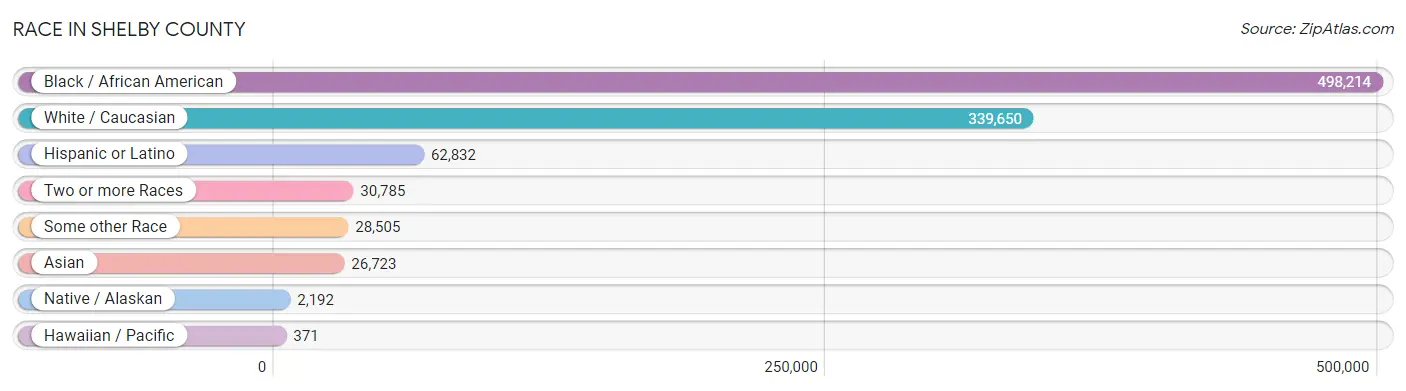
Race in Shelby County
The most populous races in Shelby County are Black / African American (498,214 | 53.8%), White / Caucasian (339,650 | 36.7%), and Hispanic or Latino (62,832 | 6.8%).
| Race | # Population | % Population |
| Asian | 26,723 | 2.9% |
| Black / African American | 498,214 | 53.8% |
| Hawaiian / Pacific | 371 | 0.0% |
| Hispanic or Latino | 62,832 | 6.8% |
| Native / Alaskan | 2,192 | 0.2% |
| White / Caucasian | 339,650 | 36.7% |
| Two or more Races | 30,785 | 3.3% |
| Some other Race | 28,505 | 3.1% |
| Total | 926,440 | 100.0% |
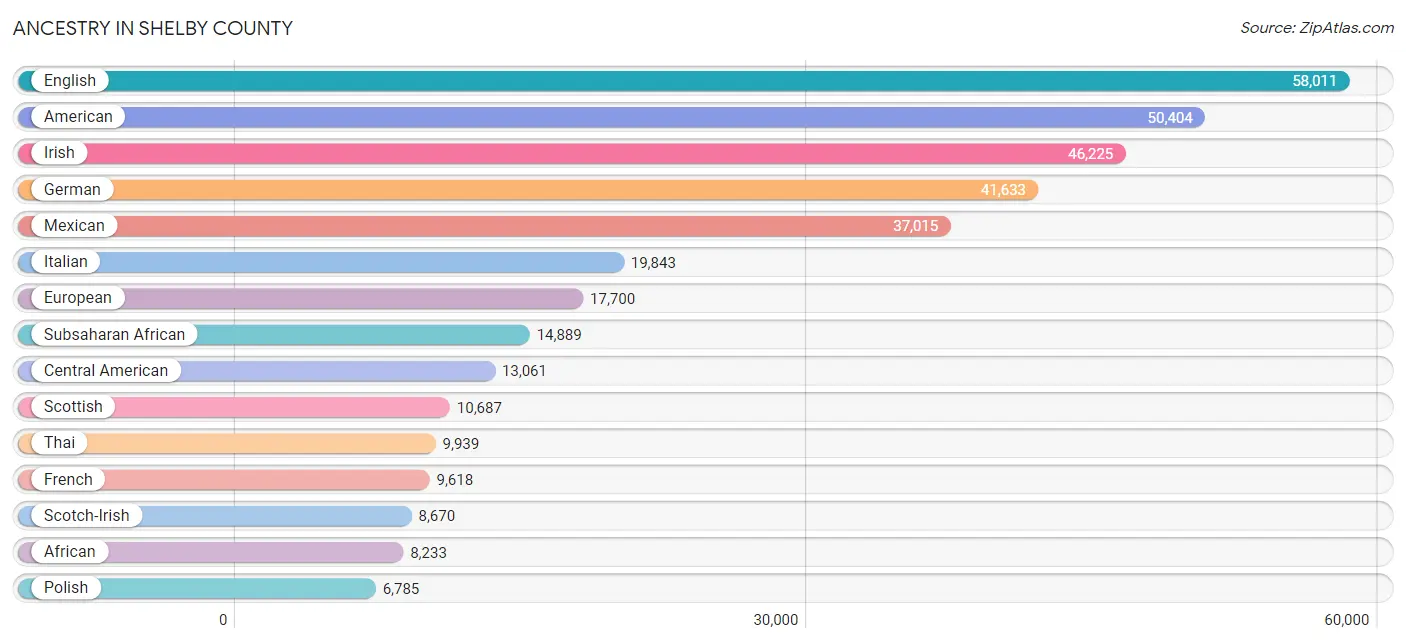
Ancestry in Shelby County
The most populous ancestries reported in Shelby County are English (58,011 | 6.3%), American (50,404 | 5.4%), Irish (46,225 | 5.0%), German (41,633 | 4.5%), and Mexican (37,015 | 4.0%), together accounting for 25.2% of all Shelby County residents.
| Ancestry | # Population | % Population |
| Afghan | 5 | 0.0% |
| African | 8,233 | 0.9% |
| Alaskan Athabascan | 5 | 0.0% |
| Albanian | 36 | 0.0% |
| Alsatian | 7 | 0.0% |
| American | 50,404 | 5.4% |
| Apache | 171 | 0.0% |
| Arab | 6,438 | 0.7% |
| Argentinean | 279 | 0.0% |
| Armenian | 156 | 0.0% |
| Assyrian / Chaldean / Syriac | 8 | 0.0% |
| Australian | 77 | 0.0% |
| Austrian | 851 | 0.1% |
| Bahamian | 51 | 0.0% |
| Bangladeshi | 148 | 0.0% |
| Barbadian | 19 | 0.0% |
| Basque | 29 | 0.0% |
| Belgian | 234 | 0.0% |
| Belizean | 44 | 0.0% |
| Bermudan | 7 | 0.0% |
| Bhutanese | 875 | 0.1% |
| Blackfeet | 187 | 0.0% |
| Bolivian | 12 | 0.0% |
| Brazilian | 263 | 0.0% |
| British | 3,361 | 0.4% |
| British West Indian | 49 | 0.0% |
| Bulgarian | 34 | 0.0% |
| Burmese | 1,720 | 0.2% |
| Cajun | 98 | 0.0% |
| Cambodian | 166 | 0.0% |
| Canadian | 587 | 0.1% |
| Cape Verdean | 57 | 0.0% |
| Celtic | 31 | 0.0% |
| Central American | 13,061 | 1.4% |
| Central American Indian | 234 | 0.0% |
| Cherokee | 1,820 | 0.2% |
| Cheyenne | 16 | 0.0% |
| Chickasaw | 61 | 0.0% |
| Chilean | 247 | 0.0% |
| Chinese | 4 | 0.0% |
| Chippewa | 11 | 0.0% |
| Choctaw | 150 | 0.0% |
| Colombian | 826 | 0.1% |
| Costa Rican | 40 | 0.0% |
| Creek | 128 | 0.0% |
| Croatian | 655 | 0.1% |
| Crow | 14 | 0.0% |
| Cuban | 1,628 | 0.2% |
| Czech | 1,254 | 0.1% |
| Czechoslovakian | 217 | 0.0% |
| Danish | 1,020 | 0.1% |
| Delaware | 2 | 0.0% |
| Dominican | 712 | 0.1% |
| Dutch | 3,641 | 0.4% |
| Eastern European | 1,504 | 0.2% |
| Ecuadorian | 121 | 0.0% |
| Egyptian | 532 | 0.1% |
| English | 58,011 | 6.3% |
| Estonian | 9 | 0.0% |
| Ethiopian | 1,104 | 0.1% |
| European | 17,700 | 1.9% |
| Filipino | 277 | 0.0% |
| Finnish | 399 | 0.0% |
| French | 9,618 | 1.0% |
| French American Indian | 2 | 0.0% |
| French Canadian | 1,238 | 0.1% |
| German | 41,633 | 4.5% |
| German Russian | 18 | 0.0% |
| Ghanaian | 479 | 0.1% |
| Greek | 1,539 | 0.2% |
| Guamanian / Chamorro | 60 | 0.0% |
| Guatemalan | 5,657 | 0.6% |
| Guyanese | 38 | 0.0% |
| Haitian | 68 | 0.0% |
| Honduran | 3,984 | 0.4% |
| Houma | 27 | 0.0% |
| Hungarian | 888 | 0.1% |
| Icelander | 10 | 0.0% |
| Indian (Asian) | 5,790 | 0.6% |
| Indonesian | 110 | 0.0% |
| Iranian | 413 | 0.0% |
| Iraqi | 22 | 0.0% |
| Irish | 46,225 | 5.0% |
| Iroquois | 34 | 0.0% |
| Israeli | 132 | 0.0% |
| Italian | 19,843 | 2.1% |
| Jamaican | 834 | 0.1% |
| Japanese | 394 | 0.0% |
| Jordanian | 158 | 0.0% |
| Kenyan | 116 | 0.0% |
| Kiowa | 11 | 0.0% |
| Korean | 4,118 | 0.4% |
| Laotian | 112 | 0.0% |
| Latvian | 76 | 0.0% |
| Lebanese | 1,333 | 0.1% |
| Liberian | 10 | 0.0% |
| Lithuanian | 639 | 0.1% |
| Lumbee | 5 | 0.0% |
| Luxembourger | 50 | 0.0% |
| Malaysian | 655 | 0.1% |
| Maltese | 5 | 0.0% |
| Mexican | 37,015 | 4.0% |
| Mexican American Indian | 671 | 0.1% |
| Mongolian | 30 | 0.0% |
| Moroccan | 118 | 0.0% |
| Native Hawaiian | 541 | 0.1% |
| Navajo | 65 | 0.0% |
| Nicaraguan | 568 | 0.1% |
| Nigerian | 2,997 | 0.3% |
| Northern European | 745 | 0.1% |
| Norwegian | 2,931 | 0.3% |
| Okinawan | 2 | 0.0% |
| Pakistani | 272 | 0.0% |
| Palestinian | 776 | 0.1% |
| Panamanian | 382 | 0.0% |
| Paraguayan | 6 | 0.0% |
| Pennsylvania German | 35 | 0.0% |
| Peruvian | 532 | 0.1% |
| Polish | 6,785 | 0.7% |
| Portuguese | 690 | 0.1% |
| Potawatomi | 44 | 0.0% |
| Pueblo | 57 | 0.0% |
| Puerto Rican | 3,172 | 0.3% |
| Puget Sound Salish | 1 | 0.0% |
| Romanian | 289 | 0.0% |
| Russian | 1,939 | 0.2% |
| Salvadoran | 2,331 | 0.3% |
| Samoan | 158 | 0.0% |
| Scandinavian | 1,423 | 0.2% |
| Scotch-Irish | 8,670 | 0.9% |
| Scottish | 10,687 | 1.1% |
| Seminole | 13 | 0.0% |
| Senegalese | 406 | 0.0% |
| Serbian | 134 | 0.0% |
| Sierra Leonean | 16 | 0.0% |
| Sioux | 105 | 0.0% |
| Slavic | 123 | 0.0% |
| Slovak | 123 | 0.0% |
| Slovene | 21 | 0.0% |
| Somali | 172 | 0.0% |
| South African | 106 | 0.0% |
| South American | 3,849 | 0.4% |
| South American Indian | 6 | 0.0% |
| Spaniard | 540 | 0.1% |
| Spanish | 695 | 0.1% |
| Spanish American | 22 | 0.0% |
| Sri Lankan | 5,266 | 0.6% |
| Subsaharan African | 14,889 | 1.6% |
| Sudanese | 168 | 0.0% |
| Swedish | 2,619 | 0.3% |
| Swiss | 1,043 | 0.1% |
| Syrian | 321 | 0.0% |
| Thai | 9,939 | 1.1% |
| Tlingit-Haida | 8 | 0.0% |
| Tongan | 12 | 0.0% |
| Trinidadian and Tobagonian | 400 | 0.0% |
| Turkish | 165 | 0.0% |
| U.S. Virgin Islander | 18 | 0.0% |
| Ugandan | 14 | 0.0% |
| Ukrainian | 435 | 0.1% |
| Uruguayan | 44 | 0.0% |
| Venezuelan | 1,603 | 0.2% |
| Vietnamese | 129 | 0.0% |
| Welsh | 3,088 | 0.3% |
| West Indian | 127 | 0.0% |
| Yaqui | 10 | 0.0% |
| Yugoslavian | 142 | 0.0% | View All 167 Rows |
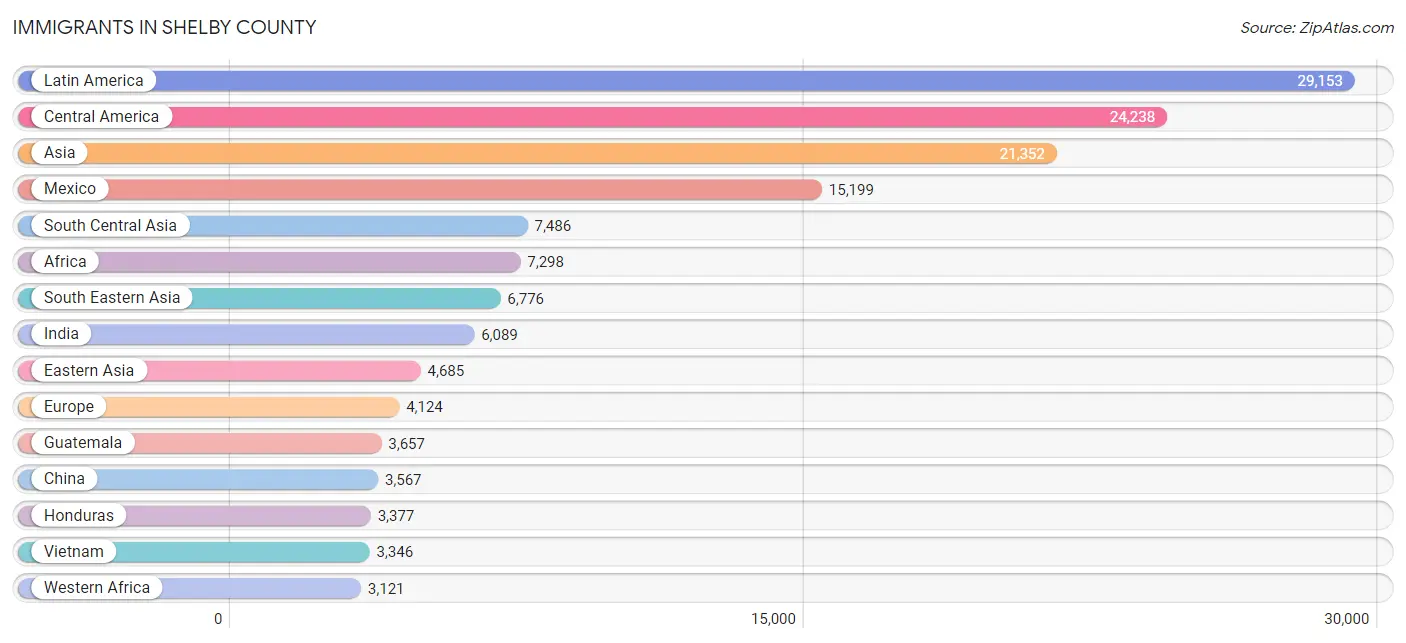
Immigrants in Shelby County
The most numerous immigrant groups reported in Shelby County came from Latin America (29,153 | 3.2%), Central America (24,238 | 2.6%), Asia (21,352 | 2.3%), Mexico (15,199 | 1.6%), and South Central Asia (7,486 | 0.8%), together accounting for 10.5% of all Shelby County residents.
| Immigration Origin | # Population | % Population |
| Afghanistan | 5 | 0.0% |
| Africa | 7,298 | 0.8% |
| Albania | 11 | 0.0% |
| Argentina | 136 | 0.0% |
| Armenia | 10 | 0.0% |
| Asia | 21,352 | 2.3% |
| Australia | 143 | 0.0% |
| Austria | 83 | 0.0% |
| Bahamas | 43 | 0.0% |
| Bangladesh | 156 | 0.0% |
| Barbados | 6 | 0.0% |
| Belarus | 33 | 0.0% |
| Belgium | 39 | 0.0% |
| Belize | 161 | 0.0% |
| Bolivia | 6 | 0.0% |
| Bosnia and Herzegovina | 71 | 0.0% |
| Brazil | 344 | 0.0% |
| Bulgaria | 34 | 0.0% |
| Cambodia | 221 | 0.0% |
| Cameroon | 18 | 0.0% |
| Canada | 897 | 0.1% |
| Caribbean | 1,886 | 0.2% |
| Central America | 24,238 | 2.6% |
| Chile | 59 | 0.0% |
| China | 3,567 | 0.4% |
| Colombia | 463 | 0.1% |
| Congo | 339 | 0.0% |
| Costa Rica | 31 | 0.0% |
| Cuba | 573 | 0.1% |
| Czechoslovakia | 42 | 0.0% |
| Dominica | 44 | 0.0% |
| Dominican Republic | 295 | 0.0% |
| Eastern Africa | 1,651 | 0.2% |
| Eastern Asia | 4,685 | 0.5% |
| Eastern Europe | 1,299 | 0.1% |
| Ecuador | 37 | 0.0% |
| Egypt | 760 | 0.1% |
| El Salvador | 1,399 | 0.2% |
| England | 579 | 0.1% |
| Eritrea | 37 | 0.0% |
| Ethiopia | 1,149 | 0.1% |
| Europe | 4,124 | 0.4% |
| France | 77 | 0.0% |
| Germany | 664 | 0.1% |
| Ghana | 254 | 0.0% |
| Greece | 102 | 0.0% |
| Guatemala | 3,657 | 0.4% |
| Guyana | 158 | 0.0% |
| Haiti | 24 | 0.0% |
| Honduras | 3,377 | 0.4% |
| Hong Kong | 92 | 0.0% |
| India | 6,089 | 0.7% |
| Indonesia | 132 | 0.0% |
| Iran | 401 | 0.0% |
| Iraq | 78 | 0.0% |
| Ireland | 216 | 0.0% |
| Israel | 164 | 0.0% |
| Italy | 197 | 0.0% |
| Jamaica | 332 | 0.0% |
| Japan | 266 | 0.0% |
| Jordan | 241 | 0.0% |
| Kazakhstan | 25 | 0.0% |
| Kenya | 137 | 0.0% |
| Korea | 773 | 0.1% |
| Kuwait | 75 | 0.0% |
| Laos | 221 | 0.0% |
| Latin America | 29,153 | 3.2% |
| Lebanon | 455 | 0.1% |
| Liberia | 11 | 0.0% |
| Lithuania | 12 | 0.0% |
| Malaysia | 106 | 0.0% |
| Mexico | 15,199 | 1.6% |
| Middle Africa | 458 | 0.1% |
| Morocco | 10 | 0.0% |
| Nepal | 139 | 0.0% |
| Netherlands | 94 | 0.0% |
| Nicaragua | 237 | 0.0% |
| Nigeria | 1,439 | 0.2% |
| Northern Africa | 1,090 | 0.1% |
| Northern Europe | 1,432 | 0.2% |
| Oceania | 192 | 0.0% |
| Pakistan | 640 | 0.1% |
| Panama | 158 | 0.0% |
| Peru | 215 | 0.0% |
| Philippines | 2,537 | 0.3% |
| Poland | 428 | 0.1% |
| Portugal | 25 | 0.0% |
| Romania | 112 | 0.0% |
| Russia | 272 | 0.0% |
| Saudi Arabia | 581 | 0.1% |
| Scotland | 45 | 0.0% |
| Senegal | 576 | 0.1% |
| Serbia | 21 | 0.0% |
| Sierra Leone | 19 | 0.0% |
| Singapore | 35 | 0.0% |
| Somalia | 50 | 0.0% |
| South Africa | 143 | 0.0% |
| South America | 3,029 | 0.3% |
| South Central Asia | 7,486 | 0.8% |
| South Eastern Asia | 6,776 | 0.7% |
| Southern Europe | 428 | 0.1% |
| Spain | 104 | 0.0% |
| St. Vincent and the Grenadines | 16 | 0.0% |
| Sudan | 264 | 0.0% |
| Sweden | 62 | 0.0% |
| Switzerland | 8 | 0.0% |
| Syria | 91 | 0.0% |
| Taiwan | 310 | 0.0% |
| Thailand | 119 | 0.0% |
| Trinidad and Tobago | 476 | 0.1% |
| Turkey | 140 | 0.0% |
| Uganda | 28 | 0.0% |
| Ukraine | 179 | 0.0% |
| Uruguay | 31 | 0.0% |
| Uzbekistan | 31 | 0.0% |
| Venezuela | 1,561 | 0.2% |
| Vietnam | 3,346 | 0.4% |
| West Indies | 34 | 0.0% |
| Western Africa | 3,121 | 0.3% |
| Western Asia | 2,209 | 0.2% |
| Western Europe | 965 | 0.1% |
| Yemen | 348 | 0.0% |
| Zaire | 101 | 0.0% | View All 123 Rows |
Sex and Age in Shelby County
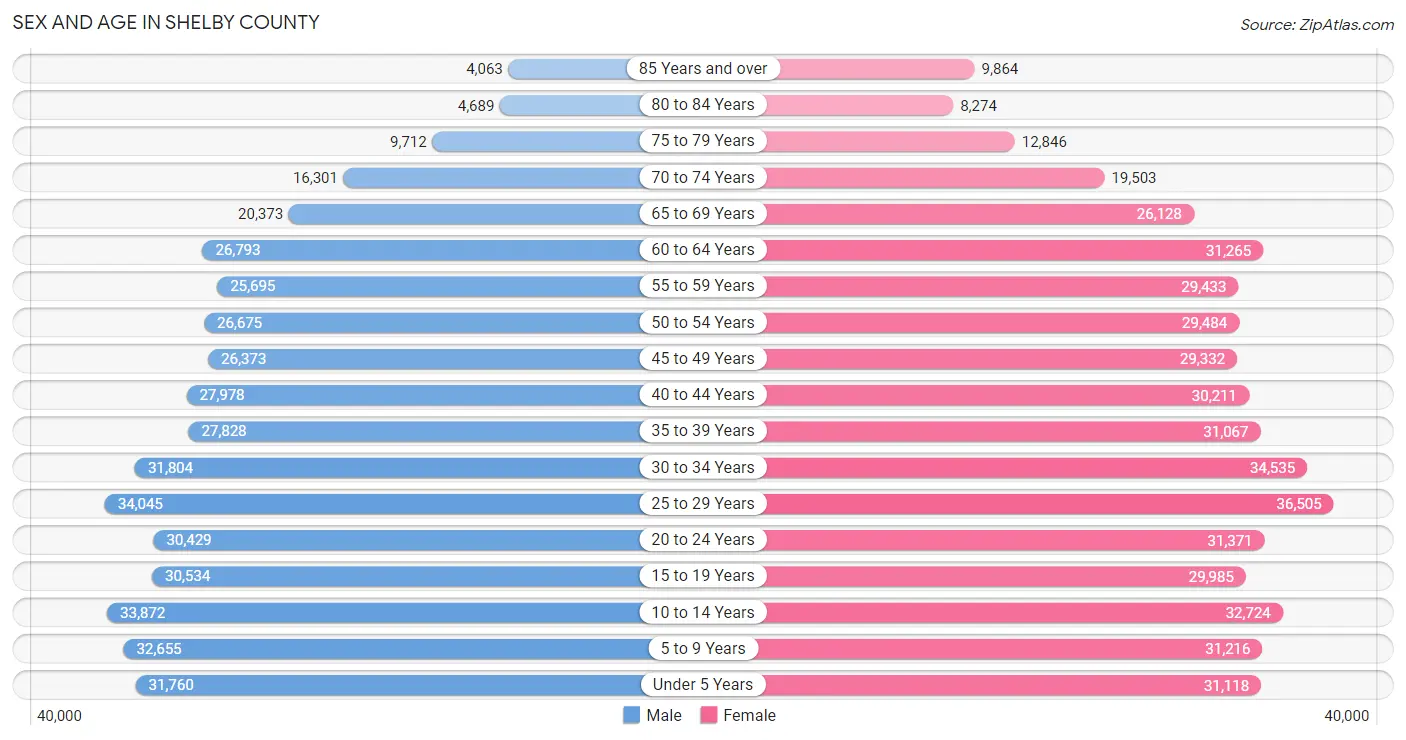
Sex and Age in Shelby County
The most populous age groups in Shelby County are 25 to 29 Years (34,045 | 7.7%) for men and 25 to 29 Years (36,505 | 7.5%) for women.
| Age Bracket | Male | Female |
| Under 5 Years | 31,760 (7.2%) | 31,118 (6.4%) |
| 5 to 9 Years | 32,655 (7.4%) | 31,216 (6.4%) |
| 10 to 14 Years | 33,872 (7.7%) | 32,724 (6.8%) |
| 15 to 19 Years | 30,534 (6.9%) | 29,985 (6.2%) |
| 20 to 24 Years | 30,429 (6.9%) | 31,371 (6.5%) |
| 25 to 29 Years | 34,045 (7.7%) | 36,505 (7.5%) |
| 30 to 34 Years | 31,804 (7.2%) | 34,535 (7.1%) |
| 35 to 39 Years | 27,828 (6.3%) | 31,067 (6.4%) |
| 40 to 44 Years | 27,978 (6.3%) | 30,211 (6.2%) |
| 45 to 49 Years | 26,373 (6.0%) | 29,332 (6.0%) |
| 50 to 54 Years | 26,675 (6.0%) | 29,484 (6.1%) |
| 55 to 59 Years | 25,695 (5.8%) | 29,433 (6.1%) |
| 60 to 64 Years | 26,793 (6.1%) | 31,265 (6.5%) |
| 65 to 69 Years | 20,373 (4.6%) | 26,128 (5.4%) |
| 70 to 74 Years | 16,301 (3.7%) | 19,503 (4.0%) |
| 75 to 79 Years | 9,712 (2.2%) | 12,846 (2.6%) |
| 80 to 84 Years | 4,689 (1.1%) | 8,274 (1.7%) |
| 85 Years and over | 4,063 (0.9%) | 9,864 (2.0%) |
| Total | 441,579 (100.0%) | 484,861 (100.0%) |
Families and Households in Shelby County
Median Family Size in Shelby County
The median family size in Shelby County is 3.33 persons per family, with single female/mother families (69,725 | 32.0%) accounting for the largest median family size of 3.53 persons per family. On the other hand, single male/father families (17,036 | 7.8%) represent the smallest median family size with 3.07 persons per family.

| Family Type | # Families | Family Size |
| Married-Couple | 130,920 (60.1%) | 3.25 |
| Single Male/Father | 17,036 (7.8%) | 3.07 |
| Single Female/Mother | 69,725 (32.0%) | 3.53 |
| Total Families | 217,681 (100.0%) | 3.33 |
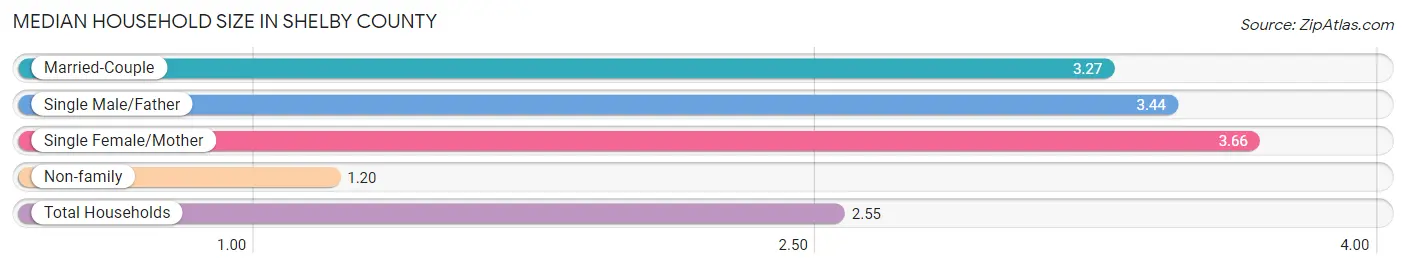
Median Household Size in Shelby County
The median household size in Shelby County is 2.55 persons per household, with single female/mother households (69,725 | 19.5%) accounting for the largest median household size of 3.66 persons per household. non-family households (140,158 | 39.2%) represent the smallest median household size with 1.20 persons per household.
| Household Type | # Households | Household Size |
| Married-Couple | 130,920 (36.6%) | 3.27 |
| Single Male/Father | 17,036 (4.8%) | 3.44 |
| Single Female/Mother | 69,725 (19.5%) | 3.66 |
| Non-family | 140,158 (39.2%) | 1.20 |
| Total Households | 357,839 (100.0%) | 2.55 |
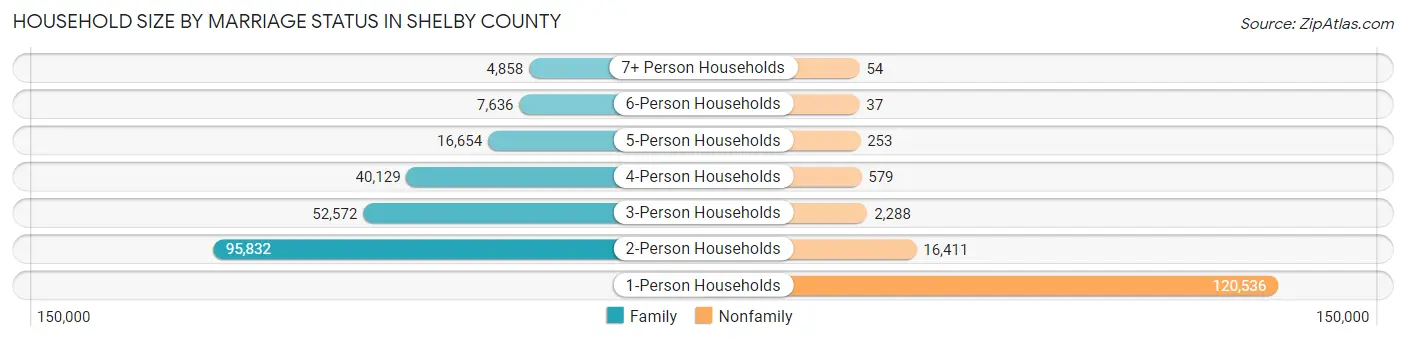
Household Size by Marriage Status in Shelby County
Out of a total of 357,839 households in Shelby County, 217,681 (60.8%) are family households, while 140,158 (39.2%) are nonfamily households. The most numerous type of family households are 2-person households, comprising 95,832, and the most common type of nonfamily households are 1-person households, comprising 120,536.
| Household Size | Family Households | Nonfamily Households |
| 1-Person Households | - | 120,536 (33.7%) |
| 2-Person Households | 95,832 (26.8%) | 16,411 (4.6%) |
| 3-Person Households | 52,572 (14.7%) | 2,288 (0.6%) |
| 4-Person Households | 40,129 (11.2%) | 579 (0.2%) |
| 5-Person Households | 16,654 (4.6%) | 253 (0.1%) |
| 6-Person Households | 7,636 (2.1%) | 37 (0.0%) |
| 7+ Person Households | 4,858 (1.4%) | 54 (0.0%) |
| Total | 217,681 (60.8%) | 140,158 (39.2%) |
Female Fertility in Shelby County
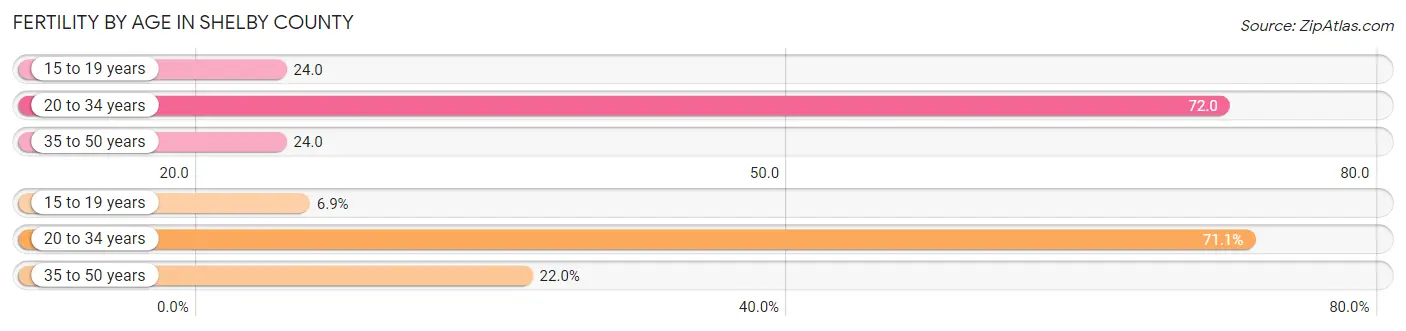
Fertility by Age in Shelby County
Average fertility rate in Shelby County is 45.0 births per 1,000 women. Women in the age bracket of 20 to 34 years have the highest fertility rate with 72.0 births per 1,000 women. Women in the age bracket of 20 to 34 years acount for 71.1% of all women with births.
| Age Bracket | Women with Births | Births / 1,000 Women |
| 15 to 19 years | 719 (6.9%) | 24.0 |
| 20 to 34 years | 7,392 (71.1%) | 72.0 |
| 35 to 50 years | 2,292 (22.0%) | 24.0 |
| Total | 10,403 (100.0%) | 45.0 |
Fertility by Age by Marriage Status in Shelby County
43.7% of women with births (10,403) in Shelby County are married. The highest percentage of unmarried women with births falls into 15 to 19 years age bracket with 97.1% of them unmarried at the time of birth, while the lowest percentage of unmarried women with births belong to 35 to 50 years age bracket with 37.7% of them unmarried.
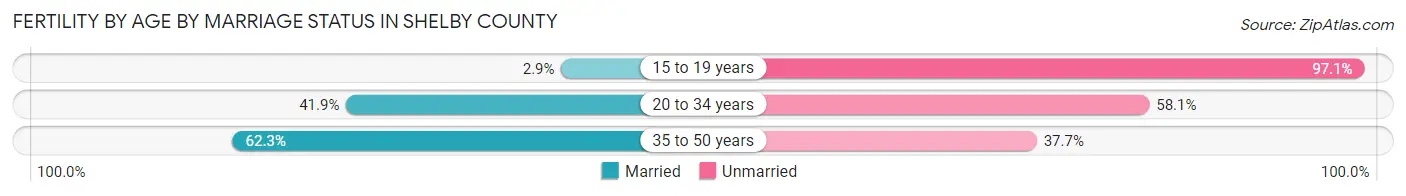
| Age Bracket | Married | Unmarried |
| 15 to 19 years | 21 (2.9%) | 698 (97.1%) |
| 20 to 34 years | 3,097 (41.9%) | 4,295 (58.1%) |
| 35 to 50 years | 1,428 (62.3%) | 864 (37.7%) |
| Total | 4,546 (43.7%) | 5,857 (56.3%) |
Fertility by Education in Shelby County
Average fertility rate in Shelby County is 45.0 births per 1,000 women. Women with the education attainment of high school diploma have the highest fertility rate of 55.0 births per 1,000 women, while women with the education attainment of less than high school have the lowest fertility at 34.0 births per 1,000 women. Women with the education attainment of high school diploma represent 28.9% of all women with births.
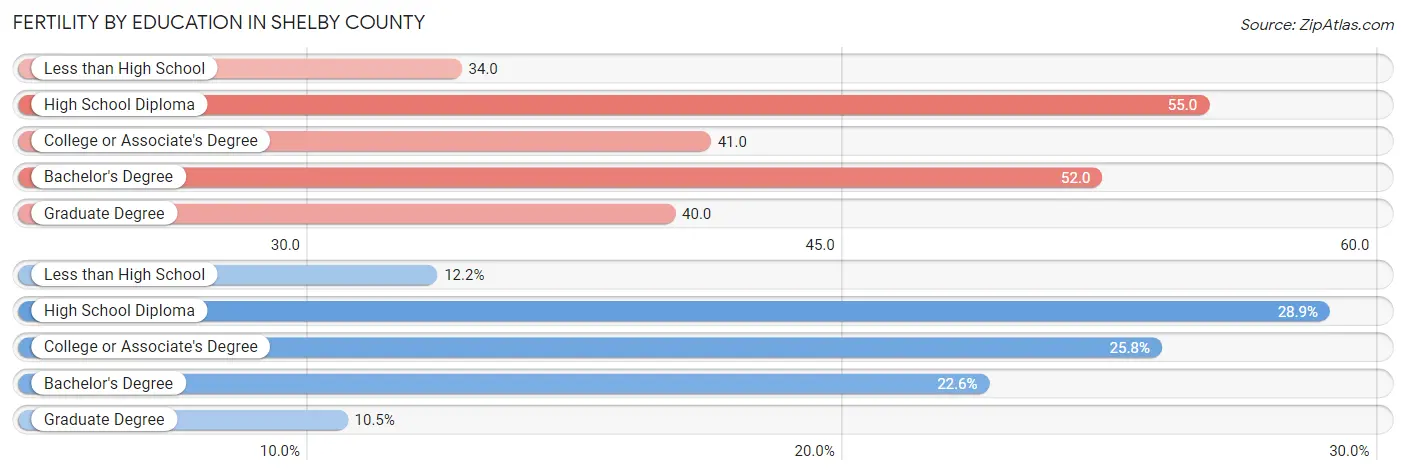
| Educational Attainment | Women with Births | Births / 1,000 Women |
| Less than High School | 1,270 (12.2%) | 34.0 |
| High School Diploma | 3,010 (28.9%) | 55.0 |
| College or Associate's Degree | 2,682 (25.8%) | 41.0 |
| Bachelor's Degree | 2,346 (22.6%) | 52.0 |
| Graduate Degree | 1,095 (10.5%) | 40.0 |
| Total | 10,403 (100.0%) | 45.0 |
Fertility by Education by Marriage Status in Shelby County
56.3% of women with births in Shelby County are unmarried. Women with the educational attainment of graduate degree are most likely to be married with 93.5% of them married at childbirth, while women with the educational attainment of high school diploma are least likely to be married with 75.8% of them unmarried at childbirth.
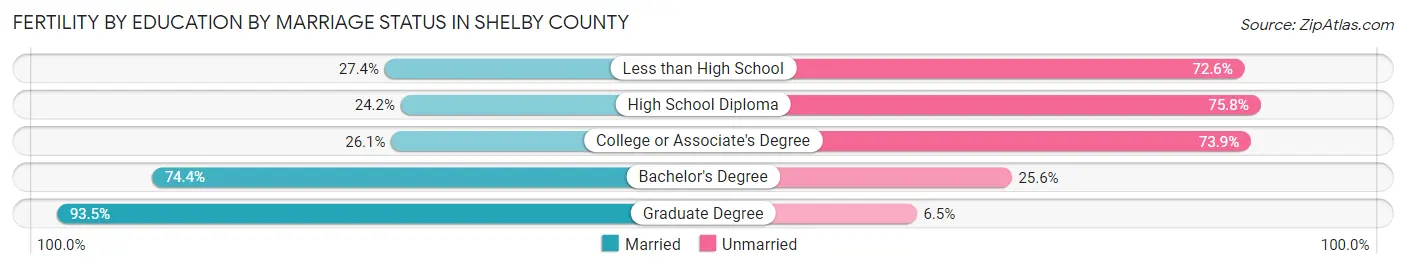
| Educational Attainment | Married | Unmarried |
| Less than High School | 348 (27.4%) | 922 (72.6%) |
| High School Diploma | 728 (24.2%) | 2,282 (75.8%) |
| College or Associate's Degree | 700 (26.1%) | 1,982 (73.9%) |
| Bachelor's Degree | 1,745 (74.4%) | 601 (25.6%) |
| Graduate Degree | 1,024 (93.5%) | 71 (6.5%) |
| Total | 4,546 (43.7%) | 5,857 (56.3%) |
Income in Shelby County
Income Overview in Shelby County
Per Capita Income in Shelby County is $36,230, while median incomes of families and households are $77,264 and $59,621 respectively.
| Characteristic | Number | Measure |
| Per Capita Income | 926,440 | $36,230 |
| Median Family Income | 217,681 | $77,264 |
| Mean Family Income | 217,681 | $111,421 |
| Median Household Income | 357,839 | $59,621 |
| Mean Household Income | 357,839 | $90,500 |
| Income Deficit | 217,681 | $12,200 |
| Wage / Income Gap (%) | 926,440 | 19.02% |
| Wage / Income Gap ($) | 926,440 | 80.98¢ per $1 |
| Gini / Inequality Index | 926,440 | 0.51 |
Earnings by Sex in Shelby County
Average Earnings in Shelby County are $38,538, $42,987 for men and $34,810 for women, a difference of 19.0%.
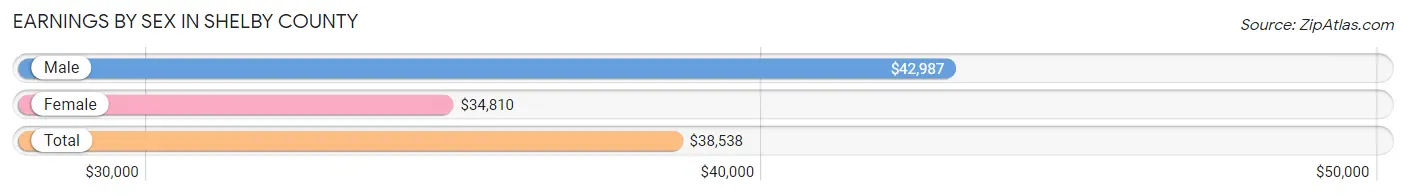
| Sex | Number | Average Earnings |
| Male | 236,125 (49.8%) | $42,987 |
| Female | 238,028 (50.2%) | $34,810 |
| Total | 474,153 (100.0%) | $38,538 |
Earnings by Sex by Income Bracket in Shelby County
The most common earnings brackets in Shelby County are $100,000+ for men (41,152 | 17.4%) and $25,000 to $29,999 for women (18,228 | 7.7%).
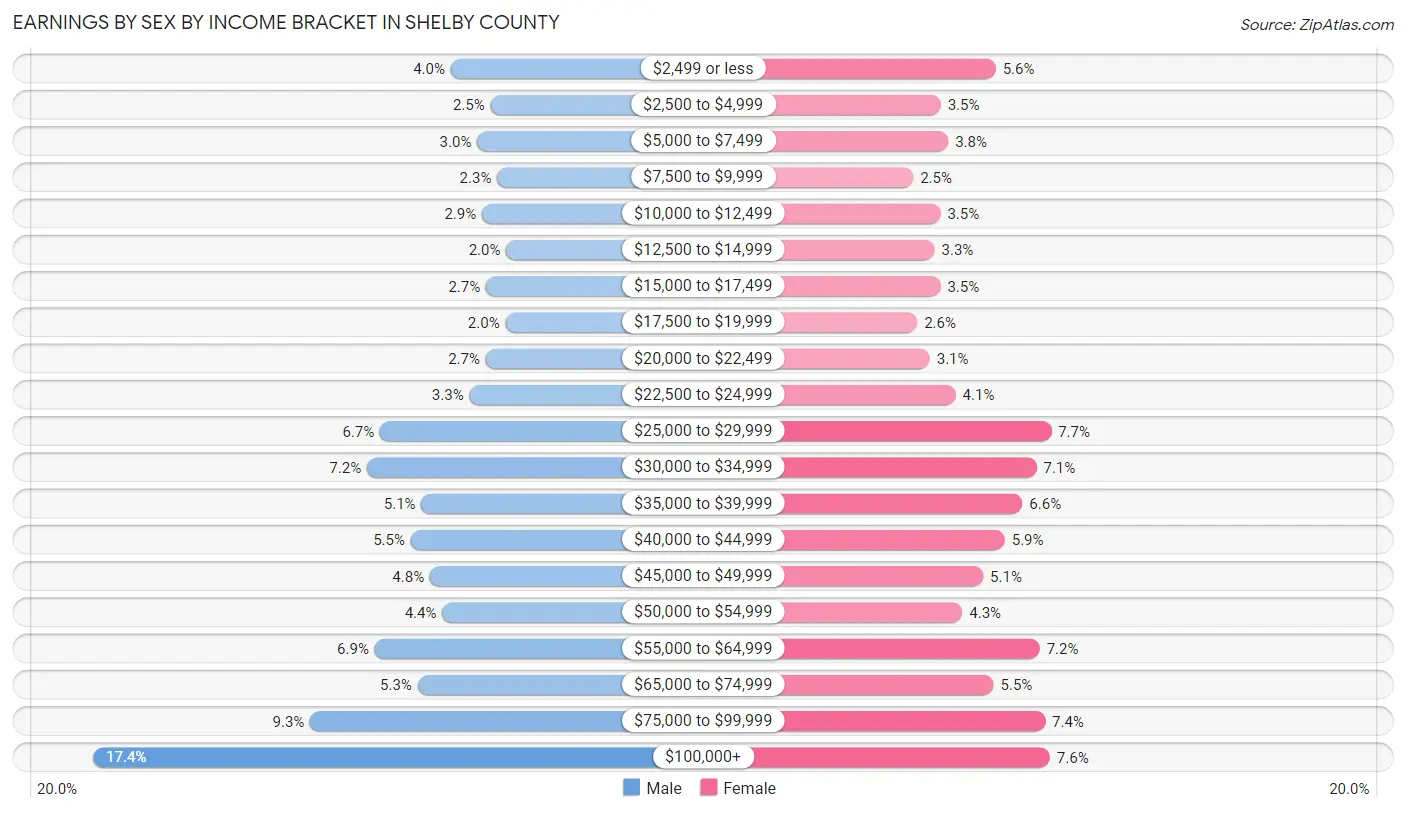
| Income | Male | Female |
| $2,499 or less | 9,518 (4.0%) | 13,288 (5.6%) |
| $2,500 to $4,999 | 5,996 (2.5%) | 8,388 (3.5%) |
| $5,000 to $7,499 | 7,188 (3.0%) | 9,049 (3.8%) |
| $7,500 to $9,999 | 5,407 (2.3%) | 5,927 (2.5%) |
| $10,000 to $12,499 | 6,745 (2.9%) | 8,355 (3.5%) |
| $12,500 to $14,999 | 4,602 (1.9%) | 7,827 (3.3%) |
| $15,000 to $17,499 | 6,393 (2.7%) | 8,364 (3.5%) |
| $17,500 to $19,999 | 4,672 (2.0%) | 6,273 (2.6%) |
| $20,000 to $22,499 | 6,420 (2.7%) | 7,400 (3.1%) |
| $22,500 to $24,999 | 7,873 (3.3%) | 9,700 (4.1%) |
| $25,000 to $29,999 | 15,771 (6.7%) | 18,228 (7.7%) |
| $30,000 to $34,999 | 16,932 (7.2%) | 16,925 (7.1%) |
| $35,000 to $39,999 | 12,110 (5.1%) | 15,655 (6.6%) |
| $40,000 to $44,999 | 13,062 (5.5%) | 14,095 (5.9%) |
| $45,000 to $49,999 | 11,359 (4.8%) | 12,152 (5.1%) |
| $50,000 to $54,999 | 10,262 (4.3%) | 10,304 (4.3%) |
| $55,000 to $64,999 | 16,240 (6.9%) | 17,198 (7.2%) |
| $65,000 to $74,999 | 12,452 (5.3%) | 13,095 (5.5%) |
| $75,000 to $99,999 | 21,971 (9.3%) | 17,682 (7.4%) |
| $100,000+ | 41,152 (17.4%) | 18,123 (7.6%) |
| Total | 236,125 (100.0%) | 238,028 (100.0%) |
Earnings by Sex by Educational Attainment in Shelby County
Average earnings in Shelby County are $48,459 for men and $39,172 for women, a difference of 19.2%. Men with an educational attainment of graduate degree enjoy the highest average annual earnings of $101,311, while those with less than high school education earn the least with $30,214. Women with an educational attainment of graduate degree earn the most with the average annual earnings of $69,114, while those with less than high school education have the smallest earnings of $21,519.
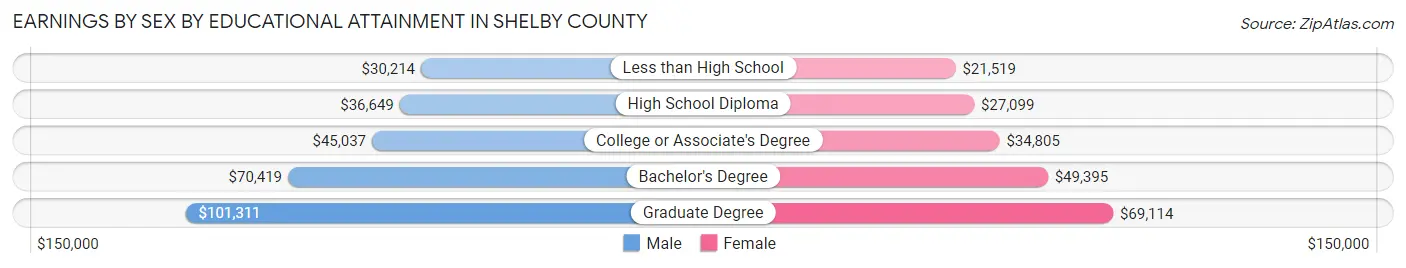
| Educational Attainment | Male Income | Female Income |
| Less than High School | $30,214 | $21,519 |
| High School Diploma | $36,649 | $27,099 |
| College or Associate's Degree | $45,037 | $34,805 |
| Bachelor's Degree | $70,419 | $49,395 |
| Graduate Degree | $101,311 | $69,114 |
| Total | $48,459 | $39,172 |
Family Income in Shelby County
Family Income Brackets in Shelby County
According to the Shelby County family income data, there are 39,183 families falling into the $100,000 to $149,999 income range, which is the most common income bracket and makes up 18.0% of all families. Conversely, the $10,000 to $14,999 income bracket is the least frequent group with only 5,660 families (2.6%) belonging to this category.
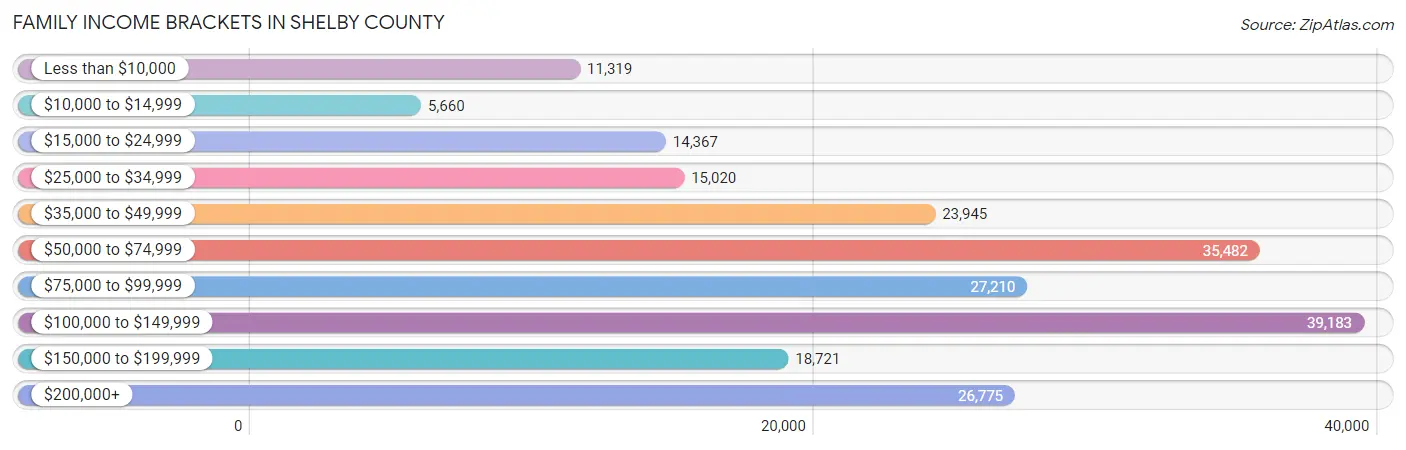
| Income Bracket | # Families | % Families |
| Less than $10,000 | 11,319 | 5.2% |
| $10,000 to $14,999 | 5,660 | 2.6% |
| $15,000 to $24,999 | 14,367 | 6.6% |
| $25,000 to $34,999 | 15,020 | 6.9% |
| $35,000 to $49,999 | 23,945 | 11.0% |
| $50,000 to $74,999 | 35,482 | 16.3% |
| $75,000 to $99,999 | 27,210 | 12.5% |
| $100,000 to $149,999 | 39,183 | 18.0% |
| $150,000 to $199,999 | 18,721 | 8.6% |
| $200,000+ | 26,775 | 12.3% |
Family Income by Famaliy Size in Shelby County
4-person families (37,541 | 17.2%) account for the highest median family income in Shelby County with $99,186 per family, while 2-person families (102,072 | 46.9%) have the highest median income of $35,787 per family member.
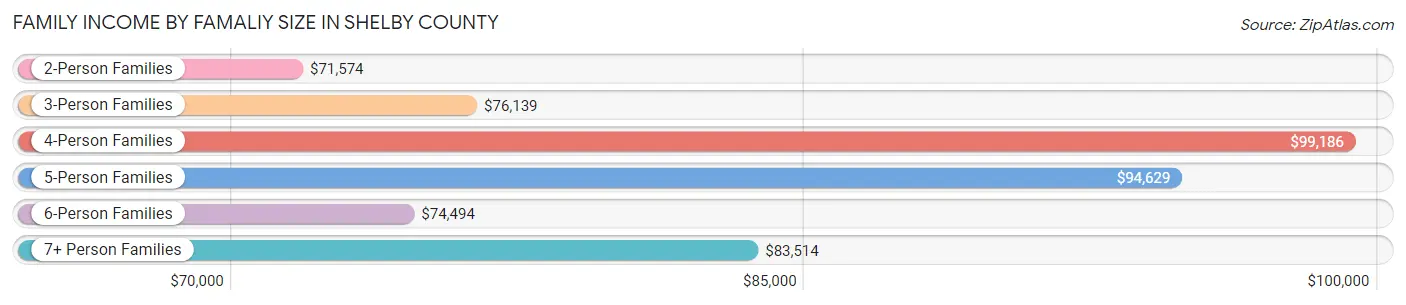
| Income Bracket | # Families | Median Income |
| 2-Person Families | 102,072 (46.9%) | $71,574 |
| 3-Person Families | 51,265 (23.5%) | $76,139 |
| 4-Person Families | 37,541 (17.2%) | $99,186 |
| 5-Person Families | 15,447 (7.1%) | $94,629 |
| 6-Person Families | 7,132 (3.3%) | $74,494 |
| 7+ Person Families | 4,224 (1.9%) | $83,514 |
| Total | 217,681 (100.0%) | $77,264 |
Family Income by Number of Earners in Shelby County
The median family income in Shelby County is $77,264, with families comprising 3+ earners (21,701) having the highest median family income of $130,153, while families with no earners (29,044) have the lowest median family income of $32,597, accounting for 10.0% and 13.3% of families, respectively.
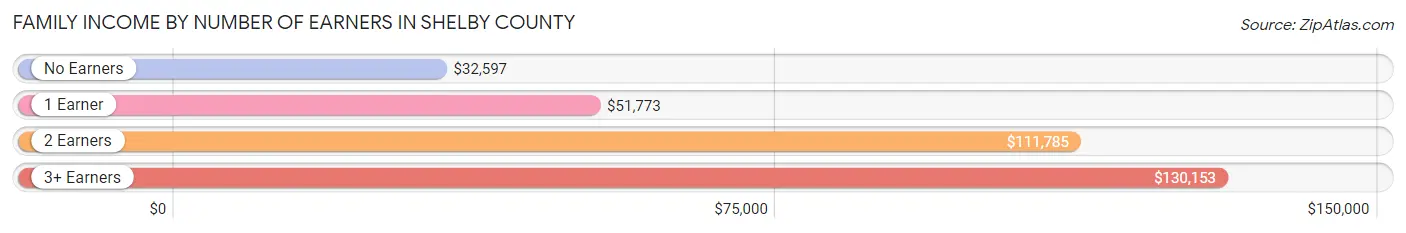
| Number of Earners | # Families | Median Income |
| No Earners | 29,044 (13.3%) | $32,597 |
| 1 Earner | 83,135 (38.2%) | $51,773 |
| 2 Earners | 83,801 (38.5%) | $111,785 |
| 3+ Earners | 21,701 (10.0%) | $130,153 |
| Total | 217,681 (100.0%) | $77,264 |
Household Income in Shelby County
Household Income Brackets in Shelby County
With 59,401 households falling in the category, the $50,000 to $74,999 income range is the most frequent in Shelby County, accounting for 16.6% of all households. In contrast, only 18,250 households (5.1%) fall into the $10,000 to $14,999 income bracket, making it the least populous group.
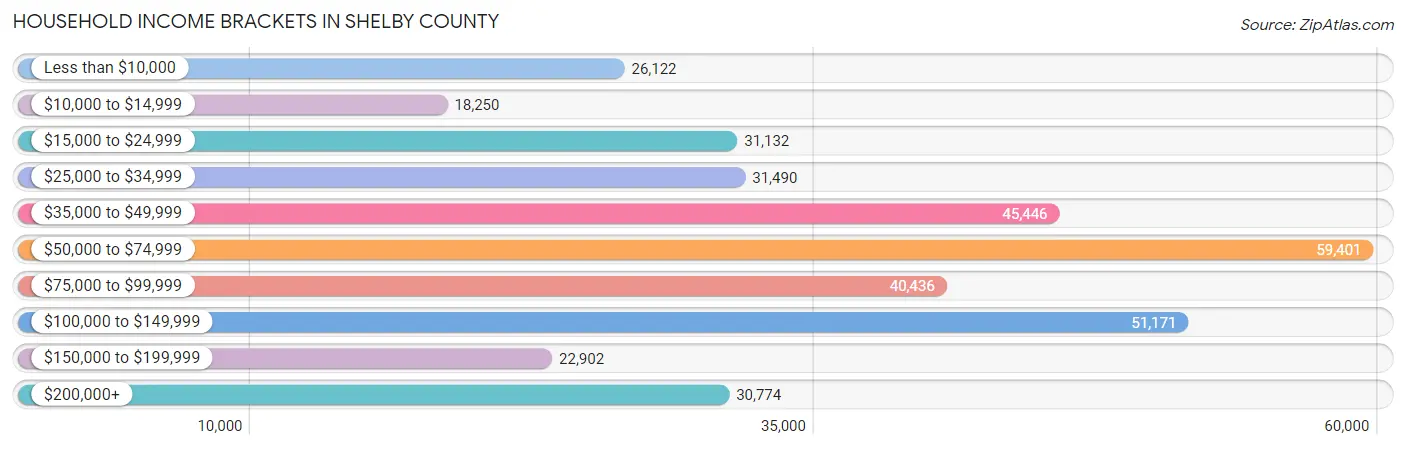
| Income Bracket | # Households | % Households |
| Less than $10,000 | 26,122 | 7.3% |
| $10,000 to $14,999 | 18,250 | 5.1% |
| $15,000 to $24,999 | 31,132 | 8.7% |
| $25,000 to $34,999 | 31,490 | 8.8% |
| $35,000 to $49,999 | 45,446 | 12.7% |
| $50,000 to $74,999 | 59,401 | 16.6% |
| $75,000 to $99,999 | 40,436 | 11.3% |
| $100,000 to $149,999 | 51,171 | 14.3% |
| $150,000 to $199,999 | 22,902 | 6.4% |
| $200,000+ | 30,774 | 8.6% |
Household Income by Householder Age in Shelby County
The median household income in Shelby County is $59,621, with the highest median household income of $73,464 found in the 45 to 64 years age bracket for the primary householder. A total of 132,393 households (37.0%) fall into this category. Meanwhile, the 15 to 24 years age bracket for the primary householder has the lowest median household income of $32,691, with 14,463 households (4.0%) in this group.
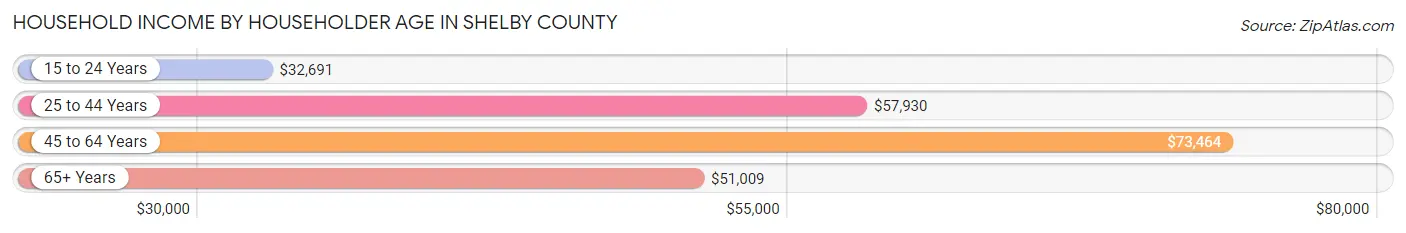
| Income Bracket | # Households | Median Income |
| 15 to 24 Years | 14,463 (4.0%) | $32,691 |
| 25 to 44 Years | 124,996 (34.9%) | $57,930 |
| 45 to 64 Years | 132,393 (37.0%) | $73,464 |
| 65+ Years | 85,987 (24.0%) | $51,009 |
| Total | 357,839 (100.0%) | $59,621 |
Poverty in Shelby County
Income Below Poverty by Sex and Age in Shelby County
With 16.4% poverty level for males and 19.6% for females among the residents of Shelby County, 5 year old males and 5 year old females are the most vulnerable to poverty, with 2,483 males (38.6%) and 2,241 females (32.7%) in their respective age groups living below the poverty level.
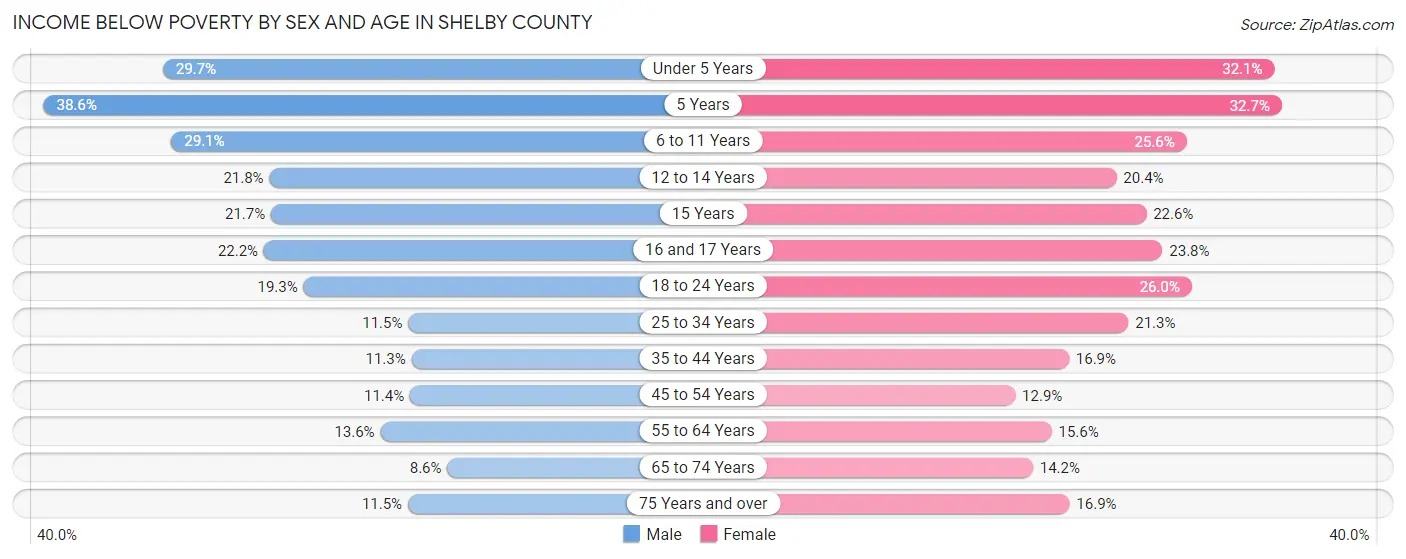
| Age Bracket | Male | Female |
| Under 5 Years | 9,208 (29.7%) | 9,698 (32.1%) |
| 5 Years | 2,483 (38.6%) | 2,241 (32.7%) |
| 6 to 11 Years | 11,421 (29.1%) | 9,395 (25.6%) |
| 12 to 14 Years | 4,371 (21.8%) | 3,992 (20.4%) |
| 15 Years | 1,300 (21.7%) | 1,218 (22.6%) |
| 16 and 17 Years | 2,872 (22.2%) | 3,188 (23.8%) |
| 18 to 24 Years | 7,661 (19.3%) | 10,449 (26.0%) |
| 25 to 34 Years | 7,340 (11.5%) | 15,041 (21.3%) |
| 35 to 44 Years | 6,120 (11.3%) | 10,309 (16.9%) |
| 45 to 54 Years | 5,953 (11.4%) | 7,540 (12.9%) |
| 55 to 64 Years | 7,045 (13.6%) | 9,417 (15.6%) |
| 65 to 74 Years | 3,114 (8.6%) | 6,396 (14.2%) |
| 75 Years and over | 2,072 (11.5%) | 5,017 (16.9%) |
| Total | 70,960 (16.4%) | 93,901 (19.6%) |
Income Above Poverty by Sex and Age in Shelby County
According to the poverty statistics in Shelby County, males aged 65 to 74 years and females aged 45 to 54 years are the age groups that are most secure financially, with 91.4% of males and 87.1% of females in these age groups living above the poverty line.
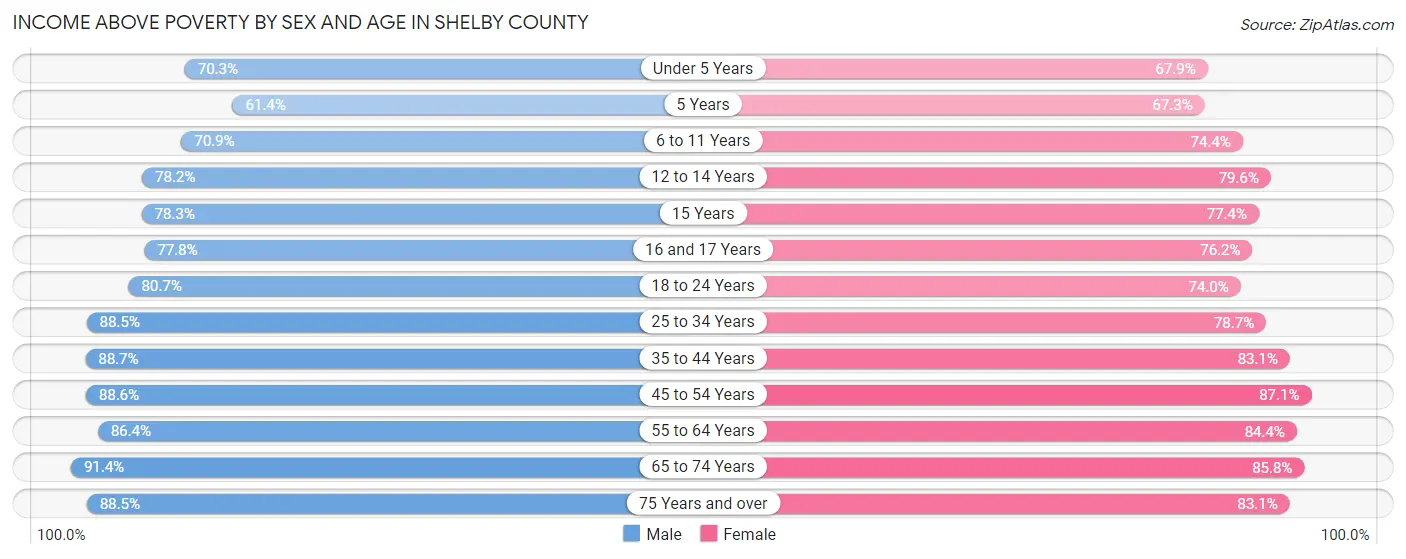
| Age Bracket | Male | Female |
| Under 5 Years | 21,754 (70.3%) | 20,505 (67.9%) |
| 5 Years | 3,951 (61.4%) | 4,621 (67.3%) |
| 6 to 11 Years | 27,833 (70.9%) | 27,298 (74.4%) |
| 12 to 14 Years | 15,663 (78.2%) | 15,591 (79.6%) |
| 15 Years | 4,692 (78.3%) | 4,171 (77.4%) |
| 16 and 17 Years | 10,047 (77.8%) | 10,207 (76.2%) |
| 18 to 24 Years | 32,052 (80.7%) | 29,777 (74.0%) |
| 25 to 34 Years | 56,441 (88.5%) | 55,678 (78.7%) |
| 35 to 44 Years | 48,168 (88.7%) | 50,843 (83.1%) |
| 45 to 54 Years | 46,381 (88.6%) | 51,024 (87.1%) |
| 55 to 64 Years | 44,837 (86.4%) | 51,058 (84.4%) |
| 65 to 74 Years | 33,033 (91.4%) | 38,712 (85.8%) |
| 75 Years and over | 15,884 (88.5%) | 24,672 (83.1%) |
| Total | 360,736 (83.6%) | 384,157 (80.4%) |
Income Below Poverty Among Married-Couple Families in Shelby County
The poverty statistics for married-couple families in Shelby County show that 4.9% or 6,407 of the total 130,920 families live below the poverty line. Families with 5 or more children have the highest poverty rate of 27.6%, comprising of 271 families. On the other hand, families with no children have the lowest poverty rate of 3.9%, which includes 3,035 families.
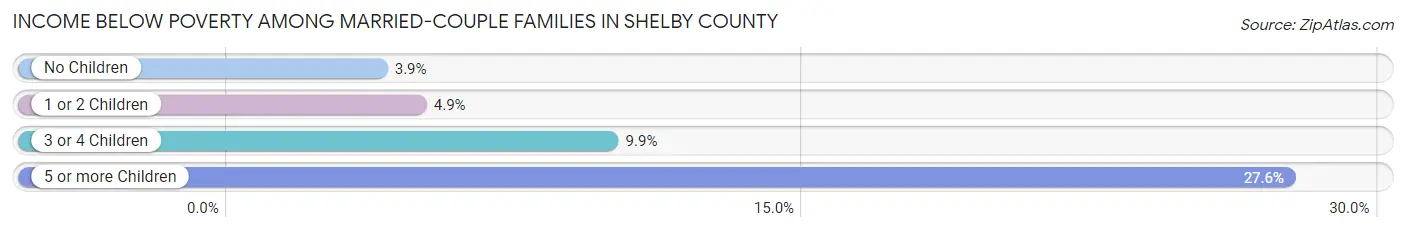
| Children | Above Poverty | Below Poverty |
| No Children | 74,509 (96.1%) | 3,035 (3.9%) |
| 1 or 2 Children | 39,971 (95.1%) | 2,072 (4.9%) |
| 3 or 4 Children | 9,323 (90.1%) | 1,029 (9.9%) |
| 5 or more Children | 710 (72.4%) | 271 (27.6%) |
| Total | 124,513 (95.1%) | 6,407 (4.9%) |
Income Below Poverty Among Single-Parent Households in Shelby County
According to the poverty data in Shelby County, 16.7% or 2,850 single-father households and 29.0% or 20,201 single-mother households are living below the poverty line. Among single-father households, those with 3 or 4 children have the highest poverty rate, with 591 households (44.1%) experiencing poverty. Likewise, among single-mother households, those with 5 or more children have the highest poverty rate, with 1,181 households (86.7%) falling below the poverty line.
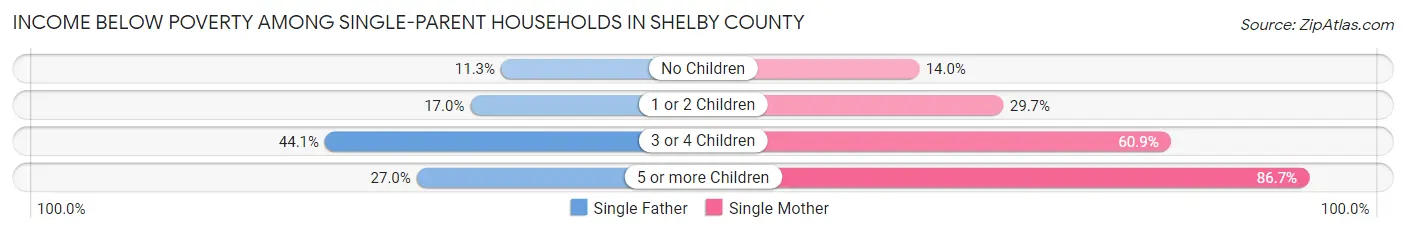
| Children | Single Father | Single Mother |
| No Children | 869 (11.3%) | 3,473 (14.0%) |
| 1 or 2 Children | 1,305 (17.0%) | 10,385 (29.6%) |
| 3 or 4 Children | 591 (44.1%) | 5,162 (60.9%) |
| 5 or more Children | 85 (27.0%) | 1,181 (86.7%) |
| Total | 2,850 (16.7%) | 20,201 (29.0%) |
Income Below Poverty Among Married-Couple vs Single-Parent Households in Shelby County
The poverty data for Shelby County shows that 6,407 of the married-couple family households (4.9%) and 23,051 of the single-parent households (26.6%) are living below the poverty level. Within the married-couple family households, those with 5 or more children have the highest poverty rate, with 271 households (27.6%) falling below the poverty line. Among the single-parent households, those with 5 or more children have the highest poverty rate, with 1,266 household (75.4%) living below poverty.
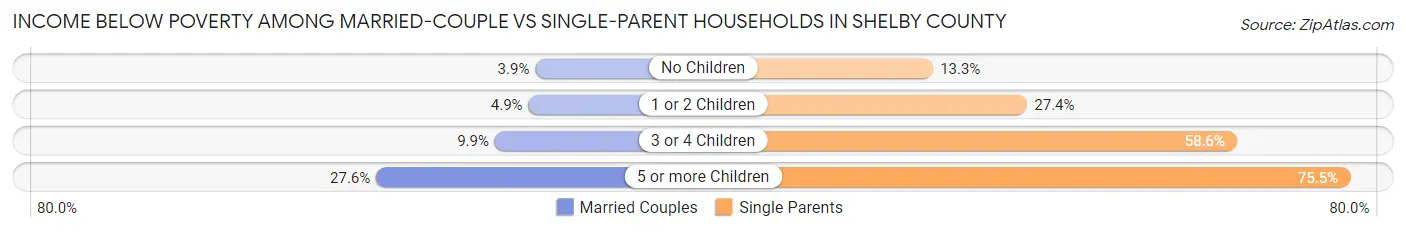
| Children | Married-Couple Families | Single-Parent Households |
| No Children | 3,035 (3.9%) | 4,342 (13.3%) |
| 1 or 2 Children | 2,072 (4.9%) | 11,690 (27.4%) |
| 3 or 4 Children | 1,029 (9.9%) | 5,753 (58.6%) |
| 5 or more Children | 271 (27.6%) | 1,266 (75.4%) |
| Total | 6,407 (4.9%) | 23,051 (26.6%) |
Employment Characteristics in Shelby County
Employment by Class of Employer in Shelby County
Among the 422,464 employed individuals in Shelby County, private company employees (294,988 | 69.8%), not-for-profit organizations (38,888 | 9.2%), and local government employees (28,747 | 6.8%) make up the most common classes of employment.
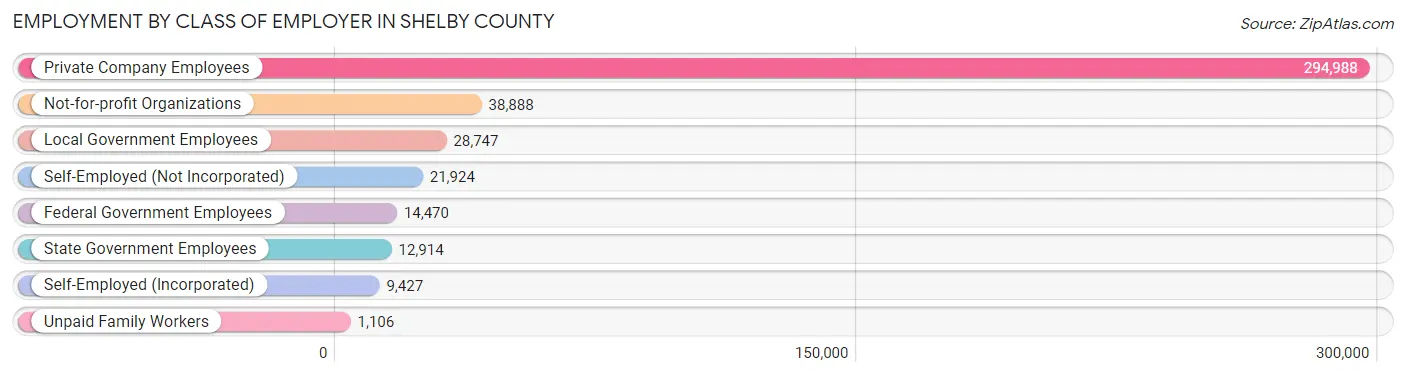
| Employer Class | # Employees | % Employees |
| Private Company Employees | 294,988 | 69.8% |
| Self-Employed (Incorporated) | 9,427 | 2.2% |
| Self-Employed (Not Incorporated) | 21,924 | 5.2% |
| Not-for-profit Organizations | 38,888 | 9.2% |
| Local Government Employees | 28,747 | 6.8% |
| State Government Employees | 12,914 | 3.1% |
| Federal Government Employees | 14,470 | 3.4% |
| Unpaid Family Workers | 1,106 | 0.3% |
| Total | 422,464 | 100.0% |
Employment Status by Age in Shelby County
According to the labor force statistics for Shelby County, out of the total population over 16 years of age (721,643), 64.5% or 465,460 individuals are in the labor force, with 7.3% or 33,979 of them unemployed. The age group with the highest labor force participation rate is 25 to 29 years, with 82.6% or 58,274 individuals in the labor force. Within the labor force, the 16 to 19 years age range has the highest percentage of unemployed individuals, with 22.9% or 4,113 of them being unemployed.
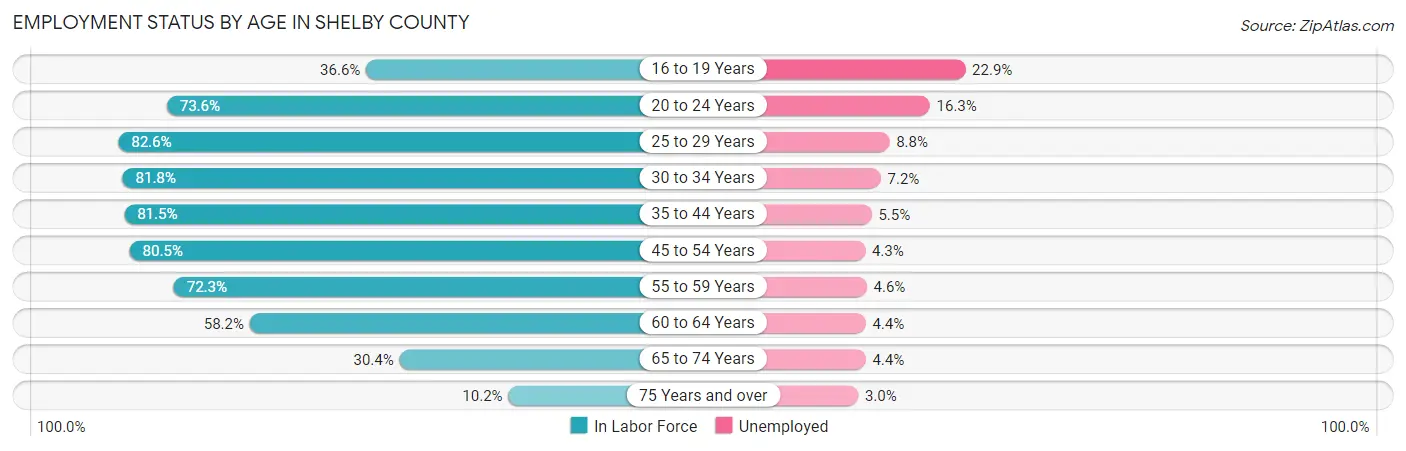
| Age Bracket | In Labor Force | Unemployed |
| 16 to 19 Years | 17,959 (36.6%) | 4,113 (22.9%) |
| 20 to 24 Years | 45,485 (73.6%) | 7,414 (16.3%) |
| 25 to 29 Years | 58,274 (82.6%) | 5,128 (8.8%) |
| 30 to 34 Years | 54,265 (81.8%) | 3,907 (7.2%) |
| 35 to 44 Years | 95,423 (81.5%) | 5,248 (5.5%) |
| 45 to 54 Years | 90,051 (80.5%) | 3,872 (4.3%) |
| 55 to 59 Years | 39,858 (72.3%) | 1,833 (4.6%) |
| 60 to 64 Years | 33,790 (58.2%) | 1,487 (4.4%) |
| 65 to 74 Years | 25,021 (30.4%) | 1,101 (4.4%) |
| 75 Years and over | 5,044 (10.2%) | 151 (3.0%) |
| Total | 465,460 (64.5%) | 33,979 (7.3%) |
Employment Status by Educational Attainment in Shelby County
According to labor force statistics for Shelby County, 77.6% of individuals (371,722) out of the total population between 25 and 64 years of age (479,023) are in the labor force, with 5.8% or 21,560 of them being unemployed. The group with the highest labor force participation rate are those with the educational attainment of bachelor's degree or higher, with 87.4% or 145,118 individuals in the labor force. Within the labor force, individuals with less than high school education have the highest percentage of unemployment, with 11.9% or 3,136 of them being unemployed.
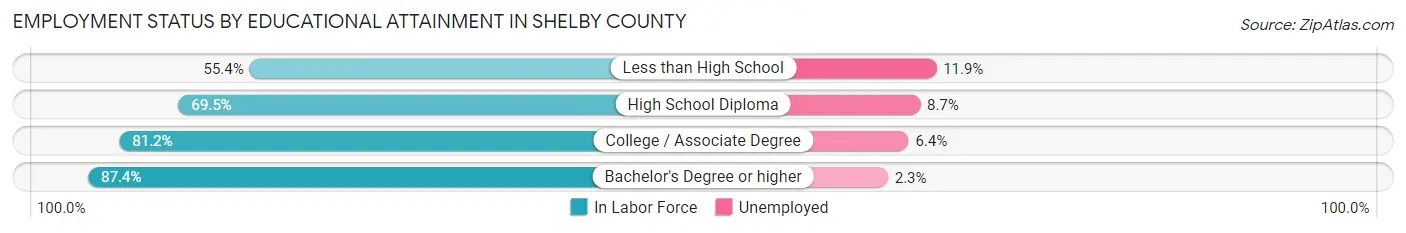
| Educational Attainment | In Labor Force | Unemployed |
| Less than High School | 26,353 (55.4%) | 5,661 (11.9%) |
| High School Diploma | 90,862 (69.5%) | 11,374 (8.7%) |
| College / Associate Degree | 109,360 (81.2%) | 8,620 (6.4%) |
| Bachelor's Degree or higher | 145,118 (87.4%) | 3,819 (2.3%) |
| Total | 371,722 (77.6%) | 27,783 (5.8%) |
Employment Occupations by Sex in Shelby County
Management, Business, Science and Arts Occupations
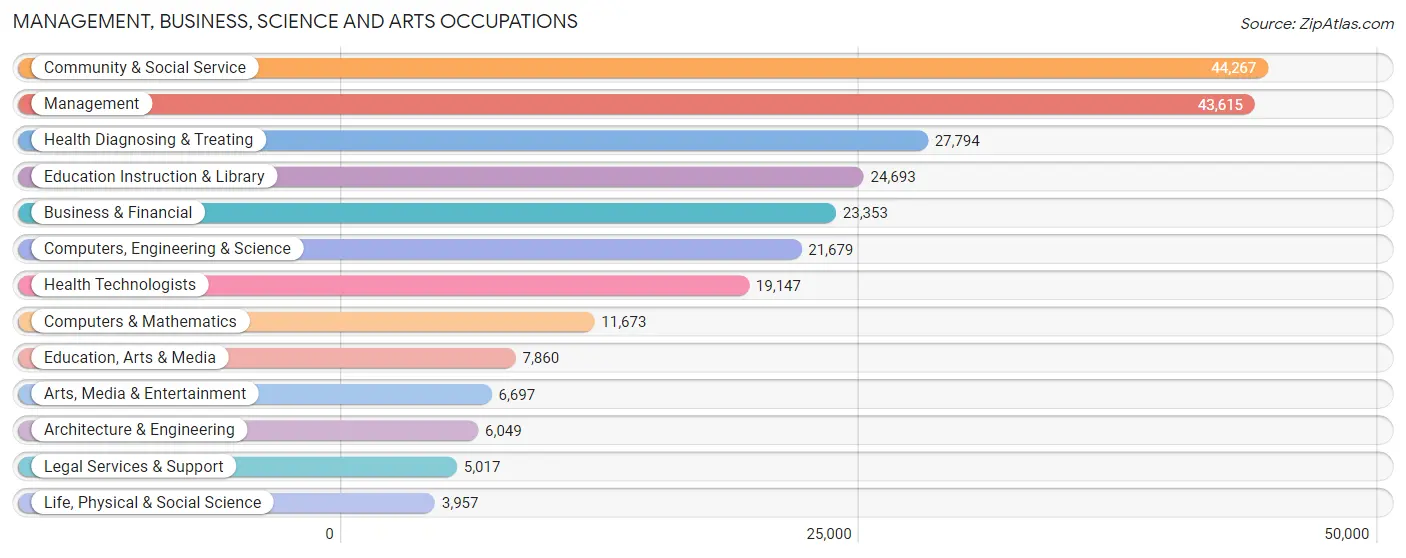
The most common Management, Business, Science and Arts occupations in Shelby County are Community & Social Service (44,267 | 10.3%), Management (43,615 | 10.2%), Health Diagnosing & Treating (27,794 | 6.5%), Education Instruction & Library (24,693 | 5.8%), and Business & Financial (23,353 | 5.4%).
Management, Business, Science and Arts Occupations by Sex
Within the Management, Business, Science and Arts occupations in Shelby County, the most male-oriented occupations are Architecture & Engineering (79.9%), Computers & Mathematics (72.2%), and Computers, Engineering & Science (69.6%), while the most female-oriented occupations are Health Diagnosing & Treating (74.2%), Education Instruction & Library (73.9%), and Health Technologists (72.3%).
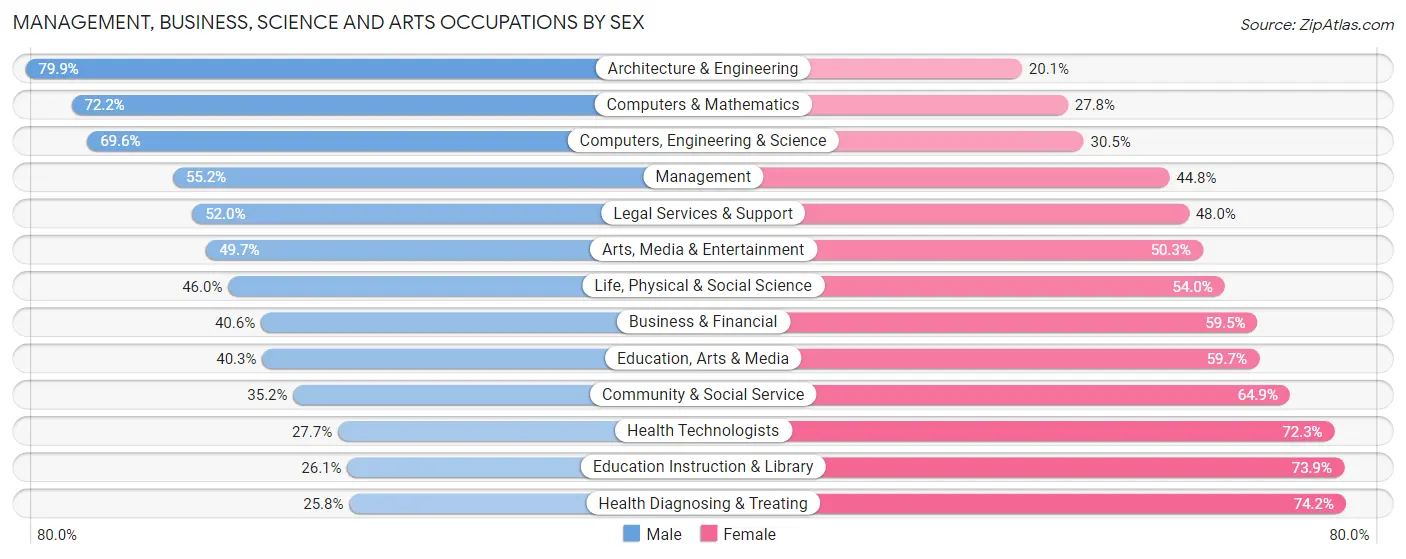
| Occupation | Male | Female |
| Management | 24,091 (55.2%) | 19,524 (44.8%) |
| Business & Financial | 9,470 (40.6%) | 13,883 (59.5%) |
| Computers, Engineering & Science | 15,078 (69.6%) | 6,601 (30.4%) |
| Computers & Mathematics | 8,426 (72.2%) | 3,247 (27.8%) |
| Architecture & Engineering | 4,831 (79.9%) | 1,218 (20.1%) |
| Life, Physical & Social Science | 1,821 (46.0%) | 2,136 (54.0%) |
| Community & Social Service | 15,562 (35.1%) | 28,705 (64.8%) |
| Education, Arts & Media | 3,170 (40.3%) | 4,690 (59.7%) |
| Legal Services & Support | 2,610 (52.0%) | 2,407 (48.0%) |
| Education Instruction & Library | 6,454 (26.1%) | 18,239 (73.9%) |
| Arts, Media & Entertainment | 3,328 (49.7%) | 3,369 (50.3%) |
| Health Diagnosing & Treating | 7,174 (25.8%) | 20,620 (74.2%) |
| Health Technologists | 5,304 (27.7%) | 13,843 (72.3%) |
| Total (Category) | 71,375 (44.4%) | 89,333 (55.6%) |
| Total (Overall) | 214,798 (50.1%) | 214,266 (49.9%) |
Services Occupations
The most common Services occupations in Shelby County are Food Preparation & Serving (21,060 | 4.9%), Cleaning & Maintenance (15,420 | 3.6%), Security & Protection (12,649 | 2.9%), Healthcare Support (11,760 | 2.7%), and Personal Care & Service (9,653 | 2.2%).
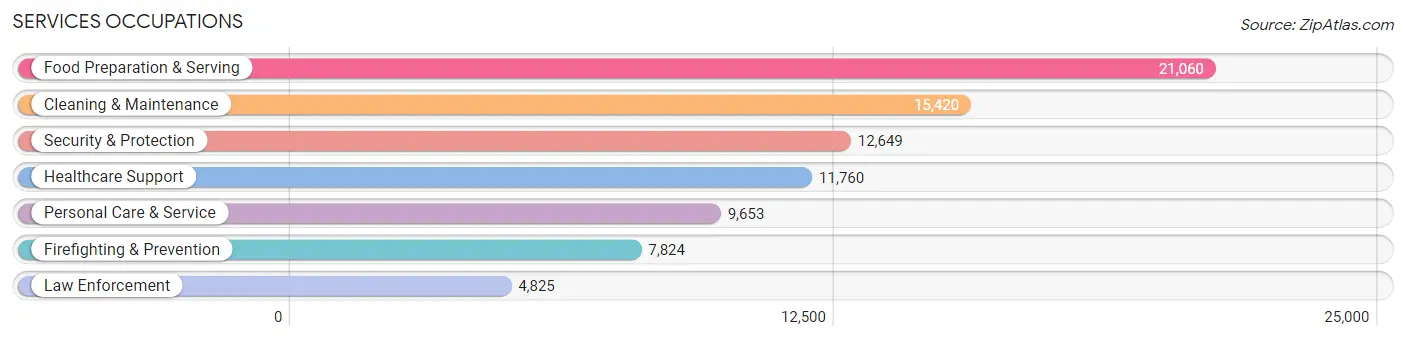
Services Occupations by Sex
Within the Services occupations in Shelby County, the most male-oriented occupations are Law Enforcement (69.9%), Security & Protection (67.9%), and Firefighting & Prevention (66.6%), while the most female-oriented occupations are Healthcare Support (85.2%), Personal Care & Service (74.0%), and Food Preparation & Serving (52.5%).
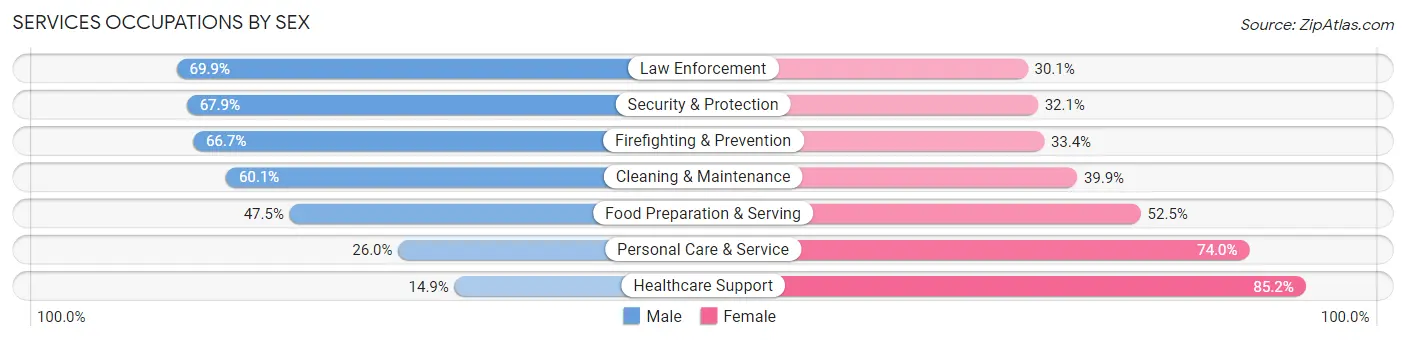
| Occupation | Male | Female |
| Healthcare Support | 1,746 (14.8%) | 10,014 (85.2%) |
| Security & Protection | 8,588 (67.9%) | 4,061 (32.1%) |
| Firefighting & Prevention | 5,215 (66.6%) | 2,609 (33.4%) |
| Law Enforcement | 3,373 (69.9%) | 1,452 (30.1%) |
| Food Preparation & Serving | 10,004 (47.5%) | 11,056 (52.5%) |
| Cleaning & Maintenance | 9,271 (60.1%) | 6,149 (39.9%) |
| Personal Care & Service | 2,509 (26.0%) | 7,144 (74.0%) |
| Total (Category) | 32,118 (45.5%) | 38,424 (54.5%) |
| Total (Overall) | 214,798 (50.1%) | 214,266 (49.9%) |
Sales and Office Occupations
The most common Sales and Office occupations in Shelby County are Office & Administration (53,961 | 12.6%), and Sales & Related (38,177 | 8.9%).

Sales and Office Occupations by Sex
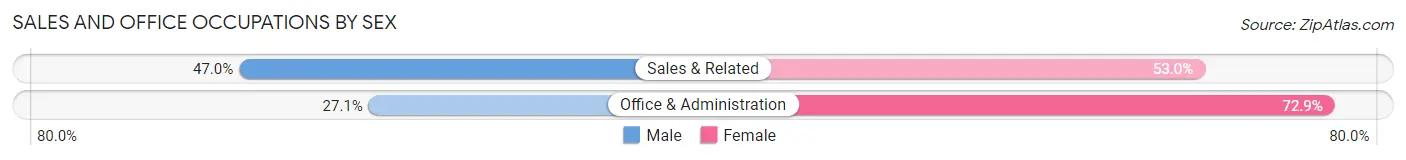
| Occupation | Male | Female |
| Sales & Related | 17,948 (47.0%) | 20,229 (53.0%) |
| Office & Administration | 14,607 (27.1%) | 39,354 (72.9%) |
| Total (Category) | 32,555 (35.3%) | 59,583 (64.7%) |
| Total (Overall) | 214,798 (50.1%) | 214,266 (49.9%) |
Natural Resources, Construction and Maintenance Occupations
The most common Natural Resources, Construction and Maintenance occupations in Shelby County are Construction & Extraction (15,755 | 3.7%), Installation, Maintenance & Repair (9,528 | 2.2%), and Farming, Fishing & Forestry (584 | 0.1%).

Natural Resources, Construction and Maintenance Occupations by Sex
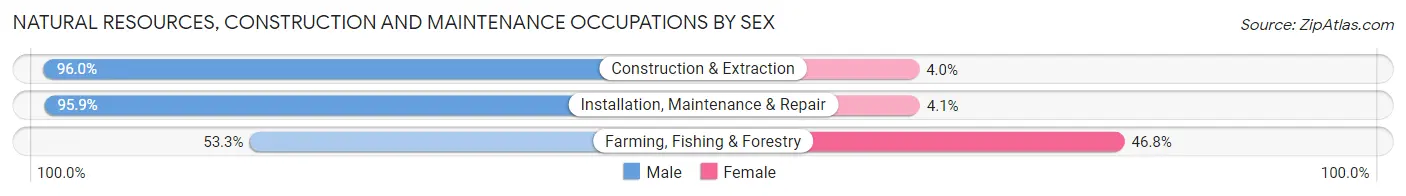
| Occupation | Male | Female |
| Farming, Fishing & Forestry | 311 (53.2%) | 273 (46.8%) |
| Construction & Extraction | 15,123 (96.0%) | 632 (4.0%) |
| Installation, Maintenance & Repair | 9,134 (95.9%) | 394 (4.1%) |
| Total (Category) | 24,568 (95.0%) | 1,299 (5.0%) |
| Total (Overall) | 214,798 (50.1%) | 214,266 (49.9%) |
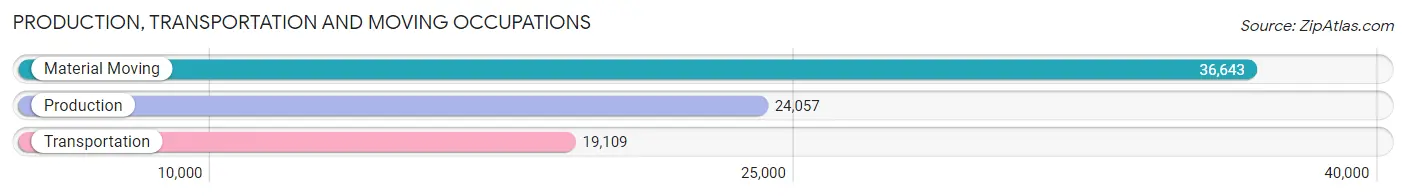
Production, Transportation and Moving Occupations
The most common Production, Transportation and Moving occupations in Shelby County are Material Moving (36,643 | 8.5%), Production (24,057 | 5.6%), and Transportation (19,109 | 4.4%).
Production, Transportation and Moving Occupations by Sex
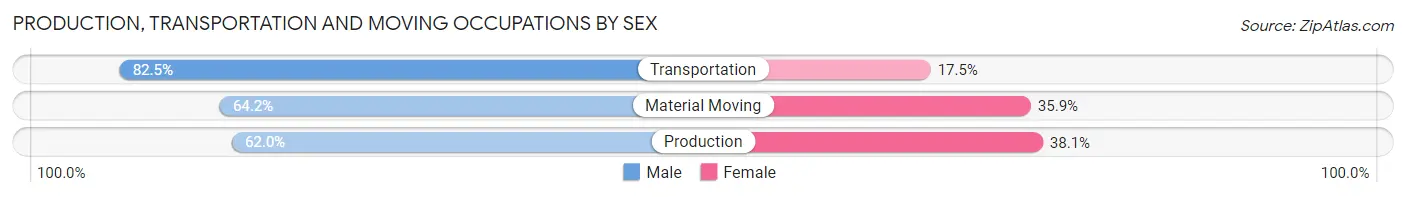
| Occupation | Male | Female |
| Production | 14,904 (62.0%) | 9,153 (38.1%) |
| Transportation | 15,773 (82.5%) | 3,336 (17.5%) |
| Material Moving | 23,505 (64.1%) | 13,138 (35.8%) |
| Total (Category) | 54,182 (67.9%) | 25,627 (32.1%) |
| Total (Overall) | 214,798 (50.1%) | 214,266 (49.9%) |
Employment Industries by Sex in Shelby County
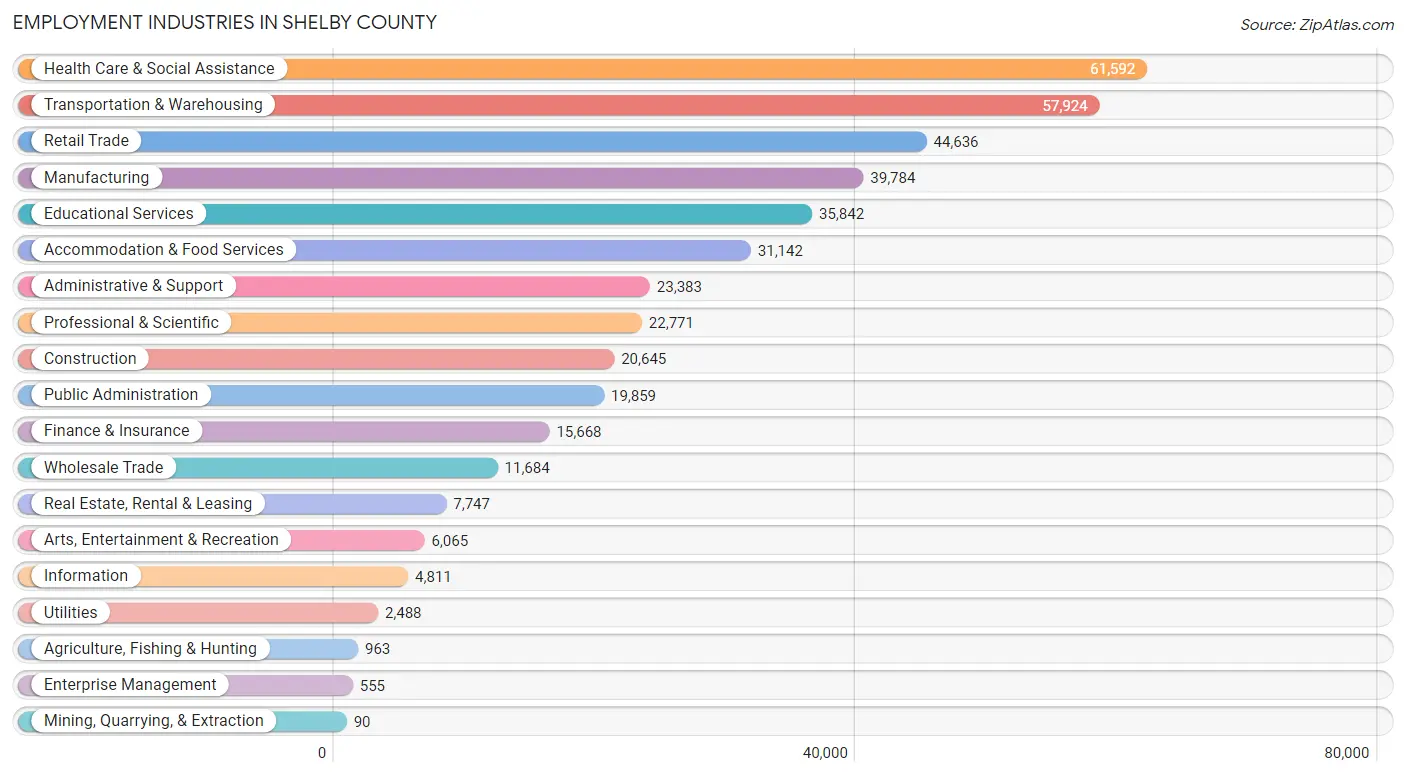
Employment Industries in Shelby County
The major employment industries in Shelby County include Health Care & Social Assistance (61,592 | 14.3%), Transportation & Warehousing (57,924 | 13.5%), Retail Trade (44,636 | 10.4%), Manufacturing (39,784 | 9.3%), and Educational Services (35,842 | 8.4%).
Employment Industries by Sex in Shelby County
The Shelby County industries that see more men than women are Construction (89.5%), Utilities (76.4%), and Agriculture, Fishing & Hunting (68.5%), whereas the industries that tend to have a higher number of women are Health Care & Social Assistance (74.7%), Educational Services (69.1%), and Finance & Insurance (63.0%).
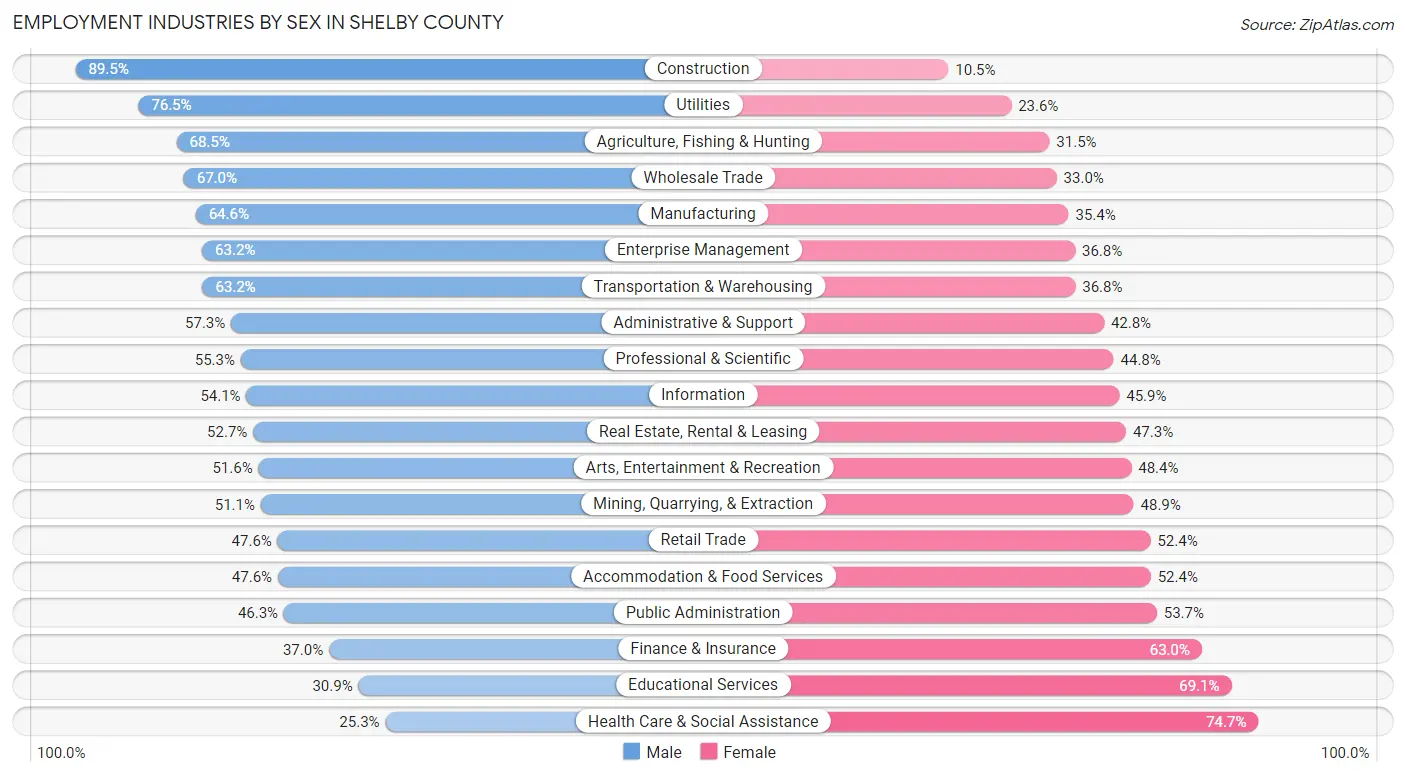
| Industry | Male | Female |
| Agriculture, Fishing & Hunting | 660 (68.5%) | 303 (31.5%) |
| Mining, Quarrying, & Extraction | 46 (51.1%) | 44 (48.9%) |
| Construction | 18,468 (89.5%) | 2,177 (10.5%) |
| Manufacturing | 25,687 (64.6%) | 14,097 (35.4%) |
| Wholesale Trade | 7,833 (67.0%) | 3,851 (33.0%) |
| Retail Trade | 21,255 (47.6%) | 23,381 (52.4%) |
| Transportation & Warehousing | 36,597 (63.2%) | 21,327 (36.8%) |
| Utilities | 1,902 (76.4%) | 586 (23.5%) |
| Information | 2,602 (54.1%) | 2,209 (45.9%) |
| Finance & Insurance | 5,797 (37.0%) | 9,871 (63.0%) |
| Real Estate, Rental & Leasing | 4,082 (52.7%) | 3,665 (47.3%) |
| Professional & Scientific | 12,582 (55.2%) | 10,189 (44.8%) |
| Enterprise Management | 351 (63.2%) | 204 (36.8%) |
| Administrative & Support | 13,386 (57.3%) | 9,997 (42.7%) |
| Educational Services | 11,070 (30.9%) | 24,772 (69.1%) |
| Health Care & Social Assistance | 15,596 (25.3%) | 45,996 (74.7%) |
| Arts, Entertainment & Recreation | 3,129 (51.6%) | 2,936 (48.4%) |
| Accommodation & Food Services | 14,813 (47.6%) | 16,329 (52.4%) |
| Public Administration | 9,199 (46.3%) | 10,660 (53.7%) |
| Total | 214,798 (50.1%) | 214,266 (49.9%) |
Education in Shelby County
School Enrollment in Shelby County
The most common levels of schooling among the 232,880 students in Shelby County are middle school (52,148 | 22.4%), high school (50,532 | 21.7%), and elementary school (47,768 | 20.5%).
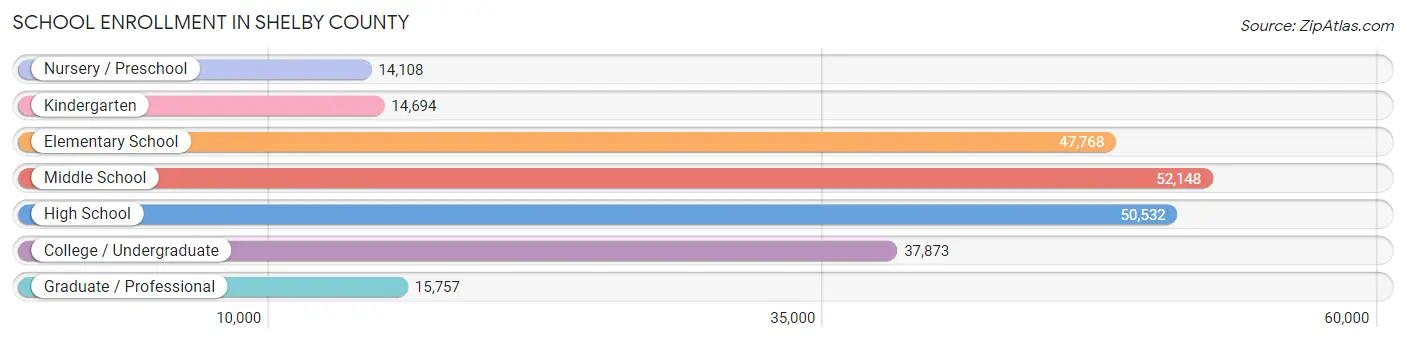
| School Level | # Students | % Students |
| Nursery / Preschool | 14,108 | 6.1% |
| Kindergarten | 14,694 | 6.3% |
| Elementary School | 47,768 | 20.5% |
| Middle School | 52,148 | 22.4% |
| High School | 50,532 | 21.7% |
| College / Undergraduate | 37,873 | 16.3% |
| Graduate / Professional | 15,757 | 6.8% |
| Total | 232,880 | 100.0% |
School Enrollment by Age by Funding Source in Shelby County
Out of a total of 232,880 students who are enrolled in schools in Shelby County, 42,850 (18.4%) attend a private institution, while the remaining 190,030 (81.6%) are enrolled in public schools. The age group of 3 to 4 year olds has the highest likelihood of being enrolled in private schools, with 5,057 (44.7% in the age bracket) enrolled. Conversely, the age group of 5 to 9 year old has the lowest likelihood of being enrolled in a private school, with 51,504 (86.7% in the age bracket) attending a public institution.
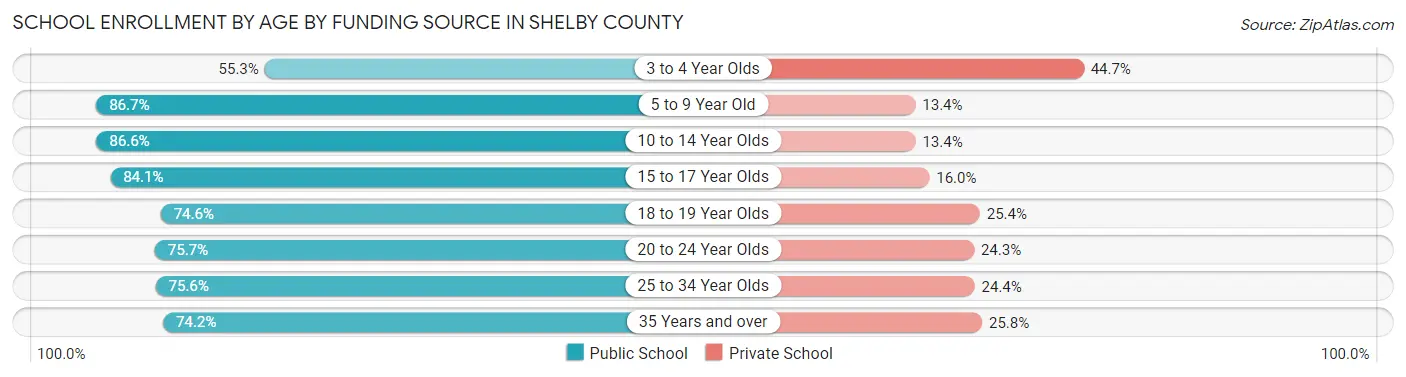
| Age Bracket | Public School | Private School |
| 3 to 4 Year Olds | 6,253 (55.3%) | 5,057 (44.7%) |
| 5 to 9 Year Old | 51,504 (86.7%) | 7,933 (13.4%) |
| 10 to 14 Year Olds | 55,211 (86.6%) | 8,525 (13.4%) |
| 15 to 17 Year Olds | 30,450 (84.1%) | 5,780 (16.0%) |
| 18 to 19 Year Olds | 10,723 (74.6%) | 3,644 (25.4%) |
| 20 to 24 Year Olds | 15,238 (75.7%) | 4,884 (24.3%) |
| 25 to 34 Year Olds | 12,051 (75.6%) | 3,887 (24.4%) |
| 35 Years and over | 8,713 (74.2%) | 3,027 (25.8%) |
| Total | 190,030 (81.6%) | 42,850 (18.4%) |
Educational Attainment by Field of Study in Shelby County
Business (54,766 | 24.8%), education (24,921 | 11.3%), science & technology (22,500 | 10.2%), arts & humanities (14,920 | 6.8%), and social sciences (14,512 | 6.6%) are the most common fields of study among 220,632 individuals in Shelby County who have obtained a bachelor's degree or higher.
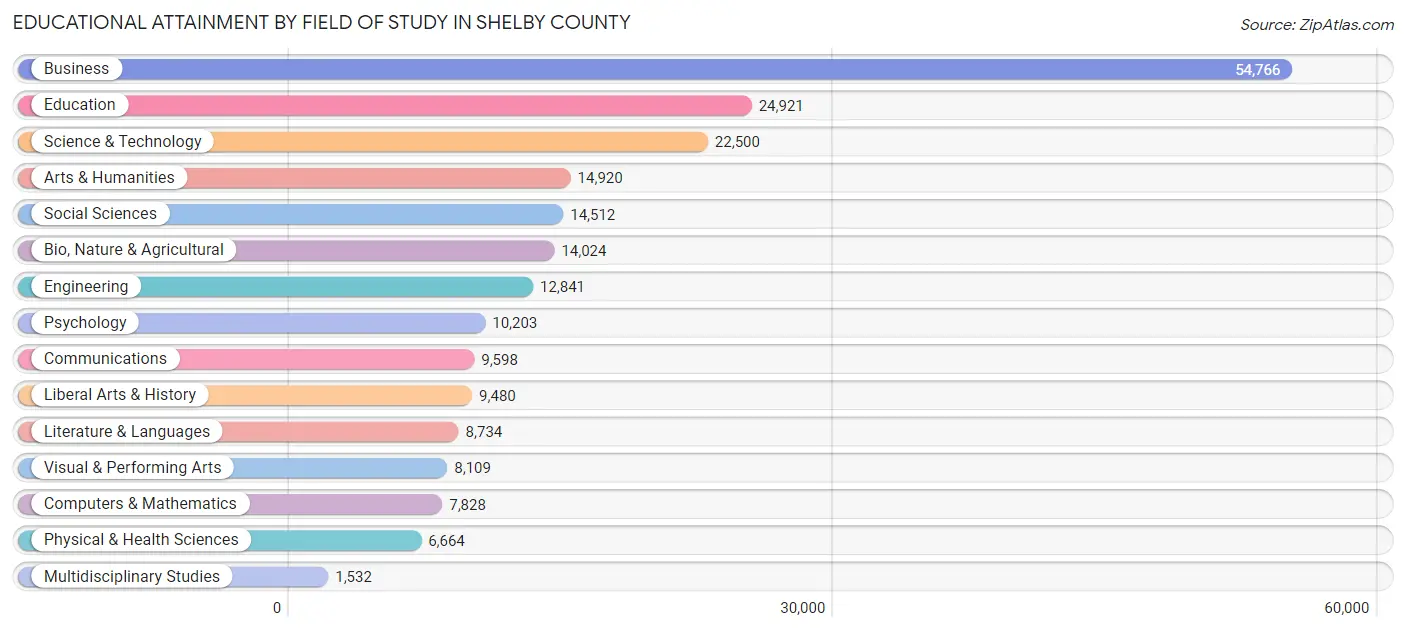
| Field of Study | # Graduates | % Graduates |
| Computers & Mathematics | 7,828 | 3.5% |
| Bio, Nature & Agricultural | 14,024 | 6.4% |
| Physical & Health Sciences | 6,664 | 3.0% |
| Psychology | 10,203 | 4.6% |
| Social Sciences | 14,512 | 6.6% |
| Engineering | 12,841 | 5.8% |
| Multidisciplinary Studies | 1,532 | 0.7% |
| Science & Technology | 22,500 | 10.2% |
| Business | 54,766 | 24.8% |
| Education | 24,921 | 11.3% |
| Literature & Languages | 8,734 | 4.0% |
| Liberal Arts & History | 9,480 | 4.3% |
| Visual & Performing Arts | 8,109 | 3.7% |
| Communications | 9,598 | 4.3% |
| Arts & Humanities | 14,920 | 6.8% |
| Total | 220,632 | 100.0% |
Transportation & Commute in Shelby County
Vehicle Availability by Sex in Shelby County
The most prevalent vehicle ownership categories in Shelby County are males with 2 vehicles (92,671, accounting for 43.7%) and females with 2 vehicles (84,109, making up 44.4%).
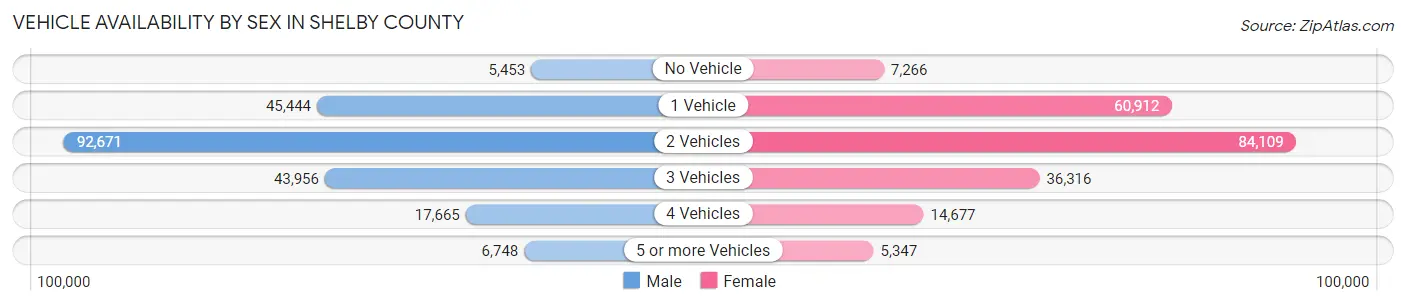
| Vehicles Available | Male | Female |
| No Vehicle | 5,453 (2.6%) | 7,266 (3.5%) |
| 1 Vehicle | 45,444 (21.4%) | 60,912 (29.2%) |
| 2 Vehicles | 92,671 (43.7%) | 84,109 (40.3%) |
| 3 Vehicles | 43,956 (20.7%) | 36,316 (17.4%) |
| 4 Vehicles | 17,665 (8.3%) | 14,677 (7.0%) |
| 5 or more Vehicles | 6,748 (3.2%) | 5,347 (2.6%) |
| Total | 211,937 (100.0%) | 208,627 (100.0%) |
Commute Time in Shelby County
The most frequently occuring commute durations in Shelby County are 20 to 24 minutes (88,579 commuters, 22.7%), 30 to 34 minutes (66,944 commuters, 17.2%), and 15 to 19 minutes (66,934 commuters, 17.2%).
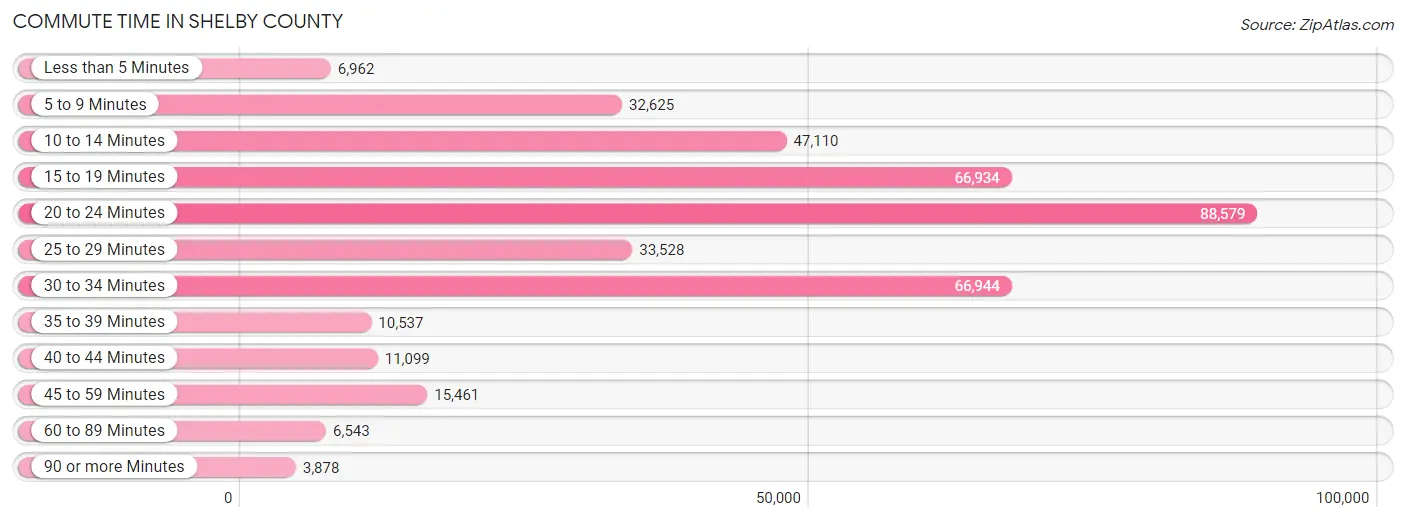
| Commute Time | # Commuters | % Commuters |
| Less than 5 Minutes | 6,962 | 1.8% |
| 5 to 9 Minutes | 32,625 | 8.4% |
| 10 to 14 Minutes | 47,110 | 12.1% |
| 15 to 19 Minutes | 66,934 | 17.2% |
| 20 to 24 Minutes | 88,579 | 22.7% |
| 25 to 29 Minutes | 33,528 | 8.6% |
| 30 to 34 Minutes | 66,944 | 17.2% |
| 35 to 39 Minutes | 10,537 | 2.7% |
| 40 to 44 Minutes | 11,099 | 2.8% |
| 45 to 59 Minutes | 15,461 | 4.0% |
| 60 to 89 Minutes | 6,543 | 1.7% |
| 90 or more Minutes | 3,878 | 1.0% |
Commute Time by Sex in Shelby County
The most common commute times in Shelby County are 20 to 24 minutes (44,277 commuters, 22.4%) for males and 20 to 24 minutes (44,302 commuters, 23.1%) for females.
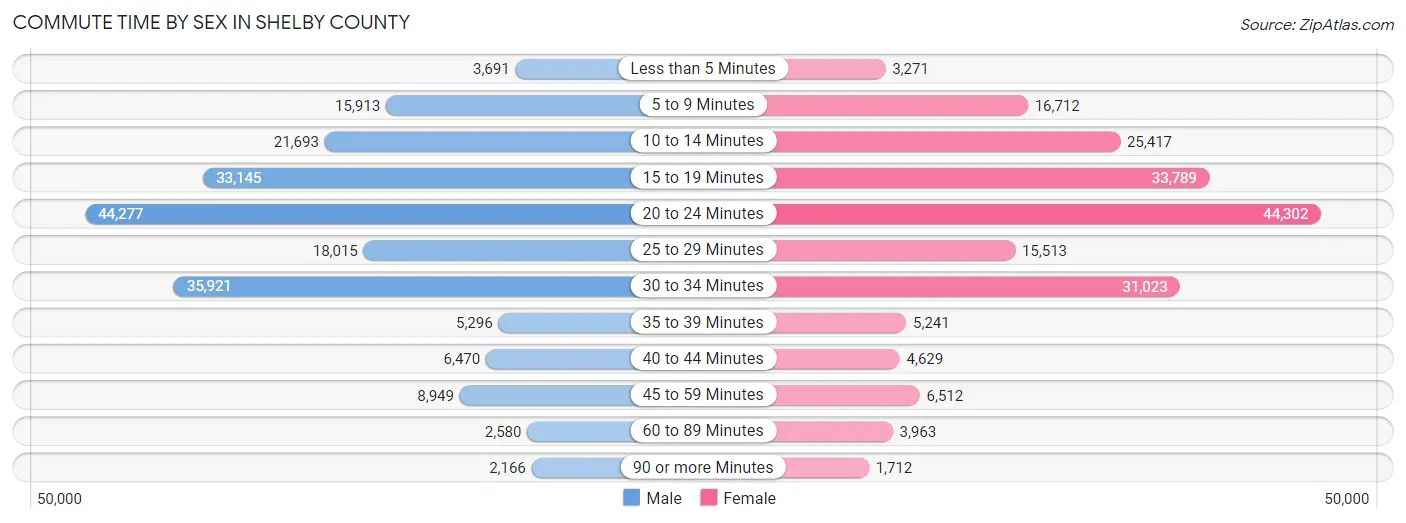
| Commute Time | Male | Female |
| Less than 5 Minutes | 3,691 (1.9%) | 3,271 (1.7%) |
| 5 to 9 Minutes | 15,913 (8.0%) | 16,712 (8.7%) |
| 10 to 14 Minutes | 21,693 (11.0%) | 25,417 (13.2%) |
| 15 to 19 Minutes | 33,145 (16.7%) | 33,789 (17.6%) |
| 20 to 24 Minutes | 44,277 (22.4%) | 44,302 (23.1%) |
| 25 to 29 Minutes | 18,015 (9.1%) | 15,513 (8.1%) |
| 30 to 34 Minutes | 35,921 (18.1%) | 31,023 (16.2%) |
| 35 to 39 Minutes | 5,296 (2.7%) | 5,241 (2.7%) |
| 40 to 44 Minutes | 6,470 (3.3%) | 4,629 (2.4%) |
| 45 to 59 Minutes | 8,949 (4.5%) | 6,512 (3.4%) |
| 60 to 89 Minutes | 2,580 (1.3%) | 3,963 (2.1%) |
| 90 or more Minutes | 2,166 (1.1%) | 1,712 (0.9%) |
Time of Departure to Work by Sex in Shelby County
The most frequent times of departure to work in Shelby County are 7:00 AM to 7:29 AM (26,995, 13.6%) for males and 7:00 AM to 7:29 AM (33,296, 17.3%) for females.
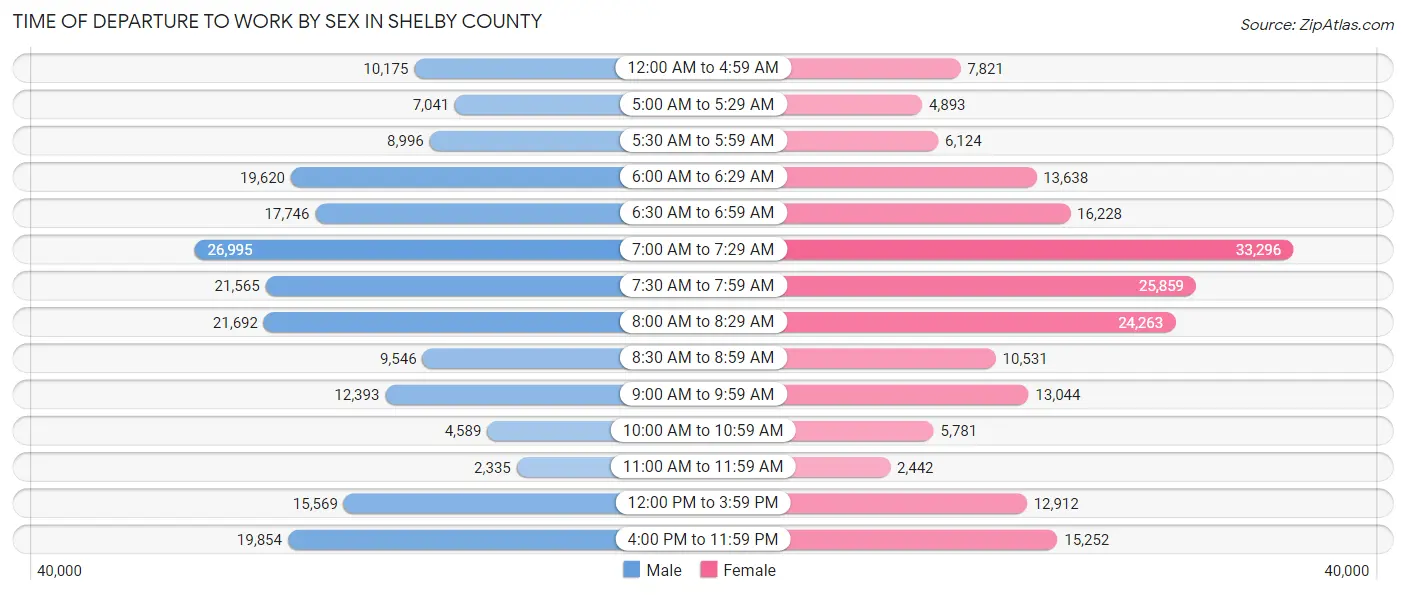
| Time of Departure | Male | Female |
| 12:00 AM to 4:59 AM | 10,175 (5.1%) | 7,821 (4.1%) |
| 5:00 AM to 5:29 AM | 7,041 (3.5%) | 4,893 (2.5%) |
| 5:30 AM to 5:59 AM | 8,996 (4.5%) | 6,124 (3.2%) |
| 6:00 AM to 6:29 AM | 19,620 (9.9%) | 13,638 (7.1%) |
| 6:30 AM to 6:59 AM | 17,746 (9.0%) | 16,228 (8.5%) |
| 7:00 AM to 7:29 AM | 26,995 (13.6%) | 33,296 (17.3%) |
| 7:30 AM to 7:59 AM | 21,565 (10.9%) | 25,859 (13.5%) |
| 8:00 AM to 8:29 AM | 21,692 (11.0%) | 24,263 (12.6%) |
| 8:30 AM to 8:59 AM | 9,546 (4.8%) | 10,531 (5.5%) |
| 9:00 AM to 9:59 AM | 12,393 (6.3%) | 13,044 (6.8%) |
| 10:00 AM to 10:59 AM | 4,589 (2.3%) | 5,781 (3.0%) |
| 11:00 AM to 11:59 AM | 2,335 (1.2%) | 2,442 (1.3%) |
| 12:00 PM to 3:59 PM | 15,569 (7.9%) | 12,912 (6.7%) |
| 4:00 PM to 11:59 PM | 19,854 (10.0%) | 15,252 (7.9%) |
| Total | 198,116 (100.0%) | 192,084 (100.0%) |
Housing Occupancy in Shelby County
Occupancy by Ownership in Shelby County
Of the total 357,839 dwellings in Shelby County, owner-occupied units account for 197,510 (55.2%), while renter-occupied units make up 160,329 (44.8%).
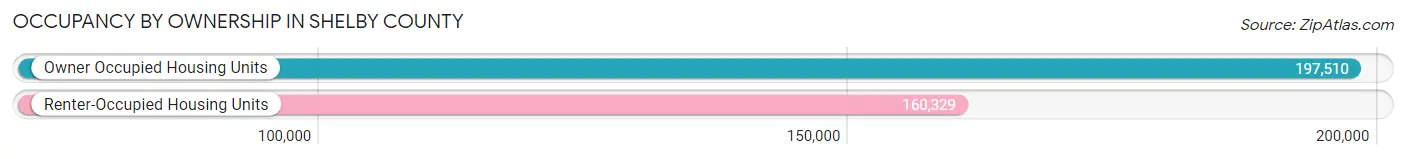
| Occupancy | # Housing Units | % Housing Units |
| Owner Occupied Housing Units | 197,510 | 55.2% |
| Renter-Occupied Housing Units | 160,329 | 44.8% |
| Total Occupied Housing Units | 357,839 | 100.0% |
Occupancy by Household Size in Shelby County
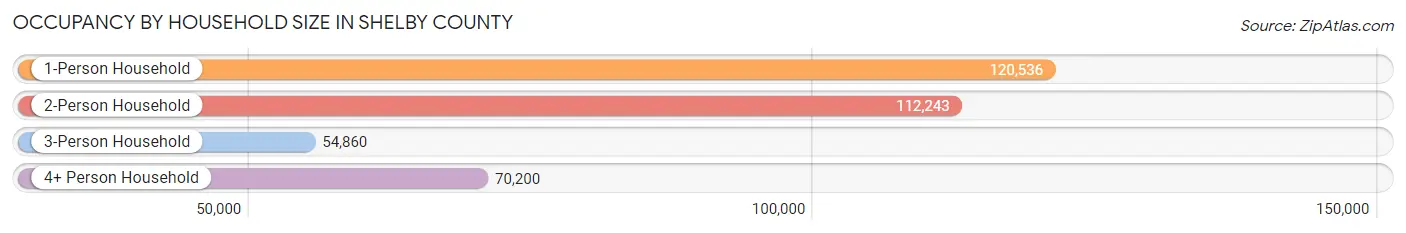
| Household Size | # Housing Units | % Housing Units |
| 1-Person Household | 120,536 | 33.7% |
| 2-Person Household | 112,243 | 31.4% |
| 3-Person Household | 54,860 | 15.3% |
| 4+ Person Household | 70,200 | 19.6% |
| Total Housing Units | 357,839 | 100.0% |
Occupancy by Ownership by Household Size in Shelby County
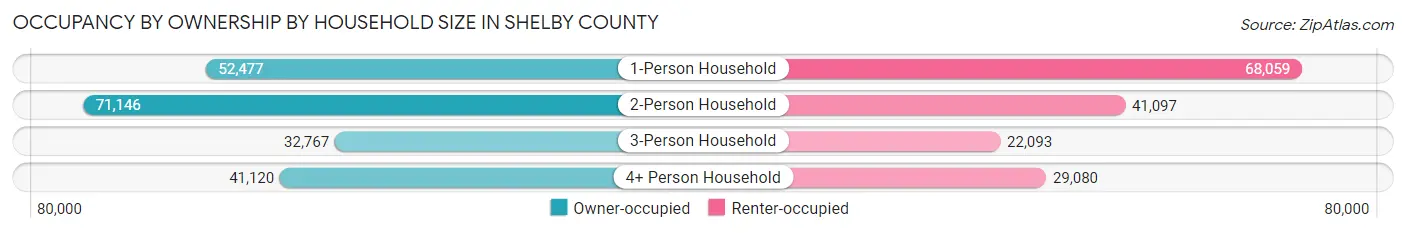
| Household Size | Owner-occupied | Renter-occupied |
| 1-Person Household | 52,477 (43.5%) | 68,059 (56.5%) |
| 2-Person Household | 71,146 (63.4%) | 41,097 (36.6%) |
| 3-Person Household | 32,767 (59.7%) | 22,093 (40.3%) |
| 4+ Person Household | 41,120 (58.6%) | 29,080 (41.4%) |
| Total Housing Units | 197,510 (55.2%) | 160,329 (44.8%) |
Occupancy by Educational Attainment in Shelby County

| Household Size | Owner-occupied | Renter-occupied |
| Less than High School | 11,032 (34.6%) | 20,870 (65.4%) |
| High School Diploma | 40,614 (45.1%) | 49,383 (54.9%) |
| College/Associate Degree | 55,778 (51.2%) | 53,146 (48.8%) |
| Bachelor's Degree or higher | 90,086 (70.9%) | 36,930 (29.1%) |
Occupancy by Age of Householder in Shelby County
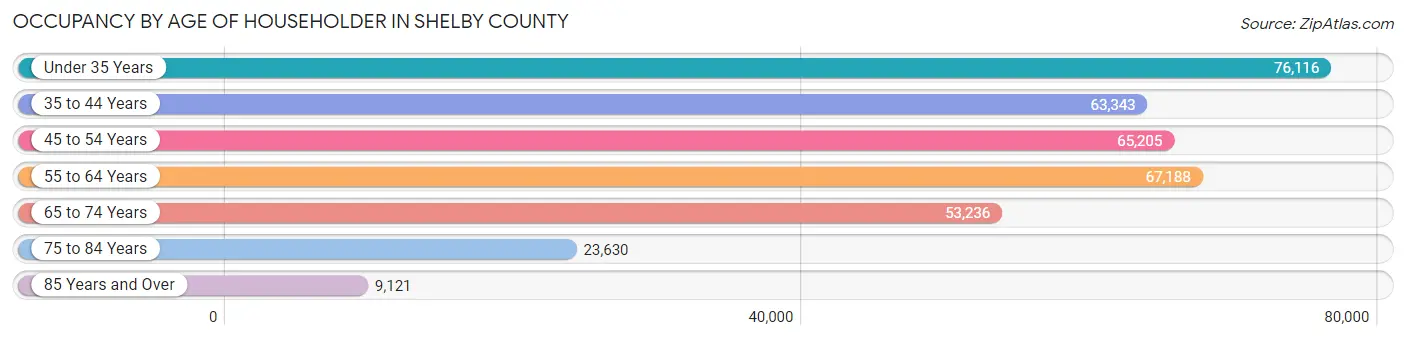
| Age Bracket | # Households | % Households |
| Under 35 Years | 76,116 | 21.3% |
| 35 to 44 Years | 63,343 | 17.7% |
| 45 to 54 Years | 65,205 | 18.2% |
| 55 to 64 Years | 67,188 | 18.8% |
| 65 to 74 Years | 53,236 | 14.9% |
| 75 to 84 Years | 23,630 | 6.6% |
| 85 Years and Over | 9,121 | 2.5% |
| Total | 357,839 | 100.0% |
Housing Finances in Shelby County
Median Income by Occupancy in Shelby County
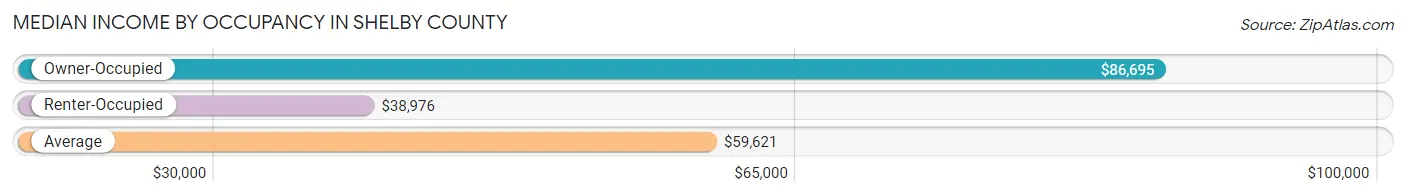
| Occupancy Type | # Households | Median Income |
| Owner-Occupied | 197,510 (55.2%) | $86,695 |
| Renter-Occupied | 160,329 (44.8%) | $38,976 |
| Average | 357,839 (100.0%) | $59,621 |
Occupancy by Householder Income Bracket in Shelby County
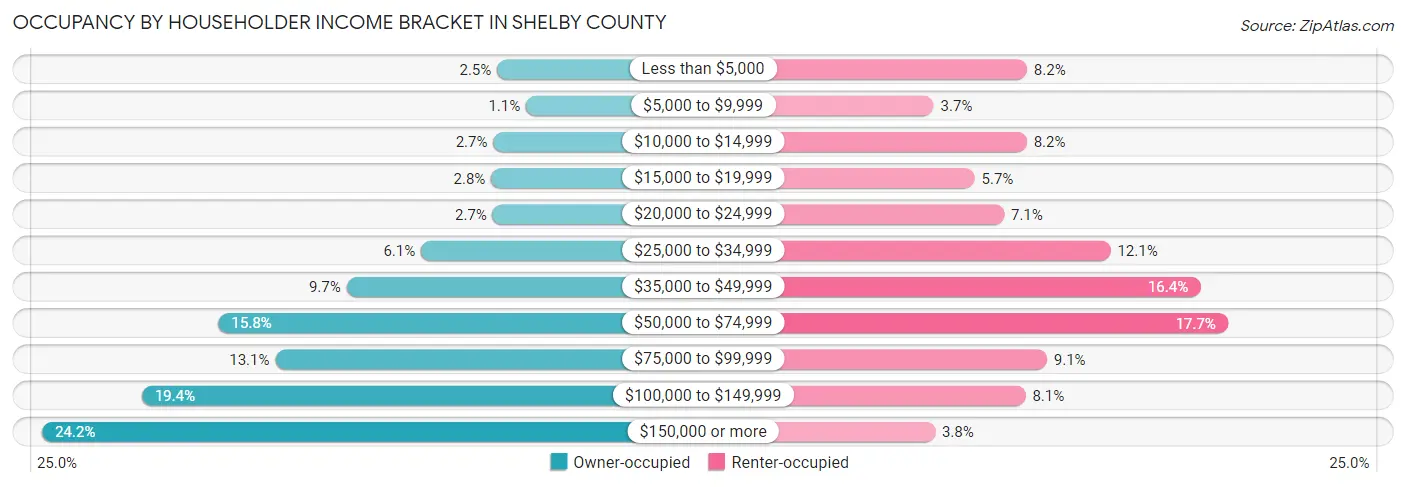
| Income Bracket | Owner-occupied | Renter-occupied |
| Less than $5,000 | 4,941 (2.5%) | 13,081 (8.2%) |
| $5,000 to $9,999 | 2,203 (1.1%) | 5,968 (3.7%) |
| $10,000 to $14,999 | 5,287 (2.7%) | 13,067 (8.2%) |
| $15,000 to $19,999 | 5,486 (2.8%) | 9,087 (5.7%) |
| $20,000 to $24,999 | 5,354 (2.7%) | 11,334 (7.1%) |
| $25,000 to $34,999 | 12,089 (6.1%) | 19,460 (12.1%) |
| $35,000 to $49,999 | 19,103 (9.7%) | 26,290 (16.4%) |
| $50,000 to $74,999 | 31,144 (15.8%) | 28,408 (17.7%) |
| $75,000 to $99,999 | 25,804 (13.1%) | 14,598 (9.1%) |
| $100,000 to $149,999 | 38,355 (19.4%) | 12,970 (8.1%) |
| $150,000 or more | 47,744 (24.2%) | 6,066 (3.8%) |
| Total | 197,510 (100.0%) | 160,329 (100.0%) |
Monthly Housing Cost Tiers in Shelby County
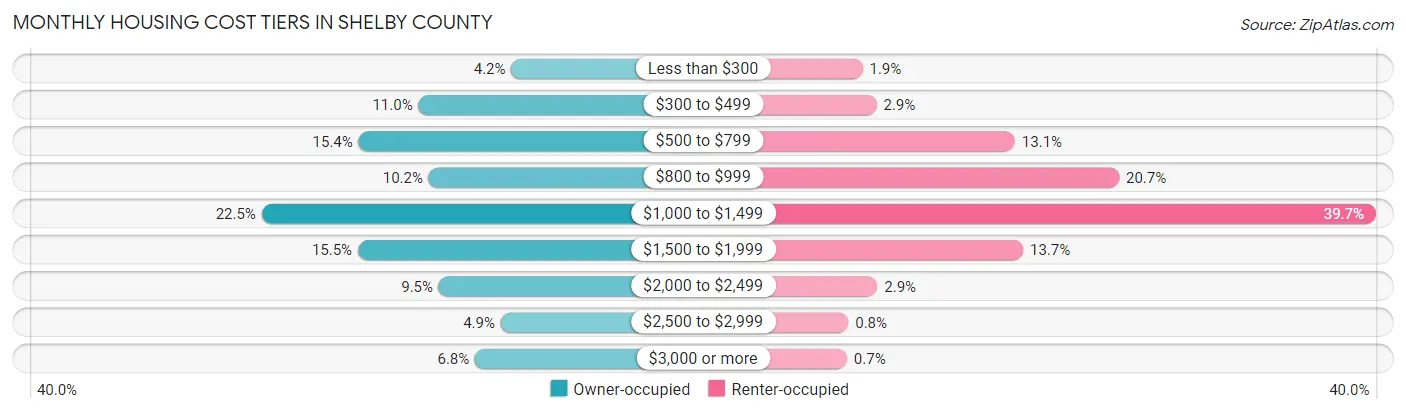
| Monthly Cost | Owner-occupied | Renter-occupied |
| Less than $300 | 8,197 (4.2%) | 2,972 (1.8%) |
| $300 to $499 | 21,702 (11.0%) | 4,620 (2.9%) |
| $500 to $799 | 30,414 (15.4%) | 20,963 (13.1%) |
| $800 to $999 | 20,213 (10.2%) | 33,252 (20.7%) |
| $1,000 to $1,499 | 44,522 (22.5%) | 63,564 (39.7%) |
| $1,500 to $1,999 | 30,509 (15.4%) | 21,919 (13.7%) |
| $2,000 to $2,499 | 18,748 (9.5%) | 4,717 (2.9%) |
| $2,500 to $2,999 | 9,732 (4.9%) | 1,280 (0.8%) |
| $3,000 or more | 13,473 (6.8%) | 1,126 (0.7%) |
| Total | 197,510 (100.0%) | 160,329 (100.0%) |
Physical Housing Characteristics in Shelby County
Housing Structures in Shelby County
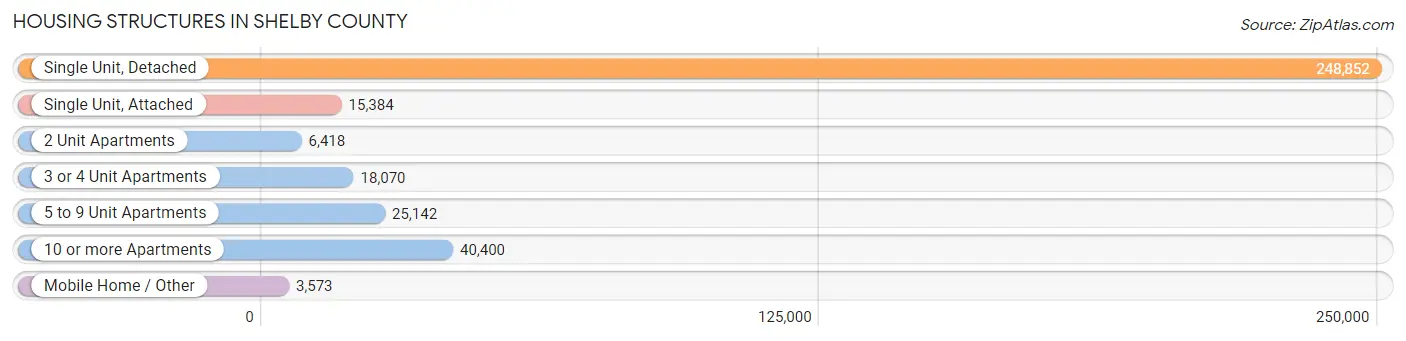
| Structure Type | # Housing Units | % Housing Units |
| Single Unit, Detached | 248,852 | 69.5% |
| Single Unit, Attached | 15,384 | 4.3% |
| 2 Unit Apartments | 6,418 | 1.8% |
| 3 or 4 Unit Apartments | 18,070 | 5.1% |
| 5 to 9 Unit Apartments | 25,142 | 7.0% |
| 10 or more Apartments | 40,400 | 11.3% |
| Mobile Home / Other | 3,573 | 1.0% |
| Total | 357,839 | 100.0% |
Housing Structures by Occupancy in Shelby County
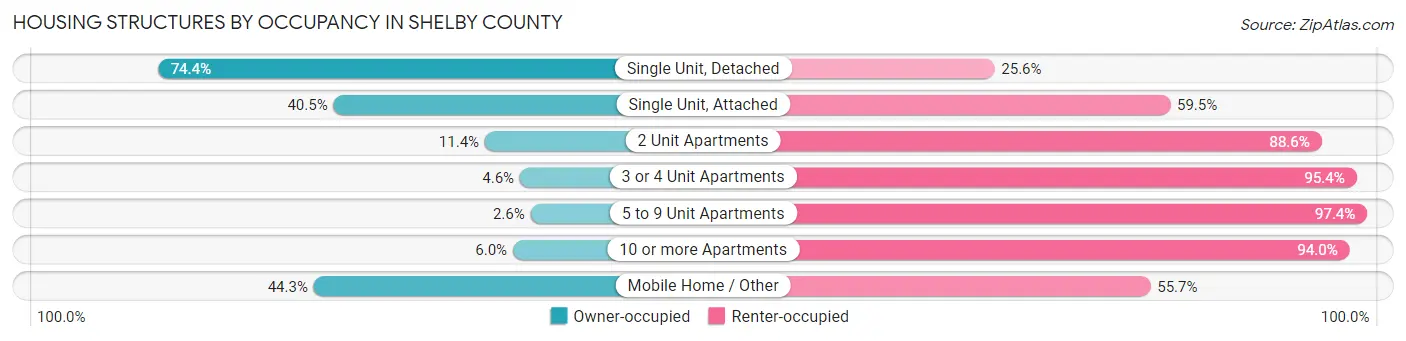
| Structure Type | Owner-occupied | Renter-occupied |
| Single Unit, Detached | 185,057 (74.4%) | 63,795 (25.6%) |
| Single Unit, Attached | 6,235 (40.5%) | 9,149 (59.5%) |
| 2 Unit Apartments | 730 (11.4%) | 5,688 (88.6%) |
| 3 or 4 Unit Apartments | 837 (4.6%) | 17,233 (95.4%) |
| 5 to 9 Unit Apartments | 650 (2.6%) | 24,492 (97.4%) |
| 10 or more Apartments | 2,417 (6.0%) | 37,983 (94.0%) |
| Mobile Home / Other | 1,584 (44.3%) | 1,989 (55.7%) |
| Total | 197,510 (55.2%) | 160,329 (44.8%) |
Housing Structures by Number of Rooms in Shelby County
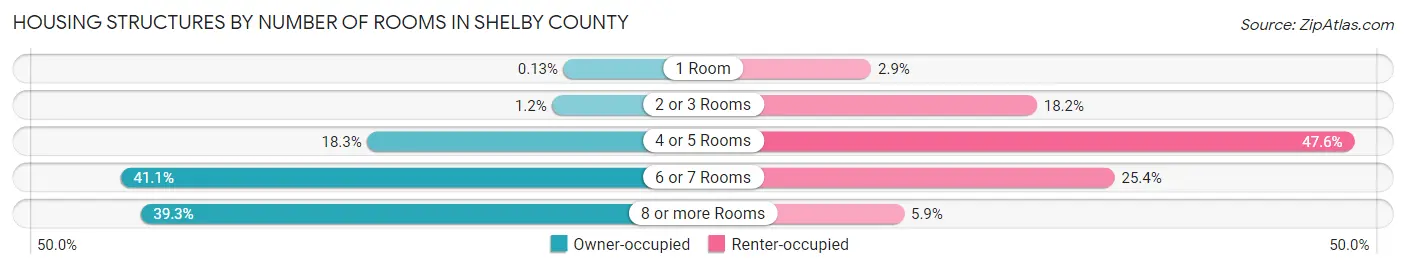
| Number of Rooms | Owner-occupied | Renter-occupied |
| 1 Room | 265 (0.1%) | 4,619 (2.9%) |
| 2 or 3 Rooms | 2,315 (1.2%) | 29,190 (18.2%) |
| 4 or 5 Rooms | 36,098 (18.3%) | 76,277 (47.6%) |
| 6 or 7 Rooms | 81,223 (41.1%) | 40,731 (25.4%) |
| 8 or more Rooms | 77,609 (39.3%) | 9,512 (5.9%) |
| Total | 197,510 (100.0%) | 160,329 (100.0%) |
Housing Structure by Heating Type in Shelby County
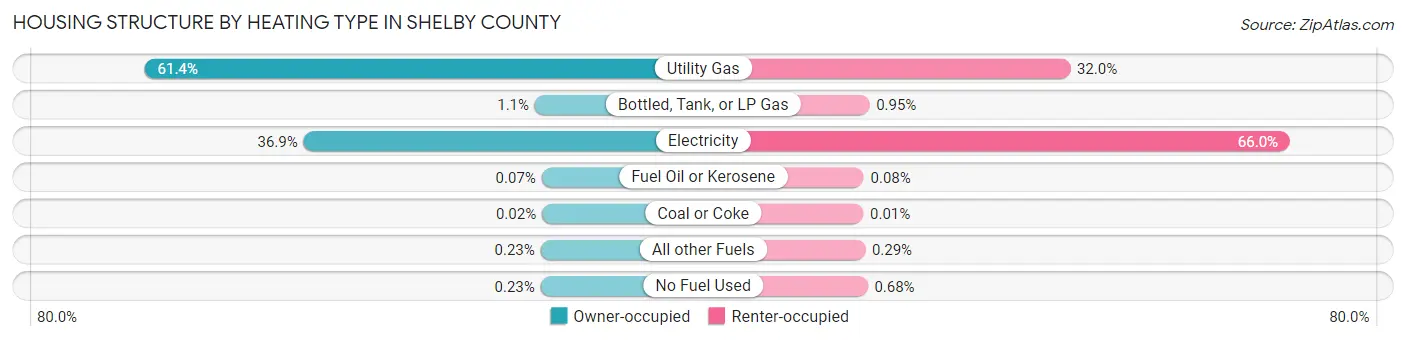
| Heating Type | Owner-occupied | Renter-occupied |
| Utility Gas | 121,351 (61.4%) | 51,296 (32.0%) |
| Bottled, Tank, or LP Gas | 2,205 (1.1%) | 1,523 (0.9%) |
| Electricity | 72,850 (36.9%) | 105,790 (66.0%) |
| Fuel Oil or Kerosene | 140 (0.1%) | 136 (0.1%) |
| Coal or Coke | 46 (0.0%) | 20 (0.0%) |
| All other Fuels | 455 (0.2%) | 469 (0.3%) |
| No Fuel Used | 463 (0.2%) | 1,095 (0.7%) |
| Total | 197,510 (100.0%) | 160,329 (100.0%) |
Household Vehicle Usage in Shelby County
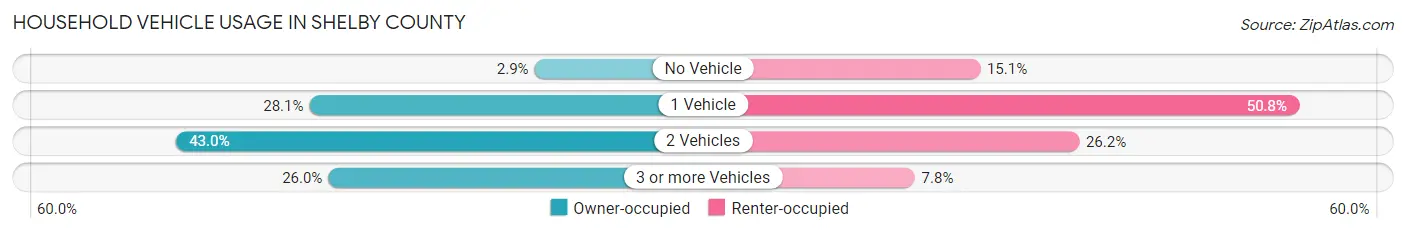
| Vehicles per Household | Owner-occupied | Renter-occupied |
| No Vehicle | 5,716 (2.9%) | 24,255 (15.1%) |
| 1 Vehicle | 55,517 (28.1%) | 81,515 (50.8%) |
| 2 Vehicles | 84,950 (43.0%) | 42,043 (26.2%) |
| 3 or more Vehicles | 51,327 (26.0%) | 12,516 (7.8%) |
| Total | 197,510 (100.0%) | 160,329 (100.0%) |
Real Estate & Mortgages in Shelby County
Real Estate and Mortgage Overview in Shelby County
| Characteristic | Without Mortgage | With Mortgage |
| Housing Units | 70,939 | 126,571 |
| Median Property Value | $161,900 | $223,400 |
| Median Household Income | $64,384 | $35,645 |
| Monthly Housing Costs | $568 | $12,738 |
| Real Estate Taxes | $1,953 | $4,823 |
Property Value by Mortgage Status in Shelby County
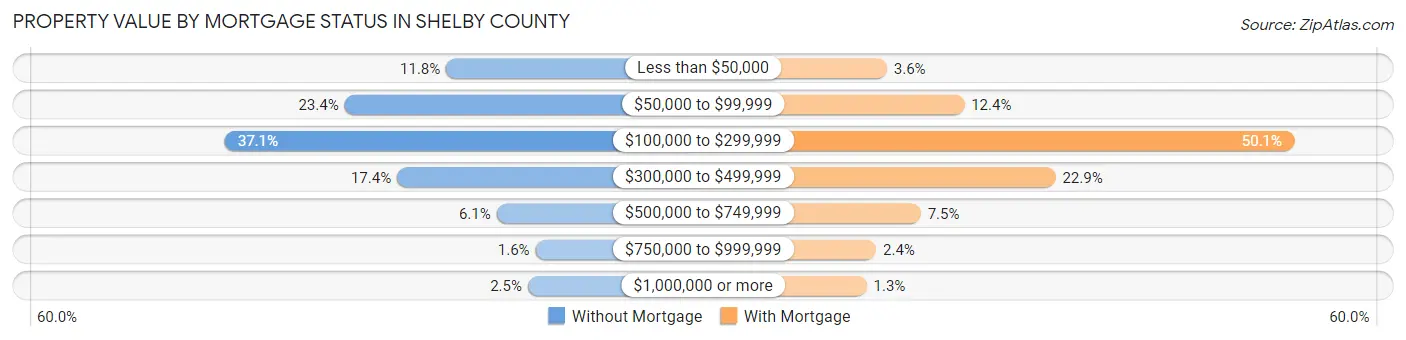
| Property Value | Without Mortgage | With Mortgage |
| Less than $50,000 | 8,392 (11.8%) | 4,530 (3.6%) |
| $50,000 to $99,999 | 16,629 (23.4%) | 15,726 (12.4%) |
| $100,000 to $299,999 | 26,331 (37.1%) | 63,396 (50.1%) |
| $300,000 to $499,999 | 12,369 (17.4%) | 28,923 (22.9%) |
| $500,000 to $749,999 | 4,302 (6.1%) | 9,426 (7.4%) |
| $750,000 to $999,999 | 1,151 (1.6%) | 2,979 (2.4%) |
| $1,000,000 or more | 1,765 (2.5%) | 1,591 (1.3%) |
| Total | 70,939 (100.0%) | 126,571 (100.0%) |
Household Income by Mortgage Status in Shelby County
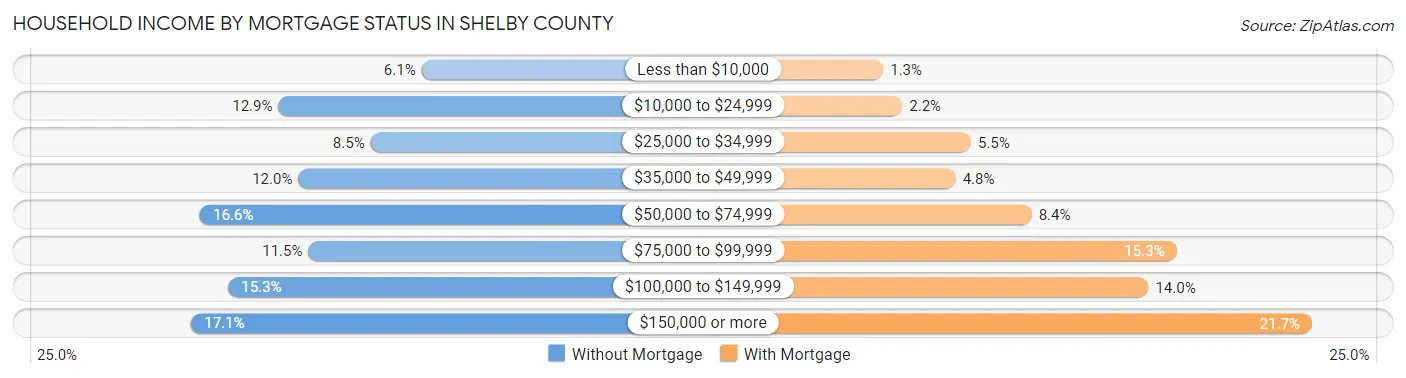
| Household Income | Without Mortgage | With Mortgage |
| Less than $10,000 | 4,325 (6.1%) | 1,668 (1.3%) |
| $10,000 to $24,999 | 9,166 (12.9%) | 2,819 (2.2%) |
| $25,000 to $34,999 | 6,049 (8.5%) | 6,961 (5.5%) |
| $35,000 to $49,999 | 8,489 (12.0%) | 6,040 (4.8%) |
| $50,000 to $74,999 | 11,807 (16.6%) | 10,614 (8.4%) |
| $75,000 to $99,999 | 8,151 (11.5%) | 19,337 (15.3%) |
| $100,000 to $149,999 | 10,853 (15.3%) | 17,653 (14.0%) |
| $150,000 or more | 12,099 (17.1%) | 27,502 (21.7%) |
| Total | 70,939 (100.0%) | 126,571 (100.0%) |
Property Value to Household Income Ratio in Shelby County
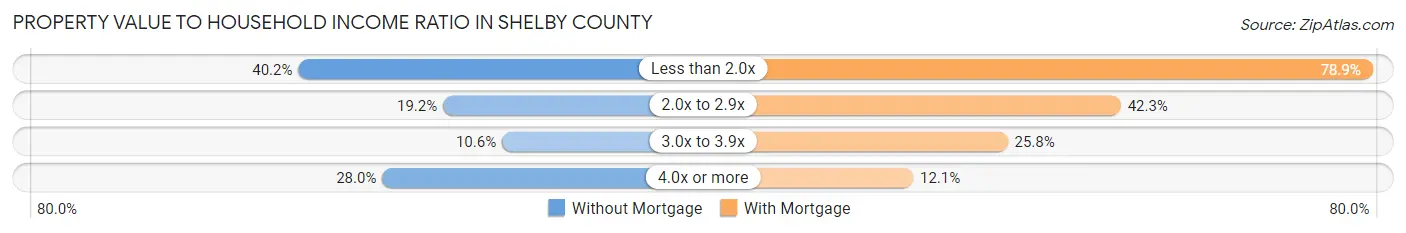
| Value-to-Income Ratio | Without Mortgage | With Mortgage |
| Less than 2.0x | 28,537 (40.2%) | 99,814 (78.9%) |
| 2.0x to 2.9x | 13,627 (19.2%) | 53,482 (42.2%) |
| 3.0x to 3.9x | 7,547 (10.6%) | 32,673 (25.8%) |
| 4.0x or more | 19,894 (28.0%) | 15,286 (12.1%) |
| Total | 70,939 (100.0%) | 126,571 (100.0%) |
Real Estate Taxes by Mortgage Status in Shelby County
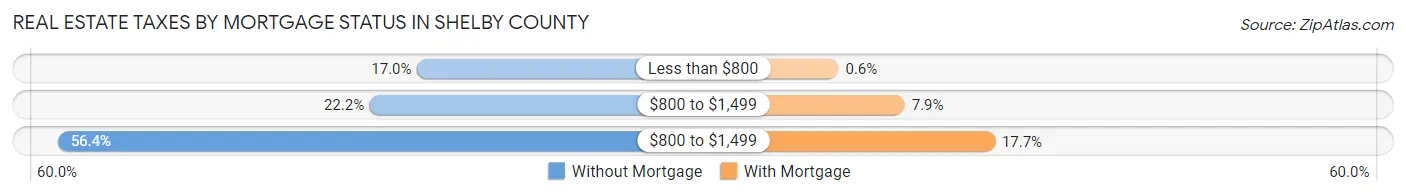
| Property Taxes | Without Mortgage | With Mortgage |
| Less than $800 | 12,029 (17.0%) | 763 (0.6%) |
| $800 to $1,499 | 15,715 (22.2%) | 9,954 (7.9%) |
| $800 to $1,499 | 39,987 (56.4%) | 22,453 (17.7%) |
| Total | 70,939 (100.0%) | 126,571 (100.0%) |
Health & Disability in Shelby County
Health Insurance Coverage by Age in Shelby County
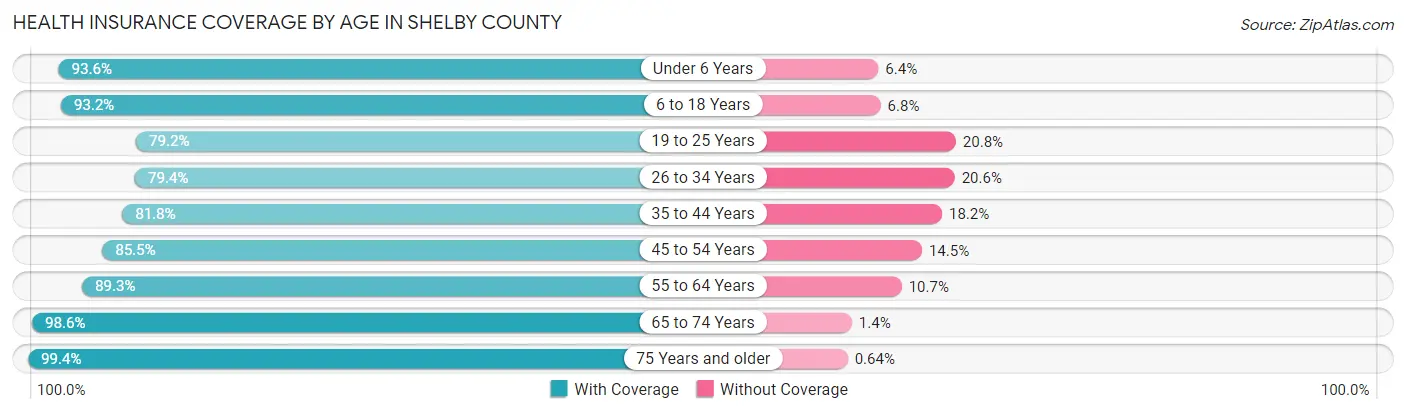
| Age Bracket | With Coverage | Without Coverage |
| Under 6 Years | 71,381 (93.6%) | 4,845 (6.4%) |
| 6 to 18 Years | 154,840 (93.2%) | 11,253 (6.8%) |
| 19 to 25 Years | 67,385 (79.2%) | 17,710 (20.8%) |
| 26 to 34 Years | 95,671 (79.4%) | 24,823 (20.6%) |
| 35 to 44 Years | 93,736 (81.8%) | 20,899 (18.2%) |
| 45 to 54 Years | 94,719 (85.5%) | 16,052 (14.5%) |
| 55 to 64 Years | 100,306 (89.3%) | 12,026 (10.7%) |
| 65 to 74 Years | 80,102 (98.6%) | 1,153 (1.4%) |
| 75 Years and older | 47,339 (99.4%) | 306 (0.6%) |
| Total | 805,479 (88.1%) | 109,067 (11.9%) |
Health Insurance Coverage by Citizenship Status in Shelby County
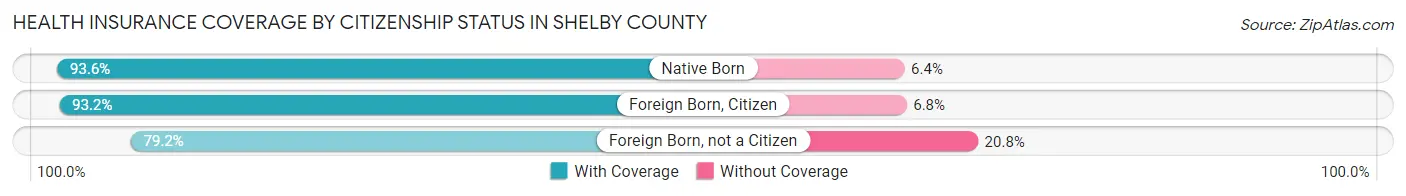
| Citizenship Status | With Coverage | Without Coverage |
| Native Born | 71,381 (93.6%) | 4,845 (6.4%) |
| Foreign Born, Citizen | 154,840 (93.2%) | 11,253 (6.8%) |
| Foreign Born, not a Citizen | 67,385 (79.2%) | 17,710 (20.8%) |
Health Insurance Coverage by Household Income in Shelby County
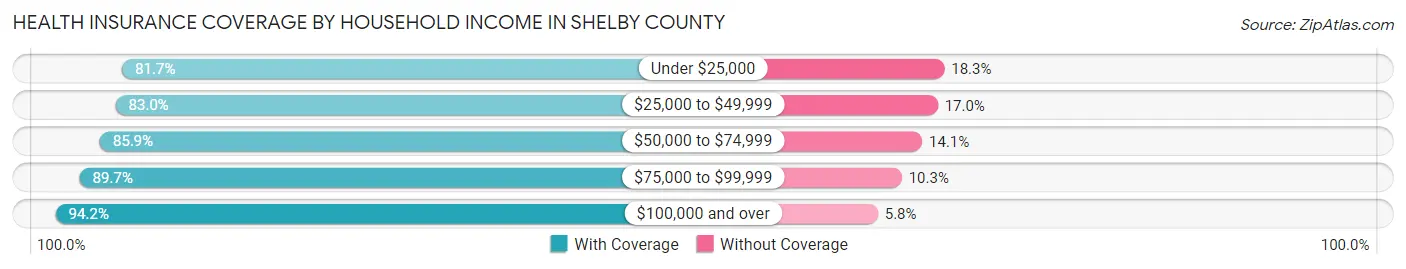
| Household Income | With Coverage | Without Coverage |
| Under $25,000 | 121,981 (81.7%) | 27,254 (18.3%) |
| $25,000 to $49,999 | 142,792 (83.0%) | 29,302 (17.0%) |
| $50,000 to $74,999 | 130,111 (85.9%) | 21,382 (14.1%) |
| $75,000 to $99,999 | 98,953 (89.7%) | 11,349 (10.3%) |
| $100,000 and over | 306,965 (94.2%) | 18,925 (5.8%) |
Public vs Private Health Insurance Coverage by Age in Shelby County
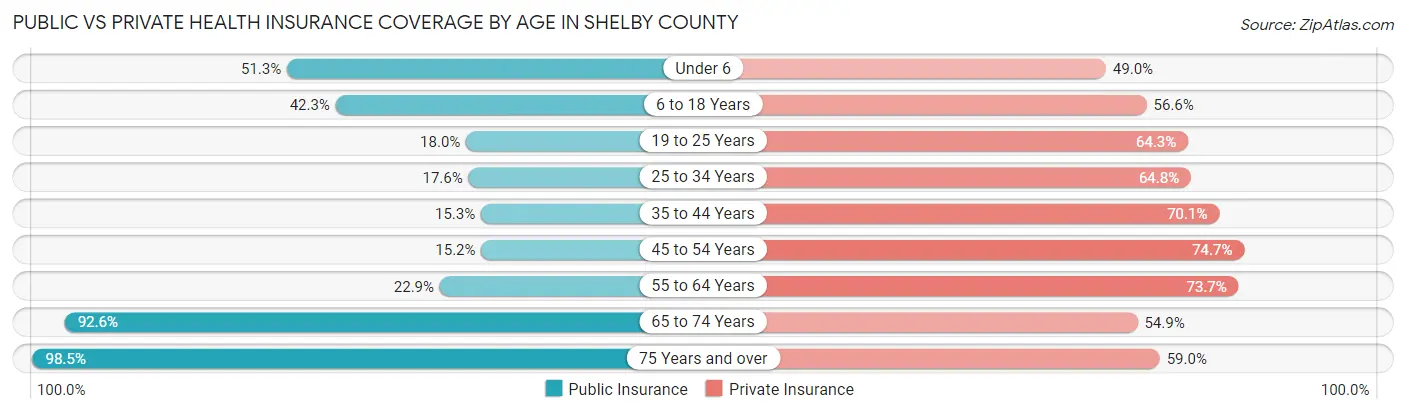
| Age Bracket | Public Insurance | Private Insurance |
| Under 6 | 39,086 (51.3%) | 37,365 (49.0%) |
| 6 to 18 Years | 70,198 (42.3%) | 93,970 (56.6%) |
| 19 to 25 Years | 15,355 (18.0%) | 54,688 (64.3%) |
| 25 to 34 Years | 21,191 (17.6%) | 78,089 (64.8%) |
| 35 to 44 Years | 17,515 (15.3%) | 80,301 (70.1%) |
| 45 to 54 Years | 16,859 (15.2%) | 82,738 (74.7%) |
| 55 to 64 Years | 25,749 (22.9%) | 82,729 (73.7%) |
| 65 to 74 Years | 75,201 (92.5%) | 44,590 (54.9%) |
| 75 Years and over | 46,936 (98.5%) | 28,114 (59.0%) |
| Total | 328,090 (35.9%) | 582,584 (63.7%) |
Disability Status by Sex by Age in Shelby County
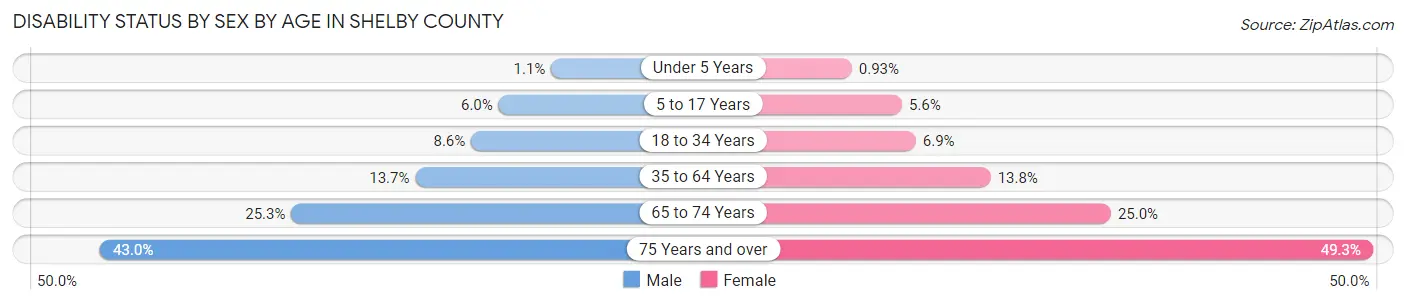
| Age Bracket | Male | Female |
| Under 5 Years | 358 (1.1%) | 289 (0.9%) |
| 5 to 17 Years | 5,125 (6.0%) | 4,626 (5.6%) |
| 18 to 34 Years | 8,929 (8.6%) | 7,753 (6.9%) |
| 35 to 64 Years | 21,673 (13.7%) | 24,868 (13.8%) |
| 65 to 74 Years | 9,128 (25.3%) | 11,269 (25.0%) |
| 75 Years and over | 7,721 (43.0%) | 14,630 (49.3%) |
Disability Class by Sex by Age in Shelby County
Disability Class: Hearing Difficulty
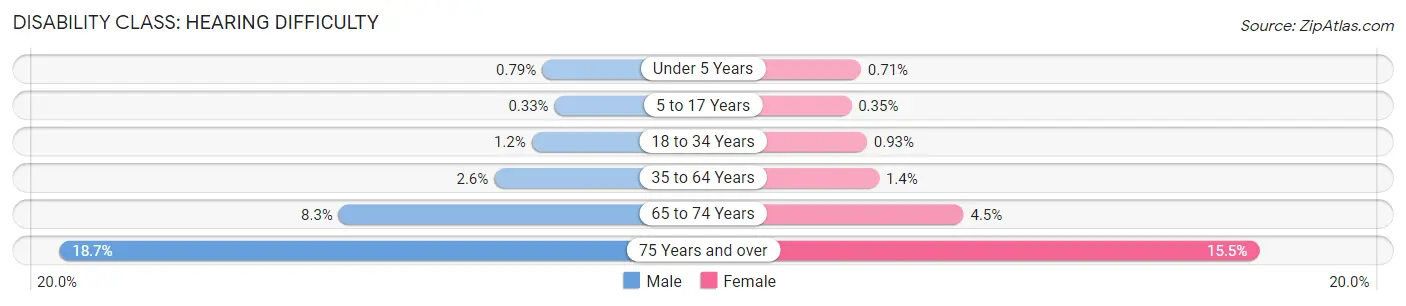
| Age Bracket | Male | Female |
| Under 5 Years | 250 (0.8%) | 220 (0.7%) |
| 5 to 17 Years | 282 (0.3%) | 291 (0.4%) |
| 18 to 34 Years | 1,230 (1.2%) | 1,048 (0.9%) |
| 35 to 64 Years | 4,055 (2.6%) | 2,484 (1.4%) |
| 65 to 74 Years | 3,016 (8.3%) | 2,037 (4.5%) |
| 75 Years and over | 3,359 (18.7%) | 4,600 (15.5%) |
Disability Class: Vision Difficulty
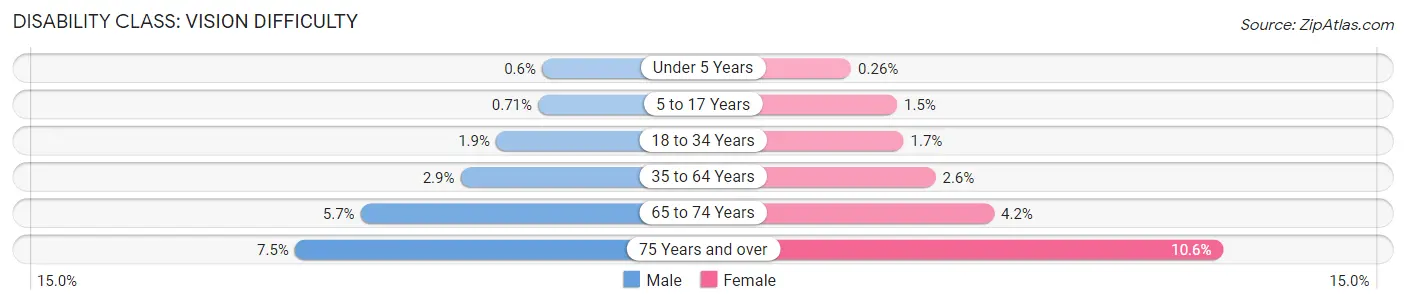
| Age Bracket | Male | Female |
| Under 5 Years | 192 (0.6%) | 80 (0.3%) |
| 5 to 17 Years | 604 (0.7%) | 1,271 (1.5%) |
| 18 to 34 Years | 1,960 (1.9%) | 1,943 (1.7%) |
| 35 to 64 Years | 4,528 (2.9%) | 4,690 (2.6%) |
| 65 to 74 Years | 2,044 (5.7%) | 1,912 (4.2%) |
| 75 Years and over | 1,344 (7.5%) | 3,153 (10.6%) |
Disability Class: Cognitive Difficulty
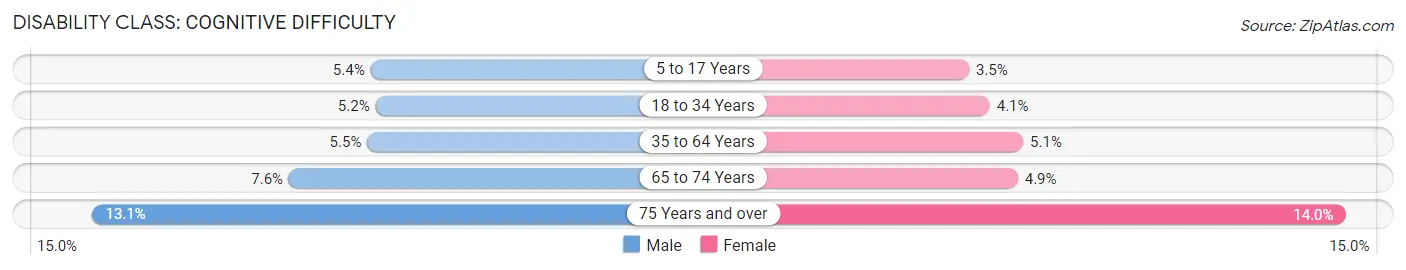
| Age Bracket | Male | Female |
| 5 to 17 Years | 4,580 (5.4%) | 2,928 (3.5%) |
| 18 to 34 Years | 5,450 (5.2%) | 4,644 (4.1%) |
| 35 to 64 Years | 8,616 (5.5%) | 9,089 (5.1%) |
| 65 to 74 Years | 2,762 (7.6%) | 2,209 (4.9%) |
| 75 Years and over | 2,354 (13.1%) | 4,161 (14.0%) |
Disability Class: Ambulatory Difficulty
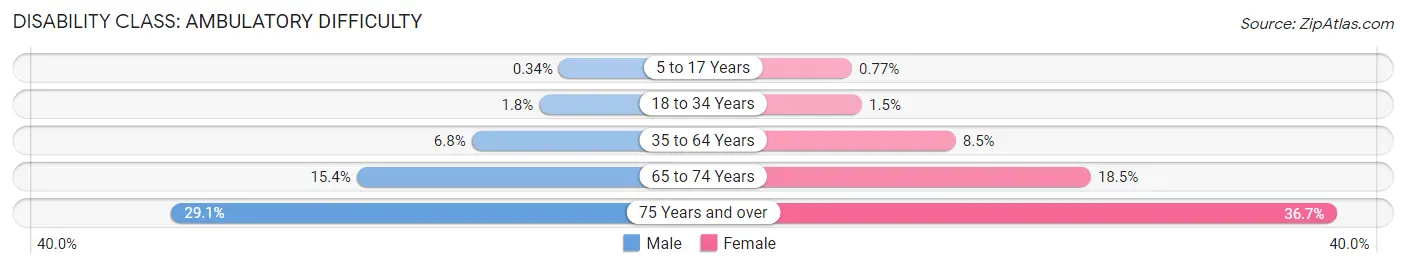
| Age Bracket | Male | Female |
| 5 to 17 Years | 293 (0.3%) | 639 (0.8%) |
| 18 to 34 Years | 1,873 (1.8%) | 1,707 (1.5%) |
| 35 to 64 Years | 10,754 (6.8%) | 15,240 (8.5%) |
| 65 to 74 Years | 5,552 (15.4%) | 8,345 (18.5%) |
| 75 Years and over | 5,226 (29.1%) | 10,899 (36.7%) |
Disability Class: Self-Care Difficulty
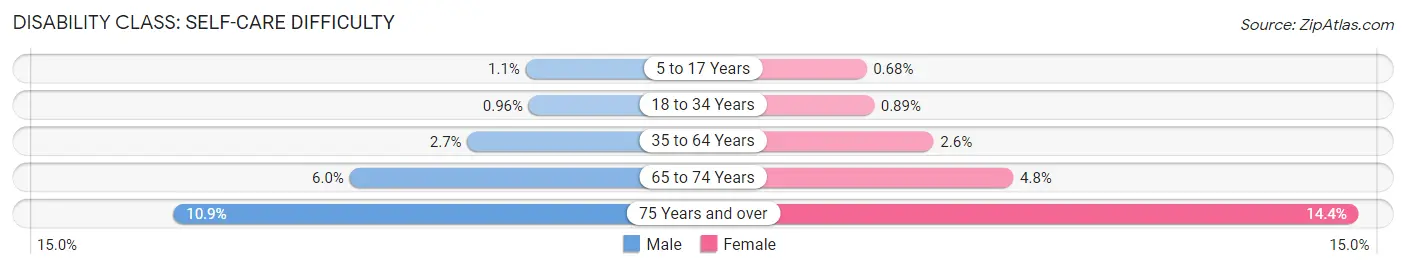
| Age Bracket | Male | Female |
| 5 to 17 Years | 891 (1.1%) | 564 (0.7%) |
| 18 to 34 Years | 1,004 (1.0%) | 1,008 (0.9%) |
| 35 to 64 Years | 4,213 (2.7%) | 4,583 (2.5%) |
| 65 to 74 Years | 2,149 (5.9%) | 2,150 (4.8%) |
| 75 Years and over | 1,950 (10.9%) | 4,272 (14.4%) |
Technology Access in Shelby County
Computing Device Access in Shelby County
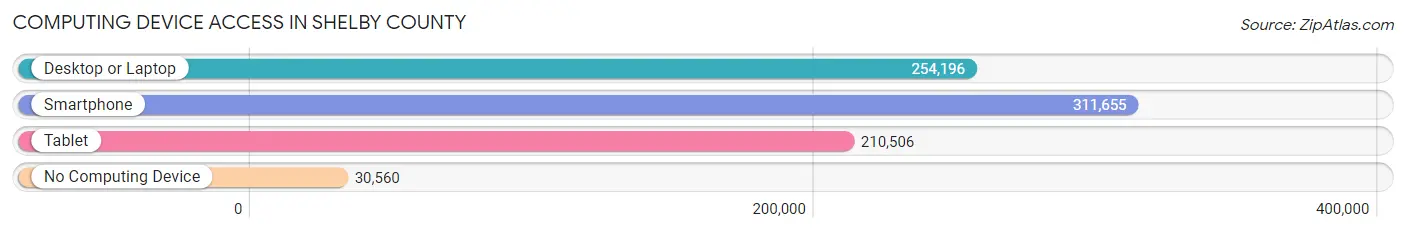
| Device Type | # Households | % Households |
| Desktop or Laptop | 254,196 | 71.0% |
| Smartphone | 311,655 | 87.1% |
| Tablet | 210,506 | 58.8% |
| No Computing Device | 30,560 | 8.5% |
| Total | 357,839 | 100.0% |
Internet Access in Shelby County

| Internet Type | # Households | % Households |
| Dial-Up Internet | 396 | 0.1% |
| Broadband Home | 237,094 | 66.3% |
| Cellular Data Only | 53,007 | 14.8% |
| Satellite Internet | 24,560 | 6.9% |
| No Internet | 55,795 | 15.6% |
| Total | 357,839 | 100.0% |
Shelby County Summary
Shelby County, Tennessee is located in the western part of the state and is the most populous county in the state. It is bordered by Fayette, Tipton, and Lauderdale counties to the north, DeSoto County, Mississippi to the west, Marshall County, Mississippi to the south, and Tipton and Fayette counties to the east. The county seat is Memphis, the largest city in the state and the second largest city in the United States.
History
Shelby County was established in 1819 and named after Governor Isaac Shelby of Kentucky. The county was originally part of the Chickasaw Nation, and the area was first settled by Europeans in the early 1800s. The county was home to many plantations and was a major center of the cotton industry. During the Civil War, the county was the site of several battles, including the Battle of Memphis in 1862.
After the war, the county experienced a period of growth and development. The city of Memphis was incorporated in 1826 and became a major transportation hub, with the Mississippi River and the Memphis and Charleston Railroad providing access to the rest of the country. The city also became a major center of the blues and jazz music scenes.
In the late 19th and early 20th centuries, the county experienced a period of industrialization and population growth. The city of Memphis became a major center of manufacturing and transportation, and the county's population grew rapidly. The city also became a major center of the civil rights movement in the 1950s and 1960s.
Geography
Shelby County covers an area of 717 square miles and is located in the western part of the state. The county is bordered by Fayette, Tipton, and Lauderdale counties to the north, DeSoto County, Mississippi to the west, Marshall County, Mississippi to the south, and Tipton and Fayette counties to the east. The county is located in the Mississippi Alluvial Plain, and the terrain is mostly flat. The county is drained by the Mississippi River and its tributaries, including the Wolf, Loosahatchie, and Nonconnah rivers.
Economy
Shelby County has a diverse economy, with a mix of manufacturing, services, and government. The county is home to several major employers, including FedEx, St. Jude Children's Research Hospital, and the University of Memphis. The county is also home to several major tourist attractions, including Graceland, the home of Elvis Presley, and the National Civil Rights Museum.
The county's economy is also supported by agriculture, with cotton, soybeans, and corn being the major crops. The county is also home to several major industrial parks, including the Memphis International Airport Industrial Park and the Memphis Regional Megasite.
Demographics
As of the 2010 census, Shelby County had a population of 927,644. The population is racially diverse, with African Americans making up the largest racial group at 63.3%, followed by whites at 30.2%, Hispanics at 4.2%, and Asians at 2.3%. The median household income is $41,943, and the median age is 35.7.
Shelby County is home to several major cities, including Memphis, Germantown, Bartlett, and Collierville. The county is also home to several smaller towns and unincorporated communities. The county is served by several major highways, including Interstate 40, Interstate 55, and Interstate 240.
Common Questions
What is the Total Population of Shelby County?
Total Population of Shelby County is 926,440.
What is the Total Male Population of Shelby County?
Total Male Population of Shelby County is 441,579.
What is the Total Female Population of Shelby County?
Total Female Population of Shelby County is 484,861.
What is the Ratio of Males per 100 Females in Shelby County?
There are 91.07 Males per 100 Females in Shelby County.
What is the Ratio of Females per 100 Males in Shelby County?
There are 109.80 Females per 100 Males in Shelby County.
What is the Median Population Age in Shelby County?
Median Population Age in Shelby County is 35.9 Years.
What is the Average Family Size in Shelby County
Average Family Size in Shelby County is 3.3 People.
What is the Average Household Size in Shelby County
Average Household Size in Shelby County is 2.5 People.
What is Per Capita Income in Shelby County?
Per Capita income in Shelby County is $36,230.
What is the Median Family Income in Shelby County?
Median Family Income in Shelby County is $77,264.
What is the Median Household income in Shelby County?
Median Household Income in Shelby County is $59,621.
What is Income or Wage Gap in Shelby County?
Income or Wage Gap in Shelby County is 19.0%.
Women in Shelby County earn 81.0 cents for every dollar earned by a man.
What is Family Income Deficit in Shelby County?
Family Income Deficit in Shelby County is $12,200.
Families that are below poverty line in Shelby County earn $12,200 less on average than the poverty threshold level.
What is Inequality or Gini Index in Shelby County?
Inequality or Gini Index in Shelby County is 0.51.
How Large is the Labor Force in Shelby County?
There are 465,460 People in the Labor Forcein in Shelby County.
What is the Percentage of People in the Labor Force in Shelby County?
64.5% of People are in the Labor Force in Shelby County.
What is the Unemployment Rate in Shelby County?
Unemployment Rate in Shelby County is 7.3%.