Sequatchie County, TN
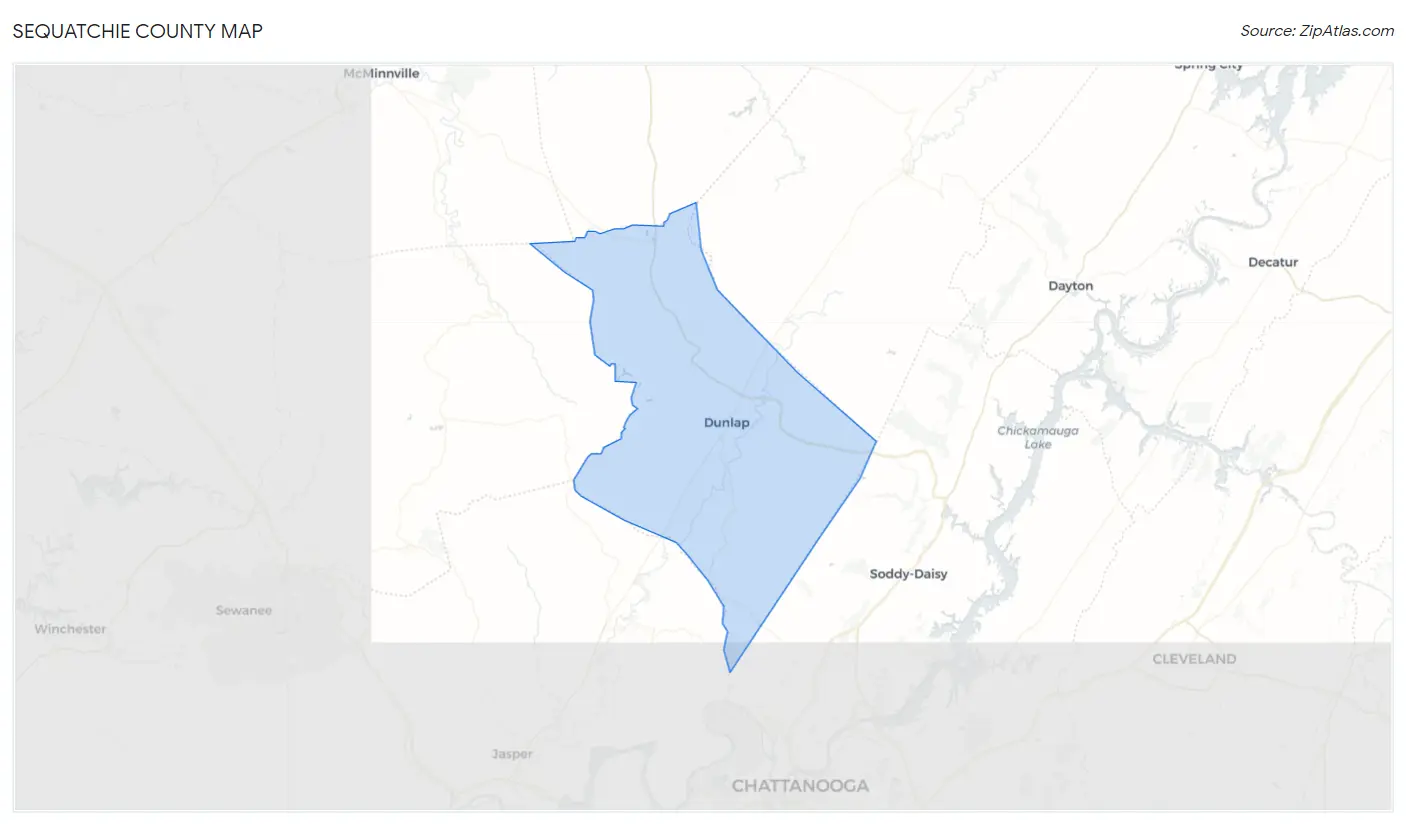
Sequatchie County Map
Sequatchie County Overview
16,065
TOTAL POPULATION
8,232
MALE POPULATION
7,833
FEMALE POPULATION
105.09
MALES / 100 FEMALES
95.15
FEMALES / 100 MALES
44.4
MEDIAN AGE
3.0
AVG FAMILY SIZE
2.7
AVG HOUSEHOLD SIZE
$25,954
PER CAPITA INCOME
$63,095
AVG FAMILY INCOME
$53,038
AVG HOUSEHOLD INCOME
36.0%
WAGE / INCOME GAP [ % ]
64.0¢/ $1
WAGE / INCOME GAP [ $ ]
$10,597
FAMILY INCOME DEFICIT
0.44
INEQUALITY / GINI INDEX
6,606
LABOR FORCE [ PEOPLE ]
50.0%
PERCENT IN LABOR FORCE
3.3%
UNEMPLOYMENT RATE
Sequatchie County Area Codes
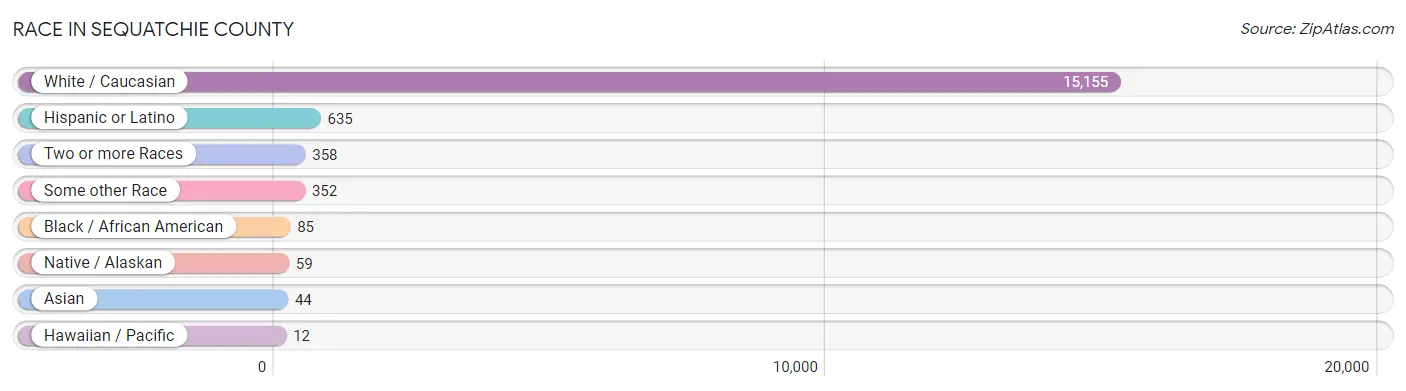
Race in Sequatchie County
The most populous races in Sequatchie County are White / Caucasian (15,155 | 94.3%), Hispanic or Latino (635 | 4.0%), and Two or more Races (358 | 2.2%).
| Race | # Population | % Population |
| Asian | 44 | 0.3% |
| Black / African American | 85 | 0.5% |
| Hawaiian / Pacific | 12 | 0.1% |
| Hispanic or Latino | 635 | 4.0% |
| Native / Alaskan | 59 | 0.4% |
| White / Caucasian | 15,155 | 94.3% |
| Two or more Races | 358 | 2.2% |
| Some other Race | 352 | 2.2% |
| Total | 16,065 | 100.0% |
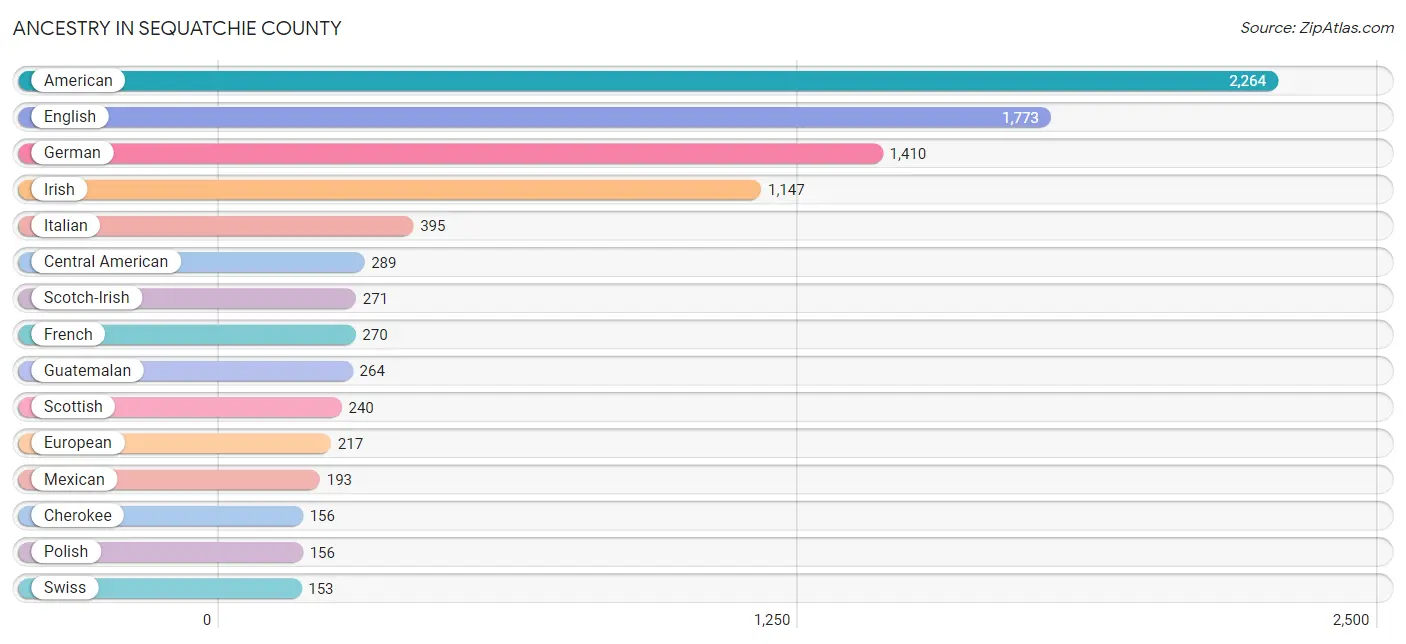
Ancestry in Sequatchie County
The most populous ancestries reported in Sequatchie County are American (2,264 | 14.1%), English (1,773 | 11.0%), German (1,410 | 8.8%), Irish (1,147 | 7.1%), and Italian (395 | 2.5%), together accounting for 43.5% of all Sequatchie County residents.
| Ancestry | # Population | % Population |
| American | 2,264 | 14.1% |
| Apache | 17 | 0.1% |
| Arab | 72 | 0.4% |
| Austrian | 9 | 0.1% |
| Canadian | 17 | 0.1% |
| Central American | 289 | 1.8% |
| Cherokee | 156 | 1.0% |
| Chippewa | 22 | 0.1% |
| Danish | 5 | 0.0% |
| Dutch | 85 | 0.5% |
| Eastern European | 16 | 0.1% |
| Egyptian | 72 | 0.4% |
| English | 1,773 | 11.0% |
| European | 217 | 1.3% |
| Finnish | 25 | 0.2% |
| French | 270 | 1.7% |
| French Canadian | 23 | 0.1% |
| German | 1,410 | 8.8% |
| Guatemalan | 264 | 1.6% |
| Hungarian | 25 | 0.2% |
| Indian (Asian) | 44 | 0.3% |
| Irish | 1,147 | 7.1% |
| Italian | 395 | 2.5% |
| Lithuanian | 4 | 0.0% |
| Lumbee | 7 | 0.0% |
| Mexican | 193 | 1.2% |
| Northern European | 16 | 0.1% |
| Norwegian | 44 | 0.3% |
| Palestinian | 72 | 0.4% |
| Panamanian | 6 | 0.0% |
| Pennsylvania German | 17 | 0.1% |
| Polish | 156 | 1.0% |
| Portuguese | 6 | 0.0% |
| Puerto Rican | 51 | 0.3% |
| Salvadoran | 19 | 0.1% |
| Samoan | 12 | 0.1% |
| Scandinavian | 12 | 0.1% |
| Scotch-Irish | 271 | 1.7% |
| Scottish | 240 | 1.5% |
| Sioux | 34 | 0.2% |
| Slovene | 10 | 0.1% |
| Spaniard | 15 | 0.1% |
| Swedish | 17 | 0.1% |
| Swiss | 153 | 0.9% |
| Welsh | 33 | 0.2% | View All 45 Rows |
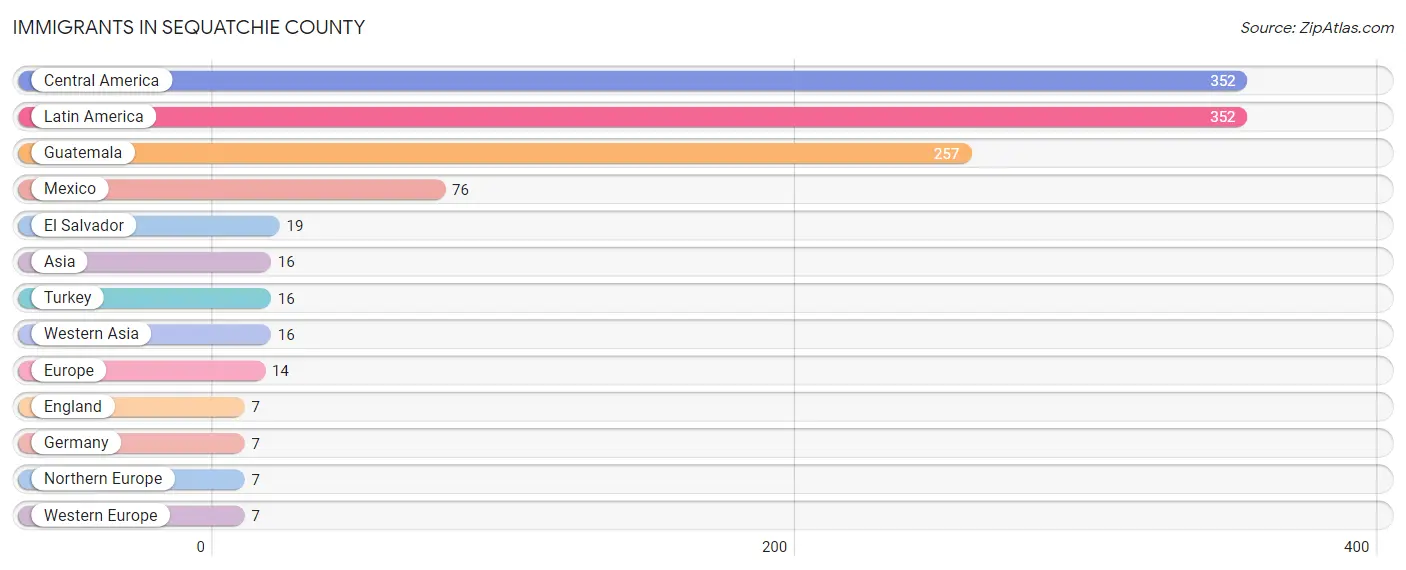
Immigrants in Sequatchie County
The most numerous immigrant groups reported in Sequatchie County came from Central America (352 | 2.2%), Latin America (352 | 2.2%), Guatemala (257 | 1.6%), Mexico (76 | 0.5%), and El Salvador (19 | 0.1%), together accounting for 6.6% of all Sequatchie County residents.
| Immigration Origin | # Population | % Population |
| Asia | 16 | 0.1% |
| Central America | 352 | 2.2% |
| El Salvador | 19 | 0.1% |
| England | 7 | 0.0% |
| Europe | 14 | 0.1% |
| Germany | 7 | 0.0% |
| Guatemala | 257 | 1.6% |
| Latin America | 352 | 2.2% |
| Mexico | 76 | 0.5% |
| Northern Europe | 7 | 0.0% |
| Turkey | 16 | 0.1% |
| Western Asia | 16 | 0.1% |
| Western Europe | 7 | 0.0% | View All 13 Rows |
Sex and Age in Sequatchie County
Sex and Age in Sequatchie County
The most populous age groups in Sequatchie County are 15 to 19 Years (664 | 8.1%) for men and 60 to 64 Years (608 | 7.8%) for women.
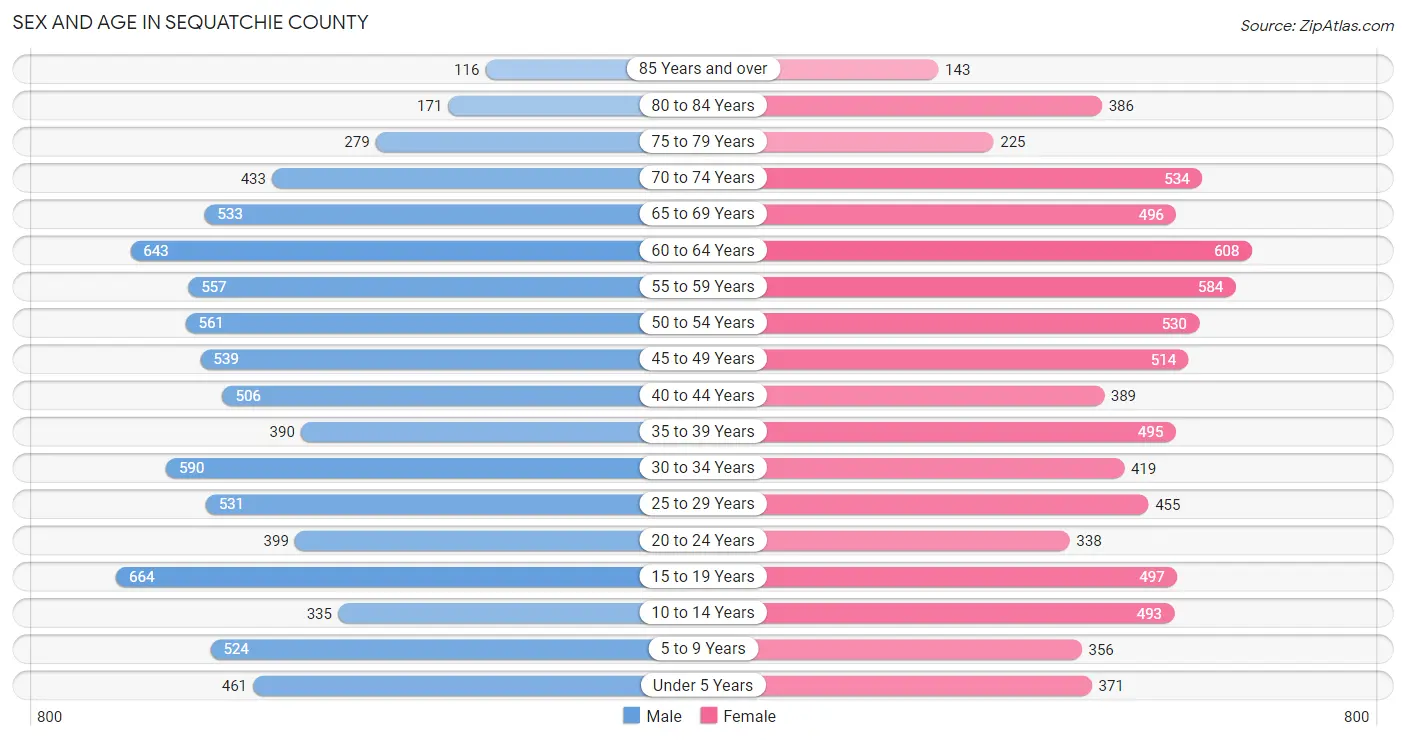
| Age Bracket | Male | Female |
| Under 5 Years | 461 (5.6%) | 371 (4.7%) |
| 5 to 9 Years | 524 (6.4%) | 356 (4.5%) |
| 10 to 14 Years | 335 (4.1%) | 493 (6.3%) |
| 15 to 19 Years | 664 (8.1%) | 497 (6.3%) |
| 20 to 24 Years | 399 (4.9%) | 338 (4.3%) |
| 25 to 29 Years | 531 (6.5%) | 455 (5.8%) |
| 30 to 34 Years | 590 (7.2%) | 419 (5.3%) |
| 35 to 39 Years | 390 (4.7%) | 495 (6.3%) |
| 40 to 44 Years | 506 (6.1%) | 389 (5.0%) |
| 45 to 49 Years | 539 (6.6%) | 514 (6.6%) |
| 50 to 54 Years | 561 (6.8%) | 530 (6.8%) |
| 55 to 59 Years | 557 (6.8%) | 584 (7.5%) |
| 60 to 64 Years | 643 (7.8%) | 608 (7.8%) |
| 65 to 69 Years | 533 (6.5%) | 496 (6.3%) |
| 70 to 74 Years | 433 (5.3%) | 534 (6.8%) |
| 75 to 79 Years | 279 (3.4%) | 225 (2.9%) |
| 80 to 84 Years | 171 (2.1%) | 386 (4.9%) |
| 85 Years and over | 116 (1.4%) | 143 (1.8%) |
| Total | 8,232 (100.0%) | 7,833 (100.0%) |
Families and Households in Sequatchie County
Median Family Size in Sequatchie County
The median family size in Sequatchie County is 3.03 persons per family, with single male/father families (430 | 9.6%) accounting for the largest median family size of 3.59 persons per family. On the other hand, married-couple families (3,395 | 75.5%) represent the smallest median family size with 2.91 persons per family.
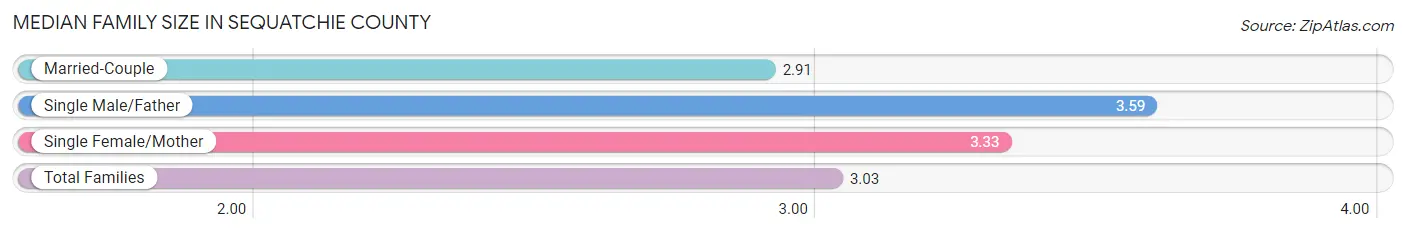
| Family Type | # Families | Family Size |
| Married-Couple | 3,395 (75.5%) | 2.91 |
| Single Male/Father | 430 (9.6%) | 3.59 |
| Single Female/Mother | 673 (15.0%) | 3.33 |
| Total Families | 4,498 (100.0%) | 3.03 |
Median Household Size in Sequatchie County
The median household size in Sequatchie County is 2.67 persons per household, with single male/father households (430 | 7.3%) accounting for the largest median household size of 4.12 persons per household. non-family households (1,427 | 24.1%) represent the smallest median household size with 1.19 persons per household.
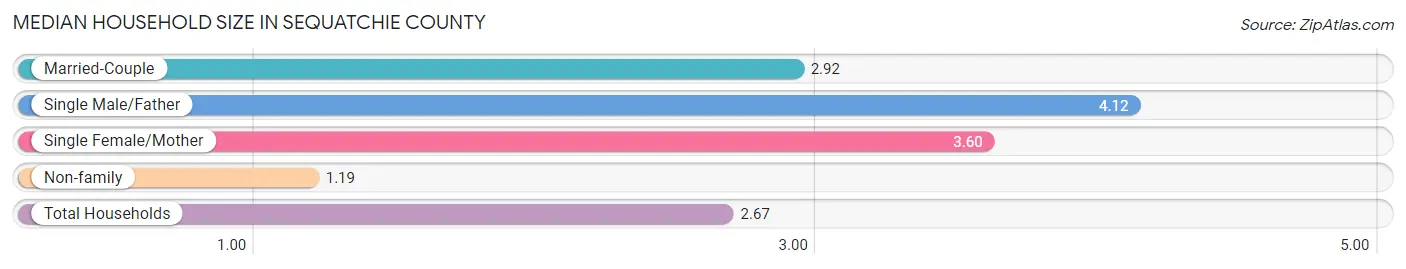
| Household Type | # Households | Household Size |
| Married-Couple | 3,395 (57.3%) | 2.92 |
| Single Male/Father | 430 (7.3%) | 4.12 |
| Single Female/Mother | 673 (11.4%) | 3.60 |
| Non-family | 1,427 (24.1%) | 1.19 |
| Total Households | 5,925 (100.0%) | 2.67 |
Household Size by Marriage Status in Sequatchie County
Out of a total of 5,925 households in Sequatchie County, 4,498 (75.9%) are family households, while 1,427 (24.1%) are nonfamily households. The most numerous type of family households are 2-person households, comprising 2,292, and the most common type of nonfamily households are 1-person households, comprising 1,188.
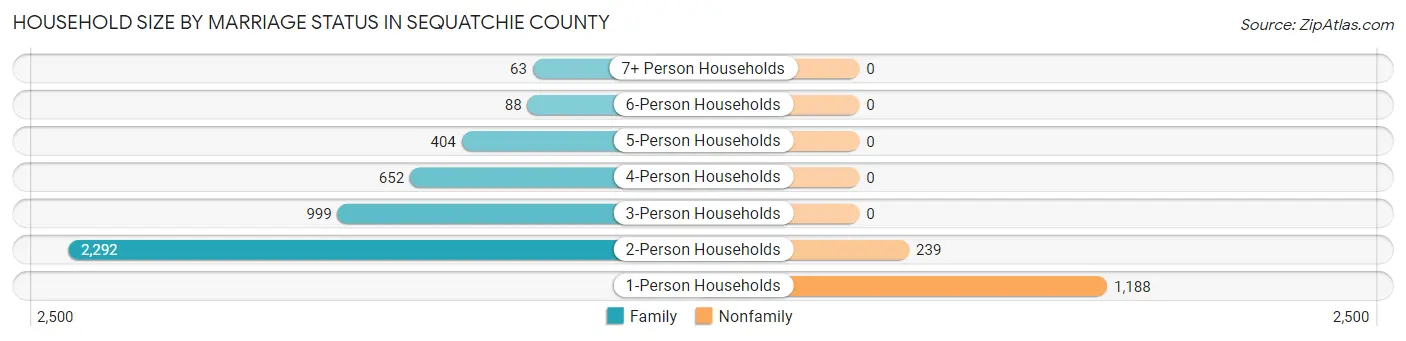
| Household Size | Family Households | Nonfamily Households |
| 1-Person Households | - | 1,188 (20.1%) |
| 2-Person Households | 2,292 (38.7%) | 239 (4.0%) |
| 3-Person Households | 999 (16.9%) | 0 (0.0%) |
| 4-Person Households | 652 (11.0%) | 0 (0.0%) |
| 5-Person Households | 404 (6.8%) | 0 (0.0%) |
| 6-Person Households | 88 (1.5%) | 0 (0.0%) |
| 7+ Person Households | 63 (1.1%) | 0 (0.0%) |
| Total | 4,498 (75.9%) | 1,427 (24.1%) |
Female Fertility in Sequatchie County
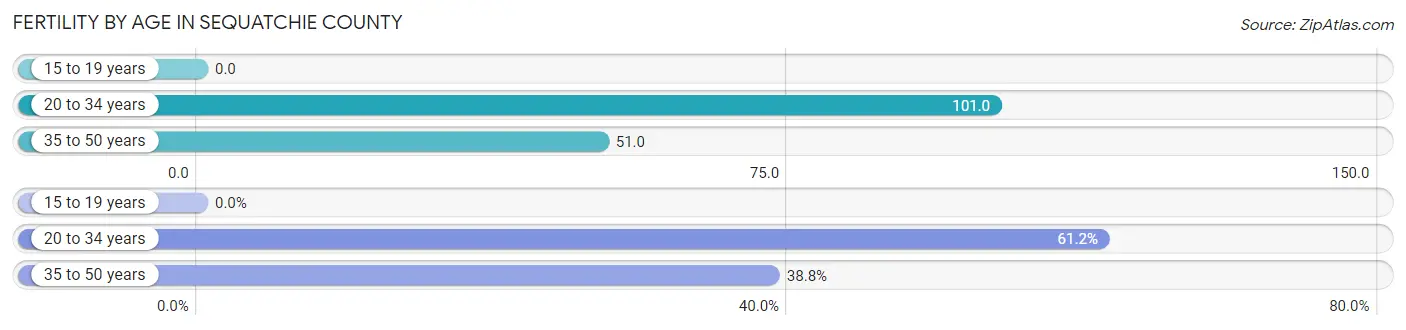
Fertility by Age in Sequatchie County
Average fertility rate in Sequatchie County is 62.0 births per 1,000 women. Women in the age bracket of 20 to 34 years have the highest fertility rate with 101.0 births per 1,000 women. Women in the age bracket of 20 to 34 years acount for 61.2% of all women with births.
| Age Bracket | Women with Births | Births / 1,000 Women |
| 15 to 19 years | 0 (0.0%) | 0.0 |
| 20 to 34 years | 123 (61.2%) | 101.0 |
| 35 to 50 years | 78 (38.8%) | 51.0 |
| Total | 201 (100.0%) | 62.0 |
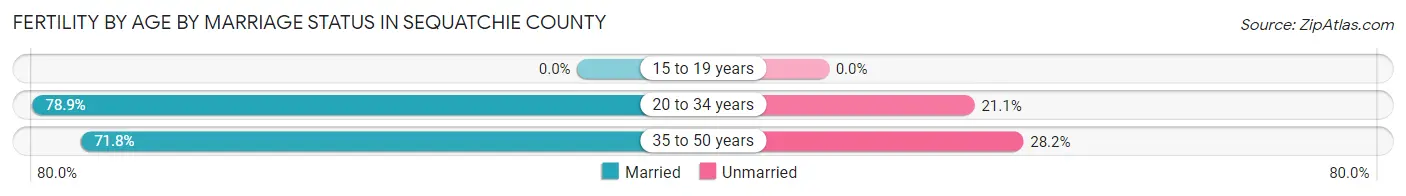
Fertility by Age by Marriage Status in Sequatchie County
76.1% of women with births (201) in Sequatchie County are married. The highest percentage of unmarried women with births falls into 35 to 50 years age bracket with 28.2% of them unmarried at the time of birth, while the lowest percentage of unmarried women with births belong to 20 to 34 years age bracket with 21.1% of them unmarried.
| Age Bracket | Married | Unmarried |
| 15 to 19 years | 0 (0.0%) | 0 (0.0%) |
| 20 to 34 years | 97 (78.9%) | 26 (21.1%) |
| 35 to 50 years | 56 (71.8%) | 22 (28.2%) |
| Total | 153 (76.1%) | 48 (23.9%) |
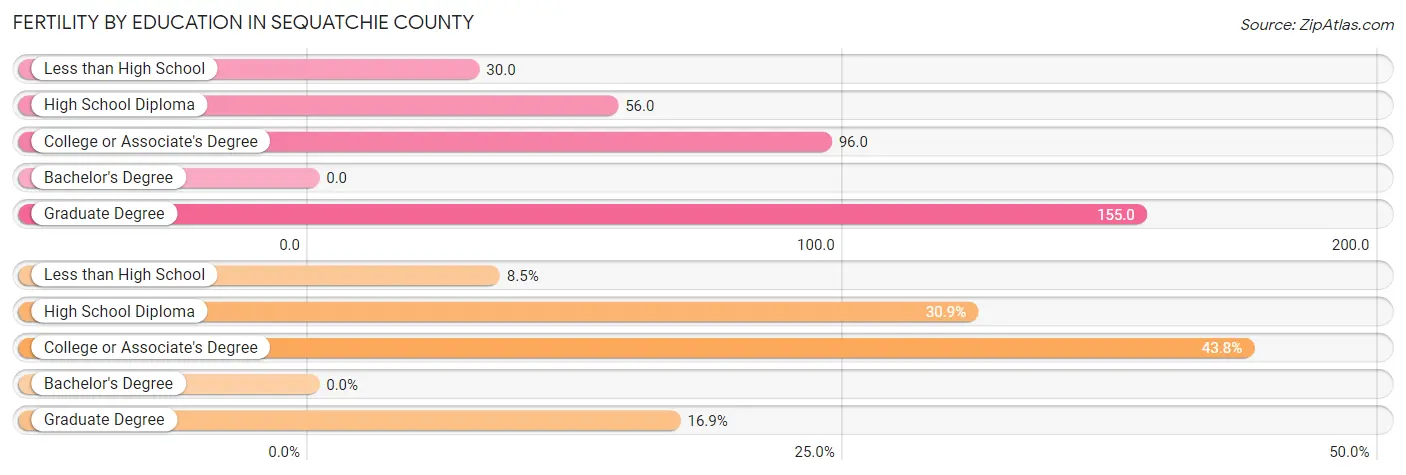
Fertility by Education in Sequatchie County
| Educational Attainment | Women with Births | Births / 1,000 Women |
| Less than High School | 17 (8.5%) | 30.0 |
| High School Diploma | 62 (30.8%) | 56.0 |
| College or Associate's Degree | 88 (43.8%) | 96.0 |
| Bachelor's Degree | 0 (0.0%) | 0.0 |
| Graduate Degree | 34 (16.9%) | 155.0 |
| Total | 201 (100.0%) | 62.0 |
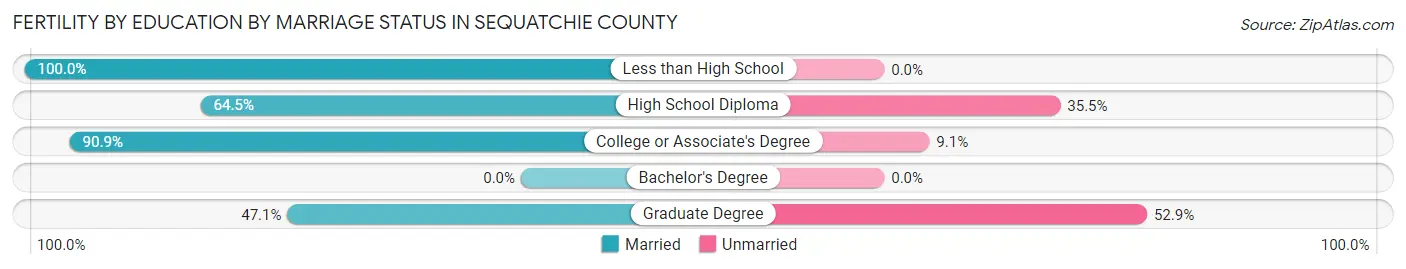
Fertility by Education by Marriage Status in Sequatchie County
23.9% of women with births in Sequatchie County are unmarried. Women with the educational attainment of less than high school are most likely to be married with 100.0% of them married at childbirth, while women with the educational attainment of graduate degree are least likely to be married with 52.9% of them unmarried at childbirth.
| Educational Attainment | Married | Unmarried |
| Less than High School | 17 (100.0%) | 0 (0.0%) |
| High School Diploma | 40 (64.5%) | 22 (35.5%) |
| College or Associate's Degree | 80 (90.9%) | 8 (9.1%) |
| Bachelor's Degree | 0 (0.0%) | 0 (0.0%) |
| Graduate Degree | 16 (47.1%) | 18 (52.9%) |
| Total | 153 (76.1%) | 48 (23.9%) |
Income in Sequatchie County
Income Overview in Sequatchie County
Per Capita Income in Sequatchie County is $25,954, while median incomes of families and households are $63,095 and $53,038 respectively.
| Characteristic | Number | Measure |
| Per Capita Income | 16,065 | $25,954 |
| Median Family Income | 4,498 | $63,095 |
| Mean Family Income | 4,498 | $76,394 |
| Median Household Income | 5,925 | $53,038 |
| Mean Household Income | 5,925 | $67,774 |
| Income Deficit | 4,498 | $10,597 |
| Wage / Income Gap (%) | 16,065 | 36.05% |
| Wage / Income Gap ($) | 16,065 | 63.95¢ per $1 |
| Gini / Inequality Index | 16,065 | 0.44 |
Earnings by Sex in Sequatchie County
Average Earnings in Sequatchie County are $29,960, $35,292 for men and $22,570 for women, a difference of 36.0%.
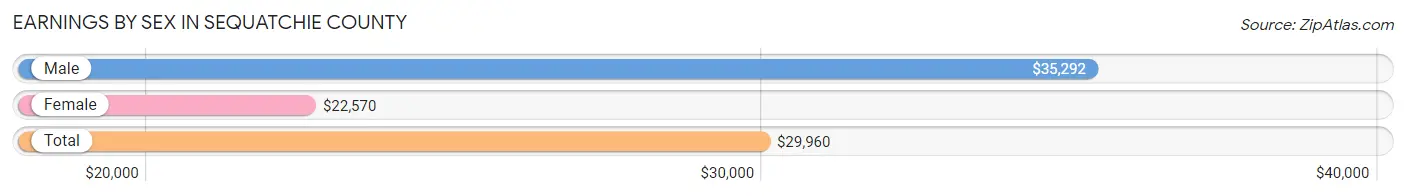
| Sex | Number | Average Earnings |
| Male | 3,953 (56.7%) | $35,292 |
| Female | 3,018 (43.3%) | $22,570 |
| Total | 6,971 (100.0%) | $29,960 |
Earnings by Sex by Income Bracket in Sequatchie County
The most common earnings brackets in Sequatchie County are $75,000 to $99,999 for men (397 | 10.0%) and $2,499 or less for women (284 | 9.4%).
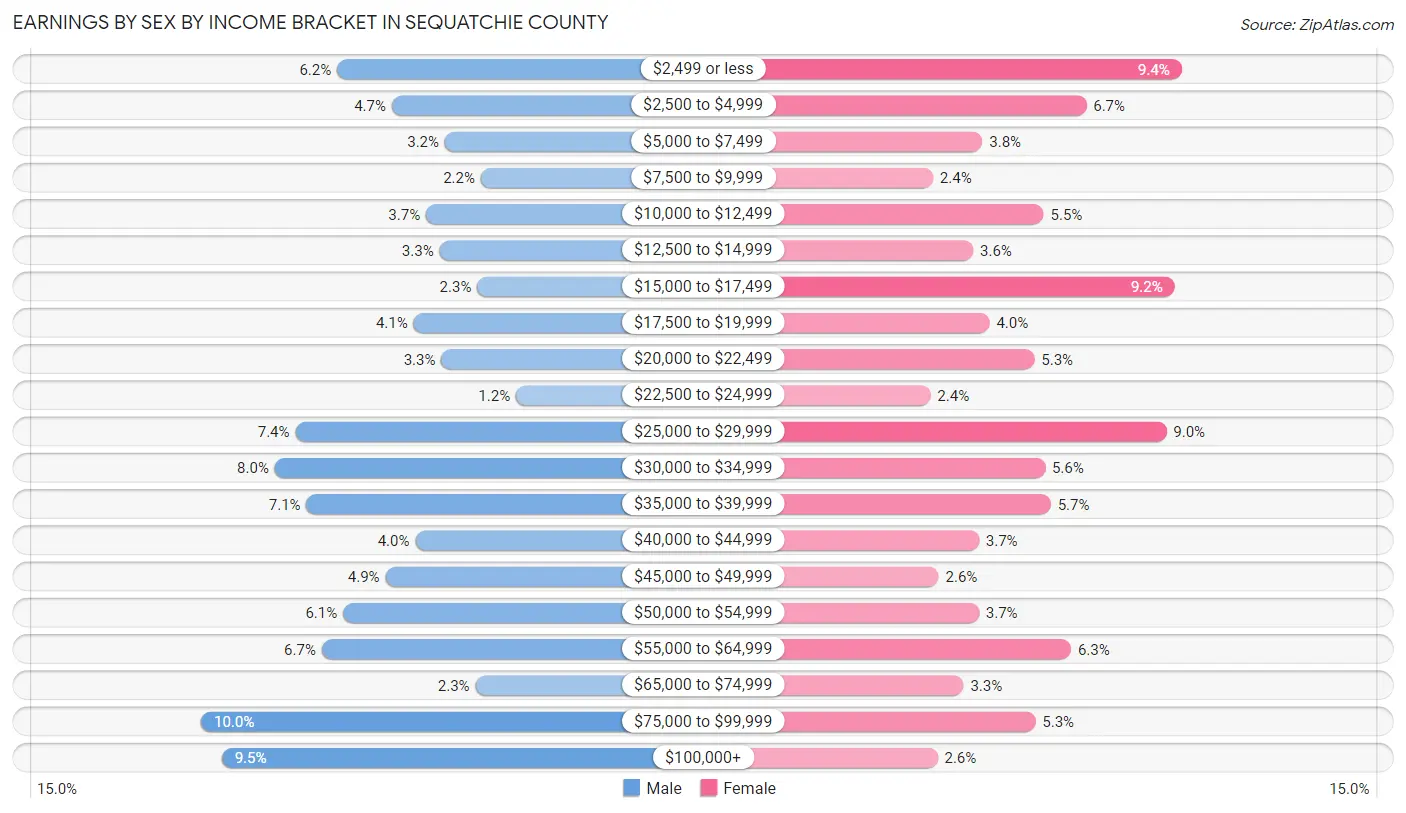
| Income | Male | Female |
| $2,499 or less | 246 (6.2%) | 284 (9.4%) |
| $2,500 to $4,999 | 185 (4.7%) | 203 (6.7%) |
| $5,000 to $7,499 | 126 (3.2%) | 115 (3.8%) |
| $7,500 to $9,999 | 86 (2.2%) | 73 (2.4%) |
| $10,000 to $12,499 | 147 (3.7%) | 167 (5.5%) |
| $12,500 to $14,999 | 132 (3.3%) | 107 (3.5%) |
| $15,000 to $17,499 | 90 (2.3%) | 278 (9.2%) |
| $17,500 to $19,999 | 161 (4.1%) | 121 (4.0%) |
| $20,000 to $22,499 | 130 (3.3%) | 159 (5.3%) |
| $22,500 to $24,999 | 47 (1.2%) | 71 (2.4%) |
| $25,000 to $29,999 | 292 (7.4%) | 271 (9.0%) |
| $30,000 to $34,999 | 315 (8.0%) | 168 (5.6%) |
| $35,000 to $39,999 | 280 (7.1%) | 173 (5.7%) |
| $40,000 to $44,999 | 159 (4.0%) | 112 (3.7%) |
| $45,000 to $49,999 | 192 (4.9%) | 78 (2.6%) |
| $50,000 to $54,999 | 239 (6.0%) | 112 (3.7%) |
| $55,000 to $64,999 | 263 (6.7%) | 190 (6.3%) |
| $65,000 to $74,999 | 92 (2.3%) | 99 (3.3%) |
| $75,000 to $99,999 | 397 (10.0%) | 160 (5.3%) |
| $100,000+ | 374 (9.5%) | 77 (2.5%) |
| Total | 3,953 (100.0%) | 3,018 (100.0%) |
Earnings by Sex by Educational Attainment in Sequatchie County
Average earnings in Sequatchie County are $39,912 for men and $25,919 for women, a difference of 35.1%. Men with an educational attainment of bachelor's degree enjoy the highest average annual earnings of $54,792, while those with less than high school education earn the least with $24,773. Women with an educational attainment of graduate degree earn the most with the average annual earnings of $54,817, while those with high school diploma education have the smallest earnings of $16,716.
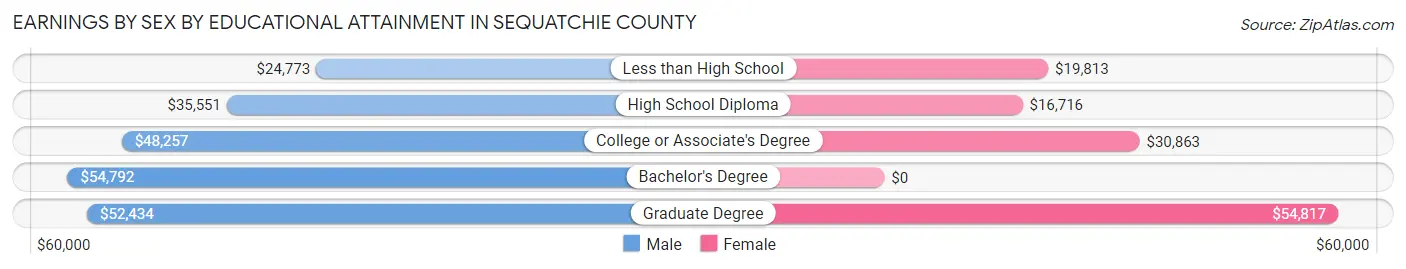
| Educational Attainment | Male Income | Female Income |
| Less than High School | $24,773 | $19,813 |
| High School Diploma | $35,551 | $16,716 |
| College or Associate's Degree | $48,257 | $30,863 |
| Bachelor's Degree | $54,792 | $0 |
| Graduate Degree | $52,434 | $54,817 |
| Total | $39,912 | $25,919 |
Family Income in Sequatchie County
Family Income Brackets in Sequatchie County
According to the Sequatchie County family income data, there are 841 families falling into the $50,000 to $74,999 income range, which is the most common income bracket and makes up 18.7% of all families. Conversely, the $10,000 to $14,999 income bracket is the least frequent group with only 121 families (2.7%) belonging to this category.
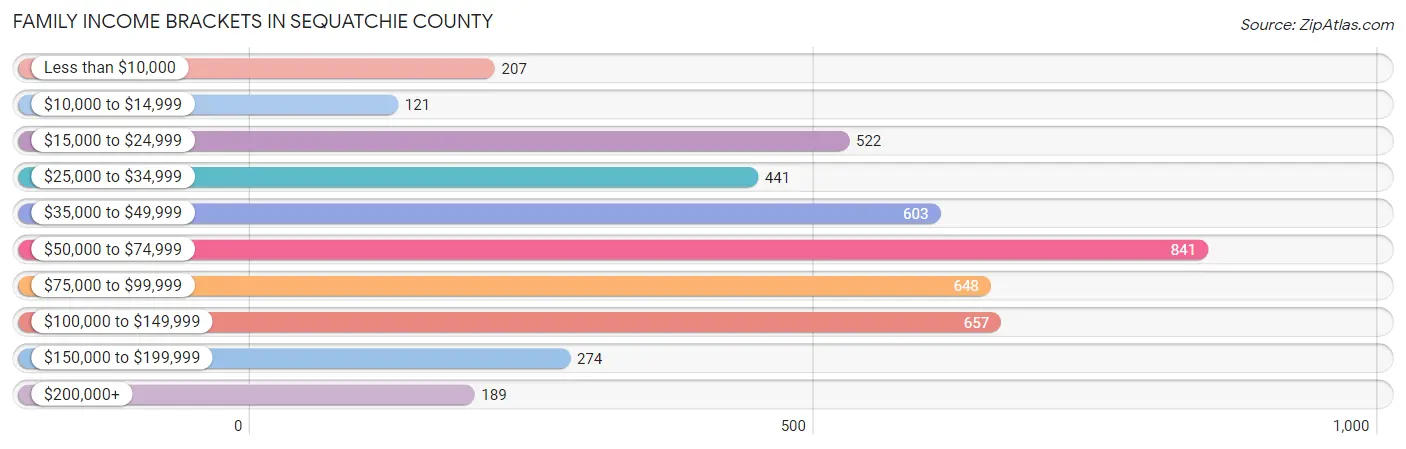
| Income Bracket | # Families | % Families |
| Less than $10,000 | 207 | 4.6% |
| $10,000 to $14,999 | 121 | 2.7% |
| $15,000 to $24,999 | 522 | 11.6% |
| $25,000 to $34,999 | 441 | 9.8% |
| $35,000 to $49,999 | 603 | 13.4% |
| $50,000 to $74,999 | 841 | 18.7% |
| $75,000 to $99,999 | 648 | 14.4% |
| $100,000 to $149,999 | 657 | 14.6% |
| $150,000 to $199,999 | 274 | 6.1% |
| $200,000+ | 189 | 4.2% |
Family Income by Famaliy Size in Sequatchie County
4-person families (497 | 11.1%) account for the highest median family income in Sequatchie County with $88,242 per family, while 2-person families (2,414 | 53.7%) have the highest median income of $30,208 per family member.
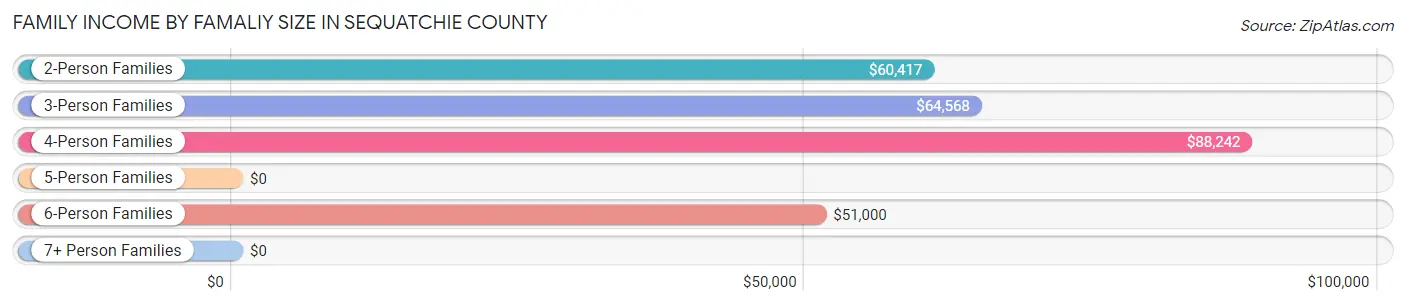
| Income Bracket | # Families | Median Income |
| 2-Person Families | 2,414 (53.7%) | $60,417 |
| 3-Person Families | 1,058 (23.5%) | $64,568 |
| 4-Person Families | 497 (11.1%) | $88,242 |
| 5-Person Families | 412 (9.2%) | $0 |
| 6-Person Families | 54 (1.2%) | $51,000 |
| 7+ Person Families | 63 (1.4%) | $0 |
| Total | 4,498 (100.0%) | $63,095 |
Family Income by Number of Earners in Sequatchie County
The median family income in Sequatchie County is $63,095, with families comprising 3+ earners (293) having the highest median family income of $97,165, while families with no earners (1,243) have the lowest median family income of $36,858, accounting for 6.5% and 27.6% of families, respectively.
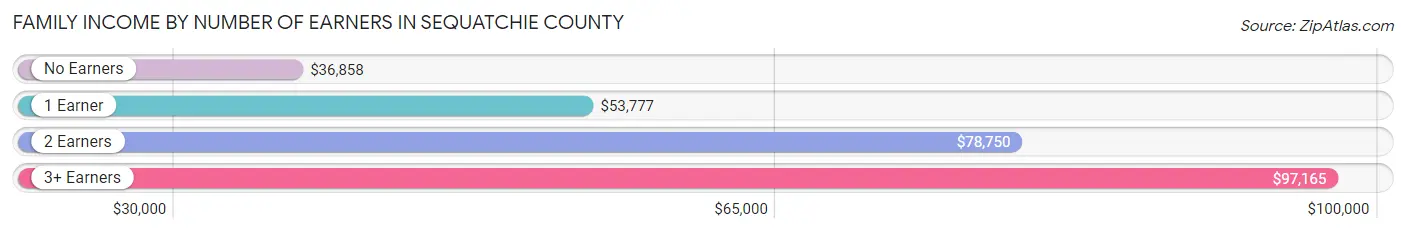
| Number of Earners | # Families | Median Income |
| No Earners | 1,243 (27.6%) | $36,858 |
| 1 Earner | 1,516 (33.7%) | $53,777 |
| 2 Earners | 1,446 (32.2%) | $78,750 |
| 3+ Earners | 293 (6.5%) | $97,165 |
| Total | 4,498 (100.0%) | $63,095 |
Household Income in Sequatchie County
Household Income Brackets in Sequatchie County
With 1,078 households falling in the category, the $50,000 to $74,999 income range is the most frequent in Sequatchie County, accounting for 18.2% of all households. In contrast, only 196 households (3.3%) fall into the $200,000+ income bracket, making it the least populous group.
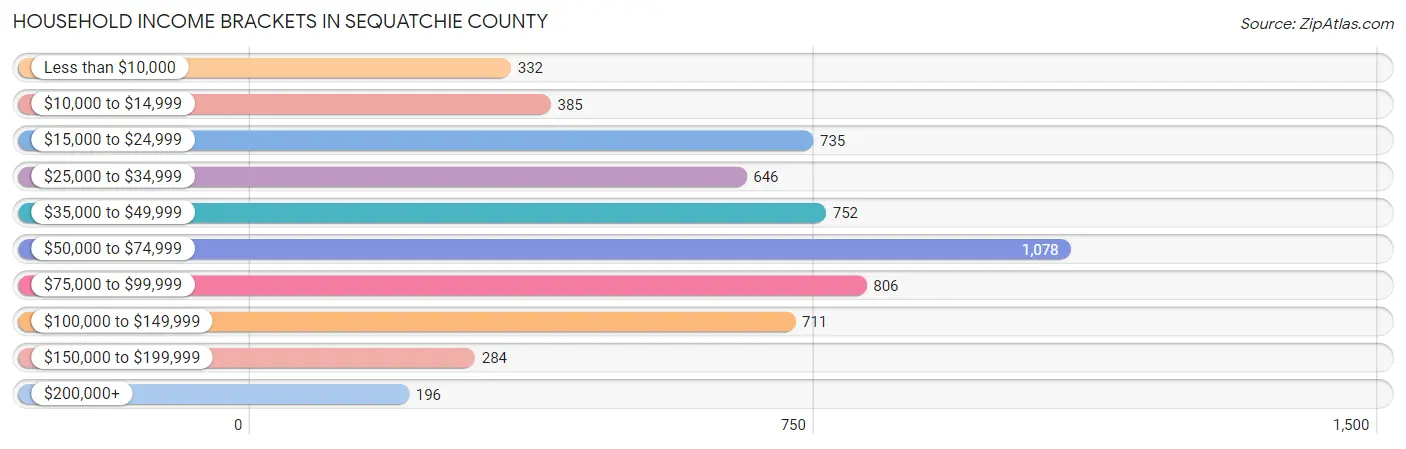
| Income Bracket | # Households | % Households |
| Less than $10,000 | 332 | 5.6% |
| $10,000 to $14,999 | 385 | 6.5% |
| $15,000 to $24,999 | 735 | 12.4% |
| $25,000 to $34,999 | 646 | 10.9% |
| $35,000 to $49,999 | 752 | 12.7% |
| $50,000 to $74,999 | 1,078 | 18.2% |
| $75,000 to $99,999 | 806 | 13.6% |
| $100,000 to $149,999 | 711 | 12.0% |
| $150,000 to $199,999 | 284 | 4.8% |
| $200,000+ | 196 | 3.3% |
Household Income by Householder Age in Sequatchie County
The median household income in Sequatchie County is $53,038, with the highest median household income of $64,768 found in the 45 to 64 years age bracket for the primary householder. A total of 2,430 households (41.0%) fall into this category. Meanwhile, the 15 to 24 years age bracket for the primary householder has the lowest median household income of $0, with 104 households (1.8%) in this group.
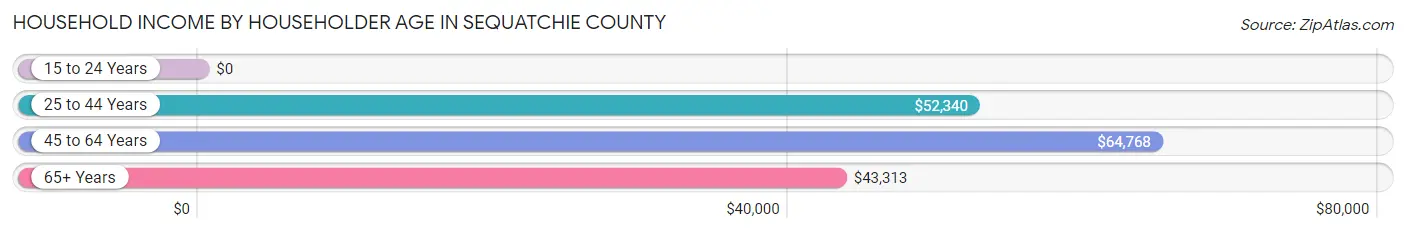
| Income Bracket | # Households | Median Income |
| 15 to 24 Years | 104 (1.8%) | $0 |
| 25 to 44 Years | 1,375 (23.2%) | $52,340 |
| 45 to 64 Years | 2,430 (41.0%) | $64,768 |
| 65+ Years | 2,016 (34.0%) | $43,313 |
| Total | 5,925 (100.0%) | $53,038 |
Poverty in Sequatchie County
Income Below Poverty by Sex and Age in Sequatchie County
With 21.7% poverty level for males and 22.9% for females among the residents of Sequatchie County, 5 year old males and under 5 year old females are the most vulnerable to poverty, with 62 males (65.3%) and 231 females (62.3%) in their respective age groups living below the poverty level.
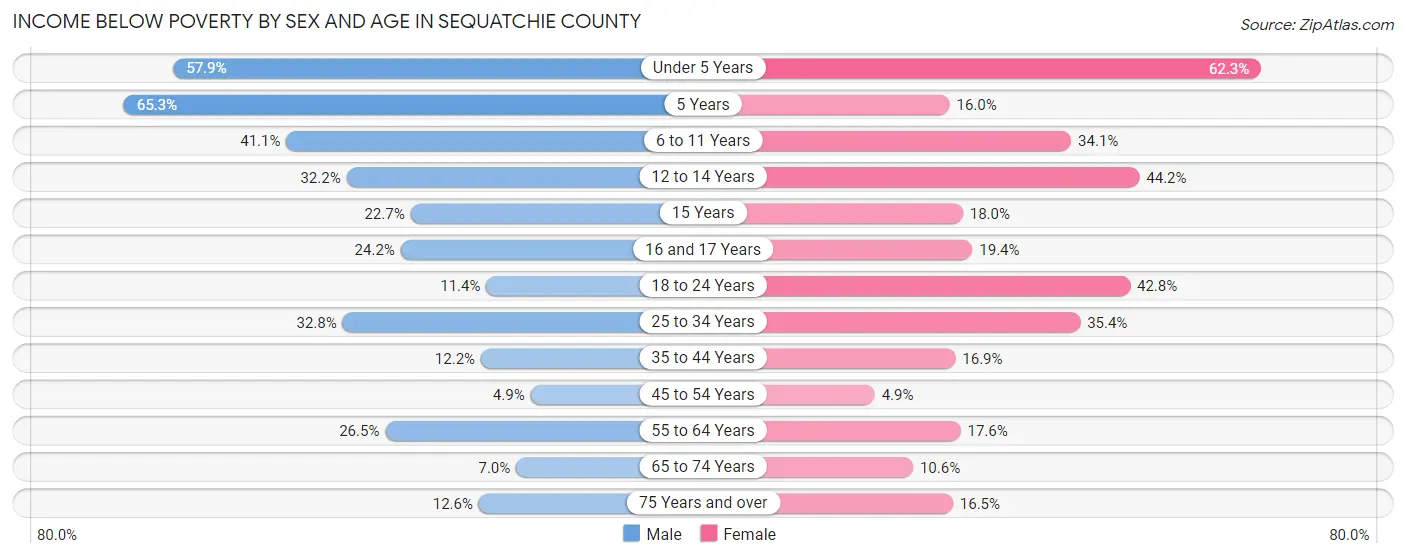
| Age Bracket | Male | Female |
| Under 5 Years | 267 (57.9%) | 231 (62.3%) |
| 5 Years | 62 (65.3%) | 4 (16.0%) |
| 6 to 11 Years | 230 (41.1%) | 173 (34.1%) |
| 12 to 14 Years | 66 (32.2%) | 133 (44.2%) |
| 15 Years | 42 (22.7%) | 23 (18.0%) |
| 16 and 17 Years | 43 (24.2%) | 32 (19.4%) |
| 18 to 24 Years | 78 (11.4%) | 229 (42.8%) |
| 25 to 34 Years | 363 (32.8%) | 308 (35.4%) |
| 35 to 44 Years | 105 (12.2%) | 148 (16.9%) |
| 45 to 54 Years | 53 (4.9%) | 51 (4.9%) |
| 55 to 64 Years | 310 (26.5%) | 207 (17.6%) |
| 65 to 74 Years | 67 (7.0%) | 103 (10.6%) |
| 75 Years and over | 69 (12.6%) | 123 (16.5%) |
| Total | 1,755 (21.7%) | 1,765 (22.9%) |
Income Above Poverty by Sex and Age in Sequatchie County
According to the poverty statistics in Sequatchie County, males aged 45 to 54 years and females aged 45 to 54 years are the age groups that are most secure financially, with 95.1% of males and 95.1% of females in these age groups living above the poverty line.
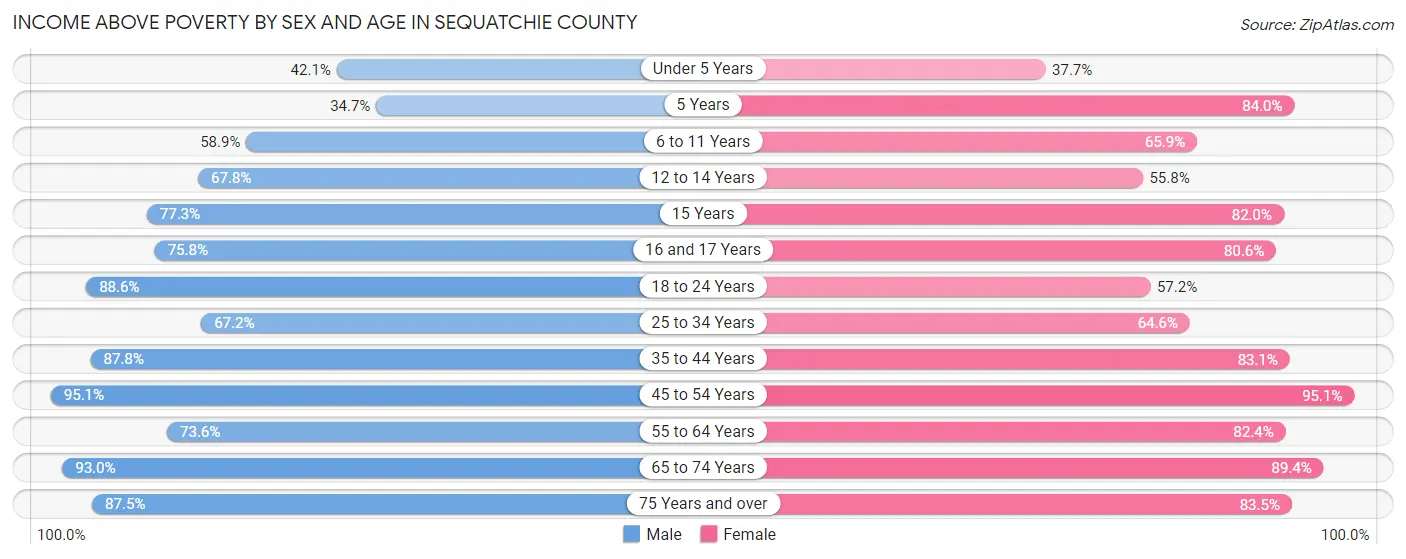
| Age Bracket | Male | Female |
| Under 5 Years | 194 (42.1%) | 140 (37.7%) |
| 5 Years | 33 (34.7%) | 21 (84.0%) |
| 6 to 11 Years | 329 (58.9%) | 335 (65.9%) |
| 12 to 14 Years | 139 (67.8%) | 168 (55.8%) |
| 15 Years | 143 (77.3%) | 105 (82.0%) |
| 16 and 17 Years | 135 (75.8%) | 133 (80.6%) |
| 18 to 24 Years | 604 (88.6%) | 306 (57.2%) |
| 25 to 34 Years | 744 (67.2%) | 562 (64.6%) |
| 35 to 44 Years | 753 (87.8%) | 730 (83.1%) |
| 45 to 54 Years | 1,033 (95.1%) | 993 (95.1%) |
| 55 to 64 Years | 862 (73.6%) | 967 (82.4%) |
| 65 to 74 Years | 889 (93.0%) | 871 (89.4%) |
| 75 Years and over | 481 (87.5%) | 623 (83.5%) |
| Total | 6,339 (78.3%) | 5,954 (77.1%) |
Income Below Poverty Among Married-Couple Families in Sequatchie County
The poverty statistics for married-couple families in Sequatchie County show that 11.6% or 395 of the total 3,395 families live below the poverty line. Families with 5 or more children have the highest poverty rate of 100.0%, comprising of 17 families. On the other hand, families with no children have the lowest poverty rate of 8.2%, which includes 196 families.
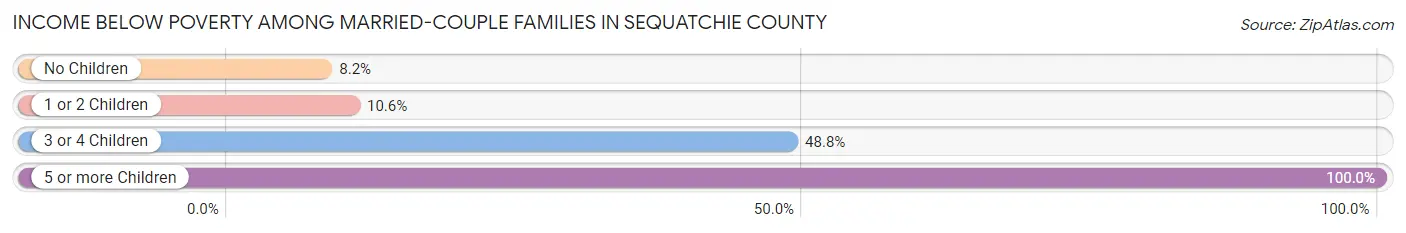
| Children | Above Poverty | Below Poverty |
| No Children | 2,190 (91.8%) | 196 (8.2%) |
| 1 or 2 Children | 707 (89.4%) | 84 (10.6%) |
| 3 or 4 Children | 103 (51.2%) | 98 (48.8%) |
| 5 or more Children | 0 (0.0%) | 17 (100.0%) |
| Total | 3,000 (88.4%) | 395 (11.6%) |
Income Below Poverty Among Single-Parent Households in Sequatchie County
According to the poverty data in Sequatchie County, 32.3% or 139 single-father households and 41.6% or 280 single-mother households are living below the poverty line. Among single-father households, those with 3 or 4 children have the highest poverty rate, with 72 households (91.1%) experiencing poverty. Likewise, among single-mother households, those with 3 or 4 children have the highest poverty rate, with 62 households (81.6%) falling below the poverty line.
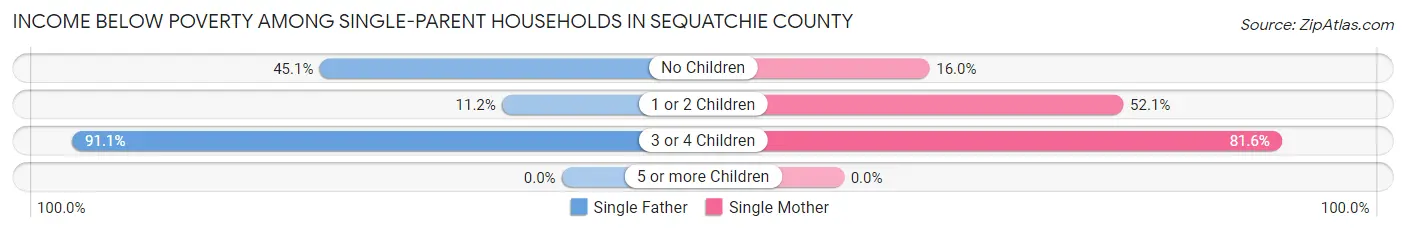
| Children | Single Father | Single Mother |
| No Children | 37 (45.1%) | 41 (16.0%) |
| 1 or 2 Children | 30 (11.2%) | 177 (52.1%) |
| 3 or 4 Children | 72 (91.1%) | 62 (81.6%) |
| 5 or more Children | 0 (0.0%) | 0 (0.0%) |
| Total | 139 (32.3%) | 280 (41.6%) |
Income Below Poverty Among Married-Couple vs Single-Parent Households in Sequatchie County
The poverty data for Sequatchie County shows that 395 of the married-couple family households (11.6%) and 419 of the single-parent households (38.0%) are living below the poverty level. Within the married-couple family households, those with 5 or more children have the highest poverty rate, with 17 households (100.0%) falling below the poverty line. Among the single-parent households, those with 3 or 4 children have the highest poverty rate, with 134 household (86.5%) living below poverty.
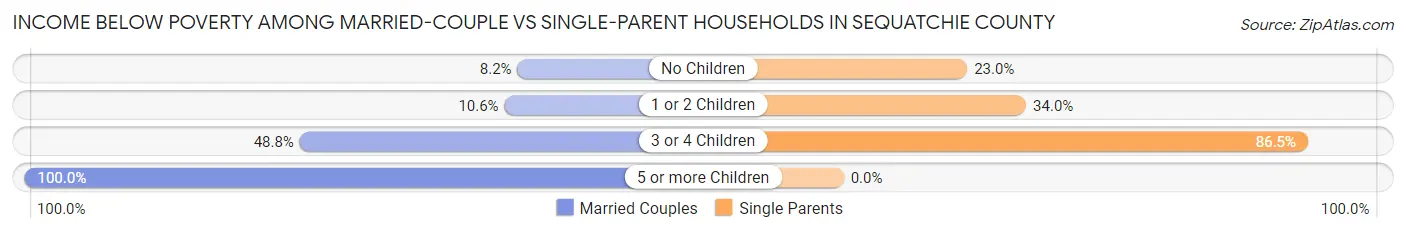
| Children | Married-Couple Families | Single-Parent Households |
| No Children | 196 (8.2%) | 78 (23.0%) |
| 1 or 2 Children | 84 (10.6%) | 207 (34.0%) |
| 3 or 4 Children | 98 (48.8%) | 134 (86.5%) |
| 5 or more Children | 17 (100.0%) | 0 (0.0%) |
| Total | 395 (11.6%) | 419 (38.0%) |
Employment Characteristics in Sequatchie County
Employment by Class of Employer in Sequatchie County
Among the 6,249 employed individuals in Sequatchie County, private company employees (4,204 | 67.3%), local government employees (632 | 10.1%), and self-employed (not incorporated) (485 | 7.8%) make up the most common classes of employment.
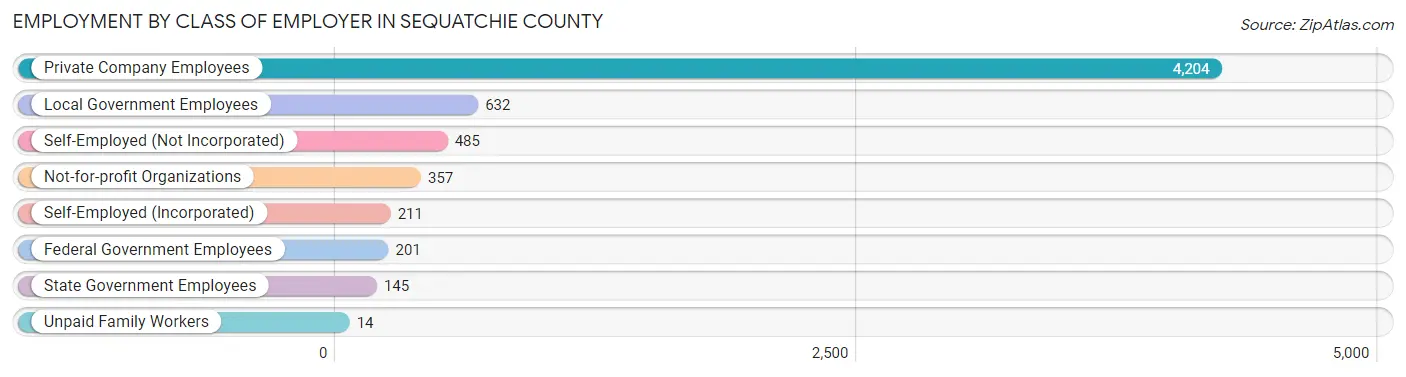
| Employer Class | # Employees | % Employees |
| Private Company Employees | 4,204 | 67.3% |
| Self-Employed (Incorporated) | 211 | 3.4% |
| Self-Employed (Not Incorporated) | 485 | 7.8% |
| Not-for-profit Organizations | 357 | 5.7% |
| Local Government Employees | 632 | 10.1% |
| State Government Employees | 145 | 2.3% |
| Federal Government Employees | 201 | 3.2% |
| Unpaid Family Workers | 14 | 0.2% |
| Total | 6,249 | 100.0% |
Employment Status by Age in Sequatchie County
According to the labor force statistics for Sequatchie County, out of the total population over 16 years of age (13,212), 50.0% or 6,606 individuals are in the labor force, with 3.3% or 218 of them unemployed. The age group with the highest labor force participation rate is 25 to 29 years, with 83.6% or 824 individuals in the labor force. Within the labor force, the 16 to 19 years age range has the highest percentage of unemployed individuals, with 16.3% or 60 of them being unemployed.
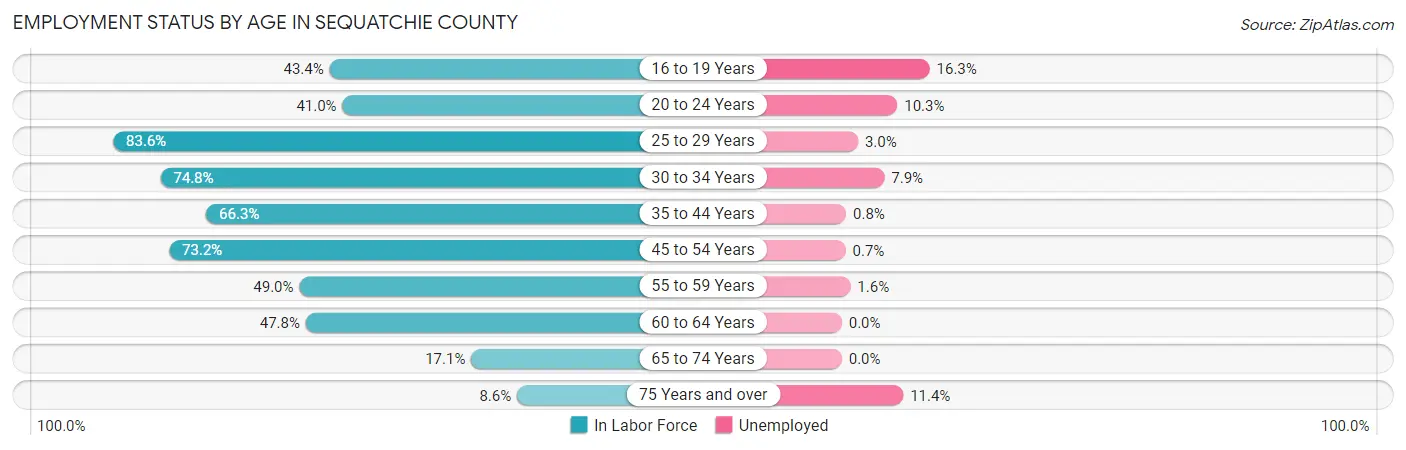
| Age Bracket | In Labor Force | Unemployed |
| 16 to 19 Years | 368 (43.4%) | 60 (16.3%) |
| 20 to 24 Years | 302 (41.0%) | 31 (10.3%) |
| 25 to 29 Years | 824 (83.6%) | 25 (3.0%) |
| 30 to 34 Years | 755 (74.8%) | 60 (7.9%) |
| 35 to 44 Years | 1,180 (66.3%) | 9 (0.8%) |
| 45 to 54 Years | 1,569 (73.2%) | 11 (0.7%) |
| 55 to 59 Years | 559 (49.0%) | 9 (1.6%) |
| 60 to 64 Years | 598 (47.8%) | 0 (0.0%) |
| 65 to 74 Years | 341 (17.1%) | 0 (0.0%) |
| 75 Years and over | 114 (8.6%) | 13 (11.4%) |
| Total | 6,606 (50.0%) | 218 (3.3%) |
Employment Status by Educational Attainment in Sequatchie County
According to labor force statistics for Sequatchie County, 66.0% of individuals (5,485) out of the total population between 25 and 64 years of age (8,311) are in the labor force, with 2.1% or 115 of them being unemployed. The group with the highest labor force participation rate are those with the educational attainment of college / associate degree, with 72.9% or 1,756 individuals in the labor force. Within the labor force, individuals with less than high school education have the highest percentage of unemployment, with 10.1% or 48 of them being unemployed.
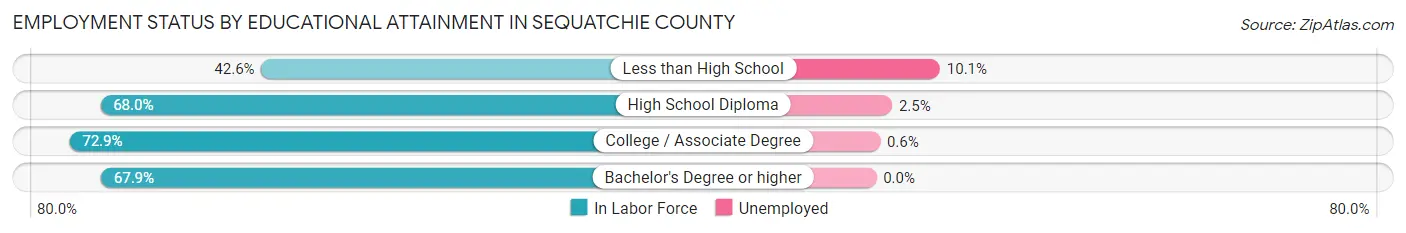
| Educational Attainment | In Labor Force | Unemployed |
| Less than High School | 477 (42.6%) | 113 (10.1%) |
| High School Diploma | 2,227 (68.0%) | 82 (2.5%) |
| College / Associate Degree | 1,756 (72.9%) | 14 (0.6%) |
| Bachelor's Degree or higher | 1,024 (67.9%) | 0 (0.0%) |
| Total | 5,485 (66.0%) | 175 (2.1%) |
Employment Occupations by Sex in Sequatchie County
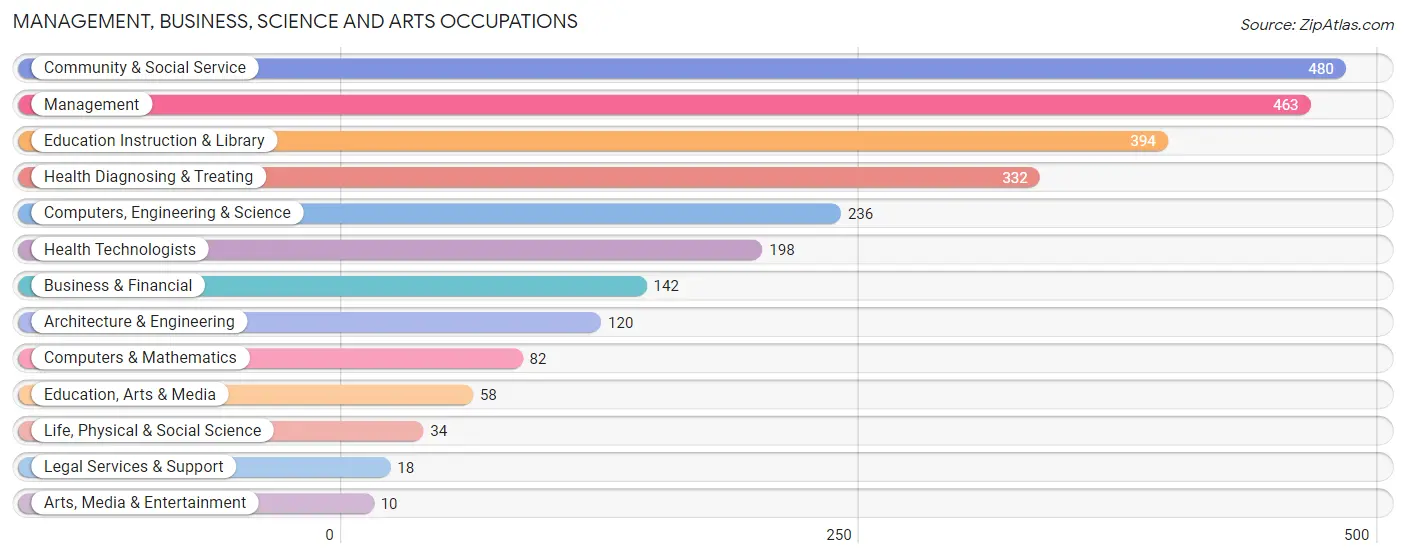
Management, Business, Science and Arts Occupations
The most common Management, Business, Science and Arts occupations in Sequatchie County are Community & Social Service (480 | 7.5%), Management (463 | 7.2%), Education Instruction & Library (394 | 6.2%), Health Diagnosing & Treating (332 | 5.2%), and Computers, Engineering & Science (236 | 3.7%).
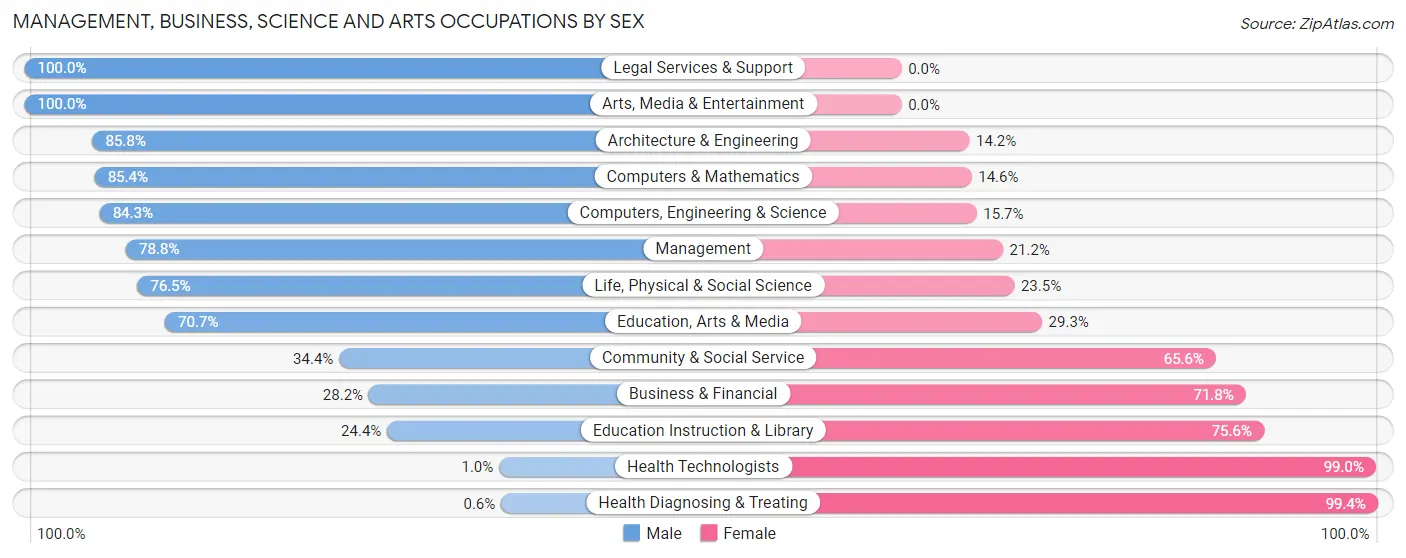
Management, Business, Science and Arts Occupations by Sex
Within the Management, Business, Science and Arts occupations in Sequatchie County, the most male-oriented occupations are Legal Services & Support (100.0%), Arts, Media & Entertainment (100.0%), and Architecture & Engineering (85.8%), while the most female-oriented occupations are Health Diagnosing & Treating (99.4%), Health Technologists (99.0%), and Education Instruction & Library (75.6%).
| Occupation | Male | Female |
| Management | 365 (78.8%) | 98 (21.2%) |
| Business & Financial | 40 (28.2%) | 102 (71.8%) |
| Computers, Engineering & Science | 199 (84.3%) | 37 (15.7%) |
| Computers & Mathematics | 70 (85.4%) | 12 (14.6%) |
| Architecture & Engineering | 103 (85.8%) | 17 (14.2%) |
| Life, Physical & Social Science | 26 (76.5%) | 8 (23.5%) |
| Community & Social Service | 165 (34.4%) | 315 (65.6%) |
| Education, Arts & Media | 41 (70.7%) | 17 (29.3%) |
| Legal Services & Support | 18 (100.0%) | 0 (0.0%) |
| Education Instruction & Library | 96 (24.4%) | 298 (75.6%) |
| Arts, Media & Entertainment | 10 (100.0%) | 0 (0.0%) |
| Health Diagnosing & Treating | 2 (0.6%) | 330 (99.4%) |
| Health Technologists | 2 (1.0%) | 196 (99.0%) |
| Total (Category) | 771 (46.6%) | 882 (53.4%) |
| Total (Overall) | 3,693 (57.8%) | 2,698 (42.2%) |
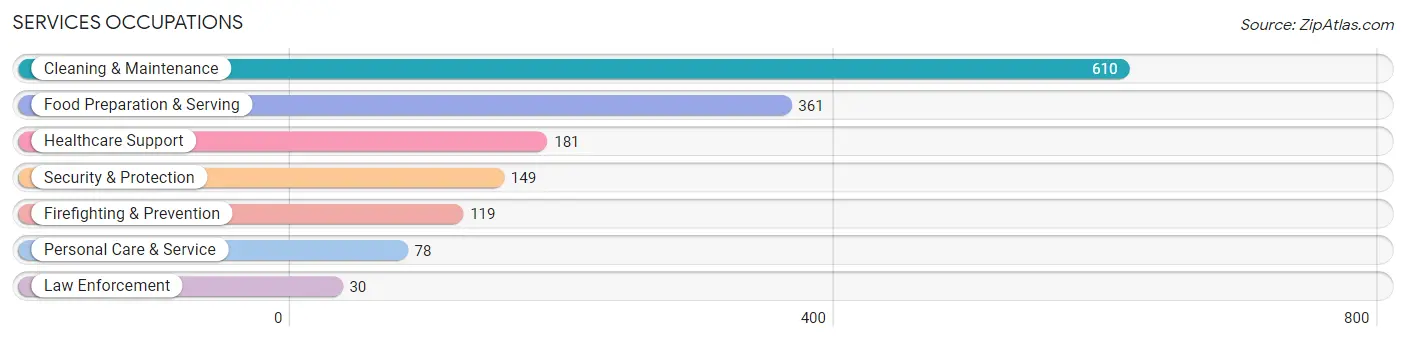
Services Occupations
The most common Services occupations in Sequatchie County are Cleaning & Maintenance (610 | 9.5%), Food Preparation & Serving (361 | 5.7%), Healthcare Support (181 | 2.8%), Security & Protection (149 | 2.3%), and Firefighting & Prevention (119 | 1.9%).
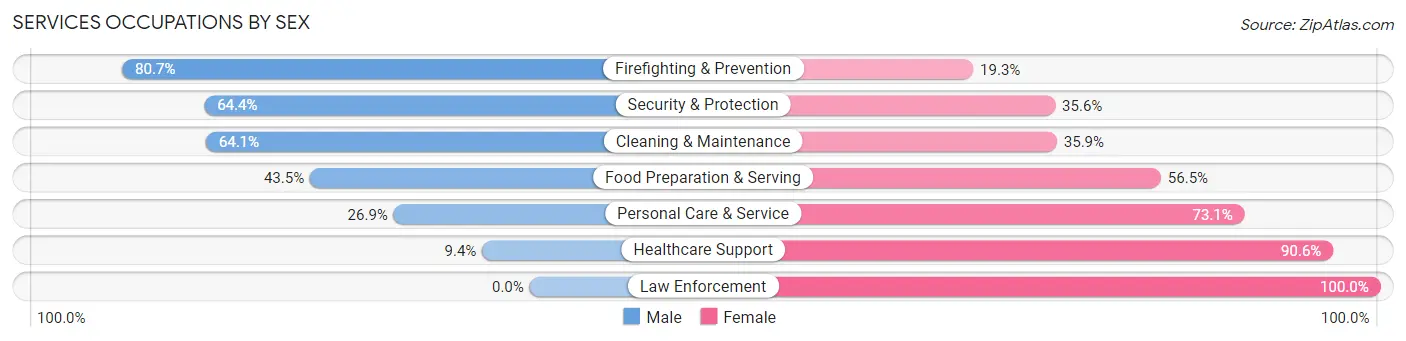
Services Occupations by Sex
Within the Services occupations in Sequatchie County, the most male-oriented occupations are Firefighting & Prevention (80.7%), Security & Protection (64.4%), and Cleaning & Maintenance (64.1%), while the most female-oriented occupations are Law Enforcement (100.0%), Healthcare Support (90.6%), and Personal Care & Service (73.1%).
| Occupation | Male | Female |
| Healthcare Support | 17 (9.4%) | 164 (90.6%) |
| Security & Protection | 96 (64.4%) | 53 (35.6%) |
| Firefighting & Prevention | 96 (80.7%) | 23 (19.3%) |
| Law Enforcement | 0 (0.0%) | 30 (100.0%) |
| Food Preparation & Serving | 157 (43.5%) | 204 (56.5%) |
| Cleaning & Maintenance | 391 (64.1%) | 219 (35.9%) |
| Personal Care & Service | 21 (26.9%) | 57 (73.1%) |
| Total (Category) | 682 (49.5%) | 697 (50.5%) |
| Total (Overall) | 3,693 (57.8%) | 2,698 (42.2%) |
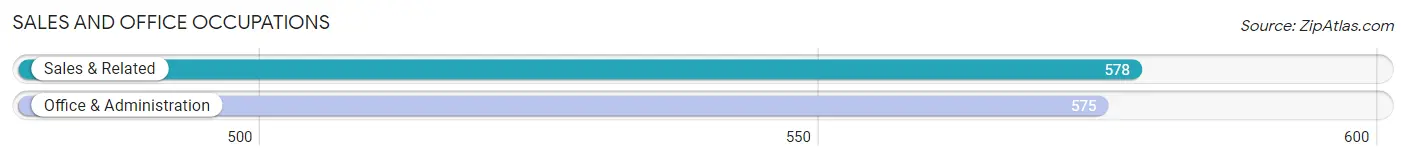
Sales and Office Occupations
The most common Sales and Office occupations in Sequatchie County are Sales & Related (578 | 9.0%), and Office & Administration (575 | 9.0%).
Sales and Office Occupations by Sex
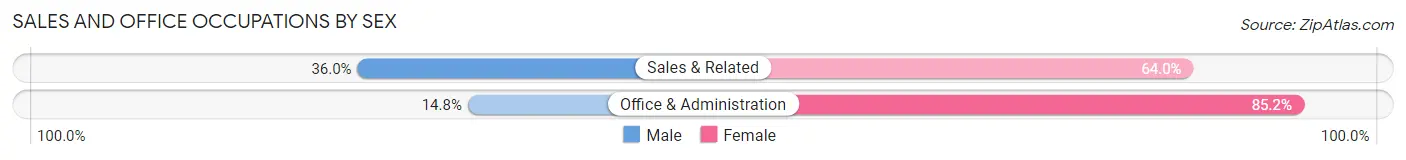
| Occupation | Male | Female |
| Sales & Related | 208 (36.0%) | 370 (64.0%) |
| Office & Administration | 85 (14.8%) | 490 (85.2%) |
| Total (Category) | 293 (25.4%) | 860 (74.6%) |
| Total (Overall) | 3,693 (57.8%) | 2,698 (42.2%) |
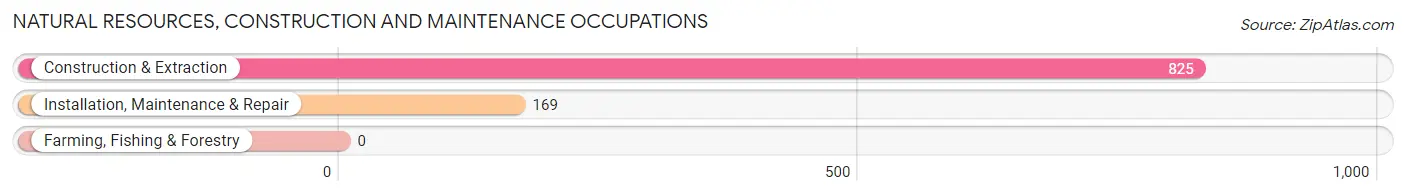
Natural Resources, Construction and Maintenance Occupations
The most common Natural Resources, Construction and Maintenance occupations in Sequatchie County are Construction & Extraction (825 | 12.9%), and Installation, Maintenance & Repair (169 | 2.6%).
Natural Resources, Construction and Maintenance Occupations by Sex
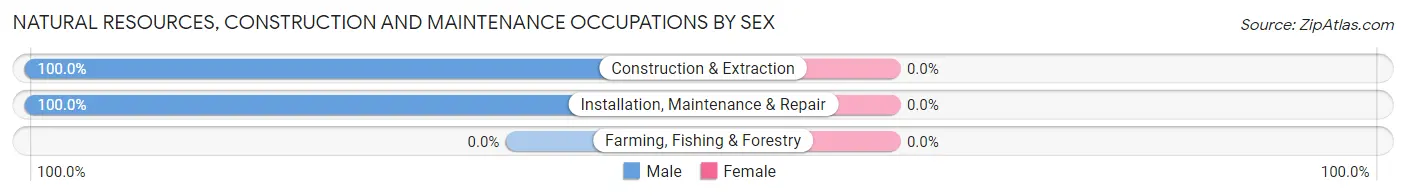
| Occupation | Male | Female |
| Farming, Fishing & Forestry | 0 (0.0%) | 0 (0.0%) |
| Construction & Extraction | 825 (100.0%) | 0 (0.0%) |
| Installation, Maintenance & Repair | 169 (100.0%) | 0 (0.0%) |
| Total (Category) | 994 (100.0%) | 0 (0.0%) |
| Total (Overall) | 3,693 (57.8%) | 2,698 (42.2%) |
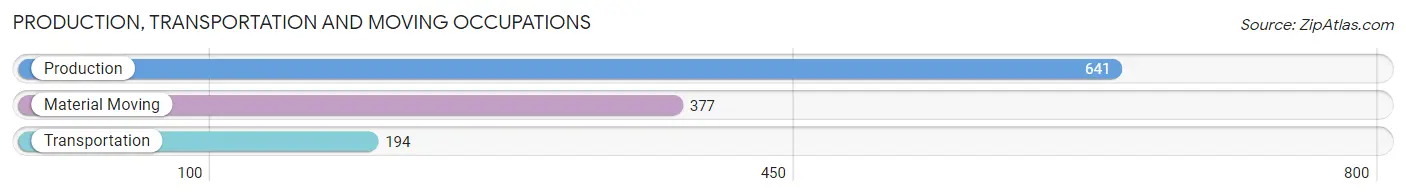
Production, Transportation and Moving Occupations
The most common Production, Transportation and Moving occupations in Sequatchie County are Production (641 | 10.0%), Material Moving (377 | 5.9%), and Transportation (194 | 3.0%).
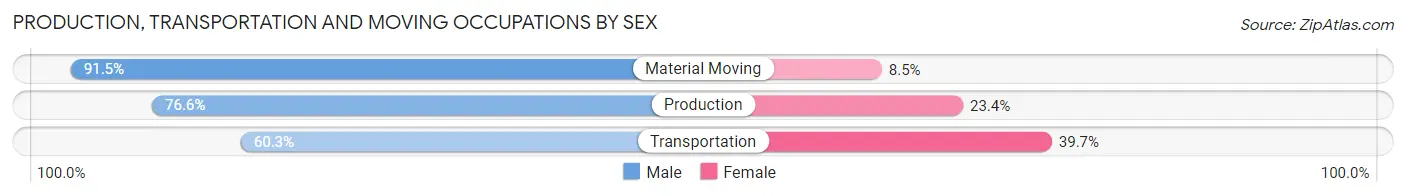
Production, Transportation and Moving Occupations by Sex
| Occupation | Male | Female |
| Production | 491 (76.6%) | 150 (23.4%) |
| Transportation | 117 (60.3%) | 77 (39.7%) |
| Material Moving | 345 (91.5%) | 32 (8.5%) |
| Total (Category) | 953 (78.6%) | 259 (21.4%) |
| Total (Overall) | 3,693 (57.8%) | 2,698 (42.2%) |
Employment Industries by Sex in Sequatchie County
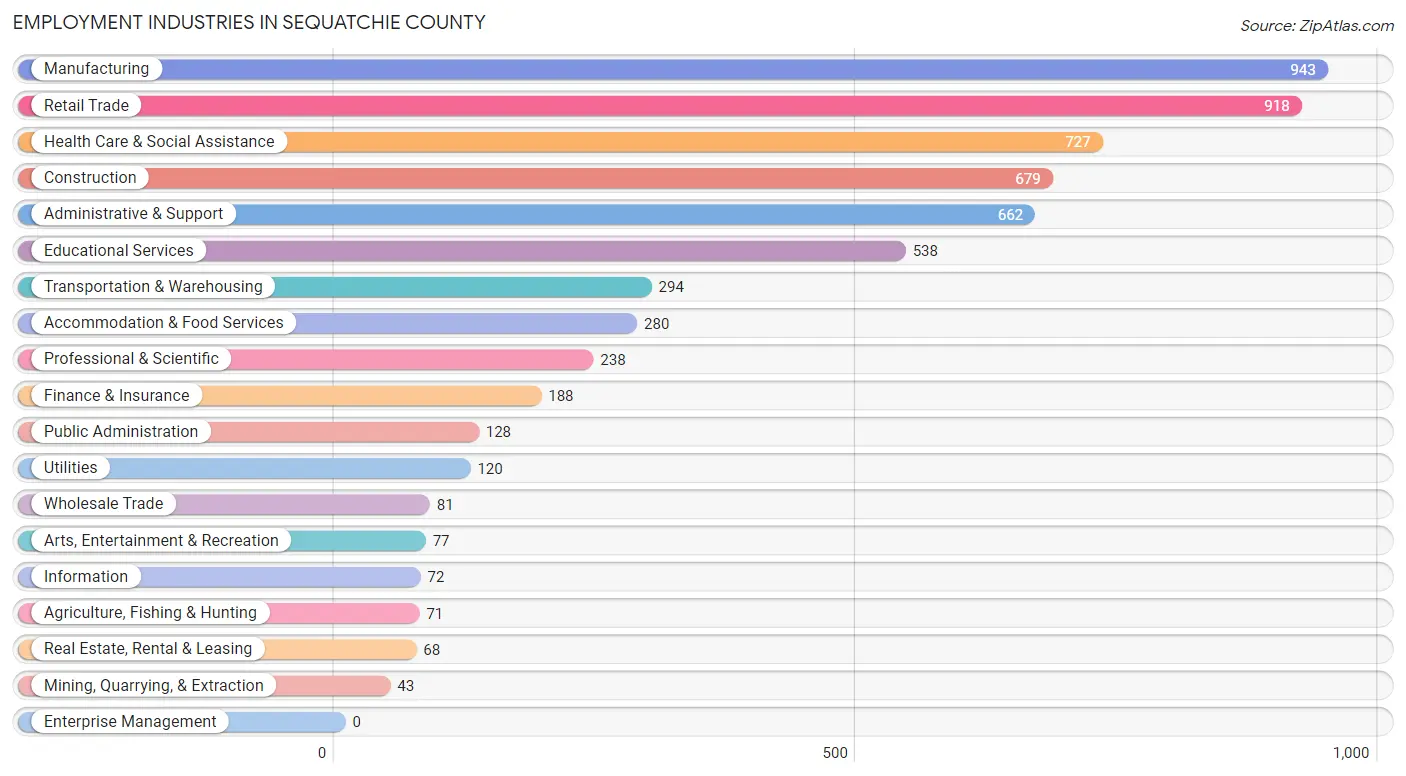
Employment Industries in Sequatchie County
The major employment industries in Sequatchie County include Manufacturing (943 | 14.8%), Retail Trade (918 | 14.4%), Health Care & Social Assistance (727 | 11.4%), Construction (679 | 10.6%), and Administrative & Support (662 | 10.4%).
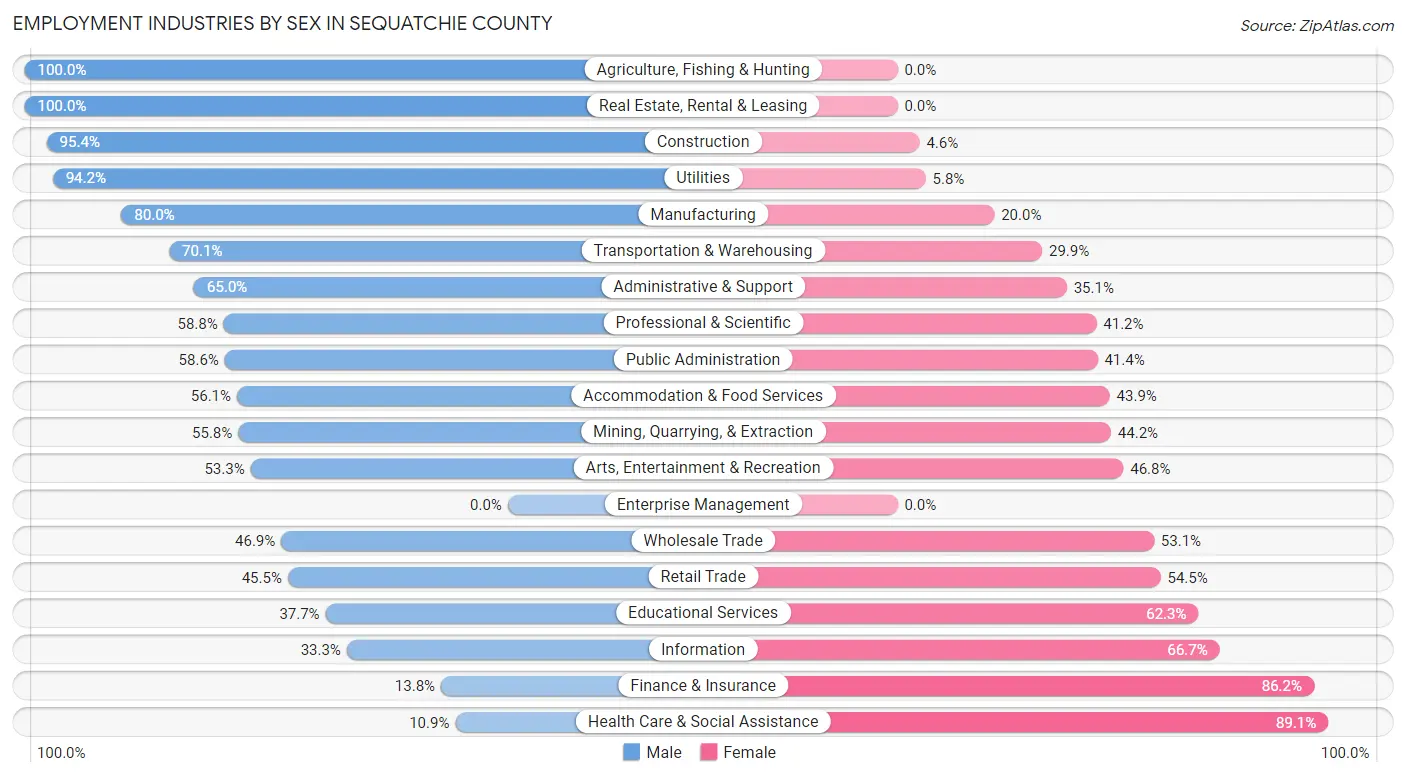
Employment Industries by Sex in Sequatchie County
The Sequatchie County industries that see more men than women are Agriculture, Fishing & Hunting (100.0%), Real Estate, Rental & Leasing (100.0%), and Construction (95.4%), whereas the industries that tend to have a higher number of women are Health Care & Social Assistance (89.1%), Finance & Insurance (86.2%), and Information (66.7%).
| Industry | Male | Female |
| Agriculture, Fishing & Hunting | 71 (100.0%) | 0 (0.0%) |
| Mining, Quarrying, & Extraction | 24 (55.8%) | 19 (44.2%) |
| Construction | 648 (95.4%) | 31 (4.6%) |
| Manufacturing | 754 (80.0%) | 189 (20.0%) |
| Wholesale Trade | 38 (46.9%) | 43 (53.1%) |
| Retail Trade | 418 (45.5%) | 500 (54.5%) |
| Transportation & Warehousing | 206 (70.1%) | 88 (29.9%) |
| Utilities | 113 (94.2%) | 7 (5.8%) |
| Information | 24 (33.3%) | 48 (66.7%) |
| Finance & Insurance | 26 (13.8%) | 162 (86.2%) |
| Real Estate, Rental & Leasing | 68 (100.0%) | 0 (0.0%) |
| Professional & Scientific | 140 (58.8%) | 98 (41.2%) |
| Enterprise Management | 0 (0.0%) | 0 (0.0%) |
| Administrative & Support | 430 (64.9%) | 232 (35.0%) |
| Educational Services | 203 (37.7%) | 335 (62.3%) |
| Health Care & Social Assistance | 79 (10.9%) | 648 (89.1%) |
| Arts, Entertainment & Recreation | 41 (53.2%) | 36 (46.8%) |
| Accommodation & Food Services | 157 (56.1%) | 123 (43.9%) |
| Public Administration | 75 (58.6%) | 53 (41.4%) |
| Total | 3,693 (57.8%) | 2,698 (42.2%) |
Education in Sequatchie County
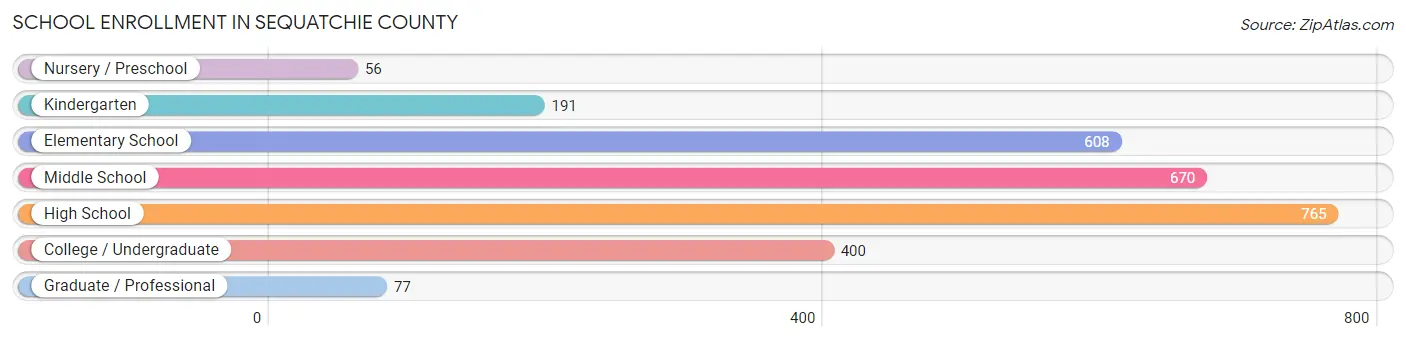
School Enrollment in Sequatchie County
The most common levels of schooling among the 2,767 students in Sequatchie County are high school (765 | 27.7%), middle school (670 | 24.2%), and elementary school (608 | 22.0%).
| School Level | # Students | % Students |
| Nursery / Preschool | 56 | 2.0% |
| Kindergarten | 191 | 6.9% |
| Elementary School | 608 | 22.0% |
| Middle School | 670 | 24.2% |
| High School | 765 | 27.7% |
| College / Undergraduate | 400 | 14.5% |
| Graduate / Professional | 77 | 2.8% |
| Total | 2,767 | 100.0% |
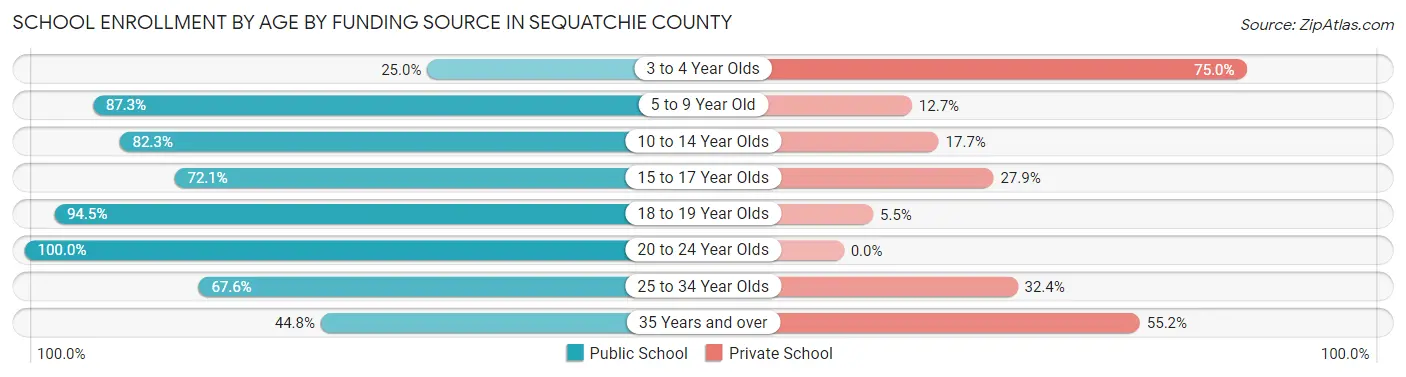
School Enrollment by Age by Funding Source in Sequatchie County
Out of a total of 2,767 students who are enrolled in schools in Sequatchie County, 559 (20.2%) attend a private institution, while the remaining 2,208 (79.8%) are enrolled in public schools. The age group of 3 to 4 year olds has the highest likelihood of being enrolled in private schools, with 42 (75.0% in the age bracket) enrolled. Conversely, the age group of 20 to 24 year olds has the lowest likelihood of being enrolled in a private school, with 36 (100.0% in the age bracket) attending a public institution.
| Age Bracket | Public School | Private School |
| 3 to 4 Year Olds | 14 (25.0%) | 42 (75.0%) |
| 5 to 9 Year Old | 570 (87.3%) | 83 (12.7%) |
| 10 to 14 Year Olds | 670 (82.3%) | 144 (17.7%) |
| 15 to 17 Year Olds | 473 (72.1%) | 183 (27.9%) |
| 18 to 19 Year Olds | 345 (94.5%) | 20 (5.5%) |
| 20 to 24 Year Olds | 36 (100.0%) | 0 (0.0%) |
| 25 to 34 Year Olds | 48 (67.6%) | 23 (32.4%) |
| 35 Years and over | 52 (44.8%) | 64 (55.2%) |
| Total | 2,208 (79.8%) | 559 (20.2%) |
Educational Attainment by Field of Study in Sequatchie County
Education (311 | 13.5%), business (309 | 13.4%), science & technology (271 | 11.8%), bio, nature & agricultural (229 | 9.9%), and engineering (223 | 9.7%) are the most common fields of study among 2,303 individuals in Sequatchie County who have obtained a bachelor's degree or higher.
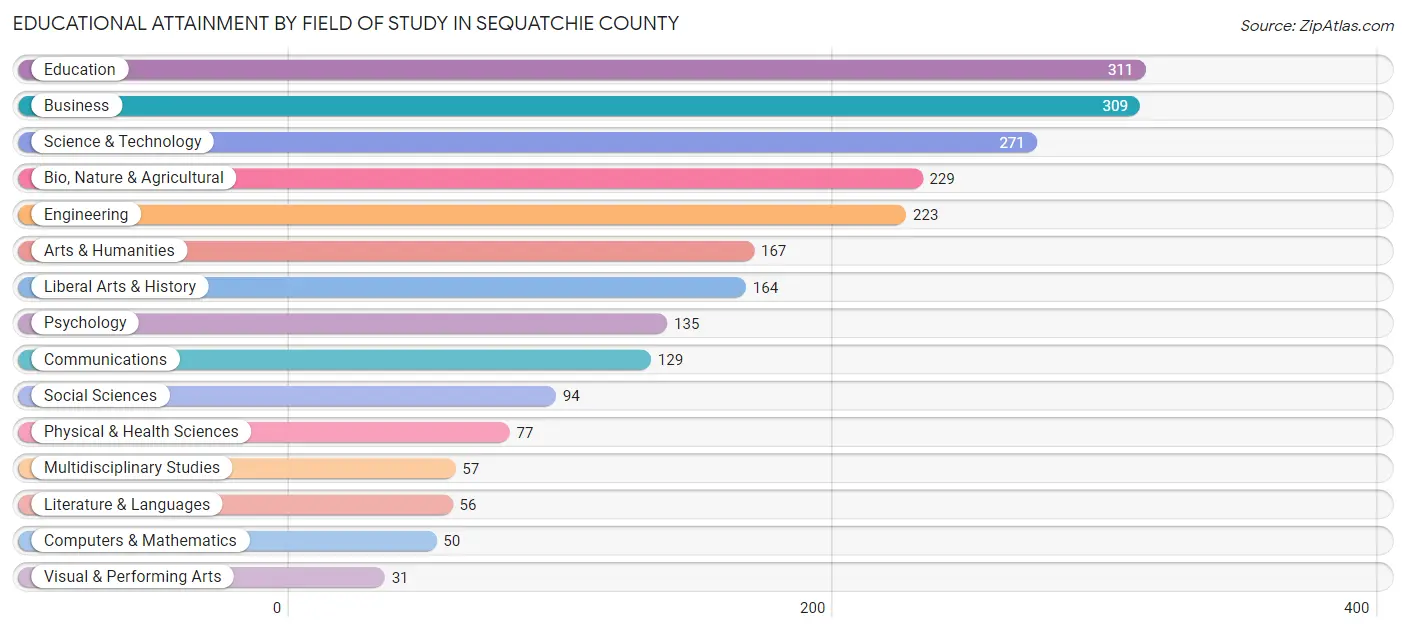
| Field of Study | # Graduates | % Graduates |
| Computers & Mathematics | 50 | 2.2% |
| Bio, Nature & Agricultural | 229 | 9.9% |
| Physical & Health Sciences | 77 | 3.3% |
| Psychology | 135 | 5.9% |
| Social Sciences | 94 | 4.1% |
| Engineering | 223 | 9.7% |
| Multidisciplinary Studies | 57 | 2.5% |
| Science & Technology | 271 | 11.8% |
| Business | 309 | 13.4% |
| Education | 311 | 13.5% |
| Literature & Languages | 56 | 2.4% |
| Liberal Arts & History | 164 | 7.1% |
| Visual & Performing Arts | 31 | 1.3% |
| Communications | 129 | 5.6% |
| Arts & Humanities | 167 | 7.2% |
| Total | 2,303 | 100.0% |
Transportation & Commute in Sequatchie County
Vehicle Availability by Sex in Sequatchie County
The most prevalent vehicle ownership categories in Sequatchie County are males with 2 vehicles (1,217, accounting for 33.5%) and females with 2 vehicles (714, making up 46.6%).
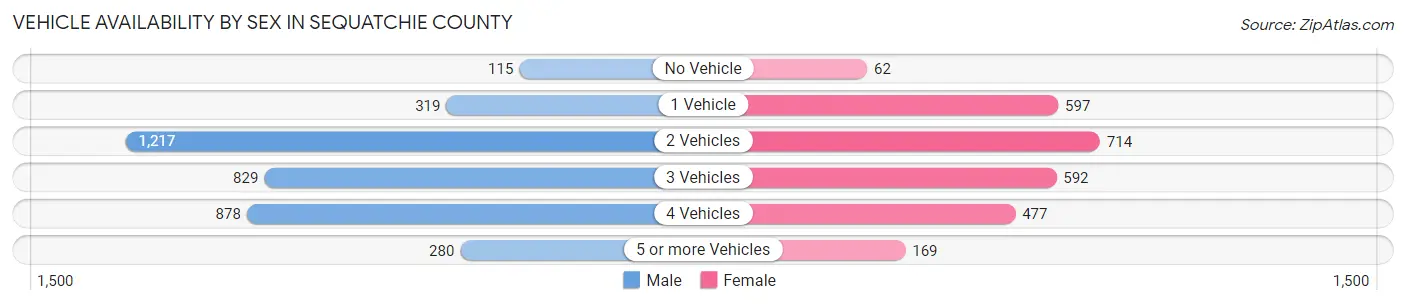
| Vehicles Available | Male | Female |
| No Vehicle | 115 (3.2%) | 62 (2.4%) |
| 1 Vehicle | 319 (8.8%) | 597 (22.9%) |
| 2 Vehicles | 1,217 (33.5%) | 714 (27.4%) |
| 3 Vehicles | 829 (22.8%) | 592 (22.7%) |
| 4 Vehicles | 878 (24.1%) | 477 (18.3%) |
| 5 or more Vehicles | 280 (7.7%) | 169 (6.5%) |
| Total | 3,638 (100.0%) | 2,611 (100.0%) |
Commute Time in Sequatchie County
The most frequently occuring commute durations in Sequatchie County are 45 to 59 minutes (1,045 commuters, 18.3%), 5 to 9 minutes (783 commuters, 13.7%), and 30 to 34 minutes (613 commuters, 10.7%).
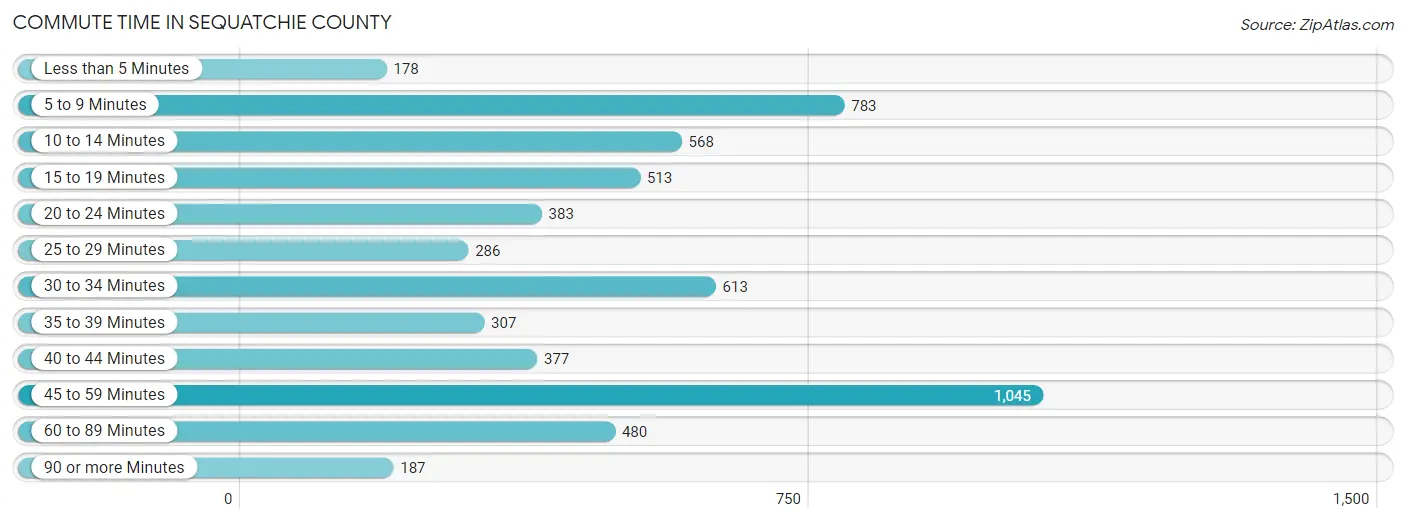
| Commute Time | # Commuters | % Commuters |
| Less than 5 Minutes | 178 | 3.1% |
| 5 to 9 Minutes | 783 | 13.7% |
| 10 to 14 Minutes | 568 | 9.9% |
| 15 to 19 Minutes | 513 | 9.0% |
| 20 to 24 Minutes | 383 | 6.7% |
| 25 to 29 Minutes | 286 | 5.0% |
| 30 to 34 Minutes | 613 | 10.7% |
| 35 to 39 Minutes | 307 | 5.4% |
| 40 to 44 Minutes | 377 | 6.6% |
| 45 to 59 Minutes | 1,045 | 18.3% |
| 60 to 89 Minutes | 480 | 8.4% |
| 90 or more Minutes | 187 | 3.3% |
Commute Time by Sex in Sequatchie County
The most common commute times in Sequatchie County are 45 to 59 minutes (775 commuters, 22.6%) for males and 5 to 9 minutes (424 commuters, 18.5%) for females.
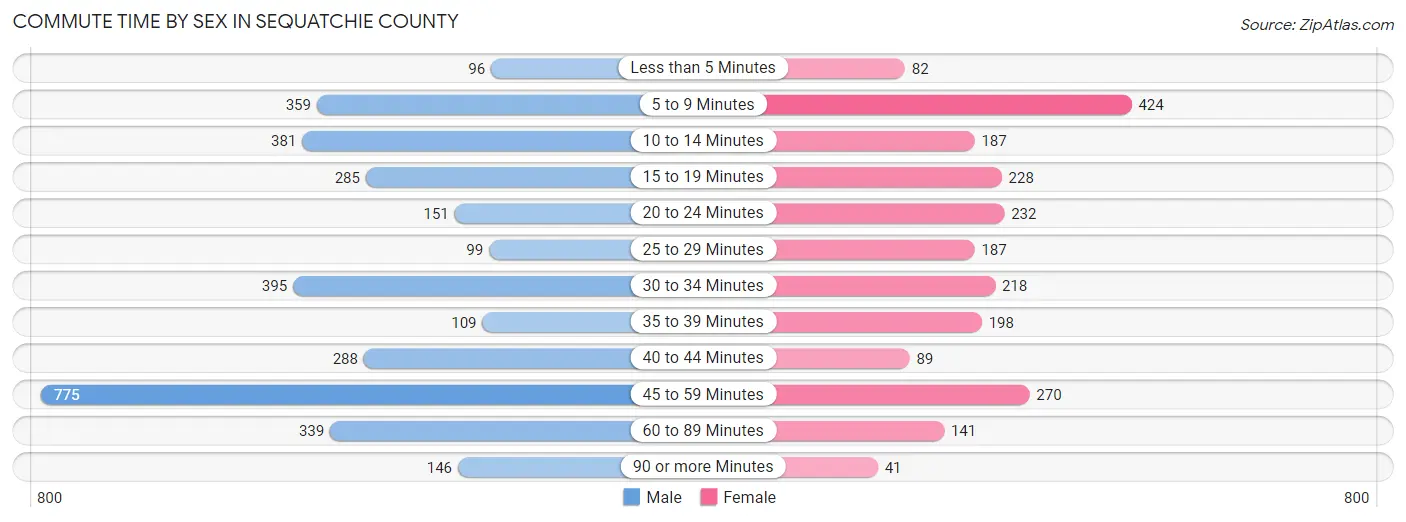
| Commute Time | Male | Female |
| Less than 5 Minutes | 96 (2.8%) | 82 (3.6%) |
| 5 to 9 Minutes | 359 (10.5%) | 424 (18.5%) |
| 10 to 14 Minutes | 381 (11.1%) | 187 (8.1%) |
| 15 to 19 Minutes | 285 (8.3%) | 228 (9.9%) |
| 20 to 24 Minutes | 151 (4.4%) | 232 (10.1%) |
| 25 to 29 Minutes | 99 (2.9%) | 187 (8.1%) |
| 30 to 34 Minutes | 395 (11.5%) | 218 (9.5%) |
| 35 to 39 Minutes | 109 (3.2%) | 198 (8.6%) |
| 40 to 44 Minutes | 288 (8.4%) | 89 (3.9%) |
| 45 to 59 Minutes | 775 (22.6%) | 270 (11.7%) |
| 60 to 89 Minutes | 339 (9.9%) | 141 (6.1%) |
| 90 or more Minutes | 146 (4.3%) | 41 (1.8%) |
Time of Departure to Work by Sex in Sequatchie County
The most frequent times of departure to work in Sequatchie County are 12:00 AM to 4:59 AM (516, 15.1%) for males and 7:00 AM to 7:29 AM (469, 20.4%) for females.
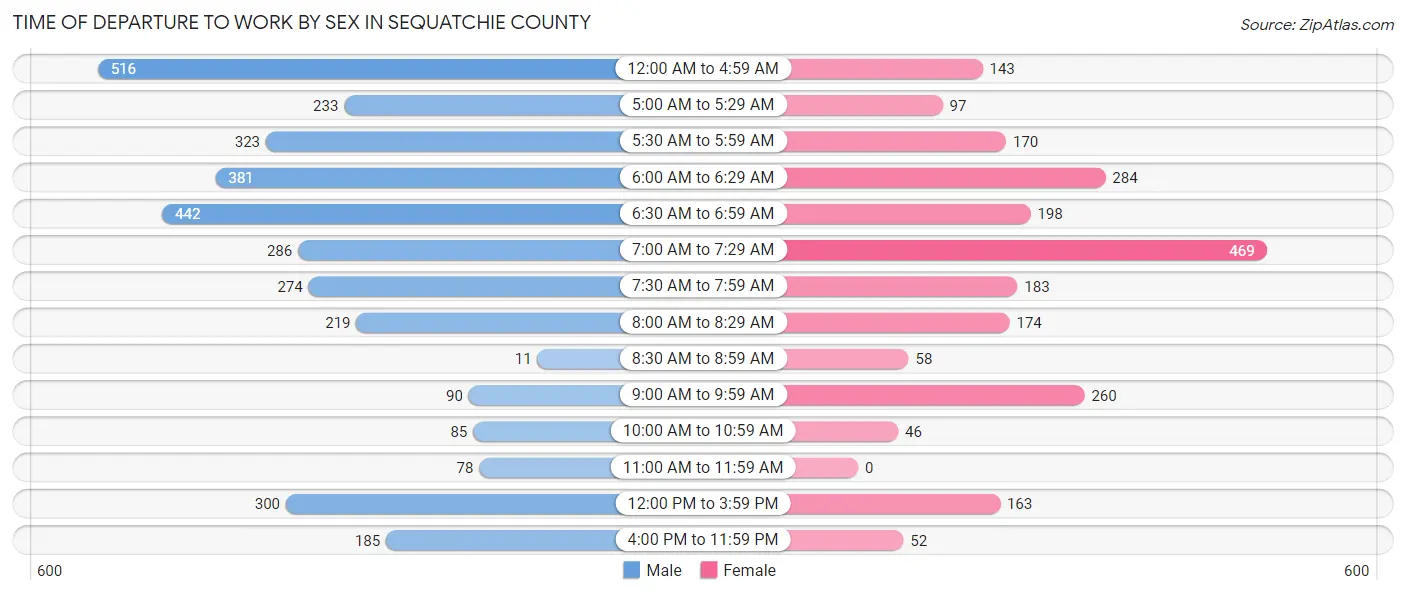
| Time of Departure | Male | Female |
| 12:00 AM to 4:59 AM | 516 (15.1%) | 143 (6.2%) |
| 5:00 AM to 5:29 AM | 233 (6.8%) | 97 (4.2%) |
| 5:30 AM to 5:59 AM | 323 (9.4%) | 170 (7.4%) |
| 6:00 AM to 6:29 AM | 381 (11.1%) | 284 (12.4%) |
| 6:30 AM to 6:59 AM | 442 (12.9%) | 198 (8.6%) |
| 7:00 AM to 7:29 AM | 286 (8.4%) | 469 (20.4%) |
| 7:30 AM to 7:59 AM | 274 (8.0%) | 183 (8.0%) |
| 8:00 AM to 8:29 AM | 219 (6.4%) | 174 (7.6%) |
| 8:30 AM to 8:59 AM | 11 (0.3%) | 58 (2.5%) |
| 9:00 AM to 9:59 AM | 90 (2.6%) | 260 (11.3%) |
| 10:00 AM to 10:59 AM | 85 (2.5%) | 46 (2.0%) |
| 11:00 AM to 11:59 AM | 78 (2.3%) | 0 (0.0%) |
| 12:00 PM to 3:59 PM | 300 (8.8%) | 163 (7.1%) |
| 4:00 PM to 11:59 PM | 185 (5.4%) | 52 (2.3%) |
| Total | 3,423 (100.0%) | 2,297 (100.0%) |
Housing Occupancy in Sequatchie County
Occupancy by Ownership in Sequatchie County
Of the total 5,925 dwellings in Sequatchie County, owner-occupied units account for 4,537 (76.6%), while renter-occupied units make up 1,388 (23.4%).
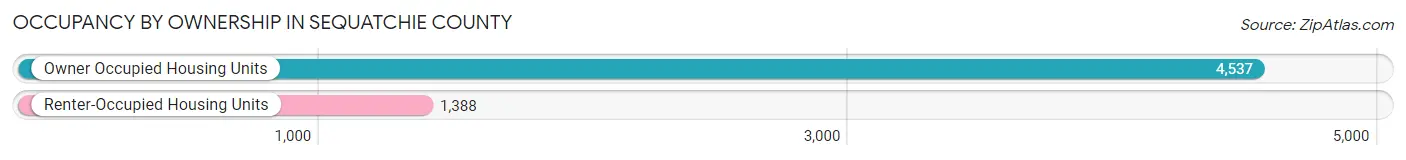
| Occupancy | # Housing Units | % Housing Units |
| Owner Occupied Housing Units | 4,537 | 76.6% |
| Renter-Occupied Housing Units | 1,388 | 23.4% |
| Total Occupied Housing Units | 5,925 | 100.0% |
Occupancy by Household Size in Sequatchie County
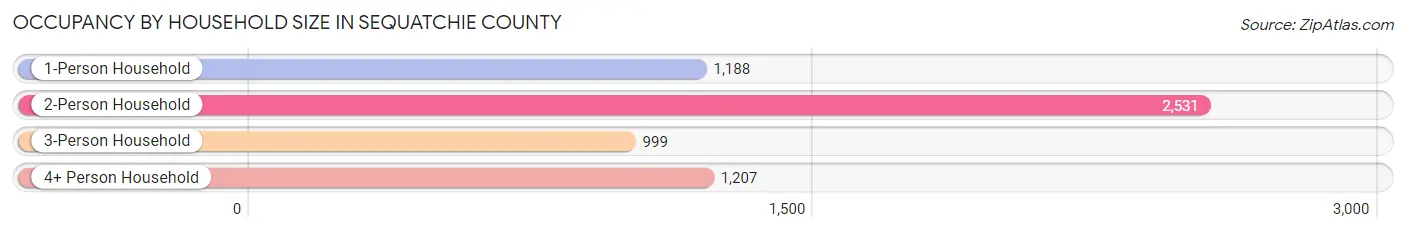
| Household Size | # Housing Units | % Housing Units |
| 1-Person Household | 1,188 | 20.1% |
| 2-Person Household | 2,531 | 42.7% |
| 3-Person Household | 999 | 16.9% |
| 4+ Person Household | 1,207 | 20.4% |
| Total Housing Units | 5,925 | 100.0% |
Occupancy by Ownership by Household Size in Sequatchie County
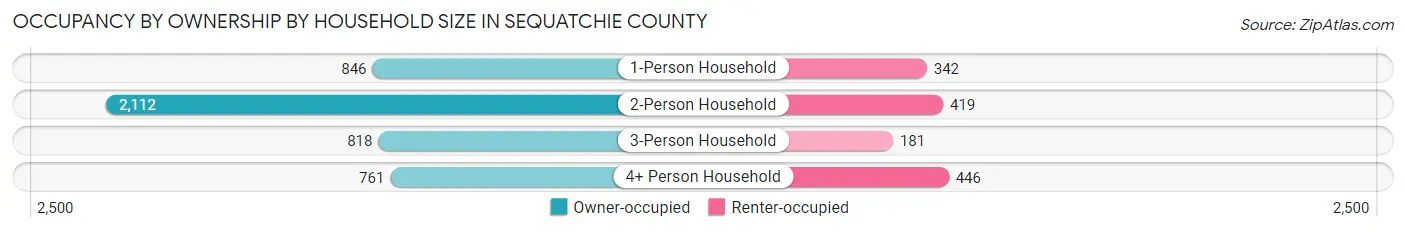
| Household Size | Owner-occupied | Renter-occupied |
| 1-Person Household | 846 (71.2%) | 342 (28.8%) |
| 2-Person Household | 2,112 (83.5%) | 419 (16.6%) |
| 3-Person Household | 818 (81.9%) | 181 (18.1%) |
| 4+ Person Household | 761 (63.0%) | 446 (36.9%) |
| Total Housing Units | 4,537 (76.6%) | 1,388 (23.4%) |
Occupancy by Educational Attainment in Sequatchie County
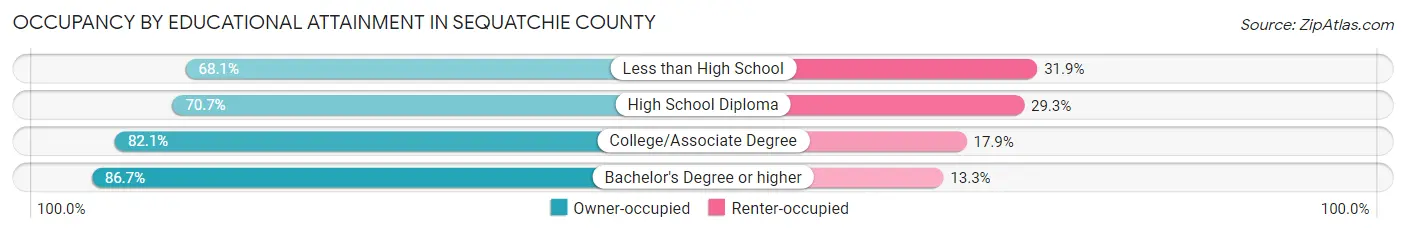
| Household Size | Owner-occupied | Renter-occupied |
| Less than High School | 697 (68.1%) | 327 (31.9%) |
| High School Diploma | 1,427 (70.7%) | 592 (29.3%) |
| College/Associate Degree | 1,516 (82.1%) | 331 (17.9%) |
| Bachelor's Degree or higher | 897 (86.7%) | 138 (13.3%) |
Occupancy by Age of Householder in Sequatchie County
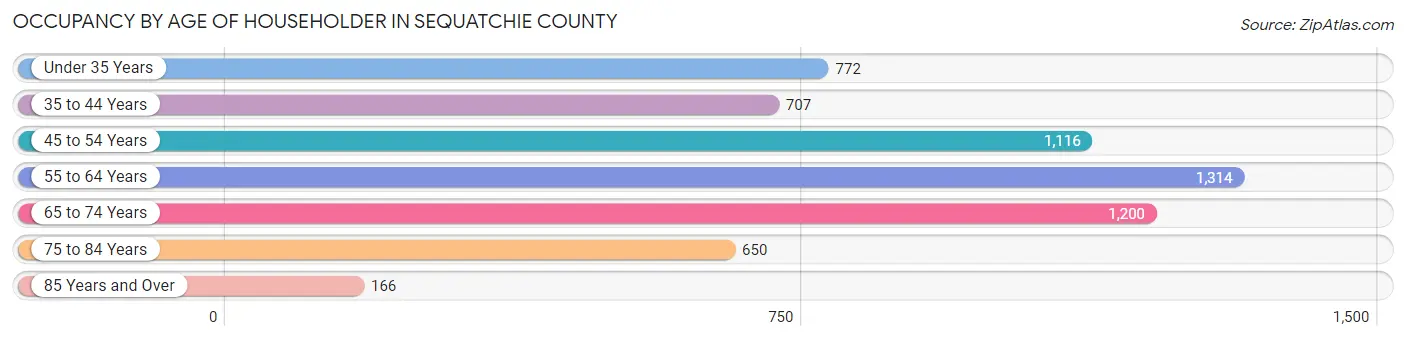
| Age Bracket | # Households | % Households |
| Under 35 Years | 772 | 13.0% |
| 35 to 44 Years | 707 | 11.9% |
| 45 to 54 Years | 1,116 | 18.8% |
| 55 to 64 Years | 1,314 | 22.2% |
| 65 to 74 Years | 1,200 | 20.3% |
| 75 to 84 Years | 650 | 11.0% |
| 85 Years and Over | 166 | 2.8% |
| Total | 5,925 | 100.0% |
Housing Finances in Sequatchie County
Median Income by Occupancy in Sequatchie County
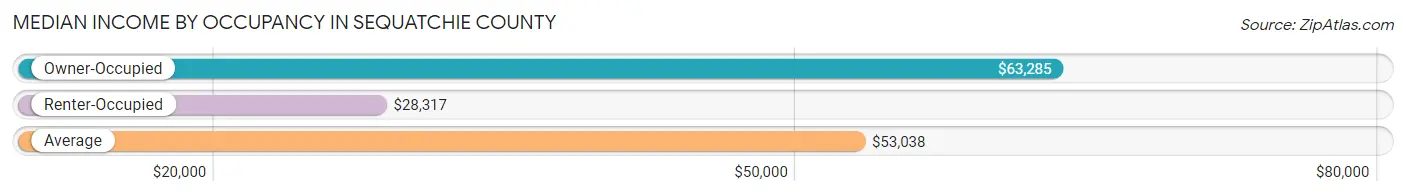
| Occupancy Type | # Households | Median Income |
| Owner-Occupied | 4,537 (76.6%) | $63,285 |
| Renter-Occupied | 1,388 (23.4%) | $28,317 |
| Average | 5,925 (100.0%) | $53,038 |
Occupancy by Householder Income Bracket in Sequatchie County
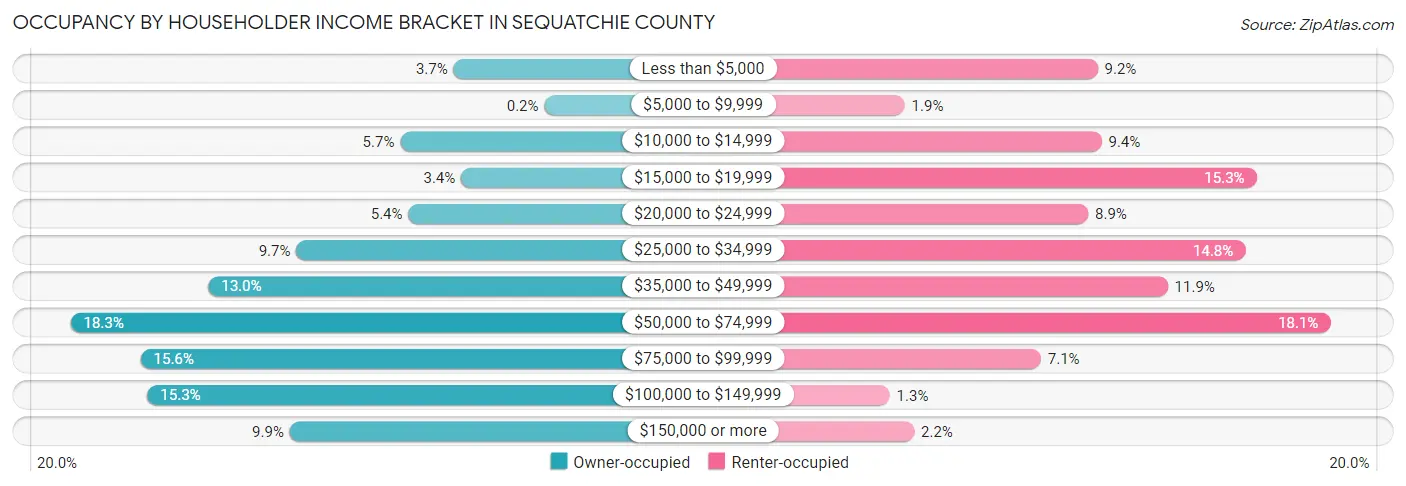
| Income Bracket | Owner-occupied | Renter-occupied |
| Less than $5,000 | 166 (3.7%) | 128 (9.2%) |
| $5,000 to $9,999 | 9 (0.2%) | 26 (1.9%) |
| $10,000 to $14,999 | 258 (5.7%) | 130 (9.4%) |
| $15,000 to $19,999 | 153 (3.4%) | 212 (15.3%) |
| $20,000 to $24,999 | 244 (5.4%) | 123 (8.9%) |
| $25,000 to $34,999 | 438 (9.7%) | 206 (14.8%) |
| $35,000 to $49,999 | 590 (13.0%) | 165 (11.9%) |
| $50,000 to $74,999 | 828 (18.2%) | 251 (18.1%) |
| $75,000 to $99,999 | 707 (15.6%) | 98 (7.1%) |
| $100,000 to $149,999 | 695 (15.3%) | 18 (1.3%) |
| $150,000 or more | 449 (9.9%) | 31 (2.2%) |
| Total | 4,537 (100.0%) | 1,388 (100.0%) |
Monthly Housing Cost Tiers in Sequatchie County
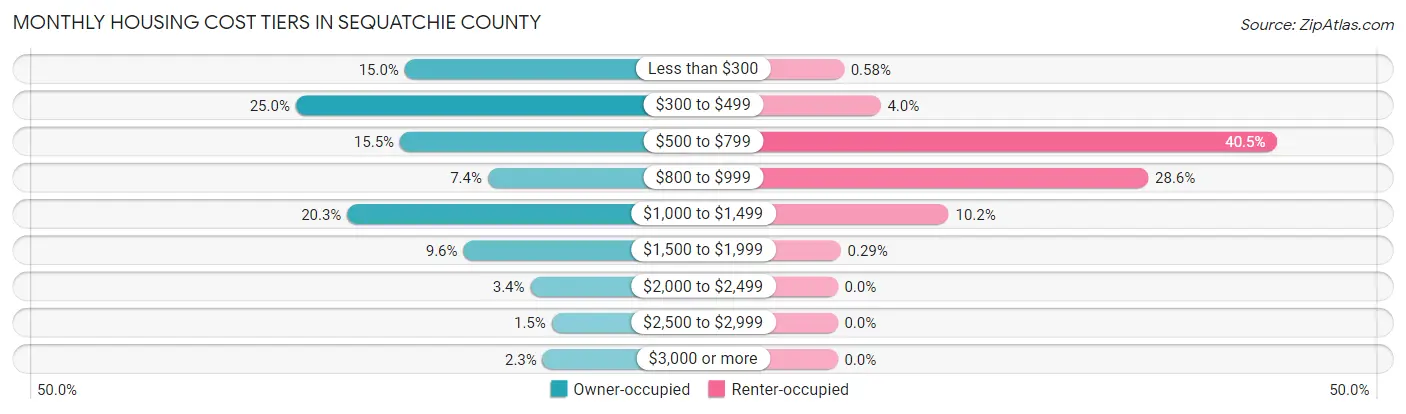
| Monthly Cost | Owner-occupied | Renter-occupied |
| Less than $300 | 681 (15.0%) | 8 (0.6%) |
| $300 to $499 | 1,136 (25.0%) | 55 (4.0%) |
| $500 to $799 | 701 (15.4%) | 562 (40.5%) |
| $800 to $999 | 334 (7.4%) | 397 (28.6%) |
| $1,000 to $1,499 | 921 (20.3%) | 142 (10.2%) |
| $1,500 to $1,999 | 436 (9.6%) | 4 (0.3%) |
| $2,000 to $2,499 | 156 (3.4%) | 0 (0.0%) |
| $2,500 to $2,999 | 67 (1.5%) | 0 (0.0%) |
| $3,000 or more | 105 (2.3%) | 0 (0.0%) |
| Total | 4,537 (100.0%) | 1,388 (100.0%) |
Physical Housing Characteristics in Sequatchie County
Housing Structures in Sequatchie County
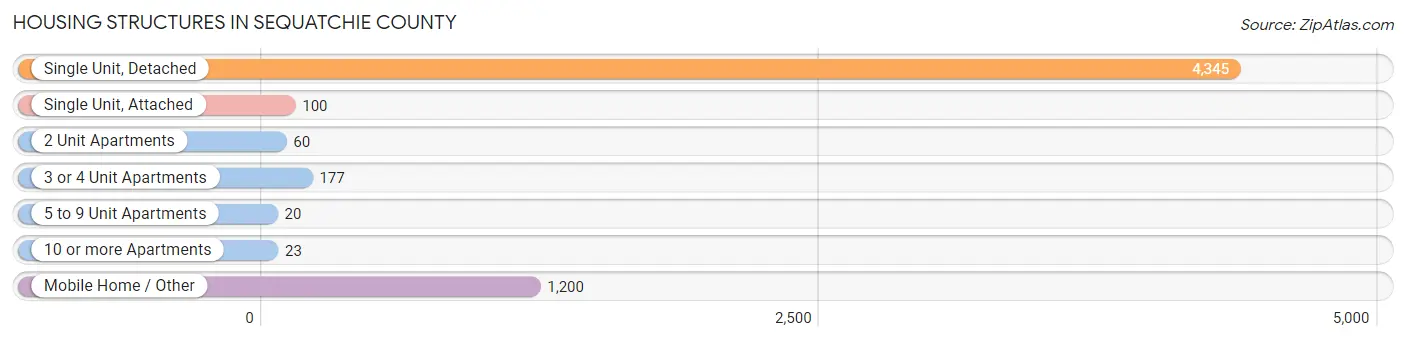
| Structure Type | # Housing Units | % Housing Units |
| Single Unit, Detached | 4,345 | 73.3% |
| Single Unit, Attached | 100 | 1.7% |
| 2 Unit Apartments | 60 | 1.0% |
| 3 or 4 Unit Apartments | 177 | 3.0% |
| 5 to 9 Unit Apartments | 20 | 0.3% |
| 10 or more Apartments | 23 | 0.4% |
| Mobile Home / Other | 1,200 | 20.3% |
| Total | 5,925 | 100.0% |
Housing Structures by Occupancy in Sequatchie County
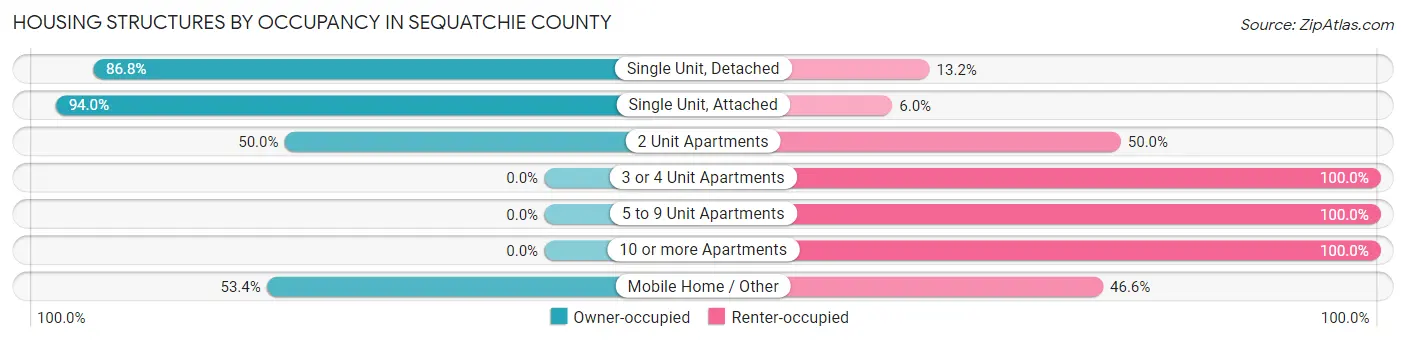
| Structure Type | Owner-occupied | Renter-occupied |
| Single Unit, Detached | 3,772 (86.8%) | 573 (13.2%) |
| Single Unit, Attached | 94 (94.0%) | 6 (6.0%) |
| 2 Unit Apartments | 30 (50.0%) | 30 (50.0%) |
| 3 or 4 Unit Apartments | 0 (0.0%) | 177 (100.0%) |
| 5 to 9 Unit Apartments | 0 (0.0%) | 20 (100.0%) |
| 10 or more Apartments | 0 (0.0%) | 23 (100.0%) |
| Mobile Home / Other | 641 (53.4%) | 559 (46.6%) |
| Total | 4,537 (76.6%) | 1,388 (23.4%) |
Housing Structures by Number of Rooms in Sequatchie County
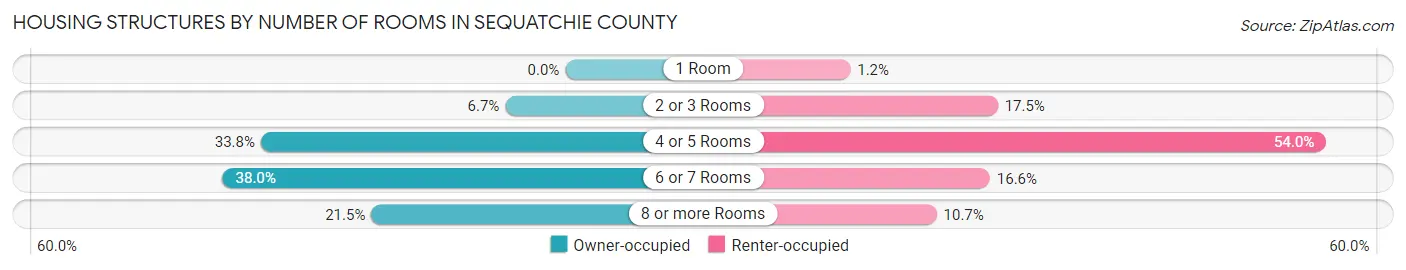
| Number of Rooms | Owner-occupied | Renter-occupied |
| 1 Room | 0 (0.0%) | 16 (1.1%) |
| 2 or 3 Rooms | 302 (6.7%) | 243 (17.5%) |
| 4 or 5 Rooms | 1,533 (33.8%) | 749 (54.0%) |
| 6 or 7 Rooms | 1,725 (38.0%) | 231 (16.6%) |
| 8 or more Rooms | 977 (21.5%) | 149 (10.7%) |
| Total | 4,537 (100.0%) | 1,388 (100.0%) |
Housing Structure by Heating Type in Sequatchie County
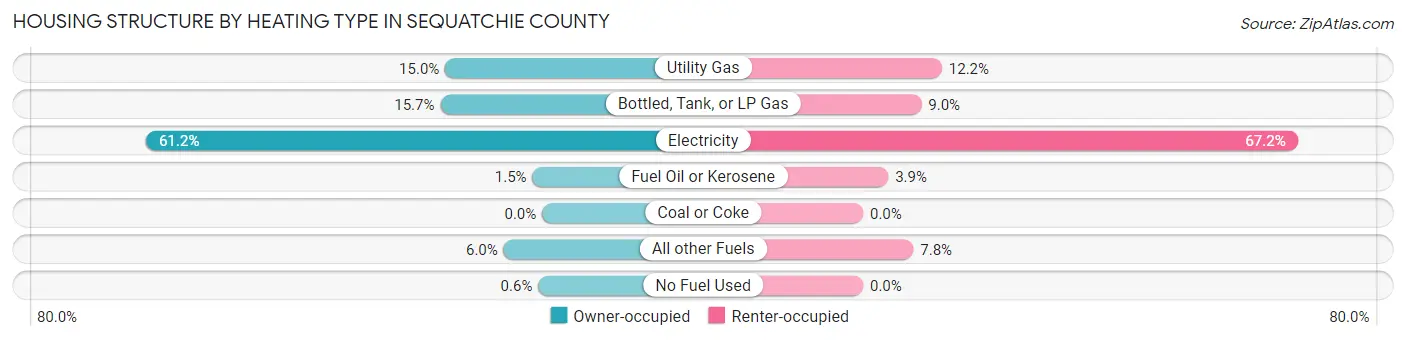
| Heating Type | Owner-occupied | Renter-occupied |
| Utility Gas | 680 (15.0%) | 169 (12.2%) |
| Bottled, Tank, or LP Gas | 714 (15.7%) | 125 (9.0%) |
| Electricity | 2,778 (61.2%) | 932 (67.1%) |
| Fuel Oil or Kerosene | 68 (1.5%) | 54 (3.9%) |
| Coal or Coke | 0 (0.0%) | 0 (0.0%) |
| All other Fuels | 270 (5.9%) | 108 (7.8%) |
| No Fuel Used | 27 (0.6%) | 0 (0.0%) |
| Total | 4,537 (100.0%) | 1,388 (100.0%) |
Household Vehicle Usage in Sequatchie County
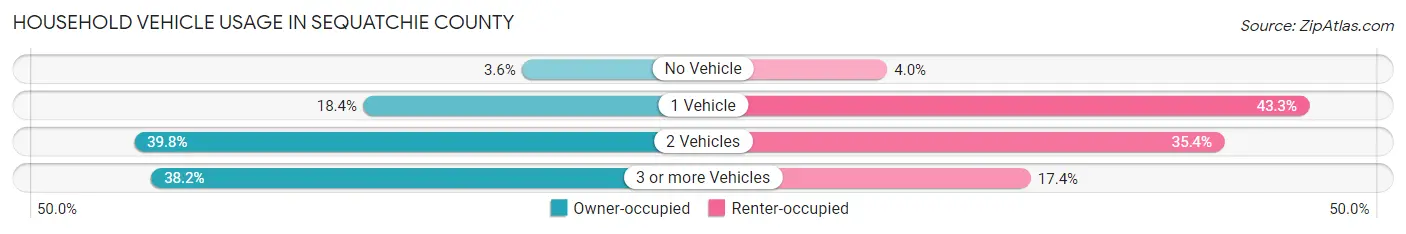
| Vehicles per Household | Owner-occupied | Renter-occupied |
| No Vehicle | 164 (3.6%) | 55 (4.0%) |
| 1 Vehicle | 836 (18.4%) | 601 (43.3%) |
| 2 Vehicles | 1,805 (39.8%) | 491 (35.4%) |
| 3 or more Vehicles | 1,732 (38.2%) | 241 (17.4%) |
| Total | 4,537 (100.0%) | 1,388 (100.0%) |
Real Estate & Mortgages in Sequatchie County
Real Estate and Mortgage Overview in Sequatchie County
| Characteristic | Without Mortgage | With Mortgage |
| Housing Units | 2,440 | 2,097 |
| Median Property Value | $165,200 | $207,100 |
| Median Household Income | $44,063 | $318 |
| Monthly Housing Costs | $396 | $105 |
| Real Estate Taxes | $897 | $77 |
Property Value by Mortgage Status in Sequatchie County
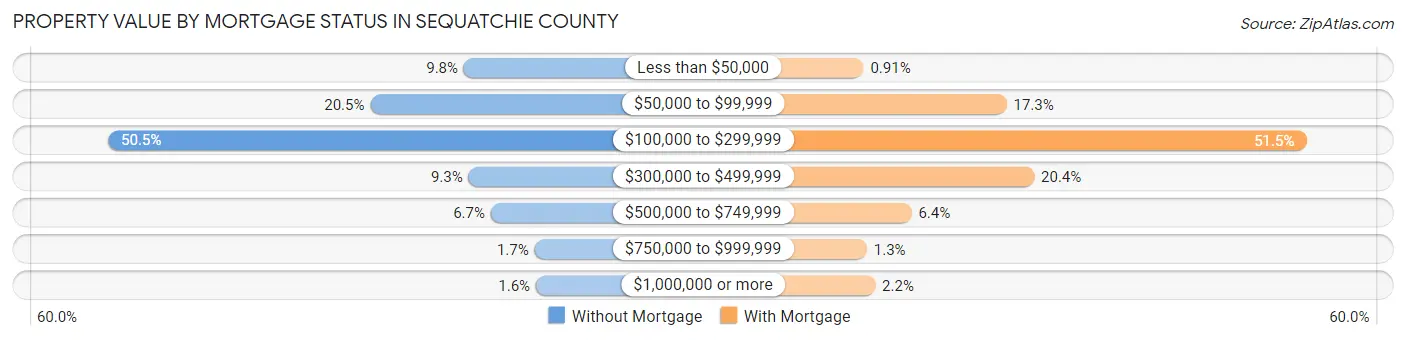
| Property Value | Without Mortgage | With Mortgage |
| Less than $50,000 | 239 (9.8%) | 19 (0.9%) |
| $50,000 to $99,999 | 500 (20.5%) | 362 (17.3%) |
| $100,000 to $299,999 | 1,231 (50.4%) | 1,080 (51.5%) |
| $300,000 to $499,999 | 226 (9.3%) | 428 (20.4%) |
| $500,000 to $749,999 | 164 (6.7%) | 134 (6.4%) |
| $750,000 to $999,999 | 42 (1.7%) | 27 (1.3%) |
| $1,000,000 or more | 38 (1.6%) | 47 (2.2%) |
| Total | 2,440 (100.0%) | 2,097 (100.0%) |
Household Income by Mortgage Status in Sequatchie County
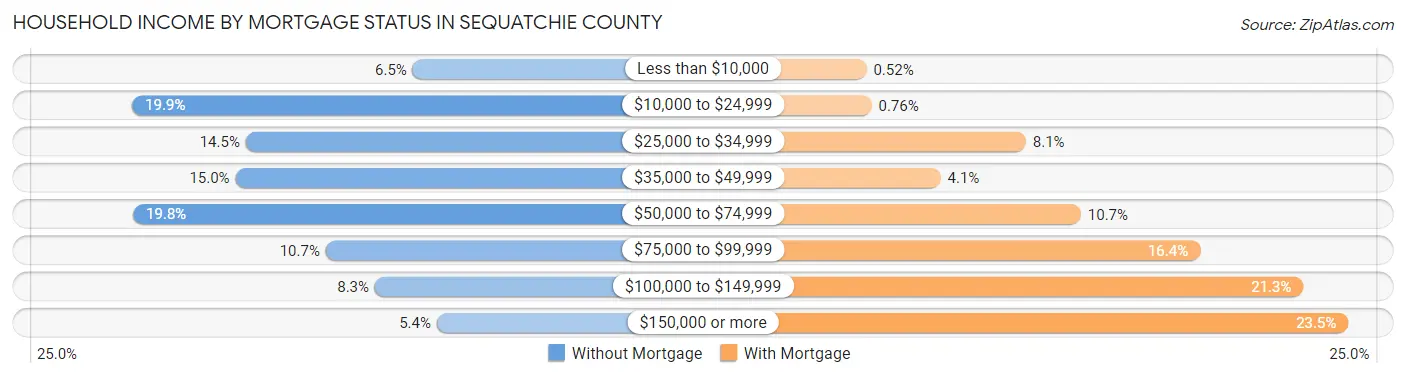
| Household Income | Without Mortgage | With Mortgage |
| Less than $10,000 | 159 (6.5%) | 11 (0.5%) |
| $10,000 to $24,999 | 485 (19.9%) | 16 (0.8%) |
| $25,000 to $34,999 | 353 (14.5%) | 170 (8.1%) |
| $35,000 to $49,999 | 365 (15.0%) | 85 (4.1%) |
| $50,000 to $74,999 | 484 (19.8%) | 225 (10.7%) |
| $75,000 to $99,999 | 260 (10.7%) | 344 (16.4%) |
| $100,000 to $149,999 | 203 (8.3%) | 447 (21.3%) |
| $150,000 or more | 131 (5.4%) | 492 (23.5%) |
| Total | 2,440 (100.0%) | 2,097 (100.0%) |
Property Value to Household Income Ratio in Sequatchie County
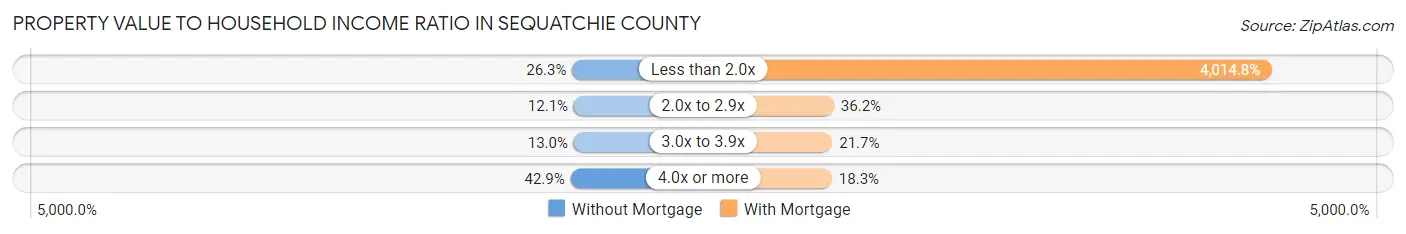
| Value-to-Income Ratio | Without Mortgage | With Mortgage |
| Less than 2.0x | 641 (26.3%) | 84,191 (4,014.8%) |
| 2.0x to 2.9x | 295 (12.1%) | 759 (36.2%) |
| 3.0x to 3.9x | 316 (13.0%) | 455 (21.7%) |
| 4.0x or more | 1,046 (42.9%) | 383 (18.3%) |
| Total | 2,440 (100.0%) | 2,097 (100.0%) |
Real Estate Taxes by Mortgage Status in Sequatchie County
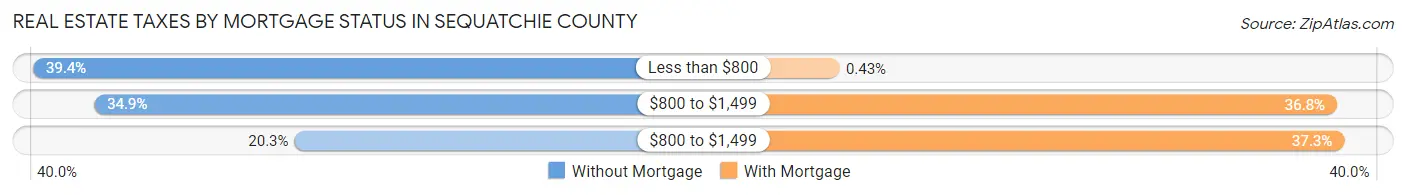
| Property Taxes | Without Mortgage | With Mortgage |
| Less than $800 | 961 (39.4%) | 9 (0.4%) |
| $800 to $1,499 | 852 (34.9%) | 772 (36.8%) |
| $800 to $1,499 | 495 (20.3%) | 783 (37.3%) |
| Total | 2,440 (100.0%) | 2,097 (100.0%) |
Health & Disability in Sequatchie County
Health Insurance Coverage by Age in Sequatchie County
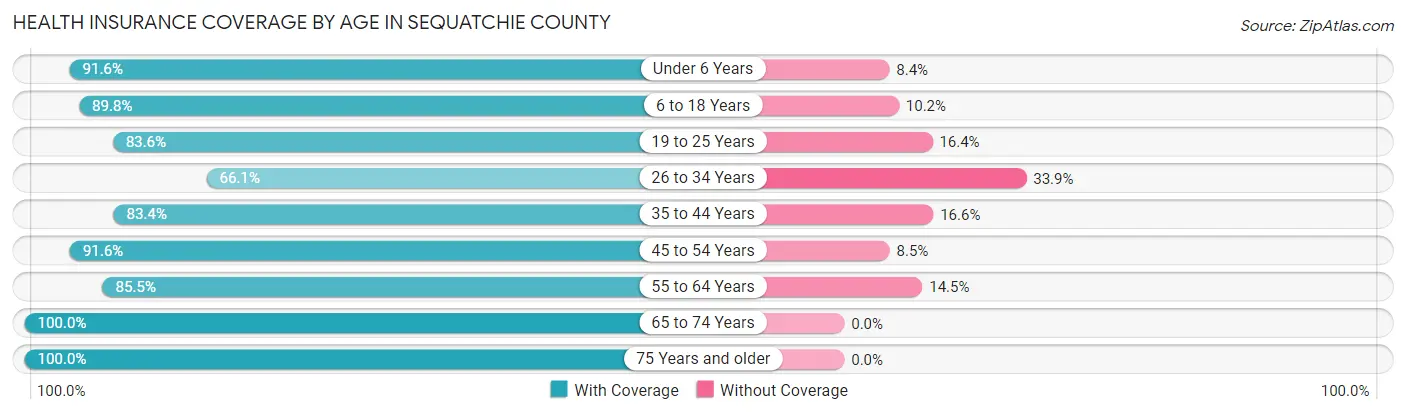
| Age Bracket | With Coverage | Without Coverage |
| Under 6 Years | 872 (91.6%) | 80 (8.4%) |
| 6 to 18 Years | 2,253 (89.8%) | 255 (10.2%) |
| 19 to 25 Years | 981 (83.6%) | 193 (16.4%) |
| 26 to 34 Years | 1,160 (66.1%) | 596 (33.9%) |
| 35 to 44 Years | 1,448 (83.4%) | 288 (16.6%) |
| 45 to 54 Years | 1,950 (91.5%) | 180 (8.5%) |
| 55 to 64 Years | 2,005 (85.5%) | 341 (14.5%) |
| 65 to 74 Years | 1,930 (100.0%) | 0 (0.0%) |
| 75 Years and older | 1,296 (100.0%) | 0 (0.0%) |
| Total | 13,895 (87.8%) | 1,933 (12.2%) |
Health Insurance Coverage by Citizenship Status in Sequatchie County
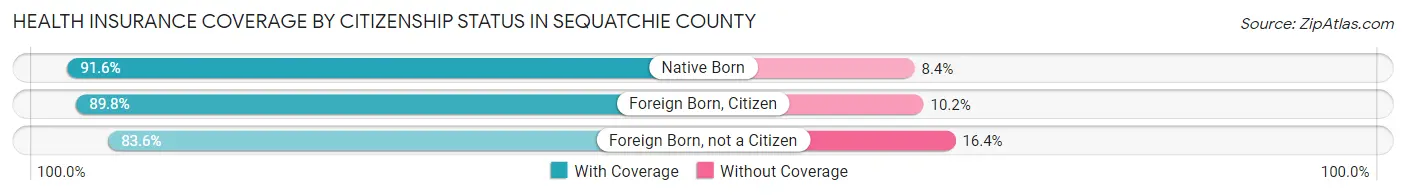
| Citizenship Status | With Coverage | Without Coverage |
| Native Born | 872 (91.6%) | 80 (8.4%) |
| Foreign Born, Citizen | 2,253 (89.8%) | 255 (10.2%) |
| Foreign Born, not a Citizen | 981 (83.6%) | 193 (16.4%) |
Health Insurance Coverage by Household Income in Sequatchie County
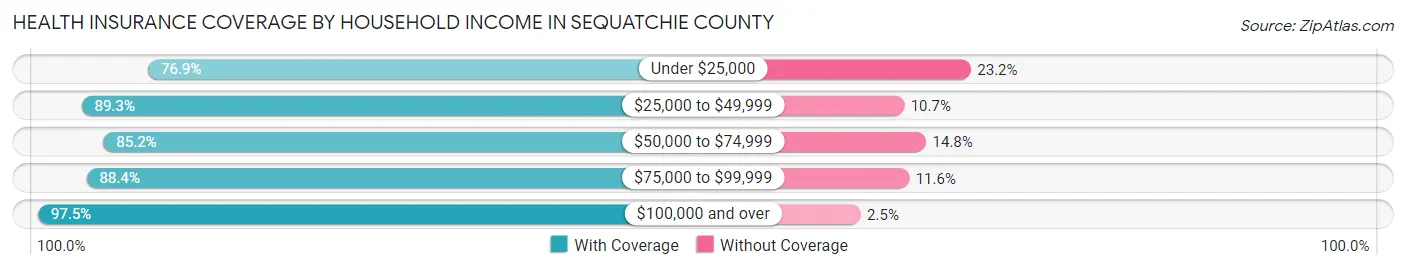
| Household Income | With Coverage | Without Coverage |
| Under $25,000 | 2,390 (76.8%) | 720 (23.2%) |
| $25,000 to $49,999 | 3,055 (89.3%) | 365 (10.7%) |
| $50,000 to $74,999 | 2,533 (85.2%) | 439 (14.8%) |
| $75,000 to $99,999 | 2,438 (88.4%) | 320 (11.6%) |
| $100,000 and over | 3,472 (97.5%) | 89 (2.5%) |
Public vs Private Health Insurance Coverage by Age in Sequatchie County
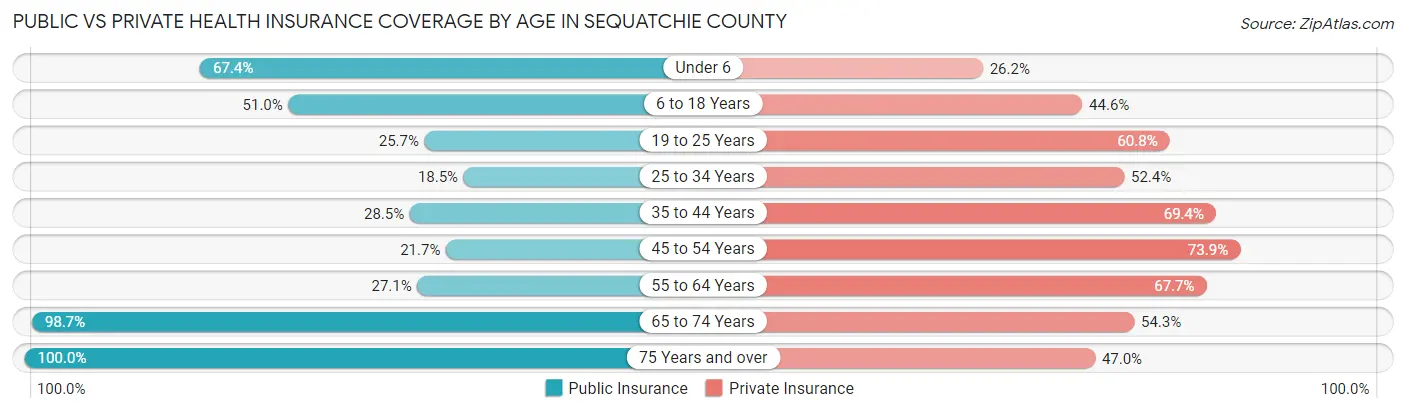
| Age Bracket | Public Insurance | Private Insurance |
| Under 6 | 642 (67.4%) | 249 (26.2%) |
| 6 to 18 Years | 1,279 (51.0%) | 1,119 (44.6%) |
| 19 to 25 Years | 302 (25.7%) | 714 (60.8%) |
| 25 to 34 Years | 324 (18.4%) | 920 (52.4%) |
| 35 to 44 Years | 494 (28.5%) | 1,205 (69.4%) |
| 45 to 54 Years | 463 (21.7%) | 1,574 (73.9%) |
| 55 to 64 Years | 635 (27.1%) | 1,587 (67.6%) |
| 65 to 74 Years | 1,904 (98.7%) | 1,047 (54.2%) |
| 75 Years and over | 1,296 (100.0%) | 609 (47.0%) |
| Total | 7,339 (46.4%) | 9,024 (57.0%) |
Disability Status by Sex by Age in Sequatchie County
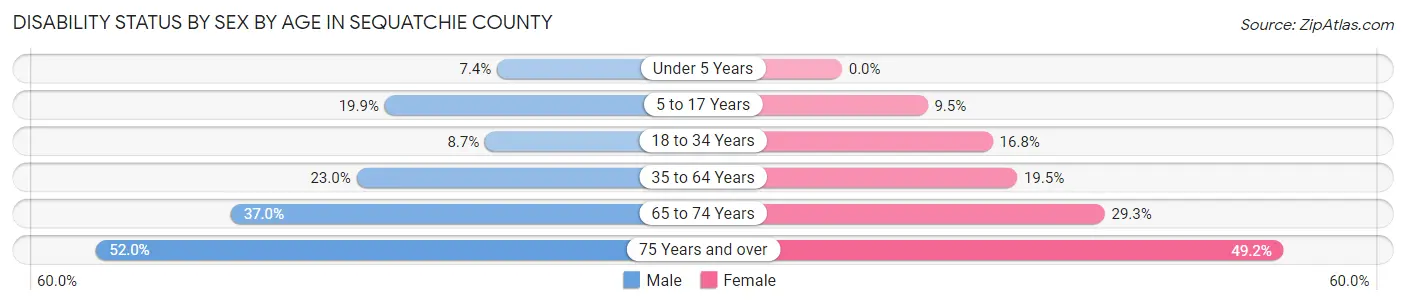
| Age Bracket | Male | Female |
| Under 5 Years | 34 (7.4%) | 0 (0.0%) |
| 5 to 17 Years | 243 (19.9%) | 109 (9.5%) |
| 18 to 34 Years | 156 (8.7%) | 236 (16.8%) |
| 35 to 64 Years | 718 (23.0%) | 604 (19.5%) |
| 65 to 74 Years | 354 (37.0%) | 285 (29.3%) |
| 75 Years and over | 286 (52.0%) | 367 (49.2%) |
Disability Class by Sex by Age in Sequatchie County
Disability Class: Hearing Difficulty
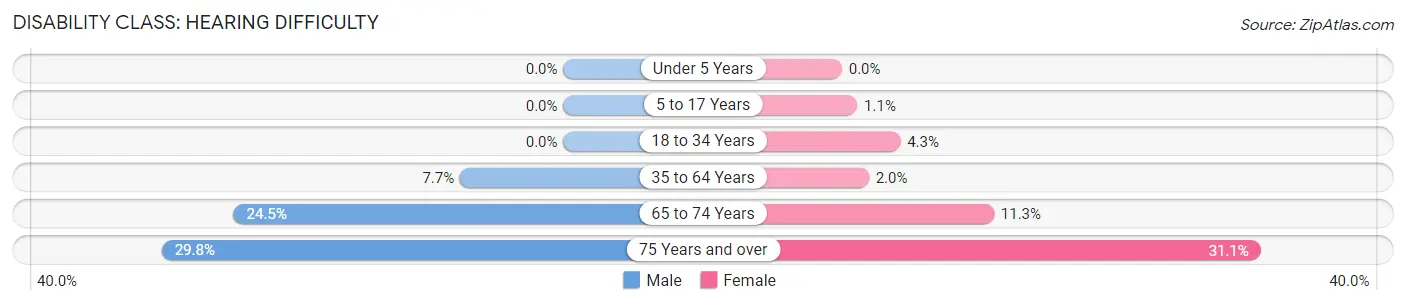
| Age Bracket | Male | Female |
| Under 5 Years | 0 (0.0%) | 0 (0.0%) |
| 5 to 17 Years | 0 (0.0%) | 13 (1.1%) |
| 18 to 34 Years | 0 (0.0%) | 61 (4.3%) |
| 35 to 64 Years | 239 (7.7%) | 62 (2.0%) |
| 65 to 74 Years | 234 (24.5%) | 110 (11.3%) |
| 75 Years and over | 164 (29.8%) | 232 (31.1%) |
Disability Class: Vision Difficulty
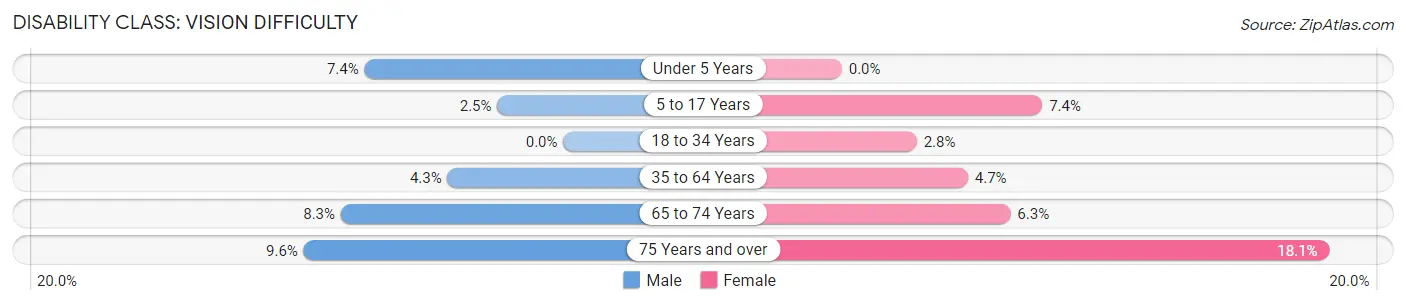
| Age Bracket | Male | Female |
| Under 5 Years | 34 (7.4%) | 0 (0.0%) |
| 5 to 17 Years | 30 (2.5%) | 85 (7.4%) |
| 18 to 34 Years | 0 (0.0%) | 39 (2.8%) |
| 35 to 64 Years | 134 (4.3%) | 145 (4.7%) |
| 65 to 74 Years | 79 (8.3%) | 61 (6.3%) |
| 75 Years and over | 53 (9.6%) | 135 (18.1%) |
Disability Class: Cognitive Difficulty

| Age Bracket | Male | Female |
| 5 to 17 Years | 213 (17.4%) | 11 (1.0%) |
| 18 to 34 Years | 132 (7.4%) | 52 (3.7%) |
| 35 to 64 Years | 300 (9.6%) | 161 (5.2%) |
| 65 to 74 Years | 80 (8.4%) | 102 (10.5%) |
| 75 Years and over | 87 (15.8%) | 145 (19.4%) |
Disability Class: Ambulatory Difficulty
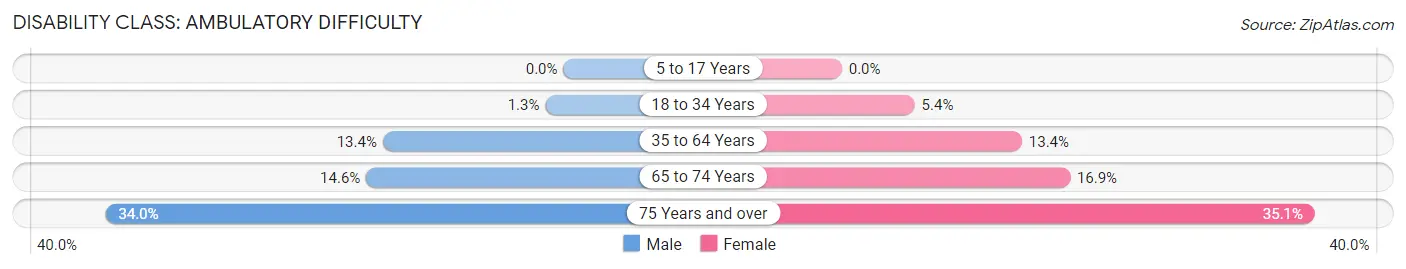
| Age Bracket | Male | Female |
| 5 to 17 Years | 0 (0.0%) | 0 (0.0%) |
| 18 to 34 Years | 24 (1.3%) | 76 (5.4%) |
| 35 to 64 Years | 418 (13.4%) | 414 (13.4%) |
| 65 to 74 Years | 140 (14.6%) | 165 (16.9%) |
| 75 Years and over | 187 (34.0%) | 262 (35.1%) |
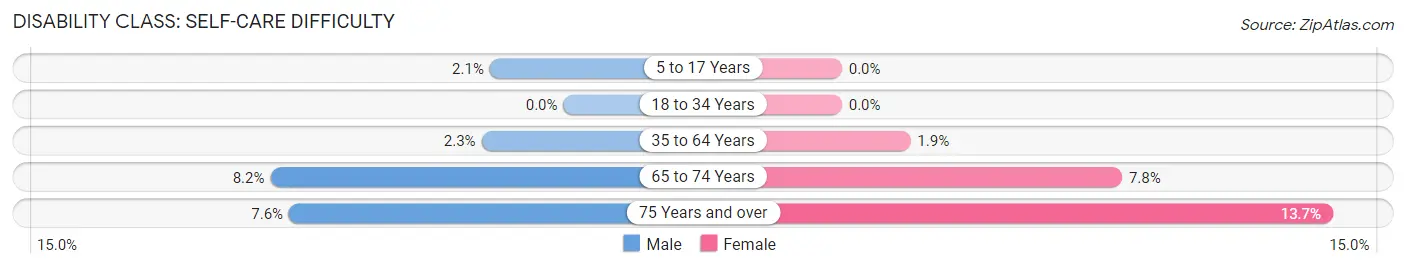
Disability Class: Self-Care Difficulty
| Age Bracket | Male | Female |
| 5 to 17 Years | 25 (2.1%) | 0 (0.0%) |
| 18 to 34 Years | 0 (0.0%) | 0 (0.0%) |
| 35 to 64 Years | 71 (2.3%) | 59 (1.9%) |
| 65 to 74 Years | 78 (8.2%) | 76 (7.8%) |
| 75 Years and over | 42 (7.6%) | 102 (13.7%) |
Technology Access in Sequatchie County
Computing Device Access in Sequatchie County
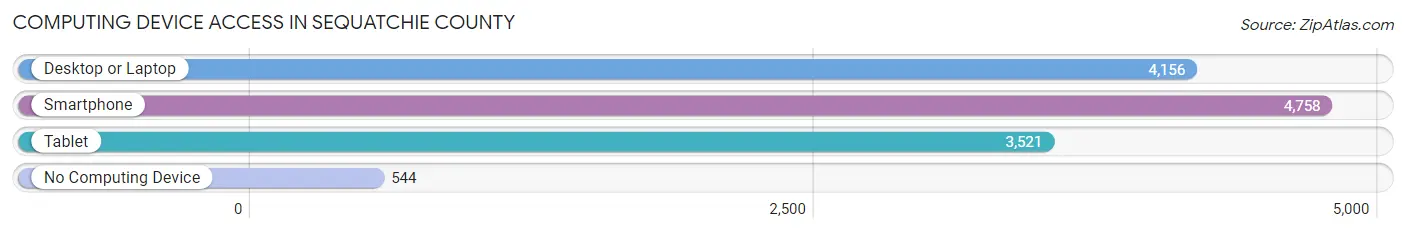
| Device Type | # Households | % Households |
| Desktop or Laptop | 4,156 | 70.1% |
| Smartphone | 4,758 | 80.3% |
| Tablet | 3,521 | 59.4% |
| No Computing Device | 544 | 9.2% |
| Total | 5,925 | 100.0% |
Internet Access in Sequatchie County
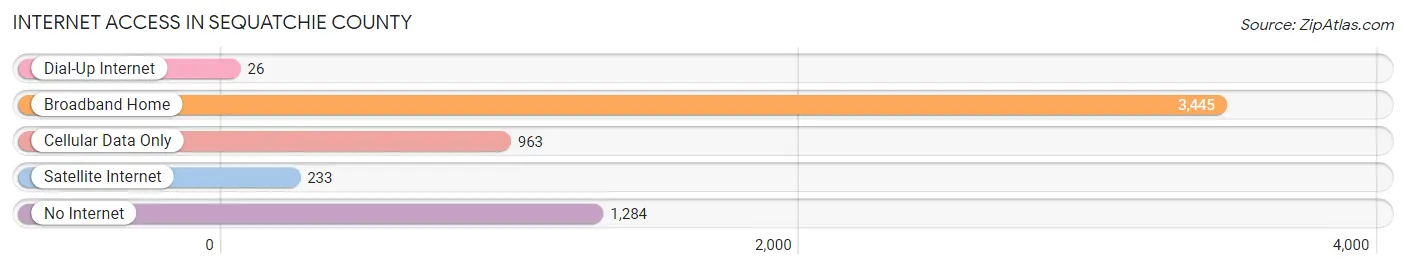
| Internet Type | # Households | % Households |
| Dial-Up Internet | 26 | 0.4% |
| Broadband Home | 3,445 | 58.1% |
| Cellular Data Only | 963 | 16.3% |
| Satellite Internet | 233 | 3.9% |
| No Internet | 1,284 | 21.7% |
| Total | 5,925 | 100.0% |
Sequatchie County Summary
Situated in the Cumberland Plateau region of Tennessee, Sequatchie County is a rural county located in the southeastern part of the state. It is bordered by Bledsoe County to the north, Marion County to the east, Grundy County to the south, and Hamilton County to the west. The county seat is Dunlap, and the county has a total area of 256 square miles.
History
Sequatchie County was established in 1857 from parts of Hamilton, Bledsoe, and Marion counties. It was named for the Sequatchie Valley, which was named after a Cherokee chief. The county was originally part of the Cherokee Nation, and the first settlers arrived in the area in the early 1800s. The county was home to several Civil War battles, including the Battle of Dunlap and the Battle of Sequatchie Valley.
Geography
Sequatchie County is located in the Cumberland Plateau region of Tennessee. It is bordered by Bledsoe County to the north, Marion County to the east, Grundy County to the south, and Hamilton County to the west. The county has a total area of 256 square miles, and is mostly mountainous. The highest point in the county is Signal Mountain, which has an elevation of 2,039 feet. The county is home to several rivers and creeks, including the Sequatchie River, which flows through the county.
Economy
Sequatchie County has a largely agricultural economy. The county is home to several farms, and the main crops grown in the area are corn, soybeans, and hay. The county is also home to several manufacturing companies, including a furniture factory and a paper mill. The county also has a growing tourism industry, with several attractions, including the Sequatchie Valley Railroad Museum and the Sequatchie County Historical Museum.
Demographics
As of the 2010 census, Sequatchie County had a population of 14,112. The population was spread out, with 48.3% male and 51.7% female. The median age was 41.2 years. The racial makeup of the county was 95.2% White, 1.7% African American, 0.4% Native American, 0.3% Asian, 0.1% Pacific Islander, 1.2% from other races, and 1.1% from two or more races. Hispanic or Latino of any race were 2.7% of the population.
The median household income in Sequatchie County was $37,945, and the median family income was $45,945. The per capita income was $19,945. About 14.2% of the population was below the poverty line.
Common Questions
What is the Total Population of Sequatchie County?
Total Population of Sequatchie County is 16,065.
What is the Total Male Population of Sequatchie County?
Total Male Population of Sequatchie County is 8,232.
What is the Total Female Population of Sequatchie County?
Total Female Population of Sequatchie County is 7,833.
What is the Ratio of Males per 100 Females in Sequatchie County?
There are 105.09 Males per 100 Females in Sequatchie County.
What is the Ratio of Females per 100 Males in Sequatchie County?
There are 95.15 Females per 100 Males in Sequatchie County.
What is the Median Population Age in Sequatchie County?
Median Population Age in Sequatchie County is 44.4 Years.
What is the Average Family Size in Sequatchie County
Average Family Size in Sequatchie County is 3.0 People.
What is the Average Household Size in Sequatchie County
Average Household Size in Sequatchie County is 2.7 People.
What is Per Capita Income in Sequatchie County?
Per Capita income in Sequatchie County is $25,954.
What is the Median Family Income in Sequatchie County?
Median Family Income in Sequatchie County is $63,095.
What is the Median Household income in Sequatchie County?
Median Household Income in Sequatchie County is $53,038.
What is Income or Wage Gap in Sequatchie County?
Income or Wage Gap in Sequatchie County is 36.0%.
Women in Sequatchie County earn 64.0 cents for every dollar earned by a man.
What is Family Income Deficit in Sequatchie County?
Family Income Deficit in Sequatchie County is $10,597.
Families that are below poverty line in Sequatchie County earn $10,597 less on average than the poverty threshold level.
What is Inequality or Gini Index in Sequatchie County?
Inequality or Gini Index in Sequatchie County is 0.44.
How Large is the Labor Force in Sequatchie County?
There are 6,606 People in the Labor Forcein in Sequatchie County.
What is the Percentage of People in the Labor Force in Sequatchie County?
50.0% of People are in the Labor Force in Sequatchie County.
What is the Unemployment Rate in Sequatchie County?
Unemployment Rate in Sequatchie County is 3.3%.