Rutherford County, TN
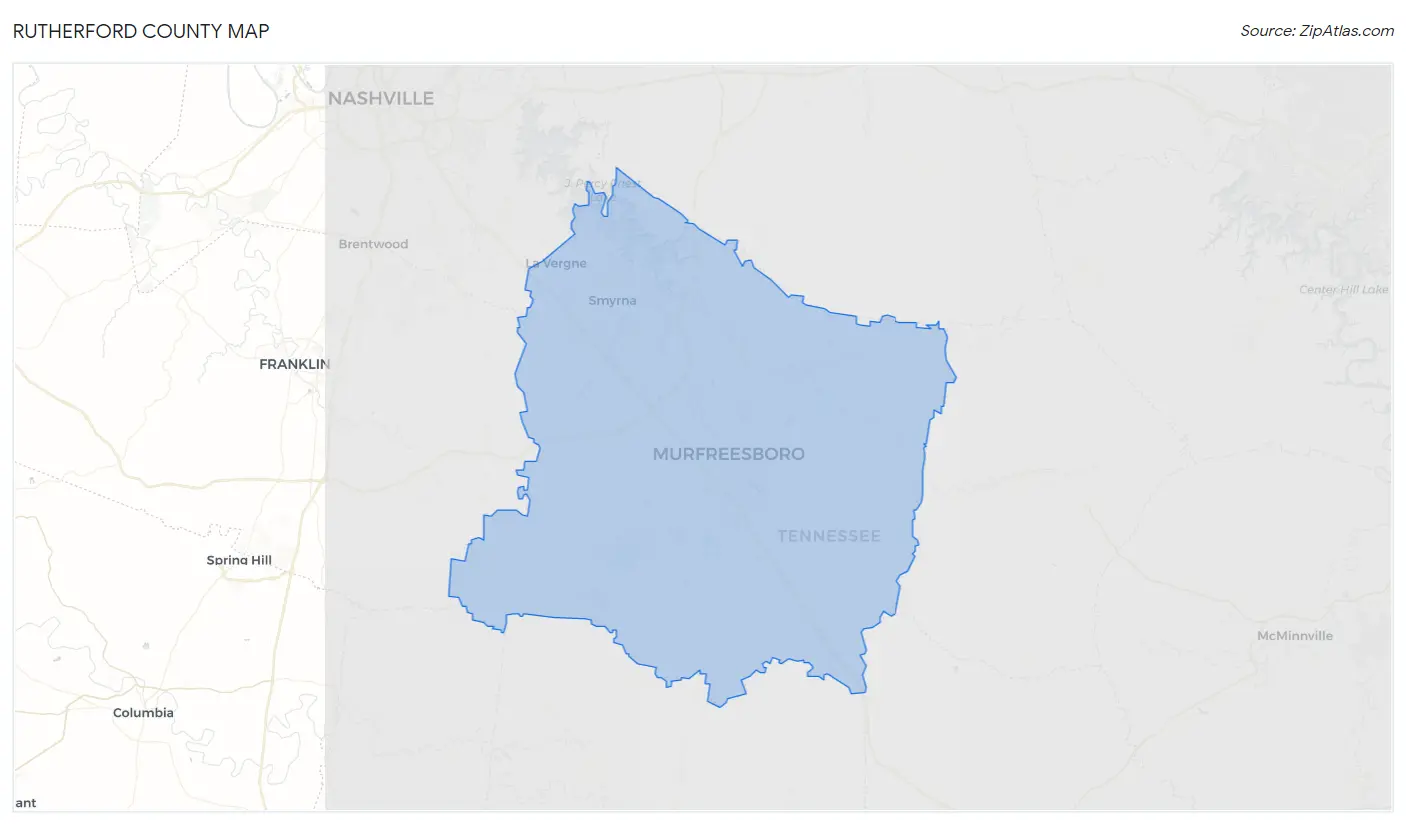
Rutherford County Map
Rutherford County Overview
343,727
TOTAL POPULATION
169,927
MALE POPULATION
173,800
FEMALE POPULATION
97.77
MALES / 100 FEMALES
102.28
FEMALES / 100 MALES
34.0
MEDIAN AGE
3.2
AVG FAMILY SIZE
2.8
AVG HOUSEHOLD SIZE
$35,135
PER CAPITA INCOME
$90,389
AVG FAMILY INCOME
$78,291
AVG HOUSEHOLD INCOME
25.6%
WAGE / INCOME GAP [ % ]
74.4¢/ $1
WAGE / INCOME GAP [ $ ]
$10,491
FAMILY INCOME DEFICIT
0.40
INEQUALITY / GINI INDEX
192,211
LABOR FORCE [ PEOPLE ]
71.2%
PERCENT IN LABOR FORCE
3.9%
UNEMPLOYMENT RATE
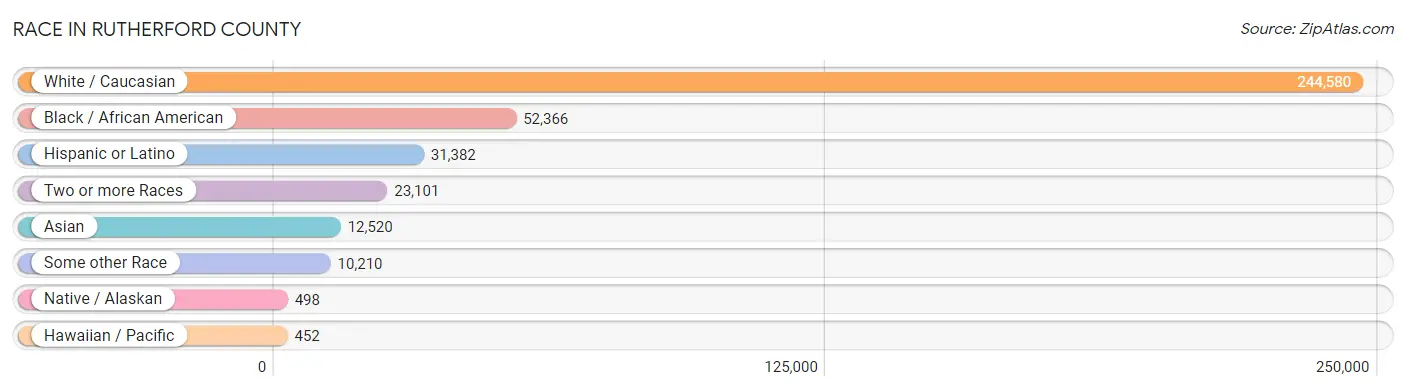
Race in Rutherford County
The most populous races in Rutherford County are White / Caucasian (244,580 | 71.2%), Black / African American (52,366 | 15.2%), and Hispanic or Latino (31,382 | 9.1%).
| Race | # Population | % Population |
| Asian | 12,520 | 3.6% |
| Black / African American | 52,366 | 15.2% |
| Hawaiian / Pacific | 452 | 0.1% |
| Hispanic or Latino | 31,382 | 9.1% |
| Native / Alaskan | 498 | 0.1% |
| White / Caucasian | 244,580 | 71.2% |
| Two or more Races | 23,101 | 6.7% |
| Some other Race | 10,210 | 3.0% |
| Total | 343,727 | 100.0% |
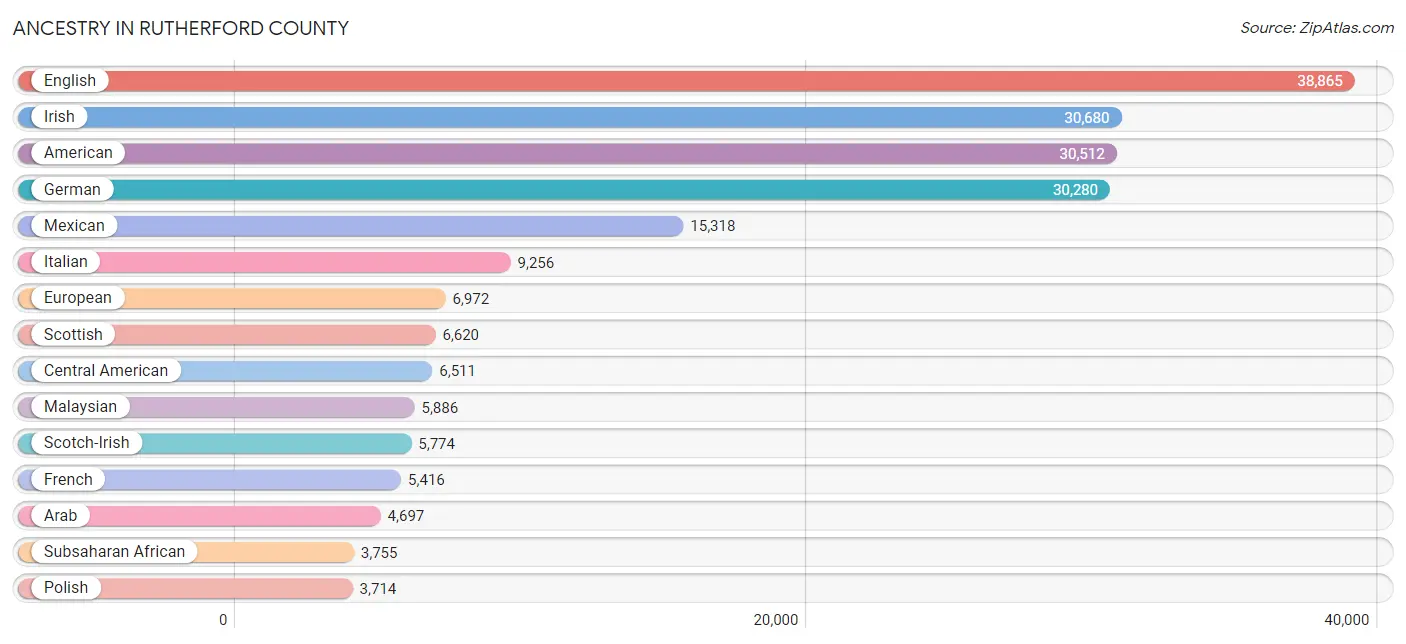
Ancestry in Rutherford County
The most populous ancestries reported in Rutherford County are English (38,865 | 11.3%), Irish (30,680 | 8.9%), American (30,512 | 8.9%), German (30,280 | 8.8%), and Mexican (15,318 | 4.5%), together accounting for 42.4% of all Rutherford County residents.
| Ancestry | # Population | % Population |
| African | 2,059 | 0.6% |
| American | 30,512 | 8.9% |
| Apache | 70 | 0.0% |
| Arab | 4,697 | 1.4% |
| Argentinean | 349 | 0.1% |
| Armenian | 235 | 0.1% |
| Assyrian / Chaldean / Syriac | 9 | 0.0% |
| Australian | 125 | 0.0% |
| Austrian | 542 | 0.2% |
| Bahamian | 25 | 0.0% |
| Bangladeshi | 41 | 0.0% |
| Belgian | 131 | 0.0% |
| Belizean | 54 | 0.0% |
| Bermudan | 8 | 0.0% |
| Bhutanese | 1,082 | 0.3% |
| Blackfeet | 171 | 0.1% |
| Brazilian | 42 | 0.0% |
| British | 1,836 | 0.5% |
| British West Indian | 47 | 0.0% |
| Bulgarian | 80 | 0.0% |
| Burmese | 1,082 | 0.3% |
| Cajun | 56 | 0.0% |
| Canadian | 154 | 0.0% |
| Celtic | 142 | 0.0% |
| Central American | 6,511 | 1.9% |
| Central American Indian | 270 | 0.1% |
| Cherokee | 1,303 | 0.4% |
| Chickasaw | 3 | 0.0% |
| Chilean | 11 | 0.0% |
| Choctaw | 32 | 0.0% |
| Colombian | 544 | 0.2% |
| Comanche | 6 | 0.0% |
| Costa Rican | 86 | 0.0% |
| Creek | 24 | 0.0% |
| Croatian | 152 | 0.0% |
| Cuban | 814 | 0.2% |
| Cypriot | 10 | 0.0% |
| Czech | 422 | 0.1% |
| Czechoslovakian | 140 | 0.0% |
| Danish | 344 | 0.1% |
| Dominican | 528 | 0.2% |
| Dutch | 2,259 | 0.7% |
| Dutch West Indian | 13 | 0.0% |
| Eastern European | 254 | 0.1% |
| Ecuadorian | 162 | 0.1% |
| Egyptian | 2,778 | 0.8% |
| English | 38,865 | 11.3% |
| Ethiopian | 606 | 0.2% |
| European | 6,972 | 2.0% |
| Filipino | 88 | 0.0% |
| Finnish | 773 | 0.2% |
| French | 5,416 | 1.6% |
| French American Indian | 26 | 0.0% |
| French Canadian | 889 | 0.3% |
| German | 30,280 | 8.8% |
| Ghanaian | 79 | 0.0% |
| Greek | 775 | 0.2% |
| Guatemalan | 2,090 | 0.6% |
| Haitian | 486 | 0.1% |
| Honduran | 1,935 | 0.6% |
| Hungarian | 822 | 0.2% |
| Icelander | 44 | 0.0% |
| Indian (Asian) | 1,565 | 0.5% |
| Indonesian | 1,219 | 0.4% |
| Iranian | 95 | 0.0% |
| Iraqi | 394 | 0.1% |
| Irish | 30,680 | 8.9% |
| Iroquois | 70 | 0.0% |
| Israeli | 16 | 0.0% |
| Italian | 9,256 | 2.7% |
| Jamaican | 402 | 0.1% |
| Japanese | 248 | 0.1% |
| Jordanian | 73 | 0.0% |
| Kenyan | 85 | 0.0% |
| Korean | 1,749 | 0.5% |
| Laotian | 53 | 0.0% |
| Latvian | 121 | 0.0% |
| Lebanese | 313 | 0.1% |
| Liberian | 19 | 0.0% |
| Lithuanian | 223 | 0.1% |
| Malaysian | 5,886 | 1.7% |
| Maltese | 46 | 0.0% |
| Mexican | 15,318 | 4.5% |
| Mexican American Indian | 139 | 0.0% |
| Moroccan | 29 | 0.0% |
| Native Hawaiian | 350 | 0.1% |
| Navajo | 80 | 0.0% |
| Nicaraguan | 40 | 0.0% |
| Nigerian | 538 | 0.2% |
| Northern European | 428 | 0.1% |
| Norwegian | 2,577 | 0.7% |
| Pakistani | 771 | 0.2% |
| Palestinian | 237 | 0.1% |
| Panamanian | 203 | 0.1% |
| Pennsylvania German | 78 | 0.0% |
| Peruvian | 448 | 0.1% |
| Polish | 3,714 | 1.1% |
| Portuguese | 267 | 0.1% |
| Potawatomi | 14 | 0.0% |
| Puerto Rican | 3,617 | 1.1% |
| Romanian | 235 | 0.1% |
| Russian | 831 | 0.2% |
| Salvadoran | 2,157 | 0.6% |
| Samoan | 378 | 0.1% |
| Scandinavian | 783 | 0.2% |
| Scotch-Irish | 5,774 | 1.7% |
| Scottish | 6,620 | 1.9% |
| Seminole | 28 | 0.0% |
| Serbian | 101 | 0.0% |
| Slavic | 33 | 0.0% |
| Slovak | 356 | 0.1% |
| Slovene | 95 | 0.0% |
| Somali | 3 | 0.0% |
| South African | 26 | 0.0% |
| South American | 2,799 | 0.8% |
| South American Indian | 11 | 0.0% |
| Spaniard | 357 | 0.1% |
| Spanish | 386 | 0.1% |
| Sri Lankan | 854 | 0.3% |
| Subsaharan African | 3,755 | 1.1% |
| Sudanese | 41 | 0.0% |
| Swedish | 1,595 | 0.5% |
| Swiss | 423 | 0.1% |
| Syrian | 33 | 0.0% |
| Thai | 1,322 | 0.4% |
| Tlingit-Haida | 13 | 0.0% |
| Trinidadian and Tobagonian | 78 | 0.0% |
| Turkish | 105 | 0.0% |
| U.S. Virgin Islander | 15 | 0.0% |
| Ugandan | 12 | 0.0% |
| Ukrainian | 317 | 0.1% |
| Venezuelan | 1,111 | 0.3% |
| Welsh | 1,930 | 0.6% |
| West Indian | 302 | 0.1% |
| Yugoslavian | 226 | 0.1% |
| Yup'ik | 7 | 0.0% | View All 136 Rows |
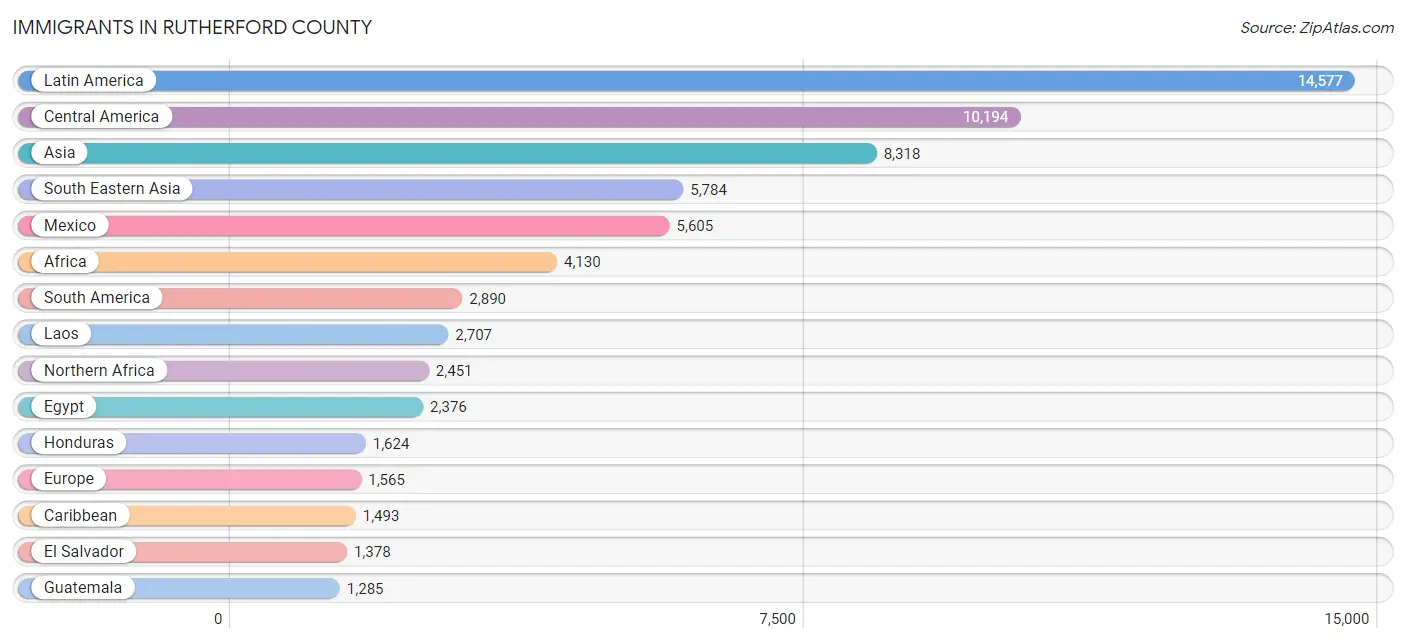
Immigrants in Rutherford County
The most numerous immigrant groups reported in Rutherford County came from Latin America (14,577 | 4.2%), Central America (10,194 | 3.0%), Asia (8,318 | 2.4%), South Eastern Asia (5,784 | 1.7%), and Mexico (5,605 | 1.6%), together accounting for 12.9% of all Rutherford County residents.
| Immigration Origin | # Population | % Population |
| Africa | 4,130 | 1.2% |
| Argentina | 161 | 0.1% |
| Asia | 8,318 | 2.4% |
| Australia | 78 | 0.0% |
| Bahamas | 83 | 0.0% |
| Belize | 7 | 0.0% |
| Bolivia | 36 | 0.0% |
| Bosnia and Herzegovina | 139 | 0.0% |
| Brazil | 692 | 0.2% |
| Cambodia | 18 | 0.0% |
| Canada | 578 | 0.2% |
| Caribbean | 1,493 | 0.4% |
| Central America | 10,194 | 3.0% |
| Chile | 13 | 0.0% |
| China | 566 | 0.2% |
| Colombia | 535 | 0.2% |
| Costa Rica | 74 | 0.0% |
| Croatia | 101 | 0.0% |
| Cuba | 533 | 0.2% |
| Czechoslovakia | 42 | 0.0% |
| Dominican Republic | 339 | 0.1% |
| Eastern Africa | 705 | 0.2% |
| Eastern Asia | 1,179 | 0.3% |
| Eastern Europe | 751 | 0.2% |
| Ecuador | 11 | 0.0% |
| Egypt | 2,376 | 0.7% |
| El Salvador | 1,378 | 0.4% |
| England | 131 | 0.0% |
| Ethiopia | 455 | 0.1% |
| Europe | 1,565 | 0.5% |
| France | 139 | 0.0% |
| Germany | 172 | 0.1% |
| Ghana | 116 | 0.0% |
| Greece | 26 | 0.0% |
| Guatemala | 1,285 | 0.4% |
| Haiti | 186 | 0.1% |
| Honduras | 1,624 | 0.5% |
| Hong Kong | 47 | 0.0% |
| Hungary | 34 | 0.0% |
| India | 299 | 0.1% |
| Indonesia | 53 | 0.0% |
| Iran | 45 | 0.0% |
| Iraq | 511 | 0.2% |
| Ireland | 36 | 0.0% |
| Israel | 3 | 0.0% |
| Italy | 79 | 0.0% |
| Jamaica | 325 | 0.1% |
| Japan | 311 | 0.1% |
| Jordan | 60 | 0.0% |
| Kenya | 63 | 0.0% |
| Korea | 302 | 0.1% |
| Kuwait | 93 | 0.0% |
| Laos | 2,707 | 0.8% |
| Latin America | 14,577 | 4.2% |
| Lebanon | 25 | 0.0% |
| Malaysia | 104 | 0.0% |
| Mexico | 5,605 | 1.6% |
| Middle Africa | 153 | 0.0% |
| Nepal | 52 | 0.0% |
| Netherlands | 46 | 0.0% |
| Nicaragua | 75 | 0.0% |
| Nigeria | 600 | 0.2% |
| Northern Africa | 2,451 | 0.7% |
| Northern Europe | 266 | 0.1% |
| Oceania | 105 | 0.0% |
| Panama | 146 | 0.0% |
| Peru | 270 | 0.1% |
| Philippines | 963 | 0.3% |
| Poland | 92 | 0.0% |
| Portugal | 17 | 0.0% |
| Romania | 150 | 0.0% |
| Russia | 127 | 0.0% |
| Saudi Arabia | 32 | 0.0% |
| South Africa | 26 | 0.0% |
| South America | 2,890 | 0.8% |
| South Central Asia | 396 | 0.1% |
| South Eastern Asia | 5,784 | 1.7% |
| Southern Europe | 191 | 0.1% |
| Spain | 69 | 0.0% |
| Sudan | 25 | 0.0% |
| Sweden | 8 | 0.0% |
| Syria | 91 | 0.0% |
| Taiwan | 21 | 0.0% |
| Thailand | 848 | 0.3% |
| Trinidad and Tobago | 27 | 0.0% |
| Turkey | 57 | 0.0% |
| Ukraine | 55 | 0.0% |
| Venezuela | 1,172 | 0.3% |
| Vietnam | 325 | 0.1% |
| Western Africa | 735 | 0.2% |
| Western Asia | 882 | 0.3% |
| Western Europe | 357 | 0.1% |
| Zaire | 153 | 0.0% | View All 93 Rows |
Sex and Age in Rutherford County
Sex and Age in Rutherford County
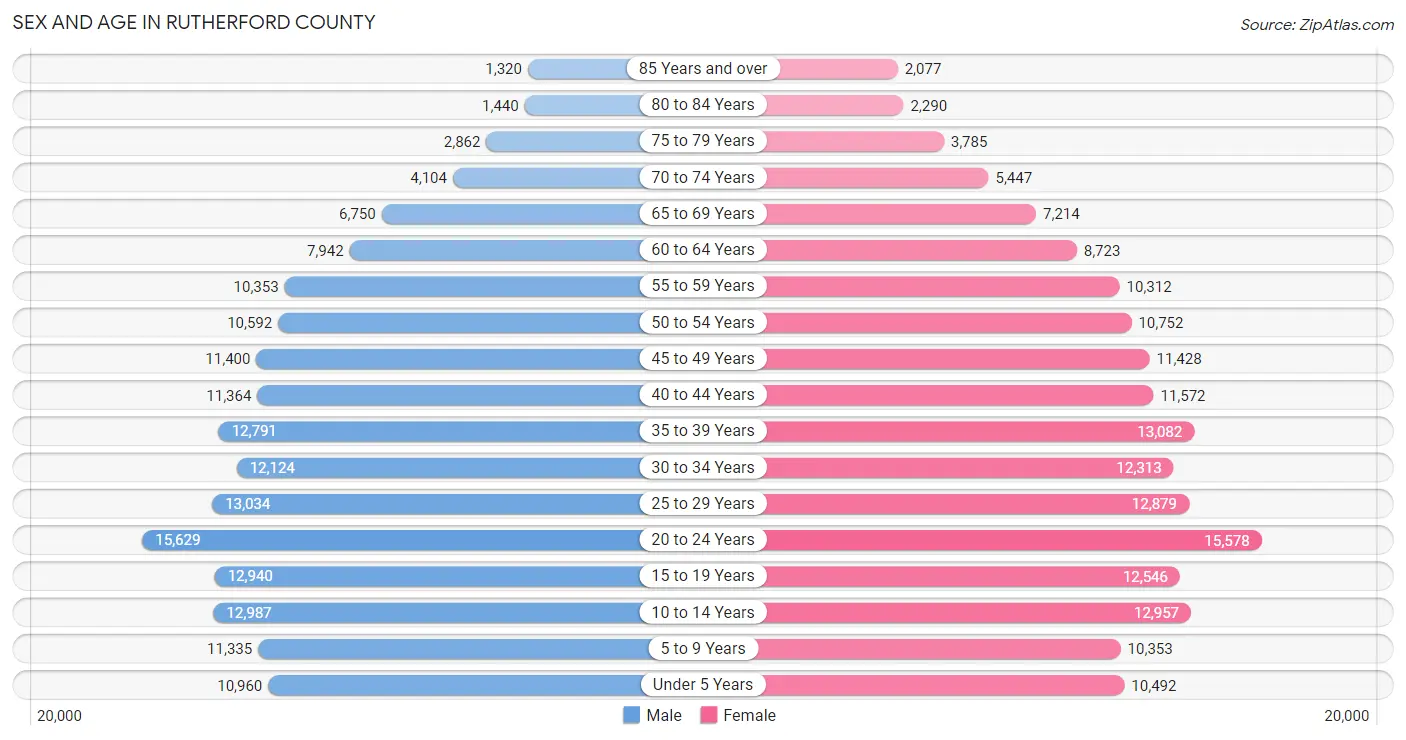
The most populous age groups in Rutherford County are 20 to 24 Years (15,629 | 9.2%) for men and 20 to 24 Years (15,578 | 9.0%) for women.
| Age Bracket | Male | Female |
| Under 5 Years | 10,960 (6.5%) | 10,492 (6.0%) |
| 5 to 9 Years | 11,335 (6.7%) | 10,353 (6.0%) |
| 10 to 14 Years | 12,987 (7.6%) | 12,957 (7.5%) |
| 15 to 19 Years | 12,940 (7.6%) | 12,546 (7.2%) |
| 20 to 24 Years | 15,629 (9.2%) | 15,578 (9.0%) |
| 25 to 29 Years | 13,034 (7.7%) | 12,879 (7.4%) |
| 30 to 34 Years | 12,124 (7.1%) | 12,313 (7.1%) |
| 35 to 39 Years | 12,791 (7.5%) | 13,082 (7.5%) |
| 40 to 44 Years | 11,364 (6.7%) | 11,572 (6.7%) |
| 45 to 49 Years | 11,400 (6.7%) | 11,428 (6.6%) |
| 50 to 54 Years | 10,592 (6.2%) | 10,752 (6.2%) |
| 55 to 59 Years | 10,353 (6.1%) | 10,312 (5.9%) |
| 60 to 64 Years | 7,942 (4.7%) | 8,723 (5.0%) |
| 65 to 69 Years | 6,750 (4.0%) | 7,214 (4.2%) |
| 70 to 74 Years | 4,104 (2.4%) | 5,447 (3.1%) |
| 75 to 79 Years | 2,862 (1.7%) | 3,785 (2.2%) |
| 80 to 84 Years | 1,440 (0.9%) | 2,290 (1.3%) |
| 85 Years and over | 1,320 (0.8%) | 2,077 (1.2%) |
| Total | 169,927 (100.0%) | 173,800 (100.0%) |
Families and Households in Rutherford County
Median Family Size in Rutherford County
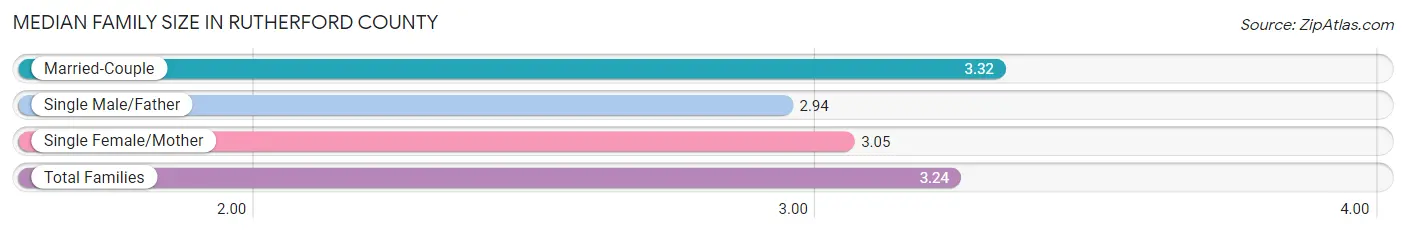
The median family size in Rutherford County is 3.24 persons per family, with married-couple families (63,277 | 74.1%) accounting for the largest median family size of 3.32 persons per family. On the other hand, single male/father families (7,175 | 8.4%) represent the smallest median family size with 2.94 persons per family.
| Family Type | # Families | Family Size |
| Married-Couple | 63,277 (74.1%) | 3.32 |
| Single Male/Father | 7,175 (8.4%) | 2.94 |
| Single Female/Mother | 14,988 (17.5%) | 3.05 |
| Total Families | 85,440 (100.0%) | 3.24 |
Median Household Size in Rutherford County
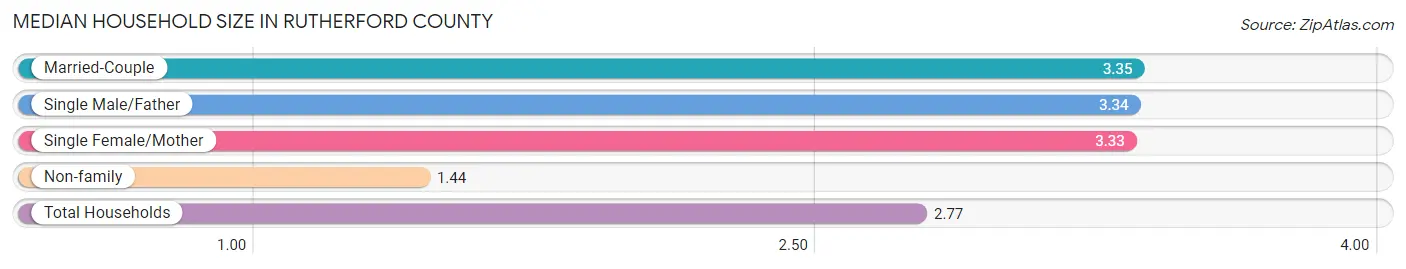
The median household size in Rutherford County is 2.77 persons per household, with married-couple households (63,277 | 51.6%) accounting for the largest median household size of 3.35 persons per household. non-family households (37,070 | 30.3%) represent the smallest median household size with 1.44 persons per household.
| Household Type | # Households | Household Size |
| Married-Couple | 63,277 (51.6%) | 3.35 |
| Single Male/Father | 7,175 (5.9%) | 3.34 |
| Single Female/Mother | 14,988 (12.2%) | 3.33 |
| Non-family | 37,070 (30.3%) | 1.44 |
| Total Households | 122,510 (100.0%) | 2.77 |
Household Size by Marriage Status in Rutherford County
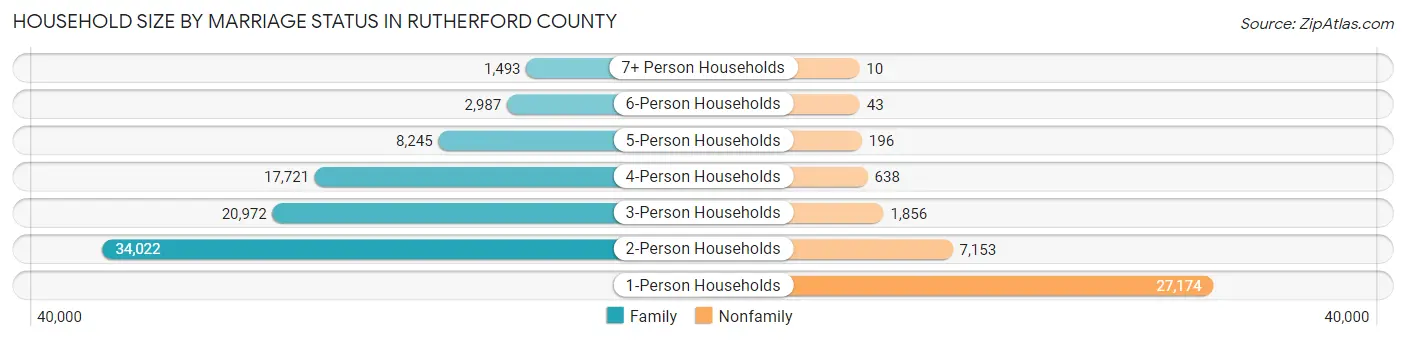
Out of a total of 122,510 households in Rutherford County, 85,440 (69.7%) are family households, while 37,070 (30.3%) are nonfamily households. The most numerous type of family households are 2-person households, comprising 34,022, and the most common type of nonfamily households are 1-person households, comprising 27,174.
| Household Size | Family Households | Nonfamily Households |
| 1-Person Households | - | 27,174 (22.2%) |
| 2-Person Households | 34,022 (27.8%) | 7,153 (5.8%) |
| 3-Person Households | 20,972 (17.1%) | 1,856 (1.5%) |
| 4-Person Households | 17,721 (14.5%) | 638 (0.5%) |
| 5-Person Households | 8,245 (6.7%) | 196 (0.2%) |
| 6-Person Households | 2,987 (2.4%) | 43 (0.0%) |
| 7+ Person Households | 1,493 (1.2%) | 10 (0.0%) |
| Total | 85,440 (69.7%) | 37,070 (30.3%) |
Female Fertility in Rutherford County
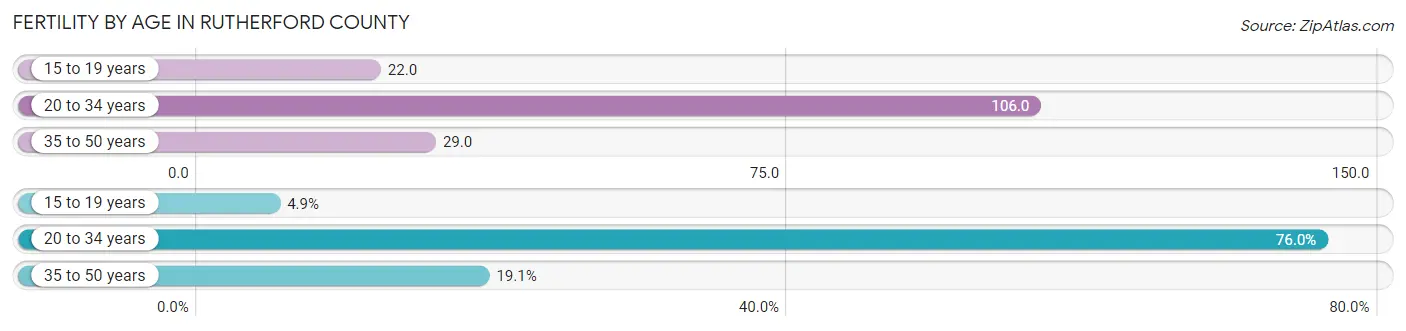
Fertility by Age in Rutherford County
Average fertility rate in Rutherford County is 62.0 births per 1,000 women. Women in the age bracket of 20 to 34 years have the highest fertility rate with 106.0 births per 1,000 women. Women in the age bracket of 20 to 34 years acount for 76.0% of all women with births.
| Age Bracket | Women with Births | Births / 1,000 Women |
| 15 to 19 years | 278 (4.9%) | 22.0 |
| 20 to 34 years | 4,312 (76.0%) | 106.0 |
| 35 to 50 years | 1,084 (19.1%) | 29.0 |
| Total | 5,674 (100.0%) | 62.0 |
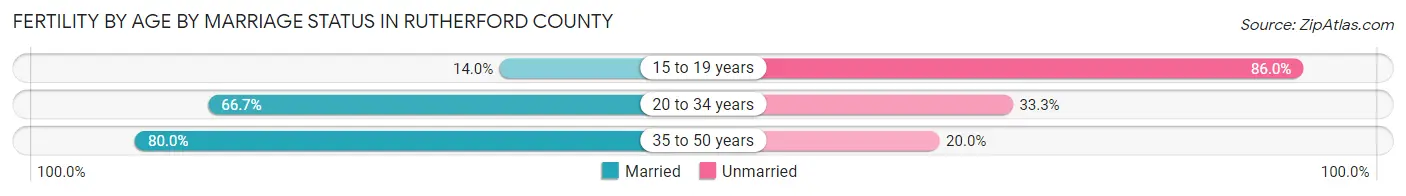
Fertility by Age by Marriage Status in Rutherford County
66.6% of women with births (5,674) in Rutherford County are married. The highest percentage of unmarried women with births falls into 15 to 19 years age bracket with 86.0% of them unmarried at the time of birth, while the lowest percentage of unmarried women with births belong to 35 to 50 years age bracket with 20.0% of them unmarried.
| Age Bracket | Married | Unmarried |
| 15 to 19 years | 39 (14.0%) | 239 (86.0%) |
| 20 to 34 years | 2,876 (66.7%) | 1,436 (33.3%) |
| 35 to 50 years | 867 (80.0%) | 217 (20.0%) |
| Total | 3,779 (66.6%) | 1,895 (33.4%) |
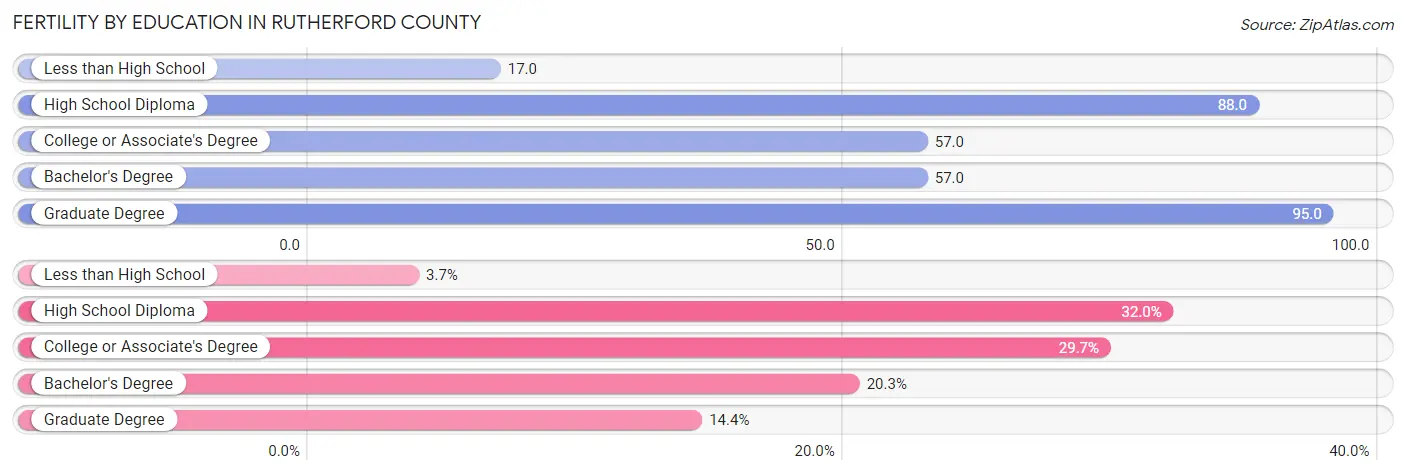
Fertility by Education in Rutherford County
Average fertility rate in Rutherford County is 62.0 births per 1,000 women. Women with the education attainment of graduate degree have the highest fertility rate of 95.0 births per 1,000 women, while women with the education attainment of less than high school have the lowest fertility at 17.0 births per 1,000 women. Women with the education attainment of high school diploma represent 32.0% of all women with births.
| Educational Attainment | Women with Births | Births / 1,000 Women |
| Less than High School | 212 (3.7%) | 17.0 |
| High School Diploma | 1,816 (32.0%) | 88.0 |
| College or Associate's Degree | 1,683 (29.7%) | 57.0 |
| Bachelor's Degree | 1,149 (20.3%) | 57.0 |
| Graduate Degree | 814 (14.3%) | 95.0 |
| Total | 5,674 (100.0%) | 62.0 |
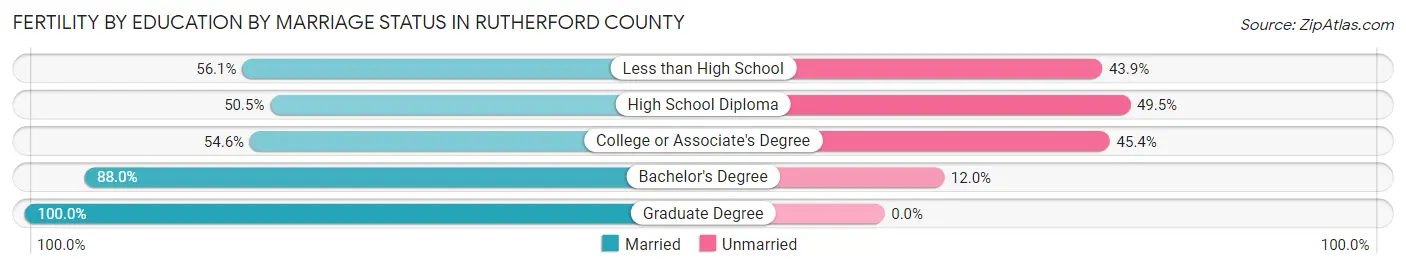
Fertility by Education by Marriage Status in Rutherford County
33.4% of women with births in Rutherford County are unmarried. Women with the educational attainment of graduate degree are most likely to be married with 100.0% of them married at childbirth, while women with the educational attainment of high school diploma are least likely to be married with 49.5% of them unmarried at childbirth.
| Educational Attainment | Married | Unmarried |
| Less than High School | 119 (56.1%) | 93 (43.9%) |
| High School Diploma | 917 (50.5%) | 899 (49.5%) |
| College or Associate's Degree | 919 (54.6%) | 764 (45.4%) |
| Bachelor's Degree | 1,011 (88.0%) | 138 (12.0%) |
| Graduate Degree | 814 (100.0%) | 0 (0.0%) |
| Total | 3,779 (66.6%) | 1,895 (33.4%) |
Income in Rutherford County
Income Overview in Rutherford County
Per Capita Income in Rutherford County is $35,135, while median incomes of families and households are $90,389 and $78,291 respectively.
| Characteristic | Number | Measure |
| Per Capita Income | 343,727 | $35,135 |
| Median Family Income | 85,440 | $90,389 |
| Mean Family Income | 85,440 | $107,651 |
| Median Household Income | 122,510 | $78,291 |
| Mean Household Income | 122,510 | $95,579 |
| Income Deficit | 85,440 | $10,491 |
| Wage / Income Gap (%) | 343,727 | 25.63% |
| Wage / Income Gap ($) | 343,727 | 74.37¢ per $1 |
| Gini / Inequality Index | 343,727 | 0.40 |
Earnings by Sex in Rutherford County
Average Earnings in Rutherford County are $40,459, $46,494 for men and $34,577 for women, a difference of 25.6%.
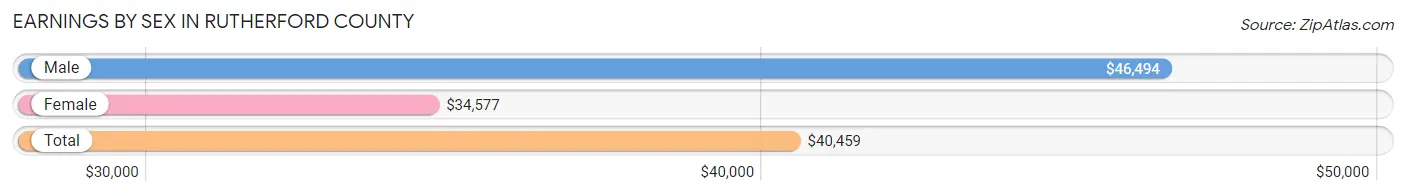
| Sex | Number | Average Earnings |
| Male | 105,907 (52.8%) | $46,494 |
| Female | 94,665 (47.2%) | $34,577 |
| Total | 200,572 (100.0%) | $40,459 |
Earnings by Sex by Income Bracket in Rutherford County
The most common earnings brackets in Rutherford County are $100,000+ for men (14,732 | 13.9%) and $55,000 to $64,999 for women (7,889 | 8.3%).
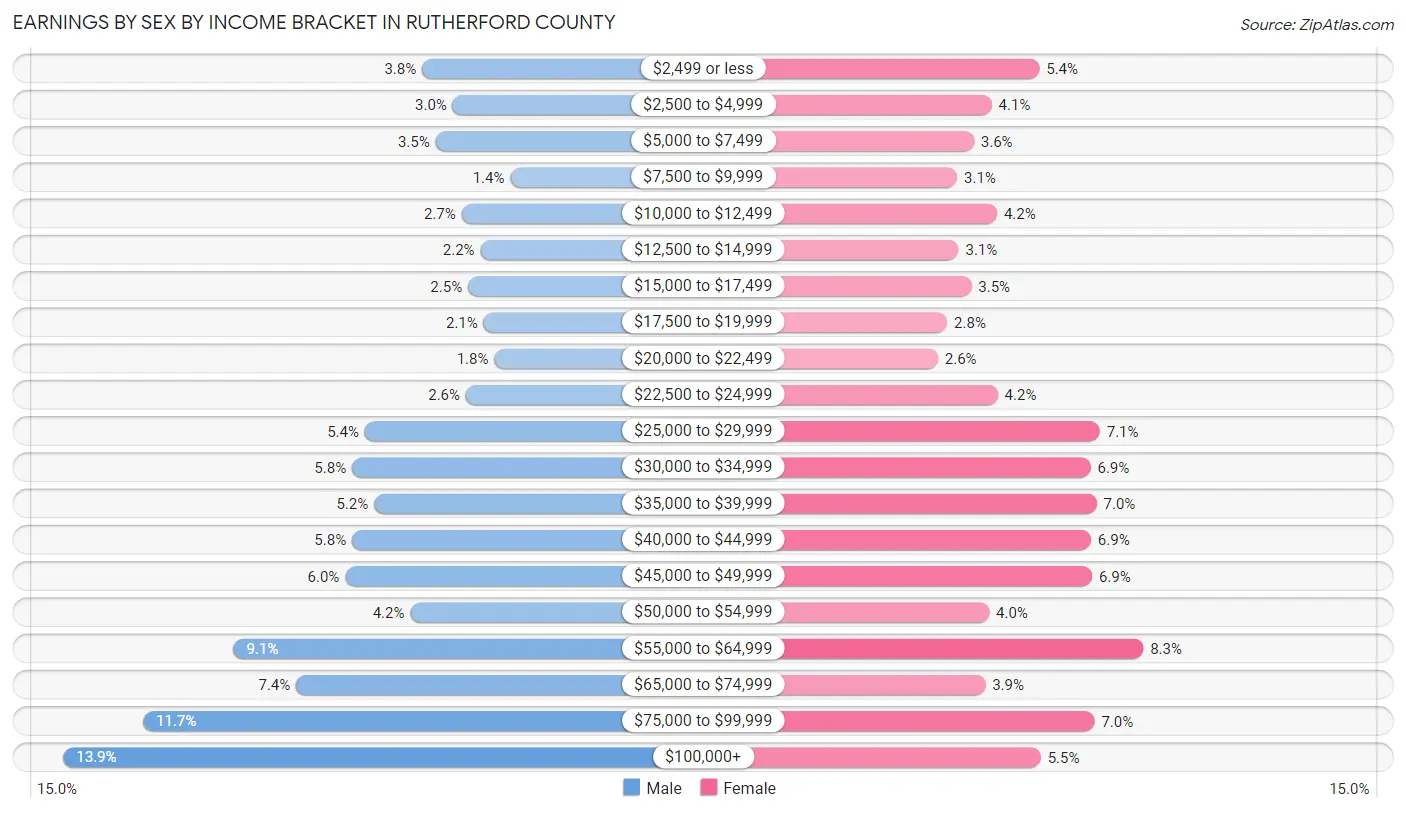
| Income | Male | Female |
| $2,499 or less | 4,052 (3.8%) | 5,122 (5.4%) |
| $2,500 to $4,999 | 3,145 (3.0%) | 3,853 (4.1%) |
| $5,000 to $7,499 | 3,649 (3.5%) | 3,375 (3.6%) |
| $7,500 to $9,999 | 1,434 (1.3%) | 2,938 (3.1%) |
| $10,000 to $12,499 | 2,881 (2.7%) | 3,991 (4.2%) |
| $12,500 to $14,999 | 2,322 (2.2%) | 2,973 (3.1%) |
| $15,000 to $17,499 | 2,690 (2.5%) | 3,314 (3.5%) |
| $17,500 to $19,999 | 2,220 (2.1%) | 2,670 (2.8%) |
| $20,000 to $22,499 | 1,911 (1.8%) | 2,419 (2.6%) |
| $22,500 to $24,999 | 2,756 (2.6%) | 4,018 (4.2%) |
| $25,000 to $29,999 | 5,765 (5.4%) | 6,733 (7.1%) |
| $30,000 to $34,999 | 6,142 (5.8%) | 6,484 (6.9%) |
| $35,000 to $39,999 | 5,481 (5.2%) | 6,648 (7.0%) |
| $40,000 to $44,999 | 6,143 (5.8%) | 6,498 (6.9%) |
| $45,000 to $49,999 | 6,349 (6.0%) | 6,527 (6.9%) |
| $50,000 to $54,999 | 4,405 (4.2%) | 3,789 (4.0%) |
| $55,000 to $64,999 | 9,672 (9.1%) | 7,889 (8.3%) |
| $65,000 to $74,999 | 7,801 (7.4%) | 3,679 (3.9%) |
| $75,000 to $99,999 | 12,357 (11.7%) | 6,584 (7.0%) |
| $100,000+ | 14,732 (13.9%) | 5,161 (5.4%) |
| Total | 105,907 (100.0%) | 94,665 (100.0%) |
Earnings by Sex by Educational Attainment in Rutherford County
Average earnings in Rutherford County are $55,478 for men and $40,679 for women, a difference of 26.7%. Men with an educational attainment of graduate degree enjoy the highest average annual earnings of $75,630, while those with less than high school education earn the least with $39,282. Women with an educational attainment of graduate degree earn the most with the average annual earnings of $59,847, while those with less than high school education have the smallest earnings of $30,575.
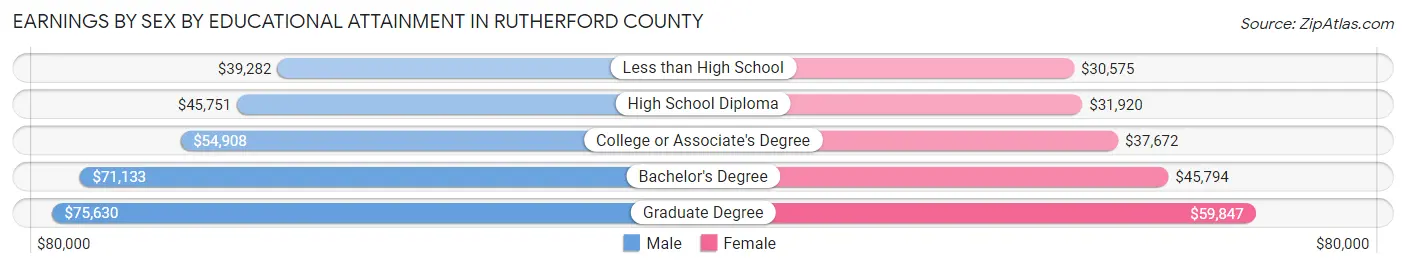
| Educational Attainment | Male Income | Female Income |
| Less than High School | $39,282 | $30,575 |
| High School Diploma | $45,751 | $31,920 |
| College or Associate's Degree | $54,908 | $37,672 |
| Bachelor's Degree | $71,133 | $45,794 |
| Graduate Degree | $75,630 | $59,847 |
| Total | $55,478 | $40,679 |
Family Income in Rutherford County
Family Income Brackets in Rutherford County
According to the Rutherford County family income data, there are 20,847 families falling into the $100,000 to $149,999 income range, which is the most common income bracket and makes up 24.4% of all families. Conversely, the $10,000 to $14,999 income bracket is the least frequent group with only 1,025 families (1.2%) belonging to this category.
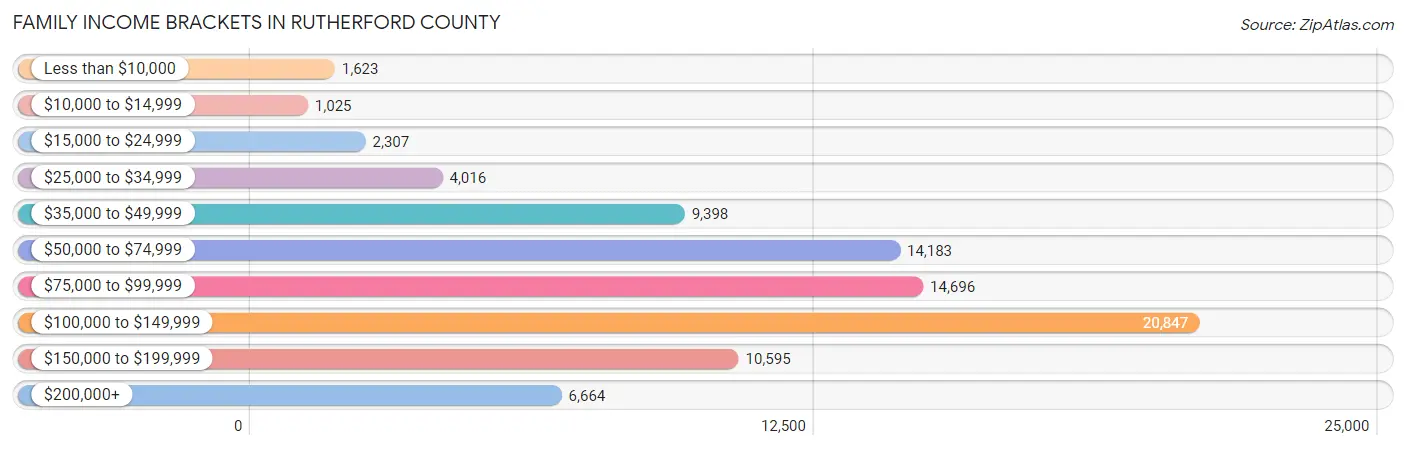
| Income Bracket | # Families | % Families |
| Less than $10,000 | 1,623 | 1.9% |
| $10,000 to $14,999 | 1,025 | 1.2% |
| $15,000 to $24,999 | 2,307 | 2.7% |
| $25,000 to $34,999 | 4,016 | 4.7% |
| $35,000 to $49,999 | 9,398 | 11.0% |
| $50,000 to $74,999 | 14,183 | 16.6% |
| $75,000 to $99,999 | 14,696 | 17.2% |
| $100,000 to $149,999 | 20,847 | 24.4% |
| $150,000 to $199,999 | 10,595 | 12.4% |
| $200,000+ | 6,664 | 7.8% |
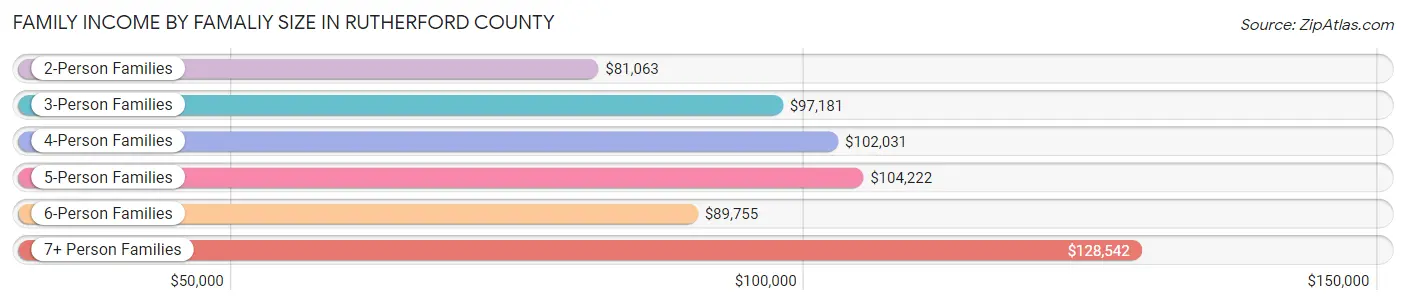
Family Income by Famaliy Size in Rutherford County
7+ person families (1,320 | 1.5%) account for the highest median family income in Rutherford County with $128,542 per family, while 2-person families (37,331 | 43.7%) have the highest median income of $40,532 per family member.
| Income Bracket | # Families | Median Income |
| 2-Person Families | 37,331 (43.7%) | $81,063 |
| 3-Person Families | 19,719 (23.1%) | $97,181 |
| 4-Person Families | 17,286 (20.2%) | $102,031 |
| 5-Person Families | 7,245 (8.5%) | $104,222 |
| 6-Person Families | 2,539 (3.0%) | $89,755 |
| 7+ Person Families | 1,320 (1.5%) | $128,542 |
| Total | 85,440 (100.0%) | $90,389 |
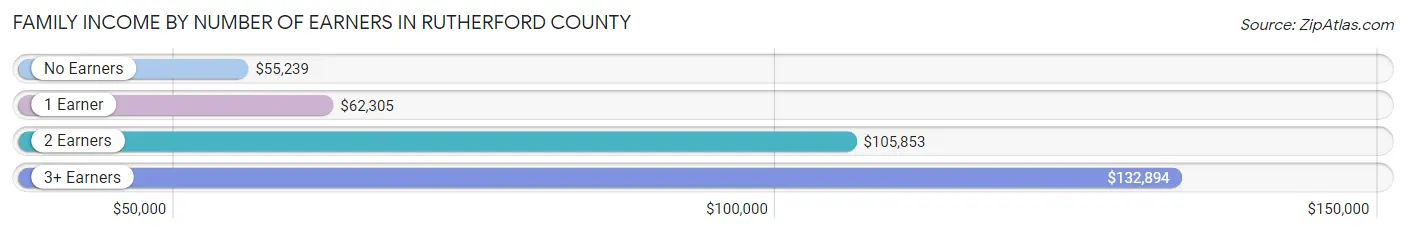
Family Income by Number of Earners in Rutherford County
The median family income in Rutherford County is $90,389, with families comprising 3+ earners (11,079) having the highest median family income of $132,894, while families with no earners (8,002) have the lowest median family income of $55,239, accounting for 13.0% and 9.4% of families, respectively.
| Number of Earners | # Families | Median Income |
| No Earners | 8,002 (9.4%) | $55,239 |
| 1 Earner | 25,400 (29.7%) | $62,305 |
| 2 Earners | 40,959 (47.9%) | $105,853 |
| 3+ Earners | 11,079 (13.0%) | $132,894 |
| Total | 85,440 (100.0%) | $90,389 |
Household Income in Rutherford County
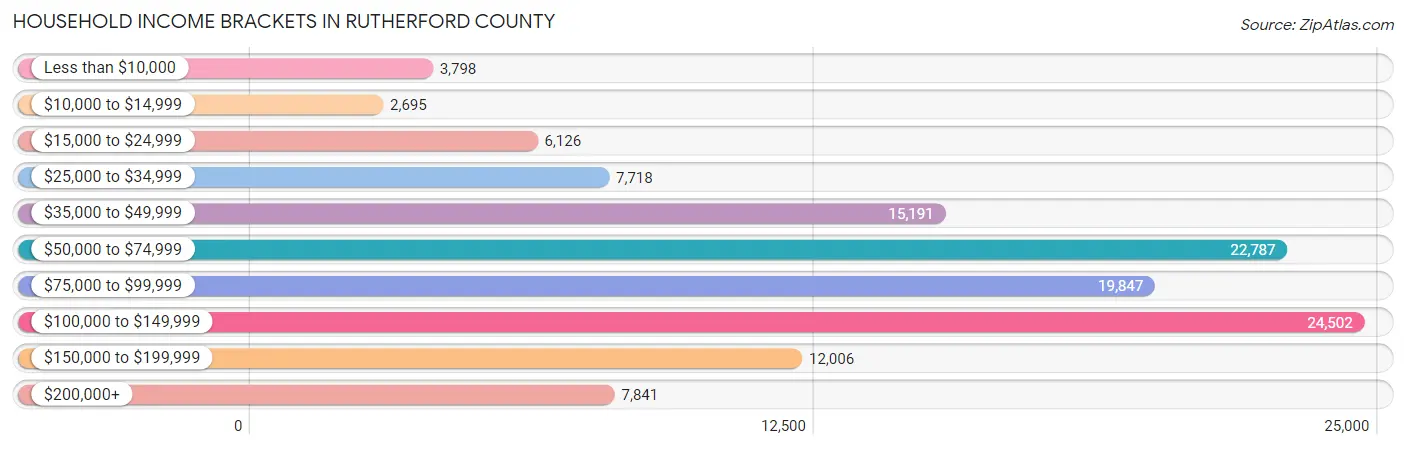
Household Income Brackets in Rutherford County
With 24,502 households falling in the category, the $100,000 to $149,999 income range is the most frequent in Rutherford County, accounting for 20.0% of all households. In contrast, only 2,695 households (2.2%) fall into the $10,000 to $14,999 income bracket, making it the least populous group.
| Income Bracket | # Households | % Households |
| Less than $10,000 | 3,798 | 3.1% |
| $10,000 to $14,999 | 2,695 | 2.2% |
| $15,000 to $24,999 | 6,126 | 5.0% |
| $25,000 to $34,999 | 7,718 | 6.3% |
| $35,000 to $49,999 | 15,191 | 12.4% |
| $50,000 to $74,999 | 22,787 | 18.6% |
| $75,000 to $99,999 | 19,847 | 16.2% |
| $100,000 to $149,999 | 24,502 | 20.0% |
| $150,000 to $199,999 | 12,006 | 9.8% |
| $200,000+ | 7,841 | 6.4% |
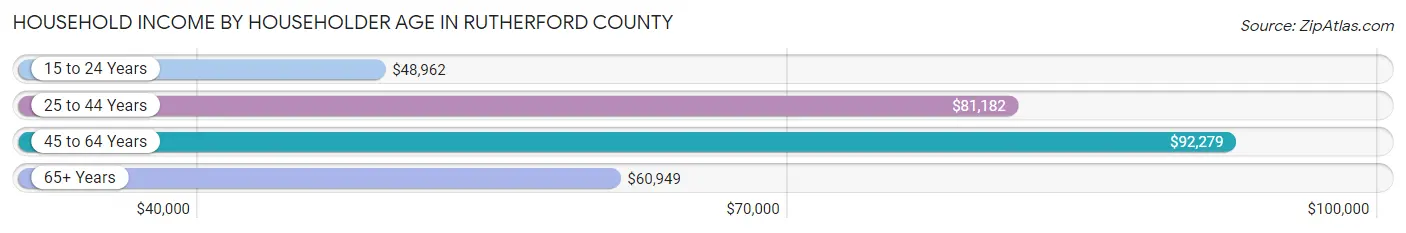
Household Income by Householder Age in Rutherford County
The median household income in Rutherford County is $78,291, with the highest median household income of $92,279 found in the 45 to 64 years age bracket for the primary householder. A total of 44,361 households (36.2%) fall into this category. Meanwhile, the 15 to 24 years age bracket for the primary householder has the lowest median household income of $48,962, with 7,771 households (6.3%) in this group.
| Income Bracket | # Households | Median Income |
| 15 to 24 Years | 7,771 (6.3%) | $48,962 |
| 25 to 44 Years | 47,740 (39.0%) | $81,182 |
| 45 to 64 Years | 44,361 (36.2%) | $92,279 |
| 65+ Years | 22,638 (18.5%) | $60,949 |
| Total | 122,510 (100.0%) | $78,291 |
Poverty in Rutherford County
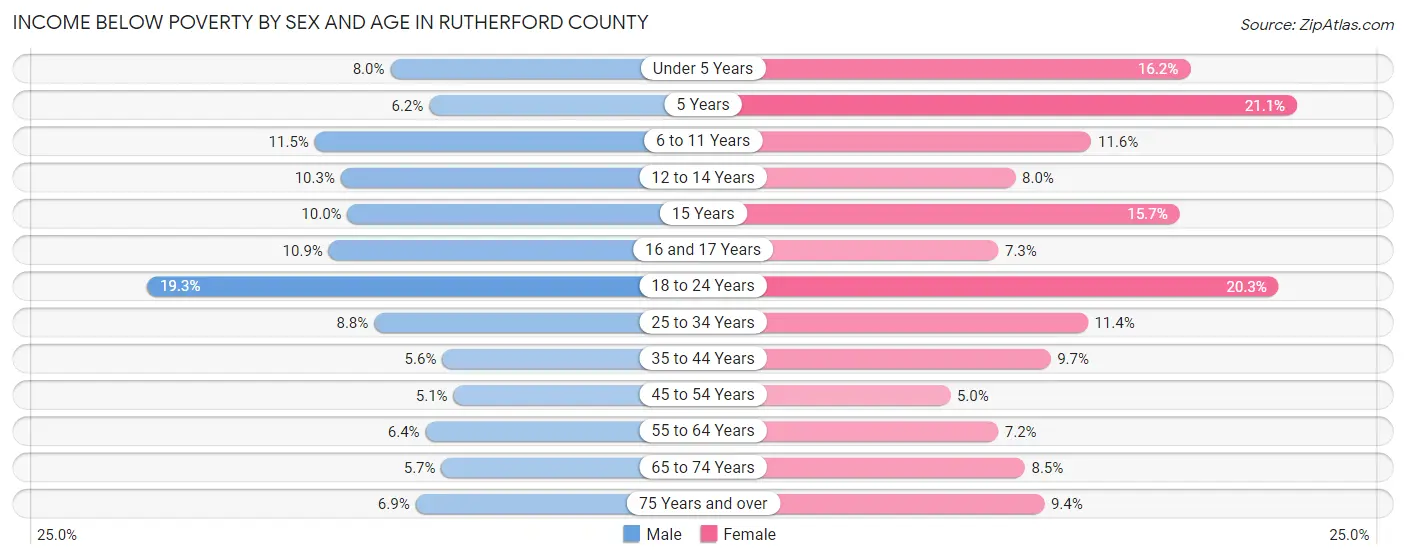
Income Below Poverty by Sex and Age in Rutherford County
With 8.8% poverty level for males and 10.8% for females among the residents of Rutherford County, 18 to 24 year old males and 5 year old females are the most vulnerable to poverty, with 3,774 males (19.3%) and 456 females (21.1%) in their respective age groups living below the poverty level.
| Age Bracket | Male | Female |
| Under 5 Years | 865 (8.0%) | 1,693 (16.2%) |
| 5 Years | 128 (6.2%) | 456 (21.1%) |
| 6 to 11 Years | 1,548 (11.5%) | 1,545 (11.6%) |
| 12 to 14 Years | 855 (10.3%) | 585 (8.0%) |
| 15 Years | 228 (10.0%) | 373 (15.7%) |
| 16 and 17 Years | 564 (10.9%) | 352 (7.2%) |
| 18 to 24 Years | 3,774 (19.3%) | 3,942 (20.3%) |
| 25 to 34 Years | 2,189 (8.8%) | 2,864 (11.4%) |
| 35 to 44 Years | 1,349 (5.6%) | 2,381 (9.7%) |
| 45 to 54 Years | 1,116 (5.1%) | 1,113 (5.0%) |
| 55 to 64 Years | 1,163 (6.4%) | 1,371 (7.2%) |
| 65 to 74 Years | 612 (5.7%) | 1,064 (8.5%) |
| 75 Years and over | 377 (6.9%) | 741 (9.4%) |
| Total | 14,768 (8.8%) | 18,480 (10.8%) |
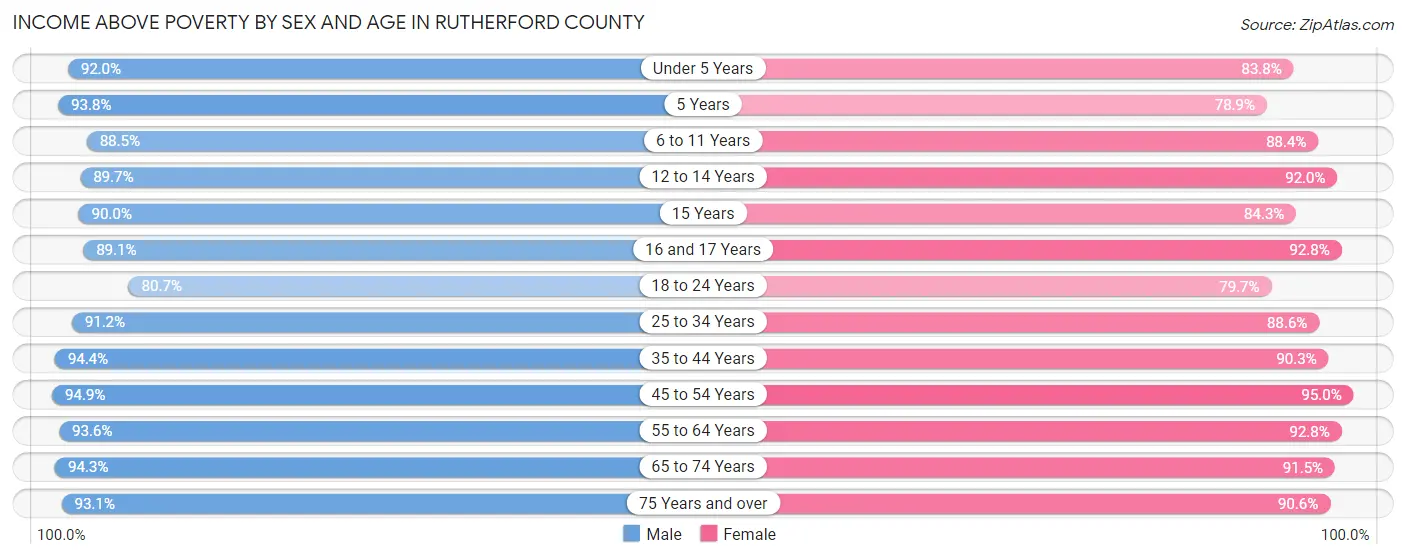
Income Above Poverty by Sex and Age in Rutherford County
According to the poverty statistics in Rutherford County, males aged 45 to 54 years and females aged 45 to 54 years are the age groups that are most secure financially, with 94.9% of males and 95.0% of females in these age groups living above the poverty line.
| Age Bracket | Male | Female |
| Under 5 Years | 9,909 (92.0%) | 8,784 (83.8%) |
| 5 Years | 1,928 (93.8%) | 1,703 (78.9%) |
| 6 to 11 Years | 11,867 (88.5%) | 11,813 (88.4%) |
| 12 to 14 Years | 7,418 (89.7%) | 6,694 (92.0%) |
| 15 Years | 2,048 (90.0%) | 2,008 (84.3%) |
| 16 and 17 Years | 4,615 (89.1%) | 4,501 (92.7%) |
| 18 to 24 Years | 15,759 (80.7%) | 15,510 (79.7%) |
| 25 to 34 Years | 22,732 (91.2%) | 22,268 (88.6%) |
| 35 to 44 Years | 22,640 (94.4%) | 22,231 (90.3%) |
| 45 to 54 Years | 20,779 (94.9%) | 21,066 (95.0%) |
| 55 to 64 Years | 17,014 (93.6%) | 17,577 (92.8%) |
| 65 to 74 Years | 10,205 (94.3%) | 11,489 (91.5%) |
| 75 Years and over | 5,121 (93.1%) | 7,156 (90.6%) |
| Total | 152,035 (91.1%) | 152,800 (89.2%) |
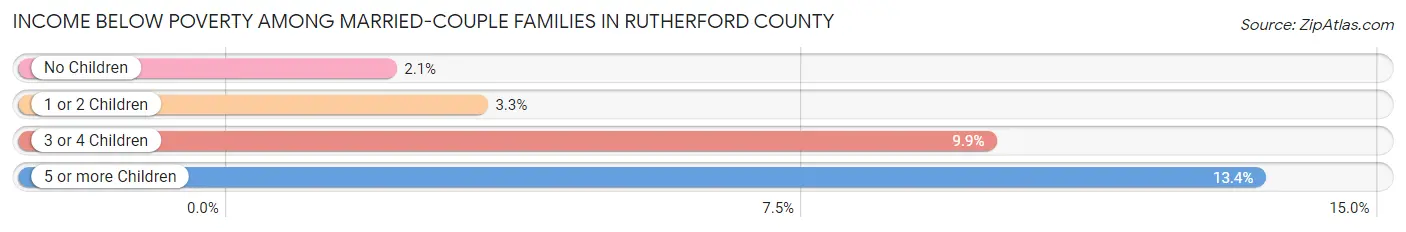
Income Below Poverty Among Married-Couple Families in Rutherford County
The poverty statistics for married-couple families in Rutherford County show that 3.4% or 2,121 of the total 63,277 families live below the poverty line. Families with 5 or more children have the highest poverty rate of 13.4%, comprising of 59 families. On the other hand, families with no children have the lowest poverty rate of 2.1%, which includes 704 families.
| Children | Above Poverty | Below Poverty |
| No Children | 33,113 (97.9%) | 704 (2.1%) |
| 1 or 2 Children | 22,100 (96.7%) | 747 (3.3%) |
| 3 or 4 Children | 5,562 (90.1%) | 611 (9.9%) |
| 5 or more Children | 381 (86.6%) | 59 (13.4%) |
| Total | 61,156 (96.7%) | 2,121 (3.4%) |
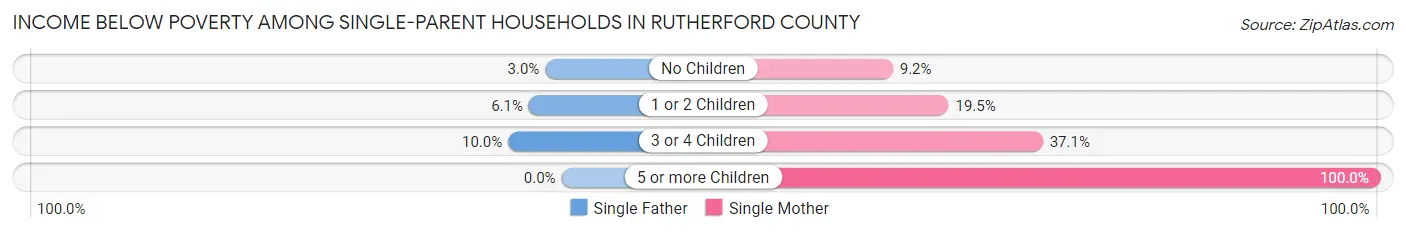
Income Below Poverty Among Single-Parent Households in Rutherford County
According to the poverty data in Rutherford County, 5.2% or 370 single-father households and 17.8% or 2,663 single-mother households are living below the poverty line. Among single-father households, those with 3 or 4 children have the highest poverty rate, with 69 households (10.0%) experiencing poverty. Likewise, among single-mother households, those with 5 or more children have the highest poverty rate, with 77 households (100.0%) falling below the poverty line.
| Children | Single Father | Single Mother |
| No Children | 91 (3.0%) | 449 (9.1%) |
| 1 or 2 Children | 210 (6.1%) | 1,751 (19.5%) |
| 3 or 4 Children | 69 (10.0%) | 386 (37.1%) |
| 5 or more Children | 0 (0.0%) | 77 (100.0%) |
| Total | 370 (5.2%) | 2,663 (17.8%) |
Income Below Poverty Among Married-Couple vs Single-Parent Households in Rutherford County
The poverty data for Rutherford County shows that 2,121 of the married-couple family households (3.4%) and 3,033 of the single-parent households (13.7%) are living below the poverty level. Within the married-couple family households, those with 5 or more children have the highest poverty rate, with 59 households (13.4%) falling below the poverty line. Among the single-parent households, those with 5 or more children have the highest poverty rate, with 77 household (73.3%) living below poverty.
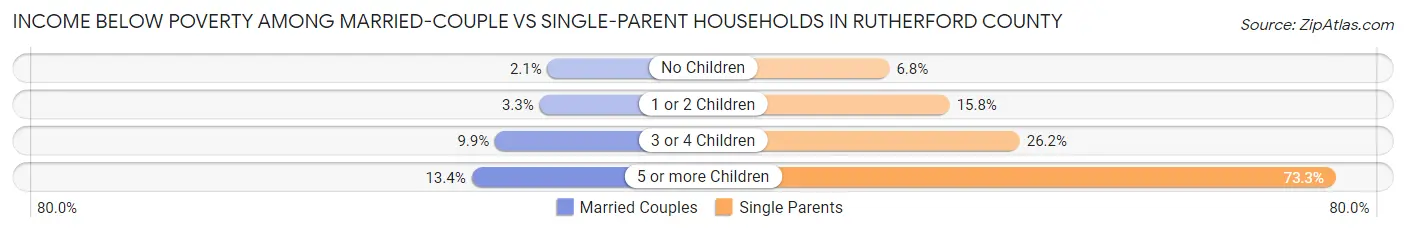
| Children | Married-Couple Families | Single-Parent Households |
| No Children | 704 (2.1%) | 540 (6.8%) |
| 1 or 2 Children | 747 (3.3%) | 1,961 (15.8%) |
| 3 or 4 Children | 611 (9.9%) | 455 (26.2%) |
| 5 or more Children | 59 (13.4%) | 77 (73.3%) |
| Total | 2,121 (3.4%) | 3,033 (13.7%) |
Employment Characteristics in Rutherford County
Employment by Class of Employer in Rutherford County
Among the 180,732 employed individuals in Rutherford County, private company employees (131,151 | 72.6%), local government employees (11,177 | 6.2%), and not-for-profit organizations (11,147 | 6.2%) make up the most common classes of employment.
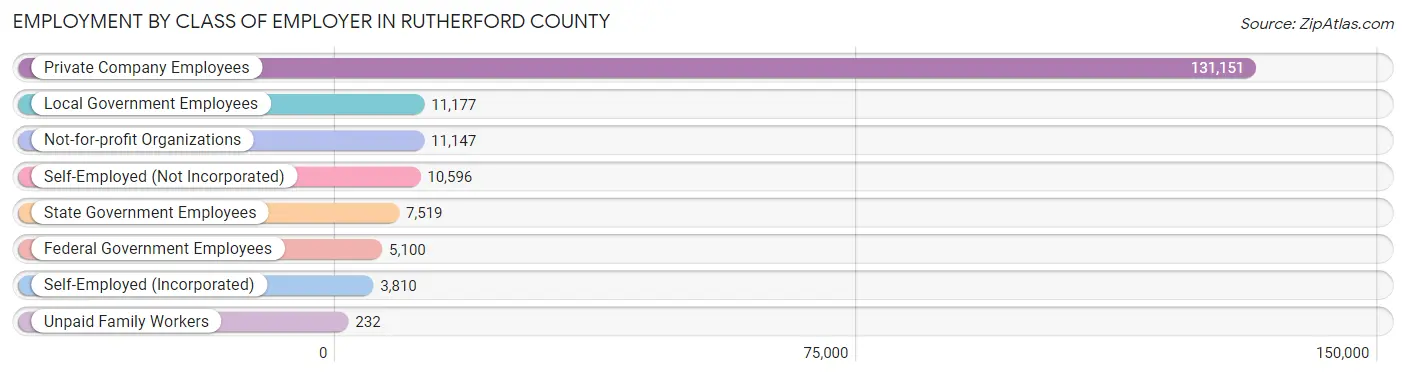
| Employer Class | # Employees | % Employees |
| Private Company Employees | 131,151 | 72.6% |
| Self-Employed (Incorporated) | 3,810 | 2.1% |
| Self-Employed (Not Incorporated) | 10,596 | 5.9% |
| Not-for-profit Organizations | 11,147 | 6.2% |
| Local Government Employees | 11,177 | 6.2% |
| State Government Employees | 7,519 | 4.2% |
| Federal Government Employees | 5,100 | 2.8% |
| Unpaid Family Workers | 232 | 0.1% |
| Total | 180,732 | 100.0% |
Employment Status by Age in Rutherford County
According to the labor force statistics for Rutherford County, out of the total population over 16 years of age (269,959), 71.2% or 192,211 individuals are in the labor force, with 3.9% or 7,496 of them unemployed. The age group with the highest labor force participation rate is 25 to 29 years, with 87.7% or 22,726 individuals in the labor force. Within the labor force, the 16 to 19 years age range has the highest percentage of unemployed individuals, with 12.3% or 1,154 of them being unemployed.
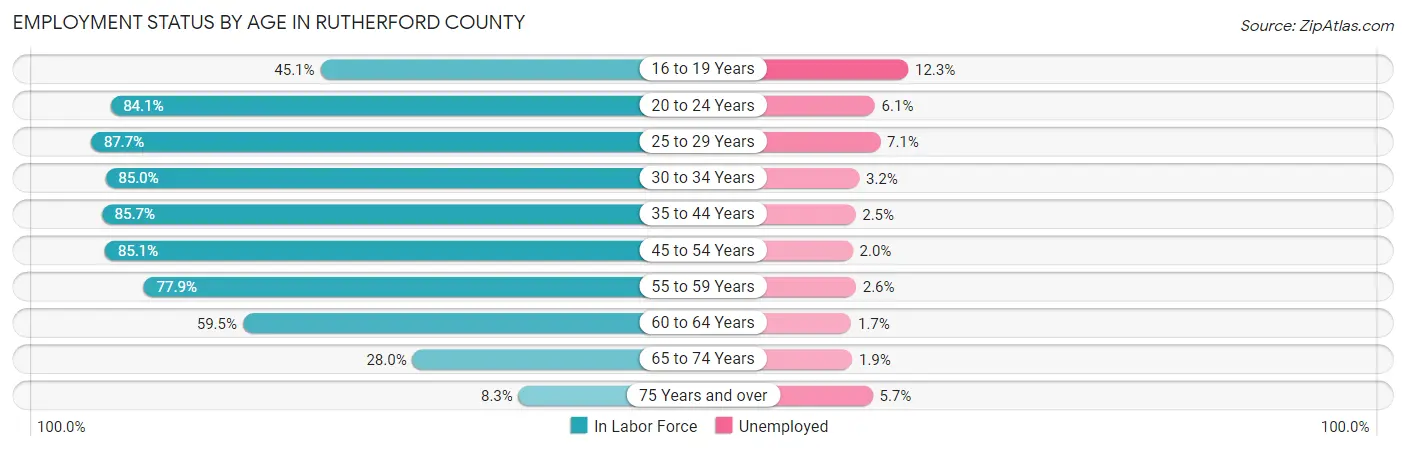
| Age Bracket | In Labor Force | Unemployed |
| 16 to 19 Years | 9,382 (45.1%) | 1,154 (12.3%) |
| 20 to 24 Years | 26,245 (84.1%) | 1,601 (6.1%) |
| 25 to 29 Years | 22,726 (87.7%) | 1,614 (7.1%) |
| 30 to 34 Years | 20,771 (85.0%) | 665 (3.2%) |
| 35 to 44 Years | 41,829 (85.7%) | 1,046 (2.5%) |
| 45 to 54 Years | 37,590 (85.1%) | 752 (2.0%) |
| 55 to 59 Years | 16,098 (77.9%) | 419 (2.6%) |
| 60 to 64 Years | 9,916 (59.5%) | 169 (1.7%) |
| 65 to 74 Years | 6,584 (28.0%) | 125 (1.9%) |
| 75 Years and over | 1,143 (8.3%) | 65 (5.7%) |
| Total | 192,211 (71.2%) | 7,496 (3.9%) |
Employment Status by Educational Attainment in Rutherford County
According to labor force statistics for Rutherford County, 82.4% of individuals (148,865) out of the total population between 25 and 64 years of age (180,661) are in the labor force, with 3.1% or 4,615 of them being unemployed. The group with the highest labor force participation rate are those with the educational attainment of bachelor's degree or higher, with 88.2% or 55,722 individuals in the labor force. Within the labor force, individuals with less than high school education have the highest percentage of unemployment, with 6.2% or 461 of them being unemployed.
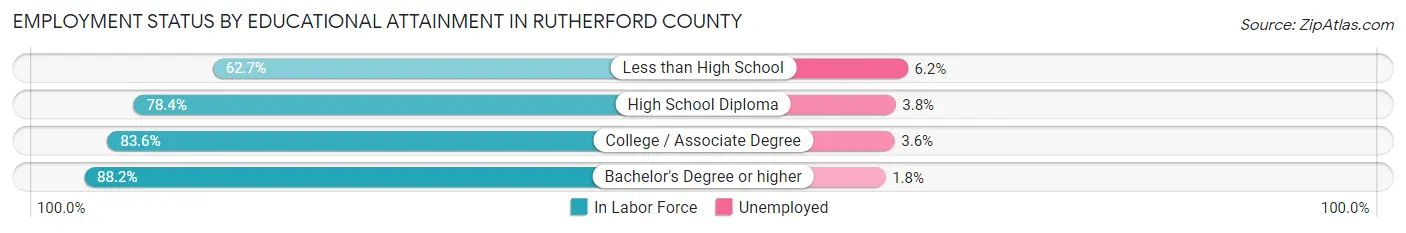
| Educational Attainment | In Labor Force | Unemployed |
| Less than High School | 7,436 (62.7%) | 735 (6.2%) |
| High School Diploma | 37,539 (78.4%) | 1,819 (3.8%) |
| College / Associate Degree | 48,273 (83.6%) | 2,079 (3.6%) |
| Bachelor's Degree or higher | 55,722 (88.2%) | 1,137 (1.8%) |
| Total | 148,865 (82.4%) | 5,600 (3.1%) |
Employment Occupations by Sex in Rutherford County
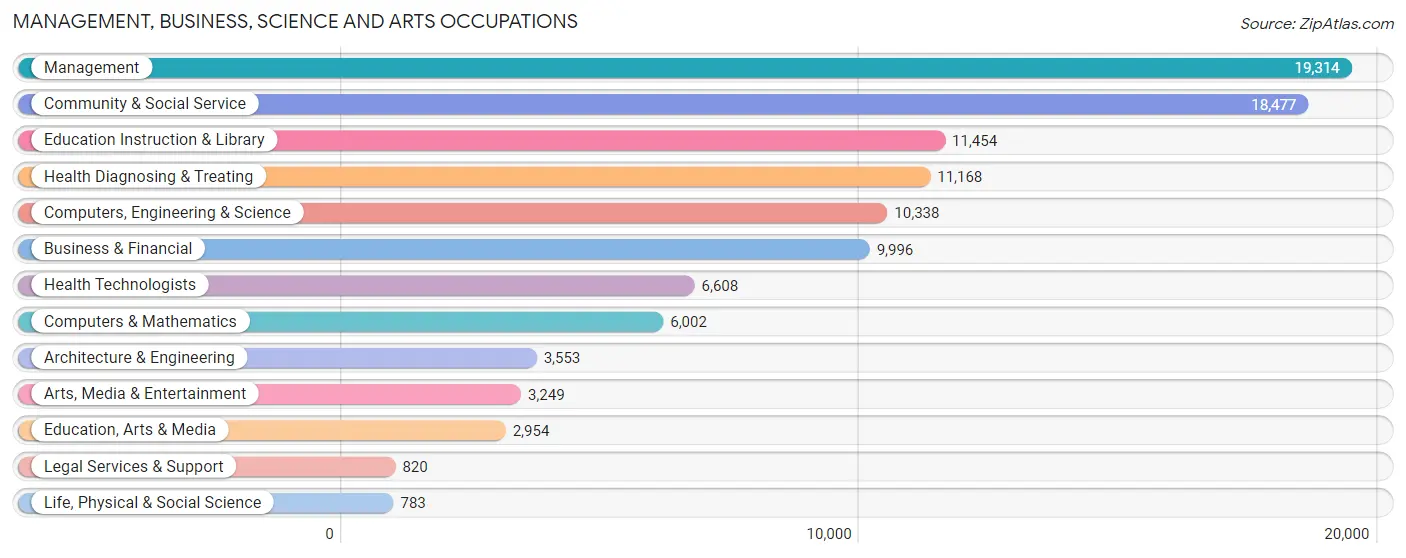
Management, Business, Science and Arts Occupations
The most common Management, Business, Science and Arts occupations in Rutherford County are Management (19,314 | 10.5%), Community & Social Service (18,477 | 10.0%), Education Instruction & Library (11,454 | 6.2%), Health Diagnosing & Treating (11,168 | 6.1%), and Computers, Engineering & Science (10,338 | 5.6%).
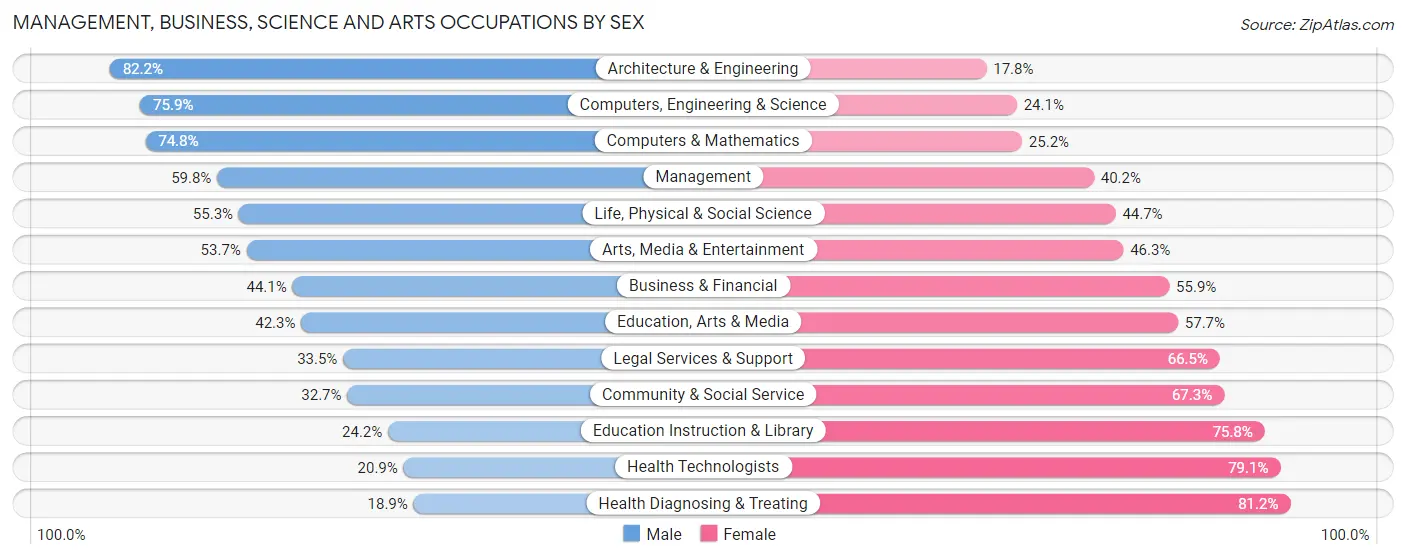
Management, Business, Science and Arts Occupations by Sex
Within the Management, Business, Science and Arts occupations in Rutherford County, the most male-oriented occupations are Architecture & Engineering (82.2%), Computers, Engineering & Science (75.9%), and Computers & Mathematics (74.8%), while the most female-oriented occupations are Health Diagnosing & Treating (81.1%), Health Technologists (79.1%), and Education Instruction & Library (75.8%).
| Occupation | Male | Female |
| Management | 11,554 (59.8%) | 7,760 (40.2%) |
| Business & Financial | 4,408 (44.1%) | 5,588 (55.9%) |
| Computers, Engineering & Science | 7,845 (75.9%) | 2,493 (24.1%) |
| Computers & Mathematics | 4,490 (74.8%) | 1,512 (25.2%) |
| Architecture & Engineering | 2,922 (82.2%) | 631 (17.8%) |
| Life, Physical & Social Science | 433 (55.3%) | 350 (44.7%) |
| Community & Social Service | 6,037 (32.7%) | 12,440 (67.3%) |
| Education, Arts & Media | 1,249 (42.3%) | 1,705 (57.7%) |
| Legal Services & Support | 275 (33.5%) | 545 (66.5%) |
| Education Instruction & Library | 2,769 (24.2%) | 8,685 (75.8%) |
| Arts, Media & Entertainment | 1,744 (53.7%) | 1,505 (46.3%) |
| Health Diagnosing & Treating | 2,105 (18.9%) | 9,063 (81.1%) |
| Health Technologists | 1,383 (20.9%) | 5,225 (79.1%) |
| Total (Category) | 31,949 (46.1%) | 37,344 (53.9%) |
| Total (Overall) | 97,500 (53.0%) | 86,520 (47.0%) |
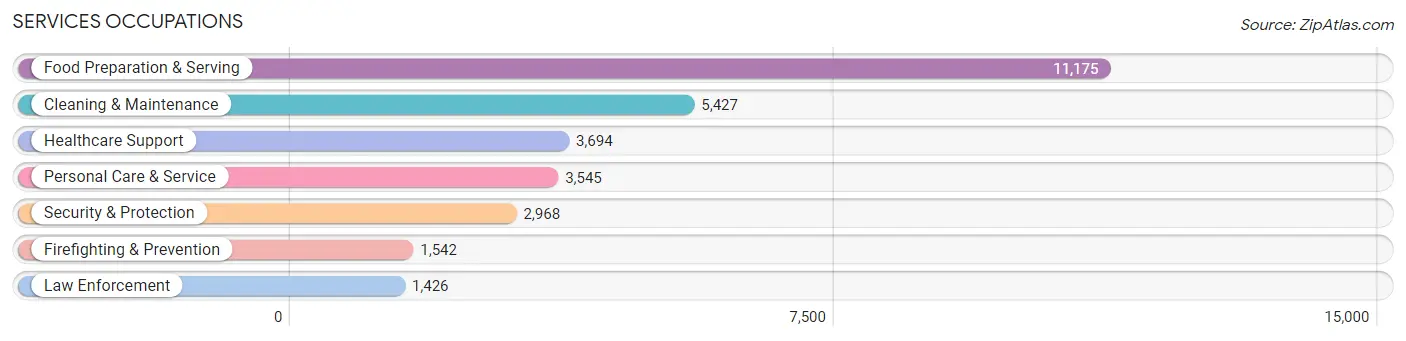
Services Occupations
The most common Services occupations in Rutherford County are Food Preparation & Serving (11,175 | 6.1%), Cleaning & Maintenance (5,427 | 2.9%), Healthcare Support (3,694 | 2.0%), Personal Care & Service (3,545 | 1.9%), and Security & Protection (2,968 | 1.6%).
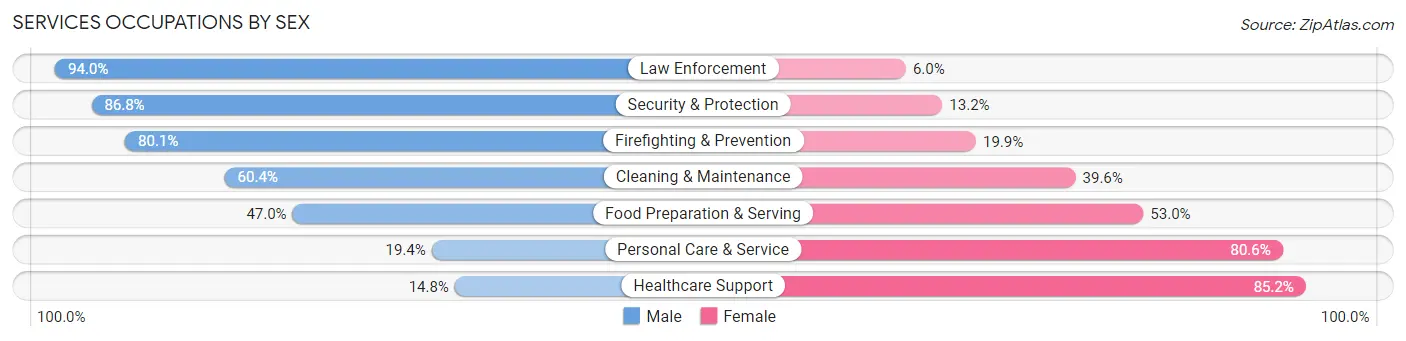
Services Occupations by Sex
Within the Services occupations in Rutherford County, the most male-oriented occupations are Law Enforcement (94.0%), Security & Protection (86.8%), and Firefighting & Prevention (80.1%), while the most female-oriented occupations are Healthcare Support (85.2%), Personal Care & Service (80.6%), and Food Preparation & Serving (53.0%).
| Occupation | Male | Female |
| Healthcare Support | 548 (14.8%) | 3,146 (85.2%) |
| Security & Protection | 2,575 (86.8%) | 393 (13.2%) |
| Firefighting & Prevention | 1,235 (80.1%) | 307 (19.9%) |
| Law Enforcement | 1,340 (94.0%) | 86 (6.0%) |
| Food Preparation & Serving | 5,248 (47.0%) | 5,927 (53.0%) |
| Cleaning & Maintenance | 3,277 (60.4%) | 2,150 (39.6%) |
| Personal Care & Service | 688 (19.4%) | 2,857 (80.6%) |
| Total (Category) | 12,336 (46.0%) | 14,473 (54.0%) |
| Total (Overall) | 97,500 (53.0%) | 86,520 (47.0%) |
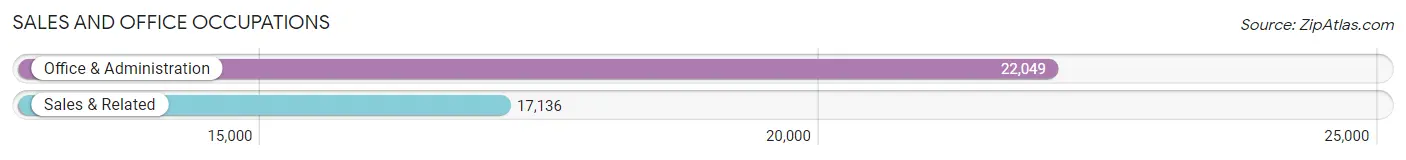
Sales and Office Occupations
The most common Sales and Office occupations in Rutherford County are Office & Administration (22,049 | 12.0%), and Sales & Related (17,136 | 9.3%).
Sales and Office Occupations by Sex
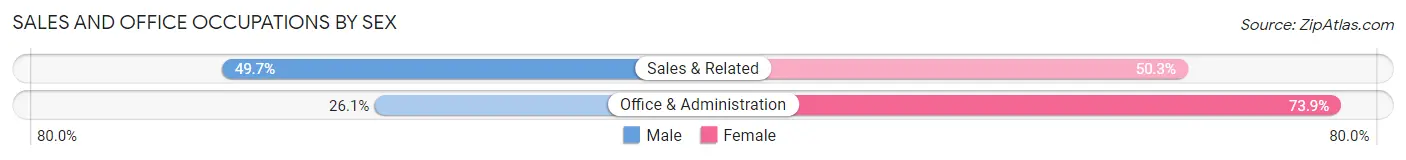
| Occupation | Male | Female |
| Sales & Related | 8,510 (49.7%) | 8,626 (50.3%) |
| Office & Administration | 5,748 (26.1%) | 16,301 (73.9%) |
| Total (Category) | 14,258 (36.4%) | 24,927 (63.6%) |
| Total (Overall) | 97,500 (53.0%) | 86,520 (47.0%) |
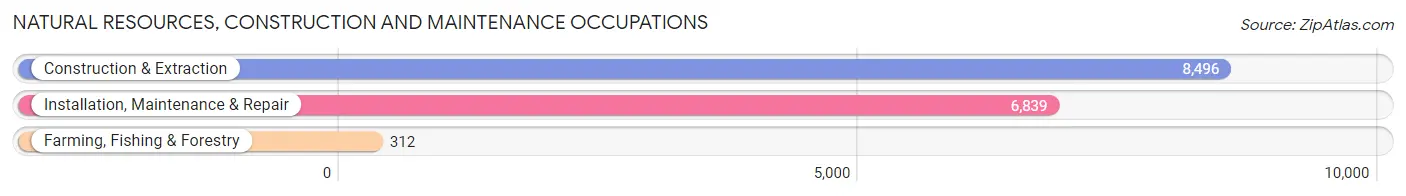
Natural Resources, Construction and Maintenance Occupations
The most common Natural Resources, Construction and Maintenance occupations in Rutherford County are Construction & Extraction (8,496 | 4.6%), Installation, Maintenance & Repair (6,839 | 3.7%), and Farming, Fishing & Forestry (312 | 0.2%).
Natural Resources, Construction and Maintenance Occupations by Sex
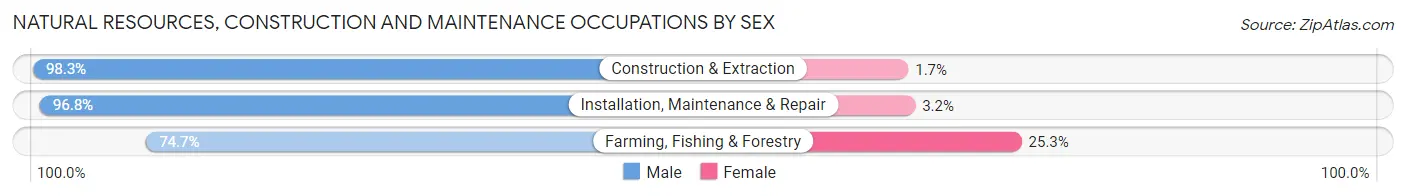
| Occupation | Male | Female |
| Farming, Fishing & Forestry | 233 (74.7%) | 79 (25.3%) |
| Construction & Extraction | 8,348 (98.3%) | 148 (1.7%) |
| Installation, Maintenance & Repair | 6,621 (96.8%) | 218 (3.2%) |
| Total (Category) | 15,202 (97.2%) | 445 (2.8%) |
| Total (Overall) | 97,500 (53.0%) | 86,520 (47.0%) |
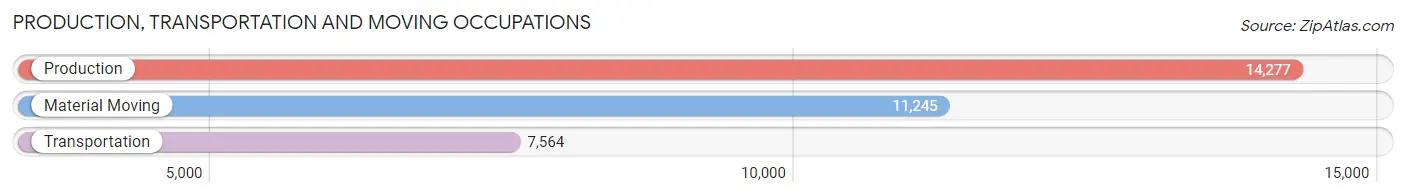
Production, Transportation and Moving Occupations
The most common Production, Transportation and Moving occupations in Rutherford County are Production (14,277 | 7.8%), Material Moving (11,245 | 6.1%), and Transportation (7,564 | 4.1%).
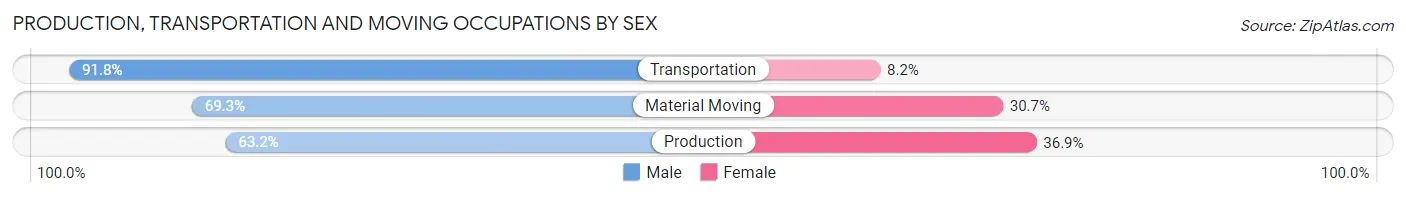
Production, Transportation and Moving Occupations by Sex
| Occupation | Male | Female |
| Production | 9,016 (63.1%) | 5,261 (36.8%) |
| Transportation | 6,945 (91.8%) | 619 (8.2%) |
| Material Moving | 7,794 (69.3%) | 3,451 (30.7%) |
| Total (Category) | 23,755 (71.8%) | 9,331 (28.2%) |
| Total (Overall) | 97,500 (53.0%) | 86,520 (47.0%) |
Employment Industries by Sex in Rutherford County
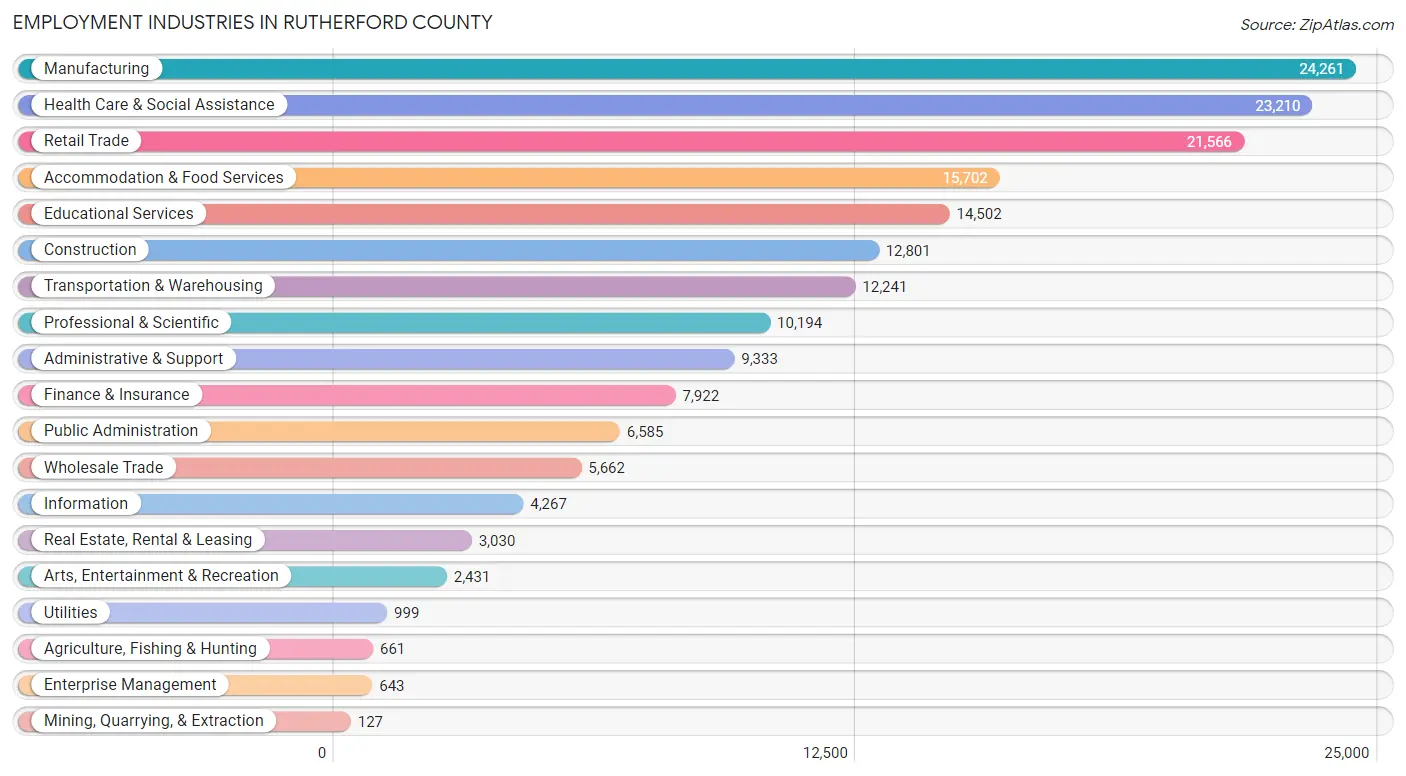
Employment Industries in Rutherford County
The major employment industries in Rutherford County include Manufacturing (24,261 | 13.2%), Health Care & Social Assistance (23,210 | 12.6%), Retail Trade (21,566 | 11.7%), Accommodation & Food Services (15,702 | 8.5%), and Educational Services (14,502 | 7.9%).
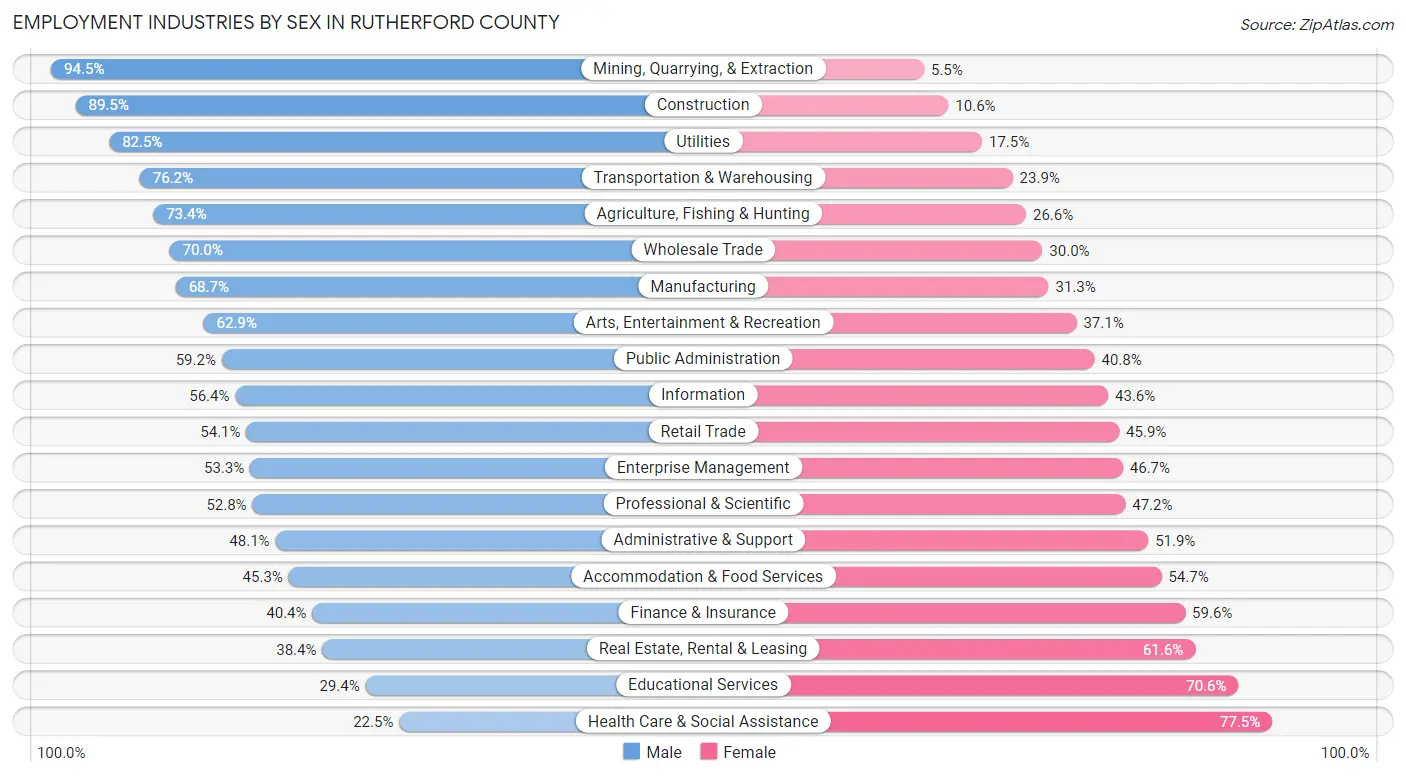
Employment Industries by Sex in Rutherford County
The Rutherford County industries that see more men than women are Mining, Quarrying, & Extraction (94.5%), Construction (89.4%), and Utilities (82.5%), whereas the industries that tend to have a higher number of women are Health Care & Social Assistance (77.5%), Educational Services (70.6%), and Real Estate, Rental & Leasing (61.6%).
| Industry | Male | Female |
| Agriculture, Fishing & Hunting | 485 (73.4%) | 176 (26.6%) |
| Mining, Quarrying, & Extraction | 120 (94.5%) | 7 (5.5%) |
| Construction | 11,451 (89.4%) | 1,350 (10.5%) |
| Manufacturing | 16,671 (68.7%) | 7,590 (31.3%) |
| Wholesale Trade | 3,963 (70.0%) | 1,699 (30.0%) |
| Retail Trade | 11,667 (54.1%) | 9,899 (45.9%) |
| Transportation & Warehousing | 9,321 (76.1%) | 2,920 (23.8%) |
| Utilities | 824 (82.5%) | 175 (17.5%) |
| Information | 2,406 (56.4%) | 1,861 (43.6%) |
| Finance & Insurance | 3,204 (40.4%) | 4,718 (59.6%) |
| Real Estate, Rental & Leasing | 1,163 (38.4%) | 1,867 (61.6%) |
| Professional & Scientific | 5,387 (52.8%) | 4,807 (47.2%) |
| Enterprise Management | 343 (53.3%) | 300 (46.7%) |
| Administrative & Support | 4,488 (48.1%) | 4,845 (51.9%) |
| Educational Services | 4,270 (29.4%) | 10,232 (70.6%) |
| Health Care & Social Assistance | 5,212 (22.5%) | 17,998 (77.5%) |
| Arts, Entertainment & Recreation | 1,530 (62.9%) | 901 (37.1%) |
| Accommodation & Food Services | 7,120 (45.3%) | 8,582 (54.7%) |
| Public Administration | 3,898 (59.2%) | 2,687 (40.8%) |
| Total | 97,500 (53.0%) | 86,520 (47.0%) |
Education in Rutherford County
School Enrollment in Rutherford County
The most common levels of schooling among the 93,404 students in Rutherford County are college / undergraduate (22,599 | 24.2%), middle school (21,501 | 23.0%), and high school (19,718 | 21.1%).
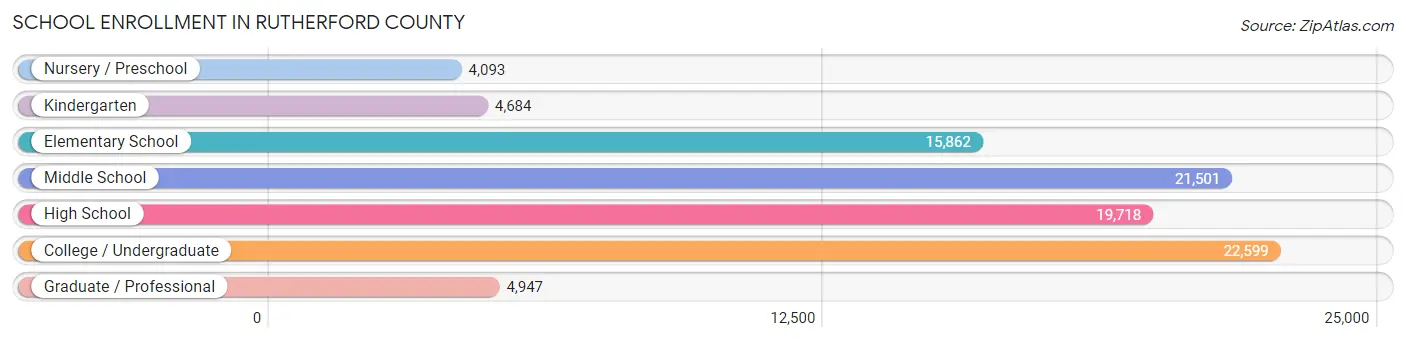
| School Level | # Students | % Students |
| Nursery / Preschool | 4,093 | 4.4% |
| Kindergarten | 4,684 | 5.0% |
| Elementary School | 15,862 | 17.0% |
| Middle School | 21,501 | 23.0% |
| High School | 19,718 | 21.1% |
| College / Undergraduate | 22,599 | 24.2% |
| Graduate / Professional | 4,947 | 5.3% |
| Total | 93,404 | 100.0% |
School Enrollment by Age by Funding Source in Rutherford County
Out of a total of 93,404 students who are enrolled in schools in Rutherford County, 13,450 (14.4%) attend a private institution, while the remaining 79,954 (85.6%) are enrolled in public schools. The age group of 35 years and over has the highest likelihood of being enrolled in private schools, with 1,922 (42.1% in the age bracket) enrolled. Conversely, the age group of 18 to 19 year olds has the lowest likelihood of being enrolled in a private school, with 7,240 (89.9% in the age bracket) attending a public institution.
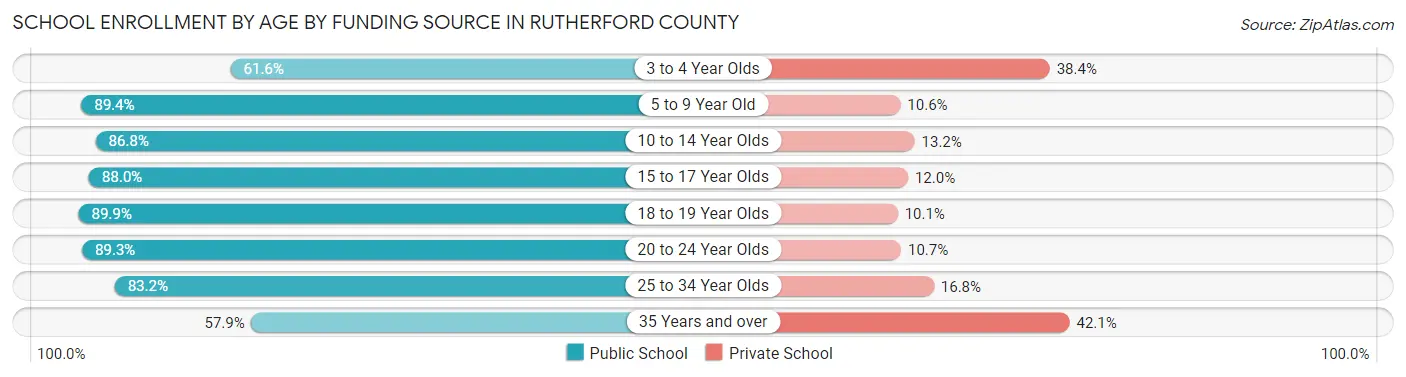
| Age Bracket | Public School | Private School |
| 3 to 4 Year Olds | 2,118 (61.6%) | 1,319 (38.4%) |
| 5 to 9 Year Old | 17,531 (89.4%) | 2,071 (10.6%) |
| 10 to 14 Year Olds | 22,053 (86.8%) | 3,356 (13.2%) |
| 15 to 17 Year Olds | 12,338 (88.0%) | 1,679 (12.0%) |
| 18 to 19 Year Olds | 7,240 (89.9%) | 810 (10.1%) |
| 20 to 24 Year Olds | 11,431 (89.3%) | 1,368 (10.7%) |
| 25 to 34 Year Olds | 4,595 (83.2%) | 928 (16.8%) |
| 35 Years and over | 2,645 (57.9%) | 1,922 (42.1%) |
| Total | 79,954 (85.6%) | 13,450 (14.4%) |
Educational Attainment by Field of Study in Rutherford County
Business (17,870 | 23.0%), education (8,916 | 11.5%), science & technology (8,697 | 11.2%), arts & humanities (7,330 | 9.4%), and communications (4,441 | 5.7%) are the most common fields of study among 77,874 individuals in Rutherford County who have obtained a bachelor's degree or higher.
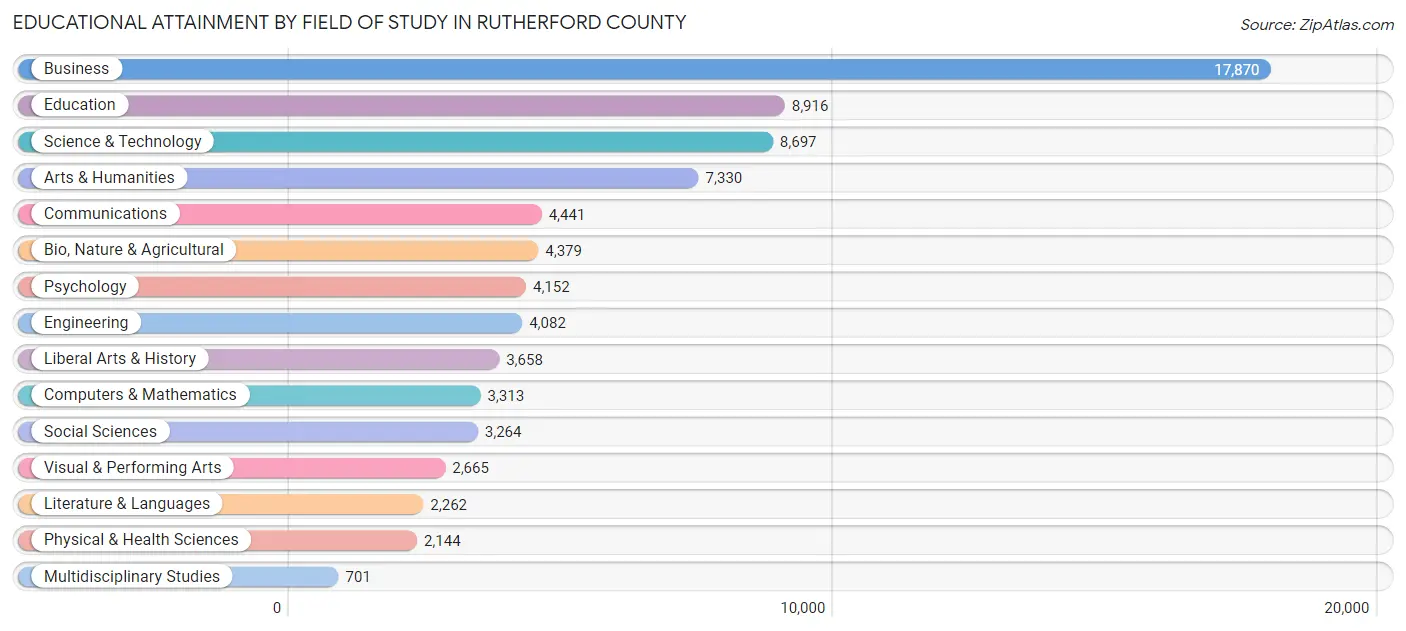
| Field of Study | # Graduates | % Graduates |
| Computers & Mathematics | 3,313 | 4.3% |
| Bio, Nature & Agricultural | 4,379 | 5.6% |
| Physical & Health Sciences | 2,144 | 2.8% |
| Psychology | 4,152 | 5.3% |
| Social Sciences | 3,264 | 4.2% |
| Engineering | 4,082 | 5.2% |
| Multidisciplinary Studies | 701 | 0.9% |
| Science & Technology | 8,697 | 11.2% |
| Business | 17,870 | 23.0% |
| Education | 8,916 | 11.5% |
| Literature & Languages | 2,262 | 2.9% |
| Liberal Arts & History | 3,658 | 4.7% |
| Visual & Performing Arts | 2,665 | 3.4% |
| Communications | 4,441 | 5.7% |
| Arts & Humanities | 7,330 | 9.4% |
| Total | 77,874 | 100.0% |
Transportation & Commute in Rutherford County
Vehicle Availability by Sex in Rutherford County
The most prevalent vehicle ownership categories in Rutherford County are males with 2 vehicles (40,666, accounting for 42.1%) and females with 2 vehicles (34,190, making up 48.9%).
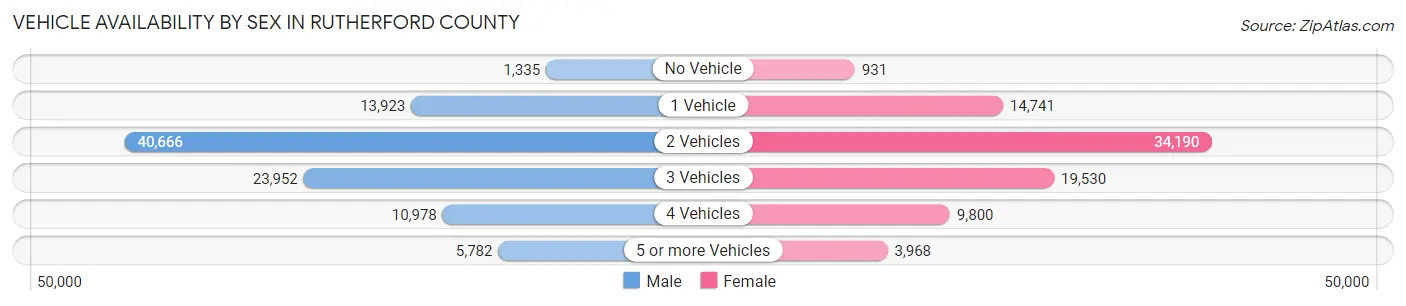
| Vehicles Available | Male | Female |
| No Vehicle | 1,335 (1.4%) | 931 (1.1%) |
| 1 Vehicle | 13,923 (14.4%) | 14,741 (17.7%) |
| 2 Vehicles | 40,666 (42.1%) | 34,190 (41.1%) |
| 3 Vehicles | 23,952 (24.8%) | 19,530 (23.5%) |
| 4 Vehicles | 10,978 (11.4%) | 9,800 (11.8%) |
| 5 or more Vehicles | 5,782 (6.0%) | 3,968 (4.8%) |
| Total | 96,636 (100.0%) | 83,160 (100.0%) |
Commute Time in Rutherford County
The most frequently occuring commute durations in Rutherford County are 15 to 19 minutes (26,437 commuters, 16.5%), 30 to 34 minutes (22,169 commuters, 13.8%), and 20 to 24 minutes (21,936 commuters, 13.7%).
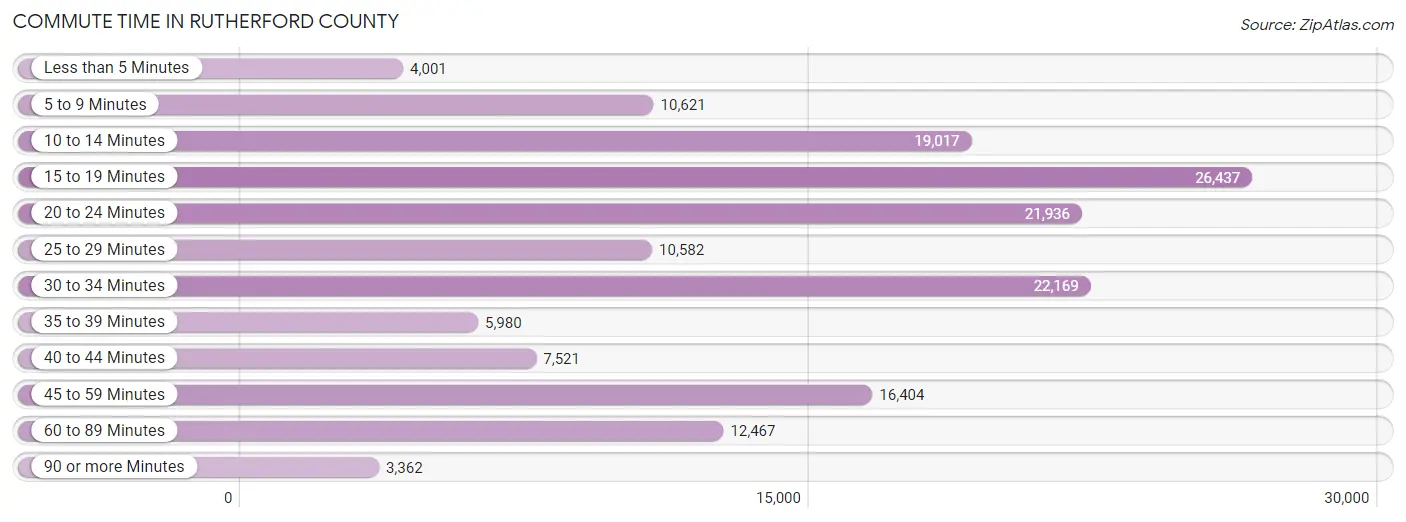
| Commute Time | # Commuters | % Commuters |
| Less than 5 Minutes | 4,001 | 2.5% |
| 5 to 9 Minutes | 10,621 | 6.6% |
| 10 to 14 Minutes | 19,017 | 11.8% |
| 15 to 19 Minutes | 26,437 | 16.5% |
| 20 to 24 Minutes | 21,936 | 13.7% |
| 25 to 29 Minutes | 10,582 | 6.6% |
| 30 to 34 Minutes | 22,169 | 13.8% |
| 35 to 39 Minutes | 5,980 | 3.7% |
| 40 to 44 Minutes | 7,521 | 4.7% |
| 45 to 59 Minutes | 16,404 | 10.2% |
| 60 to 89 Minutes | 12,467 | 7.8% |
| 90 or more Minutes | 3,362 | 2.1% |
Commute Time by Sex in Rutherford County
The most common commute times in Rutherford County are 15 to 19 minutes (13,950 commuters, 15.9%) for males and 15 to 19 minutes (12,487 commuters, 17.2%) for females.
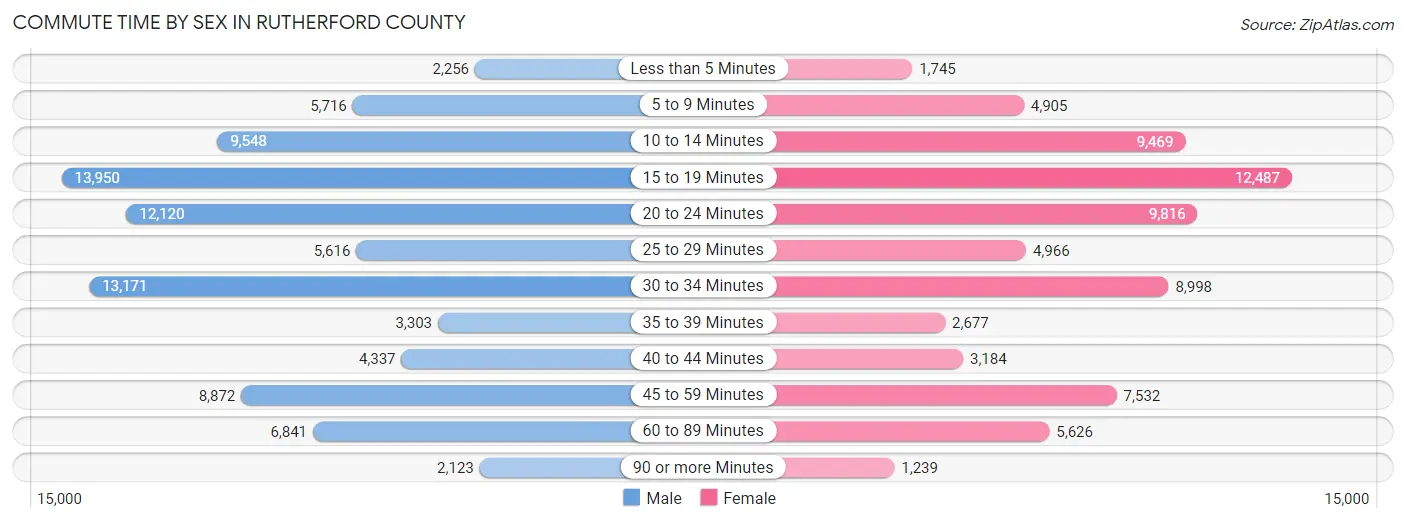
| Commute Time | Male | Female |
| Less than 5 Minutes | 2,256 (2.6%) | 1,745 (2.4%) |
| 5 to 9 Minutes | 5,716 (6.5%) | 4,905 (6.8%) |
| 10 to 14 Minutes | 9,548 (10.9%) | 9,469 (13.0%) |
| 15 to 19 Minutes | 13,950 (15.9%) | 12,487 (17.2%) |
| 20 to 24 Minutes | 12,120 (13.8%) | 9,816 (13.5%) |
| 25 to 29 Minutes | 5,616 (6.4%) | 4,966 (6.8%) |
| 30 to 34 Minutes | 13,171 (15.0%) | 8,998 (12.4%) |
| 35 to 39 Minutes | 3,303 (3.8%) | 2,677 (3.7%) |
| 40 to 44 Minutes | 4,337 (4.9%) | 3,184 (4.4%) |
| 45 to 59 Minutes | 8,872 (10.1%) | 7,532 (10.4%) |
| 60 to 89 Minutes | 6,841 (7.8%) | 5,626 (7.7%) |
| 90 or more Minutes | 2,123 (2.4%) | 1,239 (1.7%) |
Time of Departure to Work by Sex in Rutherford County
The most frequent times of departure to work in Rutherford County are 6:00 AM to 6:29 AM (11,229, 12.8%) for males and 7:00 AM to 7:29 AM (11,933, 16.4%) for females.
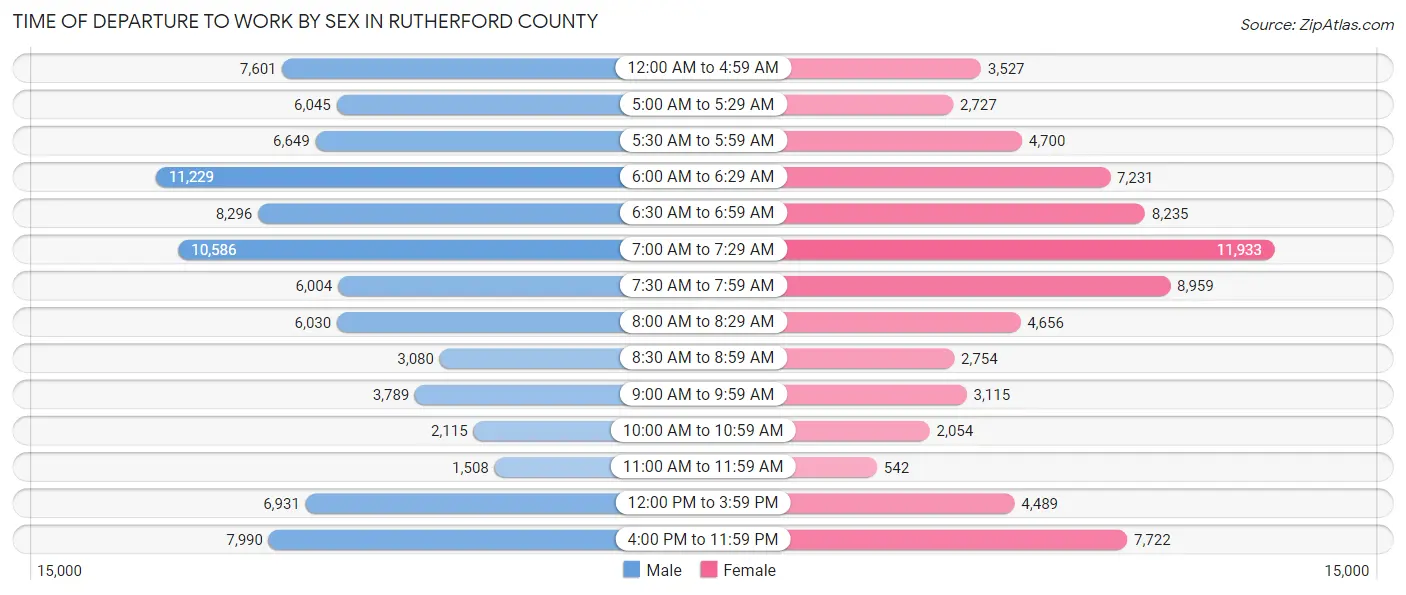
| Time of Departure | Male | Female |
| 12:00 AM to 4:59 AM | 7,601 (8.6%) | 3,527 (4.9%) |
| 5:00 AM to 5:29 AM | 6,045 (6.9%) | 2,727 (3.7%) |
| 5:30 AM to 5:59 AM | 6,649 (7.6%) | 4,700 (6.5%) |
| 6:00 AM to 6:29 AM | 11,229 (12.8%) | 7,231 (10.0%) |
| 6:30 AM to 6:59 AM | 8,296 (9.4%) | 8,235 (11.3%) |
| 7:00 AM to 7:29 AM | 10,586 (12.0%) | 11,933 (16.4%) |
| 7:30 AM to 7:59 AM | 6,004 (6.8%) | 8,959 (12.3%) |
| 8:00 AM to 8:29 AM | 6,030 (6.9%) | 4,656 (6.4%) |
| 8:30 AM to 8:59 AM | 3,080 (3.5%) | 2,754 (3.8%) |
| 9:00 AM to 9:59 AM | 3,789 (4.3%) | 3,115 (4.3%) |
| 10:00 AM to 10:59 AM | 2,115 (2.4%) | 2,054 (2.8%) |
| 11:00 AM to 11:59 AM | 1,508 (1.7%) | 542 (0.7%) |
| 12:00 PM to 3:59 PM | 6,931 (7.9%) | 4,489 (6.2%) |
| 4:00 PM to 11:59 PM | 7,990 (9.1%) | 7,722 (10.6%) |
| Total | 87,853 (100.0%) | 72,644 (100.0%) |
Housing Occupancy in Rutherford County
Occupancy by Ownership in Rutherford County
Of the total 122,510 dwellings in Rutherford County, owner-occupied units account for 79,898 (65.2%), while renter-occupied units make up 42,612 (34.8%).
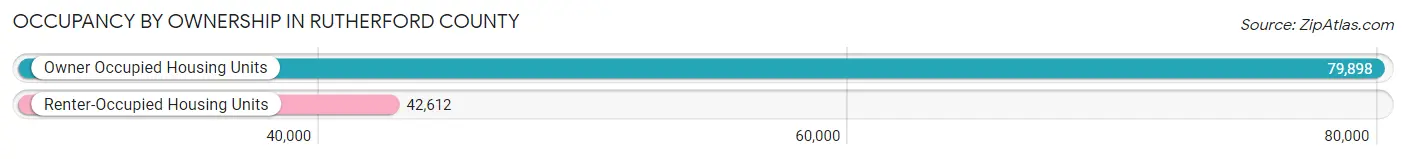
| Occupancy | # Housing Units | % Housing Units |
| Owner Occupied Housing Units | 79,898 | 65.2% |
| Renter-Occupied Housing Units | 42,612 | 34.8% |
| Total Occupied Housing Units | 122,510 | 100.0% |
Occupancy by Household Size in Rutherford County
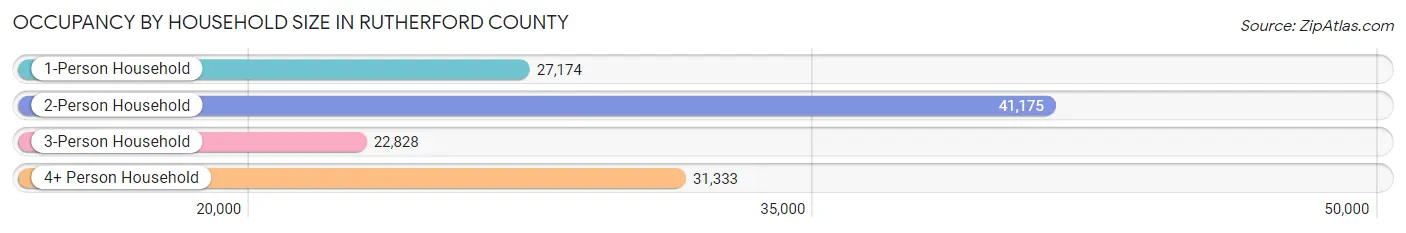
| Household Size | # Housing Units | % Housing Units |
| 1-Person Household | 27,174 | 22.2% |
| 2-Person Household | 41,175 | 33.6% |
| 3-Person Household | 22,828 | 18.6% |
| 4+ Person Household | 31,333 | 25.6% |
| Total Housing Units | 122,510 | 100.0% |
Occupancy by Ownership by Household Size in Rutherford County
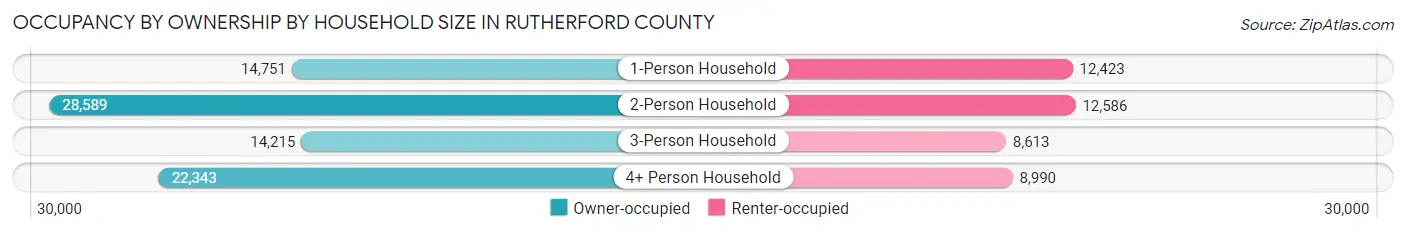
| Household Size | Owner-occupied | Renter-occupied |
| 1-Person Household | 14,751 (54.3%) | 12,423 (45.7%) |
| 2-Person Household | 28,589 (69.4%) | 12,586 (30.6%) |
| 3-Person Household | 14,215 (62.3%) | 8,613 (37.7%) |
| 4+ Person Household | 22,343 (71.3%) | 8,990 (28.7%) |
| Total Housing Units | 79,898 (65.2%) | 42,612 (34.8%) |
Occupancy by Educational Attainment in Rutherford County
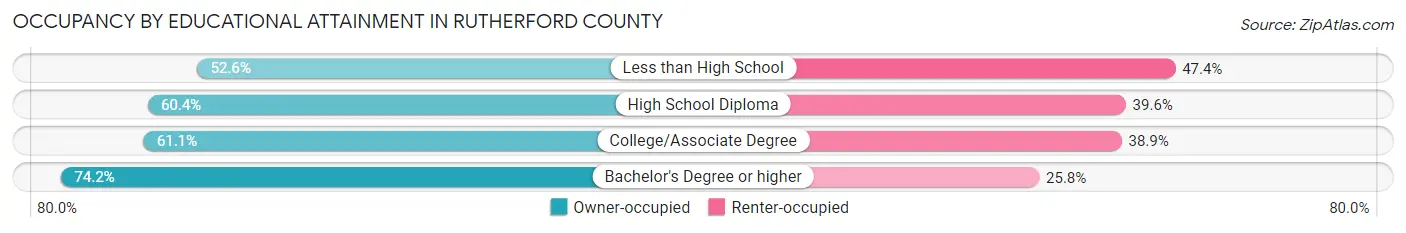
| Household Size | Owner-occupied | Renter-occupied |
| Less than High School | 3,557 (52.6%) | 3,209 (47.4%) |
| High School Diploma | 17,988 (60.4%) | 11,777 (39.6%) |
| College/Associate Degree | 25,273 (61.1%) | 16,102 (38.9%) |
| Bachelor's Degree or higher | 33,080 (74.2%) | 11,524 (25.8%) |
Occupancy by Age of Householder in Rutherford County
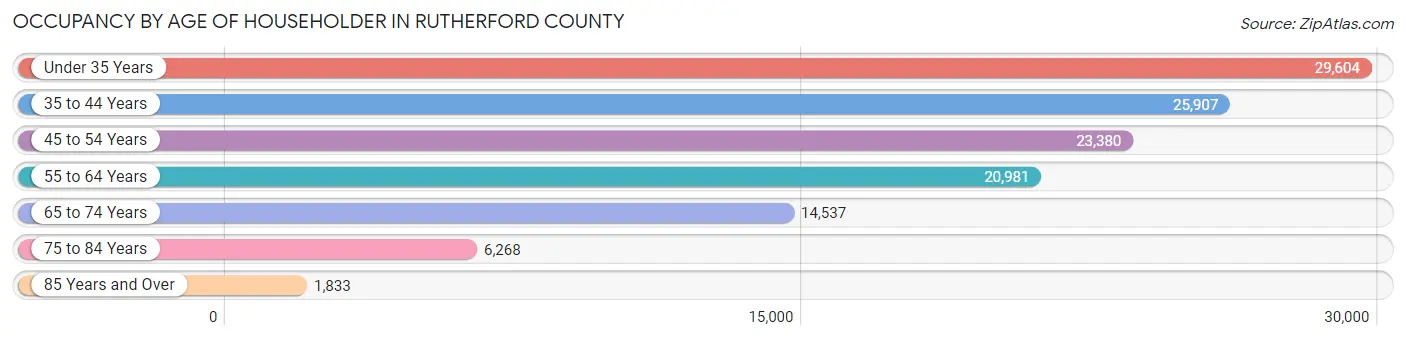
| Age Bracket | # Households | % Households |
| Under 35 Years | 29,604 | 24.2% |
| 35 to 44 Years | 25,907 | 21.1% |
| 45 to 54 Years | 23,380 | 19.1% |
| 55 to 64 Years | 20,981 | 17.1% |
| 65 to 74 Years | 14,537 | 11.9% |
| 75 to 84 Years | 6,268 | 5.1% |
| 85 Years and Over | 1,833 | 1.5% |
| Total | 122,510 | 100.0% |
Housing Finances in Rutherford County
Median Income by Occupancy in Rutherford County
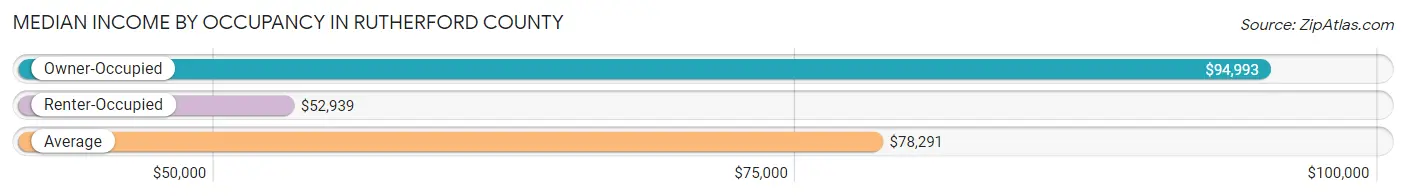
| Occupancy Type | # Households | Median Income |
| Owner-Occupied | 79,898 (65.2%) | $94,993 |
| Renter-Occupied | 42,612 (34.8%) | $52,939 |
| Average | 122,510 (100.0%) | $78,291 |
Occupancy by Householder Income Bracket in Rutherford County
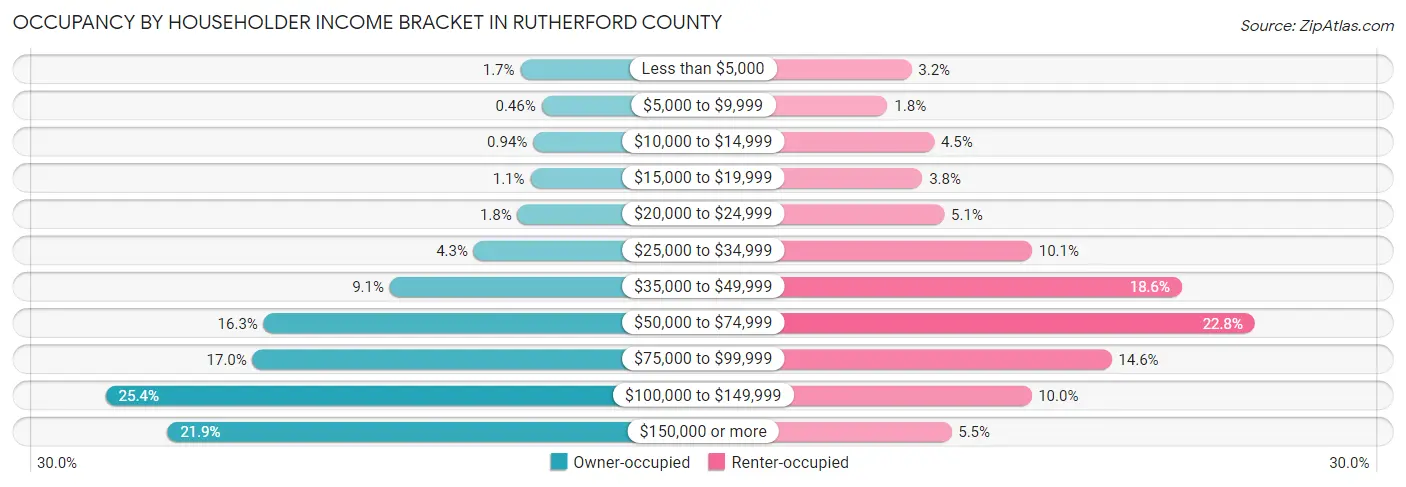
| Income Bracket | Owner-occupied | Renter-occupied |
| Less than $5,000 | 1,332 (1.7%) | 1,358 (3.2%) |
| $5,000 to $9,999 | 371 (0.5%) | 775 (1.8%) |
| $10,000 to $14,999 | 752 (0.9%) | 1,910 (4.5%) |
| $15,000 to $19,999 | 882 (1.1%) | 1,622 (3.8%) |
| $20,000 to $24,999 | 1,461 (1.8%) | 2,155 (5.1%) |
| $25,000 to $34,999 | 3,462 (4.3%) | 4,291 (10.1%) |
| $35,000 to $49,999 | 7,298 (9.1%) | 7,943 (18.6%) |
| $50,000 to $74,999 | 13,053 (16.3%) | 9,720 (22.8%) |
| $75,000 to $99,999 | 13,559 (17.0%) | 6,231 (14.6%) |
| $100,000 to $149,999 | 20,274 (25.4%) | 4,278 (10.0%) |
| $150,000 or more | 17,454 (21.8%) | 2,329 (5.5%) |
| Total | 79,898 (100.0%) | 42,612 (100.0%) |
Monthly Housing Cost Tiers in Rutherford County
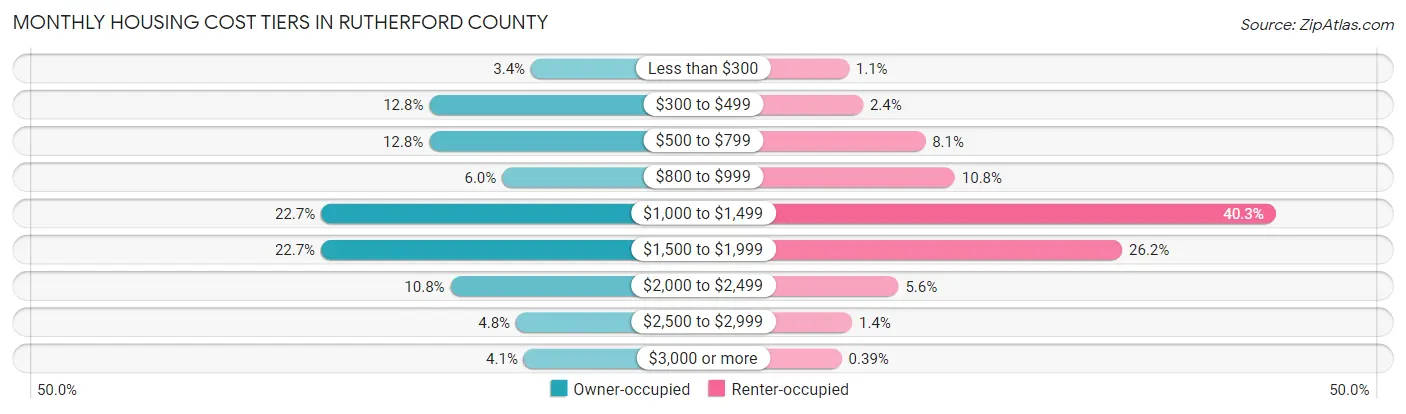
| Monthly Cost | Owner-occupied | Renter-occupied |
| Less than $300 | 2,707 (3.4%) | 449 (1.1%) |
| $300 to $499 | 10,189 (12.8%) | 1,000 (2.4%) |
| $500 to $799 | 10,204 (12.8%) | 3,442 (8.1%) |
| $800 to $999 | 4,822 (6.0%) | 4,608 (10.8%) |
| $1,000 to $1,499 | 18,145 (22.7%) | 17,184 (40.3%) |
| $1,500 to $1,999 | 18,156 (22.7%) | 11,167 (26.2%) |
| $2,000 to $2,499 | 8,632 (10.8%) | 2,393 (5.6%) |
| $2,500 to $2,999 | 3,808 (4.8%) | 574 (1.3%) |
| $3,000 or more | 3,235 (4.1%) | 165 (0.4%) |
| Total | 79,898 (100.0%) | 42,612 (100.0%) |
Physical Housing Characteristics in Rutherford County
Housing Structures in Rutherford County
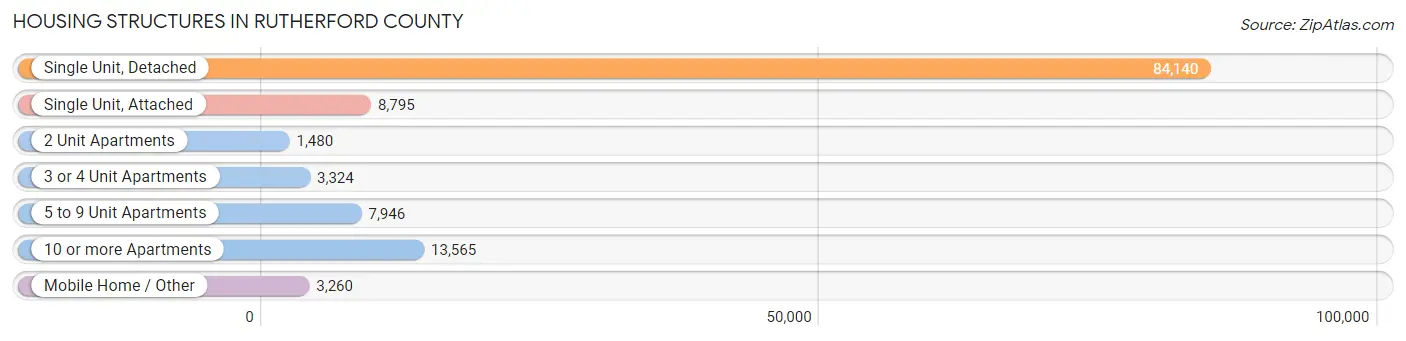
| Structure Type | # Housing Units | % Housing Units |
| Single Unit, Detached | 84,140 | 68.7% |
| Single Unit, Attached | 8,795 | 7.2% |
| 2 Unit Apartments | 1,480 | 1.2% |
| 3 or 4 Unit Apartments | 3,324 | 2.7% |
| 5 to 9 Unit Apartments | 7,946 | 6.5% |
| 10 or more Apartments | 13,565 | 11.1% |
| Mobile Home / Other | 3,260 | 2.7% |
| Total | 122,510 | 100.0% |
Housing Structures by Occupancy in Rutherford County
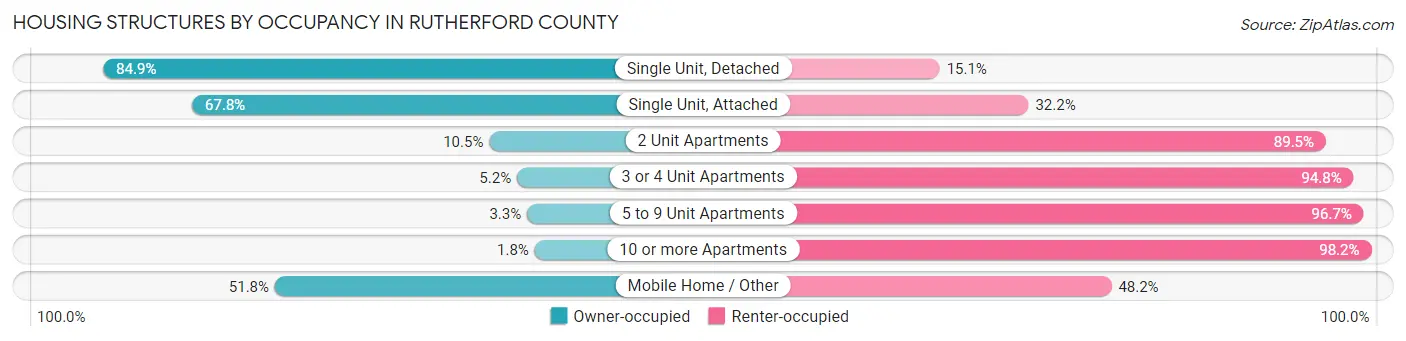
| Structure Type | Owner-occupied | Renter-occupied |
| Single Unit, Detached | 71,417 (84.9%) | 12,723 (15.1%) |
| Single Unit, Attached | 5,961 (67.8%) | 2,834 (32.2%) |
| 2 Unit Apartments | 156 (10.5%) | 1,324 (89.5%) |
| 3 or 4 Unit Apartments | 173 (5.2%) | 3,151 (94.8%) |
| 5 to 9 Unit Apartments | 259 (3.3%) | 7,687 (96.7%) |
| 10 or more Apartments | 243 (1.8%) | 13,322 (98.2%) |
| Mobile Home / Other | 1,689 (51.8%) | 1,571 (48.2%) |
| Total | 79,898 (65.2%) | 42,612 (34.8%) |
Housing Structures by Number of Rooms in Rutherford County
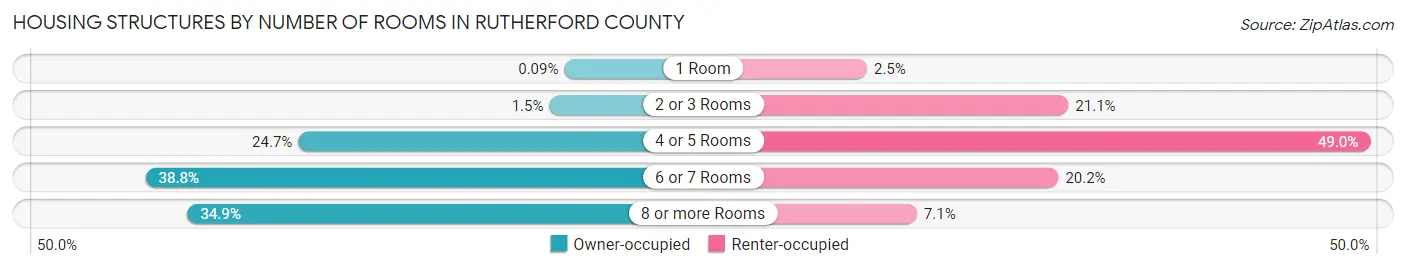
| Number of Rooms | Owner-occupied | Renter-occupied |
| 1 Room | 75 (0.1%) | 1,068 (2.5%) |
| 2 or 3 Rooms | 1,176 (1.5%) | 9,002 (21.1%) |
| 4 or 5 Rooms | 19,738 (24.7%) | 20,894 (49.0%) |
| 6 or 7 Rooms | 31,002 (38.8%) | 8,613 (20.2%) |
| 8 or more Rooms | 27,907 (34.9%) | 3,035 (7.1%) |
| Total | 79,898 (100.0%) | 42,612 (100.0%) |
Housing Structure by Heating Type in Rutherford County
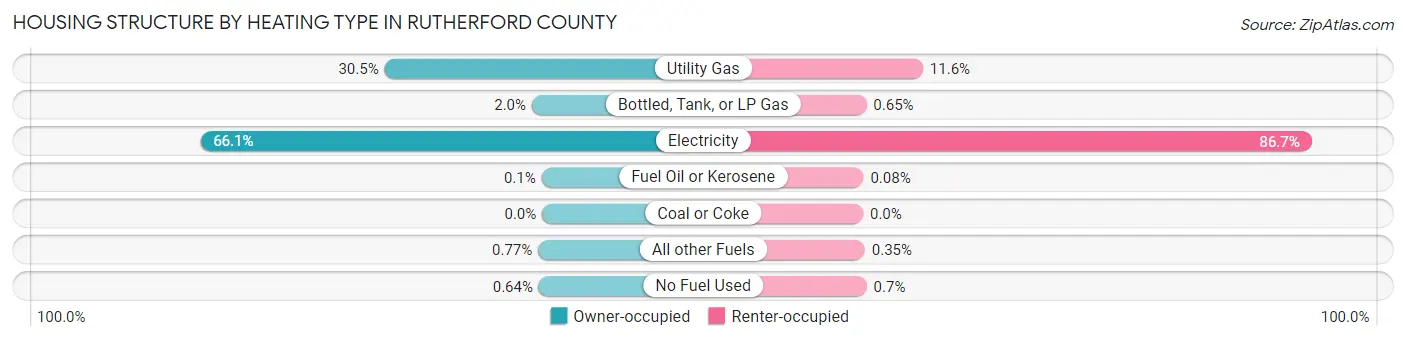
| Heating Type | Owner-occupied | Renter-occupied |
| Utility Gas | 24,336 (30.5%) | 4,930 (11.6%) |
| Bottled, Tank, or LP Gas | 1,579 (2.0%) | 275 (0.6%) |
| Electricity | 52,778 (66.1%) | 36,927 (86.7%) |
| Fuel Oil or Kerosene | 77 (0.1%) | 32 (0.1%) |
| Coal or Coke | 0 (0.0%) | 0 (0.0%) |
| All other Fuels | 619 (0.8%) | 148 (0.4%) |
| No Fuel Used | 509 (0.6%) | 300 (0.7%) |
| Total | 79,898 (100.0%) | 42,612 (100.0%) |
Household Vehicle Usage in Rutherford County
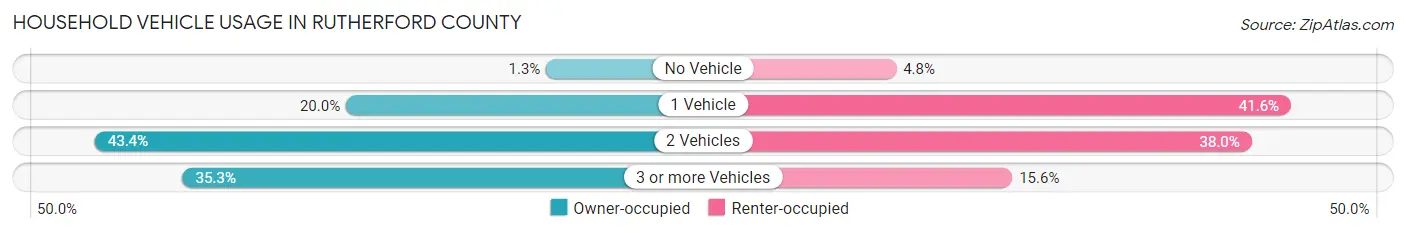
| Vehicles per Household | Owner-occupied | Renter-occupied |
| No Vehicle | 1,044 (1.3%) | 2,039 (4.8%) |
| 1 Vehicle | 15,983 (20.0%) | 17,738 (41.6%) |
| 2 Vehicles | 34,704 (43.4%) | 16,177 (38.0%) |
| 3 or more Vehicles | 28,167 (35.2%) | 6,658 (15.6%) |
| Total | 79,898 (100.0%) | 42,612 (100.0%) |
Real Estate & Mortgages in Rutherford County
Real Estate and Mortgage Overview in Rutherford County
| Characteristic | Without Mortgage | With Mortgage |
| Housing Units | 22,898 | 57,000 |
| Median Property Value | $293,400 | $310,600 |
| Median Household Income | $72,626 | $14,085 |
| Monthly Housing Costs | $477 | $3,210 |
| Real Estate Taxes | $1,628 | $2,512 |
Property Value by Mortgage Status in Rutherford County
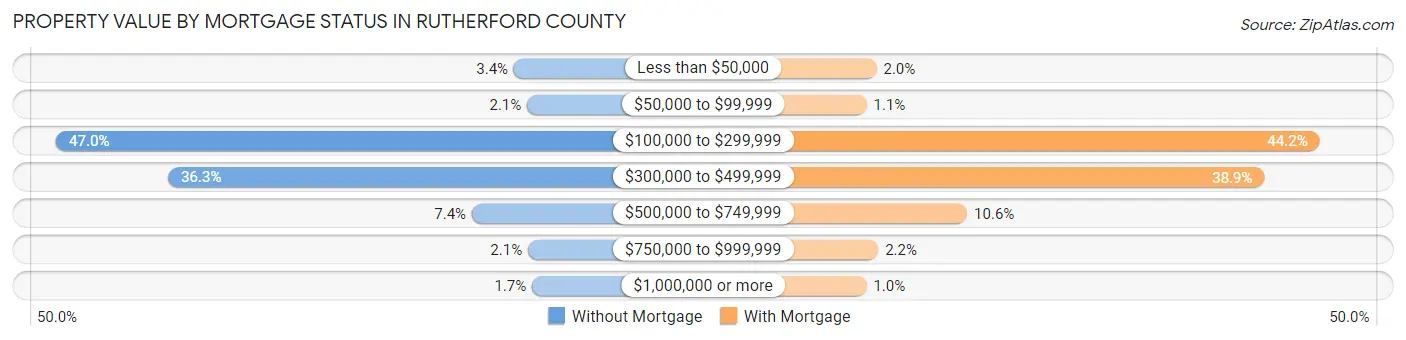
| Property Value | Without Mortgage | With Mortgage |
| Less than $50,000 | 778 (3.4%) | 1,142 (2.0%) |
| $50,000 to $99,999 | 491 (2.1%) | 598 (1.1%) |
| $100,000 to $299,999 | 10,759 (47.0%) | 25,190 (44.2%) |
| $300,000 to $499,999 | 8,321 (36.3%) | 22,188 (38.9%) |
| $500,000 to $749,999 | 1,695 (7.4%) | 6,058 (10.6%) |
| $750,000 to $999,999 | 472 (2.1%) | 1,234 (2.2%) |
| $1,000,000 or more | 382 (1.7%) | 590 (1.0%) |
| Total | 22,898 (100.0%) | 57,000 (100.0%) |
Household Income by Mortgage Status in Rutherford County
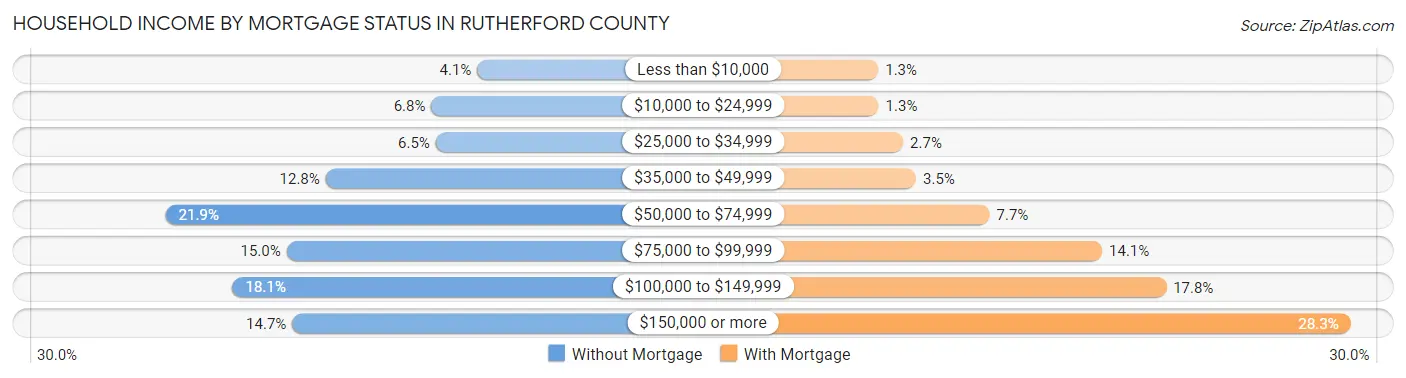
| Household Income | Without Mortgage | With Mortgage |
| Less than $10,000 | 948 (4.1%) | 739 (1.3%) |
| $10,000 to $24,999 | 1,547 (6.8%) | 755 (1.3%) |
| $25,000 to $34,999 | 1,490 (6.5%) | 1,548 (2.7%) |
| $35,000 to $49,999 | 2,930 (12.8%) | 1,972 (3.5%) |
| $50,000 to $74,999 | 5,024 (21.9%) | 4,368 (7.7%) |
| $75,000 to $99,999 | 3,441 (15.0%) | 8,029 (14.1%) |
| $100,000 to $149,999 | 4,149 (18.1%) | 10,118 (17.7%) |
| $150,000 or more | 3,369 (14.7%) | 16,125 (28.3%) |
| Total | 22,898 (100.0%) | 57,000 (100.0%) |
Property Value to Household Income Ratio in Rutherford County
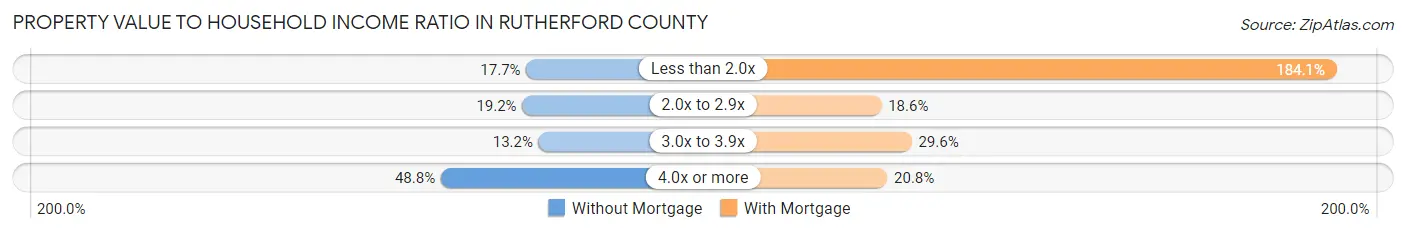
| Value-to-Income Ratio | Without Mortgage | With Mortgage |
| Less than 2.0x | 4,061 (17.7%) | 104,955 (184.1%) |
| 2.0x to 2.9x | 4,389 (19.2%) | 10,627 (18.6%) |
| 3.0x to 3.9x | 3,028 (13.2%) | 16,888 (29.6%) |
| 4.0x or more | 11,166 (48.8%) | 11,840 (20.8%) |
| Total | 22,898 (100.0%) | 57,000 (100.0%) |
Real Estate Taxes by Mortgage Status in Rutherford County
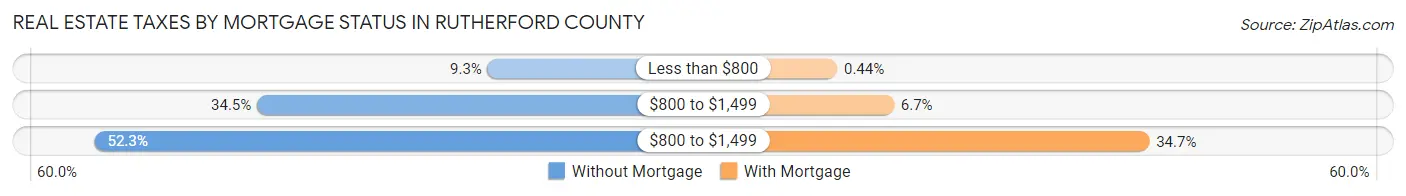
| Property Taxes | Without Mortgage | With Mortgage |
| Less than $800 | 2,119 (9.2%) | 248 (0.4%) |
| $800 to $1,499 | 7,905 (34.5%) | 3,798 (6.7%) |
| $800 to $1,499 | 11,983 (52.3%) | 19,749 (34.6%) |
| Total | 22,898 (100.0%) | 57,000 (100.0%) |
Health & Disability in Rutherford County
Health Insurance Coverage by Age in Rutherford County
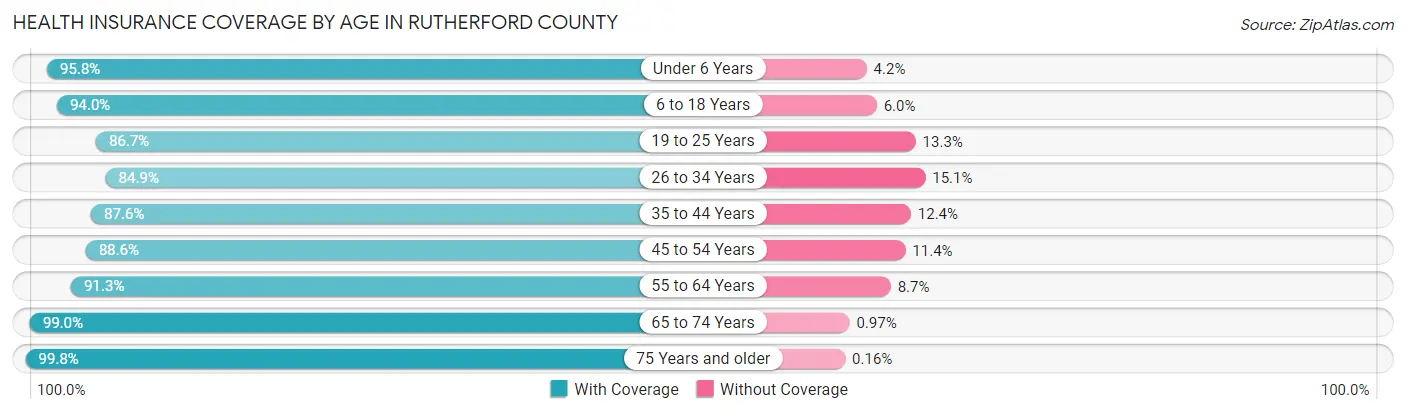
| Age Bracket | With Coverage | Without Coverage |
| Under 6 Years | 24,756 (95.8%) | 1,078 (4.2%) |
| 6 to 18 Years | 59,434 (94.0%) | 3,820 (6.0%) |
| 19 to 25 Years | 35,093 (86.7%) | 5,390 (13.3%) |
| 26 to 34 Years | 38,788 (84.9%) | 6,900 (15.1%) |
| 35 to 44 Years | 42,332 (87.6%) | 5,995 (12.4%) |
| 45 to 54 Years | 38,983 (88.6%) | 5,014 (11.4%) |
| 55 to 64 Years | 33,875 (91.3%) | 3,213 (8.7%) |
| 65 to 74 Years | 23,144 (99.0%) | 226 (1.0%) |
| 75 Years and older | 13,374 (99.8%) | 21 (0.2%) |
| Total | 309,779 (90.7%) | 31,657 (9.3%) |
Health Insurance Coverage by Citizenship Status in Rutherford County
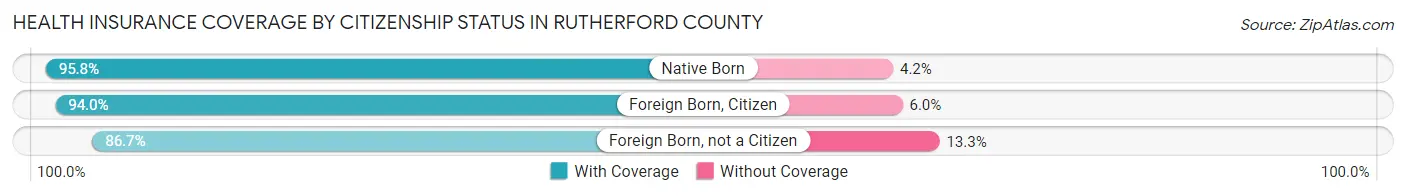
| Citizenship Status | With Coverage | Without Coverage |
| Native Born | 24,756 (95.8%) | 1,078 (4.2%) |
| Foreign Born, Citizen | 59,434 (94.0%) | 3,820 (6.0%) |
| Foreign Born, not a Citizen | 35,093 (86.7%) | 5,390 (13.3%) |
Health Insurance Coverage by Household Income in Rutherford County
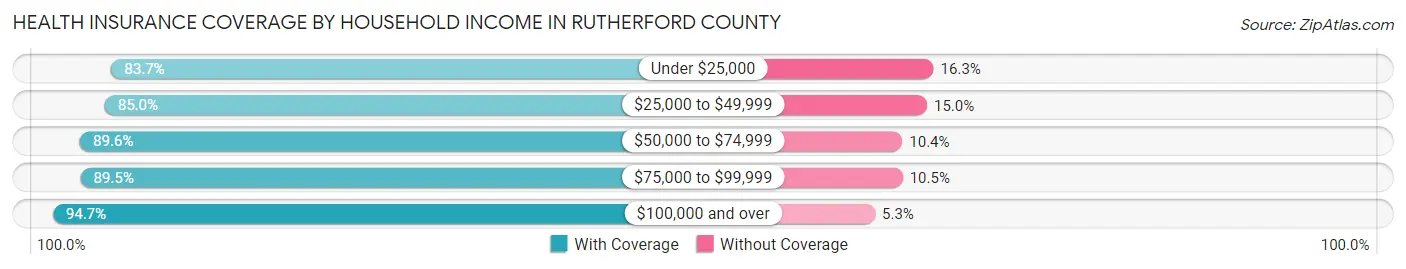
| Household Income | With Coverage | Without Coverage |
| Under $25,000 | 20,195 (83.7%) | 3,923 (16.3%) |
| $25,000 to $49,999 | 44,060 (85.0%) | 7,796 (15.0%) |
| $50,000 to $74,999 | 50,446 (89.6%) | 5,864 (10.4%) |
| $75,000 to $99,999 | 51,143 (89.5%) | 5,988 (10.5%) |
| $100,000 and over | 140,893 (94.7%) | 7,892 (5.3%) |
Public vs Private Health Insurance Coverage by Age in Rutherford County
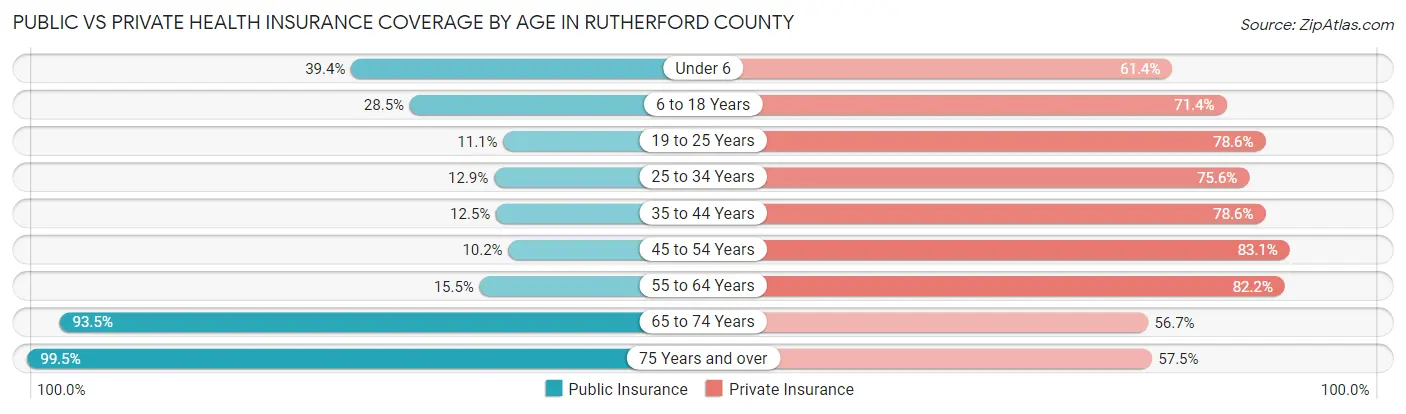
| Age Bracket | Public Insurance | Private Insurance |
| Under 6 | 10,171 (39.4%) | 15,849 (61.4%) |
| 6 to 18 Years | 18,017 (28.5%) | 45,148 (71.4%) |
| 19 to 25 Years | 4,510 (11.1%) | 31,820 (78.6%) |
| 25 to 34 Years | 5,872 (12.9%) | 34,543 (75.6%) |
| 35 to 44 Years | 6,024 (12.5%) | 37,989 (78.6%) |
| 45 to 54 Years | 4,484 (10.2%) | 36,576 (83.1%) |
| 55 to 64 Years | 5,761 (15.5%) | 30,489 (82.2%) |
| 65 to 74 Years | 21,855 (93.5%) | 13,258 (56.7%) |
| 75 Years and over | 13,327 (99.5%) | 7,697 (57.5%) |
| Total | 90,021 (26.4%) | 253,369 (74.2%) |
Disability Status by Sex by Age in Rutherford County
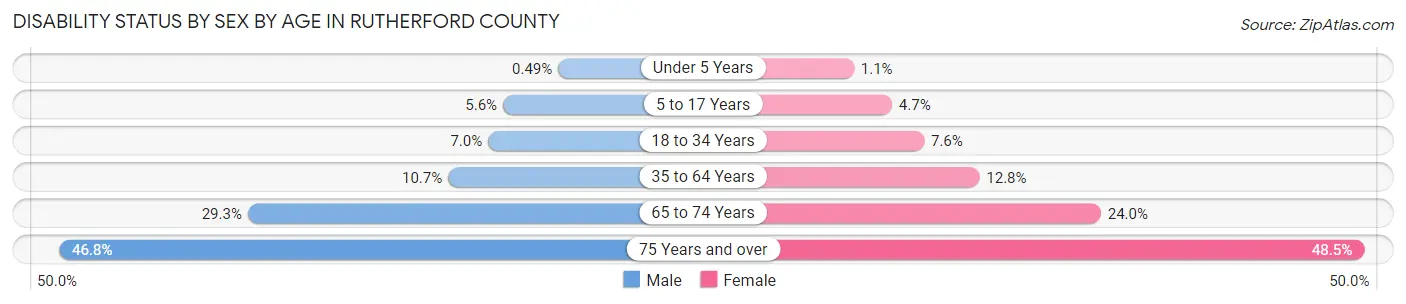
| Age Bracket | Male | Female |
| Under 5 Years | 54 (0.5%) | 118 (1.1%) |
| 5 to 17 Years | 1,780 (5.6%) | 1,422 (4.6%) |
| 18 to 34 Years | 3,188 (7.0%) | 3,501 (7.6%) |
| 35 to 64 Years | 6,811 (10.7%) | 8,394 (12.8%) |
| 65 to 74 Years | 3,168 (29.3%) | 3,018 (24.0%) |
| 75 Years and over | 2,573 (46.8%) | 3,827 (48.5%) |
Disability Class by Sex by Age in Rutherford County
Disability Class: Hearing Difficulty
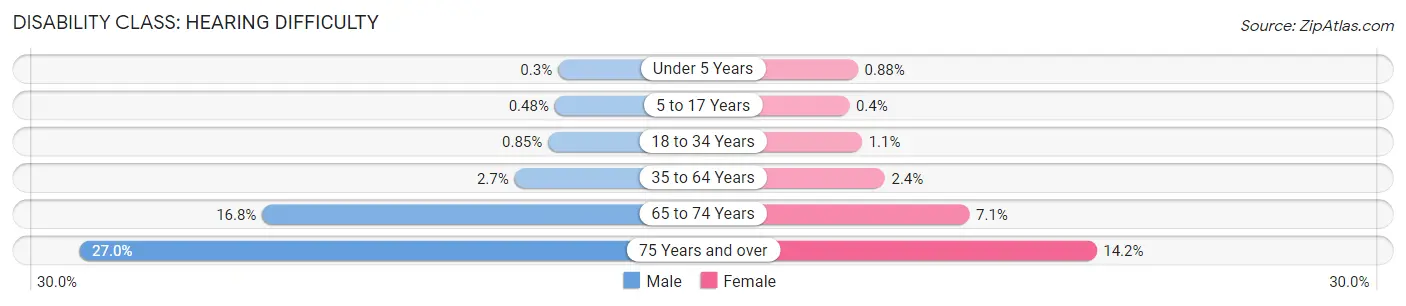
| Age Bracket | Male | Female |
| Under 5 Years | 33 (0.3%) | 92 (0.9%) |
| 5 to 17 Years | 153 (0.5%) | 123 (0.4%) |
| 18 to 34 Years | 387 (0.9%) | 507 (1.1%) |
| 35 to 64 Years | 1,735 (2.7%) | 1,562 (2.4%) |
| 65 to 74 Years | 1,814 (16.8%) | 890 (7.1%) |
| 75 Years and over | 1,482 (27.0%) | 1,119 (14.2%) |
Disability Class: Vision Difficulty
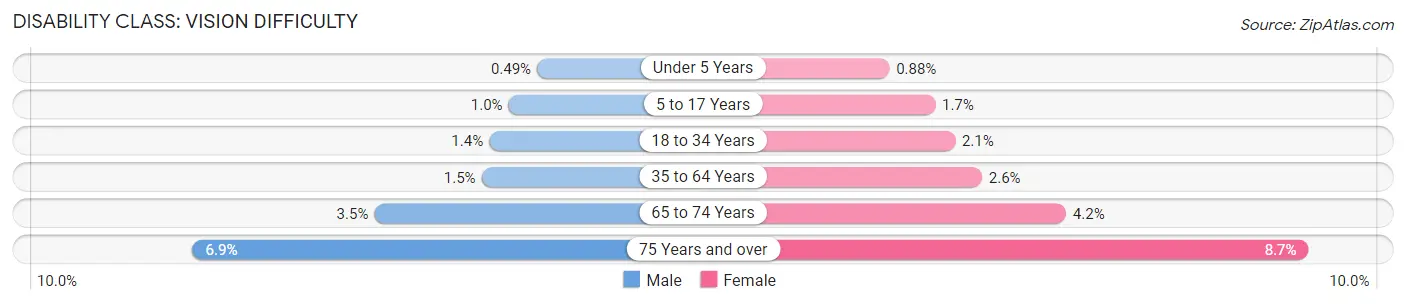
| Age Bracket | Male | Female |
| Under 5 Years | 54 (0.5%) | 92 (0.9%) |
| 5 to 17 Years | 323 (1.0%) | 530 (1.7%) |
| 18 to 34 Years | 629 (1.4%) | 965 (2.1%) |
| 35 to 64 Years | 970 (1.5%) | 1,706 (2.6%) |
| 65 to 74 Years | 380 (3.5%) | 522 (4.2%) |
| 75 Years and over | 378 (6.9%) | 684 (8.7%) |
Disability Class: Cognitive Difficulty
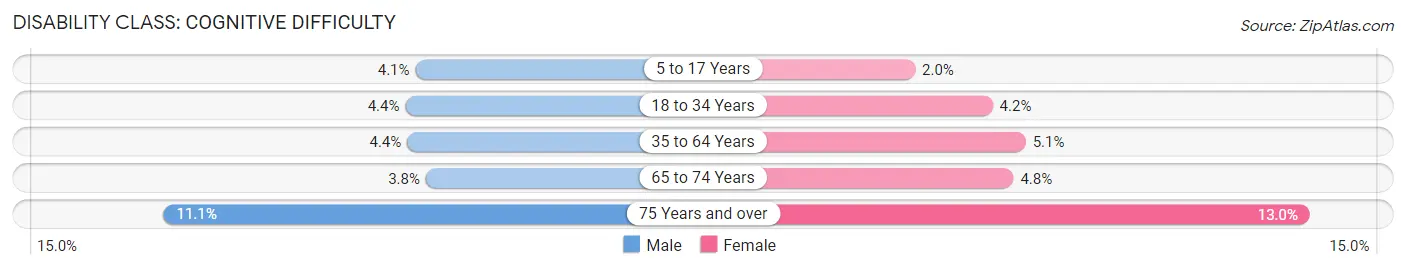
| Age Bracket | Male | Female |
| 5 to 17 Years | 1,309 (4.1%) | 624 (2.0%) |
| 18 to 34 Years | 2,009 (4.4%) | 1,926 (4.2%) |
| 35 to 64 Years | 2,767 (4.3%) | 3,367 (5.1%) |
| 65 to 74 Years | 414 (3.8%) | 600 (4.8%) |
| 75 Years and over | 612 (11.1%) | 1,029 (13.0%) |
Disability Class: Ambulatory Difficulty
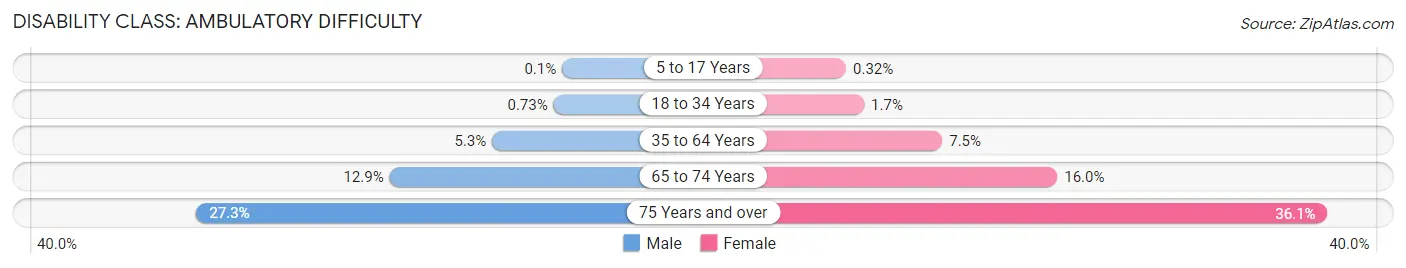
| Age Bracket | Male | Female |
| 5 to 17 Years | 33 (0.1%) | 97 (0.3%) |
| 18 to 34 Years | 335 (0.7%) | 763 (1.7%) |
| 35 to 64 Years | 3,370 (5.3%) | 4,905 (7.5%) |
| 65 to 74 Years | 1,397 (12.9%) | 2,008 (16.0%) |
| 75 Years and over | 1,498 (27.3%) | 2,847 (36.0%) |
Disability Class: Self-Care Difficulty
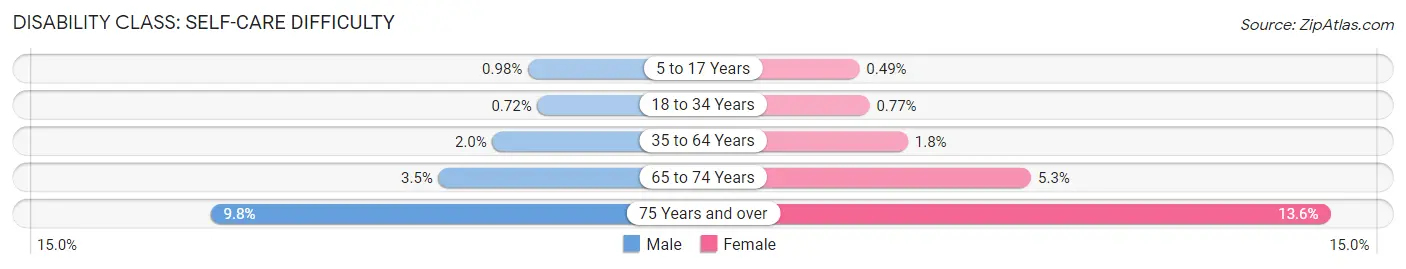
| Age Bracket | Male | Female |
| 5 to 17 Years | 312 (1.0%) | 151 (0.5%) |
| 18 to 34 Years | 329 (0.7%) | 354 (0.8%) |
| 35 to 64 Years | 1,253 (2.0%) | 1,210 (1.8%) |
| 65 to 74 Years | 375 (3.5%) | 661 (5.3%) |
| 75 Years and over | 540 (9.8%) | 1,074 (13.6%) |
Technology Access in Rutherford County
Computing Device Access in Rutherford County
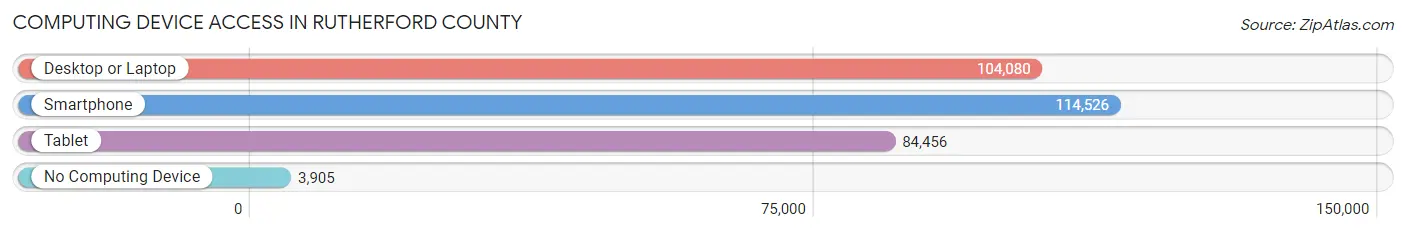
| Device Type | # Households | % Households |
| Desktop or Laptop | 104,080 | 85.0% |
| Smartphone | 114,526 | 93.5% |
| Tablet | 84,456 | 68.9% |
| No Computing Device | 3,905 | 3.2% |
| Total | 122,510 | 100.0% |
Internet Access in Rutherford County
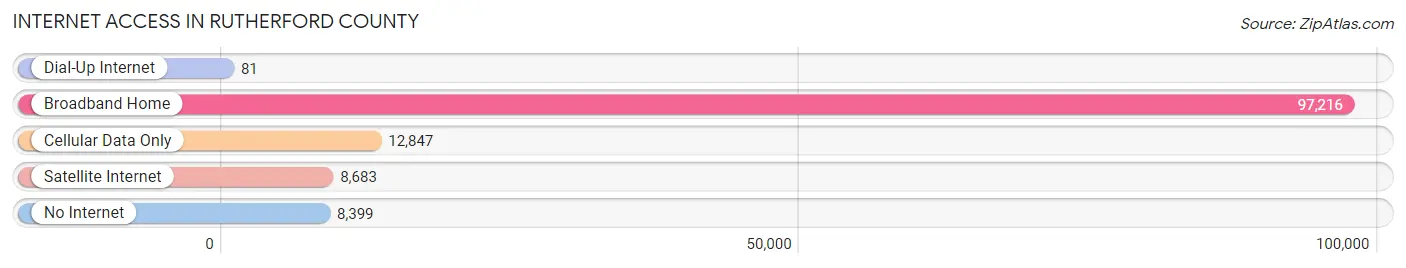
| Internet Type | # Households | % Households |
| Dial-Up Internet | 81 | 0.1% |
| Broadband Home | 97,216 | 79.3% |
| Cellular Data Only | 12,847 | 10.5% |
| Satellite Internet | 8,683 | 7.1% |
| No Internet | 8,399 | 6.9% |
| Total | 122,510 | 100.0% |
Rutherford County Summary
Rutherford County is located in the central part of the state of Tennessee, and is part of the Nashville metropolitan area. It is bordered by Davidson, Williamson, Wilson, Cannon, and Coffee counties. The county seat is Murfreesboro, which is also the largest city in the county. The county was named after Griffith Rutherford, a Revolutionary War hero and North Carolina politician.
Geography
Rutherford County covers an area of 624 square miles, making it the fifth largest county in Tennessee. The terrain is mostly rolling hills, with the highest point being the summit of Short Mountain at 1,068 feet. The county is drained by the Stones River, which flows through the center of the county. The county is also home to several lakes, including Percy Priest Lake, J. Percy Priest Reservoir, and Old Hickory Lake.
Climate
Rutherford County has a humid subtropical climate, with hot, humid summers and mild winters. The average annual temperature is around 62°F, with the average high in July being around 90°F and the average low in January being around 34°F. The average annual precipitation is around 45 inches, with the wettest month being May and the driest month being October.
Demographics
As of the 2010 census, Rutherford County had a population of 262,604, making it the fifth most populous county in Tennessee. The racial makeup of the county was 81.3% White, 13.2% African American, 0.7% Native American, 2.2% Asian, 0.1% Pacific Islander, and 2.5% from other races. Hispanic or Latino of any race were 5.2% of the population.
The median household income in the county was $50,813, and the median family income was $60,867. The per capita income was $25,988. About 10.2% of the population was below the poverty line.
Economy
Rutherford County has a diverse economy, with a mix of manufacturing, retail, healthcare, and education. The largest employers in the county are Nissan North America, State Farm Insurance, Middle Tennessee State University, and Saint Thomas Rutherford Hospital.
The county is also home to several major shopping centers, including The Avenue Murfreesboro, Stones River Mall, and The Shops at Indian Lake.
History
Rutherford County was formed in 1803 from parts of Davidson and Williamson counties. It was named after Griffith Rutherford, a Revolutionary War hero and North Carolina politician.
The county was home to several Native American tribes, including the Cherokee, Chickasaw, and Choctaw. The first European settlers arrived in the area in the late 1700s, and the county was officially established in 1803.
During the Civil War, Rutherford County was the site of several battles, including the Battle of Stones River and the Battle of Murfreesboro. After the war, the county experienced a period of growth and development, with the establishment of several towns and cities, including Murfreesboro, Smyrna, and La Vergne.
In the late 20th century, Rutherford County experienced a population boom, due in part to its proximity to Nashville. The county has continued to grow in recent years, and is now home to several major employers, shopping centers, and educational institutions.
Common Questions
What is the Total Population of Rutherford County?
Total Population of Rutherford County is 343,727.
What is the Total Male Population of Rutherford County?
Total Male Population of Rutherford County is 169,927.
What is the Total Female Population of Rutherford County?
Total Female Population of Rutherford County is 173,800.
What is the Ratio of Males per 100 Females in Rutherford County?
There are 97.77 Males per 100 Females in Rutherford County.
What is the Ratio of Females per 100 Males in Rutherford County?
There are 102.28 Females per 100 Males in Rutherford County.
What is the Median Population Age in Rutherford County?
Median Population Age in Rutherford County is 34.0 Years.
What is the Average Family Size in Rutherford County
Average Family Size in Rutherford County is 3.2 People.
What is the Average Household Size in Rutherford County
Average Household Size in Rutherford County is 2.8 People.
What is Per Capita Income in Rutherford County?
Per Capita income in Rutherford County is $35,135.
What is the Median Family Income in Rutherford County?
Median Family Income in Rutherford County is $90,389.
What is the Median Household income in Rutherford County?
Median Household Income in Rutherford County is $78,291.
What is Income or Wage Gap in Rutherford County?
Income or Wage Gap in Rutherford County is 25.6%.
Women in Rutherford County earn 74.4 cents for every dollar earned by a man.
What is Family Income Deficit in Rutherford County?
Family Income Deficit in Rutherford County is $10,491.
Families that are below poverty line in Rutherford County earn $10,491 less on average than the poverty threshold level.
What is Inequality or Gini Index in Rutherford County?
Inequality or Gini Index in Rutherford County is 0.40.
How Large is the Labor Force in Rutherford County?
There are 192,211 People in the Labor Forcein in Rutherford County.
What is the Percentage of People in the Labor Force in Rutherford County?
71.2% of People are in the Labor Force in Rutherford County.
What is the Unemployment Rate in Rutherford County?
Unemployment Rate in Rutherford County is 3.9%.