Robertson County, TN
Robertson County Map
Robertson County Overview
73,297
TOTAL POPULATION
36,439
MALE POPULATION
36,858
FEMALE POPULATION
98.86
MALES / 100 FEMALES
101.15
FEMALES / 100 MALES
39.4
MEDIAN AGE
3.1
AVG FAMILY SIZE
2.7
AVG HOUSEHOLD SIZE
$35,093
PER CAPITA INCOME
$87,439
AVG FAMILY INCOME
$74,440
AVG HOUSEHOLD INCOME
28.6%
WAGE / INCOME GAP [ % ]
71.4¢/ $1
WAGE / INCOME GAP [ $ ]
$10,404
FAMILY INCOME DEFICIT
0.41
INEQUALITY / GINI INDEX
37,297
LABOR FORCE [ PEOPLE ]
64.3%
PERCENT IN LABOR FORCE
3.8%
UNEMPLOYMENT RATE
Race in Robertson County
The most populous races in Robertson County are White / Caucasian (61,202 | 83.5%), Hispanic or Latino (5,636 | 7.7%), and Black / African American (5,263 | 7.2%).
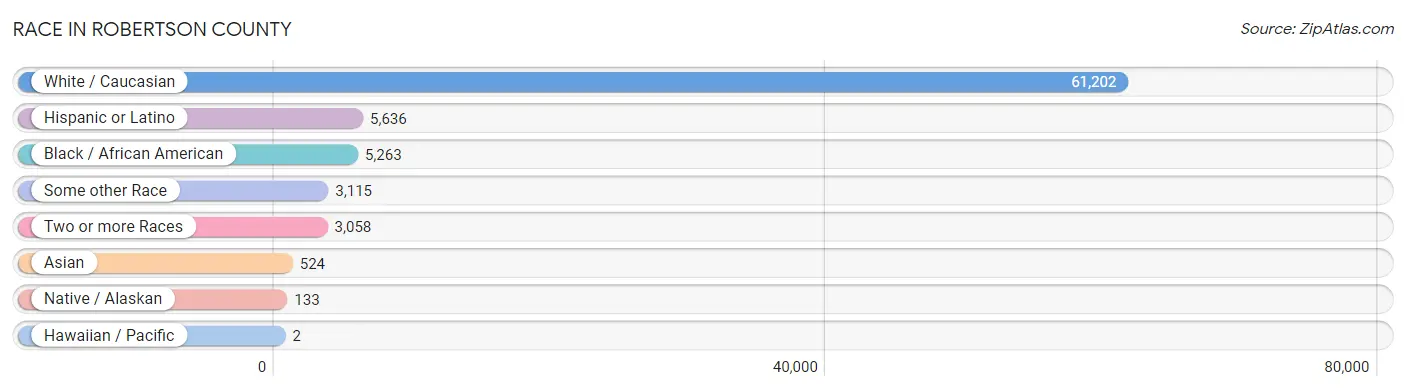
| Race | # Population | % Population |
| Asian | 524 | 0.7% |
| Black / African American | 5,263 | 7.2% |
| Hawaiian / Pacific | 2 | 0.0% |
| Hispanic or Latino | 5,636 | 7.7% |
| Native / Alaskan | 133 | 0.2% |
| White / Caucasian | 61,202 | 83.5% |
| Two or more Races | 3,058 | 4.2% |
| Some other Race | 3,115 | 4.3% |
| Total | 73,297 | 100.0% |
Ancestry in Robertson County
The most populous ancestries reported in Robertson County are American (12,111 | 16.5%), English (8,783 | 12.0%), German (8,336 | 11.4%), Irish (7,878 | 10.7%), and Mexican (3,941 | 5.4%), together accounting for 56.0% of all Robertson County residents.
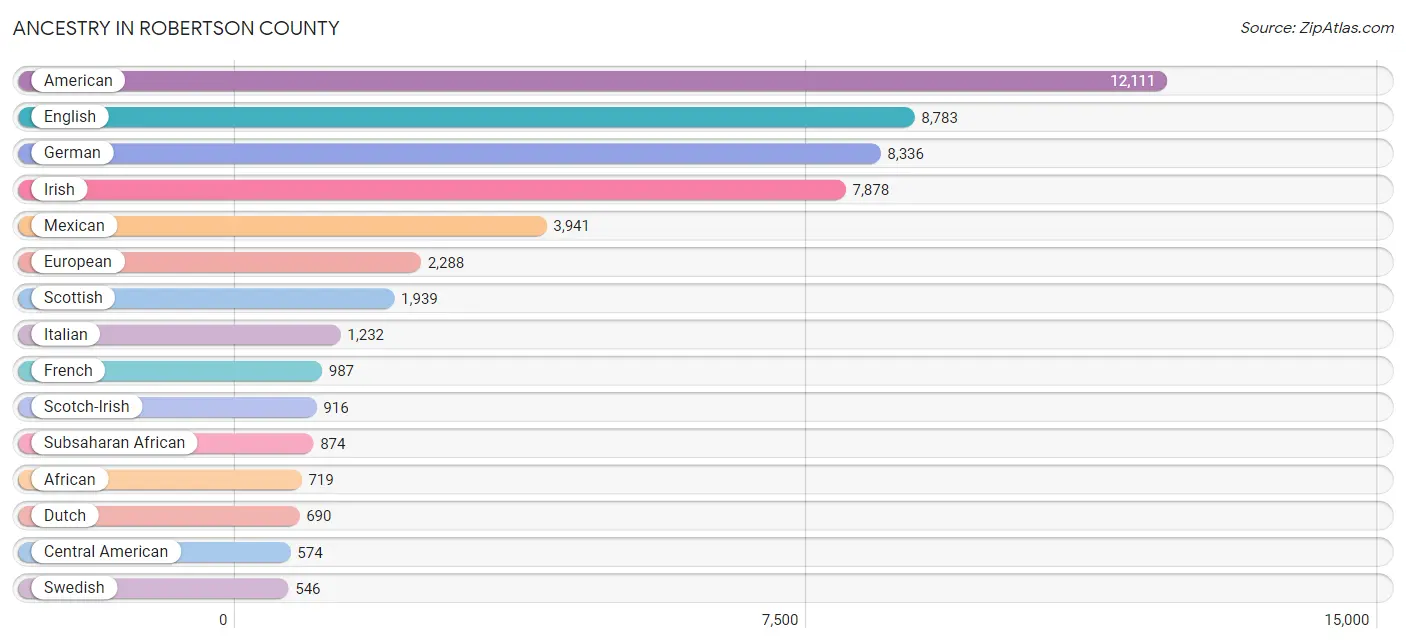
| Ancestry | # Population | % Population |
| African | 719 | 1.0% |
| American | 12,111 | 16.5% |
| Arab | 90 | 0.1% |
| Argentinean | 26 | 0.0% |
| Australian | 40 | 0.1% |
| Austrian | 19 | 0.0% |
| Belgian | 6 | 0.0% |
| Bhutanese | 105 | 0.1% |
| Blackfeet | 5 | 0.0% |
| Brazilian | 7 | 0.0% |
| British | 224 | 0.3% |
| Burmese | 171 | 0.2% |
| Canadian | 116 | 0.2% |
| Central American | 574 | 0.8% |
| Central American Indian | 22 | 0.0% |
| Cherokee | 471 | 0.6% |
| Choctaw | 93 | 0.1% |
| Colombian | 103 | 0.1% |
| Costa Rican | 28 | 0.0% |
| Creek | 5 | 0.0% |
| Croatian | 23 | 0.0% |
| Cuban | 165 | 0.2% |
| Czech | 200 | 0.3% |
| Czechoslovakian | 11 | 0.0% |
| Danish | 207 | 0.3% |
| Dominican | 1 | 0.0% |
| Dutch | 690 | 0.9% |
| Eastern European | 52 | 0.1% |
| English | 8,783 | 12.0% |
| European | 2,288 | 3.1% |
| Finnish | 102 | 0.1% |
| French | 987 | 1.3% |
| French Canadian | 275 | 0.4% |
| German | 8,336 | 11.4% |
| Greek | 150 | 0.2% |
| Guamanian / Chamorro | 2 | 0.0% |
| Guatemalan | 133 | 0.2% |
| Haitian | 6 | 0.0% |
| Honduran | 221 | 0.3% |
| Hungarian | 176 | 0.2% |
| Indian (Asian) | 91 | 0.1% |
| Iranian | 9 | 0.0% |
| Irish | 7,878 | 10.7% |
| Italian | 1,232 | 1.7% |
| Jamaican | 25 | 0.0% |
| Jordanian | 16 | 0.0% |
| Korean | 110 | 0.2% |
| Lebanese | 60 | 0.1% |
| Lithuanian | 5 | 0.0% |
| Malaysian | 49 | 0.1% |
| Mexican | 3,941 | 5.4% |
| Mexican American Indian | 75 | 0.1% |
| Native Hawaiian | 6 | 0.0% |
| Nigerian | 97 | 0.1% |
| Northern European | 6 | 0.0% |
| Norwegian | 277 | 0.4% |
| Pakistani | 108 | 0.2% |
| Palestinian | 14 | 0.0% |
| Polish | 321 | 0.4% |
| Portuguese | 61 | 0.1% |
| Puerto Rican | 329 | 0.4% |
| Romanian | 8 | 0.0% |
| Russian | 255 | 0.4% |
| Salvadoran | 181 | 0.3% |
| Samoan | 4 | 0.0% |
| Scandinavian | 167 | 0.2% |
| Scotch-Irish | 916 | 1.3% |
| Scottish | 1,939 | 2.6% |
| Sioux | 49 | 0.1% |
| Slovak | 17 | 0.0% |
| Slovene | 8 | 0.0% |
| South African | 4 | 0.0% |
| South American | 217 | 0.3% |
| South American Indian | 27 | 0.0% |
| Spaniard | 142 | 0.2% |
| Spanish | 8 | 0.0% |
| Sri Lankan | 25 | 0.0% |
| Subsaharan African | 874 | 1.2% |
| Sudanese | 46 | 0.1% |
| Swedish | 546 | 0.7% |
| Swiss | 68 | 0.1% |
| Thai | 38 | 0.1% |
| Venezuelan | 30 | 0.0% |
| Welsh | 485 | 0.7% |
| Yugoslavian | 38 | 0.1% | View All 85 Rows |
Immigrants in Robertson County
The most numerous immigrant groups reported in Robertson County came from Latin America (2,411 | 3.3%), Central America (2,153 | 2.9%), Mexico (1,682 | 2.3%), Asia (414 | 0.6%), and Europe (275 | 0.4%), together accounting for 9.5% of all Robertson County residents.
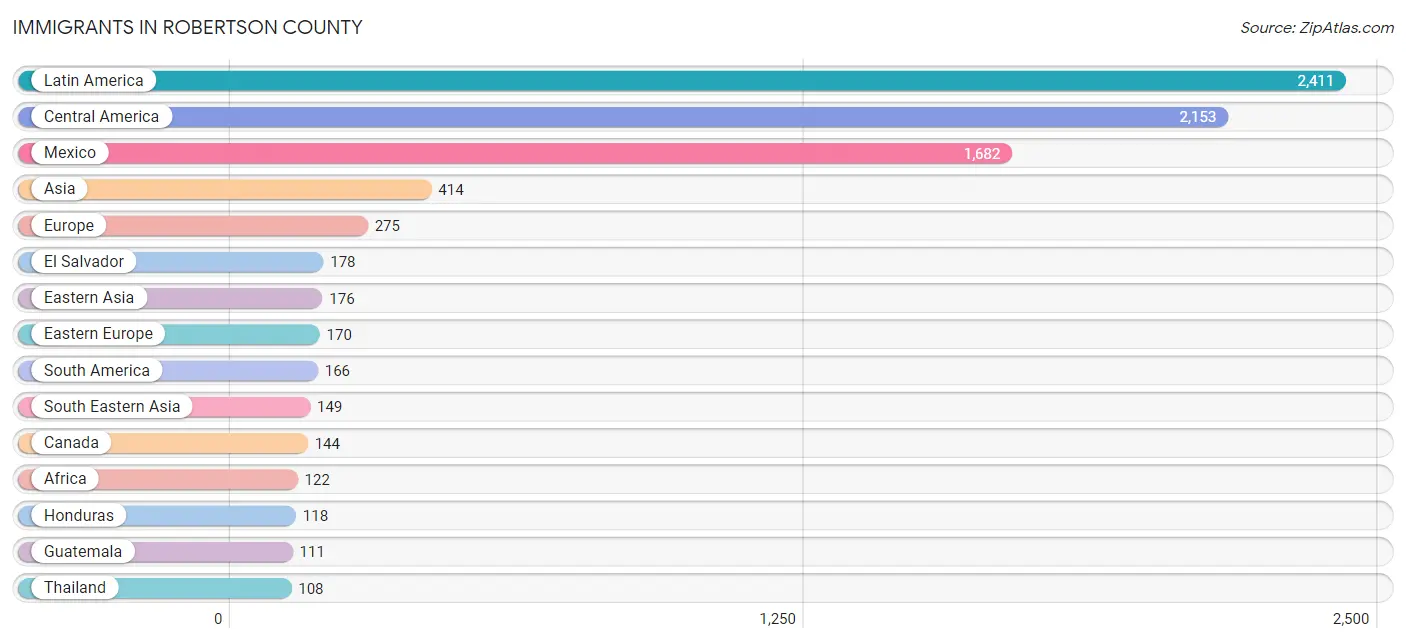
| Immigration Origin | # Population | % Population |
| Africa | 122 | 0.2% |
| Argentina | 26 | 0.0% |
| Asia | 414 | 0.6% |
| Bosnia and Herzegovina | 38 | 0.1% |
| Brazil | 13 | 0.0% |
| Canada | 144 | 0.2% |
| Caribbean | 92 | 0.1% |
| Central America | 2,153 | 2.9% |
| China | 73 | 0.1% |
| Colombia | 37 | 0.1% |
| Costa Rica | 64 | 0.1% |
| Cuba | 57 | 0.1% |
| Czechoslovakia | 86 | 0.1% |
| Dominican Republic | 1 | 0.0% |
| Eastern Africa | 29 | 0.0% |
| Eastern Asia | 176 | 0.2% |
| Eastern Europe | 170 | 0.2% |
| Ecuador | 29 | 0.0% |
| Egypt | 6 | 0.0% |
| El Salvador | 178 | 0.2% |
| Eritrea | 10 | 0.0% |
| Europe | 275 | 0.4% |
| Germany | 50 | 0.1% |
| Guatemala | 111 | 0.2% |
| Honduras | 118 | 0.2% |
| India | 54 | 0.1% |
| Indonesia | 1 | 0.0% |
| Iran | 9 | 0.0% |
| Italy | 4 | 0.0% |
| Jamaica | 12 | 0.0% |
| Japan | 23 | 0.0% |
| Jordan | 10 | 0.0% |
| Korea | 80 | 0.1% |
| Latin America | 2,411 | 3.3% |
| Mexico | 1,682 | 2.3% |
| Nigeria | 52 | 0.1% |
| Northern Africa | 37 | 0.1% |
| Northern Europe | 51 | 0.1% |
| Pakistan | 16 | 0.0% |
| Philippines | 40 | 0.1% |
| Romania | 18 | 0.0% |
| Russia | 28 | 0.0% |
| Scotland | 15 | 0.0% |
| South Africa | 4 | 0.0% |
| South America | 166 | 0.2% |
| South Central Asia | 79 | 0.1% |
| South Eastern Asia | 149 | 0.2% |
| Southern Europe | 4 | 0.0% |
| St. Vincent and the Grenadines | 22 | 0.0% |
| Sudan | 10 | 0.0% |
| Thailand | 108 | 0.2% |
| Venezuela | 61 | 0.1% |
| Western Africa | 52 | 0.1% |
| Western Asia | 10 | 0.0% |
| Western Europe | 50 | 0.1% | View All 55 Rows |
Sex and Age in Robertson County
Sex and Age in Robertson County
The most populous age groups in Robertson County are 10 to 14 Years (2,847 | 7.8%) for men and 55 to 59 Years (2,914 | 7.9%) for women.
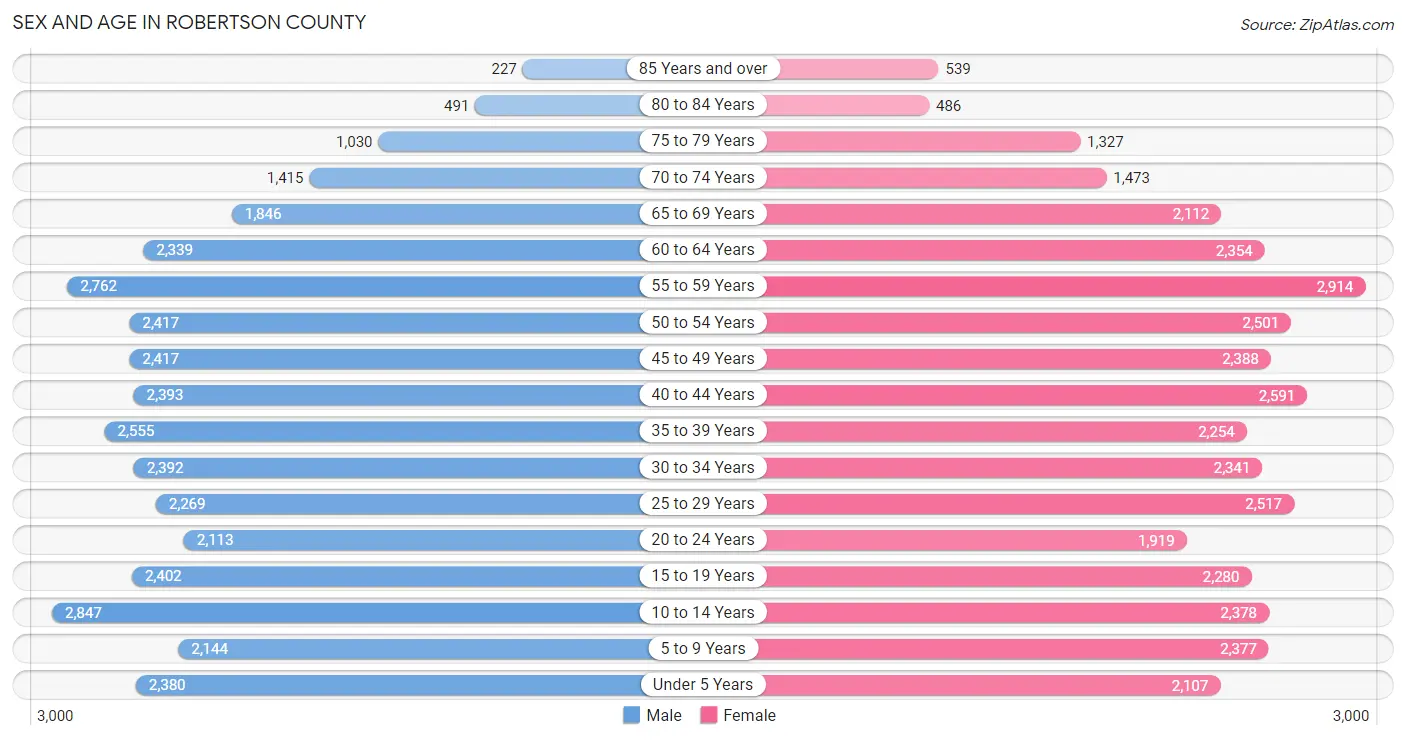
| Age Bracket | Male | Female |
| Under 5 Years | 2,380 (6.5%) | 2,107 (5.7%) |
| 5 to 9 Years | 2,144 (5.9%) | 2,377 (6.5%) |
| 10 to 14 Years | 2,847 (7.8%) | 2,378 (6.5%) |
| 15 to 19 Years | 2,402 (6.6%) | 2,280 (6.2%) |
| 20 to 24 Years | 2,113 (5.8%) | 1,919 (5.2%) |
| 25 to 29 Years | 2,269 (6.2%) | 2,517 (6.8%) |
| 30 to 34 Years | 2,392 (6.6%) | 2,341 (6.4%) |
| 35 to 39 Years | 2,555 (7.0%) | 2,254 (6.1%) |
| 40 to 44 Years | 2,393 (6.6%) | 2,591 (7.0%) |
| 45 to 49 Years | 2,417 (6.6%) | 2,388 (6.5%) |
| 50 to 54 Years | 2,417 (6.6%) | 2,501 (6.8%) |
| 55 to 59 Years | 2,762 (7.6%) | 2,914 (7.9%) |
| 60 to 64 Years | 2,339 (6.4%) | 2,354 (6.4%) |
| 65 to 69 Years | 1,846 (5.1%) | 2,112 (5.7%) |
| 70 to 74 Years | 1,415 (3.9%) | 1,473 (4.0%) |
| 75 to 79 Years | 1,030 (2.8%) | 1,327 (3.6%) |
| 80 to 84 Years | 491 (1.3%) | 486 (1.3%) |
| 85 Years and over | 227 (0.6%) | 539 (1.5%) |
| Total | 36,439 (100.0%) | 36,858 (100.0%) |
Families and Households in Robertson County
Median Family Size in Robertson County
The median family size in Robertson County is 3.09 persons per family, with married-couple families (15,568 | 76.9%) accounting for the largest median family size of 3.13 persons per family. On the other hand, single male/father families (1,409 | 7.0%) represent the smallest median family size with 2.70 persons per family.
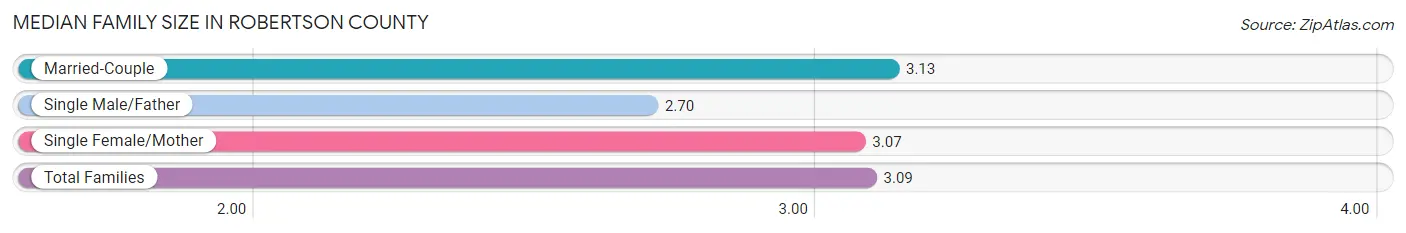
| Family Type | # Families | Family Size |
| Married-Couple | 15,568 (76.9%) | 3.13 |
| Single Male/Father | 1,409 (7.0%) | 2.70 |
| Single Female/Mother | 3,263 (16.1%) | 3.07 |
| Total Families | 20,240 (100.0%) | 3.09 |
Median Household Size in Robertson County
The median household size in Robertson County is 2.67 persons per household, with single female/mother households (3,263 | 12.0%) accounting for the largest median household size of 3.3 persons per household. non-family households (6,914 | 25.5%) represent the smallest median household size with 1.22 persons per household.
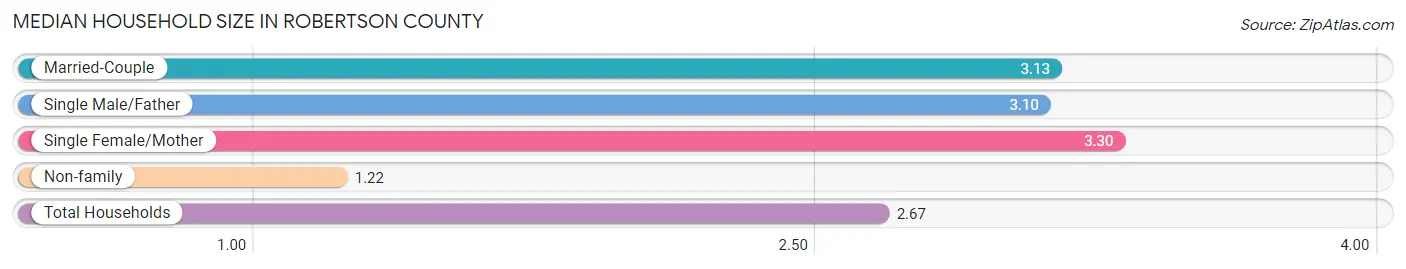
| Household Type | # Households | Household Size |
| Married-Couple | 15,568 (57.3%) | 3.13 |
| Single Male/Father | 1,409 (5.2%) | 3.10 |
| Single Female/Mother | 3,263 (12.0%) | 3.30 |
| Non-family | 6,914 (25.5%) | 1.22 |
| Total Households | 27,154 (100.0%) | 2.67 |
Household Size by Marriage Status in Robertson County
Out of a total of 27,154 households in Robertson County, 20,240 (74.5%) are family households, while 6,914 (25.5%) are nonfamily households. The most numerous type of family households are 2-person households, comprising 8,925, and the most common type of nonfamily households are 1-person households, comprising 5,593.
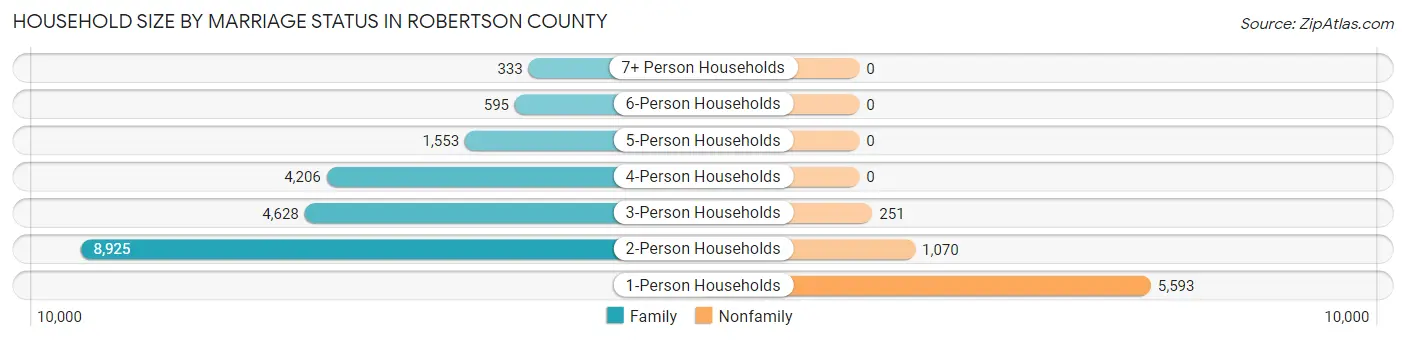
| Household Size | Family Households | Nonfamily Households |
| 1-Person Households | - | 5,593 (20.6%) |
| 2-Person Households | 8,925 (32.9%) | 1,070 (3.9%) |
| 3-Person Households | 4,628 (17.0%) | 251 (0.9%) |
| 4-Person Households | 4,206 (15.5%) | 0 (0.0%) |
| 5-Person Households | 1,553 (5.7%) | 0 (0.0%) |
| 6-Person Households | 595 (2.2%) | 0 (0.0%) |
| 7+ Person Households | 333 (1.2%) | 0 (0.0%) |
| Total | 20,240 (74.5%) | 6,914 (25.5%) |
Female Fertility in Robertson County
Fertility by Age in Robertson County
Average fertility rate in Robertson County is 67.0 births per 1,000 women. Women in the age bracket of 20 to 34 years have the highest fertility rate with 131.0 births per 1,000 women. Women in the age bracket of 20 to 34 years acount for 78.1% of all women with births.
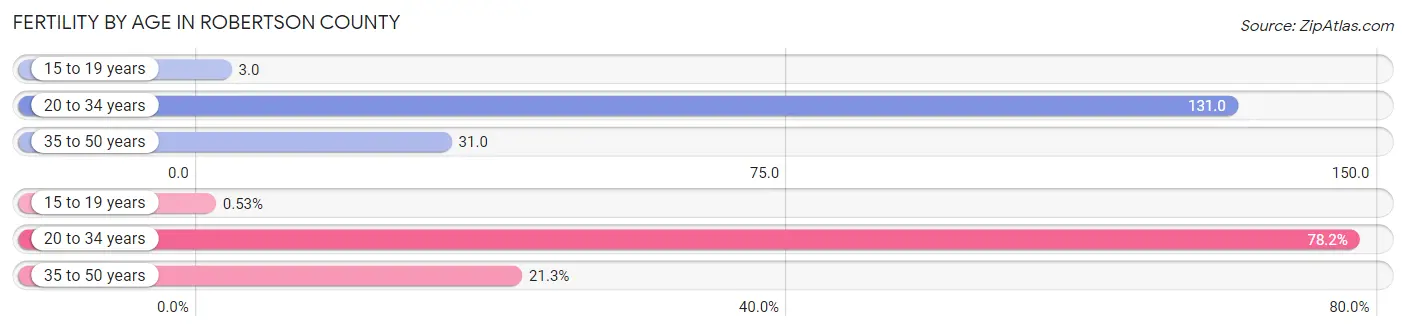
| Age Bracket | Women with Births | Births / 1,000 Women |
| 15 to 19 years | 6 (0.5%) | 3.0 |
| 20 to 34 years | 887 (78.1%) | 131.0 |
| 35 to 50 years | 242 (21.3%) | 31.0 |
| Total | 1,135 (100.0%) | 67.0 |
Fertility by Age by Marriage Status in Robertson County
82.9% of women with births (1,135) in Robertson County are married. The highest percentage of unmarried women with births falls into 15 to 19 years age bracket with 100.0% of them unmarried at the time of birth, while the lowest percentage of unmarried women with births belong to 35 to 50 years age bracket with 5.0% of them unmarried.
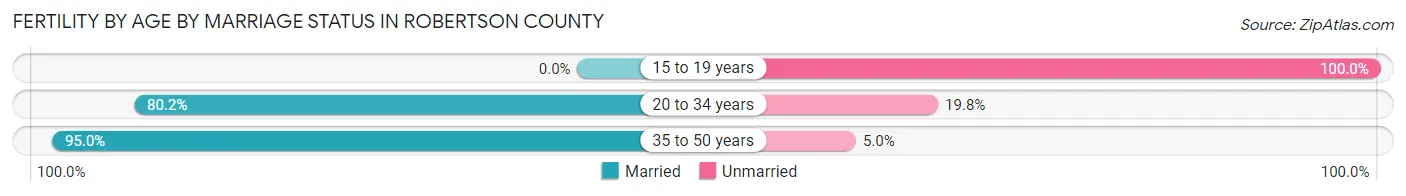
| Age Bracket | Married | Unmarried |
| 15 to 19 years | 0 (0.0%) | 6 (100.0%) |
| 20 to 34 years | 711 (80.2%) | 176 (19.8%) |
| 35 to 50 years | 230 (95.0%) | 12 (5.0%) |
| Total | 941 (82.9%) | 194 (17.1%) |
Fertility by Education in Robertson County
Average fertility rate in Robertson County is 67.0 births per 1,000 women. Women with the education attainment of bachelor's degree have the highest fertility rate of 97.0 births per 1,000 women, while women with the education attainment of less than high school have the lowest fertility at 11.0 births per 1,000 women. Women with the education attainment of college or associate's degree represent 42.5% of all women with births.
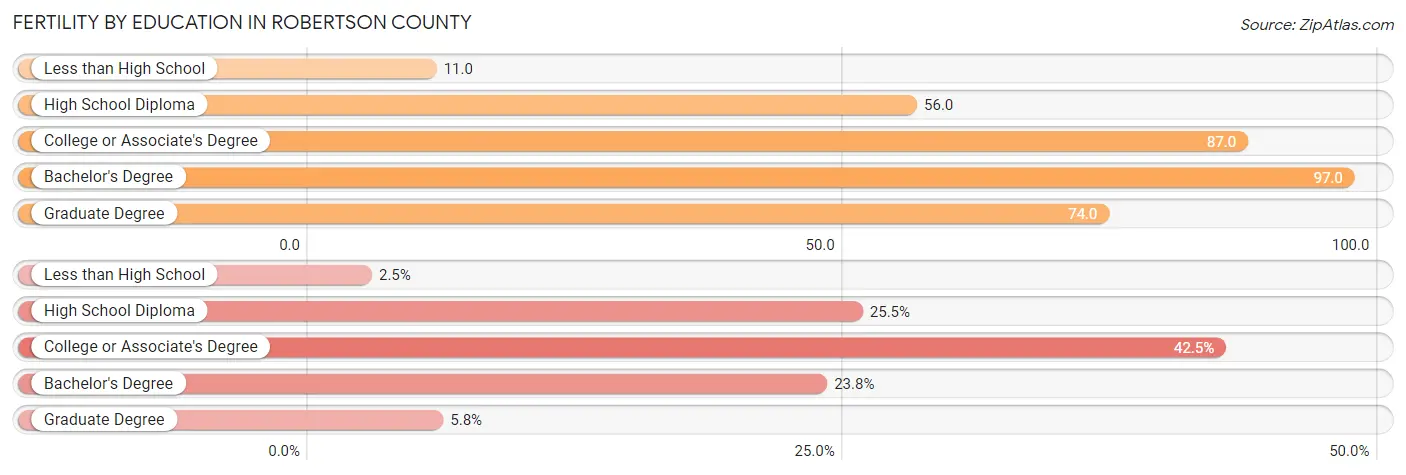
| Educational Attainment | Women with Births | Births / 1,000 Women |
| Less than High School | 28 (2.5%) | 11.0 |
| High School Diploma | 289 (25.5%) | 56.0 |
| College or Associate's Degree | 482 (42.5%) | 87.0 |
| Bachelor's Degree | 270 (23.8%) | 97.0 |
| Graduate Degree | 66 (5.8%) | 74.0 |
| Total | 1,135 (100.0%) | 67.0 |
Fertility by Education by Marriage Status in Robertson County
17.1% of women with births in Robertson County are unmarried. Women with the educational attainment of less than high school are most likely to be married with 100.0% of them married at childbirth, while women with the educational attainment of high school diploma are least likely to be married with 42.2% of them unmarried at childbirth.
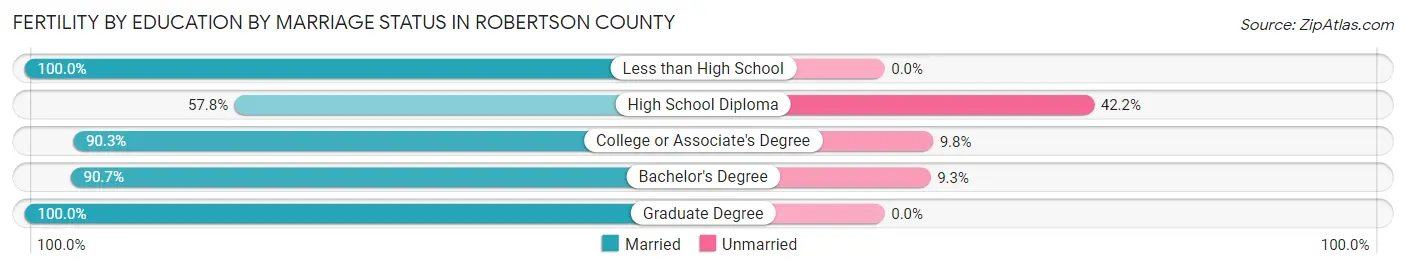
| Educational Attainment | Married | Unmarried |
| Less than High School | 28 (100.0%) | 0 (0.0%) |
| High School Diploma | 167 (57.8%) | 122 (42.2%) |
| College or Associate's Degree | 435 (90.2%) | 47 (9.8%) |
| Bachelor's Degree | 245 (90.7%) | 25 (9.3%) |
| Graduate Degree | 66 (100.0%) | 0 (0.0%) |
| Total | 941 (82.9%) | 194 (17.1%) |
Income in Robertson County
Income Overview in Robertson County
Per Capita Income in Robertson County is $35,093, while median incomes of families and households are $87,439 and $74,440 respectively.
| Characteristic | Number | Measure |
| Per Capita Income | 73,297 | $35,093 |
| Median Family Income | 20,240 | $87,439 |
| Mean Family Income | 20,240 | $102,347 |
| Median Household Income | 27,154 | $74,440 |
| Mean Household Income | 27,154 | $92,227 |
| Income Deficit | 20,240 | $10,404 |
| Wage / Income Gap (%) | 73,297 | 28.61% |
| Wage / Income Gap ($) | 73,297 | 71.39¢ per $1 |
| Gini / Inequality Index | 73,297 | 0.41 |
Earnings by Sex in Robertson County
Average Earnings in Robertson County are $42,251, $48,793 for men and $34,832 for women, a difference of 28.6%.
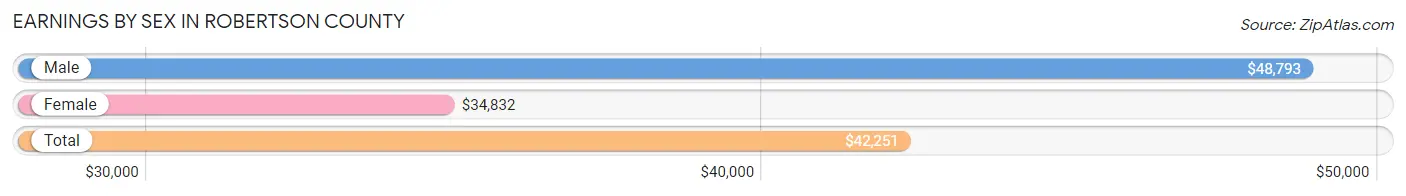
| Sex | Number | Average Earnings |
| Male | 21,061 (53.3%) | $48,793 |
| Female | 18,415 (46.7%) | $34,832 |
| Total | 39,476 (100.0%) | $42,251 |
Earnings by Sex by Income Bracket in Robertson County
The most common earnings brackets in Robertson County are $100,000+ for men (2,976 | 14.1%) and $25,000 to $29,999 for women (1,551 | 8.4%).
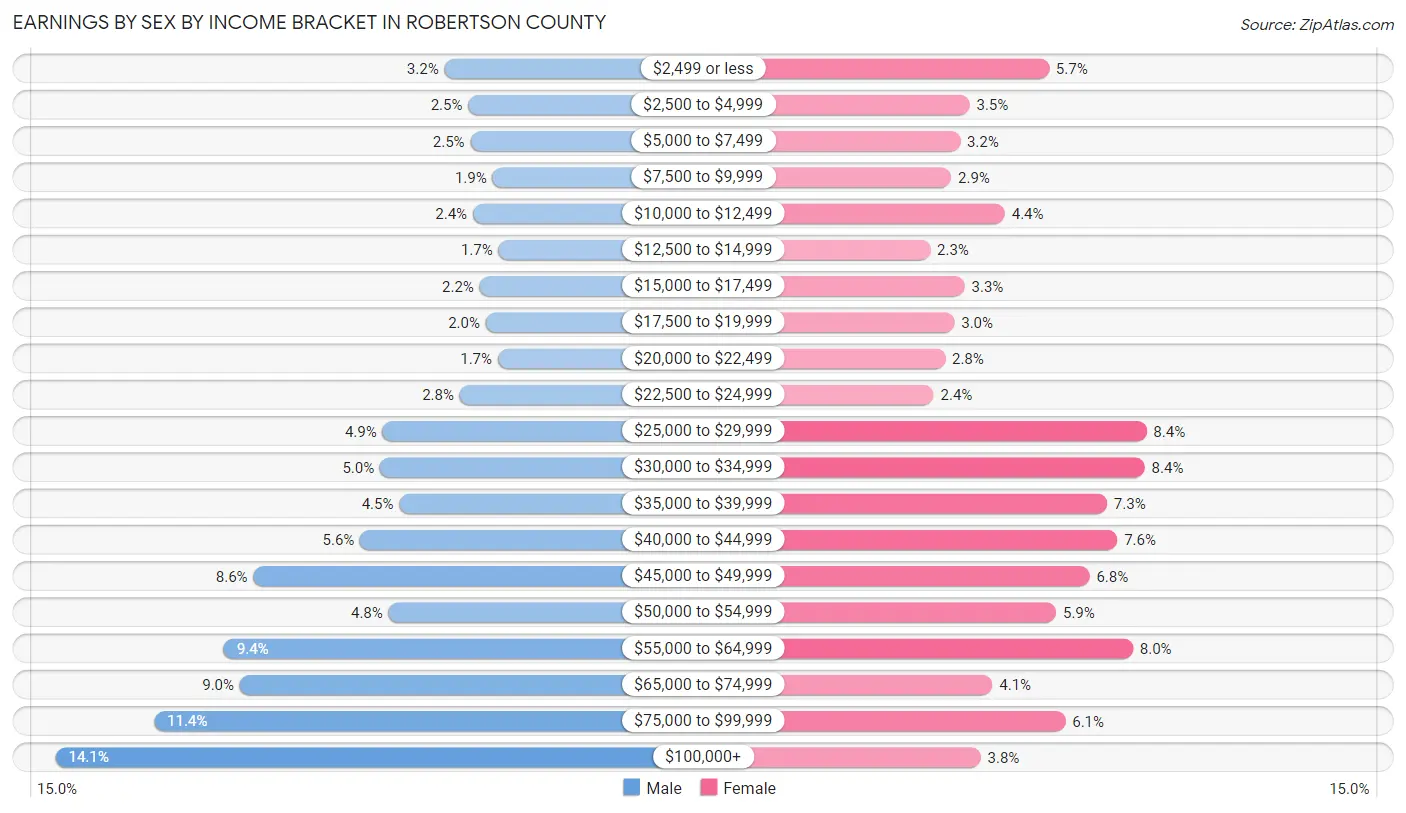
| Income | Male | Female |
| $2,499 or less | 674 (3.2%) | 1,046 (5.7%) |
| $2,500 to $4,999 | 532 (2.5%) | 636 (3.5%) |
| $5,000 to $7,499 | 520 (2.5%) | 586 (3.2%) |
| $7,500 to $9,999 | 390 (1.8%) | 539 (2.9%) |
| $10,000 to $12,499 | 505 (2.4%) | 817 (4.4%) |
| $12,500 to $14,999 | 353 (1.7%) | 430 (2.3%) |
| $15,000 to $17,499 | 466 (2.2%) | 610 (3.3%) |
| $17,500 to $19,999 | 429 (2.0%) | 557 (3.0%) |
| $20,000 to $22,499 | 357 (1.7%) | 509 (2.8%) |
| $22,500 to $24,999 | 583 (2.8%) | 450 (2.4%) |
| $25,000 to $29,999 | 1,040 (4.9%) | 1,551 (8.4%) |
| $30,000 to $34,999 | 1,056 (5.0%) | 1,542 (8.4%) |
| $35,000 to $39,999 | 942 (4.5%) | 1,346 (7.3%) |
| $40,000 to $44,999 | 1,174 (5.6%) | 1,400 (7.6%) |
| $45,000 to $49,999 | 1,804 (8.6%) | 1,256 (6.8%) |
| $50,000 to $54,999 | 1,004 (4.8%) | 1,083 (5.9%) |
| $55,000 to $64,999 | 1,979 (9.4%) | 1,481 (8.0%) |
| $65,000 to $74,999 | 1,885 (8.9%) | 754 (4.1%) |
| $75,000 to $99,999 | 2,392 (11.4%) | 1,130 (6.1%) |
| $100,000+ | 2,976 (14.1%) | 692 (3.8%) |
| Total | 21,061 (100.0%) | 18,415 (100.0%) |
Earnings by Sex by Educational Attainment in Robertson County
Average earnings in Robertson County are $54,402 for men and $38,208 for women, a difference of 29.8%. Men with an educational attainment of graduate degree enjoy the highest average annual earnings of $95,000, while those with high school diploma education earn the least with $45,916. Women with an educational attainment of graduate degree earn the most with the average annual earnings of $55,536, while those with less than high school education have the smallest earnings of $21,875.
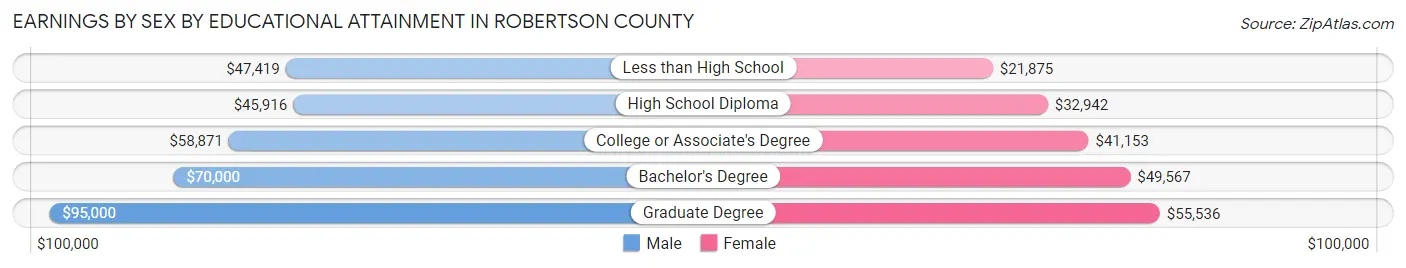
| Educational Attainment | Male Income | Female Income |
| Less than High School | $47,419 | $21,875 |
| High School Diploma | $45,916 | $32,942 |
| College or Associate's Degree | $58,871 | $41,153 |
| Bachelor's Degree | $70,000 | $49,567 |
| Graduate Degree | $95,000 | $55,536 |
| Total | $54,402 | $38,208 |
Family Income in Robertson County
Family Income Brackets in Robertson County
According to the Robertson County family income data, there are 4,594 families falling into the $100,000 to $149,999 income range, which is the most common income bracket and makes up 22.7% of all families. Conversely, the $10,000 to $14,999 income bracket is the least frequent group with only 405 families (2.0%) belonging to this category.
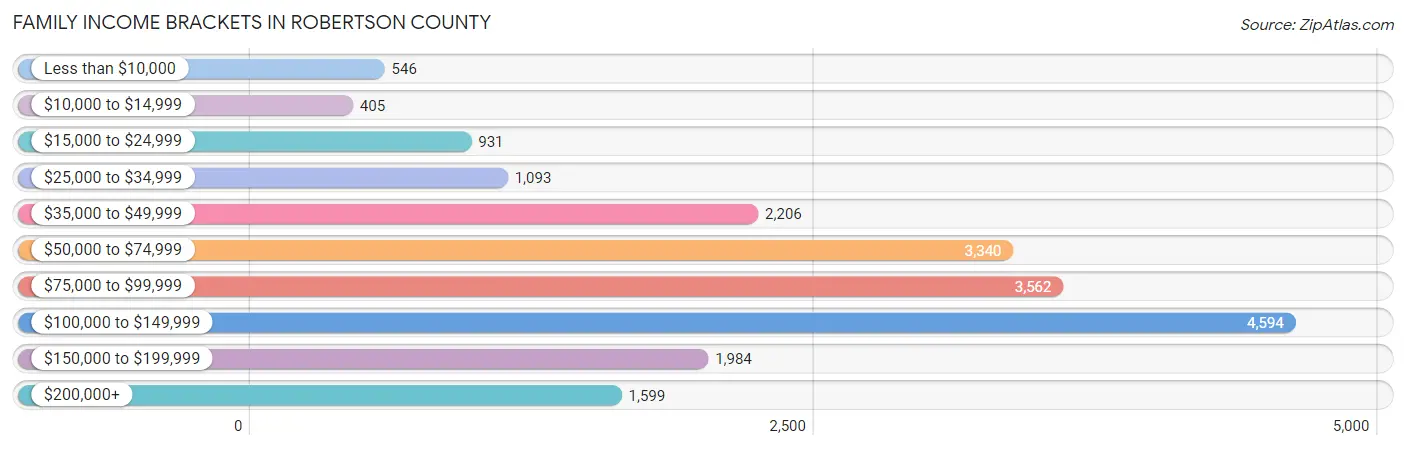
| Income Bracket | # Families | % Families |
| Less than $10,000 | 546 | 2.7% |
| $10,000 to $14,999 | 405 | 2.0% |
| $15,000 to $24,999 | 931 | 4.6% |
| $25,000 to $34,999 | 1,093 | 5.4% |
| $35,000 to $49,999 | 2,206 | 10.9% |
| $50,000 to $74,999 | 3,340 | 16.5% |
| $75,000 to $99,999 | 3,562 | 17.6% |
| $100,000 to $149,999 | 4,594 | 22.7% |
| $150,000 to $199,999 | 1,984 | 9.8% |
| $200,000+ | 1,599 | 7.9% |
Family Income by Famaliy Size in Robertson County
7+ person families (306 | 1.5%) account for the highest median family income in Robertson County with $120,143 per family, while 2-person families (9,486 | 46.9%) have the highest median income of $37,008 per family member.
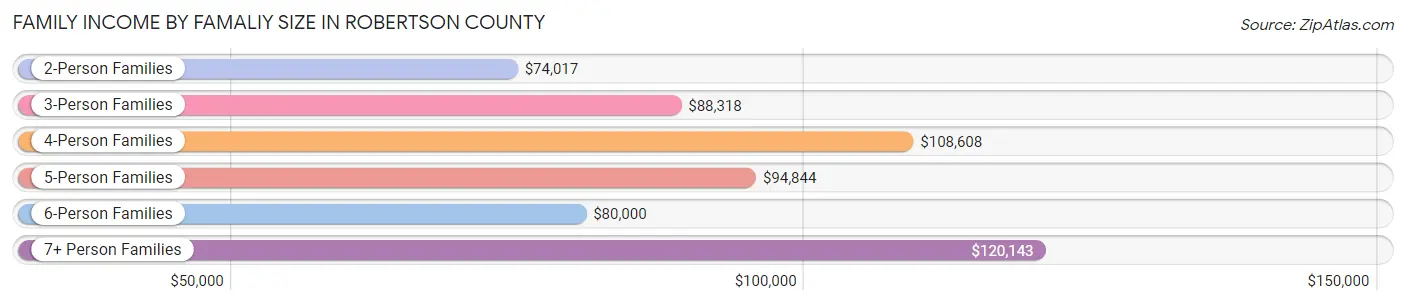
| Income Bracket | # Families | Median Income |
| 2-Person Families | 9,486 (46.9%) | $74,017 |
| 3-Person Families | 4,688 (23.2%) | $88,318 |
| 4-Person Families | 3,737 (18.5%) | $108,608 |
| 5-Person Families | 1,531 (7.6%) | $94,844 |
| 6-Person Families | 492 (2.4%) | $80,000 |
| 7+ Person Families | 306 (1.5%) | $120,143 |
| Total | 20,240 (100.0%) | $87,439 |
Family Income by Number of Earners in Robertson County
The median family income in Robertson County is $87,439, with families comprising 3+ earners (2,258) having the highest median family income of $126,864, while families with no earners (2,846) have the lowest median family income of $44,146, accounting for 11.2% and 14.1% of families, respectively.
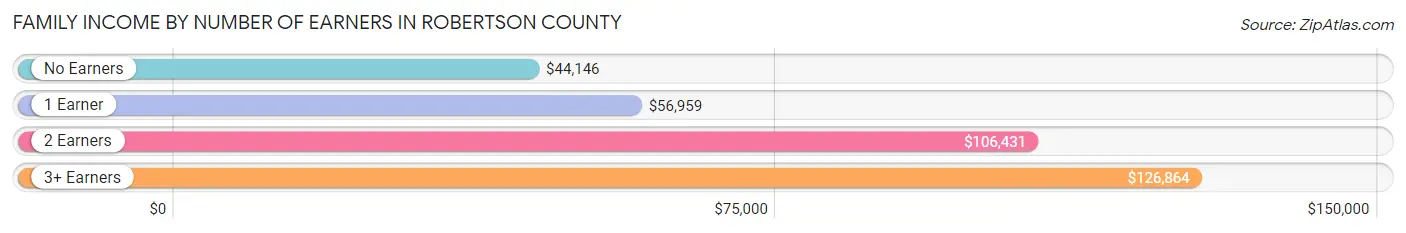
| Number of Earners | # Families | Median Income |
| No Earners | 2,846 (14.1%) | $44,146 |
| 1 Earner | 5,790 (28.6%) | $56,959 |
| 2 Earners | 9,346 (46.2%) | $106,431 |
| 3+ Earners | 2,258 (11.2%) | $126,864 |
| Total | 20,240 (100.0%) | $87,439 |
Household Income in Robertson County
Household Income Brackets in Robertson County
With 5,322 households falling in the category, the $100,000 to $149,999 income range is the most frequent in Robertson County, accounting for 19.6% of all households. In contrast, only 815 households (3.0%) fall into the less than $10,000 income bracket, making it the least populous group.
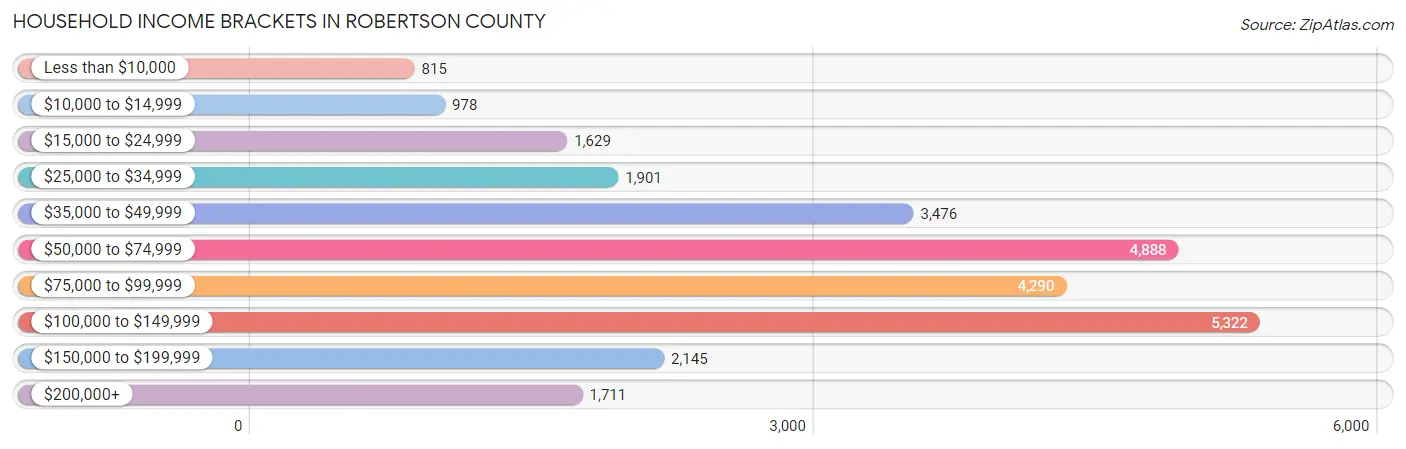
| Income Bracket | # Households | % Households |
| Less than $10,000 | 815 | 3.0% |
| $10,000 to $14,999 | 978 | 3.6% |
| $15,000 to $24,999 | 1,629 | 6.0% |
| $25,000 to $34,999 | 1,901 | 7.0% |
| $35,000 to $49,999 | 3,476 | 12.8% |
| $50,000 to $74,999 | 4,888 | 18.0% |
| $75,000 to $99,999 | 4,290 | 15.8% |
| $100,000 to $149,999 | 5,322 | 19.6% |
| $150,000 to $199,999 | 2,145 | 7.9% |
| $200,000+ | 1,711 | 6.3% |
Household Income by Householder Age in Robertson County
The median household income in Robertson County is $74,440, with the highest median household income of $87,472 found in the 45 to 64 years age bracket for the primary householder. A total of 10,833 households (39.9%) fall into this category. Meanwhile, the 15 to 24 years age bracket for the primary householder has the lowest median household income of $39,130, with 879 households (3.2%) in this group.
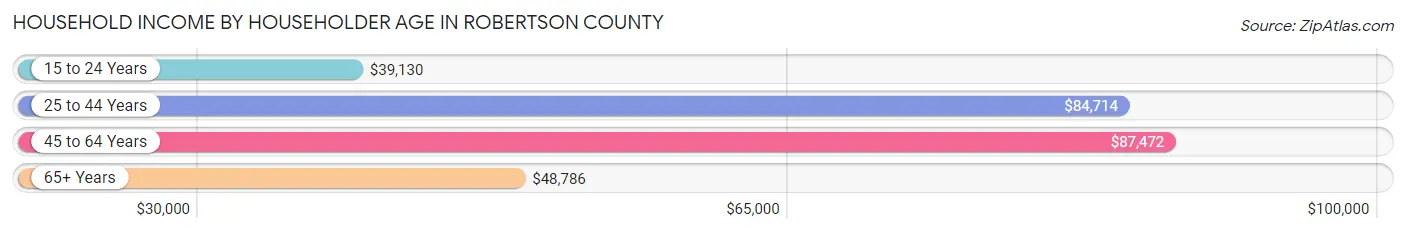
| Income Bracket | # Households | Median Income |
| 15 to 24 Years | 879 (3.2%) | $39,130 |
| 25 to 44 Years | 8,696 (32.0%) | $84,714 |
| 45 to 64 Years | 10,833 (39.9%) | $87,472 |
| 65+ Years | 6,746 (24.8%) | $48,786 |
| Total | 27,154 (100.0%) | $74,440 |
Poverty in Robertson County
Income Below Poverty by Sex and Age in Robertson County
With 10.1% poverty level for males and 10.5% for females among the residents of Robertson County, under 5 year old males and 5 year old females are the most vulnerable to poverty, with 598 males (25.7%) and 85 females (25.5%) in their respective age groups living below the poverty level.
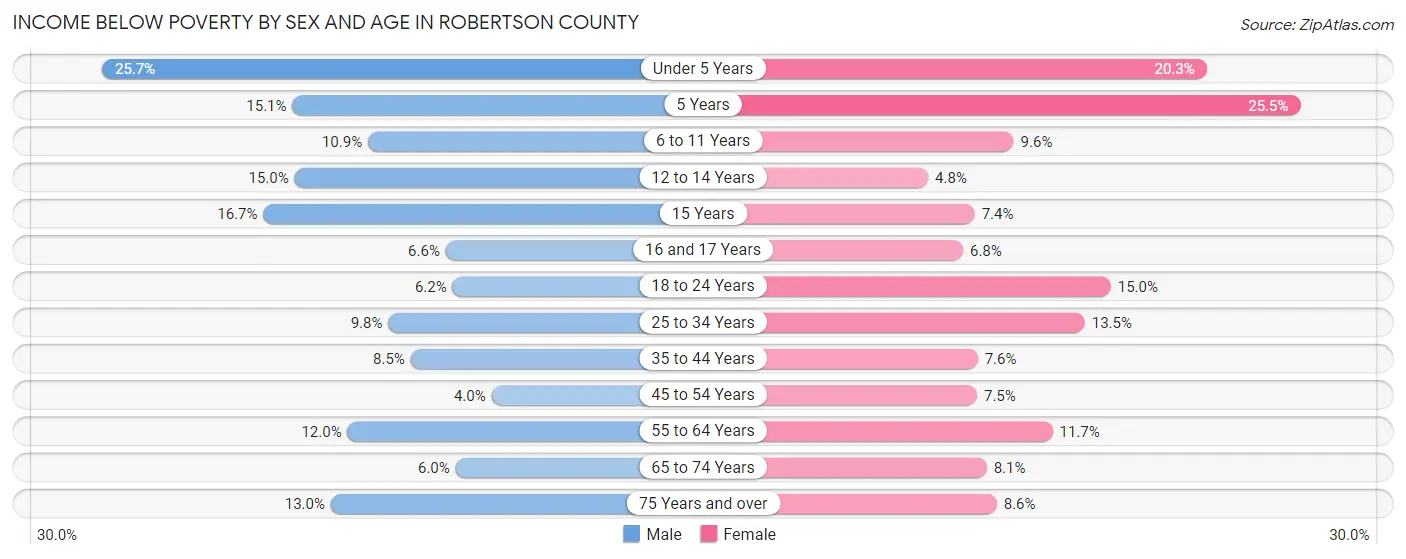
| Age Bracket | Male | Female |
| Under 5 Years | 598 (25.7%) | 428 (20.3%) |
| 5 Years | 64 (15.1%) | 85 (25.5%) |
| 6 to 11 Years | 278 (10.9%) | 270 (9.6%) |
| 12 to 14 Years | 298 (15.0%) | 77 (4.8%) |
| 15 Years | 71 (16.7%) | 47 (7.4%) |
| 16 and 17 Years | 73 (6.6%) | 63 (6.8%) |
| 18 to 24 Years | 181 (6.2%) | 394 (15.0%) |
| 25 to 34 Years | 439 (9.8%) | 653 (13.5%) |
| 35 to 44 Years | 413 (8.5%) | 364 (7.6%) |
| 45 to 54 Years | 190 (4.0%) | 365 (7.5%) |
| 55 to 64 Years | 609 (12.0%) | 615 (11.7%) |
| 65 to 74 Years | 191 (6.0%) | 289 (8.1%) |
| 75 Years and over | 222 (13.0%) | 193 (8.6%) |
| Total | 3,627 (10.1%) | 3,843 (10.5%) |
Income Above Poverty by Sex and Age in Robertson County
According to the poverty statistics in Robertson County, males aged 45 to 54 years and females aged 12 to 14 years are the age groups that are most secure financially, with 96.0% of males and 95.2% of females in these age groups living above the poverty line.
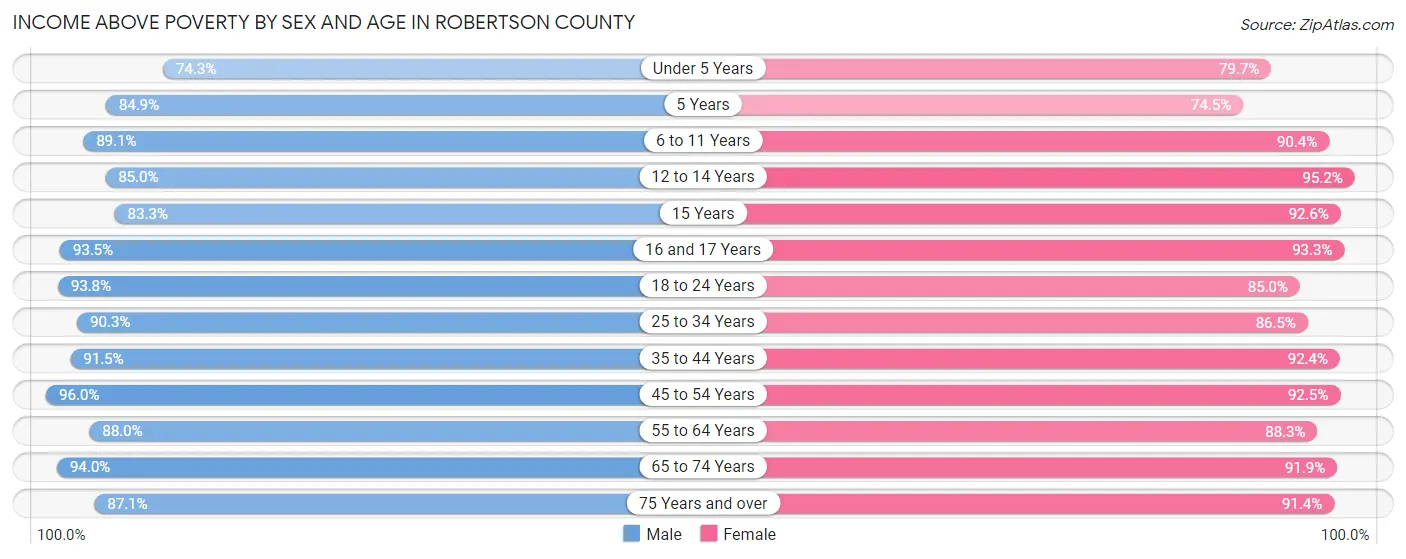
| Age Bracket | Male | Female |
| Under 5 Years | 1,730 (74.3%) | 1,679 (79.7%) |
| 5 Years | 360 (84.9%) | 248 (74.5%) |
| 6 to 11 Years | 2,278 (89.1%) | 2,550 (90.4%) |
| 12 to 14 Years | 1,692 (85.0%) | 1,525 (95.2%) |
| 15 Years | 354 (83.3%) | 588 (92.6%) |
| 16 and 17 Years | 1,041 (93.4%) | 871 (93.2%) |
| 18 to 24 Years | 2,754 (93.8%) | 2,236 (85.0%) |
| 25 to 34 Years | 4,062 (90.2%) | 4,173 (86.5%) |
| 35 to 44 Years | 4,444 (91.5%) | 4,443 (92.4%) |
| 45 to 54 Years | 4,559 (96.0%) | 4,484 (92.5%) |
| 55 to 64 Years | 4,457 (88.0%) | 4,623 (88.3%) |
| 65 to 74 Years | 2,990 (94.0%) | 3,294 (91.9%) |
| 75 Years and over | 1,492 (87.1%) | 2,043 (91.4%) |
| Total | 32,213 (89.9%) | 32,757 (89.5%) |
Income Below Poverty Among Married-Couple Families in Robertson County
The poverty statistics for married-couple families in Robertson County show that 4.9% or 761 of the total 15,568 families live below the poverty line. Families with 5 or more children have the highest poverty rate of 30.7%, comprising of 23 families. On the other hand, families with 1 or 2 children have the lowest poverty rate of 3.3%, which includes 176 families.
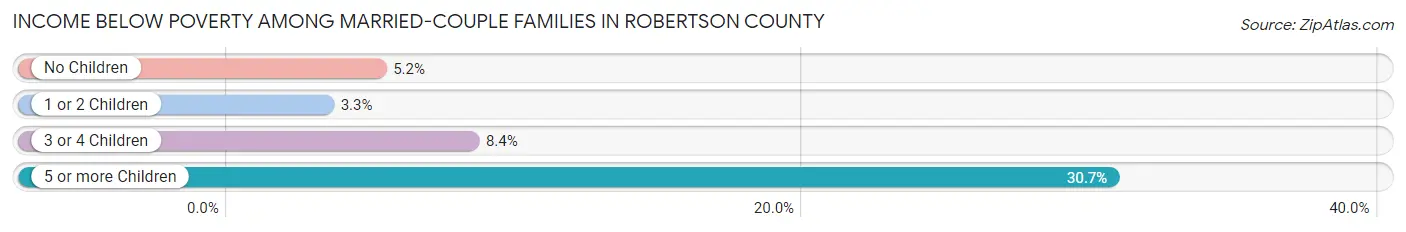
| Children | Above Poverty | Below Poverty |
| No Children | 8,649 (94.8%) | 471 (5.2%) |
| 1 or 2 Children | 5,112 (96.7%) | 176 (3.3%) |
| 3 or 4 Children | 994 (91.6%) | 91 (8.4%) |
| 5 or more Children | 52 (69.3%) | 23 (30.7%) |
| Total | 14,807 (95.1%) | 761 (4.9%) |
Income Below Poverty Among Single-Parent Households in Robertson County
According to the poverty data in Robertson County, 17.0% or 239 single-father households and 21.2% or 691 single-mother households are living below the poverty line. Among single-father households, those with 3 or 4 children have the highest poverty rate, with 36 households (52.9%) experiencing poverty. Likewise, among single-mother households, those with 5 or more children have the highest poverty rate, with 13 households (100.0%) falling below the poverty line.
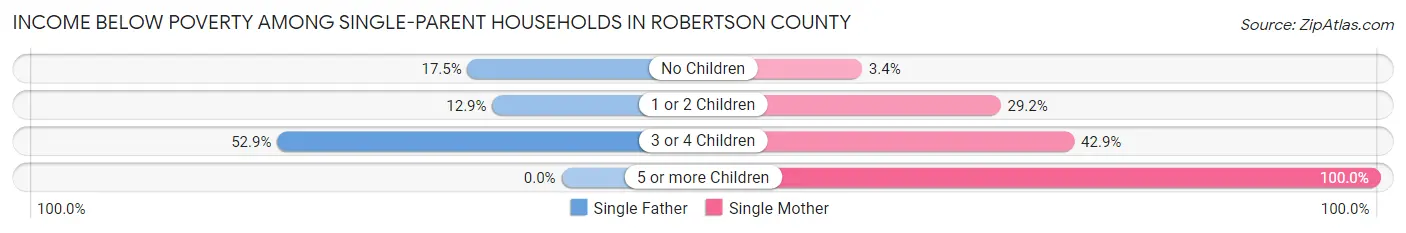
| Children | Single Father | Single Mother |
| No Children | 115 (17.5%) | 43 (3.4%) |
| 1 or 2 Children | 88 (12.9%) | 462 (29.2%) |
| 3 or 4 Children | 36 (52.9%) | 173 (42.9%) |
| 5 or more Children | 0 (0.0%) | 13 (100.0%) |
| Total | 239 (17.0%) | 691 (21.2%) |
Income Below Poverty Among Married-Couple vs Single-Parent Households in Robertson County
The poverty data for Robertson County shows that 761 of the married-couple family households (4.9%) and 930 of the single-parent households (19.9%) are living below the poverty level. Within the married-couple family households, those with 5 or more children have the highest poverty rate, with 23 households (30.7%) falling below the poverty line. Among the single-parent households, those with 5 or more children have the highest poverty rate, with 13 household (100.0%) living below poverty.
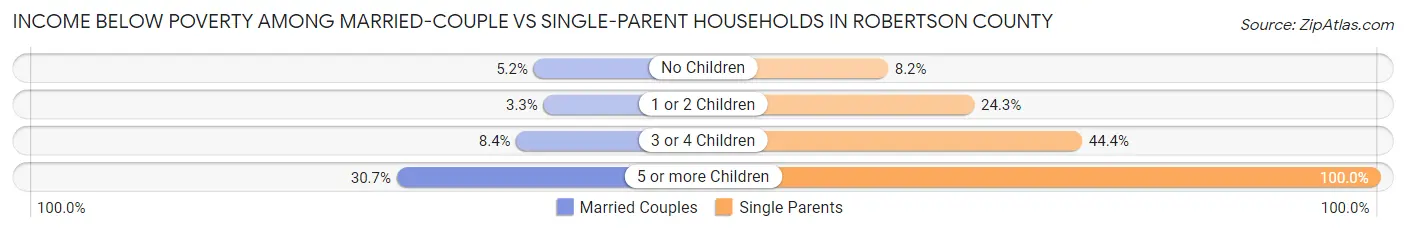
| Children | Married-Couple Families | Single-Parent Households |
| No Children | 471 (5.2%) | 158 (8.2%) |
| 1 or 2 Children | 176 (3.3%) | 550 (24.3%) |
| 3 or 4 Children | 91 (8.4%) | 209 (44.4%) |
| 5 or more Children | 23 (30.7%) | 13 (100.0%) |
| Total | 761 (4.9%) | 930 (19.9%) |
Employment Characteristics in Robertson County
Employment by Class of Employer in Robertson County
Among the 35,452 employed individuals in Robertson County, private company employees (25,900 | 73.1%), local government employees (2,909 | 8.2%), and self-employed (not incorporated) (2,495 | 7.0%) make up the most common classes of employment.

| Employer Class | # Employees | % Employees |
| Private Company Employees | 25,900 | 73.1% |
| Self-Employed (Incorporated) | 717 | 2.0% |
| Self-Employed (Not Incorporated) | 2,495 | 7.0% |
| Not-for-profit Organizations | 1,727 | 4.9% |
| Local Government Employees | 2,909 | 8.2% |
| State Government Employees | 1,050 | 3.0% |
| Federal Government Employees | 644 | 1.8% |
| Unpaid Family Workers | 10 | 0.0% |
| Total | 35,452 | 100.0% |
Employment Status by Age in Robertson County
According to the labor force statistics for Robertson County, out of the total population over 16 years of age (58,004), 64.3% or 37,297 individuals are in the labor force, with 3.8% or 1,417 of them unemployed. The age group with the highest labor force participation rate is 30 to 34 years, with 84.0% or 3,976 individuals in the labor force. Within the labor force, the 16 to 19 years age range has the highest percentage of unemployed individuals, with 17.4% or 252 of them being unemployed.
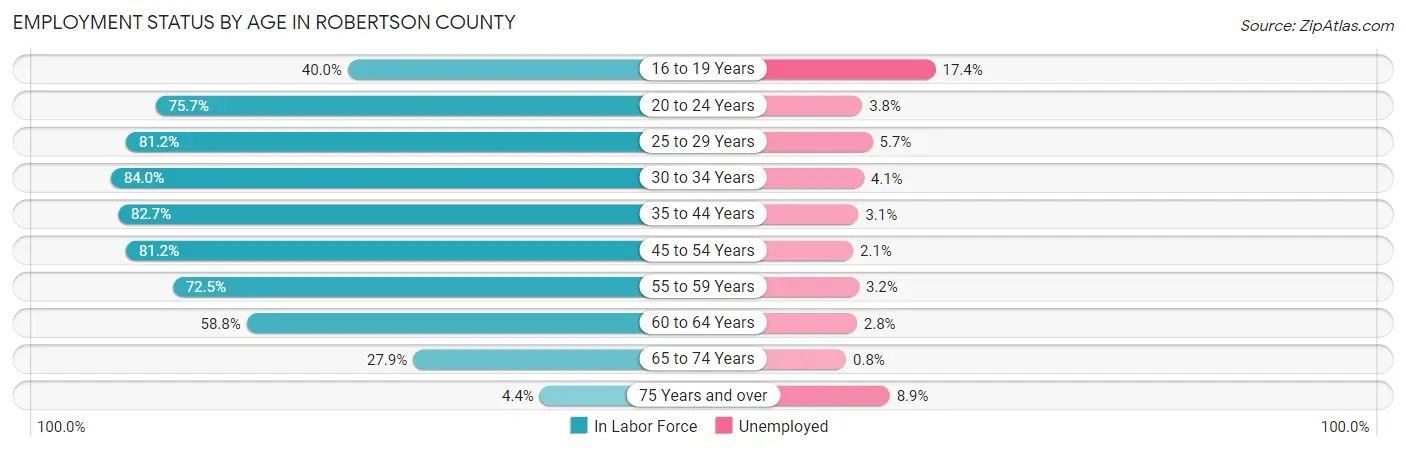
| Age Bracket | In Labor Force | Unemployed |
| 16 to 19 Years | 1,449 (40.0%) | 252 (17.4%) |
| 20 to 24 Years | 3,052 (75.7%) | 116 (3.8%) |
| 25 to 29 Years | 3,886 (81.2%) | 222 (5.7%) |
| 30 to 34 Years | 3,976 (84.0%) | 163 (4.1%) |
| 35 to 44 Years | 8,099 (82.7%) | 251 (3.1%) |
| 45 to 54 Years | 7,895 (81.2%) | 166 (2.1%) |
| 55 to 59 Years | 4,115 (72.5%) | 132 (3.2%) |
| 60 to 64 Years | 2,759 (58.8%) | 77 (2.8%) |
| 65 to 74 Years | 1,910 (27.9%) | 15 (0.8%) |
| 75 Years and over | 180 (4.4%) | 16 (8.9%) |
| Total | 37,297 (64.3%) | 1,417 (3.8%) |
Employment Status by Educational Attainment in Robertson County
According to labor force statistics for Robertson County, 78.0% of individuals (30,735) out of the total population between 25 and 64 years of age (39,404) are in the labor force, with 3.3% or 1,014 of them being unemployed. The group with the highest labor force participation rate are those with the educational attainment of bachelor's degree or higher, with 85.7% or 7,645 individuals in the labor force. Within the labor force, individuals with less than high school education have the highest percentage of unemployment, with 7.1% or 146 of them being unemployed.
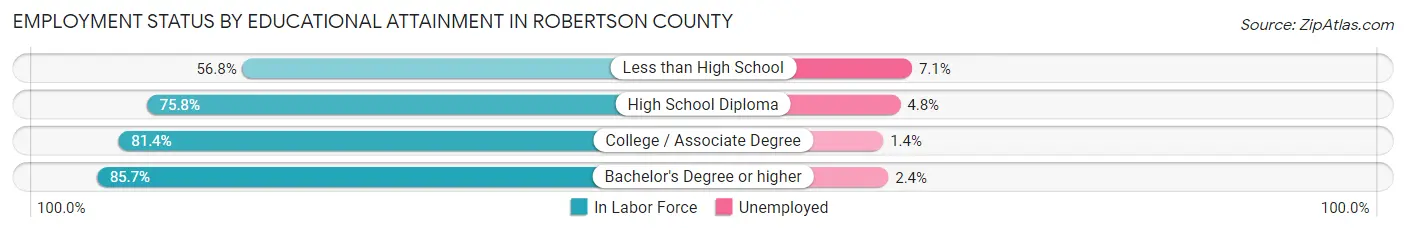
| Educational Attainment | In Labor Force | Unemployed |
| Less than High School | 2,050 (56.8%) | 256 (7.1%) |
| High School Diploma | 11,447 (75.8%) | 725 (4.8%) |
| College / Associate Degree | 9,582 (81.4%) | 165 (1.4%) |
| Bachelor's Degree or higher | 7,645 (85.7%) | 214 (2.4%) |
| Total | 30,735 (78.0%) | 1,300 (3.3%) |
Employment Occupations by Sex in Robertson County
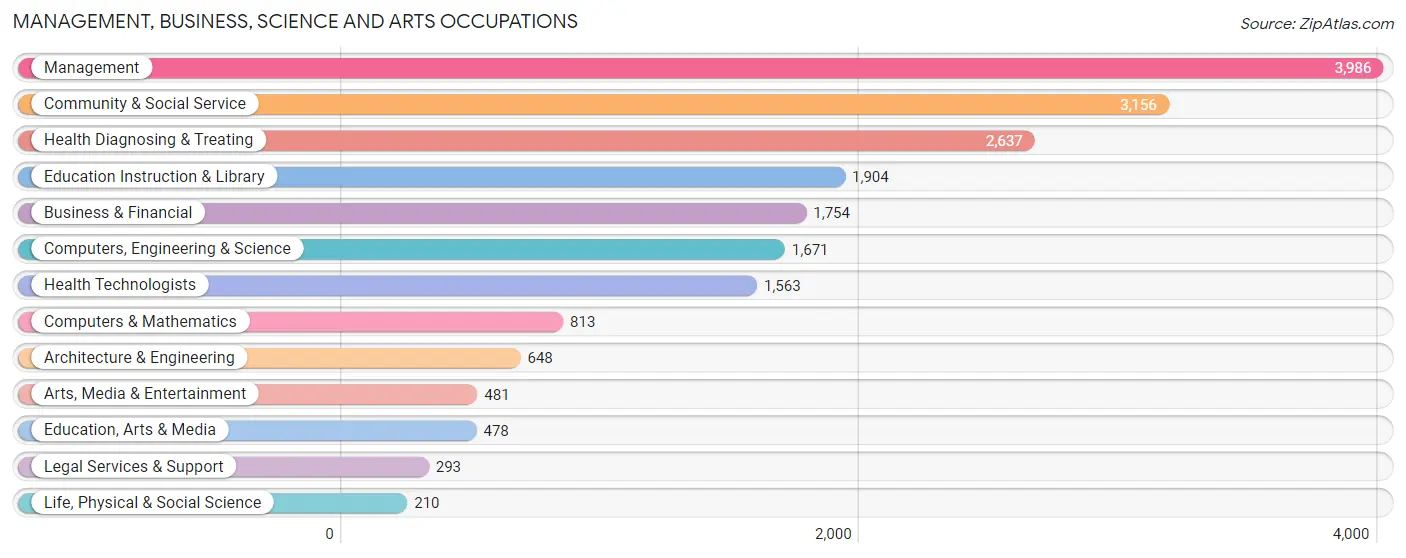
Management, Business, Science and Arts Occupations
The most common Management, Business, Science and Arts occupations in Robertson County are Management (3,986 | 11.1%), Community & Social Service (3,156 | 8.8%), Health Diagnosing & Treating (2,637 | 7.3%), Education Instruction & Library (1,904 | 5.3%), and Business & Financial (1,754 | 4.9%).
Management, Business, Science and Arts Occupations by Sex
Within the Management, Business, Science and Arts occupations in Robertson County, the most male-oriented occupations are Architecture & Engineering (91.7%), Computers & Mathematics (82.8%), and Computers, Engineering & Science (81.6%), while the most female-oriented occupations are Health Technologists (79.8%), Education Instruction & Library (78.0%), and Health Diagnosing & Treating (78.0%).
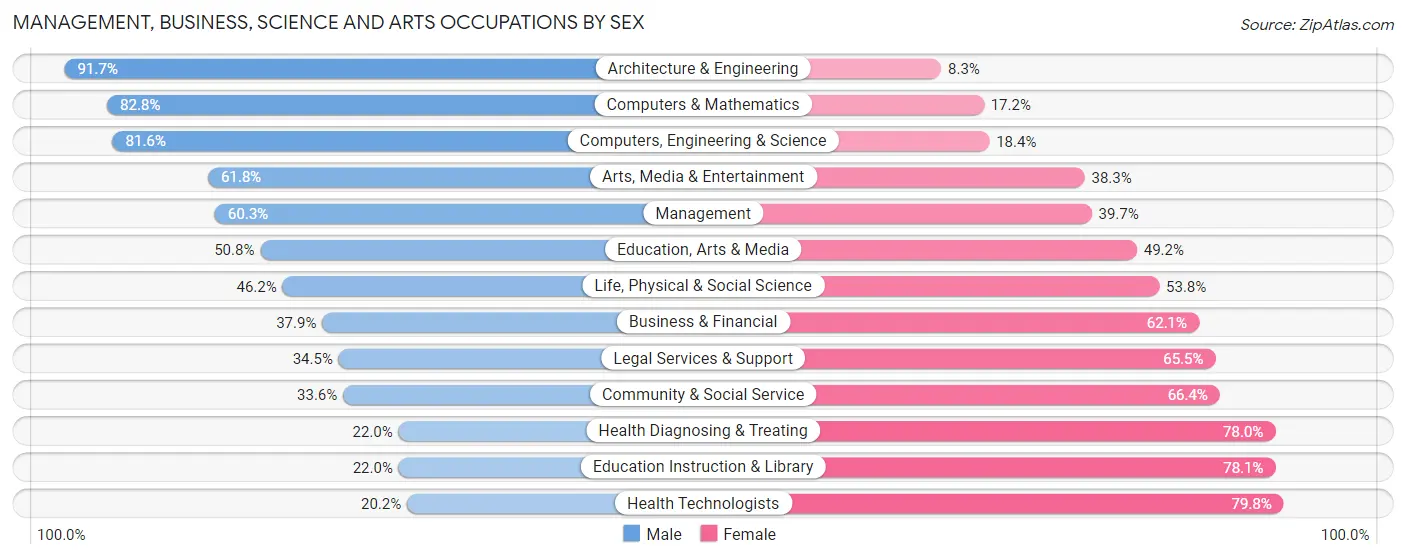
| Occupation | Male | Female |
| Management | 2,403 (60.3%) | 1,583 (39.7%) |
| Business & Financial | 665 (37.9%) | 1,089 (62.1%) |
| Computers, Engineering & Science | 1,364 (81.6%) | 307 (18.4%) |
| Computers & Mathematics | 673 (82.8%) | 140 (17.2%) |
| Architecture & Engineering | 594 (91.7%) | 54 (8.3%) |
| Life, Physical & Social Science | 97 (46.2%) | 113 (53.8%) |
| Community & Social Service | 1,059 (33.6%) | 2,097 (66.4%) |
| Education, Arts & Media | 243 (50.8%) | 235 (49.2%) |
| Legal Services & Support | 101 (34.5%) | 192 (65.5%) |
| Education Instruction & Library | 418 (22.0%) | 1,486 (78.0%) |
| Arts, Media & Entertainment | 297 (61.8%) | 184 (38.3%) |
| Health Diagnosing & Treating | 580 (22.0%) | 2,057 (78.0%) |
| Health Technologists | 316 (20.2%) | 1,247 (79.8%) |
| Total (Category) | 6,071 (46.0%) | 7,133 (54.0%) |
| Total (Overall) | 19,335 (53.9%) | 16,545 (46.1%) |
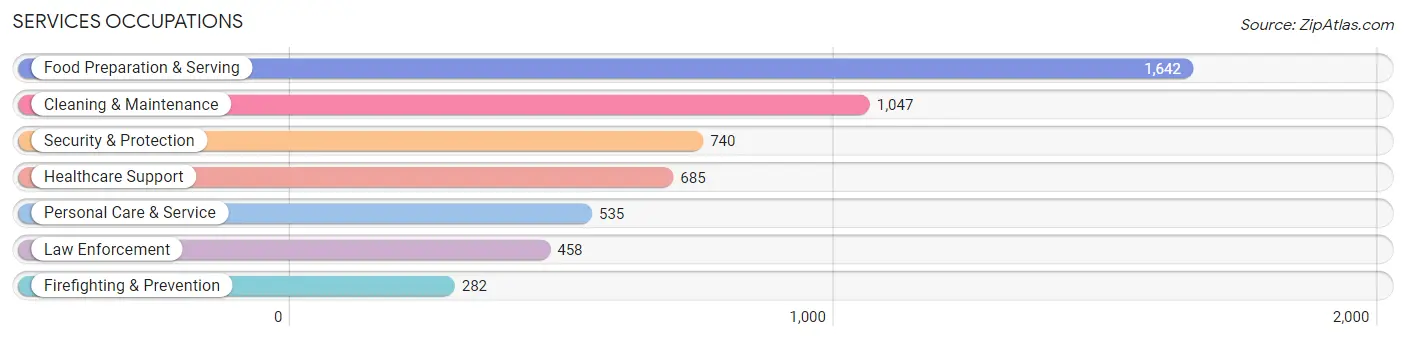
Services Occupations
The most common Services occupations in Robertson County are Food Preparation & Serving (1,642 | 4.6%), Cleaning & Maintenance (1,047 | 2.9%), Security & Protection (740 | 2.1%), Healthcare Support (685 | 1.9%), and Personal Care & Service (535 | 1.5%).
Services Occupations by Sex
Within the Services occupations in Robertson County, the most male-oriented occupations are Law Enforcement (90.0%), Security & Protection (84.7%), and Firefighting & Prevention (76.2%), while the most female-oriented occupations are Personal Care & Service (95.3%), Healthcare Support (93.6%), and Food Preparation & Serving (68.0%).
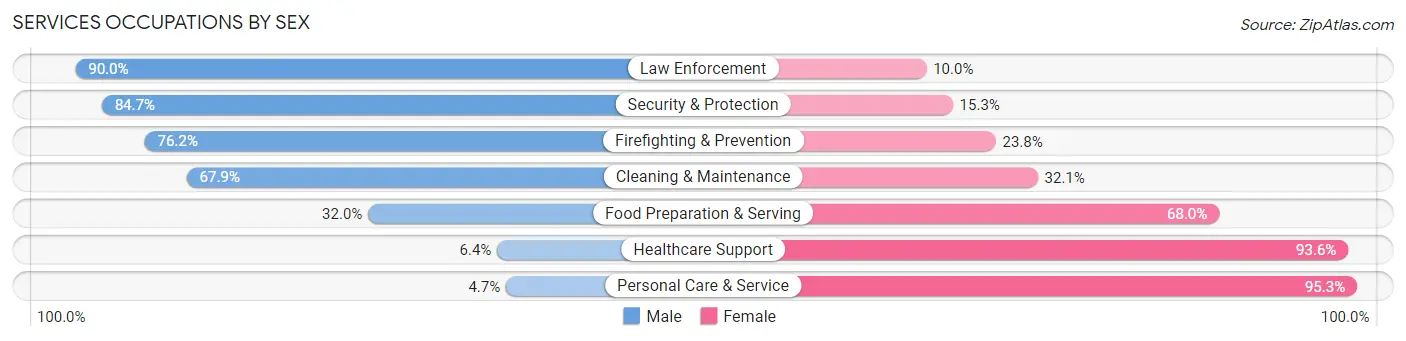
| Occupation | Male | Female |
| Healthcare Support | 44 (6.4%) | 641 (93.6%) |
| Security & Protection | 627 (84.7%) | 113 (15.3%) |
| Firefighting & Prevention | 215 (76.2%) | 67 (23.8%) |
| Law Enforcement | 412 (90.0%) | 46 (10.0%) |
| Food Preparation & Serving | 525 (32.0%) | 1,117 (68.0%) |
| Cleaning & Maintenance | 711 (67.9%) | 336 (32.1%) |
| Personal Care & Service | 25 (4.7%) | 510 (95.3%) |
| Total (Category) | 1,932 (41.6%) | 2,717 (58.4%) |
| Total (Overall) | 19,335 (53.9%) | 16,545 (46.1%) |
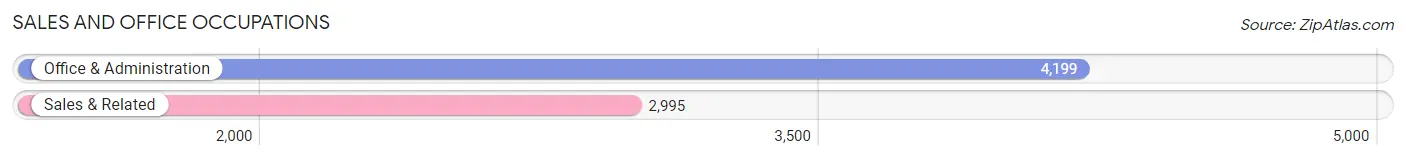
Sales and Office Occupations
The most common Sales and Office occupations in Robertson County are Office & Administration (4,199 | 11.7%), and Sales & Related (2,995 | 8.4%).
Sales and Office Occupations by Sex
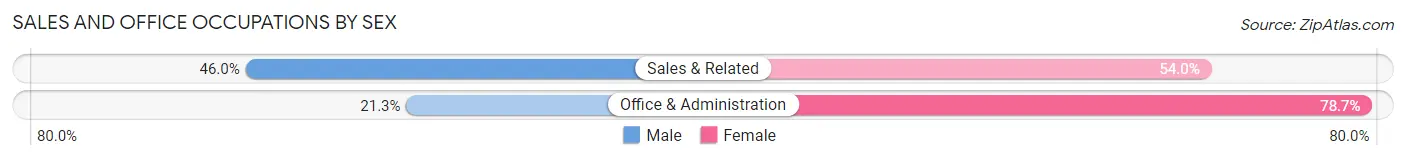
| Occupation | Male | Female |
| Sales & Related | 1,378 (46.0%) | 1,617 (54.0%) |
| Office & Administration | 893 (21.3%) | 3,306 (78.7%) |
| Total (Category) | 2,271 (31.6%) | 4,923 (68.4%) |
| Total (Overall) | 19,335 (53.9%) | 16,545 (46.1%) |
Natural Resources, Construction and Maintenance Occupations
The most common Natural Resources, Construction and Maintenance occupations in Robertson County are Construction & Extraction (2,794 | 7.8%), Installation, Maintenance & Repair (1,873 | 5.2%), and Farming, Fishing & Forestry (83 | 0.2%).
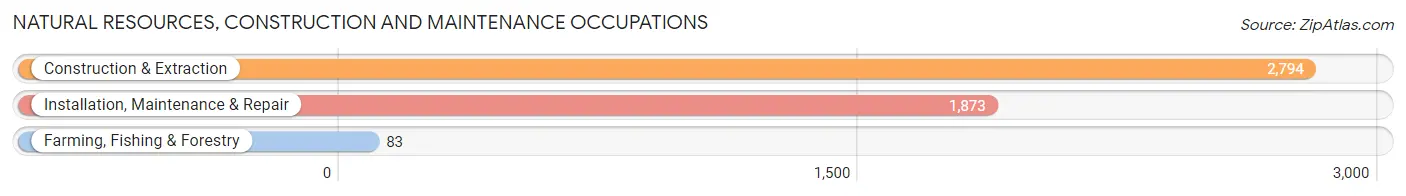
Natural Resources, Construction and Maintenance Occupations by Sex
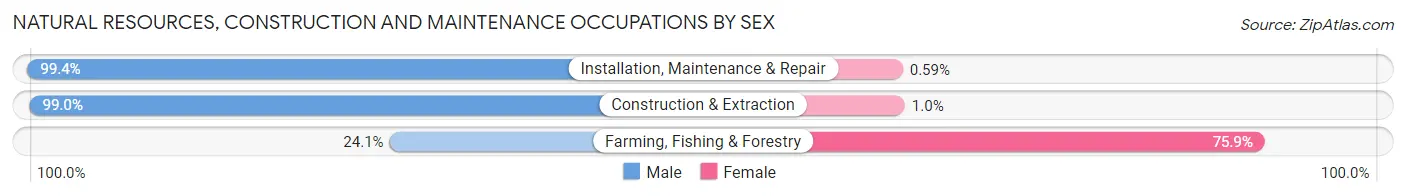
| Occupation | Male | Female |
| Farming, Fishing & Forestry | 20 (24.1%) | 63 (75.9%) |
| Construction & Extraction | 2,765 (99.0%) | 29 (1.0%) |
| Installation, Maintenance & Repair | 1,862 (99.4%) | 11 (0.6%) |
| Total (Category) | 4,647 (97.8%) | 103 (2.2%) |
| Total (Overall) | 19,335 (53.9%) | 16,545 (46.1%) |
Production, Transportation and Moving Occupations
The most common Production, Transportation and Moving occupations in Robertson County are Production (2,908 | 8.1%), Material Moving (1,702 | 4.7%), and Transportation (1,473 | 4.1%).
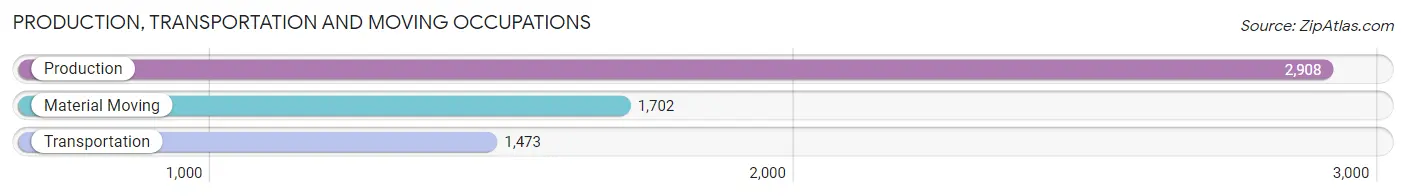
Production, Transportation and Moving Occupations by Sex
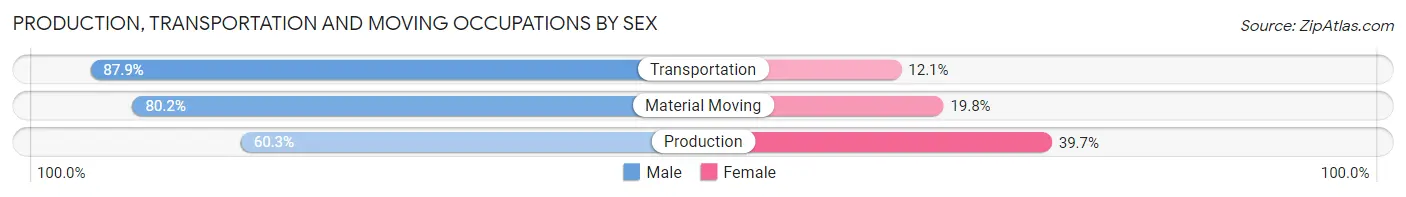
| Occupation | Male | Female |
| Production | 1,754 (60.3%) | 1,154 (39.7%) |
| Transportation | 1,295 (87.9%) | 178 (12.1%) |
| Material Moving | 1,365 (80.2%) | 337 (19.8%) |
| Total (Category) | 4,414 (72.6%) | 1,669 (27.4%) |
| Total (Overall) | 19,335 (53.9%) | 16,545 (46.1%) |
Employment Industries by Sex in Robertson County
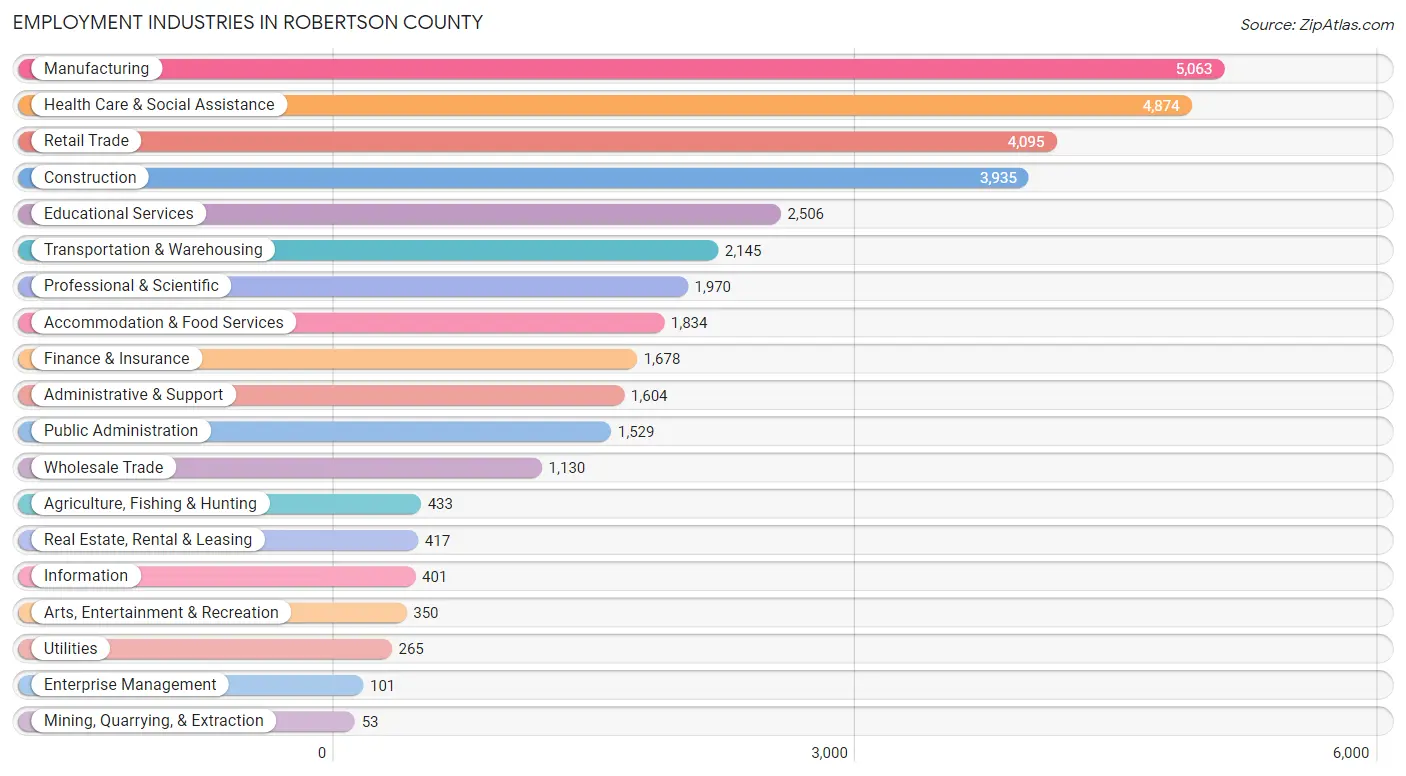
Employment Industries in Robertson County
The major employment industries in Robertson County include Manufacturing (5,063 | 14.1%), Health Care & Social Assistance (4,874 | 13.6%), Retail Trade (4,095 | 11.4%), Construction (3,935 | 11.0%), and Educational Services (2,506 | 7.0%).
Employment Industries by Sex in Robertson County
The Robertson County industries that see more men than women are Construction (92.7%), Utilities (83.0%), and Transportation & Warehousing (77.7%), whereas the industries that tend to have a higher number of women are Health Care & Social Assistance (81.5%), Enterprise Management (81.2%), and Finance & Insurance (72.6%).
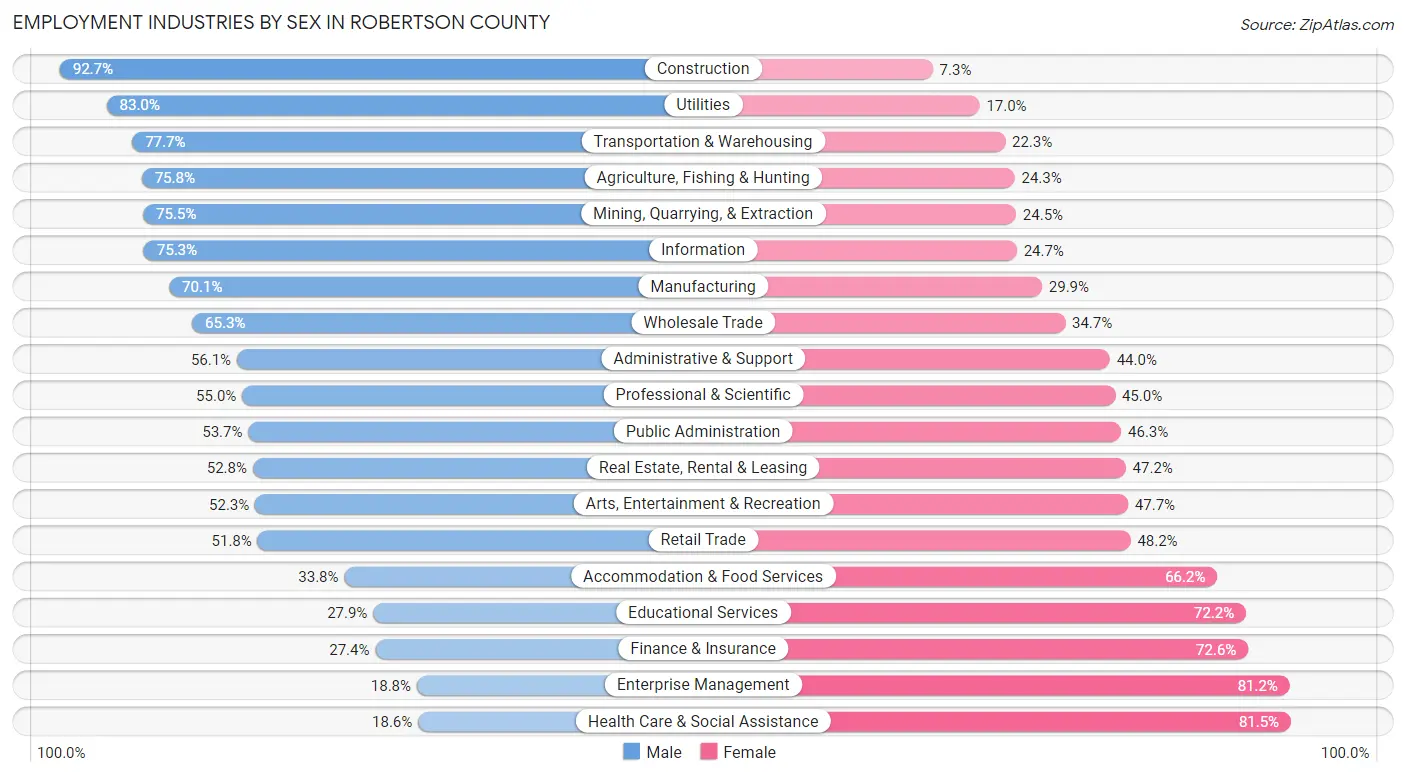
| Industry | Male | Female |
| Agriculture, Fishing & Hunting | 328 (75.7%) | 105 (24.2%) |
| Mining, Quarrying, & Extraction | 40 (75.5%) | 13 (24.5%) |
| Construction | 3,648 (92.7%) | 287 (7.3%) |
| Manufacturing | 3,549 (70.1%) | 1,514 (29.9%) |
| Wholesale Trade | 738 (65.3%) | 392 (34.7%) |
| Retail Trade | 2,120 (51.8%) | 1,975 (48.2%) |
| Transportation & Warehousing | 1,667 (77.7%) | 478 (22.3%) |
| Utilities | 220 (83.0%) | 45 (17.0%) |
| Information | 302 (75.3%) | 99 (24.7%) |
| Finance & Insurance | 460 (27.4%) | 1,218 (72.6%) |
| Real Estate, Rental & Leasing | 220 (52.8%) | 197 (47.2%) |
| Professional & Scientific | 1,083 (55.0%) | 887 (45.0%) |
| Enterprise Management | 19 (18.8%) | 82 (81.2%) |
| Administrative & Support | 899 (56.0%) | 705 (44.0%) |
| Educational Services | 698 (27.9%) | 1,808 (72.2%) |
| Health Care & Social Assistance | 904 (18.5%) | 3,970 (81.5%) |
| Arts, Entertainment & Recreation | 183 (52.3%) | 167 (47.7%) |
| Accommodation & Food Services | 620 (33.8%) | 1,214 (66.2%) |
| Public Administration | 821 (53.7%) | 708 (46.3%) |
| Total | 19,335 (53.9%) | 16,545 (46.1%) |
Education in Robertson County
School Enrollment in Robertson County
The most common levels of schooling among the 15,938 students in Robertson County are high school (4,320 | 27.1%), middle school (3,943 | 24.7%), and elementary school (3,295 | 20.7%).
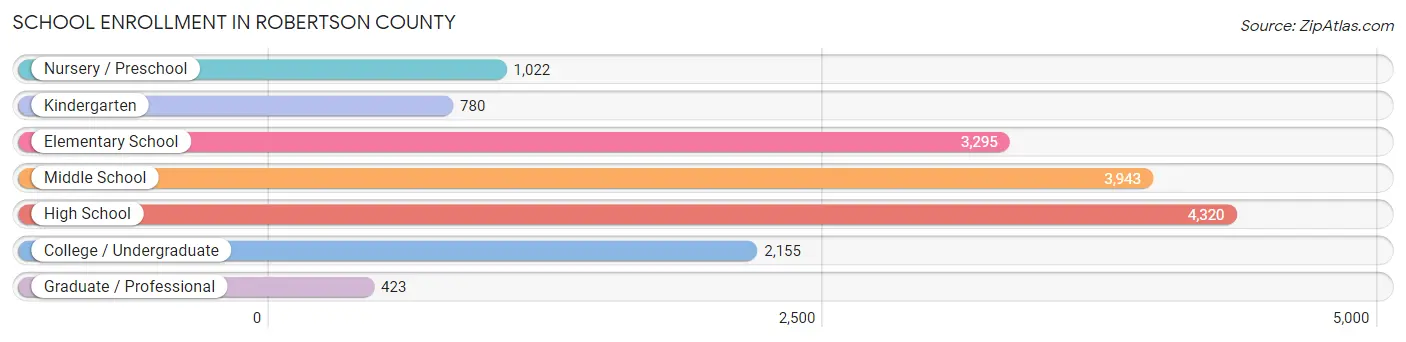
| School Level | # Students | % Students |
| Nursery / Preschool | 1,022 | 6.4% |
| Kindergarten | 780 | 4.9% |
| Elementary School | 3,295 | 20.7% |
| Middle School | 3,943 | 24.7% |
| High School | 4,320 | 27.1% |
| College / Undergraduate | 2,155 | 13.5% |
| Graduate / Professional | 423 | 2.6% |
| Total | 15,938 | 100.0% |
School Enrollment by Age by Funding Source in Robertson County
Out of a total of 15,938 students who are enrolled in schools in Robertson County, 2,964 (18.6%) attend a private institution, while the remaining 12,974 (81.4%) are enrolled in public schools. The age group of 3 to 4 year olds has the highest likelihood of being enrolled in private schools, with 404 (49.9% in the age bracket) enrolled. Conversely, the age group of 18 to 19 year olds has the lowest likelihood of being enrolled in a private school, with 866 (92.2% in the age bracket) attending a public institution.
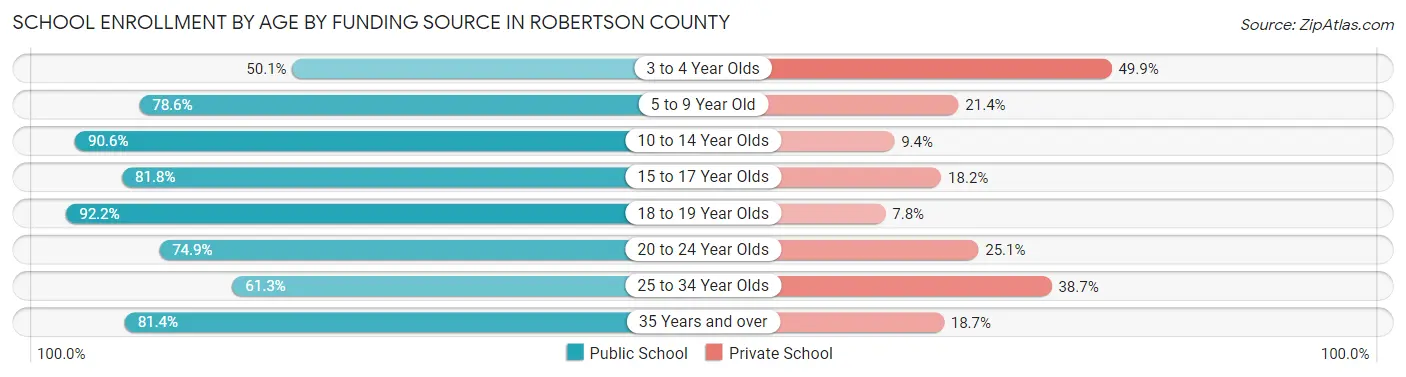
| Age Bracket | Public School | Private School |
| 3 to 4 Year Olds | 406 (50.1%) | 404 (49.9%) |
| 5 to 9 Year Old | 3,179 (78.6%) | 864 (21.4%) |
| 10 to 14 Year Olds | 4,517 (90.6%) | 469 (9.4%) |
| 15 to 17 Year Olds | 2,533 (81.8%) | 562 (18.2%) |
| 18 to 19 Year Olds | 866 (92.2%) | 73 (7.8%) |
| 20 to 24 Year Olds | 496 (74.9%) | 166 (25.1%) |
| 25 to 34 Year Olds | 505 (61.3%) | 319 (38.7%) |
| 35 Years and over | 471 (81.4%) | 108 (18.6%) |
| Total | 12,974 (81.4%) | 2,964 (18.6%) |
Educational Attainment by Field of Study in Robertson County
Business (2,360 | 20.1%), education (1,671 | 14.2%), science & technology (1,513 | 12.9%), liberal arts & history (911 | 7.7%), and arts & humanities (876 | 7.4%) are the most common fields of study among 11,757 individuals in Robertson County who have obtained a bachelor's degree or higher.
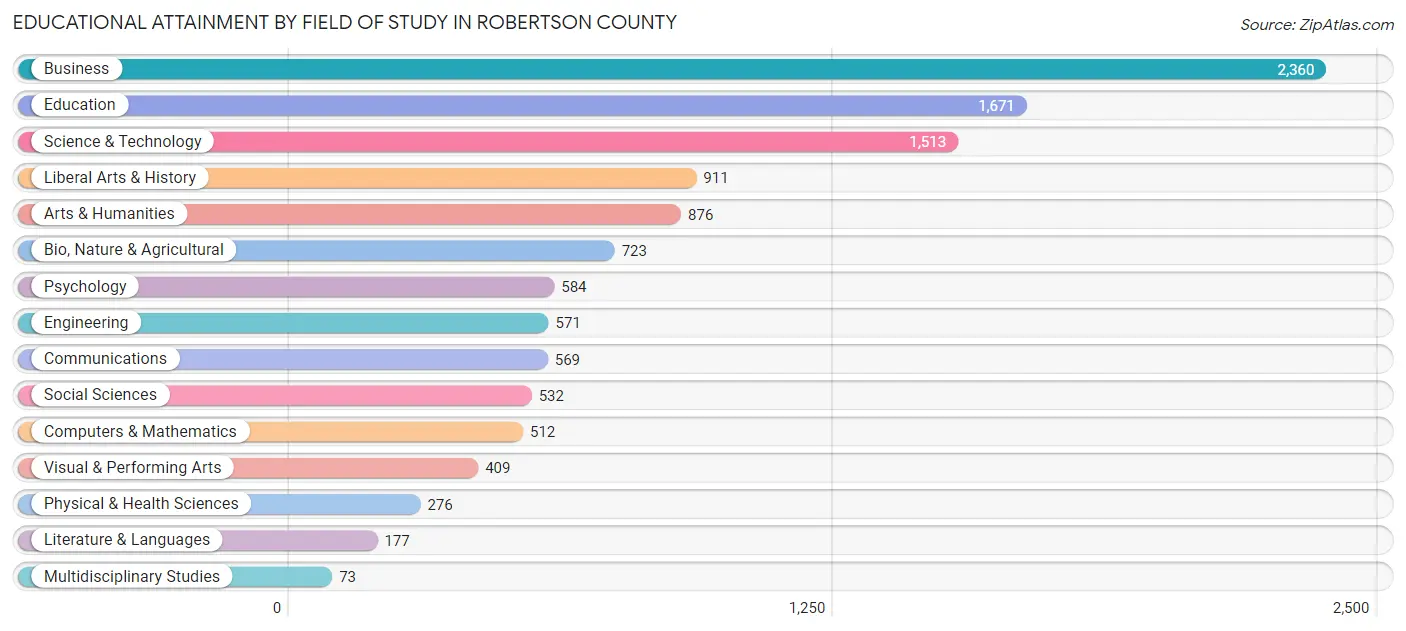
| Field of Study | # Graduates | % Graduates |
| Computers & Mathematics | 512 | 4.3% |
| Bio, Nature & Agricultural | 723 | 6.1% |
| Physical & Health Sciences | 276 | 2.4% |
| Psychology | 584 | 5.0% |
| Social Sciences | 532 | 4.5% |
| Engineering | 571 | 4.9% |
| Multidisciplinary Studies | 73 | 0.6% |
| Science & Technology | 1,513 | 12.9% |
| Business | 2,360 | 20.1% |
| Education | 1,671 | 14.2% |
| Literature & Languages | 177 | 1.5% |
| Liberal Arts & History | 911 | 7.7% |
| Visual & Performing Arts | 409 | 3.5% |
| Communications | 569 | 4.8% |
| Arts & Humanities | 876 | 7.4% |
| Total | 11,757 | 100.0% |
Transportation & Commute in Robertson County
Vehicle Availability by Sex in Robertson County
The most prevalent vehicle ownership categories in Robertson County are males with 2 vehicles (7,771, accounting for 40.6%) and females with 2 vehicles (6,309, making up 47.6%).
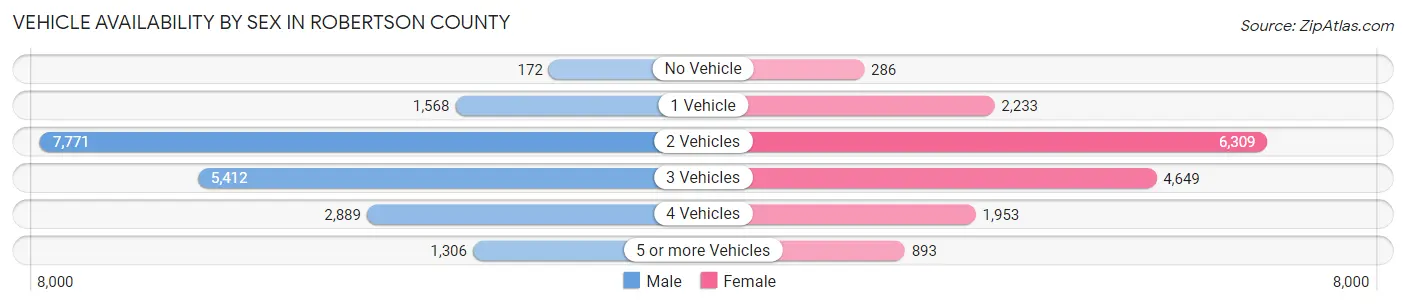
| Vehicles Available | Male | Female |
| No Vehicle | 172 (0.9%) | 286 (1.8%) |
| 1 Vehicle | 1,568 (8.2%) | 2,233 (13.7%) |
| 2 Vehicles | 7,771 (40.6%) | 6,309 (38.7%) |
| 3 Vehicles | 5,412 (28.3%) | 4,649 (28.5%) |
| 4 Vehicles | 2,889 (15.1%) | 1,953 (12.0%) |
| 5 or more Vehicles | 1,306 (6.8%) | 893 (5.5%) |
| Total | 19,118 (100.0%) | 16,323 (100.0%) |
Commute Time in Robertson County
The most frequently occuring commute durations in Robertson County are 45 to 59 minutes (5,336 commuters, 16.6%), 30 to 34 minutes (4,566 commuters, 14.2%), and 20 to 24 minutes (3,802 commuters, 11.8%).
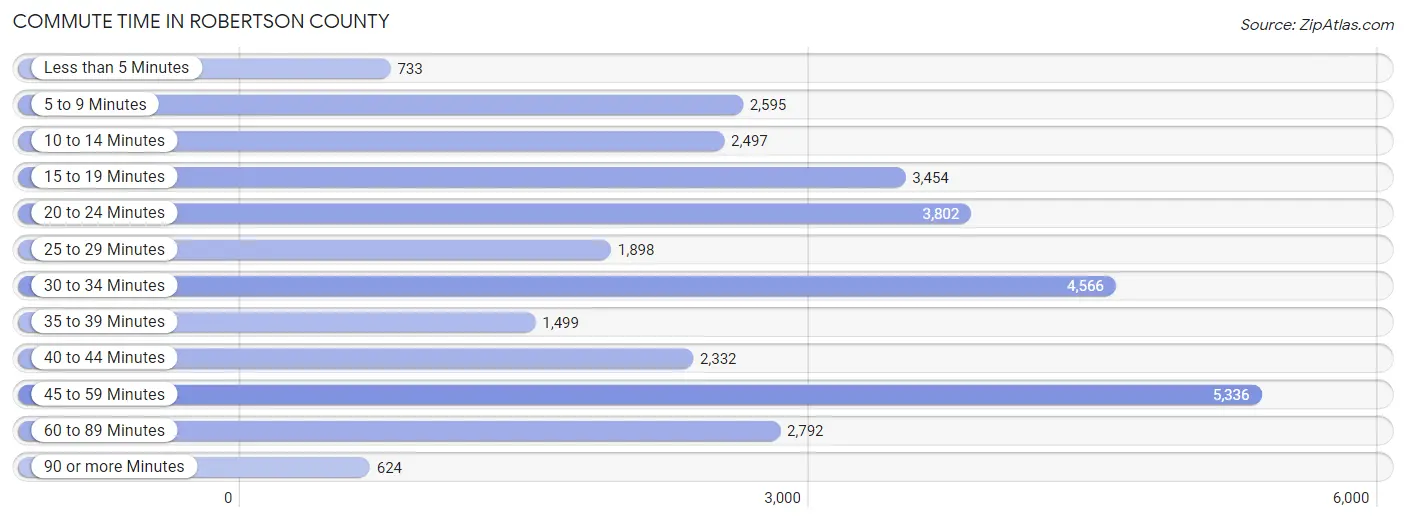
| Commute Time | # Commuters | % Commuters |
| Less than 5 Minutes | 733 | 2.3% |
| 5 to 9 Minutes | 2,595 | 8.1% |
| 10 to 14 Minutes | 2,497 | 7.8% |
| 15 to 19 Minutes | 3,454 | 10.7% |
| 20 to 24 Minutes | 3,802 | 11.8% |
| 25 to 29 Minutes | 1,898 | 5.9% |
| 30 to 34 Minutes | 4,566 | 14.2% |
| 35 to 39 Minutes | 1,499 | 4.7% |
| 40 to 44 Minutes | 2,332 | 7.3% |
| 45 to 59 Minutes | 5,336 | 16.6% |
| 60 to 89 Minutes | 2,792 | 8.7% |
| 90 or more Minutes | 624 | 1.9% |
Commute Time by Sex in Robertson County
The most common commute times in Robertson County are 45 to 59 minutes (3,211 commuters, 18.3%) for males and 45 to 59 minutes (2,125 commuters, 14.6%) for females.
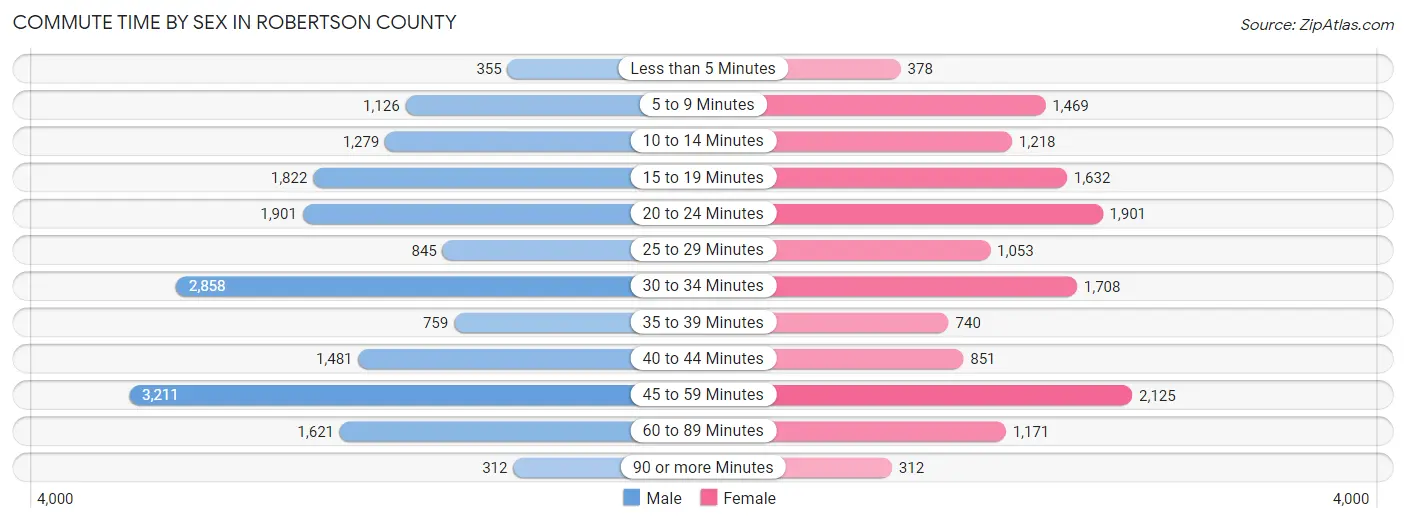
| Commute Time | Male | Female |
| Less than 5 Minutes | 355 (2.0%) | 378 (2.6%) |
| 5 to 9 Minutes | 1,126 (6.4%) | 1,469 (10.1%) |
| 10 to 14 Minutes | 1,279 (7.3%) | 1,218 (8.4%) |
| 15 to 19 Minutes | 1,822 (10.4%) | 1,632 (11.2%) |
| 20 to 24 Minutes | 1,901 (10.8%) | 1,901 (13.1%) |
| 25 to 29 Minutes | 845 (4.8%) | 1,053 (7.2%) |
| 30 to 34 Minutes | 2,858 (16.3%) | 1,708 (11.7%) |
| 35 to 39 Minutes | 759 (4.3%) | 740 (5.1%) |
| 40 to 44 Minutes | 1,481 (8.4%) | 851 (5.9%) |
| 45 to 59 Minutes | 3,211 (18.3%) | 2,125 (14.6%) |
| 60 to 89 Minutes | 1,621 (9.2%) | 1,171 (8.0%) |
| 90 or more Minutes | 312 (1.8%) | 312 (2.1%) |
Time of Departure to Work by Sex in Robertson County
The most frequent times of departure to work in Robertson County are 6:00 AM to 6:29 AM (2,656, 15.1%) for males and 7:00 AM to 7:29 AM (2,583, 17.7%) for females.
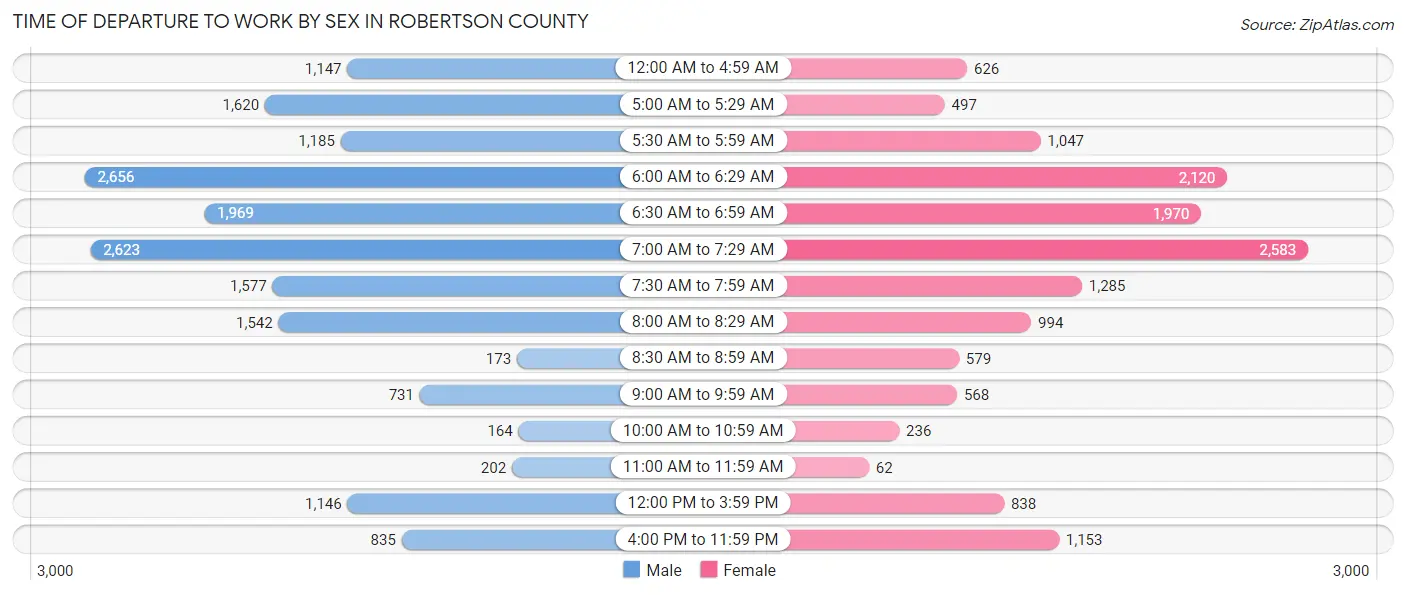
| Time of Departure | Male | Female |
| 12:00 AM to 4:59 AM | 1,147 (6.5%) | 626 (4.3%) |
| 5:00 AM to 5:29 AM | 1,620 (9.2%) | 497 (3.4%) |
| 5:30 AM to 5:59 AM | 1,185 (6.7%) | 1,047 (7.2%) |
| 6:00 AM to 6:29 AM | 2,656 (15.1%) | 2,120 (14.6%) |
| 6:30 AM to 6:59 AM | 1,969 (11.2%) | 1,970 (13.5%) |
| 7:00 AM to 7:29 AM | 2,623 (14.9%) | 2,583 (17.7%) |
| 7:30 AM to 7:59 AM | 1,577 (9.0%) | 1,285 (8.8%) |
| 8:00 AM to 8:29 AM | 1,542 (8.8%) | 994 (6.8%) |
| 8:30 AM to 8:59 AM | 173 (1.0%) | 579 (4.0%) |
| 9:00 AM to 9:59 AM | 731 (4.2%) | 568 (3.9%) |
| 10:00 AM to 10:59 AM | 164 (0.9%) | 236 (1.6%) |
| 11:00 AM to 11:59 AM | 202 (1.1%) | 62 (0.4%) |
| 12:00 PM to 3:59 PM | 1,146 (6.5%) | 838 (5.8%) |
| 4:00 PM to 11:59 PM | 835 (4.8%) | 1,153 (7.9%) |
| Total | 17,570 (100.0%) | 14,558 (100.0%) |
Housing Occupancy in Robertson County
Occupancy by Ownership in Robertson County
Of the total 27,154 dwellings in Robertson County, owner-occupied units account for 20,715 (76.3%), while renter-occupied units make up 6,439 (23.7%).
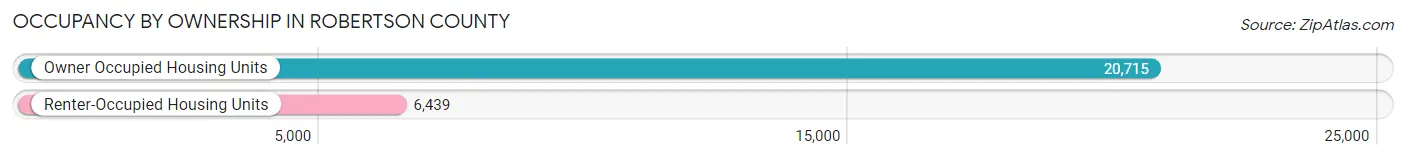
| Occupancy | # Housing Units | % Housing Units |
| Owner Occupied Housing Units | 20,715 | 76.3% |
| Renter-Occupied Housing Units | 6,439 | 23.7% |
| Total Occupied Housing Units | 27,154 | 100.0% |
Occupancy by Household Size in Robertson County
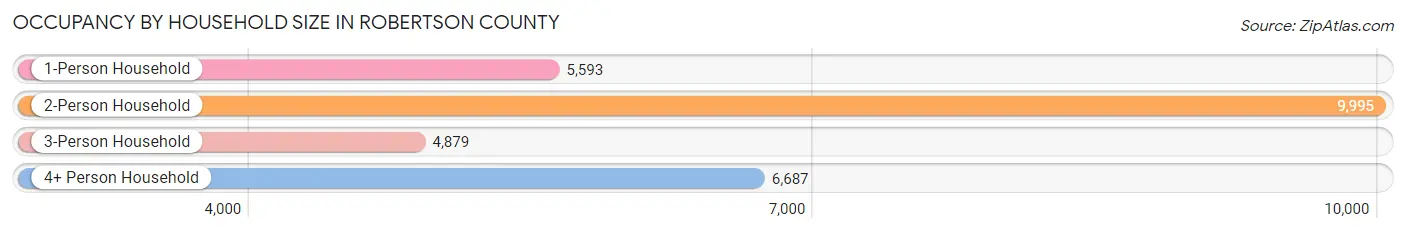
| Household Size | # Housing Units | % Housing Units |
| 1-Person Household | 5,593 | 20.6% |
| 2-Person Household | 9,995 | 36.8% |
| 3-Person Household | 4,879 | 18.0% |
| 4+ Person Household | 6,687 | 24.6% |
| Total Housing Units | 27,154 | 100.0% |
Occupancy by Ownership by Household Size in Robertson County
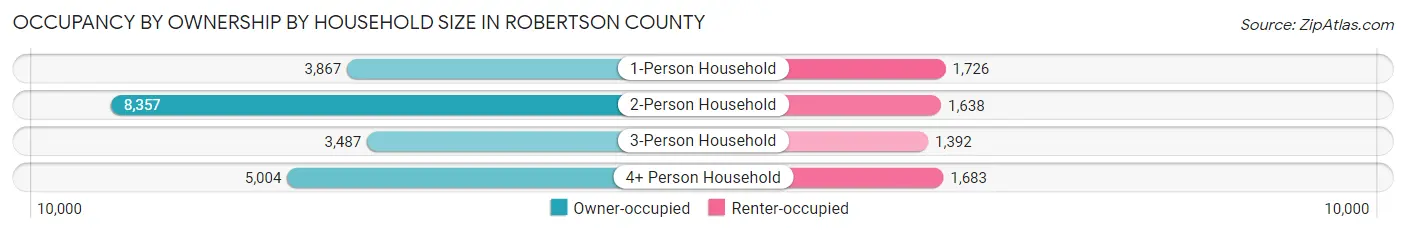
| Household Size | Owner-occupied | Renter-occupied |
| 1-Person Household | 3,867 (69.1%) | 1,726 (30.9%) |
| 2-Person Household | 8,357 (83.6%) | 1,638 (16.4%) |
| 3-Person Household | 3,487 (71.5%) | 1,392 (28.5%) |
| 4+ Person Household | 5,004 (74.8%) | 1,683 (25.2%) |
| Total Housing Units | 20,715 (76.3%) | 6,439 (23.7%) |
Occupancy by Educational Attainment in Robertson County
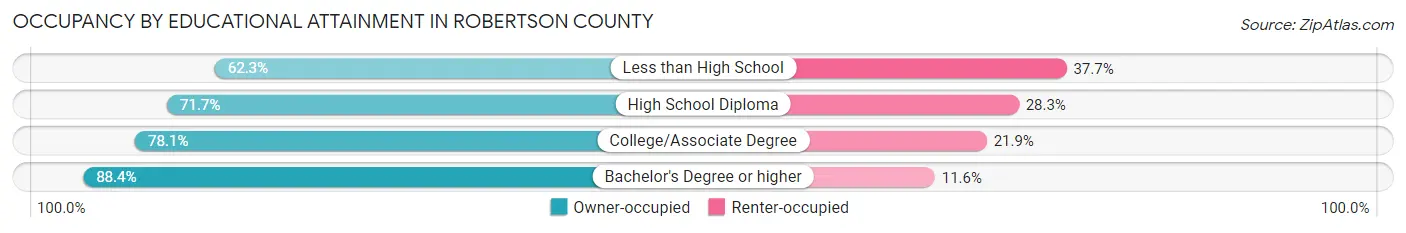
| Household Size | Owner-occupied | Renter-occupied |
| Less than High School | 1,926 (62.3%) | 1,167 (37.7%) |
| High School Diploma | 6,949 (71.7%) | 2,738 (28.3%) |
| College/Associate Degree | 6,552 (78.1%) | 1,838 (21.9%) |
| Bachelor's Degree or higher | 5,288 (88.4%) | 696 (11.6%) |
Occupancy by Age of Householder in Robertson County
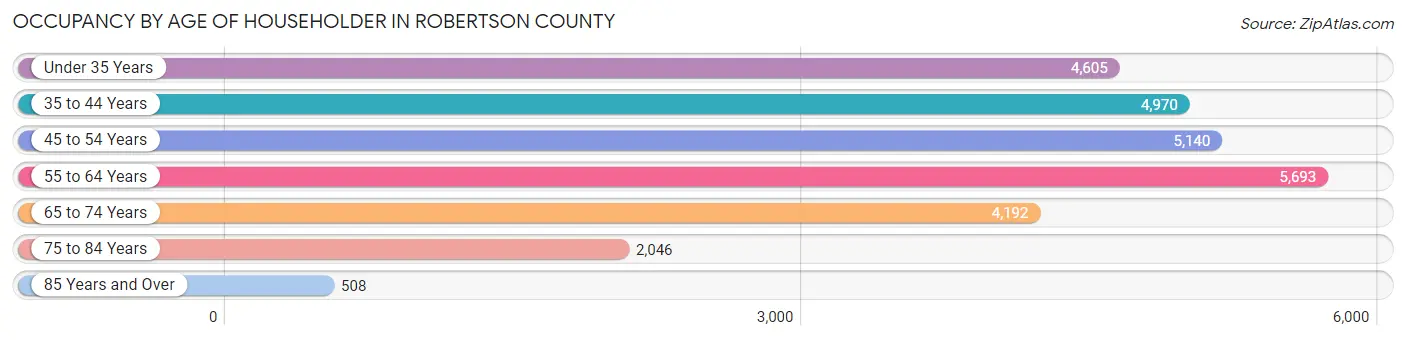
| Age Bracket | # Households | % Households |
| Under 35 Years | 4,605 | 17.0% |
| 35 to 44 Years | 4,970 | 18.3% |
| 45 to 54 Years | 5,140 | 18.9% |
| 55 to 64 Years | 5,693 | 21.0% |
| 65 to 74 Years | 4,192 | 15.4% |
| 75 to 84 Years | 2,046 | 7.5% |
| 85 Years and Over | 508 | 1.9% |
| Total | 27,154 | 100.0% |
Housing Finances in Robertson County
Median Income by Occupancy in Robertson County
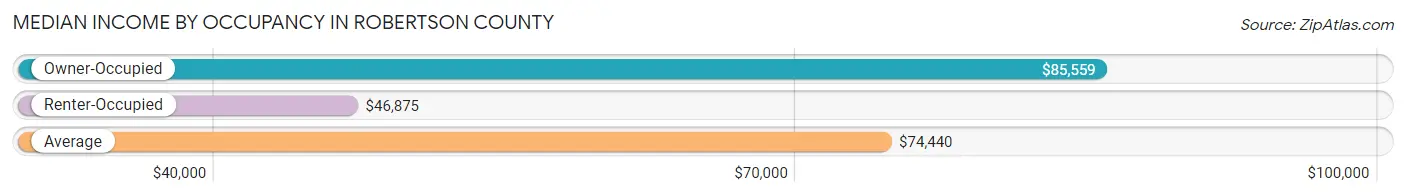
| Occupancy Type | # Households | Median Income |
| Owner-Occupied | 20,715 (76.3%) | $85,559 |
| Renter-Occupied | 6,439 (23.7%) | $46,875 |
| Average | 27,154 (100.0%) | $74,440 |
Occupancy by Householder Income Bracket in Robertson County
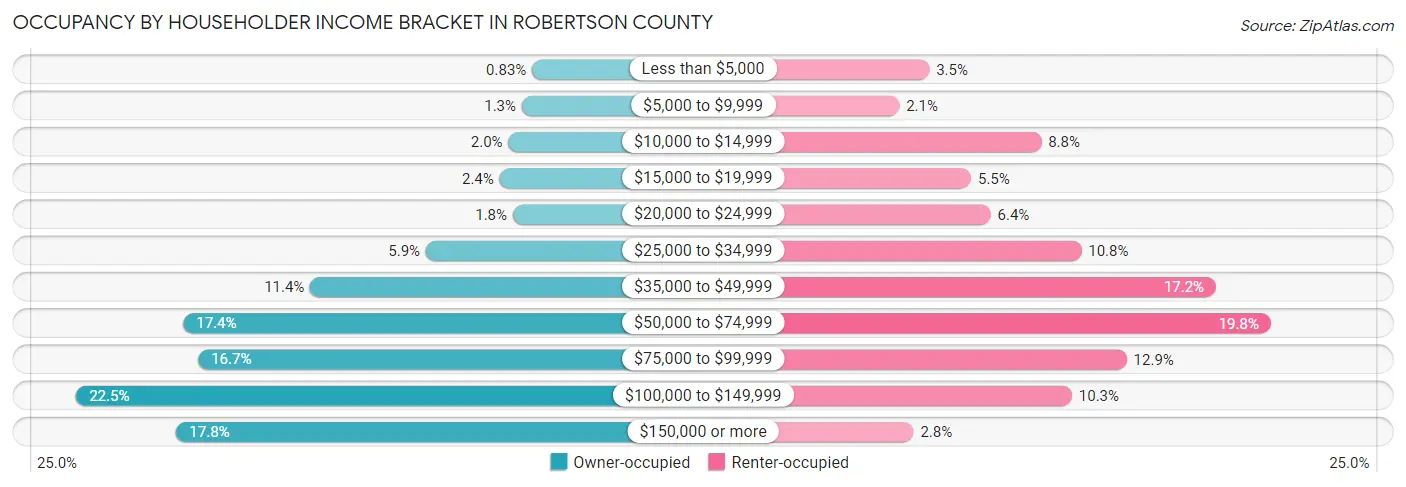
| Income Bracket | Owner-occupied | Renter-occupied |
| Less than $5,000 | 171 (0.8%) | 226 (3.5%) |
| $5,000 to $9,999 | 273 (1.3%) | 134 (2.1%) |
| $10,000 to $14,999 | 405 (2.0%) | 569 (8.8%) |
| $15,000 to $19,999 | 492 (2.4%) | 354 (5.5%) |
| $20,000 to $24,999 | 362 (1.8%) | 414 (6.4%) |
| $25,000 to $34,999 | 1,221 (5.9%) | 692 (10.7%) |
| $35,000 to $49,999 | 2,362 (11.4%) | 1,105 (17.2%) |
| $50,000 to $74,999 | 3,613 (17.4%) | 1,273 (19.8%) |
| $75,000 to $99,999 | 3,465 (16.7%) | 831 (12.9%) |
| $100,000 to $149,999 | 4,670 (22.5%) | 663 (10.3%) |
| $150,000 or more | 3,681 (17.8%) | 178 (2.8%) |
| Total | 20,715 (100.0%) | 6,439 (100.0%) |
Monthly Housing Cost Tiers in Robertson County
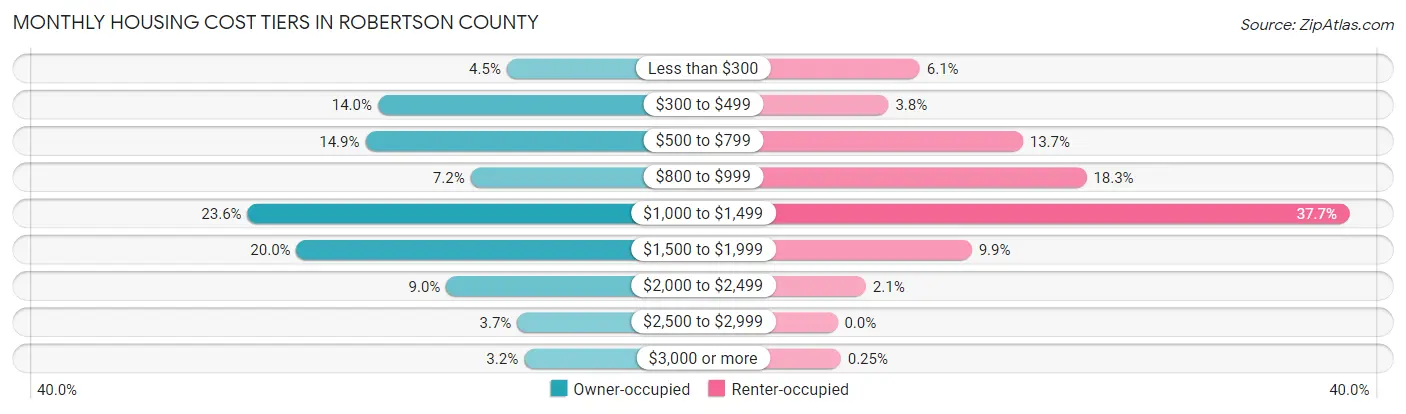
| Monthly Cost | Owner-occupied | Renter-occupied |
| Less than $300 | 931 (4.5%) | 391 (6.1%) |
| $300 to $499 | 2,898 (14.0%) | 242 (3.8%) |
| $500 to $799 | 3,088 (14.9%) | 879 (13.7%) |
| $800 to $999 | 1,484 (7.2%) | 1,181 (18.3%) |
| $1,000 to $1,499 | 4,886 (23.6%) | 2,425 (37.7%) |
| $1,500 to $1,999 | 4,139 (20.0%) | 637 (9.9%) |
| $2,000 to $2,499 | 1,853 (8.9%) | 135 (2.1%) |
| $2,500 to $2,999 | 770 (3.7%) | 0 (0.0%) |
| $3,000 or more | 666 (3.2%) | 16 (0.3%) |
| Total | 20,715 (100.0%) | 6,439 (100.0%) |
Physical Housing Characteristics in Robertson County
Housing Structures in Robertson County
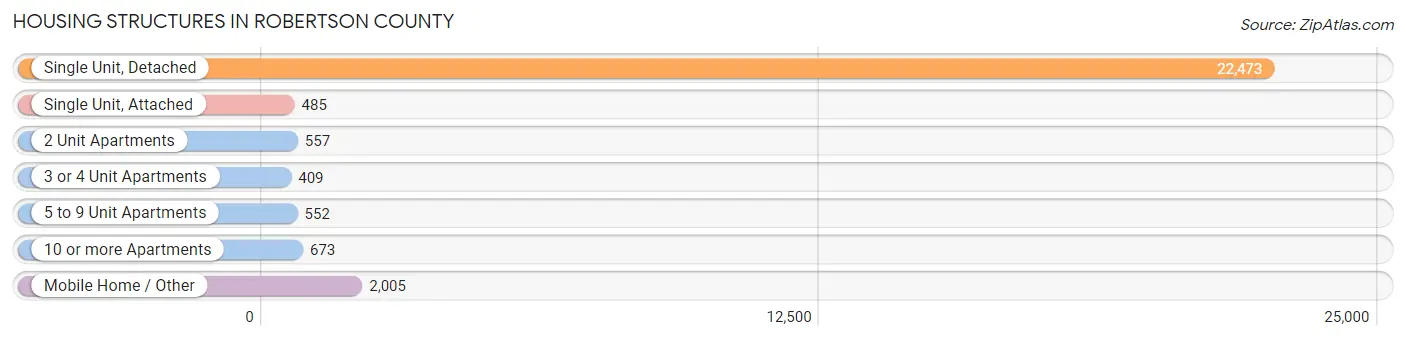
| Structure Type | # Housing Units | % Housing Units |
| Single Unit, Detached | 22,473 | 82.8% |
| Single Unit, Attached | 485 | 1.8% |
| 2 Unit Apartments | 557 | 2.1% |
| 3 or 4 Unit Apartments | 409 | 1.5% |
| 5 to 9 Unit Apartments | 552 | 2.0% |
| 10 or more Apartments | 673 | 2.5% |
| Mobile Home / Other | 2,005 | 7.4% |
| Total | 27,154 | 100.0% |
Housing Structures by Occupancy in Robertson County
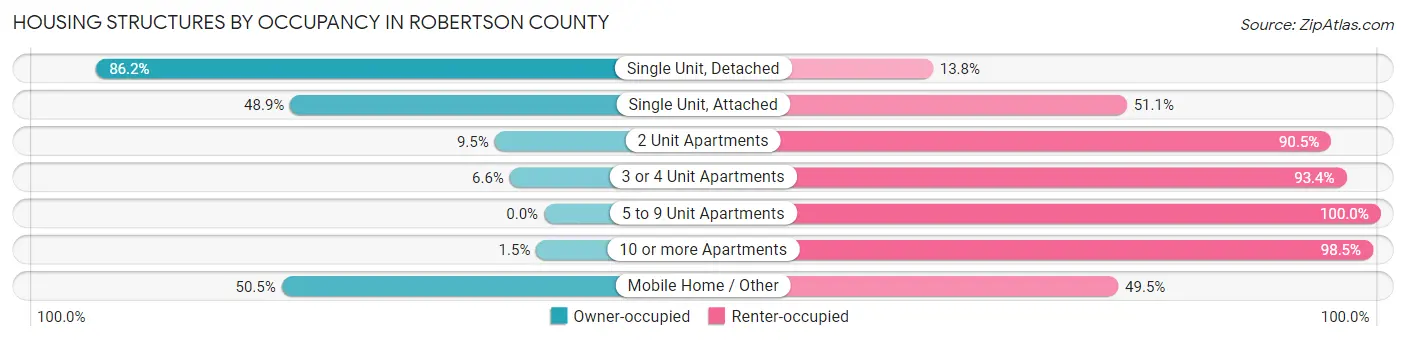
| Structure Type | Owner-occupied | Renter-occupied |
| Single Unit, Detached | 19,375 (86.2%) | 3,098 (13.8%) |
| Single Unit, Attached | 237 (48.9%) | 248 (51.1%) |
| 2 Unit Apartments | 53 (9.5%) | 504 (90.5%) |
| 3 or 4 Unit Apartments | 27 (6.6%) | 382 (93.4%) |
| 5 to 9 Unit Apartments | 0 (0.0%) | 552 (100.0%) |
| 10 or more Apartments | 10 (1.5%) | 663 (98.5%) |
| Mobile Home / Other | 1,013 (50.5%) | 992 (49.5%) |
| Total | 20,715 (76.3%) | 6,439 (23.7%) |
Housing Structures by Number of Rooms in Robertson County
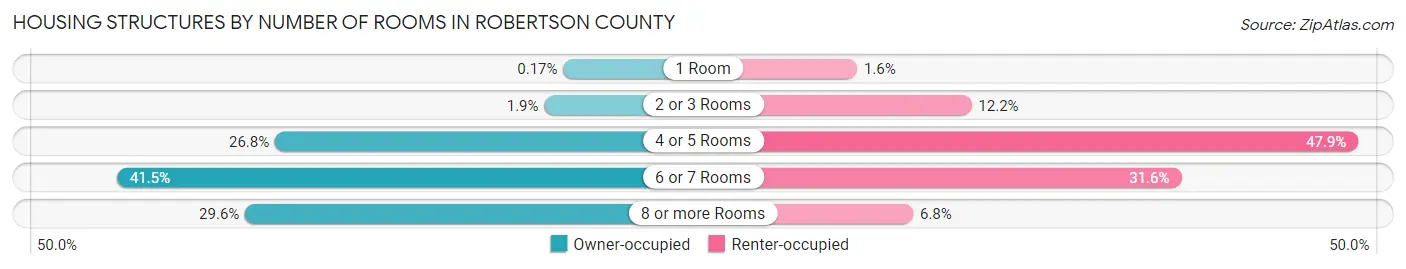
| Number of Rooms | Owner-occupied | Renter-occupied |
| 1 Room | 35 (0.2%) | 102 (1.6%) |
| 2 or 3 Rooms | 399 (1.9%) | 783 (12.2%) |
| 4 or 5 Rooms | 5,559 (26.8%) | 3,086 (47.9%) |
| 6 or 7 Rooms | 8,591 (41.5%) | 2,033 (31.6%) |
| 8 or more Rooms | 6,131 (29.6%) | 435 (6.8%) |
| Total | 20,715 (100.0%) | 6,439 (100.0%) |
Housing Structure by Heating Type in Robertson County
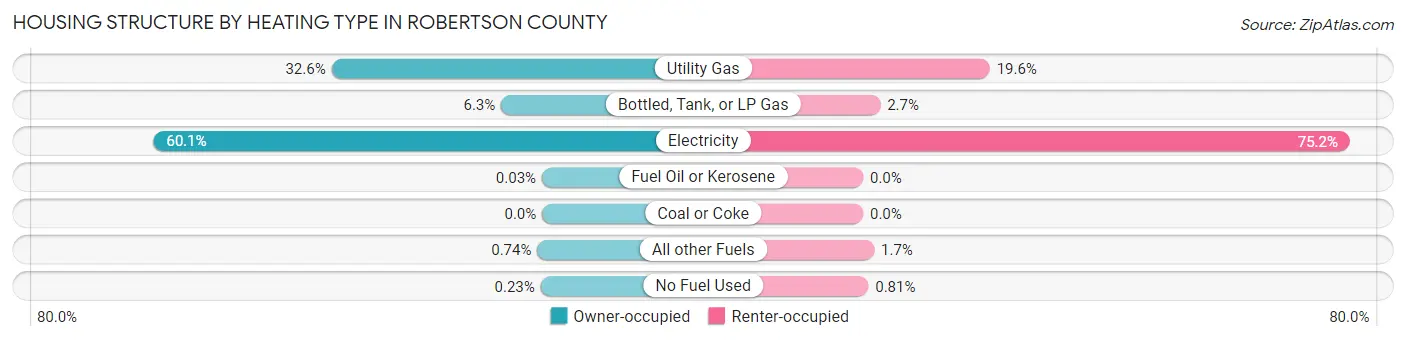
| Heating Type | Owner-occupied | Renter-occupied |
| Utility Gas | 6,745 (32.6%) | 1,261 (19.6%) |
| Bottled, Tank, or LP Gas | 1,313 (6.3%) | 171 (2.7%) |
| Electricity | 12,449 (60.1%) | 4,845 (75.2%) |
| Fuel Oil or Kerosene | 7 (0.0%) | 0 (0.0%) |
| Coal or Coke | 0 (0.0%) | 0 (0.0%) |
| All other Fuels | 153 (0.7%) | 110 (1.7%) |
| No Fuel Used | 48 (0.2%) | 52 (0.8%) |
| Total | 20,715 (100.0%) | 6,439 (100.0%) |
Household Vehicle Usage in Robertson County
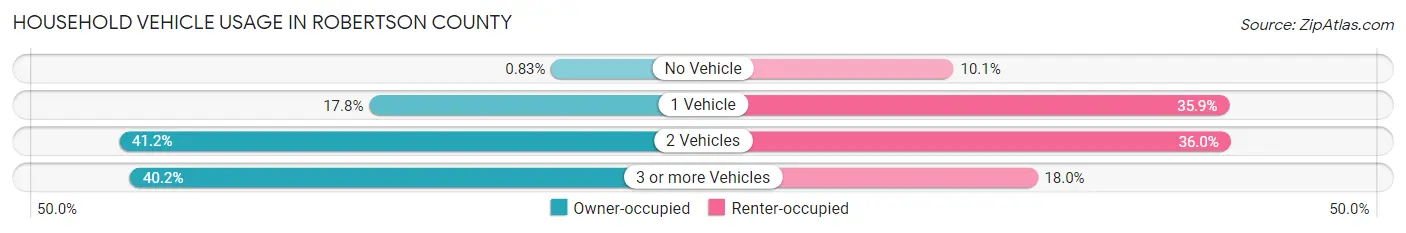
| Vehicles per Household | Owner-occupied | Renter-occupied |
| No Vehicle | 172 (0.8%) | 653 (10.1%) |
| 1 Vehicle | 3,693 (17.8%) | 2,310 (35.9%) |
| 2 Vehicles | 8,530 (41.2%) | 2,319 (36.0%) |
| 3 or more Vehicles | 8,320 (40.2%) | 1,157 (18.0%) |
| Total | 20,715 (100.0%) | 6,439 (100.0%) |
Real Estate & Mortgages in Robertson County
Real Estate and Mortgage Overview in Robertson County
| Characteristic | Without Mortgage | With Mortgage |
| Housing Units | 7,056 | 13,659 |
| Median Property Value | $248,000 | $280,800 |
| Median Household Income | $53,088 | $2,793 |
| Monthly Housing Costs | $484 | $666 |
| Real Estate Taxes | $1,470 | $332 |
Property Value by Mortgage Status in Robertson County
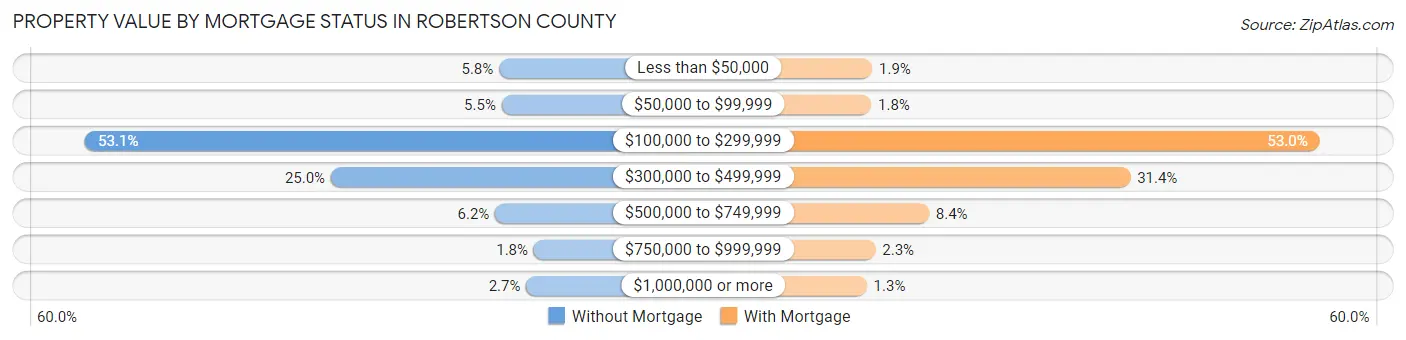
| Property Value | Without Mortgage | With Mortgage |
| Less than $50,000 | 407 (5.8%) | 258 (1.9%) |
| $50,000 to $99,999 | 386 (5.5%) | 243 (1.8%) |
| $100,000 to $299,999 | 3,746 (53.1%) | 7,243 (53.0%) |
| $300,000 to $499,999 | 1,763 (25.0%) | 4,288 (31.4%) |
| $500,000 to $749,999 | 439 (6.2%) | 1,144 (8.4%) |
| $750,000 to $999,999 | 127 (1.8%) | 309 (2.3%) |
| $1,000,000 or more | 188 (2.7%) | 174 (1.3%) |
| Total | 7,056 (100.0%) | 13,659 (100.0%) |
Household Income by Mortgage Status in Robertson County
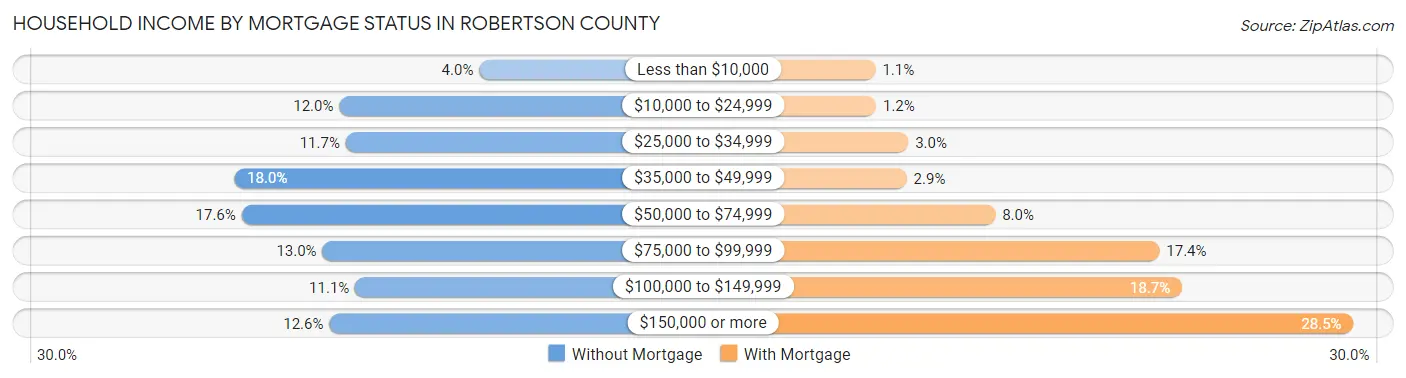
| Household Income | Without Mortgage | With Mortgage |
| Less than $10,000 | 284 (4.0%) | 156 (1.1%) |
| $10,000 to $24,999 | 848 (12.0%) | 160 (1.2%) |
| $25,000 to $34,999 | 822 (11.7%) | 411 (3.0%) |
| $35,000 to $49,999 | 1,272 (18.0%) | 399 (2.9%) |
| $50,000 to $74,999 | 1,242 (17.6%) | 1,090 (8.0%) |
| $75,000 to $99,999 | 916 (13.0%) | 2,371 (17.4%) |
| $100,000 to $149,999 | 784 (11.1%) | 2,549 (18.7%) |
| $150,000 or more | 888 (12.6%) | 3,886 (28.4%) |
| Total | 7,056 (100.0%) | 13,659 (100.0%) |
Property Value to Household Income Ratio in Robertson County
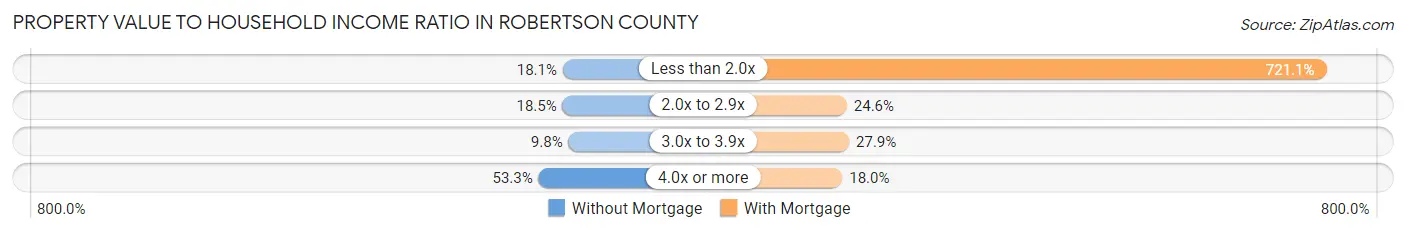
| Value-to-Income Ratio | Without Mortgage | With Mortgage |
| Less than 2.0x | 1,276 (18.1%) | 98,501 (721.1%) |
| 2.0x to 2.9x | 1,302 (18.4%) | 3,358 (24.6%) |
| 3.0x to 3.9x | 692 (9.8%) | 3,805 (27.9%) |
| 4.0x or more | 3,758 (53.3%) | 2,463 (18.0%) |
| Total | 7,056 (100.0%) | 13,659 (100.0%) |
Real Estate Taxes by Mortgage Status in Robertson County
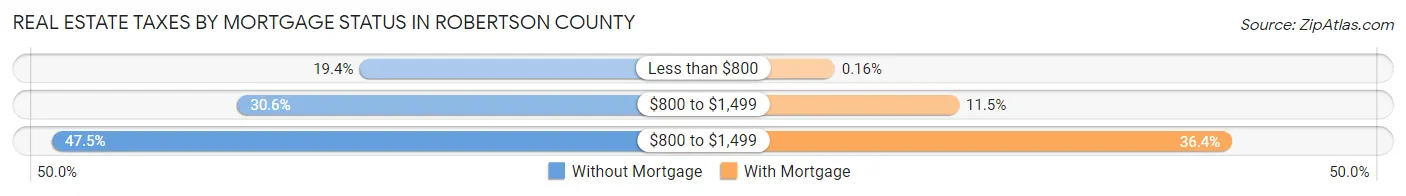
| Property Taxes | Without Mortgage | With Mortgage |
| Less than $800 | 1,372 (19.4%) | 22 (0.2%) |
| $800 to $1,499 | 2,157 (30.6%) | 1,572 (11.5%) |
| $800 to $1,499 | 3,350 (47.5%) | 4,977 (36.4%) |
| Total | 7,056 (100.0%) | 13,659 (100.0%) |
Health & Disability in Robertson County
Health Insurance Coverage by Age in Robertson County
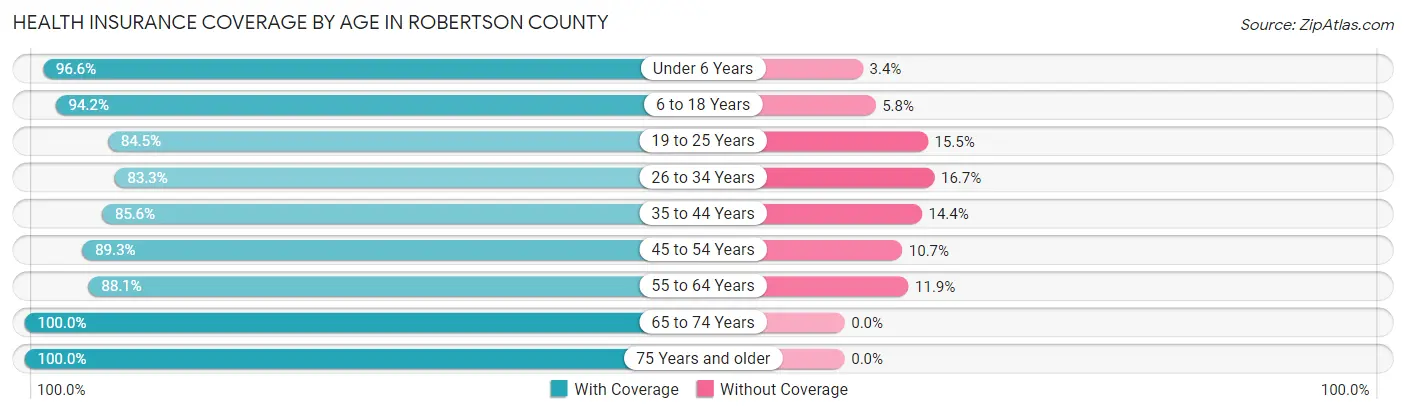
| Age Bracket | With Coverage | Without Coverage |
| Under 6 Years | 5,065 (96.6%) | 179 (3.4%) |
| 6 to 18 Years | 12,381 (94.2%) | 758 (5.8%) |
| 19 to 25 Years | 4,442 (84.5%) | 816 (15.5%) |
| 26 to 34 Years | 7,149 (83.3%) | 1,437 (16.7%) |
| 35 to 44 Years | 8,265 (85.6%) | 1,390 (14.4%) |
| 45 to 54 Years | 8,561 (89.3%) | 1,030 (10.7%) |
| 55 to 64 Years | 9,078 (88.1%) | 1,226 (11.9%) |
| 65 to 74 Years | 6,764 (100.0%) | 0 (0.0%) |
| 75 Years and older | 3,950 (100.0%) | 0 (0.0%) |
| Total | 65,655 (90.6%) | 6,836 (9.4%) |
Health Insurance Coverage by Citizenship Status in Robertson County
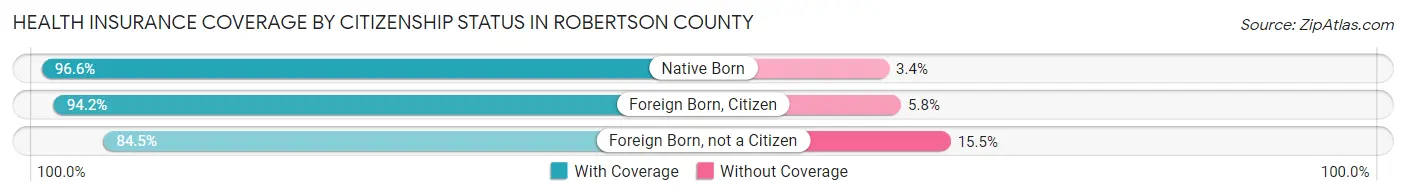
| Citizenship Status | With Coverage | Without Coverage |
| Native Born | 5,065 (96.6%) | 179 (3.4%) |
| Foreign Born, Citizen | 12,381 (94.2%) | 758 (5.8%) |
| Foreign Born, not a Citizen | 4,442 (84.5%) | 816 (15.5%) |
Health Insurance Coverage by Household Income in Robertson County
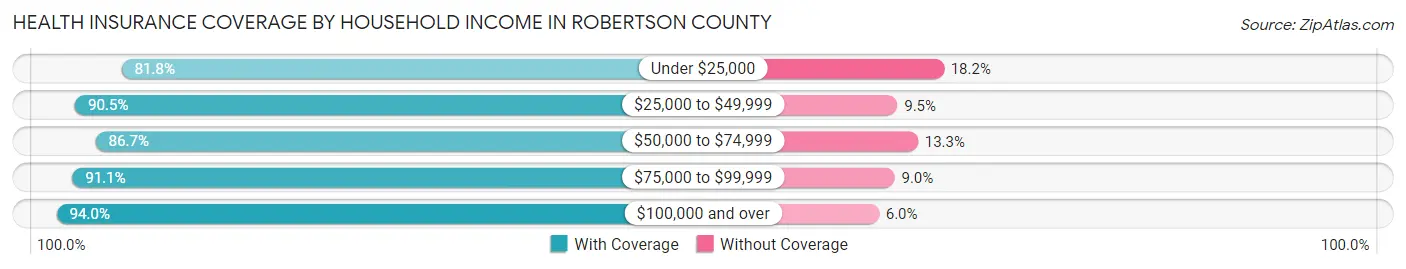
| Household Income | With Coverage | Without Coverage |
| Under $25,000 | 5,546 (81.8%) | 1,231 (18.2%) |
| $25,000 to $49,999 | 10,478 (90.5%) | 1,095 (9.5%) |
| $50,000 to $74,999 | 9,964 (86.7%) | 1,529 (13.3%) |
| $75,000 to $99,999 | 11,319 (91.0%) | 1,113 (8.9%) |
| $100,000 and over | 28,294 (94.0%) | 1,803 (6.0%) |
Public vs Private Health Insurance Coverage by Age in Robertson County
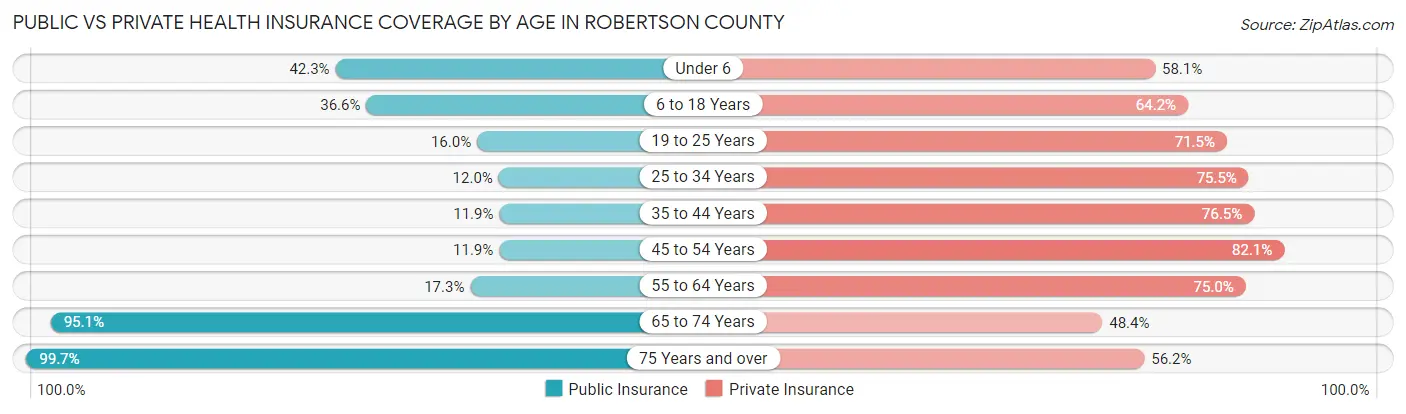
| Age Bracket | Public Insurance | Private Insurance |
| Under 6 | 2,218 (42.3%) | 3,049 (58.1%) |
| 6 to 18 Years | 4,806 (36.6%) | 8,440 (64.2%) |
| 19 to 25 Years | 843 (16.0%) | 3,757 (71.5%) |
| 25 to 34 Years | 1,031 (12.0%) | 6,484 (75.5%) |
| 35 to 44 Years | 1,148 (11.9%) | 7,388 (76.5%) |
| 45 to 54 Years | 1,143 (11.9%) | 7,873 (82.1%) |
| 55 to 64 Years | 1,781 (17.3%) | 7,724 (75.0%) |
| 65 to 74 Years | 6,435 (95.1%) | 3,271 (48.4%) |
| 75 Years and over | 3,937 (99.7%) | 2,218 (56.1%) |
| Total | 23,342 (32.2%) | 50,204 (69.3%) |
Disability Status by Sex by Age in Robertson County
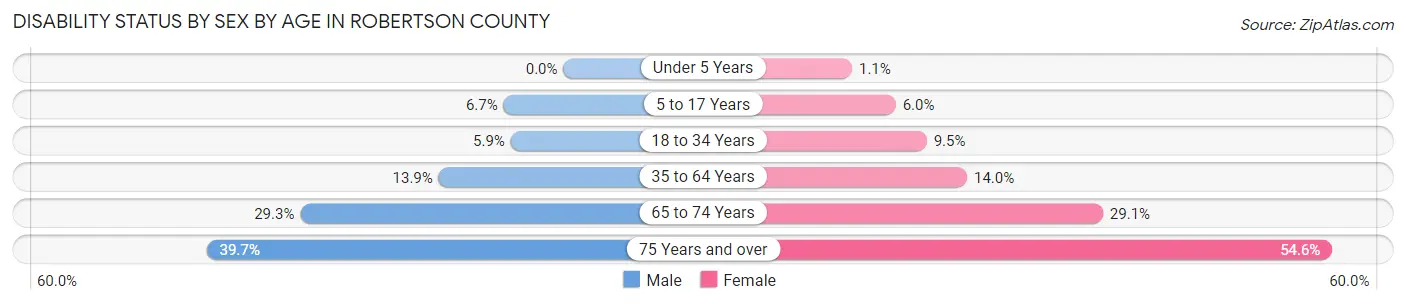
| Age Bracket | Male | Female |
| Under 5 Years | 0 (0.0%) | 24 (1.1%) |
| 5 to 17 Years | 435 (6.7%) | 380 (6.0%) |
| 18 to 34 Years | 436 (5.9%) | 705 (9.5%) |
| 35 to 64 Years | 2,035 (13.9%) | 2,078 (14.0%) |
| 65 to 74 Years | 932 (29.3%) | 1,042 (29.1%) |
| 75 Years and over | 681 (39.7%) | 1,221 (54.6%) |
Disability Class by Sex by Age in Robertson County
Disability Class: Hearing Difficulty
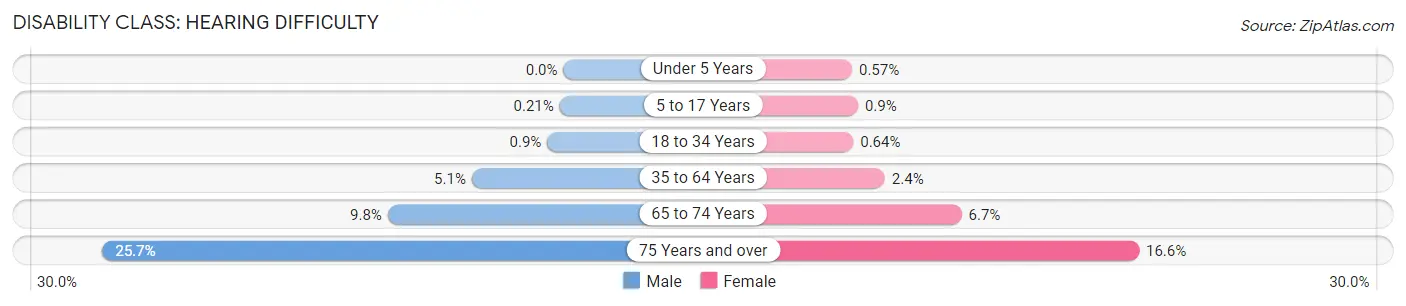
| Age Bracket | Male | Female |
| Under 5 Years | 0 (0.0%) | 12 (0.6%) |
| 5 to 17 Years | 14 (0.2%) | 57 (0.9%) |
| 18 to 34 Years | 67 (0.9%) | 48 (0.6%) |
| 35 to 64 Years | 748 (5.1%) | 358 (2.4%) |
| 65 to 74 Years | 311 (9.8%) | 239 (6.7%) |
| 75 Years and over | 440 (25.7%) | 370 (16.6%) |
Disability Class: Vision Difficulty
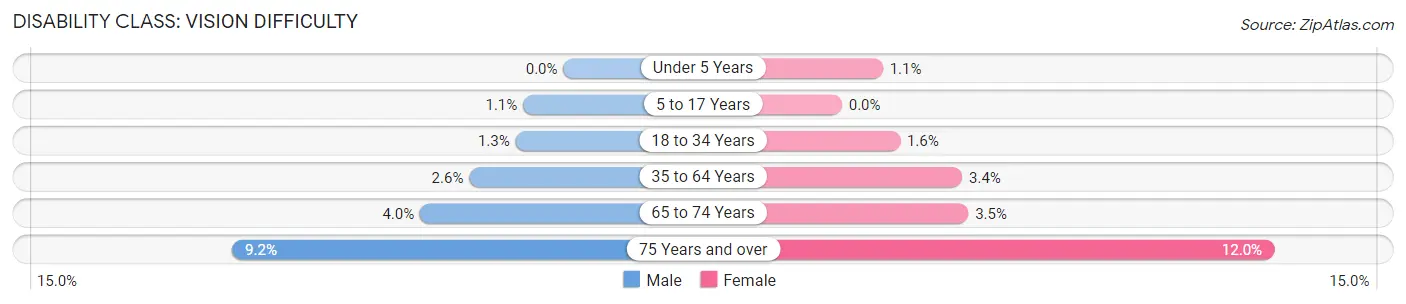
| Age Bracket | Male | Female |
| Under 5 Years | 0 (0.0%) | 24 (1.1%) |
| 5 to 17 Years | 73 (1.1%) | 0 (0.0%) |
| 18 to 34 Years | 99 (1.3%) | 121 (1.6%) |
| 35 to 64 Years | 384 (2.6%) | 499 (3.4%) |
| 65 to 74 Years | 127 (4.0%) | 126 (3.5%) |
| 75 Years and over | 158 (9.2%) | 269 (12.0%) |
Disability Class: Cognitive Difficulty
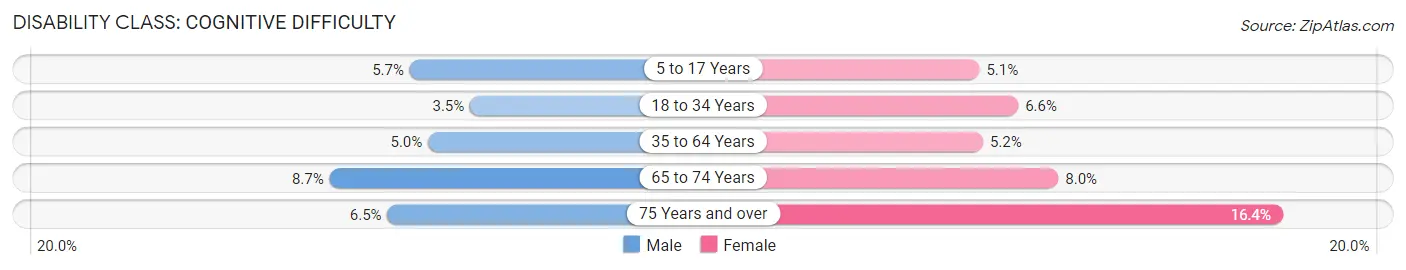
| Age Bracket | Male | Female |
| 5 to 17 Years | 372 (5.7%) | 323 (5.1%) |
| 18 to 34 Years | 257 (3.5%) | 488 (6.6%) |
| 35 to 64 Years | 736 (5.0%) | 780 (5.2%) |
| 65 to 74 Years | 276 (8.7%) | 288 (8.0%) |
| 75 Years and over | 112 (6.5%) | 366 (16.4%) |
Disability Class: Ambulatory Difficulty
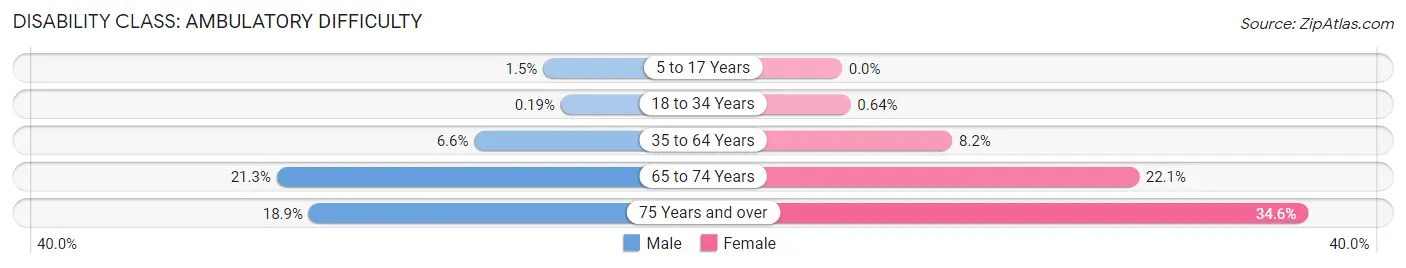
| Age Bracket | Male | Female |
| 5 to 17 Years | 98 (1.5%) | 0 (0.0%) |
| 18 to 34 Years | 14 (0.2%) | 48 (0.6%) |
| 35 to 64 Years | 969 (6.6%) | 1,220 (8.2%) |
| 65 to 74 Years | 677 (21.3%) | 790 (22.1%) |
| 75 Years and over | 324 (18.9%) | 774 (34.6%) |
Disability Class: Self-Care Difficulty
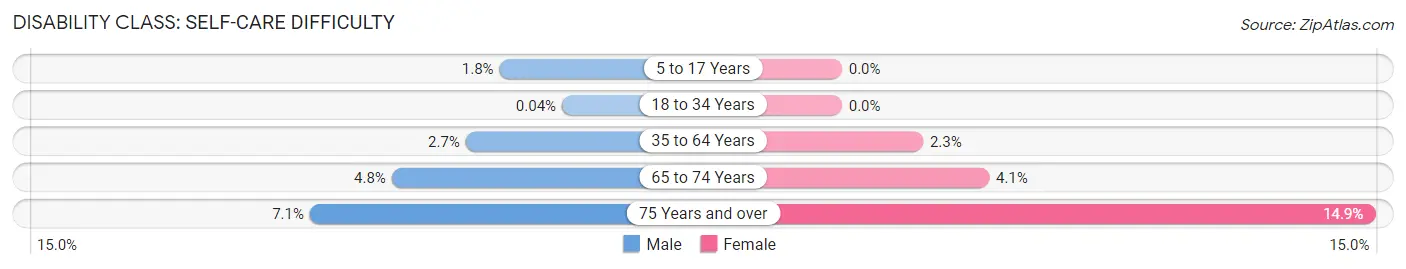
| Age Bracket | Male | Female |
| 5 to 17 Years | 116 (1.8%) | 0 (0.0%) |
| 18 to 34 Years | 3 (0.0%) | 0 (0.0%) |
| 35 to 64 Years | 398 (2.7%) | 337 (2.3%) |
| 65 to 74 Years | 152 (4.8%) | 147 (4.1%) |
| 75 Years and over | 121 (7.1%) | 332 (14.8%) |
Technology Access in Robertson County
Computing Device Access in Robertson County
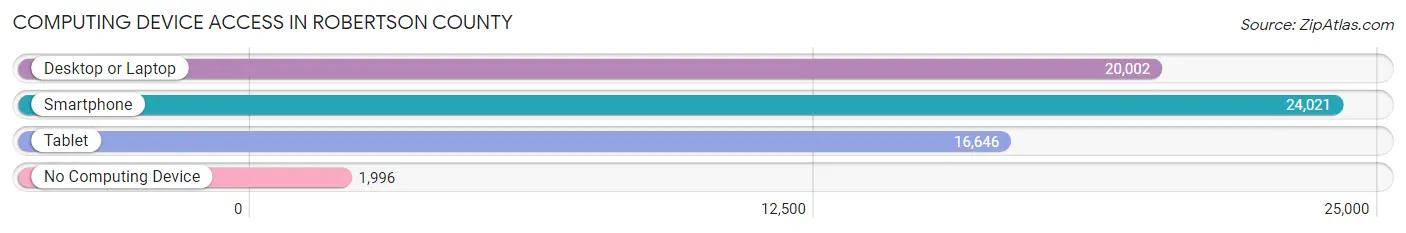
| Device Type | # Households | % Households |
| Desktop or Laptop | 20,002 | 73.7% |
| Smartphone | 24,021 | 88.5% |
| Tablet | 16,646 | 61.3% |
| No Computing Device | 1,996 | 7.3% |
| Total | 27,154 | 100.0% |
Internet Access in Robertson County
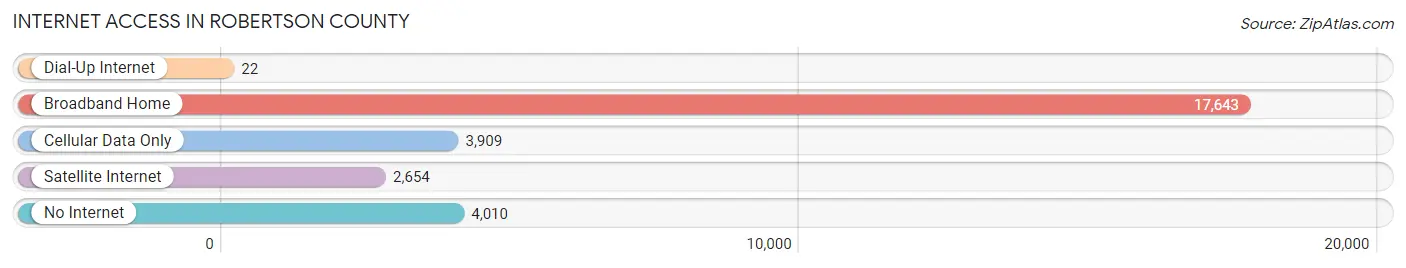
| Internet Type | # Households | % Households |
| Dial-Up Internet | 22 | 0.1% |
| Broadband Home | 17,643 | 65.0% |
| Cellular Data Only | 3,909 | 14.4% |
| Satellite Internet | 2,654 | 9.8% |
| No Internet | 4,010 | 14.8% |
| Total | 27,154 | 100.0% |
Robertson County Summary
Robertson County is located in the northern part of Middle Tennessee, and is part of the Nashville metropolitan area. It is bordered by Sumner, Cheatham, Davidson, and Williamson counties. The county seat is Springfield, and the largest city is White House. The county was named for James Robertson, a founder of the state of Tennessee.
Geography
Robertson County covers an area of 545 square miles, and is located in the Central Basin of Tennessee. The county is mostly flat, with some rolling hills in the northern part. The Cumberland River forms the northern border of the county, and the Harpeth River forms the western border. The county is drained by the Red River, which flows through the center of the county. The county is mostly rural, with some small towns and villages scattered throughout.
Climate
Robertson County has a humid subtropical climate, with hot summers and mild winters. The average annual temperature is around 62°F, and the average annual precipitation is around 45 inches.
Demographics
As of the 2010 census, there were 66,283 people, 24,845 households, and 18,717 families living in the county. The population density was 122 people per square mile. The racial makeup of the county was 90.2% White, 6.2% African American, 0.5% Native American, 0.7% Asian, 0.2% Pacific Islander, 1.2% from other races, and 1.2% from two or more races. Hispanic or Latino of any race were 3.2% of the population.
The median income for a household in the county was $45,837, and the median income for a family was $54,837. The per capita income for the county was $21,837. About 8.7% of families and 11.2% of the population were below the poverty line, including 15.2% of those under age 18 and 9.2% of those age 65 or over.
Economy
The economy of Robertson County is largely based on agriculture and manufacturing. The county is home to several large farms, and the agricultural industry is the largest employer in the county. The manufacturing sector is also important, with several factories located in the county. The county is also home to several large retail stores, including Walmart, Target, and Lowe's.
Education
Robertson County is served by the Robertson County School District, which operates 24 elementary schools, 8 middle schools, and 5 high schools. The county is also home to several private schools, including Springfield Christian Academy and White House Christian Academy. The county is also home to several higher education institutions, including Austin Peay State University, Tennessee State University, and Volunteer State Community College.
Conclusion
Robertson County is a rural county located in the northern part of Middle Tennessee. It is bordered by Sumner, Cheatham, Davidson, and Williamson counties, and is part of the Nashville metropolitan area. The county has a humid subtropical climate, with hot summers and mild winters. The population of the county was 66,283 as of the 2010 census, and the median income for a household was $45,837. The economy of the county is largely based on agriculture and manufacturing, and the county is served by the Robertson County School District.
Common Questions
What is the Total Population of Robertson County?
Total Population of Robertson County is 73,297.
What is the Total Male Population of Robertson County?
Total Male Population of Robertson County is 36,439.
What is the Total Female Population of Robertson County?
Total Female Population of Robertson County is 36,858.
What is the Ratio of Males per 100 Females in Robertson County?
There are 98.86 Males per 100 Females in Robertson County.
What is the Ratio of Females per 100 Males in Robertson County?
There are 101.15 Females per 100 Males in Robertson County.
What is the Median Population Age in Robertson County?
Median Population Age in Robertson County is 39.4 Years.
What is the Average Family Size in Robertson County
Average Family Size in Robertson County is 3.1 People.
What is the Average Household Size in Robertson County
Average Household Size in Robertson County is 2.7 People.
What is Per Capita Income in Robertson County?
Per Capita income in Robertson County is $35,093.
What is the Median Family Income in Robertson County?
Median Family Income in Robertson County is $87,439.
What is the Median Household income in Robertson County?
Median Household Income in Robertson County is $74,440.
What is Income or Wage Gap in Robertson County?
Income or Wage Gap in Robertson County is 28.6%.
Women in Robertson County earn 71.4 cents for every dollar earned by a man.
What is Family Income Deficit in Robertson County?
Family Income Deficit in Robertson County is $10,404.
Families that are below poverty line in Robertson County earn $10,404 less on average than the poverty threshold level.
What is Inequality or Gini Index in Robertson County?
Inequality or Gini Index in Robertson County is 0.41.
How Large is the Labor Force in Robertson County?
There are 37,297 People in the Labor Forcein in Robertson County.
What is the Percentage of People in the Labor Force in Robertson County?
64.3% of People are in the Labor Force in Robertson County.
What is the Unemployment Rate in Robertson County?
Unemployment Rate in Robertson County is 3.8%.