Rhea County, TN
Rhea County Map
Rhea County Overview
33,031
TOTAL POPULATION
16,691
MALE POPULATION
16,340
FEMALE POPULATION
102.15
MALES / 100 FEMALES
97.90
FEMALES / 100 MALES
40.9
MEDIAN AGE
2.9
AVG FAMILY SIZE
2.5
AVG HOUSEHOLD SIZE
$26,678
PER CAPITA INCOME
$60,674
AVG FAMILY INCOME
$55,568
AVG HOUSEHOLD INCOME
33.9%
WAGE / INCOME GAP [ % ]
66.1¢/ $1
WAGE / INCOME GAP [ $ ]
$10,943
FAMILY INCOME DEFICIT
0.42
INEQUALITY / GINI INDEX
14,182
LABOR FORCE [ PEOPLE ]
52.8%
PERCENT IN LABOR FORCE
7.9%
UNEMPLOYMENT RATE
Rhea County Area Codes
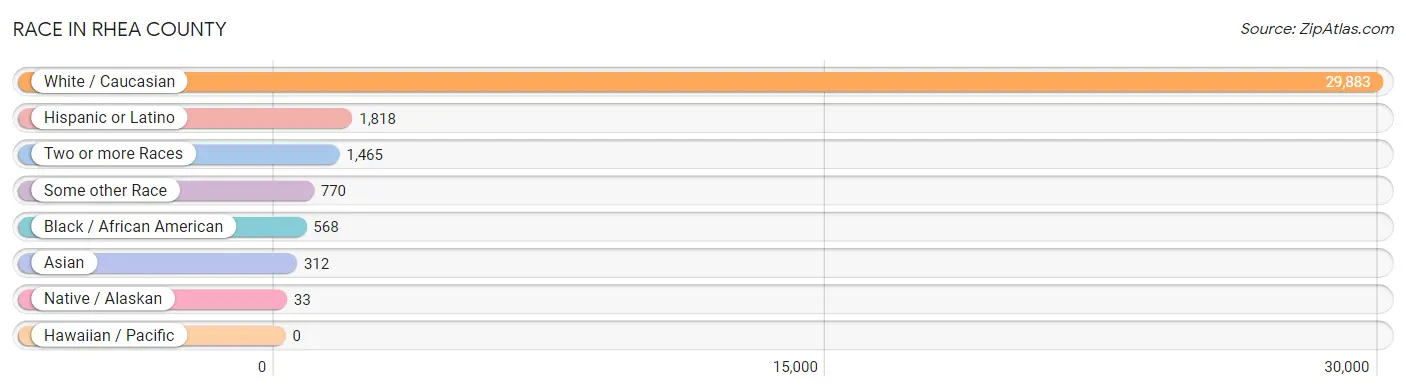
Race in Rhea County
The most populous races in Rhea County are White / Caucasian (29,883 | 90.5%), Hispanic or Latino (1,818 | 5.5%), and Two or more Races (1,465 | 4.4%).
| Race | # Population | % Population |
| Asian | 312 | 0.9% |
| Black / African American | 568 | 1.7% |
| Hawaiian / Pacific | 0 | 0.0% |
| Hispanic or Latino | 1,818 | 5.5% |
| Native / Alaskan | 33 | 0.1% |
| White / Caucasian | 29,883 | 90.5% |
| Two or more Races | 1,465 | 4.4% |
| Some other Race | 770 | 2.3% |
| Total | 33,031 | 100.0% |
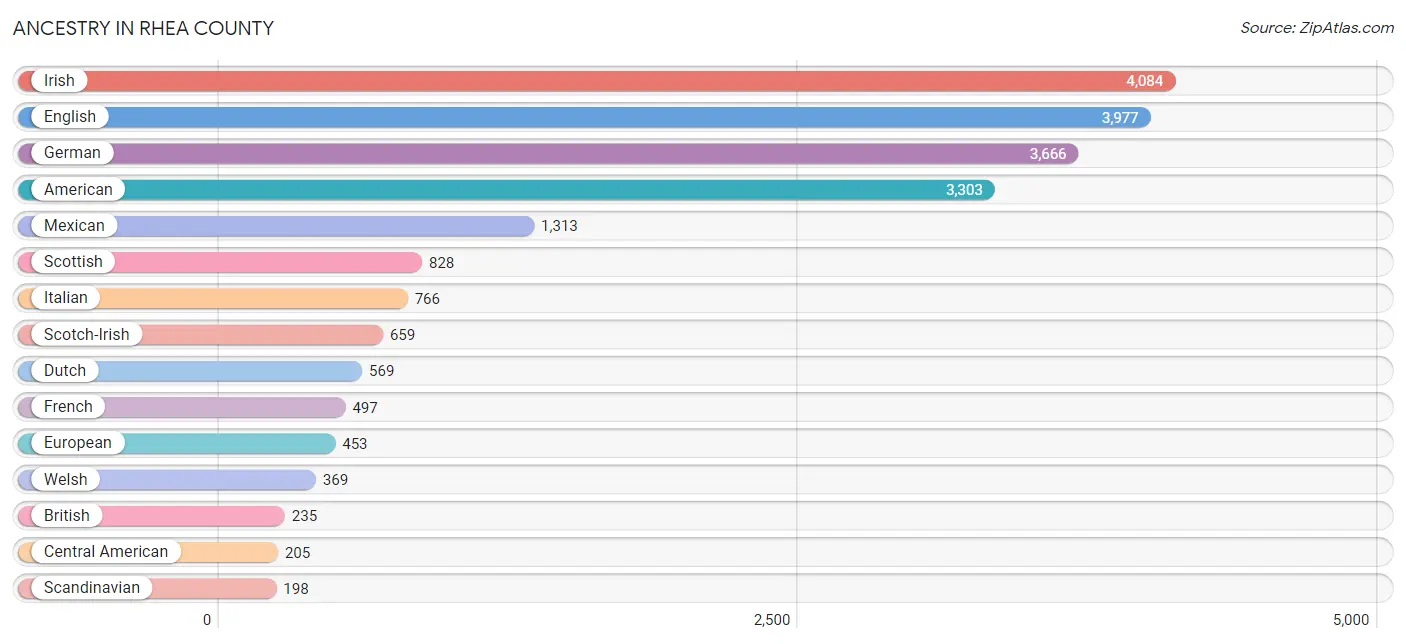
Ancestry in Rhea County
The most populous ancestries reported in Rhea County are Irish (4,084 | 12.4%), English (3,977 | 12.0%), German (3,666 | 11.1%), American (3,303 | 10.0%), and Mexican (1,313 | 4.0%), together accounting for 49.5% of all Rhea County residents.
| Ancestry | # Population | % Population |
| African | 13 | 0.0% |
| American | 3,303 | 10.0% |
| Austrian | 31 | 0.1% |
| Belgian | 42 | 0.1% |
| Bhutanese | 52 | 0.2% |
| Blackfeet | 30 | 0.1% |
| Brazilian | 15 | 0.1% |
| British | 235 | 0.7% |
| Burmese | 38 | 0.1% |
| Canadian | 11 | 0.0% |
| Central American | 205 | 0.6% |
| Central American Indian | 11 | 0.0% |
| Cherokee | 174 | 0.5% |
| Colombian | 17 | 0.1% |
| Creek | 3 | 0.0% |
| Cuban | 9 | 0.0% |
| Czech | 122 | 0.4% |
| Danish | 25 | 0.1% |
| Dominican | 4 | 0.0% |
| Dutch | 569 | 1.7% |
| Dutch West Indian | 6 | 0.0% |
| Eastern European | 25 | 0.1% |
| Ecuadorian | 66 | 0.2% |
| English | 3,977 | 12.0% |
| European | 453 | 1.4% |
| Finnish | 37 | 0.1% |
| French | 497 | 1.5% |
| French American Indian | 3 | 0.0% |
| French Canadian | 54 | 0.2% |
| German | 3,666 | 11.1% |
| Greek | 43 | 0.1% |
| Guatemalan | 90 | 0.3% |
| Hungarian | 50 | 0.2% |
| Indian (Asian) | 7 | 0.0% |
| Inupiat | 3 | 0.0% |
| Irish | 4,084 | 12.4% |
| Israeli | 4 | 0.0% |
| Italian | 766 | 2.3% |
| Korean | 189 | 0.6% |
| Mexican | 1,313 | 4.0% |
| Nicaraguan | 91 | 0.3% |
| Northern European | 90 | 0.3% |
| Norwegian | 74 | 0.2% |
| Polish | 163 | 0.5% |
| Portuguese | 19 | 0.1% |
| Puerto Rican | 170 | 0.5% |
| Russian | 45 | 0.1% |
| Salvadoran | 24 | 0.1% |
| Scandinavian | 198 | 0.6% |
| Scotch-Irish | 659 | 2.0% |
| Scottish | 828 | 2.5% |
| Seminole | 17 | 0.1% |
| Sioux | 6 | 0.0% |
| Slovak | 8 | 0.0% |
| South American | 87 | 0.3% |
| Spaniard | 17 | 0.1% |
| Spanish | 13 | 0.0% |
| Sri Lankan | 15 | 0.1% |
| Subsaharan African | 13 | 0.0% |
| Swedish | 119 | 0.4% |
| Swiss | 133 | 0.4% |
| Thai | 103 | 0.3% |
| Venezuelan | 4 | 0.0% |
| Welsh | 369 | 1.1% | View All 64 Rows |
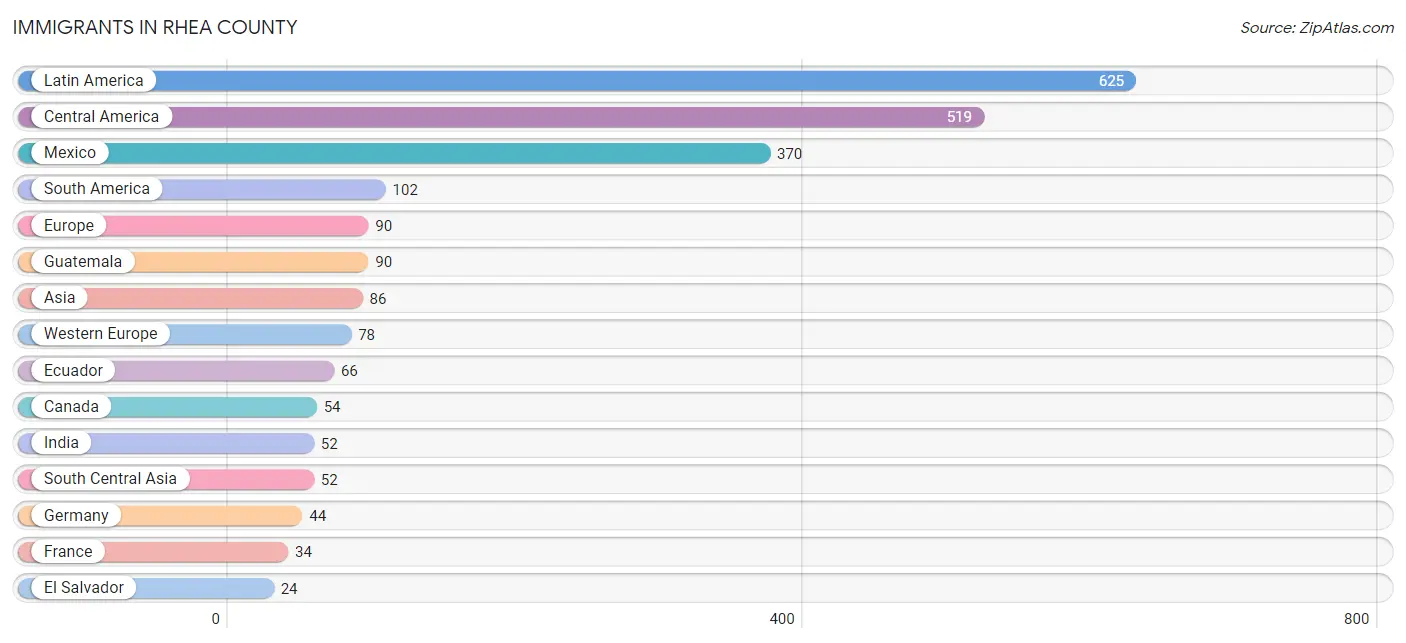
Immigrants in Rhea County
The most numerous immigrant groups reported in Rhea County came from Latin America (625 | 1.9%), Central America (519 | 1.6%), Mexico (370 | 1.1%), South America (102 | 0.3%), and Europe (90 | 0.3%), together accounting for 5.2% of all Rhea County residents.
| Immigration Origin | # Population | % Population |
| Asia | 86 | 0.3% |
| Brazil | 15 | 0.1% |
| Canada | 54 | 0.2% |
| Caribbean | 4 | 0.0% |
| Central America | 519 | 1.6% |
| Colombia | 17 | 0.1% |
| Denmark | 4 | 0.0% |
| Dominican Republic | 4 | 0.0% |
| Eastern Asia | 23 | 0.1% |
| Ecuador | 66 | 0.2% |
| El Salvador | 24 | 0.1% |
| England | 4 | 0.0% |
| Europe | 90 | 0.3% |
| France | 34 | 0.1% |
| Germany | 44 | 0.1% |
| Guatemala | 90 | 0.3% |
| India | 52 | 0.2% |
| Korea | 23 | 0.1% |
| Latin America | 625 | 1.9% |
| Mexico | 370 | 1.1% |
| Nicaragua | 22 | 0.1% |
| Northern Europe | 12 | 0.0% |
| Panama | 13 | 0.0% |
| Philippines | 11 | 0.0% |
| South America | 102 | 0.3% |
| South Central Asia | 52 | 0.2% |
| South Eastern Asia | 11 | 0.0% |
| Venezuela | 4 | 0.0% |
| Western Europe | 78 | 0.2% | View All 29 Rows |
Sex and Age in Rhea County
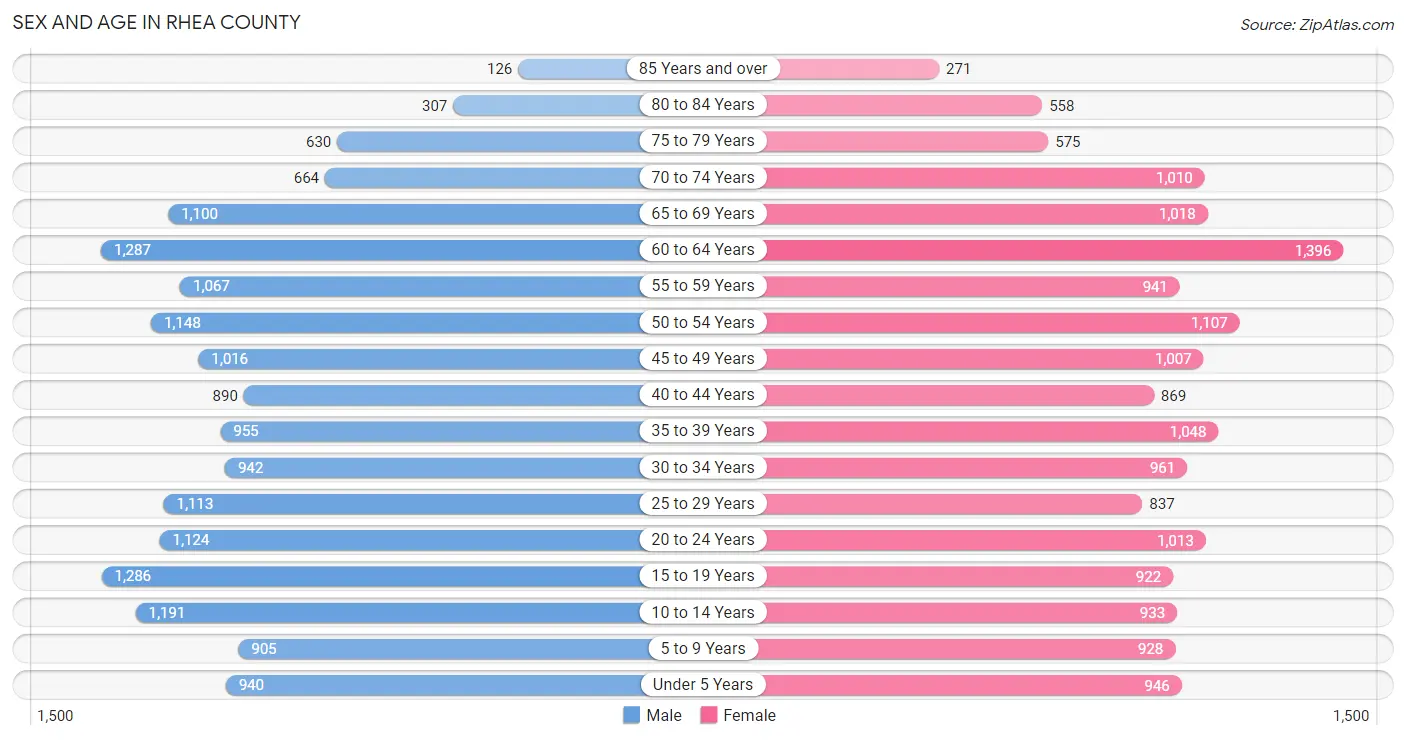
Sex and Age in Rhea County
The most populous age groups in Rhea County are 60 to 64 Years (1,287 | 7.7%) for men and 60 to 64 Years (1,396 | 8.5%) for women.
| Age Bracket | Male | Female |
| Under 5 Years | 940 (5.6%) | 946 (5.8%) |
| 5 to 9 Years | 905 (5.4%) | 928 (5.7%) |
| 10 to 14 Years | 1,191 (7.1%) | 933 (5.7%) |
| 15 to 19 Years | 1,286 (7.7%) | 922 (5.6%) |
| 20 to 24 Years | 1,124 (6.7%) | 1,013 (6.2%) |
| 25 to 29 Years | 1,113 (6.7%) | 837 (5.1%) |
| 30 to 34 Years | 942 (5.6%) | 961 (5.9%) |
| 35 to 39 Years | 955 (5.7%) | 1,048 (6.4%) |
| 40 to 44 Years | 890 (5.3%) | 869 (5.3%) |
| 45 to 49 Years | 1,016 (6.1%) | 1,007 (6.2%) |
| 50 to 54 Years | 1,148 (6.9%) | 1,107 (6.8%) |
| 55 to 59 Years | 1,067 (6.4%) | 941 (5.8%) |
| 60 to 64 Years | 1,287 (7.7%) | 1,396 (8.5%) |
| 65 to 69 Years | 1,100 (6.6%) | 1,018 (6.2%) |
| 70 to 74 Years | 664 (4.0%) | 1,010 (6.2%) |
| 75 to 79 Years | 630 (3.8%) | 575 (3.5%) |
| 80 to 84 Years | 307 (1.8%) | 558 (3.4%) |
| 85 Years and over | 126 (0.7%) | 271 (1.7%) |
| Total | 16,691 (100.0%) | 16,340 (100.0%) |
Families and Households in Rhea County
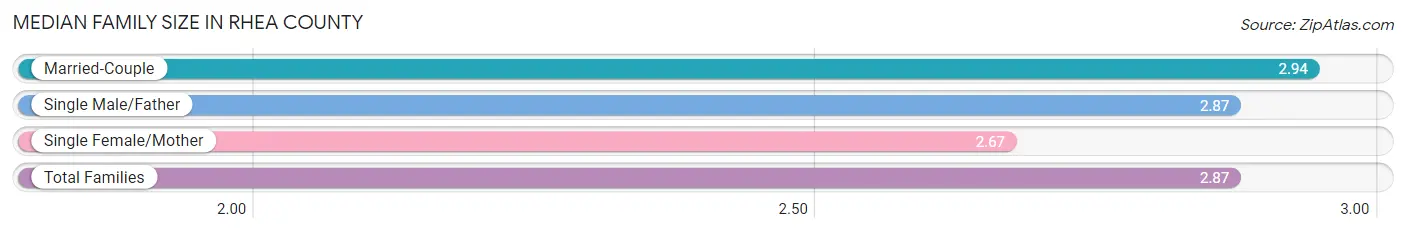
Median Family Size in Rhea County
The median family size in Rhea County is 2.87 persons per family, with married-couple families (6,541 | 70.2%) accounting for the largest median family size of 2.94 persons per family. On the other hand, single female/mother families (2,136 | 22.9%) represent the smallest median family size with 2.67 persons per family.
| Family Type | # Families | Family Size |
| Married-Couple | 6,541 (70.2%) | 2.94 |
| Single Male/Father | 635 (6.8%) | 2.87 |
| Single Female/Mother | 2,136 (22.9%) | 2.67 |
| Total Families | 9,312 (100.0%) | 2.87 |
Median Household Size in Rhea County
The median household size in Rhea County is 2.53 persons per household, with single male/father households (635 | 5.0%) accounting for the largest median household size of 3.21 persons per household. non-family households (3,432 | 26.9%) represent the smallest median household size with 1.28 persons per household.

| Household Type | # Households | Household Size |
| Married-Couple | 6,541 (51.3%) | 2.95 |
| Single Male/Father | 635 (5.0%) | 3.21 |
| Single Female/Mother | 2,136 (16.8%) | 3.07 |
| Non-family | 3,432 (26.9%) | 1.28 |
| Total Households | 12,744 (100.0%) | 2.53 |
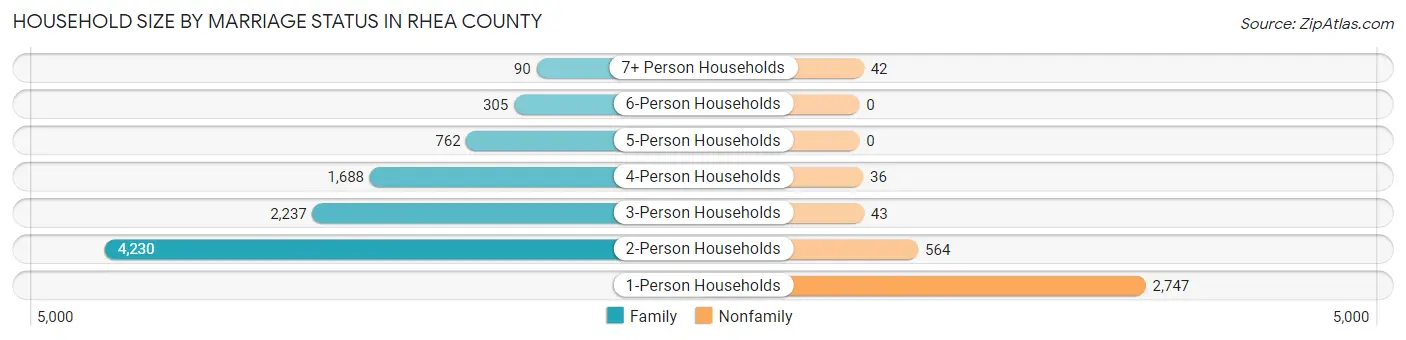
Household Size by Marriage Status in Rhea County
Out of a total of 12,744 households in Rhea County, 9,312 (73.1%) are family households, while 3,432 (26.9%) are nonfamily households. The most numerous type of family households are 2-person households, comprising 4,230, and the most common type of nonfamily households are 1-person households, comprising 2,747.
| Household Size | Family Households | Nonfamily Households |
| 1-Person Households | - | 2,747 (21.6%) |
| 2-Person Households | 4,230 (33.2%) | 564 (4.4%) |
| 3-Person Households | 2,237 (17.5%) | 43 (0.3%) |
| 4-Person Households | 1,688 (13.3%) | 36 (0.3%) |
| 5-Person Households | 762 (6.0%) | 0 (0.0%) |
| 6-Person Households | 305 (2.4%) | 0 (0.0%) |
| 7+ Person Households | 90 (0.7%) | 42 (0.3%) |
| Total | 9,312 (73.1%) | 3,432 (26.9%) |
Female Fertility in Rhea County
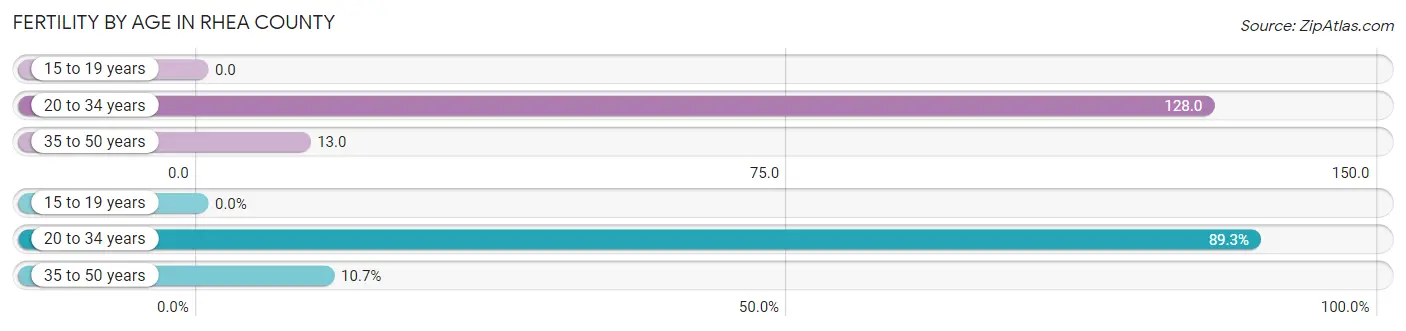
Fertility by Age in Rhea County
Average fertility rate in Rhea County is 58.0 births per 1,000 women. Women in the age bracket of 20 to 34 years have the highest fertility rate with 128.0 births per 1,000 women. Women in the age bracket of 20 to 34 years acount for 89.3% of all women with births.
| Age Bracket | Women with Births | Births / 1,000 Women |
| 15 to 19 years | 0 (0.0%) | 0.0 |
| 20 to 34 years | 359 (89.3%) | 128.0 |
| 35 to 50 years | 43 (10.7%) | 13.0 |
| Total | 402 (100.0%) | 58.0 |
Fertility by Age by Marriage Status in Rhea County
77.1% of women with births (402) in Rhea County are married. The highest percentage of unmarried women with births falls into 20 to 34 years age bracket with 25.6% of them unmarried at the time of birth, while the lowest percentage of unmarried women with births belong to 35 to 50 years age bracket with 0.0% of them unmarried.
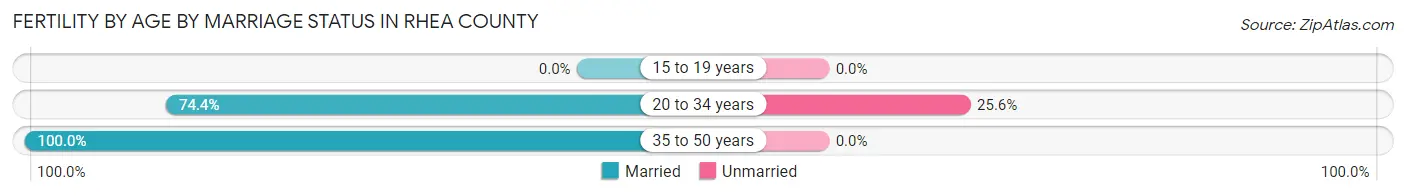
| Age Bracket | Married | Unmarried |
| 15 to 19 years | 0 (0.0%) | 0 (0.0%) |
| 20 to 34 years | 267 (74.4%) | 92 (25.6%) |
| 35 to 50 years | 43 (100.0%) | 0 (0.0%) |
| Total | 310 (77.1%) | 92 (22.9%) |
Fertility by Education in Rhea County
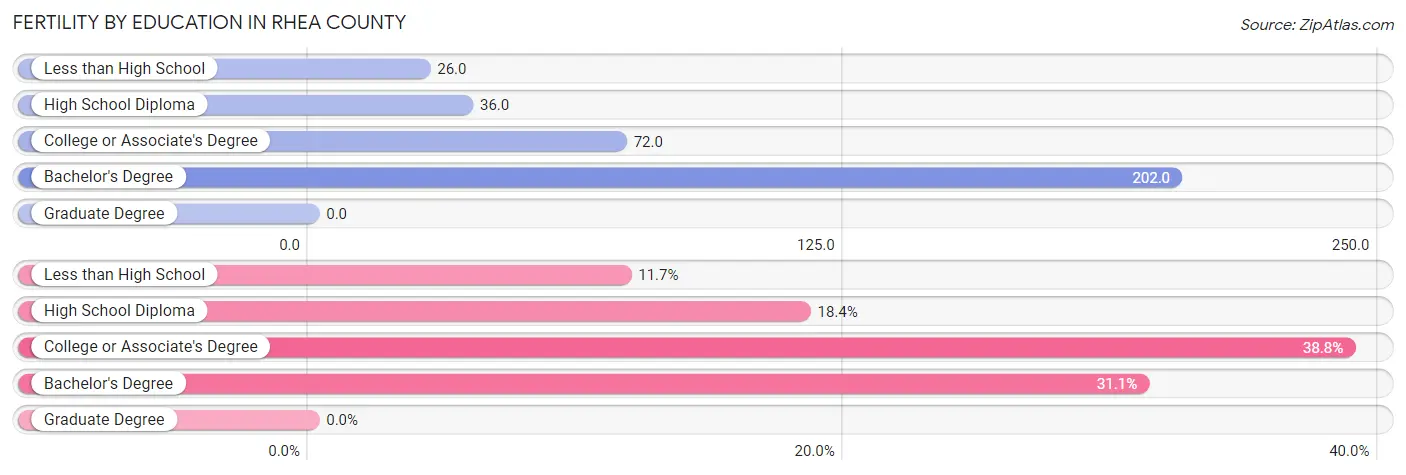
| Educational Attainment | Women with Births | Births / 1,000 Women |
| Less than High School | 47 (11.7%) | 26.0 |
| High School Diploma | 74 (18.4%) | 36.0 |
| College or Associate's Degree | 156 (38.8%) | 72.0 |
| Bachelor's Degree | 125 (31.1%) | 202.0 |
| Graduate Degree | 0 (0.0%) | 0.0 |
| Total | 402 (100.0%) | 58.0 |
Fertility by Education by Marriage Status in Rhea County
22.9% of women with births in Rhea County are unmarried. Women with the educational attainment of bachelor's degree are most likely to be married with 100.0% of them married at childbirth, while women with the educational attainment of less than high school are least likely to be married with 100.0% of them unmarried at childbirth.
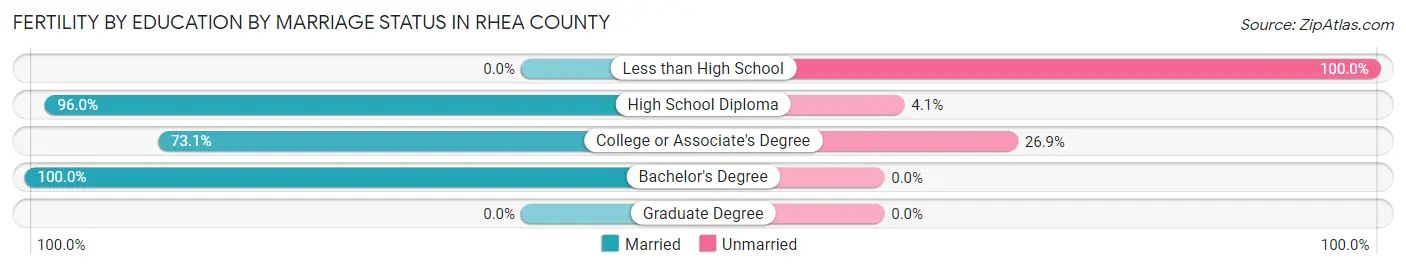
| Educational Attainment | Married | Unmarried |
| Less than High School | 0 (0.0%) | 47 (100.0%) |
| High School Diploma | 71 (96.0%) | 3 (4.1%) |
| College or Associate's Degree | 114 (73.1%) | 42 (26.9%) |
| Bachelor's Degree | 125 (100.0%) | 0 (0.0%) |
| Graduate Degree | 0 (0.0%) | 0 (0.0%) |
| Total | 310 (77.1%) | 92 (22.9%) |
Income in Rhea County
Income Overview in Rhea County
Per Capita Income in Rhea County is $26,678, while median incomes of families and households are $60,674 and $55,568 respectively.
| Characteristic | Number | Measure |
| Per Capita Income | 33,031 | $26,678 |
| Median Family Income | 9,312 | $60,674 |
| Mean Family Income | 9,312 | $76,194 |
| Median Household Income | 12,744 | $55,568 |
| Mean Household Income | 12,744 | $70,017 |
| Income Deficit | 9,312 | $10,943 |
| Wage / Income Gap (%) | 33,031 | 33.93% |
| Wage / Income Gap ($) | 33,031 | 66.07¢ per $1 |
| Gini / Inequality Index | 33,031 | 0.42 |
Earnings by Sex in Rhea County
Average Earnings in Rhea County are $32,751, $38,484 for men and $25,427 for women, a difference of 33.9%.
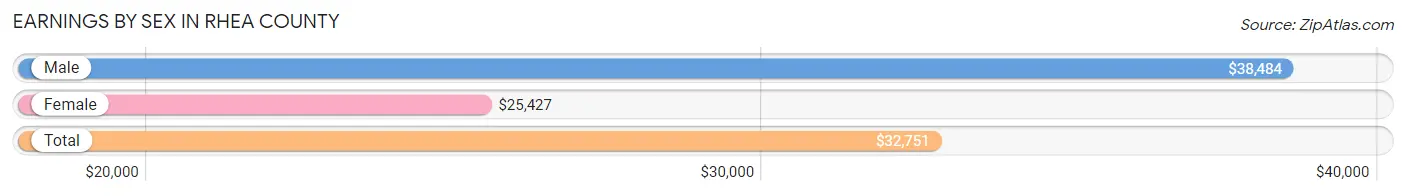
| Sex | Number | Average Earnings |
| Male | 8,647 (58.4%) | $38,484 |
| Female | 6,173 (41.6%) | $25,427 |
| Total | 14,820 (100.0%) | $32,751 |
Earnings by Sex by Income Bracket in Rhea County
The most common earnings brackets in Rhea County are $100,000+ for men (1,033 | 11.9%) and $35,000 to $39,999 for women (576 | 9.3%).
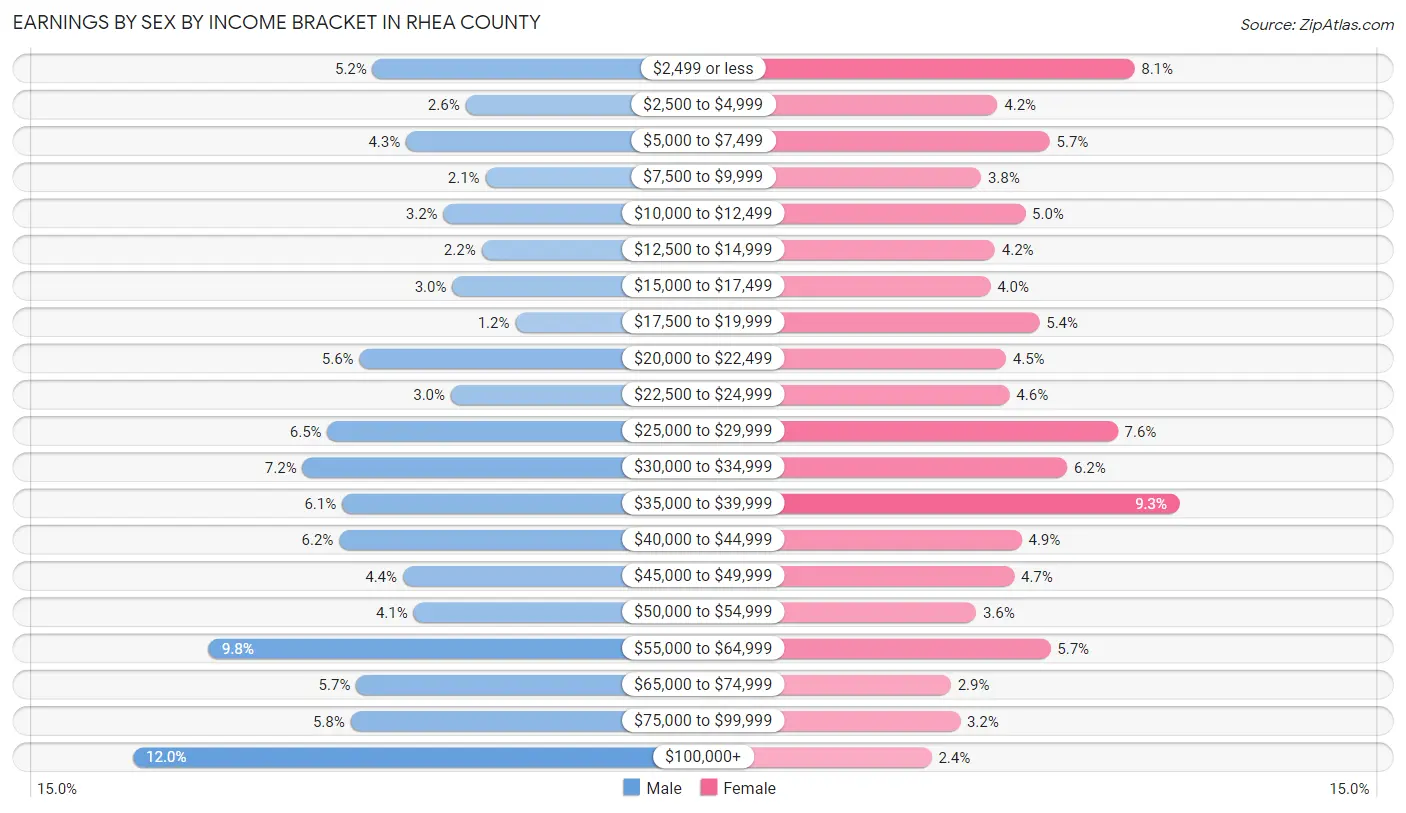
| Income | Male | Female |
| $2,499 or less | 451 (5.2%) | 499 (8.1%) |
| $2,500 to $4,999 | 226 (2.6%) | 261 (4.2%) |
| $5,000 to $7,499 | 370 (4.3%) | 352 (5.7%) |
| $7,500 to $9,999 | 177 (2.1%) | 233 (3.8%) |
| $10,000 to $12,499 | 279 (3.2%) | 309 (5.0%) |
| $12,500 to $14,999 | 187 (2.2%) | 257 (4.2%) |
| $15,000 to $17,499 | 258 (3.0%) | 249 (4.0%) |
| $17,500 to $19,999 | 105 (1.2%) | 334 (5.4%) |
| $20,000 to $22,499 | 483 (5.6%) | 276 (4.5%) |
| $22,500 to $24,999 | 261 (3.0%) | 282 (4.6%) |
| $25,000 to $29,999 | 561 (6.5%) | 470 (7.6%) |
| $30,000 to $34,999 | 622 (7.2%) | 382 (6.2%) |
| $35,000 to $39,999 | 526 (6.1%) | 576 (9.3%) |
| $40,000 to $44,999 | 533 (6.2%) | 303 (4.9%) |
| $45,000 to $49,999 | 378 (4.4%) | 290 (4.7%) |
| $50,000 to $54,999 | 352 (4.1%) | 224 (3.6%) |
| $55,000 to $64,999 | 849 (9.8%) | 353 (5.7%) |
| $65,000 to $74,999 | 491 (5.7%) | 180 (2.9%) |
| $75,000 to $99,999 | 505 (5.8%) | 196 (3.2%) |
| $100,000+ | 1,033 (11.9%) | 147 (2.4%) |
| Total | 8,647 (100.0%) | 6,173 (100.0%) |
Earnings by Sex by Educational Attainment in Rhea County
Average earnings in Rhea County are $44,755 for men and $29,054 for women, a difference of 35.1%. Men with an educational attainment of bachelor's degree enjoy the highest average annual earnings of $72,305, while those with less than high school education earn the least with $37,966. Women with an educational attainment of graduate degree earn the most with the average annual earnings of $43,606, while those with less than high school education have the smallest earnings of $12,374.
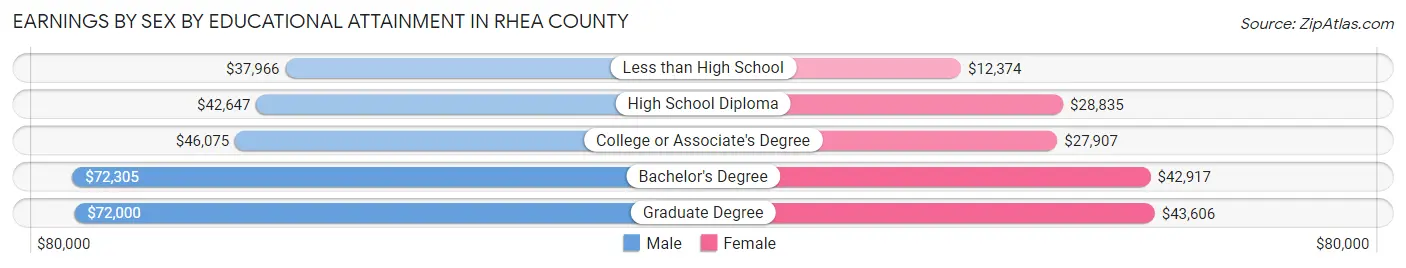
| Educational Attainment | Male Income | Female Income |
| Less than High School | $37,966 | $12,374 |
| High School Diploma | $42,647 | $28,835 |
| College or Associate's Degree | $46,075 | $27,907 |
| Bachelor's Degree | $72,305 | $42,917 |
| Graduate Degree | $72,000 | $43,606 |
| Total | $44,755 | $29,054 |
Family Income in Rhea County
Family Income Brackets in Rhea County
According to the Rhea County family income data, there are 2,309 families falling into the $50,000 to $74,999 income range, which is the most common income bracket and makes up 24.8% of all families. Conversely, the $10,000 to $14,999 income bracket is the least frequent group with only 307 families (3.3%) belonging to this category.
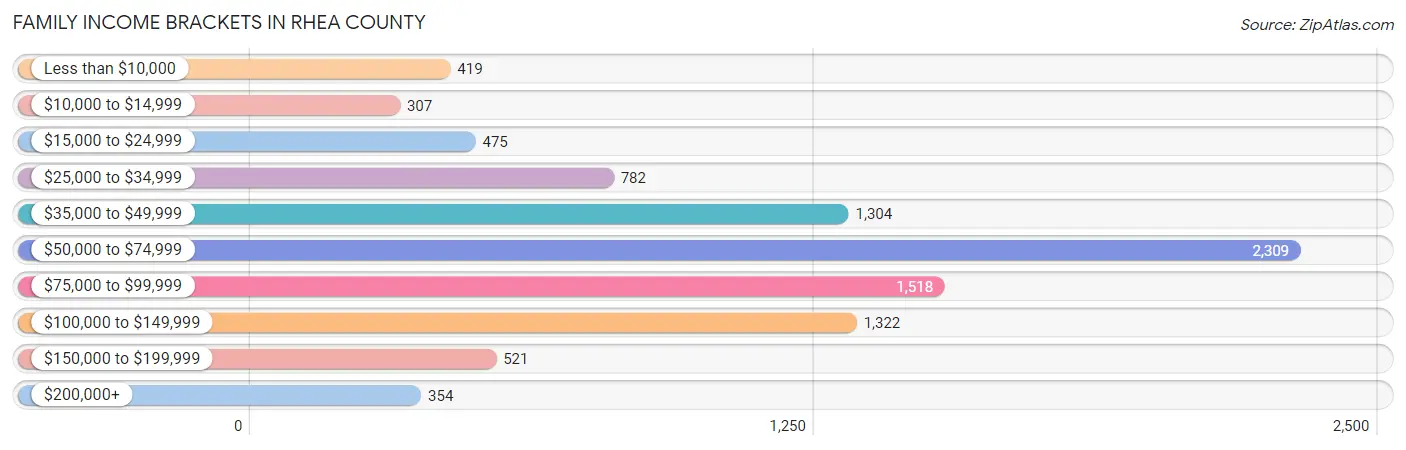
| Income Bracket | # Families | % Families |
| Less than $10,000 | 419 | 4.5% |
| $10,000 to $14,999 | 307 | 3.3% |
| $15,000 to $24,999 | 475 | 5.1% |
| $25,000 to $34,999 | 782 | 8.4% |
| $35,000 to $49,999 | 1,304 | 14.0% |
| $50,000 to $74,999 | 2,309 | 24.8% |
| $75,000 to $99,999 | 1,518 | 16.3% |
| $100,000 to $149,999 | 1,322 | 14.2% |
| $150,000 to $199,999 | 521 | 5.6% |
| $200,000+ | 354 | 3.8% |
Family Income by Famaliy Size in Rhea County
5-person families (659 | 7.1%) account for the highest median family income in Rhea County with $82,232 per family, while 2-person families (4,612 | 49.5%) have the highest median income of $30,702 per family member.
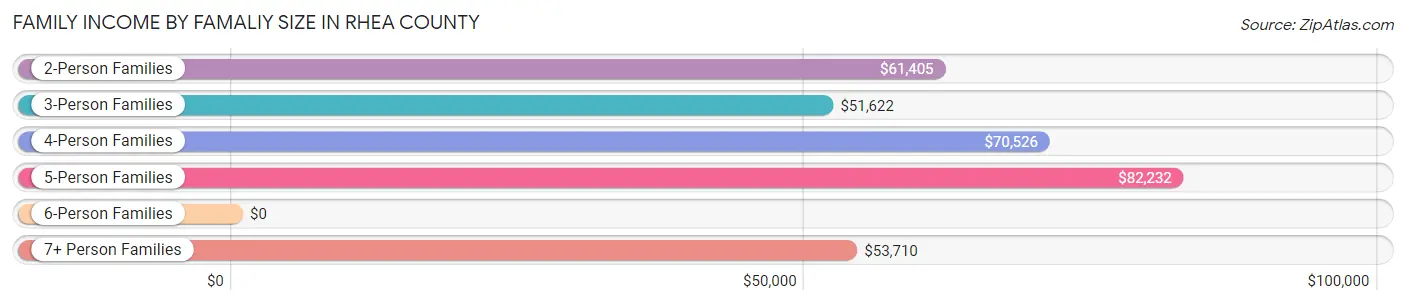
| Income Bracket | # Families | Median Income |
| 2-Person Families | 4,612 (49.5%) | $61,405 |
| 3-Person Families | 2,315 (24.9%) | $51,622 |
| 4-Person Families | 1,349 (14.5%) | $70,526 |
| 5-Person Families | 659 (7.1%) | $82,232 |
| 6-Person Families | 305 (3.3%) | $0 |
| 7+ Person Families | 72 (0.8%) | $53,710 |
| Total | 9,312 (100.0%) | $60,674 |
Family Income by Number of Earners in Rhea County
The median family income in Rhea County is $60,674, with families comprising 3+ earners (899) having the highest median family income of $108,969, while families with no earners (2,325) have the lowest median family income of $42,884, accounting for 9.7% and 25.0% of families, respectively.
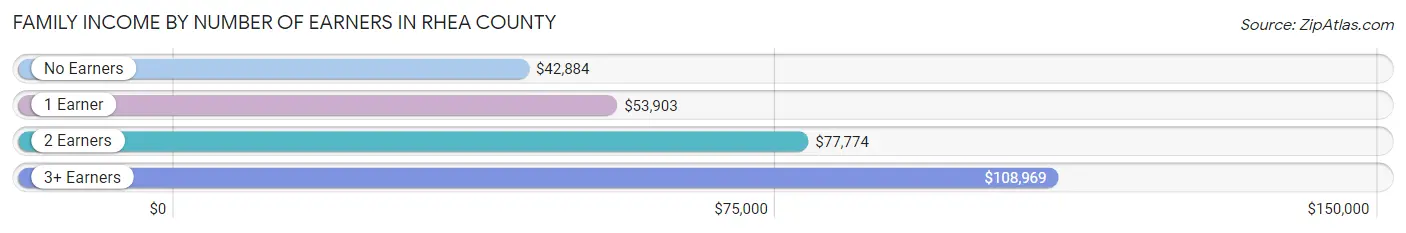
| Number of Earners | # Families | Median Income |
| No Earners | 2,325 (25.0%) | $42,884 |
| 1 Earner | 3,107 (33.4%) | $53,903 |
| 2 Earners | 2,981 (32.0%) | $77,774 |
| 3+ Earners | 899 (9.7%) | $108,969 |
| Total | 9,312 (100.0%) | $60,674 |
Household Income in Rhea County
Household Income Brackets in Rhea County
With 2,753 households falling in the category, the $50,000 to $74,999 income range is the most frequent in Rhea County, accounting for 21.6% of all households. In contrast, only 421 households (3.3%) fall into the $200,000+ income bracket, making it the least populous group.
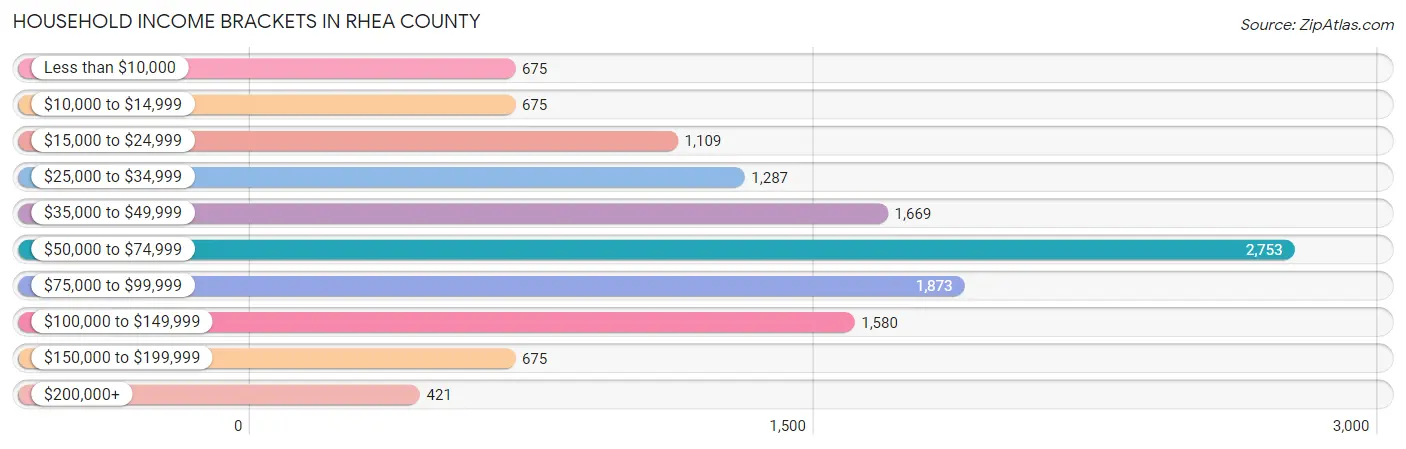
| Income Bracket | # Households | % Households |
| Less than $10,000 | 675 | 5.3% |
| $10,000 to $14,999 | 675 | 5.3% |
| $15,000 to $24,999 | 1,109 | 8.7% |
| $25,000 to $34,999 | 1,287 | 10.1% |
| $35,000 to $49,999 | 1,669 | 13.1% |
| $50,000 to $74,999 | 2,753 | 21.6% |
| $75,000 to $99,999 | 1,873 | 14.7% |
| $100,000 to $149,999 | 1,580 | 12.4% |
| $150,000 to $199,999 | 675 | 5.3% |
| $200,000+ | 421 | 3.3% |
Household Income by Householder Age in Rhea County
The median household income in Rhea County is $55,568, with the highest median household income of $61,875 found in the 45 to 64 years age bracket for the primary householder. A total of 4,629 households (36.3%) fall into this category. Meanwhile, the 15 to 24 years age bracket for the primary householder has the lowest median household income of $39,415, with 545 households (4.3%) in this group.
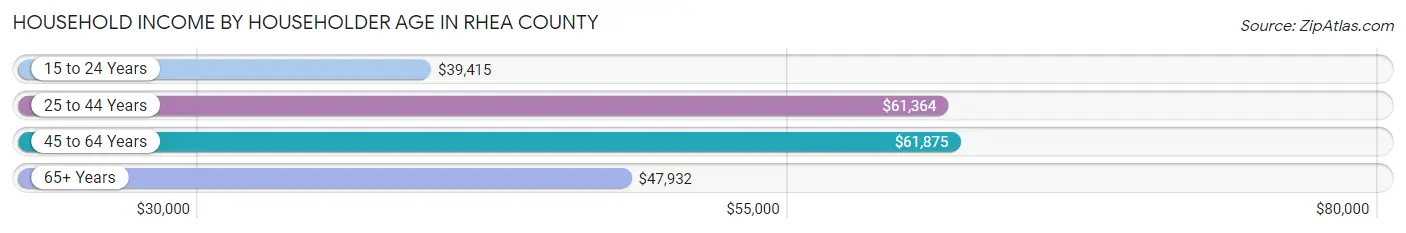
| Income Bracket | # Households | Median Income |
| 15 to 24 Years | 545 (4.3%) | $39,415 |
| 25 to 44 Years | 3,438 (27.0%) | $61,364 |
| 45 to 64 Years | 4,629 (36.3%) | $61,875 |
| 65+ Years | 4,132 (32.4%) | $47,932 |
| Total | 12,744 (100.0%) | $55,568 |
Poverty in Rhea County
Income Below Poverty by Sex and Age in Rhea County
With 13.6% poverty level for males and 17.8% for females among the residents of Rhea County, 5 year old males and under 5 year old females are the most vulnerable to poverty, with 73 males (48.0%) and 305 females (33.5%) in their respective age groups living below the poverty level.
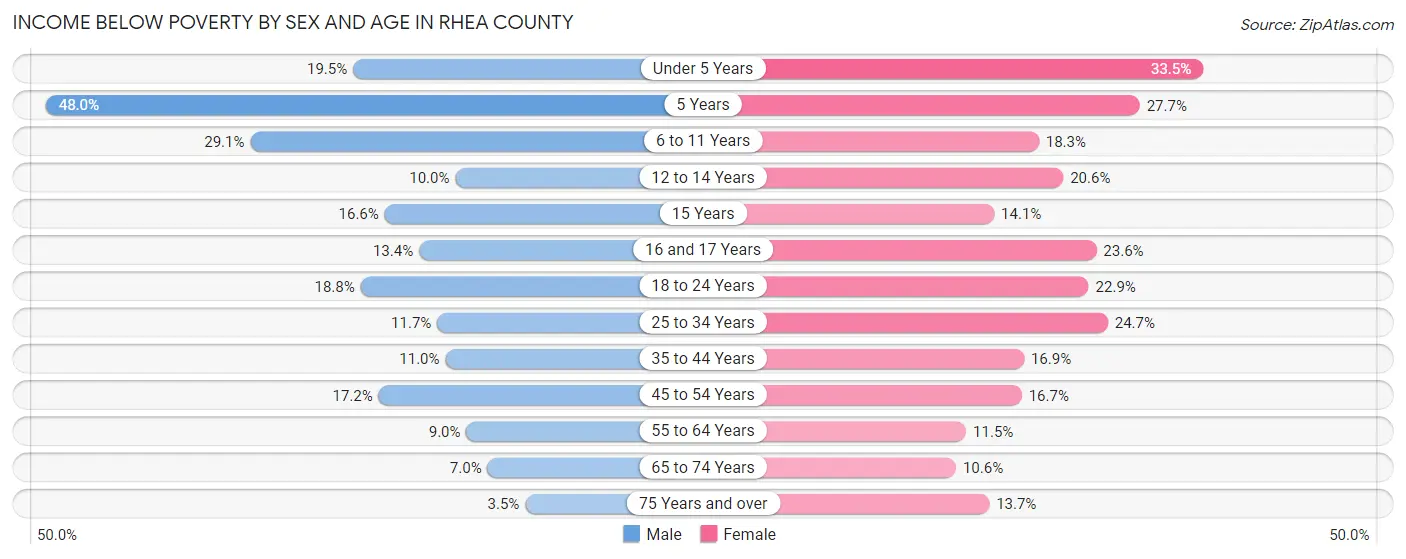
| Age Bracket | Male | Female |
| Under 5 Years | 172 (19.5%) | 305 (33.5%) |
| 5 Years | 73 (48.0%) | 60 (27.7%) |
| 6 to 11 Years | 344 (29.0%) | 174 (18.3%) |
| 12 to 14 Years | 70 (10.0%) | 126 (20.5%) |
| 15 Years | 38 (16.6%) | 14 (14.1%) |
| 16 and 17 Years | 80 (13.4%) | 116 (23.6%) |
| 18 to 24 Years | 261 (18.8%) | 260 (22.9%) |
| 25 to 34 Years | 239 (11.7%) | 443 (24.7%) |
| 35 to 44 Years | 199 (11.0%) | 324 (16.9%) |
| 45 to 54 Years | 368 (17.2%) | 353 (16.7%) |
| 55 to 64 Years | 211 (9.0%) | 269 (11.5%) |
| 65 to 74 Years | 122 (7.0%) | 214 (10.6%) |
| 75 Years and over | 37 (3.5%) | 183 (13.7%) |
| Total | 2,214 (13.6%) | 2,841 (17.8%) |
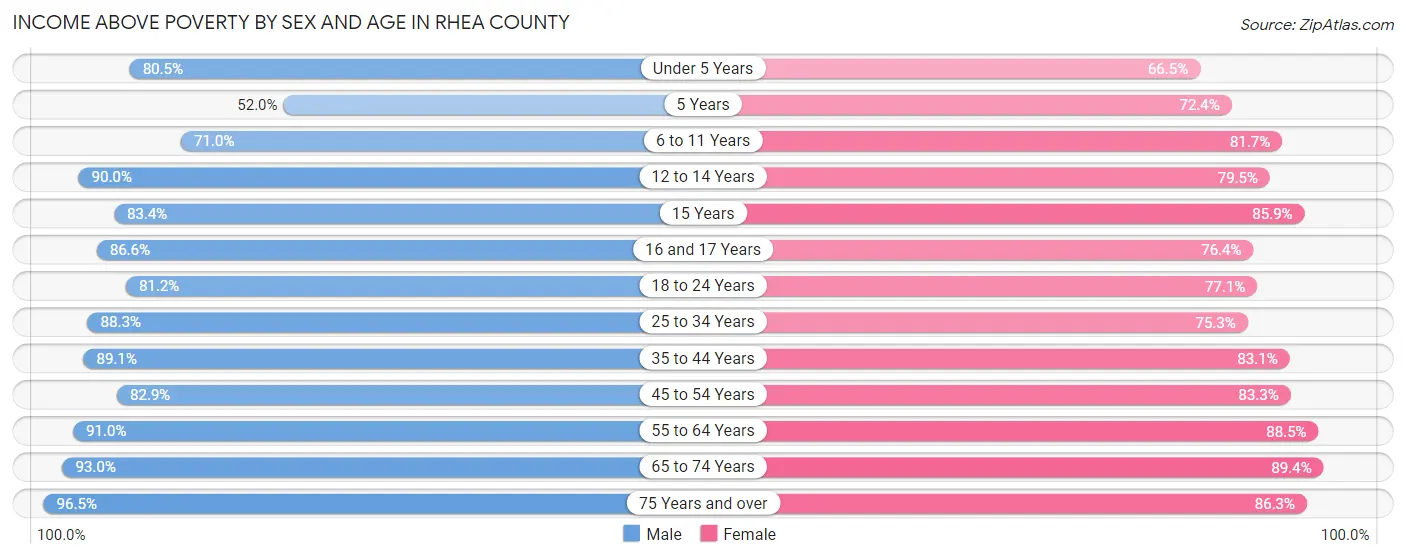
Income Above Poverty by Sex and Age in Rhea County
According to the poverty statistics in Rhea County, males aged 75 years and over and females aged 65 to 74 years are the age groups that are most secure financially, with 96.5% of males and 89.4% of females in these age groups living above the poverty line.
| Age Bracket | Male | Female |
| Under 5 Years | 709 (80.5%) | 605 (66.5%) |
| 5 Years | 79 (52.0%) | 157 (72.4%) |
| 6 to 11 Years | 840 (71.0%) | 778 (81.7%) |
| 12 to 14 Years | 628 (90.0%) | 487 (79.4%) |
| 15 Years | 191 (83.4%) | 85 (85.9%) |
| 16 and 17 Years | 517 (86.6%) | 375 (76.4%) |
| 18 to 24 Years | 1,126 (81.2%) | 875 (77.1%) |
| 25 to 34 Years | 1,802 (88.3%) | 1,351 (75.3%) |
| 35 to 44 Years | 1,618 (89.0%) | 1,592 (83.1%) |
| 45 to 54 Years | 1,778 (82.9%) | 1,761 (83.3%) |
| 55 to 64 Years | 2,133 (91.0%) | 2,063 (88.5%) |
| 65 to 74 Years | 1,611 (93.0%) | 1,805 (89.4%) |
| 75 Years and over | 1,008 (96.5%) | 1,155 (86.3%) |
| Total | 14,040 (86.4%) | 13,089 (82.2%) |
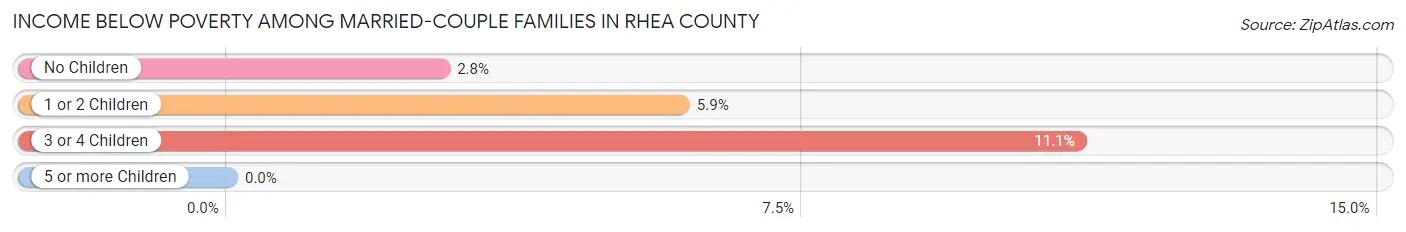
Income Below Poverty Among Married-Couple Families in Rhea County
The poverty statistics for married-couple families in Rhea County show that 4.1% or 266 of the total 6,541 families live below the poverty line. Families with 3 or 4 children have the highest poverty rate of 11.1%, comprising of 44 families. On the other hand, families with 5 or more children have the lowest poverty rate of 0.0%, which includes 0 families.
| Children | Above Poverty | Below Poverty |
| No Children | 4,310 (97.2%) | 123 (2.8%) |
| 1 or 2 Children | 1,579 (94.1%) | 99 (5.9%) |
| 3 or 4 Children | 353 (88.9%) | 44 (11.1%) |
| 5 or more Children | 33 (100.0%) | 0 (0.0%) |
| Total | 6,275 (95.9%) | 266 (4.1%) |
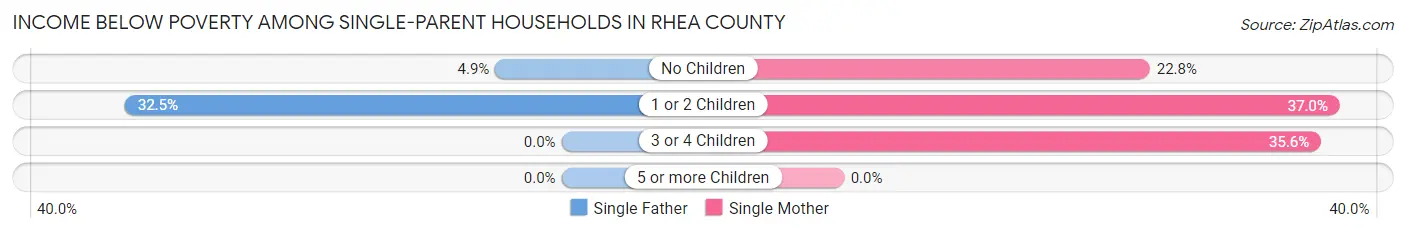
Income Below Poverty Among Single-Parent Households in Rhea County
According to the poverty data in Rhea County, 21.1% or 134 single-father households and 30.8% or 659 single-mother households are living below the poverty line. Among single-father households, those with 1 or 2 children have the highest poverty rate, with 121 households (32.5%) experiencing poverty. Likewise, among single-mother households, those with 1 or 2 children have the highest poverty rate, with 384 households (37.0%) falling below the poverty line.
| Children | Single Father | Single Mother |
| No Children | 13 (4.9%) | 206 (22.8%) |
| 1 or 2 Children | 121 (32.5%) | 384 (37.0%) |
| 3 or 4 Children | 0 (0.0%) | 69 (35.6%) |
| 5 or more Children | 0 (0.0%) | 0 (0.0%) |
| Total | 134 (21.1%) | 659 (30.8%) |
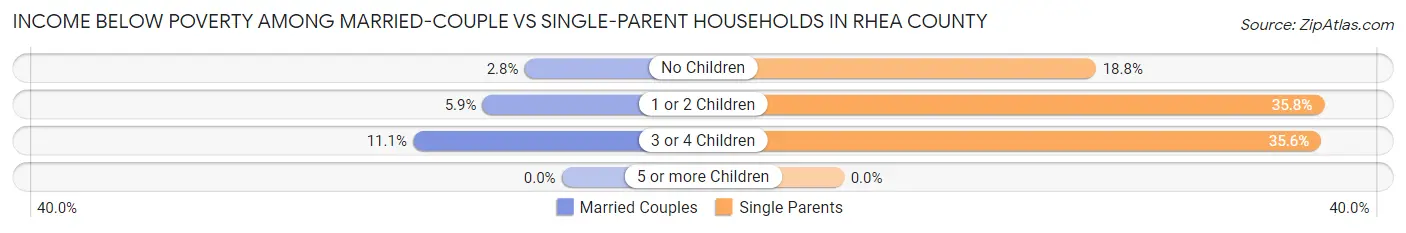
Income Below Poverty Among Married-Couple vs Single-Parent Households in Rhea County
The poverty data for Rhea County shows that 266 of the married-couple family households (4.1%) and 793 of the single-parent households (28.6%) are living below the poverty level. Within the married-couple family households, those with 3 or 4 children have the highest poverty rate, with 44 households (11.1%) falling below the poverty line. Among the single-parent households, those with 1 or 2 children have the highest poverty rate, with 505 household (35.8%) living below poverty.
| Children | Married-Couple Families | Single-Parent Households |
| No Children | 123 (2.8%) | 219 (18.8%) |
| 1 or 2 Children | 99 (5.9%) | 505 (35.8%) |
| 3 or 4 Children | 44 (11.1%) | 69 (35.6%) |
| 5 or more Children | 0 (0.0%) | 0 (0.0%) |
| Total | 266 (4.1%) | 793 (28.6%) |
Employment Characteristics in Rhea County
Employment by Class of Employer in Rhea County
Among the 12,560 employed individuals in Rhea County, private company employees (8,812 | 70.2%), local government employees (1,106 | 8.8%), and self-employed (not incorporated) (780 | 6.2%) make up the most common classes of employment.
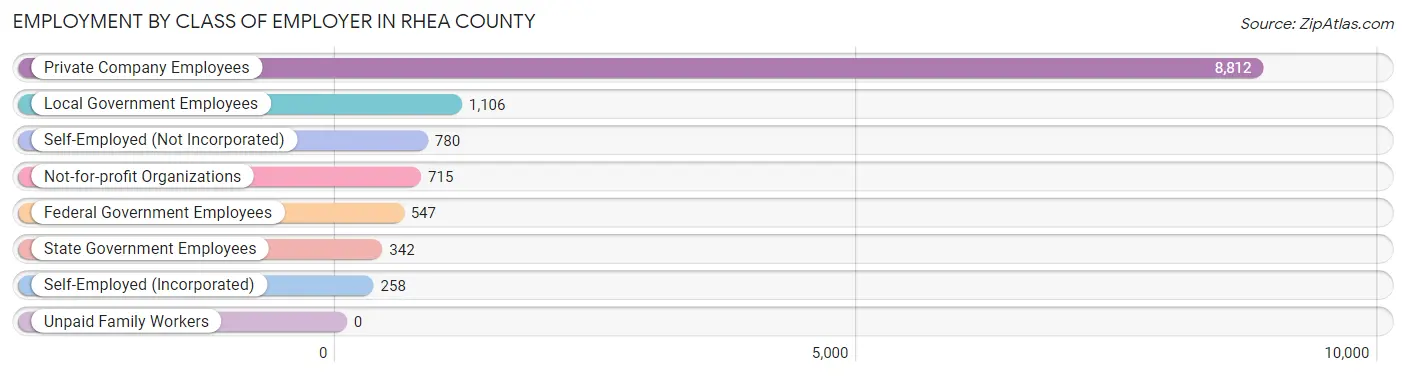
| Employer Class | # Employees | % Employees |
| Private Company Employees | 8,812 | 70.2% |
| Self-Employed (Incorporated) | 258 | 2.1% |
| Self-Employed (Not Incorporated) | 780 | 6.2% |
| Not-for-profit Organizations | 715 | 5.7% |
| Local Government Employees | 1,106 | 8.8% |
| State Government Employees | 342 | 2.7% |
| Federal Government Employees | 547 | 4.4% |
| Unpaid Family Workers | 0 | 0.0% |
| Total | 12,560 | 100.0% |
Employment Status by Age in Rhea County
According to the labor force statistics for Rhea County, out of the total population over 16 years of age (26,860), 52.8% or 14,182 individuals are in the labor force, with 7.9% or 1,120 of them unemployed. The age group with the highest labor force participation rate is 25 to 29 years, with 77.9% or 1,519 individuals in the labor force. Within the labor force, the 16 to 19 years age range has the highest percentage of unemployed individuals, with 21.4% or 168 of them being unemployed.
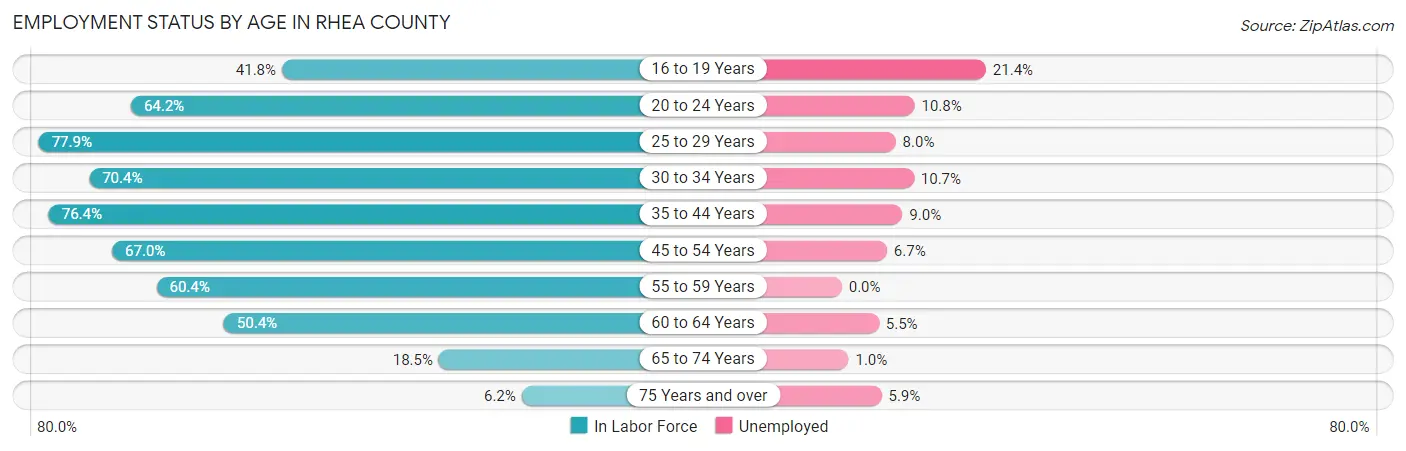
| Age Bracket | In Labor Force | Unemployed |
| 16 to 19 Years | 786 (41.8%) | 168 (21.4%) |
| 20 to 24 Years | 1,372 (64.2%) | 148 (10.8%) |
| 25 to 29 Years | 1,519 (77.9%) | 122 (8.0%) |
| 30 to 34 Years | 1,340 (70.4%) | 143 (10.7%) |
| 35 to 44 Years | 2,874 (76.4%) | 259 (9.0%) |
| 45 to 54 Years | 2,866 (67.0%) | 192 (6.7%) |
| 55 to 59 Years | 1,213 (60.4%) | 0 (0.0%) |
| 60 to 64 Years | 1,352 (50.4%) | 74 (5.5%) |
| 65 to 74 Years | 702 (18.5%) | 7 (1.0%) |
| 75 Years and over | 153 (6.2%) | 9 (5.9%) |
| Total | 14,182 (52.8%) | 1,120 (7.9%) |
Employment Status by Educational Attainment in Rhea County
According to labor force statistics for Rhea County, 67.3% of individuals (11,161) out of the total population between 25 and 64 years of age (16,584) are in the labor force, with 7.1% or 792 of them being unemployed. The group with the highest labor force participation rate are those with the educational attainment of bachelor's degree or higher, with 72.1% or 2,001 individuals in the labor force. Within the labor force, individuals with less than high school education have the highest percentage of unemployment, with 13.9% or 190 of them being unemployed.
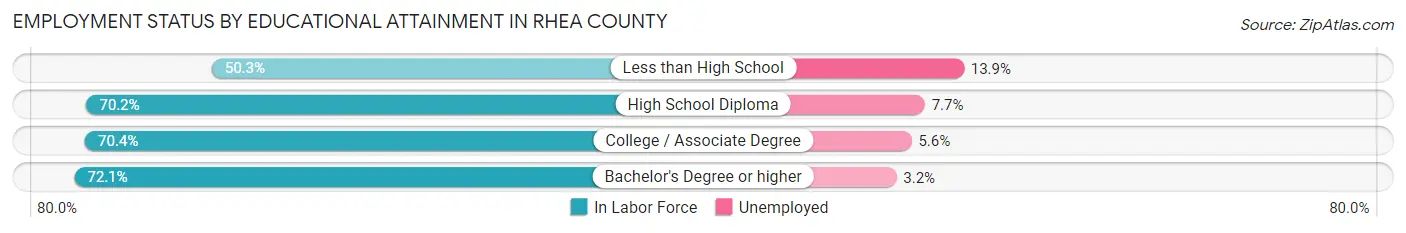
| Educational Attainment | In Labor Force | Unemployed |
| Less than High School | 1,365 (50.3%) | 377 (13.9%) |
| High School Diploma | 4,701 (70.2%) | 516 (7.7%) |
| College / Associate Degree | 3,097 (70.4%) | 246 (5.6%) |
| Bachelor's Degree or higher | 2,001 (72.1%) | 89 (3.2%) |
| Total | 11,161 (67.3%) | 1,177 (7.1%) |
Employment Occupations by Sex in Rhea County
Management, Business, Science and Arts Occupations
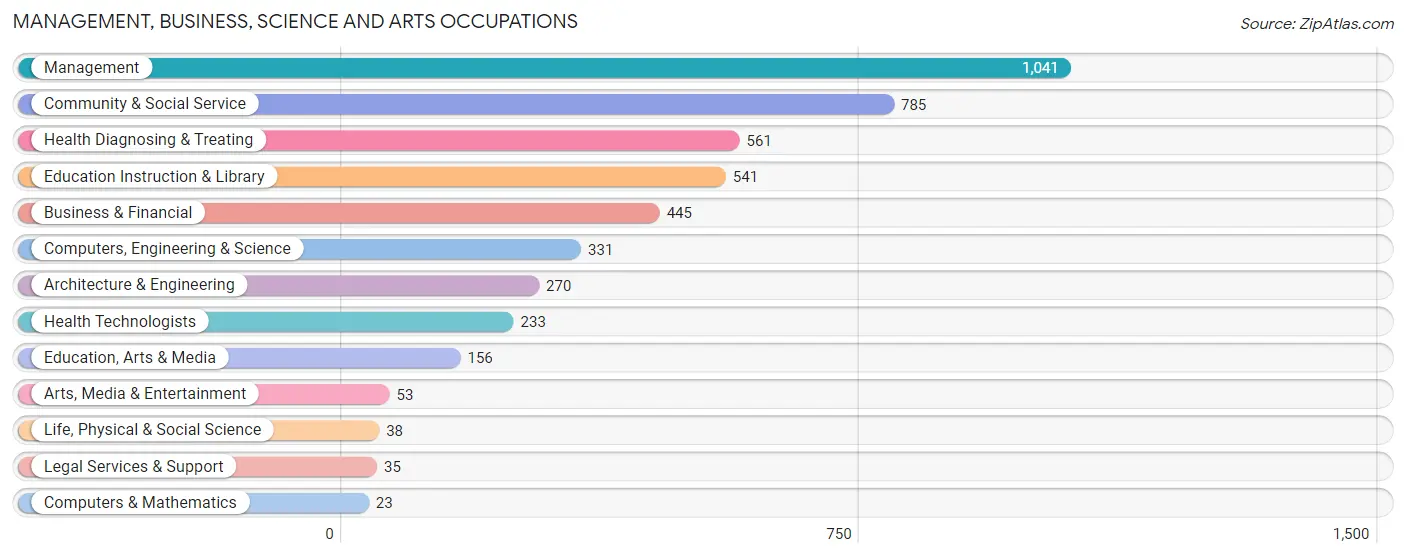
The most common Management, Business, Science and Arts occupations in Rhea County are Management (1,041 | 8.0%), Community & Social Service (785 | 6.0%), Health Diagnosing & Treating (561 | 4.3%), Education Instruction & Library (541 | 4.1%), and Business & Financial (445 | 3.4%).
Management, Business, Science and Arts Occupations by Sex
Within the Management, Business, Science and Arts occupations in Rhea County, the most male-oriented occupations are Legal Services & Support (100.0%), Computers & Mathematics (82.6%), and Architecture & Engineering (76.3%), while the most female-oriented occupations are Health Diagnosing & Treating (93.2%), Health Technologists (92.7%), and Education Instruction & Library (82.4%).
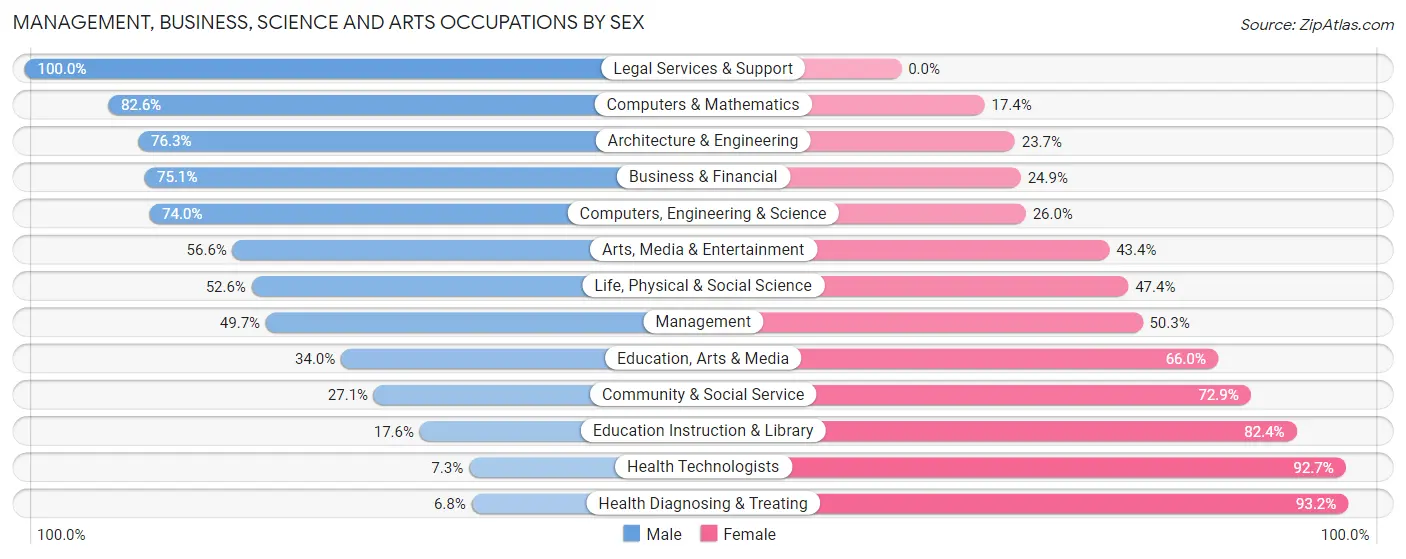
| Occupation | Male | Female |
| Management | 517 (49.7%) | 524 (50.3%) |
| Business & Financial | 334 (75.1%) | 111 (24.9%) |
| Computers, Engineering & Science | 245 (74.0%) | 86 (26.0%) |
| Computers & Mathematics | 19 (82.6%) | 4 (17.4%) |
| Architecture & Engineering | 206 (76.3%) | 64 (23.7%) |
| Life, Physical & Social Science | 20 (52.6%) | 18 (47.4%) |
| Community & Social Service | 213 (27.1%) | 572 (72.9%) |
| Education, Arts & Media | 53 (34.0%) | 103 (66.0%) |
| Legal Services & Support | 35 (100.0%) | 0 (0.0%) |
| Education Instruction & Library | 95 (17.6%) | 446 (82.4%) |
| Arts, Media & Entertainment | 30 (56.6%) | 23 (43.4%) |
| Health Diagnosing & Treating | 38 (6.8%) | 523 (93.2%) |
| Health Technologists | 17 (7.3%) | 216 (92.7%) |
| Total (Category) | 1,347 (42.6%) | 1,816 (57.4%) |
| Total (Overall) | 7,644 (58.5%) | 5,413 (41.5%) |
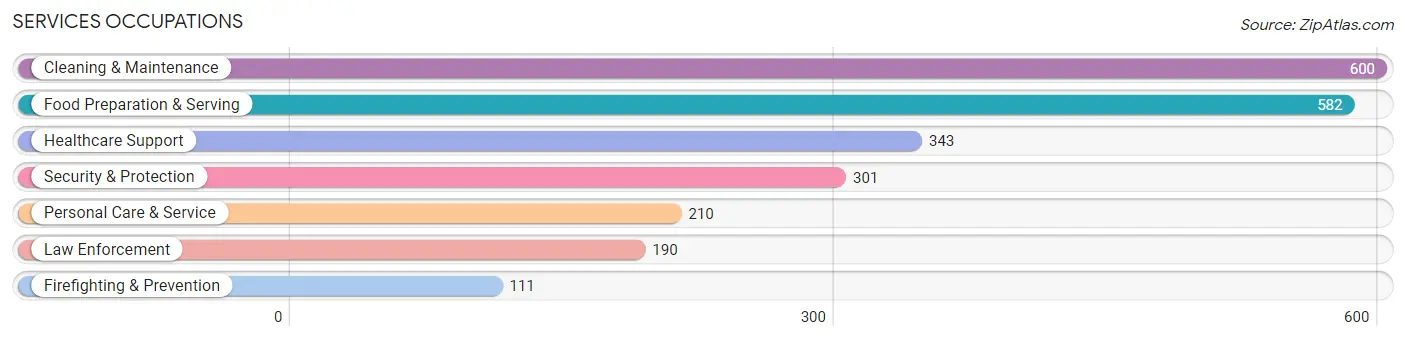
Services Occupations
The most common Services occupations in Rhea County are Cleaning & Maintenance (600 | 4.6%), Food Preparation & Serving (582 | 4.5%), Healthcare Support (343 | 2.6%), Security & Protection (301 | 2.3%), and Personal Care & Service (210 | 1.6%).
Services Occupations by Sex
Within the Services occupations in Rhea County, the most male-oriented occupations are Law Enforcement (93.2%), Security & Protection (92.7%), and Firefighting & Prevention (91.9%), while the most female-oriented occupations are Personal Care & Service (100.0%), Healthcare Support (97.4%), and Food Preparation & Serving (66.8%).
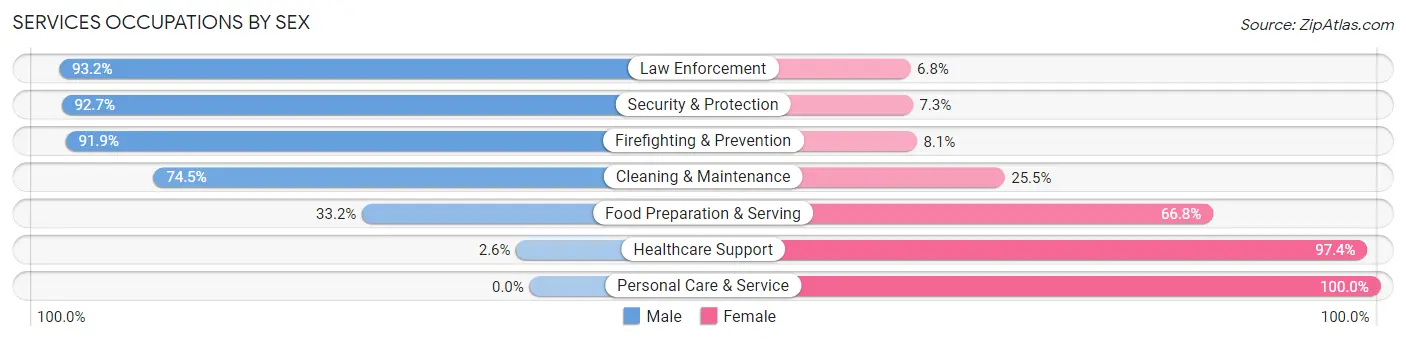
| Occupation | Male | Female |
| Healthcare Support | 9 (2.6%) | 334 (97.4%) |
| Security & Protection | 279 (92.7%) | 22 (7.3%) |
| Firefighting & Prevention | 102 (91.9%) | 9 (8.1%) |
| Law Enforcement | 177 (93.2%) | 13 (6.8%) |
| Food Preparation & Serving | 193 (33.2%) | 389 (66.8%) |
| Cleaning & Maintenance | 447 (74.5%) | 153 (25.5%) |
| Personal Care & Service | 0 (0.0%) | 210 (100.0%) |
| Total (Category) | 928 (45.6%) | 1,108 (54.4%) |
| Total (Overall) | 7,644 (58.5%) | 5,413 (41.5%) |
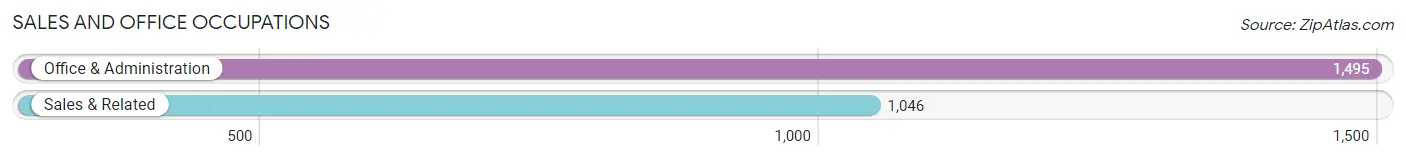
Sales and Office Occupations
The most common Sales and Office occupations in Rhea County are Office & Administration (1,495 | 11.5%), and Sales & Related (1,046 | 8.0%).
Sales and Office Occupations by Sex
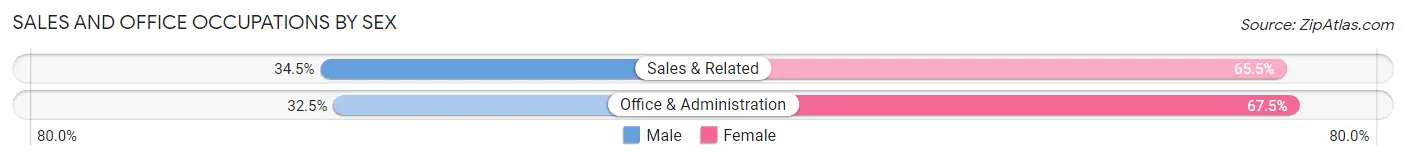
| Occupation | Male | Female |
| Sales & Related | 361 (34.5%) | 685 (65.5%) |
| Office & Administration | 486 (32.5%) | 1,009 (67.5%) |
| Total (Category) | 847 (33.3%) | 1,694 (66.7%) |
| Total (Overall) | 7,644 (58.5%) | 5,413 (41.5%) |
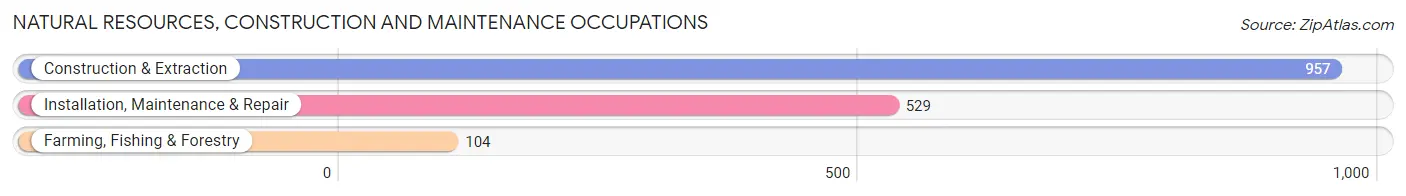
Natural Resources, Construction and Maintenance Occupations
The most common Natural Resources, Construction and Maintenance occupations in Rhea County are Construction & Extraction (957 | 7.3%), Installation, Maintenance & Repair (529 | 4.1%), and Farming, Fishing & Forestry (104 | 0.8%).
Natural Resources, Construction and Maintenance Occupations by Sex
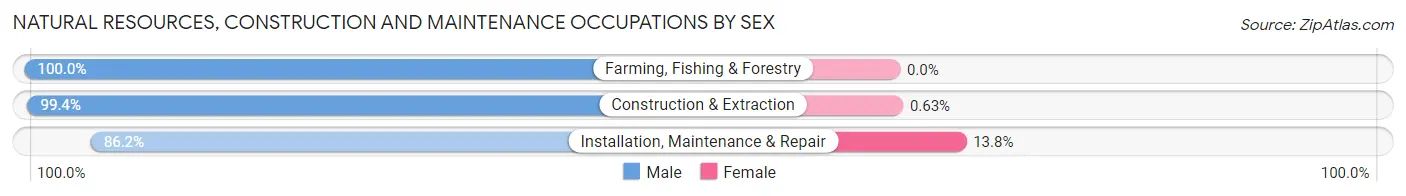
| Occupation | Male | Female |
| Farming, Fishing & Forestry | 104 (100.0%) | 0 (0.0%) |
| Construction & Extraction | 951 (99.4%) | 6 (0.6%) |
| Installation, Maintenance & Repair | 456 (86.2%) | 73 (13.8%) |
| Total (Category) | 1,511 (95.0%) | 79 (5.0%) |
| Total (Overall) | 7,644 (58.5%) | 5,413 (41.5%) |
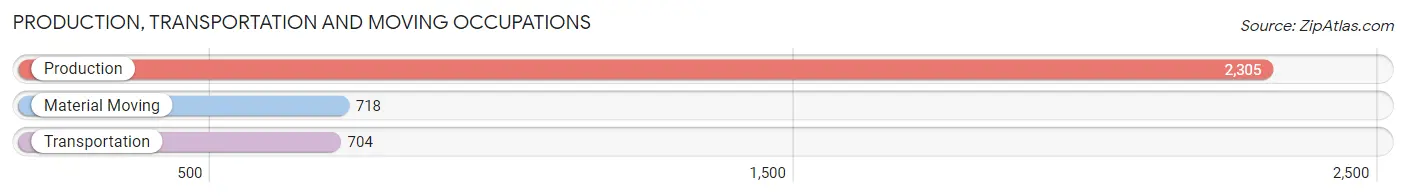
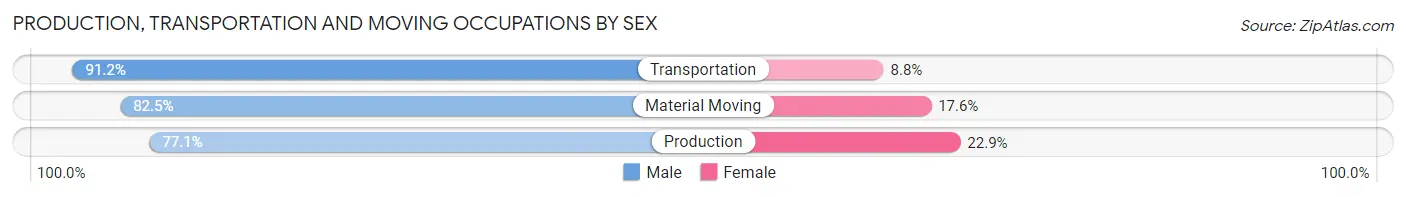
Production, Transportation and Moving Occupations
The most common Production, Transportation and Moving occupations in Rhea County are Production (2,305 | 17.6%), Material Moving (718 | 5.5%), and Transportation (704 | 5.4%).
Production, Transportation and Moving Occupations by Sex
| Occupation | Male | Female |
| Production | 1,777 (77.1%) | 528 (22.9%) |
| Transportation | 642 (91.2%) | 62 (8.8%) |
| Material Moving | 592 (82.5%) | 126 (17.5%) |
| Total (Category) | 3,011 (80.8%) | 716 (19.2%) |
| Total (Overall) | 7,644 (58.5%) | 5,413 (41.5%) |
Employment Industries by Sex in Rhea County
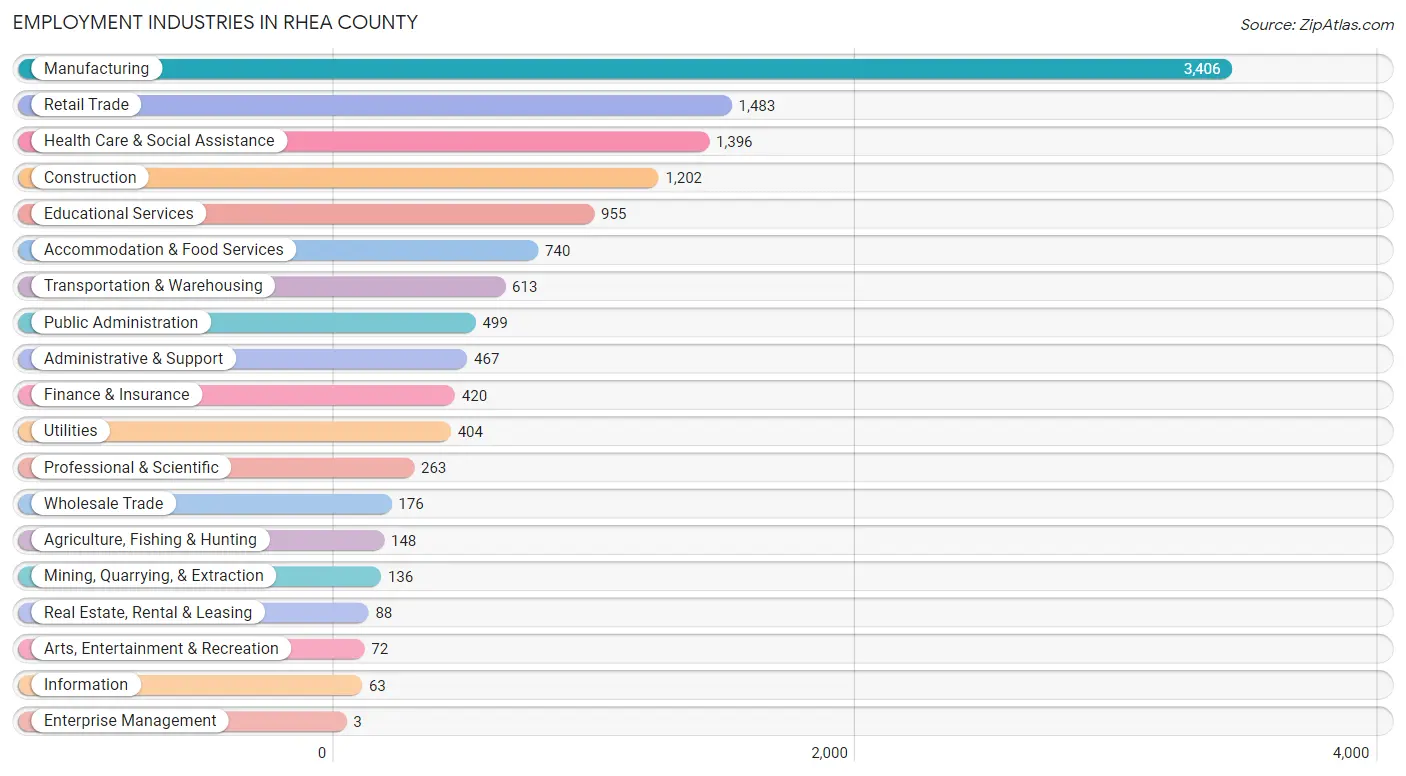
Employment Industries in Rhea County
The major employment industries in Rhea County include Manufacturing (3,406 | 26.1%), Retail Trade (1,483 | 11.4%), Health Care & Social Assistance (1,396 | 10.7%), Construction (1,202 | 9.2%), and Educational Services (955 | 7.3%).
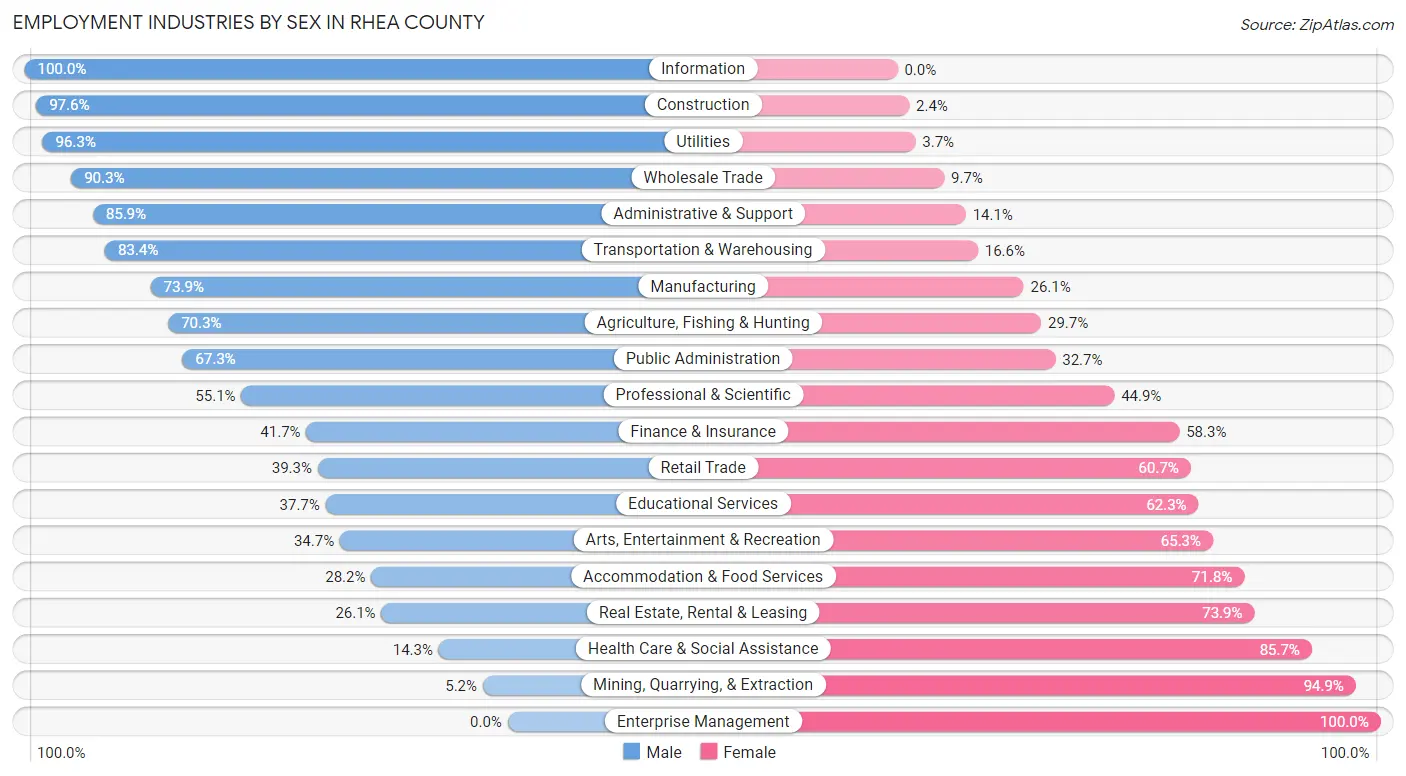
Employment Industries by Sex in Rhea County
The Rhea County industries that see more men than women are Information (100.0%), Construction (97.6%), and Utilities (96.3%), whereas the industries that tend to have a higher number of women are Enterprise Management (100.0%), Mining, Quarrying, & Extraction (94.9%), and Health Care & Social Assistance (85.7%).
| Industry | Male | Female |
| Agriculture, Fishing & Hunting | 104 (70.3%) | 44 (29.7%) |
| Mining, Quarrying, & Extraction | 7 (5.1%) | 129 (94.9%) |
| Construction | 1,173 (97.6%) | 29 (2.4%) |
| Manufacturing | 2,517 (73.9%) | 889 (26.1%) |
| Wholesale Trade | 159 (90.3%) | 17 (9.7%) |
| Retail Trade | 583 (39.3%) | 900 (60.7%) |
| Transportation & Warehousing | 511 (83.4%) | 102 (16.6%) |
| Utilities | 389 (96.3%) | 15 (3.7%) |
| Information | 63 (100.0%) | 0 (0.0%) |
| Finance & Insurance | 175 (41.7%) | 245 (58.3%) |
| Real Estate, Rental & Leasing | 23 (26.1%) | 65 (73.9%) |
| Professional & Scientific | 145 (55.1%) | 118 (44.9%) |
| Enterprise Management | 0 (0.0%) | 3 (100.0%) |
| Administrative & Support | 401 (85.9%) | 66 (14.1%) |
| Educational Services | 360 (37.7%) | 595 (62.3%) |
| Health Care & Social Assistance | 199 (14.3%) | 1,197 (85.7%) |
| Arts, Entertainment & Recreation | 25 (34.7%) | 47 (65.3%) |
| Accommodation & Food Services | 209 (28.2%) | 531 (71.8%) |
| Public Administration | 336 (67.3%) | 163 (32.7%) |
| Total | 7,644 (58.5%) | 5,413 (41.5%) |
Education in Rhea County
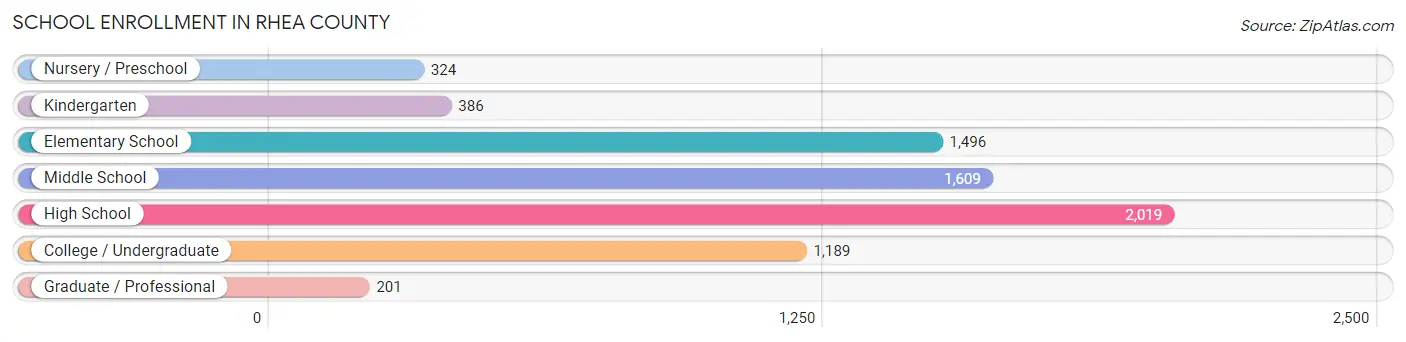
School Enrollment in Rhea County
The most common levels of schooling among the 7,224 students in Rhea County are high school (2,019 | 28.0%), middle school (1,609 | 22.3%), and elementary school (1,496 | 20.7%).
| School Level | # Students | % Students |
| Nursery / Preschool | 324 | 4.5% |
| Kindergarten | 386 | 5.3% |
| Elementary School | 1,496 | 20.7% |
| Middle School | 1,609 | 22.3% |
| High School | 2,019 | 28.0% |
| College / Undergraduate | 1,189 | 16.5% |
| Graduate / Professional | 201 | 2.8% |
| Total | 7,224 | 100.0% |
School Enrollment by Age by Funding Source in Rhea County
Out of a total of 7,224 students who are enrolled in schools in Rhea County, 1,806 (25.0%) attend a private institution, while the remaining 5,418 (75.0%) are enrolled in public schools. The age group of 20 to 24 year olds has the highest likelihood of being enrolled in private schools, with 283 (50.4% in the age bracket) enrolled. Conversely, the age group of 3 to 4 year olds has the lowest likelihood of being enrolled in a private school, with 147 (84.0% in the age bracket) attending a public institution.
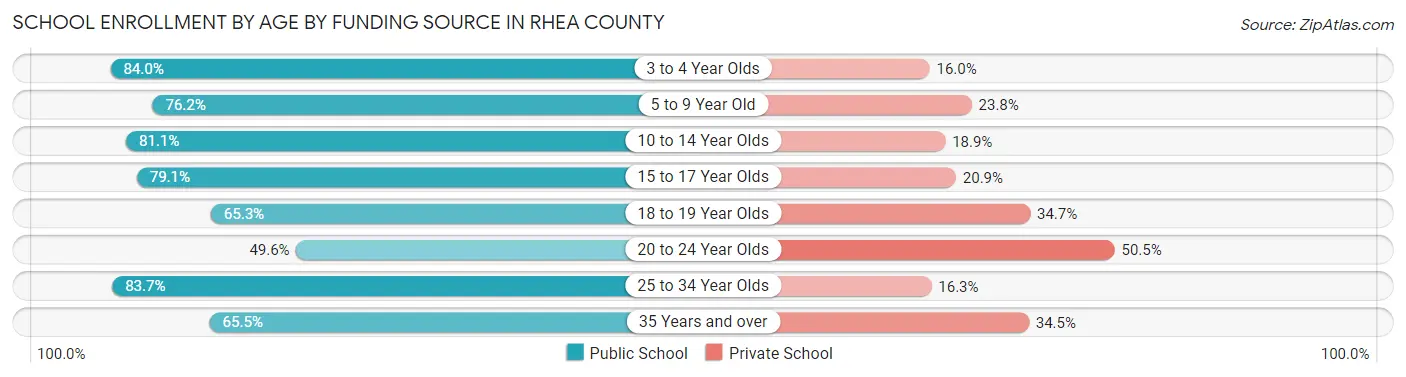
| Age Bracket | Public School | Private School |
| 3 to 4 Year Olds | 147 (84.0%) | 28 (16.0%) |
| 5 to 9 Year Old | 1,317 (76.2%) | 412 (23.8%) |
| 10 to 14 Year Olds | 1,711 (81.1%) | 399 (18.9%) |
| 15 to 17 Year Olds | 1,120 (79.1%) | 296 (20.9%) |
| 18 to 19 Year Olds | 412 (65.3%) | 219 (34.7%) |
| 20 to 24 Year Olds | 278 (49.5%) | 283 (50.4%) |
| 25 to 34 Year Olds | 164 (83.7%) | 32 (16.3%) |
| 35 Years and over | 266 (65.5%) | 140 (34.5%) |
| Total | 5,418 (75.0%) | 1,806 (25.0%) |
Educational Attainment by Field of Study in Rhea County
Business (772 | 19.2%), education (744 | 18.5%), science & technology (390 | 9.7%), engineering (358 | 8.9%), and bio, nature & agricultural (315 | 7.9%) are the most common fields of study among 4,015 individuals in Rhea County who have obtained a bachelor's degree or higher.
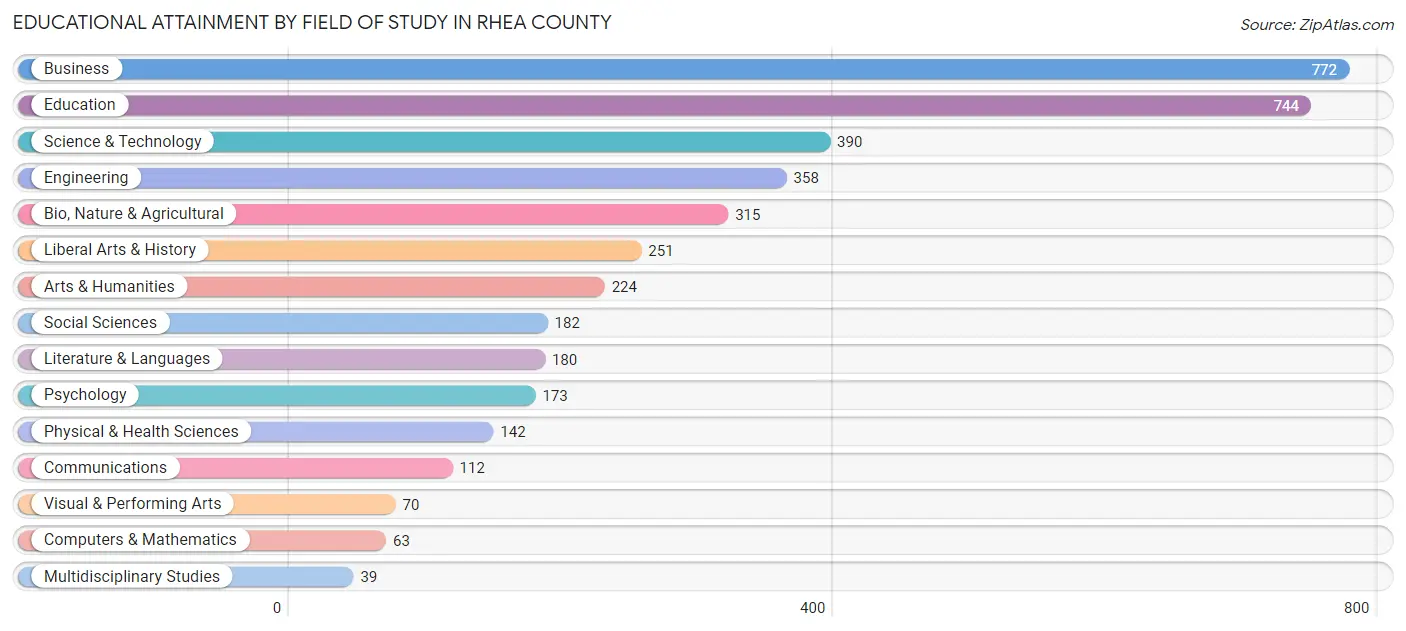
| Field of Study | # Graduates | % Graduates |
| Computers & Mathematics | 63 | 1.6% |
| Bio, Nature & Agricultural | 315 | 7.9% |
| Physical & Health Sciences | 142 | 3.5% |
| Psychology | 173 | 4.3% |
| Social Sciences | 182 | 4.5% |
| Engineering | 358 | 8.9% |
| Multidisciplinary Studies | 39 | 1.0% |
| Science & Technology | 390 | 9.7% |
| Business | 772 | 19.2% |
| Education | 744 | 18.5% |
| Literature & Languages | 180 | 4.5% |
| Liberal Arts & History | 251 | 6.2% |
| Visual & Performing Arts | 70 | 1.7% |
| Communications | 112 | 2.8% |
| Arts & Humanities | 224 | 5.6% |
| Total | 4,015 | 100.0% |
Transportation & Commute in Rhea County
Vehicle Availability by Sex in Rhea County
The most prevalent vehicle ownership categories in Rhea County are males with 2 vehicles (2,692, accounting for 37.2%) and females with 2 vehicles (1,738, making up 51.9%).
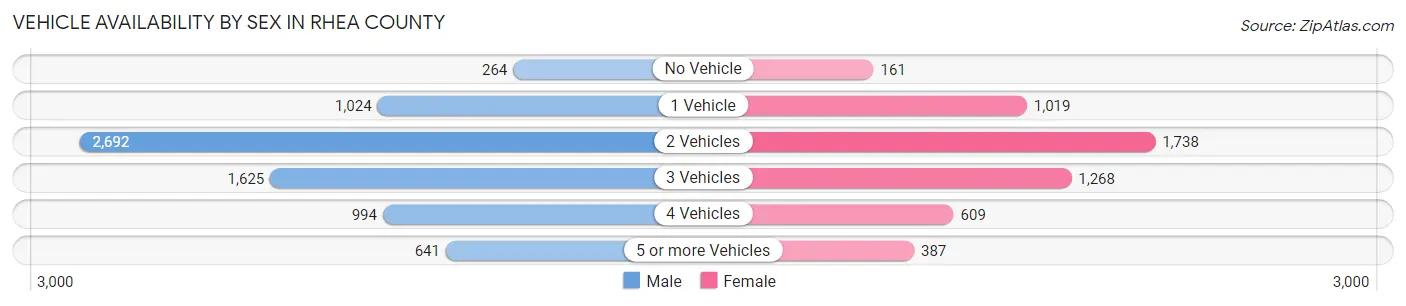
| Vehicles Available | Male | Female |
| No Vehicle | 264 (3.6%) | 161 (3.1%) |
| 1 Vehicle | 1,024 (14.1%) | 1,019 (19.7%) |
| 2 Vehicles | 2,692 (37.2%) | 1,738 (33.5%) |
| 3 Vehicles | 1,625 (22.4%) | 1,268 (24.5%) |
| 4 Vehicles | 994 (13.7%) | 609 (11.7%) |
| 5 or more Vehicles | 641 (8.8%) | 387 (7.5%) |
| Total | 7,240 (100.0%) | 5,182 (100.0%) |
Commute Time in Rhea County
The most frequently occuring commute durations in Rhea County are 10 to 14 minutes (2,196 commuters, 18.4%), 5 to 9 minutes (1,916 commuters, 16.0%), and 15 to 19 minutes (1,521 commuters, 12.7%).
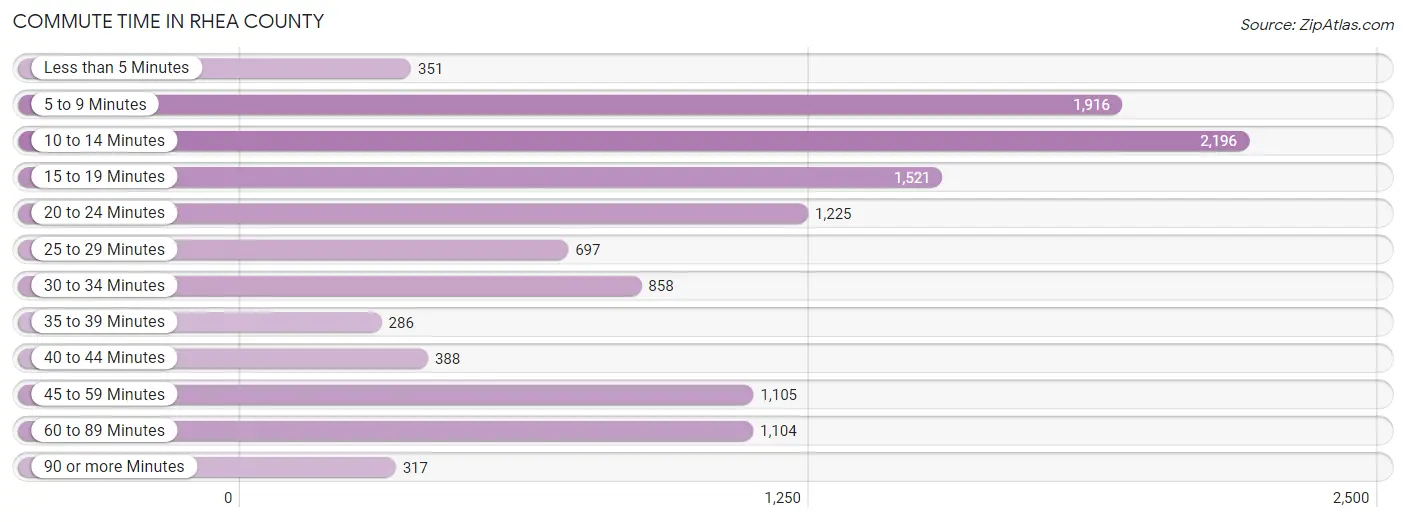
| Commute Time | # Commuters | % Commuters |
| Less than 5 Minutes | 351 | 2.9% |
| 5 to 9 Minutes | 1,916 | 16.0% |
| 10 to 14 Minutes | 2,196 | 18.4% |
| 15 to 19 Minutes | 1,521 | 12.7% |
| 20 to 24 Minutes | 1,225 | 10.2% |
| 25 to 29 Minutes | 697 | 5.8% |
| 30 to 34 Minutes | 858 | 7.2% |
| 35 to 39 Minutes | 286 | 2.4% |
| 40 to 44 Minutes | 388 | 3.2% |
| 45 to 59 Minutes | 1,105 | 9.2% |
| 60 to 89 Minutes | 1,104 | 9.2% |
| 90 or more Minutes | 317 | 2.6% |
Commute Time by Sex in Rhea County
The most common commute times in Rhea County are 10 to 14 minutes (1,155 commuters, 16.5%) for males and 10 to 14 minutes (1,041 commuters, 21.0%) for females.
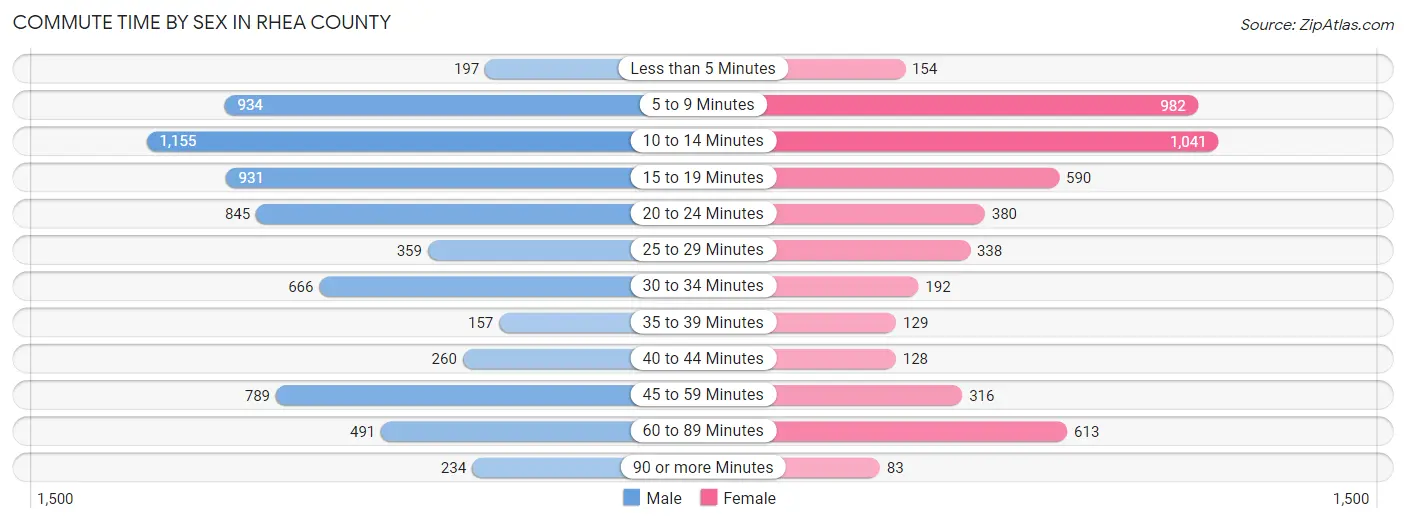
| Commute Time | Male | Female |
| Less than 5 Minutes | 197 (2.8%) | 154 (3.1%) |
| 5 to 9 Minutes | 934 (13.3%) | 982 (19.9%) |
| 10 to 14 Minutes | 1,155 (16.5%) | 1,041 (21.0%) |
| 15 to 19 Minutes | 931 (13.3%) | 590 (11.9%) |
| 20 to 24 Minutes | 845 (12.0%) | 380 (7.7%) |
| 25 to 29 Minutes | 359 (5.1%) | 338 (6.8%) |
| 30 to 34 Minutes | 666 (9.5%) | 192 (3.9%) |
| 35 to 39 Minutes | 157 (2.2%) | 129 (2.6%) |
| 40 to 44 Minutes | 260 (3.7%) | 128 (2.6%) |
| 45 to 59 Minutes | 789 (11.2%) | 316 (6.4%) |
| 60 to 89 Minutes | 491 (7.0%) | 613 (12.4%) |
| 90 or more Minutes | 234 (3.3%) | 83 (1.7%) |
Time of Departure to Work by Sex in Rhea County
The most frequent times of departure to work in Rhea County are 12:00 AM to 4:59 AM (979, 14.0%) for males and 7:00 AM to 7:29 AM (723, 14.6%) for females.

| Time of Departure | Male | Female |
| 12:00 AM to 4:59 AM | 979 (14.0%) | 413 (8.4%) |
| 5:00 AM to 5:29 AM | 558 (8.0%) | 244 (4.9%) |
| 5:30 AM to 5:59 AM | 543 (7.7%) | 198 (4.0%) |
| 6:00 AM to 6:29 AM | 938 (13.4%) | 281 (5.7%) |
| 6:30 AM to 6:59 AM | 671 (9.6%) | 487 (9.9%) |
| 7:00 AM to 7:29 AM | 589 (8.4%) | 723 (14.6%) |
| 7:30 AM to 7:59 AM | 519 (7.4%) | 721 (14.6%) |
| 8:00 AM to 8:29 AM | 368 (5.2%) | 381 (7.7%) |
| 8:30 AM to 8:59 AM | 16 (0.2%) | 162 (3.3%) |
| 9:00 AM to 9:59 AM | 184 (2.6%) | 172 (3.5%) |
| 10:00 AM to 10:59 AM | 29 (0.4%) | 196 (4.0%) |
| 11:00 AM to 11:59 AM | 155 (2.2%) | 216 (4.4%) |
| 12:00 PM to 3:59 PM | 585 (8.3%) | 203 (4.1%) |
| 4:00 PM to 11:59 PM | 884 (12.6%) | 549 (11.1%) |
| Total | 7,018 (100.0%) | 4,946 (100.0%) |
Housing Occupancy in Rhea County
Occupancy by Ownership in Rhea County
Of the total 12,744 dwellings in Rhea County, owner-occupied units account for 9,365 (73.5%), while renter-occupied units make up 3,379 (26.5%).
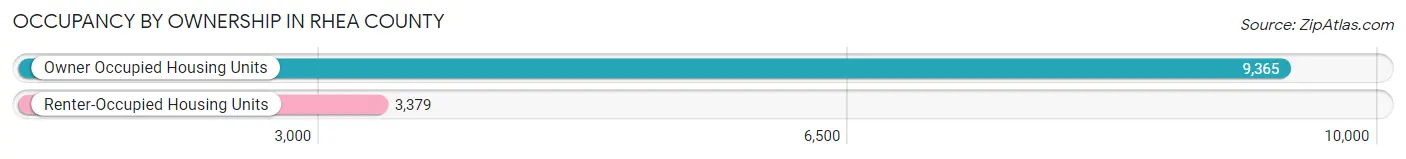
| Occupancy | # Housing Units | % Housing Units |
| Owner Occupied Housing Units | 9,365 | 73.5% |
| Renter-Occupied Housing Units | 3,379 | 26.5% |
| Total Occupied Housing Units | 12,744 | 100.0% |
Occupancy by Household Size in Rhea County
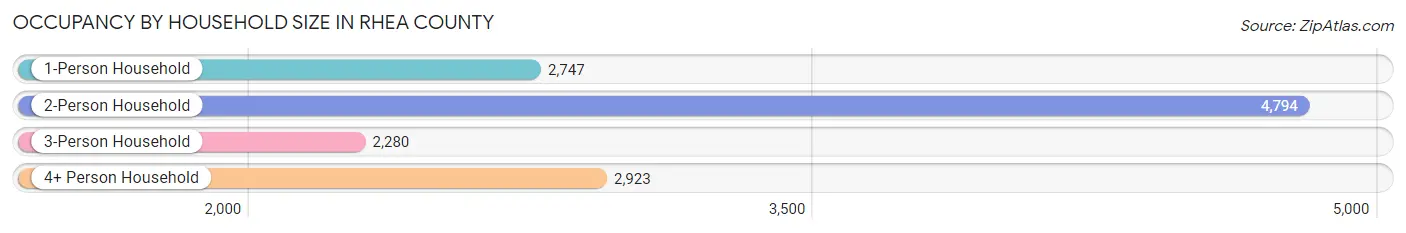
| Household Size | # Housing Units | % Housing Units |
| 1-Person Household | 2,747 | 21.6% |
| 2-Person Household | 4,794 | 37.6% |
| 3-Person Household | 2,280 | 17.9% |
| 4+ Person Household | 2,923 | 22.9% |
| Total Housing Units | 12,744 | 100.0% |
Occupancy by Ownership by Household Size in Rhea County
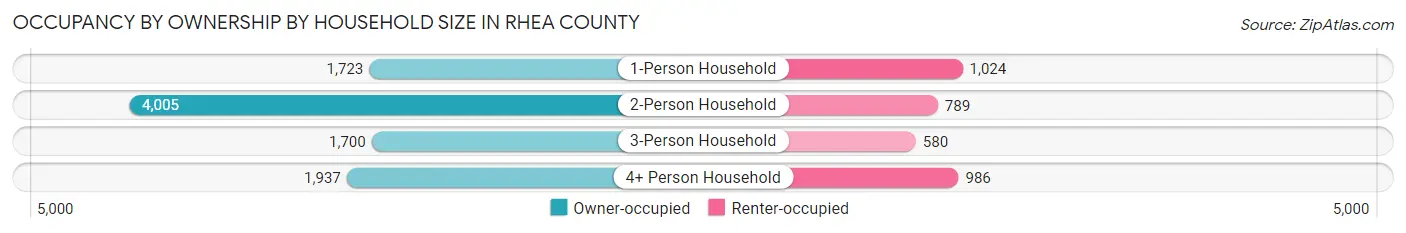
| Household Size | Owner-occupied | Renter-occupied |
| 1-Person Household | 1,723 (62.7%) | 1,024 (37.3%) |
| 2-Person Household | 4,005 (83.5%) | 789 (16.5%) |
| 3-Person Household | 1,700 (74.6%) | 580 (25.4%) |
| 4+ Person Household | 1,937 (66.3%) | 986 (33.7%) |
| Total Housing Units | 9,365 (73.5%) | 3,379 (26.5%) |
Occupancy by Educational Attainment in Rhea County
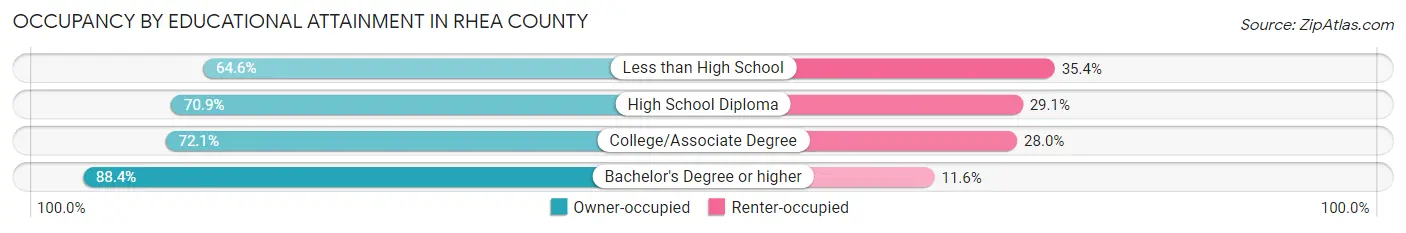
| Household Size | Owner-occupied | Renter-occupied |
| Less than High School | 1,281 (64.6%) | 702 (35.4%) |
| High School Diploma | 3,403 (70.9%) | 1,394 (29.1%) |
| College/Associate Degree | 2,609 (72.1%) | 1,012 (28.0%) |
| Bachelor's Degree or higher | 2,072 (88.4%) | 271 (11.6%) |
Occupancy by Age of Householder in Rhea County
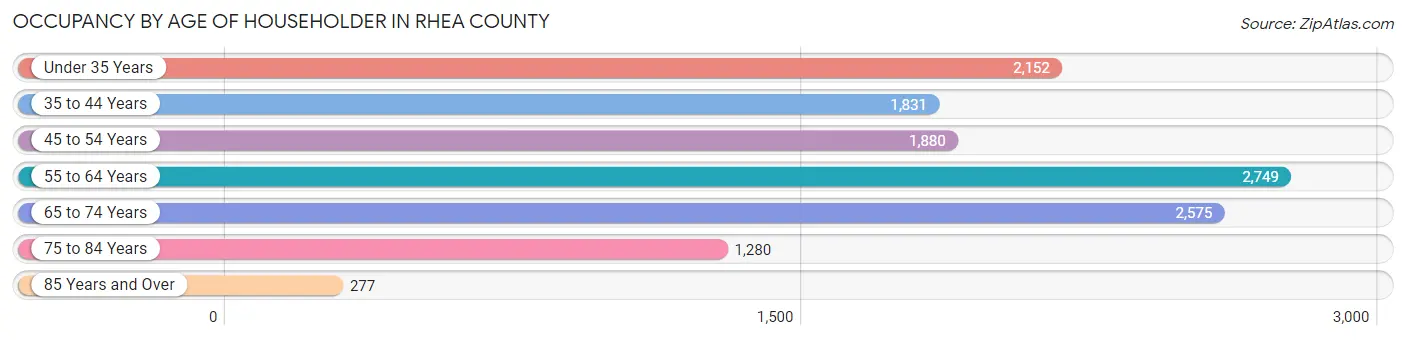
| Age Bracket | # Households | % Households |
| Under 35 Years | 2,152 | 16.9% |
| 35 to 44 Years | 1,831 | 14.4% |
| 45 to 54 Years | 1,880 | 14.7% |
| 55 to 64 Years | 2,749 | 21.6% |
| 65 to 74 Years | 2,575 | 20.2% |
| 75 to 84 Years | 1,280 | 10.0% |
| 85 Years and Over | 277 | 2.2% |
| Total | 12,744 | 100.0% |
Housing Finances in Rhea County
Median Income by Occupancy in Rhea County
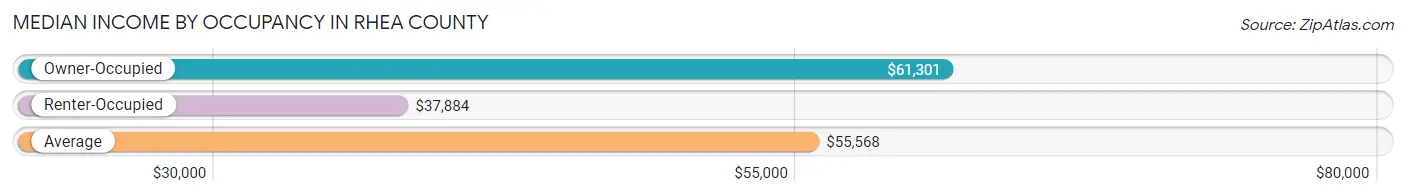
| Occupancy Type | # Households | Median Income |
| Owner-Occupied | 9,365 (73.5%) | $61,301 |
| Renter-Occupied | 3,379 (26.5%) | $37,884 |
| Average | 12,744 (100.0%) | $55,568 |
Occupancy by Householder Income Bracket in Rhea County
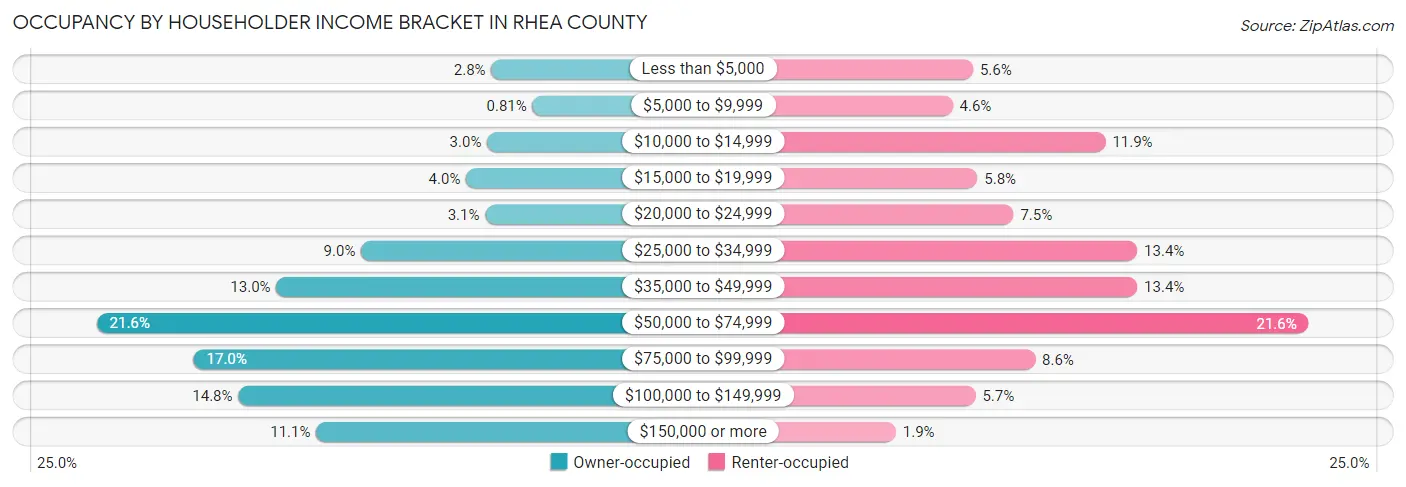
| Income Bracket | Owner-occupied | Renter-occupied |
| Less than $5,000 | 259 (2.8%) | 189 (5.6%) |
| $5,000 to $9,999 | 76 (0.8%) | 156 (4.6%) |
| $10,000 to $14,999 | 278 (3.0%) | 402 (11.9%) |
| $15,000 to $19,999 | 372 (4.0%) | 196 (5.8%) |
| $20,000 to $24,999 | 287 (3.1%) | 254 (7.5%) |
| $25,000 to $34,999 | 840 (9.0%) | 453 (13.4%) |
| $35,000 to $49,999 | 1,218 (13.0%) | 453 (13.4%) |
| $50,000 to $74,999 | 2,020 (21.6%) | 729 (21.6%) |
| $75,000 to $99,999 | 1,587 (17.0%) | 289 (8.6%) |
| $100,000 to $149,999 | 1,388 (14.8%) | 193 (5.7%) |
| $150,000 or more | 1,040 (11.1%) | 65 (1.9%) |
| Total | 9,365 (100.0%) | 3,379 (100.0%) |
Monthly Housing Cost Tiers in Rhea County
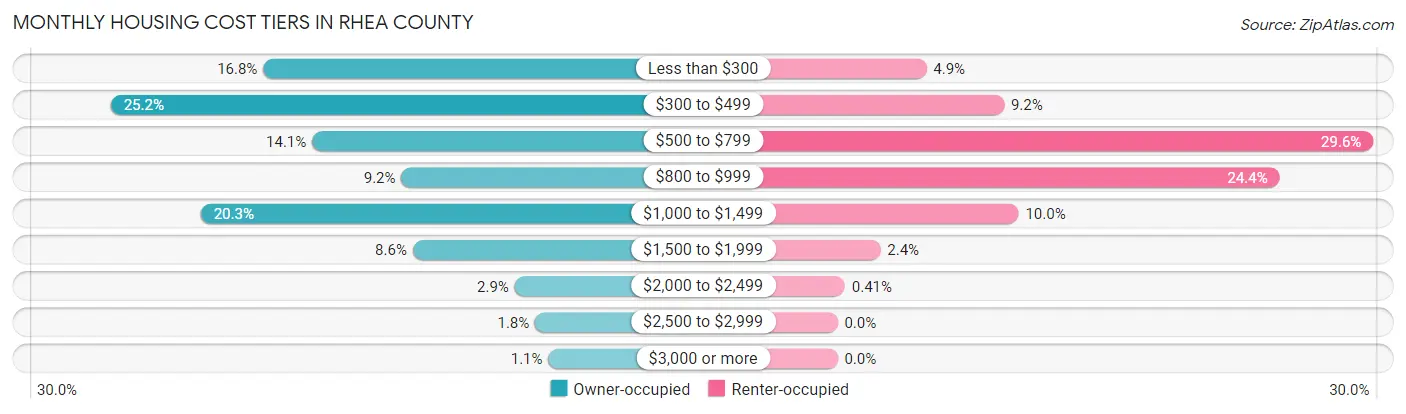
| Monthly Cost | Owner-occupied | Renter-occupied |
| Less than $300 | 1,575 (16.8%) | 166 (4.9%) |
| $300 to $499 | 2,364 (25.2%) | 311 (9.2%) |
| $500 to $799 | 1,322 (14.1%) | 1,000 (29.6%) |
| $800 to $999 | 861 (9.2%) | 825 (24.4%) |
| $1,000 to $1,499 | 1,898 (20.3%) | 338 (10.0%) |
| $1,500 to $1,999 | 802 (8.6%) | 80 (2.4%) |
| $2,000 to $2,499 | 274 (2.9%) | 14 (0.4%) |
| $2,500 to $2,999 | 169 (1.8%) | 0 (0.0%) |
| $3,000 or more | 100 (1.1%) | 0 (0.0%) |
| Total | 9,365 (100.0%) | 3,379 (100.0%) |
Physical Housing Characteristics in Rhea County
Housing Structures in Rhea County
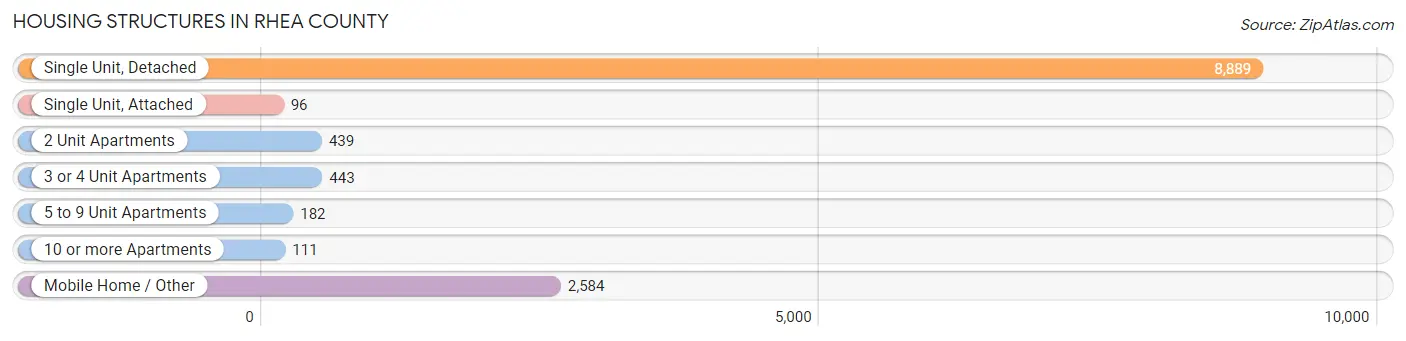
| Structure Type | # Housing Units | % Housing Units |
| Single Unit, Detached | 8,889 | 69.8% |
| Single Unit, Attached | 96 | 0.7% |
| 2 Unit Apartments | 439 | 3.4% |
| 3 or 4 Unit Apartments | 443 | 3.5% |
| 5 to 9 Unit Apartments | 182 | 1.4% |
| 10 or more Apartments | 111 | 0.9% |
| Mobile Home / Other | 2,584 | 20.3% |
| Total | 12,744 | 100.0% |
Housing Structures by Occupancy in Rhea County

| Structure Type | Owner-occupied | Renter-occupied |
| Single Unit, Detached | 7,684 (86.4%) | 1,205 (13.6%) |
| Single Unit, Attached | 18 (18.8%) | 78 (81.2%) |
| 2 Unit Apartments | 0 (0.0%) | 439 (100.0%) |
| 3 or 4 Unit Apartments | 0 (0.0%) | 443 (100.0%) |
| 5 to 9 Unit Apartments | 0 (0.0%) | 182 (100.0%) |
| 10 or more Apartments | 46 (41.4%) | 65 (58.6%) |
| Mobile Home / Other | 1,617 (62.6%) | 967 (37.4%) |
| Total | 9,365 (73.5%) | 3,379 (26.5%) |
Housing Structures by Number of Rooms in Rhea County
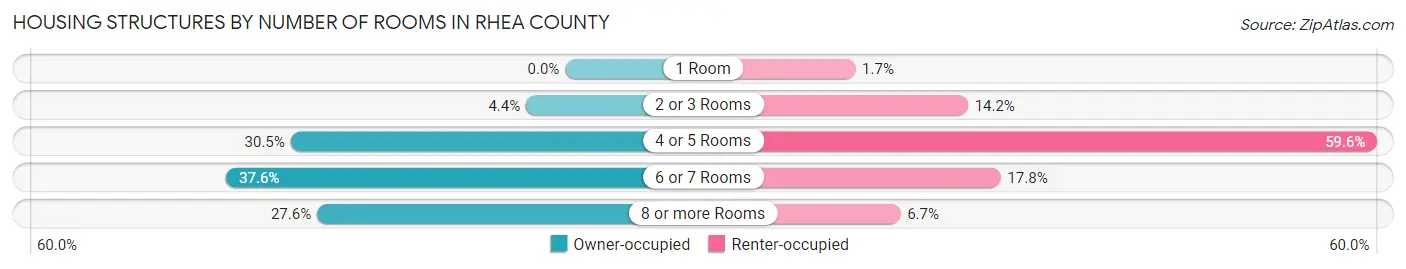
| Number of Rooms | Owner-occupied | Renter-occupied |
| 1 Room | 0 (0.0%) | 57 (1.7%) |
| 2 or 3 Rooms | 407 (4.3%) | 479 (14.2%) |
| 4 or 5 Rooms | 2,854 (30.5%) | 2,015 (59.6%) |
| 6 or 7 Rooms | 3,524 (37.6%) | 602 (17.8%) |
| 8 or more Rooms | 2,580 (27.6%) | 226 (6.7%) |
| Total | 9,365 (100.0%) | 3,379 (100.0%) |
Housing Structure by Heating Type in Rhea County
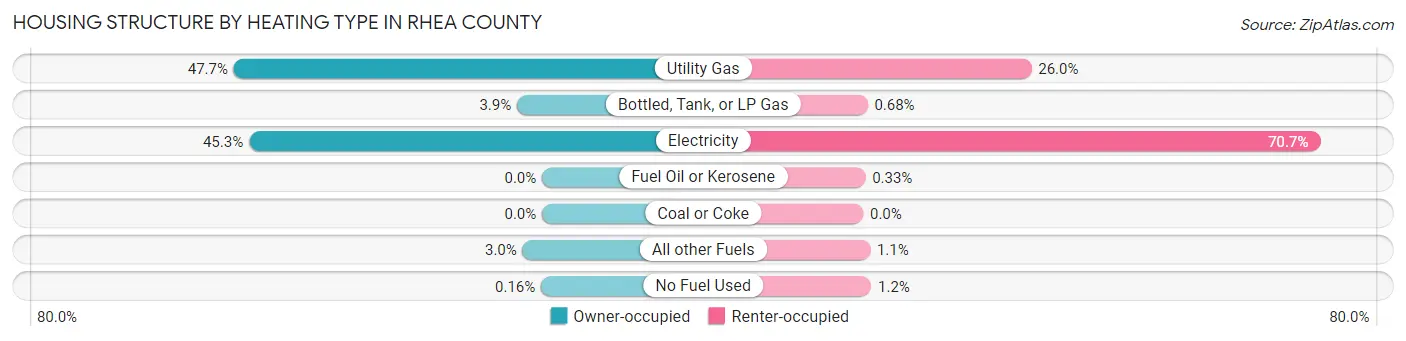
| Heating Type | Owner-occupied | Renter-occupied |
| Utility Gas | 4,463 (47.7%) | 879 (26.0%) |
| Bottled, Tank, or LP Gas | 362 (3.9%) | 23 (0.7%) |
| Electricity | 4,243 (45.3%) | 2,388 (70.7%) |
| Fuel Oil or Kerosene | 0 (0.0%) | 11 (0.3%) |
| Coal or Coke | 0 (0.0%) | 0 (0.0%) |
| All other Fuels | 282 (3.0%) | 36 (1.1%) |
| No Fuel Used | 15 (0.2%) | 42 (1.2%) |
| Total | 9,365 (100.0%) | 3,379 (100.0%) |
Household Vehicle Usage in Rhea County
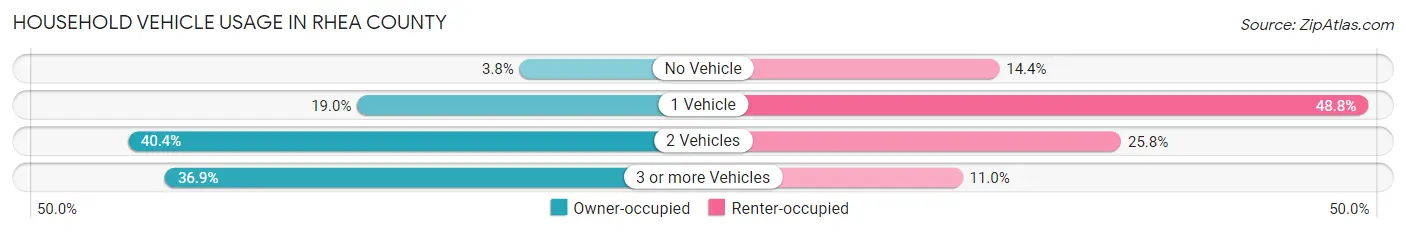
| Vehicles per Household | Owner-occupied | Renter-occupied |
| No Vehicle | 355 (3.8%) | 487 (14.4%) |
| 1 Vehicle | 1,775 (19.0%) | 1,650 (48.8%) |
| 2 Vehicles | 3,780 (40.4%) | 871 (25.8%) |
| 3 or more Vehicles | 3,455 (36.9%) | 371 (11.0%) |
| Total | 9,365 (100.0%) | 3,379 (100.0%) |
Real Estate & Mortgages in Rhea County
Real Estate and Mortgage Overview in Rhea County
| Characteristic | Without Mortgage | With Mortgage |
| Housing Units | 4,902 | 4,463 |
| Median Property Value | $123,500 | $179,100 |
| Median Household Income | $54,023 | $812 |
| Monthly Housing Costs | $379 | $100 |
| Real Estate Taxes | $730 | $43 |
Property Value by Mortgage Status in Rhea County
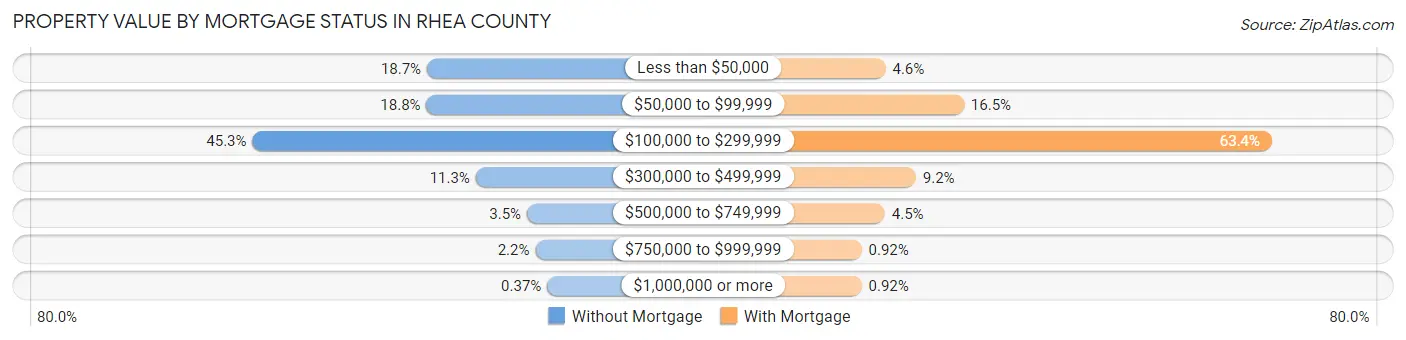
| Property Value | Without Mortgage | With Mortgage |
| Less than $50,000 | 916 (18.7%) | 204 (4.6%) |
| $50,000 to $99,999 | 920 (18.8%) | 737 (16.5%) |
| $100,000 to $299,999 | 2,220 (45.3%) | 2,831 (63.4%) |
| $300,000 to $499,999 | 552 (11.3%) | 410 (9.2%) |
| $500,000 to $749,999 | 169 (3.5%) | 199 (4.5%) |
| $750,000 to $999,999 | 107 (2.2%) | 41 (0.9%) |
| $1,000,000 or more | 18 (0.4%) | 41 (0.9%) |
| Total | 4,902 (100.0%) | 4,463 (100.0%) |
Household Income by Mortgage Status in Rhea County
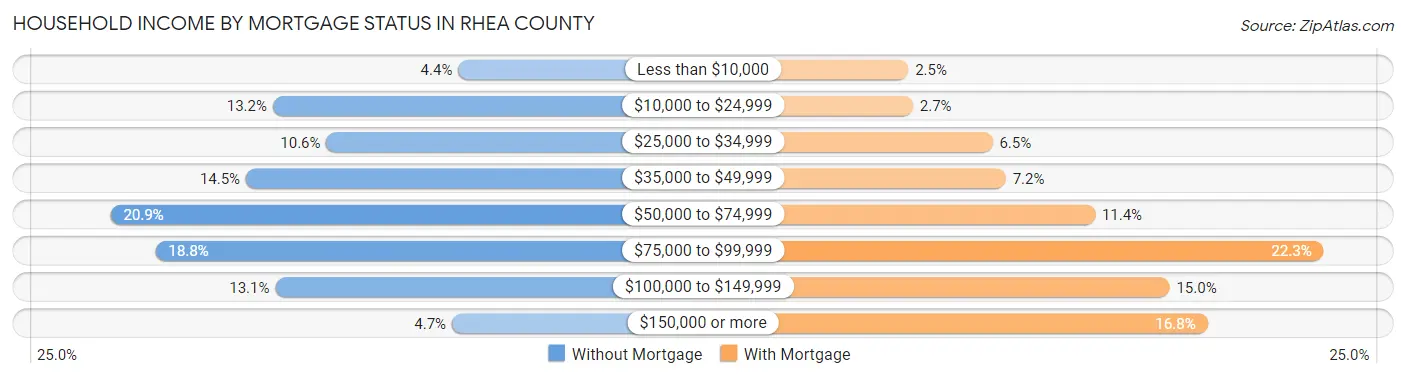
| Household Income | Without Mortgage | With Mortgage |
| Less than $10,000 | 213 (4.3%) | 112 (2.5%) |
| $10,000 to $24,999 | 646 (13.2%) | 122 (2.7%) |
| $25,000 to $34,999 | 521 (10.6%) | 291 (6.5%) |
| $35,000 to $49,999 | 709 (14.5%) | 319 (7.1%) |
| $50,000 to $74,999 | 1,025 (20.9%) | 509 (11.4%) |
| $75,000 to $99,999 | 920 (18.8%) | 995 (22.3%) |
| $100,000 to $149,999 | 640 (13.1%) | 667 (14.9%) |
| $150,000 or more | 228 (4.6%) | 748 (16.8%) |
| Total | 4,902 (100.0%) | 4,463 (100.0%) |
Property Value to Household Income Ratio in Rhea County
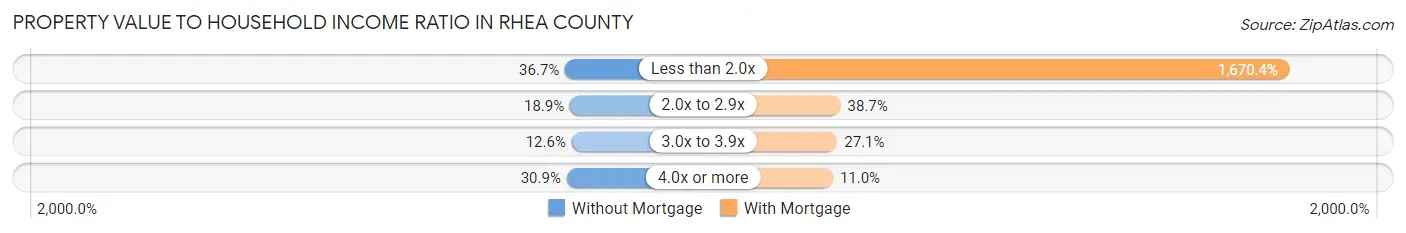
| Value-to-Income Ratio | Without Mortgage | With Mortgage |
| Less than 2.0x | 1,797 (36.7%) | 74,550 (1,670.4%) |
| 2.0x to 2.9x | 925 (18.9%) | 1,727 (38.7%) |
| 3.0x to 3.9x | 619 (12.6%) | 1,208 (27.1%) |
| 4.0x or more | 1,516 (30.9%) | 492 (11.0%) |
| Total | 4,902 (100.0%) | 4,463 (100.0%) |
Real Estate Taxes by Mortgage Status in Rhea County
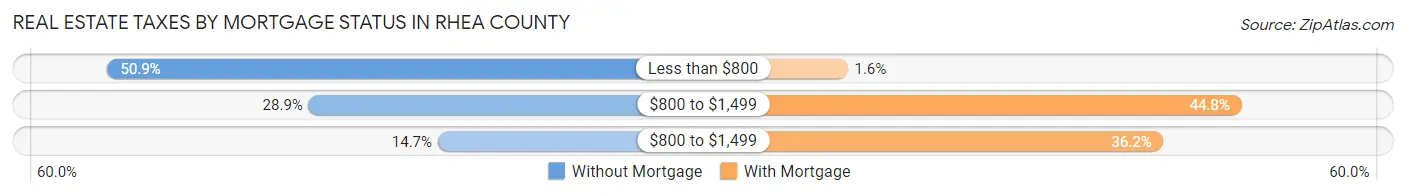
| Property Taxes | Without Mortgage | With Mortgage |
| Less than $800 | 2,496 (50.9%) | 71 (1.6%) |
| $800 to $1,499 | 1,415 (28.9%) | 1,999 (44.8%) |
| $800 to $1,499 | 721 (14.7%) | 1,617 (36.2%) |
| Total | 4,902 (100.0%) | 4,463 (100.0%) |
Health & Disability in Rhea County
Health Insurance Coverage by Age in Rhea County
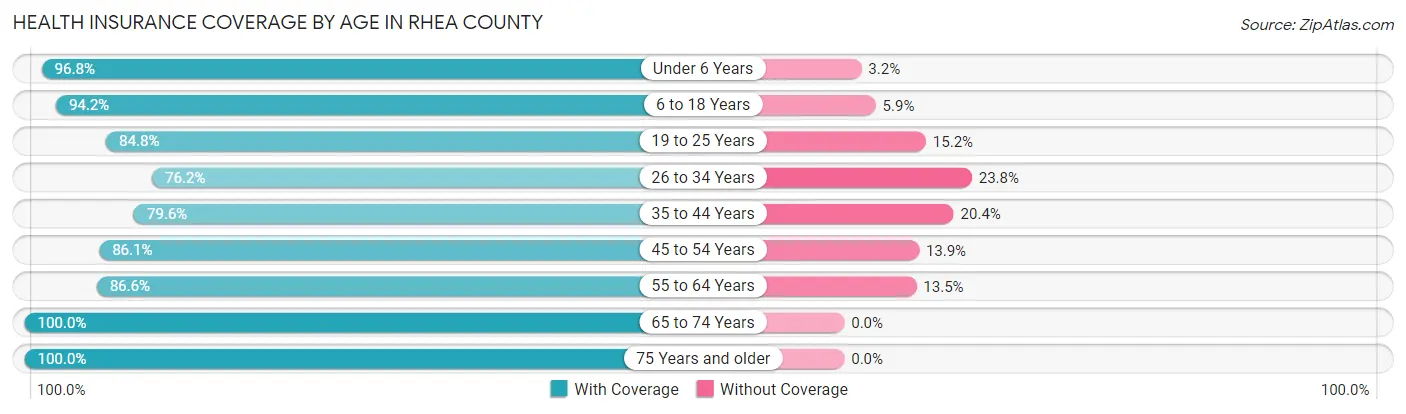
| Age Bracket | With Coverage | Without Coverage |
| Under 6 Years | 2,214 (96.8%) | 73 (3.2%) |
| 6 to 18 Years | 5,122 (94.2%) | 318 (5.9%) |
| 19 to 25 Years | 2,385 (84.8%) | 428 (15.2%) |
| 26 to 34 Years | 2,644 (76.2%) | 825 (23.8%) |
| 35 to 44 Years | 2,972 (79.6%) | 761 (20.4%) |
| 45 to 54 Years | 3,667 (86.1%) | 593 (13.9%) |
| 55 to 64 Years | 4,047 (86.6%) | 629 (13.5%) |
| 65 to 74 Years | 3,752 (100.0%) | 0 (0.0%) |
| 75 Years and older | 2,383 (100.0%) | 0 (0.0%) |
| Total | 29,186 (88.9%) | 3,627 (11.1%) |
Health Insurance Coverage by Citizenship Status in Rhea County
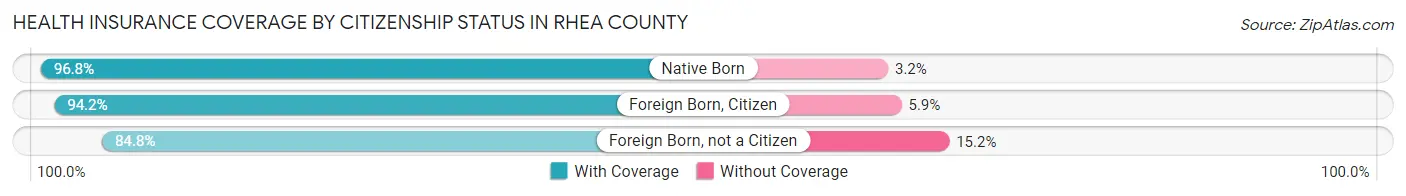
| Citizenship Status | With Coverage | Without Coverage |
| Native Born | 2,214 (96.8%) | 73 (3.2%) |
| Foreign Born, Citizen | 5,122 (94.2%) | 318 (5.9%) |
| Foreign Born, not a Citizen | 2,385 (84.8%) | 428 (15.2%) |
Health Insurance Coverage by Household Income in Rhea County

| Household Income | With Coverage | Without Coverage |
| Under $25,000 | 3,792 (83.6%) | 745 (16.4%) |
| $25,000 to $49,999 | 6,109 (85.8%) | 1,009 (14.2%) |
| $50,000 to $74,999 | 6,808 (88.6%) | 872 (11.4%) |
| $75,000 to $99,999 | 4,769 (88.9%) | 593 (11.1%) |
| $100,000 and over | 7,255 (95.8%) | 317 (4.2%) |
Public vs Private Health Insurance Coverage by Age in Rhea County
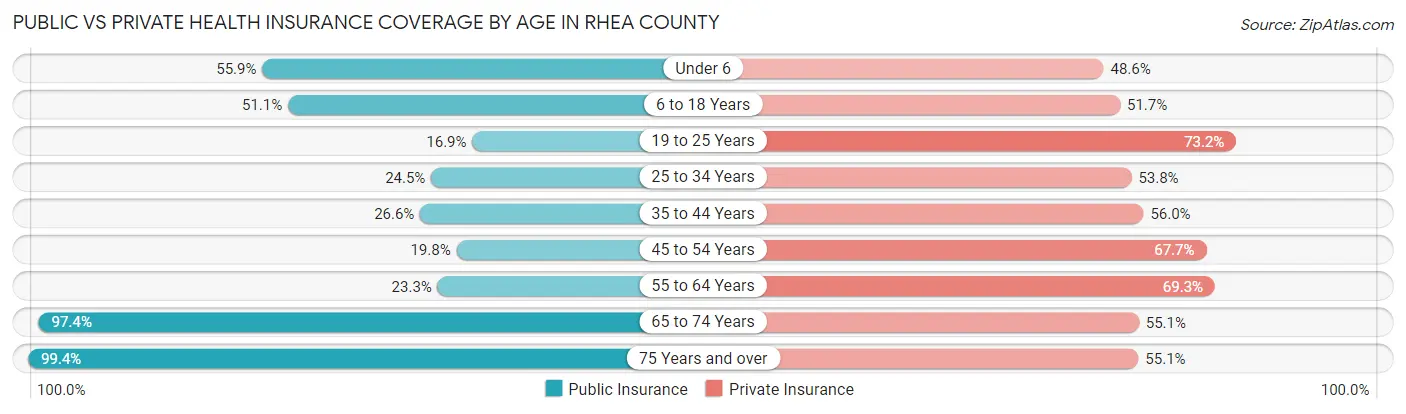
| Age Bracket | Public Insurance | Private Insurance |
| Under 6 | 1,278 (55.9%) | 1,111 (48.6%) |
| 6 to 18 Years | 2,780 (51.1%) | 2,810 (51.6%) |
| 19 to 25 Years | 475 (16.9%) | 2,059 (73.2%) |
| 25 to 34 Years | 851 (24.5%) | 1,865 (53.8%) |
| 35 to 44 Years | 992 (26.6%) | 2,090 (56.0%) |
| 45 to 54 Years | 845 (19.8%) | 2,882 (67.6%) |
| 55 to 64 Years | 1,091 (23.3%) | 3,238 (69.3%) |
| 65 to 74 Years | 3,655 (97.4%) | 2,068 (55.1%) |
| 75 Years and over | 2,368 (99.4%) | 1,312 (55.1%) |
| Total | 14,335 (43.7%) | 19,435 (59.2%) |
Disability Status by Sex by Age in Rhea County
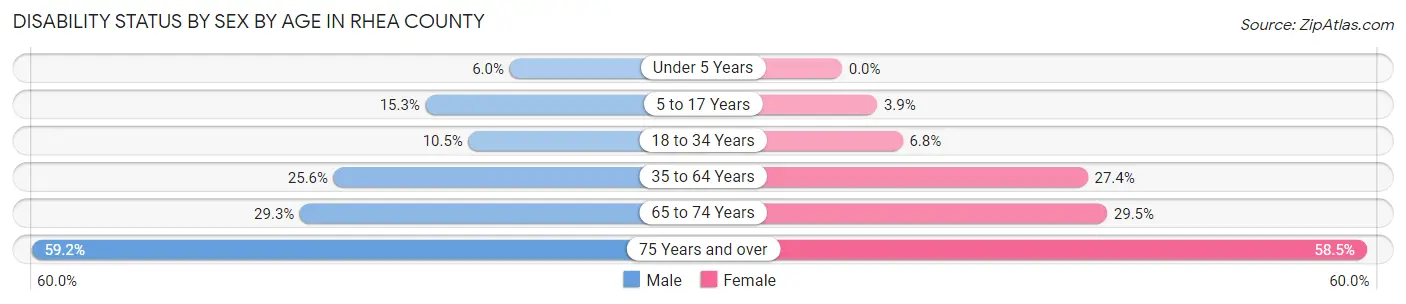
| Age Bracket | Male | Female |
| Under 5 Years | 56 (6.0%) | 0 (0.0%) |
| 5 to 17 Years | 448 (15.3%) | 96 (3.9%) |
| 18 to 34 Years | 381 (10.5%) | 212 (6.8%) |
| 35 to 64 Years | 1,612 (25.6%) | 1,741 (27.4%) |
| 65 to 74 Years | 508 (29.3%) | 596 (29.5%) |
| 75 Years and over | 619 (59.2%) | 782 (58.5%) |
Disability Class by Sex by Age in Rhea County
Disability Class: Hearing Difficulty
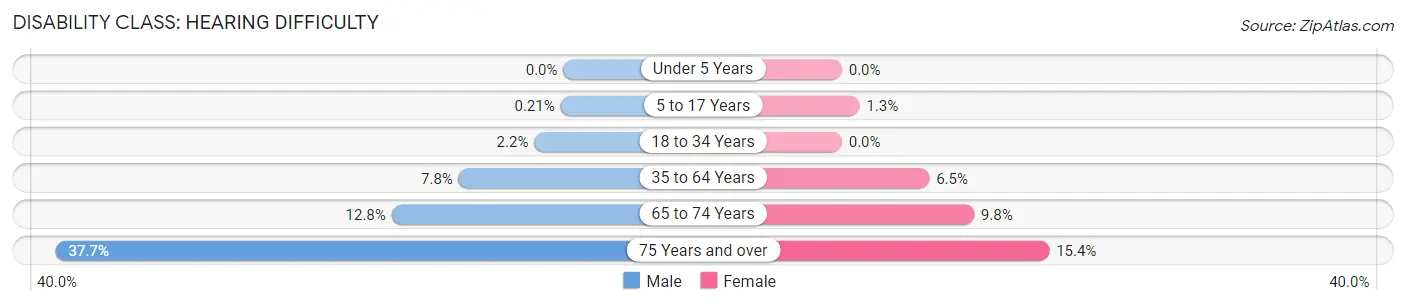
| Age Bracket | Male | Female |
| Under 5 Years | 0 (0.0%) | 0 (0.0%) |
| 5 to 17 Years | 6 (0.2%) | 32 (1.3%) |
| 18 to 34 Years | 78 (2.2%) | 0 (0.0%) |
| 35 to 64 Years | 490 (7.8%) | 413 (6.5%) |
| 65 to 74 Years | 221 (12.8%) | 198 (9.8%) |
| 75 Years and over | 394 (37.7%) | 206 (15.4%) |
Disability Class: Vision Difficulty
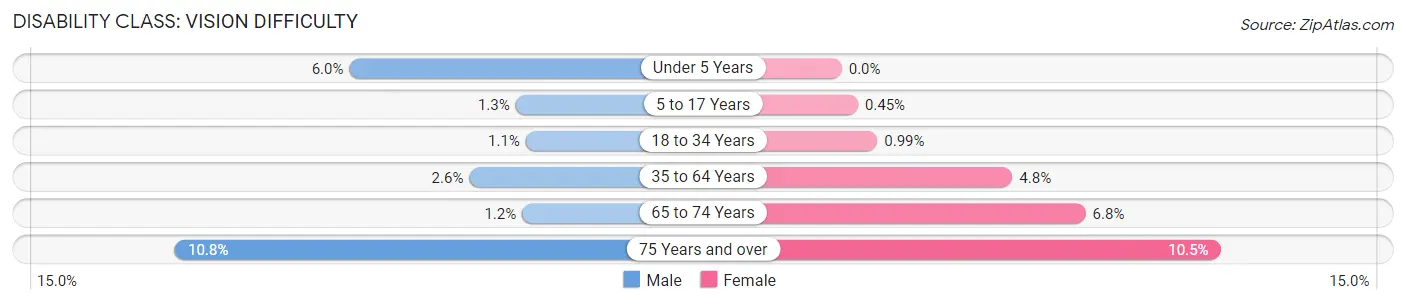
| Age Bracket | Male | Female |
| Under 5 Years | 56 (6.0%) | 0 (0.0%) |
| 5 to 17 Years | 39 (1.3%) | 11 (0.4%) |
| 18 to 34 Years | 38 (1.1%) | 31 (1.0%) |
| 35 to 64 Years | 165 (2.6%) | 302 (4.8%) |
| 65 to 74 Years | 20 (1.1%) | 137 (6.8%) |
| 75 Years and over | 113 (10.8%) | 141 (10.5%) |
Disability Class: Cognitive Difficulty

| Age Bracket | Male | Female |
| 5 to 17 Years | 448 (15.3%) | 53 (2.2%) |
| 18 to 34 Years | 246 (6.8%) | 173 (5.5%) |
| 35 to 64 Years | 602 (9.5%) | 876 (13.8%) |
| 65 to 74 Years | 131 (7.6%) | 129 (6.4%) |
| 75 Years and over | 245 (23.4%) | 218 (16.3%) |
Disability Class: Ambulatory Difficulty
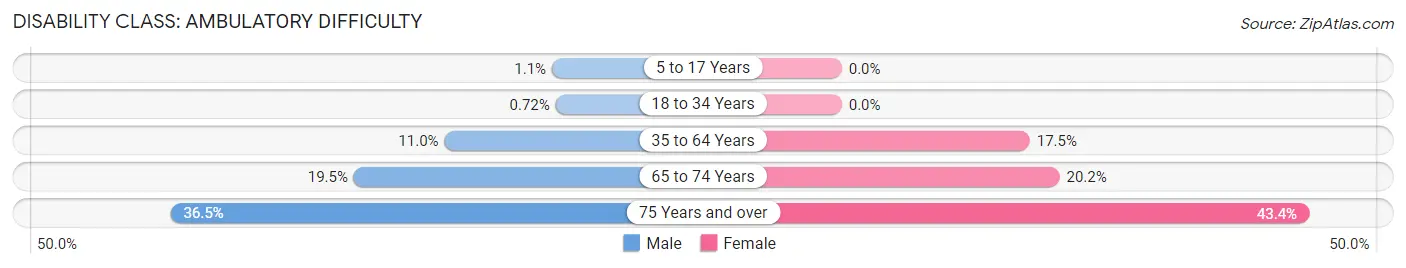
| Age Bracket | Male | Female |
| 5 to 17 Years | 31 (1.1%) | 0 (0.0%) |
| 18 to 34 Years | 26 (0.7%) | 0 (0.0%) |
| 35 to 64 Years | 696 (11.0%) | 1,110 (17.4%) |
| 65 to 74 Years | 337 (19.5%) | 408 (20.2%) |
| 75 Years and over | 381 (36.5%) | 580 (43.3%) |
Disability Class: Self-Care Difficulty
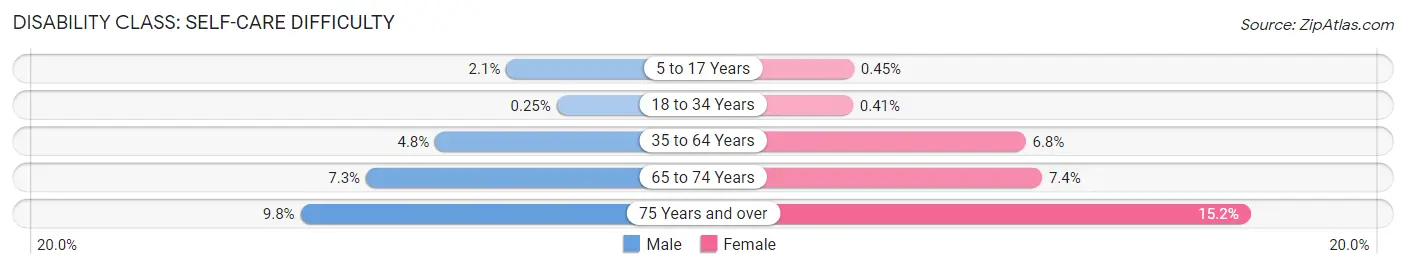
| Age Bracket | Male | Female |
| 5 to 17 Years | 62 (2.1%) | 11 (0.4%) |
| 18 to 34 Years | 9 (0.3%) | 13 (0.4%) |
| 35 to 64 Years | 300 (4.8%) | 434 (6.8%) |
| 65 to 74 Years | 127 (7.3%) | 150 (7.4%) |
| 75 Years and over | 102 (9.8%) | 203 (15.2%) |
Technology Access in Rhea County
Computing Device Access in Rhea County
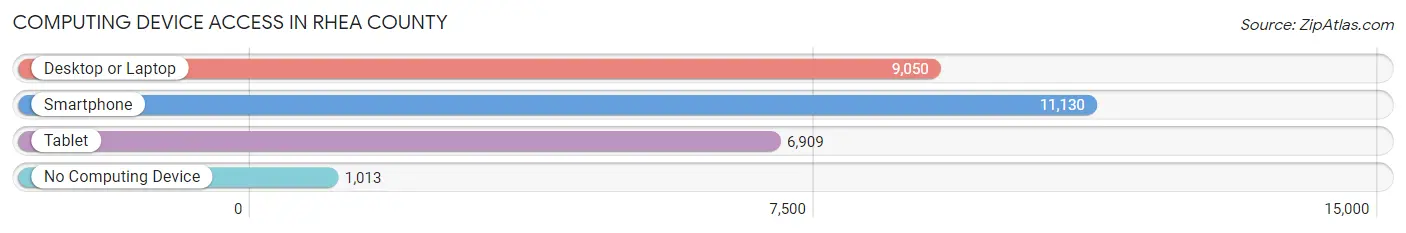
| Device Type | # Households | % Households |
| Desktop or Laptop | 9,050 | 71.0% |
| Smartphone | 11,130 | 87.3% |
| Tablet | 6,909 | 54.2% |
| No Computing Device | 1,013 | 8.0% |
| Total | 12,744 | 100.0% |
Internet Access in Rhea County
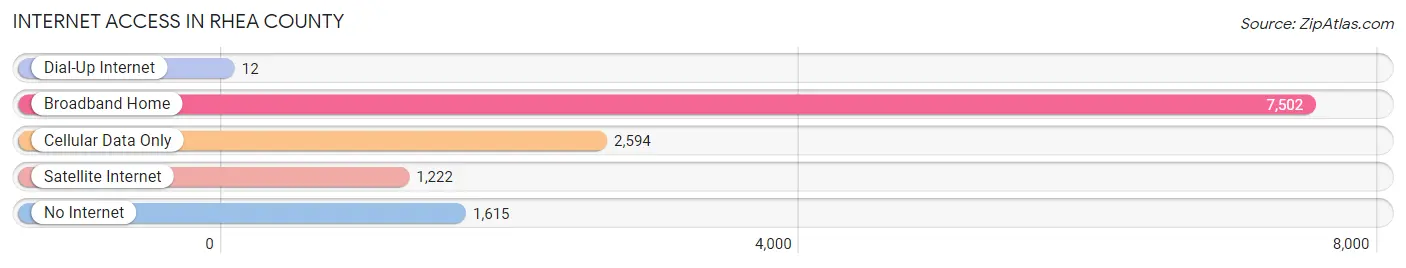
| Internet Type | # Households | % Households |
| Dial-Up Internet | 12 | 0.1% |
| Broadband Home | 7,502 | 58.9% |
| Cellular Data Only | 2,594 | 20.3% |
| Satellite Internet | 1,222 | 9.6% |
| No Internet | 1,615 | 12.7% |
| Total | 12,744 | 100.0% |
Rhea County Summary
Rhea County is located in the southeastern corner of Tennessee, and is part of the Chattanooga metropolitan area. It is bordered by Bledsoe County to the north, Roane County to the east, Meigs County to the south, and Hamilton County to the west. The county seat is Dayton, and the largest city is Spring City. The county was named after Tennessee Governor John Rhea.
Geography
Rhea County covers an area of 545 square miles, making it the second-smallest county in Tennessee. The terrain is mostly hilly, with the highest point being the summit of Pine Mountain at 1,890 feet. The county is drained by the Tennessee River, which forms its western border. Other major waterways include the Hiwassee River, which forms the northern border, and the Clinch River, which forms the eastern border. The county is home to several state parks, including the Big South Fork National River and Recreation Area, the Cumberland Trail State Park, and the Rhea County Wildlife Management Area.
Demographics
As of the 2010 census, Rhea County had a population of 31,809. The racial makeup of the county was 94.2% White, 2.7% Black or African American, 0.4% Native American, 0.3% Asian, 0.1% Pacific Islander, 1.2% from other races, and 1.2% from two or more races. Hispanic or Latino of any race were 2.7% of the population.
The median household income was $37,945 and the median family income was $45,945. The per capita income was $19,845. About 15.2% of families and 19.2% of the population were below the poverty line, including 25.2% of those under age 18 and 14.2% of those age 65 or over.
Economy
Rhea County’s economy is largely based on agriculture, with the main crops being corn, soybeans, and hay. The county is also home to several manufacturing companies, including a paper mill, a furniture factory, and a plastics plant. The county is also home to several tourist attractions, including the Rhea County Courthouse, the Rhea County Museum, and the Rhea County Fairgrounds.
History
Rhea County was created in 1807 from parts of Roane and Bledsoe counties. The county was named after Tennessee Governor John Rhea. The county seat was originally located in the town of Washington, but was moved to Dayton in 1819.
During the Civil War, Rhea County was the site of the Battle of Rhea’s Mill, which was fought on June 8, 1863. The battle was a Confederate victory, and resulted in the death of over 200 Union soldiers.
In 1925, the Scopes Trial was held in Rhea County. The trial, which was a landmark case in the debate over the teaching of evolution in public schools, was held in the Rhea County Courthouse in Dayton.
In the 1950s, the Tennessee Valley Authority (TVA) began construction of the Watts Bar Nuclear Plant in Rhea County. The plant, which is the only nuclear power plant in Tennessee, began operating in 1996.
In recent years, Rhea County has become a popular destination for outdoor recreation. The county is home to several state parks, including the Big South Fork National River and Recreation Area, the Cumberland Trail State Park, and the Rhea County Wildlife Management Area.
Common Questions
What is the Total Population of Rhea County?
Total Population of Rhea County is 33,031.
What is the Total Male Population of Rhea County?
Total Male Population of Rhea County is 16,691.
What is the Total Female Population of Rhea County?
Total Female Population of Rhea County is 16,340.
What is the Ratio of Males per 100 Females in Rhea County?
There are 102.15 Males per 100 Females in Rhea County.
What is the Ratio of Females per 100 Males in Rhea County?
There are 97.90 Females per 100 Males in Rhea County.
What is the Median Population Age in Rhea County?
Median Population Age in Rhea County is 40.9 Years.
What is the Average Family Size in Rhea County
Average Family Size in Rhea County is 2.9 People.
What is the Average Household Size in Rhea County
Average Household Size in Rhea County is 2.5 People.
What is Per Capita Income in Rhea County?
Per Capita income in Rhea County is $26,678.
What is the Median Family Income in Rhea County?
Median Family Income in Rhea County is $60,674.
What is the Median Household income in Rhea County?
Median Household Income in Rhea County is $55,568.
What is Income or Wage Gap in Rhea County?
Income or Wage Gap in Rhea County is 33.9%.
Women in Rhea County earn 66.1 cents for every dollar earned by a man.
What is Family Income Deficit in Rhea County?
Family Income Deficit in Rhea County is $10,943.
Families that are below poverty line in Rhea County earn $10,943 less on average than the poverty threshold level.
What is Inequality or Gini Index in Rhea County?
Inequality or Gini Index in Rhea County is 0.42.
How Large is the Labor Force in Rhea County?
There are 14,182 People in the Labor Forcein in Rhea County.
What is the Percentage of People in the Labor Force in Rhea County?
52.8% of People are in the Labor Force in Rhea County.
What is the Unemployment Rate in Rhea County?
Unemployment Rate in Rhea County is 7.9%.