Putnam County, TN
Putnam County Map
Putnam County Overview
80,157
TOTAL POPULATION
39,887
MALE POPULATION
40,270
FEMALE POPULATION
99.05
MALES / 100 FEMALES
100.96
FEMALES / 100 MALES
36.3
MEDIAN AGE
2.9
AVG FAMILY SIZE
2.4
AVG HOUSEHOLD SIZE
$29,419
PER CAPITA INCOME
$69,491
AVG FAMILY INCOME
$54,371
AVG HOUSEHOLD INCOME
21.3%
WAGE / INCOME GAP [ % ]
78.7¢/ $1
WAGE / INCOME GAP [ $ ]
$10,710
FAMILY INCOME DEFICIT
0.45
INEQUALITY / GINI INDEX
40,067
LABOR FORCE [ PEOPLE ]
61.0%
PERCENT IN LABOR FORCE
4.5%
UNEMPLOYMENT RATE
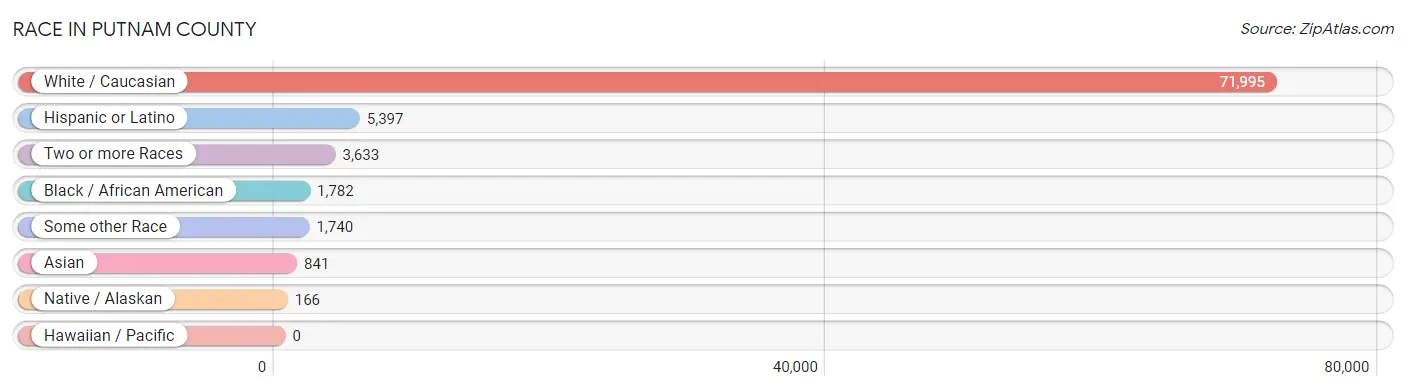
Race in Putnam County
The most populous races in Putnam County are White / Caucasian (71,995 | 89.8%), Hispanic or Latino (5,397 | 6.7%), and Two or more Races (3,633 | 4.5%).
| Race | # Population | % Population |
| Asian | 841 | 1.1% |
| Black / African American | 1,782 | 2.2% |
| Hawaiian / Pacific | 0 | 0.0% |
| Hispanic or Latino | 5,397 | 6.7% |
| Native / Alaskan | 166 | 0.2% |
| White / Caucasian | 71,995 | 89.8% |
| Two or more Races | 3,633 | 4.5% |
| Some other Race | 1,740 | 2.2% |
| Total | 80,157 | 100.0% |
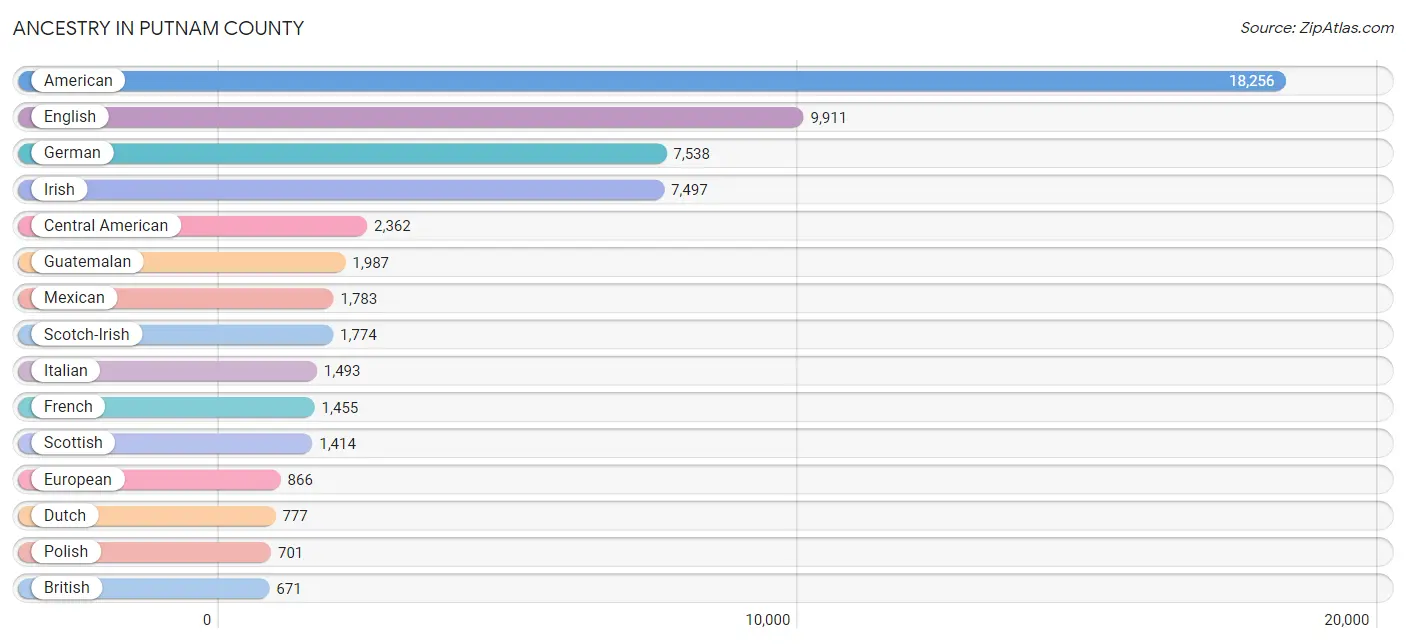
Ancestry in Putnam County
The most populous ancestries reported in Putnam County are American (18,256 | 22.8%), English (9,911 | 12.4%), German (7,538 | 9.4%), Irish (7,497 | 9.3%), and Central American (2,362 | 2.9%), together accounting for 56.8% of all Putnam County residents.
| Ancestry | # Population | % Population |
| African | 96 | 0.1% |
| American | 18,256 | 22.8% |
| Apache | 13 | 0.0% |
| Arab | 191 | 0.2% |
| Argentinean | 19 | 0.0% |
| Armenian | 43 | 0.1% |
| Australian | 145 | 0.2% |
| Austrian | 86 | 0.1% |
| Basque | 10 | 0.0% |
| Belgian | 66 | 0.1% |
| Bhutanese | 165 | 0.2% |
| Blackfeet | 13 | 0.0% |
| Brazilian | 18 | 0.0% |
| British | 671 | 0.8% |
| Bulgarian | 20 | 0.0% |
| Burmese | 34 | 0.0% |
| Cajun | 51 | 0.1% |
| Canadian | 120 | 0.2% |
| Celtic | 33 | 0.0% |
| Central American | 2,362 | 2.9% |
| Central American Indian | 102 | 0.1% |
| Cherokee | 317 | 0.4% |
| Choctaw | 3 | 0.0% |
| Colombian | 220 | 0.3% |
| Costa Rican | 4 | 0.0% |
| Croatian | 19 | 0.0% |
| Cuban | 201 | 0.3% |
| Czech | 59 | 0.1% |
| Czechoslovakian | 64 | 0.1% |
| Danish | 154 | 0.2% |
| Dominican | 99 | 0.1% |
| Dutch | 777 | 1.0% |
| Eastern European | 47 | 0.1% |
| Egyptian | 37 | 0.1% |
| English | 9,911 | 12.4% |
| European | 866 | 1.1% |
| Finnish | 64 | 0.1% |
| French | 1,455 | 1.8% |
| French American Indian | 8 | 0.0% |
| French Canadian | 368 | 0.5% |
| German | 7,538 | 9.4% |
| Greek | 62 | 0.1% |
| Guatemalan | 1,987 | 2.5% |
| Haitian | 30 | 0.0% |
| Hungarian | 79 | 0.1% |
| Indian (Asian) | 289 | 0.4% |
| Iranian | 46 | 0.1% |
| Irish | 7,497 | 9.3% |
| Italian | 1,493 | 1.9% |
| Jamaican | 9 | 0.0% |
| Japanese | 5 | 0.0% |
| Korean | 126 | 0.2% |
| Lebanese | 62 | 0.1% |
| Lithuanian | 50 | 0.1% |
| Mexican | 1,783 | 2.2% |
| Mongolian | 10 | 0.0% |
| Native Hawaiian | 28 | 0.0% |
| Nicaraguan | 8 | 0.0% |
| Nigerian | 30 | 0.0% |
| Northern European | 54 | 0.1% |
| Norwegian | 346 | 0.4% |
| Pakistani | 52 | 0.1% |
| Palestinian | 11 | 0.0% |
| Panamanian | 117 | 0.2% |
| Pennsylvania German | 23 | 0.0% |
| Peruvian | 41 | 0.1% |
| Polish | 701 | 0.9% |
| Portuguese | 97 | 0.1% |
| Puerto Rican | 307 | 0.4% |
| Romanian | 35 | 0.0% |
| Russian | 146 | 0.2% |
| Salvadoran | 246 | 0.3% |
| Scandinavian | 234 | 0.3% |
| Scotch-Irish | 1,774 | 2.2% |
| Scottish | 1,414 | 1.8% |
| Seminole | 20 | 0.0% |
| Sioux | 11 | 0.0% |
| Slavic | 16 | 0.0% |
| Slovak | 50 | 0.1% |
| Somali | 43 | 0.1% |
| South American | 387 | 0.5% |
| Spaniard | 184 | 0.2% |
| Spanish | 30 | 0.0% |
| Sri Lankan | 318 | 0.4% |
| Subsaharan African | 176 | 0.2% |
| Swedish | 339 | 0.4% |
| Swiss | 132 | 0.2% |
| Syrian | 11 | 0.0% |
| Thai | 216 | 0.3% |
| Ukrainian | 40 | 0.1% |
| Uruguayan | 8 | 0.0% |
| Venezuelan | 99 | 0.1% |
| Welsh | 459 | 0.6% |
| Yugoslavian | 6 | 0.0% | View All 94 Rows |
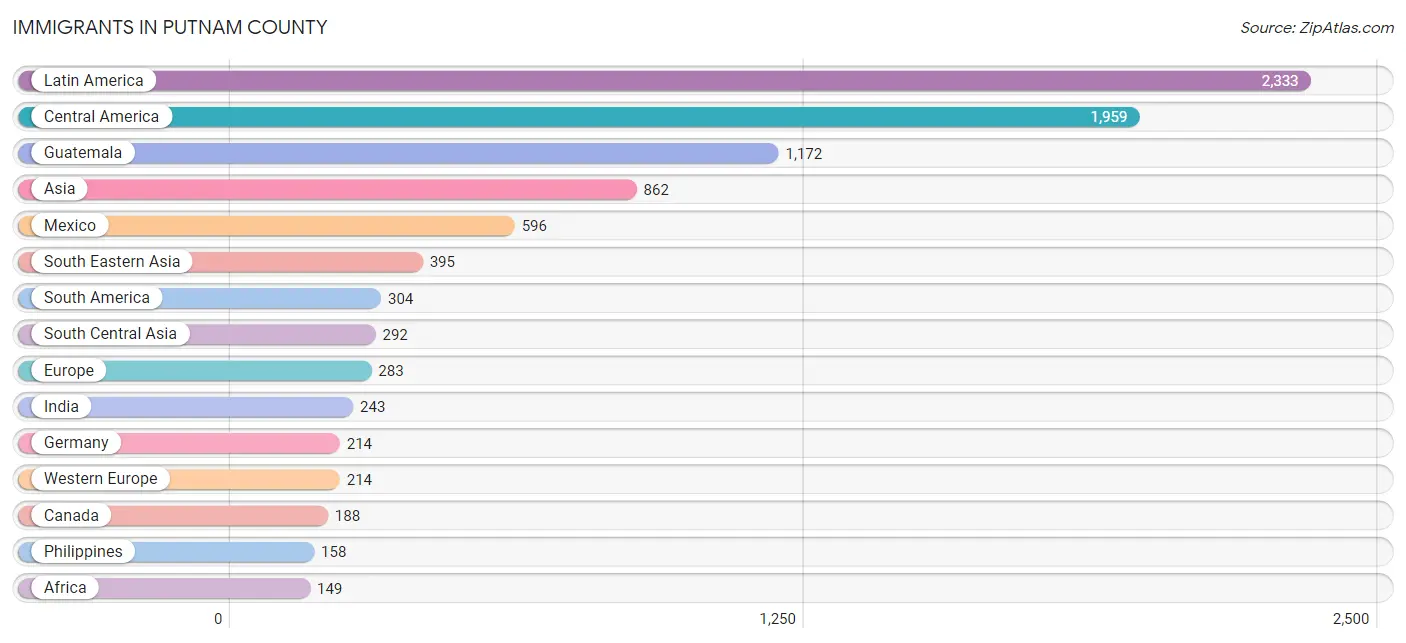
Immigrants in Putnam County
The most numerous immigrant groups reported in Putnam County came from Latin America (2,333 | 2.9%), Central America (1,959 | 2.4%), Guatemala (1,172 | 1.5%), Asia (862 | 1.1%), and Mexico (596 | 0.7%), together accounting for 8.6% of all Putnam County residents.
| Immigration Origin | # Population | % Population |
| Afghanistan | 14 | 0.0% |
| Africa | 149 | 0.2% |
| Argentina | 19 | 0.0% |
| Asia | 862 | 1.1% |
| Bosnia and Herzegovina | 6 | 0.0% |
| Brazil | 84 | 0.1% |
| Cambodia | 5 | 0.0% |
| Cameroon | 7 | 0.0% |
| Canada | 188 | 0.2% |
| Caribbean | 70 | 0.1% |
| Central America | 1,959 | 2.4% |
| China | 65 | 0.1% |
| Colombia | 61 | 0.1% |
| Costa Rica | 4 | 0.0% |
| Cuba | 42 | 0.1% |
| Dominican Republic | 28 | 0.0% |
| Eastern Asia | 97 | 0.1% |
| Eastern Europe | 24 | 0.0% |
| Egypt | 70 | 0.1% |
| El Salvador | 136 | 0.2% |
| England | 4 | 0.0% |
| Europe | 283 | 0.4% |
| Germany | 214 | 0.3% |
| Greece | 6 | 0.0% |
| Guatemala | 1,172 | 1.5% |
| India | 243 | 0.3% |
| Iran | 35 | 0.0% |
| Japan | 7 | 0.0% |
| Korea | 25 | 0.0% |
| Kuwait | 9 | 0.0% |
| Latin America | 2,333 | 2.9% |
| Malaysia | 95 | 0.1% |
| Mexico | 596 | 0.7% |
| Middle Africa | 7 | 0.0% |
| Nicaragua | 8 | 0.0% |
| Nigeria | 72 | 0.1% |
| Northern Africa | 70 | 0.1% |
| Northern Europe | 33 | 0.0% |
| Panama | 43 | 0.1% |
| Peru | 41 | 0.1% |
| Philippines | 158 | 0.2% |
| Poland | 14 | 0.0% |
| Russia | 4 | 0.0% |
| Saudi Arabia | 39 | 0.1% |
| South America | 304 | 0.4% |
| South Central Asia | 292 | 0.4% |
| South Eastern Asia | 395 | 0.5% |
| Southern Europe | 12 | 0.0% |
| Spain | 6 | 0.0% |
| Syria | 11 | 0.0% |
| Taiwan | 27 | 0.0% |
| Thailand | 14 | 0.0% |
| Venezuela | 99 | 0.1% |
| Vietnam | 123 | 0.2% |
| Western Africa | 72 | 0.1% |
| Western Asia | 78 | 0.1% |
| Western Europe | 214 | 0.3% |
| Yemen | 19 | 0.0% | View All 58 Rows |
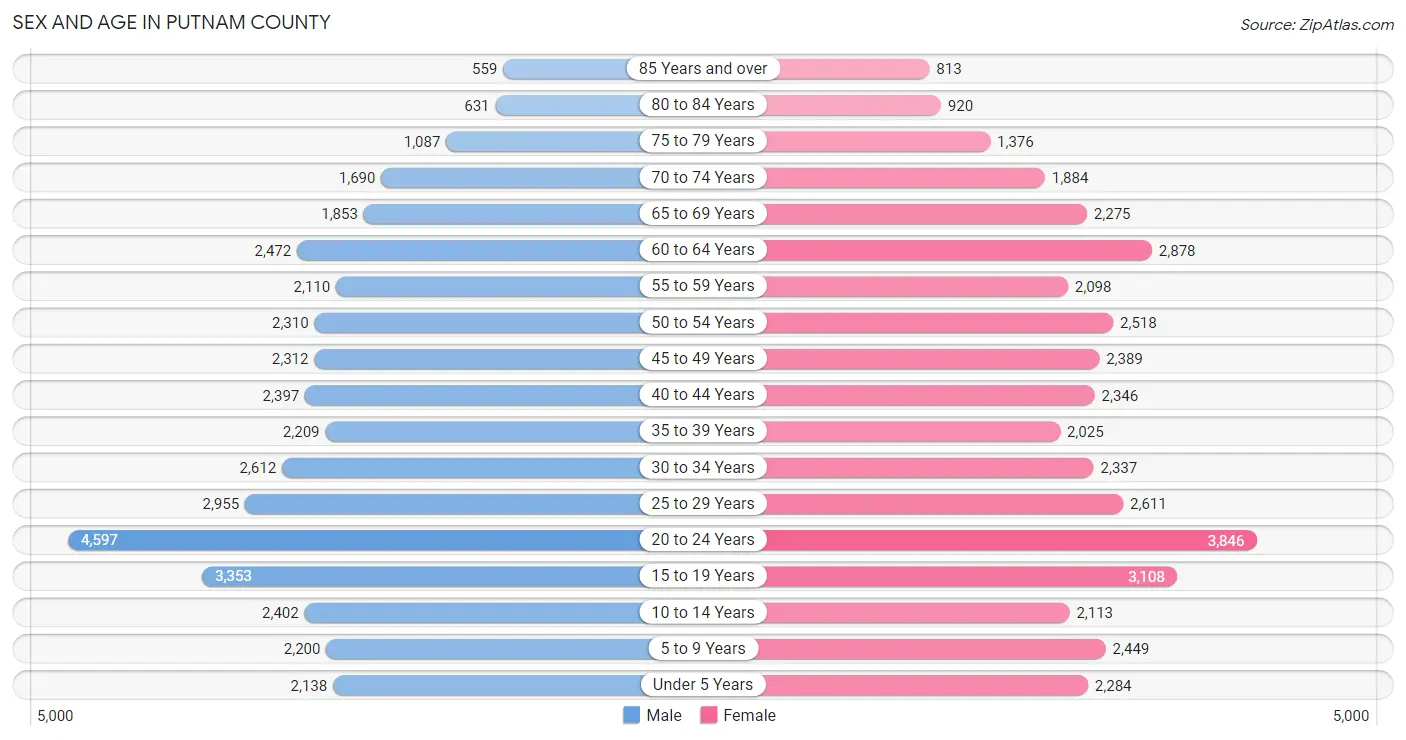
Sex and Age in Putnam County
Sex and Age in Putnam County
The most populous age groups in Putnam County are 20 to 24 Years (4,597 | 11.5%) for men and 20 to 24 Years (3,846 | 9.6%) for women.
| Age Bracket | Male | Female |
| Under 5 Years | 2,138 (5.4%) | 2,284 (5.7%) |
| 5 to 9 Years | 2,200 (5.5%) | 2,449 (6.1%) |
| 10 to 14 Years | 2,402 (6.0%) | 2,113 (5.2%) |
| 15 to 19 Years | 3,353 (8.4%) | 3,108 (7.7%) |
| 20 to 24 Years | 4,597 (11.5%) | 3,846 (9.6%) |
| 25 to 29 Years | 2,955 (7.4%) | 2,611 (6.5%) |
| 30 to 34 Years | 2,612 (6.6%) | 2,337 (5.8%) |
| 35 to 39 Years | 2,209 (5.5%) | 2,025 (5.0%) |
| 40 to 44 Years | 2,397 (6.0%) | 2,346 (5.8%) |
| 45 to 49 Years | 2,312 (5.8%) | 2,389 (5.9%) |
| 50 to 54 Years | 2,310 (5.8%) | 2,518 (6.2%) |
| 55 to 59 Years | 2,110 (5.3%) | 2,098 (5.2%) |
| 60 to 64 Years | 2,472 (6.2%) | 2,878 (7.1%) |
| 65 to 69 Years | 1,853 (4.6%) | 2,275 (5.7%) |
| 70 to 74 Years | 1,690 (4.2%) | 1,884 (4.7%) |
| 75 to 79 Years | 1,087 (2.7%) | 1,376 (3.4%) |
| 80 to 84 Years | 631 (1.6%) | 920 (2.3%) |
| 85 Years and over | 559 (1.4%) | 813 (2.0%) |
| Total | 39,887 (100.0%) | 40,270 (100.0%) |
Families and Households in Putnam County
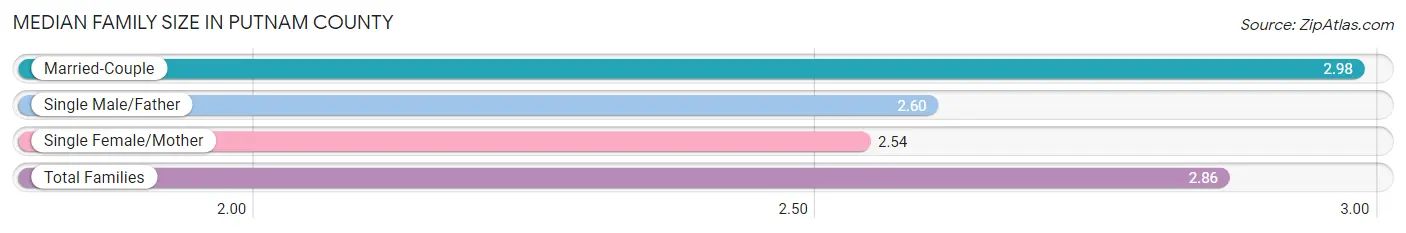
Median Family Size in Putnam County
The median family size in Putnam County is 2.86 persons per family, with married-couple families (14,922 | 72.6%) accounting for the largest median family size of 2.98 persons per family. On the other hand, single female/mother families (3,791 | 18.4%) represent the smallest median family size with 2.54 persons per family.
| Family Type | # Families | Family Size |
| Married-Couple | 14,922 (72.6%) | 2.98 |
| Single Male/Father | 1,841 (9.0%) | 2.60 |
| Single Female/Mother | 3,791 (18.4%) | 2.54 |
| Total Families | 20,554 (100.0%) | 2.86 |
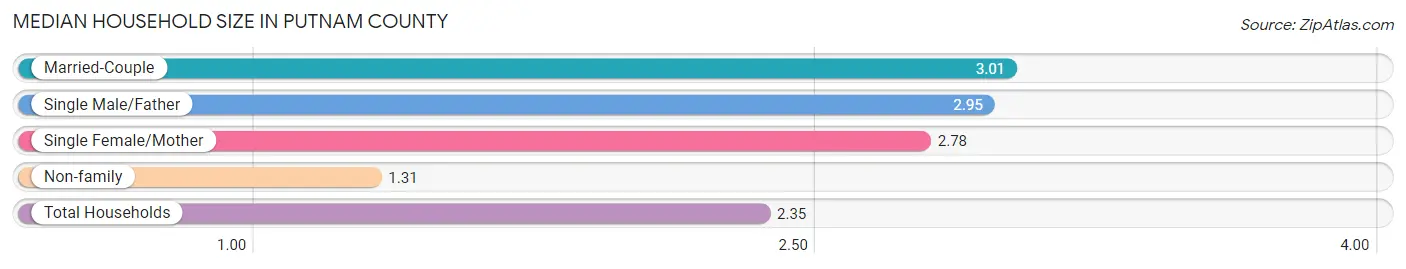
Median Household Size in Putnam County
The median household size in Putnam County is 2.35 persons per household, with married-couple households (14,922 | 45.6%) accounting for the largest median household size of 3.01 persons per household. non-family households (12,179 | 37.2%) represent the smallest median household size with 1.31 persons per household.
| Household Type | # Households | Household Size |
| Married-Couple | 14,922 (45.6%) | 3.01 |
| Single Male/Father | 1,841 (5.6%) | 2.95 |
| Single Female/Mother | 3,791 (11.6%) | 2.78 |
| Non-family | 12,179 (37.2%) | 1.31 |
| Total Households | 32,733 (100.0%) | 2.35 |
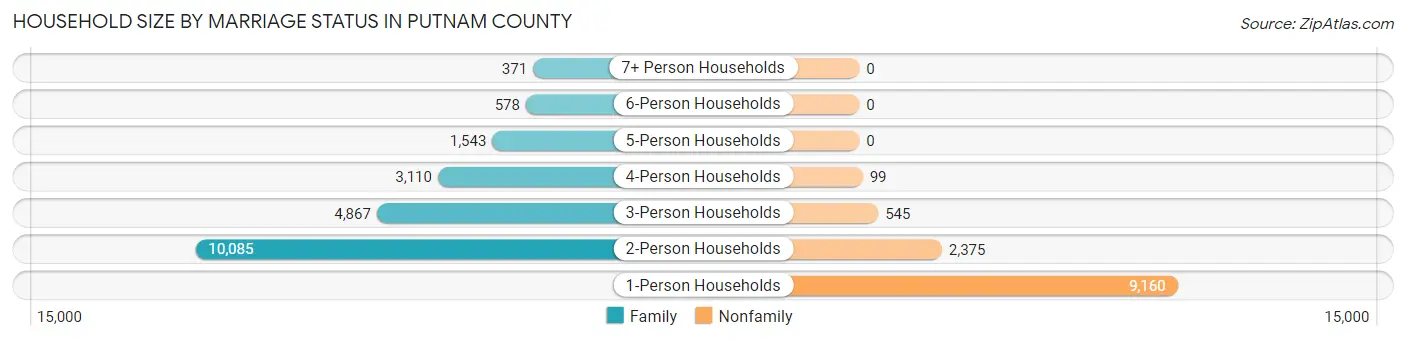
Household Size by Marriage Status in Putnam County
Out of a total of 32,733 households in Putnam County, 20,554 (62.8%) are family households, while 12,179 (37.2%) are nonfamily households. The most numerous type of family households are 2-person households, comprising 10,085, and the most common type of nonfamily households are 1-person households, comprising 9,160.
| Household Size | Family Households | Nonfamily Households |
| 1-Person Households | - | 9,160 (28.0%) |
| 2-Person Households | 10,085 (30.8%) | 2,375 (7.3%) |
| 3-Person Households | 4,867 (14.9%) | 545 (1.7%) |
| 4-Person Households | 3,110 (9.5%) | 99 (0.3%) |
| 5-Person Households | 1,543 (4.7%) | 0 (0.0%) |
| 6-Person Households | 578 (1.8%) | 0 (0.0%) |
| 7+ Person Households | 371 (1.1%) | 0 (0.0%) |
| Total | 20,554 (62.8%) | 12,179 (37.2%) |
Female Fertility in Putnam County
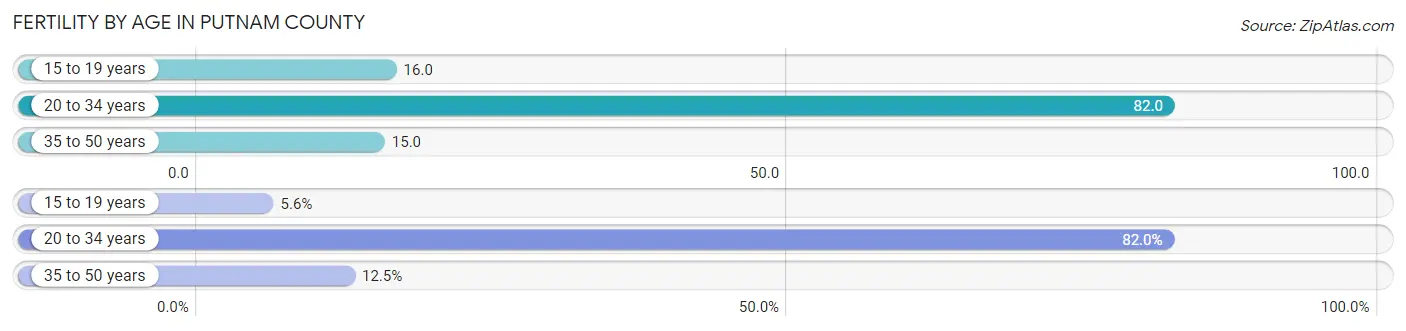
Fertility by Age in Putnam County
Average fertility rate in Putnam County is 46.0 births per 1,000 women. Women in the age bracket of 20 to 34 years have the highest fertility rate with 82.0 births per 1,000 women. Women in the age bracket of 20 to 34 years acount for 82.0% of all women with births.
| Age Bracket | Women with Births | Births / 1,000 Women |
| 15 to 19 years | 49 (5.6%) | 16.0 |
| 20 to 34 years | 723 (82.0%) | 82.0 |
| 35 to 50 years | 110 (12.5%) | 15.0 |
| Total | 882 (100.0%) | 46.0 |
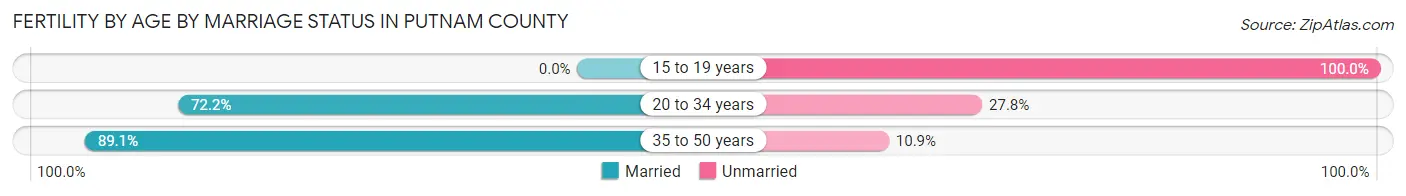
Fertility by Age by Marriage Status in Putnam County
70.3% of women with births (882) in Putnam County are married. The highest percentage of unmarried women with births falls into 15 to 19 years age bracket with 100.0% of them unmarried at the time of birth, while the lowest percentage of unmarried women with births belong to 35 to 50 years age bracket with 10.9% of them unmarried.
| Age Bracket | Married | Unmarried |
| 15 to 19 years | 0 (0.0%) | 49 (100.0%) |
| 20 to 34 years | 522 (72.2%) | 201 (27.8%) |
| 35 to 50 years | 98 (89.1%) | 12 (10.9%) |
| Total | 620 (70.3%) | 262 (29.7%) |
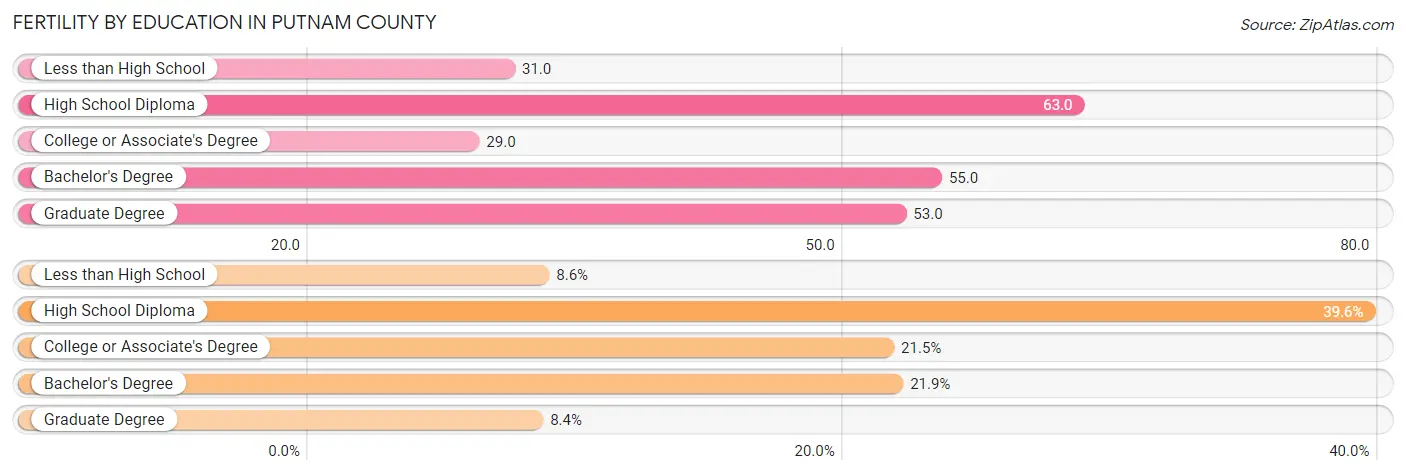
Fertility by Education in Putnam County
Average fertility rate in Putnam County is 46.0 births per 1,000 women. Women with the education attainment of high school diploma have the highest fertility rate of 63.0 births per 1,000 women, while women with the education attainment of college or associate's degree have the lowest fertility at 29.0 births per 1,000 women. Women with the education attainment of high school diploma represent 39.6% of all women with births.
| Educational Attainment | Women with Births | Births / 1,000 Women |
| Less than High School | 76 (8.6%) | 31.0 |
| High School Diploma | 349 (39.6%) | 63.0 |
| College or Associate's Degree | 190 (21.5%) | 29.0 |
| Bachelor's Degree | 193 (21.9%) | 55.0 |
| Graduate Degree | 74 (8.4%) | 53.0 |
| Total | 882 (100.0%) | 46.0 |
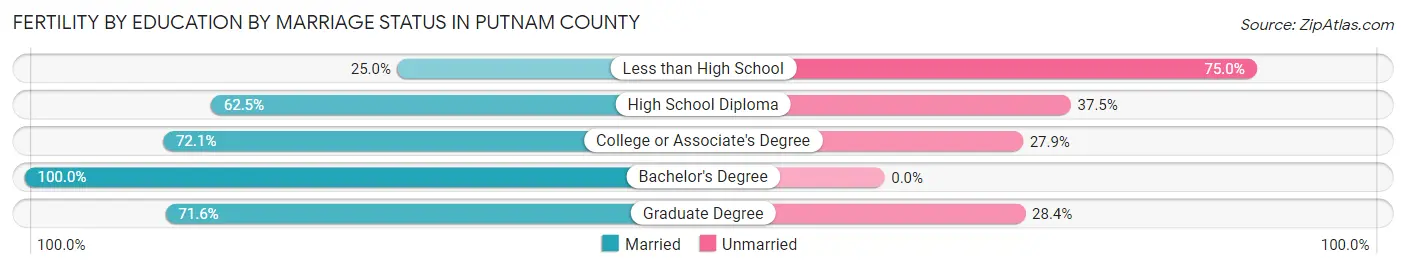
Fertility by Education by Marriage Status in Putnam County
29.7% of women with births in Putnam County are unmarried. Women with the educational attainment of bachelor's degree are most likely to be married with 100.0% of them married at childbirth, while women with the educational attainment of less than high school are least likely to be married with 75.0% of them unmarried at childbirth.
| Educational Attainment | Married | Unmarried |
| Less than High School | 19 (25.0%) | 57 (75.0%) |
| High School Diploma | 218 (62.5%) | 131 (37.5%) |
| College or Associate's Degree | 137 (72.1%) | 53 (27.9%) |
| Bachelor's Degree | 193 (100.0%) | 0 (0.0%) |
| Graduate Degree | 53 (71.6%) | 21 (28.4%) |
| Total | 620 (70.3%) | 262 (29.7%) |
Income in Putnam County
Income Overview in Putnam County
Per Capita Income in Putnam County is $29,419, while median incomes of families and households are $69,491 and $54,371 respectively.
| Characteristic | Number | Measure |
| Per Capita Income | 80,157 | $29,419 |
| Median Family Income | 20,554 | $69,491 |
| Mean Family Income | 20,554 | $86,798 |
| Median Household Income | 32,733 | $54,371 |
| Mean Household Income | 32,733 | $72,137 |
| Income Deficit | 20,554 | $10,710 |
| Wage / Income Gap (%) | 80,157 | 21.34% |
| Wage / Income Gap ($) | 80,157 | 78.66¢ per $1 |
| Gini / Inequality Index | 80,157 | 0.45 |
Earnings by Sex in Putnam County
Average Earnings in Putnam County are $33,049, $36,744 for men and $28,902 for women, a difference of 21.3%.
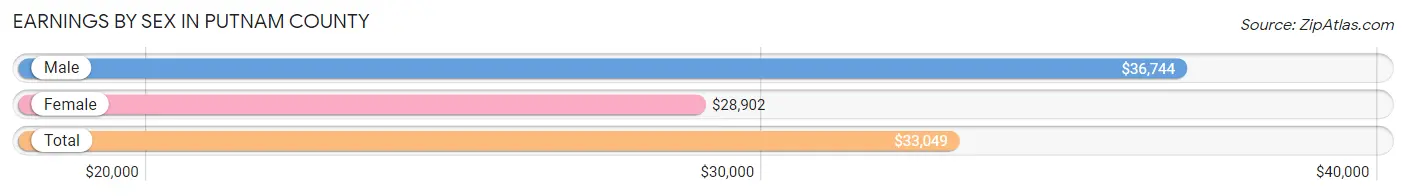
| Sex | Number | Average Earnings |
| Male | 22,727 (54.5%) | $36,744 |
| Female | 18,972 (45.5%) | $28,902 |
| Total | 41,699 (100.0%) | $33,049 |
Earnings by Sex by Income Bracket in Putnam County
The most common earnings brackets in Putnam County are $100,000+ for men (2,376 | 10.4%) and $30,000 to $34,999 for women (1,783 | 9.4%).
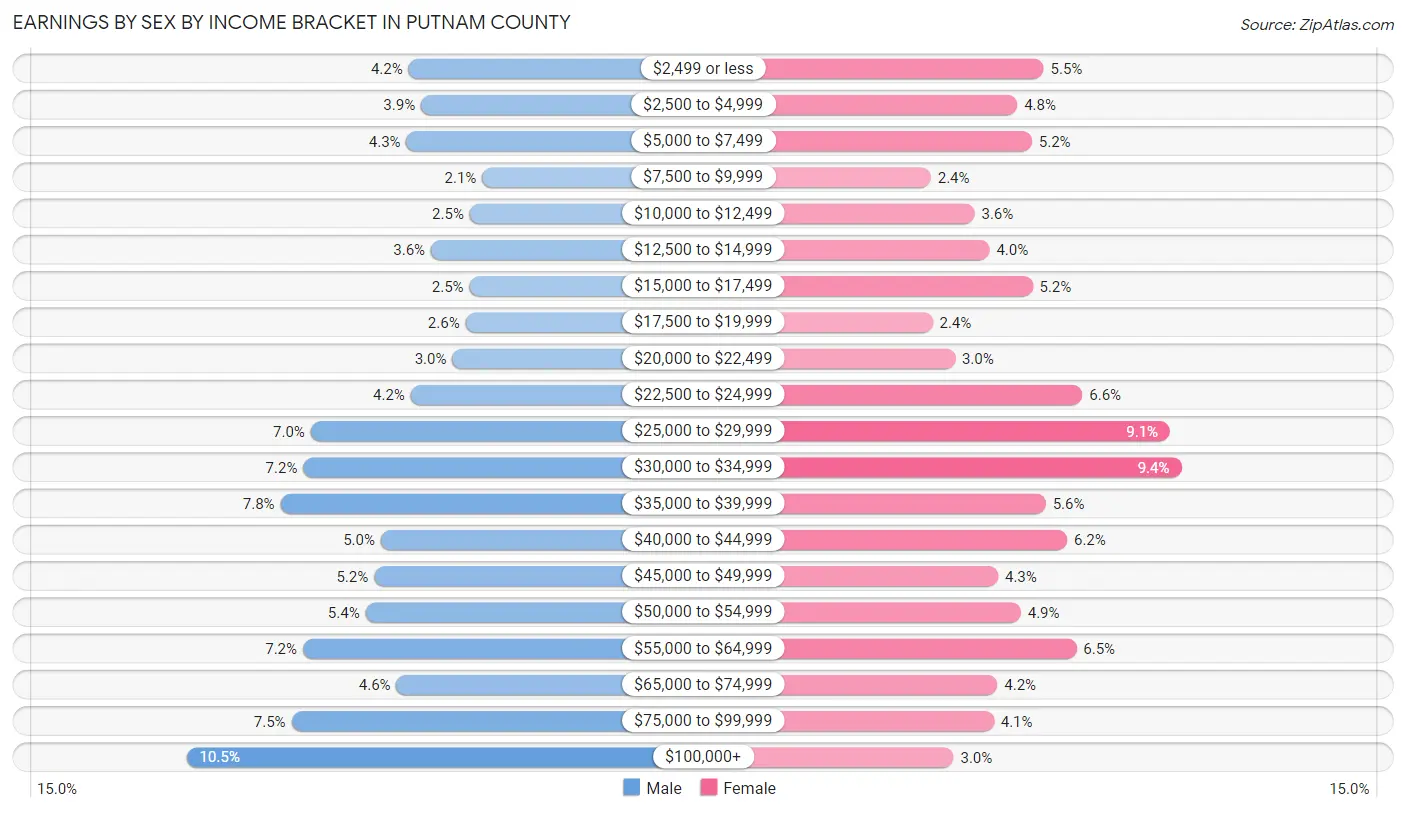
| Income | Male | Female |
| $2,499 or less | 957 (4.2%) | 1,050 (5.5%) |
| $2,500 to $4,999 | 878 (3.9%) | 908 (4.8%) |
| $5,000 to $7,499 | 970 (4.3%) | 987 (5.2%) |
| $7,500 to $9,999 | 486 (2.1%) | 448 (2.4%) |
| $10,000 to $12,499 | 565 (2.5%) | 682 (3.6%) |
| $12,500 to $14,999 | 814 (3.6%) | 761 (4.0%) |
| $15,000 to $17,499 | 569 (2.5%) | 990 (5.2%) |
| $17,500 to $19,999 | 593 (2.6%) | 458 (2.4%) |
| $20,000 to $22,499 | 677 (3.0%) | 576 (3.0%) |
| $22,500 to $24,999 | 943 (4.2%) | 1,256 (6.6%) |
| $25,000 to $29,999 | 1,582 (7.0%) | 1,723 (9.1%) |
| $30,000 to $34,999 | 1,630 (7.2%) | 1,783 (9.4%) |
| $35,000 to $39,999 | 1,776 (7.8%) | 1,060 (5.6%) |
| $40,000 to $44,999 | 1,133 (5.0%) | 1,175 (6.2%) |
| $45,000 to $49,999 | 1,177 (5.2%) | 806 (4.3%) |
| $50,000 to $54,999 | 1,231 (5.4%) | 928 (4.9%) |
| $55,000 to $64,999 | 1,631 (7.2%) | 1,224 (6.5%) |
| $65,000 to $74,999 | 1,034 (4.5%) | 803 (4.2%) |
| $75,000 to $99,999 | 1,705 (7.5%) | 784 (4.1%) |
| $100,000+ | 2,376 (10.4%) | 570 (3.0%) |
| Total | 22,727 (100.0%) | 18,972 (100.0%) |
Earnings by Sex by Educational Attainment in Putnam County
Average earnings in Putnam County are $44,769 for men and $34,559 for women, a difference of 22.8%. Men with an educational attainment of graduate degree enjoy the highest average annual earnings of $92,454, while those with less than high school education earn the least with $26,984. Women with an educational attainment of graduate degree earn the most with the average annual earnings of $51,014, while those with less than high school education have the smallest earnings of $23,233.
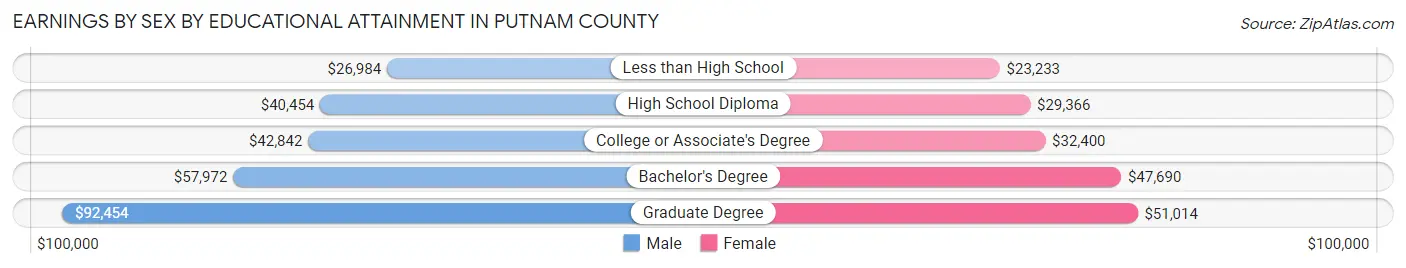
| Educational Attainment | Male Income | Female Income |
| Less than High School | $26,984 | $23,233 |
| High School Diploma | $40,454 | $29,366 |
| College or Associate's Degree | $42,842 | $32,400 |
| Bachelor's Degree | $57,972 | $47,690 |
| Graduate Degree | $92,454 | $51,014 |
| Total | $44,769 | $34,559 |
Family Income in Putnam County
Family Income Brackets in Putnam County
According to the Putnam County family income data, there are 4,357 families falling into the $50,000 to $74,999 income range, which is the most common income bracket and makes up 21.2% of all families. Conversely, the $10,000 to $14,999 income bracket is the least frequent group with only 534 families (2.6%) belonging to this category.
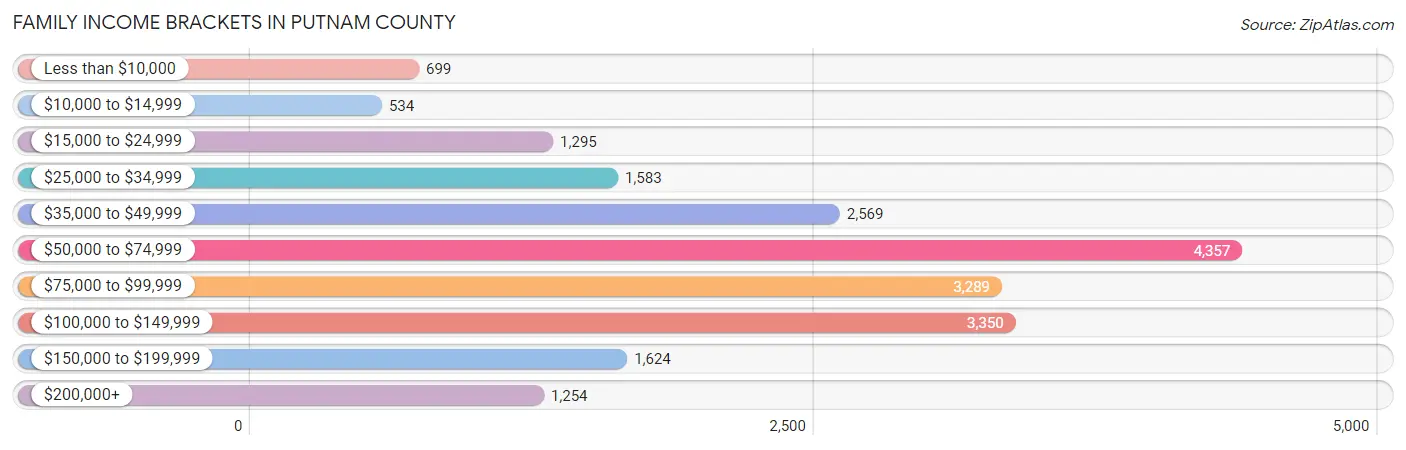
| Income Bracket | # Families | % Families |
| Less than $10,000 | 699 | 3.4% |
| $10,000 to $14,999 | 534 | 2.6% |
| $15,000 to $24,999 | 1,295 | 6.3% |
| $25,000 to $34,999 | 1,583 | 7.7% |
| $35,000 to $49,999 | 2,569 | 12.5% |
| $50,000 to $74,999 | 4,357 | 21.2% |
| $75,000 to $99,999 | 3,289 | 16.0% |
| $100,000 to $149,999 | 3,350 | 16.3% |
| $150,000 to $199,999 | 1,624 | 7.9% |
| $200,000+ | 1,254 | 6.1% |
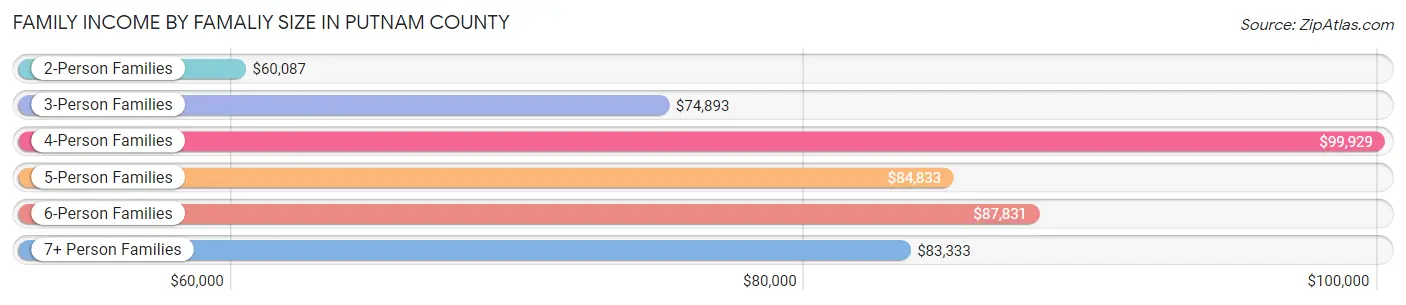
Family Income by Famaliy Size in Putnam County
4-person families (2,910 | 14.2%) account for the highest median family income in Putnam County with $99,929 per family, while 2-person families (10,925 | 53.1%) have the highest median income of $30,044 per family member.
| Income Bracket | # Families | Median Income |
| 2-Person Families | 10,925 (53.1%) | $60,087 |
| 3-Person Families | 4,496 (21.9%) | $74,893 |
| 4-Person Families | 2,910 (14.2%) | $99,929 |
| 5-Person Families | 1,344 (6.5%) | $84,833 |
| 6-Person Families | 625 (3.0%) | $87,831 |
| 7+ Person Families | 254 (1.2%) | $83,333 |
| Total | 20,554 (100.0%) | $69,491 |
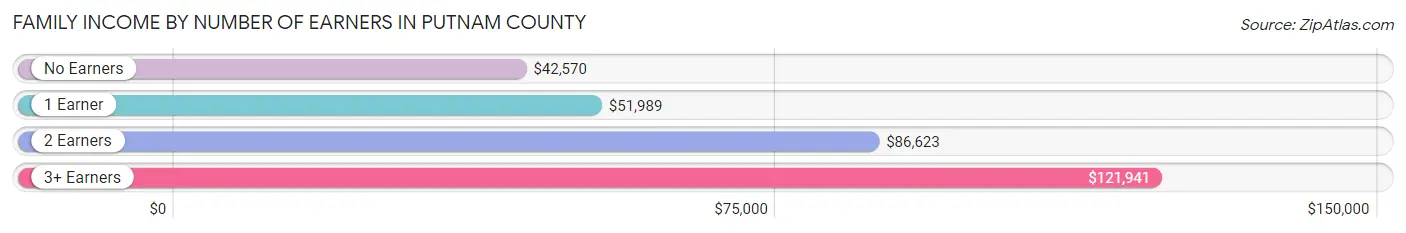
Family Income by Number of Earners in Putnam County
The median family income in Putnam County is $69,491, with families comprising 3+ earners (1,877) having the highest median family income of $121,941, while families with no earners (3,622) have the lowest median family income of $42,570, accounting for 9.1% and 17.6% of families, respectively.
| Number of Earners | # Families | Median Income |
| No Earners | 3,622 (17.6%) | $42,570 |
| 1 Earner | 7,311 (35.6%) | $51,989 |
| 2 Earners | 7,744 (37.7%) | $86,623 |
| 3+ Earners | 1,877 (9.1%) | $121,941 |
| Total | 20,554 (100.0%) | $69,491 |
Household Income in Putnam County
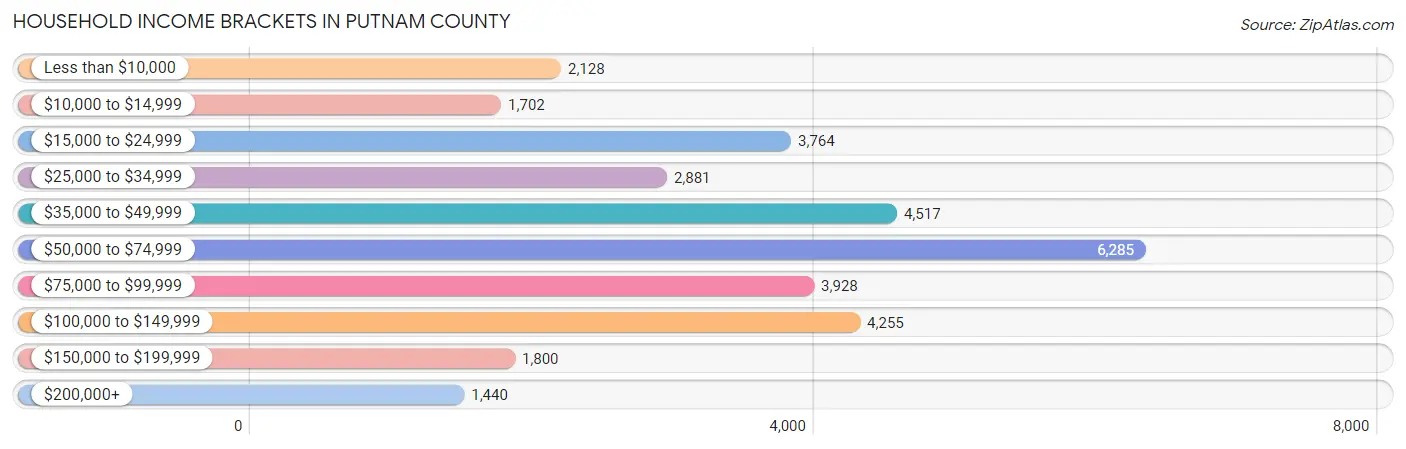
Household Income Brackets in Putnam County
With 6,285 households falling in the category, the $50,000 to $74,999 income range is the most frequent in Putnam County, accounting for 19.2% of all households. In contrast, only 1,440 households (4.4%) fall into the $200,000+ income bracket, making it the least populous group.
| Income Bracket | # Households | % Households |
| Less than $10,000 | 2,128 | 6.5% |
| $10,000 to $14,999 | 1,702 | 5.2% |
| $15,000 to $24,999 | 3,764 | 11.5% |
| $25,000 to $34,999 | 2,881 | 8.8% |
| $35,000 to $49,999 | 4,517 | 13.8% |
| $50,000 to $74,999 | 6,285 | 19.2% |
| $75,000 to $99,999 | 3,928 | 12.0% |
| $100,000 to $149,999 | 4,255 | 13.0% |
| $150,000 to $199,999 | 1,800 | 5.5% |
| $200,000+ | 1,440 | 4.4% |
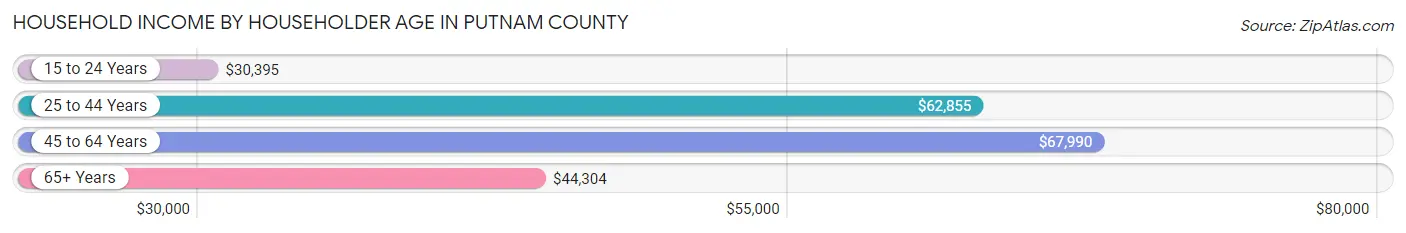
Household Income by Householder Age in Putnam County
The median household income in Putnam County is $54,371, with the highest median household income of $67,990 found in the 45 to 64 years age bracket for the primary householder. A total of 10,820 households (33.1%) fall into this category. Meanwhile, the 15 to 24 years age bracket for the primary householder has the lowest median household income of $30,395, with 3,503 households (10.7%) in this group.
| Income Bracket | # Households | Median Income |
| 15 to 24 Years | 3,503 (10.7%) | $30,395 |
| 25 to 44 Years | 10,169 (31.1%) | $62,855 |
| 45 to 64 Years | 10,820 (33.1%) | $67,990 |
| 65+ Years | 8,241 (25.2%) | $44,304 |
| Total | 32,733 (100.0%) | $54,371 |
Poverty in Putnam County
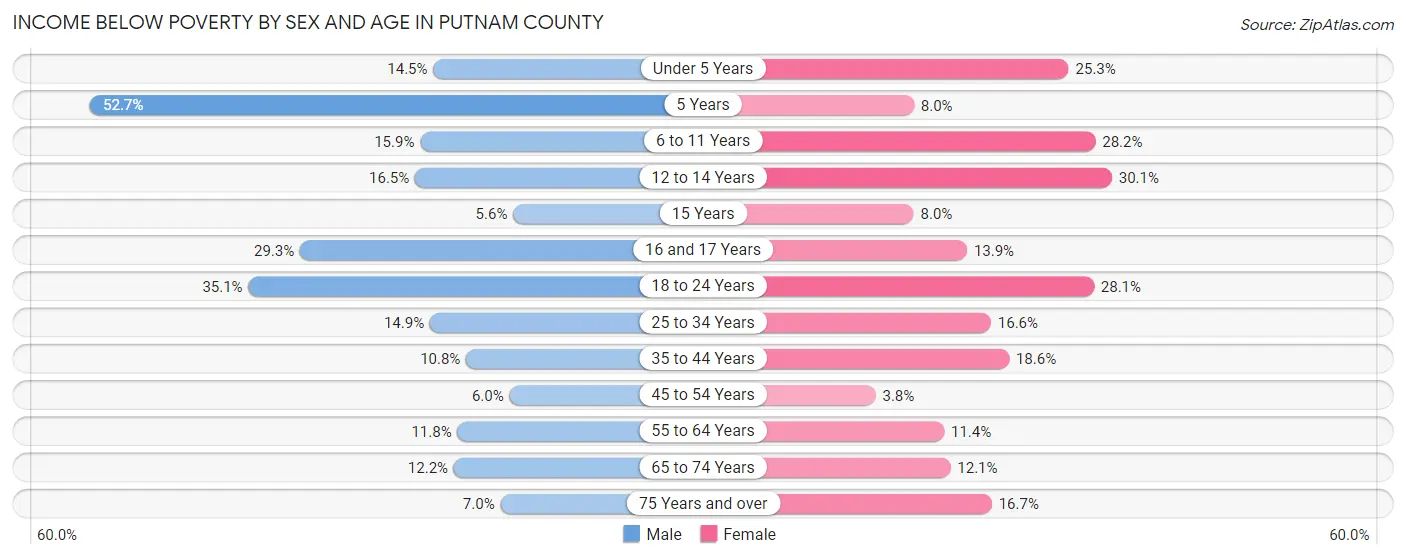
Income Below Poverty by Sex and Age in Putnam County
With 15.8% poverty level for males and 16.8% for females among the residents of Putnam County, 5 year old males and 12 to 14 year old females are the most vulnerable to poverty, with 234 males (52.7%) and 366 females (30.1%) in their respective age groups living below the poverty level.
| Age Bracket | Male | Female |
| Under 5 Years | 308 (14.5%) | 551 (25.3%) |
| 5 Years | 234 (52.7%) | 40 (8.0%) |
| 6 to 11 Years | 419 (15.9%) | 791 (28.2%) |
| 12 to 14 Years | 210 (16.5%) | 366 (30.1%) |
| 15 Years | 22 (5.6%) | 38 (8.0%) |
| 16 and 17 Years | 290 (29.3%) | 143 (13.9%) |
| 18 to 24 Years | 1,810 (35.1%) | 1,217 (28.1%) |
| 25 to 34 Years | 818 (14.8%) | 815 (16.6%) |
| 35 to 44 Years | 492 (10.8%) | 812 (18.6%) |
| 45 to 54 Years | 275 (6.0%) | 184 (3.8%) |
| 55 to 64 Years | 539 (11.8%) | 565 (11.4%) |
| 65 to 74 Years | 426 (12.2%) | 500 (12.1%) |
| 75 Years and over | 151 (7.0%) | 481 (16.7%) |
| Total | 5,994 (15.8%) | 6,503 (16.8%) |
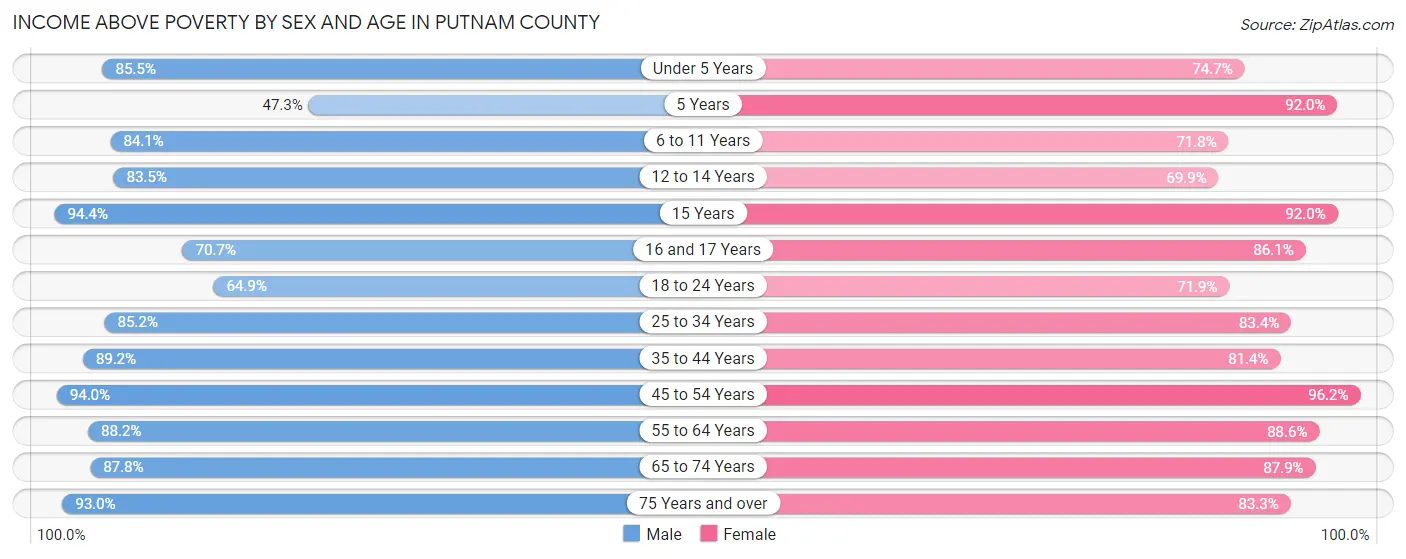
Income Above Poverty by Sex and Age in Putnam County
According to the poverty statistics in Putnam County, males aged 15 years and females aged 45 to 54 years are the age groups that are most secure financially, with 94.4% of males and 96.2% of females in these age groups living above the poverty line.
| Age Bracket | Male | Female |
| Under 5 Years | 1,819 (85.5%) | 1,630 (74.7%) |
| 5 Years | 210 (47.3%) | 459 (92.0%) |
| 6 to 11 Years | 2,209 (84.1%) | 2,011 (71.8%) |
| 12 to 14 Years | 1,062 (83.5%) | 851 (69.9%) |
| 15 Years | 372 (94.4%) | 437 (92.0%) |
| 16 and 17 Years | 699 (70.7%) | 883 (86.1%) |
| 18 to 24 Years | 3,351 (64.9%) | 3,119 (71.9%) |
| 25 to 34 Years | 4,692 (85.2%) | 4,096 (83.4%) |
| 35 to 44 Years | 4,057 (89.2%) | 3,550 (81.4%) |
| 45 to 54 Years | 4,315 (94.0%) | 4,711 (96.2%) |
| 55 to 64 Years | 4,033 (88.2%) | 4,396 (88.6%) |
| 65 to 74 Years | 3,069 (87.8%) | 3,635 (87.9%) |
| 75 Years and over | 2,006 (93.0%) | 2,399 (83.3%) |
| Total | 31,894 (84.2%) | 32,177 (83.2%) |
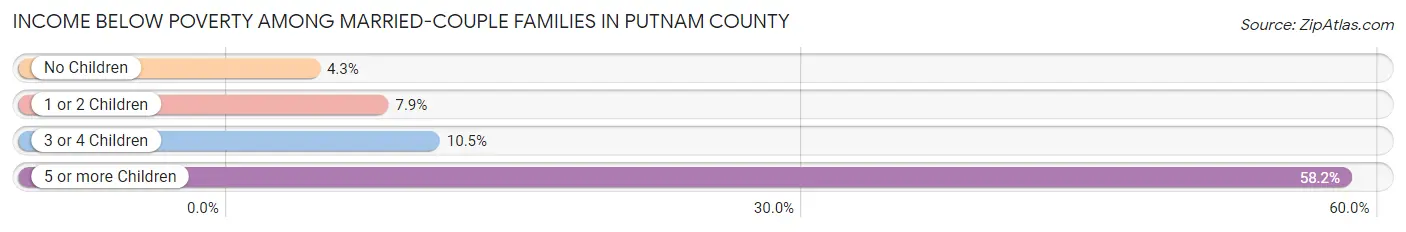
Income Below Poverty Among Married-Couple Families in Putnam County
The poverty statistics for married-couple families in Putnam County show that 6.3% or 940 of the total 14,922 families live below the poverty line. Families with 5 or more children have the highest poverty rate of 58.2%, comprising of 89 families. On the other hand, families with no children have the lowest poverty rate of 4.3%, which includes 409 families.
| Children | Above Poverty | Below Poverty |
| No Children | 9,141 (95.7%) | 409 (4.3%) |
| 1 or 2 Children | 3,716 (92.1%) | 317 (7.9%) |
| 3 or 4 Children | 1,061 (89.5%) | 125 (10.5%) |
| 5 or more Children | 64 (41.8%) | 89 (58.2%) |
| Total | 13,982 (93.7%) | 940 (6.3%) |
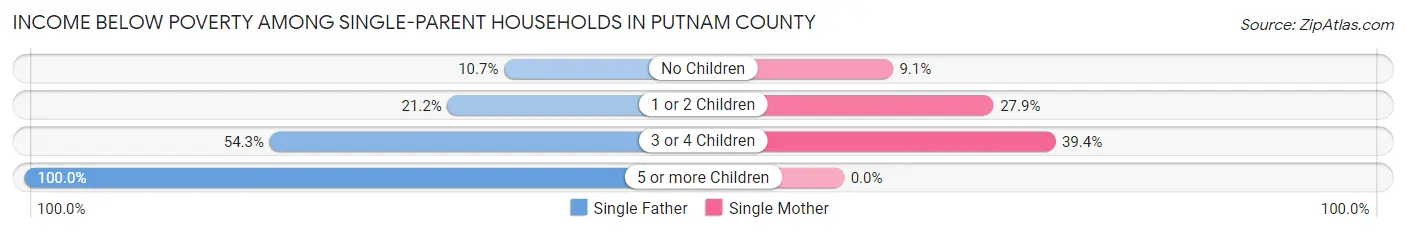
Income Below Poverty Among Single-Parent Households in Putnam County
According to the poverty data in Putnam County, 20.5% or 378 single-father households and 21.2% or 804 single-mother households are living below the poverty line. Among single-father households, those with 5 or more children have the highest poverty rate, with 29 households (100.0%) experiencing poverty. Likewise, among single-mother households, those with 3 or 4 children have the highest poverty rate, with 98 households (39.4%) falling below the poverty line.
| Children | Single Father | Single Mother |
| No Children | 78 (10.7%) | 136 (9.1%) |
| 1 or 2 Children | 202 (21.2%) | 570 (27.9%) |
| 3 or 4 Children | 69 (54.3%) | 98 (39.4%) |
| 5 or more Children | 29 (100.0%) | 0 (0.0%) |
| Total | 378 (20.5%) | 804 (21.2%) |
Income Below Poverty Among Married-Couple vs Single-Parent Households in Putnam County
The poverty data for Putnam County shows that 940 of the married-couple family households (6.3%) and 1,182 of the single-parent households (21.0%) are living below the poverty level. Within the married-couple family households, those with 5 or more children have the highest poverty rate, with 89 households (58.2%) falling below the poverty line. Among the single-parent households, those with 5 or more children have the highest poverty rate, with 29 household (100.0%) living below poverty.
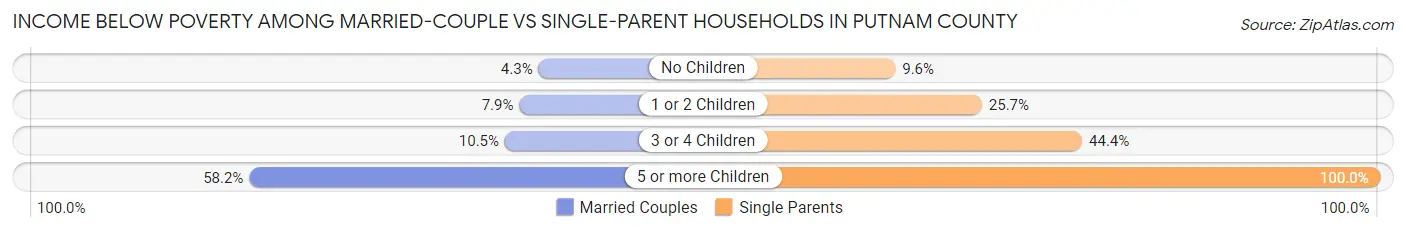
| Children | Married-Couple Families | Single-Parent Households |
| No Children | 409 (4.3%) | 214 (9.6%) |
| 1 or 2 Children | 317 (7.9%) | 772 (25.7%) |
| 3 or 4 Children | 125 (10.5%) | 167 (44.4%) |
| 5 or more Children | 89 (58.2%) | 29 (100.0%) |
| Total | 940 (6.3%) | 1,182 (21.0%) |
Employment Characteristics in Putnam County
Employment by Class of Employer in Putnam County
Among the 37,665 employed individuals in Putnam County, private company employees (26,323 | 69.9%), self-employed (not incorporated) (3,013 | 8.0%), and local government employees (2,982 | 7.9%) make up the most common classes of employment.
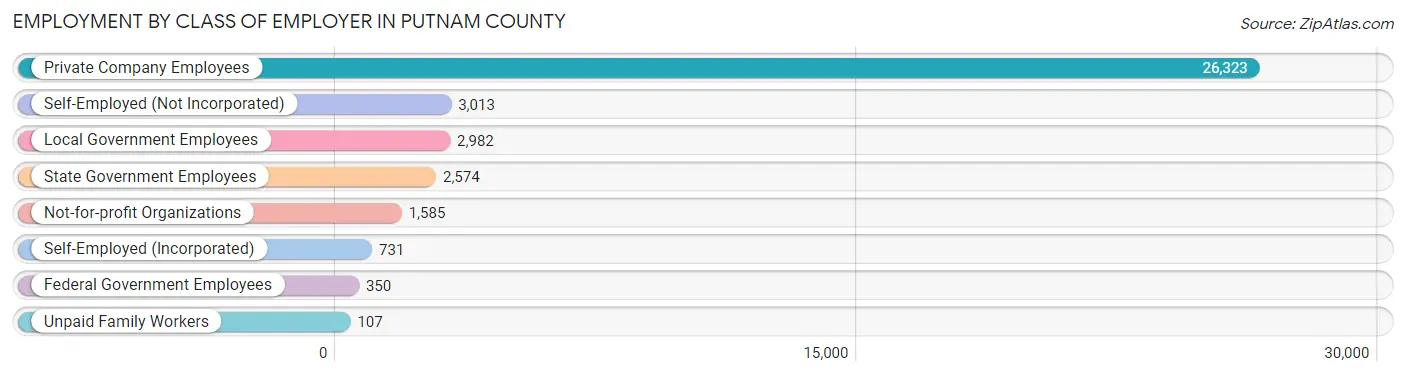
| Employer Class | # Employees | % Employees |
| Private Company Employees | 26,323 | 69.9% |
| Self-Employed (Incorporated) | 731 | 1.9% |
| Self-Employed (Not Incorporated) | 3,013 | 8.0% |
| Not-for-profit Organizations | 1,585 | 4.2% |
| Local Government Employees | 2,982 | 7.9% |
| State Government Employees | 2,574 | 6.8% |
| Federal Government Employees | 350 | 0.9% |
| Unpaid Family Workers | 107 | 0.3% |
| Total | 37,665 | 100.0% |
Employment Status by Age in Putnam County
According to the labor force statistics for Putnam County, out of the total population over 16 years of age (65,684), 61.0% or 40,067 individuals are in the labor force, with 4.5% or 1,803 of them unemployed. The age group with the highest labor force participation rate is 25 to 29 years, with 86.1% or 4,792 individuals in the labor force. Within the labor force, the 16 to 19 years age range has the highest percentage of unemployed individuals, with 14.9% or 380 of them being unemployed.
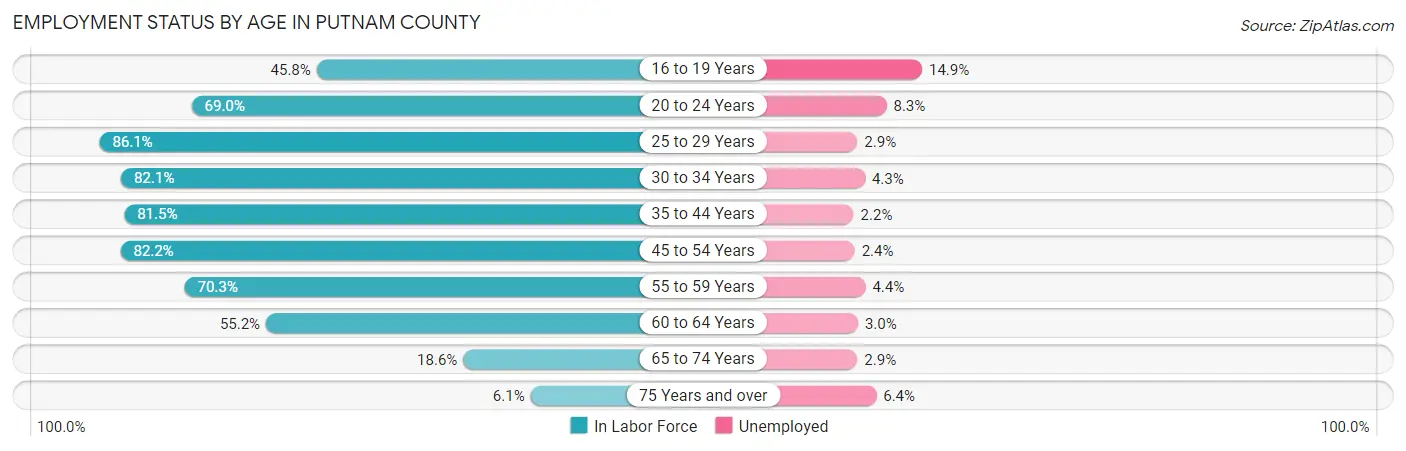
| Age Bracket | In Labor Force | Unemployed |
| 16 to 19 Years | 2,553 (45.8%) | 380 (14.9%) |
| 20 to 24 Years | 5,826 (69.0%) | 484 (8.3%) |
| 25 to 29 Years | 4,792 (86.1%) | 139 (2.9%) |
| 30 to 34 Years | 4,063 (82.1%) | 175 (4.3%) |
| 35 to 44 Years | 7,316 (81.5%) | 161 (2.2%) |
| 45 to 54 Years | 7,833 (82.2%) | 188 (2.4%) |
| 55 to 59 Years | 2,958 (70.3%) | 130 (4.4%) |
| 60 to 64 Years | 2,953 (55.2%) | 89 (3.0%) |
| 65 to 74 Years | 1,433 (18.6%) | 42 (2.9%) |
| 75 Years and over | 329 (6.1%) | 21 (6.4%) |
| Total | 40,067 (61.0%) | 1,803 (4.5%) |
Employment Status by Educational Attainment in Putnam County
According to labor force statistics for Putnam County, 77.5% of individuals (29,899) out of the total population between 25 and 64 years of age (38,579) are in the labor force, with 3.0% or 897 of them being unemployed. The group with the highest labor force participation rate are those with the educational attainment of bachelor's degree or higher, with 84.3% or 9,419 individuals in the labor force. Within the labor force, individuals with less than high school education have the highest percentage of unemployment, with 4.3% or 91 of them being unemployed.
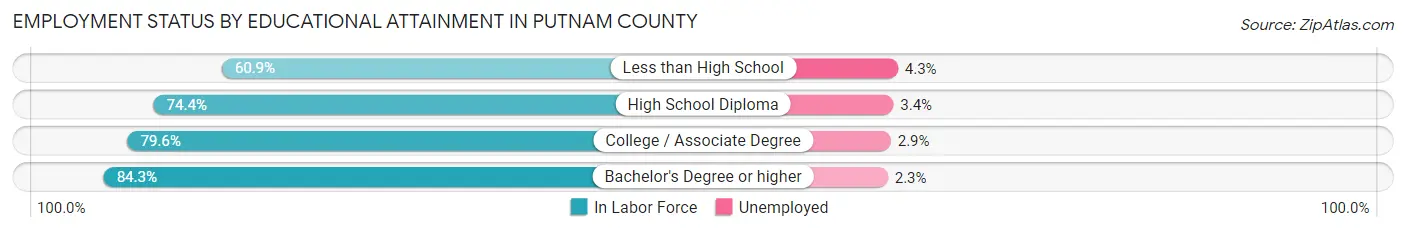
| Educational Attainment | In Labor Force | Unemployed |
| Less than High School | 2,114 (60.9%) | 149 (4.3%) |
| High School Diploma | 9,609 (74.4%) | 439 (3.4%) |
| College / Associate Degree | 8,772 (79.6%) | 320 (2.9%) |
| Bachelor's Degree or higher | 9,419 (84.3%) | 257 (2.3%) |
| Total | 29,899 (77.5%) | 1,157 (3.0%) |
Employment Occupations by Sex in Putnam County
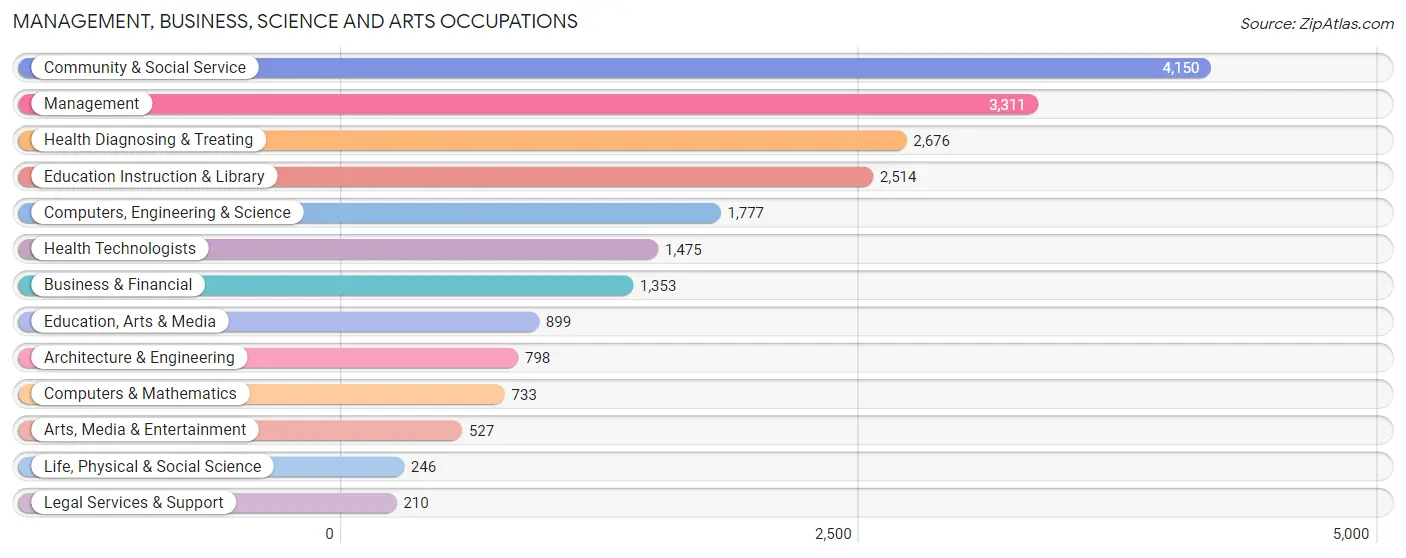
Management, Business, Science and Arts Occupations
The most common Management, Business, Science and Arts occupations in Putnam County are Community & Social Service (4,150 | 10.9%), Management (3,311 | 8.7%), Health Diagnosing & Treating (2,676 | 7.0%), Education Instruction & Library (2,514 | 6.6%), and Computers, Engineering & Science (1,777 | 4.7%).
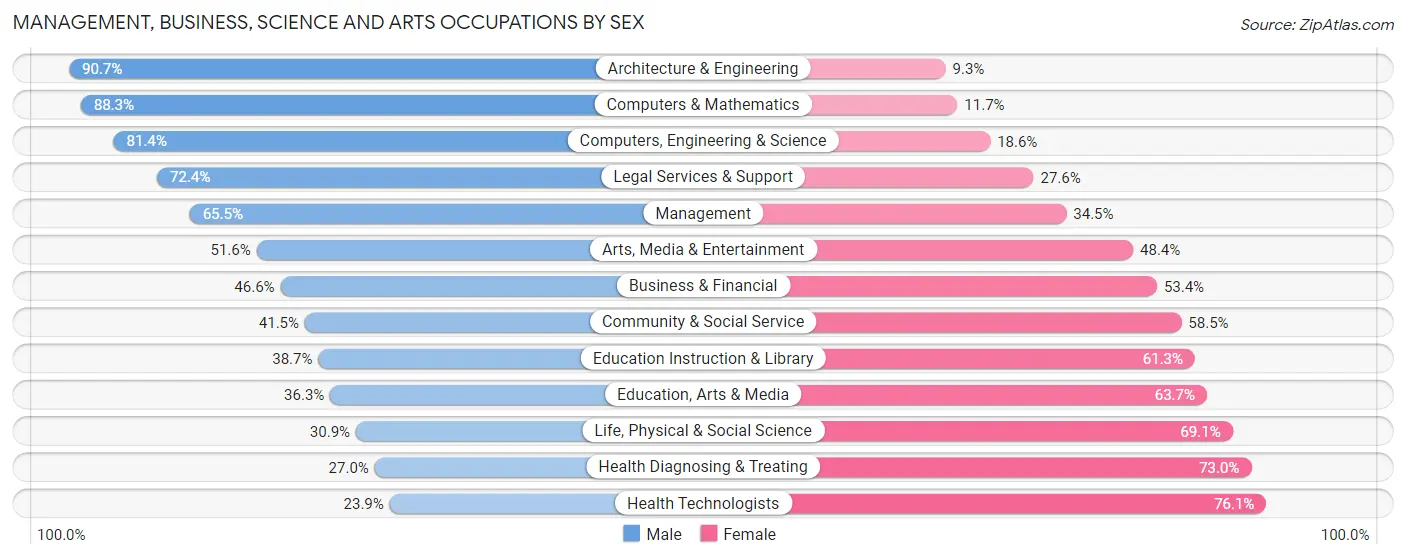
Management, Business, Science and Arts Occupations by Sex
Within the Management, Business, Science and Arts occupations in Putnam County, the most male-oriented occupations are Architecture & Engineering (90.7%), Computers & Mathematics (88.3%), and Computers, Engineering & Science (81.4%), while the most female-oriented occupations are Health Technologists (76.1%), Health Diagnosing & Treating (73.0%), and Life, Physical & Social Science (69.1%).
| Occupation | Male | Female |
| Management | 2,170 (65.5%) | 1,141 (34.5%) |
| Business & Financial | 631 (46.6%) | 722 (53.4%) |
| Computers, Engineering & Science | 1,447 (81.4%) | 330 (18.6%) |
| Computers & Mathematics | 647 (88.3%) | 86 (11.7%) |
| Architecture & Engineering | 724 (90.7%) | 74 (9.3%) |
| Life, Physical & Social Science | 76 (30.9%) | 170 (69.1%) |
| Community & Social Service | 1,724 (41.5%) | 2,426 (58.5%) |
| Education, Arts & Media | 326 (36.3%) | 573 (63.7%) |
| Legal Services & Support | 152 (72.4%) | 58 (27.6%) |
| Education Instruction & Library | 974 (38.7%) | 1,540 (61.3%) |
| Arts, Media & Entertainment | 272 (51.6%) | 255 (48.4%) |
| Health Diagnosing & Treating | 722 (27.0%) | 1,954 (73.0%) |
| Health Technologists | 352 (23.9%) | 1,123 (76.1%) |
| Total (Category) | 6,694 (50.5%) | 6,573 (49.5%) |
| Total (Overall) | 20,739 (54.5%) | 17,321 (45.5%) |
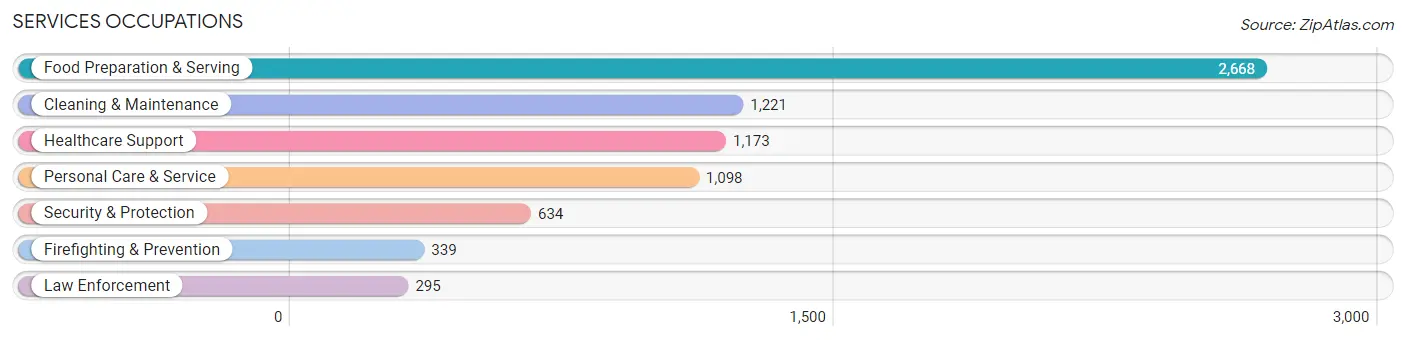
Services Occupations
The most common Services occupations in Putnam County are Food Preparation & Serving (2,668 | 7.0%), Cleaning & Maintenance (1,221 | 3.2%), Healthcare Support (1,173 | 3.1%), Personal Care & Service (1,098 | 2.9%), and Security & Protection (634 | 1.7%).
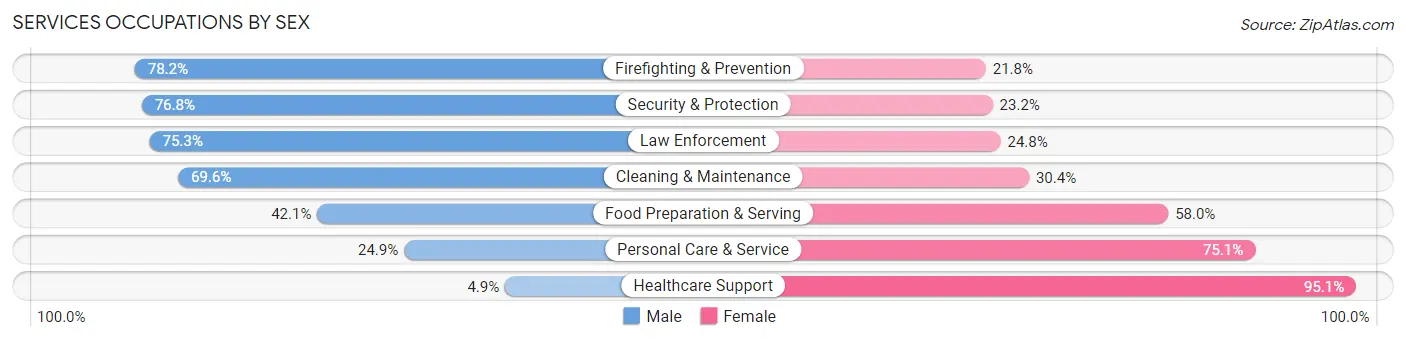
Services Occupations by Sex
Within the Services occupations in Putnam County, the most male-oriented occupations are Firefighting & Prevention (78.2%), Security & Protection (76.8%), and Law Enforcement (75.2%), while the most female-oriented occupations are Healthcare Support (95.1%), Personal Care & Service (75.1%), and Food Preparation & Serving (58.0%).
| Occupation | Male | Female |
| Healthcare Support | 57 (4.9%) | 1,116 (95.1%) |
| Security & Protection | 487 (76.8%) | 147 (23.2%) |
| Firefighting & Prevention | 265 (78.2%) | 74 (21.8%) |
| Law Enforcement | 222 (75.2%) | 73 (24.7%) |
| Food Preparation & Serving | 1,122 (42.0%) | 1,546 (58.0%) |
| Cleaning & Maintenance | 850 (69.6%) | 371 (30.4%) |
| Personal Care & Service | 273 (24.9%) | 825 (75.1%) |
| Total (Category) | 2,789 (41.0%) | 4,005 (59.0%) |
| Total (Overall) | 20,739 (54.5%) | 17,321 (45.5%) |
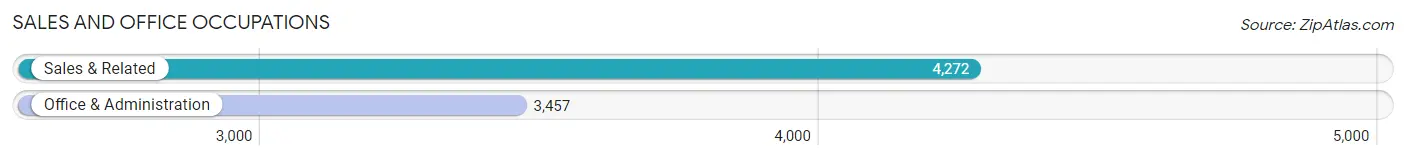
Sales and Office Occupations
The most common Sales and Office occupations in Putnam County are Sales & Related (4,272 | 11.2%), and Office & Administration (3,457 | 9.1%).
Sales and Office Occupations by Sex
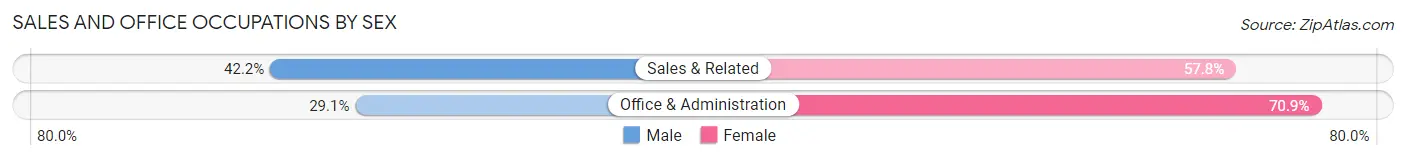
| Occupation | Male | Female |
| Sales & Related | 1,804 (42.2%) | 2,468 (57.8%) |
| Office & Administration | 1,007 (29.1%) | 2,450 (70.9%) |
| Total (Category) | 2,811 (36.4%) | 4,918 (63.6%) |
| Total (Overall) | 20,739 (54.5%) | 17,321 (45.5%) |
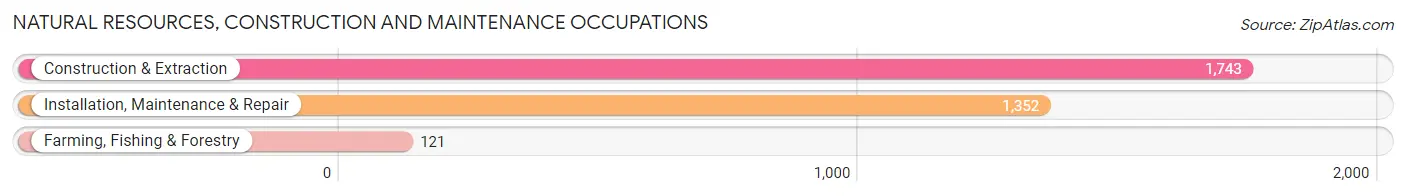
Natural Resources, Construction and Maintenance Occupations
The most common Natural Resources, Construction and Maintenance occupations in Putnam County are Construction & Extraction (1,743 | 4.6%), Installation, Maintenance & Repair (1,352 | 3.5%), and Farming, Fishing & Forestry (121 | 0.3%).
Natural Resources, Construction and Maintenance Occupations by Sex
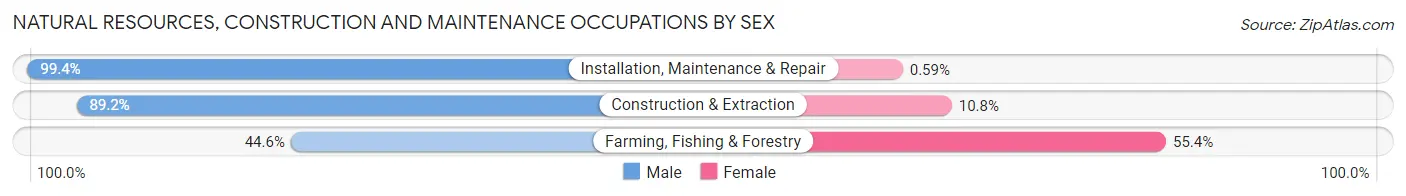
| Occupation | Male | Female |
| Farming, Fishing & Forestry | 54 (44.6%) | 67 (55.4%) |
| Construction & Extraction | 1,555 (89.2%) | 188 (10.8%) |
| Installation, Maintenance & Repair | 1,344 (99.4%) | 8 (0.6%) |
| Total (Category) | 2,953 (91.8%) | 263 (8.2%) |
| Total (Overall) | 20,739 (54.5%) | 17,321 (45.5%) |
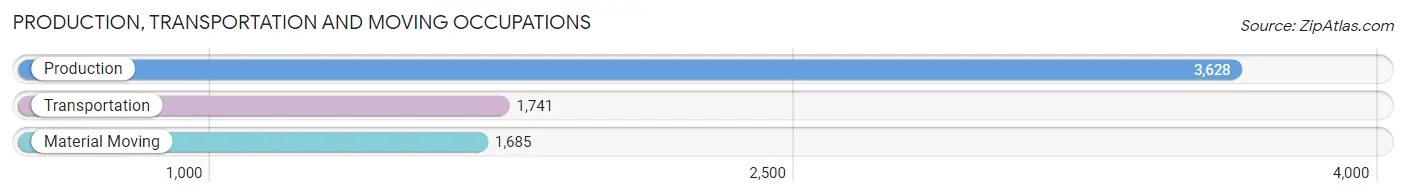
Production, Transportation and Moving Occupations
The most common Production, Transportation and Moving occupations in Putnam County are Production (3,628 | 9.5%), Transportation (1,741 | 4.6%), and Material Moving (1,685 | 4.4%).
Production, Transportation and Moving Occupations by Sex
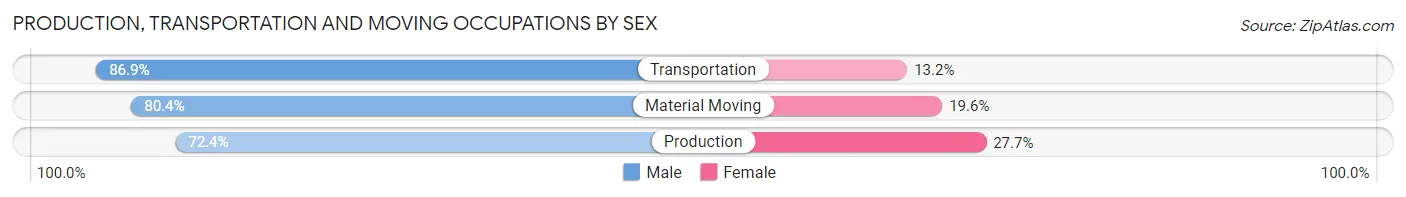
| Occupation | Male | Female |
| Production | 2,625 (72.4%) | 1,003 (27.7%) |
| Transportation | 1,512 (86.9%) | 229 (13.2%) |
| Material Moving | 1,355 (80.4%) | 330 (19.6%) |
| Total (Category) | 5,492 (77.9%) | 1,562 (22.1%) |
| Total (Overall) | 20,739 (54.5%) | 17,321 (45.5%) |
Employment Industries by Sex in Putnam County
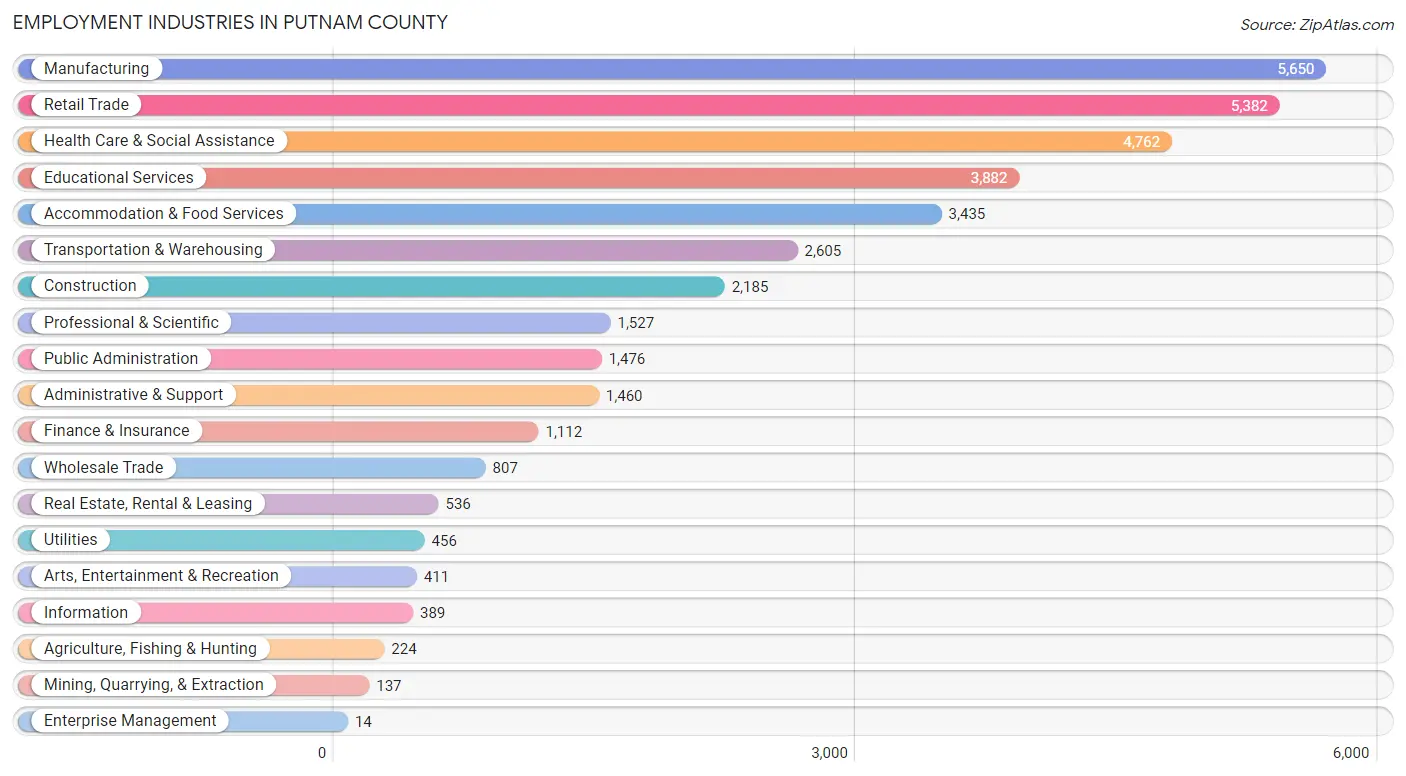
Employment Industries in Putnam County
The major employment industries in Putnam County include Manufacturing (5,650 | 14.8%), Retail Trade (5,382 | 14.1%), Health Care & Social Assistance (4,762 | 12.5%), Educational Services (3,882 | 10.2%), and Accommodation & Food Services (3,435 | 9.0%).
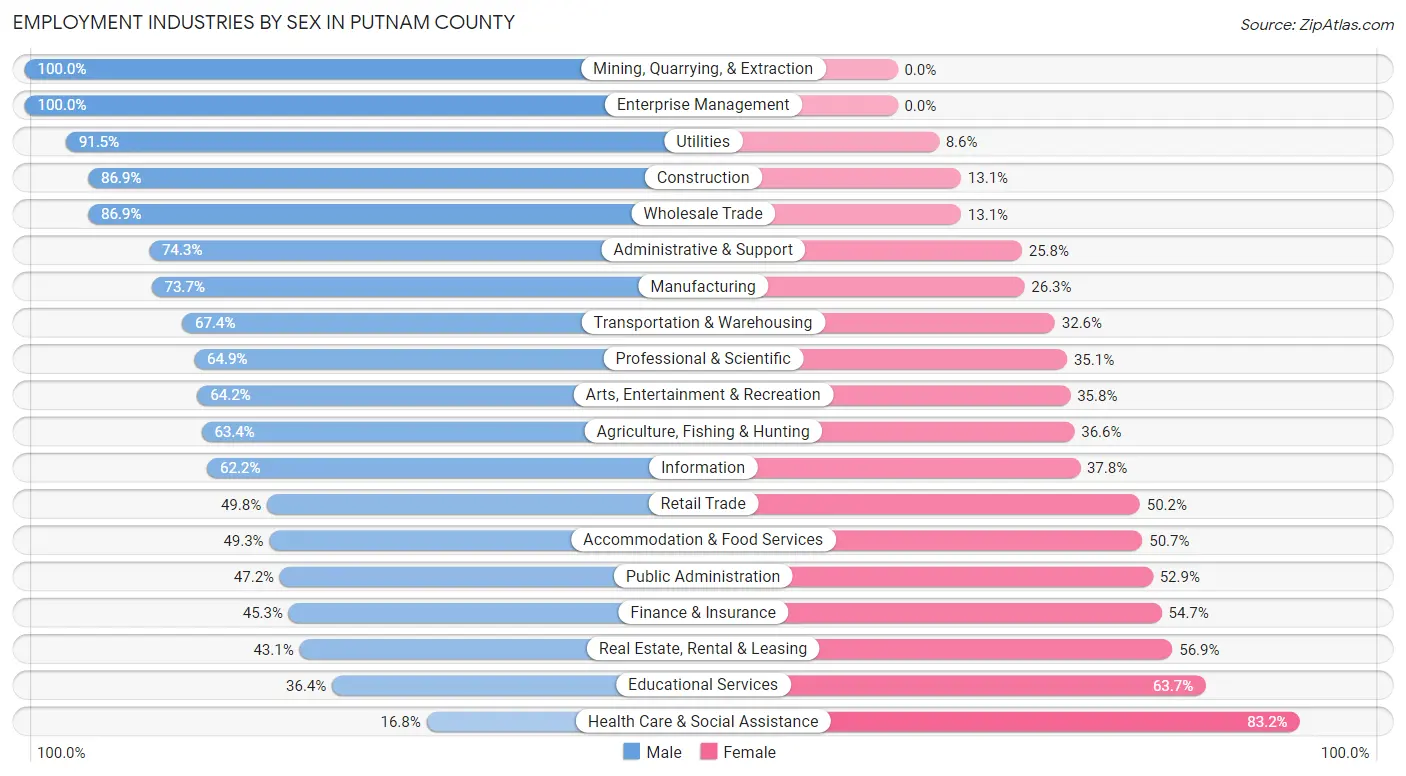
Employment Industries by Sex in Putnam County
The Putnam County industries that see more men than women are Mining, Quarrying, & Extraction (100.0%), Enterprise Management (100.0%), and Utilities (91.4%), whereas the industries that tend to have a higher number of women are Health Care & Social Assistance (83.2%), Educational Services (63.6%), and Real Estate, Rental & Leasing (56.9%).
| Industry | Male | Female |
| Agriculture, Fishing & Hunting | 142 (63.4%) | 82 (36.6%) |
| Mining, Quarrying, & Extraction | 137 (100.0%) | 0 (0.0%) |
| Construction | 1,898 (86.9%) | 287 (13.1%) |
| Manufacturing | 4,165 (73.7%) | 1,485 (26.3%) |
| Wholesale Trade | 701 (86.9%) | 106 (13.1%) |
| Retail Trade | 2,682 (49.8%) | 2,700 (50.2%) |
| Transportation & Warehousing | 1,756 (67.4%) | 849 (32.6%) |
| Utilities | 417 (91.4%) | 39 (8.6%) |
| Information | 242 (62.2%) | 147 (37.8%) |
| Finance & Insurance | 504 (45.3%) | 608 (54.7%) |
| Real Estate, Rental & Leasing | 231 (43.1%) | 305 (56.9%) |
| Professional & Scientific | 991 (64.9%) | 536 (35.1%) |
| Enterprise Management | 14 (100.0%) | 0 (0.0%) |
| Administrative & Support | 1,084 (74.3%) | 376 (25.8%) |
| Educational Services | 1,411 (36.3%) | 2,471 (63.6%) |
| Health Care & Social Assistance | 800 (16.8%) | 3,962 (83.2%) |
| Arts, Entertainment & Recreation | 264 (64.2%) | 147 (35.8%) |
| Accommodation & Food Services | 1,694 (49.3%) | 1,741 (50.7%) |
| Public Administration | 696 (47.1%) | 780 (52.8%) |
| Total | 20,739 (54.5%) | 17,321 (45.5%) |
Education in Putnam County
School Enrollment in Putnam County
The most common levels of schooling among the 21,924 students in Putnam County are college / undergraduate (8,068 | 36.8%), elementary school (3,810 | 17.4%), and high school (3,667 | 16.7%).
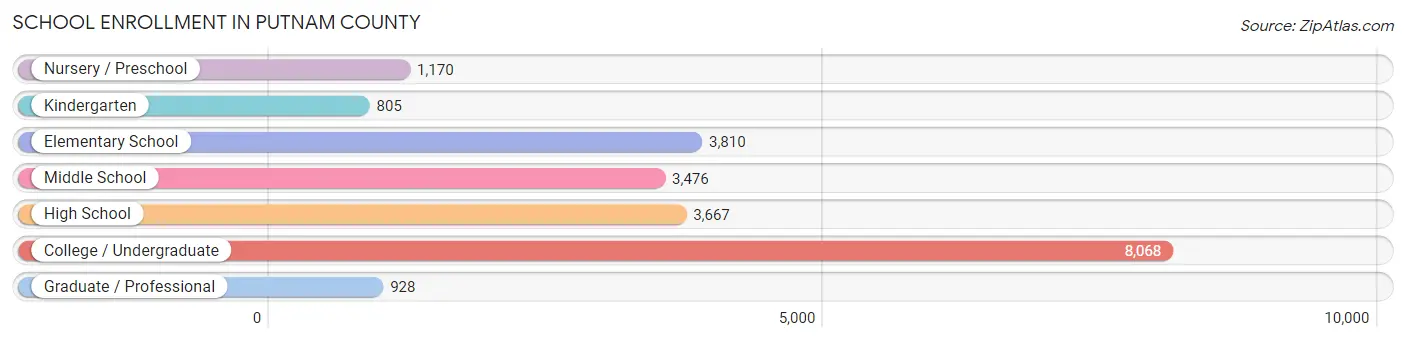
| School Level | # Students | % Students |
| Nursery / Preschool | 1,170 | 5.3% |
| Kindergarten | 805 | 3.7% |
| Elementary School | 3,810 | 17.4% |
| Middle School | 3,476 | 15.9% |
| High School | 3,667 | 16.7% |
| College / Undergraduate | 8,068 | 36.8% |
| Graduate / Professional | 928 | 4.2% |
| Total | 21,924 | 100.0% |
School Enrollment by Age by Funding Source in Putnam County
Out of a total of 21,924 students who are enrolled in schools in Putnam County, 2,587 (11.8%) attend a private institution, while the remaining 19,337 (88.2%) are enrolled in public schools. The age group of 18 to 19 year olds has the highest likelihood of being enrolled in private schools, with 553 (18.4% in the age bracket) enrolled. Conversely, the age group of 20 to 24 year olds has the lowest likelihood of being enrolled in a private school, with 4,465 (94.8% in the age bracket) attending a public institution.
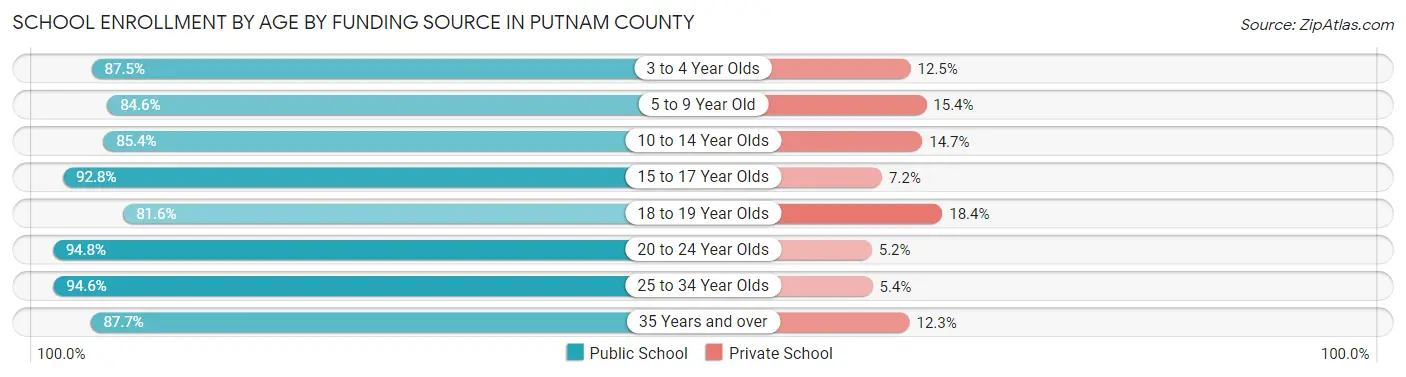
| Age Bracket | Public School | Private School |
| 3 to 4 Year Olds | 674 (87.5%) | 96 (12.5%) |
| 5 to 9 Year Old | 3,768 (84.6%) | 686 (15.4%) |
| 10 to 14 Year Olds | 3,838 (85.4%) | 659 (14.6%) |
| 15 to 17 Year Olds | 2,601 (92.8%) | 201 (7.2%) |
| 18 to 19 Year Olds | 2,457 (81.6%) | 553 (18.4%) |
| 20 to 24 Year Olds | 4,465 (94.8%) | 247 (5.2%) |
| 25 to 34 Year Olds | 864 (94.6%) | 49 (5.4%) |
| 35 Years and over | 672 (87.7%) | 94 (12.3%) |
| Total | 19,337 (88.2%) | 2,587 (11.8%) |
Educational Attainment by Field of Study in Putnam County
Business (3,355 | 22.2%), education (2,605 | 17.2%), science & technology (1,457 | 9.6%), arts & humanities (1,319 | 8.7%), and engineering (1,091 | 7.2%) are the most common fields of study among 15,138 individuals in Putnam County who have obtained a bachelor's degree or higher.
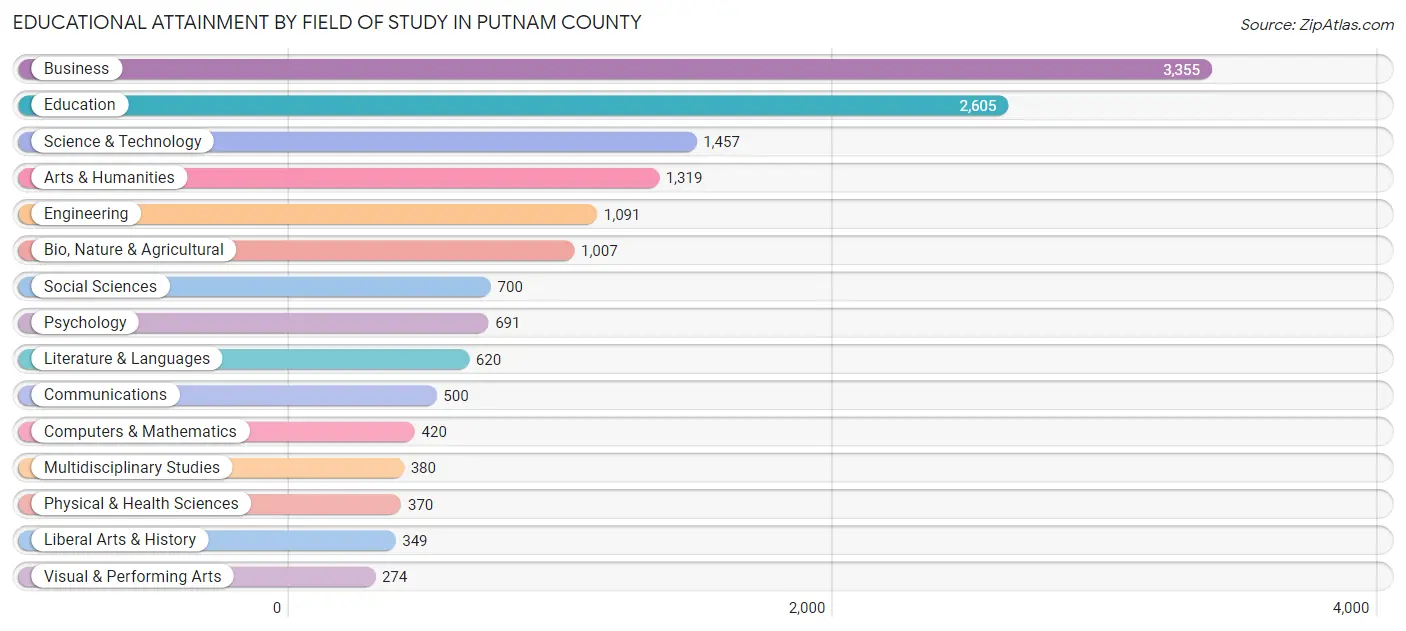
| Field of Study | # Graduates | % Graduates |
| Computers & Mathematics | 420 | 2.8% |
| Bio, Nature & Agricultural | 1,007 | 6.7% |
| Physical & Health Sciences | 370 | 2.4% |
| Psychology | 691 | 4.6% |
| Social Sciences | 700 | 4.6% |
| Engineering | 1,091 | 7.2% |
| Multidisciplinary Studies | 380 | 2.5% |
| Science & Technology | 1,457 | 9.6% |
| Business | 3,355 | 22.2% |
| Education | 2,605 | 17.2% |
| Literature & Languages | 620 | 4.1% |
| Liberal Arts & History | 349 | 2.3% |
| Visual & Performing Arts | 274 | 1.8% |
| Communications | 500 | 3.3% |
| Arts & Humanities | 1,319 | 8.7% |
| Total | 15,138 | 100.0% |
Transportation & Commute in Putnam County
Vehicle Availability by Sex in Putnam County
The most prevalent vehicle ownership categories in Putnam County are males with 2 vehicles (8,488, accounting for 41.7%) and females with 2 vehicles (6,755, making up 50.3%).
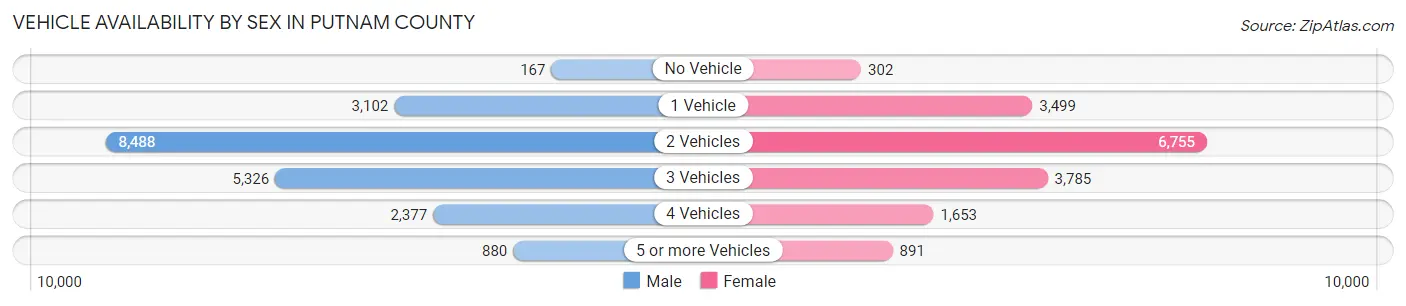
| Vehicles Available | Male | Female |
| No Vehicle | 167 (0.8%) | 302 (1.8%) |
| 1 Vehicle | 3,102 (15.2%) | 3,499 (20.7%) |
| 2 Vehicles | 8,488 (41.7%) | 6,755 (40.0%) |
| 3 Vehicles | 5,326 (26.2%) | 3,785 (22.4%) |
| 4 Vehicles | 2,377 (11.7%) | 1,653 (9.8%) |
| 5 or more Vehicles | 880 (4.3%) | 891 (5.3%) |
| Total | 20,340 (100.0%) | 16,885 (100.0%) |
Commute Time in Putnam County
The most frequently occuring commute durations in Putnam County are 15 to 19 minutes (7,859 commuters, 22.3%), 10 to 14 minutes (7,289 commuters, 20.7%), and 30 to 34 minutes (4,767 commuters, 13.6%).
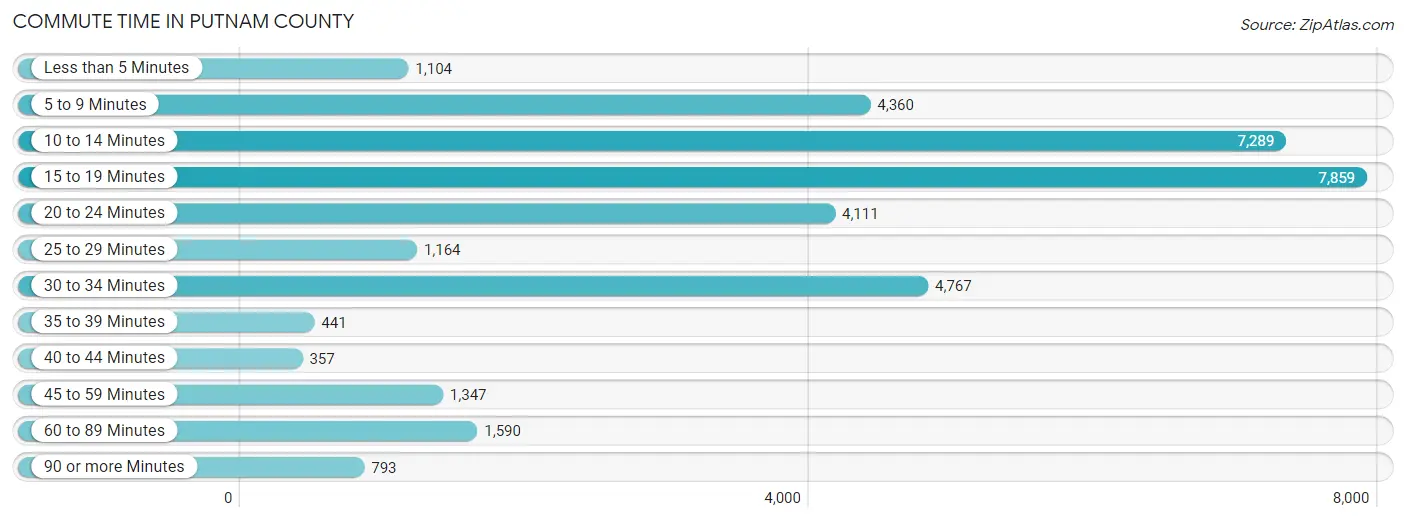
| Commute Time | # Commuters | % Commuters |
| Less than 5 Minutes | 1,104 | 3.1% |
| 5 to 9 Minutes | 4,360 | 12.4% |
| 10 to 14 Minutes | 7,289 | 20.7% |
| 15 to 19 Minutes | 7,859 | 22.3% |
| 20 to 24 Minutes | 4,111 | 11.7% |
| 25 to 29 Minutes | 1,164 | 3.3% |
| 30 to 34 Minutes | 4,767 | 13.6% |
| 35 to 39 Minutes | 441 | 1.3% |
| 40 to 44 Minutes | 357 | 1.0% |
| 45 to 59 Minutes | 1,347 | 3.8% |
| 60 to 89 Minutes | 1,590 | 4.5% |
| 90 or more Minutes | 793 | 2.2% |
Commute Time by Sex in Putnam County
The most common commute times in Putnam County are 15 to 19 minutes (3,758 commuters, 19.3%) for males and 15 to 19 minutes (4,101 commuters, 26.1%) for females.
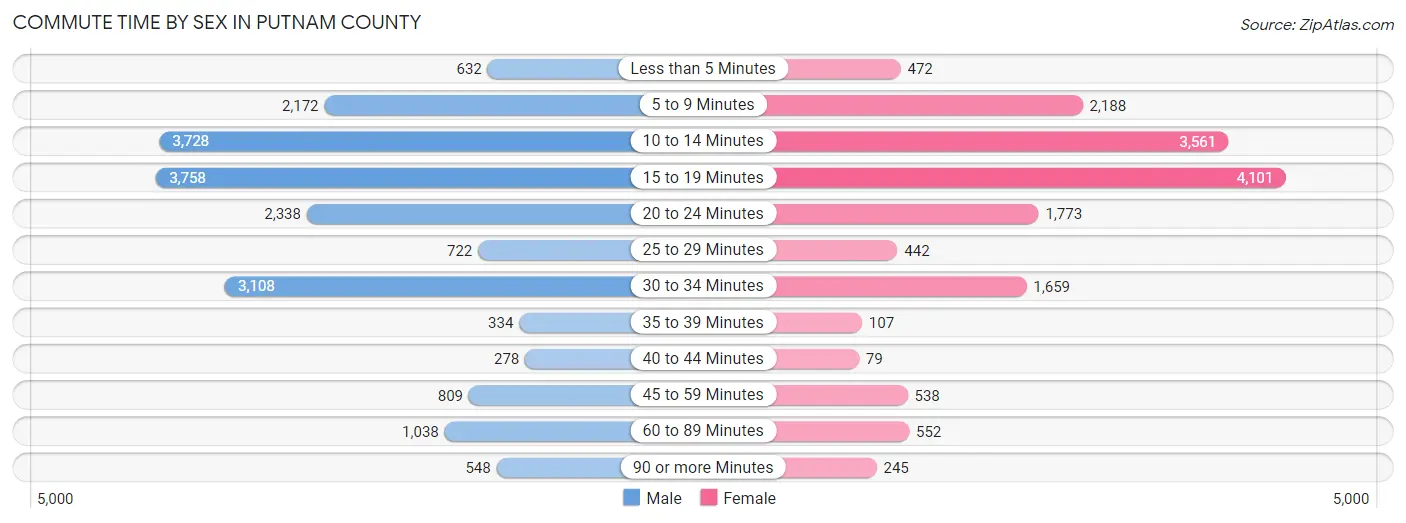
| Commute Time | Male | Female |
| Less than 5 Minutes | 632 (3.3%) | 472 (3.0%) |
| 5 to 9 Minutes | 2,172 (11.2%) | 2,188 (13.9%) |
| 10 to 14 Minutes | 3,728 (19.2%) | 3,561 (22.7%) |
| 15 to 19 Minutes | 3,758 (19.3%) | 4,101 (26.1%) |
| 20 to 24 Minutes | 2,338 (12.0%) | 1,773 (11.3%) |
| 25 to 29 Minutes | 722 (3.7%) | 442 (2.8%) |
| 30 to 34 Minutes | 3,108 (16.0%) | 1,659 (10.6%) |
| 35 to 39 Minutes | 334 (1.7%) | 107 (0.7%) |
| 40 to 44 Minutes | 278 (1.4%) | 79 (0.5%) |
| 45 to 59 Minutes | 809 (4.2%) | 538 (3.4%) |
| 60 to 89 Minutes | 1,038 (5.3%) | 552 (3.5%) |
| 90 or more Minutes | 548 (2.8%) | 245 (1.6%) |
Time of Departure to Work by Sex in Putnam County
The most frequent times of departure to work in Putnam County are 7:30 AM to 7:59 AM (2,751, 14.1%) for males and 7:30 AM to 7:59 AM (2,647, 16.8%) for females.
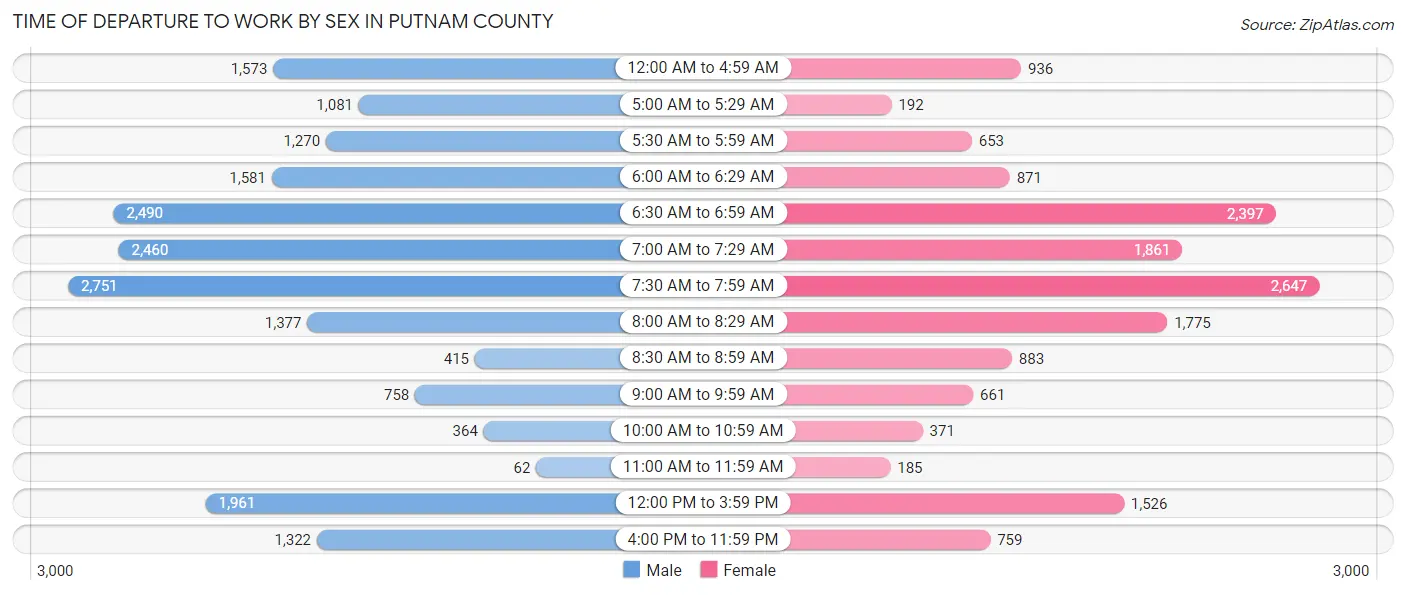
| Time of Departure | Male | Female |
| 12:00 AM to 4:59 AM | 1,573 (8.1%) | 936 (6.0%) |
| 5:00 AM to 5:29 AM | 1,081 (5.6%) | 192 (1.2%) |
| 5:30 AM to 5:59 AM | 1,270 (6.5%) | 653 (4.2%) |
| 6:00 AM to 6:29 AM | 1,581 (8.1%) | 871 (5.5%) |
| 6:30 AM to 6:59 AM | 2,490 (12.8%) | 2,397 (15.2%) |
| 7:00 AM to 7:29 AM | 2,460 (12.6%) | 1,861 (11.8%) |
| 7:30 AM to 7:59 AM | 2,751 (14.1%) | 2,647 (16.8%) |
| 8:00 AM to 8:29 AM | 1,377 (7.1%) | 1,775 (11.3%) |
| 8:30 AM to 8:59 AM | 415 (2.1%) | 883 (5.6%) |
| 9:00 AM to 9:59 AM | 758 (3.9%) | 661 (4.2%) |
| 10:00 AM to 10:59 AM | 364 (1.9%) | 371 (2.4%) |
| 11:00 AM to 11:59 AM | 62 (0.3%) | 185 (1.2%) |
| 12:00 PM to 3:59 PM | 1,961 (10.1%) | 1,526 (9.7%) |
| 4:00 PM to 11:59 PM | 1,322 (6.8%) | 759 (4.8%) |
| Total | 19,465 (100.0%) | 15,717 (100.0%) |
Housing Occupancy in Putnam County
Occupancy by Ownership in Putnam County
Of the total 32,733 dwellings in Putnam County, owner-occupied units account for 19,930 (60.9%), while renter-occupied units make up 12,803 (39.1%).
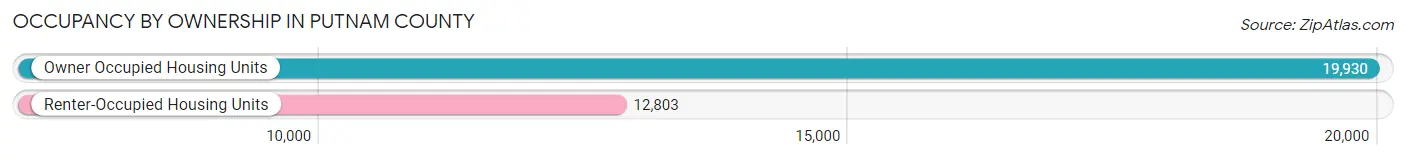
| Occupancy | # Housing Units | % Housing Units |
| Owner Occupied Housing Units | 19,930 | 60.9% |
| Renter-Occupied Housing Units | 12,803 | 39.1% |
| Total Occupied Housing Units | 32,733 | 100.0% |
Occupancy by Household Size in Putnam County
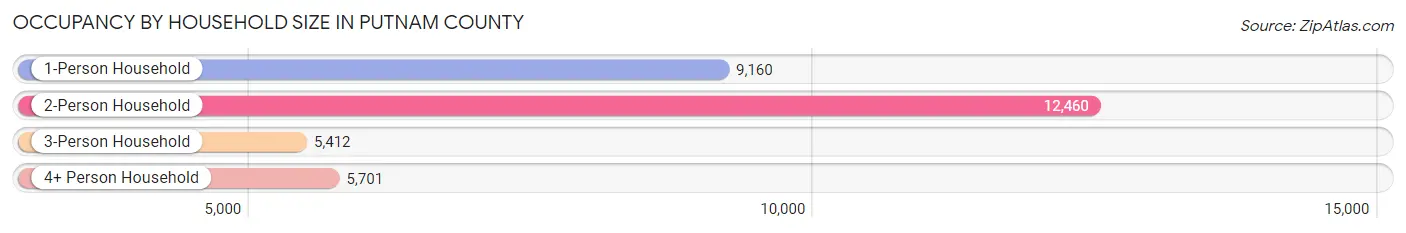
| Household Size | # Housing Units | % Housing Units |
| 1-Person Household | 9,160 | 28.0% |
| 2-Person Household | 12,460 | 38.1% |
| 3-Person Household | 5,412 | 16.5% |
| 4+ Person Household | 5,701 | 17.4% |
| Total Housing Units | 32,733 | 100.0% |
Occupancy by Ownership by Household Size in Putnam County
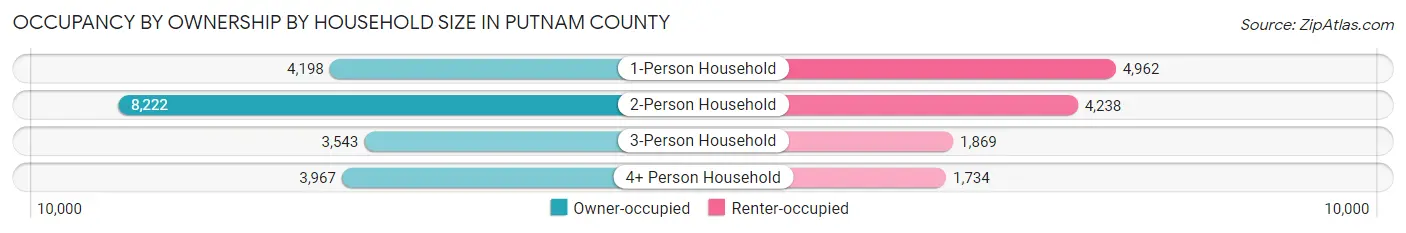
| Household Size | Owner-occupied | Renter-occupied |
| 1-Person Household | 4,198 (45.8%) | 4,962 (54.2%) |
| 2-Person Household | 8,222 (66.0%) | 4,238 (34.0%) |
| 3-Person Household | 3,543 (65.5%) | 1,869 (34.5%) |
| 4+ Person Household | 3,967 (69.6%) | 1,734 (30.4%) |
| Total Housing Units | 19,930 (60.9%) | 12,803 (39.1%) |
Occupancy by Educational Attainment in Putnam County
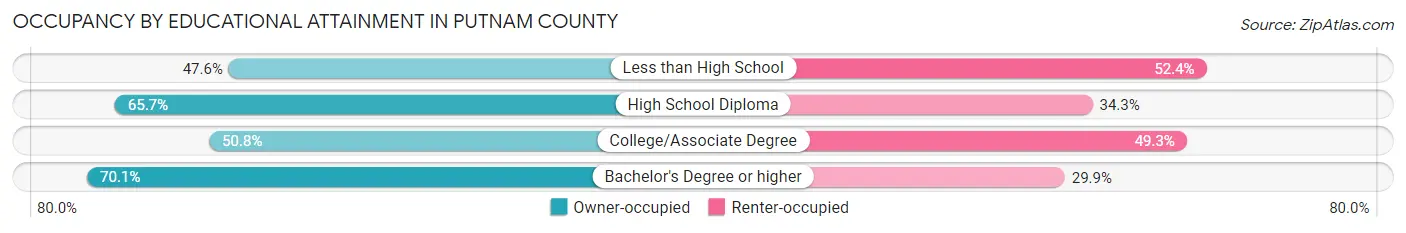
| Household Size | Owner-occupied | Renter-occupied |
| Less than High School | 1,373 (47.6%) | 1,510 (52.4%) |
| High School Diploma | 6,902 (65.7%) | 3,607 (34.3%) |
| College/Associate Degree | 4,985 (50.7%) | 4,838 (49.2%) |
| Bachelor's Degree or higher | 6,670 (70.1%) | 2,848 (29.9%) |
Occupancy by Age of Householder in Putnam County
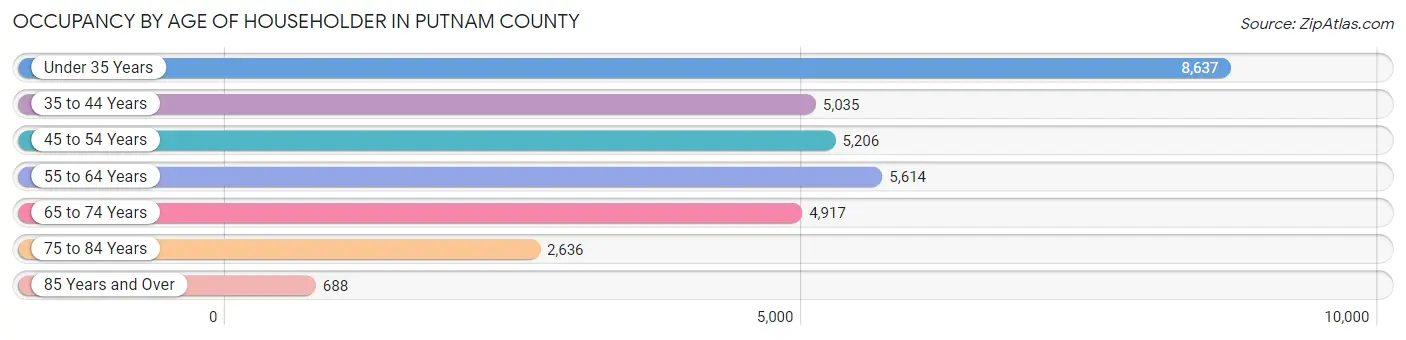
| Age Bracket | # Households | % Households |
| Under 35 Years | 8,637 | 26.4% |
| 35 to 44 Years | 5,035 | 15.4% |
| 45 to 54 Years | 5,206 | 15.9% |
| 55 to 64 Years | 5,614 | 17.2% |
| 65 to 74 Years | 4,917 | 15.0% |
| 75 to 84 Years | 2,636 | 8.1% |
| 85 Years and Over | 688 | 2.1% |
| Total | 32,733 | 100.0% |
Housing Finances in Putnam County
Median Income by Occupancy in Putnam County
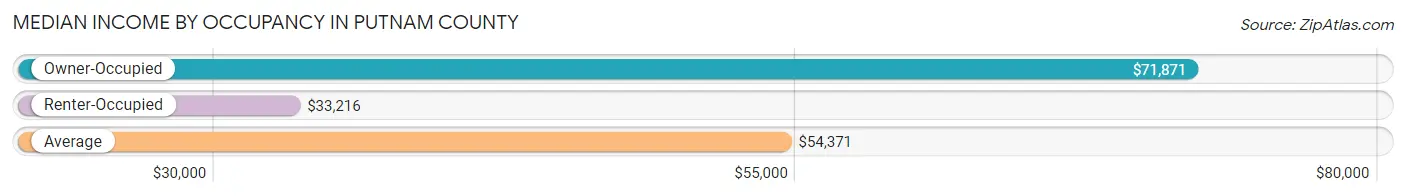
| Occupancy Type | # Households | Median Income |
| Owner-Occupied | 19,930 (60.9%) | $71,871 |
| Renter-Occupied | 12,803 (39.1%) | $33,216 |
| Average | 32,733 (100.0%) | $54,371 |
Occupancy by Householder Income Bracket in Putnam County
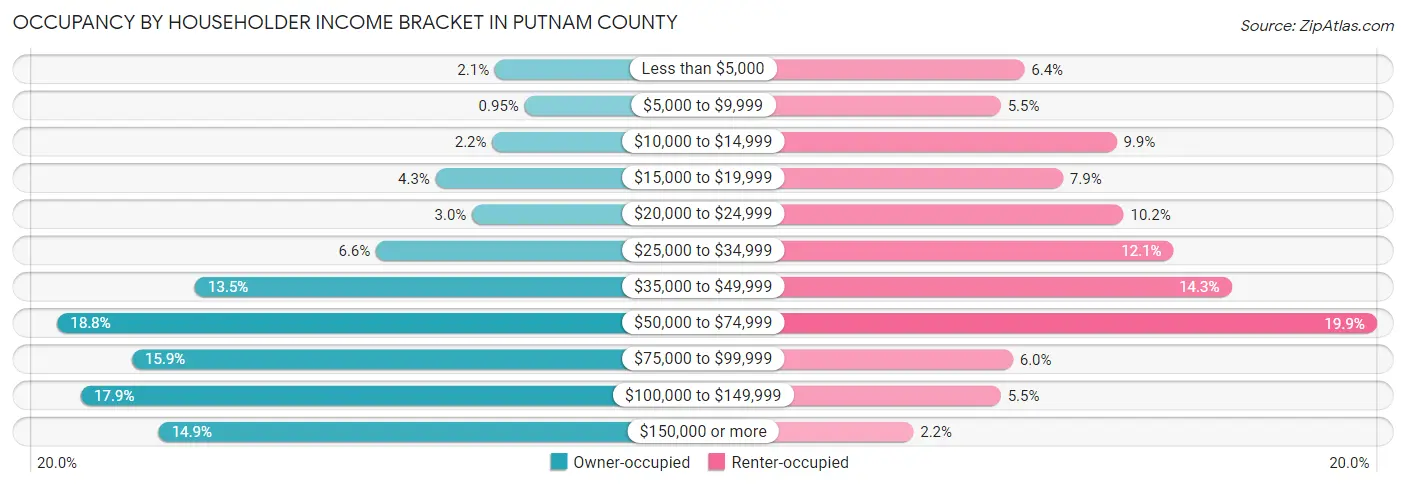
| Income Bracket | Owner-occupied | Renter-occupied |
| Less than $5,000 | 414 (2.1%) | 823 (6.4%) |
| $5,000 to $9,999 | 190 (0.9%) | 708 (5.5%) |
| $10,000 to $14,999 | 434 (2.2%) | 1,273 (9.9%) |
| $15,000 to $19,999 | 864 (4.3%) | 1,011 (7.9%) |
| $20,000 to $24,999 | 587 (2.9%) | 1,307 (10.2%) |
| $25,000 to $34,999 | 1,317 (6.6%) | 1,550 (12.1%) |
| $35,000 to $49,999 | 2,692 (13.5%) | 1,832 (14.3%) |
| $50,000 to $74,999 | 3,737 (18.8%) | 2,542 (19.9%) |
| $75,000 to $99,999 | 3,171 (15.9%) | 767 (6.0%) |
| $100,000 to $149,999 | 3,557 (17.8%) | 708 (5.5%) |
| $150,000 or more | 2,967 (14.9%) | 282 (2.2%) |
| Total | 19,930 (100.0%) | 12,803 (100.0%) |
Monthly Housing Cost Tiers in Putnam County
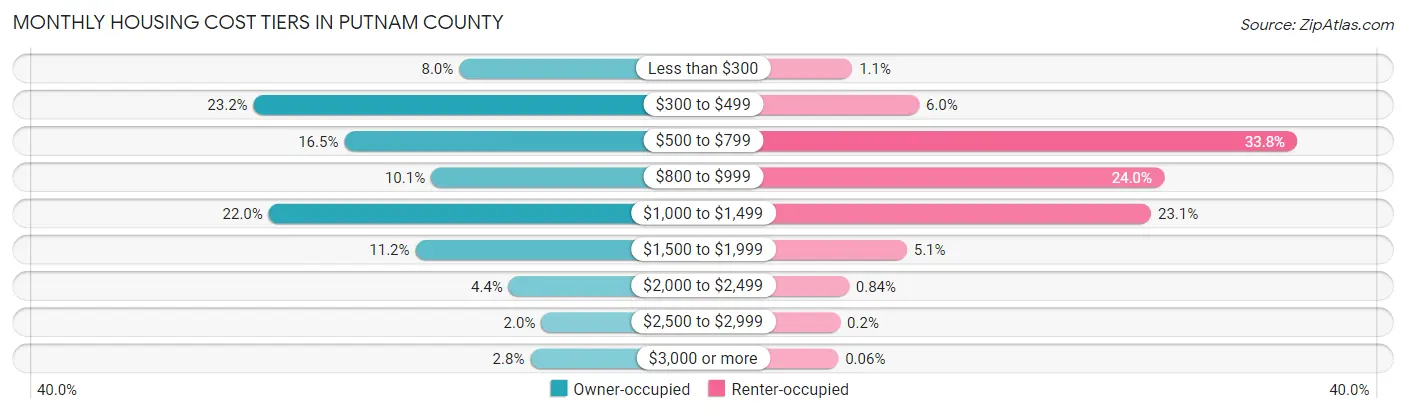
| Monthly Cost | Owner-occupied | Renter-occupied |
| Less than $300 | 1,594 (8.0%) | 139 (1.1%) |
| $300 to $499 | 4,614 (23.2%) | 770 (6.0%) |
| $500 to $799 | 3,281 (16.5%) | 4,333 (33.8%) |
| $800 to $999 | 2,006 (10.1%) | 3,078 (24.0%) |
| $1,000 to $1,499 | 4,391 (22.0%) | 2,958 (23.1%) |
| $1,500 to $1,999 | 2,237 (11.2%) | 654 (5.1%) |
| $2,000 to $2,499 | 867 (4.3%) | 107 (0.8%) |
| $2,500 to $2,999 | 389 (1.9%) | 26 (0.2%) |
| $3,000 or more | 551 (2.8%) | 8 (0.1%) |
| Total | 19,930 (100.0%) | 12,803 (100.0%) |
Physical Housing Characteristics in Putnam County
Housing Structures in Putnam County
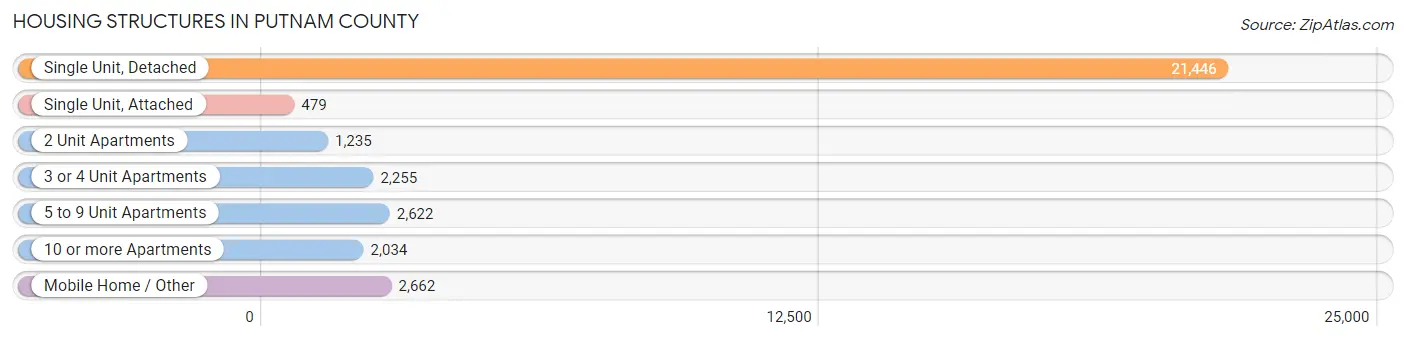
| Structure Type | # Housing Units | % Housing Units |
| Single Unit, Detached | 21,446 | 65.5% |
| Single Unit, Attached | 479 | 1.5% |
| 2 Unit Apartments | 1,235 | 3.8% |
| 3 or 4 Unit Apartments | 2,255 | 6.9% |
| 5 to 9 Unit Apartments | 2,622 | 8.0% |
| 10 or more Apartments | 2,034 | 6.2% |
| Mobile Home / Other | 2,662 | 8.1% |
| Total | 32,733 | 100.0% |
Housing Structures by Occupancy in Putnam County
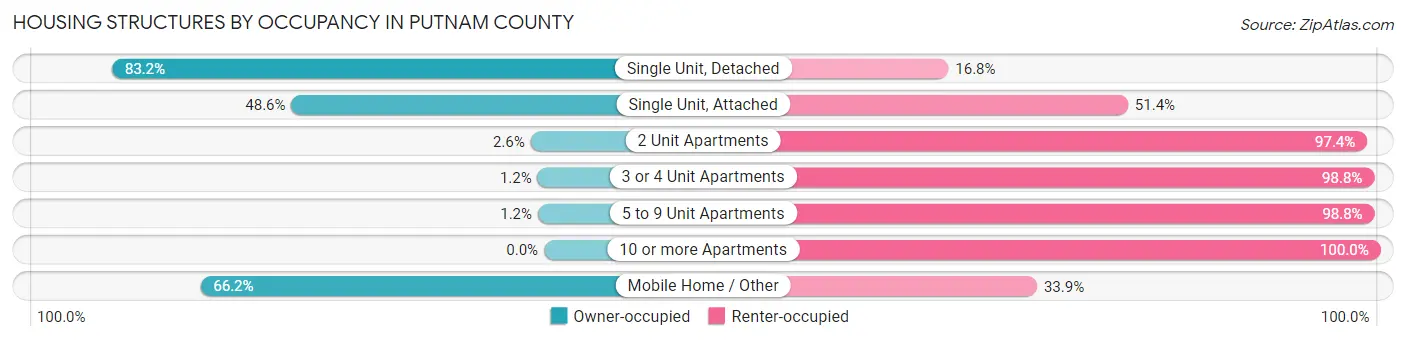
| Structure Type | Owner-occupied | Renter-occupied |
| Single Unit, Detached | 17,845 (83.2%) | 3,601 (16.8%) |
| Single Unit, Attached | 233 (48.6%) | 246 (51.4%) |
| 2 Unit Apartments | 32 (2.6%) | 1,203 (97.4%) |
| 3 or 4 Unit Apartments | 28 (1.2%) | 2,227 (98.8%) |
| 5 to 9 Unit Apartments | 31 (1.2%) | 2,591 (98.8%) |
| 10 or more Apartments | 0 (0.0%) | 2,034 (100.0%) |
| Mobile Home / Other | 1,761 (66.1%) | 901 (33.9%) |
| Total | 19,930 (60.9%) | 12,803 (39.1%) |
Housing Structures by Number of Rooms in Putnam County
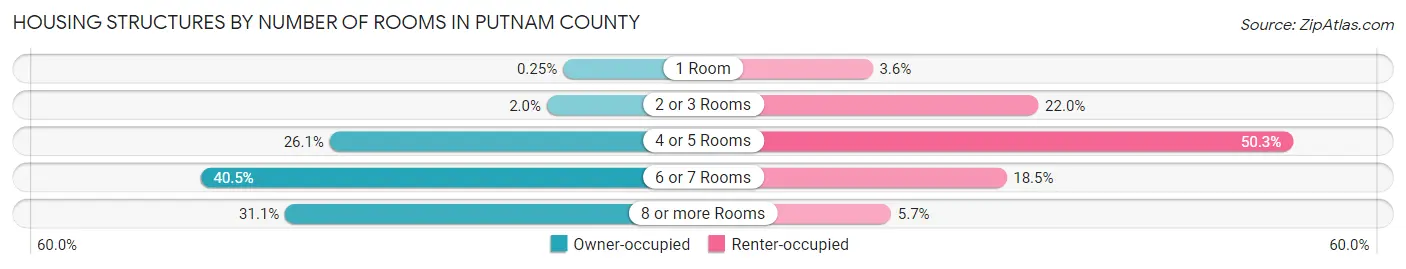
| Number of Rooms | Owner-occupied | Renter-occupied |
| 1 Room | 50 (0.3%) | 462 (3.6%) |
| 2 or 3 Rooms | 407 (2.0%) | 2,817 (22.0%) |
| 4 or 5 Rooms | 5,210 (26.1%) | 6,438 (50.3%) |
| 6 or 7 Rooms | 8,068 (40.5%) | 2,363 (18.5%) |
| 8 or more Rooms | 6,195 (31.1%) | 723 (5.7%) |
| Total | 19,930 (100.0%) | 12,803 (100.0%) |
Housing Structure by Heating Type in Putnam County
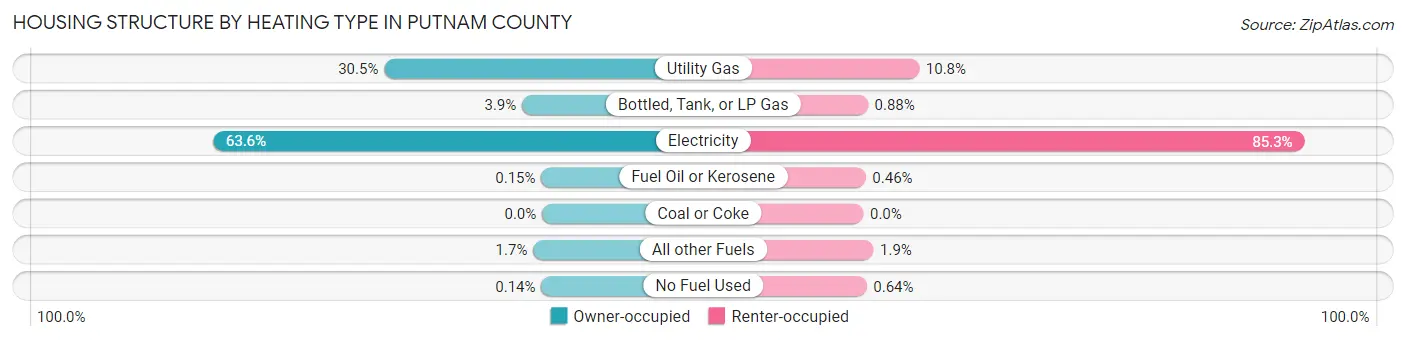
| Heating Type | Owner-occupied | Renter-occupied |
| Utility Gas | 6,081 (30.5%) | 1,380 (10.8%) |
| Bottled, Tank, or LP Gas | 770 (3.9%) | 113 (0.9%) |
| Electricity | 12,680 (63.6%) | 10,920 (85.3%) |
| Fuel Oil or Kerosene | 30 (0.2%) | 59 (0.5%) |
| Coal or Coke | 0 (0.0%) | 0 (0.0%) |
| All other Fuels | 341 (1.7%) | 249 (1.9%) |
| No Fuel Used | 28 (0.1%) | 82 (0.6%) |
| Total | 19,930 (100.0%) | 12,803 (100.0%) |
Household Vehicle Usage in Putnam County
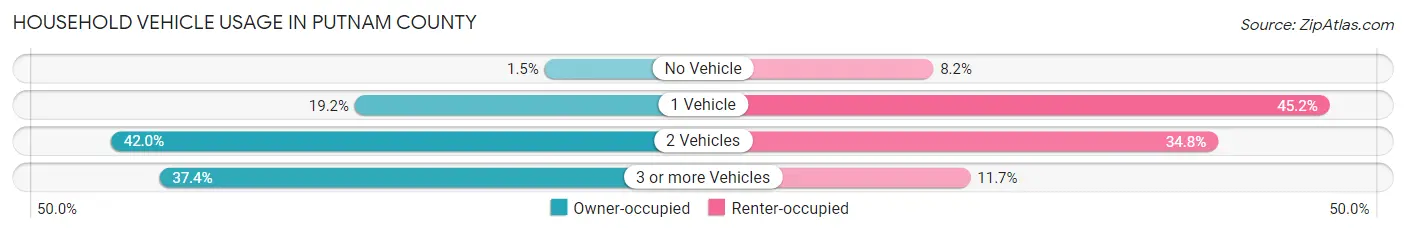
| Vehicles per Household | Owner-occupied | Renter-occupied |
| No Vehicle | 291 (1.5%) | 1,055 (8.2%) |
| 1 Vehicle | 3,821 (19.2%) | 5,791 (45.2%) |
| 2 Vehicles | 8,361 (41.9%) | 4,458 (34.8%) |
| 3 or more Vehicles | 7,457 (37.4%) | 1,499 (11.7%) |
| Total | 19,930 (100.0%) | 12,803 (100.0%) |
Real Estate & Mortgages in Putnam County
Real Estate and Mortgage Overview in Putnam County
| Characteristic | Without Mortgage | With Mortgage |
| Housing Units | 8,631 | 11,299 |
| Median Property Value | $209,700 | $228,700 |
| Median Household Income | $62,770 | $1,934 |
| Monthly Housing Costs | $426 | $538 |
| Real Estate Taxes | $1,182 | $221 |
Property Value by Mortgage Status in Putnam County
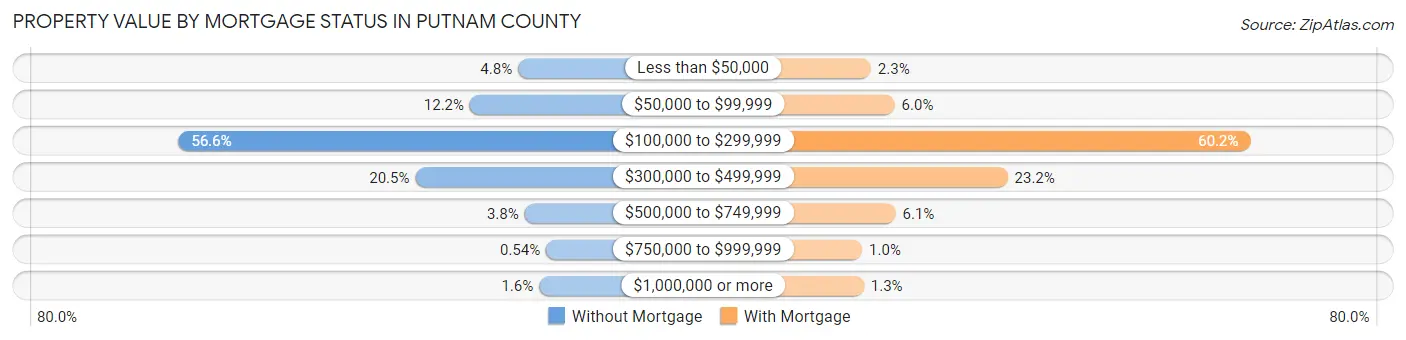
| Property Value | Without Mortgage | With Mortgage |
| Less than $50,000 | 416 (4.8%) | 264 (2.3%) |
| $50,000 to $99,999 | 1,049 (12.1%) | 673 (6.0%) |
| $100,000 to $299,999 | 4,883 (56.6%) | 6,798 (60.2%) |
| $300,000 to $499,999 | 1,767 (20.5%) | 2,618 (23.2%) |
| $500,000 to $749,999 | 330 (3.8%) | 690 (6.1%) |
| $750,000 to $999,999 | 47 (0.5%) | 114 (1.0%) |
| $1,000,000 or more | 139 (1.6%) | 142 (1.3%) |
| Total | 8,631 (100.0%) | 11,299 (100.0%) |
Household Income by Mortgage Status in Putnam County
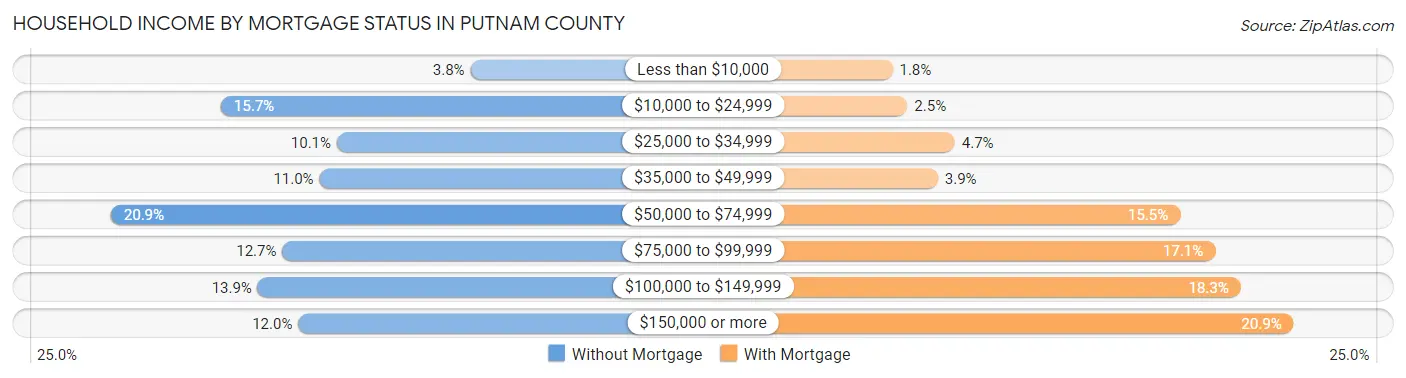
| Household Income | Without Mortgage | With Mortgage |
| Less than $10,000 | 325 (3.8%) | 199 (1.8%) |
| $10,000 to $24,999 | 1,351 (15.7%) | 279 (2.5%) |
| $25,000 to $34,999 | 874 (10.1%) | 534 (4.7%) |
| $35,000 to $49,999 | 946 (11.0%) | 443 (3.9%) |
| $50,000 to $74,999 | 1,803 (20.9%) | 1,746 (15.4%) |
| $75,000 to $99,999 | 1,099 (12.7%) | 1,934 (17.1%) |
| $100,000 to $149,999 | 1,200 (13.9%) | 2,072 (18.3%) |
| $150,000 or more | 1,033 (12.0%) | 2,357 (20.9%) |
| Total | 8,631 (100.0%) | 11,299 (100.0%) |
Property Value to Household Income Ratio in Putnam County
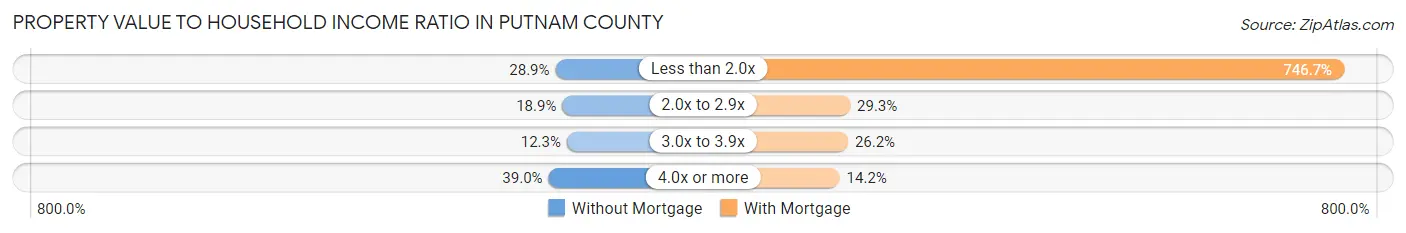
| Value-to-Income Ratio | Without Mortgage | With Mortgage |
| Less than 2.0x | 2,491 (28.9%) | 84,369 (746.7%) |
| 2.0x to 2.9x | 1,630 (18.9%) | 3,313 (29.3%) |
| 3.0x to 3.9x | 1,060 (12.3%) | 2,962 (26.2%) |
| 4.0x or more | 3,364 (39.0%) | 1,599 (14.1%) |
| Total | 8,631 (100.0%) | 11,299 (100.0%) |
Real Estate Taxes by Mortgage Status in Putnam County
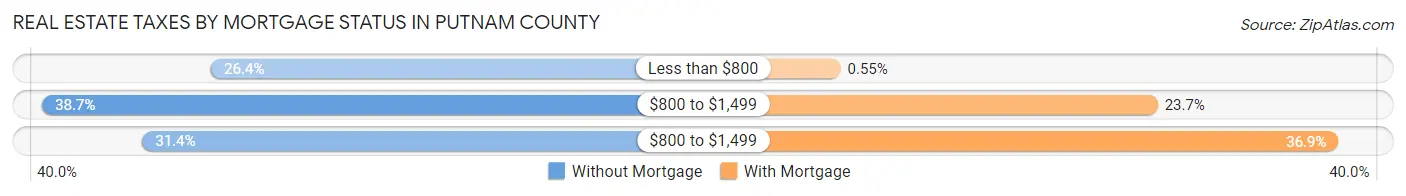
| Property Taxes | Without Mortgage | With Mortgage |
| Less than $800 | 2,276 (26.4%) | 62 (0.5%) |
| $800 to $1,499 | 3,342 (38.7%) | 2,680 (23.7%) |
| $800 to $1,499 | 2,710 (31.4%) | 4,171 (36.9%) |
| Total | 8,631 (100.0%) | 11,299 (100.0%) |
Health & Disability in Putnam County
Health Insurance Coverage by Age in Putnam County
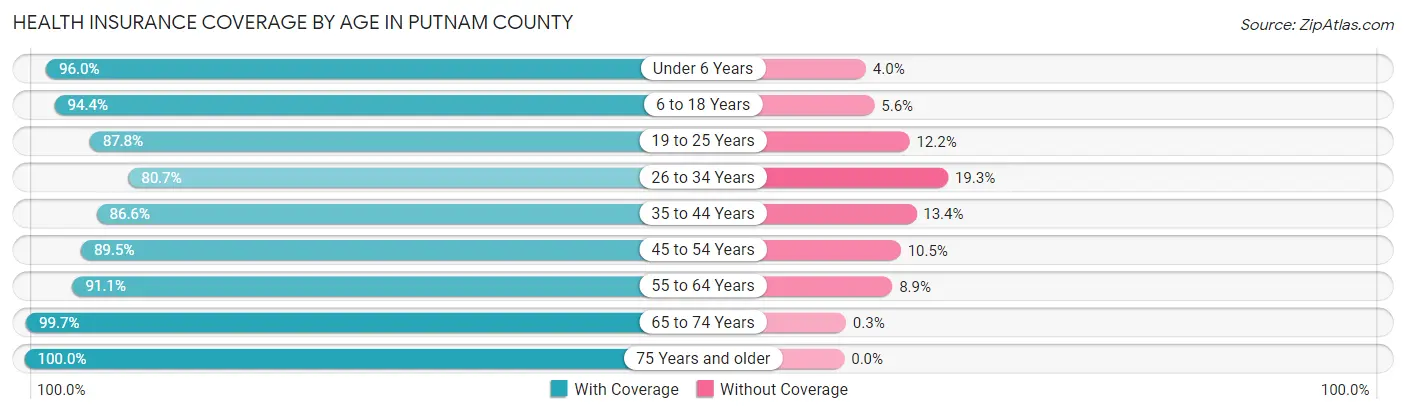
| Age Bracket | With Coverage | Without Coverage |
| Under 6 Years | 5,149 (96.0%) | 216 (4.0%) |
| 6 to 18 Years | 12,061 (94.4%) | 717 (5.6%) |
| 19 to 25 Years | 9,976 (87.8%) | 1,381 (12.2%) |
| 26 to 34 Years | 7,409 (80.7%) | 1,777 (19.3%) |
| 35 to 44 Years | 7,688 (86.6%) | 1,193 (13.4%) |
| 45 to 54 Years | 8,457 (89.5%) | 994 (10.5%) |
| 55 to 64 Years | 8,668 (91.1%) | 851 (8.9%) |
| 65 to 74 Years | 7,607 (99.7%) | 23 (0.3%) |
| 75 Years and older | 5,037 (100.0%) | 0 (0.0%) |
| Total | 72,052 (91.0%) | 7,152 (9.0%) |
Health Insurance Coverage by Citizenship Status in Putnam County
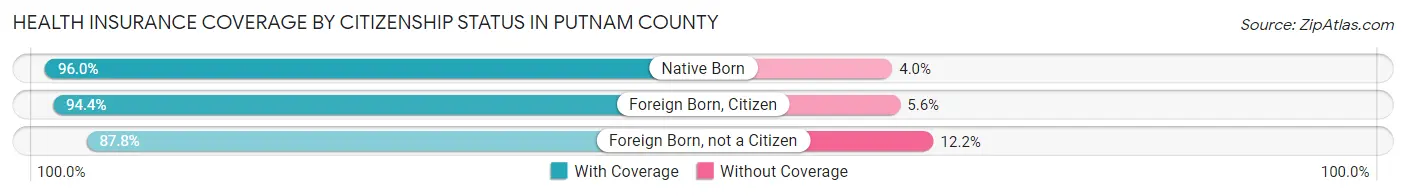
| Citizenship Status | With Coverage | Without Coverage |
| Native Born | 5,149 (96.0%) | 216 (4.0%) |
| Foreign Born, Citizen | 12,061 (94.4%) | 717 (5.6%) |
| Foreign Born, not a Citizen | 9,976 (87.8%) | 1,381 (12.2%) |
Health Insurance Coverage by Household Income in Putnam County
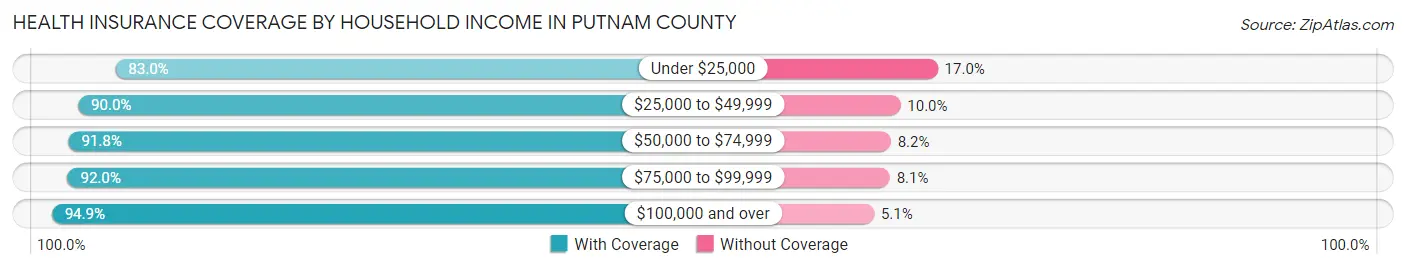
| Household Income | With Coverage | Without Coverage |
| Under $25,000 | 10,947 (83.0%) | 2,245 (17.0%) |
| $25,000 to $49,999 | 13,590 (90.0%) | 1,517 (10.0%) |
| $50,000 to $74,999 | 13,724 (91.8%) | 1,230 (8.2%) |
| $75,000 to $99,999 | 10,543 (91.9%) | 923 (8.1%) |
| $100,000 and over | 20,811 (94.9%) | 1,116 (5.1%) |
Public vs Private Health Insurance Coverage by Age in Putnam County
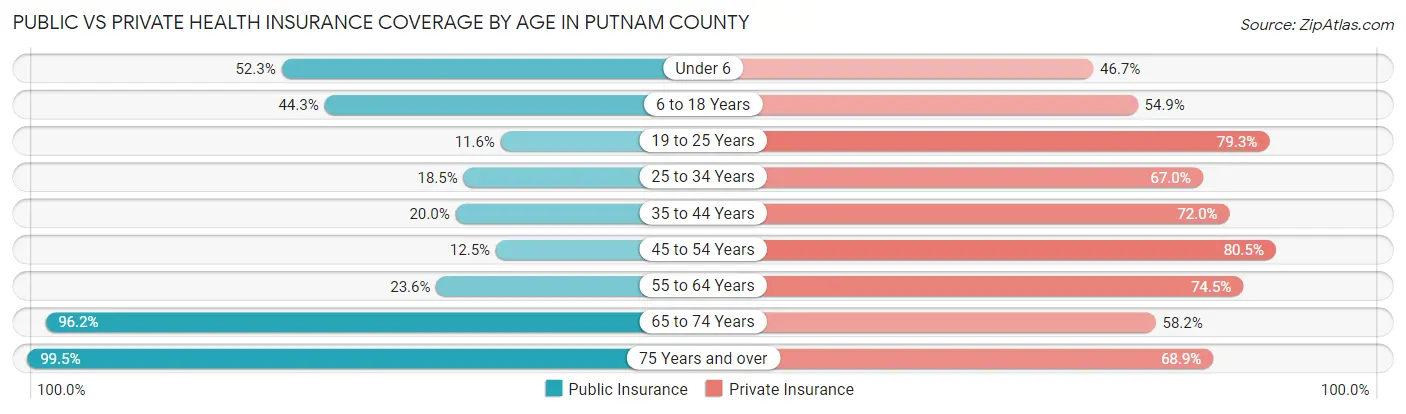
| Age Bracket | Public Insurance | Private Insurance |
| Under 6 | 2,807 (52.3%) | 2,503 (46.7%) |
| 6 to 18 Years | 5,666 (44.3%) | 7,017 (54.9%) |
| 19 to 25 Years | 1,321 (11.6%) | 9,008 (79.3%) |
| 25 to 34 Years | 1,702 (18.5%) | 6,150 (66.9%) |
| 35 to 44 Years | 1,778 (20.0%) | 6,390 (72.0%) |
| 45 to 54 Years | 1,183 (12.5%) | 7,612 (80.5%) |
| 55 to 64 Years | 2,245 (23.6%) | 7,092 (74.5%) |
| 65 to 74 Years | 7,338 (96.2%) | 4,444 (58.2%) |
| 75 Years and over | 5,012 (99.5%) | 3,472 (68.9%) |
| Total | 29,052 (36.7%) | 53,688 (67.8%) |
Disability Status by Sex by Age in Putnam County
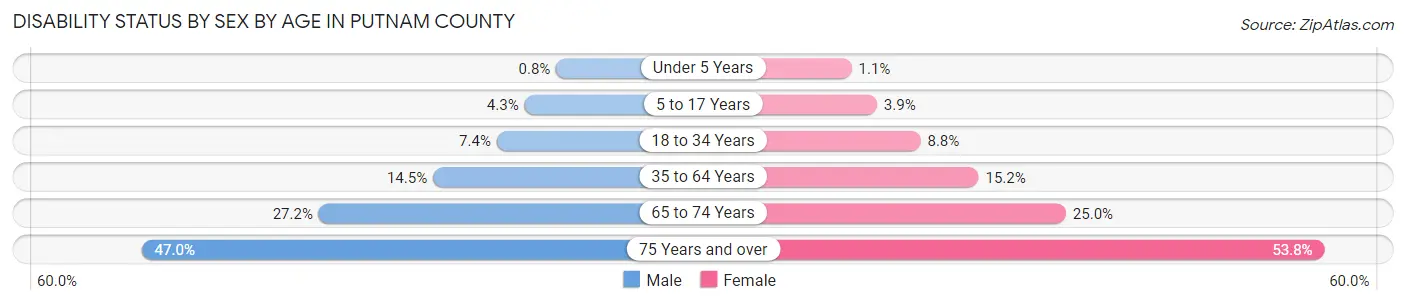
| Age Bracket | Male | Female |
| Under 5 Years | 17 (0.8%) | 25 (1.1%) |
| 5 to 17 Years | 258 (4.3%) | 237 (3.9%) |
| 18 to 34 Years | 884 (7.4%) | 906 (8.8%) |
| 35 to 64 Years | 1,980 (14.5%) | 2,165 (15.2%) |
| 65 to 74 Years | 952 (27.2%) | 1,032 (25.0%) |
| 75 Years and over | 1,013 (47.0%) | 1,548 (53.7%) |
Disability Class by Sex by Age in Putnam County
Disability Class: Hearing Difficulty
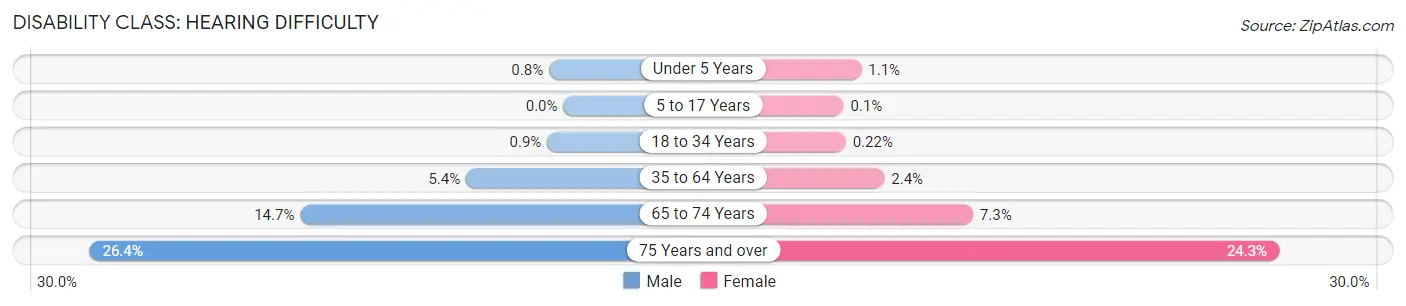
| Age Bracket | Male | Female |
| Under 5 Years | 17 (0.8%) | 25 (1.1%) |
| 5 to 17 Years | 0 (0.0%) | 6 (0.1%) |
| 18 to 34 Years | 107 (0.9%) | 23 (0.2%) |
| 35 to 64 Years | 739 (5.4%) | 337 (2.4%) |
| 65 to 74 Years | 512 (14.6%) | 302 (7.3%) |
| 75 Years and over | 569 (26.4%) | 701 (24.3%) |
Disability Class: Vision Difficulty
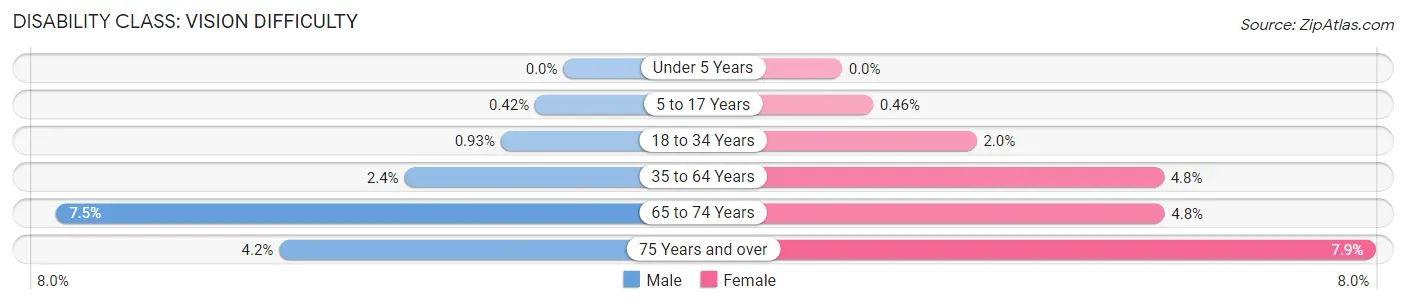
| Age Bracket | Male | Female |
| Under 5 Years | 0 (0.0%) | 0 (0.0%) |
| 5 to 17 Years | 25 (0.4%) | 28 (0.5%) |
| 18 to 34 Years | 111 (0.9%) | 207 (2.0%) |
| 35 to 64 Years | 322 (2.4%) | 679 (4.8%) |
| 65 to 74 Years | 263 (7.5%) | 198 (4.8%) |
| 75 Years and over | 91 (4.2%) | 228 (7.9%) |
Disability Class: Cognitive Difficulty
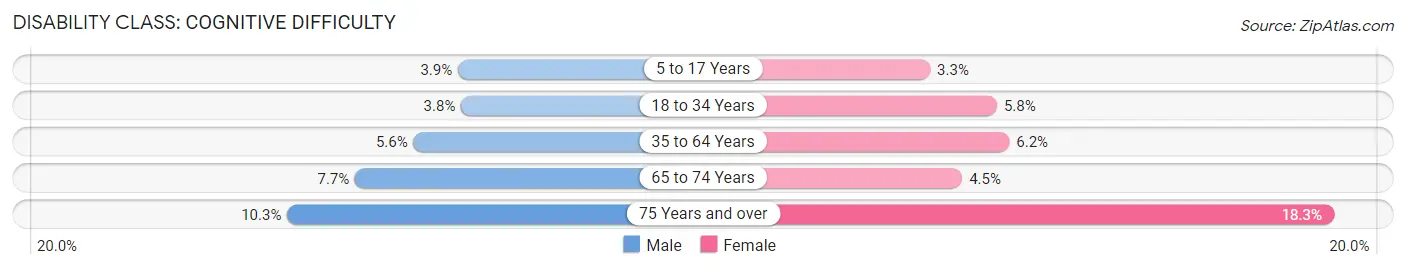
| Age Bracket | Male | Female |
| 5 to 17 Years | 233 (3.9%) | 199 (3.3%) |
| 18 to 34 Years | 451 (3.8%) | 595 (5.8%) |
| 35 to 64 Years | 758 (5.6%) | 885 (6.2%) |
| 65 to 74 Years | 270 (7.7%) | 185 (4.5%) |
| 75 Years and over | 221 (10.2%) | 526 (18.3%) |
Disability Class: Ambulatory Difficulty
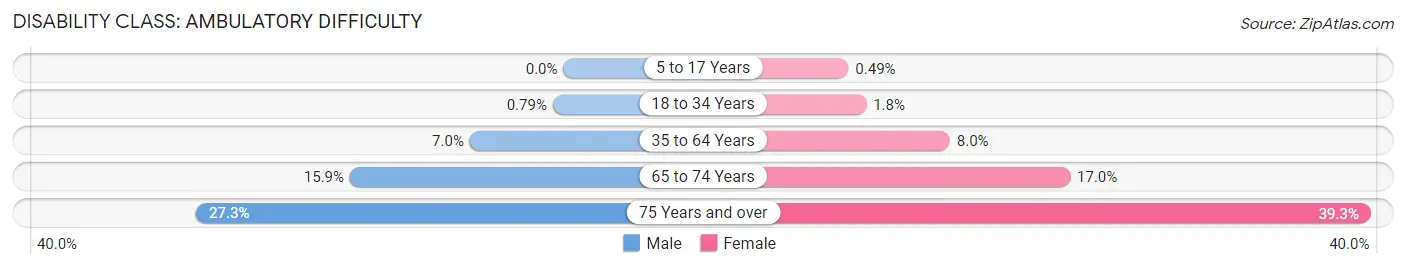
| Age Bracket | Male | Female |
| 5 to 17 Years | 0 (0.0%) | 30 (0.5%) |
| 18 to 34 Years | 94 (0.8%) | 187 (1.8%) |
| 35 to 64 Years | 947 (7.0%) | 1,140 (8.0%) |
| 65 to 74 Years | 554 (15.9%) | 701 (17.0%) |
| 75 Years and over | 588 (27.3%) | 1,131 (39.3%) |
Disability Class: Self-Care Difficulty
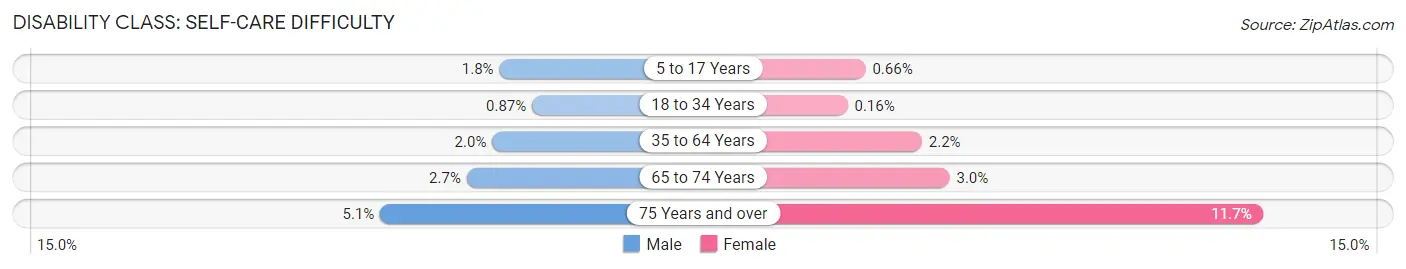
| Age Bracket | Male | Female |
| 5 to 17 Years | 106 (1.8%) | 40 (0.7%) |
| 18 to 34 Years | 103 (0.9%) | 17 (0.2%) |
| 35 to 64 Years | 270 (2.0%) | 317 (2.2%) |
| 65 to 74 Years | 94 (2.7%) | 124 (3.0%) |
| 75 Years and over | 110 (5.1%) | 338 (11.7%) |
Technology Access in Putnam County
Computing Device Access in Putnam County
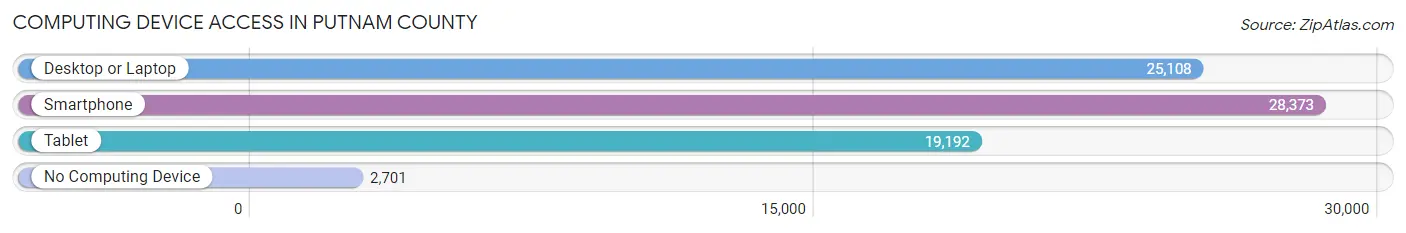
| Device Type | # Households | % Households |
| Desktop or Laptop | 25,108 | 76.7% |
| Smartphone | 28,373 | 86.7% |
| Tablet | 19,192 | 58.6% |
| No Computing Device | 2,701 | 8.3% |
| Total | 32,733 | 100.0% |
Internet Access in Putnam County
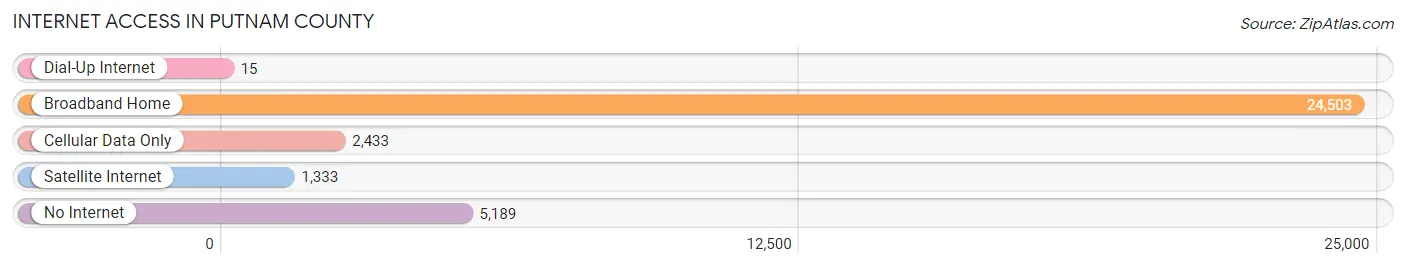
| Internet Type | # Households | % Households |
| Dial-Up Internet | 15 | 0.1% |
| Broadband Home | 24,503 | 74.9% |
| Cellular Data Only | 2,433 | 7.4% |
| Satellite Internet | 1,333 | 4.1% |
| No Internet | 5,189 | 15.9% |
| Total | 32,733 | 100.0% |
Putnam County Summary
Putnam County is located in the Upper Cumberland region of Middle Tennessee. It is bordered by White, Overton, Jackson, and DeKalb counties. The county seat is Cookeville, which is also the largest city in the county. Putnam County was established in 1842 and named after Israel Putnam, a Revolutionary War hero.
Geography
Putnam County is located in the Upper Cumberland region of Middle Tennessee. It is bordered by White, Overton, Jackson, and DeKalb counties. The county has a total area of 517 square miles, of which 514 square miles is land and 3 square miles is water. The terrain is mostly hilly and forested, with some flat areas in the valleys. The highest point in the county is the summit of Bunkum Mountain, which has an elevation of 1,890 feet. The county is drained by the Caney Fork River and its tributaries.
Economy
Putnam County’s economy is largely based on agriculture and manufacturing. The county is home to several large manufacturing companies, including A.O. Smith, which produces water heaters and boilers, and Whirlpool Corporation, which produces refrigerators and other appliances. Agriculture is also an important part of the county’s economy, with corn, soybeans, and hay being the main crops. Livestock production is also important, with beef cattle, dairy cattle, and hogs being the main types of livestock raised in the county.
Demographics
As of the 2010 census, Putnam County had a population of 72,321. The population was spread out, with 24.3% under the age of 18, 11.2% from 18 to 24, 28.2% from 25 to 44, 22.7% from 45 to 64, and 13.6% who were 65 years of age or older. The median age was 35.3 years. The median income for a household in the county was $41,945, and the median income for a family was $50,945.
The racial makeup of the county was 92.2% White, 3.7% African American, 0.3% Native American, 1.7% Asian, 0.1% Pacific Islander, 0.9% from other races, and 1.1% from two or more races. Hispanic or Latino of any race were 2.7% of the population.
Conclusion
Putnam County is a rural county located in the Upper Cumberland region of Middle Tennessee. It is bordered by White, Overton, Jackson, and DeKalb counties. The county has a population of 72,321 and is largely based on agriculture and manufacturing. The county is home to several large manufacturing companies, and agriculture is also an important part of the county’s economy. The racial makeup of the county is mostly White, with African Americans, Native Americans, Asians, and Pacific Islanders making up the remainder of the population.
Common Questions
What is the Total Population of Putnam County?
Total Population of Putnam County is 80,157.
What is the Total Male Population of Putnam County?
Total Male Population of Putnam County is 39,887.
What is the Total Female Population of Putnam County?
Total Female Population of Putnam County is 40,270.
What is the Ratio of Males per 100 Females in Putnam County?
There are 99.05 Males per 100 Females in Putnam County.
What is the Ratio of Females per 100 Males in Putnam County?
There are 100.96 Females per 100 Males in Putnam County.
What is the Median Population Age in Putnam County?
Median Population Age in Putnam County is 36.3 Years.
What is the Average Family Size in Putnam County
Average Family Size in Putnam County is 2.9 People.
What is the Average Household Size in Putnam County
Average Household Size in Putnam County is 2.4 People.
What is Per Capita Income in Putnam County?
Per Capita income in Putnam County is $29,419.
What is the Median Family Income in Putnam County?
Median Family Income in Putnam County is $69,491.
What is the Median Household income in Putnam County?
Median Household Income in Putnam County is $54,371.
What is Income or Wage Gap in Putnam County?
Income or Wage Gap in Putnam County is 21.3%.
Women in Putnam County earn 78.7 cents for every dollar earned by a man.
What is Family Income Deficit in Putnam County?
Family Income Deficit in Putnam County is $10,710.
Families that are below poverty line in Putnam County earn $10,710 less on average than the poverty threshold level.
What is Inequality or Gini Index in Putnam County?
Inequality or Gini Index in Putnam County is 0.45.
How Large is the Labor Force in Putnam County?
There are 40,067 People in the Labor Forcein in Putnam County.
What is the Percentage of People in the Labor Force in Putnam County?
61.0% of People are in the Labor Force in Putnam County.
What is the Unemployment Rate in Putnam County?
Unemployment Rate in Putnam County is 4.5%.