Polk County, TN
Polk County Map
Polk County Overview
17,620
TOTAL POPULATION
8,836
MALE POPULATION
8,784
FEMALE POPULATION
100.59
MALES / 100 FEMALES
99.41
FEMALES / 100 MALES
46.3
MEDIAN AGE
2.9
AVG FAMILY SIZE
2.5
AVG HOUSEHOLD SIZE
$30,400
PER CAPITA INCOME
$69,871
AVG FAMILY INCOME
$53,775
AVG HOUSEHOLD INCOME
40.4%
WAGE / INCOME GAP [ % ]
59.6¢/ $1
WAGE / INCOME GAP [ $ ]
$8,073
FAMILY INCOME DEFICIT
0.46
INEQUALITY / GINI INDEX
7,945
LABOR FORCE [ PEOPLE ]
54.6%
PERCENT IN LABOR FORCE
7.8%
UNEMPLOYMENT RATE
Polk County Area Codes
Race in Polk County
The most populous races in Polk County are White / Caucasian (16,164 | 91.7%), Two or more Races (1,188 | 6.7%), and Hispanic or Latino (394 | 2.2%).

| Race | # Population | % Population |
| Asian | 37 | 0.2% |
| Black / African American | 72 | 0.4% |
| Hawaiian / Pacific | 0 | 0.0% |
| Hispanic or Latino | 394 | 2.2% |
| Native / Alaskan | 51 | 0.3% |
| White / Caucasian | 16,164 | 91.7% |
| Two or more Races | 1,188 | 6.7% |
| Some other Race | 108 | 0.6% |
| Total | 17,620 | 100.0% |
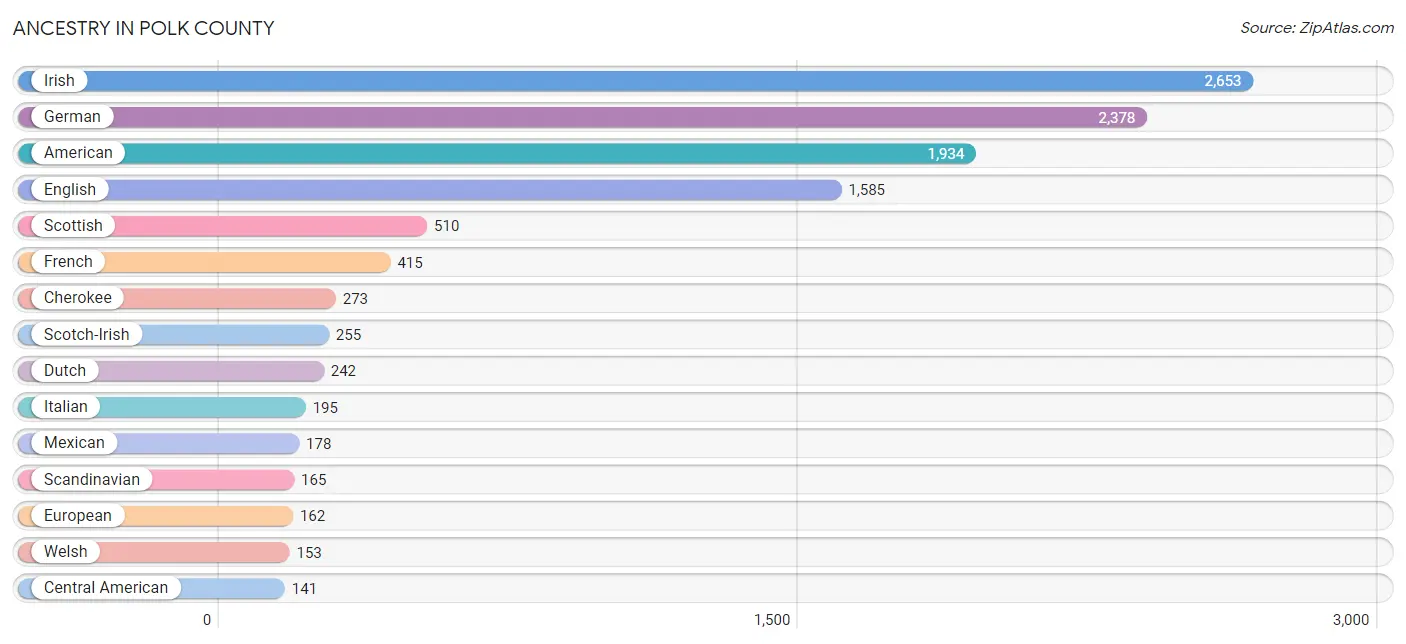
Ancestry in Polk County
The most populous ancestries reported in Polk County are Irish (2,653 | 15.1%), German (2,378 | 13.5%), American (1,934 | 11.0%), English (1,585 | 9.0%), and Scottish (510 | 2.9%), together accounting for 51.4% of all Polk County residents.
| Ancestry | # Population | % Population |
| African | 5 | 0.0% |
| American | 1,934 | 11.0% |
| Arab | 7 | 0.0% |
| Australian | 5 | 0.0% |
| Bhutanese | 38 | 0.2% |
| Blackfeet | 2 | 0.0% |
| British | 96 | 0.5% |
| Burmese | 14 | 0.1% |
| Cajun | 13 | 0.1% |
| Canadian | 15 | 0.1% |
| Central American | 141 | 0.8% |
| Central American Indian | 10 | 0.1% |
| Cherokee | 273 | 1.5% |
| Cuban | 27 | 0.2% |
| Cypriot | 8 | 0.1% |
| Czech | 5 | 0.0% |
| Czechoslovakian | 9 | 0.1% |
| Dutch | 242 | 1.4% |
| Eastern European | 31 | 0.2% |
| English | 1,585 | 9.0% |
| European | 162 | 0.9% |
| French | 415 | 2.4% |
| French American Indian | 10 | 0.1% |
| French Canadian | 32 | 0.2% |
| German | 2,378 | 13.5% |
| Greek | 16 | 0.1% |
| Guatemalan | 137 | 0.8% |
| Hungarian | 76 | 0.4% |
| Indian (Asian) | 28 | 0.2% |
| Irish | 2,653 | 15.1% |
| Italian | 195 | 1.1% |
| Korean | 6 | 0.0% |
| Liberian | 5 | 0.0% |
| Lithuanian | 17 | 0.1% |
| Mexican | 178 | 1.0% |
| Moroccan | 7 | 0.0% |
| Northern European | 74 | 0.4% |
| Norwegian | 52 | 0.3% |
| Panamanian | 4 | 0.0% |
| Polish | 120 | 0.7% |
| Portuguese | 15 | 0.1% |
| Potawatomi | 3 | 0.0% |
| Puerto Rican | 28 | 0.2% |
| Russian | 87 | 0.5% |
| Scandinavian | 165 | 0.9% |
| Scotch-Irish | 255 | 1.5% |
| Scottish | 510 | 2.9% |
| Serbian | 9 | 0.1% |
| Sioux | 15 | 0.1% |
| Slavic | 7 | 0.0% |
| Slovak | 24 | 0.1% |
| Spaniard | 9 | 0.1% |
| Spanish | 5 | 0.0% |
| Subsaharan African | 10 | 0.1% |
| Swedish | 19 | 0.1% |
| Swiss | 17 | 0.1% |
| Welsh | 153 | 0.9% | View All 57 Rows |
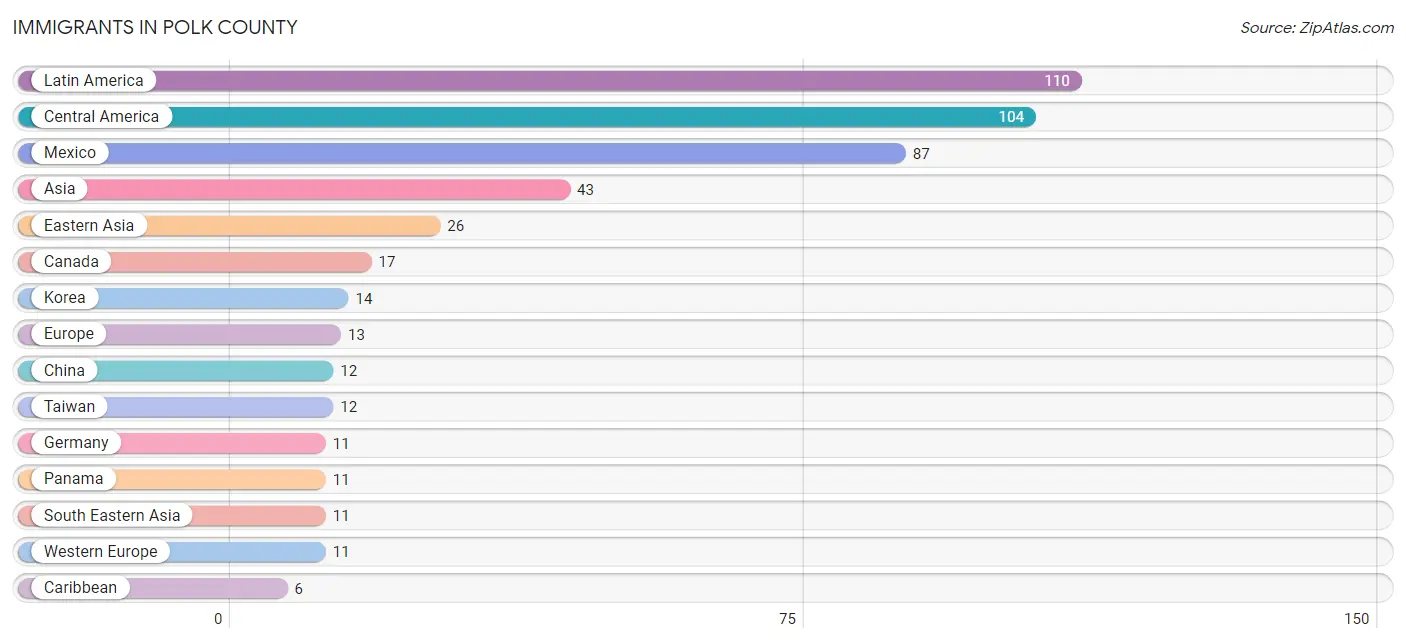
Immigrants in Polk County
The most numerous immigrant groups reported in Polk County came from Latin America (110 | 0.6%), Central America (104 | 0.6%), Mexico (87 | 0.5%), Asia (43 | 0.2%), and Eastern Asia (26 | 0.2%), together accounting for 2.1% of all Polk County residents.
| Immigration Origin | # Population | % Population |
| Africa | 5 | 0.0% |
| Asia | 43 | 0.2% |
| Canada | 17 | 0.1% |
| Caribbean | 6 | 0.0% |
| Central America | 104 | 0.6% |
| China | 12 | 0.1% |
| Cuba | 6 | 0.0% |
| Eastern Asia | 26 | 0.2% |
| Europe | 13 | 0.1% |
| Germany | 11 | 0.1% |
| Guatemala | 6 | 0.0% |
| Korea | 14 | 0.1% |
| Latin America | 110 | 0.6% |
| Lebanon | 6 | 0.0% |
| Liberia | 5 | 0.0% |
| Malaysia | 5 | 0.0% |
| Mexico | 87 | 0.5% |
| Northern Europe | 2 | 0.0% |
| Panama | 11 | 0.1% |
| Philippines | 6 | 0.0% |
| South Eastern Asia | 11 | 0.1% |
| Taiwan | 12 | 0.1% |
| Western Africa | 5 | 0.0% |
| Western Asia | 6 | 0.0% |
| Western Europe | 11 | 0.1% | View All 25 Rows |
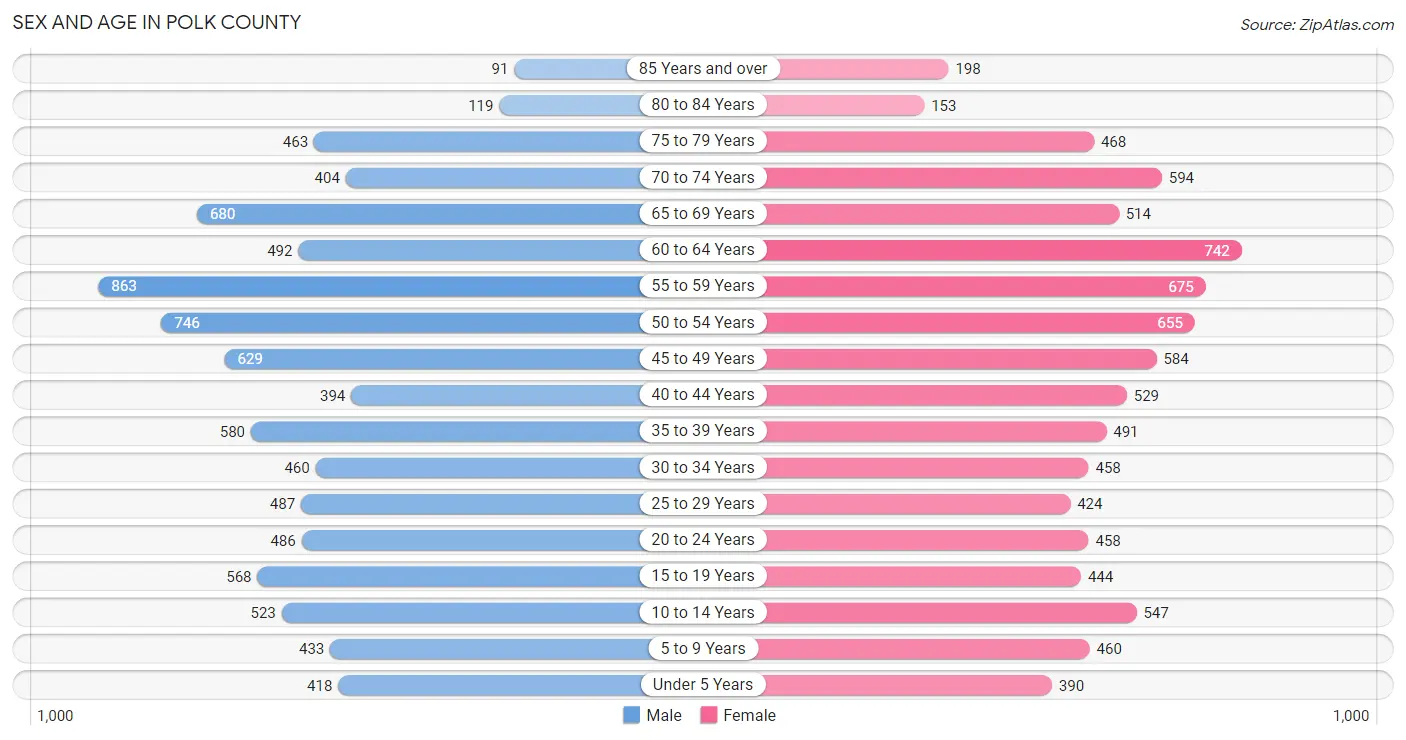
Sex and Age in Polk County
Sex and Age in Polk County
The most populous age groups in Polk County are 55 to 59 Years (863 | 9.8%) for men and 60 to 64 Years (742 | 8.5%) for women.
| Age Bracket | Male | Female |
| Under 5 Years | 418 (4.7%) | 390 (4.4%) |
| 5 to 9 Years | 433 (4.9%) | 460 (5.2%) |
| 10 to 14 Years | 523 (5.9%) | 547 (6.2%) |
| 15 to 19 Years | 568 (6.4%) | 444 (5.1%) |
| 20 to 24 Years | 486 (5.5%) | 458 (5.2%) |
| 25 to 29 Years | 487 (5.5%) | 424 (4.8%) |
| 30 to 34 Years | 460 (5.2%) | 458 (5.2%) |
| 35 to 39 Years | 580 (6.6%) | 491 (5.6%) |
| 40 to 44 Years | 394 (4.5%) | 529 (6.0%) |
| 45 to 49 Years | 629 (7.1%) | 584 (6.7%) |
| 50 to 54 Years | 746 (8.4%) | 655 (7.5%) |
| 55 to 59 Years | 863 (9.8%) | 675 (7.7%) |
| 60 to 64 Years | 492 (5.6%) | 742 (8.5%) |
| 65 to 69 Years | 680 (7.7%) | 514 (5.9%) |
| 70 to 74 Years | 404 (4.6%) | 594 (6.8%) |
| 75 to 79 Years | 463 (5.2%) | 468 (5.3%) |
| 80 to 84 Years | 119 (1.3%) | 153 (1.7%) |
| 85 Years and over | 91 (1.0%) | 198 (2.2%) |
| Total | 8,836 (100.0%) | 8,784 (100.0%) |
Families and Households in Polk County
Median Family Size in Polk County
The median family size in Polk County is 2.93 persons per family, with single female/mother families (777 | 15.9%) accounting for the largest median family size of 3.29 persons per family. On the other hand, single male/father families (365 | 7.4%) represent the smallest median family size with 2.64 persons per family.
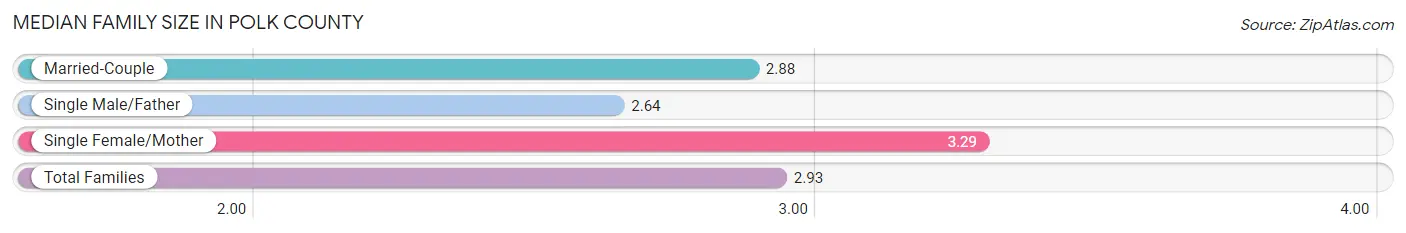
| Family Type | # Families | Family Size |
| Married-Couple | 3,755 (76.7%) | 2.88 |
| Single Male/Father | 365 (7.4%) | 2.64 |
| Single Female/Mother | 777 (15.9%) | 3.29 |
| Total Families | 4,897 (100.0%) | 2.93 |
Median Household Size in Polk County
The median household size in Polk County is 2.45 persons per household, with single female/mother households (777 | 10.9%) accounting for the largest median household size of 3.41 persons per household. non-family households (2,204 | 31.0%) represent the smallest median household size with 1.22 persons per household.
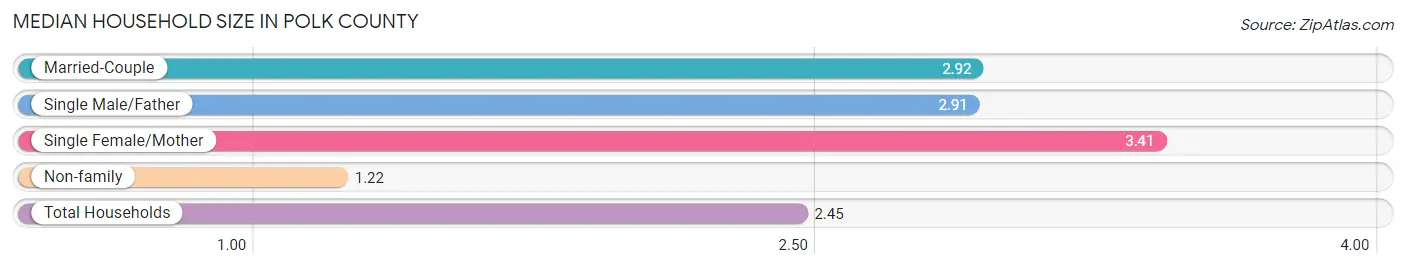
| Household Type | # Households | Household Size |
| Married-Couple | 3,755 (52.9%) | 2.92 |
| Single Male/Father | 365 (5.1%) | 2.91 |
| Single Female/Mother | 777 (10.9%) | 3.41 |
| Non-family | 2,204 (31.0%) | 1.22 |
| Total Households | 7,101 (100.0%) | 2.45 |
Household Size by Marriage Status in Polk County
Out of a total of 7,101 households in Polk County, 4,897 (69.0%) are family households, while 2,204 (31.0%) are nonfamily households. The most numerous type of family households are 2-person households, comprising 2,459, and the most common type of nonfamily households are 1-person households, comprising 1,819.
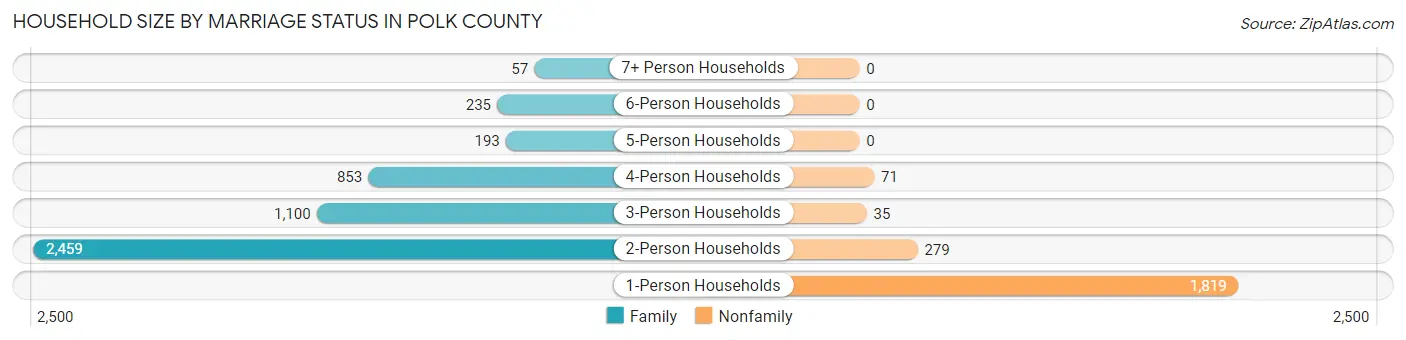
| Household Size | Family Households | Nonfamily Households |
| 1-Person Households | - | 1,819 (25.6%) |
| 2-Person Households | 2,459 (34.6%) | 279 (3.9%) |
| 3-Person Households | 1,100 (15.5%) | 35 (0.5%) |
| 4-Person Households | 853 (12.0%) | 71 (1.0%) |
| 5-Person Households | 193 (2.7%) | 0 (0.0%) |
| 6-Person Households | 235 (3.3%) | 0 (0.0%) |
| 7+ Person Households | 57 (0.8%) | 0 (0.0%) |
| Total | 4,897 (69.0%) | 2,204 (31.0%) |
Female Fertility in Polk County
Fertility by Age in Polk County
Average fertility rate in Polk County is 37.0 births per 1,000 women. Women in the age bracket of 20 to 34 years have the highest fertility rate with 98.0 births per 1,000 women. Women in the age bracket of 20 to 34 years acount for 97.8% of all women with births.
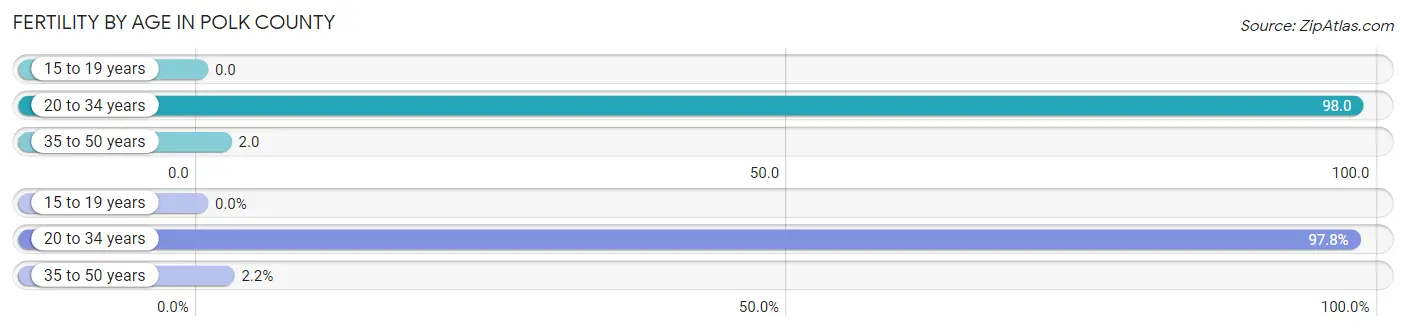
| Age Bracket | Women with Births | Births / 1,000 Women |
| 15 to 19 years | 0 (0.0%) | 0.0 |
| 20 to 34 years | 131 (97.8%) | 98.0 |
| 35 to 50 years | 3 (2.2%) | 2.0 |
| Total | 134 (100.0%) | 37.0 |
Fertility by Age by Marriage Status in Polk County
79.9% of women with births (134) in Polk County are married. The highest percentage of unmarried women with births falls into 20 to 34 years age bracket with 20.6% of them unmarried at the time of birth, while the lowest percentage of unmarried women with births belong to 35 to 50 years age bracket with 0.0% of them unmarried.
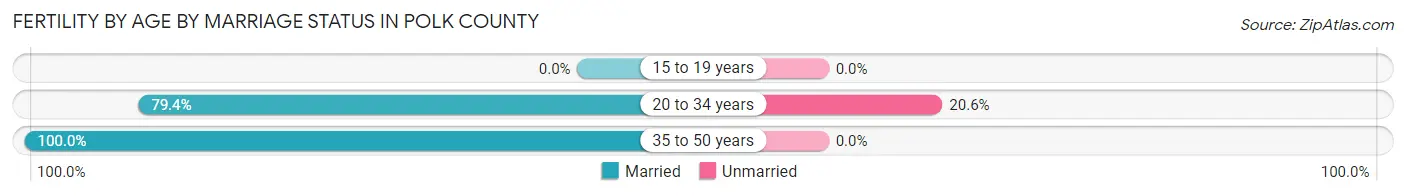
| Age Bracket | Married | Unmarried |
| 15 to 19 years | 0 (0.0%) | 0 (0.0%) |
| 20 to 34 years | 104 (79.4%) | 27 (20.6%) |
| 35 to 50 years | 3 (100.0%) | 0 (0.0%) |
| Total | 107 (79.8%) | 27 (20.2%) |
Fertility by Education in Polk County
Average fertility rate in Polk County is 37.0 births per 1,000 women. Women with the education attainment of graduate degree have the highest fertility rate of 55.0 births per 1,000 women, while women with the education attainment of high school diploma have the lowest fertility at 22.0 births per 1,000 women. Women with the education attainment of college or associate's degree represent 49.2% of all women with births.
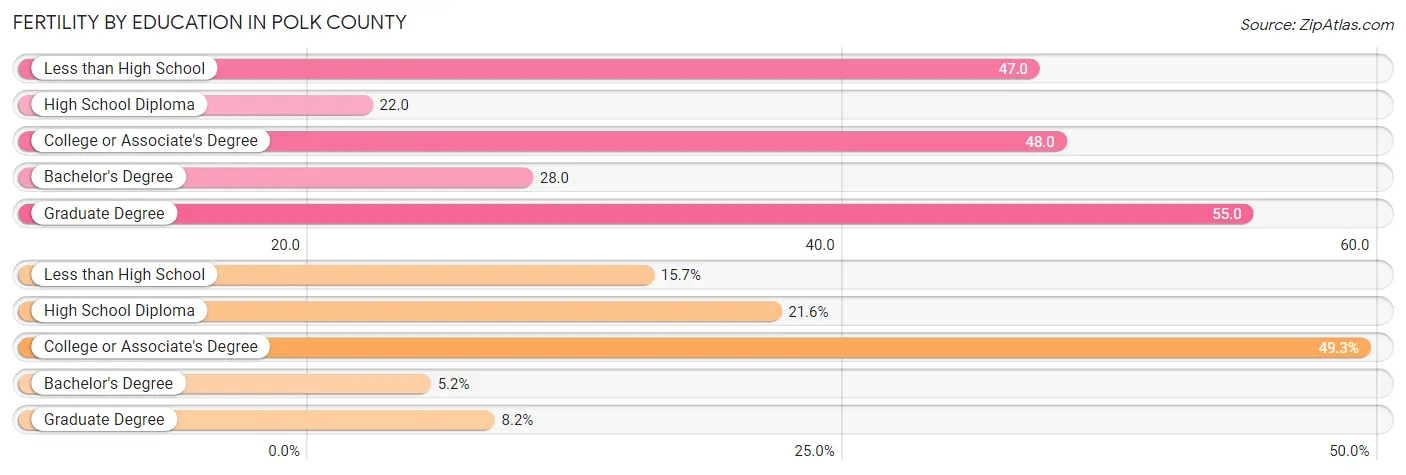
| Educational Attainment | Women with Births | Births / 1,000 Women |
| Less than High School | 21 (15.7%) | 47.0 |
| High School Diploma | 29 (21.6%) | 22.0 |
| College or Associate's Degree | 66 (49.2%) | 48.0 |
| Bachelor's Degree | 7 (5.2%) | 28.0 |
| Graduate Degree | 11 (8.2%) | 55.0 |
| Total | 134 (100.0%) | 37.0 |
Fertility by Education by Marriage Status in Polk County
20.2% of women with births in Polk County are unmarried. Women with the educational attainment of high school diploma are most likely to be married with 100.0% of them married at childbirth, while women with the educational attainment of less than high school are least likely to be married with 71.4% of them unmarried at childbirth.
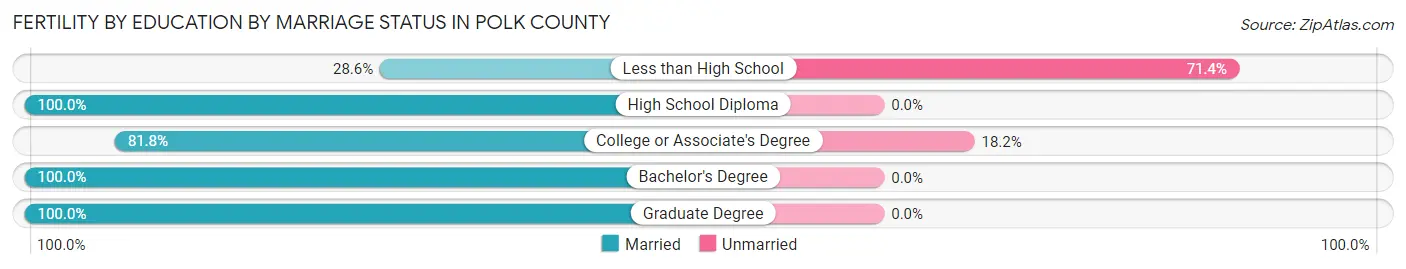
| Educational Attainment | Married | Unmarried |
| Less than High School | 6 (28.6%) | 15 (71.4%) |
| High School Diploma | 29 (100.0%) | 0 (0.0%) |
| College or Associate's Degree | 54 (81.8%) | 12 (18.2%) |
| Bachelor's Degree | 7 (100.0%) | 0 (0.0%) |
| Graduate Degree | 11 (100.0%) | 0 (0.0%) |
| Total | 107 (79.8%) | 27 (20.2%) |
Income in Polk County
Income Overview in Polk County
Per Capita Income in Polk County is $30,400, while median incomes of families and households are $69,871 and $53,775 respectively.
| Characteristic | Number | Measure |
| Per Capita Income | 17,620 | $30,400 |
| Median Family Income | 4,897 | $69,871 |
| Mean Family Income | 4,897 | $89,613 |
| Median Household Income | 7,101 | $53,775 |
| Mean Household Income | 7,101 | $73,916 |
| Income Deficit | 4,897 | $8,073 |
| Wage / Income Gap (%) | 17,620 | 40.44% |
| Wage / Income Gap ($) | 17,620 | 59.56¢ per $1 |
| Gini / Inequality Index | 17,620 | 0.46 |
Earnings by Sex in Polk County
Average Earnings in Polk County are $34,868, $42,968 for men and $25,593 for women, a difference of 40.4%.
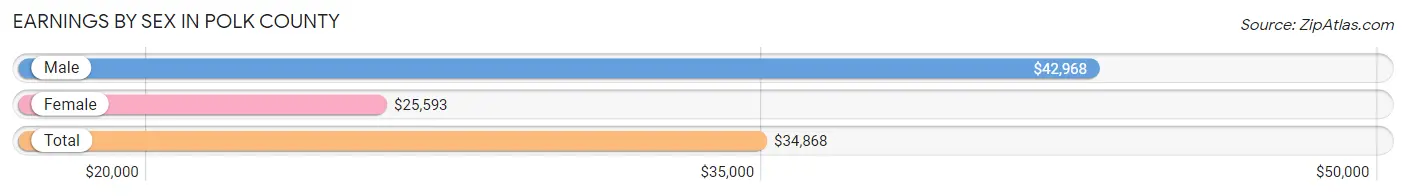
| Sex | Number | Average Earnings |
| Male | 4,641 (54.5%) | $42,968 |
| Female | 3,879 (45.5%) | $25,593 |
| Total | 8,520 (100.0%) | $34,868 |
Earnings by Sex by Income Bracket in Polk County
The most common earnings brackets in Polk County are $100,000+ for men (649 | 14.0%) and $25,000 to $29,999 for women (364 | 9.4%).
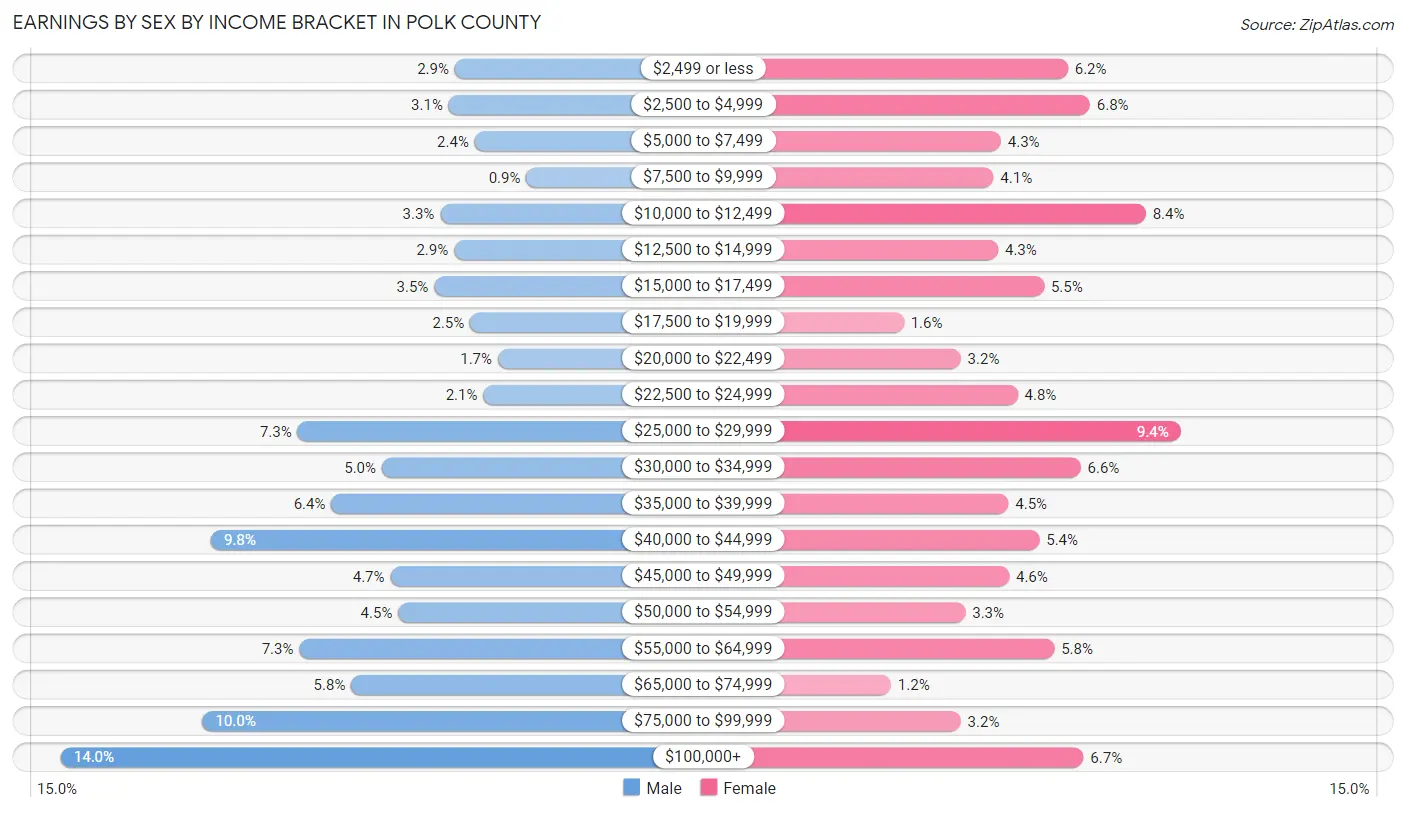
| Income | Male | Female |
| $2,499 or less | 135 (2.9%) | 241 (6.2%) |
| $2,500 to $4,999 | 143 (3.1%) | 265 (6.8%) |
| $5,000 to $7,499 | 109 (2.4%) | 168 (4.3%) |
| $7,500 to $9,999 | 42 (0.9%) | 160 (4.1%) |
| $10,000 to $12,499 | 154 (3.3%) | 326 (8.4%) |
| $12,500 to $14,999 | 136 (2.9%) | 165 (4.3%) |
| $15,000 to $17,499 | 162 (3.5%) | 215 (5.5%) |
| $17,500 to $19,999 | 115 (2.5%) | 62 (1.6%) |
| $20,000 to $22,499 | 79 (1.7%) | 124 (3.2%) |
| $22,500 to $24,999 | 98 (2.1%) | 186 (4.8%) |
| $25,000 to $29,999 | 340 (7.3%) | 364 (9.4%) |
| $30,000 to $34,999 | 230 (5.0%) | 255 (6.6%) |
| $35,000 to $39,999 | 296 (6.4%) | 176 (4.5%) |
| $40,000 to $44,999 | 453 (9.8%) | 210 (5.4%) |
| $45,000 to $49,999 | 219 (4.7%) | 177 (4.6%) |
| $50,000 to $54,999 | 209 (4.5%) | 129 (3.3%) |
| $55,000 to $64,999 | 338 (7.3%) | 226 (5.8%) |
| $65,000 to $74,999 | 270 (5.8%) | 48 (1.2%) |
| $75,000 to $99,999 | 464 (10.0%) | 124 (3.2%) |
| $100,000+ | 649 (14.0%) | 258 (6.7%) |
| Total | 4,641 (100.0%) | 3,879 (100.0%) |
Earnings by Sex by Educational Attainment in Polk County
Average earnings in Polk County are $47,065 for men and $28,900 for women, a difference of 38.6%. Men with an educational attainment of graduate degree enjoy the highest average annual earnings of $78,958, while those with less than high school education earn the least with $43,569. Women with an educational attainment of graduate degree earn the most with the average annual earnings of $55,766, while those with less than high school education have the smallest earnings of $15,500.
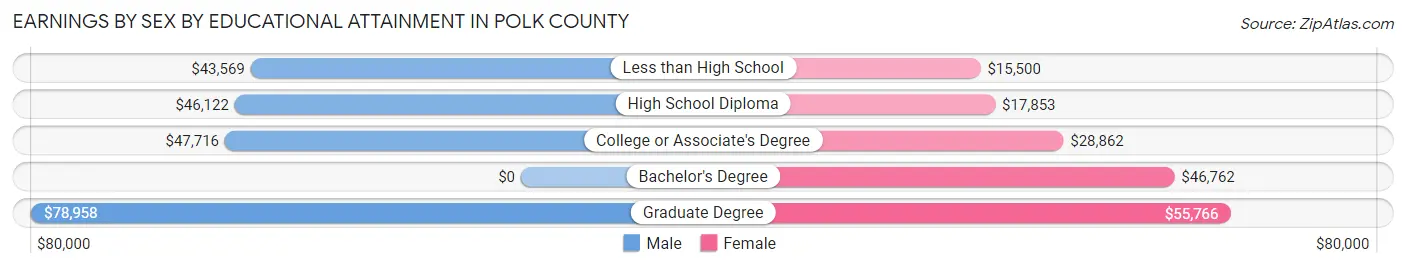
| Educational Attainment | Male Income | Female Income |
| Less than High School | $43,569 | $15,500 |
| High School Diploma | $46,122 | $17,853 |
| College or Associate's Degree | $47,716 | $28,862 |
| Bachelor's Degree | - | - |
| Graduate Degree | $78,958 | $55,766 |
| Total | $47,065 | $28,900 |
Family Income in Polk County
Family Income Brackets in Polk County
According to the Polk County family income data, there are 945 families falling into the $50,000 to $74,999 income range, which is the most common income bracket and makes up 19.3% of all families. Conversely, the less than $10,000 income bracket is the least frequent group with only 93 families (1.9%) belonging to this category.
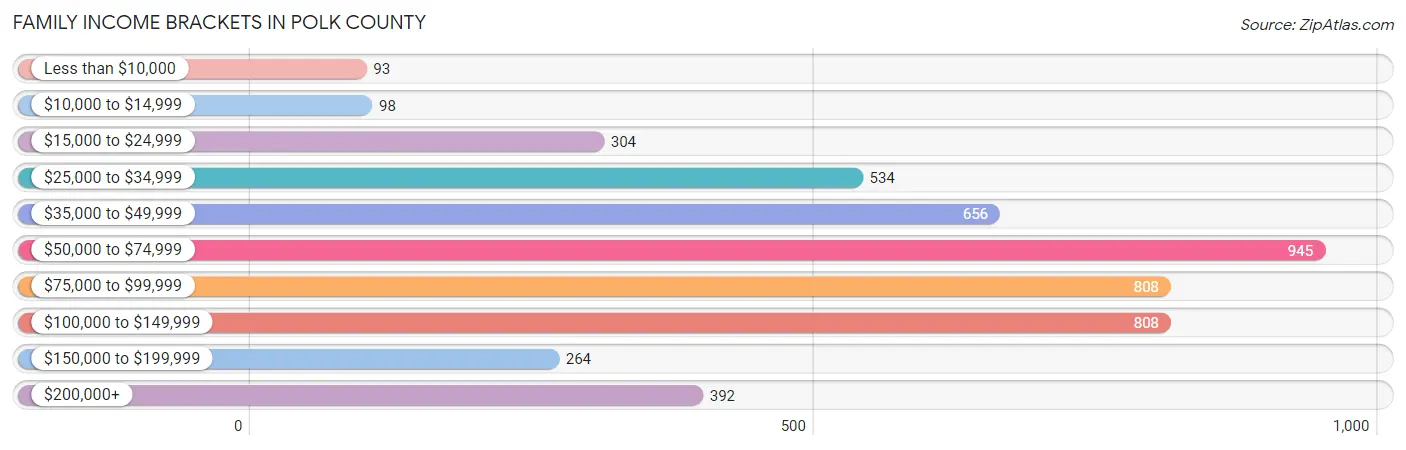
| Income Bracket | # Families | % Families |
| Less than $10,000 | 93 | 1.9% |
| $10,000 to $14,999 | 98 | 2.0% |
| $15,000 to $24,999 | 304 | 6.2% |
| $25,000 to $34,999 | 534 | 10.9% |
| $35,000 to $49,999 | 656 | 13.4% |
| $50,000 to $74,999 | 945 | 19.3% |
| $75,000 to $99,999 | 808 | 16.5% |
| $100,000 to $149,999 | 808 | 16.5% |
| $150,000 to $199,999 | 264 | 5.4% |
| $200,000+ | 392 | 8.0% |
Family Income by Famaliy Size in Polk County
6-person families (231 | 4.7%) account for the highest median family income in Polk County with $230,074 per family, while 6-person families (231 | 4.7%) have the highest median income of $38,346 per family member.
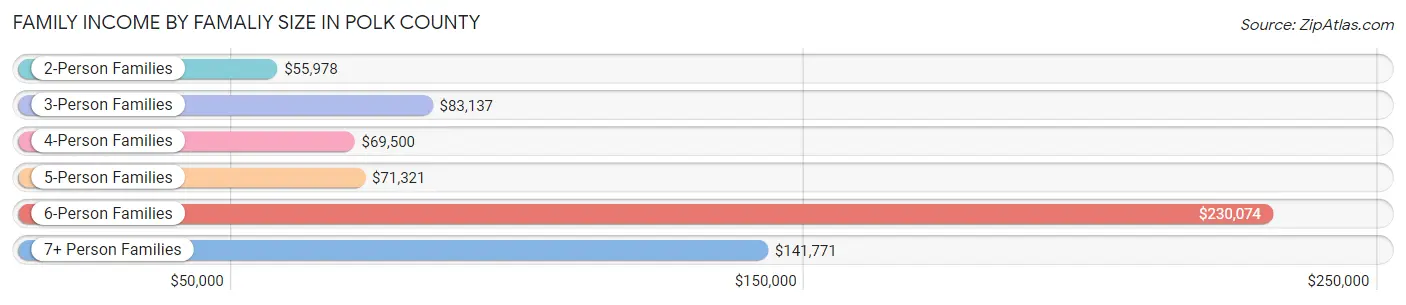
| Income Bracket | # Families | Median Income |
| 2-Person Families | 2,572 (52.5%) | $55,978 |
| 3-Person Families | 1,173 (23.9%) | $83,137 |
| 4-Person Families | 688 (14.1%) | $69,500 |
| 5-Person Families | 181 (3.7%) | $71,321 |
| 6-Person Families | 231 (4.7%) | $230,074 |
| 7+ Person Families | 52 (1.1%) | $141,771 |
| Total | 4,897 (100.0%) | $69,871 |
Family Income by Number of Earners in Polk County
The median family income in Polk County is $69,871, with families comprising 3+ earners (551) having the highest median family income of $149,728, while families with no earners (992) have the lowest median family income of $35,934, accounting for 11.3% and 20.3% of families, respectively.
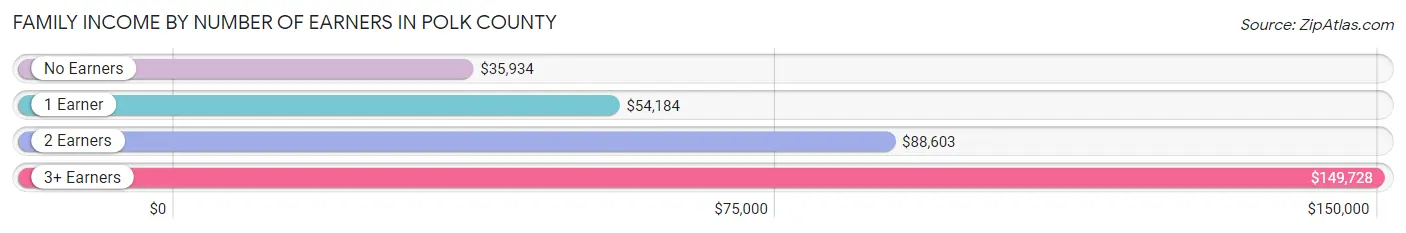
| Number of Earners | # Families | Median Income |
| No Earners | 992 (20.3%) | $35,934 |
| 1 Earner | 1,670 (34.1%) | $54,184 |
| 2 Earners | 1,684 (34.4%) | $88,603 |
| 3+ Earners | 551 (11.3%) | $149,728 |
| Total | 4,897 (100.0%) | $69,871 |
Household Income in Polk County
Household Income Brackets in Polk County
With 1,165 households falling in the category, the $50,000 to $74,999 income range is the most frequent in Polk County, accounting for 16.4% of all households. In contrast, only 334 households (4.7%) fall into the $150,000 to $199,999 income bracket, making it the least populous group.
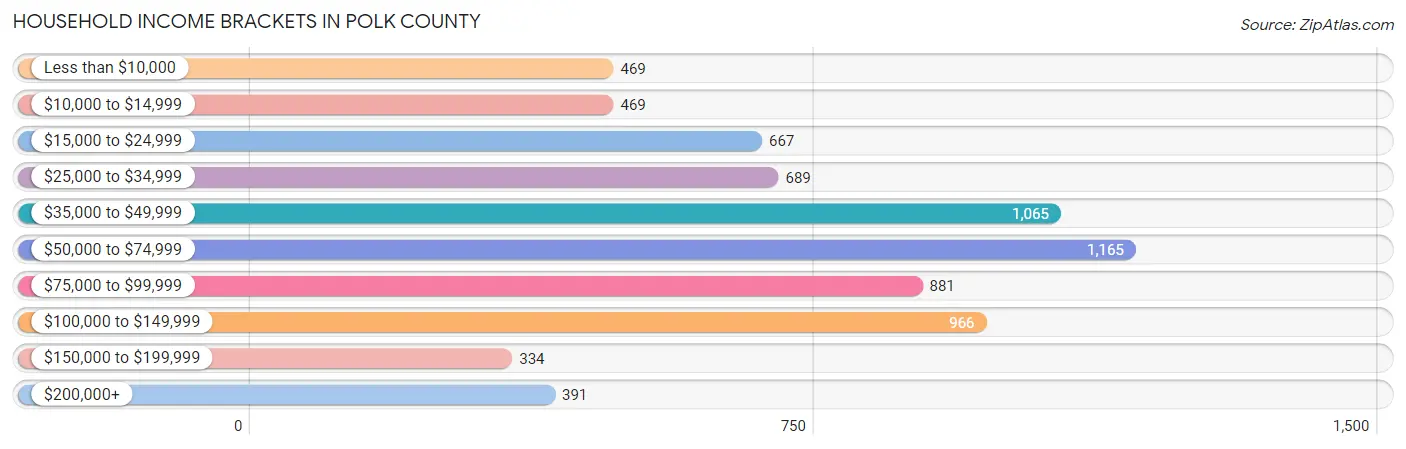
| Income Bracket | # Households | % Households |
| Less than $10,000 | 469 | 6.6% |
| $10,000 to $14,999 | 469 | 6.6% |
| $15,000 to $24,999 | 667 | 9.4% |
| $25,000 to $34,999 | 689 | 9.7% |
| $35,000 to $49,999 | 1,065 | 15.0% |
| $50,000 to $74,999 | 1,165 | 16.4% |
| $75,000 to $99,999 | 881 | 12.4% |
| $100,000 to $149,999 | 966 | 13.6% |
| $150,000 to $199,999 | 334 | 4.7% |
| $200,000+ | 391 | 5.5% |
Household Income by Householder Age in Polk County
The median household income in Polk County is $53,775, with the highest median household income of $68,321 found in the 25 to 44 years age bracket for the primary householder. A total of 1,545 households (21.8%) fall into this category. Meanwhile, the 65+ years age bracket for the primary householder has the lowest median household income of $40,833, with 2,150 households (30.3%) in this group.
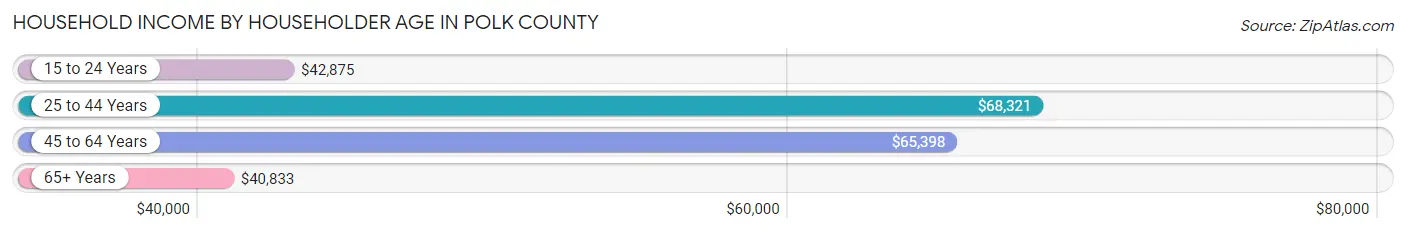
| Income Bracket | # Households | Median Income |
| 15 to 24 Years | 243 (3.4%) | $42,875 |
| 25 to 44 Years | 1,545 (21.8%) | $68,321 |
| 45 to 64 Years | 3,163 (44.5%) | $65,398 |
| 65+ Years | 2,150 (30.3%) | $40,833 |
| Total | 7,101 (100.0%) | $53,775 |
Poverty in Polk County
Income Below Poverty by Sex and Age in Polk County
With 10.2% poverty level for males and 15.5% for females among the residents of Polk County, under 5 year old males and 15 year old females are the most vulnerable to poverty, with 109 males (28.7%) and 58 females (34.1%) in their respective age groups living below the poverty level.
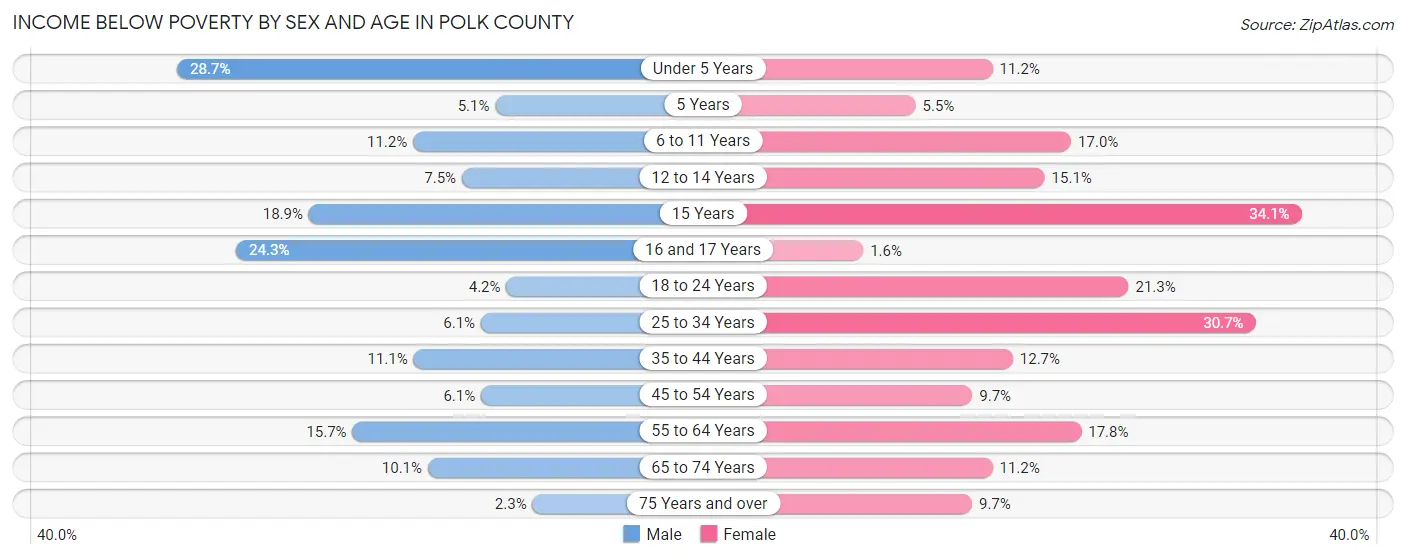
| Age Bracket | Male | Female |
| Under 5 Years | 109 (28.7%) | 42 (11.2%) |
| 5 Years | 5 (5.1%) | 8 (5.5%) |
| 6 to 11 Years | 50 (11.2%) | 86 (17.0%) |
| 12 to 14 Years | 25 (7.5%) | 53 (15.1%) |
| 15 Years | 24 (18.9%) | 58 (34.1%) |
| 16 and 17 Years | 60 (24.3%) | 2 (1.6%) |
| 18 to 24 Years | 28 (4.2%) | 129 (21.3%) |
| 25 to 34 Years | 55 (6.1%) | 269 (30.7%) |
| 35 to 44 Years | 105 (11.1%) | 128 (12.7%) |
| 45 to 54 Years | 83 (6.1%) | 120 (9.7%) |
| 55 to 64 Years | 209 (15.7%) | 252 (17.8%) |
| 65 to 74 Years | 109 (10.1%) | 124 (11.2%) |
| 75 Years and over | 15 (2.3%) | 74 (9.7%) |
| Total | 877 (10.2%) | 1,345 (15.5%) |
Income Above Poverty by Sex and Age in Polk County
According to the poverty statistics in Polk County, males aged 75 years and over and females aged 16 and 17 years are the age groups that are most secure financially, with 97.7% of males and 98.4% of females in these age groups living above the poverty line.
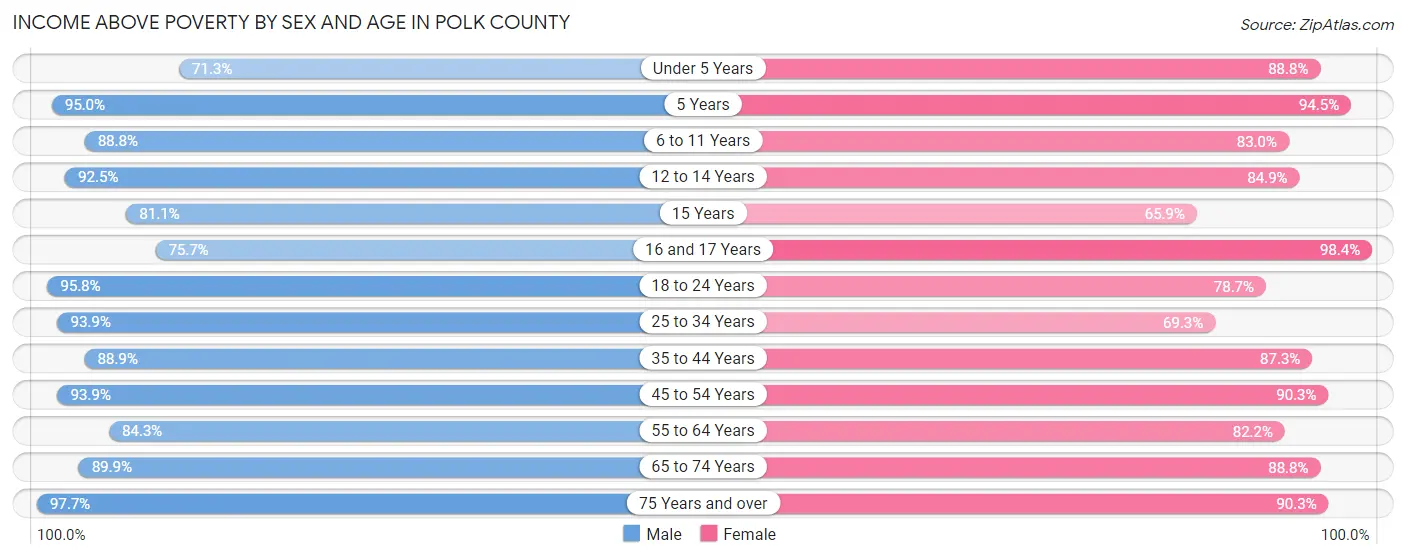
| Age Bracket | Male | Female |
| Under 5 Years | 271 (71.3%) | 333 (88.8%) |
| 5 Years | 94 (95.0%) | 138 (94.5%) |
| 6 to 11 Years | 398 (88.8%) | 419 (83.0%) |
| 12 to 14 Years | 307 (92.5%) | 299 (84.9%) |
| 15 Years | 103 (81.1%) | 112 (65.9%) |
| 16 and 17 Years | 187 (75.7%) | 124 (98.4%) |
| 18 to 24 Years | 634 (95.8%) | 477 (78.7%) |
| 25 to 34 Years | 843 (93.9%) | 607 (69.3%) |
| 35 to 44 Years | 839 (88.9%) | 880 (87.3%) |
| 45 to 54 Years | 1,276 (93.9%) | 1,119 (90.3%) |
| 55 to 64 Years | 1,126 (84.3%) | 1,165 (82.2%) |
| 65 to 74 Years | 975 (89.9%) | 984 (88.8%) |
| 75 Years and over | 641 (97.7%) | 691 (90.3%) |
| Total | 7,694 (89.8%) | 7,348 (84.5%) |
Income Below Poverty Among Married-Couple Families in Polk County
The poverty statistics for married-couple families in Polk County show that 3.8% or 143 of the total 3,755 families live below the poverty line. Families with 3 or 4 children have the highest poverty rate of 10.6%, comprising of 18 families. On the other hand, families with 5 or more children have the lowest poverty rate of 0.0%, which includes 0 families.
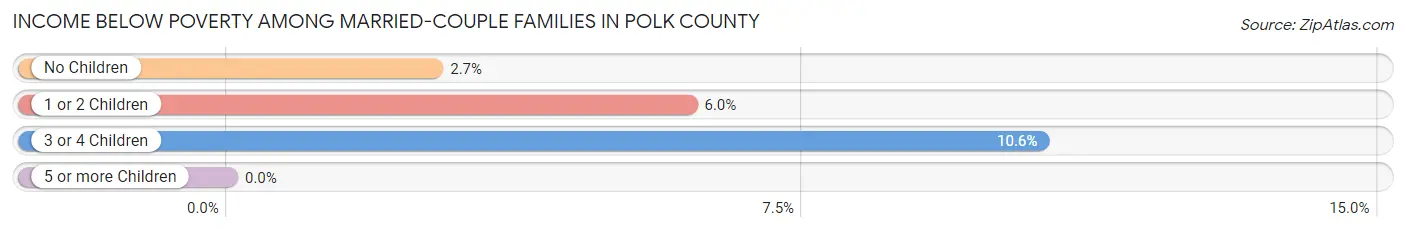
| Children | Above Poverty | Below Poverty |
| No Children | 2,619 (97.3%) | 72 (2.7%) |
| 1 or 2 Children | 830 (94.0%) | 53 (6.0%) |
| 3 or 4 Children | 152 (89.4%) | 18 (10.6%) |
| 5 or more Children | 11 (100.0%) | 0 (0.0%) |
| Total | 3,612 (96.2%) | 143 (3.8%) |
Income Below Poverty Among Single-Parent Households in Polk County
According to the poverty data in Polk County, 14.8% or 54 single-father households and 22.1% or 172 single-mother households are living below the poverty line. Among single-father households, those with no children have the highest poverty rate, with 37 households (25.0%) experiencing poverty. Likewise, among single-mother households, those with 1 or 2 children have the highest poverty rate, with 114 households (34.3%) falling below the poverty line.
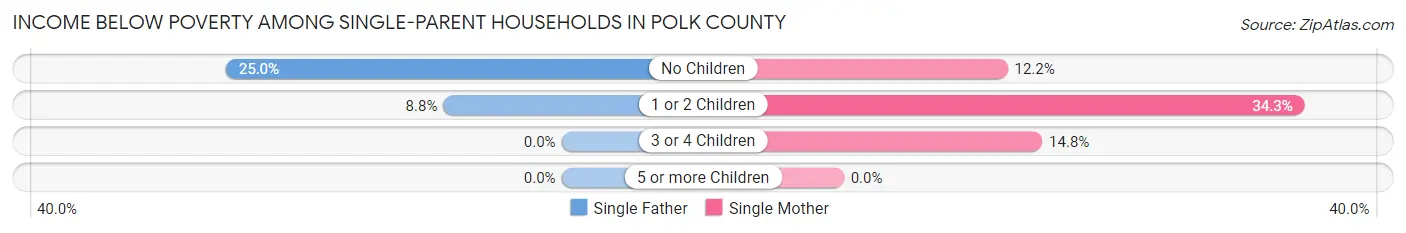
| Children | Single Father | Single Mother |
| No Children | 37 (25.0%) | 37 (12.2%) |
| 1 or 2 Children | 17 (8.8%) | 114 (34.3%) |
| 3 or 4 Children | 0 (0.0%) | 21 (14.8%) |
| 5 or more Children | 0 (0.0%) | 0 (0.0%) |
| Total | 54 (14.8%) | 172 (22.1%) |
Income Below Poverty Among Married-Couple vs Single-Parent Households in Polk County
The poverty data for Polk County shows that 143 of the married-couple family households (3.8%) and 226 of the single-parent households (19.8%) are living below the poverty level. Within the married-couple family households, those with 3 or 4 children have the highest poverty rate, with 18 households (10.6%) falling below the poverty line. Among the single-parent households, those with 1 or 2 children have the highest poverty rate, with 131 household (24.9%) living below poverty.
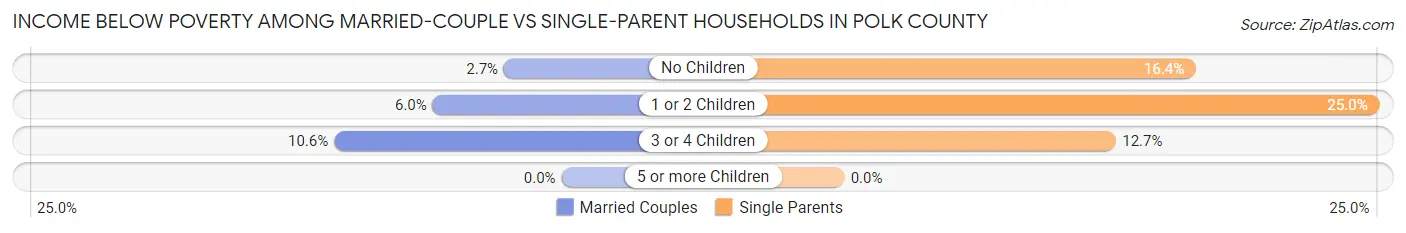
| Children | Married-Couple Families | Single-Parent Households |
| No Children | 72 (2.7%) | 74 (16.4%) |
| 1 or 2 Children | 53 (6.0%) | 131 (24.9%) |
| 3 or 4 Children | 18 (10.6%) | 21 (12.7%) |
| 5 or more Children | 0 (0.0%) | 0 (0.0%) |
| Total | 143 (3.8%) | 226 (19.8%) |
Employment Characteristics in Polk County
Employment by Class of Employer in Polk County
Among the 7,143 employed individuals in Polk County, private company employees (4,944 | 69.2%), local government employees (659 | 9.2%), and not-for-profit organizations (570 | 8.0%) make up the most common classes of employment.
| Employer Class | # Employees | % Employees |
| Private Company Employees | 4,944 | 69.2% |
| Self-Employed (Incorporated) | 141 | 2.0% |
| Self-Employed (Not Incorporated) | 503 | 7.0% |
| Not-for-profit Organizations | 570 | 8.0% |
| Local Government Employees | 659 | 9.2% |
| State Government Employees | 241 | 3.4% |
| Federal Government Employees | 85 | 1.2% |
| Unpaid Family Workers | 0 | 0.0% |
| Total | 7,143 | 100.0% |
Employment Status by Age in Polk County
According to the labor force statistics for Polk County, out of the total population over 16 years of age (14,552), 54.6% or 7,945 individuals are in the labor force, with 7.8% or 620 of them unemployed. The age group with the highest labor force participation rate is 20 to 24 years, with 81.7% or 771 individuals in the labor force. Within the labor force, the 20 to 24 years age range has the highest percentage of unemployed individuals, with 25.0% or 193 of them being unemployed.
| Age Bracket | In Labor Force | Unemployed |
| 16 to 19 Years | 291 (40.7%) | 47 (16.2%) |
| 20 to 24 Years | 771 (81.7%) | 193 (25.0%) |
| 25 to 29 Years | 714 (78.4%) | 47 (6.6%) |
| 30 to 34 Years | 707 (77.0%) | 58 (8.2%) |
| 35 to 44 Years | 1,496 (75.0%) | 208 (13.9%) |
| 45 to 54 Years | 2,133 (81.6%) | 11 (0.5%) |
| 55 to 59 Years | 884 (57.5%) | 57 (6.4%) |
| 60 to 64 Years | 619 (50.2%) | 0 (0.0%) |
| 65 to 74 Years | 272 (12.4%) | 0 (0.0%) |
| 75 Years and over | 63 (4.2%) | 0 (0.0%) |
| Total | 7,945 (54.6%) | 620 (7.8%) |
Employment Status by Educational Attainment in Polk County
According to labor force statistics for Polk County, 71.1% of individuals (6,548) out of the total population between 25 and 64 years of age (9,209) are in the labor force, with 5.8% or 380 of them being unemployed. The group with the highest labor force participation rate are those with the educational attainment of bachelor's degree or higher, with 86.2% or 1,068 individuals in the labor force. Within the labor force, individuals with less than high school education have the highest percentage of unemployment, with 16.5% or 111 of them being unemployed.
| Educational Attainment | In Labor Force | Unemployed |
| Less than High School | 672 (62.9%) | 176 (16.5%) |
| High School Diploma | 2,521 (67.8%) | 253 (6.8%) |
| College / Associate Degree | 2,291 (72.0%) | 121 (3.8%) |
| Bachelor's Degree or higher | 1,068 (86.2%) | 11 (0.9%) |
| Total | 6,548 (71.1%) | 534 (5.8%) |
Employment Occupations by Sex in Polk County
Management, Business, Science and Arts Occupations
The most common Management, Business, Science and Arts occupations in Polk County are Management (628 | 8.6%), Community & Social Service (606 | 8.3%), Health Diagnosing & Treating (504 | 6.9%), Education Instruction & Library (426 | 5.8%), and Health Technologists (324 | 4.4%).
Management, Business, Science and Arts Occupations by Sex
Within the Management, Business, Science and Arts occupations in Polk County, the most male-oriented occupations are Life, Physical & Social Science (100.0%), Arts, Media & Entertainment (84.6%), and Architecture & Engineering (73.7%), while the most female-oriented occupations are Legal Services & Support (100.0%), Health Technologists (95.4%), and Computers & Mathematics (81.8%).
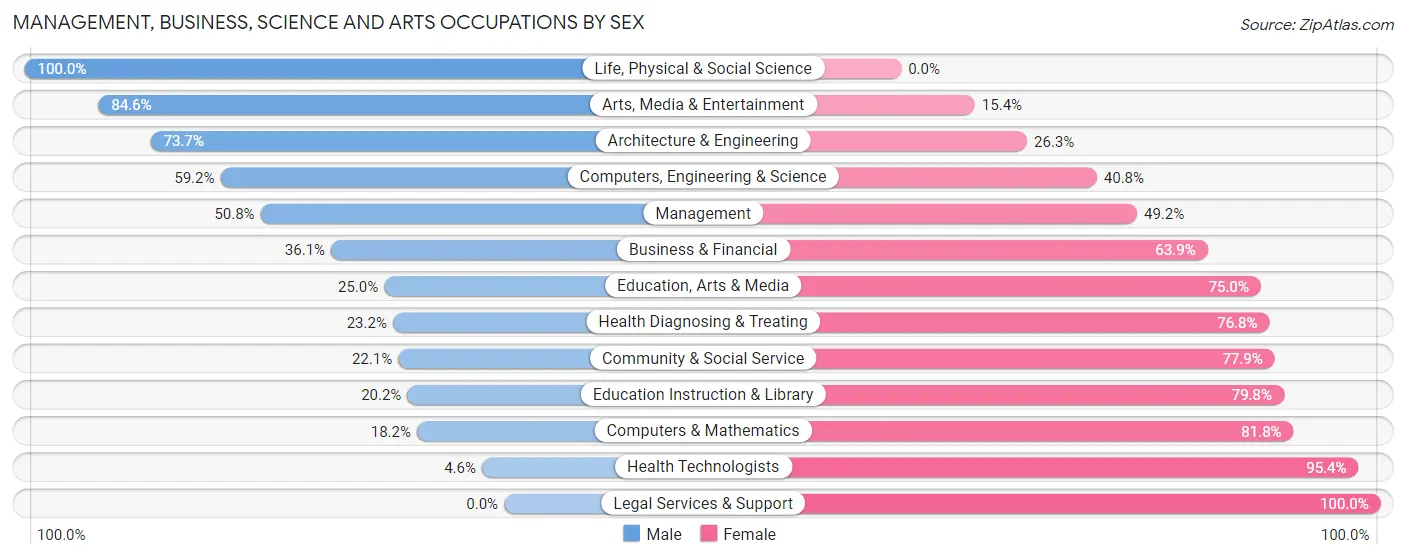
| Occupation | Male | Female |
| Management | 319 (50.8%) | 309 (49.2%) |
| Business & Financial | 100 (36.1%) | 177 (63.9%) |
| Computers, Engineering & Science | 187 (59.2%) | 129 (40.8%) |
| Computers & Mathematics | 16 (18.2%) | 72 (81.8%) |
| Architecture & Engineering | 160 (73.7%) | 57 (26.3%) |
| Life, Physical & Social Science | 11 (100.0%) | 0 (0.0%) |
| Community & Social Service | 134 (22.1%) | 472 (77.9%) |
| Education, Arts & Media | 26 (25.0%) | 78 (75.0%) |
| Legal Services & Support | 0 (0.0%) | 50 (100.0%) |
| Education Instruction & Library | 86 (20.2%) | 340 (79.8%) |
| Arts, Media & Entertainment | 22 (84.6%) | 4 (15.4%) |
| Health Diagnosing & Treating | 117 (23.2%) | 387 (76.8%) |
| Health Technologists | 15 (4.6%) | 309 (95.4%) |
| Total (Category) | 857 (36.8%) | 1,474 (63.2%) |
| Total (Overall) | 4,192 (57.2%) | 3,136 (42.8%) |
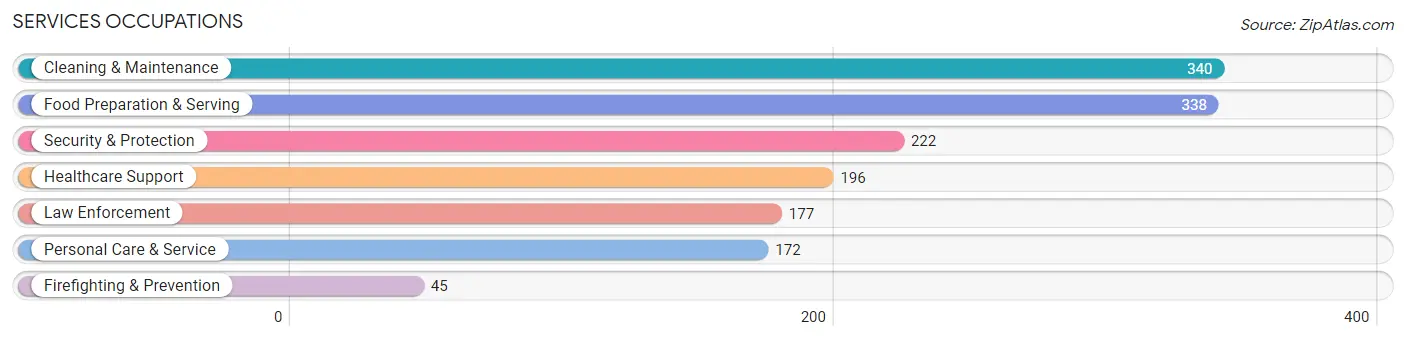
Services Occupations
The most common Services occupations in Polk County are Cleaning & Maintenance (340 | 4.6%), Food Preparation & Serving (338 | 4.6%), Security & Protection (222 | 3.0%), Healthcare Support (196 | 2.7%), and Law Enforcement (177 | 2.4%).
Services Occupations by Sex
Within the Services occupations in Polk County, the most male-oriented occupations are Firefighting & Prevention (100.0%), Security & Protection (94.6%), and Law Enforcement (93.2%), while the most female-oriented occupations are Healthcare Support (95.9%), Food Preparation & Serving (80.5%), and Personal Care & Service (75.0%).
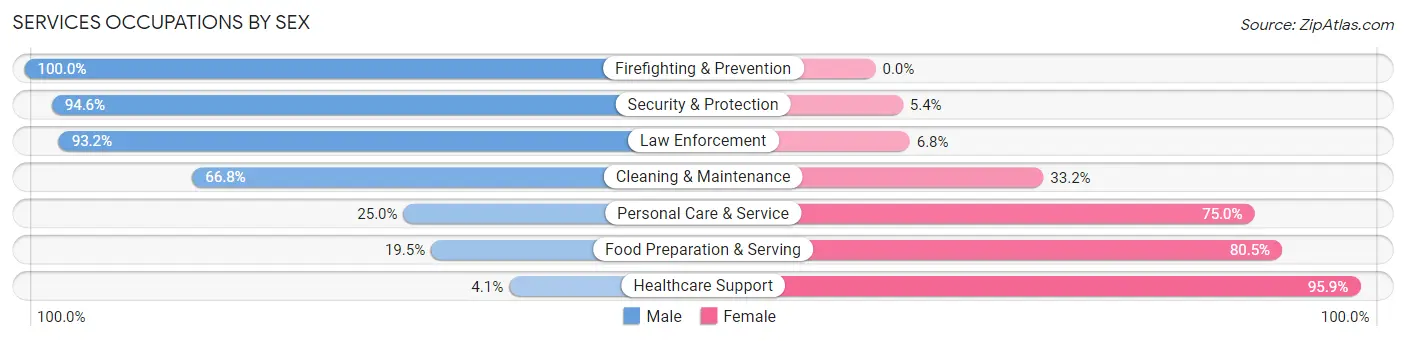
| Occupation | Male | Female |
| Healthcare Support | 8 (4.1%) | 188 (95.9%) |
| Security & Protection | 210 (94.6%) | 12 (5.4%) |
| Firefighting & Prevention | 45 (100.0%) | 0 (0.0%) |
| Law Enforcement | 165 (93.2%) | 12 (6.8%) |
| Food Preparation & Serving | 66 (19.5%) | 272 (80.5%) |
| Cleaning & Maintenance | 227 (66.8%) | 113 (33.2%) |
| Personal Care & Service | 43 (25.0%) | 129 (75.0%) |
| Total (Category) | 554 (43.7%) | 714 (56.3%) |
| Total (Overall) | 4,192 (57.2%) | 3,136 (42.8%) |
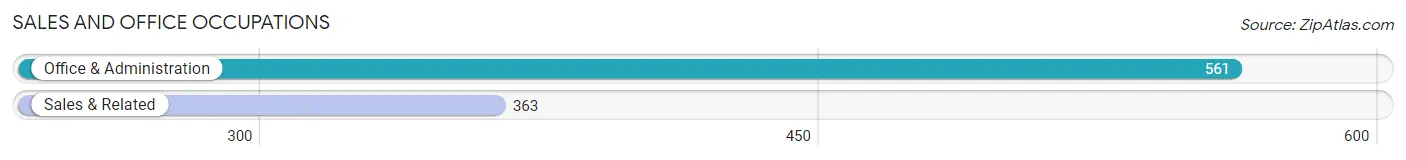
Sales and Office Occupations
The most common Sales and Office occupations in Polk County are Office & Administration (561 | 7.7%), and Sales & Related (363 | 5.0%).
Sales and Office Occupations by Sex
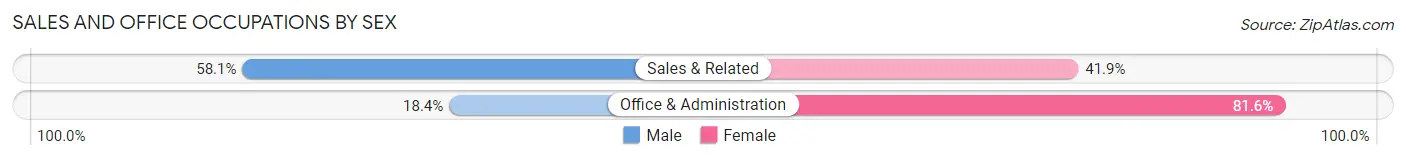
| Occupation | Male | Female |
| Sales & Related | 211 (58.1%) | 152 (41.9%) |
| Office & Administration | 103 (18.4%) | 458 (81.6%) |
| Total (Category) | 314 (34.0%) | 610 (66.0%) |
| Total (Overall) | 4,192 (57.2%) | 3,136 (42.8%) |
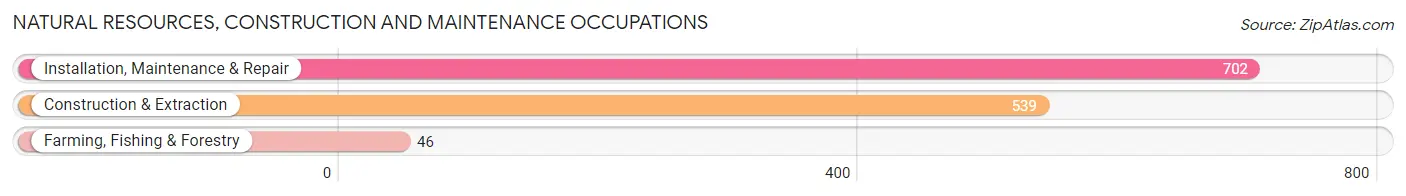
Natural Resources, Construction and Maintenance Occupations
The most common Natural Resources, Construction and Maintenance occupations in Polk County are Installation, Maintenance & Repair (702 | 9.6%), Construction & Extraction (539 | 7.4%), and Farming, Fishing & Forestry (46 | 0.6%).
Natural Resources, Construction and Maintenance Occupations by Sex
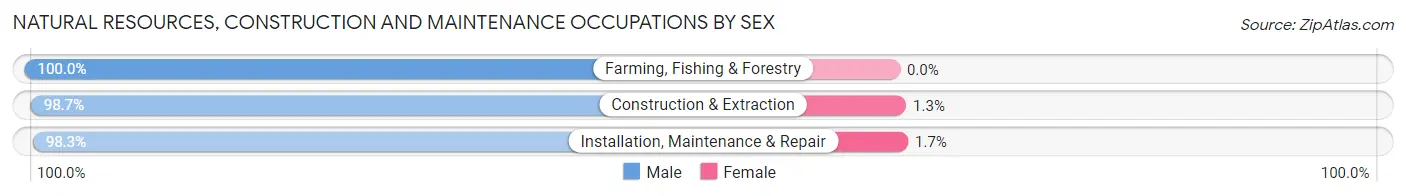
| Occupation | Male | Female |
| Farming, Fishing & Forestry | 46 (100.0%) | 0 (0.0%) |
| Construction & Extraction | 532 (98.7%) | 7 (1.3%) |
| Installation, Maintenance & Repair | 690 (98.3%) | 12 (1.7%) |
| Total (Category) | 1,268 (98.5%) | 19 (1.5%) |
| Total (Overall) | 4,192 (57.2%) | 3,136 (42.8%) |
Production, Transportation and Moving Occupations
The most common Production, Transportation and Moving occupations in Polk County are Production (769 | 10.5%), Material Moving (416 | 5.7%), and Transportation (333 | 4.5%).
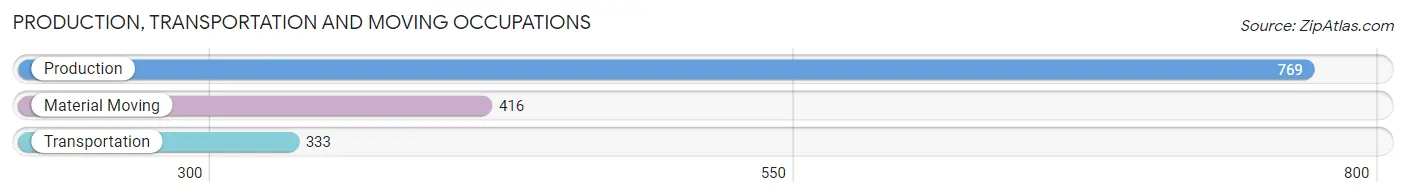
Production, Transportation and Moving Occupations by Sex
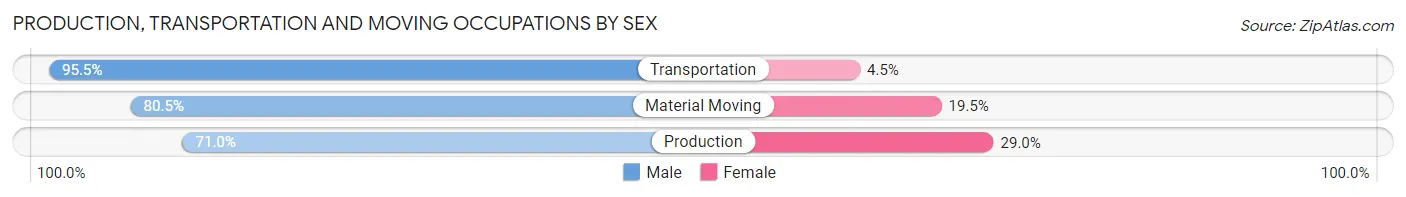
| Occupation | Male | Female |
| Production | 546 (71.0%) | 223 (29.0%) |
| Transportation | 318 (95.5%) | 15 (4.5%) |
| Material Moving | 335 (80.5%) | 81 (19.5%) |
| Total (Category) | 1,199 (79.0%) | 319 (21.0%) |
| Total (Overall) | 4,192 (57.2%) | 3,136 (42.8%) |
Employment Industries by Sex in Polk County
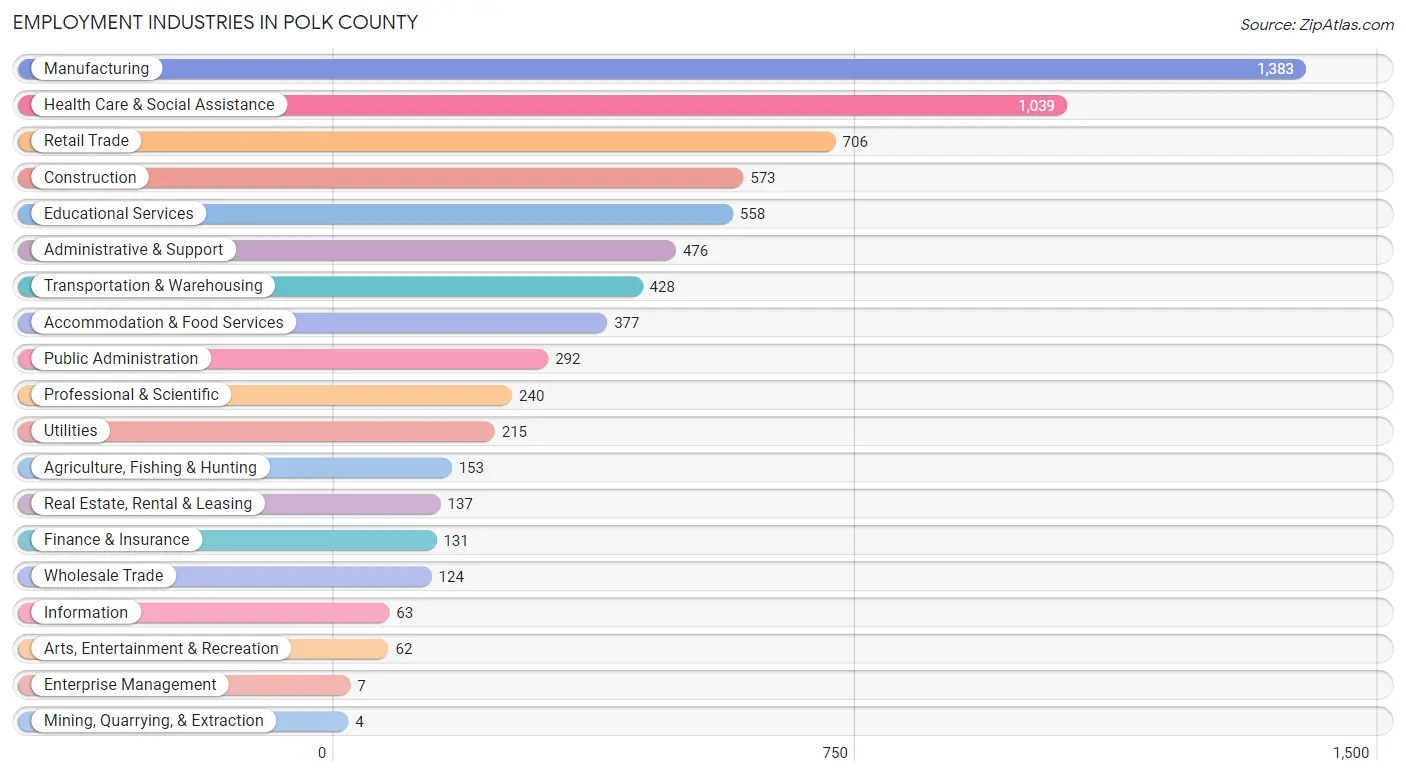
Employment Industries in Polk County
The major employment industries in Polk County include Manufacturing (1,383 | 18.9%), Health Care & Social Assistance (1,039 | 14.2%), Retail Trade (706 | 9.6%), Construction (573 | 7.8%), and Educational Services (558 | 7.6%).
Employment Industries by Sex in Polk County
The Polk County industries that see more men than women are Mining, Quarrying, & Extraction (100.0%), Wholesale Trade (100.0%), and Information (100.0%), whereas the industries that tend to have a higher number of women are Enterprise Management (100.0%), Health Care & Social Assistance (82.1%), and Accommodation & Food Services (74.5%).
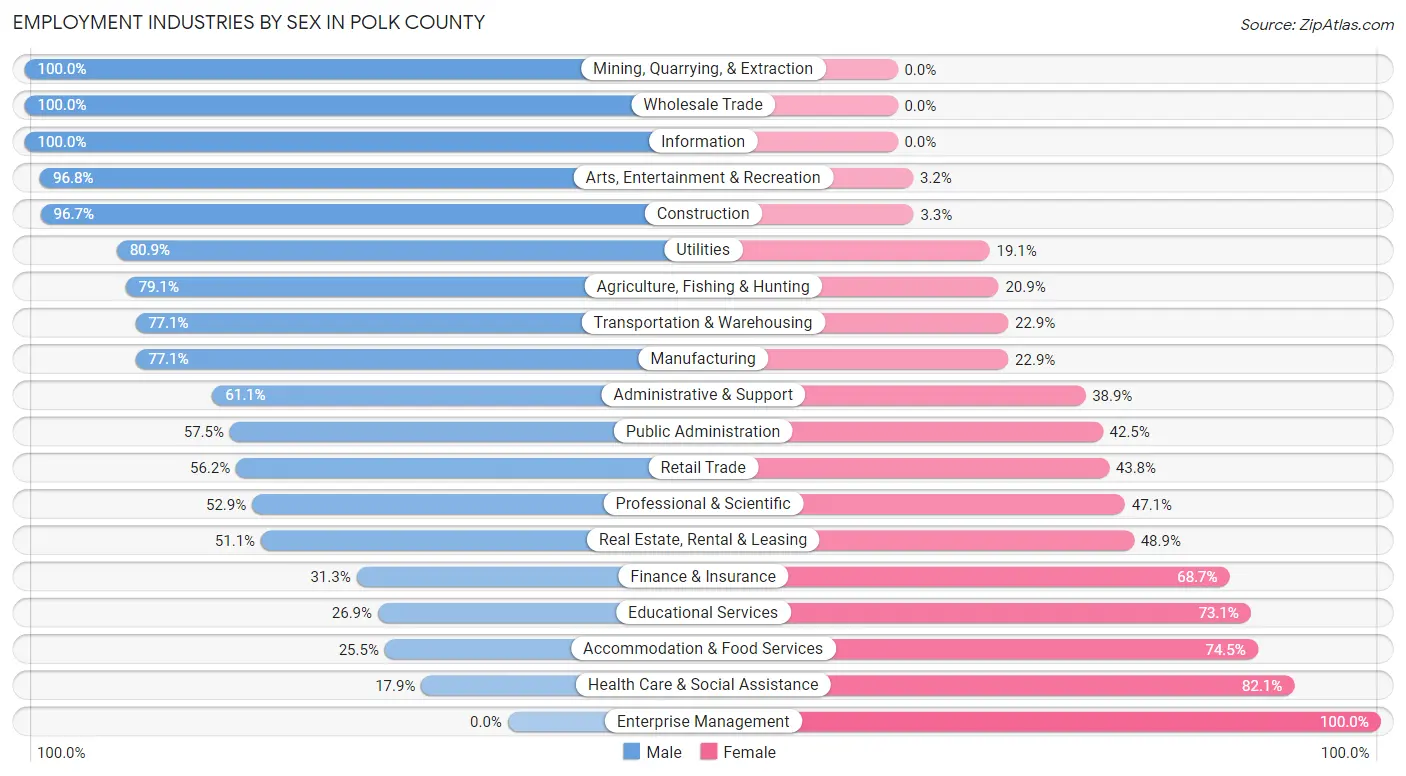
| Industry | Male | Female |
| Agriculture, Fishing & Hunting | 121 (79.1%) | 32 (20.9%) |
| Mining, Quarrying, & Extraction | 4 (100.0%) | 0 (0.0%) |
| Construction | 554 (96.7%) | 19 (3.3%) |
| Manufacturing | 1,066 (77.1%) | 317 (22.9%) |
| Wholesale Trade | 124 (100.0%) | 0 (0.0%) |
| Retail Trade | 397 (56.2%) | 309 (43.8%) |
| Transportation & Warehousing | 330 (77.1%) | 98 (22.9%) |
| Utilities | 174 (80.9%) | 41 (19.1%) |
| Information | 63 (100.0%) | 0 (0.0%) |
| Finance & Insurance | 41 (31.3%) | 90 (68.7%) |
| Real Estate, Rental & Leasing | 70 (51.1%) | 67 (48.9%) |
| Professional & Scientific | 127 (52.9%) | 113 (47.1%) |
| Enterprise Management | 0 (0.0%) | 7 (100.0%) |
| Administrative & Support | 291 (61.1%) | 185 (38.9%) |
| Educational Services | 150 (26.9%) | 408 (73.1%) |
| Health Care & Social Assistance | 186 (17.9%) | 853 (82.1%) |
| Arts, Entertainment & Recreation | 60 (96.8%) | 2 (3.2%) |
| Accommodation & Food Services | 96 (25.5%) | 281 (74.5%) |
| Public Administration | 168 (57.5%) | 124 (42.5%) |
| Total | 4,192 (57.2%) | 3,136 (42.8%) |
Education in Polk County
School Enrollment in Polk County
The most common levels of schooling among the 3,246 students in Polk County are high school (909 | 28.0%), middle school (881 | 27.1%), and elementary school (639 | 19.7%).
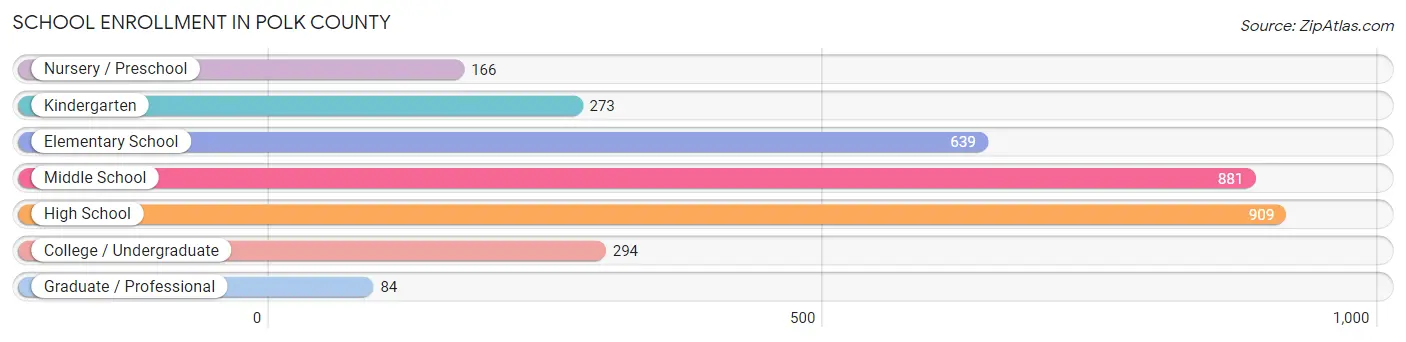
| School Level | # Students | % Students |
| Nursery / Preschool | 166 | 5.1% |
| Kindergarten | 273 | 8.4% |
| Elementary School | 639 | 19.7% |
| Middle School | 881 | 27.1% |
| High School | 909 | 28.0% |
| College / Undergraduate | 294 | 9.1% |
| Graduate / Professional | 84 | 2.6% |
| Total | 3,246 | 100.0% |
School Enrollment by Age by Funding Source in Polk County
Out of a total of 3,246 students who are enrolled in schools in Polk County, 698 (21.5%) attend a private institution, while the remaining 2,548 (78.5%) are enrolled in public schools. The age group of 35 years and over has the highest likelihood of being enrolled in private schools, with 71 (55.9% in the age bracket) enrolled. Conversely, the age group of 3 to 4 year olds has the lowest likelihood of being enrolled in a private school, with 62 (100.0% in the age bracket) attending a public institution.
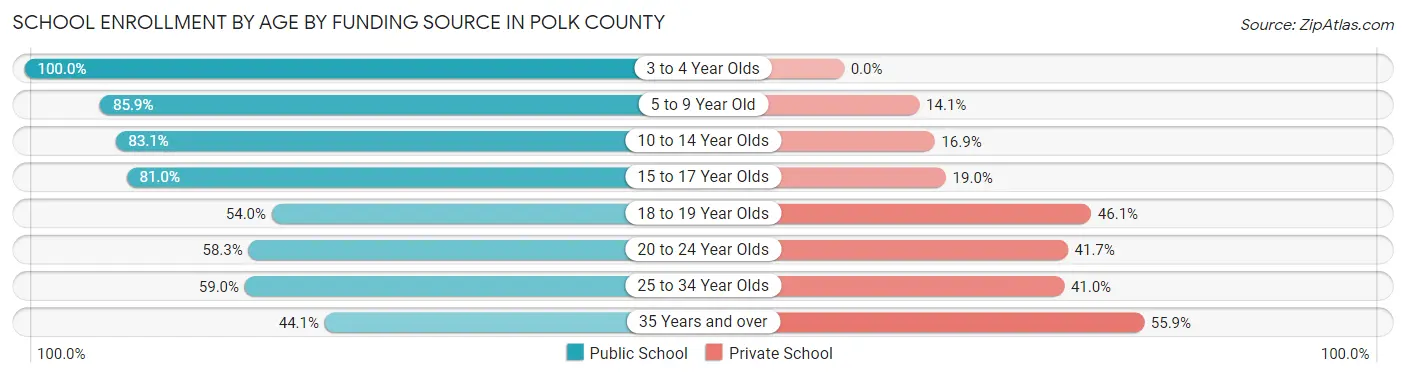
| Age Bracket | Public School | Private School |
| 3 to 4 Year Olds | 62 (100.0%) | 0 (0.0%) |
| 5 to 9 Year Old | 752 (85.9%) | 123 (14.1%) |
| 10 to 14 Year Olds | 889 (83.1%) | 181 (16.9%) |
| 15 to 17 Year Olds | 533 (81.0%) | 125 (19.0%) |
| 18 to 19 Year Olds | 123 (53.9%) | 105 (46.1%) |
| 20 to 24 Year Olds | 109 (58.3%) | 78 (41.7%) |
| 25 to 34 Year Olds | 23 (59.0%) | 16 (41.0%) |
| 35 Years and over | 56 (44.1%) | 71 (55.9%) |
| Total | 2,548 (78.5%) | 698 (21.5%) |
Educational Attainment by Field of Study in Polk County
Business (459 | 24.6%), science & technology (312 | 16.7%), education (297 | 15.9%), liberal arts & history (150 | 8.1%), and engineering (106 | 5.7%) are the most common fields of study among 1,864 individuals in Polk County who have obtained a bachelor's degree or higher.
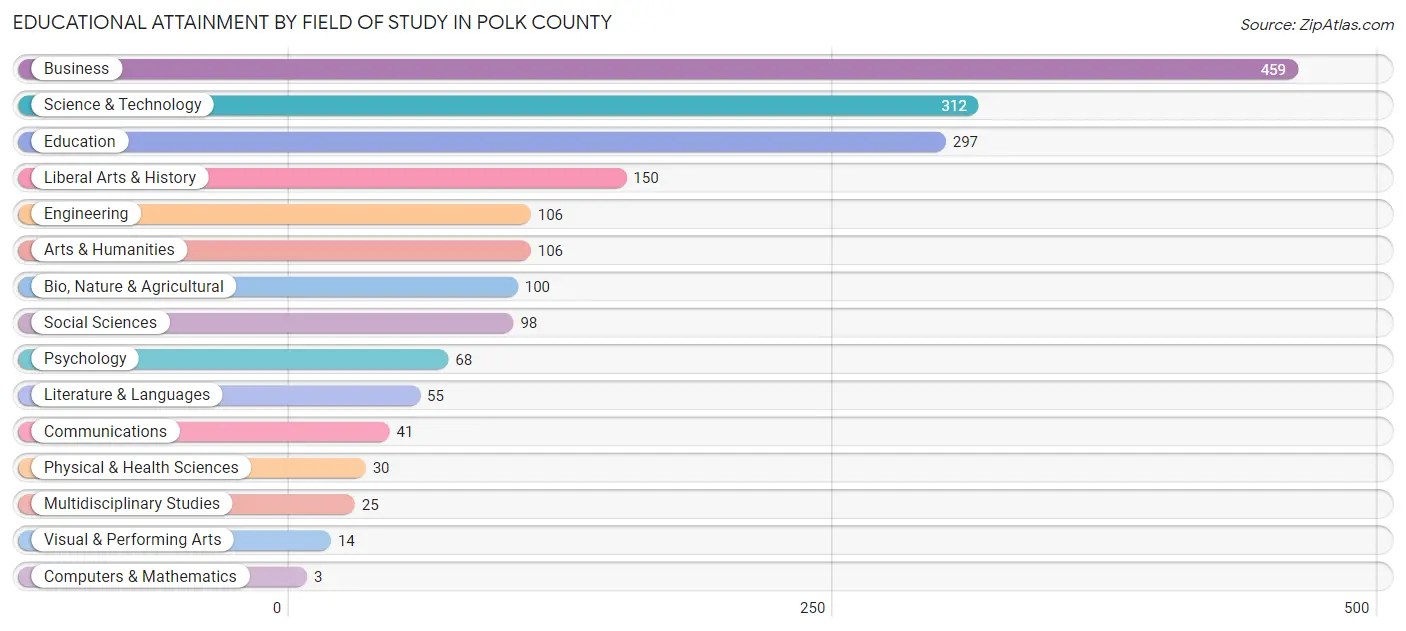
| Field of Study | # Graduates | % Graduates |
| Computers & Mathematics | 3 | 0.2% |
| Bio, Nature & Agricultural | 100 | 5.4% |
| Physical & Health Sciences | 30 | 1.6% |
| Psychology | 68 | 3.6% |
| Social Sciences | 98 | 5.3% |
| Engineering | 106 | 5.7% |
| Multidisciplinary Studies | 25 | 1.3% |
| Science & Technology | 312 | 16.7% |
| Business | 459 | 24.6% |
| Education | 297 | 15.9% |
| Literature & Languages | 55 | 2.9% |
| Liberal Arts & History | 150 | 8.1% |
| Visual & Performing Arts | 14 | 0.7% |
| Communications | 41 | 2.2% |
| Arts & Humanities | 106 | 5.7% |
| Total | 1,864 | 100.0% |
Transportation & Commute in Polk County
Vehicle Availability by Sex in Polk County
The most prevalent vehicle ownership categories in Polk County are males with 3 vehicles (1,414, accounting for 34.3%) and females with 3 vehicles (919, making up 46.9%).
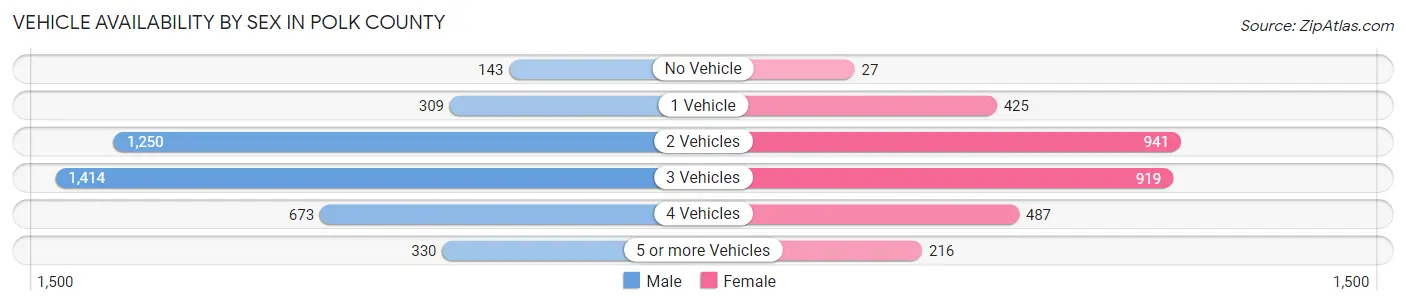
| Vehicles Available | Male | Female |
| No Vehicle | 143 (3.5%) | 27 (0.9%) |
| 1 Vehicle | 309 (7.5%) | 425 (14.1%) |
| 2 Vehicles | 1,250 (30.3%) | 941 (31.2%) |
| 3 Vehicles | 1,414 (34.3%) | 919 (30.5%) |
| 4 Vehicles | 673 (16.3%) | 487 (16.2%) |
| 5 or more Vehicles | 330 (8.0%) | 216 (7.2%) |
| Total | 4,119 (100.0%) | 3,015 (100.0%) |
Commute Time in Polk County
The most frequently occuring commute durations in Polk County are 30 to 34 minutes (1,598 commuters, 23.8%), 20 to 24 minutes (817 commuters, 12.1%), and 15 to 19 minutes (704 commuters, 10.5%).
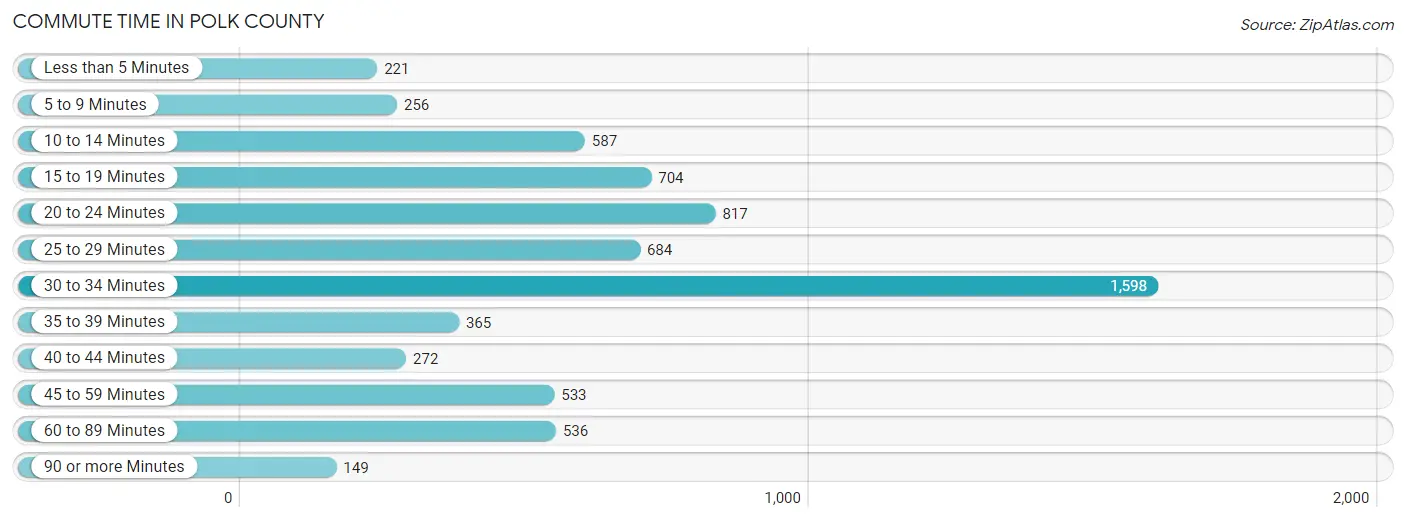
| Commute Time | # Commuters | % Commuters |
| Less than 5 Minutes | 221 | 3.3% |
| 5 to 9 Minutes | 256 | 3.8% |
| 10 to 14 Minutes | 587 | 8.7% |
| 15 to 19 Minutes | 704 | 10.5% |
| 20 to 24 Minutes | 817 | 12.1% |
| 25 to 29 Minutes | 684 | 10.2% |
| 30 to 34 Minutes | 1,598 | 23.8% |
| 35 to 39 Minutes | 365 | 5.4% |
| 40 to 44 Minutes | 272 | 4.1% |
| 45 to 59 Minutes | 533 | 7.9% |
| 60 to 89 Minutes | 536 | 8.0% |
| 90 or more Minutes | 149 | 2.2% |
Commute Time by Sex in Polk County
The most common commute times in Polk County are 30 to 34 minutes (946 commuters, 24.3%) for males and 30 to 34 minutes (652 commuters, 23.0%) for females.
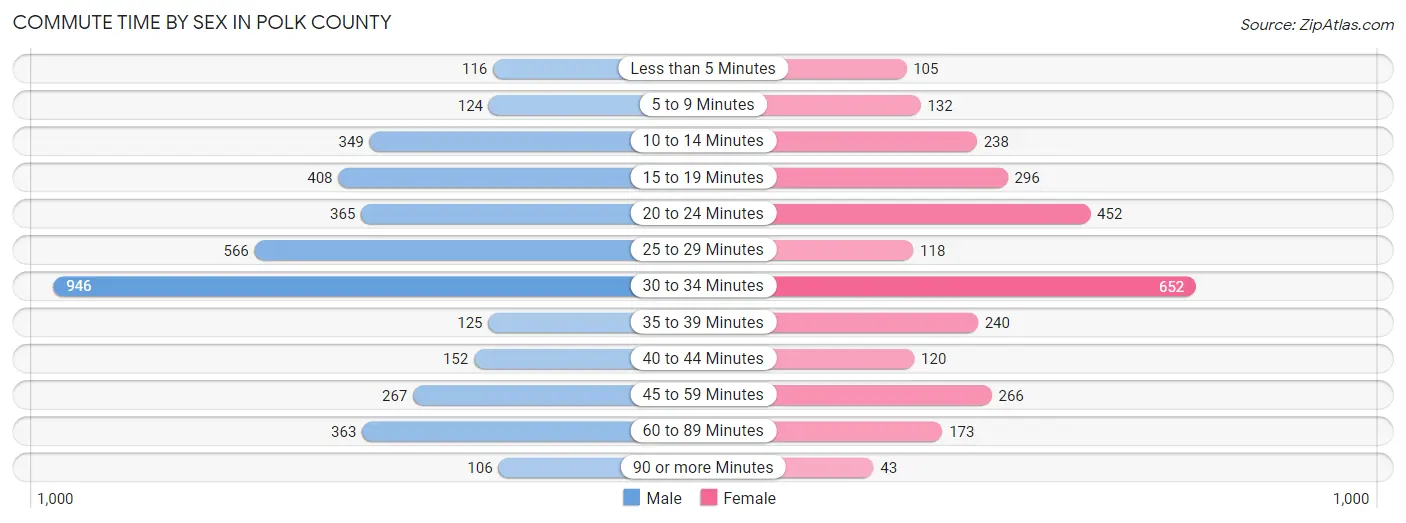
| Commute Time | Male | Female |
| Less than 5 Minutes | 116 (3.0%) | 105 (3.7%) |
| 5 to 9 Minutes | 124 (3.2%) | 132 (4.7%) |
| 10 to 14 Minutes | 349 (9.0%) | 238 (8.4%) |
| 15 to 19 Minutes | 408 (10.5%) | 296 (10.4%) |
| 20 to 24 Minutes | 365 (9.4%) | 452 (15.9%) |
| 25 to 29 Minutes | 566 (14.6%) | 118 (4.2%) |
| 30 to 34 Minutes | 946 (24.3%) | 652 (23.0%) |
| 35 to 39 Minutes | 125 (3.2%) | 240 (8.5%) |
| 40 to 44 Minutes | 152 (3.9%) | 120 (4.2%) |
| 45 to 59 Minutes | 267 (6.9%) | 266 (9.4%) |
| 60 to 89 Minutes | 363 (9.3%) | 173 (6.1%) |
| 90 or more Minutes | 106 (2.7%) | 43 (1.5%) |
Time of Departure to Work by Sex in Polk County
The most frequent times of departure to work in Polk County are 6:00 AM to 6:29 AM (641, 16.5%) for males and 7:00 AM to 7:29 AM (659, 23.3%) for females.
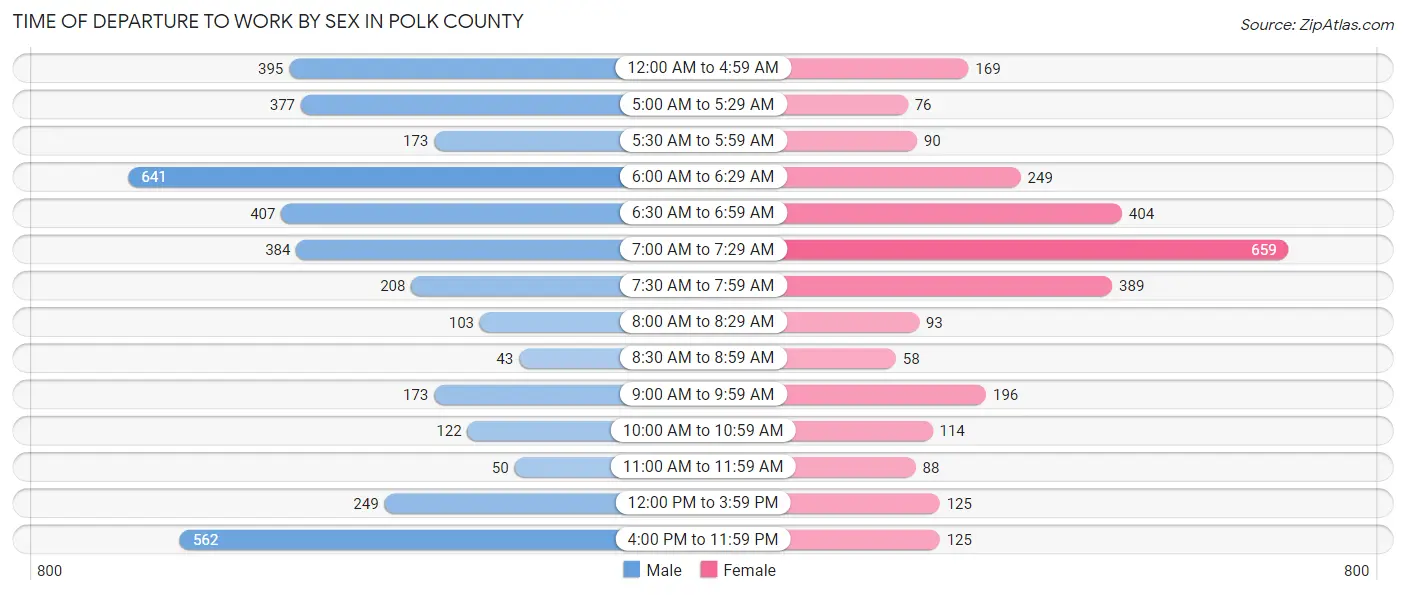
| Time of Departure | Male | Female |
| 12:00 AM to 4:59 AM | 395 (10.2%) | 169 (6.0%) |
| 5:00 AM to 5:29 AM | 377 (9.7%) | 76 (2.7%) |
| 5:30 AM to 5:59 AM | 173 (4.4%) | 90 (3.2%) |
| 6:00 AM to 6:29 AM | 641 (16.5%) | 249 (8.8%) |
| 6:30 AM to 6:59 AM | 407 (10.5%) | 404 (14.2%) |
| 7:00 AM to 7:29 AM | 384 (9.9%) | 659 (23.3%) |
| 7:30 AM to 7:59 AM | 208 (5.3%) | 389 (13.7%) |
| 8:00 AM to 8:29 AM | 103 (2.6%) | 93 (3.3%) |
| 8:30 AM to 8:59 AM | 43 (1.1%) | 58 (2.1%) |
| 9:00 AM to 9:59 AM | 173 (4.4%) | 196 (6.9%) |
| 10:00 AM to 10:59 AM | 122 (3.1%) | 114 (4.0%) |
| 11:00 AM to 11:59 AM | 50 (1.3%) | 88 (3.1%) |
| 12:00 PM to 3:59 PM | 249 (6.4%) | 125 (4.4%) |
| 4:00 PM to 11:59 PM | 562 (14.5%) | 125 (4.4%) |
| Total | 3,887 (100.0%) | 2,835 (100.0%) |
Housing Occupancy in Polk County
Occupancy by Ownership in Polk County
Of the total 7,101 dwellings in Polk County, owner-occupied units account for 5,601 (78.9%), while renter-occupied units make up 1,500 (21.1%).
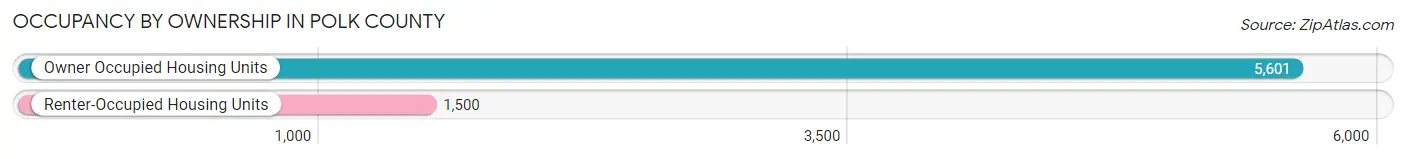
| Occupancy | # Housing Units | % Housing Units |
| Owner Occupied Housing Units | 5,601 | 78.9% |
| Renter-Occupied Housing Units | 1,500 | 21.1% |
| Total Occupied Housing Units | 7,101 | 100.0% |
Occupancy by Household Size in Polk County
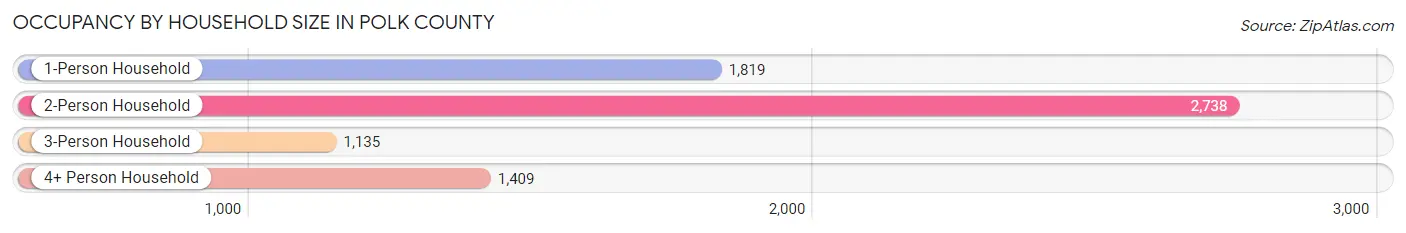
| Household Size | # Housing Units | % Housing Units |
| 1-Person Household | 1,819 | 25.6% |
| 2-Person Household | 2,738 | 38.6% |
| 3-Person Household | 1,135 | 16.0% |
| 4+ Person Household | 1,409 | 19.8% |
| Total Housing Units | 7,101 | 100.0% |
Occupancy by Ownership by Household Size in Polk County
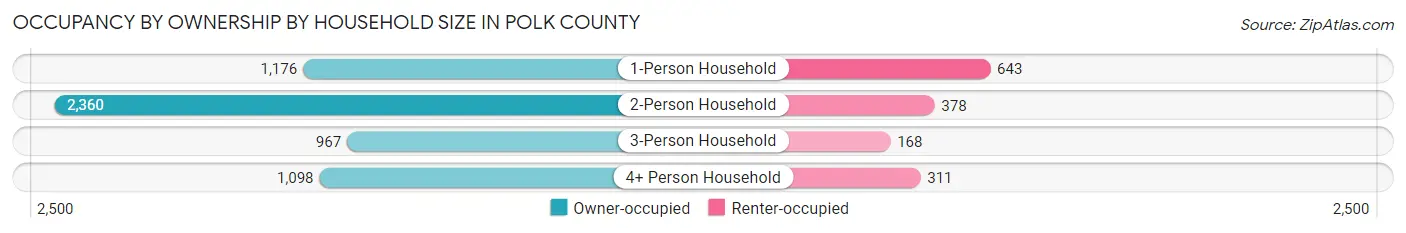
| Household Size | Owner-occupied | Renter-occupied |
| 1-Person Household | 1,176 (64.6%) | 643 (35.3%) |
| 2-Person Household | 2,360 (86.2%) | 378 (13.8%) |
| 3-Person Household | 967 (85.2%) | 168 (14.8%) |
| 4+ Person Household | 1,098 (77.9%) | 311 (22.1%) |
| Total Housing Units | 5,601 (78.9%) | 1,500 (21.1%) |
Occupancy by Educational Attainment in Polk County
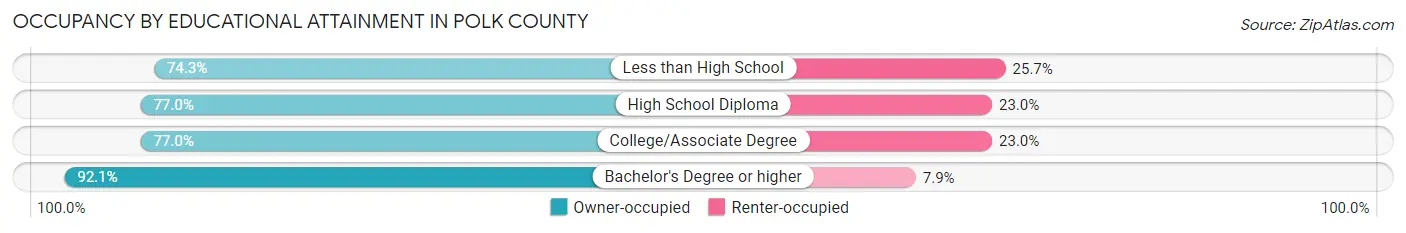
| Household Size | Owner-occupied | Renter-occupied |
| Less than High School | 817 (74.3%) | 282 (25.7%) |
| High School Diploma | 1,827 (77.0%) | 545 (23.0%) |
| College/Associate Degree | 1,973 (77.0%) | 589 (23.0%) |
| Bachelor's Degree or higher | 984 (92.1%) | 84 (7.9%) |
Occupancy by Age of Householder in Polk County
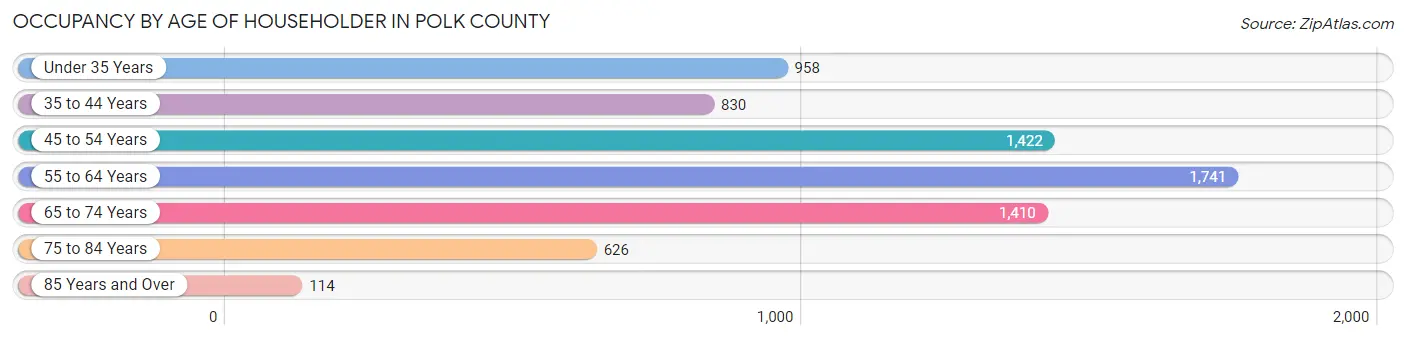
| Age Bracket | # Households | % Households |
| Under 35 Years | 958 | 13.5% |
| 35 to 44 Years | 830 | 11.7% |
| 45 to 54 Years | 1,422 | 20.0% |
| 55 to 64 Years | 1,741 | 24.5% |
| 65 to 74 Years | 1,410 | 19.9% |
| 75 to 84 Years | 626 | 8.8% |
| 85 Years and Over | 114 | 1.6% |
| Total | 7,101 | 100.0% |
Housing Finances in Polk County
Median Income by Occupancy in Polk County
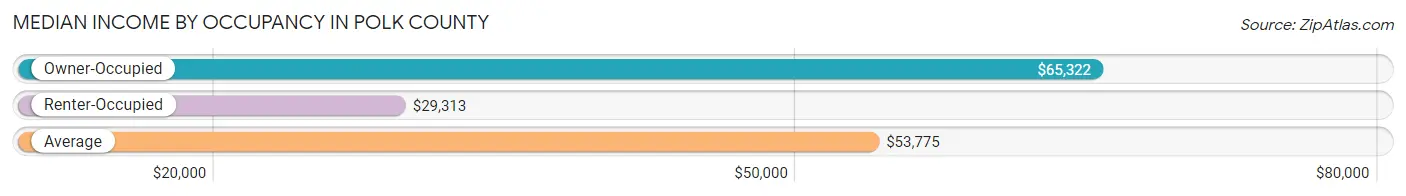
| Occupancy Type | # Households | Median Income |
| Owner-Occupied | 5,601 (78.9%) | $65,322 |
| Renter-Occupied | 1,500 (21.1%) | $29,313 |
| Average | 7,101 (100.0%) | $53,775 |
Occupancy by Householder Income Bracket in Polk County
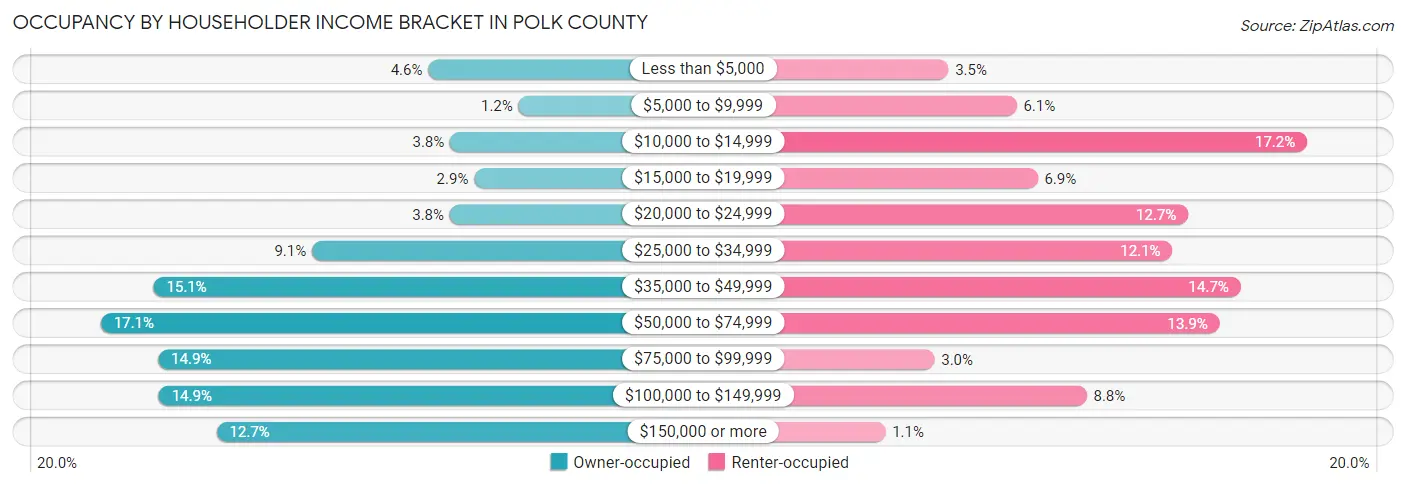
| Income Bracket | Owner-occupied | Renter-occupied |
| Less than $5,000 | 259 (4.6%) | 53 (3.5%) |
| $5,000 to $9,999 | 66 (1.2%) | 92 (6.1%) |
| $10,000 to $14,999 | 212 (3.8%) | 258 (17.2%) |
| $15,000 to $19,999 | 161 (2.9%) | 104 (6.9%) |
| $20,000 to $24,999 | 213 (3.8%) | 190 (12.7%) |
| $25,000 to $34,999 | 507 (9.0%) | 181 (12.1%) |
| $35,000 to $49,999 | 845 (15.1%) | 220 (14.7%) |
| $50,000 to $74,999 | 958 (17.1%) | 208 (13.9%) |
| $75,000 to $99,999 | 835 (14.9%) | 45 (3.0%) |
| $100,000 to $149,999 | 834 (14.9%) | 132 (8.8%) |
| $150,000 or more | 711 (12.7%) | 17 (1.1%) |
| Total | 5,601 (100.0%) | 1,500 (100.0%) |
Monthly Housing Cost Tiers in Polk County

| Monthly Cost | Owner-occupied | Renter-occupied |
| Less than $300 | 1,252 (22.4%) | 41 (2.7%) |
| $300 to $499 | 1,239 (22.1%) | 117 (7.8%) |
| $500 to $799 | 1,049 (18.7%) | 528 (35.2%) |
| $800 to $999 | 634 (11.3%) | 352 (23.5%) |
| $1,000 to $1,499 | 663 (11.8%) | 15 (1.0%) |
| $1,500 to $1,999 | 483 (8.6%) | 5 (0.3%) |
| $2,000 to $2,499 | 163 (2.9%) | 0 (0.0%) |
| $2,500 to $2,999 | 100 (1.8%) | 0 (0.0%) |
| $3,000 or more | 18 (0.3%) | 0 (0.0%) |
| Total | 5,601 (100.0%) | 1,500 (100.0%) |
Physical Housing Characteristics in Polk County
Housing Structures in Polk County
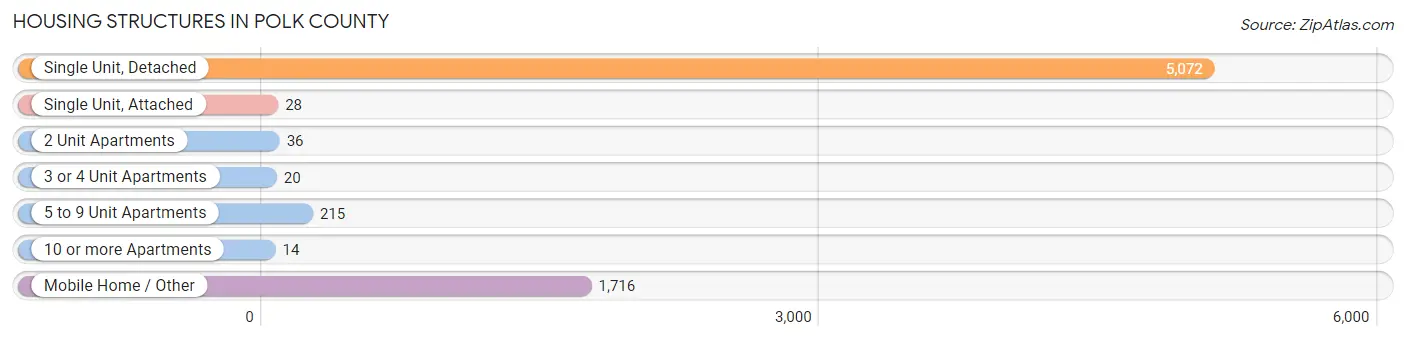
| Structure Type | # Housing Units | % Housing Units |
| Single Unit, Detached | 5,072 | 71.4% |
| Single Unit, Attached | 28 | 0.4% |
| 2 Unit Apartments | 36 | 0.5% |
| 3 or 4 Unit Apartments | 20 | 0.3% |
| 5 to 9 Unit Apartments | 215 | 3.0% |
| 10 or more Apartments | 14 | 0.2% |
| Mobile Home / Other | 1,716 | 24.2% |
| Total | 7,101 | 100.0% |
Housing Structures by Occupancy in Polk County
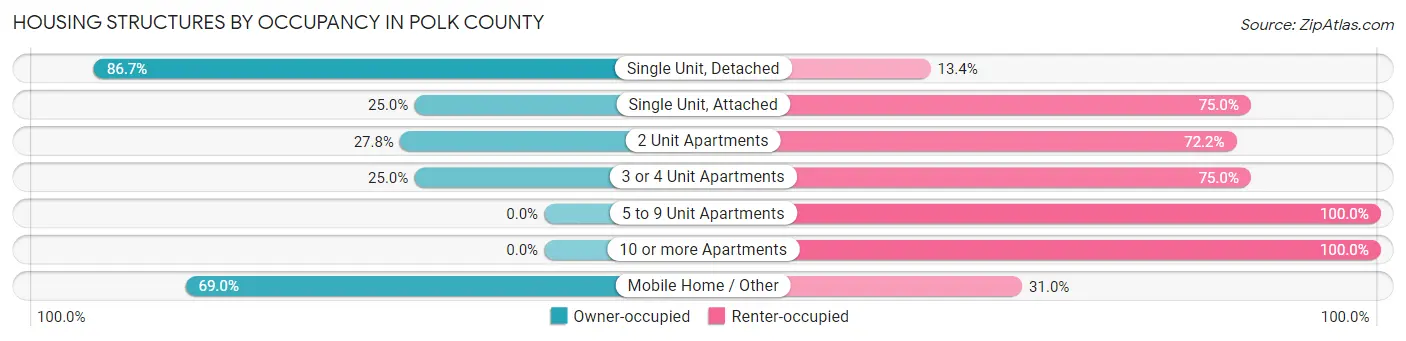
| Structure Type | Owner-occupied | Renter-occupied |
| Single Unit, Detached | 4,395 (86.7%) | 677 (13.4%) |
| Single Unit, Attached | 7 (25.0%) | 21 (75.0%) |
| 2 Unit Apartments | 10 (27.8%) | 26 (72.2%) |
| 3 or 4 Unit Apartments | 5 (25.0%) | 15 (75.0%) |
| 5 to 9 Unit Apartments | 0 (0.0%) | 215 (100.0%) |
| 10 or more Apartments | 0 (0.0%) | 14 (100.0%) |
| Mobile Home / Other | 1,184 (69.0%) | 532 (31.0%) |
| Total | 5,601 (78.9%) | 1,500 (21.1%) |
Housing Structures by Number of Rooms in Polk County
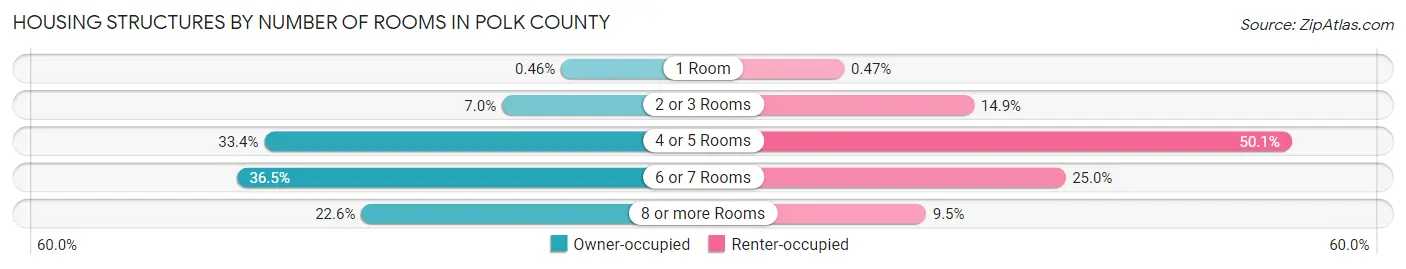
| Number of Rooms | Owner-occupied | Renter-occupied |
| 1 Room | 26 (0.5%) | 7 (0.5%) |
| 2 or 3 Rooms | 393 (7.0%) | 223 (14.9%) |
| 4 or 5 Rooms | 1,871 (33.4%) | 752 (50.1%) |
| 6 or 7 Rooms | 2,043 (36.5%) | 375 (25.0%) |
| 8 or more Rooms | 1,268 (22.6%) | 143 (9.5%) |
| Total | 5,601 (100.0%) | 1,500 (100.0%) |
Housing Structure by Heating Type in Polk County
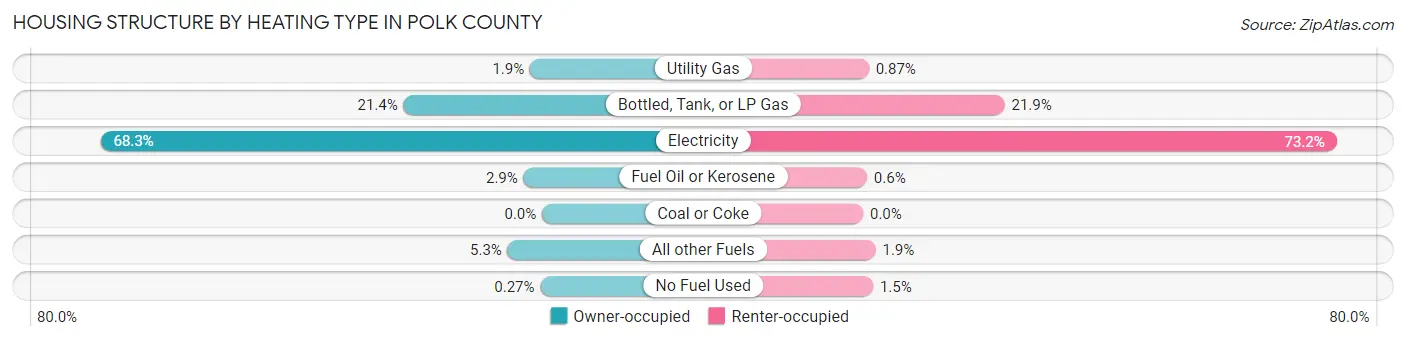
| Heating Type | Owner-occupied | Renter-occupied |
| Utility Gas | 104 (1.9%) | 13 (0.9%) |
| Bottled, Tank, or LP Gas | 1,200 (21.4%) | 328 (21.9%) |
| Electricity | 3,824 (68.3%) | 1,098 (73.2%) |
| Fuel Oil or Kerosene | 160 (2.9%) | 9 (0.6%) |
| Coal or Coke | 0 (0.0%) | 0 (0.0%) |
| All other Fuels | 298 (5.3%) | 29 (1.9%) |
| No Fuel Used | 15 (0.3%) | 23 (1.5%) |
| Total | 5,601 (100.0%) | 1,500 (100.0%) |
Household Vehicle Usage in Polk County
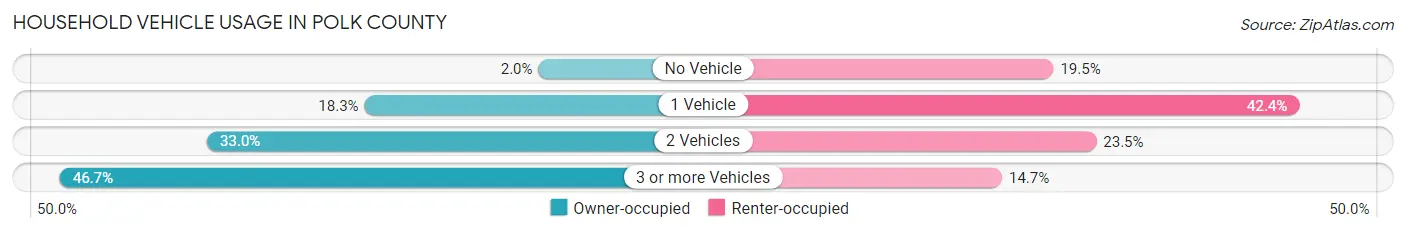
| Vehicles per Household | Owner-occupied | Renter-occupied |
| No Vehicle | 114 (2.0%) | 292 (19.5%) |
| 1 Vehicle | 1,024 (18.3%) | 636 (42.4%) |
| 2 Vehicles | 1,847 (33.0%) | 352 (23.5%) |
| 3 or more Vehicles | 2,616 (46.7%) | 220 (14.7%) |
| Total | 5,601 (100.0%) | 1,500 (100.0%) |
Real Estate & Mortgages in Polk County
Real Estate and Mortgage Overview in Polk County
| Characteristic | Without Mortgage | With Mortgage |
| Housing Units | 3,256 | 2,345 |
| Median Property Value | $107,800 | $161,300 |
| Median Household Income | $51,076 | $486 |
| Monthly Housing Costs | $356 | $10 |
| Real Estate Taxes | $679 | $86 |
Property Value by Mortgage Status in Polk County
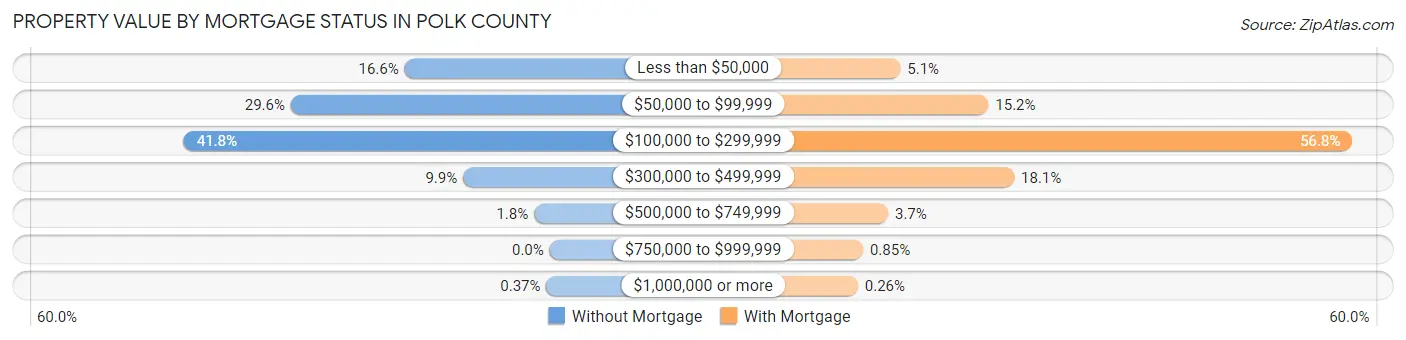
| Property Value | Without Mortgage | With Mortgage |
| Less than $50,000 | 540 (16.6%) | 120 (5.1%) |
| $50,000 to $99,999 | 963 (29.6%) | 356 (15.2%) |
| $100,000 to $299,999 | 1,361 (41.8%) | 1,331 (56.8%) |
| $300,000 to $499,999 | 322 (9.9%) | 425 (18.1%) |
| $500,000 to $749,999 | 58 (1.8%) | 87 (3.7%) |
| $750,000 to $999,999 | 0 (0.0%) | 20 (0.9%) |
| $1,000,000 or more | 12 (0.4%) | 6 (0.3%) |
| Total | 3,256 (100.0%) | 2,345 (100.0%) |
Household Income by Mortgage Status in Polk County
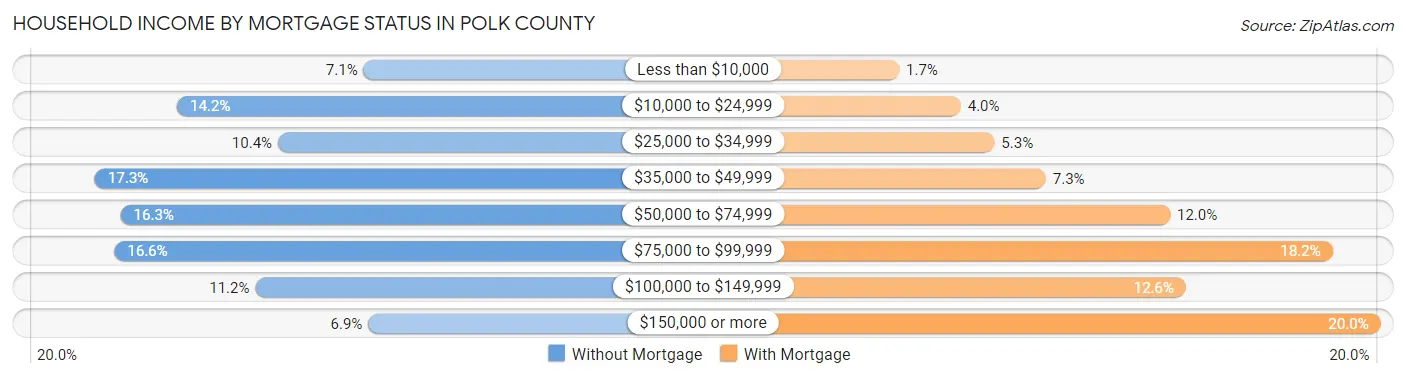
| Household Income | Without Mortgage | With Mortgage |
| Less than $10,000 | 231 (7.1%) | 39 (1.7%) |
| $10,000 to $24,999 | 462 (14.2%) | 94 (4.0%) |
| $25,000 to $34,999 | 337 (10.3%) | 124 (5.3%) |
| $35,000 to $49,999 | 564 (17.3%) | 170 (7.2%) |
| $50,000 to $74,999 | 532 (16.3%) | 281 (12.0%) |
| $75,000 to $99,999 | 540 (16.6%) | 426 (18.2%) |
| $100,000 to $149,999 | 365 (11.2%) | 295 (12.6%) |
| $150,000 or more | 225 (6.9%) | 469 (20.0%) |
| Total | 3,256 (100.0%) | 2,345 (100.0%) |
Property Value to Household Income Ratio in Polk County
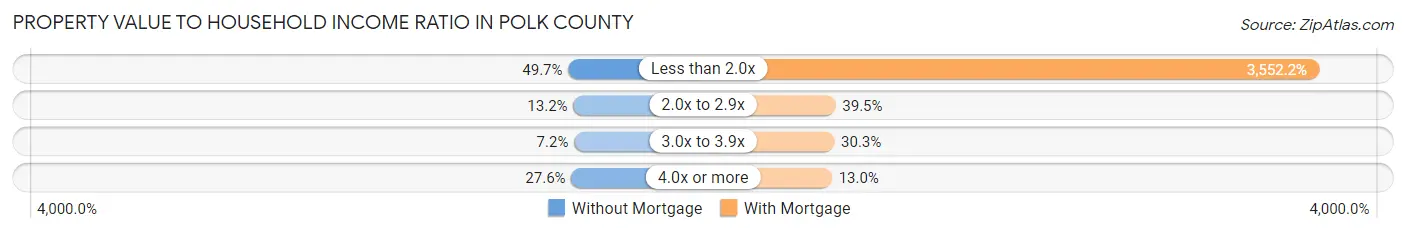
| Value-to-Income Ratio | Without Mortgage | With Mortgage |
| Less than 2.0x | 1,619 (49.7%) | 83,299 (3,552.2%) |
| 2.0x to 2.9x | 431 (13.2%) | 925 (39.5%) |
| 3.0x to 3.9x | 233 (7.2%) | 711 (30.3%) |
| 4.0x or more | 897 (27.6%) | 304 (13.0%) |
| Total | 3,256 (100.0%) | 2,345 (100.0%) |
Real Estate Taxes by Mortgage Status in Polk County
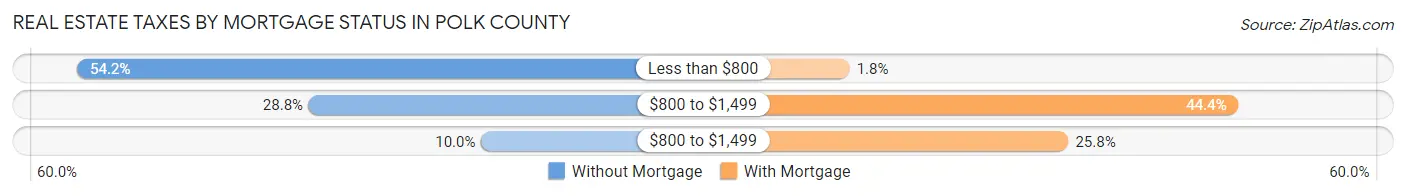
| Property Taxes | Without Mortgage | With Mortgage |
| Less than $800 | 1,766 (54.2%) | 43 (1.8%) |
| $800 to $1,499 | 939 (28.8%) | 1,042 (44.4%) |
| $800 to $1,499 | 324 (10.0%) | 605 (25.8%) |
| Total | 3,256 (100.0%) | 2,345 (100.0%) |
Health & Disability in Polk County
Health Insurance Coverage by Age in Polk County

| Age Bracket | With Coverage | Without Coverage |
| Under 6 Years | 949 (90.1%) | 104 (9.9%) |
| 6 to 18 Years | 2,359 (92.1%) | 202 (7.9%) |
| 19 to 25 Years | 945 (74.8%) | 319 (25.2%) |
| 26 to 34 Years | 1,170 (72.9%) | 435 (27.1%) |
| 35 to 44 Years | 1,434 (73.5%) | 518 (26.5%) |
| 45 to 54 Years | 1,939 (74.6%) | 659 (25.4%) |
| 55 to 64 Years | 2,285 (83.0%) | 467 (17.0%) |
| 65 to 74 Years | 2,192 (100.0%) | 0 (0.0%) |
| 75 Years and older | 1,421 (100.0%) | 0 (0.0%) |
| Total | 14,694 (84.5%) | 2,704 (15.5%) |
Health Insurance Coverage by Citizenship Status in Polk County
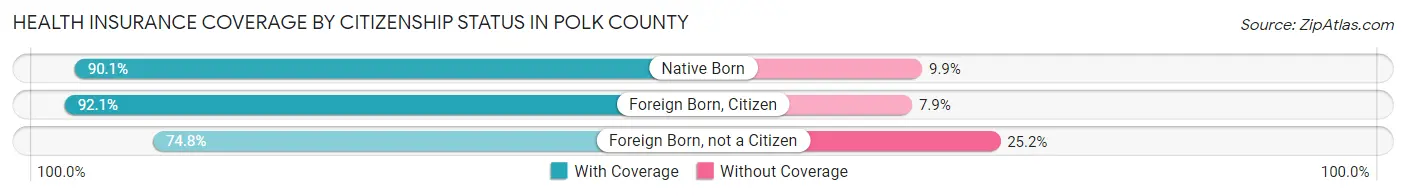
| Citizenship Status | With Coverage | Without Coverage |
| Native Born | 949 (90.1%) | 104 (9.9%) |
| Foreign Born, Citizen | 2,359 (92.1%) | 202 (7.9%) |
| Foreign Born, not a Citizen | 945 (74.8%) | 319 (25.2%) |
Health Insurance Coverage by Household Income in Polk County
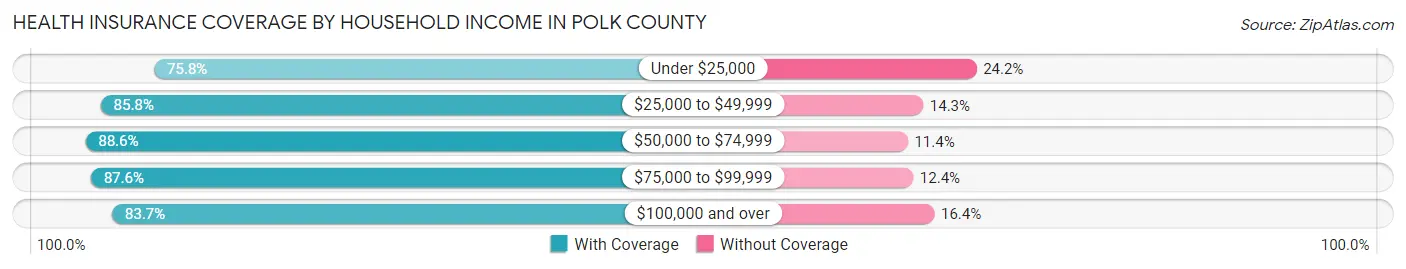
| Household Income | With Coverage | Without Coverage |
| Under $25,000 | 1,891 (75.8%) | 605 (24.2%) |
| $25,000 to $49,999 | 3,045 (85.8%) | 506 (14.2%) |
| $50,000 to $74,999 | 2,931 (88.6%) | 376 (11.4%) |
| $75,000 to $99,999 | 2,157 (87.6%) | 305 (12.4%) |
| $100,000 and over | 4,652 (83.7%) | 909 (16.4%) |
Public vs Private Health Insurance Coverage by Age in Polk County
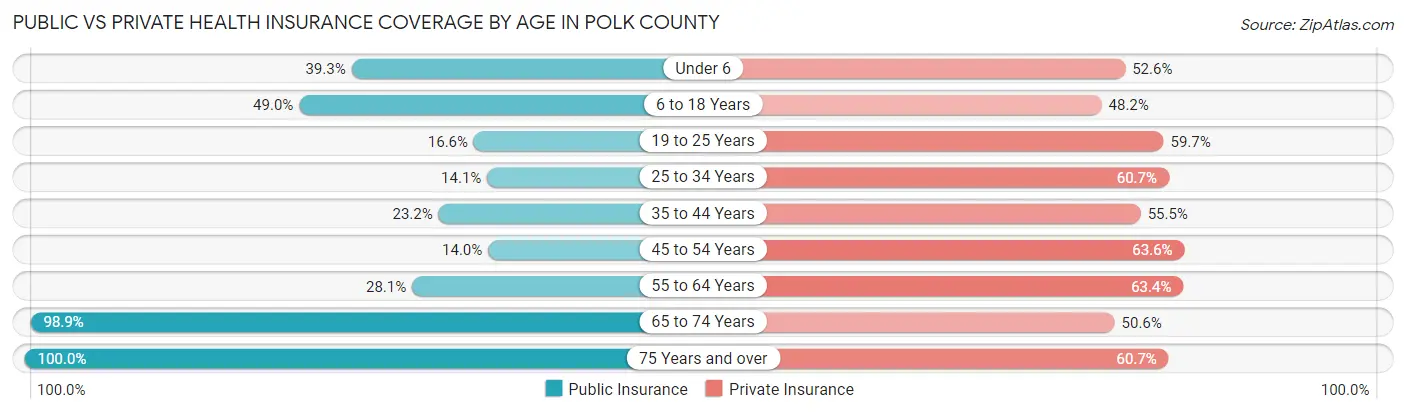
| Age Bracket | Public Insurance | Private Insurance |
| Under 6 | 414 (39.3%) | 554 (52.6%) |
| 6 to 18 Years | 1,256 (49.0%) | 1,235 (48.2%) |
| 19 to 25 Years | 210 (16.6%) | 755 (59.7%) |
| 25 to 34 Years | 227 (14.1%) | 974 (60.7%) |
| 35 to 44 Years | 452 (23.2%) | 1,083 (55.5%) |
| 45 to 54 Years | 363 (14.0%) | 1,652 (63.6%) |
| 55 to 64 Years | 773 (28.1%) | 1,744 (63.4%) |
| 65 to 74 Years | 2,168 (98.9%) | 1,110 (50.6%) |
| 75 Years and over | 1,421 (100.0%) | 862 (60.7%) |
| Total | 7,284 (41.9%) | 9,969 (57.3%) |
Disability Status by Sex by Age in Polk County
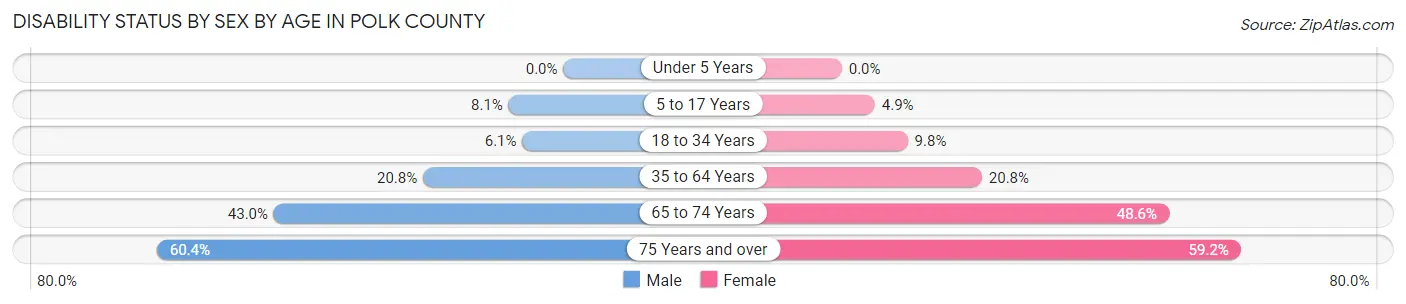
| Age Bracket | Male | Female |
| Under 5 Years | 0 (0.0%) | 0 (0.0%) |
| 5 to 17 Years | 108 (8.1%) | 64 (4.9%) |
| 18 to 34 Years | 95 (6.1%) | 145 (9.8%) |
| 35 to 64 Years | 758 (20.8%) | 762 (20.8%) |
| 65 to 74 Years | 466 (43.0%) | 538 (48.6%) |
| 75 Years and over | 396 (60.4%) | 453 (59.2%) |
Disability Class by Sex by Age in Polk County
Disability Class: Hearing Difficulty
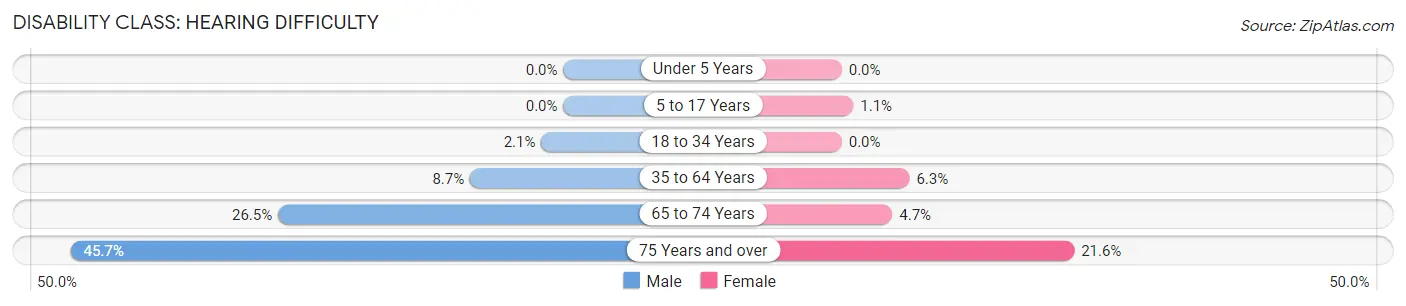
| Age Bracket | Male | Female |
| Under 5 Years | 0 (0.0%) | 0 (0.0%) |
| 5 to 17 Years | 0 (0.0%) | 14 (1.1%) |
| 18 to 34 Years | 32 (2.1%) | 0 (0.0%) |
| 35 to 64 Years | 315 (8.7%) | 230 (6.3%) |
| 65 to 74 Years | 287 (26.5%) | 52 (4.7%) |
| 75 Years and over | 300 (45.7%) | 165 (21.6%) |
Disability Class: Vision Difficulty
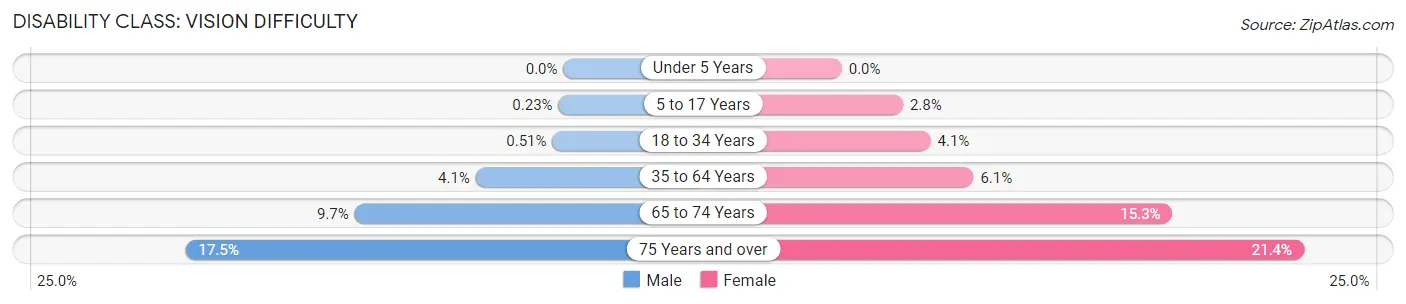
| Age Bracket | Male | Female |
| Under 5 Years | 0 (0.0%) | 0 (0.0%) |
| 5 to 17 Years | 3 (0.2%) | 37 (2.8%) |
| 18 to 34 Years | 8 (0.5%) | 61 (4.1%) |
| 35 to 64 Years | 148 (4.1%) | 224 (6.1%) |
| 65 to 74 Years | 105 (9.7%) | 170 (15.3%) |
| 75 Years and over | 115 (17.5%) | 164 (21.4%) |
Disability Class: Cognitive Difficulty
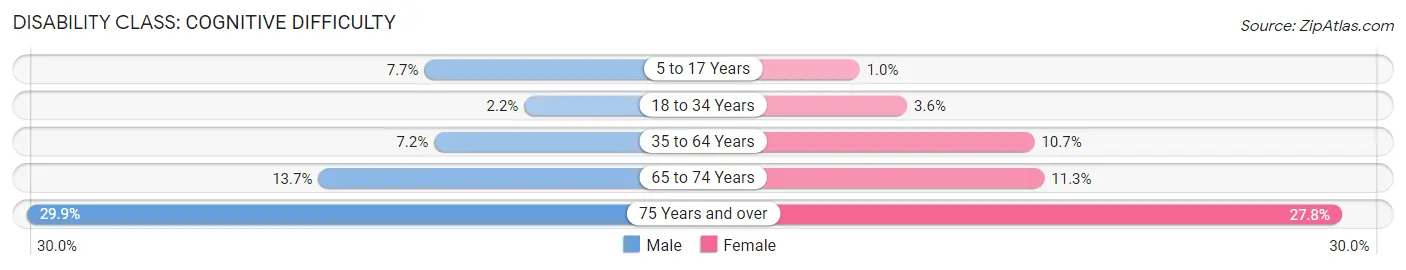
| Age Bracket | Male | Female |
| 5 to 17 Years | 103 (7.7%) | 13 (1.0%) |
| 18 to 34 Years | 34 (2.2%) | 54 (3.6%) |
| 35 to 64 Years | 262 (7.2%) | 393 (10.7%) |
| 65 to 74 Years | 148 (13.7%) | 125 (11.3%) |
| 75 Years and over | 196 (29.9%) | 213 (27.8%) |
Disability Class: Ambulatory Difficulty
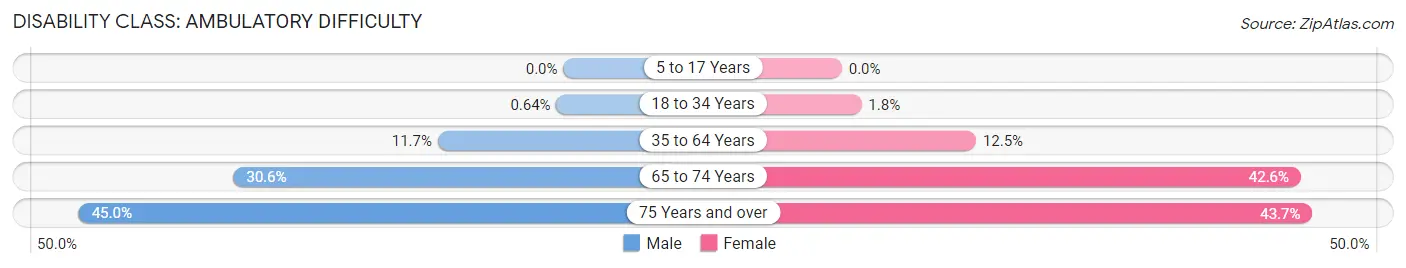
| Age Bracket | Male | Female |
| 5 to 17 Years | 0 (0.0%) | 0 (0.0%) |
| 18 to 34 Years | 10 (0.6%) | 27 (1.8%) |
| 35 to 64 Years | 424 (11.7%) | 456 (12.4%) |
| 65 to 74 Years | 332 (30.6%) | 472 (42.6%) |
| 75 Years and over | 295 (45.0%) | 334 (43.7%) |
Disability Class: Self-Care Difficulty
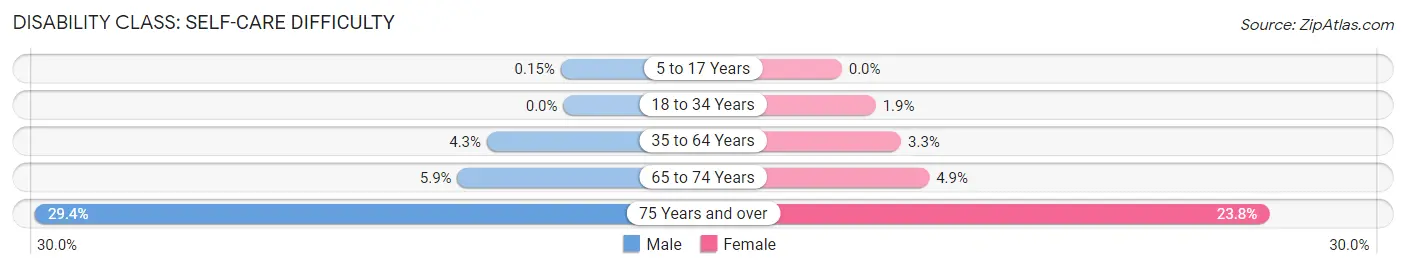
| Age Bracket | Male | Female |
| 5 to 17 Years | 2 (0.2%) | 0 (0.0%) |
| 18 to 34 Years | 0 (0.0%) | 28 (1.9%) |
| 35 to 64 Years | 155 (4.3%) | 121 (3.3%) |
| 65 to 74 Years | 64 (5.9%) | 54 (4.9%) |
| 75 Years and over | 193 (29.4%) | 182 (23.8%) |
Technology Access in Polk County
Computing Device Access in Polk County
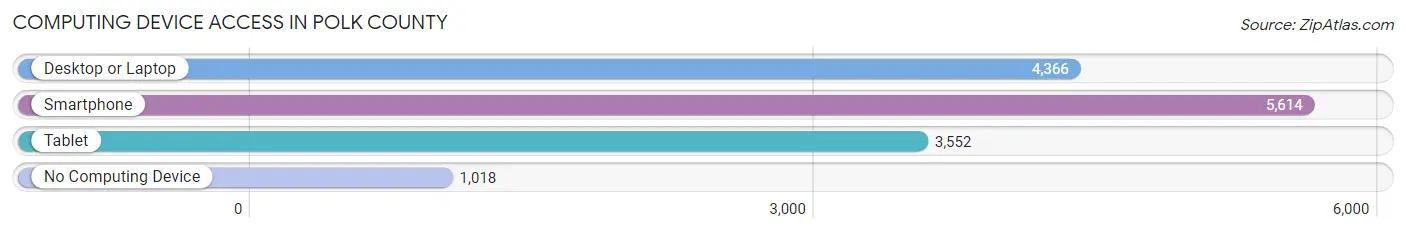
| Device Type | # Households | % Households |
| Desktop or Laptop | 4,366 | 61.5% |
| Smartphone | 5,614 | 79.1% |
| Tablet | 3,552 | 50.0% |
| No Computing Device | 1,018 | 14.3% |
| Total | 7,101 | 100.0% |
Internet Access in Polk County
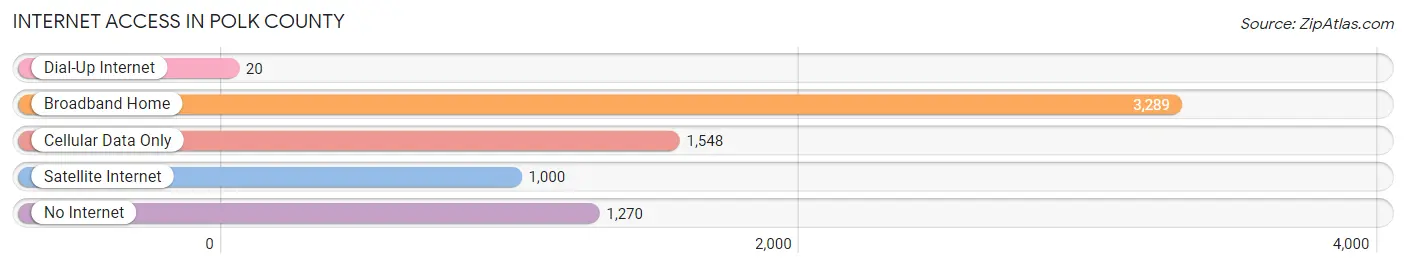
| Internet Type | # Households | % Households |
| Dial-Up Internet | 20 | 0.3% |
| Broadband Home | 3,289 | 46.3% |
| Cellular Data Only | 1,548 | 21.8% |
| Satellite Internet | 1,000 | 14.1% |
| No Internet | 1,270 | 17.9% |
| Total | 7,101 | 100.0% |
Polk County Summary
Polk County is located in the southeastern corner of Tennessee, and is part of the Appalachian region. It is bordered by Bradley County to the north, McMinn County to the east, Monroe County to the south, and the state of North Carolina to the west. The county seat is Benton, and the largest city is Copperhill. The county was established in 1839 and named after James K. Polk, the 11th President of the United States.
Geography
Polk County is located in the Appalachian Mountains, and is characterized by rugged terrain and steep slopes. The county is mostly mountainous, with elevations ranging from 800 to over 4,000 feet. The highest point in the county is the summit of White Oak Mountain, which has an elevation of 4,039 feet. The county is drained by the Ocoee River, which flows through the western part of the county. The county is also home to several lakes, including the Hiwassee, Ocoee, and Tellico Lakes.
The county has a total area of 441 square miles, of which 437 square miles is land and 4.2 square miles is water. The county is located in the Eastern Time Zone.
Demographics
As of the 2010 census, there were 16,825 people, 6,845 households, and 4,845 families residing in the county. The population density was 38.3 people per square mile. The racial makeup of the county was 95.3% White, 1.7% Black or African American, 0.3% Native American, 0.2% Asian, 0.1% Pacific Islander, 1.2% from other races, and 1.2% from two or more races. Hispanic or Latino of any race were 2.7% of the population.
The median income for a household in the county was $30,945, and the median income for a family was $37,945. The per capita income for the county was $17,845. About 17.2% of families and 21.2% of the population were below the poverty line, including 28.2% of those under age 18 and 16.2% of those age 65 or over.
Economy
The economy of Polk County is largely based on agriculture and tourism. The county is home to several farms, which produce a variety of crops, including corn, soybeans, hay, and tobacco. The county is also home to several wineries, which produce a variety of wines.
Tourism is also an important part of the county's economy. The county is home to several state parks, including the Ocoee Whitewater Center, which is a popular destination for whitewater rafting and kayaking. The county is also home to several historic sites, including the Polk County Courthouse, which was built in 1839.
History
Polk County was established in 1839 and named after James K. Polk, the 11th President of the United States. The county was originally part of the Cherokee Nation, and was home to several Native American tribes, including the Cherokee, Creek, and Chickasaw.
The county was home to several Civil War battles, including the Battle of Bentonville, which was fought in 1865. The county was also home to several moonshine stills during the Prohibition era.
In the late 19th and early 20th centuries, the county was home to several coal mines, which provided employment for many of the county's residents. The county was also home to several logging operations, which provided timber for the construction of homes and other buildings.
Today, Polk County is a rural county with a population of 16,825. The county is home to several state parks, wineries, and historic sites. The county is also home to several farms, which produce a variety of crops. Tourism is also an important part of the county's economy.
Common Questions
What is the Total Population of Polk County?
Total Population of Polk County is 17,620.
What is the Total Male Population of Polk County?
Total Male Population of Polk County is 8,836.
What is the Total Female Population of Polk County?
Total Female Population of Polk County is 8,784.
What is the Ratio of Males per 100 Females in Polk County?
There are 100.59 Males per 100 Females in Polk County.
What is the Ratio of Females per 100 Males in Polk County?
There are 99.41 Females per 100 Males in Polk County.
What is the Median Population Age in Polk County?
Median Population Age in Polk County is 46.3 Years.
What is the Average Family Size in Polk County
Average Family Size in Polk County is 2.9 People.
What is the Average Household Size in Polk County
Average Household Size in Polk County is 2.5 People.
What is Per Capita Income in Polk County?
Per Capita income in Polk County is $30,400.
What is the Median Family Income in Polk County?
Median Family Income in Polk County is $69,871.
What is the Median Household income in Polk County?
Median Household Income in Polk County is $53,775.
What is Income or Wage Gap in Polk County?
Income or Wage Gap in Polk County is 40.4%.
Women in Polk County earn 59.6 cents for every dollar earned by a man.
What is Family Income Deficit in Polk County?
Family Income Deficit in Polk County is $8,073.
Families that are below poverty line in Polk County earn $8,073 less on average than the poverty threshold level.
What is Inequality or Gini Index in Polk County?
Inequality or Gini Index in Polk County is 0.46.
How Large is the Labor Force in Polk County?
There are 7,945 People in the Labor Forcein in Polk County.
What is the Percentage of People in the Labor Force in Polk County?
54.6% of People are in the Labor Force in Polk County.
What is the Unemployment Rate in Polk County?
Unemployment Rate in Polk County is 7.8%.