Overton County, TN
Overton County Map
Overton County Overview
22,576
TOTAL POPULATION
11,305
MALE POPULATION
11,271
FEMALE POPULATION
100.30
MALES / 100 FEMALES
99.70
FEMALES / 100 MALES
43.1
MEDIAN AGE
3.1
AVG FAMILY SIZE
2.5
AVG HOUSEHOLD SIZE
$29,556
PER CAPITA INCOME
$66,627
AVG FAMILY INCOME
$46,580
AVG HOUSEHOLD INCOME
33.2%
WAGE / INCOME GAP [ % ]
66.8¢/ $1
WAGE / INCOME GAP [ $ ]
$10,461
FAMILY INCOME DEFICIT
0.51
INEQUALITY / GINI INDEX
10,560
LABOR FORCE [ PEOPLE ]
57.4%
PERCENT IN LABOR FORCE
3.5%
UNEMPLOYMENT RATE
Overton County Area Codes
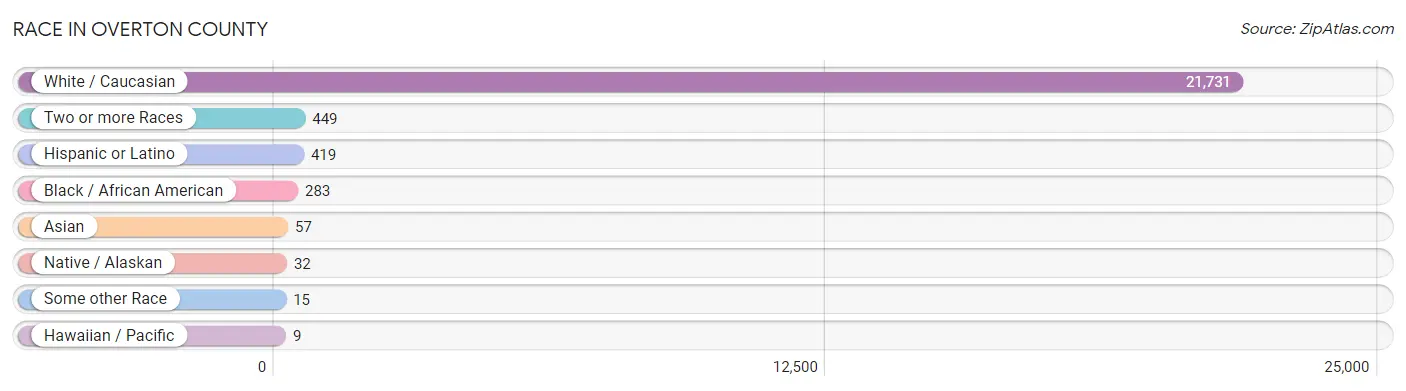
Race in Overton County
The most populous races in Overton County are White / Caucasian (21,731 | 96.3%), Two or more Races (449 | 2.0%), and Hispanic or Latino (419 | 1.9%).
| Race | # Population | % Population |
| Asian | 57 | 0.3% |
| Black / African American | 283 | 1.3% |
| Hawaiian / Pacific | 9 | 0.0% |
| Hispanic or Latino | 419 | 1.9% |
| Native / Alaskan | 32 | 0.1% |
| White / Caucasian | 21,731 | 96.3% |
| Two or more Races | 449 | 2.0% |
| Some other Race | 15 | 0.1% |
| Total | 22,576 | 100.0% |
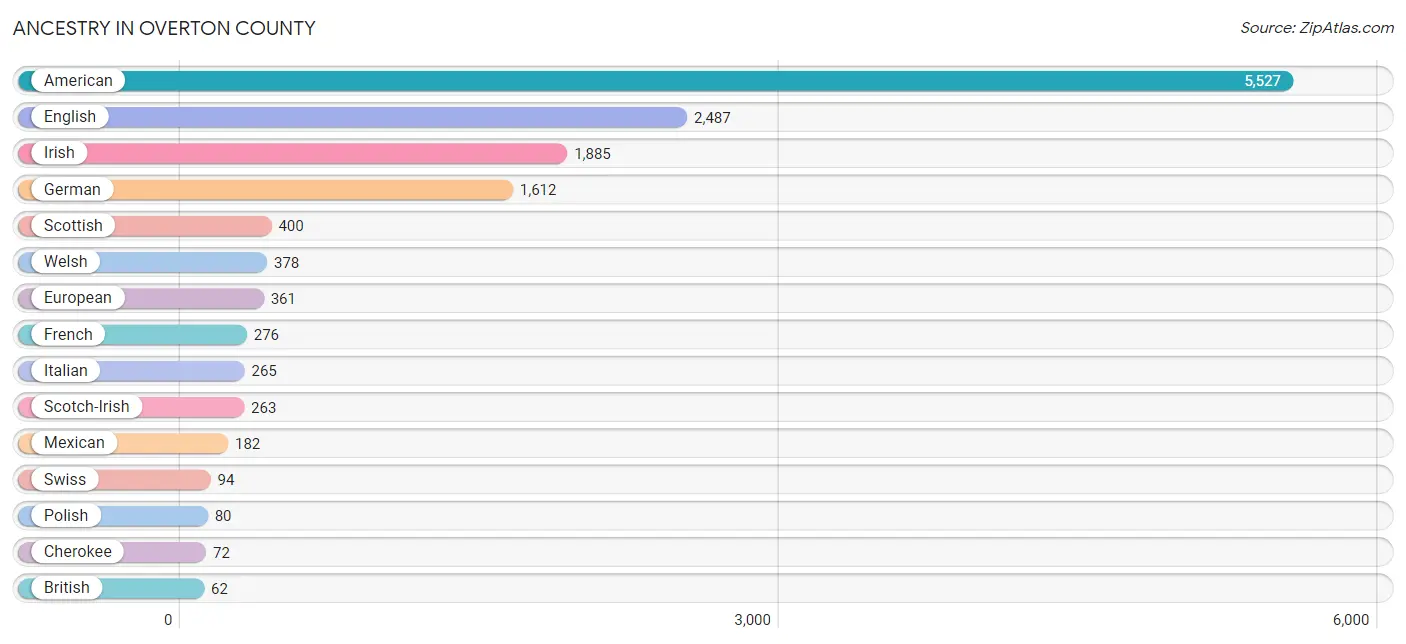
Ancestry in Overton County
The most populous ancestries reported in Overton County are American (5,527 | 24.5%), English (2,487 | 11.0%), Irish (1,885 | 8.4%), German (1,612 | 7.1%), and Scottish (400 | 1.8%), together accounting for 52.8% of all Overton County residents.
| Ancestry | # Population | % Population |
| African | 14 | 0.1% |
| American | 5,527 | 24.5% |
| Arab | 7 | 0.0% |
| Armenian | 11 | 0.1% |
| Belgian | 2 | 0.0% |
| British | 62 | 0.3% |
| Burmese | 25 | 0.1% |
| Canadian | 61 | 0.3% |
| Central American | 34 | 0.2% |
| Central American Indian | 5 | 0.0% |
| Cherokee | 72 | 0.3% |
| Chickasaw | 20 | 0.1% |
| Choctaw | 1 | 0.0% |
| Costa Rican | 17 | 0.1% |
| Cuban | 31 | 0.1% |
| Danish | 15 | 0.1% |
| Dutch | 56 | 0.3% |
| Eastern European | 49 | 0.2% |
| English | 2,487 | 11.0% |
| European | 361 | 1.6% |
| Finnish | 7 | 0.0% |
| French | 276 | 1.2% |
| French Canadian | 27 | 0.1% |
| German | 1,612 | 7.1% |
| Greek | 13 | 0.1% |
| Guatemalan | 17 | 0.1% |
| Hungarian | 10 | 0.0% |
| Indian (Asian) | 42 | 0.2% |
| Irish | 1,885 | 8.4% |
| Iroquois | 12 | 0.1% |
| Italian | 265 | 1.2% |
| Lebanese | 7 | 0.0% |
| Lithuanian | 21 | 0.1% |
| Malaysian | 3 | 0.0% |
| Mexican | 182 | 0.8% |
| Native Hawaiian | 18 | 0.1% |
| Nigerian | 43 | 0.2% |
| Northern European | 42 | 0.2% |
| Norwegian | 52 | 0.2% |
| Polish | 80 | 0.4% |
| Portuguese | 13 | 0.1% |
| Puerto Rican | 9 | 0.0% |
| Russian | 21 | 0.1% |
| Samoan | 1 | 0.0% |
| Scandinavian | 12 | 0.1% |
| Scotch-Irish | 263 | 1.2% |
| Scottish | 400 | 1.8% |
| Spaniard | 47 | 0.2% |
| Spanish | 13 | 0.1% |
| Subsaharan African | 57 | 0.3% |
| Swedish | 25 | 0.1% |
| Swiss | 94 | 0.4% |
| Welsh | 378 | 1.7% | View All 53 Rows |
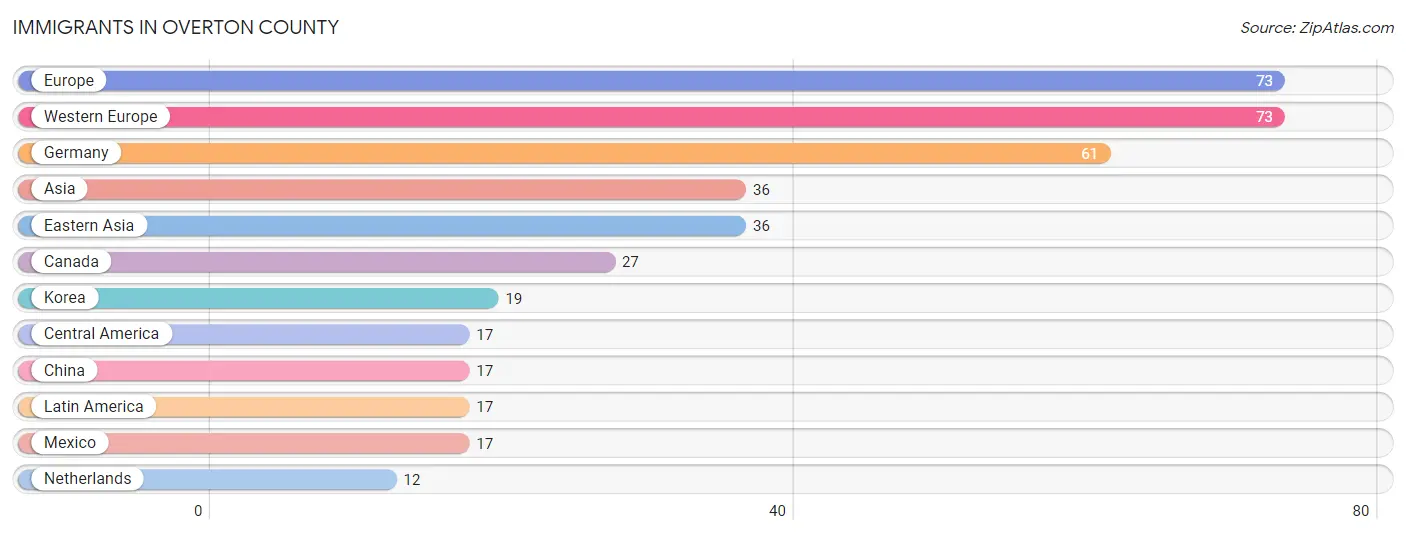
Immigrants in Overton County
The most numerous immigrant groups reported in Overton County came from Europe (73 | 0.3%), Western Europe (73 | 0.3%), Germany (61 | 0.3%), Asia (36 | 0.2%), and Eastern Asia (36 | 0.2%), together accounting for 1.2% of all Overton County residents.
| Immigration Origin | # Population | % Population |
| Asia | 36 | 0.2% |
| Canada | 27 | 0.1% |
| Central America | 17 | 0.1% |
| China | 17 | 0.1% |
| Eastern Asia | 36 | 0.2% |
| Europe | 73 | 0.3% |
| Germany | 61 | 0.3% |
| Korea | 19 | 0.1% |
| Latin America | 17 | 0.1% |
| Mexico | 17 | 0.1% |
| Netherlands | 12 | 0.1% |
| Western Europe | 73 | 0.3% | View All 12 Rows |
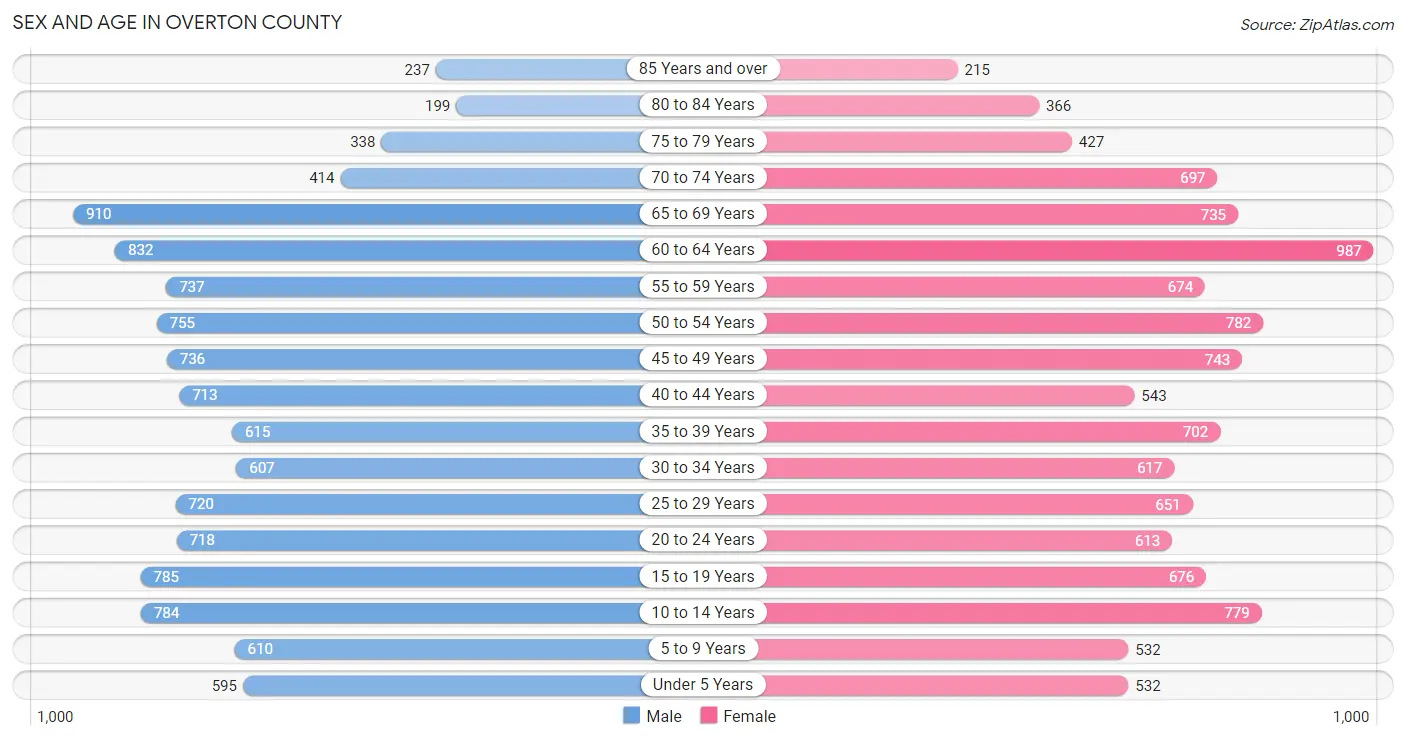
Sex and Age in Overton County
Sex and Age in Overton County
The most populous age groups in Overton County are 65 to 69 Years (910 | 8.1%) for men and 60 to 64 Years (987 | 8.8%) for women.
| Age Bracket | Male | Female |
| Under 5 Years | 595 (5.3%) | 532 (4.7%) |
| 5 to 9 Years | 610 (5.4%) | 532 (4.7%) |
| 10 to 14 Years | 784 (6.9%) | 779 (6.9%) |
| 15 to 19 Years | 785 (6.9%) | 676 (6.0%) |
| 20 to 24 Years | 718 (6.4%) | 613 (5.4%) |
| 25 to 29 Years | 720 (6.4%) | 651 (5.8%) |
| 30 to 34 Years | 607 (5.4%) | 617 (5.5%) |
| 35 to 39 Years | 615 (5.4%) | 702 (6.2%) |
| 40 to 44 Years | 713 (6.3%) | 543 (4.8%) |
| 45 to 49 Years | 736 (6.5%) | 743 (6.6%) |
| 50 to 54 Years | 755 (6.7%) | 782 (6.9%) |
| 55 to 59 Years | 737 (6.5%) | 674 (6.0%) |
| 60 to 64 Years | 832 (7.4%) | 987 (8.8%) |
| 65 to 69 Years | 910 (8.1%) | 735 (6.5%) |
| 70 to 74 Years | 414 (3.7%) | 697 (6.2%) |
| 75 to 79 Years | 338 (3.0%) | 427 (3.8%) |
| 80 to 84 Years | 199 (1.8%) | 366 (3.3%) |
| 85 Years and over | 237 (2.1%) | 215 (1.9%) |
| Total | 11,305 (100.0%) | 11,271 (100.0%) |
Families and Households in Overton County
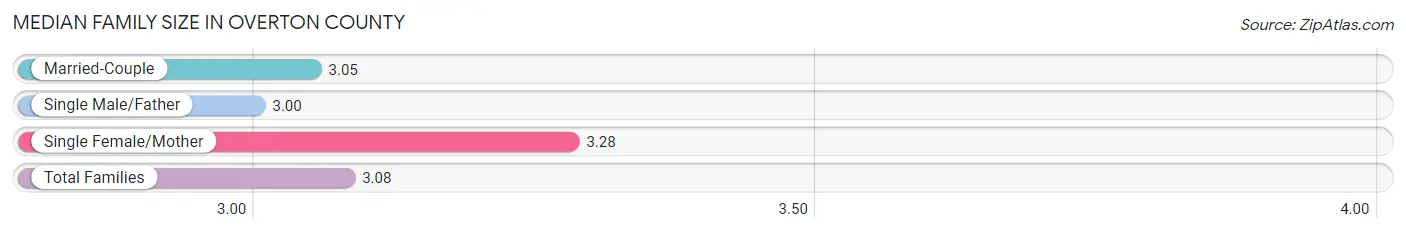
Median Family Size in Overton County
The median family size in Overton County is 3.08 persons per family, with single female/mother families (916 | 15.1%) accounting for the largest median family size of 3.28 persons per family. On the other hand, single male/father families (366 | 6.0%) represent the smallest median family size with 3.00 persons per family.
| Family Type | # Families | Family Size |
| Married-Couple | 4,801 (78.9%) | 3.05 |
| Single Male/Father | 366 (6.0%) | 3.00 |
| Single Female/Mother | 916 (15.1%) | 3.28 |
| Total Families | 6,083 (100.0%) | 3.08 |
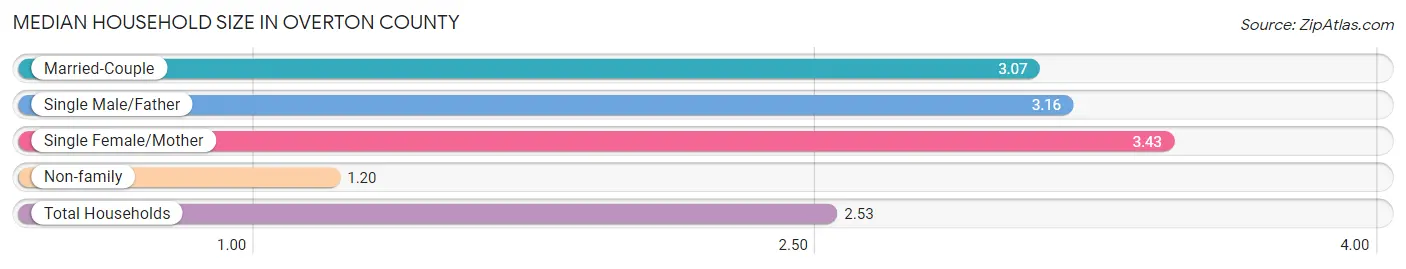
Median Household Size in Overton County
The median household size in Overton County is 2.53 persons per household, with single female/mother households (916 | 10.4%) accounting for the largest median household size of 3.43 persons per household. non-family households (2,737 | 31.0%) represent the smallest median household size with 1.20 persons per household.
| Household Type | # Households | Household Size |
| Married-Couple | 4,801 (54.4%) | 3.07 |
| Single Male/Father | 366 (4.2%) | 3.16 |
| Single Female/Mother | 916 (10.4%) | 3.43 |
| Non-family | 2,737 (31.0%) | 1.20 |
| Total Households | 8,820 (100.0%) | 2.53 |
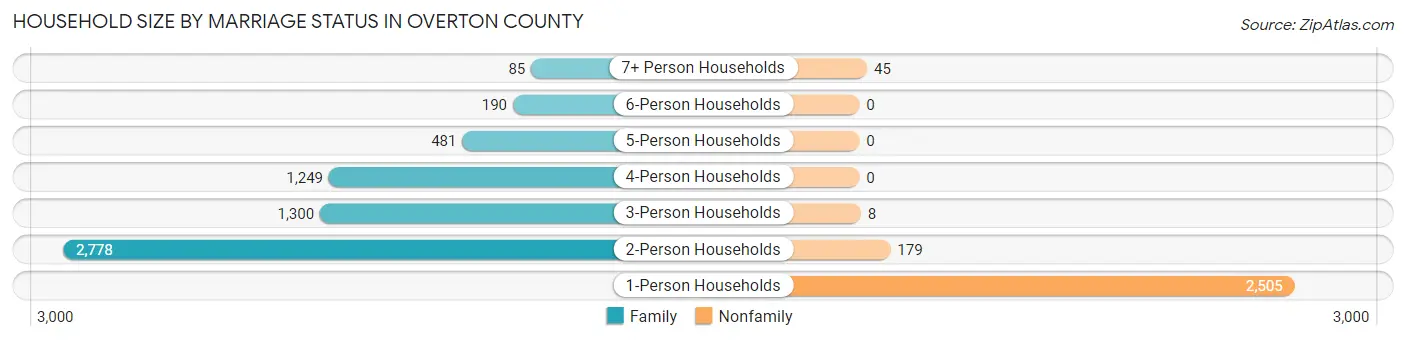
Household Size by Marriage Status in Overton County
Out of a total of 8,820 households in Overton County, 6,083 (69.0%) are family households, while 2,737 (31.0%) are nonfamily households. The most numerous type of family households are 2-person households, comprising 2,778, and the most common type of nonfamily households are 1-person households, comprising 2,505.
| Household Size | Family Households | Nonfamily Households |
| 1-Person Households | - | 2,505 (28.4%) |
| 2-Person Households | 2,778 (31.5%) | 179 (2.0%) |
| 3-Person Households | 1,300 (14.7%) | 8 (0.1%) |
| 4-Person Households | 1,249 (14.2%) | 0 (0.0%) |
| 5-Person Households | 481 (5.4%) | 0 (0.0%) |
| 6-Person Households | 190 (2.1%) | 0 (0.0%) |
| 7+ Person Households | 85 (1.0%) | 45 (0.5%) |
| Total | 6,083 (69.0%) | 2,737 (31.0%) |
Female Fertility in Overton County
Fertility by Age in Overton County
Average fertility rate in Overton County is 74.0 births per 1,000 women. Women in the age bracket of 20 to 34 years have the highest fertility rate with 141.0 births per 1,000 women. Women in the age bracket of 20 to 34 years acount for 76.4% of all women with births.

| Age Bracket | Women with Births | Births / 1,000 Women |
| 15 to 19 years | 0 (0.0%) | 0.0 |
| 20 to 34 years | 266 (76.4%) | 141.0 |
| 35 to 50 years | 82 (23.6%) | 38.0 |
| Total | 348 (100.0%) | 74.0 |
Fertility by Age by Marriage Status in Overton County
73.9% of women with births (348) in Overton County are married. The highest percentage of unmarried women with births falls into 20 to 34 years age bracket with 34.2% of them unmarried at the time of birth, while the lowest percentage of unmarried women with births belong to 35 to 50 years age bracket with 0.0% of them unmarried.

| Age Bracket | Married | Unmarried |
| 15 to 19 years | 0 (0.0%) | 0 (0.0%) |
| 20 to 34 years | 175 (65.8%) | 91 (34.2%) |
| 35 to 50 years | 82 (100.0%) | 0 (0.0%) |
| Total | 257 (73.9%) | 91 (26.2%) |
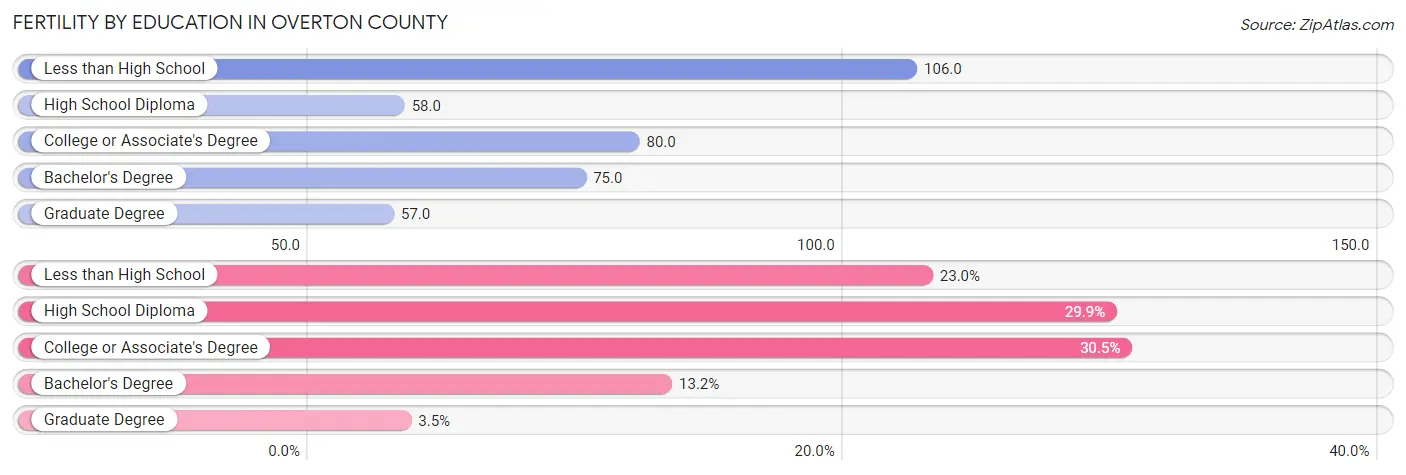
Fertility by Education in Overton County
Average fertility rate in Overton County is 74.0 births per 1,000 women. Women with the education attainment of less than high school have the highest fertility rate of 106.0 births per 1,000 women, while women with the education attainment of graduate degree have the lowest fertility at 57.0 births per 1,000 women. Women with the education attainment of college or associate's degree represent 30.5% of all women with births.
| Educational Attainment | Women with Births | Births / 1,000 Women |
| Less than High School | 80 (23.0%) | 106.0 |
| High School Diploma | 104 (29.9%) | 58.0 |
| College or Associate's Degree | 106 (30.5%) | 80.0 |
| Bachelor's Degree | 46 (13.2%) | 75.0 |
| Graduate Degree | 12 (3.5%) | 57.0 |
| Total | 348 (100.0%) | 74.0 |
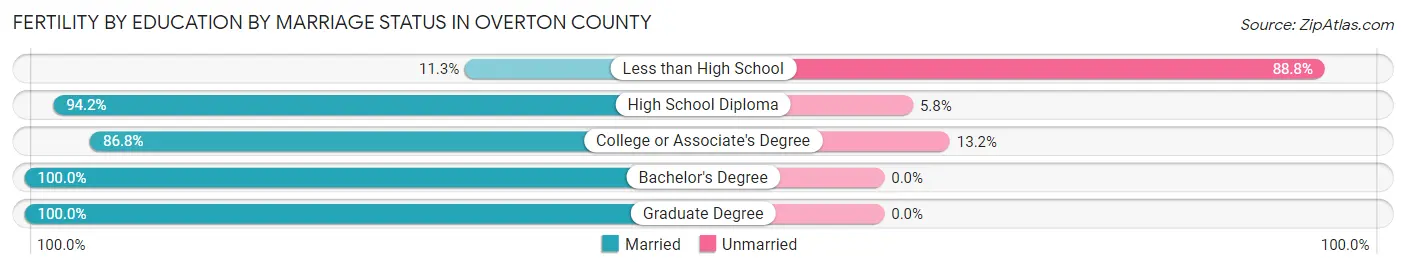
Fertility by Education by Marriage Status in Overton County
26.2% of women with births in Overton County are unmarried. Women with the educational attainment of bachelor's degree are most likely to be married with 100.0% of them married at childbirth, while women with the educational attainment of less than high school are least likely to be married with 88.7% of them unmarried at childbirth.
| Educational Attainment | Married | Unmarried |
| Less than High School | 9 (11.3%) | 71 (88.7%) |
| High School Diploma | 98 (94.2%) | 6 (5.8%) |
| College or Associate's Degree | 92 (86.8%) | 14 (13.2%) |
| Bachelor's Degree | 46 (100.0%) | 0 (0.0%) |
| Graduate Degree | 12 (100.0%) | 0 (0.0%) |
| Total | 257 (73.9%) | 91 (26.2%) |
Income in Overton County
Income Overview in Overton County
Per Capita Income in Overton County is $29,556, while median incomes of families and households are $66,627 and $46,580 respectively.
| Characteristic | Number | Measure |
| Per Capita Income | 22,576 | $29,556 |
| Median Family Income | 6,083 | $66,627 |
| Mean Family Income | 6,083 | $88,011 |
| Median Household Income | 8,820 | $46,580 |
| Mean Household Income | 8,820 | $72,062 |
| Income Deficit | 6,083 | $10,461 |
| Wage / Income Gap (%) | 22,576 | 33.25% |
| Wage / Income Gap ($) | 22,576 | 66.75¢ per $1 |
| Gini / Inequality Index | 22,576 | 0.51 |
Earnings by Sex in Overton County
Average Earnings in Overton County are $35,193, $43,059 for men and $28,743 for women, a difference of 33.3%.
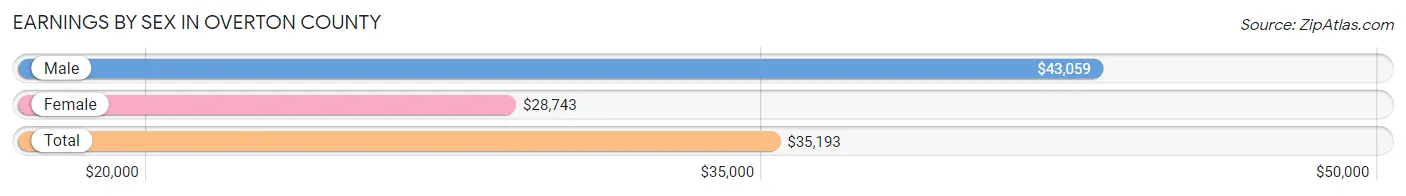
| Sex | Number | Average Earnings |
| Male | 5,966 (54.4%) | $43,059 |
| Female | 5,009 (45.6%) | $28,743 |
| Total | 10,975 (100.0%) | $35,193 |
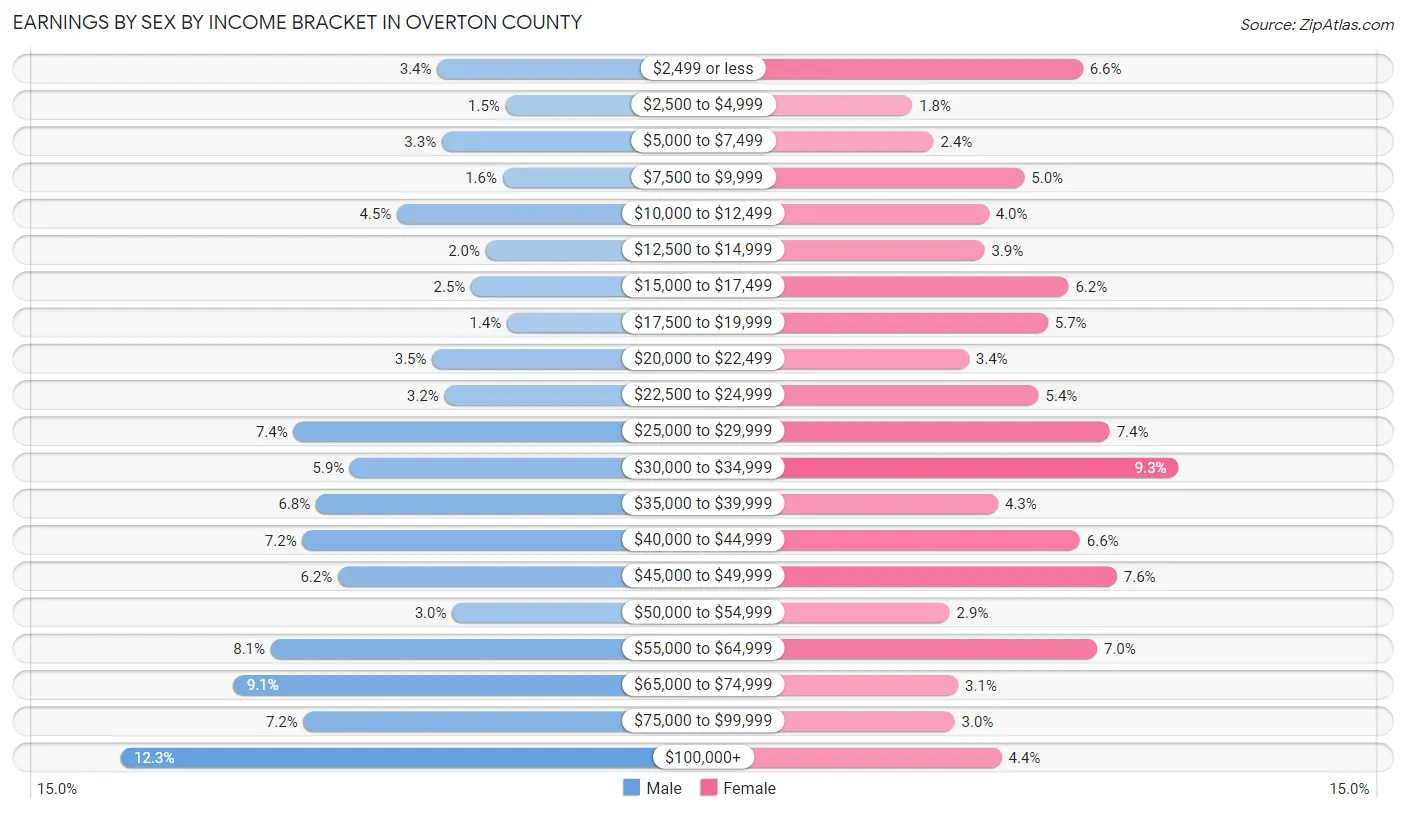
Earnings by Sex by Income Bracket in Overton County
The most common earnings brackets in Overton County are $100,000+ for men (733 | 12.3%) and $30,000 to $34,999 for women (467 | 9.3%).
| Income | Male | Female |
| $2,499 or less | 203 (3.4%) | 332 (6.6%) |
| $2,500 to $4,999 | 88 (1.5%) | 92 (1.8%) |
| $5,000 to $7,499 | 195 (3.3%) | 122 (2.4%) |
| $7,500 to $9,999 | 93 (1.6%) | 250 (5.0%) |
| $10,000 to $12,499 | 270 (4.5%) | 200 (4.0%) |
| $12,500 to $14,999 | 122 (2.0%) | 194 (3.9%) |
| $15,000 to $17,499 | 146 (2.5%) | 312 (6.2%) |
| $17,500 to $19,999 | 86 (1.4%) | 283 (5.7%) |
| $20,000 to $22,499 | 211 (3.5%) | 172 (3.4%) |
| $22,500 to $24,999 | 191 (3.2%) | 270 (5.4%) |
| $25,000 to $29,999 | 444 (7.4%) | 370 (7.4%) |
| $30,000 to $34,999 | 349 (5.9%) | 467 (9.3%) |
| $35,000 to $39,999 | 406 (6.8%) | 213 (4.3%) |
| $40,000 to $44,999 | 429 (7.2%) | 328 (6.6%) |
| $45,000 to $49,999 | 369 (6.2%) | 380 (7.6%) |
| $50,000 to $54,999 | 178 (3.0%) | 145 (2.9%) |
| $55,000 to $64,999 | 482 (8.1%) | 352 (7.0%) |
| $65,000 to $74,999 | 544 (9.1%) | 157 (3.1%) |
| $75,000 to $99,999 | 427 (7.2%) | 152 (3.0%) |
| $100,000+ | 733 (12.3%) | 218 (4.3%) |
| Total | 5,966 (100.0%) | 5,009 (100.0%) |
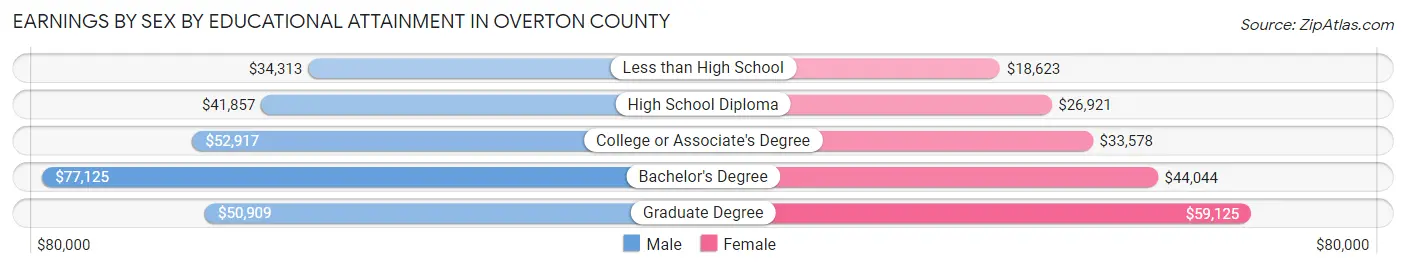
Earnings by Sex by Educational Attainment in Overton County
Average earnings in Overton County are $45,358 for men and $32,765 for women, a difference of 27.8%. Men with an educational attainment of bachelor's degree enjoy the highest average annual earnings of $77,125, while those with less than high school education earn the least with $34,313. Women with an educational attainment of graduate degree earn the most with the average annual earnings of $59,125, while those with less than high school education have the smallest earnings of $18,623.
| Educational Attainment | Male Income | Female Income |
| Less than High School | $34,313 | $18,623 |
| High School Diploma | $41,857 | $26,921 |
| College or Associate's Degree | $52,917 | $33,578 |
| Bachelor's Degree | $77,125 | $44,044 |
| Graduate Degree | $50,909 | $59,125 |
| Total | $45,358 | $32,765 |
Family Income in Overton County
Family Income Brackets in Overton County
According to the Overton County family income data, there are 1,150 families falling into the $50,000 to $74,999 income range, which is the most common income bracket and makes up 18.9% of all families. Conversely, the less than $10,000 income bracket is the least frequent group with only 262 families (4.3%) belonging to this category.

| Income Bracket | # Families | % Families |
| Less than $10,000 | 262 | 4.3% |
| $10,000 to $14,999 | 274 | 4.5% |
| $15,000 to $24,999 | 499 | 8.2% |
| $25,000 to $34,999 | 511 | 8.4% |
| $35,000 to $49,999 | 669 | 11.0% |
| $50,000 to $74,999 | 1,150 | 18.9% |
| $75,000 to $99,999 | 1,046 | 17.2% |
| $100,000 to $149,999 | 815 | 13.4% |
| $150,000 to $199,999 | 408 | 6.7% |
| $200,000+ | 450 | 7.4% |
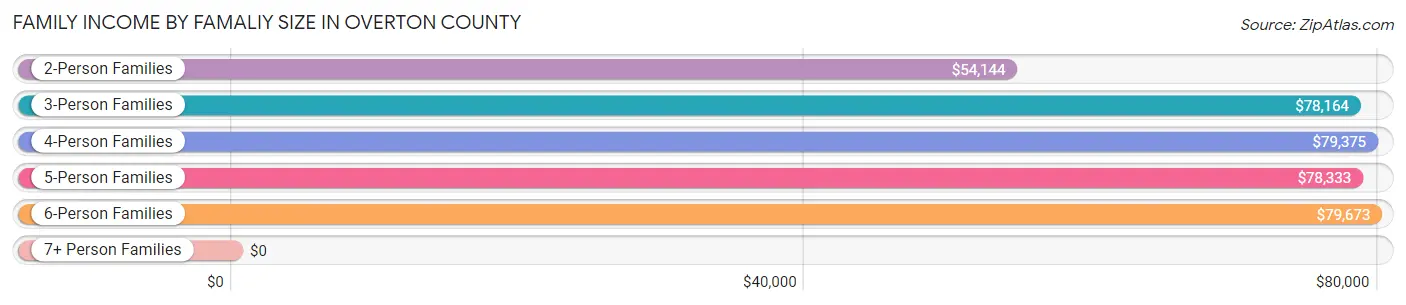
Family Income by Famaliy Size in Overton County
6-person families (187 | 3.1%) account for the highest median family income in Overton County with $79,673 per family, while 2-person families (2,870 | 47.2%) have the highest median income of $27,072 per family member.
| Income Bracket | # Families | Median Income |
| 2-Person Families | 2,870 (47.2%) | $54,144 |
| 3-Person Families | 1,278 (21.0%) | $78,164 |
| 4-Person Families | 1,213 (19.9%) | $79,375 |
| 5-Person Families | 456 (7.5%) | $78,333 |
| 6-Person Families | 187 (3.1%) | $79,673 |
| 7+ Person Families | 79 (1.3%) | $0 |
| Total | 6,083 (100.0%) | $66,627 |
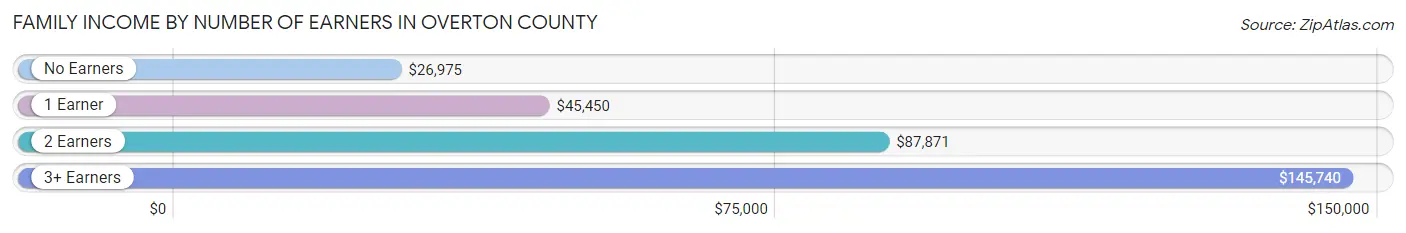
Family Income by Number of Earners in Overton County
The median family income in Overton County is $66,627, with families comprising 3+ earners (883) having the highest median family income of $145,740, while families with no earners (1,319) have the lowest median family income of $26,975, accounting for 14.5% and 21.7% of families, respectively.
| Number of Earners | # Families | Median Income |
| No Earners | 1,319 (21.7%) | $26,975 |
| 1 Earner | 1,824 (30.0%) | $45,450 |
| 2 Earners | 2,057 (33.8%) | $87,871 |
| 3+ Earners | 883 (14.5%) | $145,740 |
| Total | 6,083 (100.0%) | $66,627 |
Household Income in Overton County
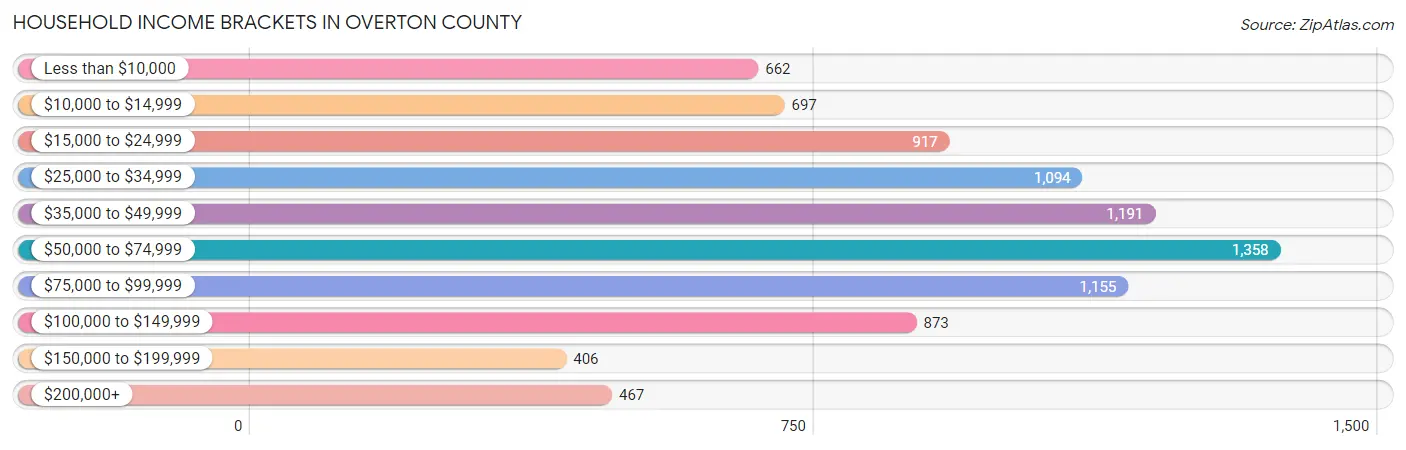
Household Income Brackets in Overton County
With 1,358 households falling in the category, the $50,000 to $74,999 income range is the most frequent in Overton County, accounting for 15.4% of all households. In contrast, only 406 households (4.6%) fall into the $150,000 to $199,999 income bracket, making it the least populous group.
| Income Bracket | # Households | % Households |
| Less than $10,000 | 662 | 7.5% |
| $10,000 to $14,999 | 697 | 7.9% |
| $15,000 to $24,999 | 917 | 10.4% |
| $25,000 to $34,999 | 1,094 | 12.4% |
| $35,000 to $49,999 | 1,191 | 13.5% |
| $50,000 to $74,999 | 1,358 | 15.4% |
| $75,000 to $99,999 | 1,155 | 13.1% |
| $100,000 to $149,999 | 873 | 9.9% |
| $150,000 to $199,999 | 406 | 4.6% |
| $200,000+ | 467 | 5.3% |
Household Income by Householder Age in Overton County
The median household income in Overton County is $46,580, with the highest median household income of $65,348 found in the 25 to 44 years age bracket for the primary householder. A total of 2,192 households (24.8%) fall into this category. Meanwhile, the 65+ years age bracket for the primary householder has the lowest median household income of $31,710, with 2,968 households (33.7%) in this group.

| Income Bracket | # Households | Median Income |
| 15 to 24 Years | 373 (4.2%) | $48,850 |
| 25 to 44 Years | 2,192 (24.8%) | $65,348 |
| 45 to 64 Years | 3,287 (37.3%) | $64,344 |
| 65+ Years | 2,968 (33.7%) | $31,710 |
| Total | 8,820 (100.0%) | $46,580 |
Poverty in Overton County
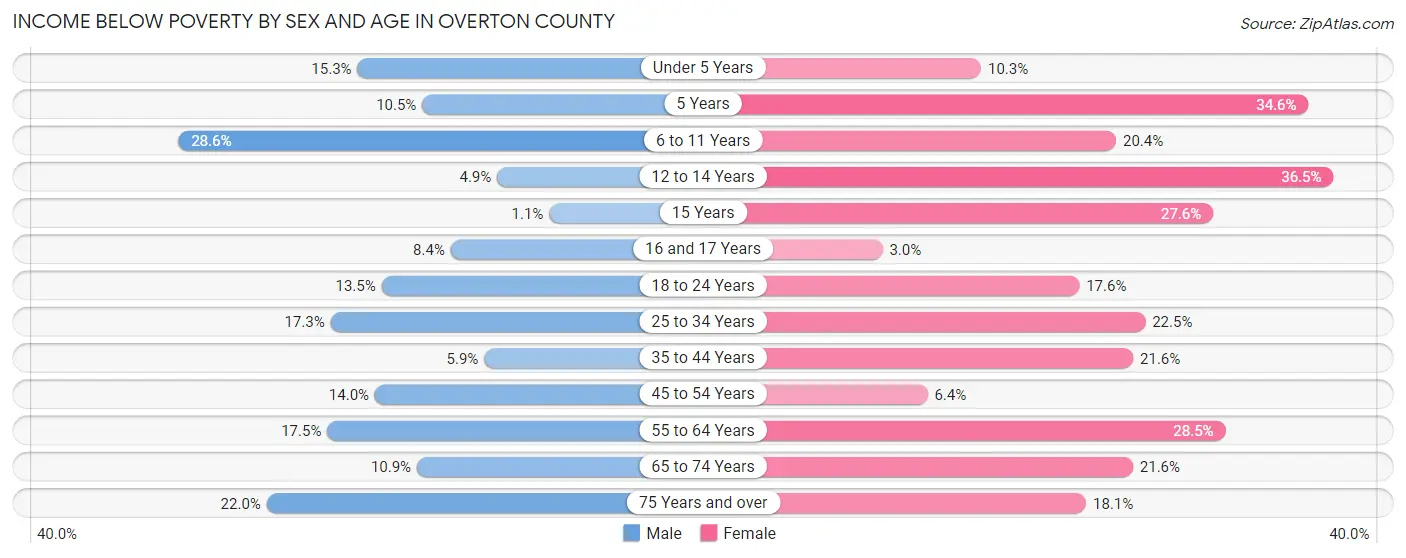
Income Below Poverty by Sex and Age in Overton County
With 14.6% poverty level for males and 19.9% for females among the residents of Overton County, 6 to 11 year old males and 12 to 14 year old females are the most vulnerable to poverty, with 261 males (28.6%) and 177 females (36.5%) in their respective age groups living below the poverty level.
| Age Bracket | Male | Female |
| Under 5 Years | 91 (15.3%) | 55 (10.3%) |
| 5 Years | 11 (10.5%) | 53 (34.6%) |
| 6 to 11 Years | 261 (28.6%) | 126 (20.4%) |
| 12 to 14 Years | 16 (4.9%) | 177 (36.5%) |
| 15 Years | 2 (1.1%) | 43 (27.6%) |
| 16 and 17 Years | 26 (8.4%) | 8 (3.0%) |
| 18 to 24 Years | 132 (13.5%) | 153 (17.6%) |
| 25 to 34 Years | 222 (17.3%) | 280 (22.5%) |
| 35 to 44 Years | 77 (5.9%) | 268 (21.6%) |
| 45 to 54 Years | 206 (14.0%) | 97 (6.4%) |
| 55 to 64 Years | 275 (17.5%) | 473 (28.5%) |
| 65 to 74 Years | 141 (10.9%) | 304 (21.6%) |
| 75 Years and over | 167 (22.0%) | 176 (18.1%) |
| Total | 1,627 (14.6%) | 2,213 (19.9%) |
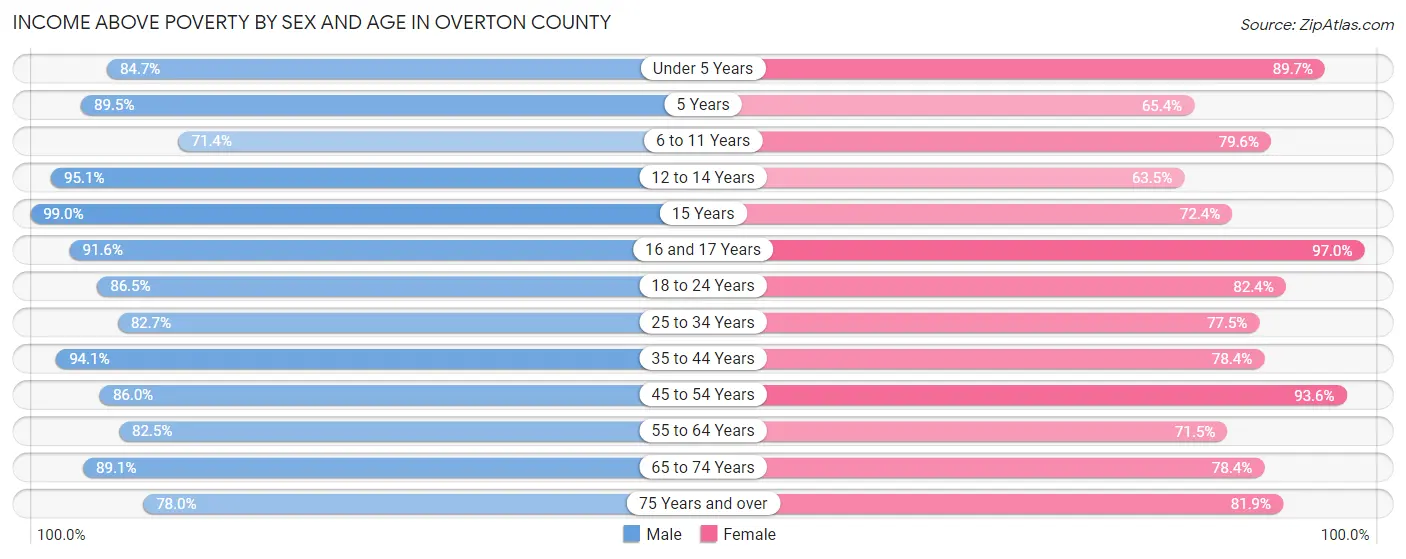
Income Above Poverty by Sex and Age in Overton County
According to the poverty statistics in Overton County, males aged 15 years and females aged 16 and 17 years are the age groups that are most secure financially, with 99.0% of males and 97.0% of females in these age groups living above the poverty line.
| Age Bracket | Male | Female |
| Under 5 Years | 504 (84.7%) | 477 (89.7%) |
| 5 Years | 94 (89.5%) | 100 (65.4%) |
| 6 to 11 Years | 652 (71.4%) | 493 (79.6%) |
| 12 to 14 Years | 309 (95.1%) | 308 (63.5%) |
| 15 Years | 188 (99.0%) | 113 (72.4%) |
| 16 and 17 Years | 285 (91.6%) | 257 (97.0%) |
| 18 to 24 Years | 846 (86.5%) | 715 (82.4%) |
| 25 to 34 Years | 1,062 (82.7%) | 963 (77.5%) |
| 35 to 44 Years | 1,232 (94.1%) | 971 (78.4%) |
| 45 to 54 Years | 1,266 (86.0%) | 1,428 (93.6%) |
| 55 to 64 Years | 1,294 (82.5%) | 1,188 (71.5%) |
| 65 to 74 Years | 1,156 (89.1%) | 1,103 (78.4%) |
| 75 Years and over | 591 (78.0%) | 794 (81.9%) |
| Total | 9,479 (85.4%) | 8,910 (80.1%) |
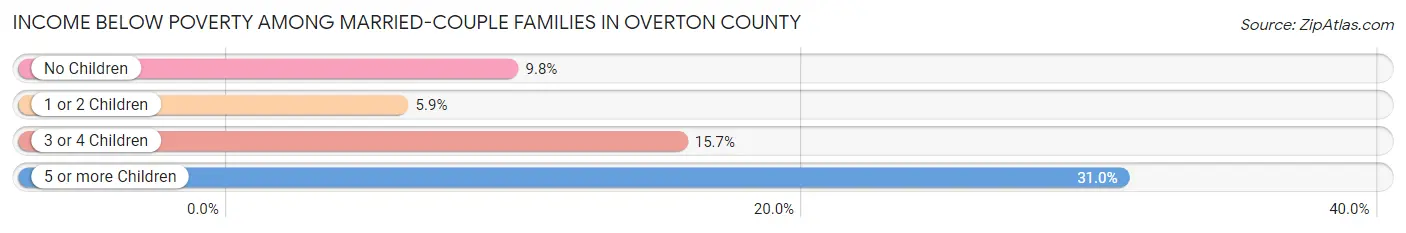
Income Below Poverty Among Married-Couple Families in Overton County
The poverty statistics for married-couple families in Overton County show that 9.0% or 433 of the total 4,801 families live below the poverty line. Families with 5 or more children have the highest poverty rate of 31.0%, comprising of 9 families. On the other hand, families with 1 or 2 children have the lowest poverty rate of 5.9%, which includes 91 families.
| Children | Above Poverty | Below Poverty |
| No Children | 2,669 (90.2%) | 289 (9.8%) |
| 1 or 2 Children | 1,442 (94.1%) | 91 (5.9%) |
| 3 or 4 Children | 237 (84.3%) | 44 (15.7%) |
| 5 or more Children | 20 (69.0%) | 9 (31.0%) |
| Total | 4,368 (91.0%) | 433 (9.0%) |
Income Below Poverty Among Single-Parent Households in Overton County
According to the poverty data in Overton County, 28.4% or 104 single-father households and 37.8% or 346 single-mother households are living below the poverty line. Among single-father households, those with no children have the highest poverty rate, with 91 households (35.1%) experiencing poverty. Likewise, among single-mother households, those with 3 or 4 children have the highest poverty rate, with 167 households (67.3%) falling below the poverty line.

| Children | Single Father | Single Mother |
| No Children | 91 (35.1%) | 64 (32.5%) |
| 1 or 2 Children | 7 (11.1%) | 115 (25.3%) |
| 3 or 4 Children | 6 (13.6%) | 167 (67.3%) |
| 5 or more Children | 0 (0.0%) | 0 (0.0%) |
| Total | 104 (28.4%) | 346 (37.8%) |
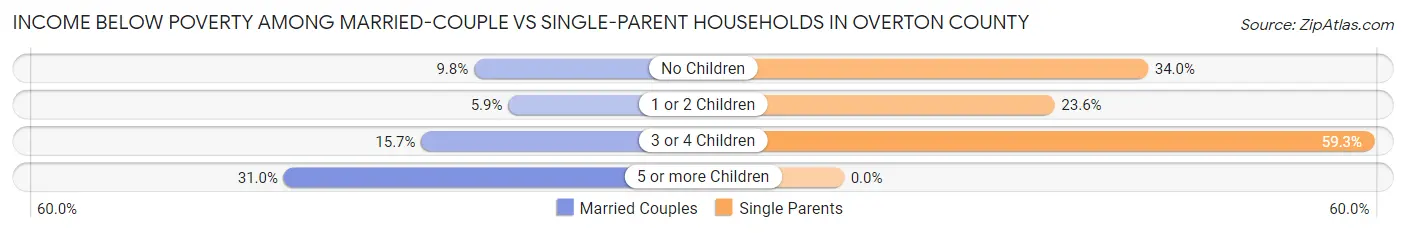
Income Below Poverty Among Married-Couple vs Single-Parent Households in Overton County
The poverty data for Overton County shows that 433 of the married-couple family households (9.0%) and 450 of the single-parent households (35.1%) are living below the poverty level. Within the married-couple family households, those with 5 or more children have the highest poverty rate, with 9 households (31.0%) falling below the poverty line. Among the single-parent households, those with 3 or 4 children have the highest poverty rate, with 173 household (59.3%) living below poverty.
| Children | Married-Couple Families | Single-Parent Households |
| No Children | 289 (9.8%) | 155 (34.0%) |
| 1 or 2 Children | 91 (5.9%) | 122 (23.5%) |
| 3 or 4 Children | 44 (15.7%) | 173 (59.3%) |
| 5 or more Children | 9 (31.0%) | 0 (0.0%) |
| Total | 433 (9.0%) | 450 (35.1%) |
Employment Characteristics in Overton County
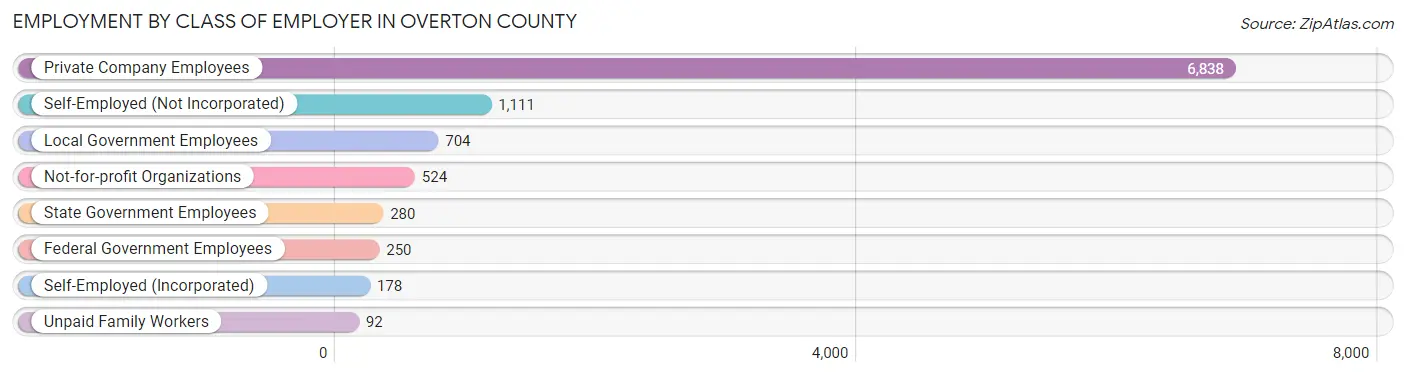
Employment by Class of Employer in Overton County
Among the 9,977 employed individuals in Overton County, private company employees (6,838 | 68.5%), self-employed (not incorporated) (1,111 | 11.1%), and local government employees (704 | 7.1%) make up the most common classes of employment.
| Employer Class | # Employees | % Employees |
| Private Company Employees | 6,838 | 68.5% |
| Self-Employed (Incorporated) | 178 | 1.8% |
| Self-Employed (Not Incorporated) | 1,111 | 11.1% |
| Not-for-profit Organizations | 524 | 5.2% |
| Local Government Employees | 704 | 7.1% |
| State Government Employees | 280 | 2.8% |
| Federal Government Employees | 250 | 2.5% |
| Unpaid Family Workers | 92 | 0.9% |
| Total | 9,977 | 100.0% |
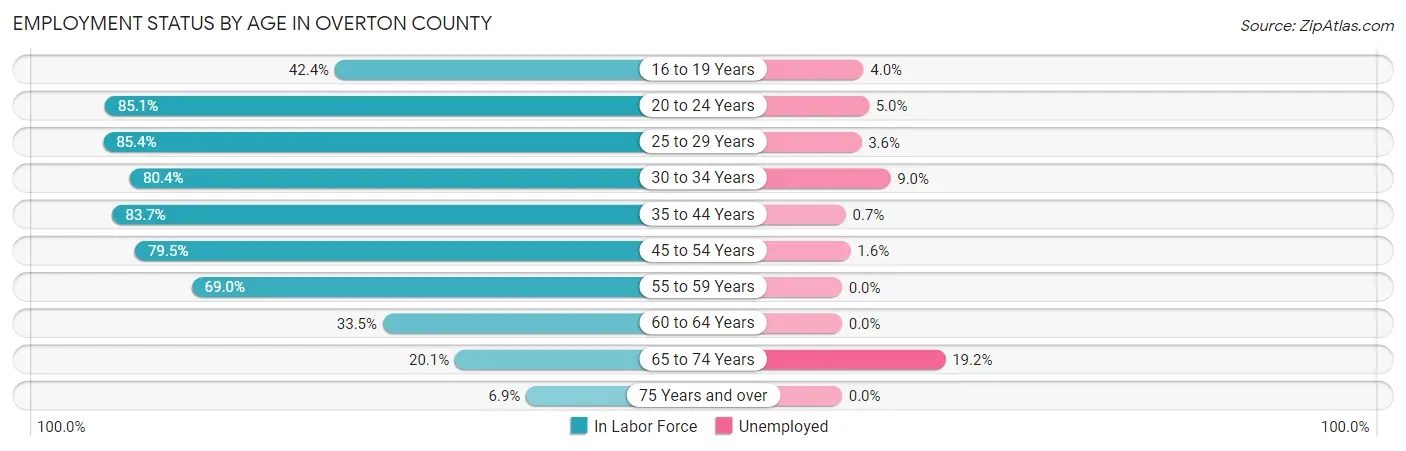
Employment Status by Age in Overton County
According to the labor force statistics for Overton County, out of the total population over 16 years of age (18,398), 57.4% or 10,560 individuals are in the labor force, with 3.5% or 370 of them unemployed. The age group with the highest labor force participation rate is 25 to 29 years, with 85.4% or 1,171 individuals in the labor force. Within the labor force, the 65 to 74 years age range has the highest percentage of unemployed individuals, with 19.2% or 106 of them being unemployed.
| Age Bracket | In Labor Force | Unemployed |
| 16 to 19 Years | 473 (42.4%) | 19 (4.0%) |
| 20 to 24 Years | 1,133 (85.1%) | 57 (5.0%) |
| 25 to 29 Years | 1,171 (85.4%) | 42 (3.6%) |
| 30 to 34 Years | 984 (80.4%) | 89 (9.0%) |
| 35 to 44 Years | 2,154 (83.7%) | 15 (0.7%) |
| 45 to 54 Years | 2,398 (79.5%) | 38 (1.6%) |
| 55 to 59 Years | 974 (69.0%) | 0 (0.0%) |
| 60 to 64 Years | 609 (33.5%) | 0 (0.0%) |
| 65 to 74 Years | 554 (20.1%) | 106 (19.2%) |
| 75 Years and over | 123 (6.9%) | 0 (0.0%) |
| Total | 10,560 (57.4%) | 370 (3.5%) |
Employment Status by Educational Attainment in Overton County
According to labor force statistics for Overton County, 72.6% of individuals (8,287) out of the total population between 25 and 64 years of age (11,414) are in the labor force, with 2.2% or 182 of them being unemployed. The group with the highest labor force participation rate are those with the educational attainment of bachelor's degree or higher, with 88.3% or 1,388 individuals in the labor force. Within the labor force, individuals with less than high school education have the highest percentage of unemployment, with 5.0% or 38 of them being unemployed.

| Educational Attainment | In Labor Force | Unemployed |
| Less than High School | 758 (49.1%) | 77 (5.0%) |
| High School Diploma | 3,895 (70.9%) | 66 (1.2%) |
| College / Associate Degree | 2,248 (80.1%) | 123 (4.4%) |
| Bachelor's Degree or higher | 1,388 (88.3%) | 0 (0.0%) |
| Total | 8,287 (72.6%) | 251 (2.2%) |
Employment Occupations by Sex in Overton County
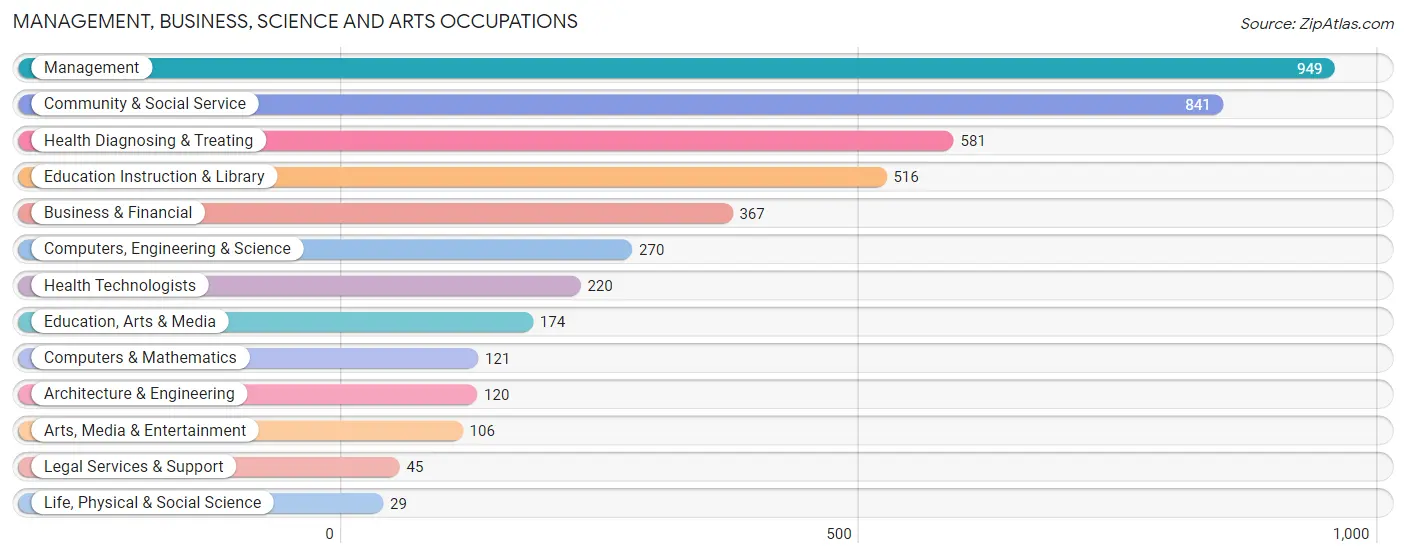
Management, Business, Science and Arts Occupations
The most common Management, Business, Science and Arts occupations in Overton County are Management (949 | 9.3%), Community & Social Service (841 | 8.2%), Health Diagnosing & Treating (581 | 5.7%), Education Instruction & Library (516 | 5.1%), and Business & Financial (367 | 3.6%).
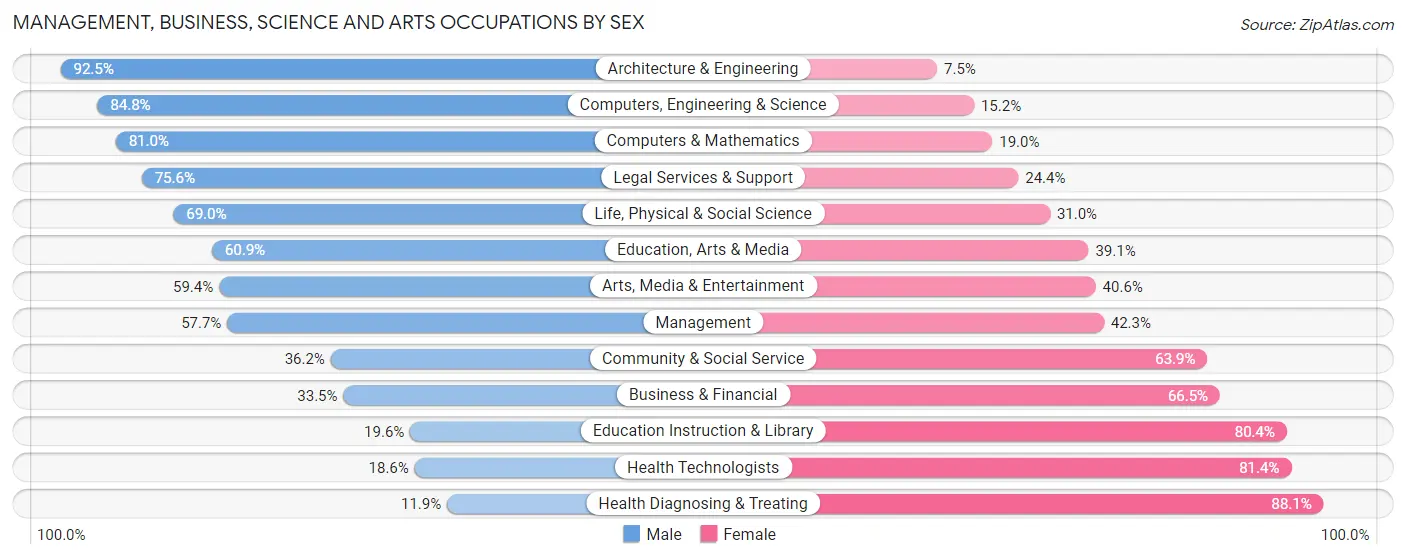
Management, Business, Science and Arts Occupations by Sex
Within the Management, Business, Science and Arts occupations in Overton County, the most male-oriented occupations are Architecture & Engineering (92.5%), Computers, Engineering & Science (84.8%), and Computers & Mathematics (81.0%), while the most female-oriented occupations are Health Diagnosing & Treating (88.1%), Health Technologists (81.4%), and Education Instruction & Library (80.4%).
| Occupation | Male | Female |
| Management | 548 (57.7%) | 401 (42.3%) |
| Business & Financial | 123 (33.5%) | 244 (66.5%) |
| Computers, Engineering & Science | 229 (84.8%) | 41 (15.2%) |
| Computers & Mathematics | 98 (81.0%) | 23 (19.0%) |
| Architecture & Engineering | 111 (92.5%) | 9 (7.5%) |
| Life, Physical & Social Science | 20 (69.0%) | 9 (31.0%) |
| Community & Social Service | 304 (36.1%) | 537 (63.8%) |
| Education, Arts & Media | 106 (60.9%) | 68 (39.1%) |
| Legal Services & Support | 34 (75.6%) | 11 (24.4%) |
| Education Instruction & Library | 101 (19.6%) | 415 (80.4%) |
| Arts, Media & Entertainment | 63 (59.4%) | 43 (40.6%) |
| Health Diagnosing & Treating | 69 (11.9%) | 512 (88.1%) |
| Health Technologists | 41 (18.6%) | 179 (81.4%) |
| Total (Category) | 1,273 (42.3%) | 1,735 (57.7%) |
| Total (Overall) | 5,609 (55.0%) | 4,592 (45.0%) |
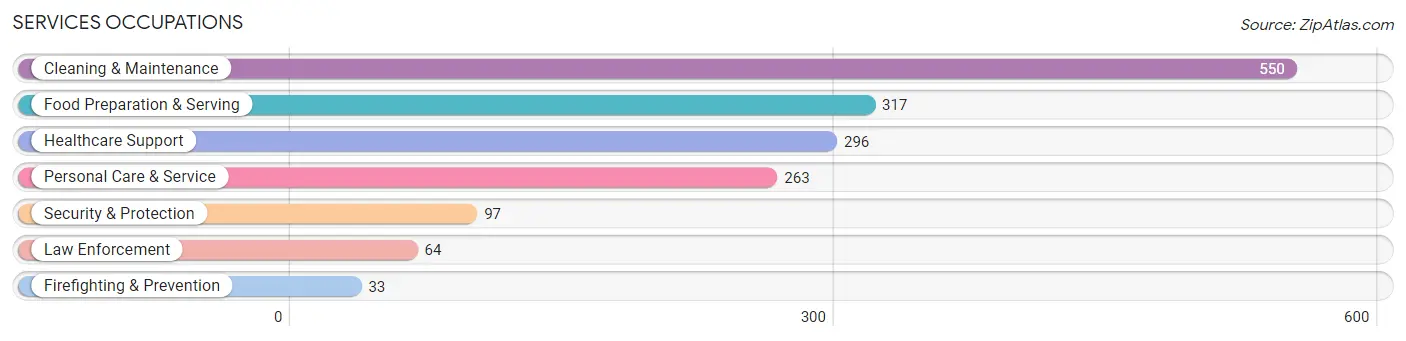
Services Occupations
The most common Services occupations in Overton County are Cleaning & Maintenance (550 | 5.4%), Food Preparation & Serving (317 | 3.1%), Healthcare Support (296 | 2.9%), Personal Care & Service (263 | 2.6%), and Security & Protection (97 | 0.9%).
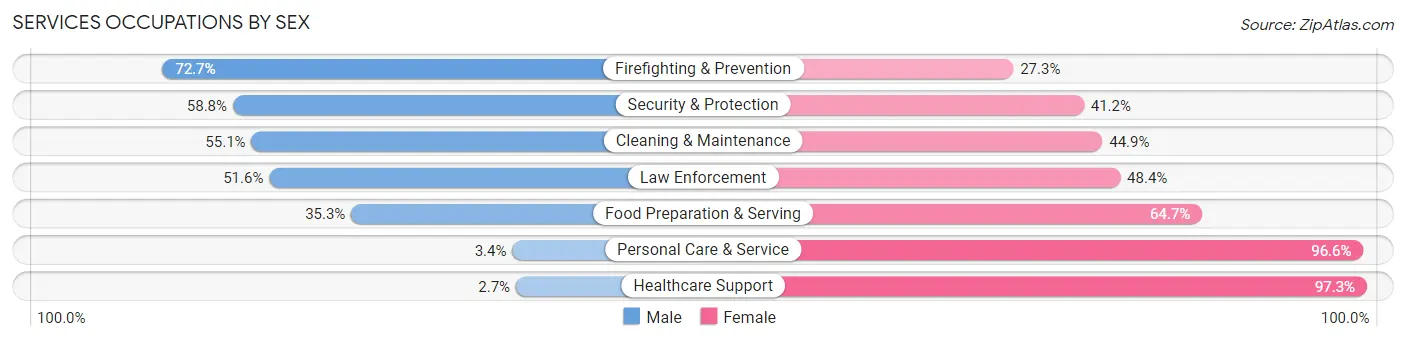
Services Occupations by Sex
Within the Services occupations in Overton County, the most male-oriented occupations are Firefighting & Prevention (72.7%), Security & Protection (58.8%), and Cleaning & Maintenance (55.1%), while the most female-oriented occupations are Healthcare Support (97.3%), Personal Care & Service (96.6%), and Food Preparation & Serving (64.7%).
| Occupation | Male | Female |
| Healthcare Support | 8 (2.7%) | 288 (97.3%) |
| Security & Protection | 57 (58.8%) | 40 (41.2%) |
| Firefighting & Prevention | 24 (72.7%) | 9 (27.3%) |
| Law Enforcement | 33 (51.6%) | 31 (48.4%) |
| Food Preparation & Serving | 112 (35.3%) | 205 (64.7%) |
| Cleaning & Maintenance | 303 (55.1%) | 247 (44.9%) |
| Personal Care & Service | 9 (3.4%) | 254 (96.6%) |
| Total (Category) | 489 (32.1%) | 1,034 (67.9%) |
| Total (Overall) | 5,609 (55.0%) | 4,592 (45.0%) |
Sales and Office Occupations
The most common Sales and Office occupations in Overton County are Office & Administration (977 | 9.6%), and Sales & Related (907 | 8.9%).

Sales and Office Occupations by Sex

| Occupation | Male | Female |
| Sales & Related | 364 (40.1%) | 543 (59.9%) |
| Office & Administration | 251 (25.7%) | 726 (74.3%) |
| Total (Category) | 615 (32.6%) | 1,269 (67.4%) |
| Total (Overall) | 5,609 (55.0%) | 4,592 (45.0%) |
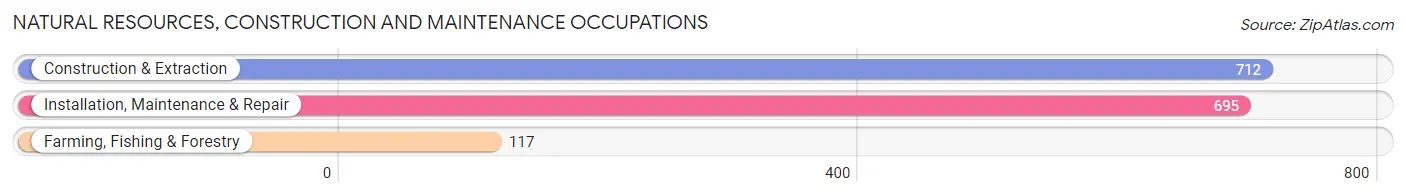
Natural Resources, Construction and Maintenance Occupations
The most common Natural Resources, Construction and Maintenance occupations in Overton County are Construction & Extraction (712 | 7.0%), Installation, Maintenance & Repair (695 | 6.8%), and Farming, Fishing & Forestry (117 | 1.1%).
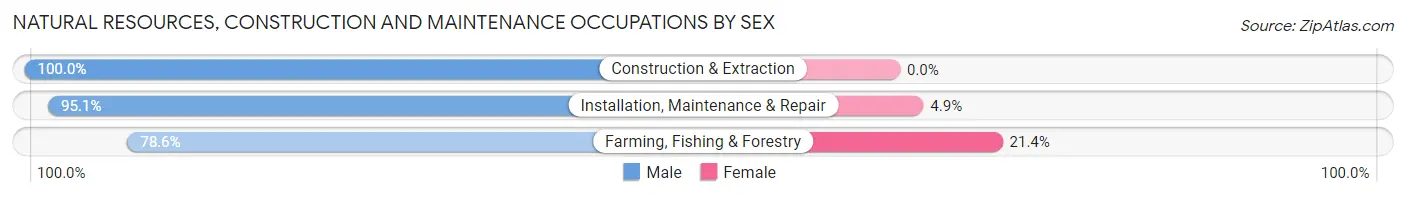
Natural Resources, Construction and Maintenance Occupations by Sex
| Occupation | Male | Female |
| Farming, Fishing & Forestry | 92 (78.6%) | 25 (21.4%) |
| Construction & Extraction | 712 (100.0%) | 0 (0.0%) |
| Installation, Maintenance & Repair | 661 (95.1%) | 34 (4.9%) |
| Total (Category) | 1,465 (96.1%) | 59 (3.9%) |
| Total (Overall) | 5,609 (55.0%) | 4,592 (45.0%) |
Production, Transportation and Moving Occupations
The most common Production, Transportation and Moving occupations in Overton County are Production (1,158 | 11.4%), Transportation (714 | 7.0%), and Material Moving (390 | 3.8%).
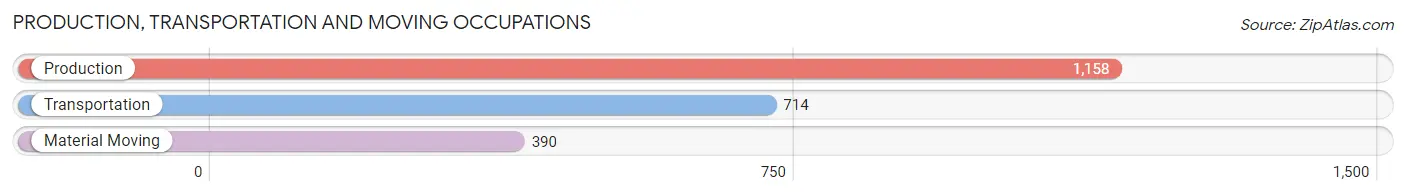
Production, Transportation and Moving Occupations by Sex

| Occupation | Male | Female |
| Production | 926 (80.0%) | 232 (20.0%) |
| Transportation | 538 (75.3%) | 176 (24.6%) |
| Material Moving | 303 (77.7%) | 87 (22.3%) |
| Total (Category) | 1,767 (78.1%) | 495 (21.9%) |
| Total (Overall) | 5,609 (55.0%) | 4,592 (45.0%) |
Employment Industries by Sex in Overton County
Employment Industries in Overton County
The major employment industries in Overton County include Manufacturing (1,915 | 18.8%), Health Care & Social Assistance (1,240 | 12.2%), Retail Trade (1,129 | 11.1%), Accommodation & Food Services (700 | 6.9%), and Construction (672 | 6.6%).

Employment Industries by Sex in Overton County
The Overton County industries that see more men than women are Mining, Quarrying, & Extraction (100.0%), Construction (96.0%), and Information (86.8%), whereas the industries that tend to have a higher number of women are Health Care & Social Assistance (92.2%), Finance & Insurance (79.6%), and Educational Services (70.7%).
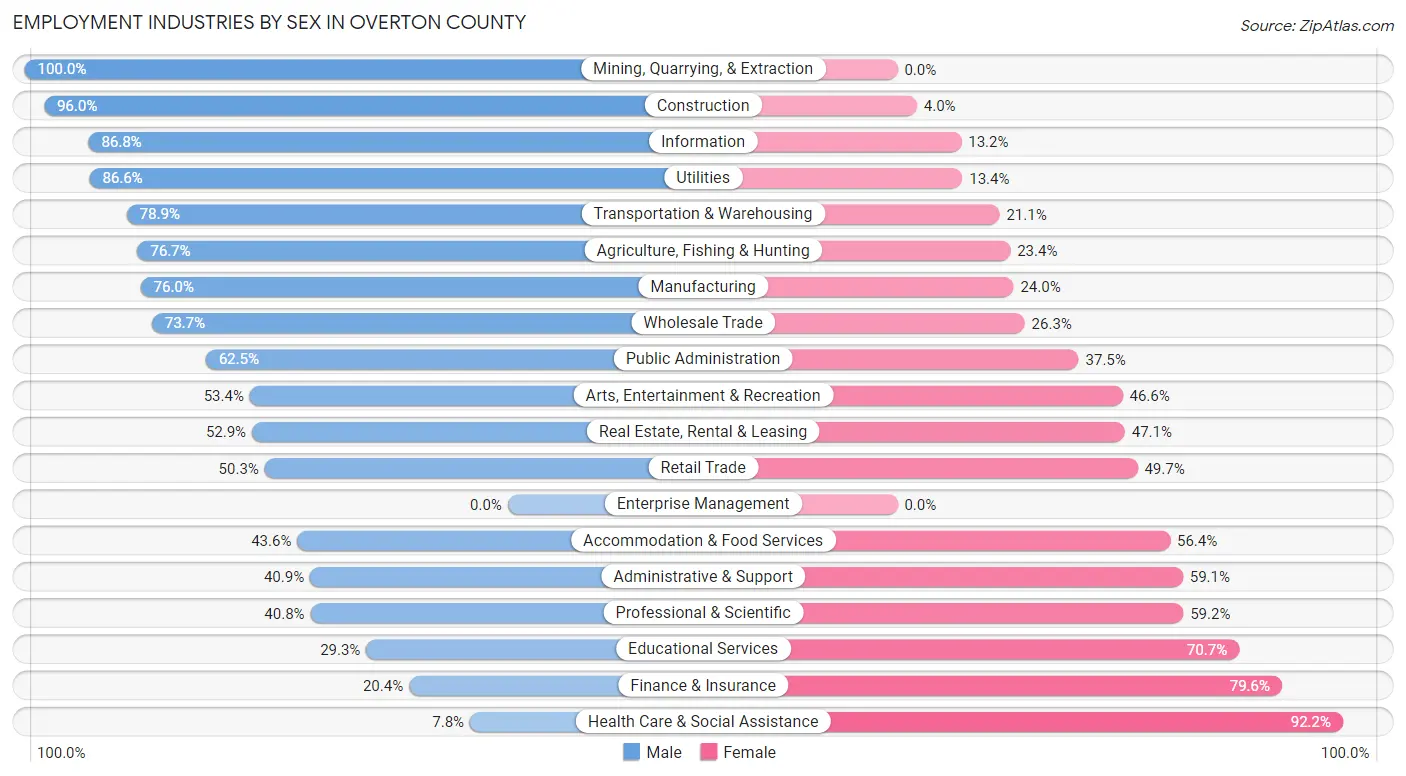
| Industry | Male | Female |
| Agriculture, Fishing & Hunting | 197 (76.6%) | 60 (23.4%) |
| Mining, Quarrying, & Extraction | 52 (100.0%) | 0 (0.0%) |
| Construction | 645 (96.0%) | 27 (4.0%) |
| Manufacturing | 1,455 (76.0%) | 460 (24.0%) |
| Wholesale Trade | 151 (73.7%) | 54 (26.3%) |
| Retail Trade | 568 (50.3%) | 561 (49.7%) |
| Transportation & Warehousing | 433 (78.9%) | 116 (21.1%) |
| Utilities | 116 (86.6%) | 18 (13.4%) |
| Information | 197 (86.8%) | 30 (13.2%) |
| Finance & Insurance | 102 (20.4%) | 397 (79.6%) |
| Real Estate, Rental & Leasing | 27 (52.9%) | 24 (47.1%) |
| Professional & Scientific | 78 (40.8%) | 113 (59.2%) |
| Enterprise Management | 0 (0.0%) | 0 (0.0%) |
| Administrative & Support | 219 (40.9%) | 316 (59.1%) |
| Educational Services | 181 (29.3%) | 437 (70.7%) |
| Health Care & Social Assistance | 97 (7.8%) | 1,143 (92.2%) |
| Arts, Entertainment & Recreation | 55 (53.4%) | 48 (46.6%) |
| Accommodation & Food Services | 305 (43.6%) | 395 (56.4%) |
| Public Administration | 200 (62.5%) | 120 (37.5%) |
| Total | 5,609 (55.0%) | 4,592 (45.0%) |
Education in Overton County
School Enrollment in Overton County
The most common levels of schooling among the 4,391 students in Overton County are middle school (1,228 | 28.0%), high school (1,022 | 23.3%), and elementary school (941 | 21.4%).
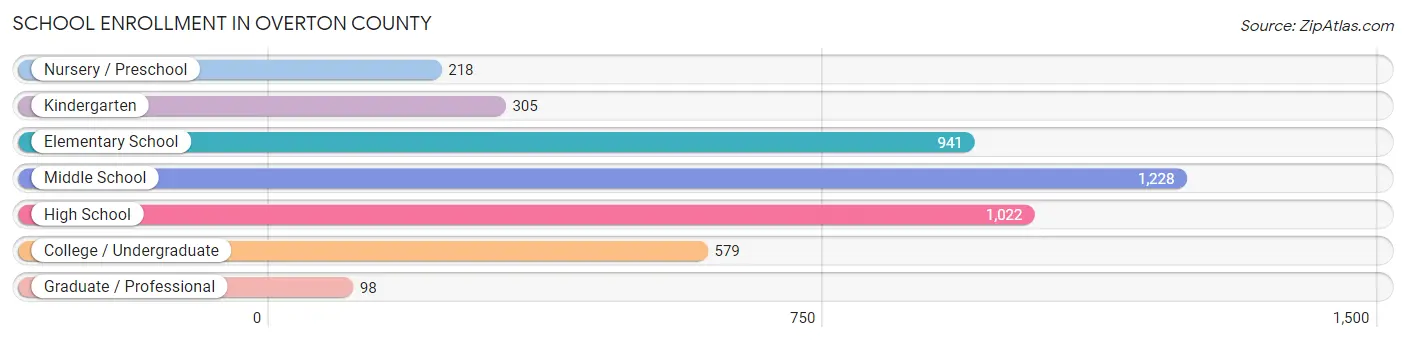
| School Level | # Students | % Students |
| Nursery / Preschool | 218 | 5.0% |
| Kindergarten | 305 | 7.0% |
| Elementary School | 941 | 21.4% |
| Middle School | 1,228 | 28.0% |
| High School | 1,022 | 23.3% |
| College / Undergraduate | 579 | 13.2% |
| Graduate / Professional | 98 | 2.2% |
| Total | 4,391 | 100.0% |
School Enrollment by Age by Funding Source in Overton County
Out of a total of 4,391 students who are enrolled in schools in Overton County, 465 (10.6%) attend a private institution, while the remaining 3,926 (89.4%) are enrolled in public schools. The age group of 35 years and over has the highest likelihood of being enrolled in private schools, with 44 (52.4% in the age bracket) enrolled. Conversely, the age group of 20 to 24 year olds has the lowest likelihood of being enrolled in a private school, with 262 (92.6% in the age bracket) attending a public institution.
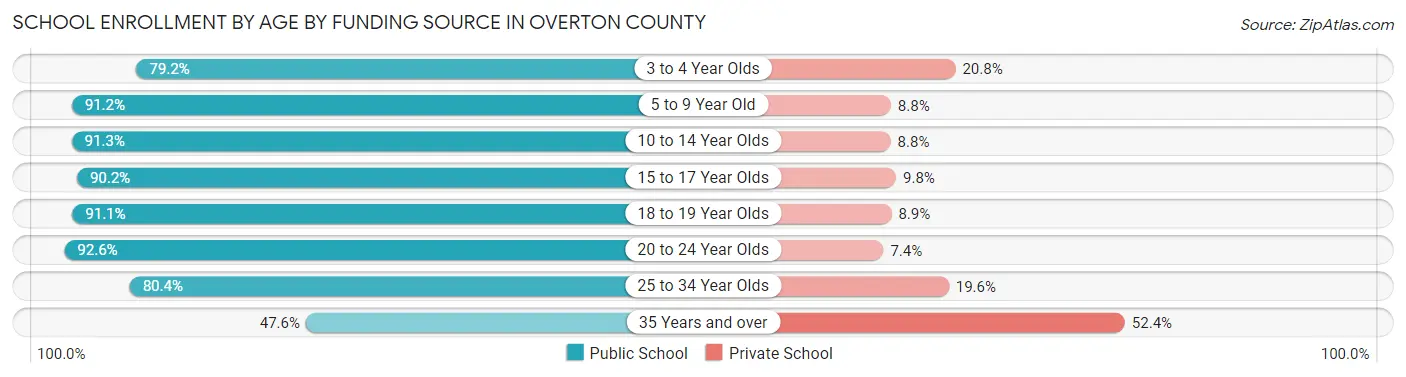
| Age Bracket | Public School | Private School |
| 3 to 4 Year Olds | 133 (79.2%) | 35 (20.8%) |
| 5 to 9 Year Old | 933 (91.2%) | 90 (8.8%) |
| 10 to 14 Year Olds | 1,398 (91.2%) | 134 (8.7%) |
| 15 to 17 Year Olds | 740 (90.2%) | 80 (9.8%) |
| 18 to 19 Year Olds | 266 (91.1%) | 26 (8.9%) |
| 20 to 24 Year Olds | 262 (92.6%) | 21 (7.4%) |
| 25 to 34 Year Olds | 152 (80.4%) | 37 (19.6%) |
| 35 Years and over | 40 (47.6%) | 44 (52.4%) |
| Total | 3,926 (89.4%) | 465 (10.6%) |
Educational Attainment by Field of Study in Overton County
Education (597 | 25.5%), business (422 | 18.0%), science & technology (305 | 13.0%), bio, nature & agricultural (191 | 8.2%), and psychology (180 | 7.7%) are the most common fields of study among 2,341 individuals in Overton County who have obtained a bachelor's degree or higher.

| Field of Study | # Graduates | % Graduates |
| Computers & Mathematics | 83 | 3.5% |
| Bio, Nature & Agricultural | 191 | 8.2% |
| Physical & Health Sciences | 23 | 1.0% |
| Psychology | 180 | 7.7% |
| Social Sciences | 88 | 3.8% |
| Engineering | 108 | 4.6% |
| Multidisciplinary Studies | 48 | 2.1% |
| Science & Technology | 305 | 13.0% |
| Business | 422 | 18.0% |
| Education | 597 | 25.5% |
| Literature & Languages | 43 | 1.8% |
| Liberal Arts & History | 160 | 6.8% |
| Visual & Performing Arts | 21 | 0.9% |
| Communications | 31 | 1.3% |
| Arts & Humanities | 41 | 1.8% |
| Total | 2,341 | 100.0% |
Transportation & Commute in Overton County
Vehicle Availability by Sex in Overton County
The most prevalent vehicle ownership categories in Overton County are males with 2 vehicles (1,636, accounting for 29.7%) and females with 2 vehicles (1,371, making up 36.5%).
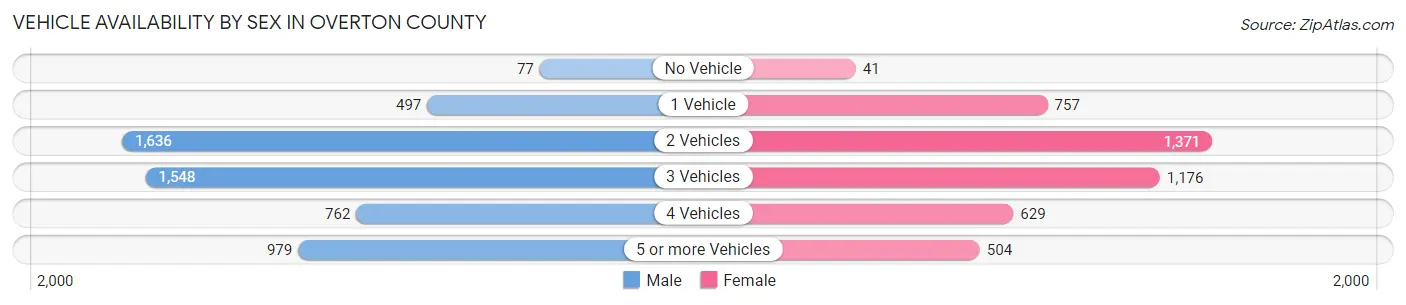
| Vehicles Available | Male | Female |
| No Vehicle | 77 (1.4%) | 41 (0.9%) |
| 1 Vehicle | 497 (9.0%) | 757 (16.9%) |
| 2 Vehicles | 1,636 (29.7%) | 1,371 (30.6%) |
| 3 Vehicles | 1,548 (28.1%) | 1,176 (26.3%) |
| 4 Vehicles | 762 (13.9%) | 629 (14.1%) |
| 5 or more Vehicles | 979 (17.8%) | 504 (11.3%) |
| Total | 5,499 (100.0%) | 4,478 (100.0%) |
Commute Time in Overton County
The most frequently occuring commute durations in Overton County are 30 to 34 minutes (1,590 commuters, 17.0%), 10 to 14 minutes (1,463 commuters, 15.6%), and 20 to 24 minutes (1,293 commuters, 13.8%).

| Commute Time | # Commuters | % Commuters |
| Less than 5 Minutes | 367 | 3.9% |
| 5 to 9 Minutes | 827 | 8.8% |
| 10 to 14 Minutes | 1,463 | 15.6% |
| 15 to 19 Minutes | 1,069 | 11.4% |
| 20 to 24 Minutes | 1,293 | 13.8% |
| 25 to 29 Minutes | 709 | 7.6% |
| 30 to 34 Minutes | 1,590 | 17.0% |
| 35 to 39 Minutes | 328 | 3.5% |
| 40 to 44 Minutes | 341 | 3.6% |
| 45 to 59 Minutes | 846 | 9.0% |
| 60 to 89 Minutes | 237 | 2.5% |
| 90 or more Minutes | 284 | 3.0% |
Commute Time by Sex in Overton County
The most common commute times in Overton County are 30 to 34 minutes (891 commuters, 17.1%) for males and 10 to 14 minutes (716 commuters, 17.3%) for females.
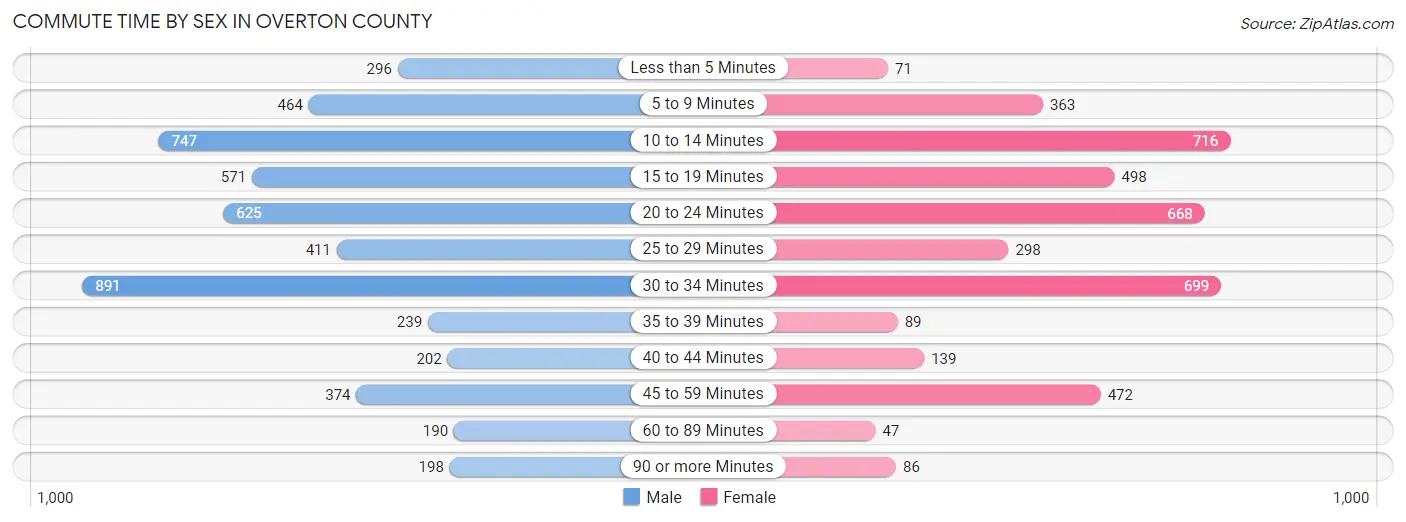
| Commute Time | Male | Female |
| Less than 5 Minutes | 296 (5.7%) | 71 (1.7%) |
| 5 to 9 Minutes | 464 (8.9%) | 363 (8.8%) |
| 10 to 14 Minutes | 747 (14.3%) | 716 (17.3%) |
| 15 to 19 Minutes | 571 (11.0%) | 498 (12.0%) |
| 20 to 24 Minutes | 625 (12.0%) | 668 (16.1%) |
| 25 to 29 Minutes | 411 (7.9%) | 298 (7.2%) |
| 30 to 34 Minutes | 891 (17.1%) | 699 (16.9%) |
| 35 to 39 Minutes | 239 (4.6%) | 89 (2.1%) |
| 40 to 44 Minutes | 202 (3.9%) | 139 (3.4%) |
| 45 to 59 Minutes | 374 (7.2%) | 472 (11.4%) |
| 60 to 89 Minutes | 190 (3.6%) | 47 (1.1%) |
| 90 or more Minutes | 198 (3.8%) | 86 (2.1%) |
Time of Departure to Work by Sex in Overton County
The most frequent times of departure to work in Overton County are 7:00 AM to 7:29 AM (852, 16.4%) for males and 7:00 AM to 7:29 AM (845, 20.4%) for females.
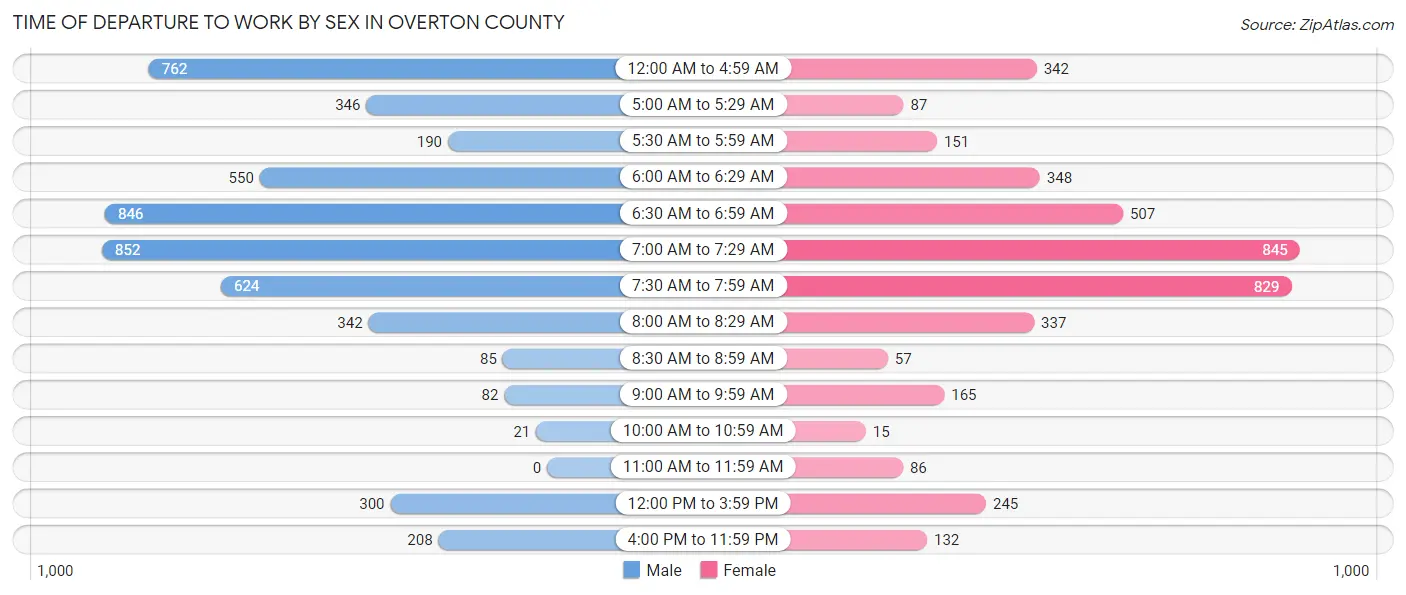
| Time of Departure | Male | Female |
| 12:00 AM to 4:59 AM | 762 (14.6%) | 342 (8.3%) |
| 5:00 AM to 5:29 AM | 346 (6.6%) | 87 (2.1%) |
| 5:30 AM to 5:59 AM | 190 (3.6%) | 151 (3.6%) |
| 6:00 AM to 6:29 AM | 550 (10.6%) | 348 (8.4%) |
| 6:30 AM to 6:59 AM | 846 (16.2%) | 507 (12.2%) |
| 7:00 AM to 7:29 AM | 852 (16.4%) | 845 (20.4%) |
| 7:30 AM to 7:59 AM | 624 (12.0%) | 829 (20.0%) |
| 8:00 AM to 8:29 AM | 342 (6.6%) | 337 (8.1%) |
| 8:30 AM to 8:59 AM | 85 (1.6%) | 57 (1.4%) |
| 9:00 AM to 9:59 AM | 82 (1.6%) | 165 (4.0%) |
| 10:00 AM to 10:59 AM | 21 (0.4%) | 15 (0.4%) |
| 11:00 AM to 11:59 AM | 0 (0.0%) | 86 (2.1%) |
| 12:00 PM to 3:59 PM | 300 (5.8%) | 245 (5.9%) |
| 4:00 PM to 11:59 PM | 208 (4.0%) | 132 (3.2%) |
| Total | 5,208 (100.0%) | 4,146 (100.0%) |
Housing Occupancy in Overton County
Occupancy by Ownership in Overton County
Of the total 8,820 dwellings in Overton County, owner-occupied units account for 6,957 (78.9%), while renter-occupied units make up 1,863 (21.1%).
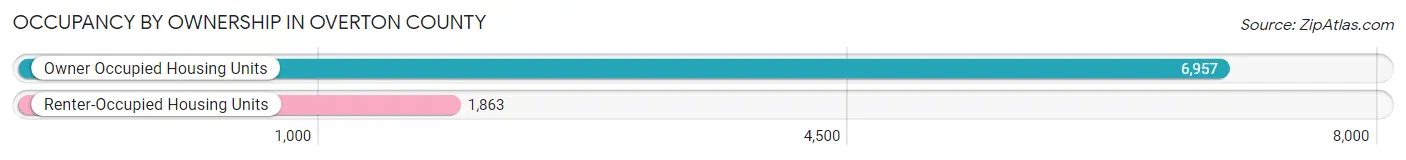
| Occupancy | # Housing Units | % Housing Units |
| Owner Occupied Housing Units | 6,957 | 78.9% |
| Renter-Occupied Housing Units | 1,863 | 21.1% |
| Total Occupied Housing Units | 8,820 | 100.0% |
Occupancy by Household Size in Overton County
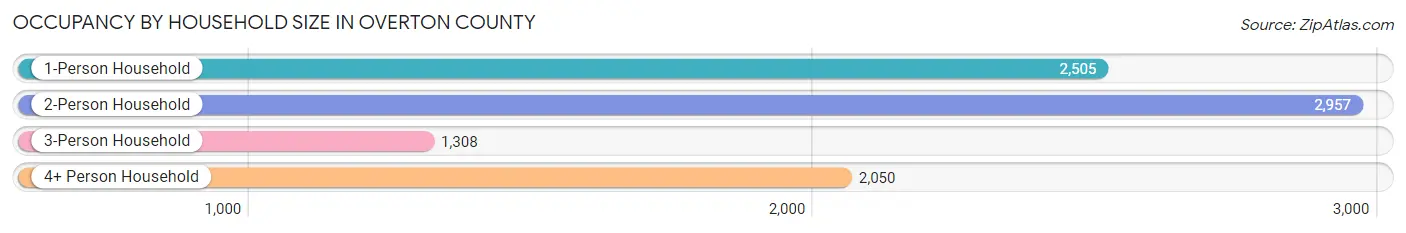
| Household Size | # Housing Units | % Housing Units |
| 1-Person Household | 2,505 | 28.4% |
| 2-Person Household | 2,957 | 33.5% |
| 3-Person Household | 1,308 | 14.8% |
| 4+ Person Household | 2,050 | 23.2% |
| Total Housing Units | 8,820 | 100.0% |
Occupancy by Ownership by Household Size in Overton County

| Household Size | Owner-occupied | Renter-occupied |
| 1-Person Household | 1,948 (77.8%) | 557 (22.2%) |
| 2-Person Household | 2,548 (86.2%) | 409 (13.8%) |
| 3-Person Household | 1,009 (77.1%) | 299 (22.9%) |
| 4+ Person Household | 1,452 (70.8%) | 598 (29.2%) |
| Total Housing Units | 6,957 (78.9%) | 1,863 (21.1%) |
Occupancy by Educational Attainment in Overton County

| Household Size | Owner-occupied | Renter-occupied |
| Less than High School | 1,154 (82.3%) | 248 (17.7%) |
| High School Diploma | 2,988 (81.2%) | 693 (18.8%) |
| College/Associate Degree | 1,692 (69.0%) | 761 (31.0%) |
| Bachelor's Degree or higher | 1,123 (87.5%) | 161 (12.5%) |
Occupancy by Age of Householder in Overton County

| Age Bracket | # Households | % Households |
| Under 35 Years | 1,290 | 14.6% |
| 35 to 44 Years | 1,275 | 14.5% |
| 45 to 54 Years | 1,351 | 15.3% |
| 55 to 64 Years | 1,936 | 22.0% |
| 65 to 74 Years | 1,795 | 20.3% |
| 75 to 84 Years | 855 | 9.7% |
| 85 Years and Over | 318 | 3.6% |
| Total | 8,820 | 100.0% |
Housing Finances in Overton County
Median Income by Occupancy in Overton County
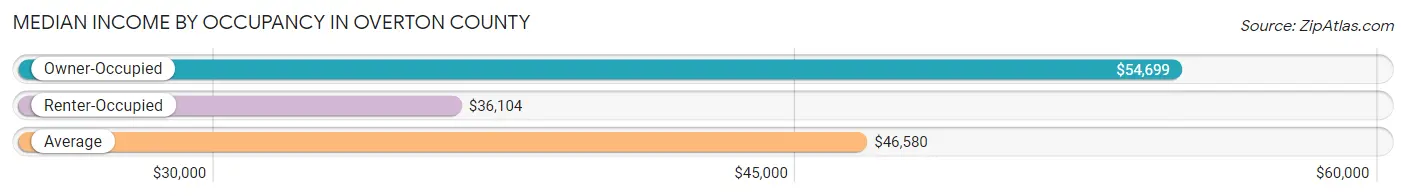
| Occupancy Type | # Households | Median Income |
| Owner-Occupied | 6,957 (78.9%) | $54,699 |
| Renter-Occupied | 1,863 (21.1%) | $36,104 |
| Average | 8,820 (100.0%) | $46,580 |
Occupancy by Householder Income Bracket in Overton County
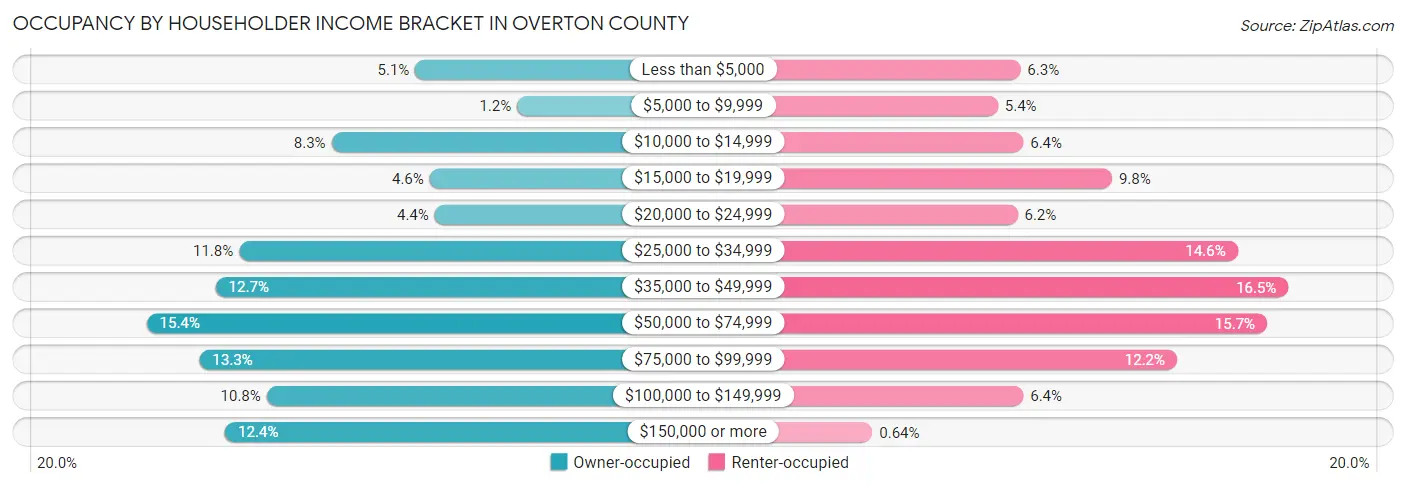
| Income Bracket | Owner-occupied | Renter-occupied |
| Less than $5,000 | 356 (5.1%) | 117 (6.3%) |
| $5,000 to $9,999 | 86 (1.2%) | 101 (5.4%) |
| $10,000 to $14,999 | 578 (8.3%) | 119 (6.4%) |
| $15,000 to $19,999 | 318 (4.6%) | 182 (9.8%) |
| $20,000 to $24,999 | 305 (4.4%) | 115 (6.2%) |
| $25,000 to $34,999 | 823 (11.8%) | 271 (14.5%) |
| $35,000 to $49,999 | 885 (12.7%) | 307 (16.5%) |
| $50,000 to $74,999 | 1,068 (15.3%) | 292 (15.7%) |
| $75,000 to $99,999 | 928 (13.3%) | 228 (12.2%) |
| $100,000 to $149,999 | 750 (10.8%) | 119 (6.4%) |
| $150,000 or more | 860 (12.4%) | 12 (0.6%) |
| Total | 6,957 (100.0%) | 1,863 (100.0%) |
Monthly Housing Cost Tiers in Overton County
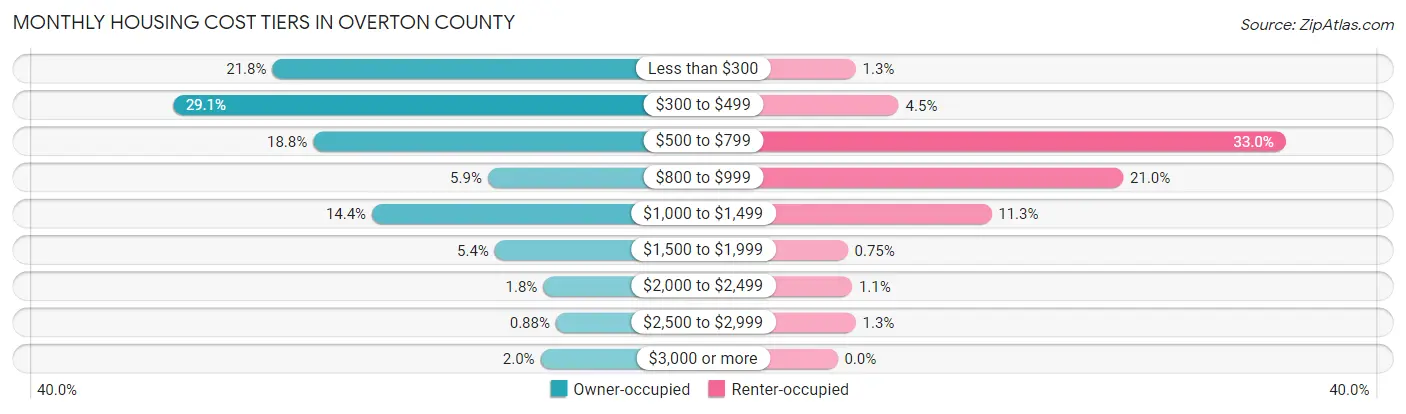
| Monthly Cost | Owner-occupied | Renter-occupied |
| Less than $300 | 1,514 (21.8%) | 25 (1.3%) |
| $300 to $499 | 2,024 (29.1%) | 84 (4.5%) |
| $500 to $799 | 1,305 (18.8%) | 615 (33.0%) |
| $800 to $999 | 410 (5.9%) | 392 (21.0%) |
| $1,000 to $1,499 | 1,003 (14.4%) | 211 (11.3%) |
| $1,500 to $1,999 | 374 (5.4%) | 14 (0.7%) |
| $2,000 to $2,499 | 126 (1.8%) | 20 (1.1%) |
| $2,500 to $2,999 | 61 (0.9%) | 25 (1.3%) |
| $3,000 or more | 140 (2.0%) | 0 (0.0%) |
| Total | 6,957 (100.0%) | 1,863 (100.0%) |
Physical Housing Characteristics in Overton County
Housing Structures in Overton County
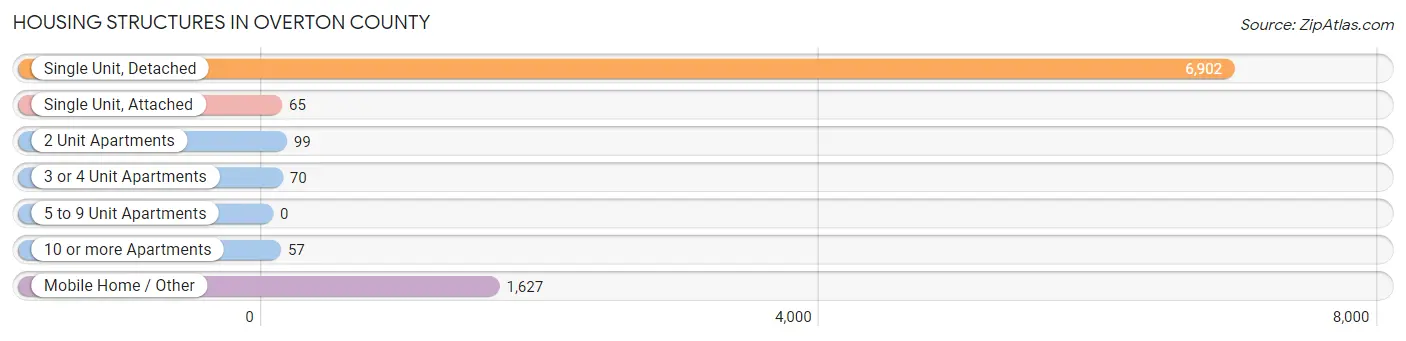
| Structure Type | # Housing Units | % Housing Units |
| Single Unit, Detached | 6,902 | 78.2% |
| Single Unit, Attached | 65 | 0.7% |
| 2 Unit Apartments | 99 | 1.1% |
| 3 or 4 Unit Apartments | 70 | 0.8% |
| 5 to 9 Unit Apartments | 0 | 0.0% |
| 10 or more Apartments | 57 | 0.6% |
| Mobile Home / Other | 1,627 | 18.4% |
| Total | 8,820 | 100.0% |
Housing Structures by Occupancy in Overton County
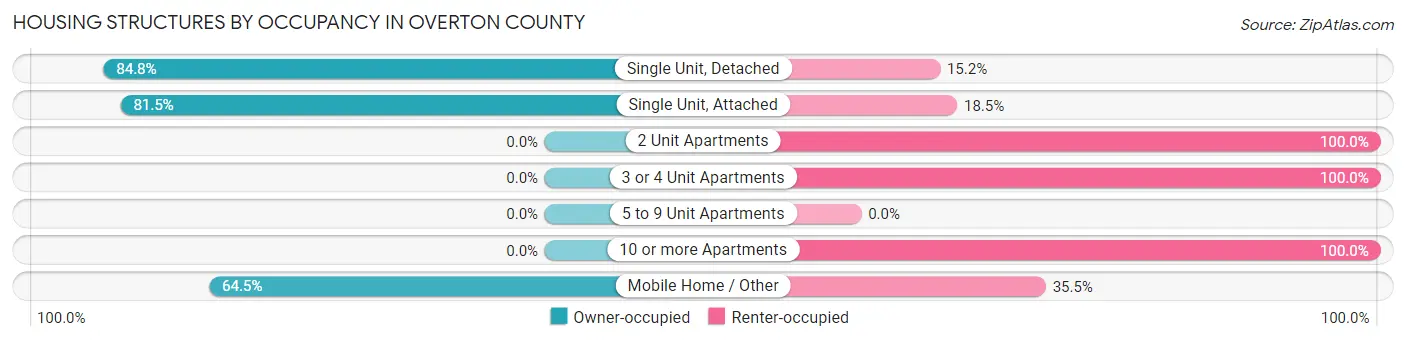
| Structure Type | Owner-occupied | Renter-occupied |
| Single Unit, Detached | 5,855 (84.8%) | 1,047 (15.2%) |
| Single Unit, Attached | 53 (81.5%) | 12 (18.5%) |
| 2 Unit Apartments | 0 (0.0%) | 99 (100.0%) |
| 3 or 4 Unit Apartments | 0 (0.0%) | 70 (100.0%) |
| 5 to 9 Unit Apartments | 0 (0.0%) | 0 (0.0%) |
| 10 or more Apartments | 0 (0.0%) | 57 (100.0%) |
| Mobile Home / Other | 1,049 (64.5%) | 578 (35.5%) |
| Total | 6,957 (78.9%) | 1,863 (21.1%) |
Housing Structures by Number of Rooms in Overton County

| Number of Rooms | Owner-occupied | Renter-occupied |
| 1 Room | 27 (0.4%) | 0 (0.0%) |
| 2 or 3 Rooms | 276 (4.0%) | 226 (12.1%) |
| 4 or 5 Rooms | 2,471 (35.5%) | 949 (50.9%) |
| 6 or 7 Rooms | 2,574 (37.0%) | 542 (29.1%) |
| 8 or more Rooms | 1,609 (23.1%) | 146 (7.8%) |
| Total | 6,957 (100.0%) | 1,863 (100.0%) |
Housing Structure by Heating Type in Overton County

| Heating Type | Owner-occupied | Renter-occupied |
| Utility Gas | 991 (14.2%) | 207 (11.1%) |
| Bottled, Tank, or LP Gas | 822 (11.8%) | 112 (6.0%) |
| Electricity | 4,410 (63.4%) | 1,408 (75.6%) |
| Fuel Oil or Kerosene | 7 (0.1%) | 25 (1.3%) |
| Coal or Coke | 0 (0.0%) | 0 (0.0%) |
| All other Fuels | 688 (9.9%) | 111 (6.0%) |
| No Fuel Used | 39 (0.6%) | 0 (0.0%) |
| Total | 6,957 (100.0%) | 1,863 (100.0%) |
Household Vehicle Usage in Overton County
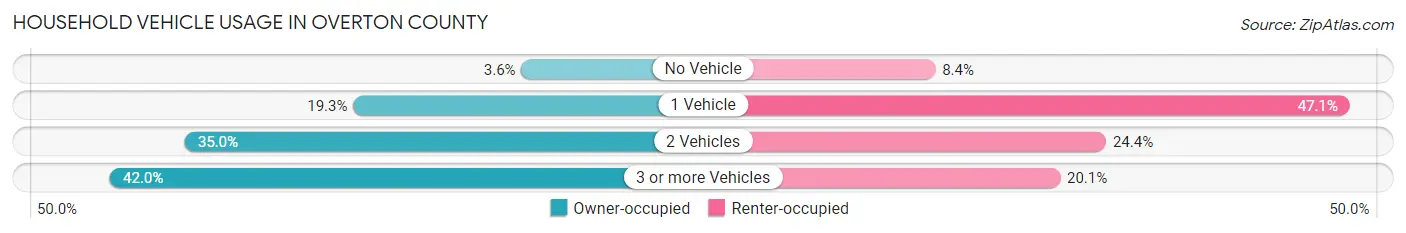
| Vehicles per Household | Owner-occupied | Renter-occupied |
| No Vehicle | 252 (3.6%) | 157 (8.4%) |
| 1 Vehicle | 1,344 (19.3%) | 878 (47.1%) |
| 2 Vehicles | 2,438 (35.0%) | 454 (24.4%) |
| 3 or more Vehicles | 2,923 (42.0%) | 374 (20.1%) |
| Total | 6,957 (100.0%) | 1,863 (100.0%) |
Real Estate & Mortgages in Overton County
Real Estate and Mortgage Overview in Overton County
| Characteristic | Without Mortgage | With Mortgage |
| Housing Units | 4,178 | 2,779 |
| Median Property Value | $144,200 | $168,700 |
| Median Household Income | $36,749 | $460 |
| Monthly Housing Costs | $359 | $140 |
| Real Estate Taxes | $579 | $220 |
Property Value by Mortgage Status in Overton County

| Property Value | Without Mortgage | With Mortgage |
| Less than $50,000 | 697 (16.7%) | 182 (6.6%) |
| $50,000 to $99,999 | 721 (17.3%) | 454 (16.3%) |
| $100,000 to $299,999 | 2,103 (50.3%) | 1,531 (55.1%) |
| $300,000 to $499,999 | 413 (9.9%) | 416 (15.0%) |
| $500,000 to $749,999 | 147 (3.5%) | 131 (4.7%) |
| $750,000 to $999,999 | 32 (0.8%) | 12 (0.4%) |
| $1,000,000 or more | 65 (1.6%) | 53 (1.9%) |
| Total | 4,178 (100.0%) | 2,779 (100.0%) |
Household Income by Mortgage Status in Overton County
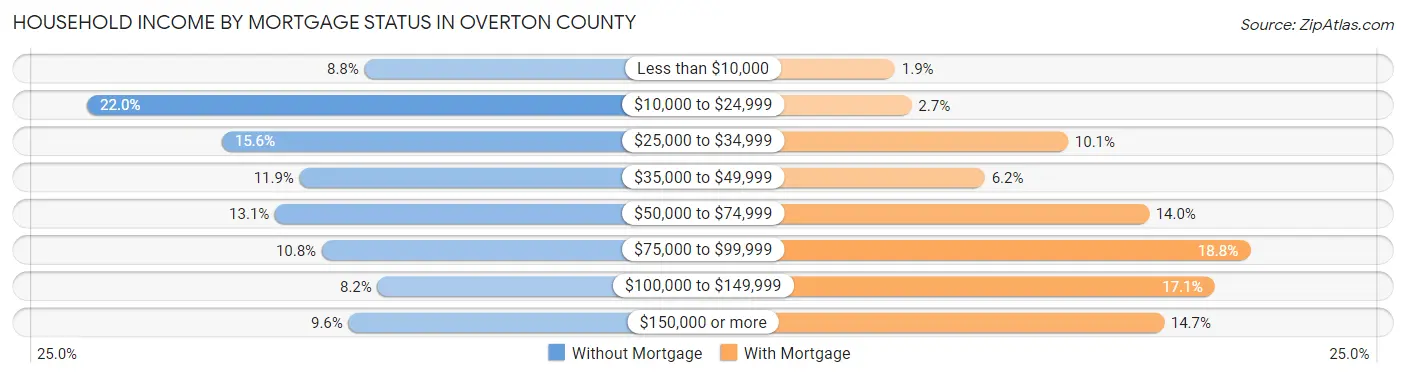
| Household Income | Without Mortgage | With Mortgage |
| Less than $10,000 | 368 (8.8%) | 52 (1.9%) |
| $10,000 to $24,999 | 920 (22.0%) | 74 (2.7%) |
| $25,000 to $34,999 | 652 (15.6%) | 281 (10.1%) |
| $35,000 to $49,999 | 497 (11.9%) | 171 (6.1%) |
| $50,000 to $74,999 | 546 (13.1%) | 388 (14.0%) |
| $75,000 to $99,999 | 453 (10.8%) | 522 (18.8%) |
| $100,000 to $149,999 | 342 (8.2%) | 475 (17.1%) |
| $150,000 or more | 400 (9.6%) | 408 (14.7%) |
| Total | 4,178 (100.0%) | 2,779 (100.0%) |
Property Value to Household Income Ratio in Overton County
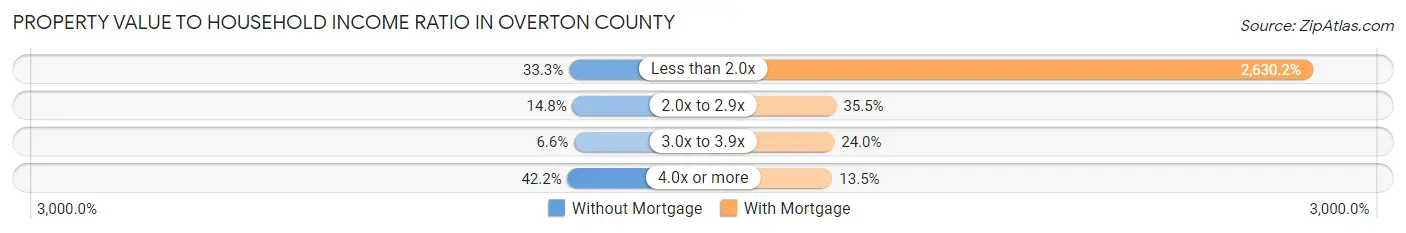
| Value-to-Income Ratio | Without Mortgage | With Mortgage |
| Less than 2.0x | 1,389 (33.3%) | 73,094 (2,630.2%) |
| 2.0x to 2.9x | 617 (14.8%) | 986 (35.5%) |
| 3.0x to 3.9x | 274 (6.6%) | 667 (24.0%) |
| 4.0x or more | 1,761 (42.1%) | 375 (13.5%) |
| Total | 4,178 (100.0%) | 2,779 (100.0%) |
Real Estate Taxes by Mortgage Status in Overton County
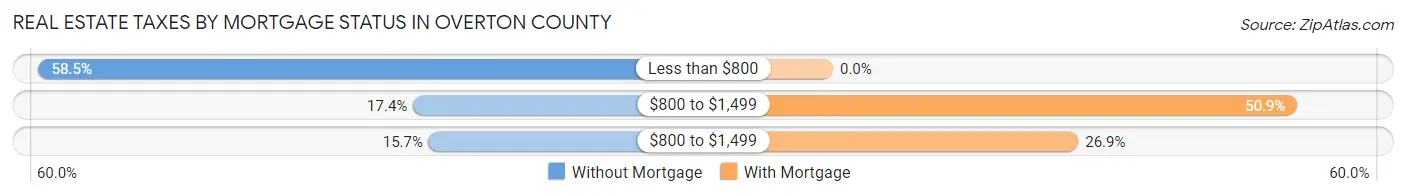
| Property Taxes | Without Mortgage | With Mortgage |
| Less than $800 | 2,443 (58.5%) | 0 (0.0%) |
| $800 to $1,499 | 728 (17.4%) | 1,414 (50.9%) |
| $800 to $1,499 | 656 (15.7%) | 747 (26.9%) |
| Total | 4,178 (100.0%) | 2,779 (100.0%) |
Health & Disability in Overton County
Health Insurance Coverage by Age in Overton County
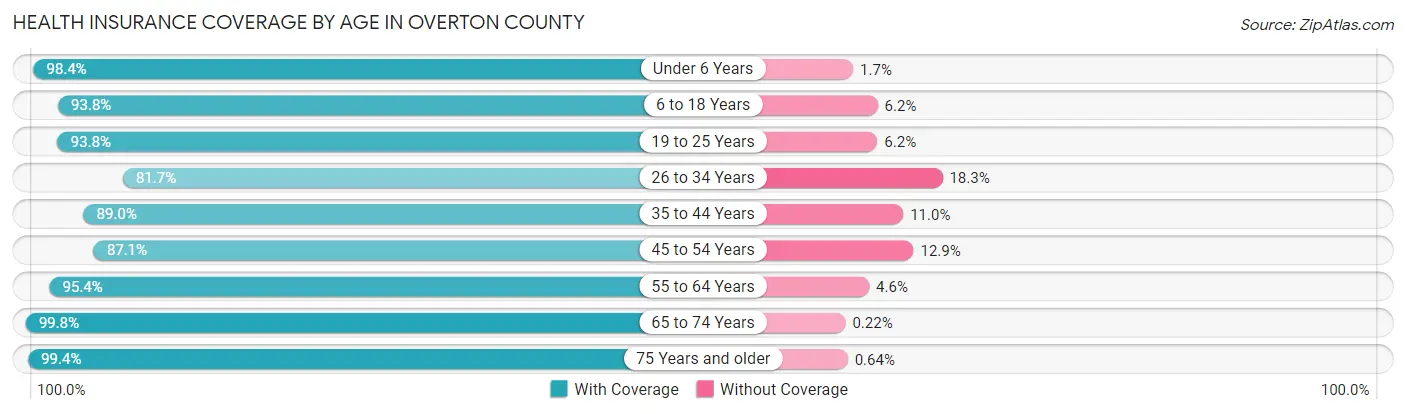
| Age Bracket | With Coverage | Without Coverage |
| Under 6 Years | 1,370 (98.4%) | 23 (1.7%) |
| 6 to 18 Years | 3,450 (93.8%) | 229 (6.2%) |
| 19 to 25 Years | 1,611 (93.8%) | 106 (6.2%) |
| 26 to 34 Years | 1,909 (81.7%) | 428 (18.3%) |
| 35 to 44 Years | 2,268 (89.0%) | 280 (11.0%) |
| 45 to 54 Years | 2,610 (87.1%) | 387 (12.9%) |
| 55 to 64 Years | 3,080 (95.4%) | 150 (4.6%) |
| 65 to 74 Years | 2,698 (99.8%) | 6 (0.2%) |
| 75 Years and older | 1,717 (99.4%) | 11 (0.6%) |
| Total | 20,713 (92.7%) | 1,620 (7.2%) |
Health Insurance Coverage by Citizenship Status in Overton County
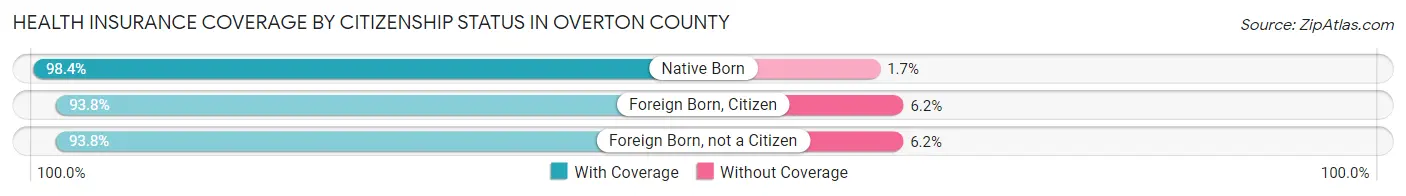
| Citizenship Status | With Coverage | Without Coverage |
| Native Born | 1,370 (98.4%) | 23 (1.7%) |
| Foreign Born, Citizen | 3,450 (93.8%) | 229 (6.2%) |
| Foreign Born, not a Citizen | 1,611 (93.8%) | 106 (6.2%) |
Health Insurance Coverage by Household Income in Overton County
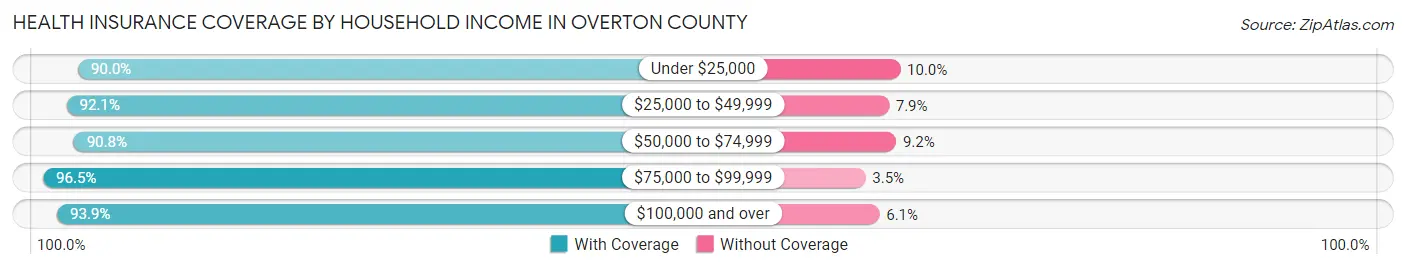
| Household Income | With Coverage | Without Coverage |
| Under $25,000 | 3,594 (90.0%) | 399 (10.0%) |
| $25,000 to $49,999 | 4,392 (92.1%) | 375 (7.9%) |
| $50,000 to $74,999 | 3,509 (90.8%) | 356 (9.2%) |
| $75,000 to $99,999 | 3,692 (96.5%) | 133 (3.5%) |
| $100,000 and over | 5,507 (93.9%) | 357 (6.1%) |
Public vs Private Health Insurance Coverage by Age in Overton County

| Age Bracket | Public Insurance | Private Insurance |
| Under 6 | 844 (60.6%) | 681 (48.9%) |
| 6 to 18 Years | 1,546 (42.0%) | 2,177 (59.2%) |
| 19 to 25 Years | 577 (33.6%) | 1,197 (69.7%) |
| 25 to 34 Years | 552 (23.6%) | 1,514 (64.8%) |
| 35 to 44 Years | 476 (18.7%) | 1,902 (74.7%) |
| 45 to 54 Years | 552 (18.4%) | 2,195 (73.2%) |
| 55 to 64 Years | 1,061 (32.9%) | 2,493 (77.2%) |
| 65 to 74 Years | 2,645 (97.8%) | 1,402 (51.8%) |
| 75 Years and over | 1,699 (98.3%) | 993 (57.5%) |
| Total | 9,952 (44.6%) | 14,554 (65.2%) |
Disability Status by Sex by Age in Overton County

| Age Bracket | Male | Female |
| Under 5 Years | 0 (0.0%) | 9 (1.7%) |
| 5 to 17 Years | 142 (7.5%) | 144 (8.3%) |
| 18 to 34 Years | 150 (6.6%) | 147 (7.0%) |
| 35 to 64 Years | 559 (12.9%) | 770 (17.4%) |
| 65 to 74 Years | 360 (27.8%) | 626 (44.5%) |
| 75 Years and over | 396 (52.2%) | 553 (57.0%) |
Disability Class by Sex by Age in Overton County
Disability Class: Hearing Difficulty
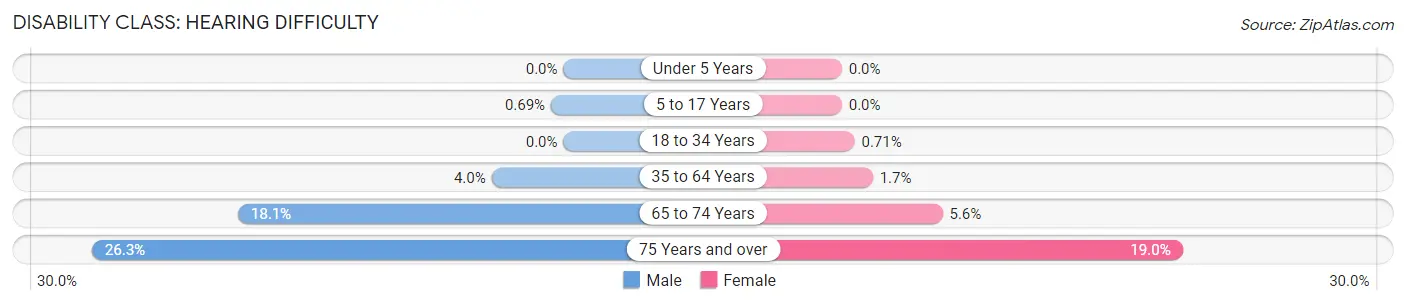
| Age Bracket | Male | Female |
| Under 5 Years | 0 (0.0%) | 0 (0.0%) |
| 5 to 17 Years | 13 (0.7%) | 0 (0.0%) |
| 18 to 34 Years | 0 (0.0%) | 15 (0.7%) |
| 35 to 64 Years | 174 (4.0%) | 76 (1.7%) |
| 65 to 74 Years | 235 (18.1%) | 79 (5.6%) |
| 75 Years and over | 199 (26.3%) | 184 (19.0%) |
Disability Class: Vision Difficulty
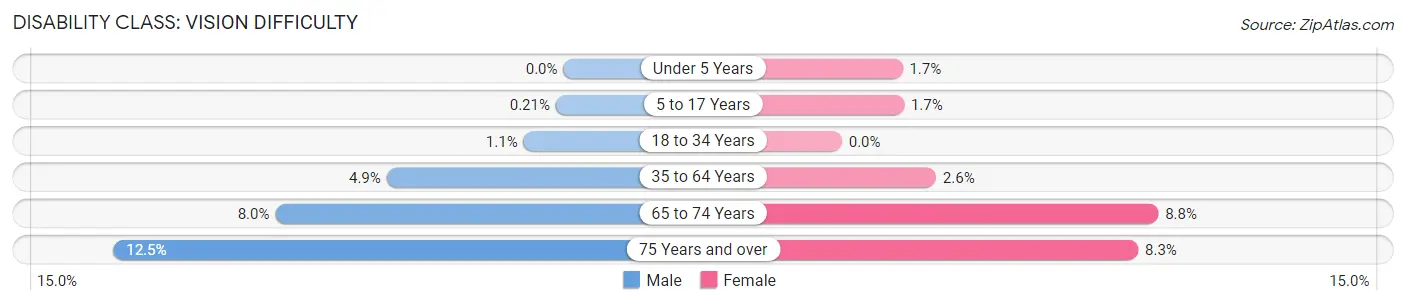
| Age Bracket | Male | Female |
| Under 5 Years | 0 (0.0%) | 9 (1.7%) |
| 5 to 17 Years | 4 (0.2%) | 30 (1.7%) |
| 18 to 34 Years | 25 (1.1%) | 0 (0.0%) |
| 35 to 64 Years | 214 (4.9%) | 116 (2.6%) |
| 65 to 74 Years | 104 (8.0%) | 124 (8.8%) |
| 75 Years and over | 95 (12.5%) | 80 (8.3%) |
Disability Class: Cognitive Difficulty
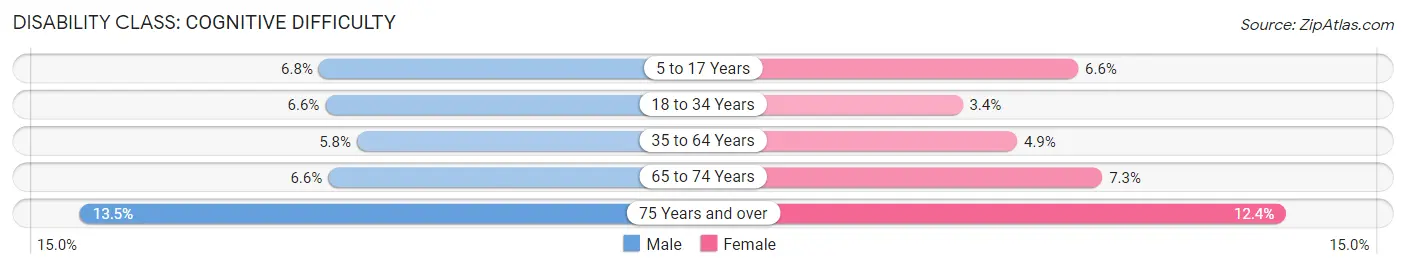
| Age Bracket | Male | Female |
| 5 to 17 Years | 129 (6.8%) | 114 (6.6%) |
| 18 to 34 Years | 150 (6.6%) | 71 (3.4%) |
| 35 to 64 Years | 250 (5.8%) | 216 (4.9%) |
| 65 to 74 Years | 85 (6.6%) | 102 (7.2%) |
| 75 Years and over | 102 (13.5%) | 120 (12.4%) |
Disability Class: Ambulatory Difficulty
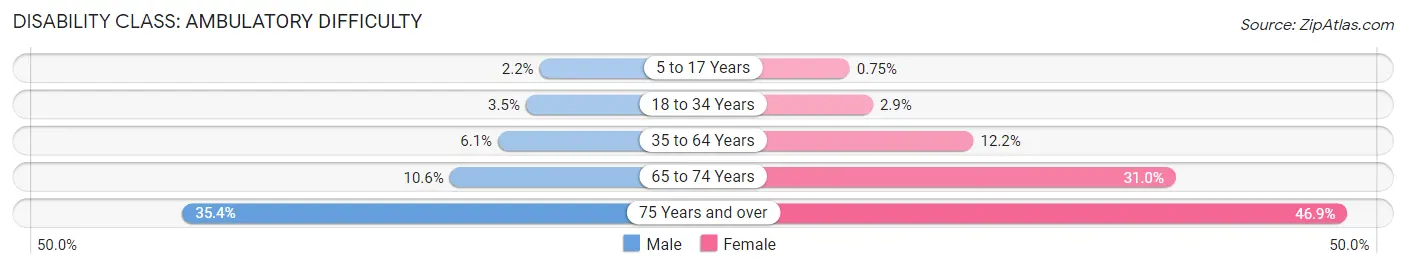
| Age Bracket | Male | Female |
| 5 to 17 Years | 42 (2.2%) | 13 (0.7%) |
| 18 to 34 Years | 79 (3.5%) | 61 (2.9%) |
| 35 to 64 Years | 264 (6.1%) | 541 (12.2%) |
| 65 to 74 Years | 137 (10.6%) | 436 (31.0%) |
| 75 Years and over | 268 (35.4%) | 455 (46.9%) |
Disability Class: Self-Care Difficulty
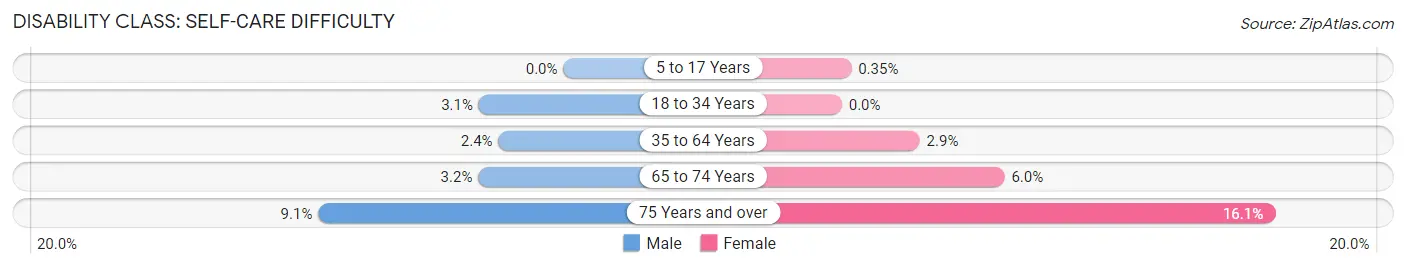
| Age Bracket | Male | Female |
| 5 to 17 Years | 0 (0.0%) | 6 (0.4%) |
| 18 to 34 Years | 71 (3.1%) | 0 (0.0%) |
| 35 to 64 Years | 105 (2.4%) | 128 (2.9%) |
| 65 to 74 Years | 41 (3.2%) | 85 (6.0%) |
| 75 Years and over | 69 (9.1%) | 156 (16.1%) |
Technology Access in Overton County
Computing Device Access in Overton County
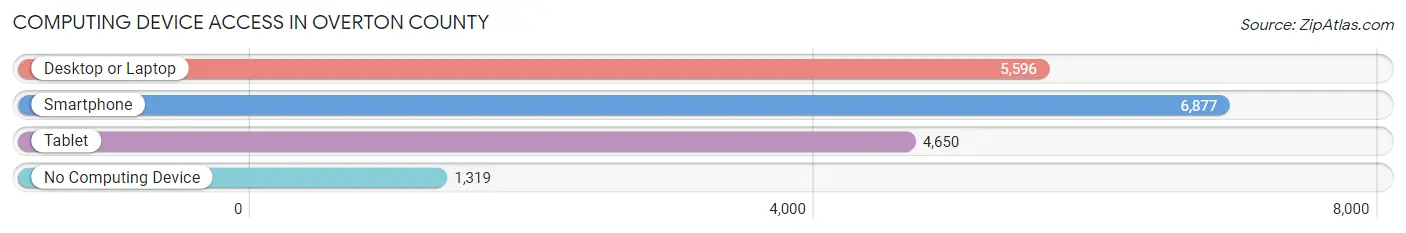
| Device Type | # Households | % Households |
| Desktop or Laptop | 5,596 | 63.4% |
| Smartphone | 6,877 | 78.0% |
| Tablet | 4,650 | 52.7% |
| No Computing Device | 1,319 | 14.9% |
| Total | 8,820 | 100.0% |
Internet Access in Overton County

| Internet Type | # Households | % Households |
| Dial-Up Internet | 15 | 0.2% |
| Broadband Home | 5,469 | 62.0% |
| Cellular Data Only | 830 | 9.4% |
| Satellite Internet | 378 | 4.3% |
| No Internet | 2,327 | 26.4% |
| Total | 8,820 | 100.0% |
Overton County Summary
Overton County is located in the Upper Cumberland region of Middle Tennessee. It is bordered by Putnam County to the north, Fentress County to the east, Jackson County to the south, and Clay and Pickett Counties to the west. The county seat is Livingston, and the largest city is Livingston. The county was established in 1806 and named for Major Andrew Overton, a Revolutionary War veteran and early settler of the area.
Geography
Overton County is located in the Upper Cumberland region of Middle Tennessee. It is bordered by Putnam County to the north, Fentress County to the east, Jackson County to the south, and Clay and Pickett Counties to the west. The county has a total area of 437 square miles, of which 434 square miles is land and 3 square miles (0.7%) is water. The terrain is mostly hilly and forested, with the highest point being the summit of Big Mountain at 1,890 feet. The county is drained by the Obey River, which flows through the center of the county.
Demographics
As of the 2010 census, there were 22,083 people, 8,845 households, and 6,323 families residing in the county. The population density was 51 people per square mile. The racial makeup of the county was 95.3% White, 1.7% Black or African American, 0.3% Native American, 0.3% Asian, 0.1% Pacific Islander, 1.2% from other races, and 1.2% from two or more races. 2.7% of the population were Hispanic or Latino of any race.
The median income for a household in the county was $30,945, and the median income for a family was $37,945. The per capita income for the county was $16,845. About 17.2% of families and 21.2% of the population were below the poverty line, including 28.2% of those under age 18 and 17.2% of those age 65 or over.
Economy
Overton County’s economy is largely based on agriculture and tourism. The county is home to several large farms, as well as several small family farms. The county is also home to several tourist attractions, including the Standing Stone State Park, the Big South Fork National River and Recreation Area, and the Dale Hollow Lake.
The county is also home to several manufacturing companies, including a furniture factory, a plastics factory, and a metal fabrication plant. The county also has several retail stores, restaurants, and other businesses.
History
Overton County was established in 1806 and named for Major Andrew Overton, a Revolutionary War veteran and early settler of the area. The county was originally part of Jackson County, but was split off in 1806.
The county was largely rural and agricultural until the late 19th century, when the railroad was built through the county. This brought new industry and economic growth to the area, and the county’s population began to grow.
In the early 20th century, the county was home to several large farms, as well as several small family farms. The county was also home to several tourist attractions, including the Standing Stone State Park, the Big South Fork National River and Recreation Area, and the Dale Hollow Lake.
Today, Overton County is still largely rural and agricultural, but has seen some economic growth in recent years. The county is home to several manufacturing companies, as well as several retail stores, restaurants, and other businesses. The county is also home to several tourist attractions, including the Standing Stone State Park, the Big South Fork National River and Recreation Area, and the Dale Hollow Lake.
Common Questions
What is the Total Population of Overton County?
Total Population of Overton County is 22,576.
What is the Total Male Population of Overton County?
Total Male Population of Overton County is 11,305.
What is the Total Female Population of Overton County?
Total Female Population of Overton County is 11,271.
What is the Ratio of Males per 100 Females in Overton County?
There are 100.30 Males per 100 Females in Overton County.
What is the Ratio of Females per 100 Males in Overton County?
There are 99.70 Females per 100 Males in Overton County.
What is the Median Population Age in Overton County?
Median Population Age in Overton County is 43.1 Years.
What is the Average Family Size in Overton County
Average Family Size in Overton County is 3.1 People.
What is the Average Household Size in Overton County
Average Household Size in Overton County is 2.5 People.
What is Per Capita Income in Overton County?
Per Capita income in Overton County is $29,556.
What is the Median Family Income in Overton County?
Median Family Income in Overton County is $66,627.
What is the Median Household income in Overton County?
Median Household Income in Overton County is $46,580.
What is Income or Wage Gap in Overton County?
Income or Wage Gap in Overton County is 33.2%.
Women in Overton County earn 66.8 cents for every dollar earned by a man.
What is Family Income Deficit in Overton County?
Family Income Deficit in Overton County is $10,461.
Families that are below poverty line in Overton County earn $10,461 less on average than the poverty threshold level.
What is Inequality or Gini Index in Overton County?
Inequality or Gini Index in Overton County is 0.51.
How Large is the Labor Force in Overton County?
There are 10,560 People in the Labor Forcein in Overton County.
What is the Percentage of People in the Labor Force in Overton County?
57.4% of People are in the Labor Force in Overton County.
What is the Unemployment Rate in Overton County?
Unemployment Rate in Overton County is 3.5%.