Obion County, TN
Obion County Map
Obion County Overview
30,670
TOTAL POPULATION
14,956
MALE POPULATION
15,714
FEMALE POPULATION
95.18
MALES / 100 FEMALES
105.07
FEMALES / 100 MALES
42.3
MEDIAN AGE
3.1
AVG FAMILY SIZE
2.4
AVG HOUSEHOLD SIZE
$28,782
PER CAPITA INCOME
$66,073
AVG FAMILY INCOME
$50,638
AVG HOUSEHOLD INCOME
23.9%
WAGE / INCOME GAP [ % ]
76.1¢/ $1
WAGE / INCOME GAP [ $ ]
$13,195
FAMILY INCOME DEFICIT
0.47
INEQUALITY / GINI INDEX
14,081
LABOR FORCE [ PEOPLE ]
57.0%
PERCENT IN LABOR FORCE
5.0%
UNEMPLOYMENT RATE
Obion County Area Codes
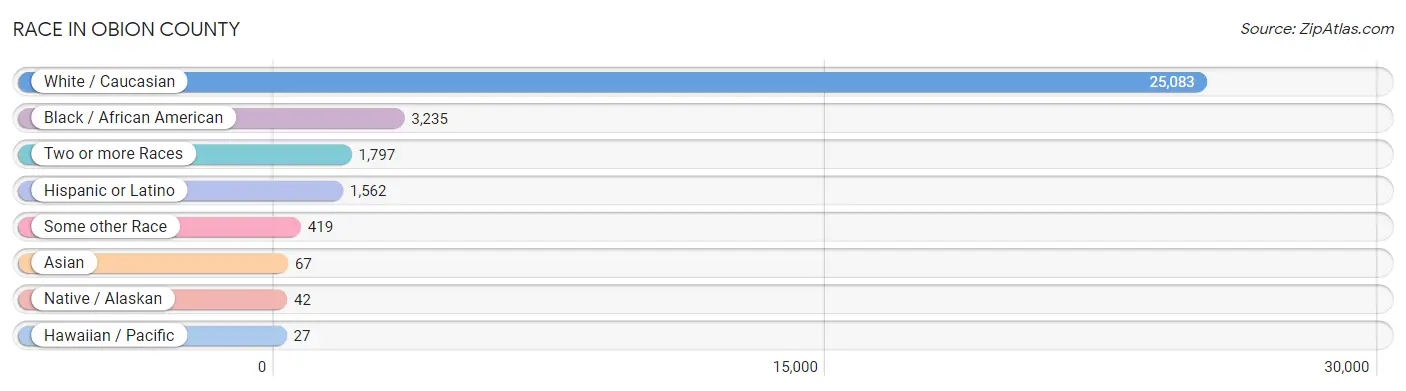
Race in Obion County
The most populous races in Obion County are White / Caucasian (25,083 | 81.8%), Black / African American (3,235 | 10.5%), and Two or more Races (1,797 | 5.9%).
| Race | # Population | % Population |
| Asian | 67 | 0.2% |
| Black / African American | 3,235 | 10.5% |
| Hawaiian / Pacific | 27 | 0.1% |
| Hispanic or Latino | 1,562 | 5.1% |
| Native / Alaskan | 42 | 0.1% |
| White / Caucasian | 25,083 | 81.8% |
| Two or more Races | 1,797 | 5.9% |
| Some other Race | 419 | 1.4% |
| Total | 30,670 | 100.0% |
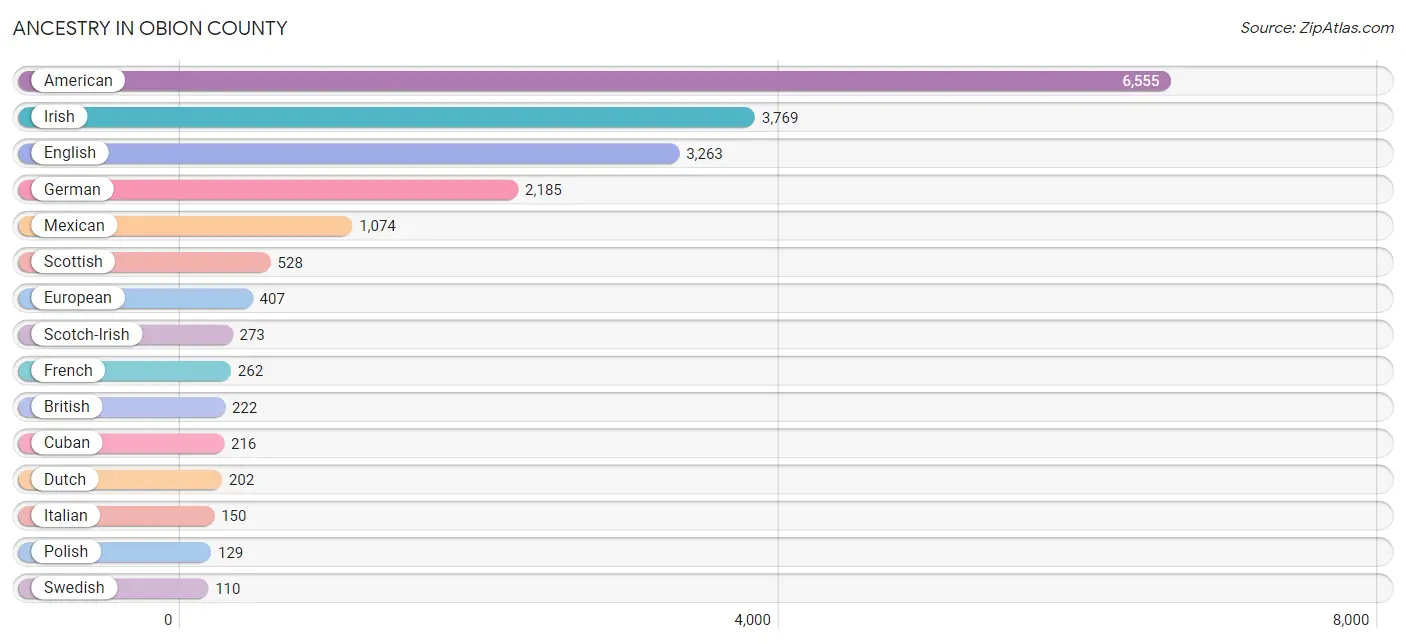
Ancestry in Obion County
The most populous ancestries reported in Obion County are American (6,555 | 21.4%), Irish (3,769 | 12.3%), English (3,263 | 10.6%), German (2,185 | 7.1%), and Mexican (1,074 | 3.5%), together accounting for 54.9% of all Obion County residents.
| Ancestry | # Population | % Population |
| African | 30 | 0.1% |
| American | 6,555 | 21.4% |
| Arab | 13 | 0.0% |
| Austrian | 7 | 0.0% |
| Belgian | 24 | 0.1% |
| Bhutanese | 9 | 0.0% |
| Blackfeet | 8 | 0.0% |
| British | 222 | 0.7% |
| Burmese | 11 | 0.0% |
| Cajun | 13 | 0.0% |
| Canadian | 9 | 0.0% |
| Central American | 69 | 0.2% |
| Cherokee | 73 | 0.2% |
| Cheyenne | 2 | 0.0% |
| Chickasaw | 1 | 0.0% |
| Chippewa | 3 | 0.0% |
| Choctaw | 8 | 0.0% |
| Colombian | 26 | 0.1% |
| Creek | 8 | 0.0% |
| Cuban | 216 | 0.7% |
| Czech | 49 | 0.2% |
| Dutch | 202 | 0.7% |
| Dutch West Indian | 28 | 0.1% |
| Eastern European | 26 | 0.1% |
| Egyptian | 13 | 0.0% |
| English | 3,263 | 10.6% |
| European | 407 | 1.3% |
| French | 262 | 0.9% |
| French American Indian | 7 | 0.0% |
| French Canadian | 23 | 0.1% |
| German | 2,185 | 7.1% |
| Greek | 6 | 0.0% |
| Guatemalan | 15 | 0.1% |
| Haitian | 6 | 0.0% |
| Hungarian | 4 | 0.0% |
| Icelander | 2 | 0.0% |
| Indian (Asian) | 24 | 0.1% |
| Irish | 3,769 | 12.3% |
| Italian | 150 | 0.5% |
| Korean | 103 | 0.3% |
| Lithuanian | 16 | 0.1% |
| Lumbee | 2 | 0.0% |
| Malaysian | 5 | 0.0% |
| Mexican | 1,074 | 3.5% |
| Mexican American Indian | 4 | 0.0% |
| Northern European | 20 | 0.1% |
| Norwegian | 30 | 0.1% |
| Pakistani | 6 | 0.0% |
| Polish | 129 | 0.4% |
| Puerto Rican | 39 | 0.1% |
| Romanian | 37 | 0.1% |
| Russian | 26 | 0.1% |
| Salvadoran | 54 | 0.2% |
| Scandinavian | 27 | 0.1% |
| Scotch-Irish | 273 | 0.9% |
| Scottish | 528 | 1.7% |
| Slavic | 7 | 0.0% |
| Slovene | 4 | 0.0% |
| South American | 26 | 0.1% |
| Spaniard | 55 | 0.2% |
| Spanish | 5 | 0.0% |
| Sri Lankan | 8 | 0.0% |
| Subsaharan African | 30 | 0.1% |
| Swedish | 110 | 0.4% |
| Swiss | 19 | 0.1% |
| Thai | 1 | 0.0% |
| Ukrainian | 43 | 0.1% |
| Welsh | 68 | 0.2% |
| West Indian | 10 | 0.0% | View All 69 Rows |
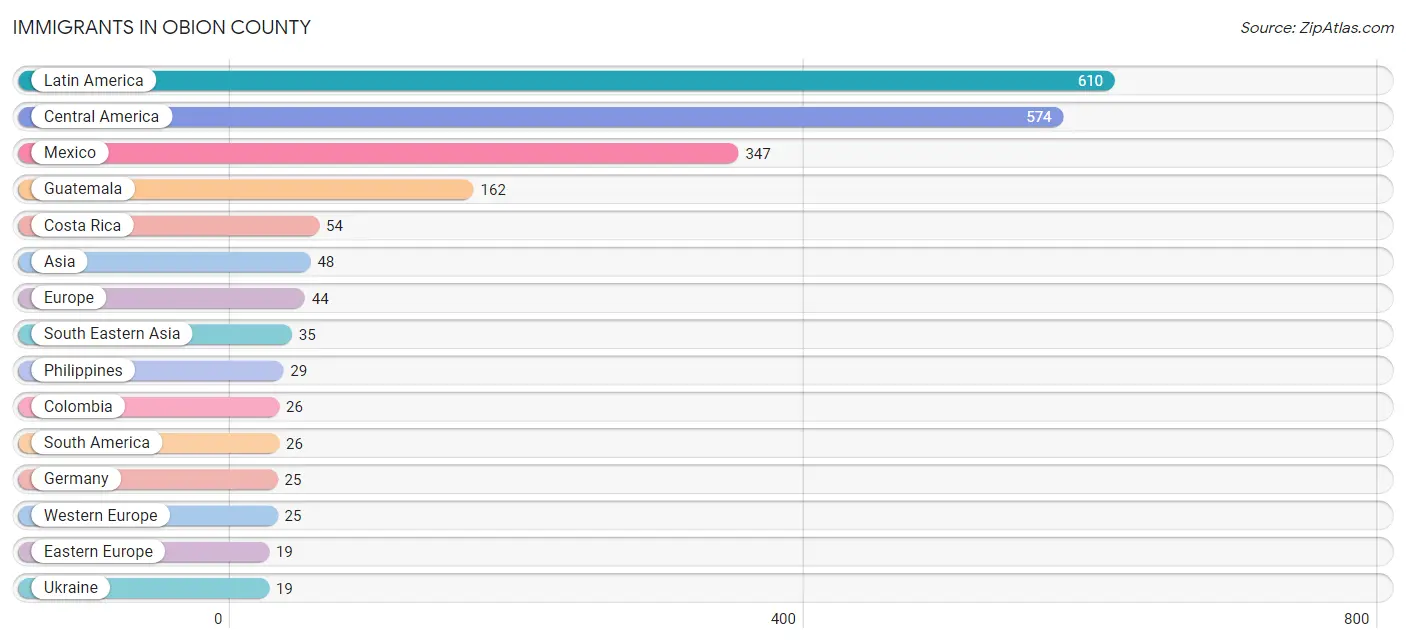
Immigrants in Obion County
The most numerous immigrant groups reported in Obion County came from Latin America (610 | 2.0%), Central America (574 | 1.9%), Mexico (347 | 1.1%), Guatemala (162 | 0.5%), and Costa Rica (54 | 0.2%), together accounting for 5.7% of all Obion County residents.
| Immigration Origin | # Population | % Population |
| Asia | 48 | 0.2% |
| Canada | 3 | 0.0% |
| Caribbean | 10 | 0.0% |
| Central America | 574 | 1.9% |
| China | 8 | 0.0% |
| Colombia | 26 | 0.1% |
| Costa Rica | 54 | 0.2% |
| Eastern Asia | 13 | 0.0% |
| Eastern Europe | 19 | 0.1% |
| El Salvador | 8 | 0.0% |
| Europe | 44 | 0.1% |
| Germany | 25 | 0.1% |
| Guatemala | 162 | 0.5% |
| Korea | 5 | 0.0% |
| Latin America | 610 | 2.0% |
| Mexico | 347 | 1.1% |
| Micronesia | 2 | 0.0% |
| Oceania | 2 | 0.0% |
| Panama | 3 | 0.0% |
| Philippines | 29 | 0.1% |
| South America | 26 | 0.1% |
| South Eastern Asia | 35 | 0.1% |
| Trinidad and Tobago | 10 | 0.0% |
| Ukraine | 19 | 0.1% |
| Vietnam | 6 | 0.0% |
| Western Europe | 25 | 0.1% | View All 26 Rows |
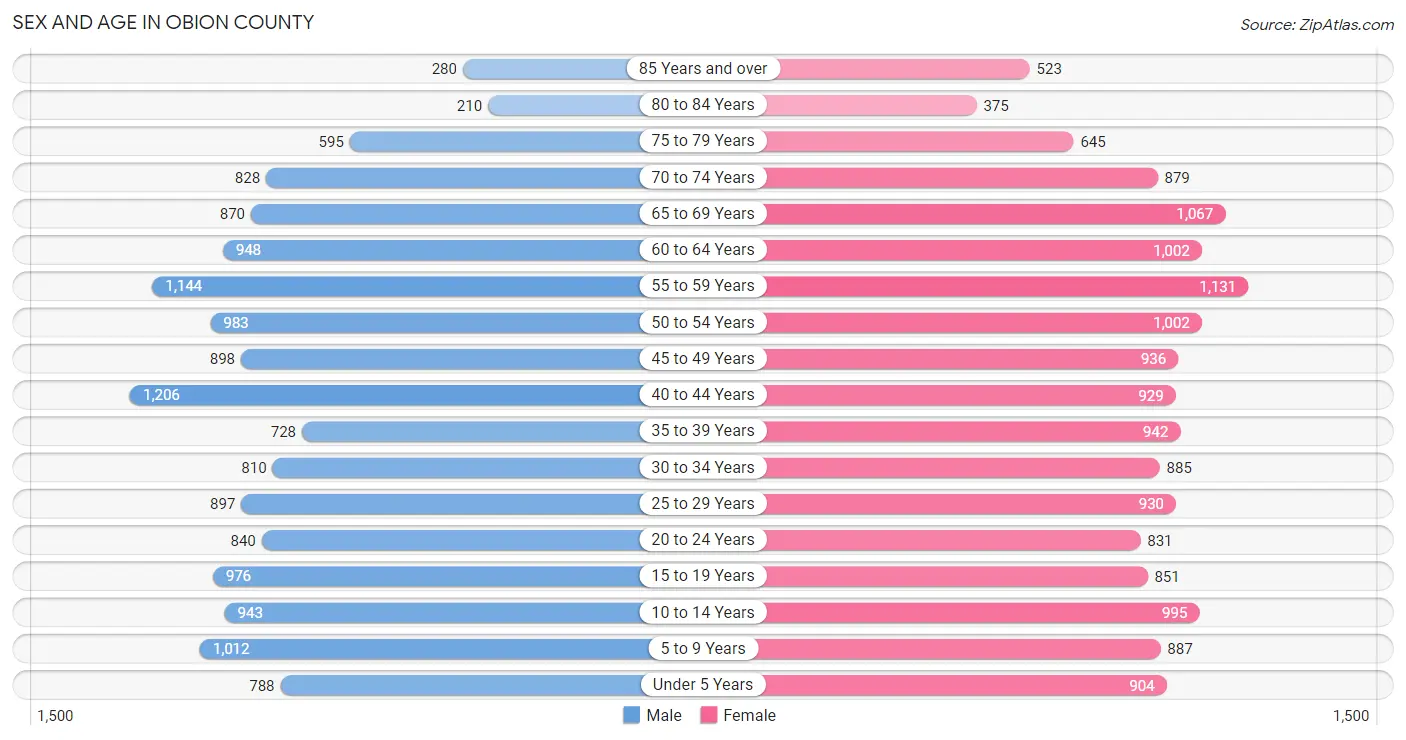
Sex and Age in Obion County
Sex and Age in Obion County
The most populous age groups in Obion County are 40 to 44 Years (1,206 | 8.1%) for men and 55 to 59 Years (1,131 | 7.2%) for women.
| Age Bracket | Male | Female |
| Under 5 Years | 788 (5.3%) | 904 (5.8%) |
| 5 to 9 Years | 1,012 (6.8%) | 887 (5.6%) |
| 10 to 14 Years | 943 (6.3%) | 995 (6.3%) |
| 15 to 19 Years | 976 (6.5%) | 851 (5.4%) |
| 20 to 24 Years | 840 (5.6%) | 831 (5.3%) |
| 25 to 29 Years | 897 (6.0%) | 930 (5.9%) |
| 30 to 34 Years | 810 (5.4%) | 885 (5.6%) |
| 35 to 39 Years | 728 (4.9%) | 942 (6.0%) |
| 40 to 44 Years | 1,206 (8.1%) | 929 (5.9%) |
| 45 to 49 Years | 898 (6.0%) | 936 (6.0%) |
| 50 to 54 Years | 983 (6.6%) | 1,002 (6.4%) |
| 55 to 59 Years | 1,144 (7.6%) | 1,131 (7.2%) |
| 60 to 64 Years | 948 (6.3%) | 1,002 (6.4%) |
| 65 to 69 Years | 870 (5.8%) | 1,067 (6.8%) |
| 70 to 74 Years | 828 (5.5%) | 879 (5.6%) |
| 75 to 79 Years | 595 (4.0%) | 645 (4.1%) |
| 80 to 84 Years | 210 (1.4%) | 375 (2.4%) |
| 85 Years and over | 280 (1.9%) | 523 (3.3%) |
| Total | 14,956 (100.0%) | 15,714 (100.0%) |
Families and Households in Obion County
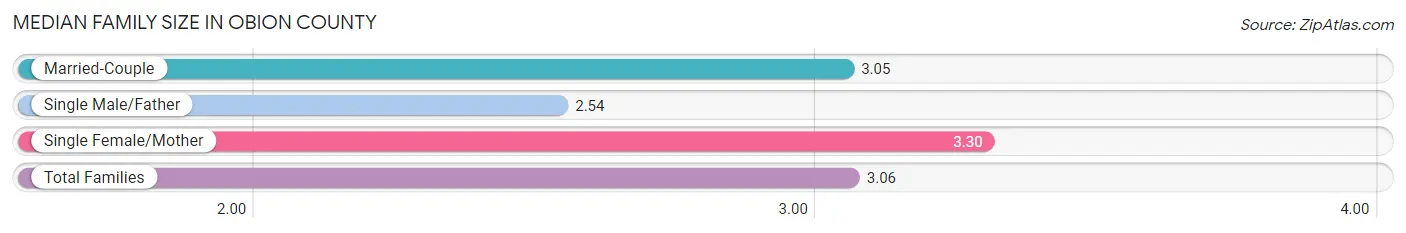
Median Family Size in Obion County
The median family size in Obion County is 3.06 persons per family, with single female/mother families (1,311 | 16.7%) accounting for the largest median family size of 3.3 persons per family. On the other hand, single male/father families (490 | 6.2%) represent the smallest median family size with 2.54 persons per family.
| Family Type | # Families | Family Size |
| Married-Couple | 6,044 (77.0%) | 3.05 |
| Single Male/Father | 490 (6.2%) | 2.54 |
| Single Female/Mother | 1,311 (16.7%) | 3.30 |
| Total Families | 7,845 (100.0%) | 3.06 |
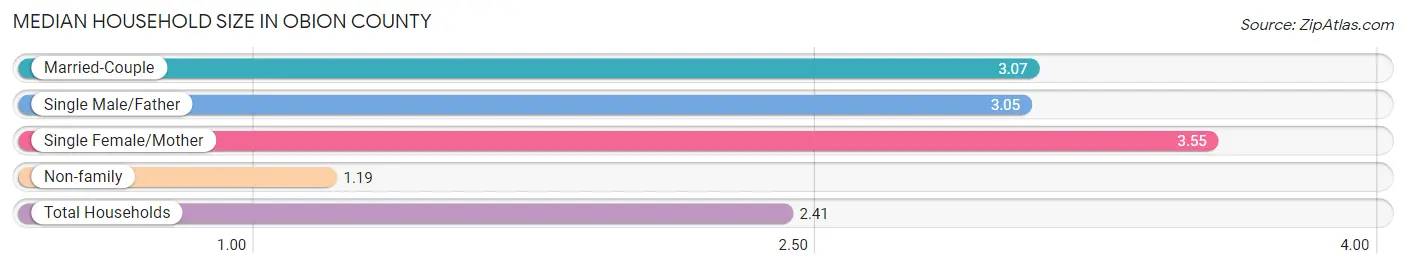
Median Household Size in Obion County
The median household size in Obion County is 2.41 persons per household, with single female/mother households (1,311 | 10.4%) accounting for the largest median household size of 3.55 persons per household. non-family households (4,697 | 37.4%) represent the smallest median household size with 1.19 persons per household.
| Household Type | # Households | Household Size |
| Married-Couple | 6,044 (48.2%) | 3.07 |
| Single Male/Father | 490 (3.9%) | 3.05 |
| Single Female/Mother | 1,311 (10.4%) | 3.55 |
| Non-family | 4,697 (37.4%) | 1.19 |
| Total Households | 12,542 (100.0%) | 2.41 |
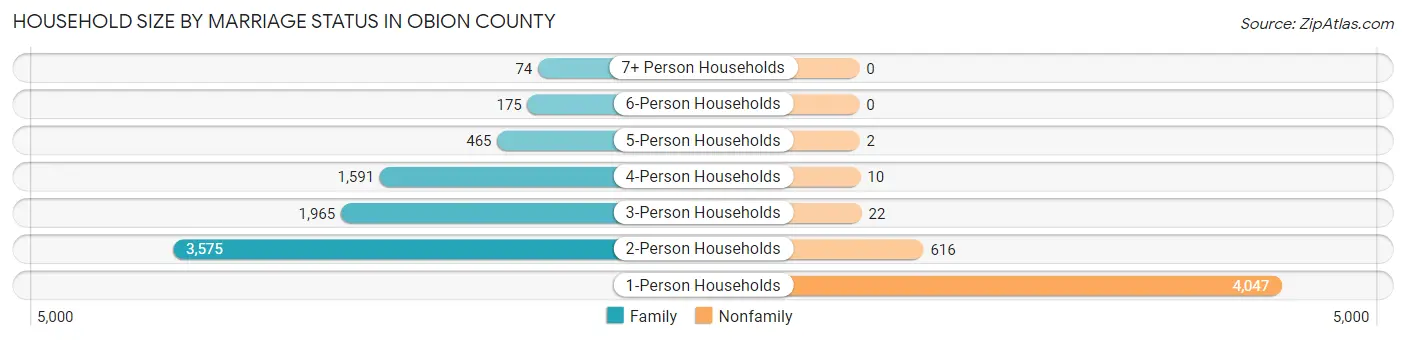
Household Size by Marriage Status in Obion County
Out of a total of 12,542 households in Obion County, 7,845 (62.5%) are family households, while 4,697 (37.4%) are nonfamily households. The most numerous type of family households are 2-person households, comprising 3,575, and the most common type of nonfamily households are 1-person households, comprising 4,047.
| Household Size | Family Households | Nonfamily Households |
| 1-Person Households | - | 4,047 (32.3%) |
| 2-Person Households | 3,575 (28.5%) | 616 (4.9%) |
| 3-Person Households | 1,965 (15.7%) | 22 (0.2%) |
| 4-Person Households | 1,591 (12.7%) | 10 (0.1%) |
| 5-Person Households | 465 (3.7%) | 2 (0.0%) |
| 6-Person Households | 175 (1.4%) | 0 (0.0%) |
| 7+ Person Households | 74 (0.6%) | 0 (0.0%) |
| Total | 7,845 (62.5%) | 4,697 (37.4%) |
Female Fertility in Obion County
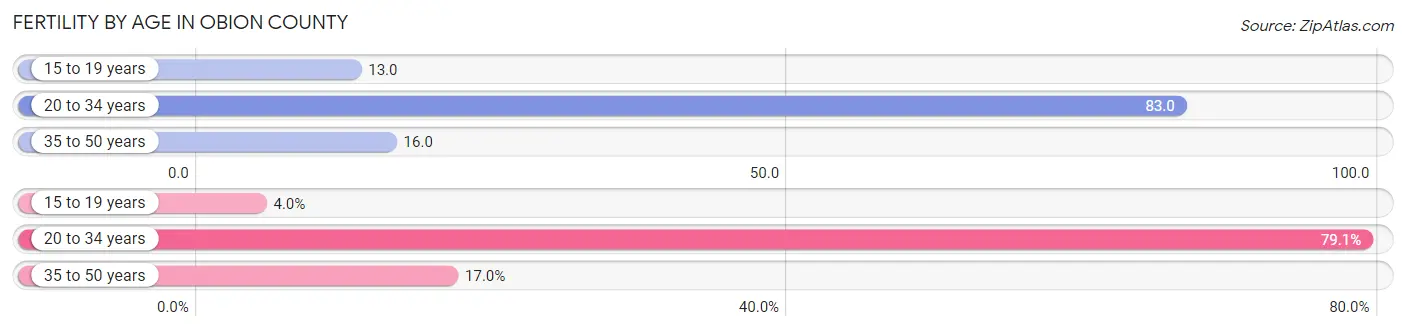
Fertility by Age in Obion County
Average fertility rate in Obion County is 43.0 births per 1,000 women. Women in the age bracket of 20 to 34 years have the highest fertility rate with 83.0 births per 1,000 women. Women in the age bracket of 20 to 34 years acount for 79.1% of all women with births.
| Age Bracket | Women with Births | Births / 1,000 Women |
| 15 to 19 years | 11 (4.0%) | 13.0 |
| 20 to 34 years | 219 (79.1%) | 83.0 |
| 35 to 50 years | 47 (17.0%) | 16.0 |
| Total | 277 (100.0%) | 43.0 |
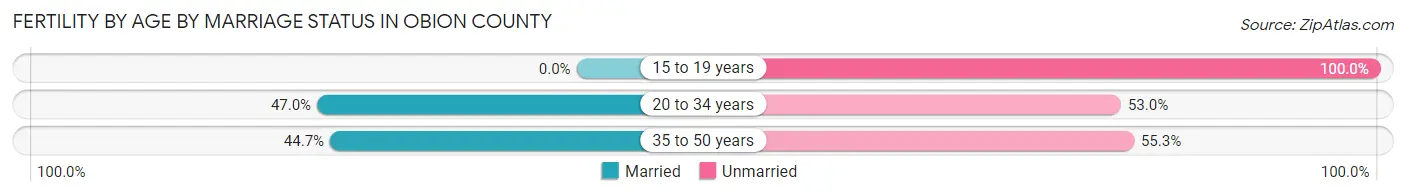
Fertility by Age by Marriage Status in Obion County
44.8% of women with births (277) in Obion County are married. The highest percentage of unmarried women with births falls into 15 to 19 years age bracket with 100.0% of them unmarried at the time of birth, while the lowest percentage of unmarried women with births belong to 20 to 34 years age bracket with 53.0% of them unmarried.
| Age Bracket | Married | Unmarried |
| 15 to 19 years | 0 (0.0%) | 11 (100.0%) |
| 20 to 34 years | 103 (47.0%) | 116 (53.0%) |
| 35 to 50 years | 21 (44.7%) | 26 (55.3%) |
| Total | 124 (44.8%) | 153 (55.2%) |
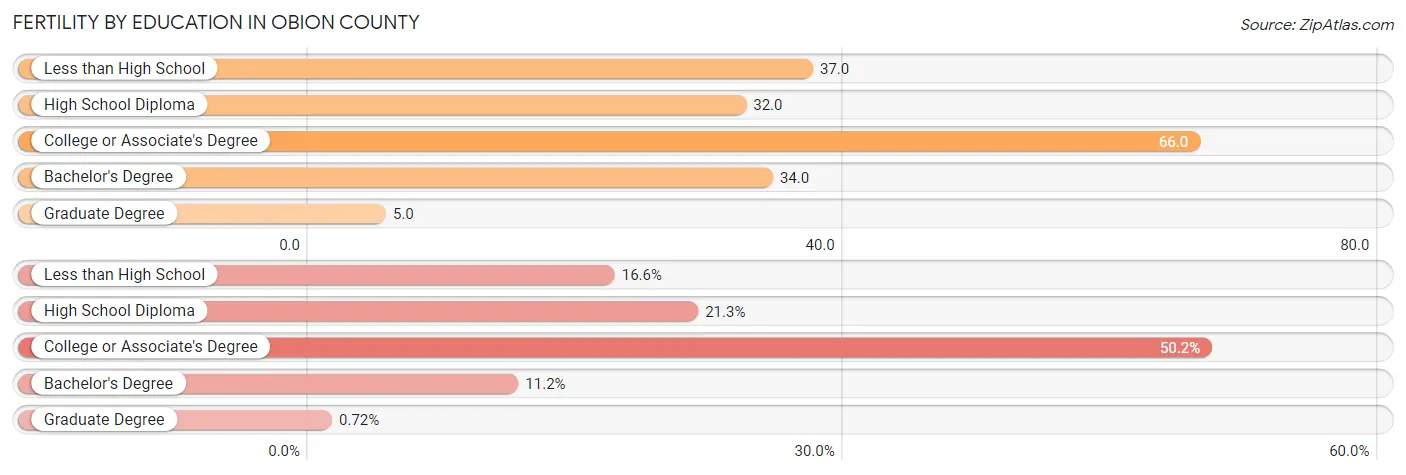
Fertility by Education in Obion County
Average fertility rate in Obion County is 43.0 births per 1,000 women. Women with the education attainment of college or associate's degree have the highest fertility rate of 66.0 births per 1,000 women, while women with the education attainment of graduate degree have the lowest fertility at 5.0 births per 1,000 women. Women with the education attainment of college or associate's degree represent 50.2% of all women with births.
| Educational Attainment | Women with Births | Births / 1,000 Women |
| Less than High School | 46 (16.6%) | 37.0 |
| High School Diploma | 59 (21.3%) | 32.0 |
| College or Associate's Degree | 139 (50.2%) | 66.0 |
| Bachelor's Degree | 31 (11.2%) | 34.0 |
| Graduate Degree | 2 (0.7%) | 5.0 |
| Total | 277 (100.0%) | 43.0 |
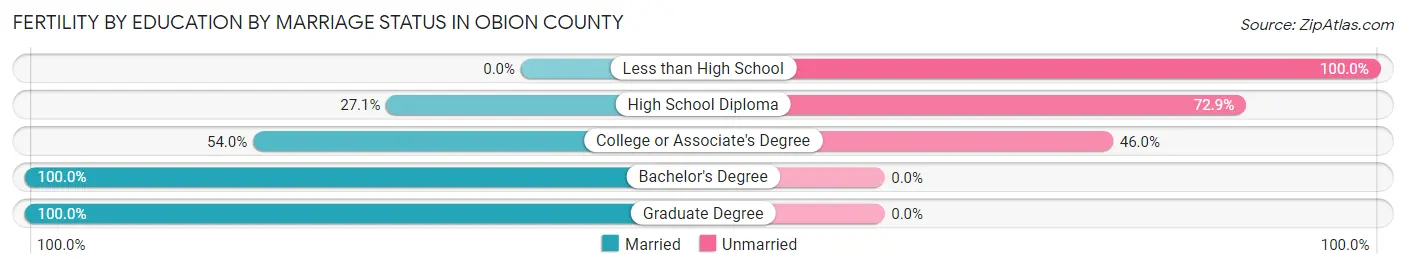
Fertility by Education by Marriage Status in Obion County
55.2% of women with births in Obion County are unmarried. Women with the educational attainment of bachelor's degree are most likely to be married with 100.0% of them married at childbirth, while women with the educational attainment of less than high school are least likely to be married with 100.0% of them unmarried at childbirth.
| Educational Attainment | Married | Unmarried |
| Less than High School | 0 (0.0%) | 46 (100.0%) |
| High School Diploma | 16 (27.1%) | 43 (72.9%) |
| College or Associate's Degree | 75 (54.0%) | 64 (46.0%) |
| Bachelor's Degree | 31 (100.0%) | 0 (0.0%) |
| Graduate Degree | 2 (100.0%) | 0 (0.0%) |
| Total | 124 (44.8%) | 153 (55.2%) |
Income in Obion County
Income Overview in Obion County
Per Capita Income in Obion County is $28,782, while median incomes of families and households are $66,073 and $50,638 respectively.
| Characteristic | Number | Measure |
| Per Capita Income | 30,670 | $28,782 |
| Median Family Income | 7,845 | $66,073 |
| Mean Family Income | 7,845 | $80,458 |
| Median Household Income | 12,542 | $50,638 |
| Mean Household Income | 12,542 | $68,079 |
| Income Deficit | 7,845 | $13,195 |
| Wage / Income Gap (%) | 30,670 | 23.91% |
| Wage / Income Gap ($) | 30,670 | 76.09¢ per $1 |
| Gini / Inequality Index | 30,670 | 0.47 |
Earnings by Sex in Obion County
Average Earnings in Obion County are $34,118, $39,085 for men and $29,739 for women, a difference of 23.9%.
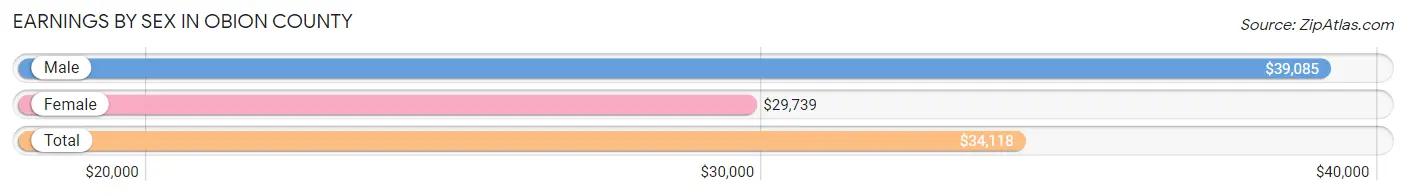
| Sex | Number | Average Earnings |
| Male | 7,674 (52.3%) | $39,085 |
| Female | 6,985 (47.6%) | $29,739 |
| Total | 14,659 (100.0%) | $34,118 |
Earnings by Sex by Income Bracket in Obion County
The most common earnings brackets in Obion County are $55,000 to $64,999 for men (795 | 10.4%) and $30,000 to $34,999 for women (619 | 8.9%).
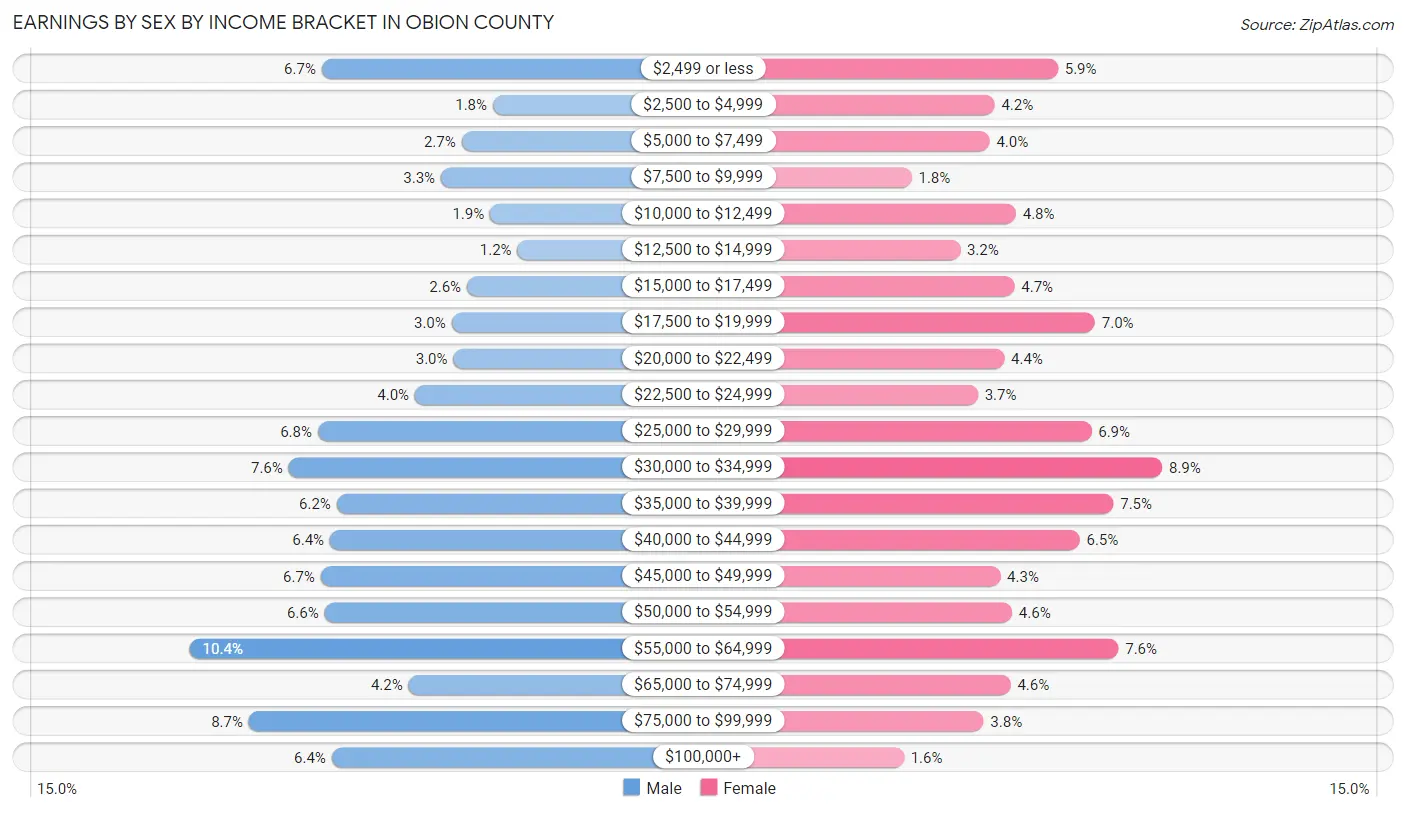
| Income | Male | Female |
| $2,499 or less | 510 (6.7%) | 414 (5.9%) |
| $2,500 to $4,999 | 141 (1.8%) | 290 (4.2%) |
| $5,000 to $7,499 | 209 (2.7%) | 280 (4.0%) |
| $7,500 to $9,999 | 253 (3.3%) | 127 (1.8%) |
| $10,000 to $12,499 | 147 (1.9%) | 332 (4.8%) |
| $12,500 to $14,999 | 88 (1.1%) | 222 (3.2%) |
| $15,000 to $17,499 | 197 (2.6%) | 329 (4.7%) |
| $17,500 to $19,999 | 230 (3.0%) | 487 (7.0%) |
| $20,000 to $22,499 | 226 (2.9%) | 309 (4.4%) |
| $22,500 to $24,999 | 309 (4.0%) | 257 (3.7%) |
| $25,000 to $29,999 | 519 (6.8%) | 480 (6.9%) |
| $30,000 to $34,999 | 582 (7.6%) | 619 (8.9%) |
| $35,000 to $39,999 | 478 (6.2%) | 523 (7.5%) |
| $40,000 to $44,999 | 493 (6.4%) | 457 (6.5%) |
| $45,000 to $49,999 | 513 (6.7%) | 301 (4.3%) |
| $50,000 to $54,999 | 504 (6.6%) | 324 (4.6%) |
| $55,000 to $64,999 | 795 (10.4%) | 533 (7.6%) |
| $65,000 to $74,999 | 323 (4.2%) | 321 (4.6%) |
| $75,000 to $99,999 | 668 (8.7%) | 268 (3.8%) |
| $100,000+ | 489 (6.4%) | 112 (1.6%) |
| Total | 7,674 (100.0%) | 6,985 (100.0%) |
Earnings by Sex by Educational Attainment in Obion County
Average earnings in Obion County are $43,910 for men and $32,028 for women, a difference of 27.1%. Men with an educational attainment of graduate degree enjoy the highest average annual earnings of $70,333, while those with less than high school education earn the least with $34,403. Women with an educational attainment of graduate degree earn the most with the average annual earnings of $59,143, while those with less than high school education have the smallest earnings of $19,420.
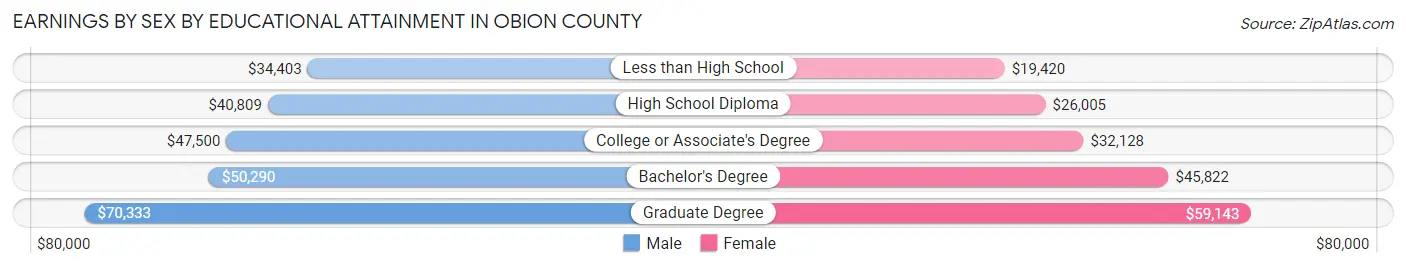
| Educational Attainment | Male Income | Female Income |
| Less than High School | $34,403 | $19,420 |
| High School Diploma | $40,809 | $26,005 |
| College or Associate's Degree | $47,500 | $32,128 |
| Bachelor's Degree | $50,290 | $45,822 |
| Graduate Degree | $70,333 | $59,143 |
| Total | $43,910 | $32,028 |
Family Income in Obion County
Family Income Brackets in Obion County
According to the Obion County family income data, there are 1,600 families falling into the $50,000 to $74,999 income range, which is the most common income bracket and makes up 20.4% of all families. Conversely, the $10,000 to $14,999 income bracket is the least frequent group with only 220 families (2.8%) belonging to this category.
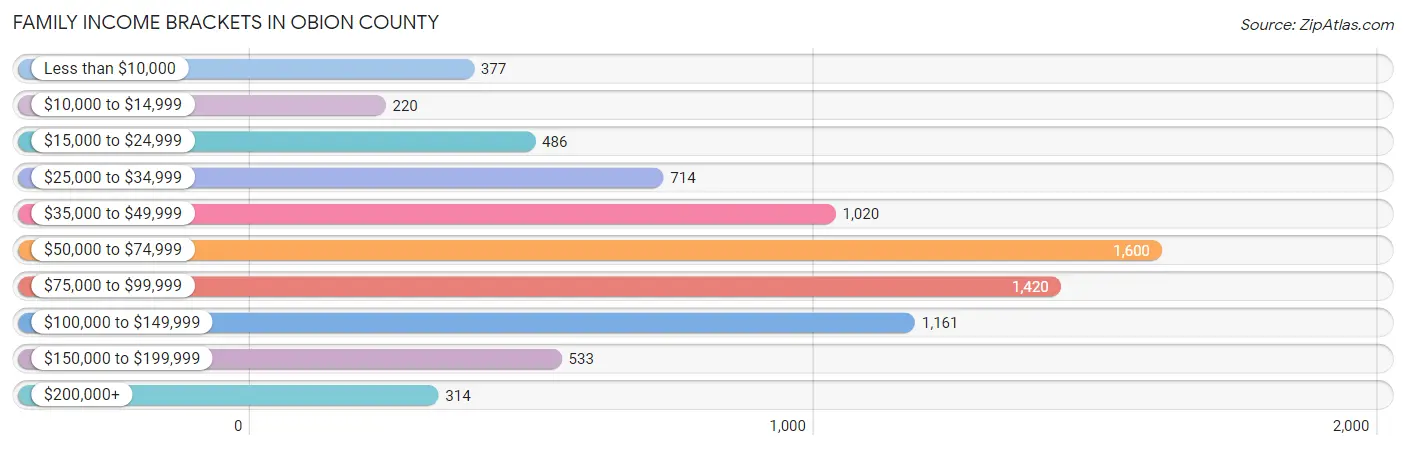
| Income Bracket | # Families | % Families |
| Less than $10,000 | 377 | 4.8% |
| $10,000 to $14,999 | 220 | 2.8% |
| $15,000 to $24,999 | 486 | 6.2% |
| $25,000 to $34,999 | 714 | 9.1% |
| $35,000 to $49,999 | 1,020 | 13.0% |
| $50,000 to $74,999 | 1,600 | 20.4% |
| $75,000 to $99,999 | 1,420 | 18.1% |
| $100,000 to $149,999 | 1,161 | 14.8% |
| $150,000 to $199,999 | 533 | 6.8% |
| $200,000+ | 314 | 4.0% |
Family Income by Famaliy Size in Obion County
4-person families (1,464 | 18.7%) account for the highest median family income in Obion County with $87,260 per family, while 2-person families (3,857 | 49.2%) have the highest median income of $28,584 per family member.
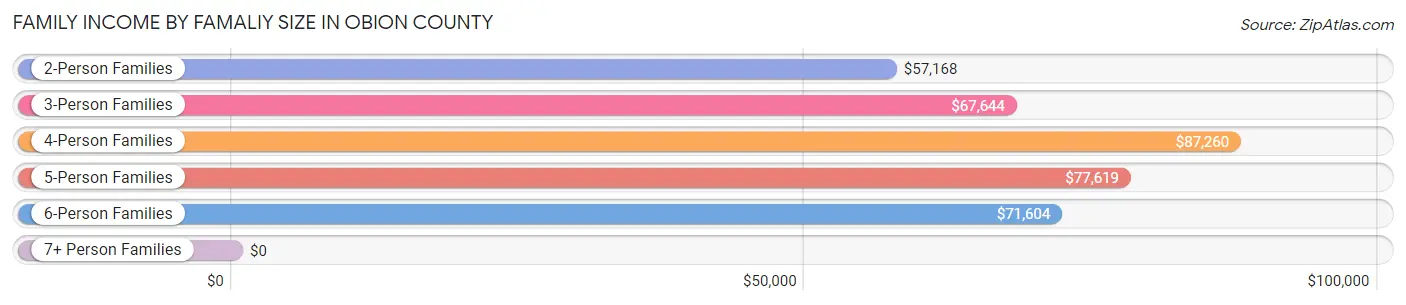
| Income Bracket | # Families | Median Income |
| 2-Person Families | 3,857 (49.2%) | $57,168 |
| 3-Person Families | 1,877 (23.9%) | $67,644 |
| 4-Person Families | 1,464 (18.7%) | $87,260 |
| 5-Person Families | 470 (6.0%) | $77,619 |
| 6-Person Families | 128 (1.6%) | $71,604 |
| 7+ Person Families | 49 (0.6%) | $0 |
| Total | 7,845 (100.0%) | $66,073 |
Family Income by Number of Earners in Obion County
The median family income in Obion County is $66,073, with families comprising 3+ earners (702) having the highest median family income of $93,611, while families with no earners (1,727) have the lowest median family income of $36,327, accounting for 8.9% and 22.0% of families, respectively.
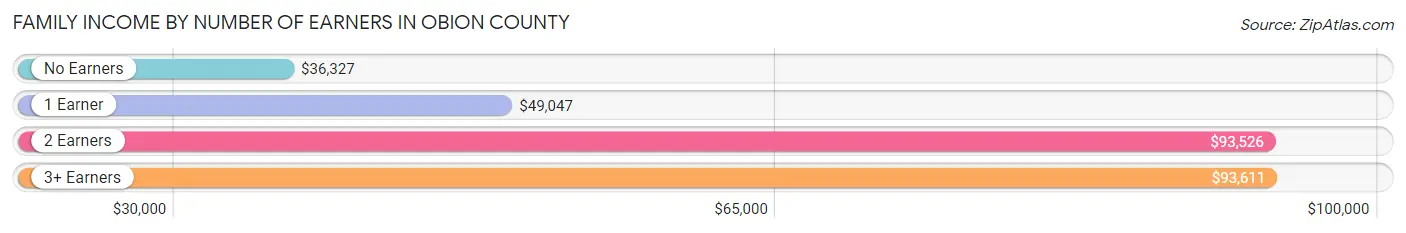
| Number of Earners | # Families | Median Income |
| No Earners | 1,727 (22.0%) | $36,327 |
| 1 Earner | 2,498 (31.8%) | $49,047 |
| 2 Earners | 2,918 (37.2%) | $93,526 |
| 3+ Earners | 702 (8.9%) | $93,611 |
| Total | 7,845 (100.0%) | $66,073 |
Household Income in Obion County
Household Income Brackets in Obion County
With 2,446 households falling in the category, the $50,000 to $74,999 income range is the most frequent in Obion County, accounting for 19.5% of all households. In contrast, only 339 households (2.7%) fall into the $200,000+ income bracket, making it the least populous group.
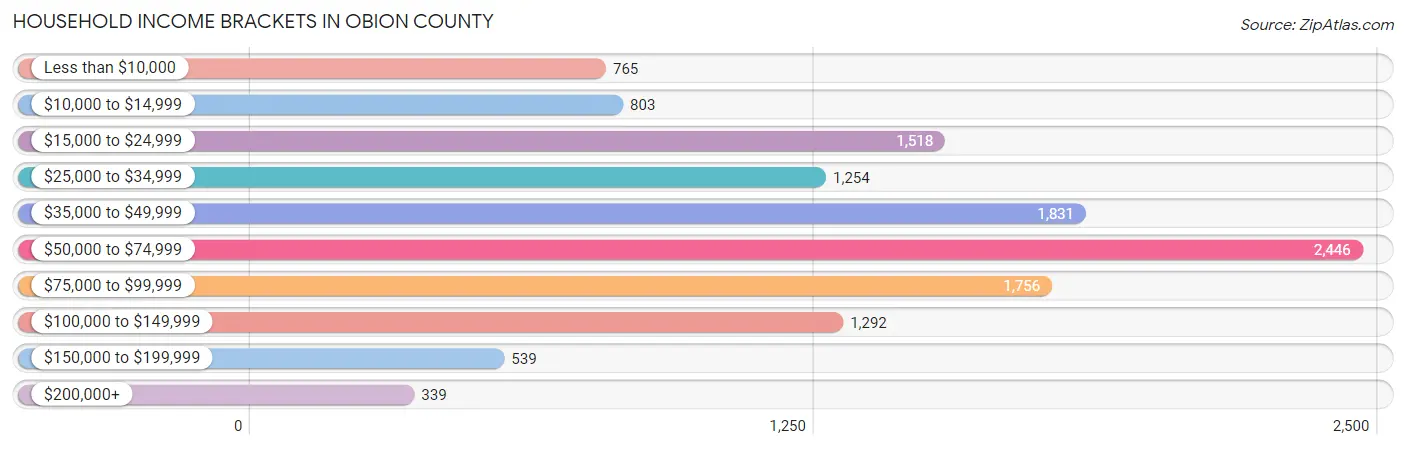
| Income Bracket | # Households | % Households |
| Less than $10,000 | 765 | 6.1% |
| $10,000 to $14,999 | 803 | 6.4% |
| $15,000 to $24,999 | 1,518 | 12.1% |
| $25,000 to $34,999 | 1,254 | 10.0% |
| $35,000 to $49,999 | 1,831 | 14.6% |
| $50,000 to $74,999 | 2,446 | 19.5% |
| $75,000 to $99,999 | 1,756 | 14.0% |
| $100,000 to $149,999 | 1,292 | 10.3% |
| $150,000 to $199,999 | 539 | 4.3% |
| $200,000+ | 339 | 2.7% |
Household Income by Householder Age in Obion County
The median household income in Obion County is $50,638, with the highest median household income of $61,085 found in the 25 to 44 years age bracket for the primary householder. A total of 3,618 households (28.8%) fall into this category. Meanwhile, the 65+ years age bracket for the primary householder has the lowest median household income of $37,380, with 4,106 households (32.7%) in this group.
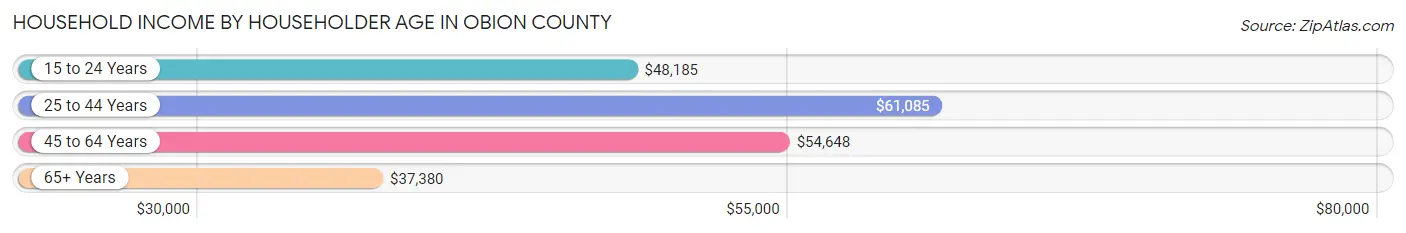
| Income Bracket | # Households | Median Income |
| 15 to 24 Years | 459 (3.7%) | $48,185 |
| 25 to 44 Years | 3,618 (28.8%) | $61,085 |
| 45 to 64 Years | 4,359 (34.8%) | $54,648 |
| 65+ Years | 4,106 (32.7%) | $37,380 |
| Total | 12,542 (100.0%) | $50,638 |
Poverty in Obion County
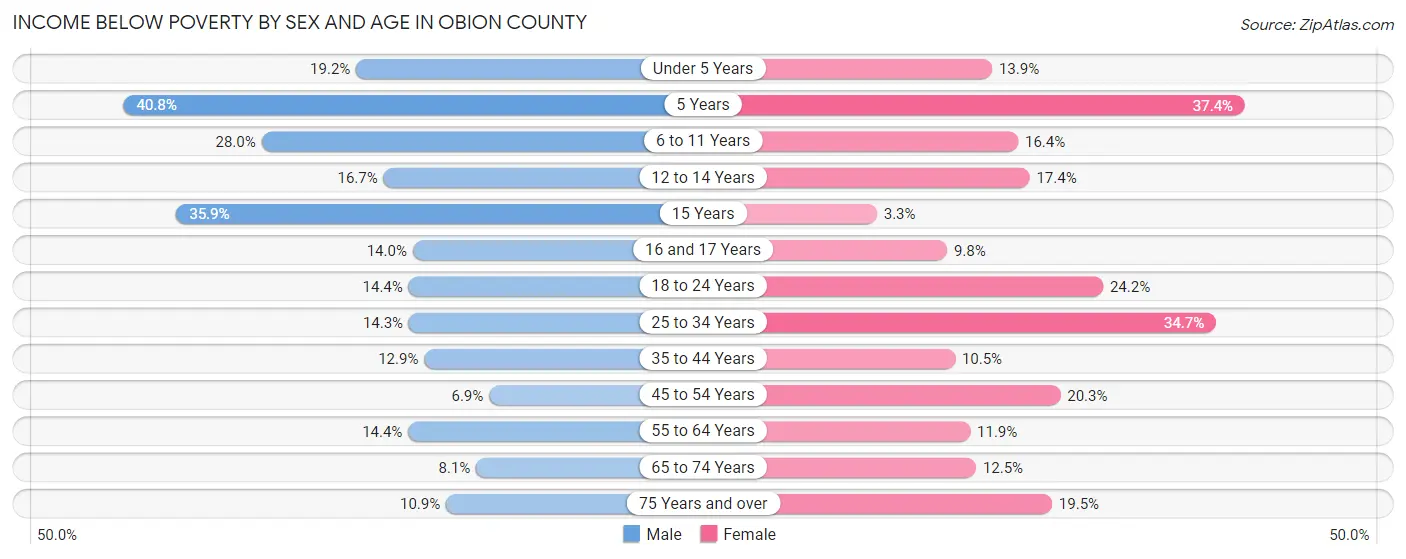
Income Below Poverty by Sex and Age in Obion County
With 14.4% poverty level for males and 17.8% for females among the residents of Obion County, 5 year old males and 5 year old females are the most vulnerable to poverty, with 60 males (40.8%) and 52 females (37.4%) in their respective age groups living below the poverty level.
| Age Bracket | Male | Female |
| Under 5 Years | 149 (19.2%) | 122 (13.9%) |
| 5 Years | 60 (40.8%) | 52 (37.4%) |
| 6 to 11 Years | 323 (28.0%) | 161 (16.4%) |
| 12 to 14 Years | 102 (16.7%) | 115 (17.4%) |
| 15 Years | 102 (35.9%) | 5 (3.3%) |
| 16 and 17 Years | 45 (14.0%) | 40 (9.8%) |
| 18 to 24 Years | 170 (14.4%) | 271 (24.2%) |
| 25 to 34 Years | 237 (14.3%) | 629 (34.7%) |
| 35 to 44 Years | 246 (12.9%) | 196 (10.5%) |
| 45 to 54 Years | 127 (6.9%) | 393 (20.3%) |
| 55 to 64 Years | 301 (14.4%) | 254 (11.9%) |
| 65 to 74 Years | 137 (8.1%) | 241 (12.4%) |
| 75 Years and over | 115 (10.9%) | 274 (19.5%) |
| Total | 2,114 (14.4%) | 2,753 (17.8%) |
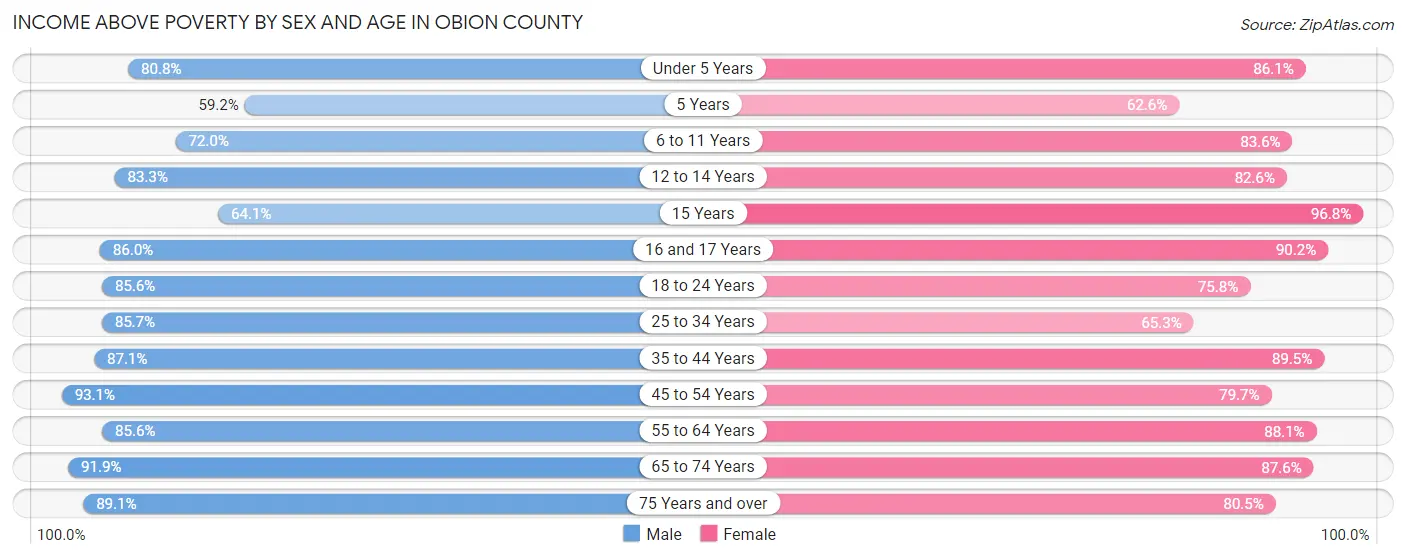
Income Above Poverty by Sex and Age in Obion County
According to the poverty statistics in Obion County, males aged 45 to 54 years and females aged 15 years are the age groups that are most secure financially, with 93.1% of males and 96.8% of females in these age groups living above the poverty line.
| Age Bracket | Male | Female |
| Under 5 Years | 626 (80.8%) | 753 (86.1%) |
| 5 Years | 87 (59.2%) | 87 (62.6%) |
| 6 to 11 Years | 830 (72.0%) | 823 (83.6%) |
| 12 to 14 Years | 509 (83.3%) | 545 (82.6%) |
| 15 Years | 182 (64.1%) | 149 (96.8%) |
| 16 and 17 Years | 277 (86.0%) | 370 (90.2%) |
| 18 to 24 Years | 1,014 (85.6%) | 847 (75.8%) |
| 25 to 34 Years | 1,417 (85.7%) | 1,182 (65.3%) |
| 35 to 44 Years | 1,660 (87.1%) | 1,670 (89.5%) |
| 45 to 54 Years | 1,715 (93.1%) | 1,545 (79.7%) |
| 55 to 64 Years | 1,789 (85.6%) | 1,879 (88.1%) |
| 65 to 74 Years | 1,556 (91.9%) | 1,694 (87.5%) |
| 75 Years and over | 941 (89.1%) | 1,131 (80.5%) |
| Total | 12,603 (85.6%) | 12,675 (82.2%) |
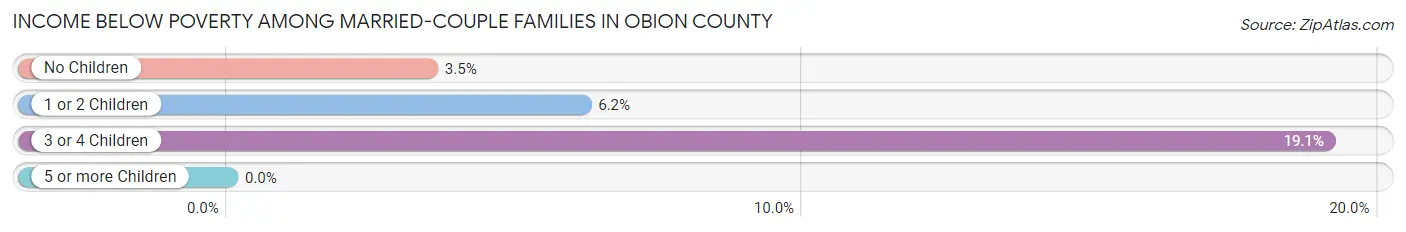
Income Below Poverty Among Married-Couple Families in Obion County
The poverty statistics for married-couple families in Obion County show that 5.1% or 305 of the total 6,044 families live below the poverty line. Families with 3 or 4 children have the highest poverty rate of 19.1%, comprising of 43 families. On the other hand, families with 5 or more children have the lowest poverty rate of 0.0%, which includes 0 families.
| Children | Above Poverty | Below Poverty |
| No Children | 3,414 (96.5%) | 123 (3.5%) |
| 1 or 2 Children | 2,122 (93.9%) | 139 (6.1%) |
| 3 or 4 Children | 182 (80.9%) | 43 (19.1%) |
| 5 or more Children | 21 (100.0%) | 0 (0.0%) |
| Total | 5,739 (95.0%) | 305 (5.1%) |
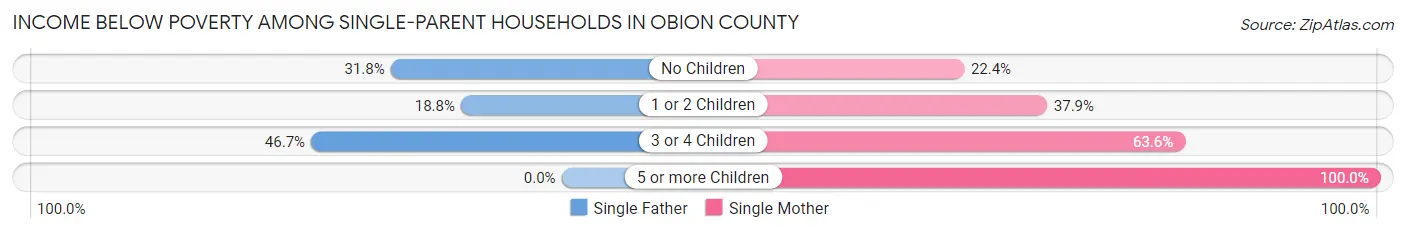
Income Below Poverty Among Single-Parent Households in Obion County
According to the poverty data in Obion County, 26.7% or 131 single-father households and 36.5% or 479 single-mother households are living below the poverty line. Among single-father households, those with 3 or 4 children have the highest poverty rate, with 7 households (46.7%) experiencing poverty. Likewise, among single-mother households, those with 5 or more children have the highest poverty rate, with 3 households (100.0%) falling below the poverty line.
| Children | Single Father | Single Mother |
| No Children | 85 (31.8%) | 84 (22.4%) |
| 1 or 2 Children | 39 (18.8%) | 296 (37.9%) |
| 3 or 4 Children | 7 (46.7%) | 96 (63.6%) |
| 5 or more Children | 0 (0.0%) | 3 (100.0%) |
| Total | 131 (26.7%) | 479 (36.5%) |
Income Below Poverty Among Married-Couple vs Single-Parent Households in Obion County
The poverty data for Obion County shows that 305 of the married-couple family households (5.1%) and 610 of the single-parent households (33.9%) are living below the poverty level. Within the married-couple family households, those with 3 or 4 children have the highest poverty rate, with 43 households (19.1%) falling below the poverty line. Among the single-parent households, those with 5 or more children have the highest poverty rate, with 3 household (100.0%) living below poverty.
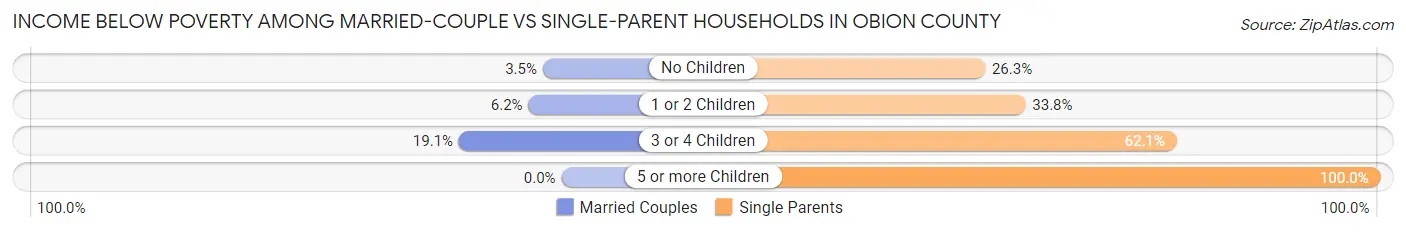
| Children | Married-Couple Families | Single-Parent Households |
| No Children | 123 (3.5%) | 169 (26.3%) |
| 1 or 2 Children | 139 (6.1%) | 335 (33.8%) |
| 3 or 4 Children | 43 (19.1%) | 103 (62.1%) |
| 5 or more Children | 0 (0.0%) | 3 (100.0%) |
| Total | 305 (5.1%) | 610 (33.9%) |
Employment Characteristics in Obion County
Employment by Class of Employer in Obion County
Among the 13,120 employed individuals in Obion County, private company employees (9,030 | 68.8%), local government employees (1,164 | 8.9%), and self-employed (not incorporated) (919 | 7.0%) make up the most common classes of employment.
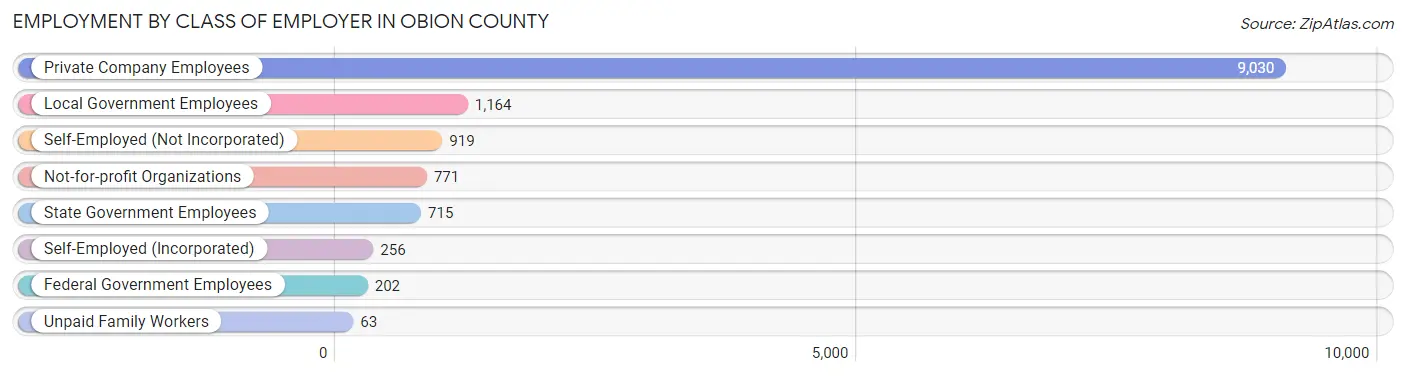
| Employer Class | # Employees | % Employees |
| Private Company Employees | 9,030 | 68.8% |
| Self-Employed (Incorporated) | 256 | 1.9% |
| Self-Employed (Not Incorporated) | 919 | 7.0% |
| Not-for-profit Organizations | 771 | 5.9% |
| Local Government Employees | 1,164 | 8.9% |
| State Government Employees | 715 | 5.4% |
| Federal Government Employees | 202 | 1.5% |
| Unpaid Family Workers | 63 | 0.5% |
| Total | 13,120 | 100.0% |
Employment Status by Age in Obion County
According to the labor force statistics for Obion County, out of the total population over 16 years of age (24,703), 57.0% or 14,081 individuals are in the labor force, with 5.0% or 704 of them unemployed. The age group with the highest labor force participation rate is 35 to 44 years, with 84.9% or 3,230 individuals in the labor force. Within the labor force, the 20 to 24 years age range has the highest percentage of unemployed individuals, with 21.0% or 270 of them being unemployed.
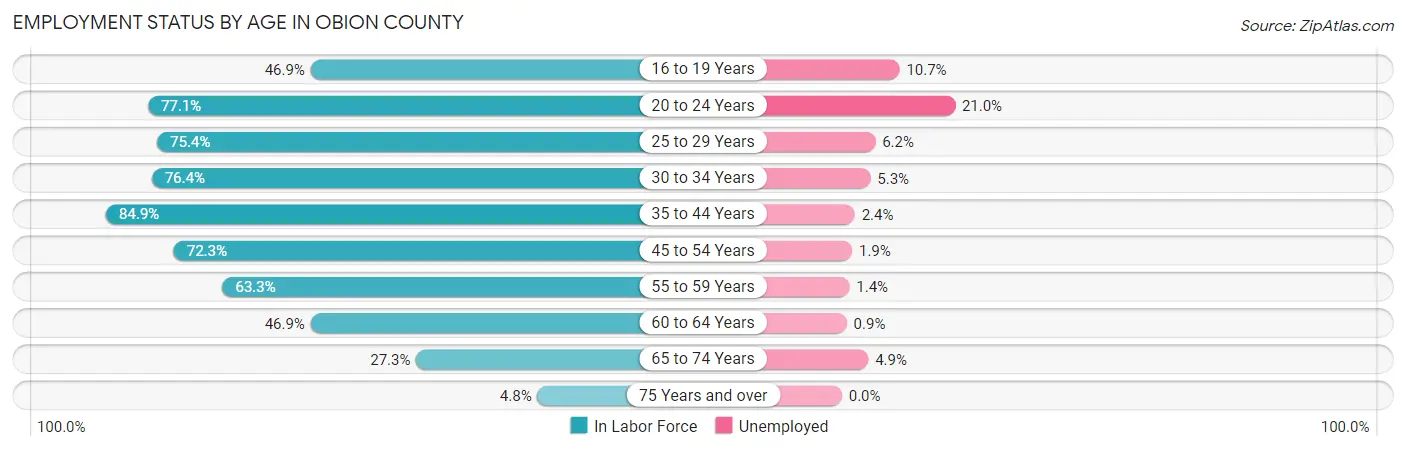
| Age Bracket | In Labor Force | Unemployed |
| 16 to 19 Years | 651 (46.9%) | 70 (10.7%) |
| 20 to 24 Years | 1,288 (77.1%) | 270 (21.0%) |
| 25 to 29 Years | 1,378 (75.4%) | 85 (6.2%) |
| 30 to 34 Years | 1,295 (76.4%) | 69 (5.3%) |
| 35 to 44 Years | 3,230 (84.9%) | 78 (2.4%) |
| 45 to 54 Years | 2,761 (72.3%) | 52 (1.9%) |
| 55 to 59 Years | 1,440 (63.3%) | 20 (1.4%) |
| 60 to 64 Years | 915 (46.9%) | 8 (0.9%) |
| 65 to 74 Years | 995 (27.3%) | 49 (4.9%) |
| 75 Years and over | 126 (4.8%) | 0 (0.0%) |
| Total | 14,081 (57.0%) | 704 (5.0%) |
Employment Status by Educational Attainment in Obion County
According to labor force statistics for Obion County, 71.7% of individuals (11,021) out of the total population between 25 and 64 years of age (15,371) are in the labor force, with 2.8% or 309 of them being unemployed. The group with the highest labor force participation rate are those with the educational attainment of bachelor's degree or higher, with 92.7% or 2,626 individuals in the labor force. Within the labor force, individuals with college / associate degree education have the highest percentage of unemployment, with 4.7% or 131 of them being unemployed.
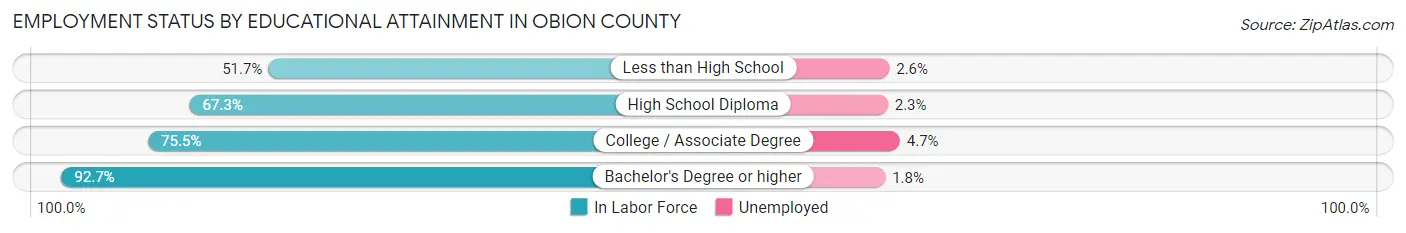
| Educational Attainment | In Labor Force | Unemployed |
| Less than High School | 1,148 (51.7%) | 58 (2.6%) |
| High School Diploma | 4,463 (67.3%) | 153 (2.3%) |
| College / Associate Degree | 2,784 (75.5%) | 173 (4.7%) |
| Bachelor's Degree or higher | 2,626 (92.7%) | 51 (1.8%) |
| Total | 11,021 (71.7%) | 430 (2.8%) |
Employment Occupations by Sex in Obion County
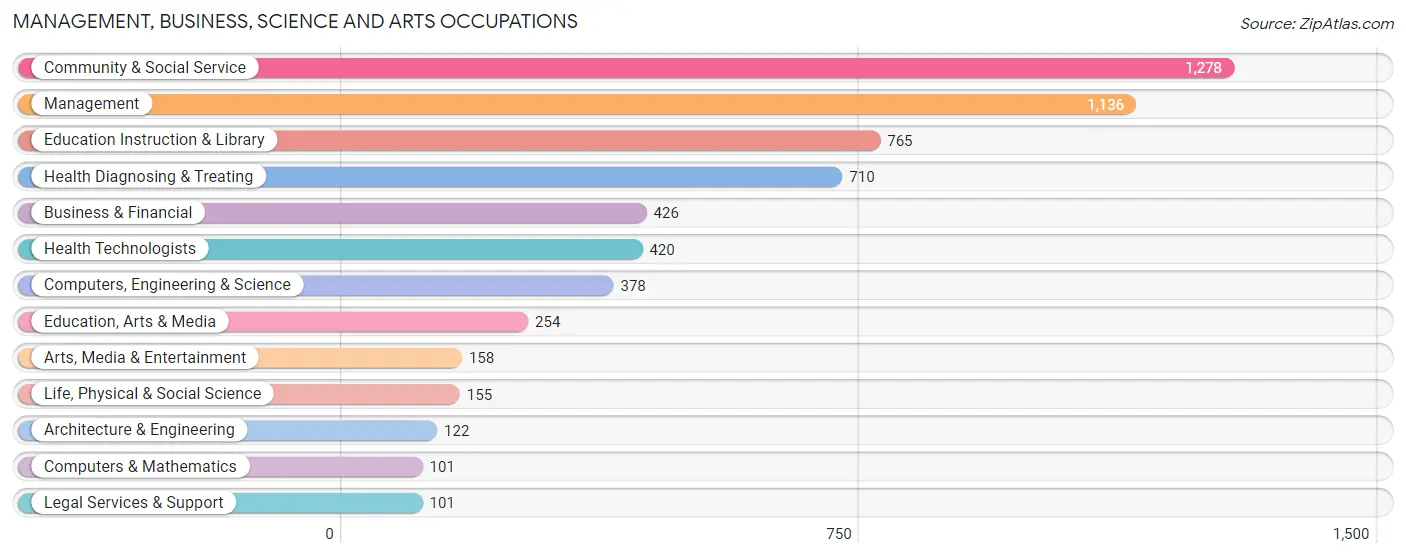
Management, Business, Science and Arts Occupations
The most common Management, Business, Science and Arts occupations in Obion County are Community & Social Service (1,278 | 9.6%), Management (1,136 | 8.5%), Education Instruction & Library (765 | 5.7%), Health Diagnosing & Treating (710 | 5.3%), and Business & Financial (426 | 3.2%).
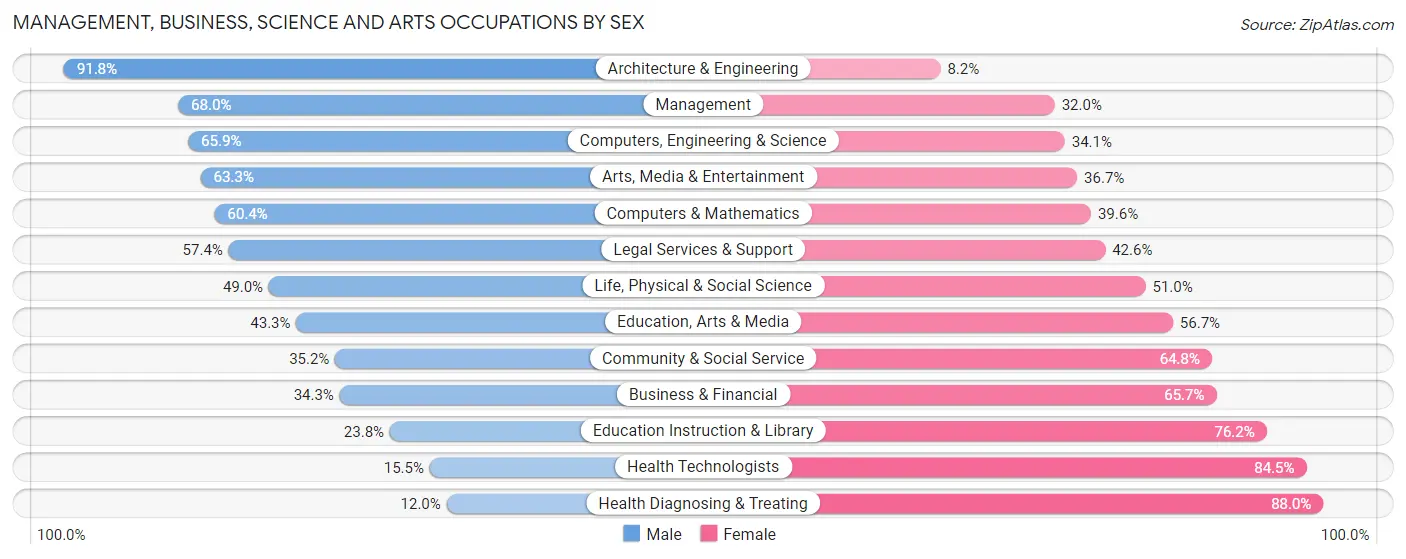
Management, Business, Science and Arts Occupations by Sex
Within the Management, Business, Science and Arts occupations in Obion County, the most male-oriented occupations are Architecture & Engineering (91.8%), Management (68.0%), and Computers, Engineering & Science (65.9%), while the most female-oriented occupations are Health Diagnosing & Treating (88.0%), Health Technologists (84.5%), and Education Instruction & Library (76.2%).
| Occupation | Male | Female |
| Management | 772 (68.0%) | 364 (32.0%) |
| Business & Financial | 146 (34.3%) | 280 (65.7%) |
| Computers, Engineering & Science | 249 (65.9%) | 129 (34.1%) |
| Computers & Mathematics | 61 (60.4%) | 40 (39.6%) |
| Architecture & Engineering | 112 (91.8%) | 10 (8.2%) |
| Life, Physical & Social Science | 76 (49.0%) | 79 (51.0%) |
| Community & Social Service | 450 (35.2%) | 828 (64.8%) |
| Education, Arts & Media | 110 (43.3%) | 144 (56.7%) |
| Legal Services & Support | 58 (57.4%) | 43 (42.6%) |
| Education Instruction & Library | 182 (23.8%) | 583 (76.2%) |
| Arts, Media & Entertainment | 100 (63.3%) | 58 (36.7%) |
| Health Diagnosing & Treating | 85 (12.0%) | 625 (88.0%) |
| Health Technologists | 65 (15.5%) | 355 (84.5%) |
| Total (Category) | 1,702 (43.3%) | 2,226 (56.7%) |
| Total (Overall) | 7,118 (53.3%) | 6,242 (46.7%) |
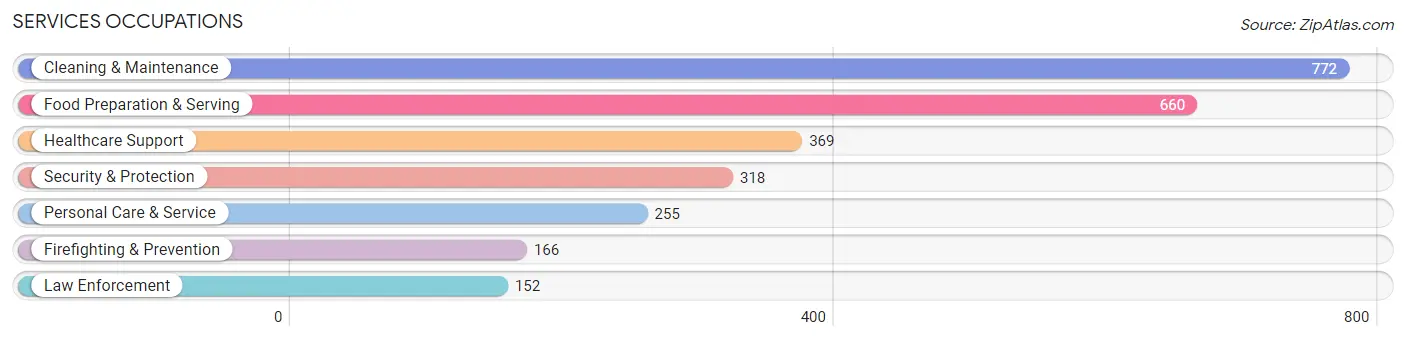
Services Occupations
The most common Services occupations in Obion County are Cleaning & Maintenance (772 | 5.8%), Food Preparation & Serving (660 | 4.9%), Healthcare Support (369 | 2.8%), Security & Protection (318 | 2.4%), and Personal Care & Service (255 | 1.9%).
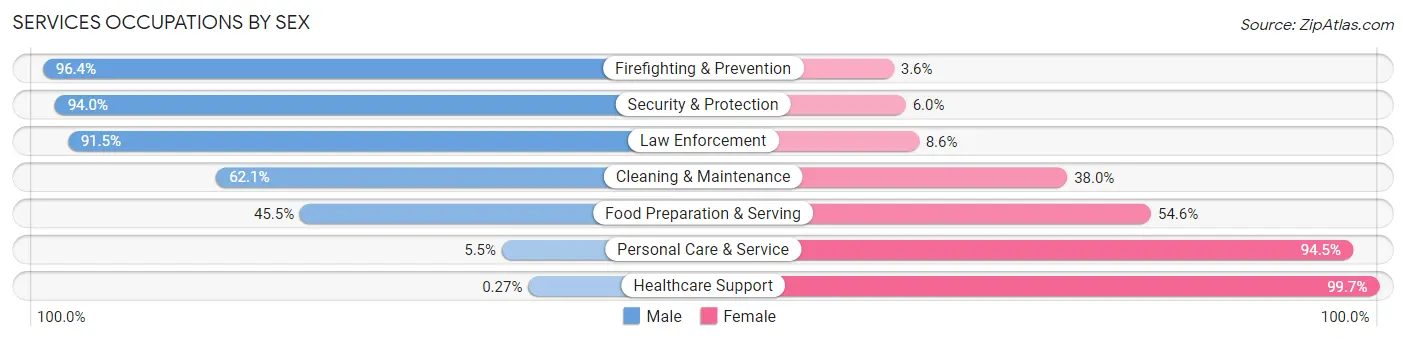
Services Occupations by Sex
Within the Services occupations in Obion County, the most male-oriented occupations are Firefighting & Prevention (96.4%), Security & Protection (94.0%), and Law Enforcement (91.4%), while the most female-oriented occupations are Healthcare Support (99.7%), Personal Care & Service (94.5%), and Food Preparation & Serving (54.5%).
| Occupation | Male | Female |
| Healthcare Support | 1 (0.3%) | 368 (99.7%) |
| Security & Protection | 299 (94.0%) | 19 (6.0%) |
| Firefighting & Prevention | 160 (96.4%) | 6 (3.6%) |
| Law Enforcement | 139 (91.4%) | 13 (8.6%) |
| Food Preparation & Serving | 300 (45.5%) | 360 (54.5%) |
| Cleaning & Maintenance | 479 (62.1%) | 293 (38.0%) |
| Personal Care & Service | 14 (5.5%) | 241 (94.5%) |
| Total (Category) | 1,093 (46.0%) | 1,281 (54.0%) |
| Total (Overall) | 7,118 (53.3%) | 6,242 (46.7%) |
Sales and Office Occupations
The most common Sales and Office occupations in Obion County are Sales & Related (1,273 | 9.5%), and Office & Administration (1,036 | 7.7%).

Sales and Office Occupations by Sex

| Occupation | Male | Female |
| Sales & Related | 587 (46.1%) | 686 (53.9%) |
| Office & Administration | 196 (18.9%) | 840 (81.1%) |
| Total (Category) | 783 (33.9%) | 1,526 (66.1%) |
| Total (Overall) | 7,118 (53.3%) | 6,242 (46.7%) |
Natural Resources, Construction and Maintenance Occupations
The most common Natural Resources, Construction and Maintenance occupations in Obion County are Construction & Extraction (636 | 4.8%), Installation, Maintenance & Repair (582 | 4.4%), and Farming, Fishing & Forestry (46 | 0.3%).
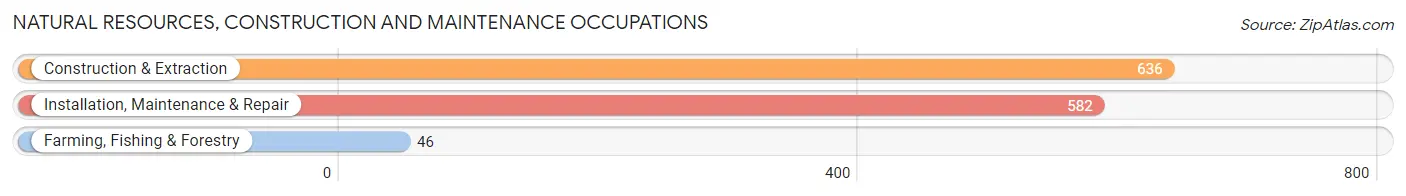
Natural Resources, Construction and Maintenance Occupations by Sex
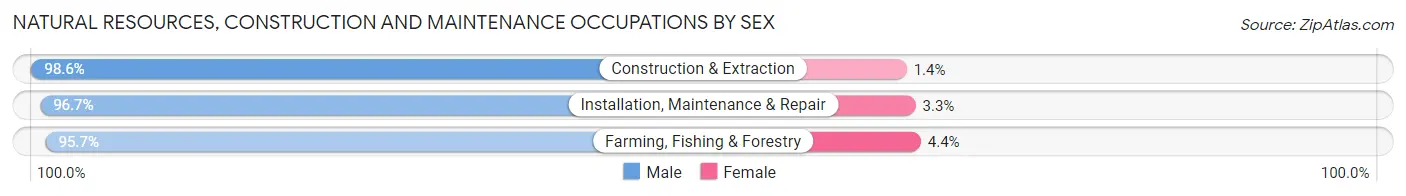
| Occupation | Male | Female |
| Farming, Fishing & Forestry | 44 (95.7%) | 2 (4.3%) |
| Construction & Extraction | 627 (98.6%) | 9 (1.4%) |
| Installation, Maintenance & Repair | 563 (96.7%) | 19 (3.3%) |
| Total (Category) | 1,234 (97.6%) | 30 (2.4%) |
| Total (Overall) | 7,118 (53.3%) | 6,242 (46.7%) |
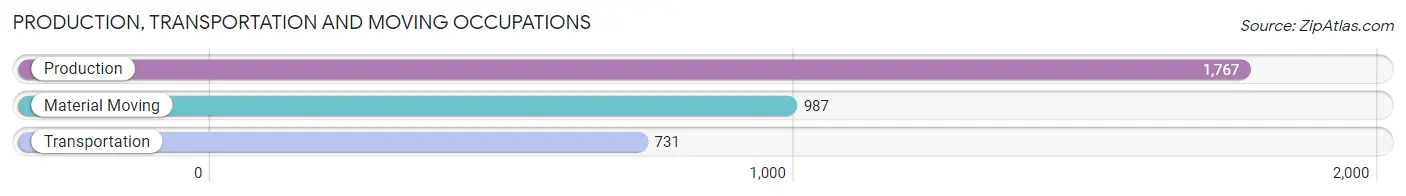
Production, Transportation and Moving Occupations
The most common Production, Transportation and Moving occupations in Obion County are Production (1,767 | 13.2%), Material Moving (987 | 7.4%), and Transportation (731 | 5.5%).
Production, Transportation and Moving Occupations by Sex
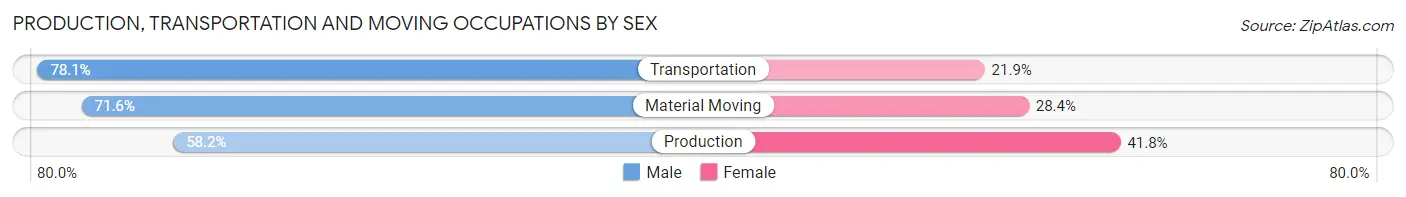
| Occupation | Male | Female |
| Production | 1,028 (58.2%) | 739 (41.8%) |
| Transportation | 571 (78.1%) | 160 (21.9%) |
| Material Moving | 707 (71.6%) | 280 (28.4%) |
| Total (Category) | 2,306 (66.2%) | 1,179 (33.8%) |
| Total (Overall) | 7,118 (53.3%) | 6,242 (46.7%) |
Employment Industries by Sex in Obion County
Employment Industries in Obion County
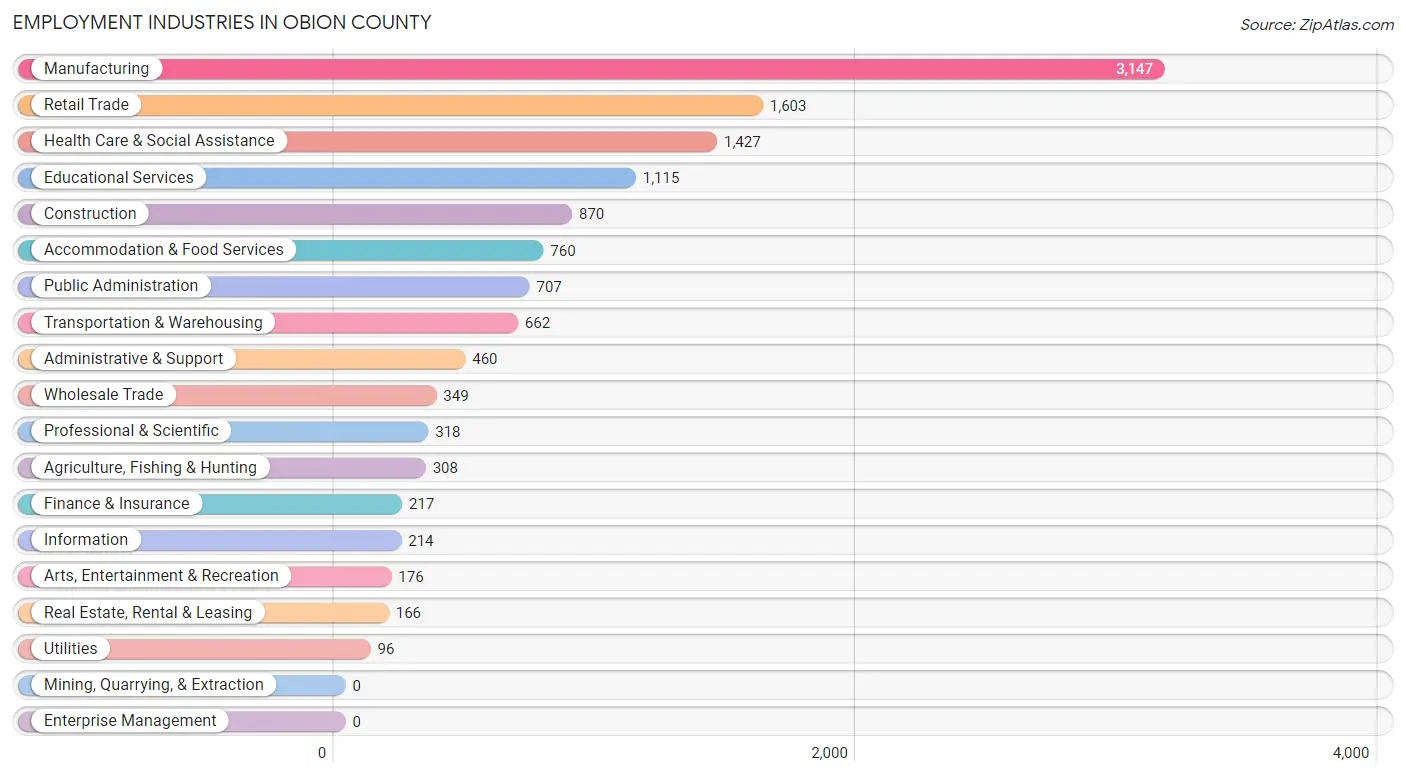
The major employment industries in Obion County include Manufacturing (3,147 | 23.6%), Retail Trade (1,603 | 12.0%), Health Care & Social Assistance (1,427 | 10.7%), Educational Services (1,115 | 8.4%), and Construction (870 | 6.5%).
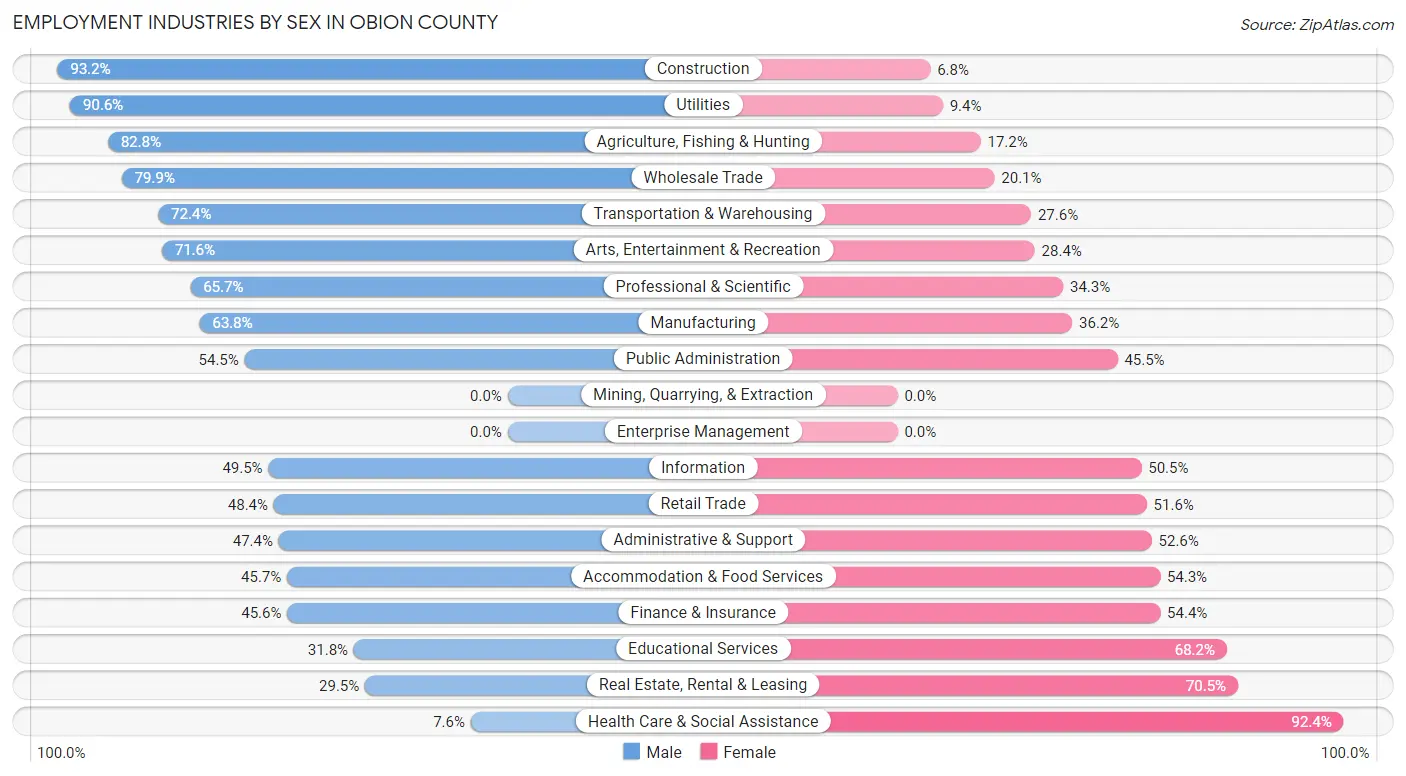
Employment Industries by Sex in Obion County
The Obion County industries that see more men than women are Construction (93.2%), Utilities (90.6%), and Agriculture, Fishing & Hunting (82.8%), whereas the industries that tend to have a higher number of women are Health Care & Social Assistance (92.4%), Real Estate, Rental & Leasing (70.5%), and Educational Services (68.2%).
| Industry | Male | Female |
| Agriculture, Fishing & Hunting | 255 (82.8%) | 53 (17.2%) |
| Mining, Quarrying, & Extraction | 0 (0.0%) | 0 (0.0%) |
| Construction | 811 (93.2%) | 59 (6.8%) |
| Manufacturing | 2,009 (63.8%) | 1,138 (36.2%) |
| Wholesale Trade | 279 (79.9%) | 70 (20.1%) |
| Retail Trade | 776 (48.4%) | 827 (51.6%) |
| Transportation & Warehousing | 479 (72.4%) | 183 (27.6%) |
| Utilities | 87 (90.6%) | 9 (9.4%) |
| Information | 106 (49.5%) | 108 (50.5%) |
| Finance & Insurance | 99 (45.6%) | 118 (54.4%) |
| Real Estate, Rental & Leasing | 49 (29.5%) | 117 (70.5%) |
| Professional & Scientific | 209 (65.7%) | 109 (34.3%) |
| Enterprise Management | 0 (0.0%) | 0 (0.0%) |
| Administrative & Support | 218 (47.4%) | 242 (52.6%) |
| Educational Services | 355 (31.8%) | 760 (68.2%) |
| Health Care & Social Assistance | 109 (7.6%) | 1,318 (92.4%) |
| Arts, Entertainment & Recreation | 126 (71.6%) | 50 (28.4%) |
| Accommodation & Food Services | 347 (45.7%) | 413 (54.3%) |
| Public Administration | 385 (54.5%) | 322 (45.5%) |
| Total | 7,118 (53.3%) | 6,242 (46.7%) |
Education in Obion County
School Enrollment in Obion County
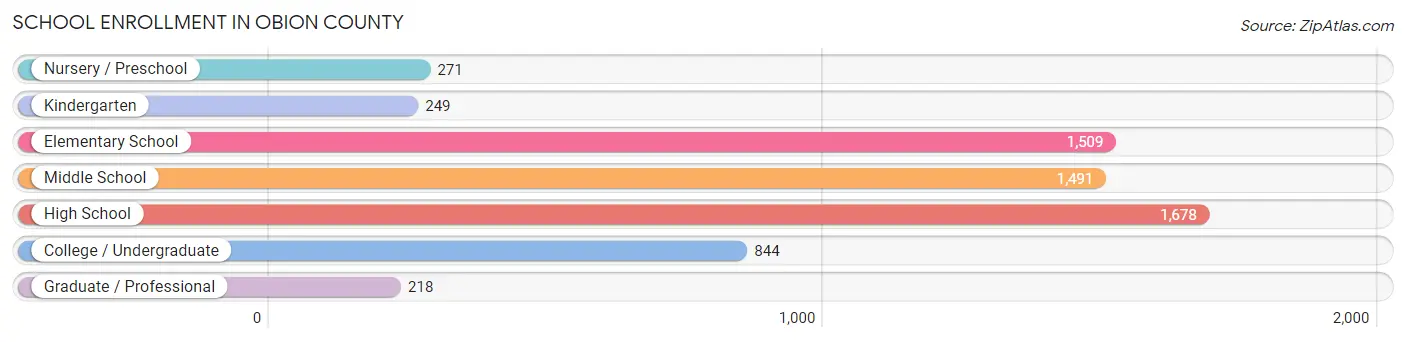
The most common levels of schooling among the 6,260 students in Obion County are high school (1,678 | 26.8%), elementary school (1,509 | 24.1%), and middle school (1,491 | 23.8%).
| School Level | # Students | % Students |
| Nursery / Preschool | 271 | 4.3% |
| Kindergarten | 249 | 4.0% |
| Elementary School | 1,509 | 24.1% |
| Middle School | 1,491 | 23.8% |
| High School | 1,678 | 26.8% |
| College / Undergraduate | 844 | 13.5% |
| Graduate / Professional | 218 | 3.5% |
| Total | 6,260 | 100.0% |
School Enrollment by Age by Funding Source in Obion County
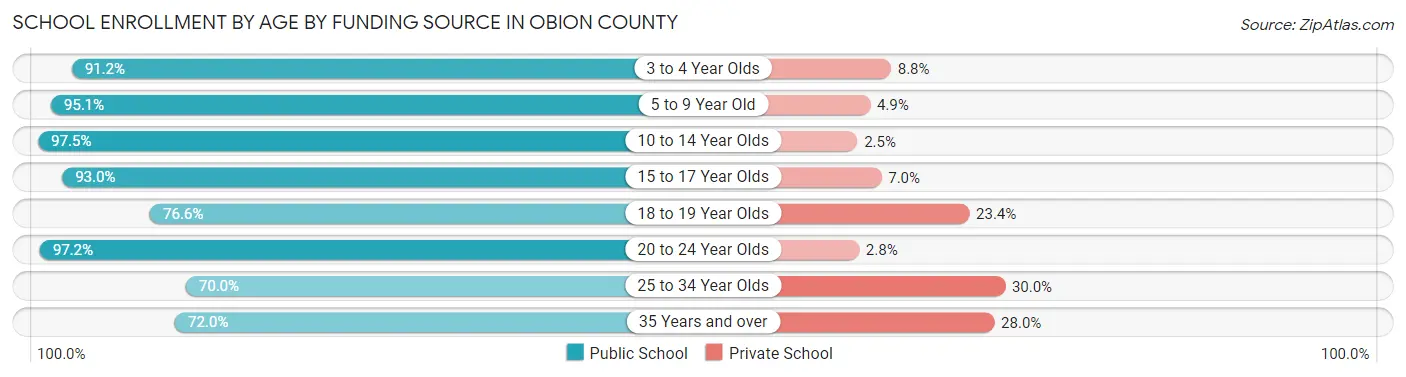
Out of a total of 6,260 students who are enrolled in schools in Obion County, 476 (7.6%) attend a private institution, while the remaining 5,784 (92.4%) are enrolled in public schools. The age group of 25 to 34 year olds has the highest likelihood of being enrolled in private schools, with 76 (30.0% in the age bracket) enrolled. Conversely, the age group of 10 to 14 year olds has the lowest likelihood of being enrolled in a private school, with 1,815 (97.5% in the age bracket) attending a public institution.
| Age Bracket | Public School | Private School |
| 3 to 4 Year Olds | 135 (91.2%) | 13 (8.8%) |
| 5 to 9 Year Old | 1,649 (95.1%) | 85 (4.9%) |
| 10 to 14 Year Olds | 1,815 (97.5%) | 47 (2.5%) |
| 15 to 17 Year Olds | 1,087 (93.0%) | 82 (7.0%) |
| 18 to 19 Year Olds | 305 (76.6%) | 93 (23.4%) |
| 20 to 24 Year Olds | 444 (97.2%) | 13 (2.8%) |
| 25 to 34 Year Olds | 177 (70.0%) | 76 (30.0%) |
| 35 Years and over | 172 (72.0%) | 67 (28.0%) |
| Total | 5,784 (92.4%) | 476 (7.6%) |
Educational Attainment by Field of Study in Obion County
Education (962 | 24.1%), business (671 | 16.8%), arts & humanities (394 | 9.9%), science & technology (363 | 9.1%), and bio, nature & agricultural (254 | 6.4%) are the most common fields of study among 3,989 individuals in Obion County who have obtained a bachelor's degree or higher.
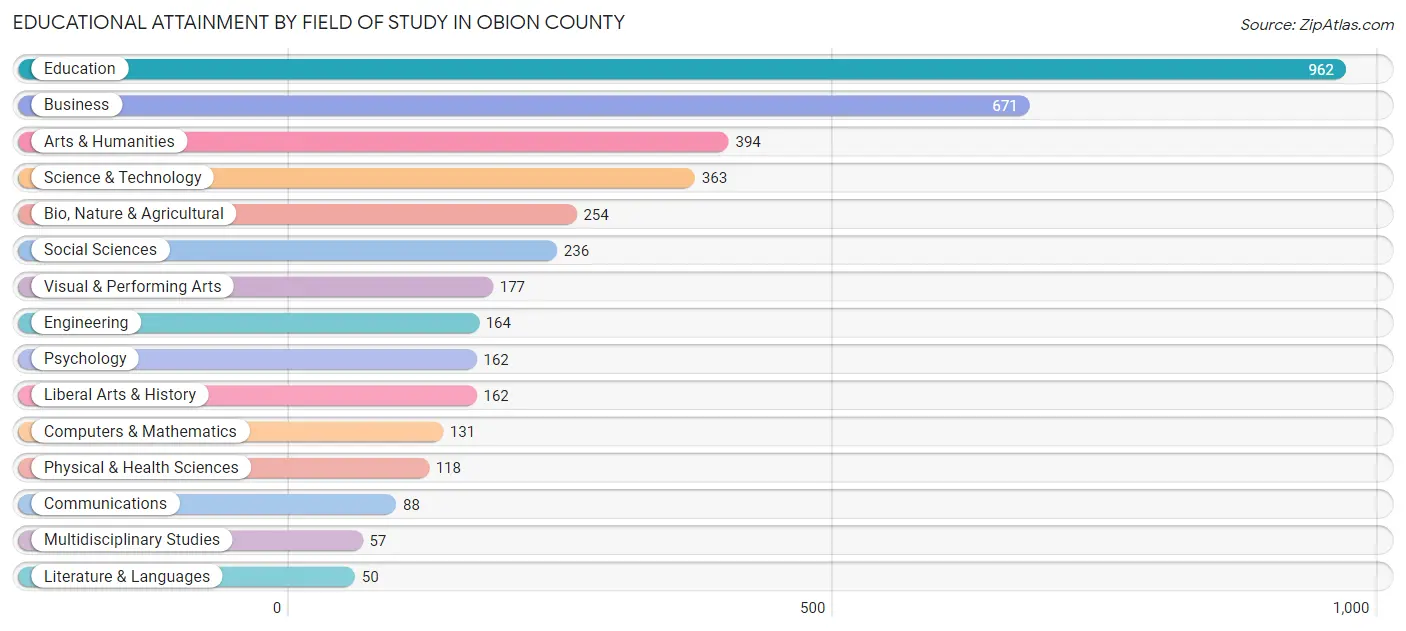
| Field of Study | # Graduates | % Graduates |
| Computers & Mathematics | 131 | 3.3% |
| Bio, Nature & Agricultural | 254 | 6.4% |
| Physical & Health Sciences | 118 | 3.0% |
| Psychology | 162 | 4.1% |
| Social Sciences | 236 | 5.9% |
| Engineering | 164 | 4.1% |
| Multidisciplinary Studies | 57 | 1.4% |
| Science & Technology | 363 | 9.1% |
| Business | 671 | 16.8% |
| Education | 962 | 24.1% |
| Literature & Languages | 50 | 1.3% |
| Liberal Arts & History | 162 | 4.1% |
| Visual & Performing Arts | 177 | 4.4% |
| Communications | 88 | 2.2% |
| Arts & Humanities | 394 | 9.9% |
| Total | 3,989 | 100.0% |
Transportation & Commute in Obion County
Vehicle Availability by Sex in Obion County
The most prevalent vehicle ownership categories in Obion County are males with 2 vehicles (3,076, accounting for 44.3%) and females with 2 vehicles (2,368, making up 49.9%).
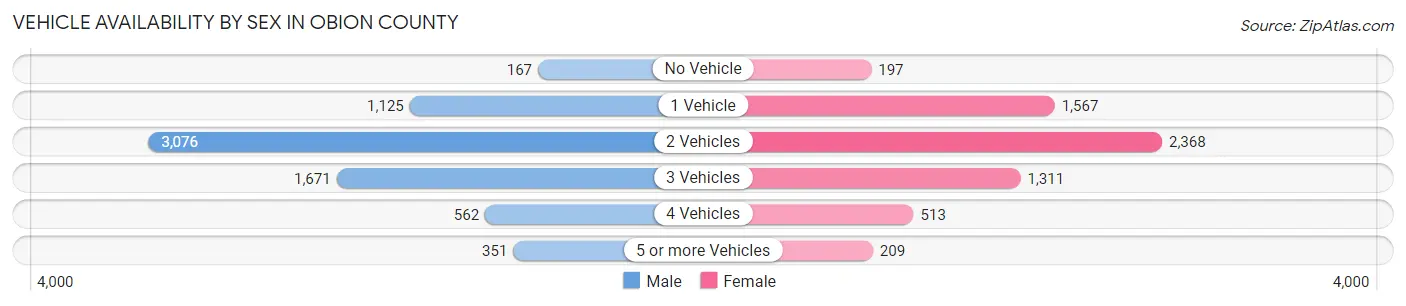
| Vehicles Available | Male | Female |
| No Vehicle | 167 (2.4%) | 197 (3.2%) |
| 1 Vehicle | 1,125 (16.2%) | 1,567 (25.4%) |
| 2 Vehicles | 3,076 (44.3%) | 2,368 (38.4%) |
| 3 Vehicles | 1,671 (24.0%) | 1,311 (21.3%) |
| 4 Vehicles | 562 (8.1%) | 513 (8.3%) |
| 5 or more Vehicles | 351 (5.1%) | 209 (3.4%) |
| Total | 6,952 (100.0%) | 6,165 (100.0%) |
Commute Time in Obion County
The most frequently occuring commute durations in Obion County are 10 to 14 minutes (2,361 commuters, 18.7%), 15 to 19 minutes (2,274 commuters, 18.0%), and 5 to 9 minutes (1,932 commuters, 15.3%).
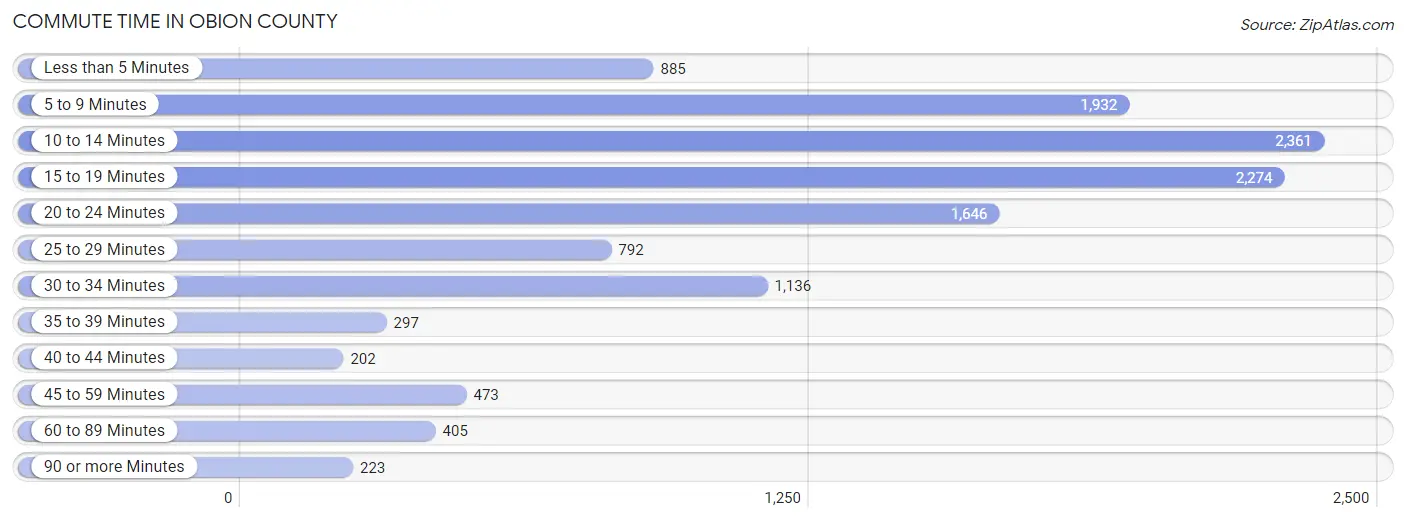
| Commute Time | # Commuters | % Commuters |
| Less than 5 Minutes | 885 | 7.0% |
| 5 to 9 Minutes | 1,932 | 15.3% |
| 10 to 14 Minutes | 2,361 | 18.7% |
| 15 to 19 Minutes | 2,274 | 18.0% |
| 20 to 24 Minutes | 1,646 | 13.0% |
| 25 to 29 Minutes | 792 | 6.3% |
| 30 to 34 Minutes | 1,136 | 9.0% |
| 35 to 39 Minutes | 297 | 2.4% |
| 40 to 44 Minutes | 202 | 1.6% |
| 45 to 59 Minutes | 473 | 3.7% |
| 60 to 89 Minutes | 405 | 3.2% |
| 90 or more Minutes | 223 | 1.8% |
Commute Time by Sex in Obion County
The most common commute times in Obion County are 10 to 14 minutes (1,223 commuters, 18.2%) for males and 10 to 14 minutes (1,138 commuters, 19.3%) for females.
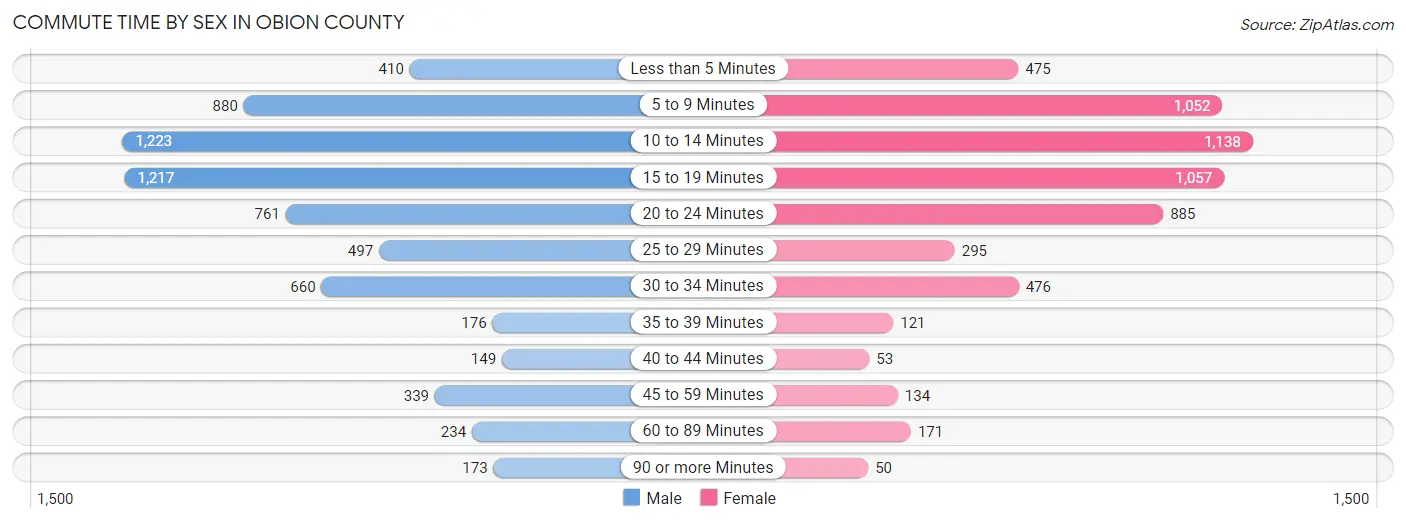
| Commute Time | Male | Female |
| Less than 5 Minutes | 410 (6.1%) | 475 (8.0%) |
| 5 to 9 Minutes | 880 (13.1%) | 1,052 (17.8%) |
| 10 to 14 Minutes | 1,223 (18.2%) | 1,138 (19.3%) |
| 15 to 19 Minutes | 1,217 (18.1%) | 1,057 (17.9%) |
| 20 to 24 Minutes | 761 (11.3%) | 885 (15.0%) |
| 25 to 29 Minutes | 497 (7.4%) | 295 (5.0%) |
| 30 to 34 Minutes | 660 (9.8%) | 476 (8.1%) |
| 35 to 39 Minutes | 176 (2.6%) | 121 (2.1%) |
| 40 to 44 Minutes | 149 (2.2%) | 53 (0.9%) |
| 45 to 59 Minutes | 339 (5.1%) | 134 (2.3%) |
| 60 to 89 Minutes | 234 (3.5%) | 171 (2.9%) |
| 90 or more Minutes | 173 (2.6%) | 50 (0.9%) |
Time of Departure to Work by Sex in Obion County
The most frequent times of departure to work in Obion County are 6:30 AM to 6:59 AM (1,149, 17.1%) for males and 7:00 AM to 7:29 AM (1,170, 19.8%) for females.
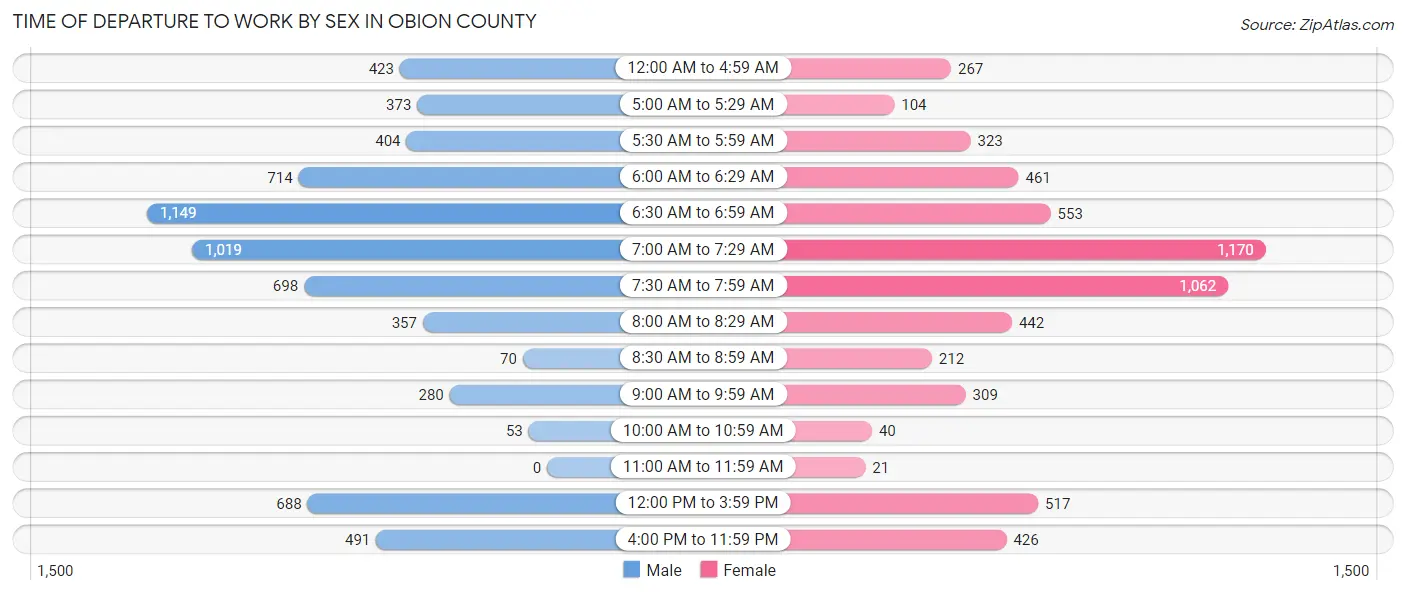
| Time of Departure | Male | Female |
| 12:00 AM to 4:59 AM | 423 (6.3%) | 267 (4.5%) |
| 5:00 AM to 5:29 AM | 373 (5.6%) | 104 (1.8%) |
| 5:30 AM to 5:59 AM | 404 (6.0%) | 323 (5.5%) |
| 6:00 AM to 6:29 AM | 714 (10.6%) | 461 (7.8%) |
| 6:30 AM to 6:59 AM | 1,149 (17.1%) | 553 (9.4%) |
| 7:00 AM to 7:29 AM | 1,019 (15.2%) | 1,170 (19.8%) |
| 7:30 AM to 7:59 AM | 698 (10.4%) | 1,062 (18.0%) |
| 8:00 AM to 8:29 AM | 357 (5.3%) | 442 (7.5%) |
| 8:30 AM to 8:59 AM | 70 (1.0%) | 212 (3.6%) |
| 9:00 AM to 9:59 AM | 280 (4.2%) | 309 (5.2%) |
| 10:00 AM to 10:59 AM | 53 (0.8%) | 40 (0.7%) |
| 11:00 AM to 11:59 AM | 0 (0.0%) | 21 (0.4%) |
| 12:00 PM to 3:59 PM | 688 (10.2%) | 517 (8.7%) |
| 4:00 PM to 11:59 PM | 491 (7.3%) | 426 (7.2%) |
| Total | 6,719 (100.0%) | 5,907 (100.0%) |
Housing Occupancy in Obion County
Occupancy by Ownership in Obion County
Of the total 12,542 dwellings in Obion County, owner-occupied units account for 8,239 (65.7%), while renter-occupied units make up 4,303 (34.3%).
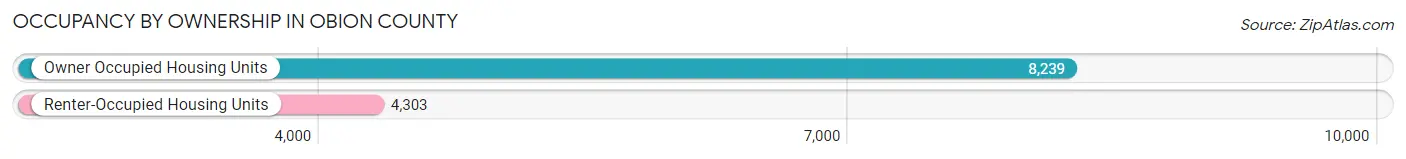
| Occupancy | # Housing Units | % Housing Units |
| Owner Occupied Housing Units | 8,239 | 65.7% |
| Renter-Occupied Housing Units | 4,303 | 34.3% |
| Total Occupied Housing Units | 12,542 | 100.0% |
Occupancy by Household Size in Obion County
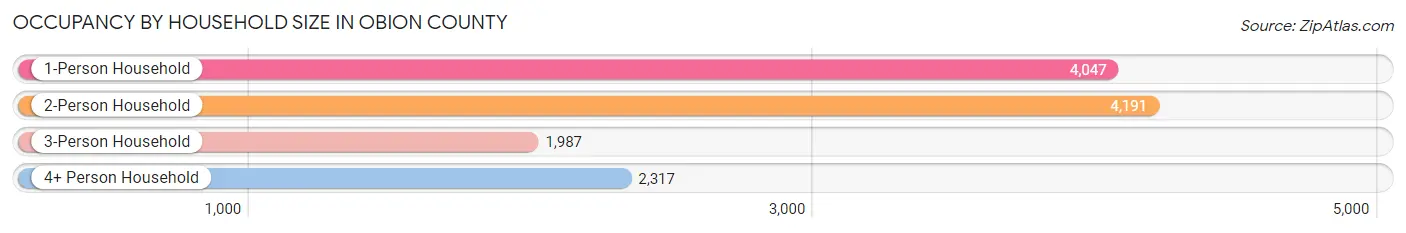
| Household Size | # Housing Units | % Housing Units |
| 1-Person Household | 4,047 | 32.3% |
| 2-Person Household | 4,191 | 33.4% |
| 3-Person Household | 1,987 | 15.8% |
| 4+ Person Household | 2,317 | 18.5% |
| Total Housing Units | 12,542 | 100.0% |
Occupancy by Ownership by Household Size in Obion County
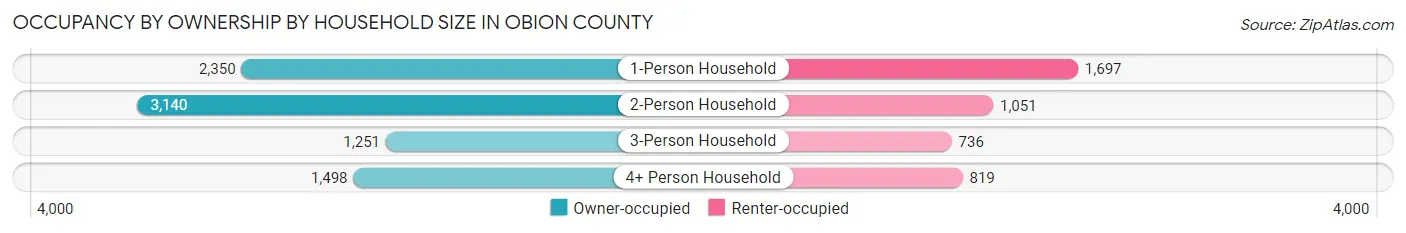
| Household Size | Owner-occupied | Renter-occupied |
| 1-Person Household | 2,350 (58.1%) | 1,697 (41.9%) |
| 2-Person Household | 3,140 (74.9%) | 1,051 (25.1%) |
| 3-Person Household | 1,251 (63.0%) | 736 (37.0%) |
| 4+ Person Household | 1,498 (64.6%) | 819 (35.3%) |
| Total Housing Units | 8,239 (65.7%) | 4,303 (34.3%) |
Occupancy by Educational Attainment in Obion County
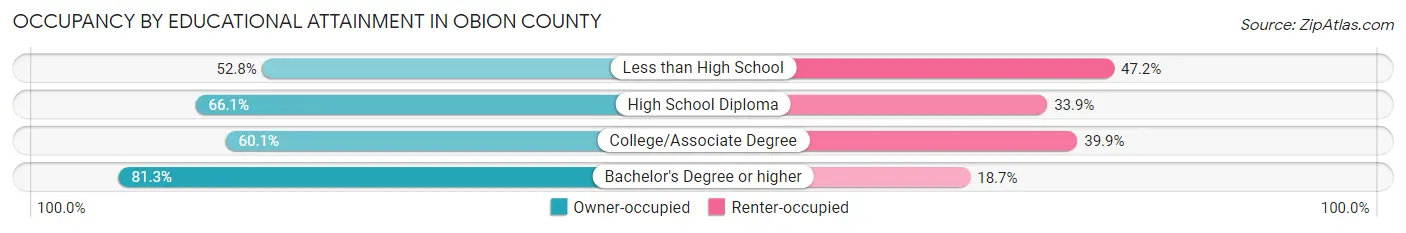
| Household Size | Owner-occupied | Renter-occupied |
| Less than High School | 811 (52.8%) | 724 (47.2%) |
| High School Diploma | 3,420 (66.1%) | 1,755 (33.9%) |
| College/Associate Degree | 2,086 (60.1%) | 1,383 (39.9%) |
| Bachelor's Degree or higher | 1,922 (81.3%) | 441 (18.7%) |
Occupancy by Age of Householder in Obion County
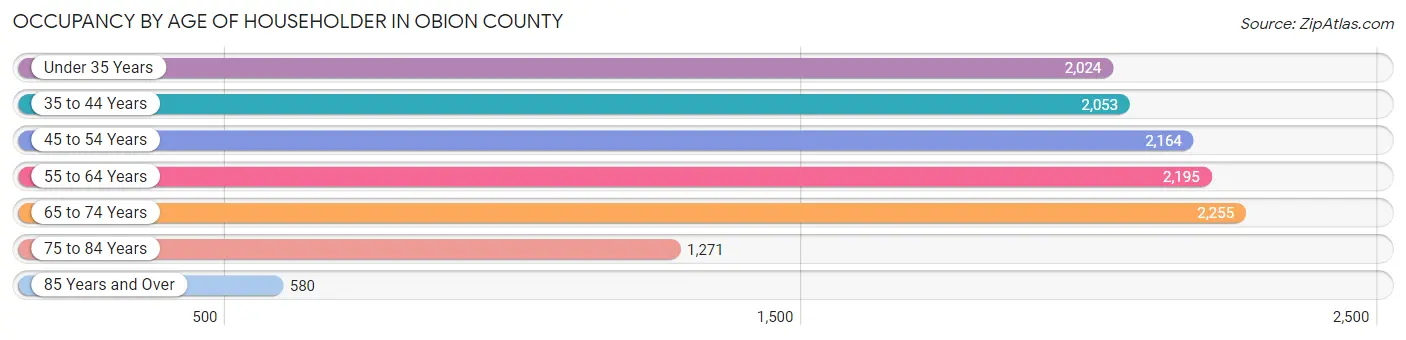
| Age Bracket | # Households | % Households |
| Under 35 Years | 2,024 | 16.1% |
| 35 to 44 Years | 2,053 | 16.4% |
| 45 to 54 Years | 2,164 | 17.2% |
| 55 to 64 Years | 2,195 | 17.5% |
| 65 to 74 Years | 2,255 | 18.0% |
| 75 to 84 Years | 1,271 | 10.1% |
| 85 Years and Over | 580 | 4.6% |
| Total | 12,542 | 100.0% |
Housing Finances in Obion County
Median Income by Occupancy in Obion County
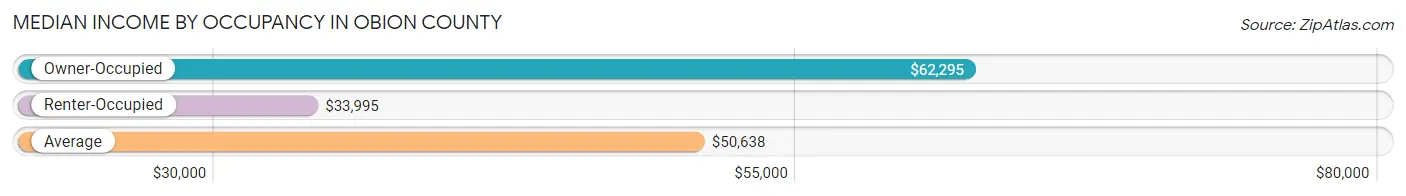
| Occupancy Type | # Households | Median Income |
| Owner-Occupied | 8,239 (65.7%) | $62,295 |
| Renter-Occupied | 4,303 (34.3%) | $33,995 |
| Average | 12,542 (100.0%) | $50,638 |
Occupancy by Householder Income Bracket in Obion County
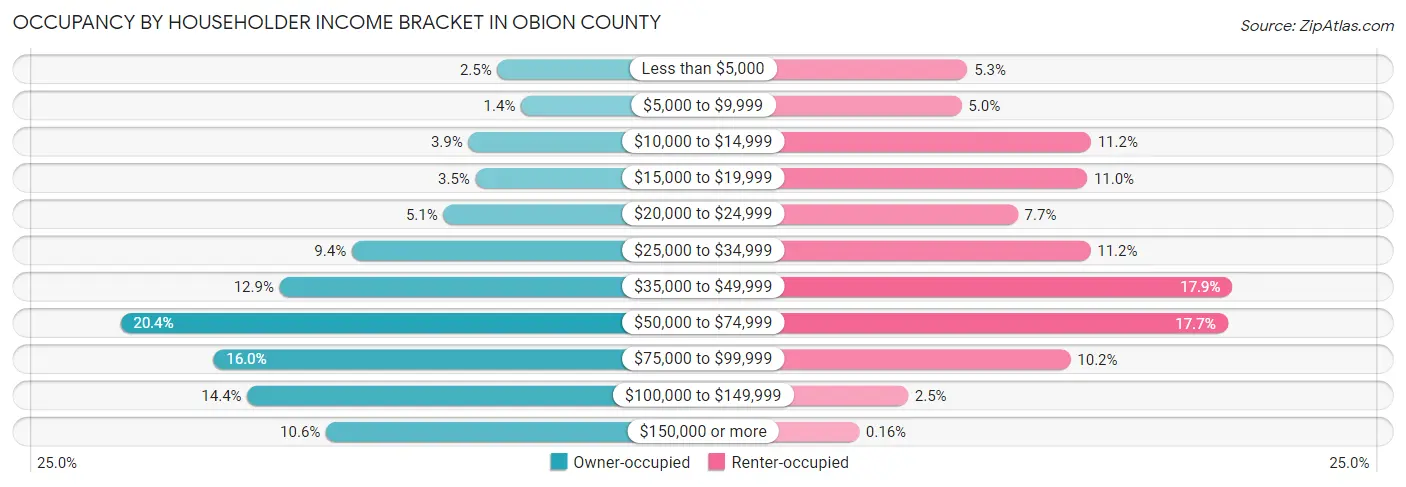
| Income Bracket | Owner-occupied | Renter-occupied |
| Less than $5,000 | 204 (2.5%) | 229 (5.3%) |
| $5,000 to $9,999 | 111 (1.3%) | 217 (5.0%) |
| $10,000 to $14,999 | 318 (3.9%) | 482 (11.2%) |
| $15,000 to $19,999 | 290 (3.5%) | 474 (11.0%) |
| $20,000 to $24,999 | 416 (5.1%) | 332 (7.7%) |
| $25,000 to $34,999 | 775 (9.4%) | 481 (11.2%) |
| $35,000 to $49,999 | 1,059 (12.9%) | 772 (17.9%) |
| $50,000 to $74,999 | 1,684 (20.4%) | 762 (17.7%) |
| $75,000 to $99,999 | 1,319 (16.0%) | 440 (10.2%) |
| $100,000 to $149,999 | 1,186 (14.4%) | 107 (2.5%) |
| $150,000 or more | 877 (10.6%) | 7 (0.2%) |
| Total | 8,239 (100.0%) | 4,303 (100.0%) |
Monthly Housing Cost Tiers in Obion County
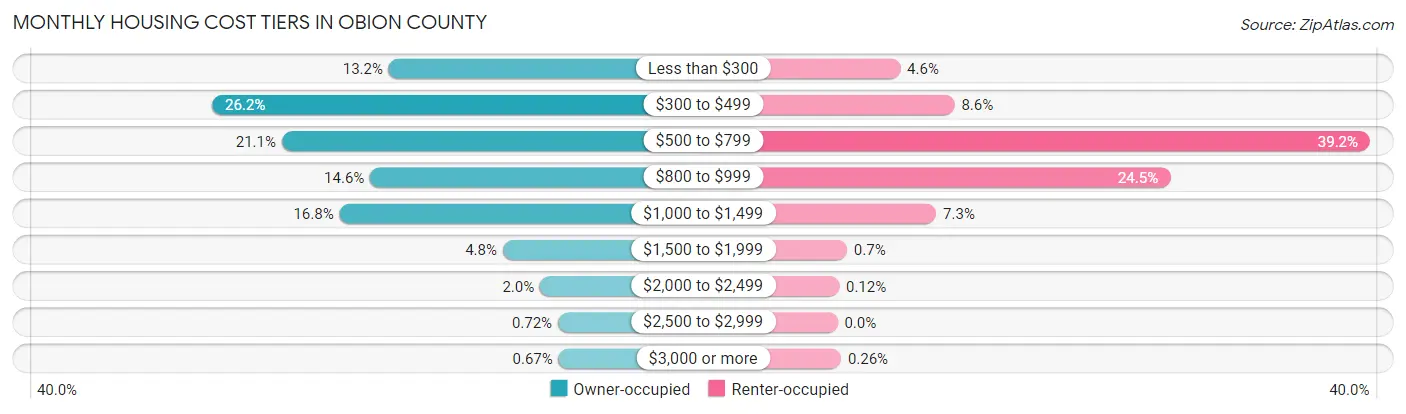
| Monthly Cost | Owner-occupied | Renter-occupied |
| Less than $300 | 1,086 (13.2%) | 199 (4.6%) |
| $300 to $499 | 2,158 (26.2%) | 371 (8.6%) |
| $500 to $799 | 1,735 (21.1%) | 1,687 (39.2%) |
| $800 to $999 | 1,199 (14.5%) | 1,054 (24.5%) |
| $1,000 to $1,499 | 1,385 (16.8%) | 313 (7.3%) |
| $1,500 to $1,999 | 394 (4.8%) | 30 (0.7%) |
| $2,000 to $2,499 | 168 (2.0%) | 5 (0.1%) |
| $2,500 to $2,999 | 59 (0.7%) | 0 (0.0%) |
| $3,000 or more | 55 (0.7%) | 11 (0.3%) |
| Total | 8,239 (100.0%) | 4,303 (100.0%) |
Physical Housing Characteristics in Obion County
Housing Structures in Obion County
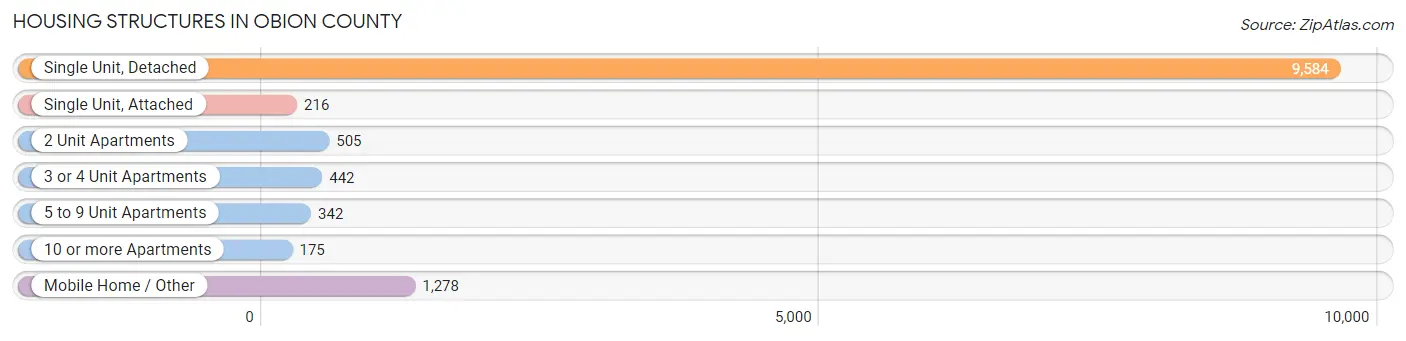
| Structure Type | # Housing Units | % Housing Units |
| Single Unit, Detached | 9,584 | 76.4% |
| Single Unit, Attached | 216 | 1.7% |
| 2 Unit Apartments | 505 | 4.0% |
| 3 or 4 Unit Apartments | 442 | 3.5% |
| 5 to 9 Unit Apartments | 342 | 2.7% |
| 10 or more Apartments | 175 | 1.4% |
| Mobile Home / Other | 1,278 | 10.2% |
| Total | 12,542 | 100.0% |
Housing Structures by Occupancy in Obion County
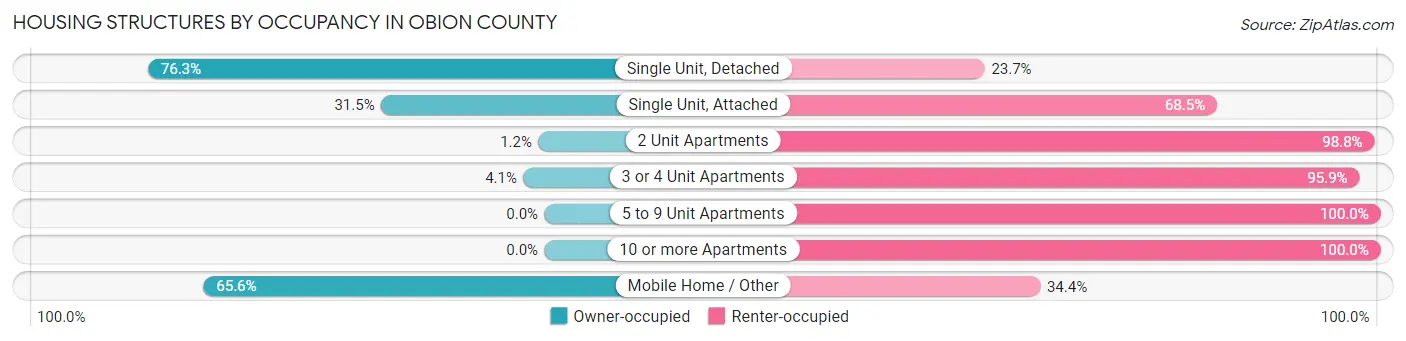
| Structure Type | Owner-occupied | Renter-occupied |
| Single Unit, Detached | 7,309 (76.3%) | 2,275 (23.7%) |
| Single Unit, Attached | 68 (31.5%) | 148 (68.5%) |
| 2 Unit Apartments | 6 (1.2%) | 499 (98.8%) |
| 3 or 4 Unit Apartments | 18 (4.1%) | 424 (95.9%) |
| 5 to 9 Unit Apartments | 0 (0.0%) | 342 (100.0%) |
| 10 or more Apartments | 0 (0.0%) | 175 (100.0%) |
| Mobile Home / Other | 838 (65.6%) | 440 (34.4%) |
| Total | 8,239 (65.7%) | 4,303 (34.3%) |
Housing Structures by Number of Rooms in Obion County
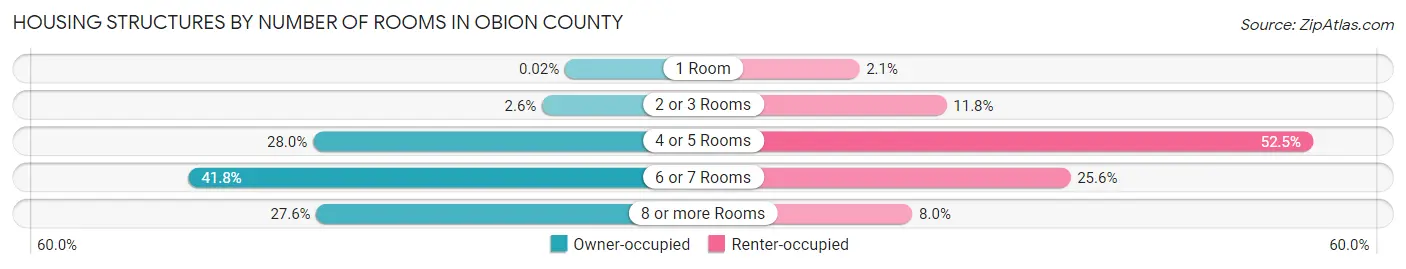
| Number of Rooms | Owner-occupied | Renter-occupied |
| 1 Room | 2 (0.0%) | 92 (2.1%) |
| 2 or 3 Rooms | 211 (2.6%) | 508 (11.8%) |
| 4 or 5 Rooms | 2,306 (28.0%) | 2,258 (52.5%) |
| 6 or 7 Rooms | 3,445 (41.8%) | 1,100 (25.6%) |
| 8 or more Rooms | 2,275 (27.6%) | 345 (8.0%) |
| Total | 8,239 (100.0%) | 4,303 (100.0%) |
Housing Structure by Heating Type in Obion County
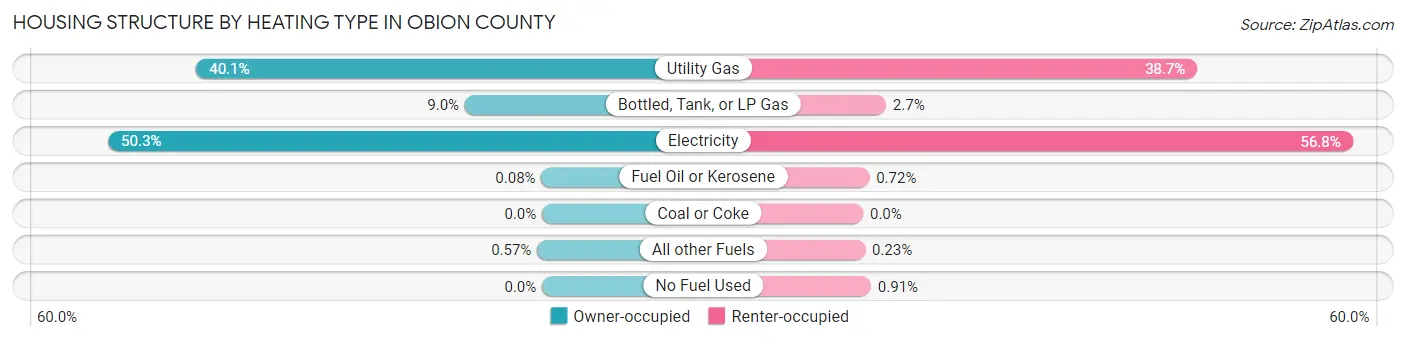
| Heating Type | Owner-occupied | Renter-occupied |
| Utility Gas | 3,303 (40.1%) | 1,667 (38.7%) |
| Bottled, Tank, or LP Gas | 737 (8.9%) | 114 (2.6%) |
| Electricity | 4,145 (50.3%) | 2,442 (56.8%) |
| Fuel Oil or Kerosene | 7 (0.1%) | 31 (0.7%) |
| Coal or Coke | 0 (0.0%) | 0 (0.0%) |
| All other Fuels | 47 (0.6%) | 10 (0.2%) |
| No Fuel Used | 0 (0.0%) | 39 (0.9%) |
| Total | 8,239 (100.0%) | 4,303 (100.0%) |
Household Vehicle Usage in Obion County
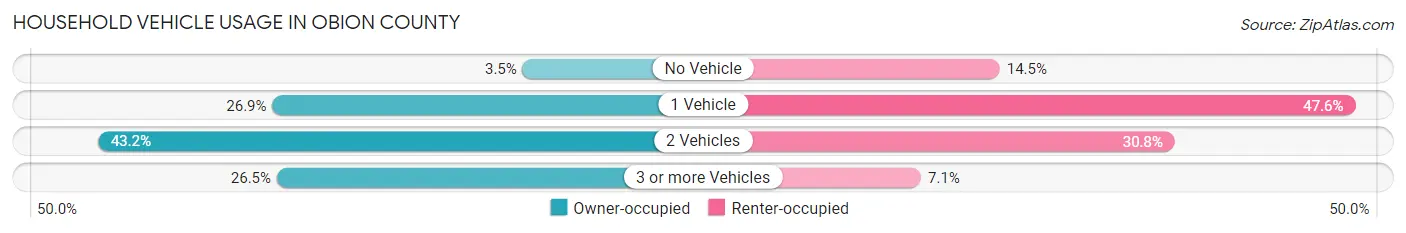
| Vehicles per Household | Owner-occupied | Renter-occupied |
| No Vehicle | 289 (3.5%) | 622 (14.5%) |
| 1 Vehicle | 2,214 (26.9%) | 2,050 (47.6%) |
| 2 Vehicles | 3,557 (43.2%) | 1,325 (30.8%) |
| 3 or more Vehicles | 2,179 (26.5%) | 306 (7.1%) |
| Total | 8,239 (100.0%) | 4,303 (100.0%) |
Real Estate & Mortgages in Obion County
Real Estate and Mortgage Overview in Obion County
| Characteristic | Without Mortgage | With Mortgage |
| Housing Units | 4,192 | 4,047 |
| Median Property Value | $103,600 | $132,200 |
| Median Household Income | $47,681 | $638 |
| Monthly Housing Costs | $389 | $55 |
| Real Estate Taxes | $661 | $61 |
Property Value by Mortgage Status in Obion County
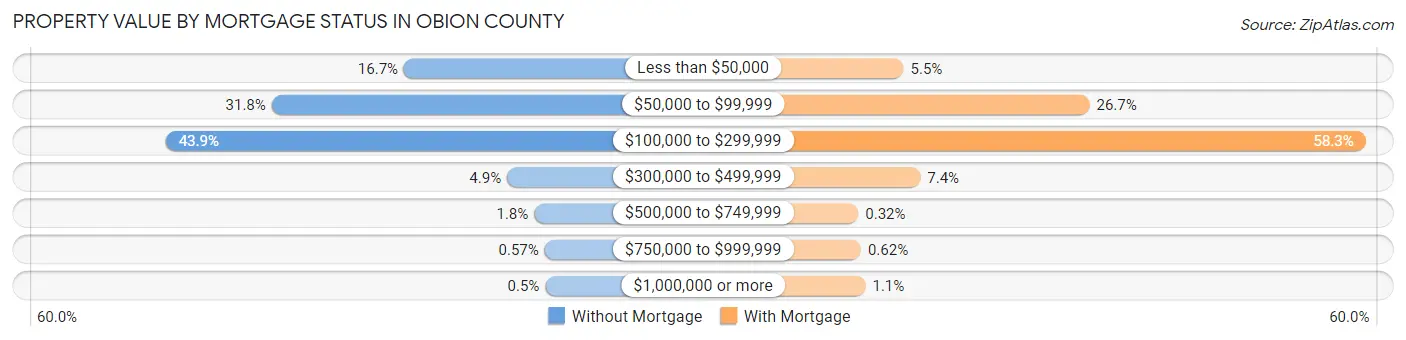
| Property Value | Without Mortgage | With Mortgage |
| Less than $50,000 | 698 (16.7%) | 222 (5.5%) |
| $50,000 to $99,999 | 1,332 (31.8%) | 1,082 (26.7%) |
| $100,000 to $299,999 | 1,839 (43.9%) | 2,359 (58.3%) |
| $300,000 to $499,999 | 204 (4.9%) | 300 (7.4%) |
| $500,000 to $749,999 | 74 (1.8%) | 13 (0.3%) |
| $750,000 to $999,999 | 24 (0.6%) | 25 (0.6%) |
| $1,000,000 or more | 21 (0.5%) | 46 (1.1%) |
| Total | 4,192 (100.0%) | 4,047 (100.0%) |
Household Income by Mortgage Status in Obion County
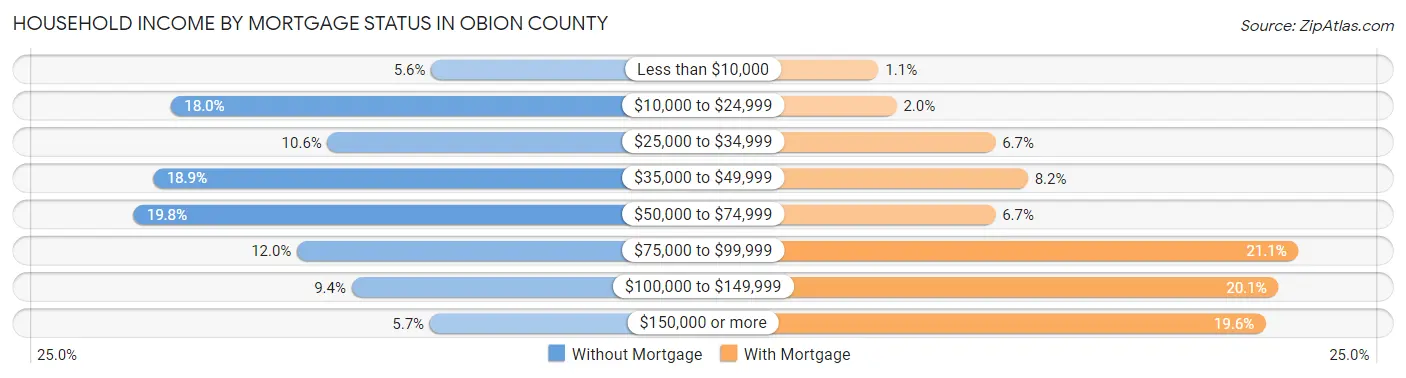
| Household Income | Without Mortgage | With Mortgage |
| Less than $10,000 | 236 (5.6%) | 44 (1.1%) |
| $10,000 to $24,999 | 755 (18.0%) | 79 (1.9%) |
| $25,000 to $34,999 | 443 (10.6%) | 269 (6.7%) |
| $35,000 to $49,999 | 790 (18.9%) | 332 (8.2%) |
| $50,000 to $74,999 | 830 (19.8%) | 269 (6.7%) |
| $75,000 to $99,999 | 504 (12.0%) | 854 (21.1%) |
| $100,000 to $149,999 | 395 (9.4%) | 815 (20.1%) |
| $150,000 or more | 239 (5.7%) | 791 (19.6%) |
| Total | 4,192 (100.0%) | 4,047 (100.0%) |
Property Value to Household Income Ratio in Obion County
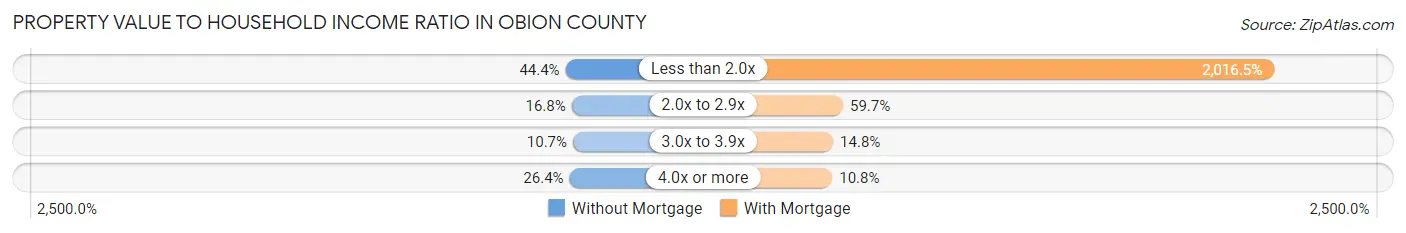
| Value-to-Income Ratio | Without Mortgage | With Mortgage |
| Less than 2.0x | 1,859 (44.4%) | 81,607 (2,016.5%) |
| 2.0x to 2.9x | 703 (16.8%) | 2,417 (59.7%) |
| 3.0x to 3.9x | 450 (10.7%) | 598 (14.8%) |
| 4.0x or more | 1,106 (26.4%) | 437 (10.8%) |
| Total | 4,192 (100.0%) | 4,047 (100.0%) |
Real Estate Taxes by Mortgage Status in Obion County
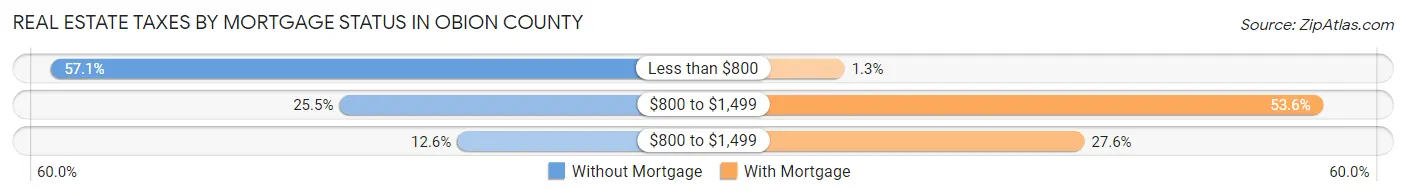
| Property Taxes | Without Mortgage | With Mortgage |
| Less than $800 | 2,393 (57.1%) | 52 (1.3%) |
| $800 to $1,499 | 1,070 (25.5%) | 2,171 (53.6%) |
| $800 to $1,499 | 528 (12.6%) | 1,115 (27.6%) |
| Total | 4,192 (100.0%) | 4,047 (100.0%) |
Health & Disability in Obion County
Health Insurance Coverage by Age in Obion County
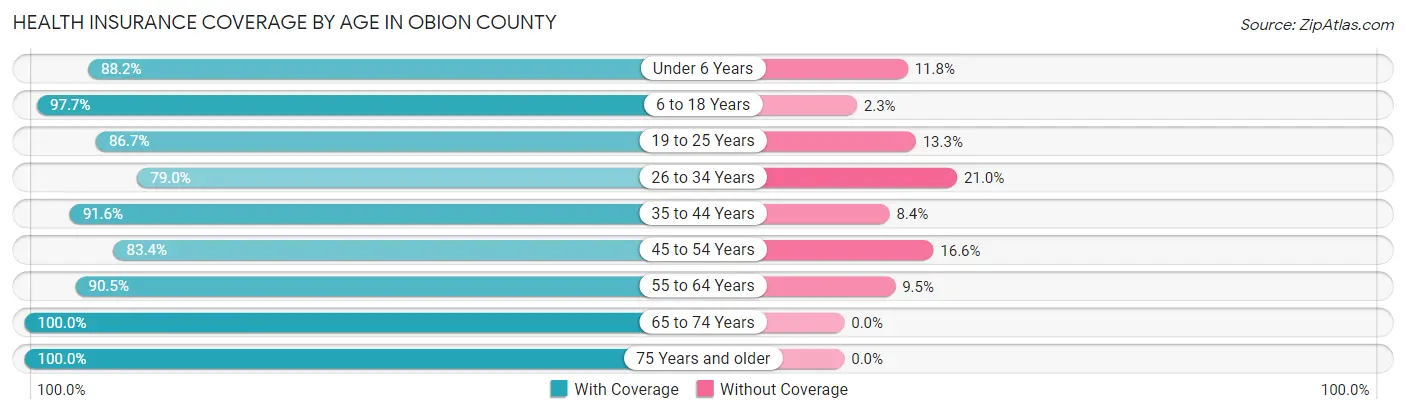
| Age Bracket | With Coverage | Without Coverage |
| Under 6 Years | 1,744 (88.2%) | 234 (11.8%) |
| 6 to 18 Years | 5,050 (97.7%) | 121 (2.3%) |
| 19 to 25 Years | 1,789 (86.7%) | 275 (13.3%) |
| 26 to 34 Years | 2,563 (79.0%) | 683 (21.0%) |
| 35 to 44 Years | 3,438 (91.6%) | 316 (8.4%) |
| 45 to 54 Years | 3,152 (83.4%) | 628 (16.6%) |
| 55 to 64 Years | 3,822 (90.5%) | 401 (9.5%) |
| 65 to 74 Years | 3,628 (100.0%) | 0 (0.0%) |
| 75 Years and older | 2,461 (100.0%) | 0 (0.0%) |
| Total | 27,647 (91.2%) | 2,658 (8.8%) |
Health Insurance Coverage by Citizenship Status in Obion County
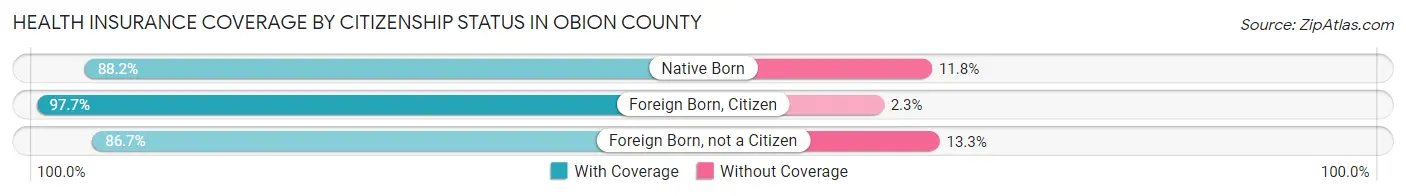
| Citizenship Status | With Coverage | Without Coverage |
| Native Born | 1,744 (88.2%) | 234 (11.8%) |
| Foreign Born, Citizen | 5,050 (97.7%) | 121 (2.3%) |
| Foreign Born, not a Citizen | 1,789 (86.7%) | 275 (13.3%) |
Health Insurance Coverage by Household Income in Obion County
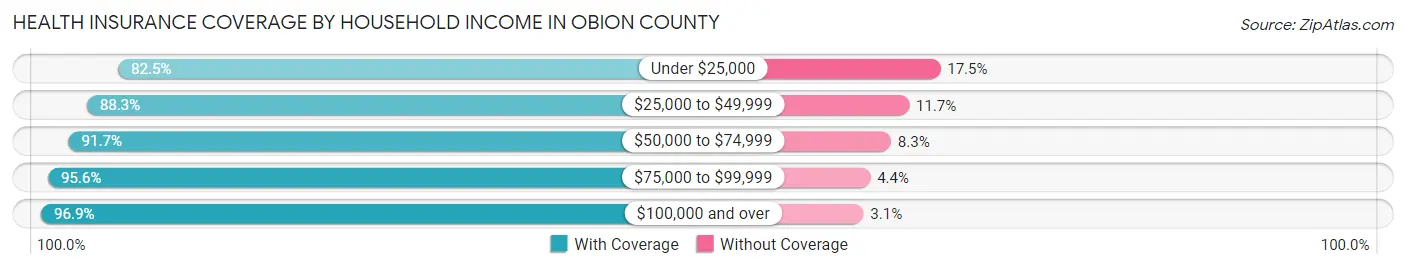
| Household Income | With Coverage | Without Coverage |
| Under $25,000 | 4,420 (82.5%) | 938 (17.5%) |
| $25,000 to $49,999 | 5,888 (88.3%) | 778 (11.7%) |
| $50,000 to $74,999 | 5,419 (91.7%) | 488 (8.3%) |
| $75,000 to $99,999 | 4,966 (95.6%) | 228 (4.4%) |
| $100,000 and over | 6,896 (96.9%) | 221 (3.1%) |
Public vs Private Health Insurance Coverage by Age in Obion County
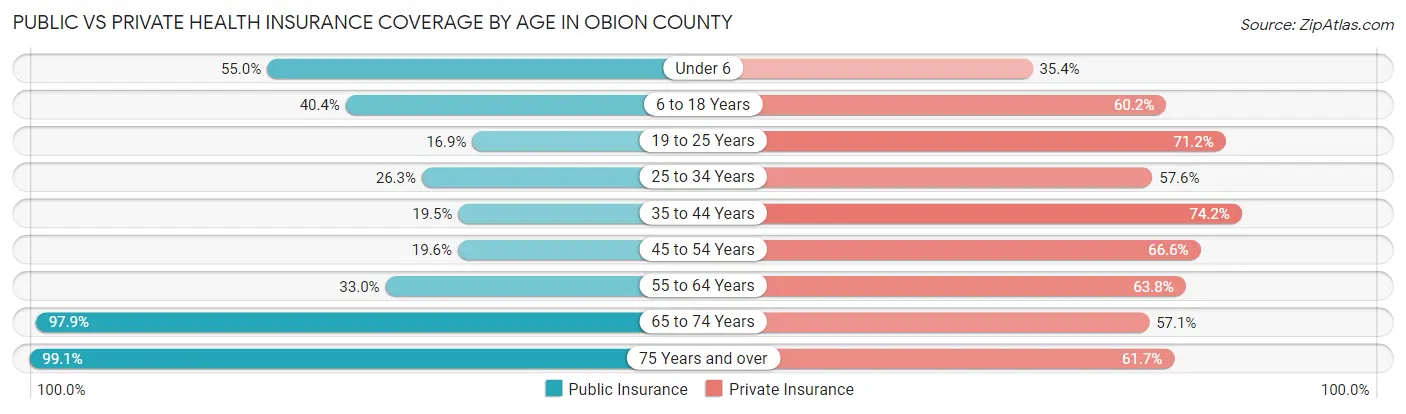
| Age Bracket | Public Insurance | Private Insurance |
| Under 6 | 1,088 (55.0%) | 700 (35.4%) |
| 6 to 18 Years | 2,089 (40.4%) | 3,113 (60.2%) |
| 19 to 25 Years | 349 (16.9%) | 1,470 (71.2%) |
| 25 to 34 Years | 853 (26.3%) | 1,871 (57.6%) |
| 35 to 44 Years | 732 (19.5%) | 2,786 (74.2%) |
| 45 to 54 Years | 740 (19.6%) | 2,516 (66.6%) |
| 55 to 64 Years | 1,395 (33.0%) | 2,694 (63.8%) |
| 65 to 74 Years | 3,553 (97.9%) | 2,070 (57.1%) |
| 75 Years and over | 2,439 (99.1%) | 1,518 (61.7%) |
| Total | 13,238 (43.7%) | 18,738 (61.8%) |
Disability Status by Sex by Age in Obion County
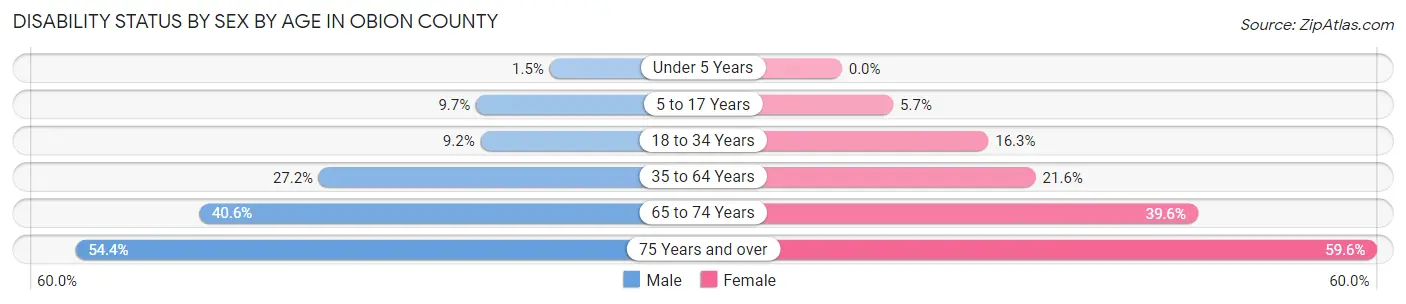
| Age Bracket | Male | Female |
| Under 5 Years | 12 (1.5%) | 0 (0.0%) |
| 5 to 17 Years | 249 (9.7%) | 140 (5.7%) |
| 18 to 34 Years | 262 (9.2%) | 477 (16.3%) |
| 35 to 64 Years | 1,584 (27.2%) | 1,282 (21.6%) |
| 65 to 74 Years | 687 (40.6%) | 767 (39.6%) |
| 75 Years and over | 574 (54.4%) | 838 (59.6%) |
Disability Class by Sex by Age in Obion County
Disability Class: Hearing Difficulty
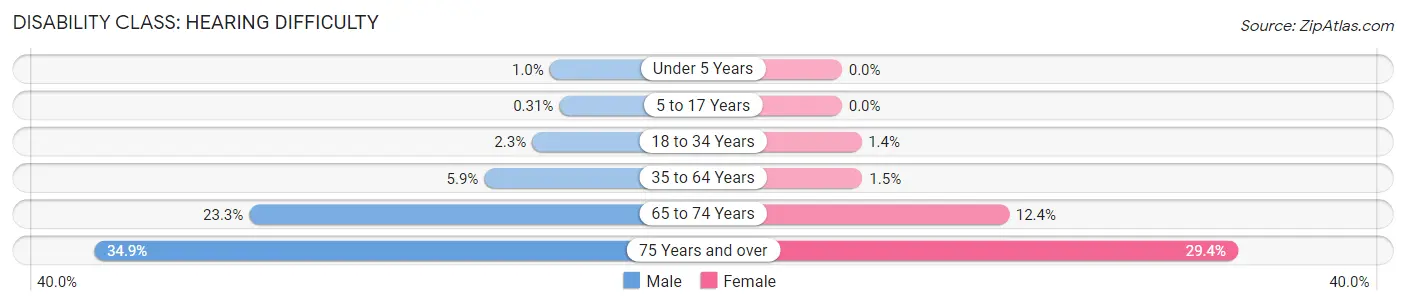
| Age Bracket | Male | Female |
| Under 5 Years | 8 (1.0%) | 0 (0.0%) |
| 5 to 17 Years | 8 (0.3%) | 0 (0.0%) |
| 18 to 34 Years | 66 (2.3%) | 42 (1.4%) |
| 35 to 64 Years | 342 (5.9%) | 91 (1.5%) |
| 65 to 74 Years | 395 (23.3%) | 240 (12.4%) |
| 75 Years and over | 368 (34.8%) | 413 (29.4%) |
Disability Class: Vision Difficulty
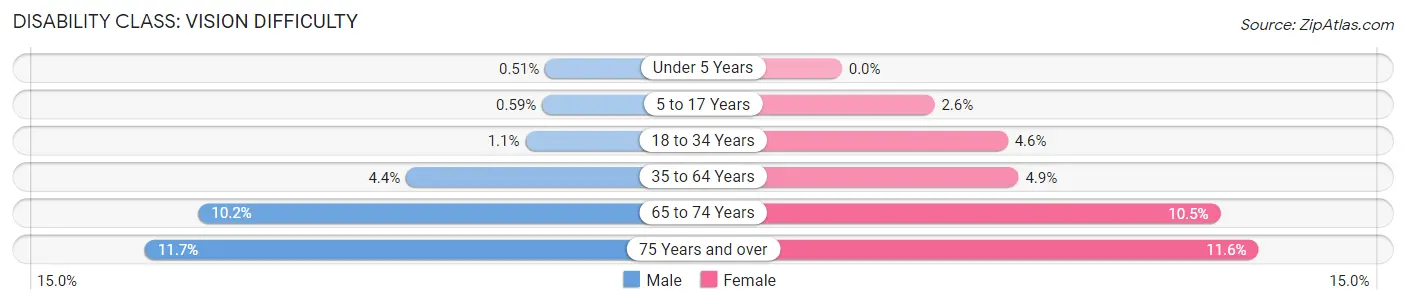
| Age Bracket | Male | Female |
| Under 5 Years | 4 (0.5%) | 0 (0.0%) |
| 5 to 17 Years | 15 (0.6%) | 63 (2.6%) |
| 18 to 34 Years | 30 (1.1%) | 135 (4.6%) |
| 35 to 64 Years | 255 (4.4%) | 292 (4.9%) |
| 65 to 74 Years | 172 (10.2%) | 204 (10.5%) |
| 75 Years and over | 123 (11.7%) | 163 (11.6%) |
Disability Class: Cognitive Difficulty
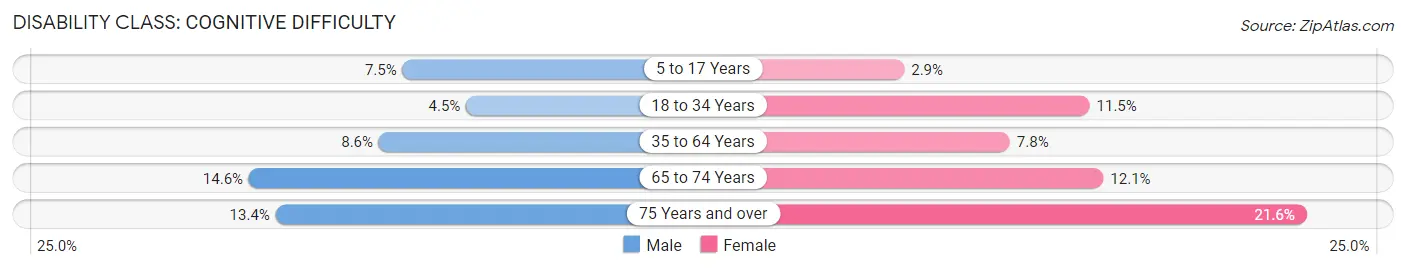
| Age Bracket | Male | Female |
| 5 to 17 Years | 191 (7.5%) | 71 (2.9%) |
| 18 to 34 Years | 128 (4.5%) | 336 (11.5%) |
| 35 to 64 Years | 498 (8.6%) | 463 (7.8%) |
| 65 to 74 Years | 247 (14.6%) | 235 (12.1%) |
| 75 Years and over | 141 (13.4%) | 303 (21.6%) |
Disability Class: Ambulatory Difficulty
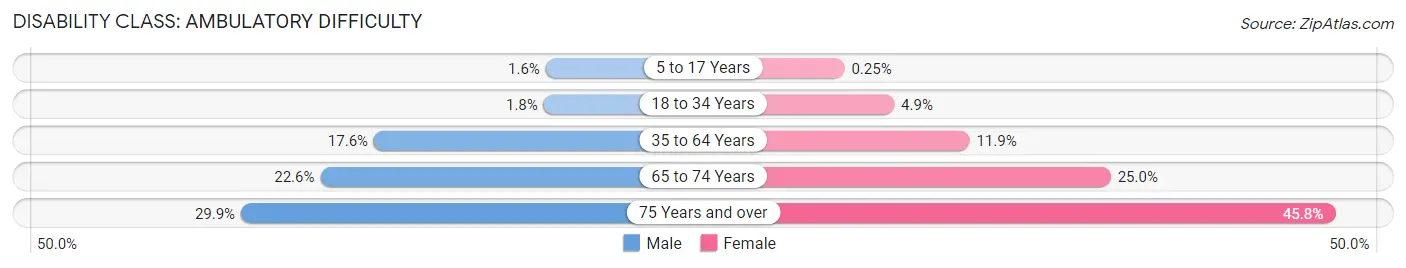
| Age Bracket | Male | Female |
| 5 to 17 Years | 42 (1.6%) | 6 (0.3%) |
| 18 to 34 Years | 52 (1.8%) | 142 (4.9%) |
| 35 to 64 Years | 1,023 (17.6%) | 704 (11.9%) |
| 65 to 74 Years | 382 (22.6%) | 483 (25.0%) |
| 75 Years and over | 316 (29.9%) | 643 (45.8%) |
Disability Class: Self-Care Difficulty
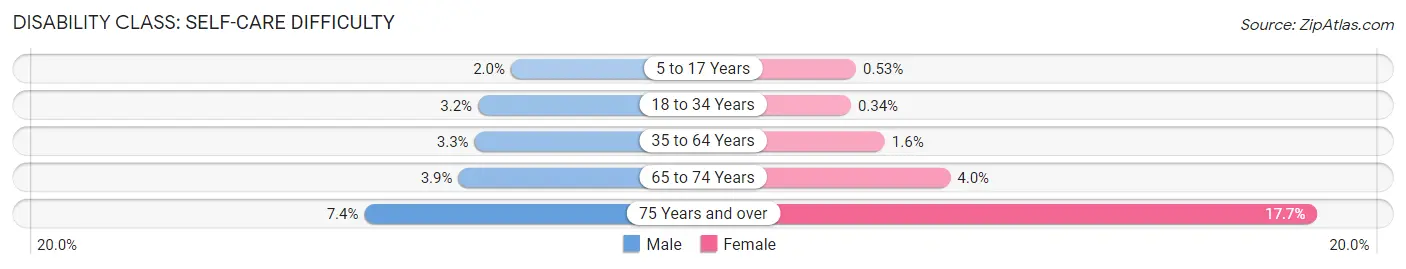
| Age Bracket | Male | Female |
| 5 to 17 Years | 50 (1.9%) | 13 (0.5%) |
| 18 to 34 Years | 90 (3.2%) | 10 (0.3%) |
| 35 to 64 Years | 192 (3.3%) | 95 (1.6%) |
| 65 to 74 Years | 66 (3.9%) | 78 (4.0%) |
| 75 Years and over | 78 (7.4%) | 248 (17.6%) |
Technology Access in Obion County
Computing Device Access in Obion County
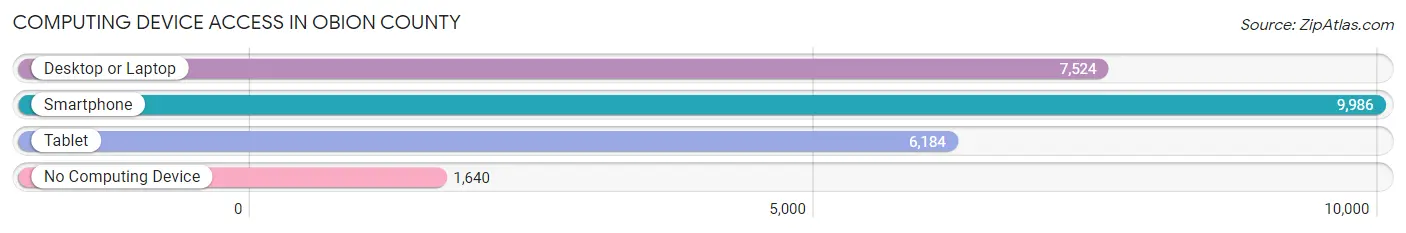
| Device Type | # Households | % Households |
| Desktop or Laptop | 7,524 | 60.0% |
| Smartphone | 9,986 | 79.6% |
| Tablet | 6,184 | 49.3% |
| No Computing Device | 1,640 | 13.1% |
| Total | 12,542 | 100.0% |
Internet Access in Obion County
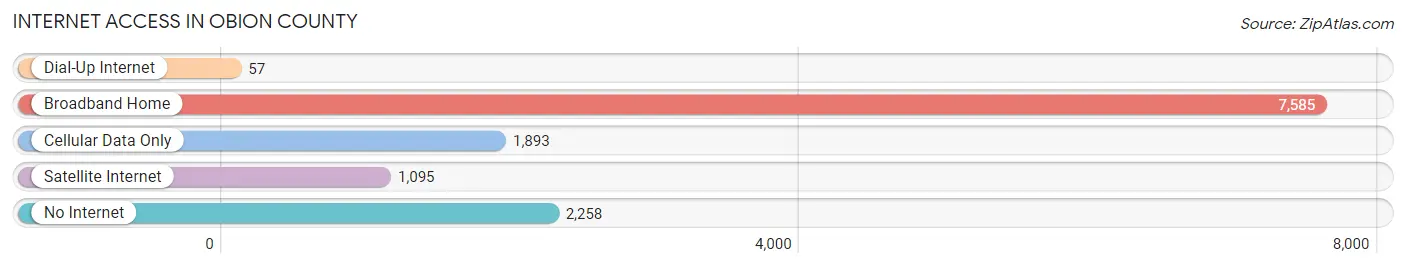
| Internet Type | # Households | % Households |
| Dial-Up Internet | 57 | 0.4% |
| Broadband Home | 7,585 | 60.5% |
| Cellular Data Only | 1,893 | 15.1% |
| Satellite Internet | 1,095 | 8.7% |
| No Internet | 2,258 | 18.0% |
| Total | 12,542 | 100.0% |
Obion County Summary
Obion County is located in the northwest corner of Tennessee, and is part of the Jackson Purchase region. It is bordered by Kentucky to the north, Lake County to the east, Weakley County to the south, and Fulton County to the west. The county seat is Union City, and the largest city is South Fulton. The county was established in 1823 and named for the Obion River, which flows through the county.
Geography
Obion County covers an area of 545 square miles, of which 543 square miles is land and 2 square miles is water. The county is located in the western part of the state, and is part of the Jackson Purchase region. The Obion River flows through the county, and is the main source of water for the area. The county is mostly flat, with some rolling hills in the northern part. The highest point in the county is located in the northwest corner, at an elevation of 590 feet.
The climate of Obion County is humid subtropical, with hot, humid summers and mild winters. The average annual temperature is around 62°F, and the average annual precipitation is around 45 inches.
Demographics
As of the 2010 census, there were 31,807 people, 12,717 households, and 8,845 families living in the county. The population density was 58.5 people per square mile. The racial makeup of the county was 87.3% White, 9.7% African American, 0.3% Native American, 0.4% Asian, 0.1% Pacific Islander, 1.2% from other races, and 1.1% from two or more races. Hispanic or Latino of any race were 2.7% of the population.
The median income for a household in the county was $35,945, and the median income for a family was $43,945. The per capita income for the county was $18,845. About 17.3% of the population was below the poverty line.
Economy
The economy of Obion County is largely based on agriculture and manufacturing. The county is home to several large farms, and the main crops grown are corn, soybeans, and cotton. The county is also home to several manufacturing companies, including a Tyson Foods poultry processing plant, a Goodyear Tire and Rubber plant, and a Whirlpool appliance manufacturing plant.
The county is also home to several tourist attractions, including the Obion County Museum, the Discovery Park of America, and the Reelfoot Lake State Park. The county is also home to several colleges and universities, including the University of Tennessee at Martin and the University of Memphis.
Conclusion
Obion County is located in the northwest corner of Tennessee, and is part of the Jackson Purchase region. It is bordered by Kentucky to the north, Lake County to the east, Weakley County to the south, and Fulton County to the west. The county has a humid subtropical climate, with hot, humid summers and mild winters. As of the 2010 census, the population was 31,807. The economy of the county is largely based on agriculture and manufacturing, and the county is also home to several tourist attractions and colleges and universities.
Common Questions
What is the Total Population of Obion County?
Total Population of Obion County is 30,670.
What is the Total Male Population of Obion County?
Total Male Population of Obion County is 14,956.
What is the Total Female Population of Obion County?
Total Female Population of Obion County is 15,714.
What is the Ratio of Males per 100 Females in Obion County?
There are 95.18 Males per 100 Females in Obion County.
What is the Ratio of Females per 100 Males in Obion County?
There are 105.07 Females per 100 Males in Obion County.
What is the Median Population Age in Obion County?
Median Population Age in Obion County is 42.3 Years.
What is the Average Family Size in Obion County
Average Family Size in Obion County is 3.1 People.
What is the Average Household Size in Obion County
Average Household Size in Obion County is 2.4 People.
What is Per Capita Income in Obion County?
Per Capita income in Obion County is $28,782.
What is the Median Family Income in Obion County?
Median Family Income in Obion County is $66,073.
What is the Median Household income in Obion County?
Median Household Income in Obion County is $50,638.
What is Income or Wage Gap in Obion County?
Income or Wage Gap in Obion County is 23.9%.
Women in Obion County earn 76.1 cents for every dollar earned by a man.
What is Family Income Deficit in Obion County?
Family Income Deficit in Obion County is $13,195.
Families that are below poverty line in Obion County earn $13,195 less on average than the poverty threshold level.
What is Inequality or Gini Index in Obion County?
Inequality or Gini Index in Obion County is 0.47.
How Large is the Labor Force in Obion County?
There are 14,081 People in the Labor Forcein in Obion County.
What is the Percentage of People in the Labor Force in Obion County?
57.0% of People are in the Labor Force in Obion County.
What is the Unemployment Rate in Obion County?
Unemployment Rate in Obion County is 5.0%.