Morgan County, TN
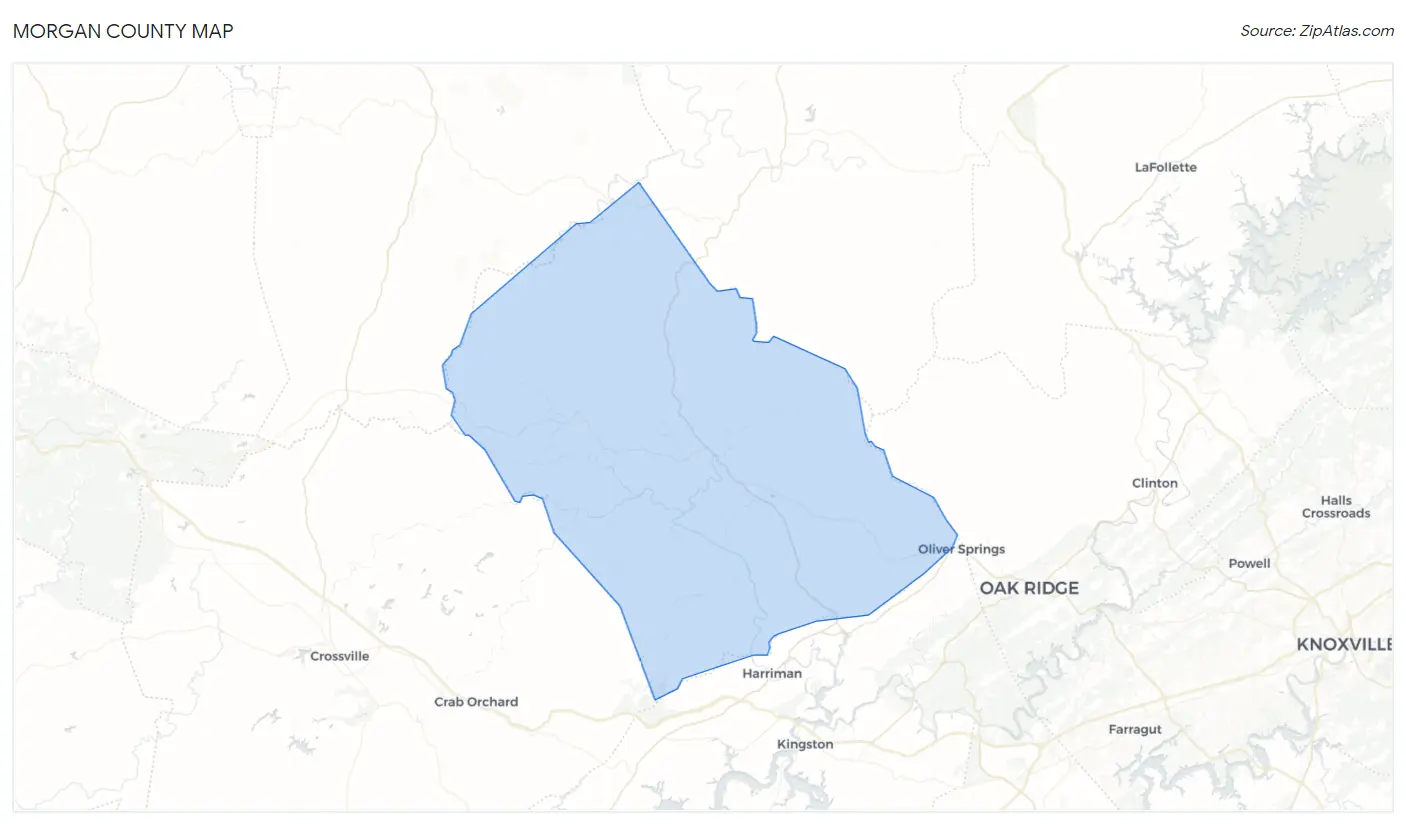
Morgan County Map
Morgan County Overview
21,124
TOTAL POPULATION
11,580
MALE POPULATION
9,544
FEMALE POPULATION
121.33
MALES / 100 FEMALES
82.42
FEMALES / 100 MALES
41.6
MEDIAN AGE
3.2
AVG FAMILY SIZE
2.7
AVG HOUSEHOLD SIZE
$27,320
PER CAPITA INCOME
$66,363
AVG FAMILY INCOME
$51,971
AVG HOUSEHOLD INCOME
39.2%
WAGE / INCOME GAP [ % ]
60.8¢/ $1
WAGE / INCOME GAP [ $ ]
$10,260
FAMILY INCOME DEFICIT
0.47
INEQUALITY / GINI INDEX
8,017
LABOR FORCE [ PEOPLE ]
45.7%
PERCENT IN LABOR FORCE
8.4%
UNEMPLOYMENT RATE
Morgan County Area Codes
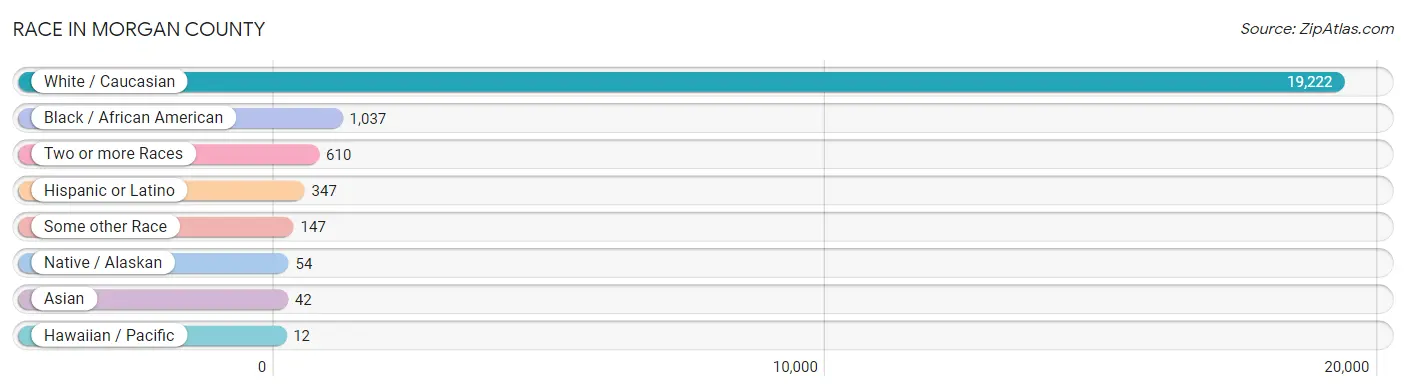
Race in Morgan County
The most populous races in Morgan County are White / Caucasian (19,222 | 91.0%), Black / African American (1,037 | 4.9%), and Two or more Races (610 | 2.9%).
| Race | # Population | % Population |
| Asian | 42 | 0.2% |
| Black / African American | 1,037 | 4.9% |
| Hawaiian / Pacific | 12 | 0.1% |
| Hispanic or Latino | 347 | 1.6% |
| Native / Alaskan | 54 | 0.3% |
| White / Caucasian | 19,222 | 91.0% |
| Two or more Races | 610 | 2.9% |
| Some other Race | 147 | 0.7% |
| Total | 21,124 | 100.0% |
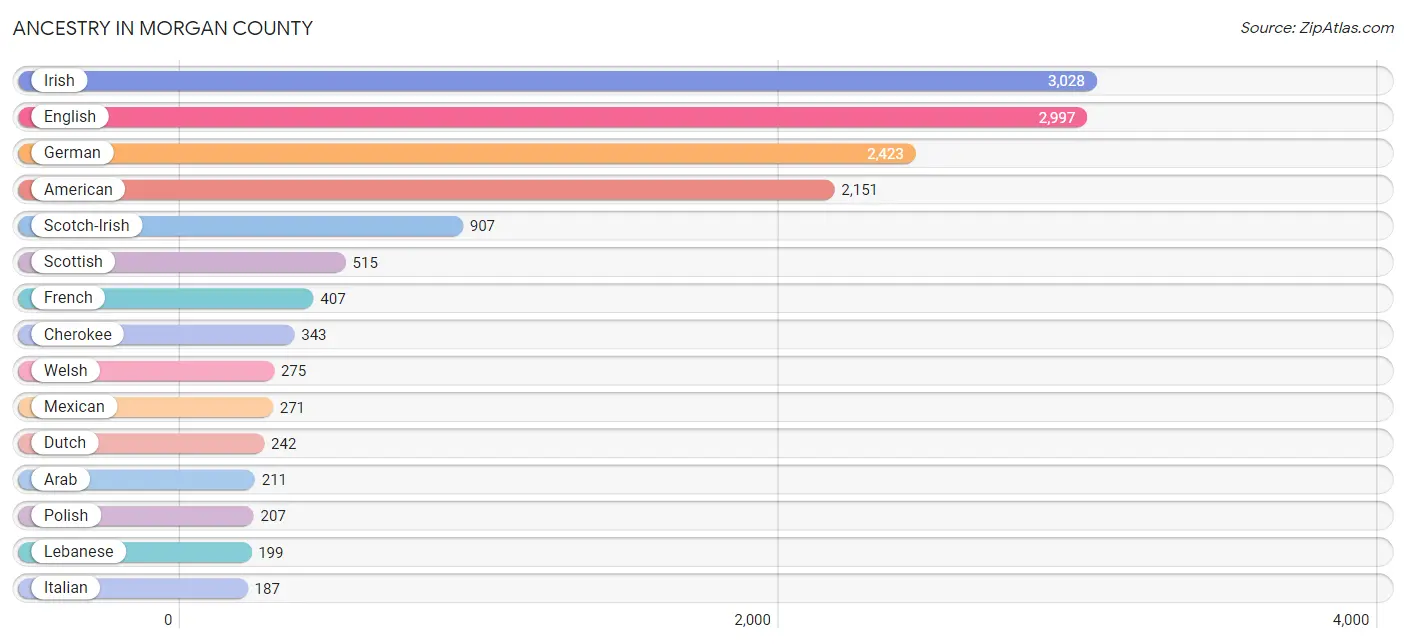
Ancestry in Morgan County
The most populous ancestries reported in Morgan County are Irish (3,028 | 14.3%), English (2,997 | 14.2%), German (2,423 | 11.5%), American (2,151 | 10.2%), and Scotch-Irish (907 | 4.3%), together accounting for 54.5% of all Morgan County residents.
| Ancestry | # Population | % Population |
| African | 9 | 0.0% |
| Albanian | 145 | 0.7% |
| American | 2,151 | 10.2% |
| Apache | 3 | 0.0% |
| Arab | 211 | 1.0% |
| Bhutanese | 8 | 0.0% |
| Brazilian | 5 | 0.0% |
| British | 68 | 0.3% |
| Burmese | 11 | 0.1% |
| Canadian | 12 | 0.1% |
| Central American | 7 | 0.0% |
| Cherokee | 343 | 1.6% |
| Cheyenne | 22 | 0.1% |
| Chickasaw | 8 | 0.0% |
| Choctaw | 5 | 0.0% |
| Costa Rican | 1 | 0.0% |
| Creek | 25 | 0.1% |
| Cuban | 2 | 0.0% |
| Czech | 39 | 0.2% |
| Dominican | 23 | 0.1% |
| Dutch | 242 | 1.1% |
| Dutch West Indian | 1 | 0.0% |
| Eastern European | 16 | 0.1% |
| English | 2,997 | 14.2% |
| European | 130 | 0.6% |
| Finnish | 12 | 0.1% |
| French | 407 | 1.9% |
| French American Indian | 9 | 0.0% |
| French Canadian | 72 | 0.3% |
| German | 2,423 | 11.5% |
| Greek | 28 | 0.1% |
| Indian (Asian) | 8 | 0.0% |
| Irish | 3,028 | 14.3% |
| Italian | 187 | 0.9% |
| Jamaican | 5 | 0.0% |
| Korean | 15 | 0.1% |
| Lebanese | 199 | 0.9% |
| Malaysian | 17 | 0.1% |
| Mexican | 271 | 1.3% |
| Moroccan | 12 | 0.1% |
| Native Hawaiian | 12 | 0.1% |
| Nigerian | 12 | 0.1% |
| Norwegian | 7 | 0.0% |
| Panamanian | 1 | 0.0% |
| Pennsylvania German | 155 | 0.7% |
| Polish | 207 | 1.0% |
| Portuguese | 14 | 0.1% |
| Puerto Rican | 28 | 0.1% |
| Russian | 56 | 0.3% |
| Scandinavian | 1 | 0.0% |
| Scotch-Irish | 907 | 4.3% |
| Scottish | 515 | 2.4% |
| Seminole | 22 | 0.1% |
| Shoshone | 3 | 0.0% |
| Sioux | 45 | 0.2% |
| Slavic | 4 | 0.0% |
| Slovak | 9 | 0.0% |
| Subsaharan African | 21 | 0.1% |
| Swiss | 56 | 0.3% |
| Thai | 6 | 0.0% |
| Ukrainian | 11 | 0.1% |
| Welsh | 275 | 1.3% | View All 62 Rows |
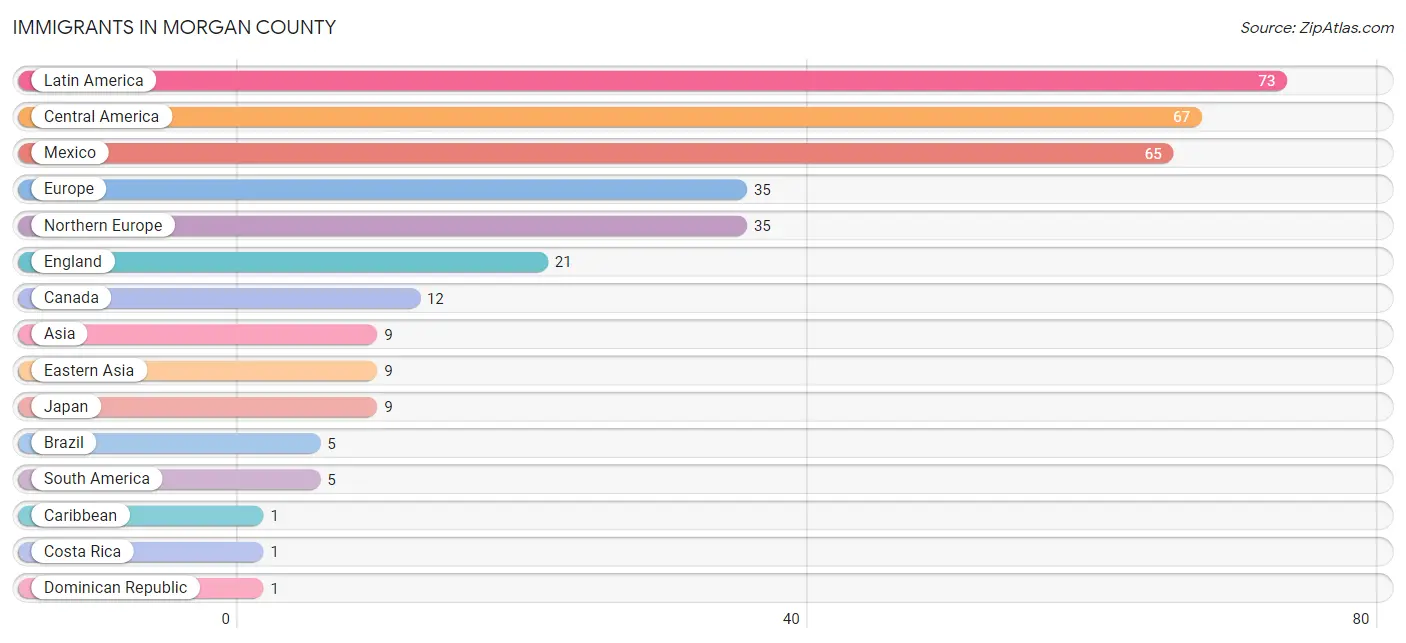
Immigrants in Morgan County
The most numerous immigrant groups reported in Morgan County came from Latin America (73 | 0.4%), Central America (67 | 0.3%), Mexico (65 | 0.3%), Europe (35 | 0.2%), and Northern Europe (35 | 0.2%), together accounting for 1.3% of all Morgan County residents.
| Immigration Origin | # Population | % Population |
| Asia | 9 | 0.0% |
| Brazil | 5 | 0.0% |
| Canada | 12 | 0.1% |
| Caribbean | 1 | 0.0% |
| Central America | 67 | 0.3% |
| Costa Rica | 1 | 0.0% |
| Dominican Republic | 1 | 0.0% |
| Eastern Asia | 9 | 0.0% |
| England | 21 | 0.1% |
| Europe | 35 | 0.2% |
| Japan | 9 | 0.0% |
| Latin America | 73 | 0.4% |
| Mexico | 65 | 0.3% |
| Northern Europe | 35 | 0.2% |
| Panama | 1 | 0.0% |
| South America | 5 | 0.0% | View All 16 Rows |
Sex and Age in Morgan County
Sex and Age in Morgan County
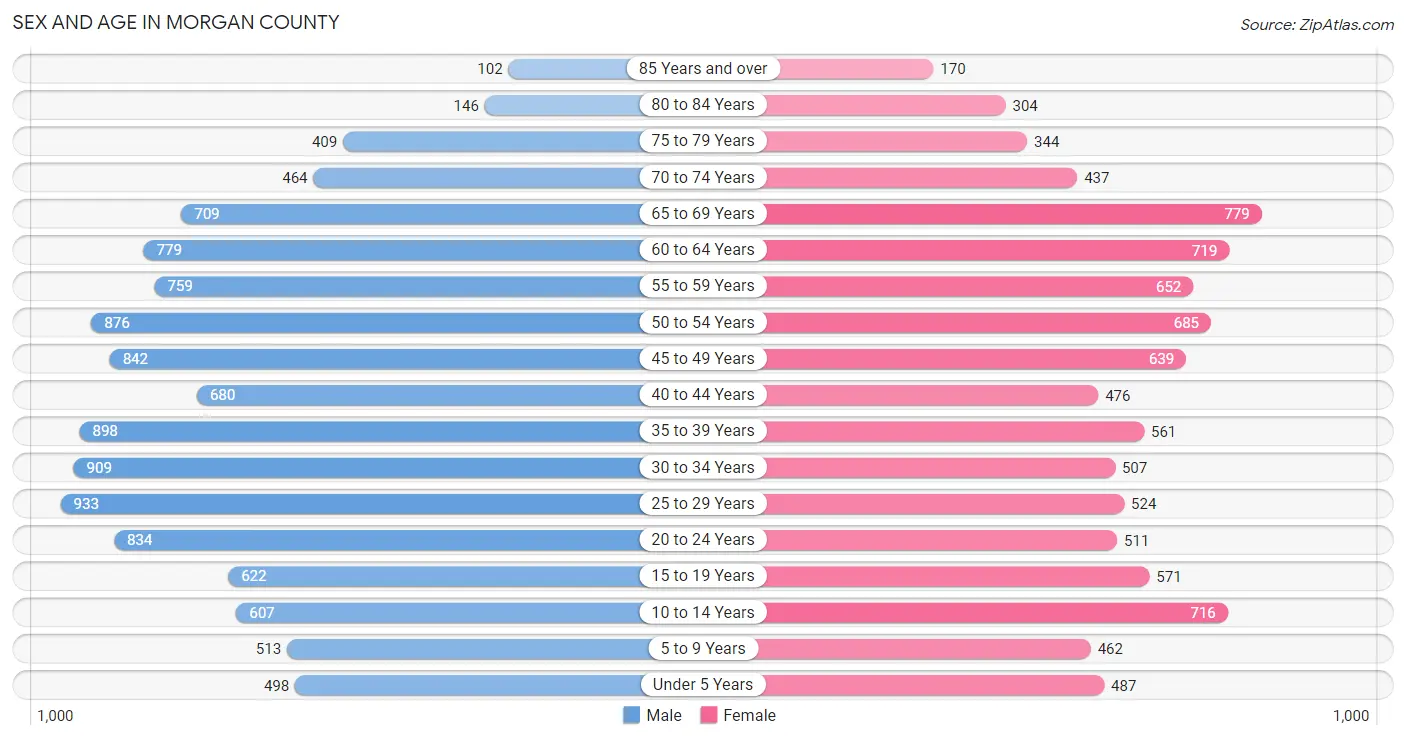
The most populous age groups in Morgan County are 25 to 29 Years (933 | 8.1%) for men and 65 to 69 Years (779 | 8.2%) for women.
| Age Bracket | Male | Female |
| Under 5 Years | 498 (4.3%) | 487 (5.1%) |
| 5 to 9 Years | 513 (4.4%) | 462 (4.8%) |
| 10 to 14 Years | 607 (5.2%) | 716 (7.5%) |
| 15 to 19 Years | 622 (5.4%) | 571 (6.0%) |
| 20 to 24 Years | 834 (7.2%) | 511 (5.3%) |
| 25 to 29 Years | 933 (8.1%) | 524 (5.5%) |
| 30 to 34 Years | 909 (7.9%) | 507 (5.3%) |
| 35 to 39 Years | 898 (7.7%) | 561 (5.9%) |
| 40 to 44 Years | 680 (5.9%) | 476 (5.0%) |
| 45 to 49 Years | 842 (7.3%) | 639 (6.7%) |
| 50 to 54 Years | 876 (7.6%) | 685 (7.2%) |
| 55 to 59 Years | 759 (6.6%) | 652 (6.8%) |
| 60 to 64 Years | 779 (6.7%) | 719 (7.5%) |
| 65 to 69 Years | 709 (6.1%) | 779 (8.2%) |
| 70 to 74 Years | 464 (4.0%) | 437 (4.6%) |
| 75 to 79 Years | 409 (3.5%) | 344 (3.6%) |
| 80 to 84 Years | 146 (1.3%) | 304 (3.2%) |
| 85 Years and over | 102 (0.9%) | 170 (1.8%) |
| Total | 11,580 (100.0%) | 9,544 (100.0%) |
Families and Households in Morgan County
Median Family Size in Morgan County
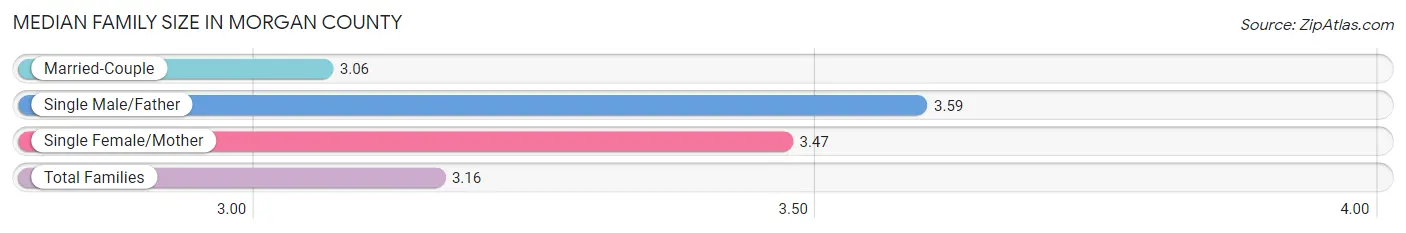
The median family size in Morgan County is 3.16 persons per family, with single male/father families (306 | 6.2%) accounting for the largest median family size of 3.59 persons per family. On the other hand, married-couple families (3,798 | 77.2%) represent the smallest median family size with 3.06 persons per family.
| Family Type | # Families | Family Size |
| Married-Couple | 3,798 (77.2%) | 3.06 |
| Single Male/Father | 306 (6.2%) | 3.59 |
| Single Female/Mother | 815 (16.6%) | 3.47 |
| Total Families | 4,919 (100.0%) | 3.16 |
Median Household Size in Morgan County
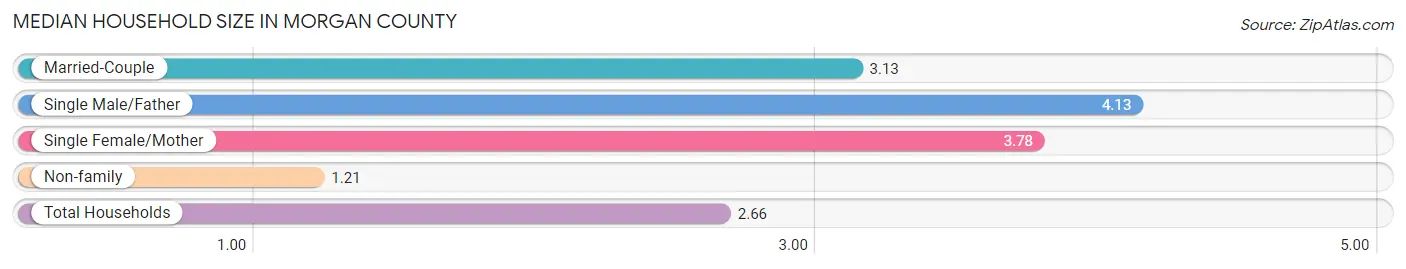
The median household size in Morgan County is 2.66 persons per household, with single male/father households (306 | 4.3%) accounting for the largest median household size of 4.13 persons per household. non-family households (2,174 | 30.6%) represent the smallest median household size with 1.21 persons per household.
| Household Type | # Households | Household Size |
| Married-Couple | 3,798 (53.5%) | 3.13 |
| Single Male/Father | 306 (4.3%) | 4.13 |
| Single Female/Mother | 815 (11.5%) | 3.78 |
| Non-family | 2,174 (30.6%) | 1.21 |
| Total Households | 7,093 (100.0%) | 2.66 |
Household Size by Marriage Status in Morgan County
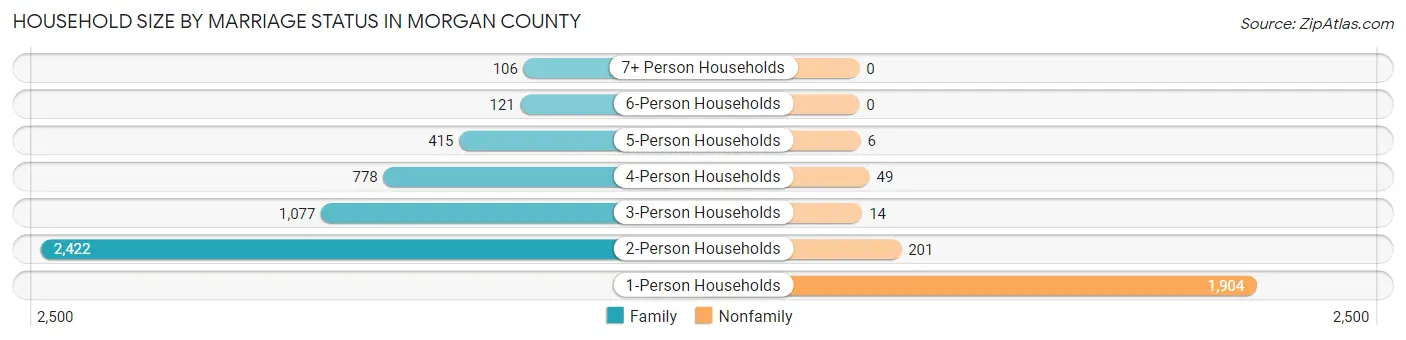
Out of a total of 7,093 households in Morgan County, 4,919 (69.4%) are family households, while 2,174 (30.6%) are nonfamily households. The most numerous type of family households are 2-person households, comprising 2,422, and the most common type of nonfamily households are 1-person households, comprising 1,904.
| Household Size | Family Households | Nonfamily Households |
| 1-Person Households | - | 1,904 (26.8%) |
| 2-Person Households | 2,422 (34.2%) | 201 (2.8%) |
| 3-Person Households | 1,077 (15.2%) | 14 (0.2%) |
| 4-Person Households | 778 (11.0%) | 49 (0.7%) |
| 5-Person Households | 415 (5.9%) | 6 (0.1%) |
| 6-Person Households | 121 (1.7%) | 0 (0.0%) |
| 7+ Person Households | 106 (1.5%) | 0 (0.0%) |
| Total | 4,919 (69.4%) | 2,174 (30.6%) |
Female Fertility in Morgan County
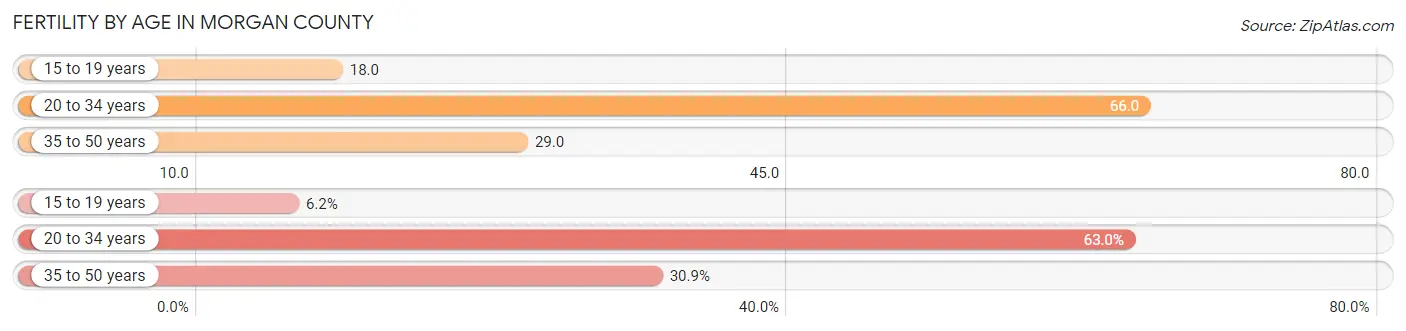
Fertility by Age in Morgan County
Average fertility rate in Morgan County is 42.0 births per 1,000 women. Women in the age bracket of 20 to 34 years have the highest fertility rate with 66.0 births per 1,000 women. Women in the age bracket of 20 to 34 years acount for 63.0% of all women with births.
| Age Bracket | Women with Births | Births / 1,000 Women |
| 15 to 19 years | 10 (6.2%) | 18.0 |
| 20 to 34 years | 102 (63.0%) | 66.0 |
| 35 to 50 years | 50 (30.9%) | 29.0 |
| Total | 162 (100.0%) | 42.0 |
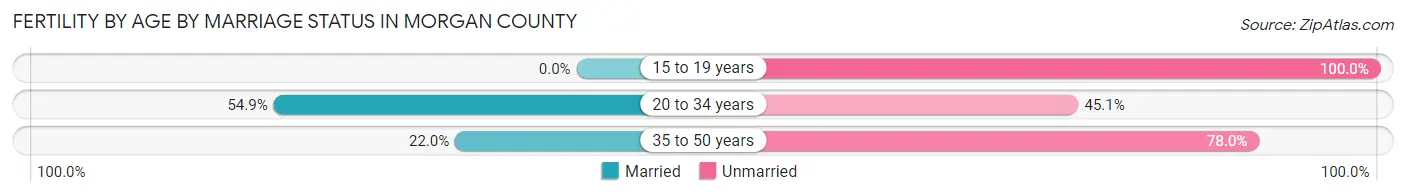
Fertility by Age by Marriage Status in Morgan County
41.4% of women with births (162) in Morgan County are married. The highest percentage of unmarried women with births falls into 15 to 19 years age bracket with 100.0% of them unmarried at the time of birth, while the lowest percentage of unmarried women with births belong to 20 to 34 years age bracket with 45.1% of them unmarried.
| Age Bracket | Married | Unmarried |
| 15 to 19 years | 0 (0.0%) | 10 (100.0%) |
| 20 to 34 years | 56 (54.9%) | 46 (45.1%) |
| 35 to 50 years | 11 (22.0%) | 39 (78.0%) |
| Total | 67 (41.4%) | 95 (58.6%) |
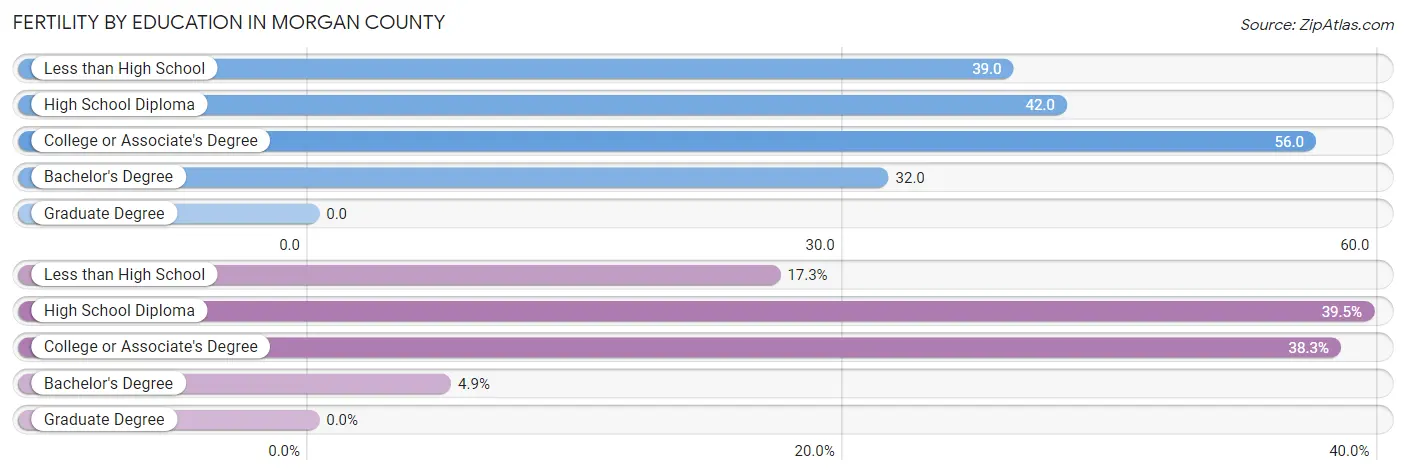
Fertility by Education in Morgan County
| Educational Attainment | Women with Births | Births / 1,000 Women |
| Less than High School | 28 (17.3%) | 39.0 |
| High School Diploma | 64 (39.5%) | 42.0 |
| College or Associate's Degree | 62 (38.3%) | 56.0 |
| Bachelor's Degree | 8 (4.9%) | 32.0 |
| Graduate Degree | 0 (0.0%) | 0.0 |
| Total | 162 (100.0%) | 42.0 |
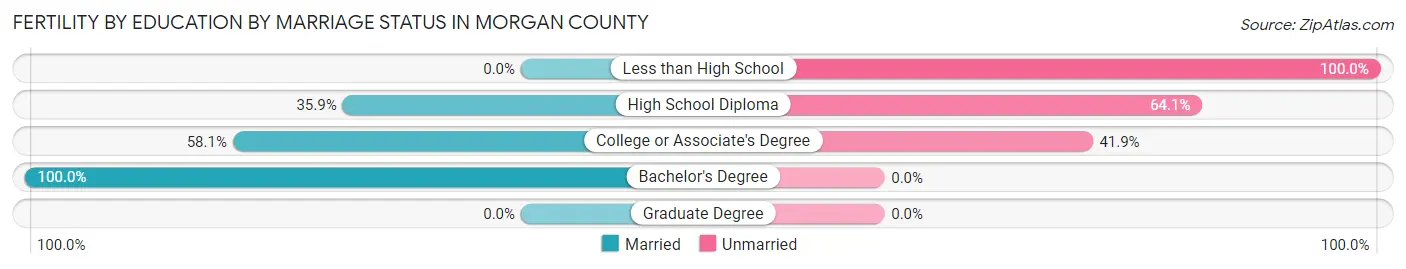
Fertility by Education by Marriage Status in Morgan County
58.6% of women with births in Morgan County are unmarried. Women with the educational attainment of bachelor's degree are most likely to be married with 100.0% of them married at childbirth, while women with the educational attainment of less than high school are least likely to be married with 100.0% of them unmarried at childbirth.
| Educational Attainment | Married | Unmarried |
| Less than High School | 0 (0.0%) | 28 (100.0%) |
| High School Diploma | 23 (35.9%) | 41 (64.1%) |
| College or Associate's Degree | 36 (58.1%) | 26 (41.9%) |
| Bachelor's Degree | 8 (100.0%) | 0 (0.0%) |
| Graduate Degree | 0 (0.0%) | 0 (0.0%) |
| Total | 67 (41.4%) | 95 (58.6%) |
Income in Morgan County
Income Overview in Morgan County
Per Capita Income in Morgan County is $27,320, while median incomes of families and households are $66,363 and $51,971 respectively.
| Characteristic | Number | Measure |
| Per Capita Income | 21,124 | $27,320 |
| Median Family Income | 4,919 | $66,363 |
| Mean Family Income | 4,919 | $86,801 |
| Median Household Income | 7,093 | $51,971 |
| Mean Household Income | 7,093 | $73,910 |
| Income Deficit | 4,919 | $10,260 |
| Wage / Income Gap (%) | 21,124 | 39.21% |
| Wage / Income Gap ($) | 21,124 | 60.79¢ per $1 |
| Gini / Inequality Index | 21,124 | 0.47 |
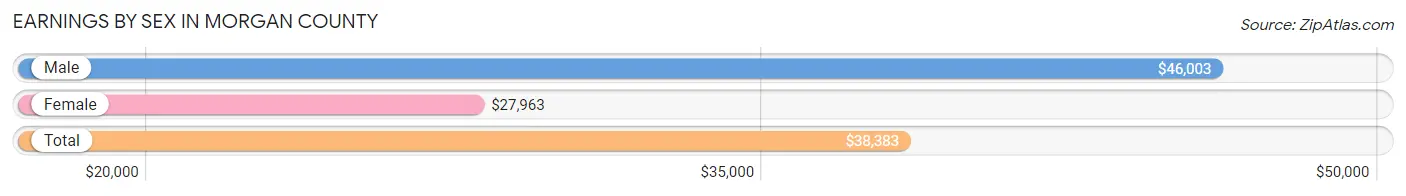
Earnings by Sex in Morgan County
Average Earnings in Morgan County are $38,383, $46,003 for men and $27,963 for women, a difference of 39.2%.
| Sex | Number | Average Earnings |
| Male | 4,900 (56.8%) | $46,003 |
| Female | 3,730 (43.2%) | $27,963 |
| Total | 8,630 (100.0%) | $38,383 |
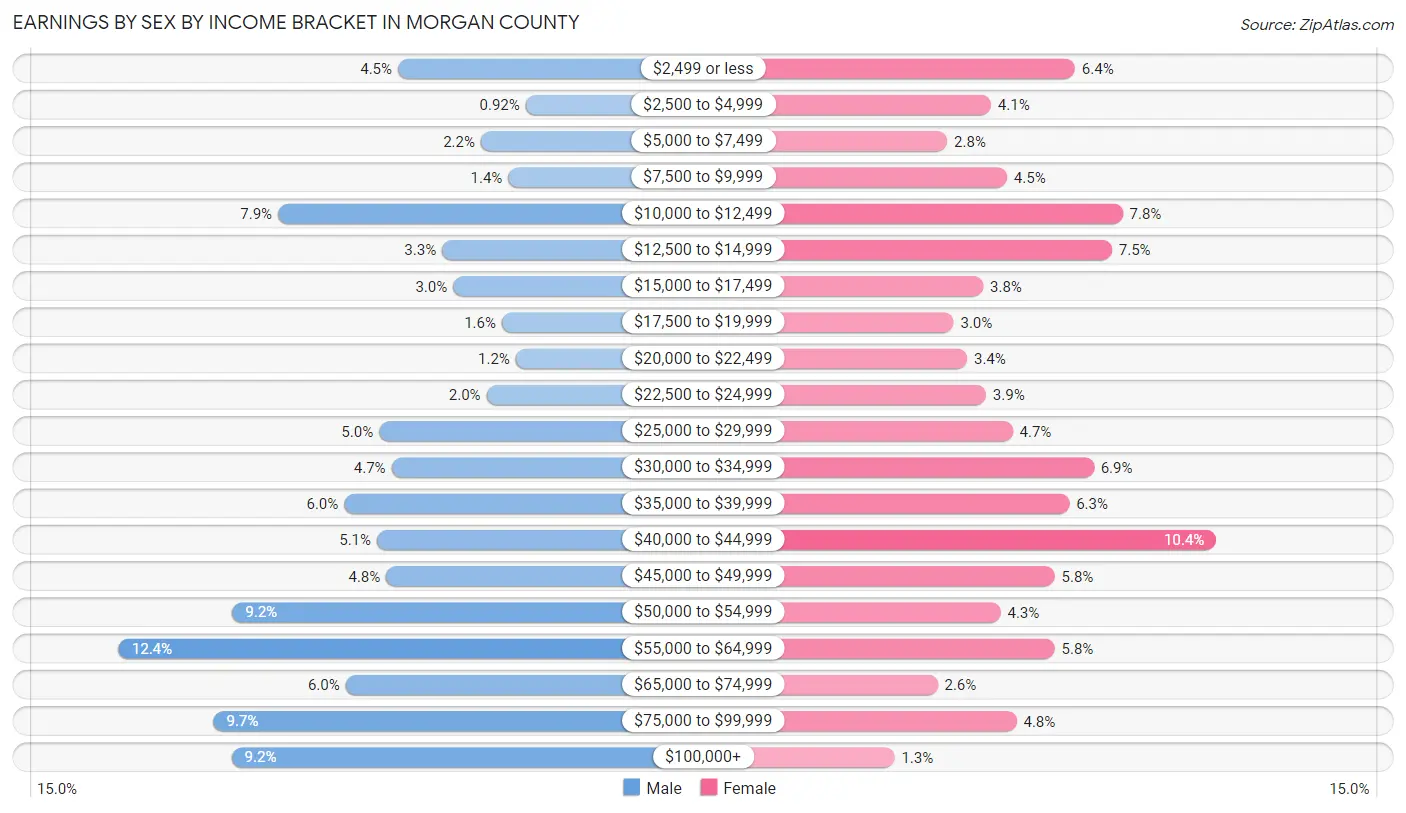
Earnings by Sex by Income Bracket in Morgan County
The most common earnings brackets in Morgan County are $55,000 to $64,999 for men (605 | 12.3%) and $40,000 to $44,999 for women (387 | 10.4%).
| Income | Male | Female |
| $2,499 or less | 221 (4.5%) | 239 (6.4%) |
| $2,500 to $4,999 | 45 (0.9%) | 151 (4.1%) |
| $5,000 to $7,499 | 107 (2.2%) | 105 (2.8%) |
| $7,500 to $9,999 | 69 (1.4%) | 168 (4.5%) |
| $10,000 to $12,499 | 386 (7.9%) | 289 (7.7%) |
| $12,500 to $14,999 | 160 (3.3%) | 278 (7.4%) |
| $15,000 to $17,499 | 145 (3.0%) | 143 (3.8%) |
| $17,500 to $19,999 | 78 (1.6%) | 112 (3.0%) |
| $20,000 to $22,499 | 59 (1.2%) | 126 (3.4%) |
| $22,500 to $24,999 | 99 (2.0%) | 146 (3.9%) |
| $25,000 to $29,999 | 247 (5.0%) | 174 (4.7%) |
| $30,000 to $34,999 | 230 (4.7%) | 259 (6.9%) |
| $35,000 to $39,999 | 295 (6.0%) | 233 (6.2%) |
| $40,000 to $44,999 | 250 (5.1%) | 387 (10.4%) |
| $45,000 to $49,999 | 237 (4.8%) | 218 (5.8%) |
| $50,000 to $54,999 | 449 (9.2%) | 161 (4.3%) |
| $55,000 to $64,999 | 605 (12.3%) | 218 (5.8%) |
| $65,000 to $74,999 | 293 (6.0%) | 95 (2.5%) |
| $75,000 to $99,999 | 475 (9.7%) | 178 (4.8%) |
| $100,000+ | 450 (9.2%) | 50 (1.3%) |
| Total | 4,900 (100.0%) | 3,730 (100.0%) |
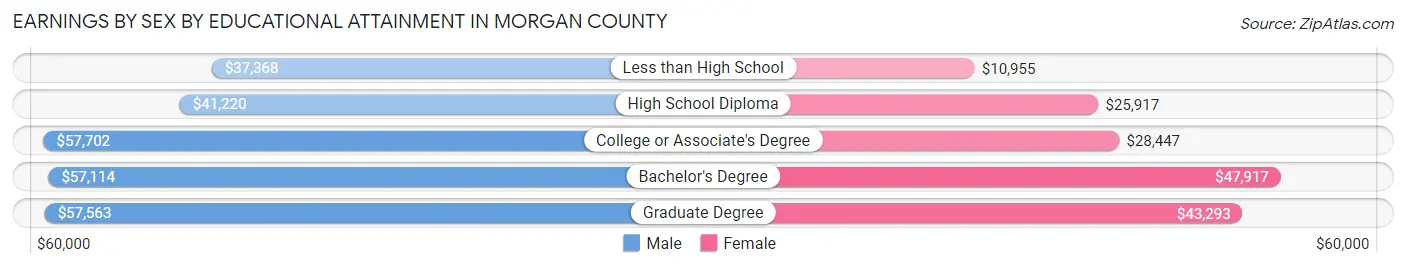
Earnings by Sex by Educational Attainment in Morgan County
Average earnings in Morgan County are $51,351 for men and $31,786 for women, a difference of 38.1%. Men with an educational attainment of college or associate's degree enjoy the highest average annual earnings of $57,702, while those with less than high school education earn the least with $37,368. Women with an educational attainment of bachelor's degree earn the most with the average annual earnings of $47,917, while those with less than high school education have the smallest earnings of $10,955.
| Educational Attainment | Male Income | Female Income |
| Less than High School | $37,368 | $10,955 |
| High School Diploma | $41,220 | $25,917 |
| College or Associate's Degree | $57,702 | $28,447 |
| Bachelor's Degree | $57,114 | $47,917 |
| Graduate Degree | $57,563 | $43,293 |
| Total | $51,351 | $31,786 |
Family Income in Morgan County
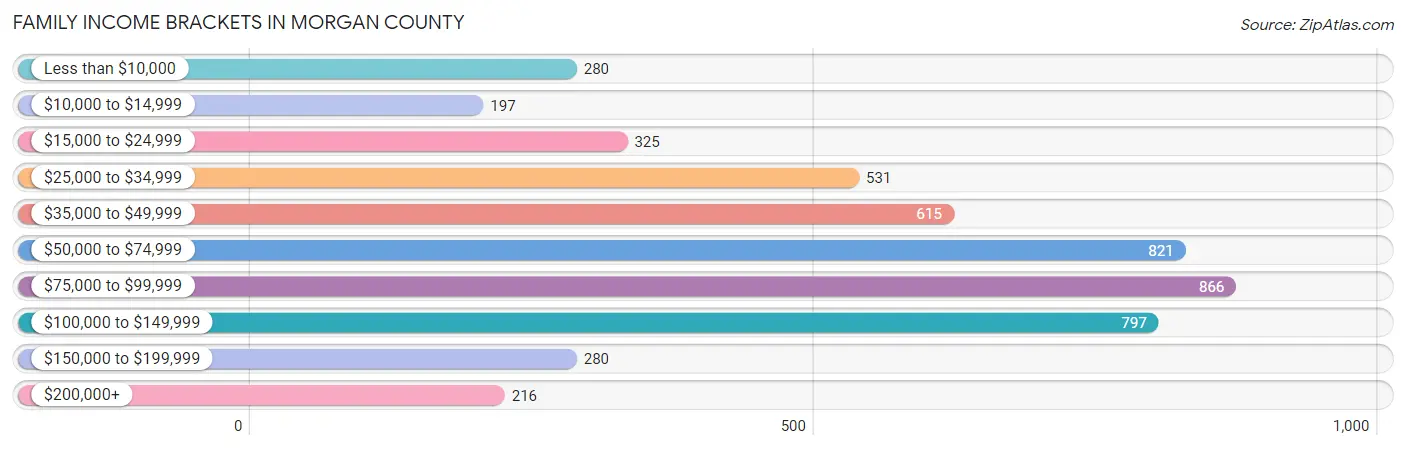
Family Income Brackets in Morgan County
According to the Morgan County family income data, there are 866 families falling into the $75,000 to $99,999 income range, which is the most common income bracket and makes up 17.6% of all families. Conversely, the $10,000 to $14,999 income bracket is the least frequent group with only 197 families (4.0%) belonging to this category.
| Income Bracket | # Families | % Families |
| Less than $10,000 | 280 | 5.7% |
| $10,000 to $14,999 | 197 | 4.0% |
| $15,000 to $24,999 | 325 | 6.6% |
| $25,000 to $34,999 | 531 | 10.8% |
| $35,000 to $49,999 | 615 | 12.5% |
| $50,000 to $74,999 | 821 | 16.7% |
| $75,000 to $99,999 | 866 | 17.6% |
| $100,000 to $149,999 | 797 | 16.2% |
| $150,000 to $199,999 | 280 | 5.7% |
| $200,000+ | 216 | 4.4% |
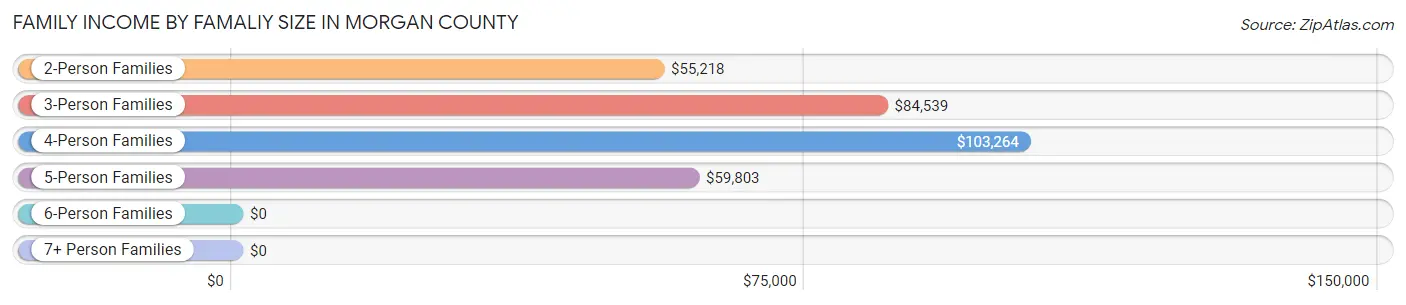
Family Income by Famaliy Size in Morgan County
4-person families (721 | 14.7%) account for the highest median family income in Morgan County with $103,264 per family, while 3-person families (1,152 | 23.4%) have the highest median income of $28,180 per family member.
| Income Bracket | # Families | Median Income |
| 2-Person Families | 2,545 (51.7%) | $55,218 |
| 3-Person Families | 1,152 (23.4%) | $84,539 |
| 4-Person Families | 721 (14.7%) | $103,264 |
| 5-Person Families | 299 (6.1%) | $59,803 |
| 6-Person Families | 119 (2.4%) | $0 |
| 7+ Person Families | 83 (1.7%) | $0 |
| Total | 4,919 (100.0%) | $66,363 |
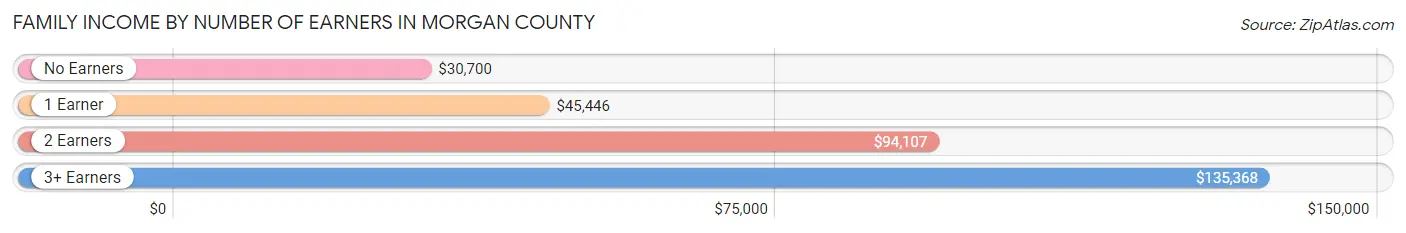
Family Income by Number of Earners in Morgan County
The median family income in Morgan County is $66,363, with families comprising 3+ earners (437) having the highest median family income of $135,368, while families with no earners (1,388) have the lowest median family income of $30,700, accounting for 8.9% and 28.2% of families, respectively.
| Number of Earners | # Families | Median Income |
| No Earners | 1,388 (28.2%) | $30,700 |
| 1 Earner | 1,274 (25.9%) | $45,446 |
| 2 Earners | 1,820 (37.0%) | $94,107 |
| 3+ Earners | 437 (8.9%) | $135,368 |
| Total | 4,919 (100.0%) | $66,363 |
Household Income in Morgan County
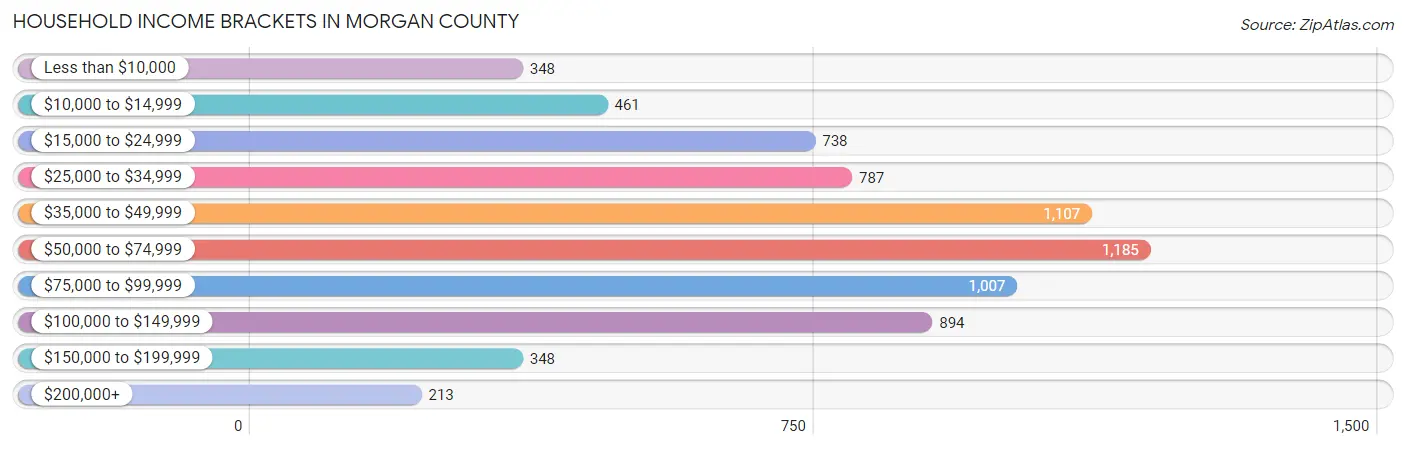
Household Income Brackets in Morgan County
With 1,185 households falling in the category, the $50,000 to $74,999 income range is the most frequent in Morgan County, accounting for 16.7% of all households. In contrast, only 213 households (3.0%) fall into the $200,000+ income bracket, making it the least populous group.
| Income Bracket | # Households | % Households |
| Less than $10,000 | 348 | 4.9% |
| $10,000 to $14,999 | 461 | 6.5% |
| $15,000 to $24,999 | 738 | 10.4% |
| $25,000 to $34,999 | 787 | 11.1% |
| $35,000 to $49,999 | 1,107 | 15.6% |
| $50,000 to $74,999 | 1,185 | 16.7% |
| $75,000 to $99,999 | 1,007 | 14.2% |
| $100,000 to $149,999 | 894 | 12.6% |
| $150,000 to $199,999 | 348 | 4.9% |
| $200,000+ | 213 | 3.0% |
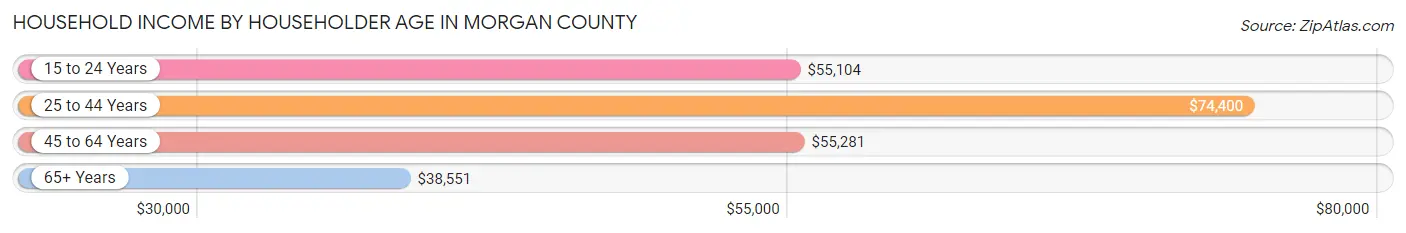
Household Income by Householder Age in Morgan County
The median household income in Morgan County is $51,971, with the highest median household income of $74,400 found in the 25 to 44 years age bracket for the primary householder. A total of 1,548 households (21.8%) fall into this category. Meanwhile, the 65+ years age bracket for the primary householder has the lowest median household income of $38,551, with 2,423 households (34.2%) in this group.
| Income Bracket | # Households | Median Income |
| 15 to 24 Years | 261 (3.7%) | $55,104 |
| 25 to 44 Years | 1,548 (21.8%) | $74,400 |
| 45 to 64 Years | 2,861 (40.3%) | $55,281 |
| 65+ Years | 2,423 (34.2%) | $38,551 |
| Total | 7,093 (100.0%) | $51,971 |
Poverty in Morgan County
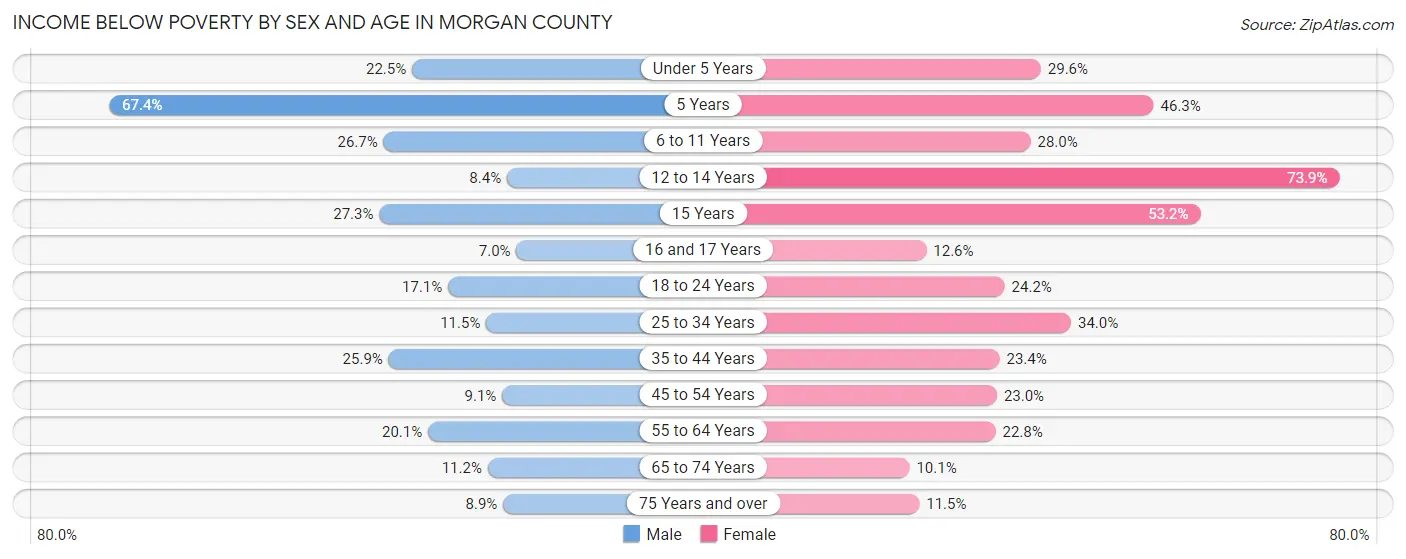
Income Below Poverty by Sex and Age in Morgan County
With 16.5% poverty level for males and 25.3% for females among the residents of Morgan County, 5 year old males and 12 to 14 year old females are the most vulnerable to poverty, with 29 males (67.4%) and 362 females (73.9%) in their respective age groups living below the poverty level.
| Age Bracket | Male | Female |
| Under 5 Years | 111 (22.5%) | 141 (29.6%) |
| 5 Years | 29 (67.4%) | 25 (46.3%) |
| 6 to 11 Years | 200 (26.7%) | 132 (28.0%) |
| 12 to 14 Years | 21 (8.4%) | 362 (73.9%) |
| 15 Years | 41 (27.3%) | 74 (53.2%) |
| 16 and 17 Years | 17 (7.0%) | 28 (12.6%) |
| 18 to 24 Years | 154 (17.1%) | 170 (24.2%) |
| 25 to 34 Years | 125 (11.5%) | 351 (34.0%) |
| 35 to 44 Years | 269 (25.9%) | 243 (23.4%) |
| 45 to 54 Years | 114 (9.1%) | 305 (23.0%) |
| 55 to 64 Years | 283 (20.1%) | 313 (22.8%) |
| 65 to 74 Years | 123 (11.2%) | 121 (10.1%) |
| 75 Years and over | 56 (8.9%) | 89 (11.5%) |
| Total | 1,543 (16.5%) | 2,354 (25.3%) |
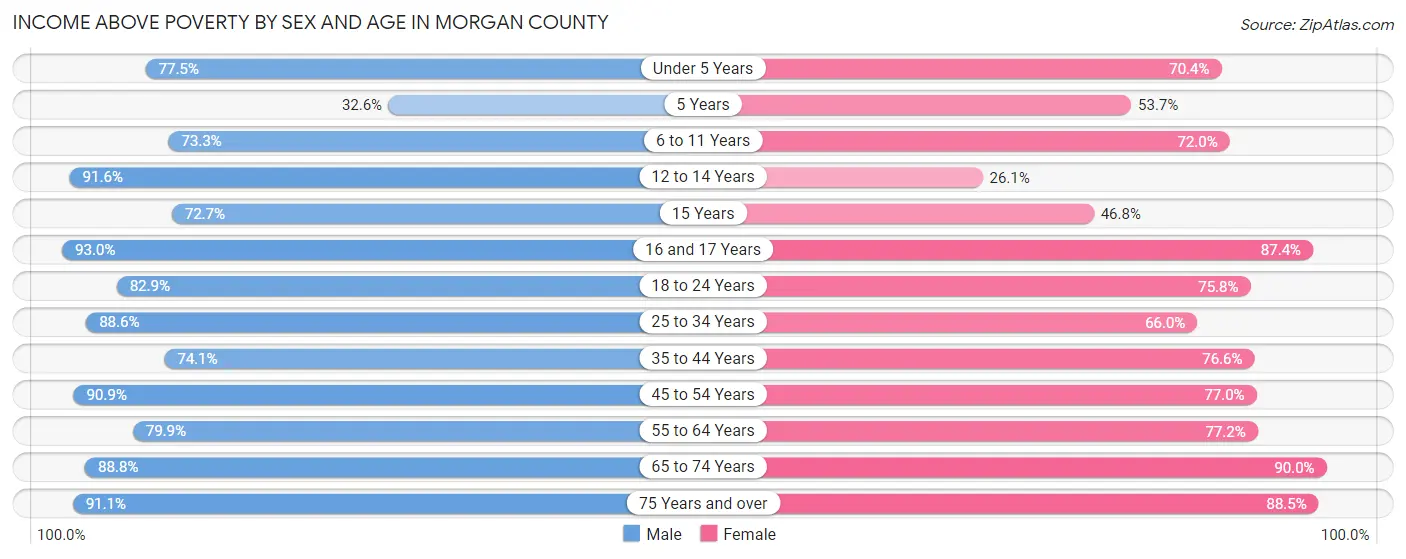
Income Above Poverty by Sex and Age in Morgan County
According to the poverty statistics in Morgan County, males aged 16 and 17 years and females aged 65 to 74 years are the age groups that are most secure financially, with 93.0% of males and 89.9% of females in these age groups living above the poverty line.
| Age Bracket | Male | Female |
| Under 5 Years | 383 (77.5%) | 336 (70.4%) |
| 5 Years | 14 (32.6%) | 29 (53.7%) |
| 6 to 11 Years | 549 (73.3%) | 339 (72.0%) |
| 12 to 14 Years | 230 (91.6%) | 128 (26.1%) |
| 15 Years | 109 (72.7%) | 65 (46.8%) |
| 16 and 17 Years | 227 (93.0%) | 195 (87.4%) |
| 18 to 24 Years | 746 (82.9%) | 533 (75.8%) |
| 25 to 34 Years | 967 (88.5%) | 680 (66.0%) |
| 35 to 44 Years | 768 (74.1%) | 794 (76.6%) |
| 45 to 54 Years | 1,141 (90.9%) | 1,019 (77.0%) |
| 55 to 64 Years | 1,126 (79.9%) | 1,058 (77.2%) |
| 65 to 74 Years | 972 (88.8%) | 1,083 (89.9%) |
| 75 Years and over | 571 (91.1%) | 684 (88.5%) |
| Total | 7,803 (83.5%) | 6,943 (74.7%) |
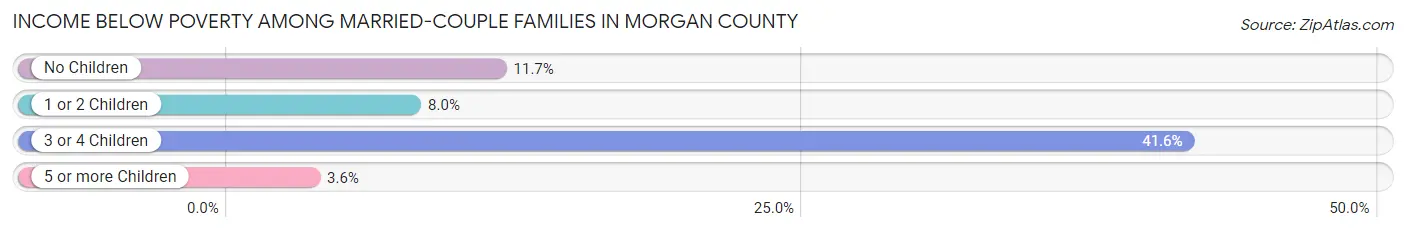
Income Below Poverty Among Married-Couple Families in Morgan County
The poverty statistics for married-couple families in Morgan County show that 11.9% or 454 of the total 3,798 families live below the poverty line. Families with 3 or 4 children have the highest poverty rate of 41.6%, comprising of 72 families. On the other hand, families with 5 or more children have the lowest poverty rate of 3.6%, which includes 1 families.
| Children | Above Poverty | Below Poverty |
| No Children | 2,235 (88.3%) | 296 (11.7%) |
| 1 or 2 Children | 981 (92.0%) | 85 (8.0%) |
| 3 or 4 Children | 101 (58.4%) | 72 (41.6%) |
| 5 or more Children | 27 (96.4%) | 1 (3.6%) |
| Total | 3,344 (88.0%) | 454 (11.9%) |
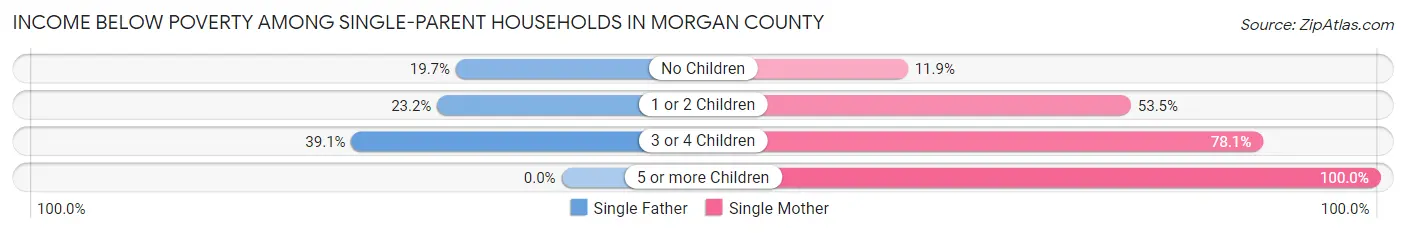
Income Below Poverty Among Single-Parent Households in Morgan County
According to the poverty data in Morgan County, 23.2% or 71 single-father households and 37.4% or 305 single-mother households are living below the poverty line. Among single-father households, those with 3 or 4 children have the highest poverty rate, with 9 households (39.1%) experiencing poverty. Likewise, among single-mother households, those with 5 or more children have the highest poverty rate, with 16 households (100.0%) falling below the poverty line.
| Children | Single Father | Single Mother |
| No Children | 12 (19.7%) | 42 (11.9%) |
| 1 or 2 Children | 50 (23.2%) | 222 (53.5%) |
| 3 or 4 Children | 9 (39.1%) | 25 (78.1%) |
| 5 or more Children | 0 (0.0%) | 16 (100.0%) |
| Total | 71 (23.2%) | 305 (37.4%) |
Income Below Poverty Among Married-Couple vs Single-Parent Households in Morgan County
The poverty data for Morgan County shows that 454 of the married-couple family households (11.9%) and 376 of the single-parent households (33.5%) are living below the poverty level. Within the married-couple family households, those with 3 or 4 children have the highest poverty rate, with 72 households (41.6%) falling below the poverty line. Among the single-parent households, those with 5 or more children have the highest poverty rate, with 16 household (72.7%) living below poverty.
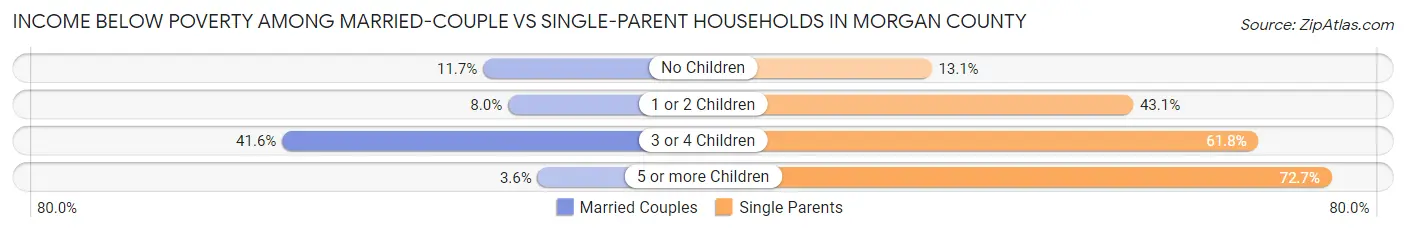
| Children | Married-Couple Families | Single-Parent Households |
| No Children | 296 (11.7%) | 54 (13.1%) |
| 1 or 2 Children | 85 (8.0%) | 272 (43.1%) |
| 3 or 4 Children | 72 (41.6%) | 34 (61.8%) |
| 5 or more Children | 1 (3.6%) | 16 (72.7%) |
| Total | 454 (11.9%) | 376 (33.5%) |
Employment Characteristics in Morgan County
Employment by Class of Employer in Morgan County
Among the 7,241 employed individuals in Morgan County, private company employees (4,579 | 63.2%), local government employees (668 | 9.2%), and state government employees (560 | 7.7%) make up the most common classes of employment.
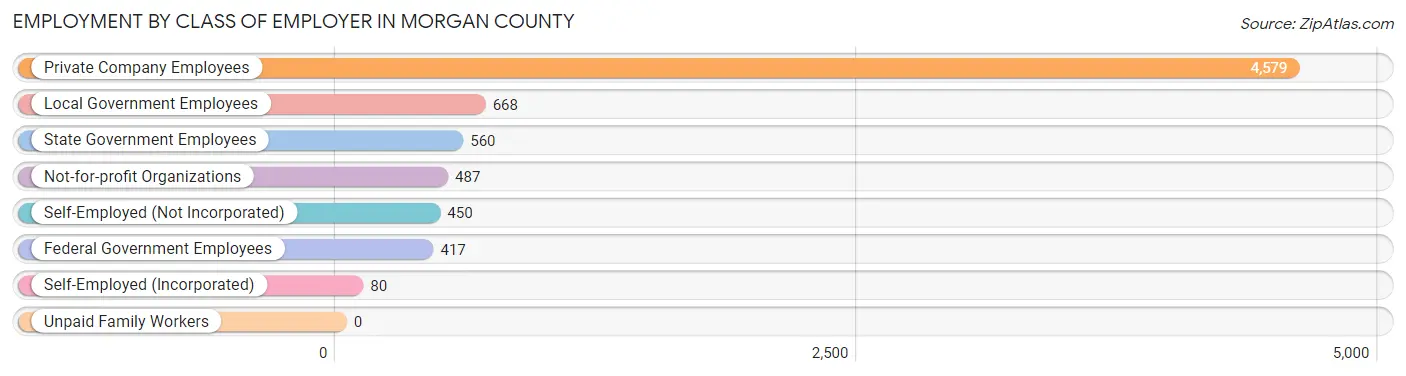
| Employer Class | # Employees | % Employees |
| Private Company Employees | 4,579 | 63.2% |
| Self-Employed (Incorporated) | 80 | 1.1% |
| Self-Employed (Not Incorporated) | 450 | 6.2% |
| Not-for-profit Organizations | 487 | 6.7% |
| Local Government Employees | 668 | 9.2% |
| State Government Employees | 560 | 7.7% |
| Federal Government Employees | 417 | 5.8% |
| Unpaid Family Workers | 0 | 0.0% |
| Total | 7,241 | 100.0% |
Employment Status by Age in Morgan County
According to the labor force statistics for Morgan County, out of the total population over 16 years of age (17,542), 45.7% or 8,017 individuals are in the labor force, with 8.4% or 673 of them unemployed. The age group with the highest labor force participation rate is 20 to 24 years, with 62.8% or 845 individuals in the labor force. Within the labor force, the 65 to 74 years age range has the highest percentage of unemployed individuals, with 17.7% or 86 of them being unemployed.
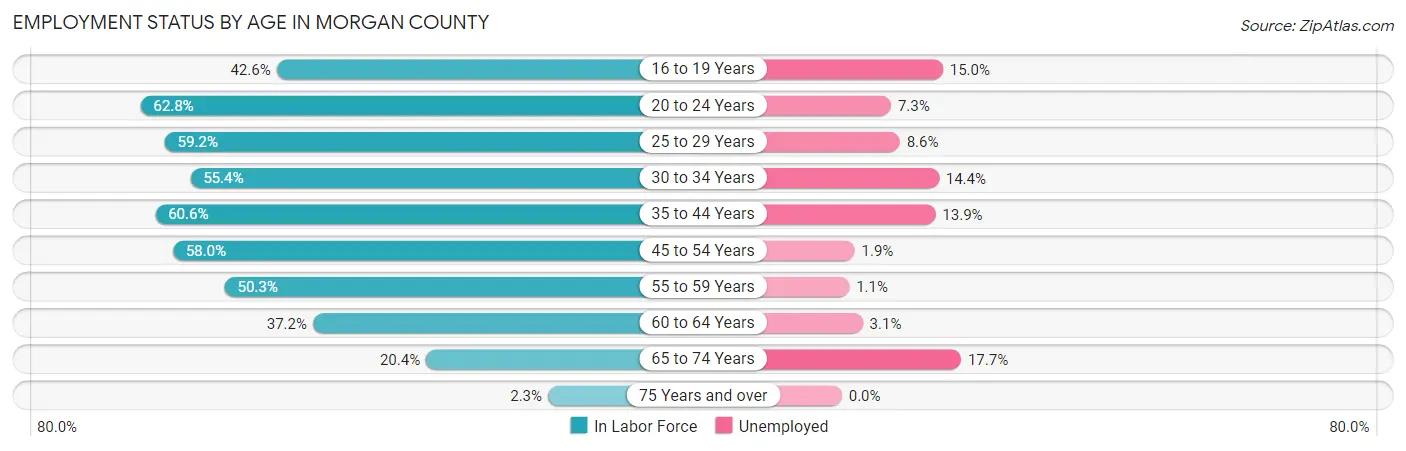
| Age Bracket | In Labor Force | Unemployed |
| 16 to 19 Years | 381 (42.6%) | 57 (15.0%) |
| 20 to 24 Years | 845 (62.8%) | 62 (7.3%) |
| 25 to 29 Years | 863 (59.2%) | 74 (8.6%) |
| 30 to 34 Years | 784 (55.4%) | 113 (14.4%) |
| 35 to 44 Years | 1,585 (60.6%) | 220 (13.9%) |
| 45 to 54 Years | 1,764 (58.0%) | 34 (1.9%) |
| 55 to 59 Years | 710 (50.3%) | 8 (1.1%) |
| 60 to 64 Years | 557 (37.2%) | 17 (3.1%) |
| 65 to 74 Years | 487 (20.4%) | 86 (17.7%) |
| 75 Years and over | 34 (2.3%) | 0 (0.0%) |
| Total | 8,017 (45.7%) | 673 (8.4%) |
Employment Status by Educational Attainment in Morgan County
According to labor force statistics for Morgan County, 54.7% of individuals (6,257) out of the total population between 25 and 64 years of age (11,439) are in the labor force, with 7.4% or 463 of them being unemployed. The group with the highest labor force participation rate are those with the educational attainment of bachelor's degree or higher, with 80.3% or 1,176 individuals in the labor force. Within the labor force, individuals with high school diploma education have the highest percentage of unemployment, with 13.7% or 365 of them being unemployed.
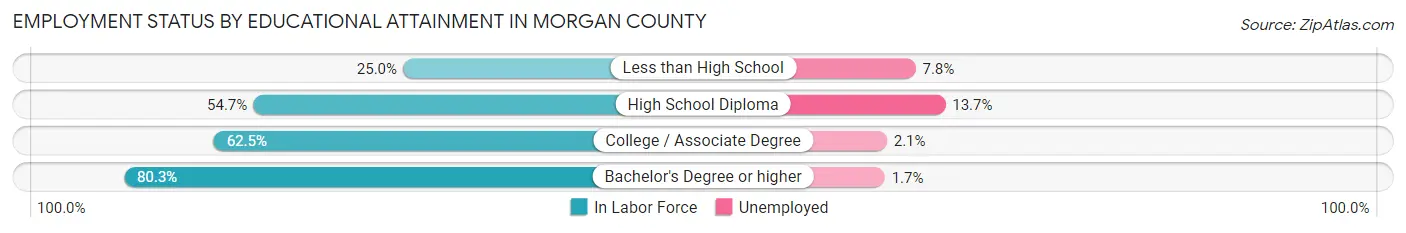
| Educational Attainment | In Labor Force | Unemployed |
| Less than High School | 511 (25.0%) | 160 (7.8%) |
| High School Diploma | 2,663 (54.7%) | 667 (13.7%) |
| College / Associate Degree | 1,912 (62.5%) | 64 (2.1%) |
| Bachelor's Degree or higher | 1,176 (80.3%) | 25 (1.7%) |
| Total | 6,257 (54.7%) | 846 (7.4%) |
Employment Occupations by Sex in Morgan County
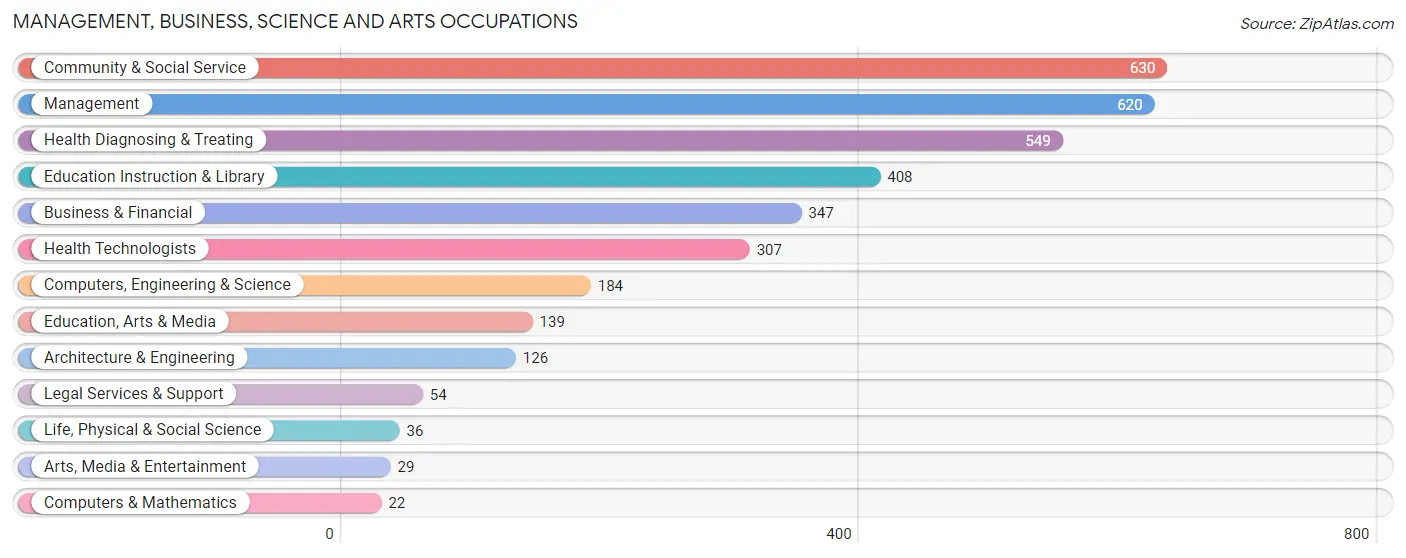
Management, Business, Science and Arts Occupations
The most common Management, Business, Science and Arts occupations in Morgan County are Community & Social Service (630 | 8.6%), Management (620 | 8.5%), Health Diagnosing & Treating (549 | 7.5%), Education Instruction & Library (408 | 5.6%), and Business & Financial (347 | 4.8%).
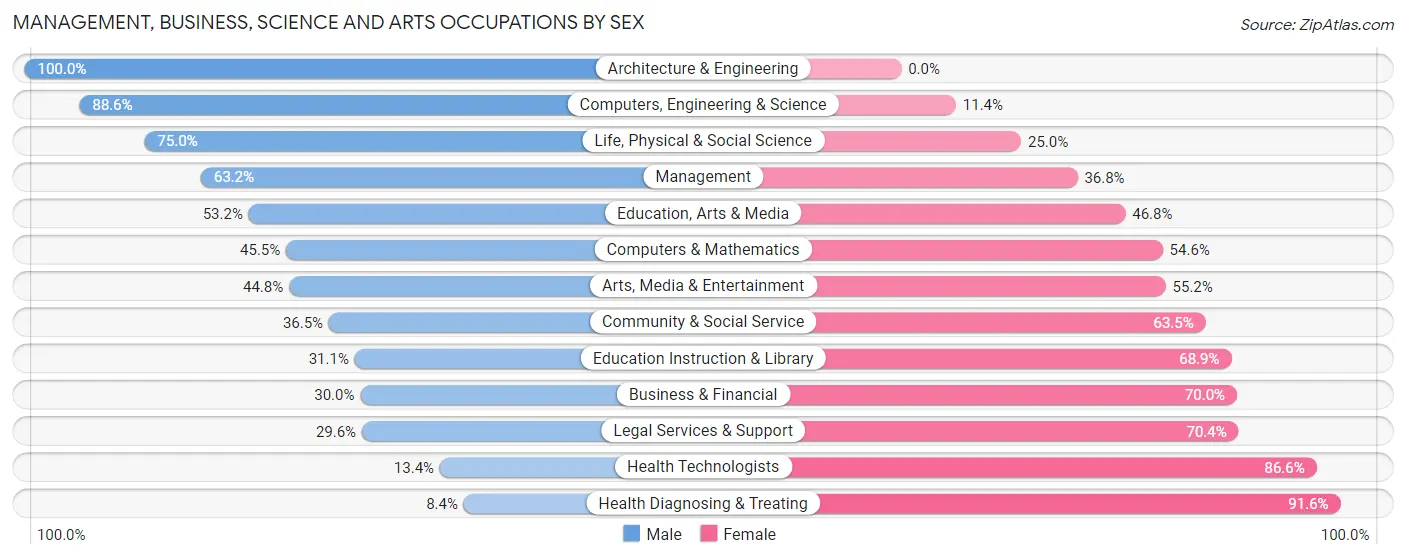
Management, Business, Science and Arts Occupations by Sex
Within the Management, Business, Science and Arts occupations in Morgan County, the most male-oriented occupations are Architecture & Engineering (100.0%), Computers, Engineering & Science (88.6%), and Life, Physical & Social Science (75.0%), while the most female-oriented occupations are Health Diagnosing & Treating (91.6%), Health Technologists (86.6%), and Legal Services & Support (70.4%).
| Occupation | Male | Female |
| Management | 392 (63.2%) | 228 (36.8%) |
| Business & Financial | 104 (30.0%) | 243 (70.0%) |
| Computers, Engineering & Science | 163 (88.6%) | 21 (11.4%) |
| Computers & Mathematics | 10 (45.5%) | 12 (54.5%) |
| Architecture & Engineering | 126 (100.0%) | 0 (0.0%) |
| Life, Physical & Social Science | 27 (75.0%) | 9 (25.0%) |
| Community & Social Service | 230 (36.5%) | 400 (63.5%) |
| Education, Arts & Media | 74 (53.2%) | 65 (46.8%) |
| Legal Services & Support | 16 (29.6%) | 38 (70.4%) |
| Education Instruction & Library | 127 (31.1%) | 281 (68.9%) |
| Arts, Media & Entertainment | 13 (44.8%) | 16 (55.2%) |
| Health Diagnosing & Treating | 46 (8.4%) | 503 (91.6%) |
| Health Technologists | 41 (13.4%) | 266 (86.6%) |
| Total (Category) | 935 (40.1%) | 1,395 (59.9%) |
| Total (Overall) | 4,181 (57.2%) | 3,131 (42.8%) |
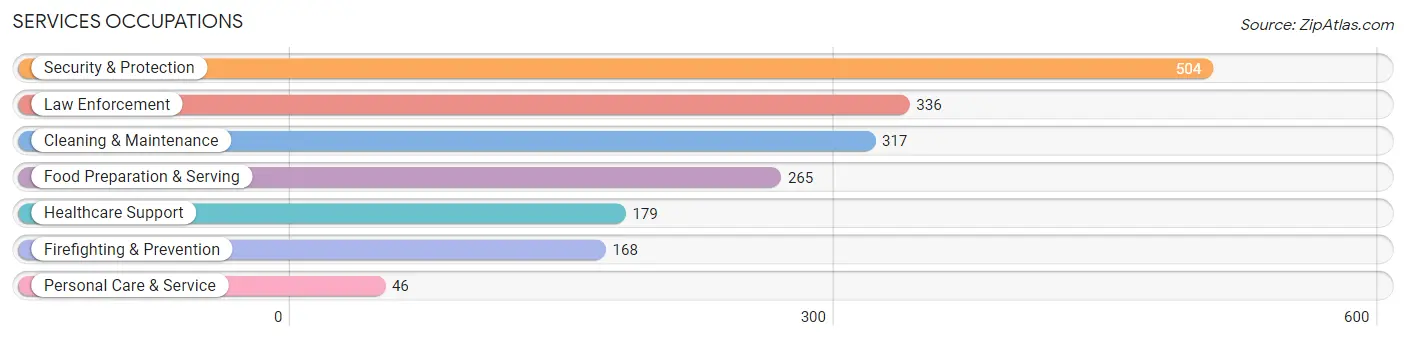
Services Occupations
The most common Services occupations in Morgan County are Security & Protection (504 | 6.9%), Law Enforcement (336 | 4.6%), Cleaning & Maintenance (317 | 4.3%), Food Preparation & Serving (265 | 3.6%), and Healthcare Support (179 | 2.5%).
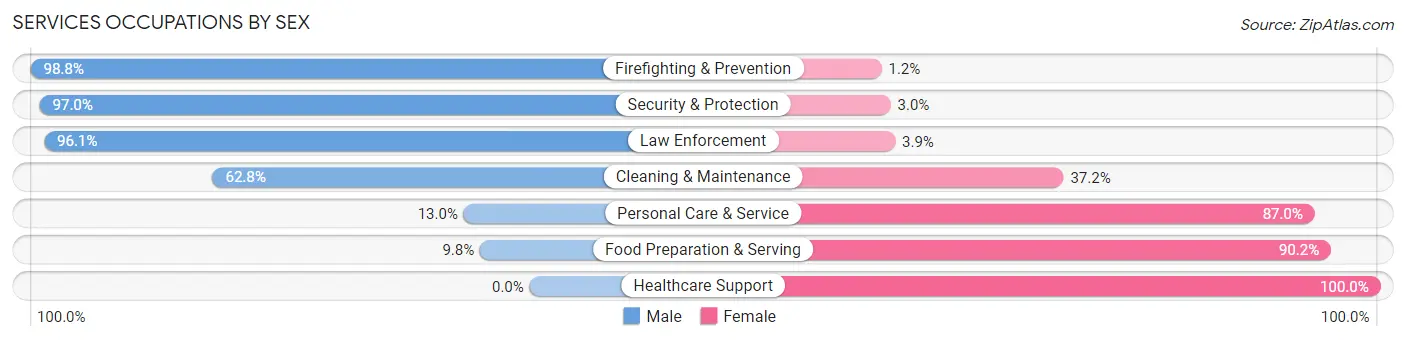
Services Occupations by Sex
Within the Services occupations in Morgan County, the most male-oriented occupations are Firefighting & Prevention (98.8%), Security & Protection (97.0%), and Law Enforcement (96.1%), while the most female-oriented occupations are Healthcare Support (100.0%), Food Preparation & Serving (90.2%), and Personal Care & Service (87.0%).
| Occupation | Male | Female |
| Healthcare Support | 0 (0.0%) | 179 (100.0%) |
| Security & Protection | 489 (97.0%) | 15 (3.0%) |
| Firefighting & Prevention | 166 (98.8%) | 2 (1.2%) |
| Law Enforcement | 323 (96.1%) | 13 (3.9%) |
| Food Preparation & Serving | 26 (9.8%) | 239 (90.2%) |
| Cleaning & Maintenance | 199 (62.8%) | 118 (37.2%) |
| Personal Care & Service | 6 (13.0%) | 40 (87.0%) |
| Total (Category) | 720 (54.9%) | 591 (45.1%) |
| Total (Overall) | 4,181 (57.2%) | 3,131 (42.8%) |
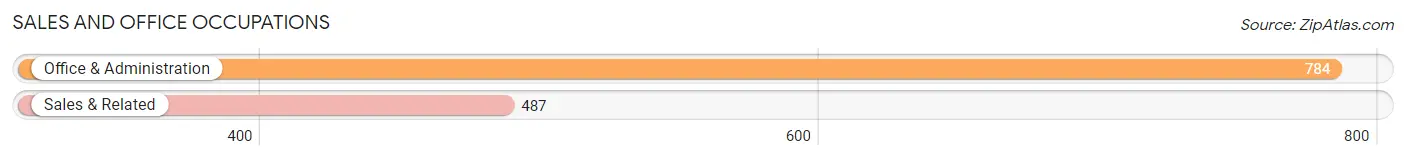
Sales and Office Occupations
The most common Sales and Office occupations in Morgan County are Office & Administration (784 | 10.7%), and Sales & Related (487 | 6.7%).
Sales and Office Occupations by Sex
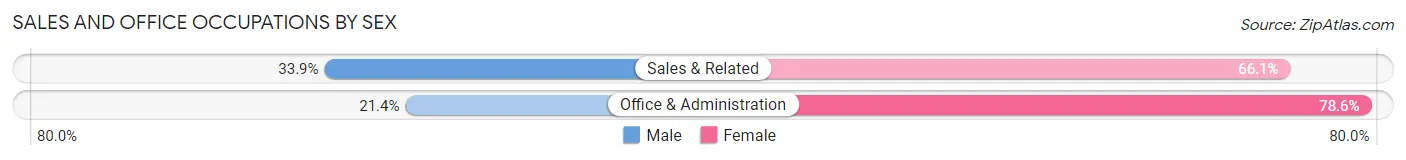
| Occupation | Male | Female |
| Sales & Related | 165 (33.9%) | 322 (66.1%) |
| Office & Administration | 168 (21.4%) | 616 (78.6%) |
| Total (Category) | 333 (26.2%) | 938 (73.8%) |
| Total (Overall) | 4,181 (57.2%) | 3,131 (42.8%) |
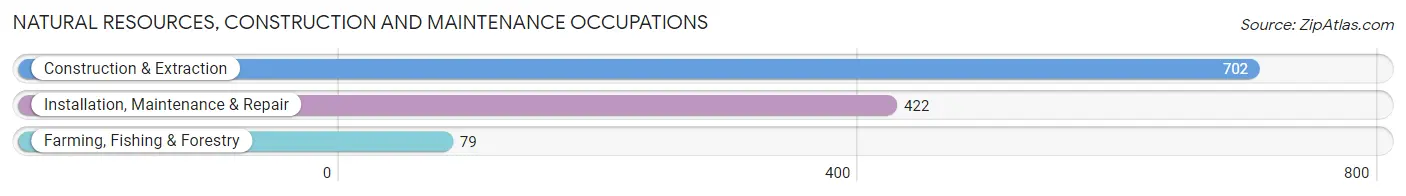
Natural Resources, Construction and Maintenance Occupations
The most common Natural Resources, Construction and Maintenance occupations in Morgan County are Construction & Extraction (702 | 9.6%), Installation, Maintenance & Repair (422 | 5.8%), and Farming, Fishing & Forestry (79 | 1.1%).
Natural Resources, Construction and Maintenance Occupations by Sex
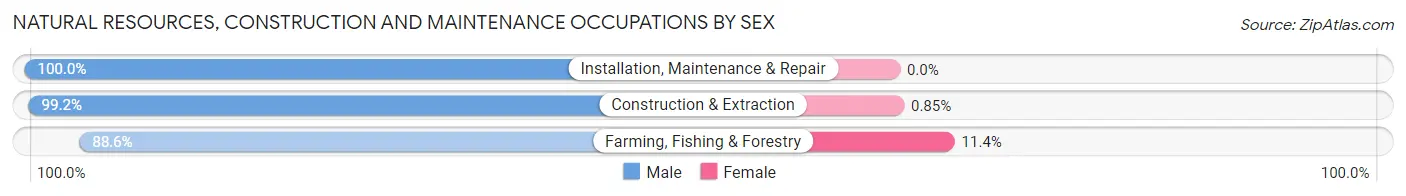
| Occupation | Male | Female |
| Farming, Fishing & Forestry | 70 (88.6%) | 9 (11.4%) |
| Construction & Extraction | 696 (99.2%) | 6 (0.9%) |
| Installation, Maintenance & Repair | 422 (100.0%) | 0 (0.0%) |
| Total (Category) | 1,188 (98.8%) | 15 (1.3%) |
| Total (Overall) | 4,181 (57.2%) | 3,131 (42.8%) |
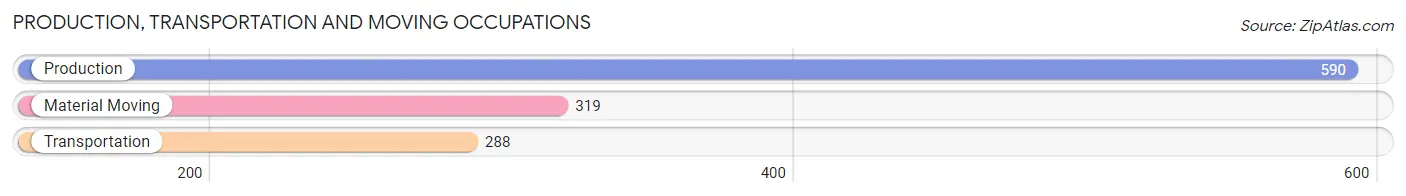
Production, Transportation and Moving Occupations
The most common Production, Transportation and Moving occupations in Morgan County are Production (590 | 8.1%), Material Moving (319 | 4.4%), and Transportation (288 | 3.9%).
Production, Transportation and Moving Occupations by Sex
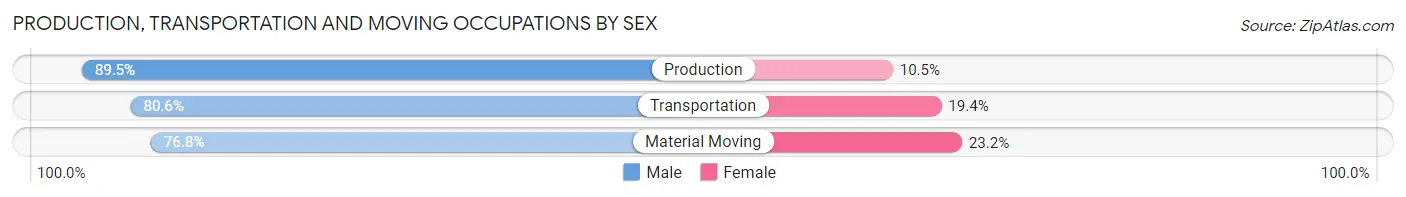
| Occupation | Male | Female |
| Production | 528 (89.5%) | 62 (10.5%) |
| Transportation | 232 (80.6%) | 56 (19.4%) |
| Material Moving | 245 (76.8%) | 74 (23.2%) |
| Total (Category) | 1,005 (84.0%) | 192 (16.0%) |
| Total (Overall) | 4,181 (57.2%) | 3,131 (42.8%) |
Employment Industries by Sex in Morgan County
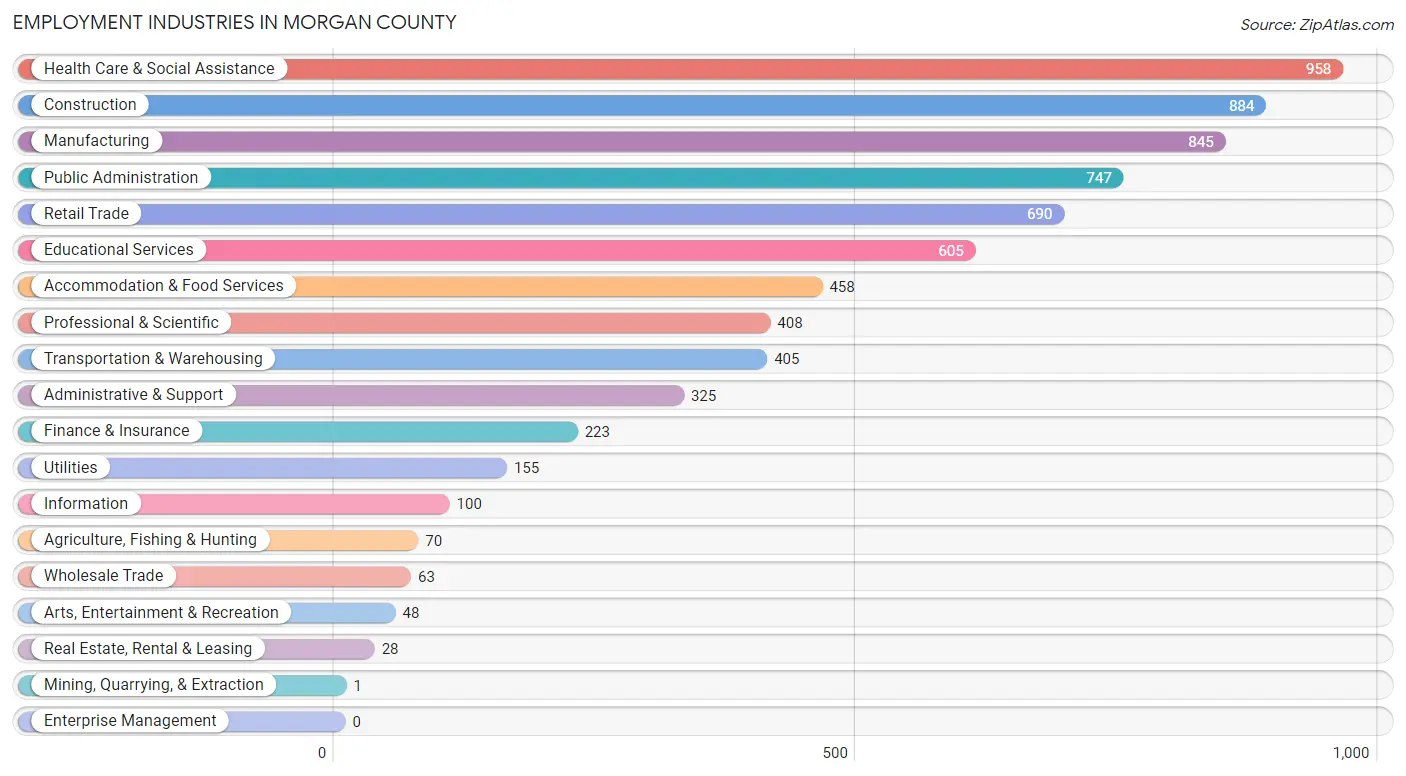
Employment Industries in Morgan County
The major employment industries in Morgan County include Health Care & Social Assistance (958 | 13.1%), Construction (884 | 12.1%), Manufacturing (845 | 11.6%), Public Administration (747 | 10.2%), and Retail Trade (690 | 9.4%).
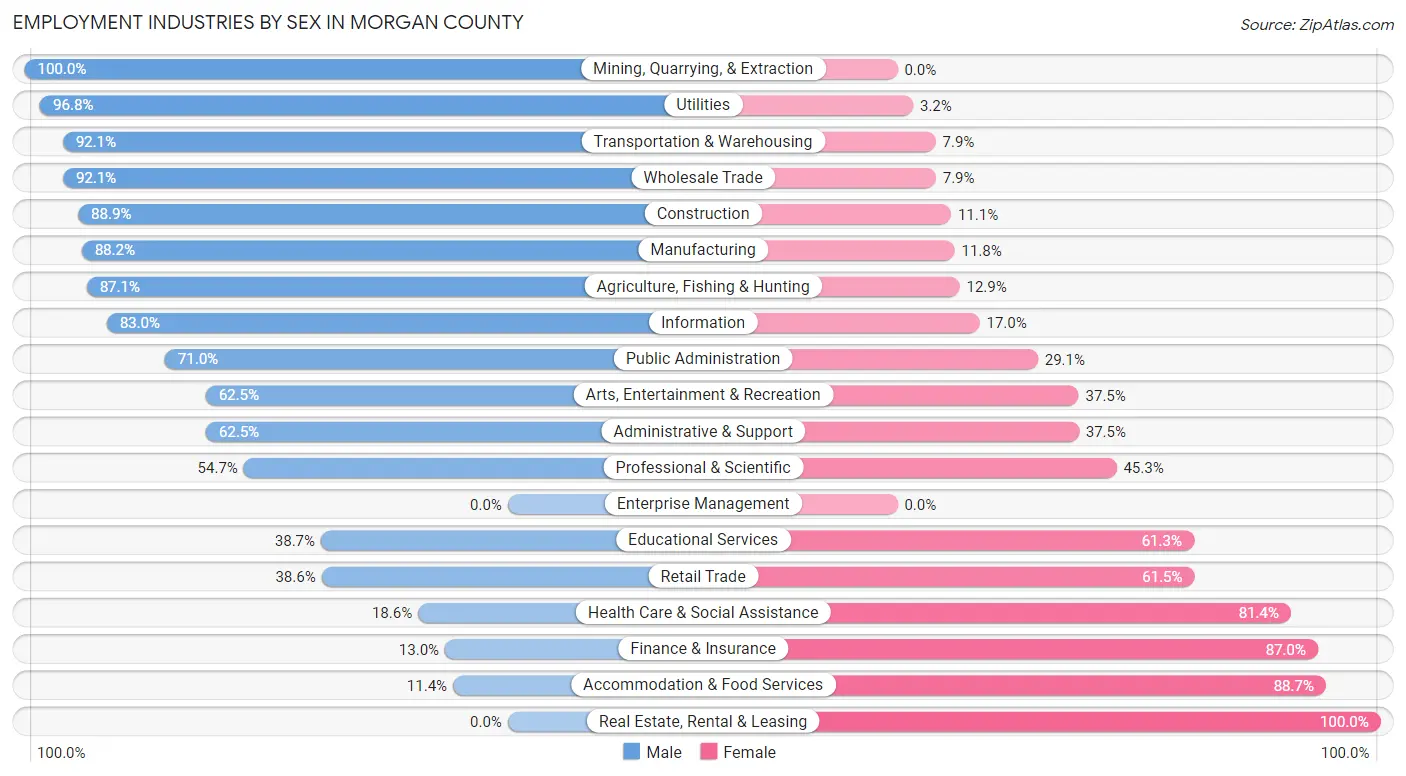
Employment Industries by Sex in Morgan County
The Morgan County industries that see more men than women are Mining, Quarrying, & Extraction (100.0%), Utilities (96.8%), and Transportation & Warehousing (92.1%), whereas the industries that tend to have a higher number of women are Real Estate, Rental & Leasing (100.0%), Accommodation & Food Services (88.6%), and Finance & Insurance (87.0%).
| Industry | Male | Female |
| Agriculture, Fishing & Hunting | 61 (87.1%) | 9 (12.9%) |
| Mining, Quarrying, & Extraction | 1 (100.0%) | 0 (0.0%) |
| Construction | 786 (88.9%) | 98 (11.1%) |
| Manufacturing | 745 (88.2%) | 100 (11.8%) |
| Wholesale Trade | 58 (92.1%) | 5 (7.9%) |
| Retail Trade | 266 (38.6%) | 424 (61.5%) |
| Transportation & Warehousing | 373 (92.1%) | 32 (7.9%) |
| Utilities | 150 (96.8%) | 5 (3.2%) |
| Information | 83 (83.0%) | 17 (17.0%) |
| Finance & Insurance | 29 (13.0%) | 194 (87.0%) |
| Real Estate, Rental & Leasing | 0 (0.0%) | 28 (100.0%) |
| Professional & Scientific | 223 (54.7%) | 185 (45.3%) |
| Enterprise Management | 0 (0.0%) | 0 (0.0%) |
| Administrative & Support | 203 (62.5%) | 122 (37.5%) |
| Educational Services | 234 (38.7%) | 371 (61.3%) |
| Health Care & Social Assistance | 178 (18.6%) | 780 (81.4%) |
| Arts, Entertainment & Recreation | 30 (62.5%) | 18 (37.5%) |
| Accommodation & Food Services | 52 (11.4%) | 406 (88.6%) |
| Public Administration | 530 (71.0%) | 217 (29.0%) |
| Total | 4,181 (57.2%) | 3,131 (42.8%) |
Education in Morgan County
School Enrollment in Morgan County
The most common levels of schooling among the 3,604 students in Morgan County are high school (1,096 | 30.4%), middle school (978 | 27.1%), and elementary school (830 | 23.0%).
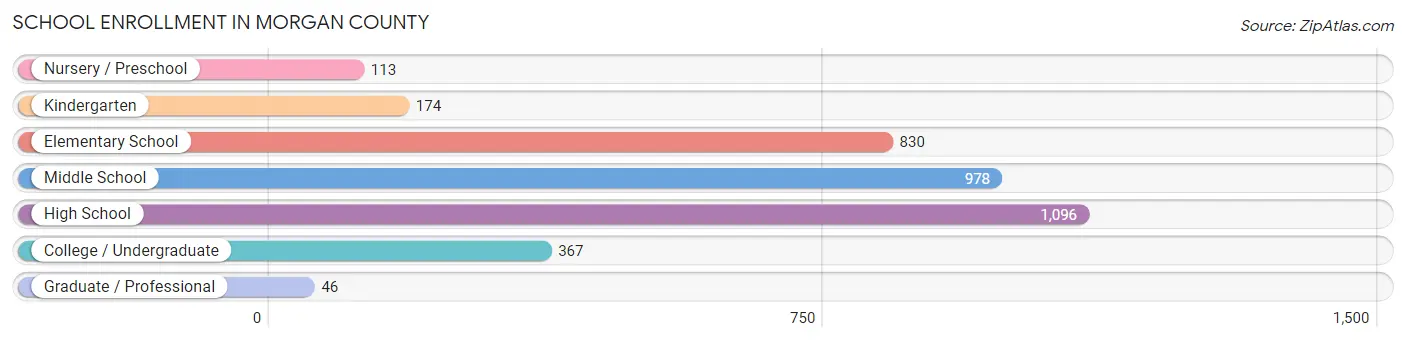
| School Level | # Students | % Students |
| Nursery / Preschool | 113 | 3.1% |
| Kindergarten | 174 | 4.8% |
| Elementary School | 830 | 23.0% |
| Middle School | 978 | 27.1% |
| High School | 1,096 | 30.4% |
| College / Undergraduate | 367 | 10.2% |
| Graduate / Professional | 46 | 1.3% |
| Total | 3,604 | 100.0% |
School Enrollment by Age by Funding Source in Morgan County
Out of a total of 3,604 students who are enrolled in schools in Morgan County, 429 (11.9%) attend a private institution, while the remaining 3,175 (88.1%) are enrolled in public schools. The age group of 35 years and over has the highest likelihood of being enrolled in private schools, with 26 (21.3% in the age bracket) enrolled. Conversely, the age group of 18 to 19 year olds has the lowest likelihood of being enrolled in a private school, with 150 (99.3% in the age bracket) attending a public institution.
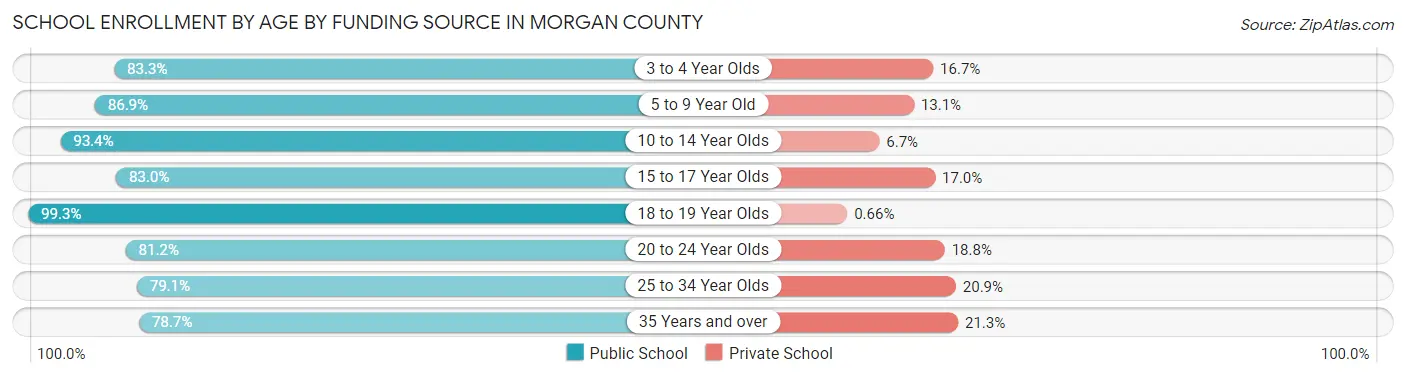
| Age Bracket | Public School | Private School |
| 3 to 4 Year Olds | 65 (83.3%) | 13 (16.7%) |
| 5 to 9 Year Old | 810 (86.9%) | 122 (13.1%) |
| 10 to 14 Year Olds | 1,221 (93.3%) | 87 (6.7%) |
| 15 to 17 Year Olds | 575 (83.0%) | 118 (17.0%) |
| 18 to 19 Year Olds | 150 (99.3%) | 1 (0.7%) |
| 20 to 24 Year Olds | 151 (81.2%) | 35 (18.8%) |
| 25 to 34 Year Olds | 106 (79.1%) | 28 (20.9%) |
| 35 Years and over | 96 (78.7%) | 26 (21.3%) |
| Total | 3,175 (88.1%) | 429 (11.9%) |
Educational Attainment by Field of Study in Morgan County
Business (491 | 23.9%), education (460 | 22.4%), science & technology (246 | 12.0%), social sciences (215 | 10.5%), and bio, nature & agricultural (118 | 5.8%) are the most common fields of study among 2,050 individuals in Morgan County who have obtained a bachelor's degree or higher.
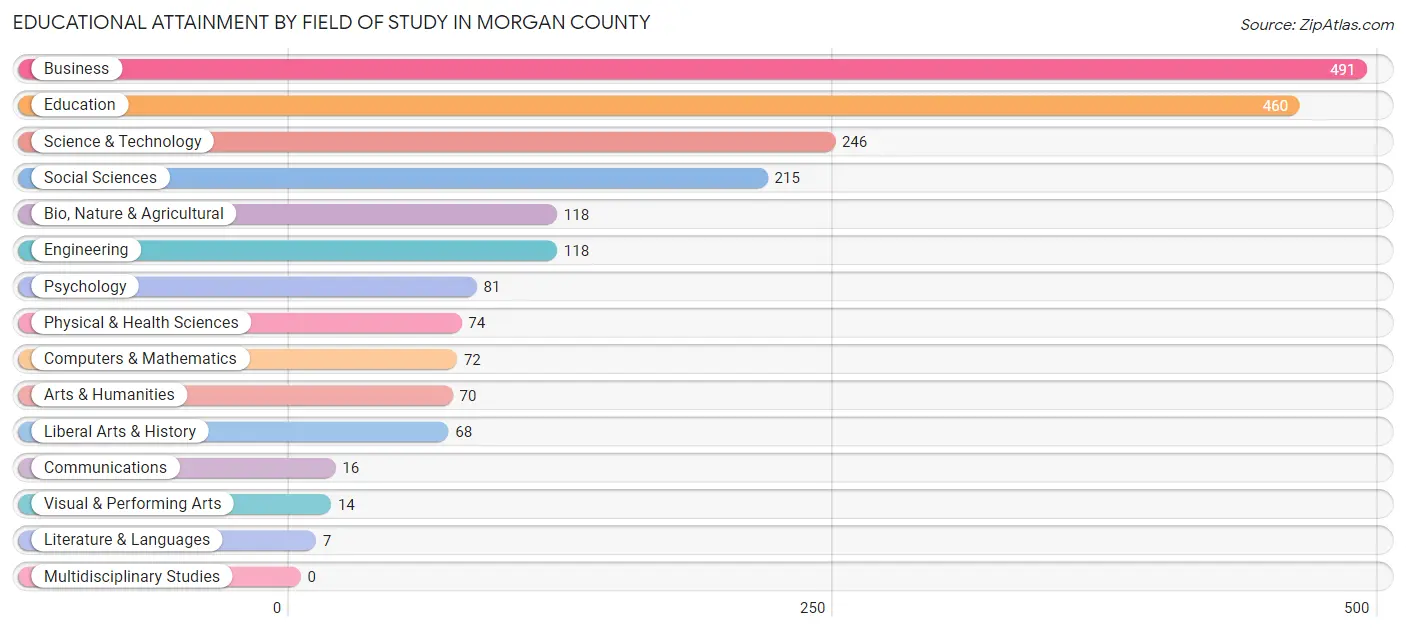
| Field of Study | # Graduates | % Graduates |
| Computers & Mathematics | 72 | 3.5% |
| Bio, Nature & Agricultural | 118 | 5.8% |
| Physical & Health Sciences | 74 | 3.6% |
| Psychology | 81 | 4.0% |
| Social Sciences | 215 | 10.5% |
| Engineering | 118 | 5.8% |
| Multidisciplinary Studies | 0 | 0.0% |
| Science & Technology | 246 | 12.0% |
| Business | 491 | 23.9% |
| Education | 460 | 22.4% |
| Literature & Languages | 7 | 0.3% |
| Liberal Arts & History | 68 | 3.3% |
| Visual & Performing Arts | 14 | 0.7% |
| Communications | 16 | 0.8% |
| Arts & Humanities | 70 | 3.4% |
| Total | 2,050 | 100.0% |
Transportation & Commute in Morgan County
Vehicle Availability by Sex in Morgan County
The most prevalent vehicle ownership categories in Morgan County are males with 3 vehicles (1,540, accounting for 37.1%) and females with 3 vehicles (1,060, making up 50.1%).
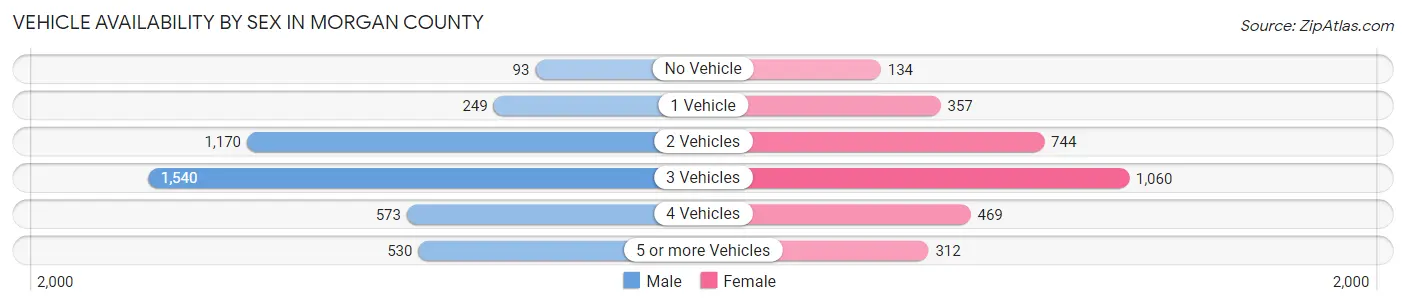
| Vehicles Available | Male | Female |
| No Vehicle | 93 (2.2%) | 134 (4.4%) |
| 1 Vehicle | 249 (6.0%) | 357 (11.6%) |
| 2 Vehicles | 1,170 (28.2%) | 744 (24.2%) |
| 3 Vehicles | 1,540 (37.1%) | 1,060 (34.5%) |
| 4 Vehicles | 573 (13.8%) | 469 (15.2%) |
| 5 or more Vehicles | 530 (12.8%) | 312 (10.1%) |
| Total | 4,155 (100.0%) | 3,076 (100.0%) |
Commute Time in Morgan County
The most frequently occuring commute durations in Morgan County are 45 to 59 minutes (1,216 commuters, 17.6%), 30 to 34 minutes (991 commuters, 14.3%), and 20 to 24 minutes (689 commuters, 10.0%).
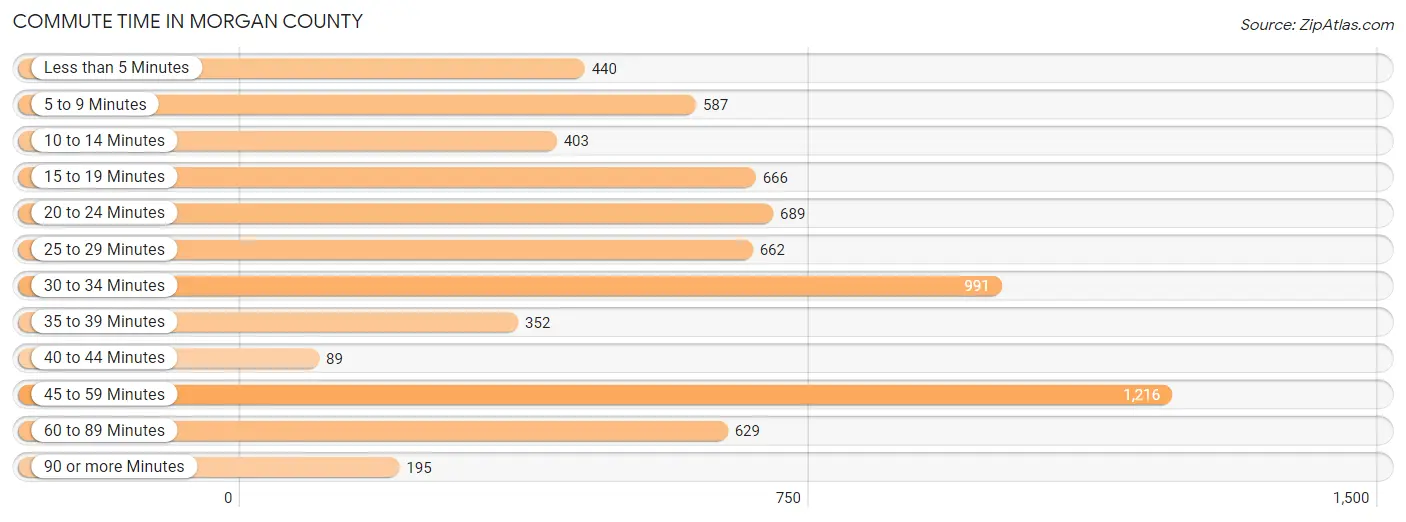
| Commute Time | # Commuters | % Commuters |
| Less than 5 Minutes | 440 | 6.4% |
| 5 to 9 Minutes | 587 | 8.5% |
| 10 to 14 Minutes | 403 | 5.8% |
| 15 to 19 Minutes | 666 | 9.6% |
| 20 to 24 Minutes | 689 | 10.0% |
| 25 to 29 Minutes | 662 | 9.6% |
| 30 to 34 Minutes | 991 | 14.3% |
| 35 to 39 Minutes | 352 | 5.1% |
| 40 to 44 Minutes | 89 | 1.3% |
| 45 to 59 Minutes | 1,216 | 17.6% |
| 60 to 89 Minutes | 629 | 9.1% |
| 90 or more Minutes | 195 | 2.8% |
Commute Time by Sex in Morgan County
The most common commute times in Morgan County are 45 to 59 minutes (592 commuters, 14.7%) for males and 45 to 59 minutes (624 commuters, 21.7%) for females.
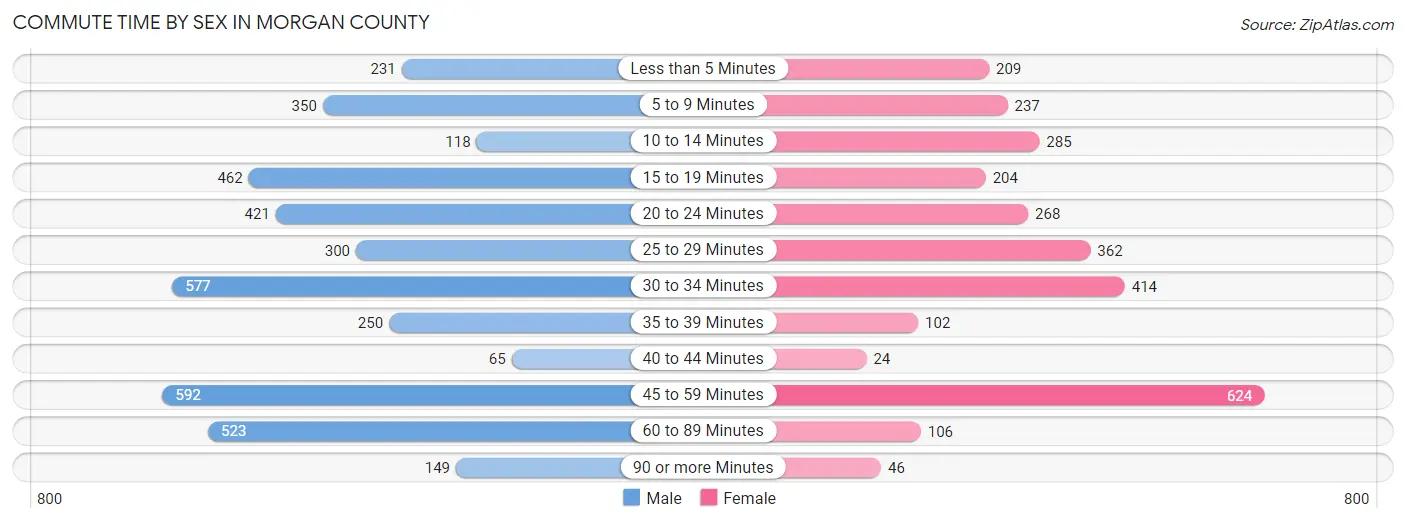
| Commute Time | Male | Female |
| Less than 5 Minutes | 231 (5.7%) | 209 (7.2%) |
| 5 to 9 Minutes | 350 (8.7%) | 237 (8.2%) |
| 10 to 14 Minutes | 118 (2.9%) | 285 (9.9%) |
| 15 to 19 Minutes | 462 (11.4%) | 204 (7.1%) |
| 20 to 24 Minutes | 421 (10.4%) | 268 (9.3%) |
| 25 to 29 Minutes | 300 (7.4%) | 362 (12.6%) |
| 30 to 34 Minutes | 577 (14.3%) | 414 (14.4%) |
| 35 to 39 Minutes | 250 (6.2%) | 102 (3.5%) |
| 40 to 44 Minutes | 65 (1.6%) | 24 (0.8%) |
| 45 to 59 Minutes | 592 (14.7%) | 624 (21.7%) |
| 60 to 89 Minutes | 523 (13.0%) | 106 (3.7%) |
| 90 or more Minutes | 149 (3.7%) | 46 (1.6%) |
Time of Departure to Work by Sex in Morgan County
The most frequent times of departure to work in Morgan County are 5:00 AM to 5:29 AM (550, 13.6%) for males and 7:30 AM to 7:59 AM (516, 17.9%) for females.
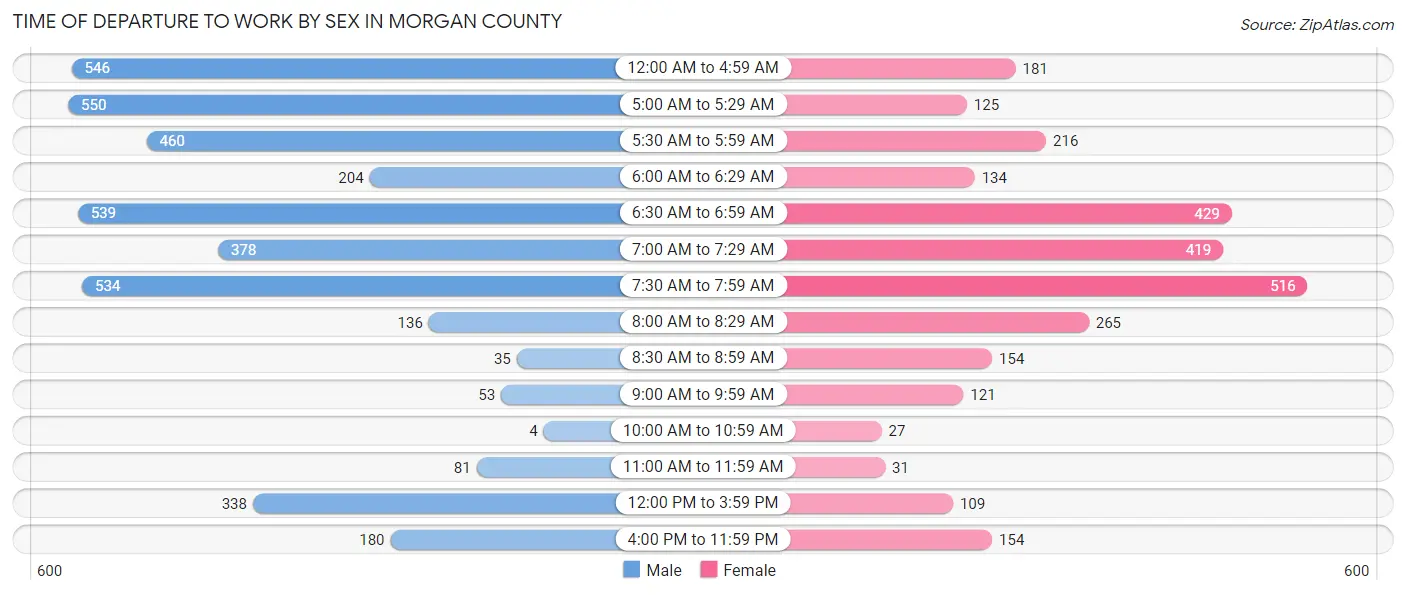
| Time of Departure | Male | Female |
| 12:00 AM to 4:59 AM | 546 (13.5%) | 181 (6.3%) |
| 5:00 AM to 5:29 AM | 550 (13.6%) | 125 (4.3%) |
| 5:30 AM to 5:59 AM | 460 (11.4%) | 216 (7.5%) |
| 6:00 AM to 6:29 AM | 204 (5.1%) | 134 (4.6%) |
| 6:30 AM to 6:59 AM | 539 (13.4%) | 429 (14.9%) |
| 7:00 AM to 7:29 AM | 378 (9.4%) | 419 (14.5%) |
| 7:30 AM to 7:59 AM | 534 (13.2%) | 516 (17.9%) |
| 8:00 AM to 8:29 AM | 136 (3.4%) | 265 (9.2%) |
| 8:30 AM to 8:59 AM | 35 (0.9%) | 154 (5.3%) |
| 9:00 AM to 9:59 AM | 53 (1.3%) | 121 (4.2%) |
| 10:00 AM to 10:59 AM | 4 (0.1%) | 27 (0.9%) |
| 11:00 AM to 11:59 AM | 81 (2.0%) | 31 (1.1%) |
| 12:00 PM to 3:59 PM | 338 (8.4%) | 109 (3.8%) |
| 4:00 PM to 11:59 PM | 180 (4.5%) | 154 (5.3%) |
| Total | 4,038 (100.0%) | 2,881 (100.0%) |
Housing Occupancy in Morgan County
Occupancy by Ownership in Morgan County
Of the total 7,093 dwellings in Morgan County, owner-occupied units account for 5,782 (81.5%), while renter-occupied units make up 1,311 (18.5%).
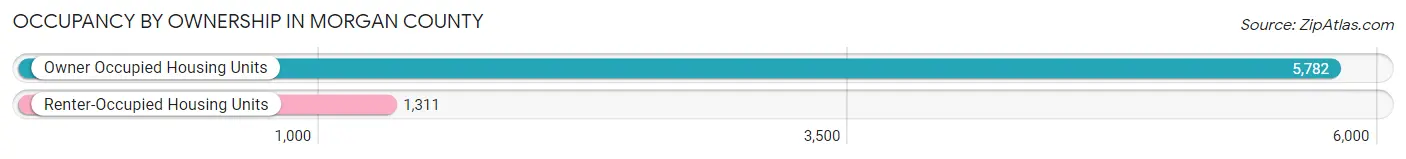
| Occupancy | # Housing Units | % Housing Units |
| Owner Occupied Housing Units | 5,782 | 81.5% |
| Renter-Occupied Housing Units | 1,311 | 18.5% |
| Total Occupied Housing Units | 7,093 | 100.0% |
Occupancy by Household Size in Morgan County
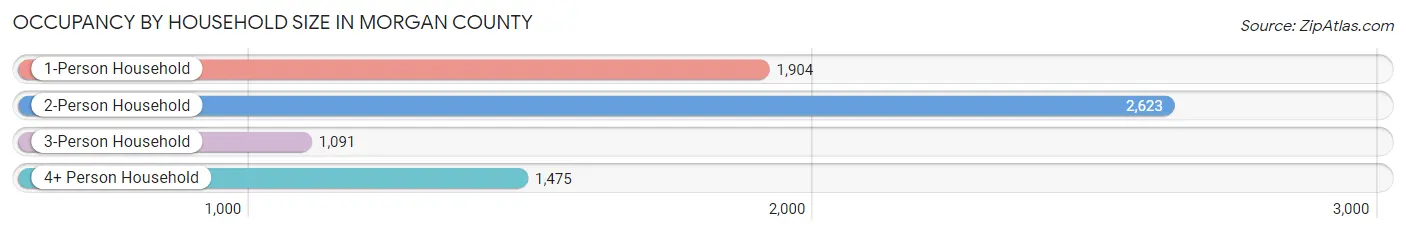
| Household Size | # Housing Units | % Housing Units |
| 1-Person Household | 1,904 | 26.8% |
| 2-Person Household | 2,623 | 37.0% |
| 3-Person Household | 1,091 | 15.4% |
| 4+ Person Household | 1,475 | 20.8% |
| Total Housing Units | 7,093 | 100.0% |
Occupancy by Ownership by Household Size in Morgan County
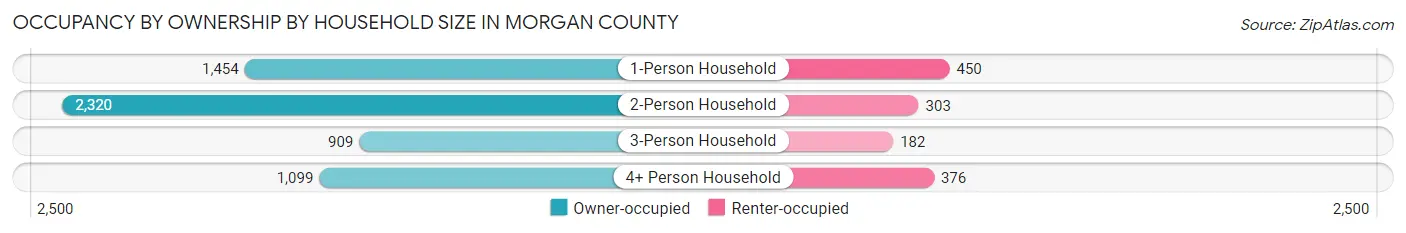
| Household Size | Owner-occupied | Renter-occupied |
| 1-Person Household | 1,454 (76.4%) | 450 (23.6%) |
| 2-Person Household | 2,320 (88.4%) | 303 (11.6%) |
| 3-Person Household | 909 (83.3%) | 182 (16.7%) |
| 4+ Person Household | 1,099 (74.5%) | 376 (25.5%) |
| Total Housing Units | 5,782 (81.5%) | 1,311 (18.5%) |
Occupancy by Educational Attainment in Morgan County
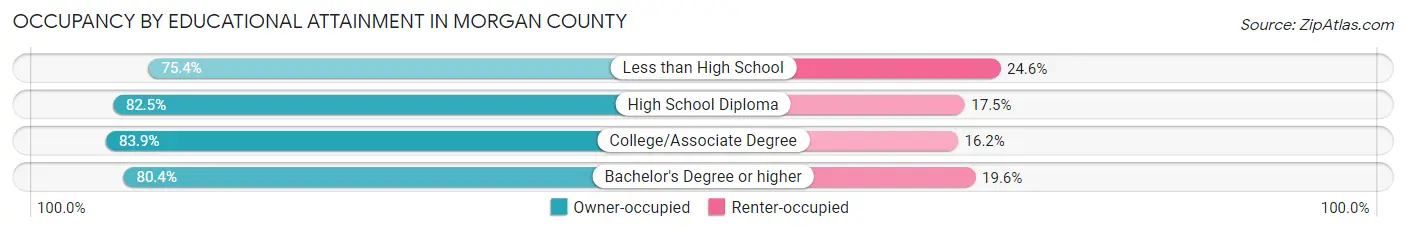
| Household Size | Owner-occupied | Renter-occupied |
| Less than High School | 817 (75.4%) | 266 (24.6%) |
| High School Diploma | 2,325 (82.5%) | 493 (17.5%) |
| College/Associate Degree | 1,796 (83.9%) | 346 (16.2%) |
| Bachelor's Degree or higher | 844 (80.4%) | 206 (19.6%) |
Occupancy by Age of Householder in Morgan County
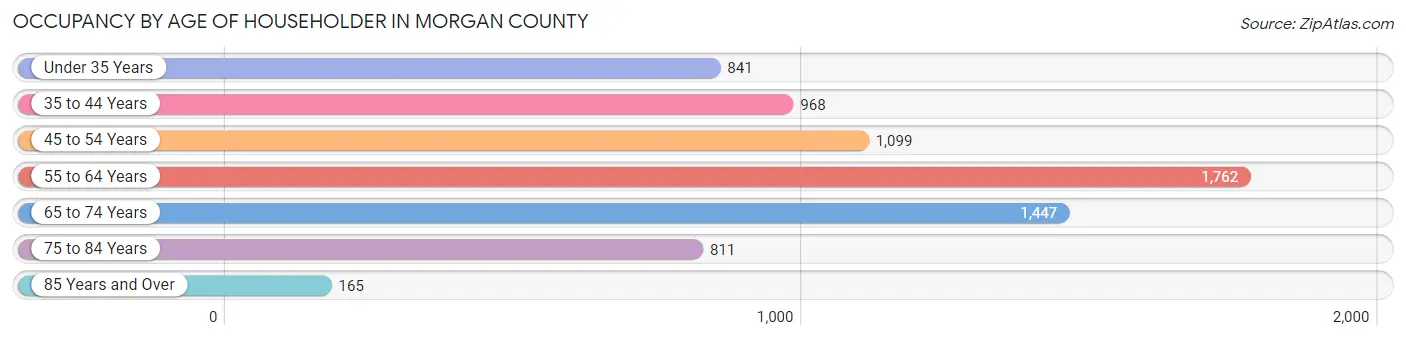
| Age Bracket | # Households | % Households |
| Under 35 Years | 841 | 11.9% |
| 35 to 44 Years | 968 | 13.7% |
| 45 to 54 Years | 1,099 | 15.5% |
| 55 to 64 Years | 1,762 | 24.8% |
| 65 to 74 Years | 1,447 | 20.4% |
| 75 to 84 Years | 811 | 11.4% |
| 85 Years and Over | 165 | 2.3% |
| Total | 7,093 | 100.0% |
Housing Finances in Morgan County
Median Income by Occupancy in Morgan County
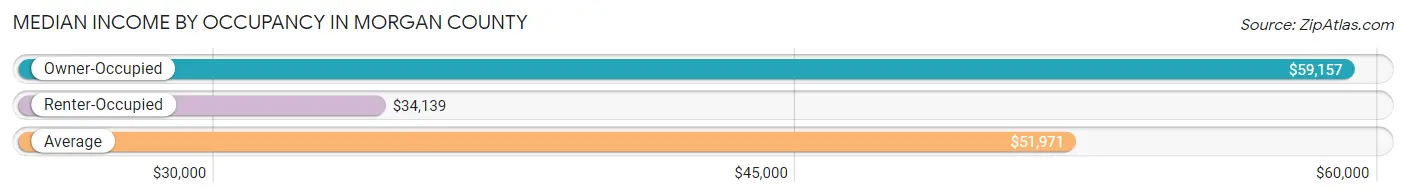
| Occupancy Type | # Households | Median Income |
| Owner-Occupied | 5,782 (81.5%) | $59,157 |
| Renter-Occupied | 1,311 (18.5%) | $34,139 |
| Average | 7,093 (100.0%) | $51,971 |
Occupancy by Householder Income Bracket in Morgan County
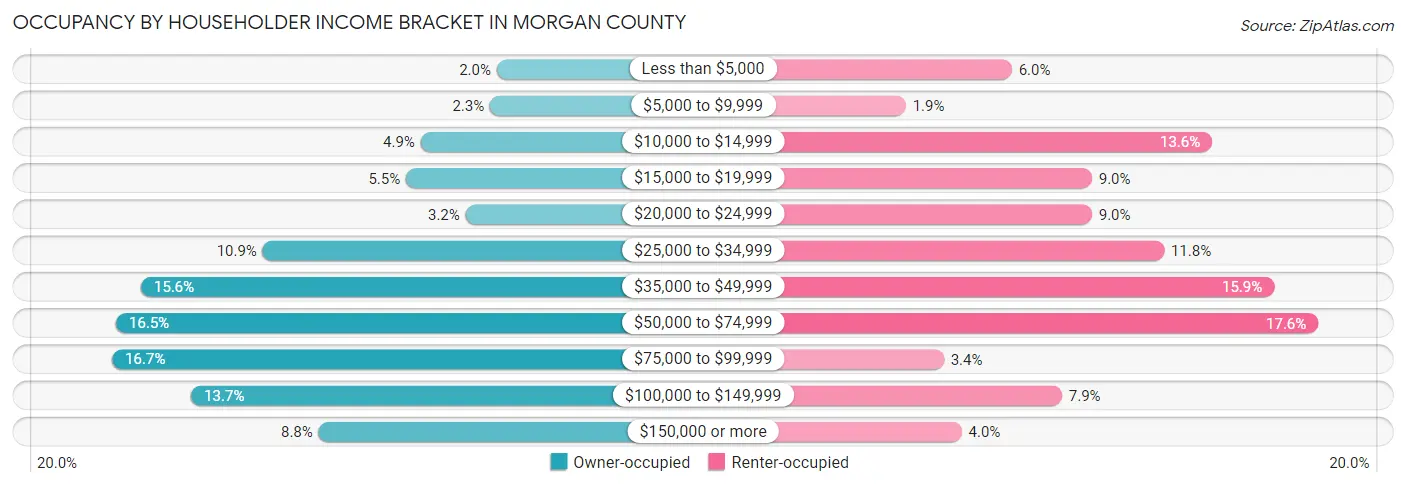
| Income Bracket | Owner-occupied | Renter-occupied |
| Less than $5,000 | 116 (2.0%) | 78 (5.9%) |
| $5,000 to $9,999 | 131 (2.3%) | 25 (1.9%) |
| $10,000 to $14,999 | 284 (4.9%) | 178 (13.6%) |
| $15,000 to $19,999 | 316 (5.5%) | 118 (9.0%) |
| $20,000 to $24,999 | 185 (3.2%) | 118 (9.0%) |
| $25,000 to $34,999 | 632 (10.9%) | 154 (11.7%) |
| $35,000 to $49,999 | 900 (15.6%) | 209 (15.9%) |
| $50,000 to $74,999 | 955 (16.5%) | 231 (17.6%) |
| $75,000 to $99,999 | 964 (16.7%) | 44 (3.4%) |
| $100,000 to $149,999 | 790 (13.7%) | 103 (7.9%) |
| $150,000 or more | 509 (8.8%) | 53 (4.0%) |
| Total | 5,782 (100.0%) | 1,311 (100.0%) |
Monthly Housing Cost Tiers in Morgan County
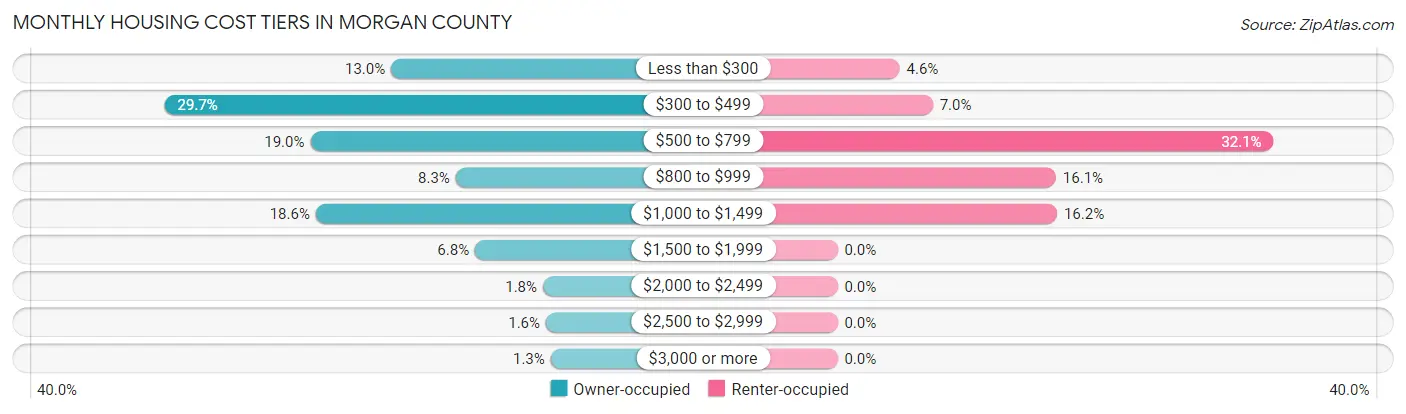
| Monthly Cost | Owner-occupied | Renter-occupied |
| Less than $300 | 752 (13.0%) | 60 (4.6%) |
| $300 to $499 | 1,717 (29.7%) | 92 (7.0%) |
| $500 to $799 | 1,096 (19.0%) | 421 (32.1%) |
| $800 to $999 | 477 (8.3%) | 211 (16.1%) |
| $1,000 to $1,499 | 1,073 (18.6%) | 212 (16.2%) |
| $1,500 to $1,999 | 395 (6.8%) | 0 (0.0%) |
| $2,000 to $2,499 | 106 (1.8%) | 0 (0.0%) |
| $2,500 to $2,999 | 93 (1.6%) | 0 (0.0%) |
| $3,000 or more | 73 (1.3%) | 0 (0.0%) |
| Total | 5,782 (100.0%) | 1,311 (100.0%) |
Physical Housing Characteristics in Morgan County
Housing Structures in Morgan County
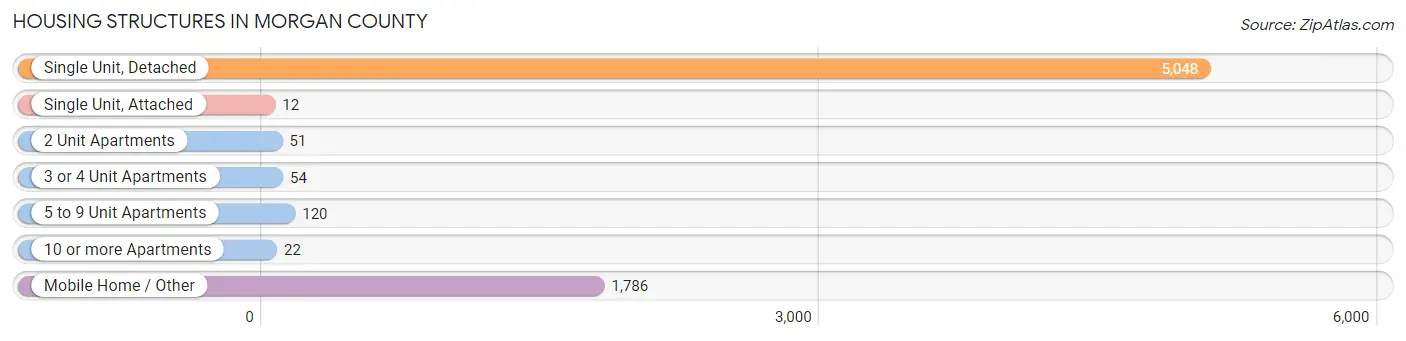
| Structure Type | # Housing Units | % Housing Units |
| Single Unit, Detached | 5,048 | 71.2% |
| Single Unit, Attached | 12 | 0.2% |
| 2 Unit Apartments | 51 | 0.7% |
| 3 or 4 Unit Apartments | 54 | 0.8% |
| 5 to 9 Unit Apartments | 120 | 1.7% |
| 10 or more Apartments | 22 | 0.3% |
| Mobile Home / Other | 1,786 | 25.2% |
| Total | 7,093 | 100.0% |
Housing Structures by Occupancy in Morgan County
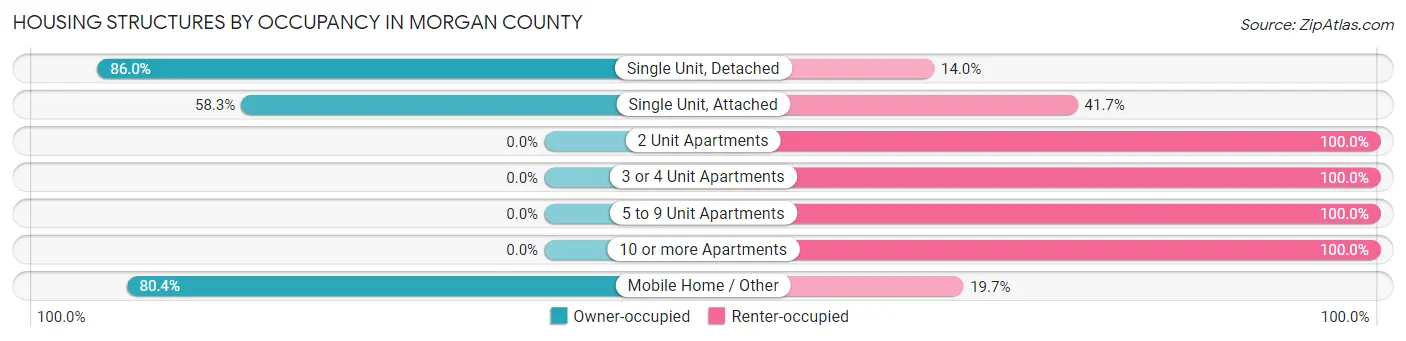
| Structure Type | Owner-occupied | Renter-occupied |
| Single Unit, Detached | 4,340 (86.0%) | 708 (14.0%) |
| Single Unit, Attached | 7 (58.3%) | 5 (41.7%) |
| 2 Unit Apartments | 0 (0.0%) | 51 (100.0%) |
| 3 or 4 Unit Apartments | 0 (0.0%) | 54 (100.0%) |
| 5 to 9 Unit Apartments | 0 (0.0%) | 120 (100.0%) |
| 10 or more Apartments | 0 (0.0%) | 22 (100.0%) |
| Mobile Home / Other | 1,435 (80.3%) | 351 (19.7%) |
| Total | 5,782 (81.5%) | 1,311 (18.5%) |
Housing Structures by Number of Rooms in Morgan County
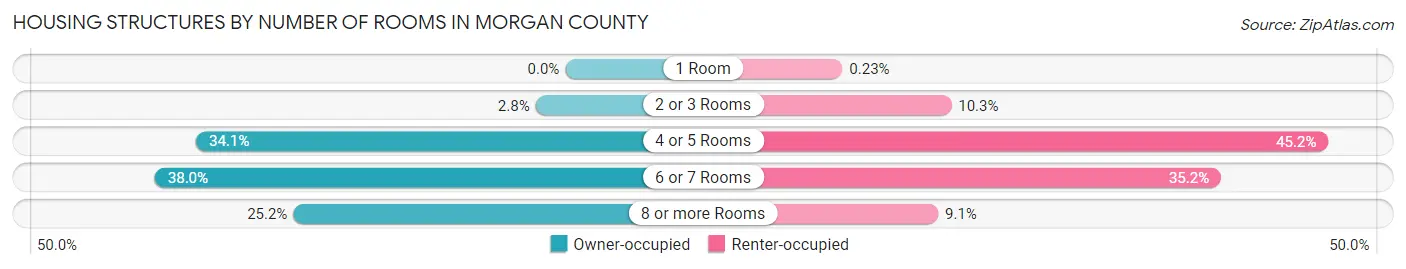
| Number of Rooms | Owner-occupied | Renter-occupied |
| 1 Room | 0 (0.0%) | 3 (0.2%) |
| 2 or 3 Rooms | 159 (2.8%) | 135 (10.3%) |
| 4 or 5 Rooms | 1,974 (34.1%) | 592 (45.2%) |
| 6 or 7 Rooms | 2,194 (38.0%) | 462 (35.2%) |
| 8 or more Rooms | 1,455 (25.2%) | 119 (9.1%) |
| Total | 5,782 (100.0%) | 1,311 (100.0%) |
Housing Structure by Heating Type in Morgan County
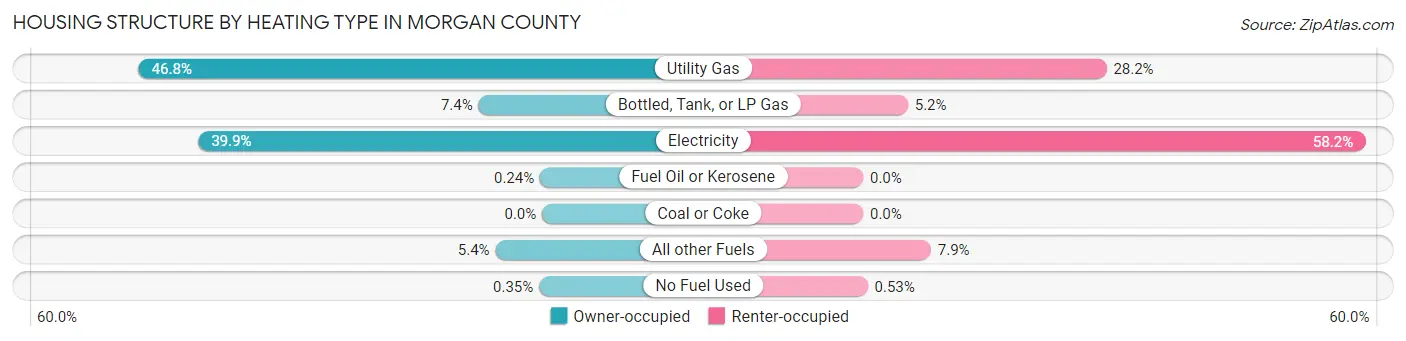
| Heating Type | Owner-occupied | Renter-occupied |
| Utility Gas | 2,704 (46.8%) | 370 (28.2%) |
| Bottled, Tank, or LP Gas | 426 (7.4%) | 68 (5.2%) |
| Electricity | 2,305 (39.9%) | 763 (58.2%) |
| Fuel Oil or Kerosene | 14 (0.2%) | 0 (0.0%) |
| Coal or Coke | 0 (0.0%) | 0 (0.0%) |
| All other Fuels | 313 (5.4%) | 103 (7.9%) |
| No Fuel Used | 20 (0.4%) | 7 (0.5%) |
| Total | 5,782 (100.0%) | 1,311 (100.0%) |
Household Vehicle Usage in Morgan County
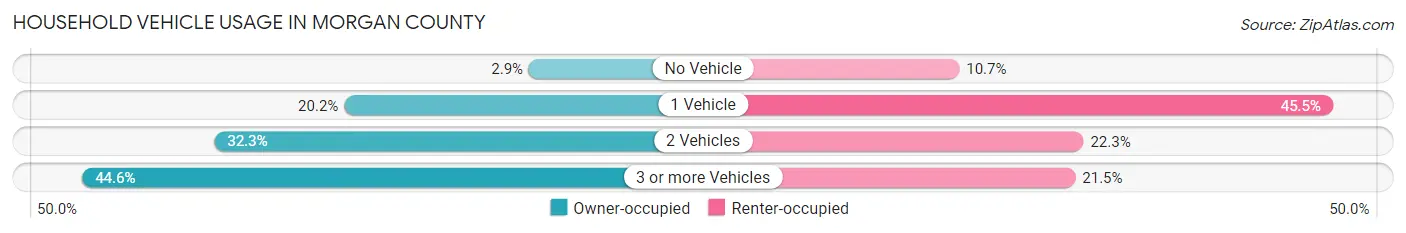
| Vehicles per Household | Owner-occupied | Renter-occupied |
| No Vehicle | 169 (2.9%) | 140 (10.7%) |
| 1 Vehicle | 1,166 (20.2%) | 597 (45.5%) |
| 2 Vehicles | 1,867 (32.3%) | 292 (22.3%) |
| 3 or more Vehicles | 2,580 (44.6%) | 282 (21.5%) |
| Total | 5,782 (100.0%) | 1,311 (100.0%) |
Real Estate & Mortgages in Morgan County
Real Estate and Mortgage Overview in Morgan County
| Characteristic | Without Mortgage | With Mortgage |
| Housing Units | 3,135 | 2,647 |
| Median Property Value | $118,300 | $144,000 |
| Median Household Income | $45,291 | $277 |
| Monthly Housing Costs | $387 | $65 |
| Real Estate Taxes | $777 | $33 |
Property Value by Mortgage Status in Morgan County
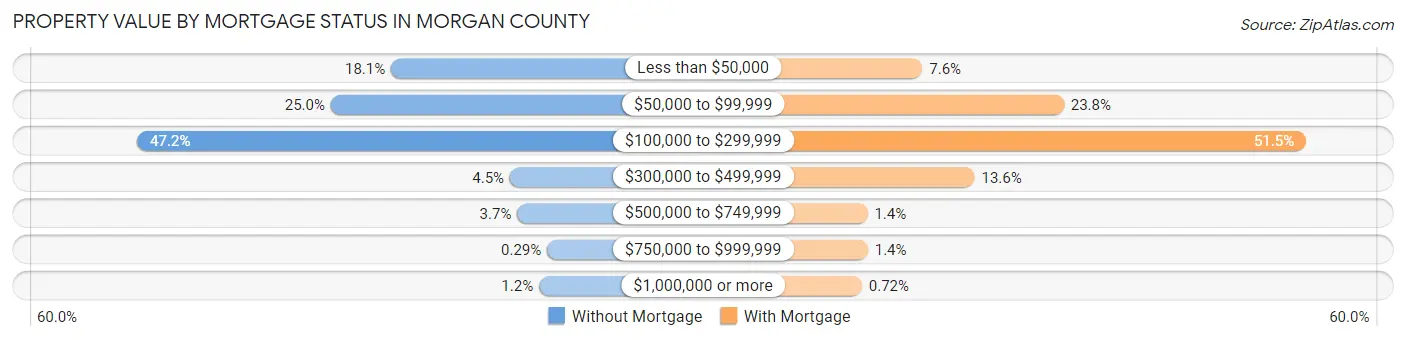
| Property Value | Without Mortgage | With Mortgage |
| Less than $50,000 | 568 (18.1%) | 202 (7.6%) |
| $50,000 to $99,999 | 784 (25.0%) | 630 (23.8%) |
| $100,000 to $299,999 | 1,478 (47.1%) | 1,363 (51.5%) |
| $300,000 to $499,999 | 142 (4.5%) | 360 (13.6%) |
| $500,000 to $749,999 | 116 (3.7%) | 36 (1.4%) |
| $750,000 to $999,999 | 9 (0.3%) | 37 (1.4%) |
| $1,000,000 or more | 38 (1.2%) | 19 (0.7%) |
| Total | 3,135 (100.0%) | 2,647 (100.0%) |
Household Income by Mortgage Status in Morgan County
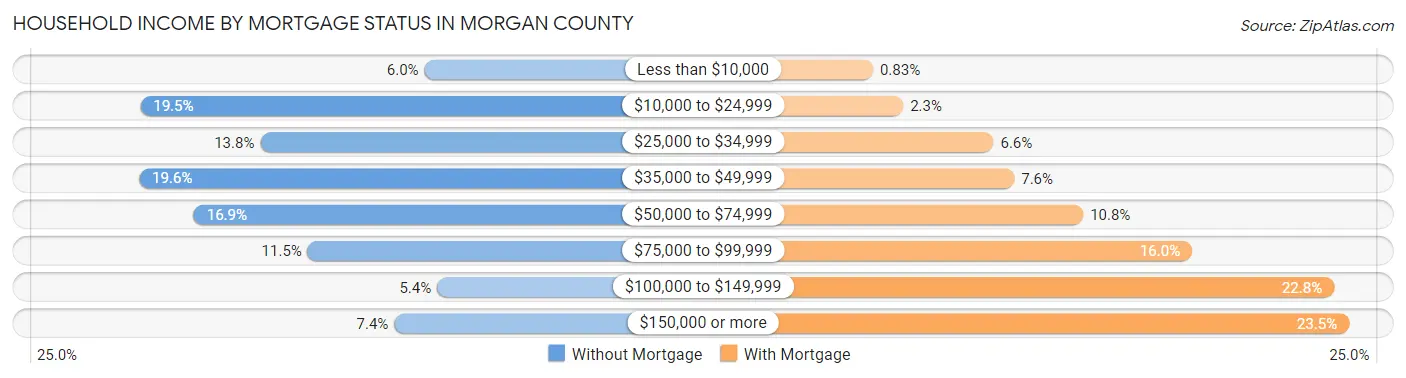
| Household Income | Without Mortgage | With Mortgage |
| Less than $10,000 | 187 (6.0%) | 22 (0.8%) |
| $10,000 to $24,999 | 611 (19.5%) | 60 (2.3%) |
| $25,000 to $34,999 | 432 (13.8%) | 174 (6.6%) |
| $35,000 to $49,999 | 613 (19.6%) | 200 (7.6%) |
| $50,000 to $74,999 | 531 (16.9%) | 287 (10.8%) |
| $75,000 to $99,999 | 361 (11.5%) | 424 (16.0%) |
| $100,000 to $149,999 | 168 (5.4%) | 603 (22.8%) |
| $150,000 or more | 232 (7.4%) | 622 (23.5%) |
| Total | 3,135 (100.0%) | 2,647 (100.0%) |
Property Value to Household Income Ratio in Morgan County
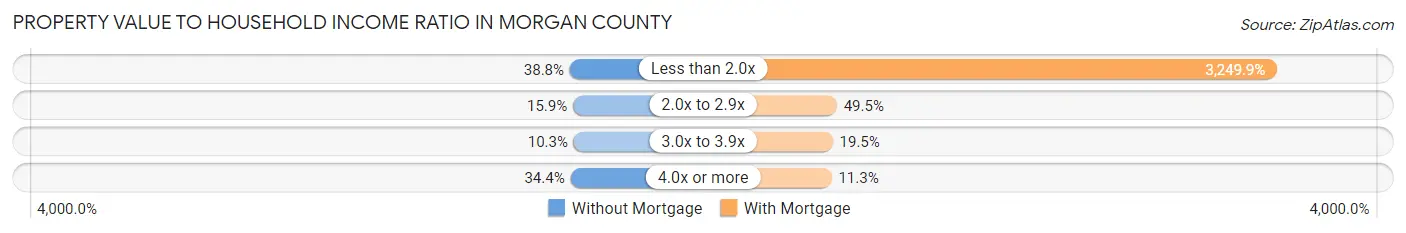
| Value-to-Income Ratio | Without Mortgage | With Mortgage |
| Less than 2.0x | 1,215 (38.8%) | 86,024 (3,249.9%) |
| 2.0x to 2.9x | 497 (15.9%) | 1,310 (49.5%) |
| 3.0x to 3.9x | 322 (10.3%) | 515 (19.5%) |
| 4.0x or more | 1,079 (34.4%) | 299 (11.3%) |
| Total | 3,135 (100.0%) | 2,647 (100.0%) |
Real Estate Taxes by Mortgage Status in Morgan County
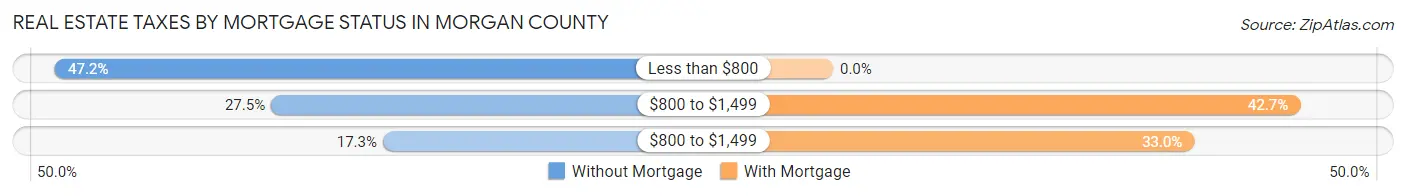
| Property Taxes | Without Mortgage | With Mortgage |
| Less than $800 | 1,480 (47.2%) | 0 (0.0%) |
| $800 to $1,499 | 862 (27.5%) | 1,129 (42.6%) |
| $800 to $1,499 | 542 (17.3%) | 873 (33.0%) |
| Total | 3,135 (100.0%) | 2,647 (100.0%) |
Health & Disability in Morgan County
Health Insurance Coverage by Age in Morgan County
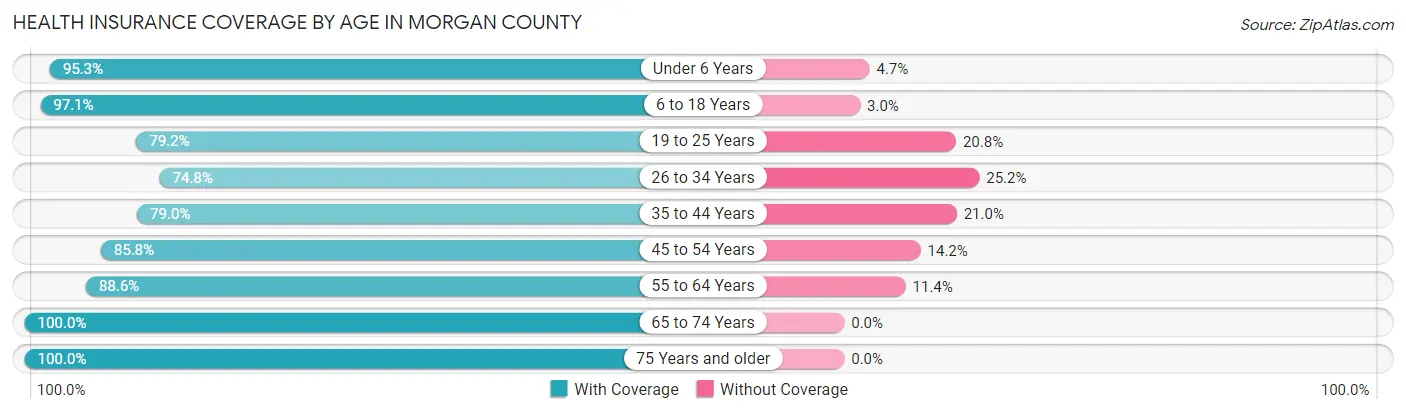
| Age Bracket | With Coverage | Without Coverage |
| Under 6 Years | 1,031 (95.3%) | 51 (4.7%) |
| 6 to 18 Years | 3,024 (97.1%) | 92 (2.9%) |
| 19 to 25 Years | 1,330 (79.2%) | 350 (20.8%) |
| 26 to 34 Years | 1,391 (74.8%) | 468 (25.2%) |
| 35 to 44 Years | 1,639 (79.0%) | 435 (21.0%) |
| 45 to 54 Years | 2,212 (85.8%) | 367 (14.2%) |
| 55 to 64 Years | 2,462 (88.6%) | 318 (11.4%) |
| 65 to 74 Years | 2,299 (100.0%) | 0 (0.0%) |
| 75 Years and older | 1,400 (100.0%) | 0 (0.0%) |
| Total | 16,788 (89.0%) | 2,081 (11.0%) |
Health Insurance Coverage by Citizenship Status in Morgan County
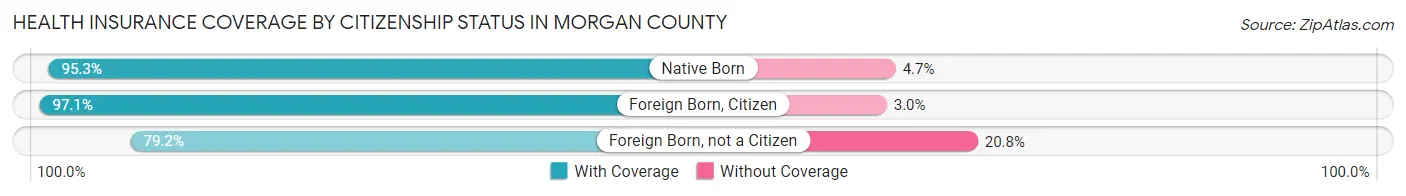
| Citizenship Status | With Coverage | Without Coverage |
| Native Born | 1,031 (95.3%) | 51 (4.7%) |
| Foreign Born, Citizen | 3,024 (97.1%) | 92 (2.9%) |
| Foreign Born, not a Citizen | 1,330 (79.2%) | 350 (20.8%) |
Health Insurance Coverage by Household Income in Morgan County
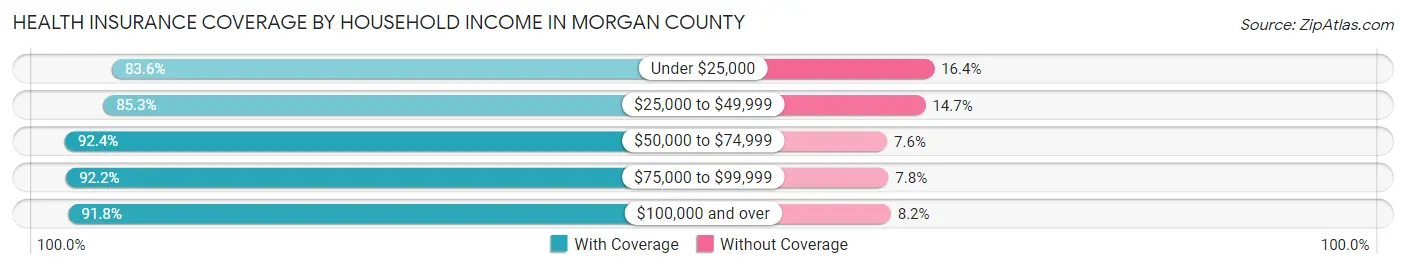
| Household Income | With Coverage | Without Coverage |
| Under $25,000 | 2,669 (83.6%) | 523 (16.4%) |
| $25,000 to $49,999 | 3,852 (85.3%) | 666 (14.7%) |
| $50,000 to $74,999 | 2,849 (92.4%) | 233 (7.6%) |
| $75,000 to $99,999 | 2,660 (92.2%) | 225 (7.8%) |
| $100,000 and over | 4,741 (91.8%) | 426 (8.2%) |
Public vs Private Health Insurance Coverage by Age in Morgan County
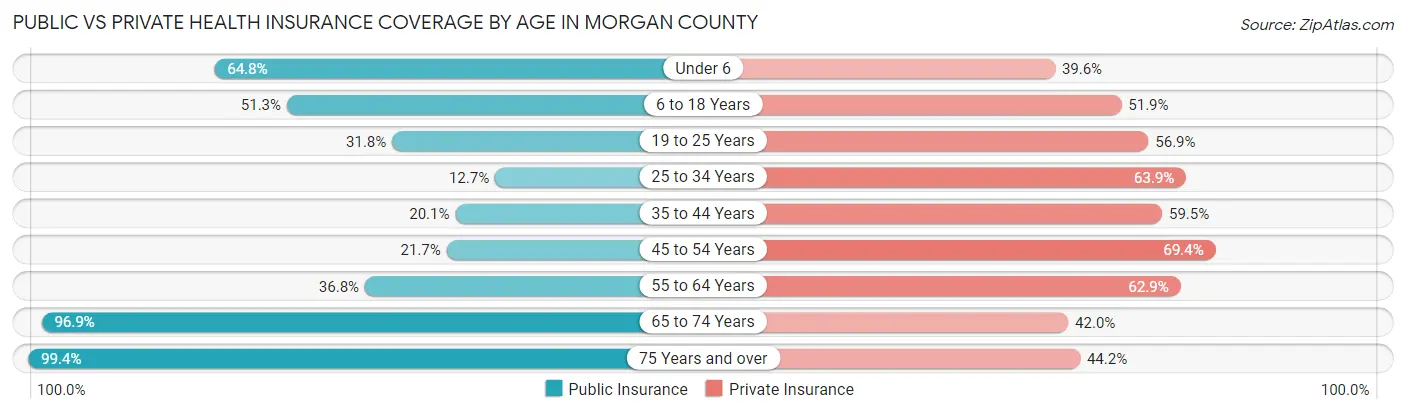
| Age Bracket | Public Insurance | Private Insurance |
| Under 6 | 701 (64.8%) | 428 (39.6%) |
| 6 to 18 Years | 1,599 (51.3%) | 1,617 (51.9%) |
| 19 to 25 Years | 534 (31.8%) | 956 (56.9%) |
| 25 to 34 Years | 236 (12.7%) | 1,188 (63.9%) |
| 35 to 44 Years | 416 (20.1%) | 1,233 (59.5%) |
| 45 to 54 Years | 559 (21.7%) | 1,789 (69.4%) |
| 55 to 64 Years | 1,024 (36.8%) | 1,748 (62.9%) |
| 65 to 74 Years | 2,227 (96.9%) | 966 (42.0%) |
| 75 Years and over | 1,391 (99.4%) | 619 (44.2%) |
| Total | 8,687 (46.0%) | 10,544 (55.9%) |
Disability Status by Sex by Age in Morgan County
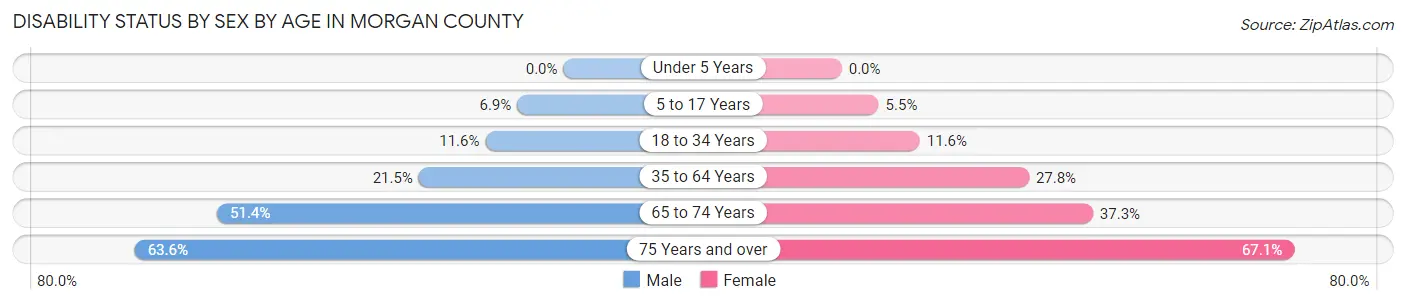
| Age Bracket | Male | Female |
| Under 5 Years | 0 (0.0%) | 0 (0.0%) |
| 5 to 17 Years | 104 (6.9%) | 84 (5.5%) |
| 18 to 34 Years | 228 (11.6%) | 201 (11.6%) |
| 35 to 64 Years | 795 (21.5%) | 1,037 (27.8%) |
| 65 to 74 Years | 563 (51.4%) | 449 (37.3%) |
| 75 Years and over | 399 (63.6%) | 519 (67.1%) |
Disability Class by Sex by Age in Morgan County
Disability Class: Hearing Difficulty
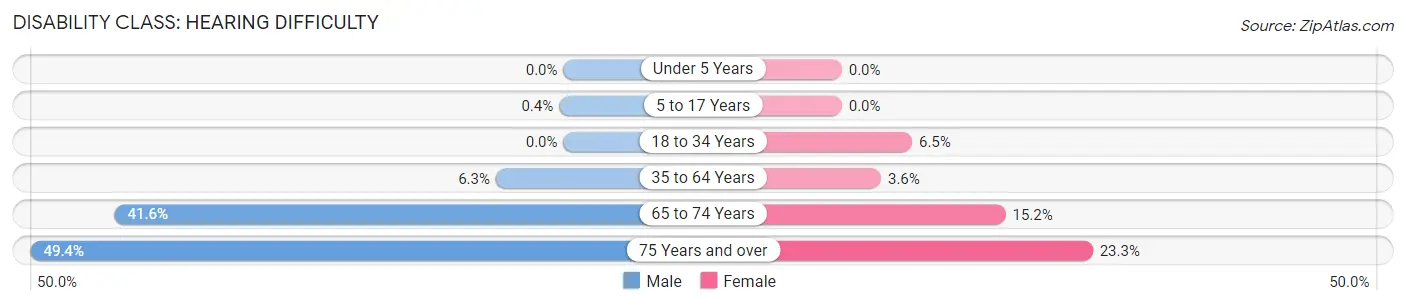
| Age Bracket | Male | Female |
| Under 5 Years | 0 (0.0%) | 0 (0.0%) |
| 5 to 17 Years | 6 (0.4%) | 0 (0.0%) |
| 18 to 34 Years | 0 (0.0%) | 113 (6.5%) |
| 35 to 64 Years | 232 (6.3%) | 136 (3.6%) |
| 65 to 74 Years | 456 (41.6%) | 183 (15.2%) |
| 75 Years and over | 310 (49.4%) | 180 (23.3%) |
Disability Class: Vision Difficulty
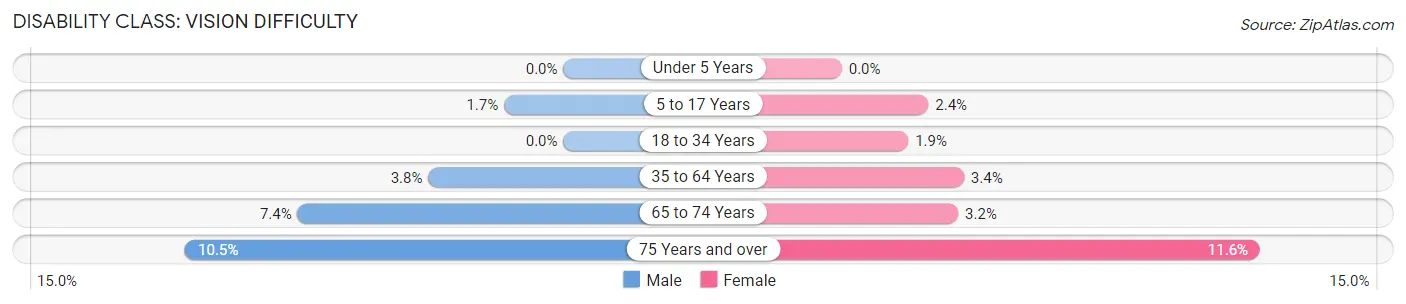
| Age Bracket | Male | Female |
| Under 5 Years | 0 (0.0%) | 0 (0.0%) |
| 5 to 17 Years | 25 (1.7%) | 37 (2.4%) |
| 18 to 34 Years | 0 (0.0%) | 32 (1.8%) |
| 35 to 64 Years | 139 (3.8%) | 127 (3.4%) |
| 65 to 74 Years | 81 (7.4%) | 39 (3.2%) |
| 75 Years and over | 66 (10.5%) | 90 (11.6%) |
Disability Class: Cognitive Difficulty
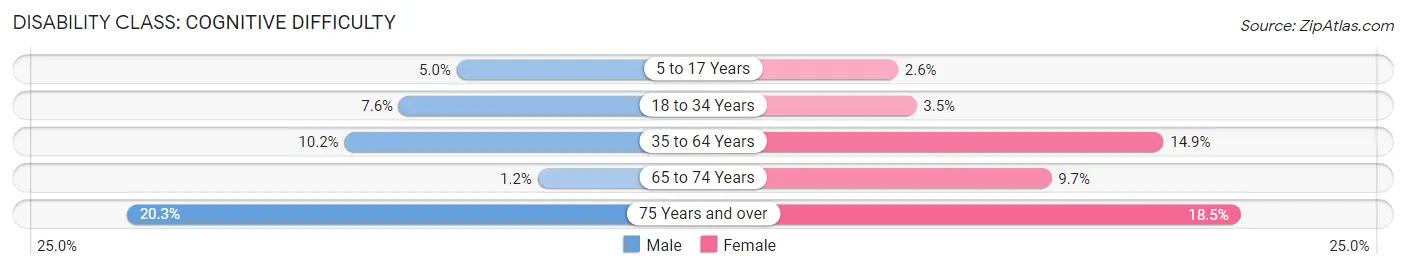
| Age Bracket | Male | Female |
| 5 to 17 Years | 75 (5.0%) | 40 (2.6%) |
| 18 to 34 Years | 150 (7.6%) | 60 (3.5%) |
| 35 to 64 Years | 376 (10.2%) | 557 (14.9%) |
| 65 to 74 Years | 13 (1.2%) | 117 (9.7%) |
| 75 Years and over | 127 (20.3%) | 143 (18.5%) |
Disability Class: Ambulatory Difficulty
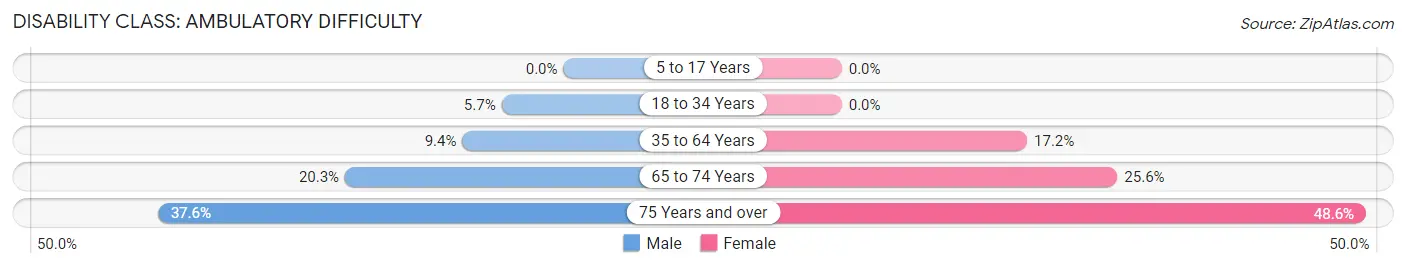
| Age Bracket | Male | Female |
| 5 to 17 Years | 0 (0.0%) | 0 (0.0%) |
| 18 to 34 Years | 113 (5.7%) | 0 (0.0%) |
| 35 to 64 Years | 347 (9.4%) | 642 (17.2%) |
| 65 to 74 Years | 222 (20.3%) | 308 (25.6%) |
| 75 Years and over | 236 (37.6%) | 376 (48.6%) |
Disability Class: Self-Care Difficulty
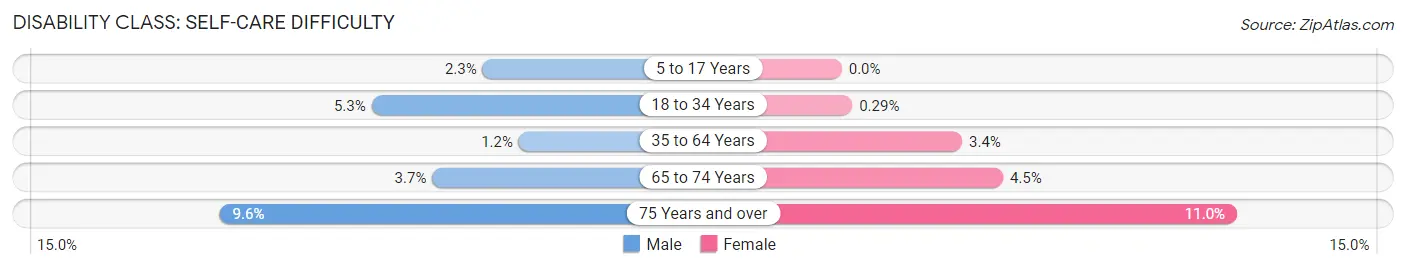
| Age Bracket | Male | Female |
| 5 to 17 Years | 34 (2.2%) | 0 (0.0%) |
| 18 to 34 Years | 105 (5.3%) | 5 (0.3%) |
| 35 to 64 Years | 46 (1.2%) | 125 (3.4%) |
| 65 to 74 Years | 40 (3.6%) | 54 (4.5%) |
| 75 Years and over | 60 (9.6%) | 85 (11.0%) |
Technology Access in Morgan County
Computing Device Access in Morgan County
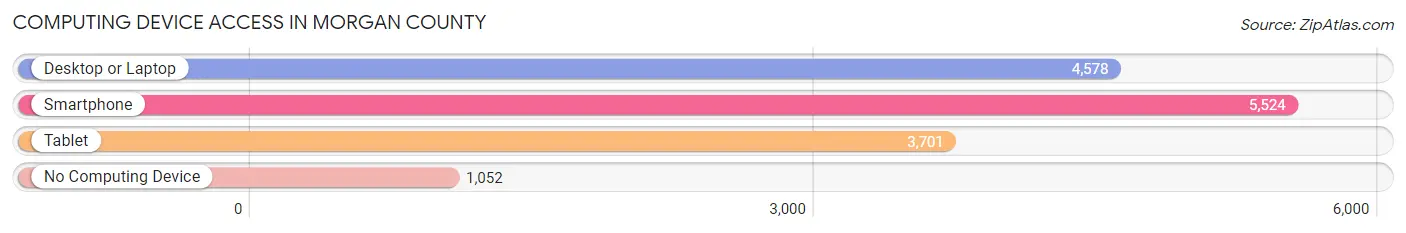
| Device Type | # Households | % Households |
| Desktop or Laptop | 4,578 | 64.5% |
| Smartphone | 5,524 | 77.9% |
| Tablet | 3,701 | 52.2% |
| No Computing Device | 1,052 | 14.8% |
| Total | 7,093 | 100.0% |
Internet Access in Morgan County
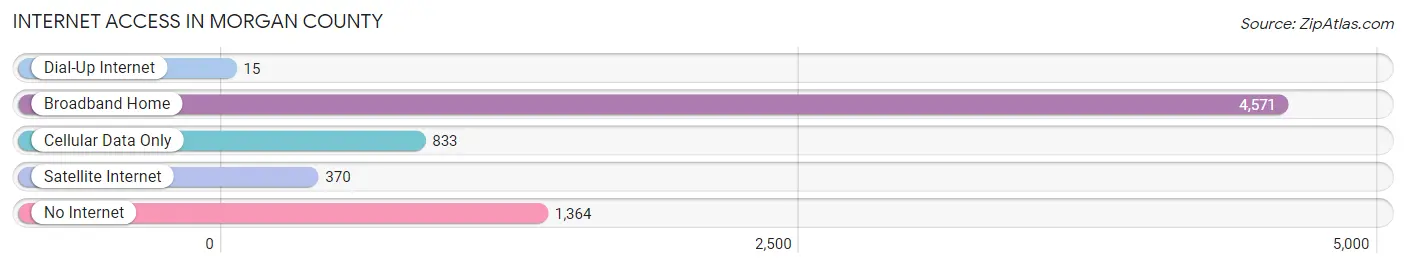
| Internet Type | # Households | % Households |
| Dial-Up Internet | 15 | 0.2% |
| Broadband Home | 4,571 | 64.4% |
| Cellular Data Only | 833 | 11.7% |
| Satellite Internet | 370 | 5.2% |
| No Internet | 1,364 | 19.2% |
| Total | 7,093 | 100.0% |
Morgan County Summary
Morgan County is located in the northeastern corner of Tennessee, and is part of the Cumberland Plateau region. It is bordered by Anderson County to the north, Scott County to the east, Fentress County to the south, and Roane County to the west. The county seat is Wartburg, and the largest city is Oakdale. The county was established in 1817 and named for Daniel Morgan, a Revolutionary War hero.
Geography
Morgan County covers an area of approximately 437 square miles, with a population of 19,919 as of the 2010 census. The terrain is mostly hilly, with elevations ranging from 800 to 1,800 feet above sea level. The county is drained by the Clinch River, which forms the northern boundary. The county is mostly forested, with oak, hickory, and pine trees dominating the landscape.
Economy
The economy of Morgan County is largely based on agriculture and forestry. The county is home to several large farms, and the timber industry is a major employer. Other industries include manufacturing, retail, and tourism. The county is home to several state parks, including Frozen Head State Park and Big South Fork National River and Recreation Area.
Demographics
As of the 2010 census, the population of Morgan County was 19,919, with a population density of 45.3 people per square mile. The racial makeup of the county was 95.3% White, 2.2% African American, 0.3% Native American, 0.3% Asian, 0.1% Pacific Islander, 0.7% from other races, and 1.2% from two or more races. Hispanic or Latino of any race were 1.7% of the population.
The median income for a household in the county was $30,945, and the median income for a family was $37,945. The per capita income for the county was $16,845. About 17.2% of families and 21.2% of the population were below the poverty line, including 28.2% of those under age 18 and 16.2% of those age 65 or over.
History
Morgan County was established in 1817 and named for Daniel Morgan, a Revolutionary War hero. The county was originally part of Roane County, and was created to provide better access to the county seat in Kingston. The first settlers arrived in the area in the early 1800s, and the county was officially organized in 1819.
The county was largely agricultural in the early years, with corn, wheat, and tobacco being the main crops. The timber industry also played an important role in the county's economy, and the county was home to several sawmills and gristmills.
In the late 1800s, the county began to develop a tourism industry, with several resorts and hotels being built in the area. The county also became a popular destination for hunting and fishing.
Today, Morgan County is a rural county with a strong agricultural and forestry base. The county is home to several state parks, and is a popular destination for outdoor recreation.
Common Questions
What is the Total Population of Morgan County?
Total Population of Morgan County is 21,124.
What is the Total Male Population of Morgan County?
Total Male Population of Morgan County is 11,580.
What is the Total Female Population of Morgan County?
Total Female Population of Morgan County is 9,544.
What is the Ratio of Males per 100 Females in Morgan County?
There are 121.33 Males per 100 Females in Morgan County.
What is the Ratio of Females per 100 Males in Morgan County?
There are 82.42 Females per 100 Males in Morgan County.
What is the Median Population Age in Morgan County?
Median Population Age in Morgan County is 41.6 Years.
What is the Average Family Size in Morgan County
Average Family Size in Morgan County is 3.2 People.
What is the Average Household Size in Morgan County
Average Household Size in Morgan County is 2.7 People.
What is Per Capita Income in Morgan County?
Per Capita income in Morgan County is $27,320.
What is the Median Family Income in Morgan County?
Median Family Income in Morgan County is $66,363.
What is the Median Household income in Morgan County?
Median Household Income in Morgan County is $51,971.
What is Income or Wage Gap in Morgan County?
Income or Wage Gap in Morgan County is 39.2%.
Women in Morgan County earn 60.8 cents for every dollar earned by a man.
What is Family Income Deficit in Morgan County?
Family Income Deficit in Morgan County is $10,260.
Families that are below poverty line in Morgan County earn $10,260 less on average than the poverty threshold level.
What is Inequality or Gini Index in Morgan County?
Inequality or Gini Index in Morgan County is 0.47.
How Large is the Labor Force in Morgan County?
There are 8,017 People in the Labor Forcein in Morgan County.
What is the Percentage of People in the Labor Force in Morgan County?
45.7% of People are in the Labor Force in Morgan County.
What is the Unemployment Rate in Morgan County?
Unemployment Rate in Morgan County is 8.4%.