McMinn County, TN
McMinn County Map
McMinn County Overview
53,532
TOTAL POPULATION
26,262
MALE POPULATION
27,270
FEMALE POPULATION
96.30
MALES / 100 FEMALES
103.84
FEMALES / 100 MALES
42.3
MEDIAN AGE
3.0
AVG FAMILY SIZE
2.5
AVG HOUSEHOLD SIZE
$30,334
PER CAPITA INCOME
$69,420
AVG FAMILY INCOME
$57,982
AVG HOUSEHOLD INCOME
36.5%
WAGE / INCOME GAP [ % ]
63.5¢/ $1
WAGE / INCOME GAP [ $ ]
$12,241
FAMILY INCOME DEFICIT
0.45
INEQUALITY / GINI INDEX
24,100
LABOR FORCE [ PEOPLE ]
55.0%
PERCENT IN LABOR FORCE
5.3%
UNEMPLOYMENT RATE
McMinn County Area Codes
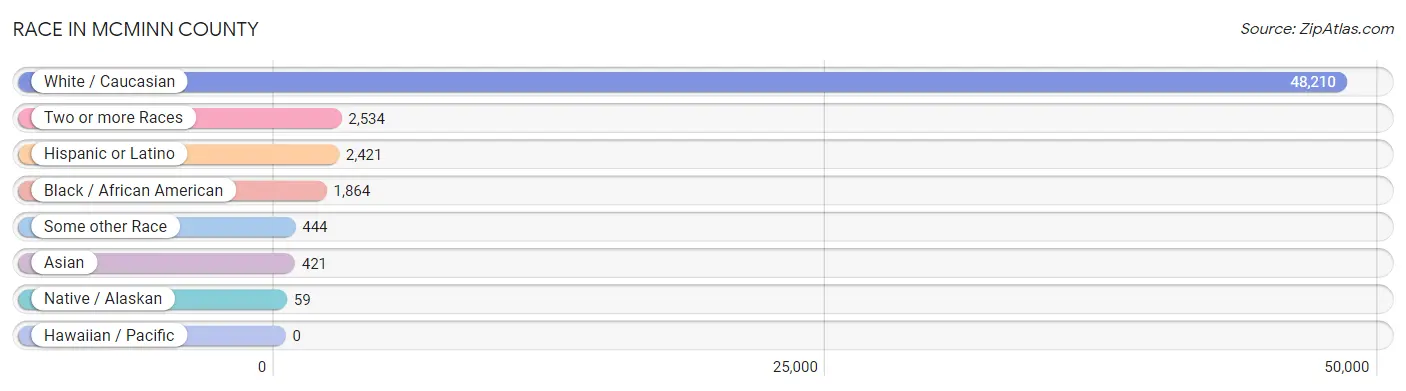
Race in McMinn County
The most populous races in McMinn County are White / Caucasian (48,210 | 90.1%), Two or more Races (2,534 | 4.7%), and Hispanic or Latino (2,421 | 4.5%).
| Race | # Population | % Population |
| Asian | 421 | 0.8% |
| Black / African American | 1,864 | 3.5% |
| Hawaiian / Pacific | 0 | 0.0% |
| Hispanic or Latino | 2,421 | 4.5% |
| Native / Alaskan | 59 | 0.1% |
| White / Caucasian | 48,210 | 90.1% |
| Two or more Races | 2,534 | 4.7% |
| Some other Race | 444 | 0.8% |
| Total | 53,532 | 100.0% |
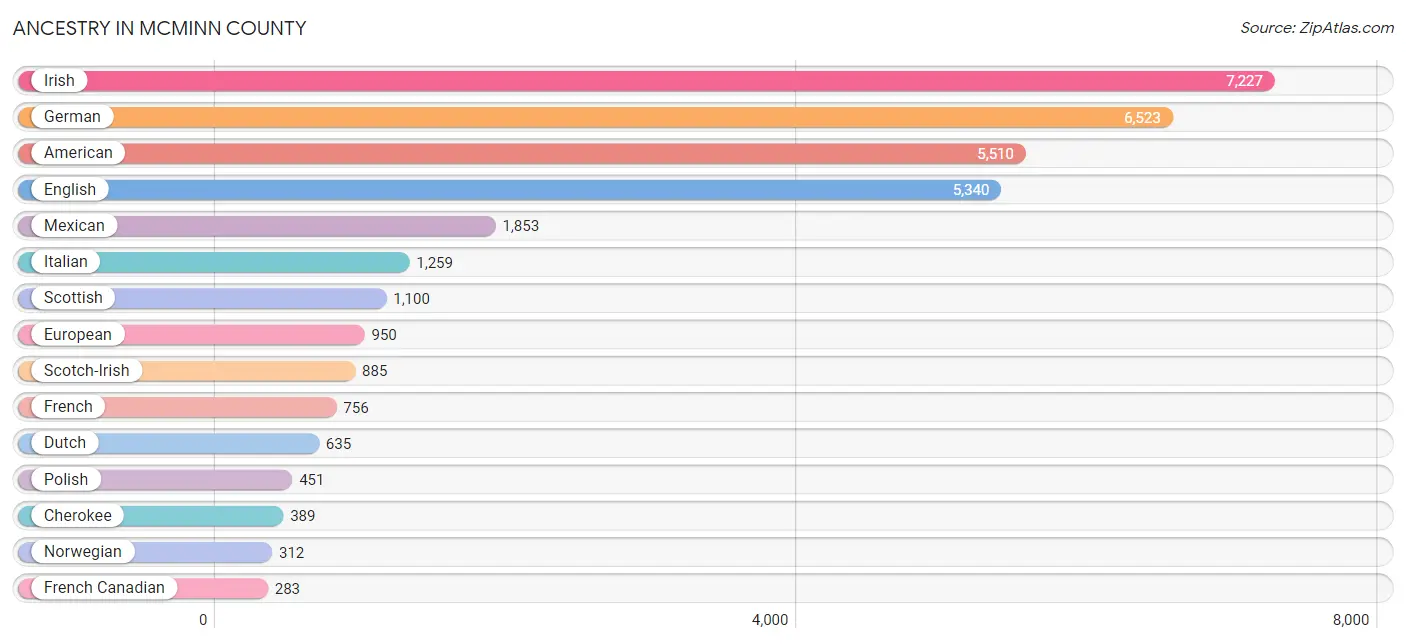
Ancestry in McMinn County
The most populous ancestries reported in McMinn County are Irish (7,227 | 13.5%), German (6,523 | 12.2%), American (5,510 | 10.3%), English (5,340 | 10.0%), and Mexican (1,853 | 3.5%), together accounting for 49.4% of all McMinn County residents.
| Ancestry | # Population | % Population |
| African | 136 | 0.3% |
| American | 5,510 | 10.3% |
| Apache | 2 | 0.0% |
| Arab | 43 | 0.1% |
| Argentinean | 21 | 0.0% |
| Austrian | 43 | 0.1% |
| Bhutanese | 47 | 0.1% |
| Blackfeet | 6 | 0.0% |
| Brazilian | 4 | 0.0% |
| British | 172 | 0.3% |
| Burmese | 43 | 0.1% |
| Cambodian | 11 | 0.0% |
| Canadian | 61 | 0.1% |
| Central American | 259 | 0.5% |
| Central American Indian | 2 | 0.0% |
| Cherokee | 389 | 0.7% |
| Chippewa | 42 | 0.1% |
| Colombian | 81 | 0.2% |
| Croatian | 13 | 0.0% |
| Cuban | 30 | 0.1% |
| Czech | 35 | 0.1% |
| Czechoslovakian | 20 | 0.0% |
| Danish | 103 | 0.2% |
| Dutch | 635 | 1.2% |
| Eastern European | 18 | 0.0% |
| English | 5,340 | 10.0% |
| European | 950 | 1.8% |
| Filipino | 2 | 0.0% |
| Finnish | 156 | 0.3% |
| French | 756 | 1.4% |
| French Canadian | 283 | 0.5% |
| German | 6,523 | 12.2% |
| Greek | 22 | 0.0% |
| Honduran | 259 | 0.5% |
| Hungarian | 81 | 0.2% |
| Indian (Asian) | 90 | 0.2% |
| Iraqi | 25 | 0.1% |
| Irish | 7,227 | 13.5% |
| Italian | 1,259 | 2.4% |
| Jamaican | 7 | 0.0% |
| Korean | 81 | 0.2% |
| Lebanese | 8 | 0.0% |
| Lithuanian | 27 | 0.1% |
| Malaysian | 57 | 0.1% |
| Mexican | 1,853 | 3.5% |
| Mexican American Indian | 2 | 0.0% |
| Navajo | 19 | 0.0% |
| Northern European | 60 | 0.1% |
| Norwegian | 312 | 0.6% |
| Pakistani | 19 | 0.0% |
| Palestinian | 10 | 0.0% |
| Pennsylvania German | 26 | 0.1% |
| Polish | 451 | 0.8% |
| Portuguese | 23 | 0.0% |
| Potawatomi | 5 | 0.0% |
| Puerto Rican | 142 | 0.3% |
| Russian | 120 | 0.2% |
| Scandinavian | 39 | 0.1% |
| Scotch-Irish | 885 | 1.7% |
| Scottish | 1,100 | 2.1% |
| Slovak | 129 | 0.2% |
| South American | 102 | 0.2% |
| Spaniard | 12 | 0.0% |
| Spanish | 9 | 0.0% |
| Subsaharan African | 136 | 0.3% |
| Swedish | 111 | 0.2% |
| Swiss | 156 | 0.3% |
| Thai | 108 | 0.2% |
| Ukrainian | 21 | 0.0% |
| Welsh | 244 | 0.5% | View All 70 Rows |
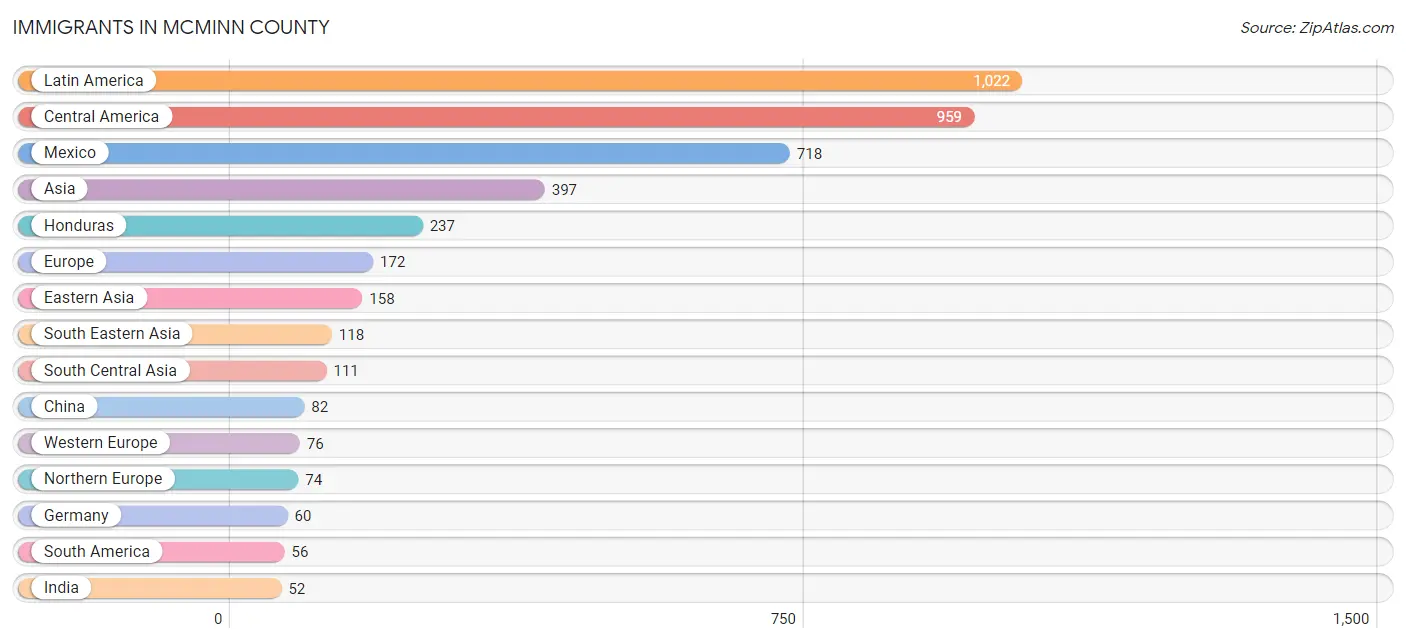
Immigrants in McMinn County
The most numerous immigrant groups reported in McMinn County came from Latin America (1,022 | 1.9%), Central America (959 | 1.8%), Mexico (718 | 1.3%), Asia (397 | 0.7%), and Honduras (237 | 0.4%), together accounting for 6.2% of all McMinn County residents.
| Immigration Origin | # Population | % Population |
| Asia | 397 | 0.7% |
| Australia | 18 | 0.0% |
| Austria | 16 | 0.0% |
| Brazil | 4 | 0.0% |
| Canada | 27 | 0.1% |
| Caribbean | 7 | 0.0% |
| Central America | 959 | 1.8% |
| China | 82 | 0.2% |
| Colombia | 49 | 0.1% |
| Denmark | 38 | 0.1% |
| Eastern Asia | 158 | 0.3% |
| Eastern Europe | 6 | 0.0% |
| England | 21 | 0.0% |
| Europe | 172 | 0.3% |
| Germany | 60 | 0.1% |
| Greece | 16 | 0.0% |
| Guatemala | 4 | 0.0% |
| Honduras | 237 | 0.4% |
| India | 52 | 0.1% |
| Jamaica | 7 | 0.0% |
| Japan | 37 | 0.1% |
| Korea | 28 | 0.1% |
| Laos | 29 | 0.1% |
| Latin America | 1,022 | 1.9% |
| Mexico | 718 | 1.3% |
| Northern Europe | 74 | 0.1% |
| Oceania | 18 | 0.0% |
| Pakistan | 33 | 0.1% |
| Philippines | 50 | 0.1% |
| Russia | 6 | 0.0% |
| South America | 56 | 0.1% |
| South Central Asia | 111 | 0.2% |
| South Eastern Asia | 118 | 0.2% |
| Southern Europe | 16 | 0.0% |
| Taiwan | 6 | 0.0% |
| Thailand | 39 | 0.1% |
| Venezuela | 3 | 0.0% |
| Western Europe | 76 | 0.1% | View All 38 Rows |
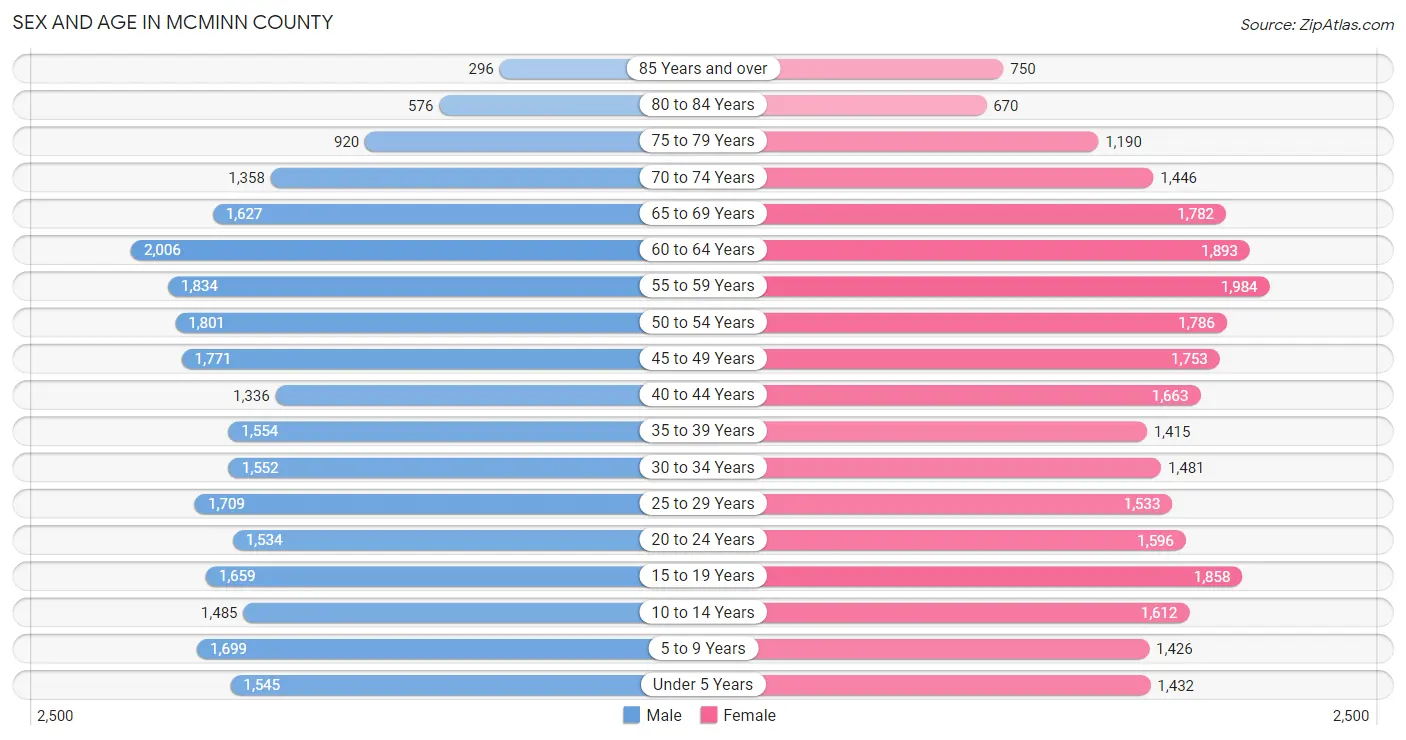
Sex and Age in McMinn County
Sex and Age in McMinn County
The most populous age groups in McMinn County are 60 to 64 Years (2,006 | 7.6%) for men and 55 to 59 Years (1,984 | 7.3%) for women.
| Age Bracket | Male | Female |
| Under 5 Years | 1,545 (5.9%) | 1,432 (5.2%) |
| 5 to 9 Years | 1,699 (6.5%) | 1,426 (5.2%) |
| 10 to 14 Years | 1,485 (5.7%) | 1,612 (5.9%) |
| 15 to 19 Years | 1,659 (6.3%) | 1,858 (6.8%) |
| 20 to 24 Years | 1,534 (5.8%) | 1,596 (5.9%) |
| 25 to 29 Years | 1,709 (6.5%) | 1,533 (5.6%) |
| 30 to 34 Years | 1,552 (5.9%) | 1,481 (5.4%) |
| 35 to 39 Years | 1,554 (5.9%) | 1,415 (5.2%) |
| 40 to 44 Years | 1,336 (5.1%) | 1,663 (6.1%) |
| 45 to 49 Years | 1,771 (6.7%) | 1,753 (6.4%) |
| 50 to 54 Years | 1,801 (6.9%) | 1,786 (6.6%) |
| 55 to 59 Years | 1,834 (7.0%) | 1,984 (7.3%) |
| 60 to 64 Years | 2,006 (7.6%) | 1,893 (6.9%) |
| 65 to 69 Years | 1,627 (6.2%) | 1,782 (6.5%) |
| 70 to 74 Years | 1,358 (5.2%) | 1,446 (5.3%) |
| 75 to 79 Years | 920 (3.5%) | 1,190 (4.4%) |
| 80 to 84 Years | 576 (2.2%) | 670 (2.5%) |
| 85 Years and over | 296 (1.1%) | 750 (2.8%) |
| Total | 26,262 (100.0%) | 27,270 (100.0%) |
Families and Households in McMinn County
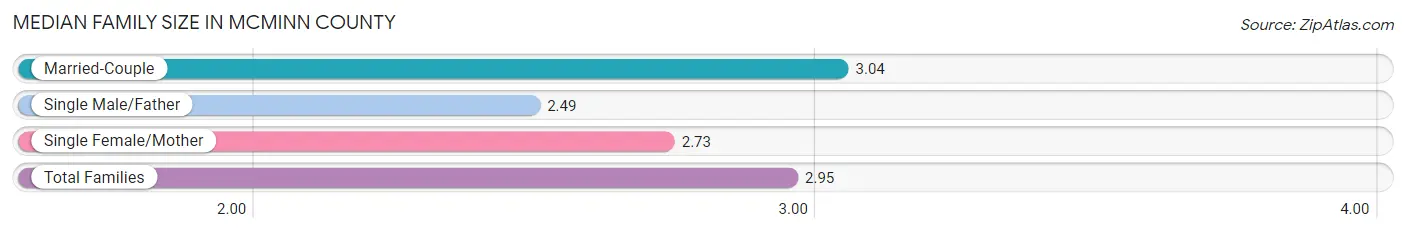
Median Family Size in McMinn County
The median family size in McMinn County is 2.95 persons per family, with married-couple families (11,028 | 75.5%) accounting for the largest median family size of 3.04 persons per family. On the other hand, single male/father families (1,113 | 7.6%) represent the smallest median family size with 2.49 persons per family.
| Family Type | # Families | Family Size |
| Married-Couple | 11,028 (75.5%) | 3.04 |
| Single Male/Father | 1,113 (7.6%) | 2.49 |
| Single Female/Mother | 2,469 (16.9%) | 2.73 |
| Total Families | 14,610 (100.0%) | 2.95 |
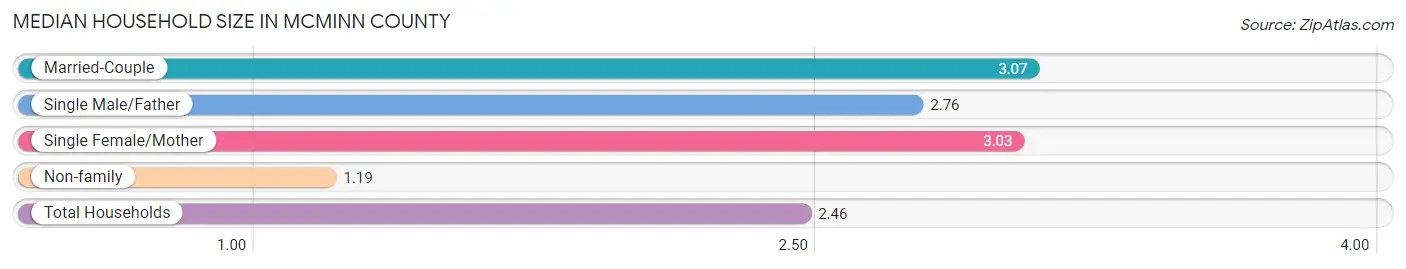
Median Household Size in McMinn County
The median household size in McMinn County is 2.46 persons per household, with married-couple households (11,028 | 51.9%) accounting for the largest median household size of 3.07 persons per household. non-family households (6,620 | 31.2%) represent the smallest median household size with 1.19 persons per household.
| Household Type | # Households | Household Size |
| Married-Couple | 11,028 (51.9%) | 3.07 |
| Single Male/Father | 1,113 (5.2%) | 2.76 |
| Single Female/Mother | 2,469 (11.6%) | 3.03 |
| Non-family | 6,620 (31.2%) | 1.19 |
| Total Households | 21,230 (100.0%) | 2.46 |
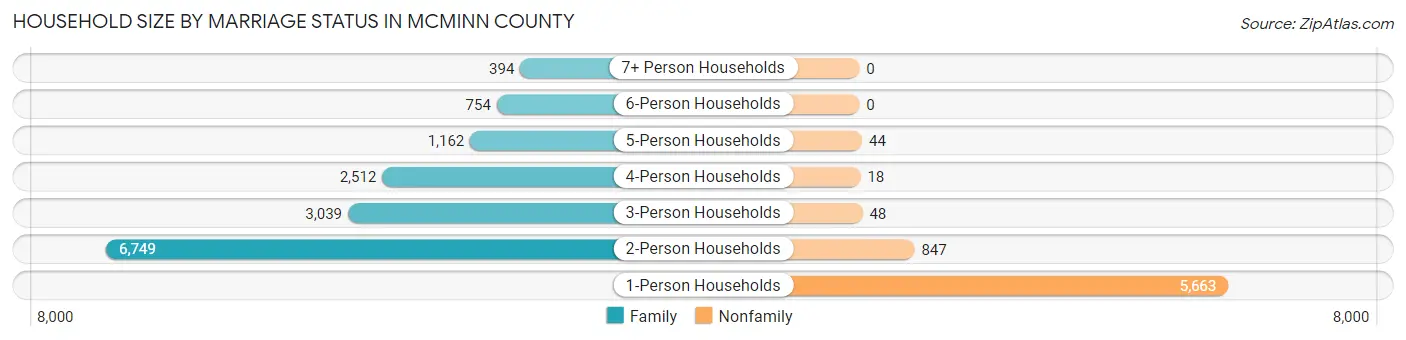
Household Size by Marriage Status in McMinn County
Out of a total of 21,230 households in McMinn County, 14,610 (68.8%) are family households, while 6,620 (31.2%) are nonfamily households. The most numerous type of family households are 2-person households, comprising 6,749, and the most common type of nonfamily households are 1-person households, comprising 5,663.
| Household Size | Family Households | Nonfamily Households |
| 1-Person Households | - | 5,663 (26.7%) |
| 2-Person Households | 6,749 (31.8%) | 847 (4.0%) |
| 3-Person Households | 3,039 (14.3%) | 48 (0.2%) |
| 4-Person Households | 2,512 (11.8%) | 18 (0.1%) |
| 5-Person Households | 1,162 (5.5%) | 44 (0.2%) |
| 6-Person Households | 754 (3.5%) | 0 (0.0%) |
| 7+ Person Households | 394 (1.9%) | 0 (0.0%) |
| Total | 14,610 (68.8%) | 6,620 (31.2%) |
Female Fertility in McMinn County
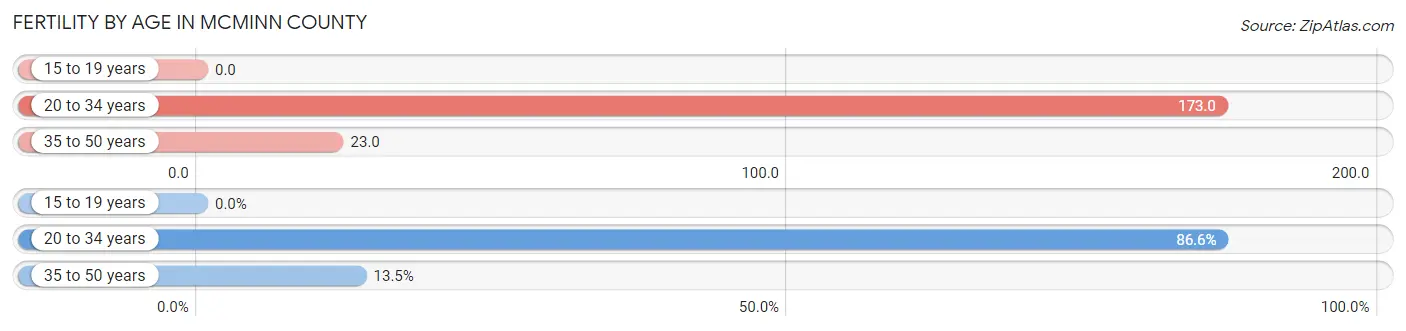
Fertility by Age in McMinn County
Average fertility rate in McMinn County is 78.0 births per 1,000 women. Women in the age bracket of 20 to 34 years have the highest fertility rate with 173.0 births per 1,000 women. Women in the age bracket of 20 to 34 years acount for 86.6% of all women with births.
| Age Bracket | Women with Births | Births / 1,000 Women |
| 15 to 19 years | 0 (0.0%) | 0.0 |
| 20 to 34 years | 798 (86.6%) | 173.0 |
| 35 to 50 years | 124 (13.5%) | 23.0 |
| Total | 922 (100.0%) | 78.0 |
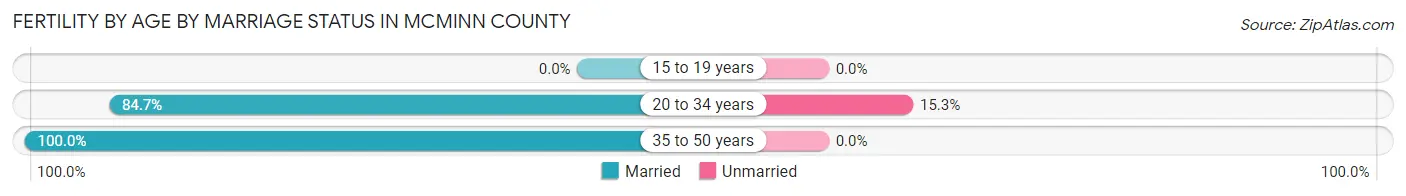
Fertility by Age by Marriage Status in McMinn County
86.8% of women with births (922) in McMinn County are married. The highest percentage of unmarried women with births falls into 20 to 34 years age bracket with 15.3% of them unmarried at the time of birth, while the lowest percentage of unmarried women with births belong to 35 to 50 years age bracket with 0.0% of them unmarried.
| Age Bracket | Married | Unmarried |
| 15 to 19 years | 0 (0.0%) | 0 (0.0%) |
| 20 to 34 years | 676 (84.7%) | 122 (15.3%) |
| 35 to 50 years | 124 (100.0%) | 0 (0.0%) |
| Total | 800 (86.8%) | 122 (13.2%) |
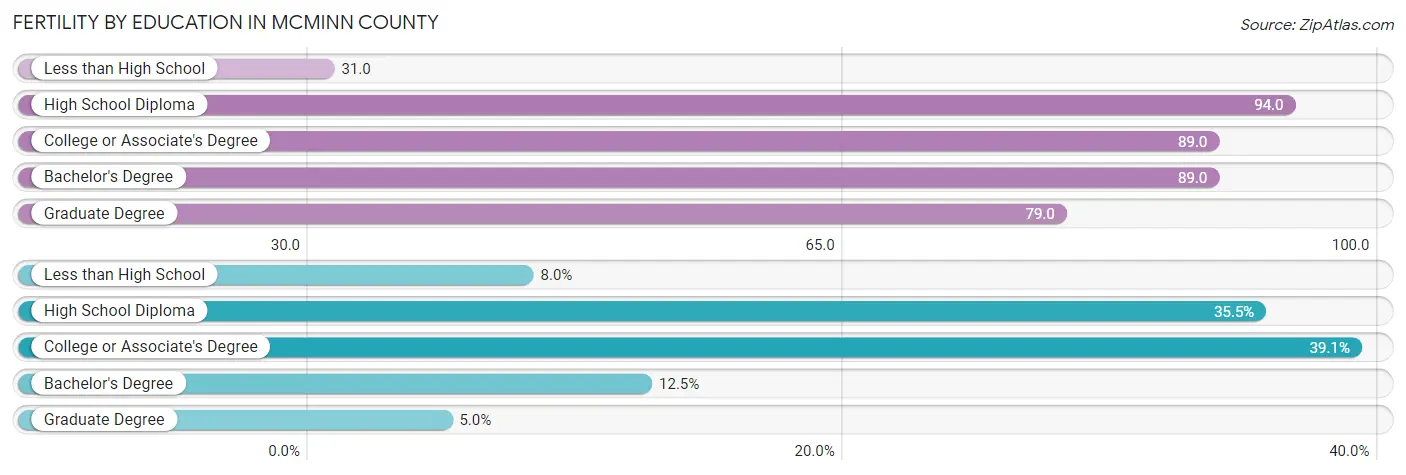
Fertility by Education in McMinn County
Average fertility rate in McMinn County is 78.0 births per 1,000 women. Women with the education attainment of high school diploma have the highest fertility rate of 94.0 births per 1,000 women, while women with the education attainment of less than high school have the lowest fertility at 31.0 births per 1,000 women. Women with the education attainment of college or associate's degree represent 39.1% of all women with births.
| Educational Attainment | Women with Births | Births / 1,000 Women |
| Less than High School | 74 (8.0%) | 31.0 |
| High School Diploma | 327 (35.5%) | 94.0 |
| College or Associate's Degree | 360 (39.1%) | 89.0 |
| Bachelor's Degree | 115 (12.5%) | 89.0 |
| Graduate Degree | 46 (5.0%) | 79.0 |
| Total | 922 (100.0%) | 78.0 |
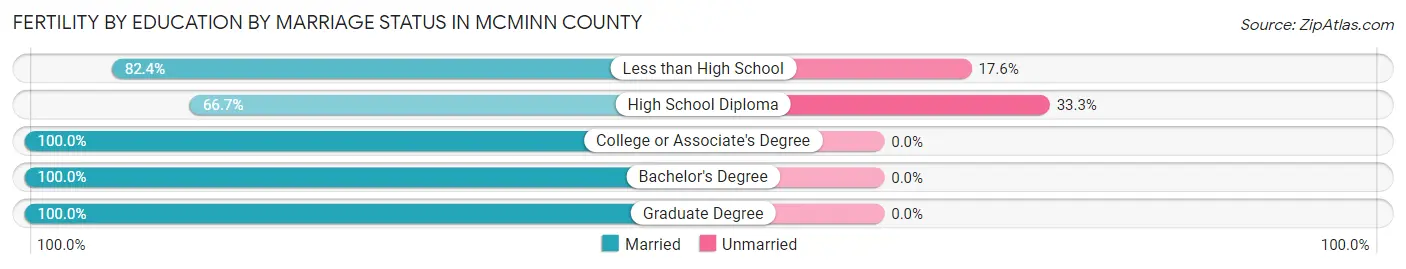
Fertility by Education by Marriage Status in McMinn County
13.2% of women with births in McMinn County are unmarried. Women with the educational attainment of college or associate's degree are most likely to be married with 100.0% of them married at childbirth, while women with the educational attainment of high school diploma are least likely to be married with 33.3% of them unmarried at childbirth.
| Educational Attainment | Married | Unmarried |
| Less than High School | 61 (82.4%) | 13 (17.6%) |
| High School Diploma | 218 (66.7%) | 109 (33.3%) |
| College or Associate's Degree | 360 (100.0%) | 0 (0.0%) |
| Bachelor's Degree | 115 (100.0%) | 0 (0.0%) |
| Graduate Degree | 46 (100.0%) | 0 (0.0%) |
| Total | 800 (86.8%) | 122 (13.2%) |
Income in McMinn County
Income Overview in McMinn County
Per Capita Income in McMinn County is $30,334, while median incomes of families and households are $69,420 and $57,982 respectively.
| Characteristic | Number | Measure |
| Per Capita Income | 53,532 | $30,334 |
| Median Family Income | 14,610 | $69,420 |
| Mean Family Income | 14,610 | $86,015 |
| Median Household Income | 21,230 | $57,982 |
| Mean Household Income | 21,230 | $75,745 |
| Income Deficit | 14,610 | $12,241 |
| Wage / Income Gap (%) | 53,532 | 36.46% |
| Wage / Income Gap ($) | 53,532 | 63.54¢ per $1 |
| Gini / Inequality Index | 53,532 | 0.45 |
Earnings by Sex in McMinn County
Average Earnings in McMinn County are $37,768, $45,215 for men and $28,731 for women, a difference of 36.5%.
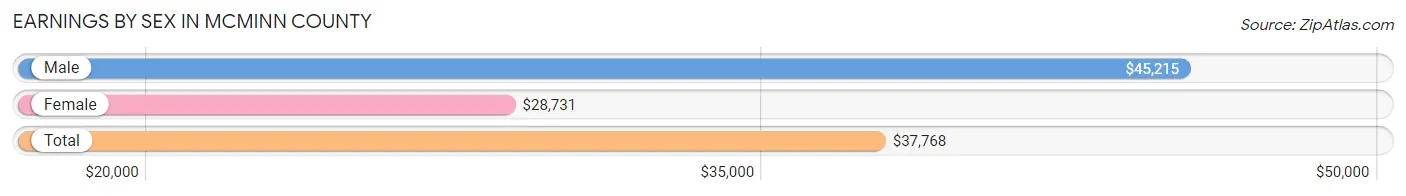
| Sex | Number | Average Earnings |
| Male | 13,490 (52.8%) | $45,215 |
| Female | 12,037 (47.1%) | $28,731 |
| Total | 25,527 (100.0%) | $37,768 |
Earnings by Sex by Income Bracket in McMinn County
The most common earnings brackets in McMinn County are $75,000 to $99,999 for men (1,449 | 10.7%) and $25,000 to $29,999 for women (914 | 7.6%).
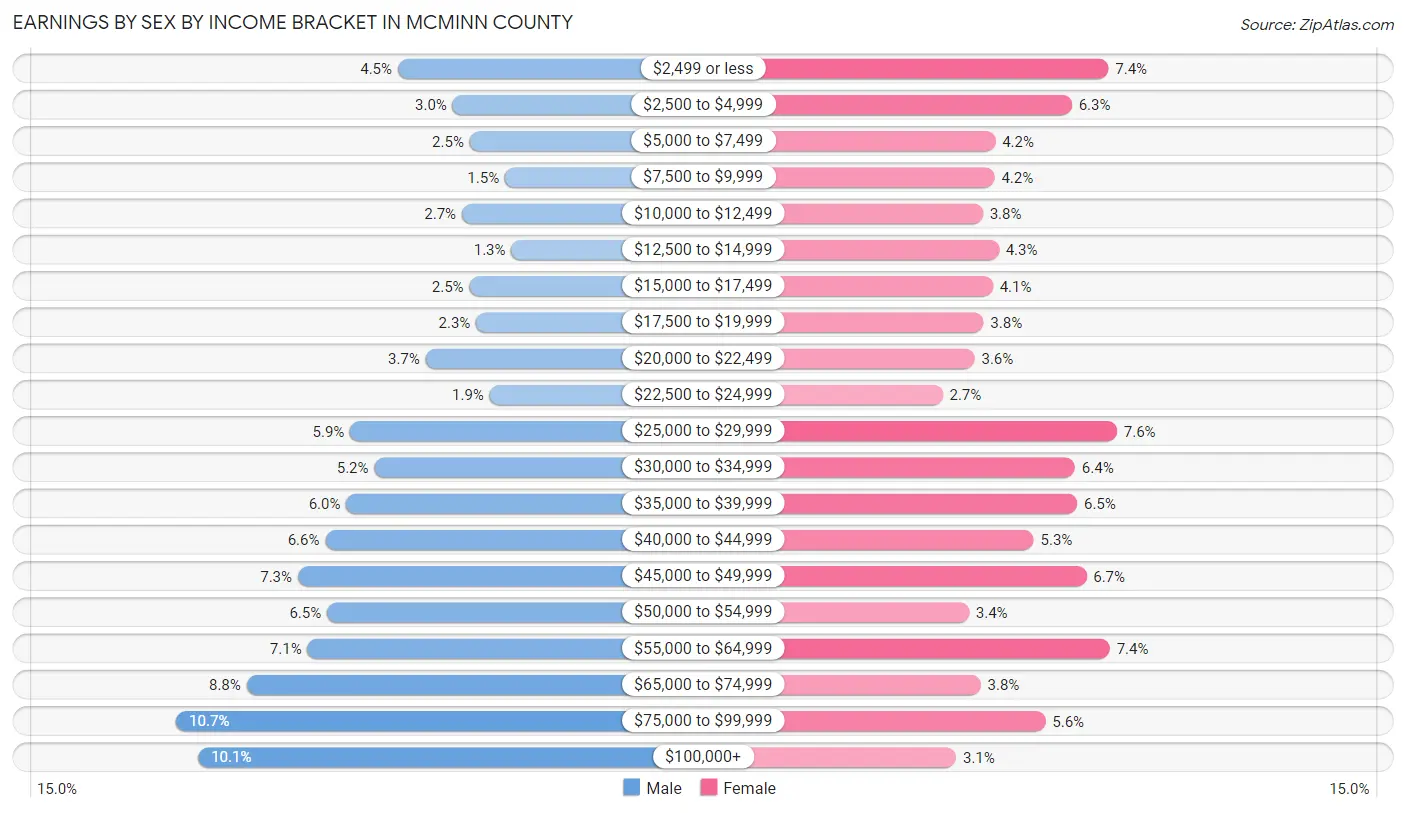
| Income | Male | Female |
| $2,499 or less | 609 (4.5%) | 885 (7.3%) |
| $2,500 to $4,999 | 400 (3.0%) | 761 (6.3%) |
| $5,000 to $7,499 | 336 (2.5%) | 502 (4.2%) |
| $7,500 to $9,999 | 202 (1.5%) | 500 (4.2%) |
| $10,000 to $12,499 | 366 (2.7%) | 460 (3.8%) |
| $12,500 to $14,999 | 178 (1.3%) | 514 (4.3%) |
| $15,000 to $17,499 | 337 (2.5%) | 494 (4.1%) |
| $17,500 to $19,999 | 311 (2.3%) | 462 (3.8%) |
| $20,000 to $22,499 | 503 (3.7%) | 432 (3.6%) |
| $22,500 to $24,999 | 261 (1.9%) | 324 (2.7%) |
| $25,000 to $29,999 | 789 (5.9%) | 914 (7.6%) |
| $30,000 to $34,999 | 698 (5.2%) | 772 (6.4%) |
| $35,000 to $39,999 | 804 (6.0%) | 779 (6.5%) |
| $40,000 to $44,999 | 884 (6.6%) | 632 (5.2%) |
| $45,000 to $49,999 | 988 (7.3%) | 810 (6.7%) |
| $50,000 to $54,999 | 877 (6.5%) | 413 (3.4%) |
| $55,000 to $64,999 | 951 (7.0%) | 890 (7.4%) |
| $65,000 to $74,999 | 1,182 (8.8%) | 452 (3.8%) |
| $75,000 to $99,999 | 1,449 (10.7%) | 672 (5.6%) |
| $100,000+ | 1,365 (10.1%) | 369 (3.1%) |
| Total | 13,490 (100.0%) | 12,037 (100.0%) |
Earnings by Sex by Educational Attainment in McMinn County
Average earnings in McMinn County are $47,495 for men and $35,248 for women, a difference of 25.8%. Men with an educational attainment of bachelor's degree enjoy the highest average annual earnings of $68,588, while those with less than high school education earn the least with $36,250. Women with an educational attainment of graduate degree earn the most with the average annual earnings of $60,347, while those with less than high school education have the smallest earnings of $21,512.
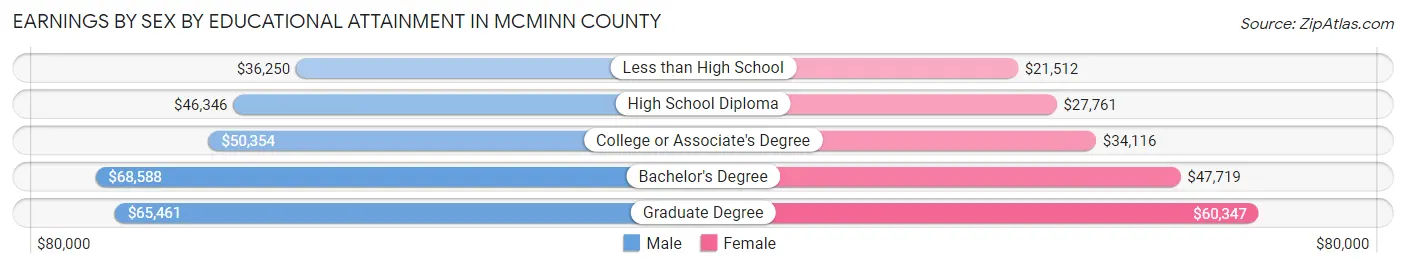
| Educational Attainment | Male Income | Female Income |
| Less than High School | $36,250 | $21,512 |
| High School Diploma | $46,346 | $27,761 |
| College or Associate's Degree | $50,354 | $34,116 |
| Bachelor's Degree | $68,588 | $47,719 |
| Graduate Degree | $65,461 | $60,347 |
| Total | $47,495 | $35,248 |
Family Income in McMinn County
Family Income Brackets in McMinn County
According to the McMinn County family income data, there are 3,024 families falling into the $50,000 to $74,999 income range, which is the most common income bracket and makes up 20.7% of all families. Conversely, the less than $10,000 income bracket is the least frequent group with only 468 families (3.2%) belonging to this category.
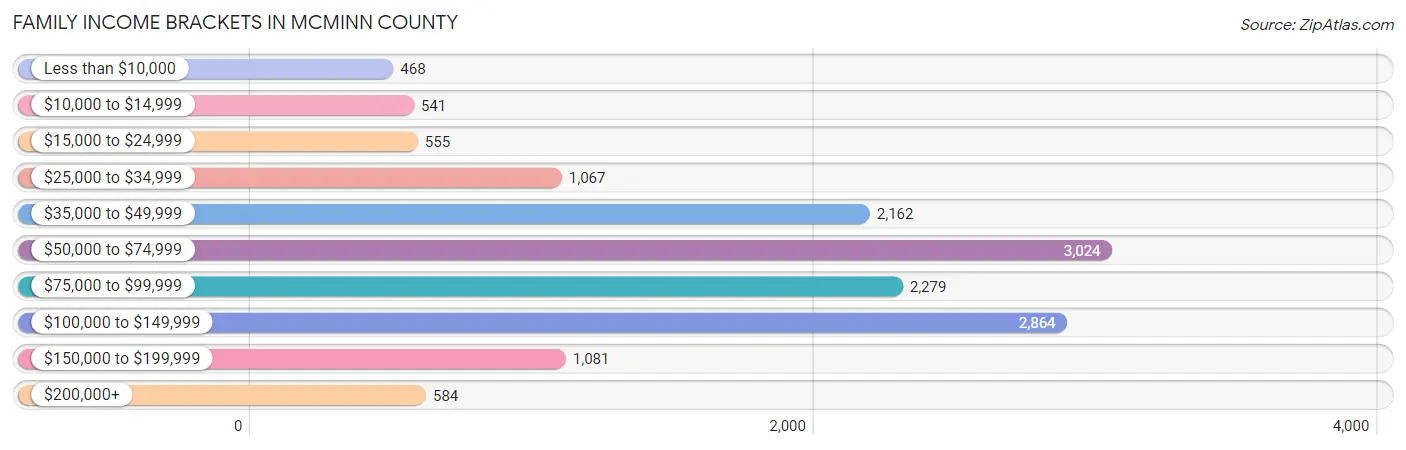
| Income Bracket | # Families | % Families |
| Less than $10,000 | 468 | 3.2% |
| $10,000 to $14,999 | 541 | 3.7% |
| $15,000 to $24,999 | 555 | 3.8% |
| $25,000 to $34,999 | 1,067 | 7.3% |
| $35,000 to $49,999 | 2,162 | 14.8% |
| $50,000 to $74,999 | 3,024 | 20.7% |
| $75,000 to $99,999 | 2,279 | 15.6% |
| $100,000 to $149,999 | 2,864 | 19.6% |
| $150,000 to $199,999 | 1,081 | 7.4% |
| $200,000+ | 584 | 4.0% |
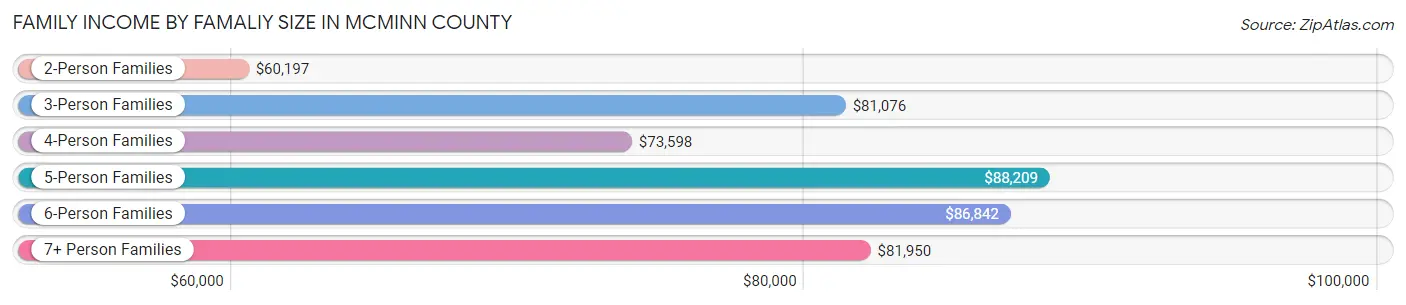
Family Income by Famaliy Size in McMinn County
5-person families (1,171 | 8.0%) account for the highest median family income in McMinn County with $88,209 per family, while 2-person families (7,197 | 49.3%) have the highest median income of $30,098 per family member.
| Income Bracket | # Families | Median Income |
| 2-Person Families | 7,197 (49.3%) | $60,197 |
| 3-Person Families | 3,117 (21.3%) | $81,076 |
| 4-Person Families | 2,118 (14.5%) | $73,598 |
| 5-Person Families | 1,171 (8.0%) | $88,209 |
| 6-Person Families | 696 (4.8%) | $86,842 |
| 7+ Person Families | 311 (2.1%) | $81,950 |
| Total | 14,610 (100.0%) | $69,420 |
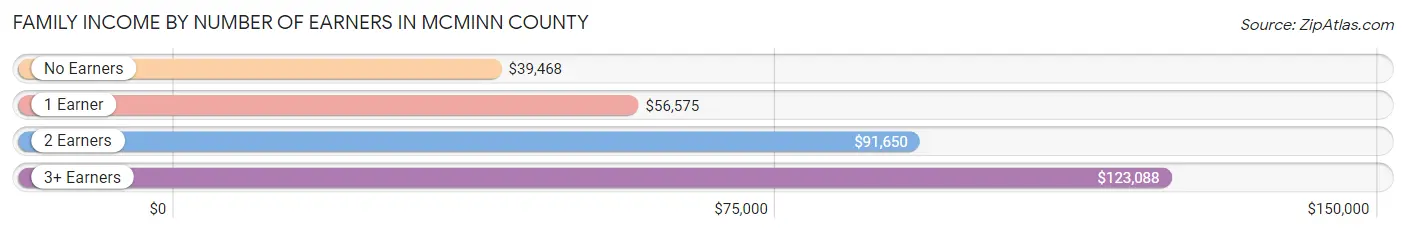
Family Income by Number of Earners in McMinn County
The median family income in McMinn County is $69,420, with families comprising 3+ earners (1,880) having the highest median family income of $123,088, while families with no earners (2,894) have the lowest median family income of $39,468, accounting for 12.9% and 19.8% of families, respectively.
| Number of Earners | # Families | Median Income |
| No Earners | 2,894 (19.8%) | $39,468 |
| 1 Earner | 5,489 (37.6%) | $56,575 |
| 2 Earners | 4,347 (29.7%) | $91,650 |
| 3+ Earners | 1,880 (12.9%) | $123,088 |
| Total | 14,610 (100.0%) | $69,420 |
Household Income in McMinn County
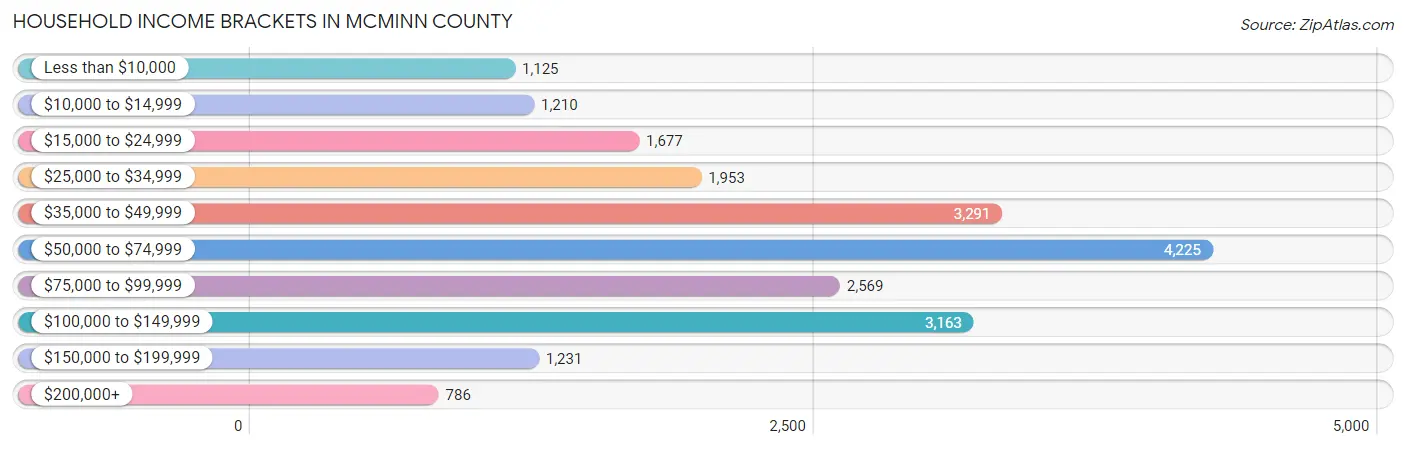
Household Income Brackets in McMinn County
With 4,225 households falling in the category, the $50,000 to $74,999 income range is the most frequent in McMinn County, accounting for 19.9% of all households. In contrast, only 786 households (3.7%) fall into the $200,000+ income bracket, making it the least populous group.
| Income Bracket | # Households | % Households |
| Less than $10,000 | 1,125 | 5.3% |
| $10,000 to $14,999 | 1,210 | 5.7% |
| $15,000 to $24,999 | 1,677 | 7.9% |
| $25,000 to $34,999 | 1,953 | 9.2% |
| $35,000 to $49,999 | 3,291 | 15.5% |
| $50,000 to $74,999 | 4,225 | 19.9% |
| $75,000 to $99,999 | 2,569 | 12.1% |
| $100,000 to $149,999 | 3,163 | 14.9% |
| $150,000 to $199,999 | 1,231 | 5.8% |
| $200,000+ | 786 | 3.7% |
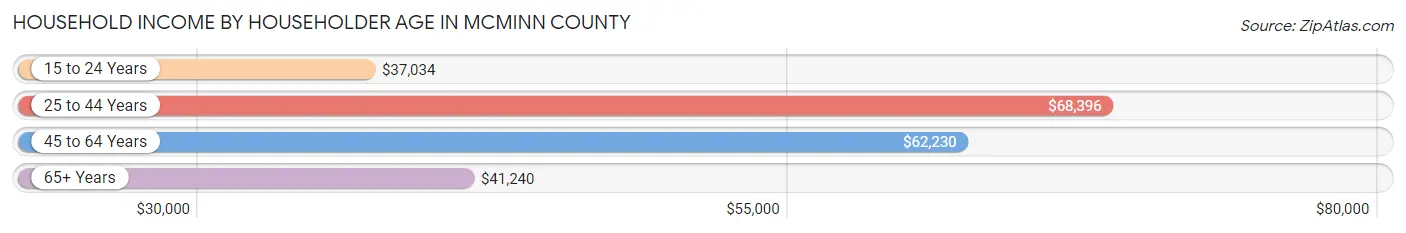
Household Income by Householder Age in McMinn County
The median household income in McMinn County is $57,982, with the highest median household income of $68,396 found in the 25 to 44 years age bracket for the primary householder. A total of 5,422 households (25.5%) fall into this category. Meanwhile, the 15 to 24 years age bracket for the primary householder has the lowest median household income of $37,034, with 803 households (3.8%) in this group.
| Income Bracket | # Households | Median Income |
| 15 to 24 Years | 803 (3.8%) | $37,034 |
| 25 to 44 Years | 5,422 (25.5%) | $68,396 |
| 45 to 64 Years | 8,417 (39.7%) | $62,230 |
| 65+ Years | 6,588 (31.0%) | $41,240 |
| Total | 21,230 (100.0%) | $57,982 |
Poverty in McMinn County
Income Below Poverty by Sex and Age in McMinn County
With 12.5% poverty level for males and 14.7% for females among the residents of McMinn County, 6 to 11 year old males and 6 to 11 year old females are the most vulnerable to poverty, with 471 males (24.7%) and 353 females (22.7%) in their respective age groups living below the poverty level.
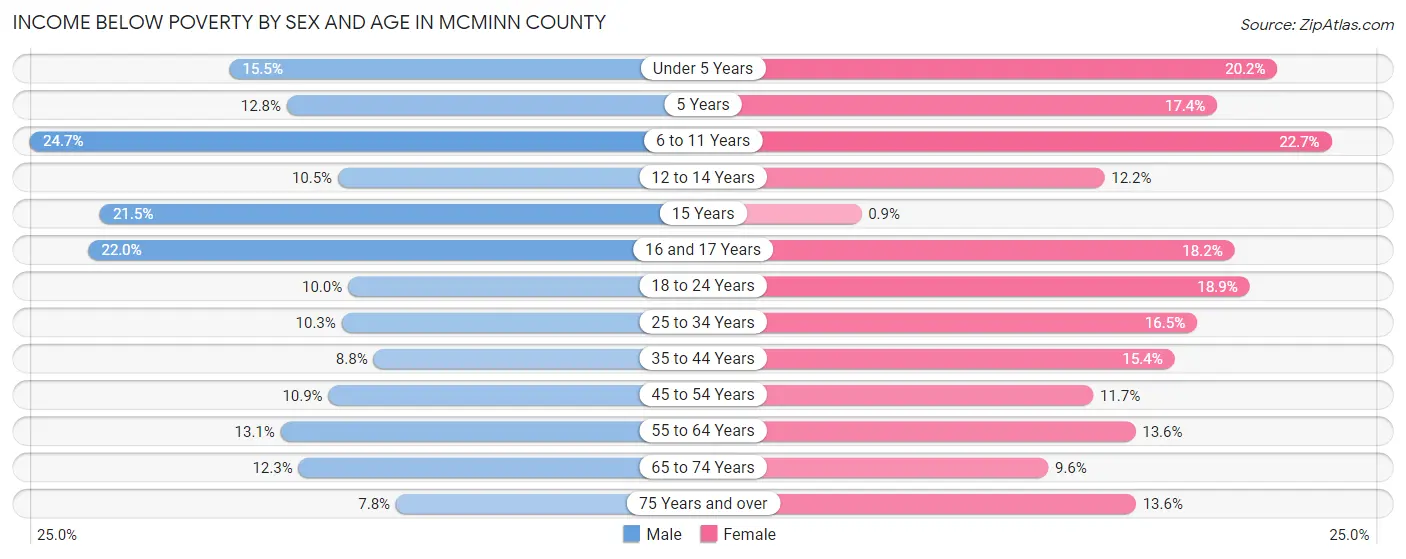
| Age Bracket | Male | Female |
| Under 5 Years | 231 (15.5%) | 284 (20.2%) |
| 5 Years | 39 (12.8%) | 35 (17.4%) |
| 6 to 11 Years | 471 (24.7%) | 353 (22.7%) |
| 12 to 14 Years | 91 (10.5%) | 147 (12.2%) |
| 15 Years | 63 (21.5%) | 2 (0.9%) |
| 16 and 17 Years | 151 (22.0%) | 158 (18.2%) |
| 18 to 24 Years | 205 (10.0%) | 391 (18.9%) |
| 25 to 34 Years | 327 (10.3%) | 494 (16.5%) |
| 35 to 44 Years | 250 (8.8%) | 472 (15.4%) |
| 45 to 54 Years | 385 (10.9%) | 409 (11.7%) |
| 55 to 64 Years | 495 (13.1%) | 522 (13.6%) |
| 65 to 74 Years | 354 (12.3%) | 305 (9.6%) |
| 75 Years and over | 133 (7.8%) | 342 (13.6%) |
| Total | 3,195 (12.5%) | 3,914 (14.7%) |
Income Above Poverty by Sex and Age in McMinn County
According to the poverty statistics in McMinn County, males aged 75 years and over and females aged 15 years are the age groups that are most secure financially, with 92.2% of males and 99.1% of females in these age groups living above the poverty line.
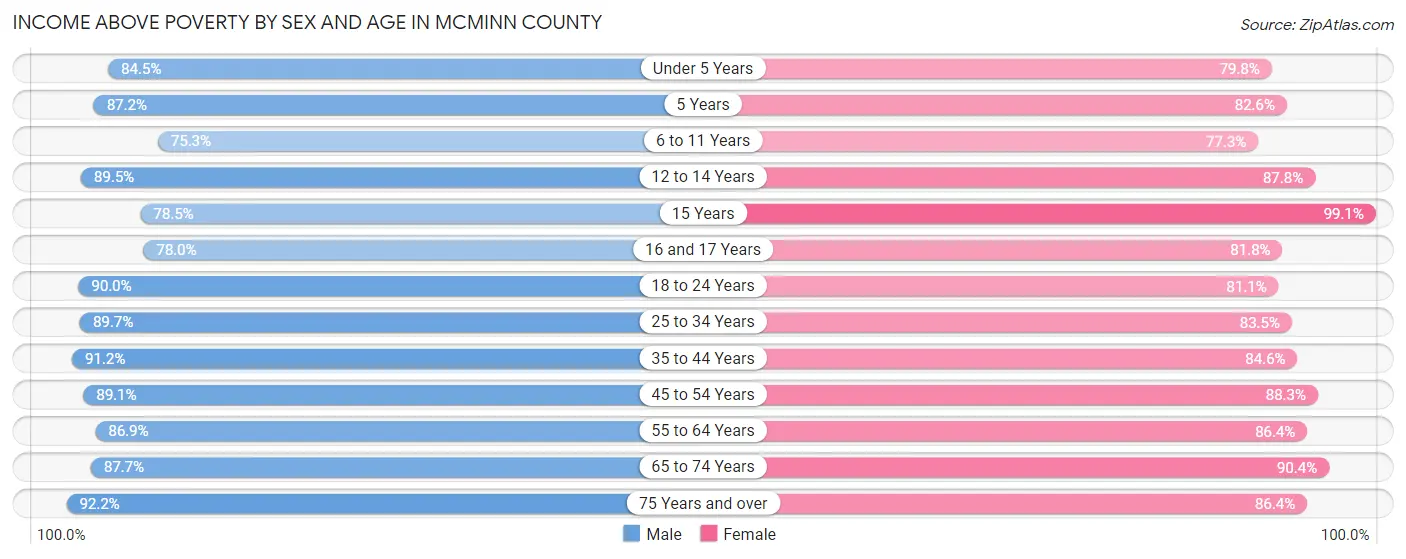
| Age Bracket | Male | Female |
| Under 5 Years | 1,260 (84.5%) | 1,121 (79.8%) |
| 5 Years | 265 (87.2%) | 166 (82.6%) |
| 6 to 11 Years | 1,433 (75.3%) | 1,201 (77.3%) |
| 12 to 14 Years | 779 (89.5%) | 1,060 (87.8%) |
| 15 Years | 230 (78.5%) | 219 (99.1%) |
| 16 and 17 Years | 534 (78.0%) | 709 (81.8%) |
| 18 to 24 Years | 1,847 (90.0%) | 1,676 (81.1%) |
| 25 to 34 Years | 2,852 (89.7%) | 2,503 (83.5%) |
| 35 to 44 Years | 2,587 (91.2%) | 2,585 (84.6%) |
| 45 to 54 Years | 3,146 (89.1%) | 3,098 (88.3%) |
| 55 to 64 Years | 3,279 (86.9%) | 3,310 (86.4%) |
| 65 to 74 Years | 2,527 (87.7%) | 2,883 (90.4%) |
| 75 Years and over | 1,579 (92.2%) | 2,165 (86.4%) |
| Total | 22,318 (87.5%) | 22,696 (85.3%) |
Income Below Poverty Among Married-Couple Families in McMinn County
The poverty statistics for married-couple families in McMinn County show that 6.5% or 716 of the total 11,028 families live below the poverty line. Families with 5 or more children have the highest poverty rate of 54.7%, comprising of 70 families. On the other hand, families with 3 or 4 children have the lowest poverty rate of 2.9%, which includes 33 families.
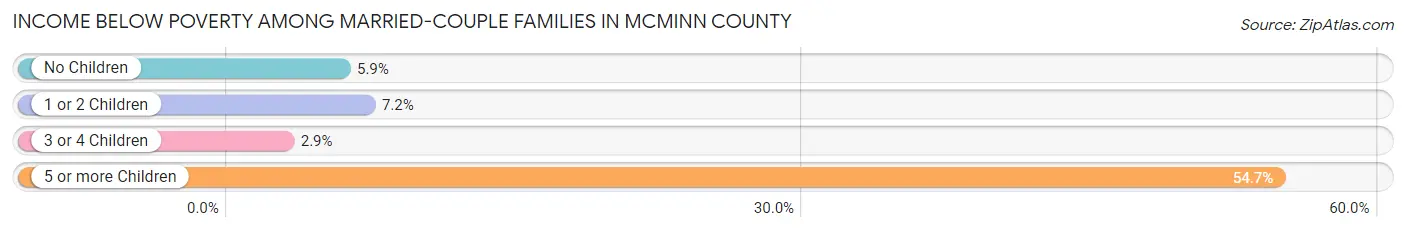
| Children | Above Poverty | Below Poverty |
| No Children | 6,193 (94.2%) | 385 (5.9%) |
| 1 or 2 Children | 2,959 (92.8%) | 228 (7.1%) |
| 3 or 4 Children | 1,102 (97.1%) | 33 (2.9%) |
| 5 or more Children | 58 (45.3%) | 70 (54.7%) |
| Total | 10,312 (93.5%) | 716 (6.5%) |
Income Below Poverty Among Single-Parent Households in McMinn County
According to the poverty data in McMinn County, 16.5% or 184 single-father households and 20.4% or 505 single-mother households are living below the poverty line. Among single-father households, those with 3 or 4 children have the highest poverty rate, with 35 households (70.0%) experiencing poverty. Likewise, among single-mother households, those with 5 or more children have the highest poverty rate, with 60 households (100.0%) falling below the poverty line.
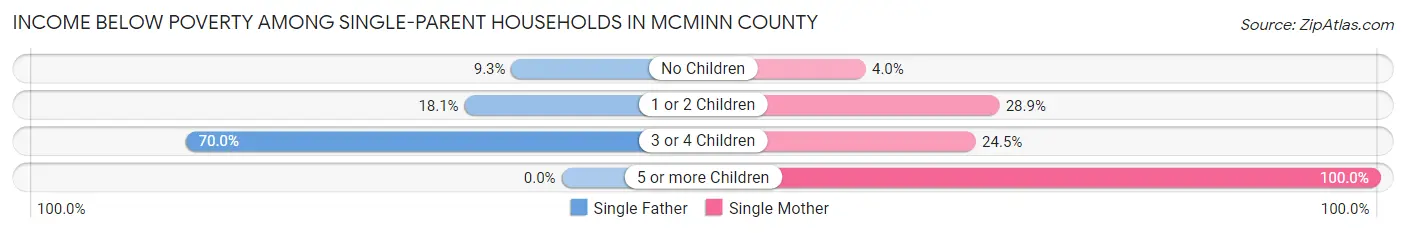
| Children | Single Father | Single Mother |
| No Children | 46 (9.3%) | 39 (4.0%) |
| 1 or 2 Children | 103 (18.1%) | 370 (28.9%) |
| 3 or 4 Children | 35 (70.0%) | 36 (24.5%) |
| 5 or more Children | 0 (0.0%) | 60 (100.0%) |
| Total | 184 (16.5%) | 505 (20.4%) |
Income Below Poverty Among Married-Couple vs Single-Parent Households in McMinn County
The poverty data for McMinn County shows that 716 of the married-couple family households (6.5%) and 689 of the single-parent households (19.2%) are living below the poverty level. Within the married-couple family households, those with 5 or more children have the highest poverty rate, with 70 households (54.7%) falling below the poverty line. Among the single-parent households, those with 5 or more children have the highest poverty rate, with 60 household (100.0%) living below poverty.
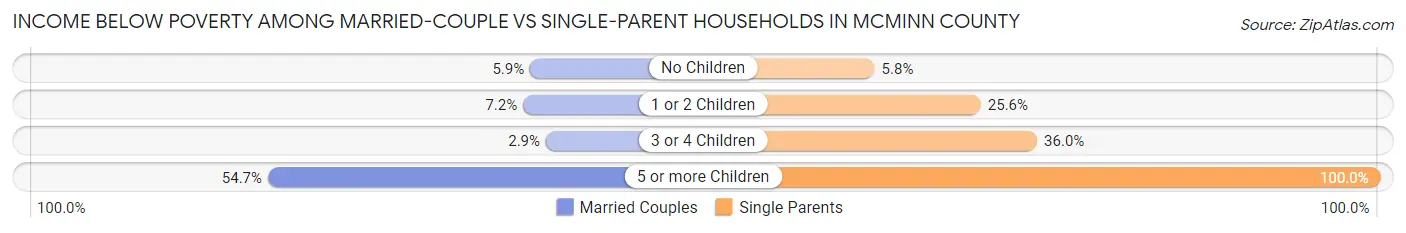
| Children | Married-Couple Families | Single-Parent Households |
| No Children | 385 (5.9%) | 85 (5.8%) |
| 1 or 2 Children | 228 (7.1%) | 473 (25.6%) |
| 3 or 4 Children | 33 (2.9%) | 71 (36.0%) |
| 5 or more Children | 70 (54.7%) | 60 (100.0%) |
| Total | 716 (6.5%) | 689 (19.2%) |
Employment Characteristics in McMinn County
Employment by Class of Employer in McMinn County
Among the 22,261 employed individuals in McMinn County, private company employees (15,998 | 71.9%), self-employed (not incorporated) (1,910 | 8.6%), and local government employees (1,214 | 5.4%) make up the most common classes of employment.
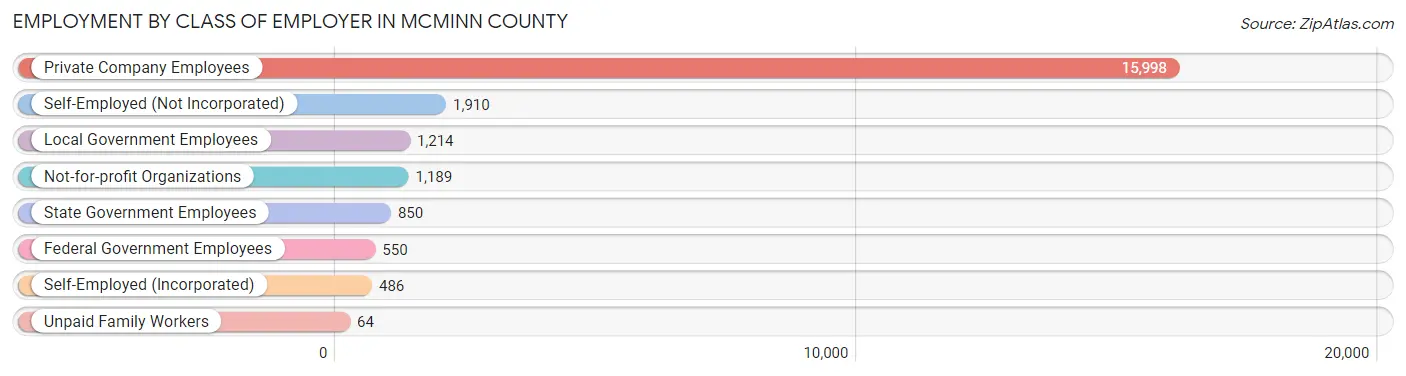
| Employer Class | # Employees | % Employees |
| Private Company Employees | 15,998 | 71.9% |
| Self-Employed (Incorporated) | 486 | 2.2% |
| Self-Employed (Not Incorporated) | 1,910 | 8.6% |
| Not-for-profit Organizations | 1,189 | 5.3% |
| Local Government Employees | 1,214 | 5.4% |
| State Government Employees | 850 | 3.8% |
| Federal Government Employees | 550 | 2.5% |
| Unpaid Family Workers | 64 | 0.3% |
| Total | 22,261 | 100.0% |
Employment Status by Age in McMinn County
According to the labor force statistics for McMinn County, out of the total population over 16 years of age (43,819), 55.0% or 24,100 individuals are in the labor force, with 5.3% or 1,277 of them unemployed. The age group with the highest labor force participation rate is 30 to 34 years, with 77.9% or 2,363 individuals in the labor force. Within the labor force, the 16 to 19 years age range has the highest percentage of unemployed individuals, with 20.8% or 287 of them being unemployed.
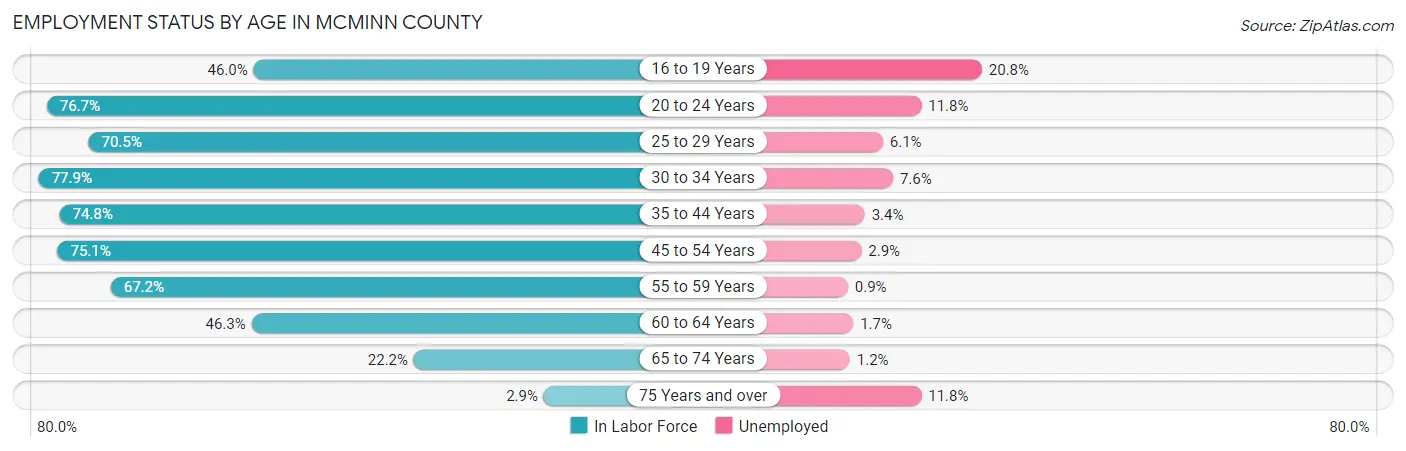
| Age Bracket | In Labor Force | Unemployed |
| 16 to 19 Years | 1,381 (46.0%) | 287 (20.8%) |
| 20 to 24 Years | 2,401 (76.7%) | 283 (11.8%) |
| 25 to 29 Years | 2,286 (70.5%) | 139 (6.1%) |
| 30 to 34 Years | 2,363 (77.9%) | 180 (7.6%) |
| 35 to 44 Years | 4,464 (74.8%) | 152 (3.4%) |
| 45 to 54 Years | 5,340 (75.1%) | 155 (2.9%) |
| 55 to 59 Years | 2,566 (67.2%) | 23 (0.9%) |
| 60 to 64 Years | 1,805 (46.3%) | 31 (1.7%) |
| 65 to 74 Years | 1,379 (22.2%) | 17 (1.2%) |
| 75 Years and over | 128 (2.9%) | 15 (11.8%) |
| Total | 24,100 (55.0%) | 1,277 (5.3%) |
Employment Status by Educational Attainment in McMinn County
According to labor force statistics for McMinn County, 69.6% of individuals (18,841) out of the total population between 25 and 64 years of age (27,071) are in the labor force, with 3.6% or 678 of them being unemployed. The group with the highest labor force participation rate are those with the educational attainment of bachelor's degree or higher, with 81.9% or 3,903 individuals in the labor force. Within the labor force, individuals with less than high school education have the highest percentage of unemployment, with 10.1% or 151 of them being unemployed.
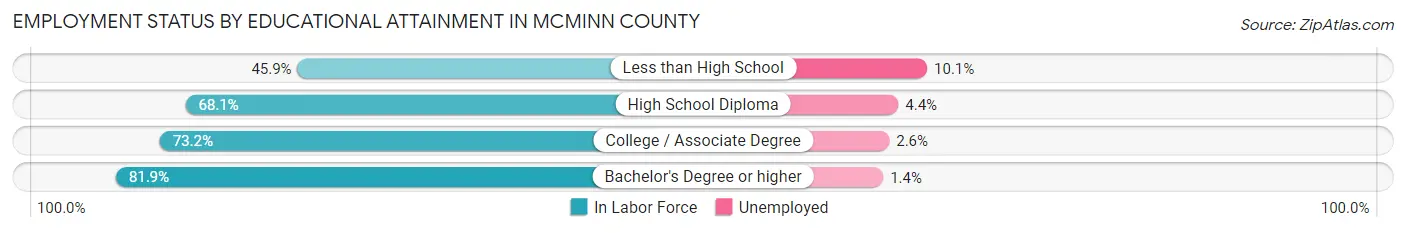
| Educational Attainment | In Labor Force | Unemployed |
| Less than High School | 1,493 (45.9%) | 329 (10.1%) |
| High School Diploma | 6,884 (68.1%) | 445 (4.4%) |
| College / Associate Degree | 6,546 (73.2%) | 233 (2.6%) |
| Bachelor's Degree or higher | 3,903 (81.9%) | 67 (1.4%) |
| Total | 18,841 (69.6%) | 975 (3.6%) |
Employment Occupations by Sex in McMinn County
Management, Business, Science and Arts Occupations
The most common Management, Business, Science and Arts occupations in McMinn County are Community & Social Service (1,990 | 8.7%), Management (1,944 | 8.5%), Health Diagnosing & Treating (1,591 | 7.0%), Education Instruction & Library (1,164 | 5.1%), and Computers, Engineering & Science (931 | 4.1%).
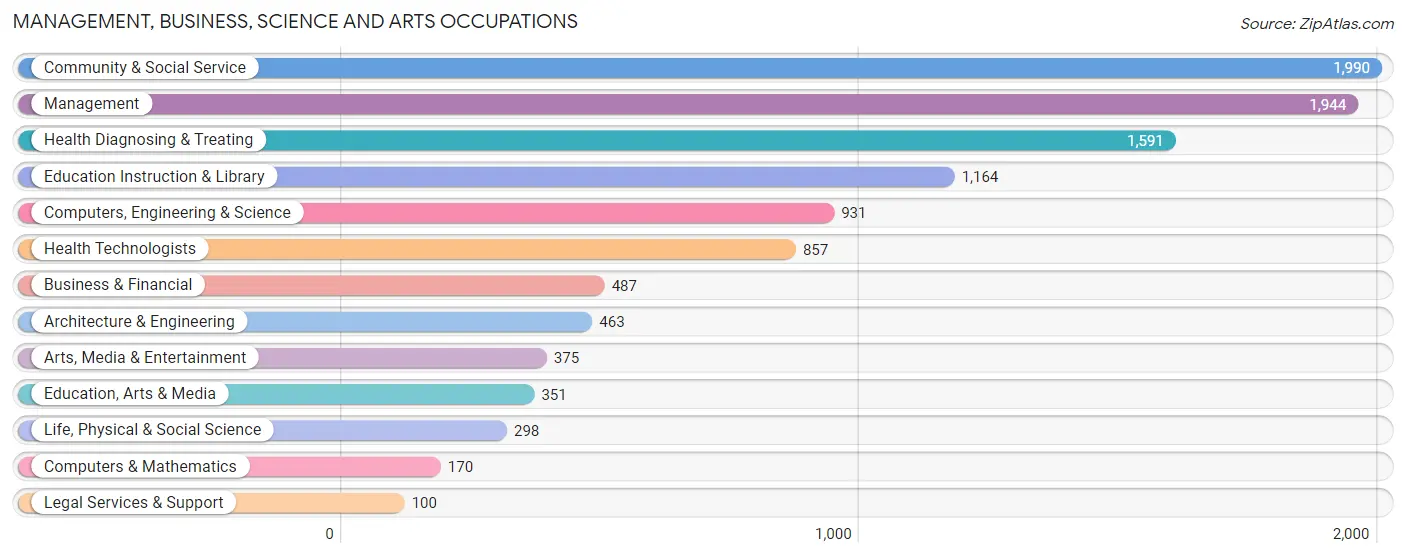
Management, Business, Science and Arts Occupations by Sex
Within the Management, Business, Science and Arts occupations in McMinn County, the most male-oriented occupations are Architecture & Engineering (83.6%), Life, Physical & Social Science (83.6%), and Computers, Engineering & Science (78.8%), while the most female-oriented occupations are Health Technologists (81.8%), Education Instruction & Library (81.0%), and Health Diagnosing & Treating (80.6%).

| Occupation | Male | Female |
| Management | 1,043 (53.6%) | 901 (46.4%) |
| Business & Financial | 275 (56.5%) | 212 (43.5%) |
| Computers, Engineering & Science | 734 (78.8%) | 197 (21.2%) |
| Computers & Mathematics | 98 (57.7%) | 72 (42.3%) |
| Architecture & Engineering | 387 (83.6%) | 76 (16.4%) |
| Life, Physical & Social Science | 249 (83.6%) | 49 (16.4%) |
| Community & Social Service | 704 (35.4%) | 1,286 (64.6%) |
| Education, Arts & Media | 210 (59.8%) | 141 (40.2%) |
| Legal Services & Support | 45 (45.0%) | 55 (55.0%) |
| Education Instruction & Library | 221 (19.0%) | 943 (81.0%) |
| Arts, Media & Entertainment | 228 (60.8%) | 147 (39.2%) |
| Health Diagnosing & Treating | 308 (19.4%) | 1,283 (80.6%) |
| Health Technologists | 156 (18.2%) | 701 (81.8%) |
| Total (Category) | 3,064 (44.1%) | 3,879 (55.9%) |
| Total (Overall) | 12,173 (53.4%) | 10,625 (46.6%) |
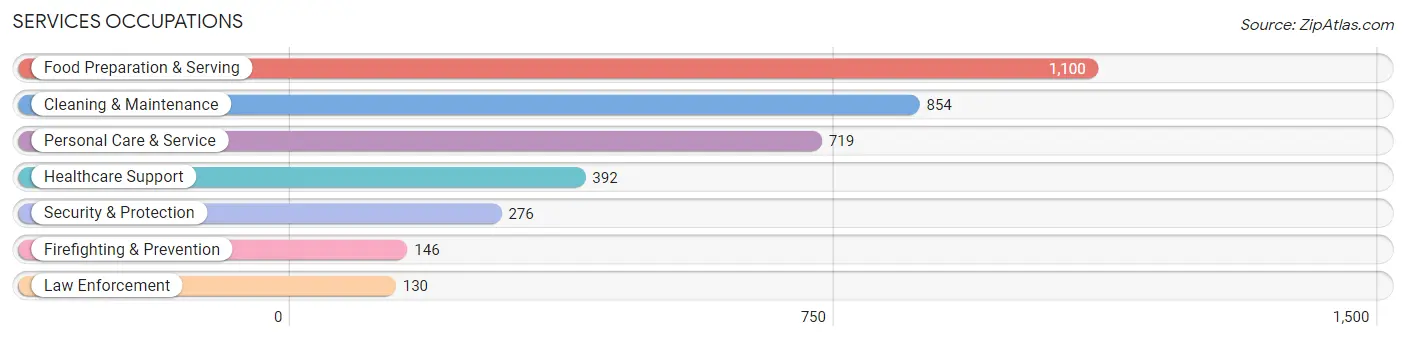
Services Occupations
The most common Services occupations in McMinn County are Food Preparation & Serving (1,100 | 4.8%), Cleaning & Maintenance (854 | 3.7%), Personal Care & Service (719 | 3.2%), Healthcare Support (392 | 1.7%), and Security & Protection (276 | 1.2%).
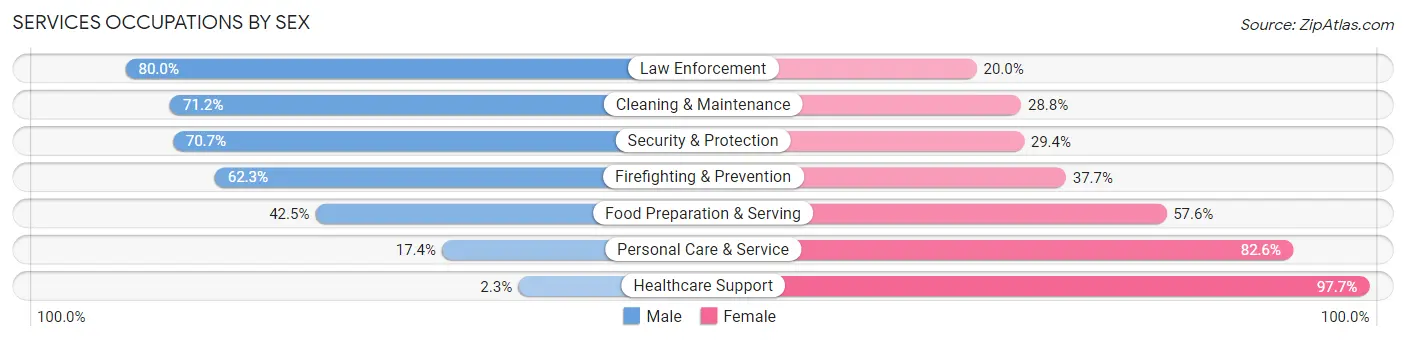
Services Occupations by Sex
Within the Services occupations in McMinn County, the most male-oriented occupations are Law Enforcement (80.0%), Cleaning & Maintenance (71.2%), and Security & Protection (70.7%), while the most female-oriented occupations are Healthcare Support (97.7%), Personal Care & Service (82.6%), and Food Preparation & Serving (57.6%).
| Occupation | Male | Female |
| Healthcare Support | 9 (2.3%) | 383 (97.7%) |
| Security & Protection | 195 (70.7%) | 81 (29.3%) |
| Firefighting & Prevention | 91 (62.3%) | 55 (37.7%) |
| Law Enforcement | 104 (80.0%) | 26 (20.0%) |
| Food Preparation & Serving | 467 (42.4%) | 633 (57.6%) |
| Cleaning & Maintenance | 608 (71.2%) | 246 (28.8%) |
| Personal Care & Service | 125 (17.4%) | 594 (82.6%) |
| Total (Category) | 1,404 (42.0%) | 1,937 (58.0%) |
| Total (Overall) | 12,173 (53.4%) | 10,625 (46.6%) |
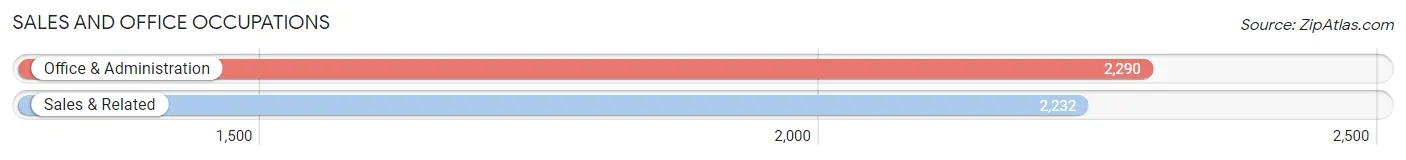
Sales and Office Occupations
The most common Sales and Office occupations in McMinn County are Office & Administration (2,290 | 10.0%), and Sales & Related (2,232 | 9.8%).
Sales and Office Occupations by Sex
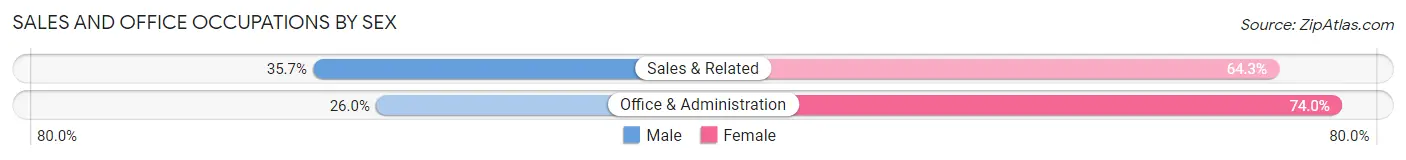
| Occupation | Male | Female |
| Sales & Related | 796 (35.7%) | 1,436 (64.3%) |
| Office & Administration | 595 (26.0%) | 1,695 (74.0%) |
| Total (Category) | 1,391 (30.8%) | 3,131 (69.2%) |
| Total (Overall) | 12,173 (53.4%) | 10,625 (46.6%) |
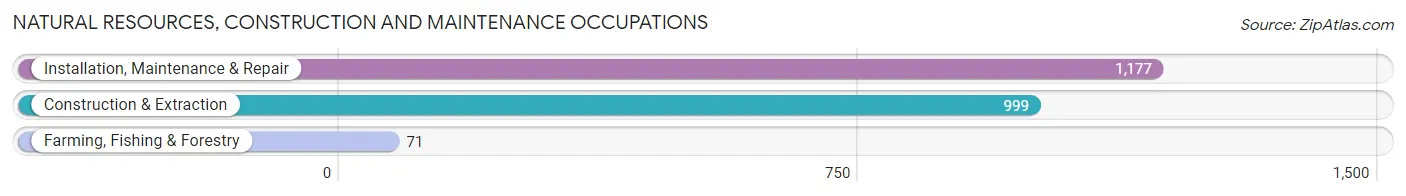
Natural Resources, Construction and Maintenance Occupations
The most common Natural Resources, Construction and Maintenance occupations in McMinn County are Installation, Maintenance & Repair (1,177 | 5.2%), Construction & Extraction (999 | 4.4%), and Farming, Fishing & Forestry (71 | 0.3%).
Natural Resources, Construction and Maintenance Occupations by Sex
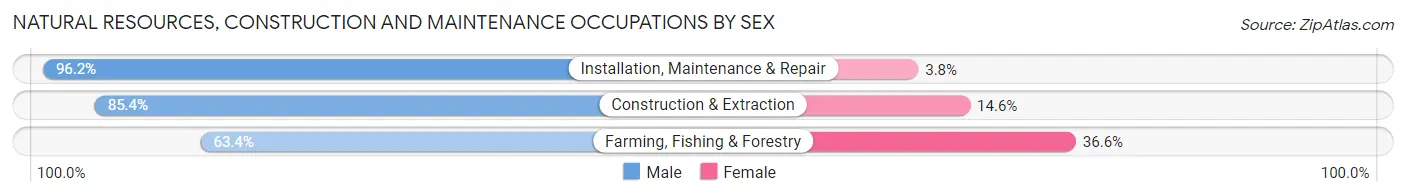
| Occupation | Male | Female |
| Farming, Fishing & Forestry | 45 (63.4%) | 26 (36.6%) |
| Construction & Extraction | 853 (85.4%) | 146 (14.6%) |
| Installation, Maintenance & Repair | 1,132 (96.2%) | 45 (3.8%) |
| Total (Category) | 2,030 (90.3%) | 217 (9.7%) |
| Total (Overall) | 12,173 (53.4%) | 10,625 (46.6%) |
Production, Transportation and Moving Occupations
The most common Production, Transportation and Moving occupations in McMinn County are Production (3,673 | 16.1%), Material Moving (1,319 | 5.8%), and Transportation (753 | 3.3%).
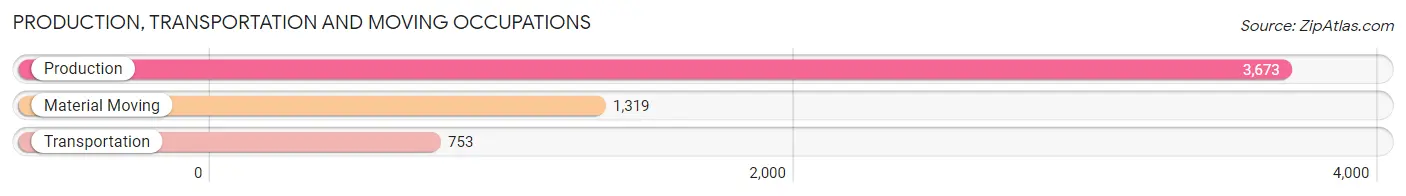
Production, Transportation and Moving Occupations by Sex
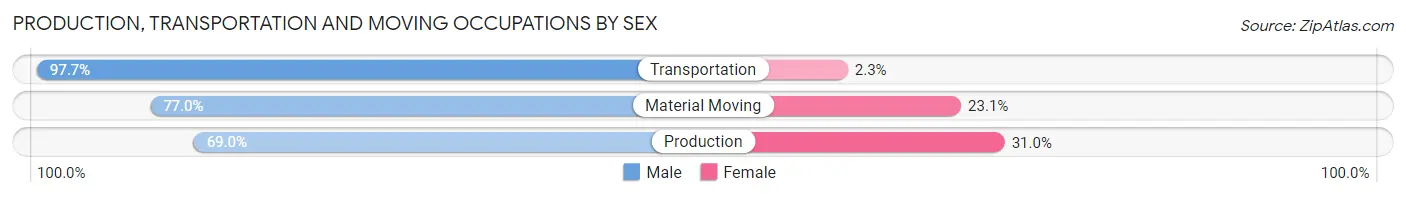
| Occupation | Male | Female |
| Production | 2,533 (69.0%) | 1,140 (31.0%) |
| Transportation | 736 (97.7%) | 17 (2.3%) |
| Material Moving | 1,015 (76.9%) | 304 (23.1%) |
| Total (Category) | 4,284 (74.6%) | 1,461 (25.4%) |
| Total (Overall) | 12,173 (53.4%) | 10,625 (46.6%) |
Employment Industries by Sex in McMinn County
Employment Industries in McMinn County
The major employment industries in McMinn County include Manufacturing (5,761 | 25.3%), Retail Trade (3,054 | 13.4%), Health Care & Social Assistance (2,581 | 11.3%), Educational Services (1,832 | 8.0%), and Construction (1,493 | 6.6%).
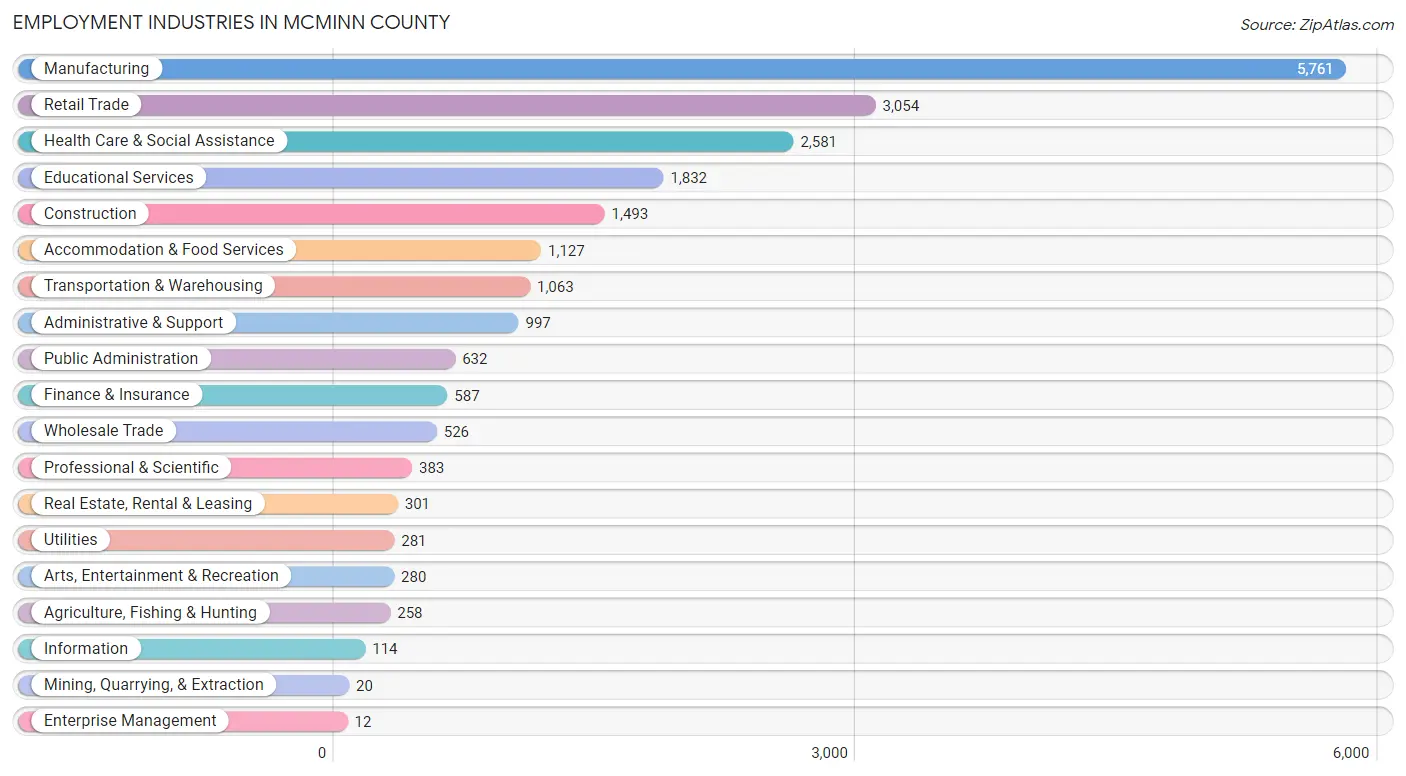
Employment Industries by Sex in McMinn County
The McMinn County industries that see more men than women are Mining, Quarrying, & Extraction (100.0%), Enterprise Management (100.0%), and Construction (80.8%), whereas the industries that tend to have a higher number of women are Finance & Insurance (87.4%), Real Estate, Rental & Leasing (87.0%), and Health Care & Social Assistance (84.1%).

| Industry | Male | Female |
| Agriculture, Fishing & Hunting | 206 (79.8%) | 52 (20.2%) |
| Mining, Quarrying, & Extraction | 20 (100.0%) | 0 (0.0%) |
| Construction | 1,206 (80.8%) | 287 (19.2%) |
| Manufacturing | 4,308 (74.8%) | 1,453 (25.2%) |
| Wholesale Trade | 320 (60.8%) | 206 (39.2%) |
| Retail Trade | 1,306 (42.8%) | 1,748 (57.2%) |
| Transportation & Warehousing | 755 (71.0%) | 308 (29.0%) |
| Utilities | 188 (66.9%) | 93 (33.1%) |
| Information | 79 (69.3%) | 35 (30.7%) |
| Finance & Insurance | 74 (12.6%) | 513 (87.4%) |
| Real Estate, Rental & Leasing | 39 (13.0%) | 262 (87.0%) |
| Professional & Scientific | 227 (59.3%) | 156 (40.7%) |
| Enterprise Management | 12 (100.0%) | 0 (0.0%) |
| Administrative & Support | 578 (58.0%) | 419 (42.0%) |
| Educational Services | 502 (27.4%) | 1,330 (72.6%) |
| Health Care & Social Assistance | 411 (15.9%) | 2,170 (84.1%) |
| Arts, Entertainment & Recreation | 198 (70.7%) | 82 (29.3%) |
| Accommodation & Food Services | 424 (37.6%) | 703 (62.4%) |
| Public Administration | 437 (69.2%) | 195 (30.8%) |
| Total | 12,173 (53.4%) | 10,625 (46.6%) |
Education in McMinn County
School Enrollment in McMinn County
The most common levels of schooling among the 11,007 students in McMinn County are high school (2,942 | 26.7%), middle school (2,449 | 22.3%), and elementary school (2,383 | 21.6%).
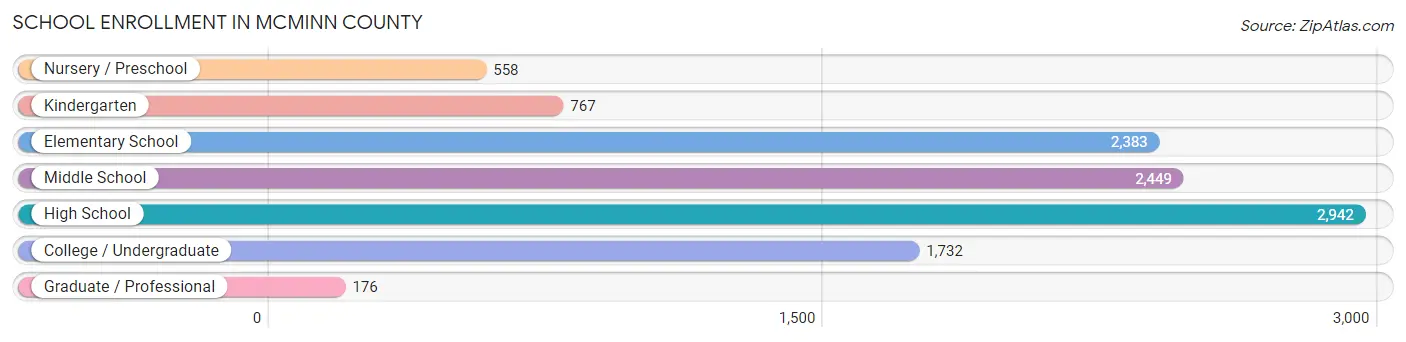
| School Level | # Students | % Students |
| Nursery / Preschool | 558 | 5.1% |
| Kindergarten | 767 | 7.0% |
| Elementary School | 2,383 | 21.6% |
| Middle School | 2,449 | 22.3% |
| High School | 2,942 | 26.7% |
| College / Undergraduate | 1,732 | 15.7% |
| Graduate / Professional | 176 | 1.6% |
| Total | 11,007 | 100.0% |
School Enrollment by Age by Funding Source in McMinn County
Out of a total of 11,007 students who are enrolled in schools in McMinn County, 2,829 (25.7%) attend a private institution, while the remaining 8,178 (74.3%) are enrolled in public schools. The age group of 3 to 4 year olds has the highest likelihood of being enrolled in private schools, with 237 (62.2% in the age bracket) enrolled. Conversely, the age group of 15 to 17 year olds has the lowest likelihood of being enrolled in a private school, with 1,775 (86.5% in the age bracket) attending a public institution.
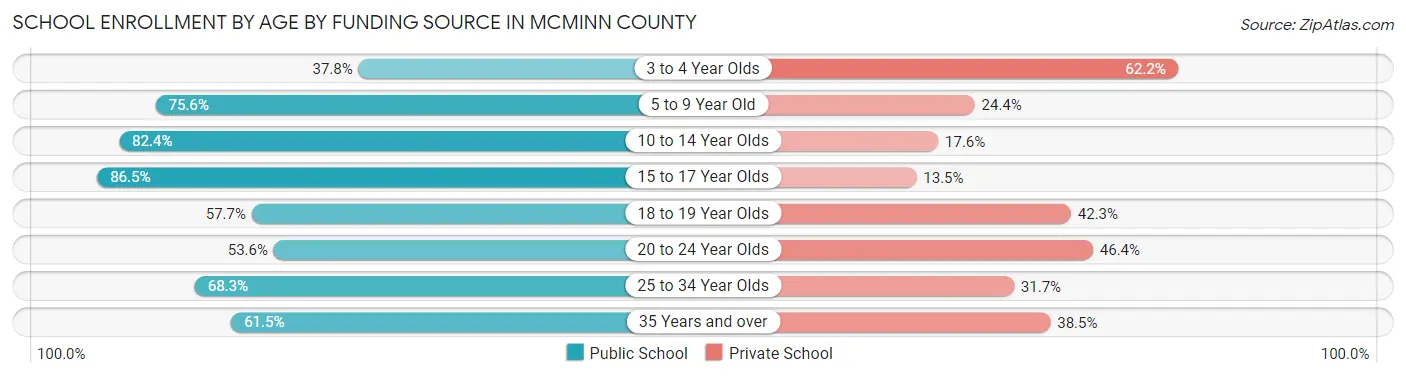
| Age Bracket | Public School | Private School |
| 3 to 4 Year Olds | 144 (37.8%) | 237 (62.2%) |
| 5 to 9 Year Old | 2,278 (75.6%) | 735 (24.4%) |
| 10 to 14 Year Olds | 2,526 (82.4%) | 539 (17.6%) |
| 15 to 17 Year Olds | 1,775 (86.5%) | 278 (13.5%) |
| 18 to 19 Year Olds | 556 (57.7%) | 408 (42.3%) |
| 20 to 24 Year Olds | 463 (53.6%) | 401 (46.4%) |
| 25 to 34 Year Olds | 239 (68.3%) | 111 (31.7%) |
| 35 Years and over | 195 (61.5%) | 122 (38.5%) |
| Total | 8,178 (74.3%) | 2,829 (25.7%) |
Educational Attainment by Field of Study in McMinn County
Education (1,549 | 22.8%), business (1,189 | 17.5%), science & technology (872 | 12.8%), bio, nature & agricultural (582 | 8.6%), and engineering (555 | 8.2%) are the most common fields of study among 6,808 individuals in McMinn County who have obtained a bachelor's degree or higher.
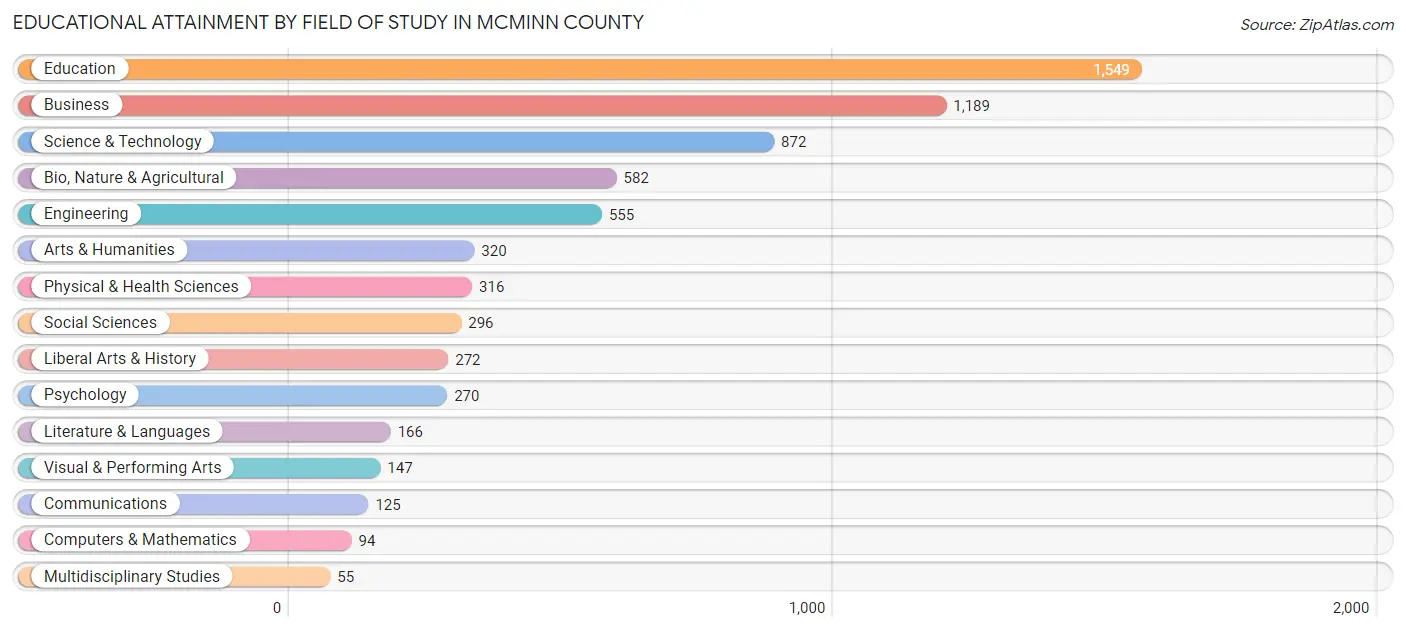
| Field of Study | # Graduates | % Graduates |
| Computers & Mathematics | 94 | 1.4% |
| Bio, Nature & Agricultural | 582 | 8.6% |
| Physical & Health Sciences | 316 | 4.6% |
| Psychology | 270 | 4.0% |
| Social Sciences | 296 | 4.3% |
| Engineering | 555 | 8.2% |
| Multidisciplinary Studies | 55 | 0.8% |
| Science & Technology | 872 | 12.8% |
| Business | 1,189 | 17.5% |
| Education | 1,549 | 22.8% |
| Literature & Languages | 166 | 2.4% |
| Liberal Arts & History | 272 | 4.0% |
| Visual & Performing Arts | 147 | 2.2% |
| Communications | 125 | 1.8% |
| Arts & Humanities | 320 | 4.7% |
| Total | 6,808 | 100.0% |
Transportation & Commute in McMinn County
Vehicle Availability by Sex in McMinn County
The most prevalent vehicle ownership categories in McMinn County are males with 2 vehicles (4,064, accounting for 33.8%) and females with 2 vehicles (3,396, making up 40.3%).
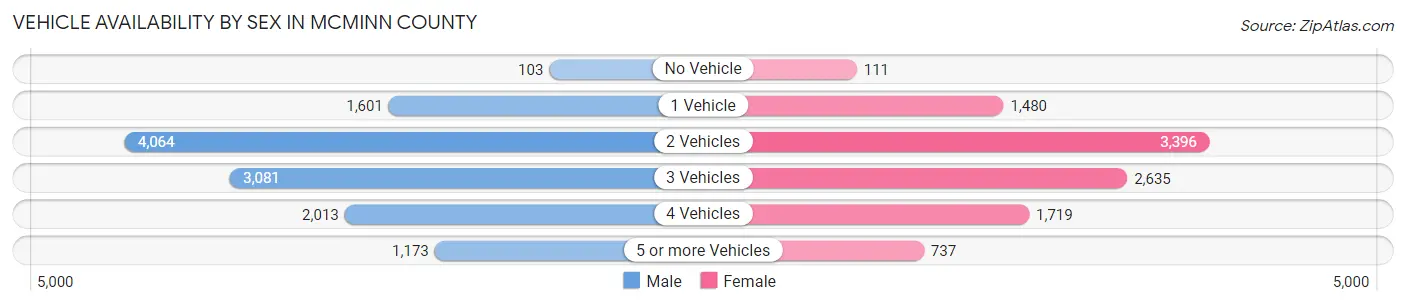
| Vehicles Available | Male | Female |
| No Vehicle | 103 (0.9%) | 111 (1.1%) |
| 1 Vehicle | 1,601 (13.3%) | 1,480 (14.7%) |
| 2 Vehicles | 4,064 (33.8%) | 3,396 (33.7%) |
| 3 Vehicles | 3,081 (25.6%) | 2,635 (26.2%) |
| 4 Vehicles | 2,013 (16.7%) | 1,719 (17.1%) |
| 5 or more Vehicles | 1,173 (9.8%) | 737 (7.3%) |
| Total | 12,035 (100.0%) | 10,078 (100.0%) |
Commute Time in McMinn County
The most frequently occuring commute durations in McMinn County are 10 to 14 minutes (4,056 commuters, 19.2%), 15 to 19 minutes (3,101 commuters, 14.6%), and 20 to 24 minutes (2,881 commuters, 13.6%).
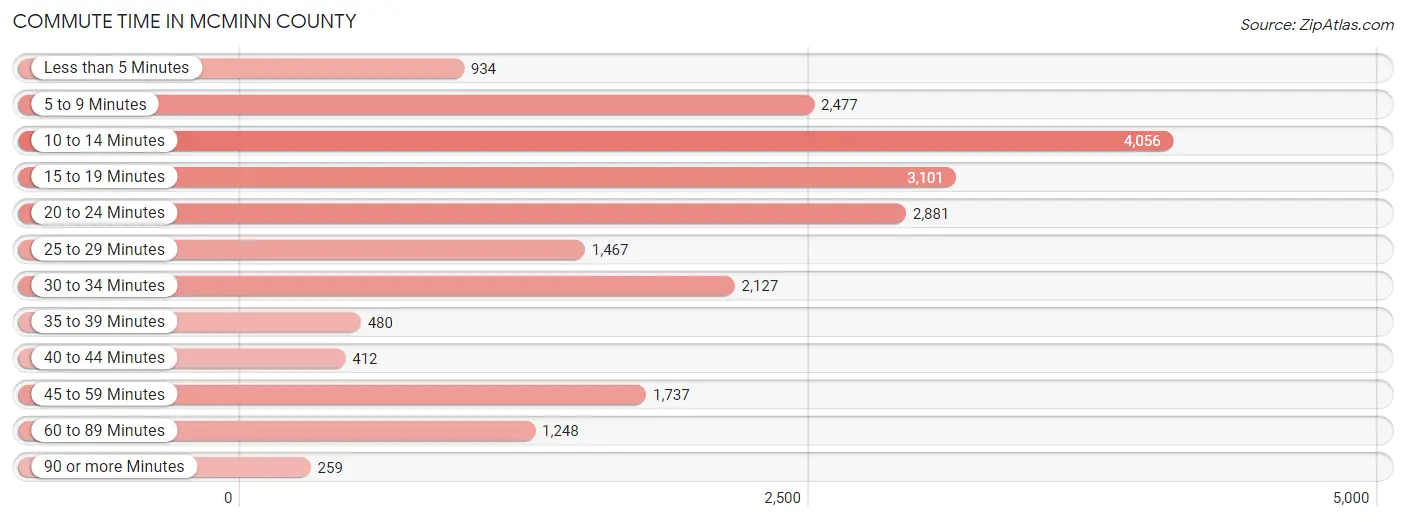
| Commute Time | # Commuters | % Commuters |
| Less than 5 Minutes | 934 | 4.4% |
| 5 to 9 Minutes | 2,477 | 11.7% |
| 10 to 14 Minutes | 4,056 | 19.2% |
| 15 to 19 Minutes | 3,101 | 14.6% |
| 20 to 24 Minutes | 2,881 | 13.6% |
| 25 to 29 Minutes | 1,467 | 6.9% |
| 30 to 34 Minutes | 2,127 | 10.0% |
| 35 to 39 Minutes | 480 | 2.3% |
| 40 to 44 Minutes | 412 | 1.9% |
| 45 to 59 Minutes | 1,737 | 8.2% |
| 60 to 89 Minutes | 1,248 | 5.9% |
| 90 or more Minutes | 259 | 1.2% |
Commute Time by Sex in McMinn County
The most common commute times in McMinn County are 10 to 14 minutes (1,812 commuters, 15.7%) for males and 10 to 14 minutes (2,244 commuters, 23.3%) for females.
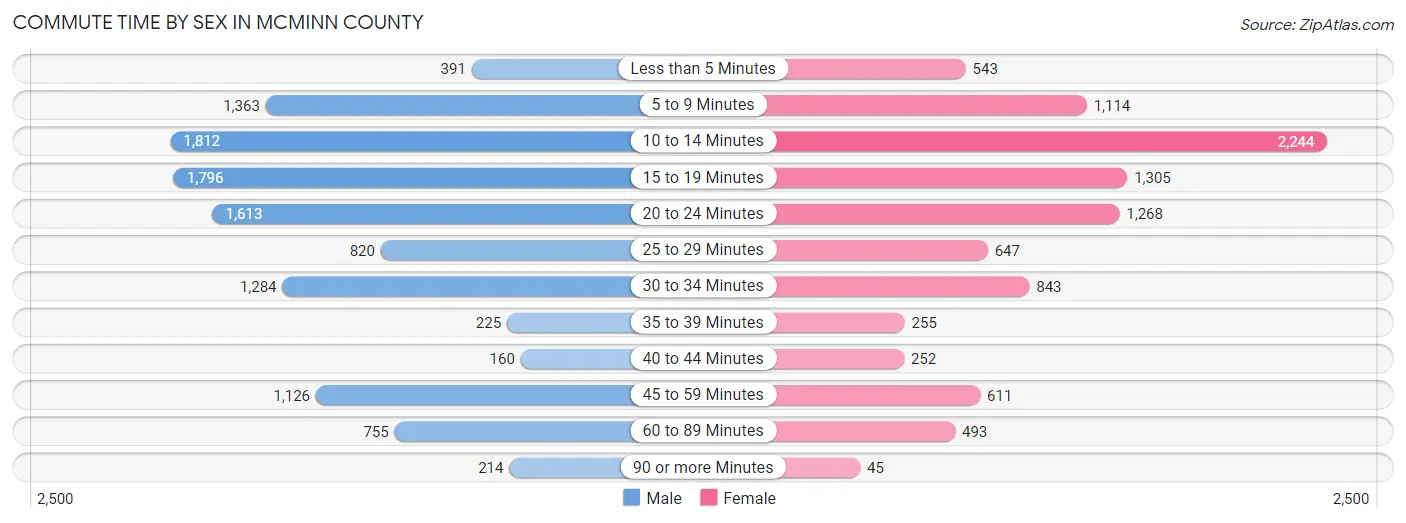
| Commute Time | Male | Female |
| Less than 5 Minutes | 391 (3.4%) | 543 (5.6%) |
| 5 to 9 Minutes | 1,363 (11.8%) | 1,114 (11.6%) |
| 10 to 14 Minutes | 1,812 (15.7%) | 2,244 (23.3%) |
| 15 to 19 Minutes | 1,796 (15.5%) | 1,305 (13.6%) |
| 20 to 24 Minutes | 1,613 (14.0%) | 1,268 (13.2%) |
| 25 to 29 Minutes | 820 (7.1%) | 647 (6.7%) |
| 30 to 34 Minutes | 1,284 (11.1%) | 843 (8.8%) |
| 35 to 39 Minutes | 225 (1.9%) | 255 (2.6%) |
| 40 to 44 Minutes | 160 (1.4%) | 252 (2.6%) |
| 45 to 59 Minutes | 1,126 (9.7%) | 611 (6.4%) |
| 60 to 89 Minutes | 755 (6.5%) | 493 (5.1%) |
| 90 or more Minutes | 214 (1.8%) | 45 (0.5%) |
Time of Departure to Work by Sex in McMinn County
The most frequent times of departure to work in McMinn County are 6:30 AM to 6:59 AM (1,411, 12.2%) for males and 7:00 AM to 7:29 AM (1,480, 15.4%) for females.
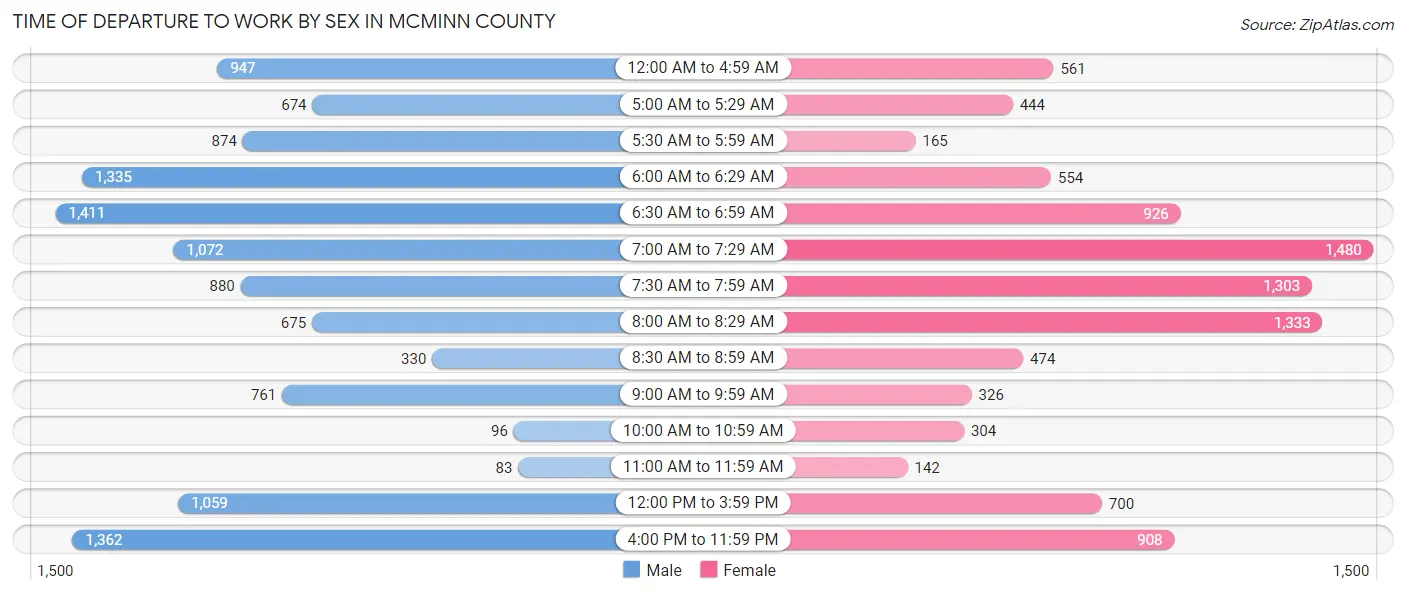
| Time of Departure | Male | Female |
| 12:00 AM to 4:59 AM | 947 (8.2%) | 561 (5.8%) |
| 5:00 AM to 5:29 AM | 674 (5.8%) | 444 (4.6%) |
| 5:30 AM to 5:59 AM | 874 (7.6%) | 165 (1.7%) |
| 6:00 AM to 6:29 AM | 1,335 (11.6%) | 554 (5.8%) |
| 6:30 AM to 6:59 AM | 1,411 (12.2%) | 926 (9.6%) |
| 7:00 AM to 7:29 AM | 1,072 (9.3%) | 1,480 (15.4%) |
| 7:30 AM to 7:59 AM | 880 (7.6%) | 1,303 (13.5%) |
| 8:00 AM to 8:29 AM | 675 (5.8%) | 1,333 (13.9%) |
| 8:30 AM to 8:59 AM | 330 (2.9%) | 474 (4.9%) |
| 9:00 AM to 9:59 AM | 761 (6.6%) | 326 (3.4%) |
| 10:00 AM to 10:59 AM | 96 (0.8%) | 304 (3.2%) |
| 11:00 AM to 11:59 AM | 83 (0.7%) | 142 (1.5%) |
| 12:00 PM to 3:59 PM | 1,059 (9.2%) | 700 (7.3%) |
| 4:00 PM to 11:59 PM | 1,362 (11.8%) | 908 (9.4%) |
| Total | 11,559 (100.0%) | 9,620 (100.0%) |
Housing Occupancy in McMinn County
Occupancy by Ownership in McMinn County
Of the total 21,230 dwellings in McMinn County, owner-occupied units account for 15,723 (74.1%), while renter-occupied units make up 5,507 (25.9%).
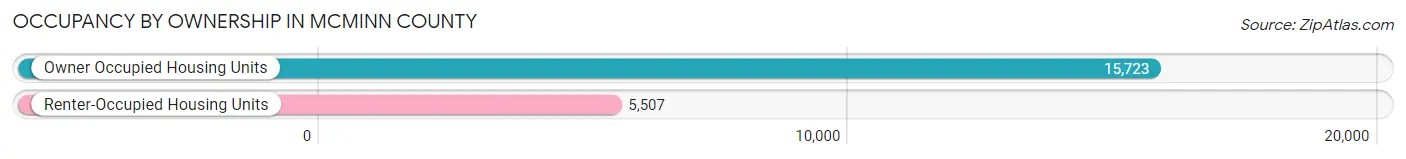
| Occupancy | # Housing Units | % Housing Units |
| Owner Occupied Housing Units | 15,723 | 74.1% |
| Renter-Occupied Housing Units | 5,507 | 25.9% |
| Total Occupied Housing Units | 21,230 | 100.0% |
Occupancy by Household Size in McMinn County
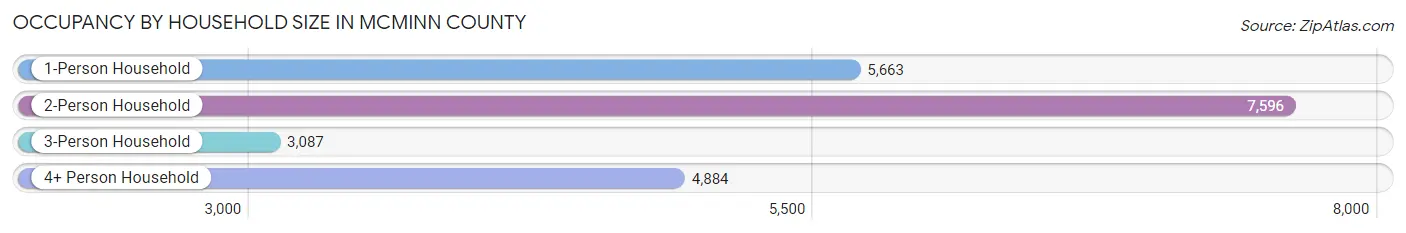
| Household Size | # Housing Units | % Housing Units |
| 1-Person Household | 5,663 | 26.7% |
| 2-Person Household | 7,596 | 35.8% |
| 3-Person Household | 3,087 | 14.5% |
| 4+ Person Household | 4,884 | 23.0% |
| Total Housing Units | 21,230 | 100.0% |
Occupancy by Ownership by Household Size in McMinn County
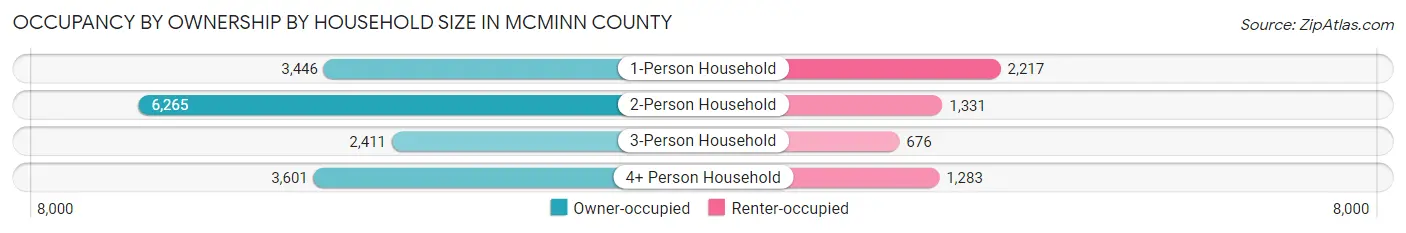
| Household Size | Owner-occupied | Renter-occupied |
| 1-Person Household | 3,446 (60.9%) | 2,217 (39.2%) |
| 2-Person Household | 6,265 (82.5%) | 1,331 (17.5%) |
| 3-Person Household | 2,411 (78.1%) | 676 (21.9%) |
| 4+ Person Household | 3,601 (73.7%) | 1,283 (26.3%) |
| Total Housing Units | 15,723 (74.1%) | 5,507 (25.9%) |
Occupancy by Educational Attainment in McMinn County
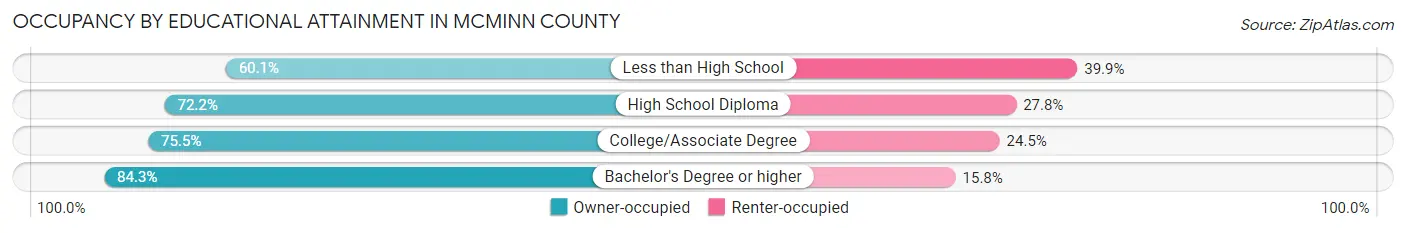
| Household Size | Owner-occupied | Renter-occupied |
| Less than High School | 1,541 (60.1%) | 1,022 (39.9%) |
| High School Diploma | 5,668 (72.2%) | 2,178 (27.8%) |
| College/Associate Degree | 5,214 (75.5%) | 1,690 (24.5%) |
| Bachelor's Degree or higher | 3,300 (84.3%) | 617 (15.8%) |
Occupancy by Age of Householder in McMinn County
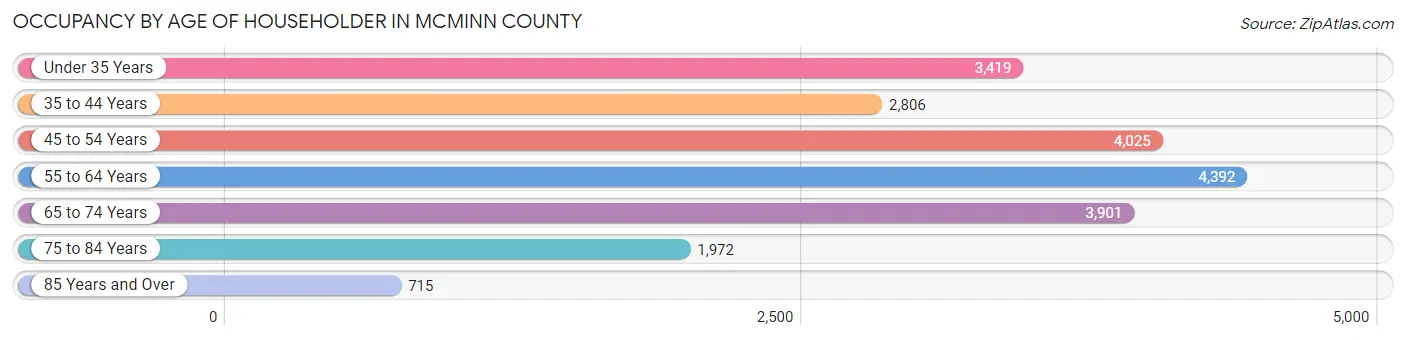
| Age Bracket | # Households | % Households |
| Under 35 Years | 3,419 | 16.1% |
| 35 to 44 Years | 2,806 | 13.2% |
| 45 to 54 Years | 4,025 | 19.0% |
| 55 to 64 Years | 4,392 | 20.7% |
| 65 to 74 Years | 3,901 | 18.4% |
| 75 to 84 Years | 1,972 | 9.3% |
| 85 Years and Over | 715 | 3.4% |
| Total | 21,230 | 100.0% |
Housing Finances in McMinn County
Median Income by Occupancy in McMinn County
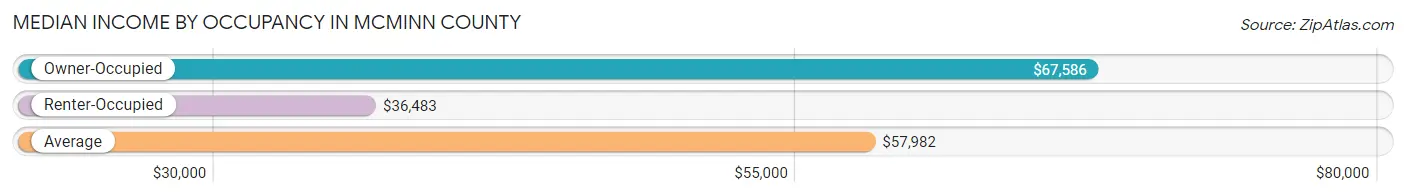
| Occupancy Type | # Households | Median Income |
| Owner-Occupied | 15,723 (74.1%) | $67,586 |
| Renter-Occupied | 5,507 (25.9%) | $36,483 |
| Average | 21,230 (100.0%) | $57,982 |
Occupancy by Householder Income Bracket in McMinn County
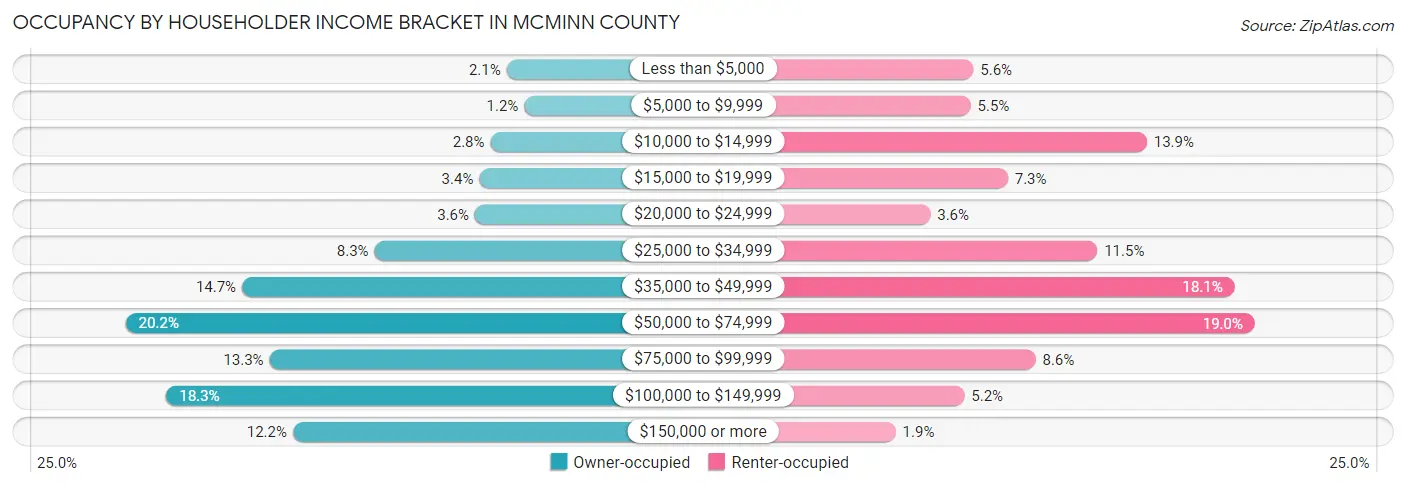
| Income Bracket | Owner-occupied | Renter-occupied |
| Less than $5,000 | 323 (2.1%) | 309 (5.6%) |
| $5,000 to $9,999 | 191 (1.2%) | 302 (5.5%) |
| $10,000 to $14,999 | 443 (2.8%) | 764 (13.9%) |
| $15,000 to $19,999 | 527 (3.4%) | 399 (7.2%) |
| $20,000 to $24,999 | 559 (3.6%) | 196 (3.6%) |
| $25,000 to $34,999 | 1,312 (8.3%) | 634 (11.5%) |
| $35,000 to $49,999 | 2,303 (14.6%) | 994 (18.0%) |
| $50,000 to $74,999 | 3,175 (20.2%) | 1,047 (19.0%) |
| $75,000 to $99,999 | 2,098 (13.3%) | 472 (8.6%) |
| $100,000 to $149,999 | 2,869 (18.2%) | 285 (5.2%) |
| $150,000 or more | 1,923 (12.2%) | 105 (1.9%) |
| Total | 15,723 (100.0%) | 5,507 (100.0%) |
Monthly Housing Cost Tiers in McMinn County
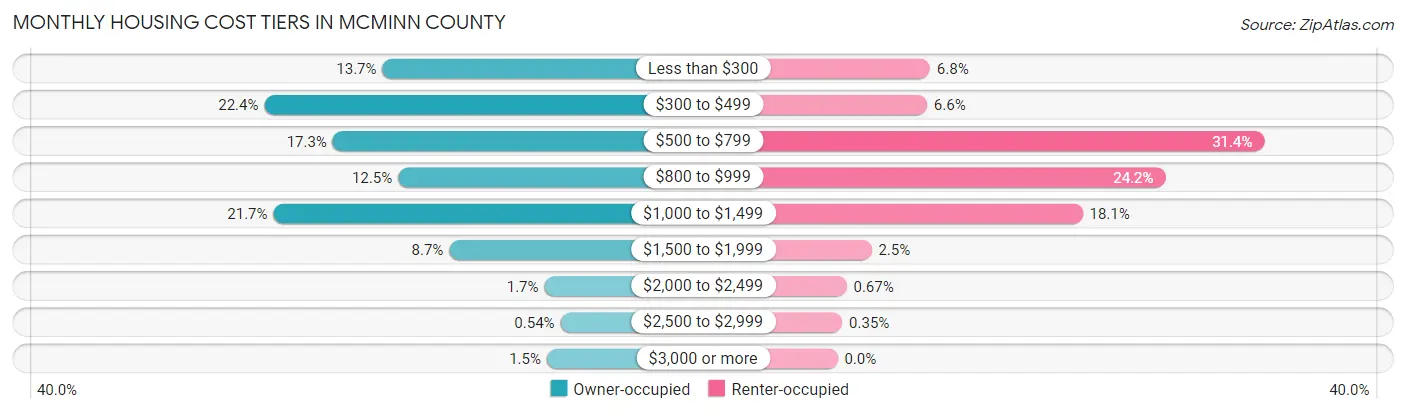
| Monthly Cost | Owner-occupied | Renter-occupied |
| Less than $300 | 2,146 (13.7%) | 375 (6.8%) |
| $300 to $499 | 3,514 (22.4%) | 363 (6.6%) |
| $500 to $799 | 2,721 (17.3%) | 1,731 (31.4%) |
| $800 to $999 | 1,965 (12.5%) | 1,330 (24.1%) |
| $1,000 to $1,499 | 3,408 (21.7%) | 994 (18.0%) |
| $1,500 to $1,999 | 1,372 (8.7%) | 138 (2.5%) |
| $2,000 to $2,499 | 270 (1.7%) | 37 (0.7%) |
| $2,500 to $2,999 | 85 (0.5%) | 19 (0.4%) |
| $3,000 or more | 242 (1.5%) | 0 (0.0%) |
| Total | 15,723 (100.0%) | 5,507 (100.0%) |
Physical Housing Characteristics in McMinn County
Housing Structures in McMinn County
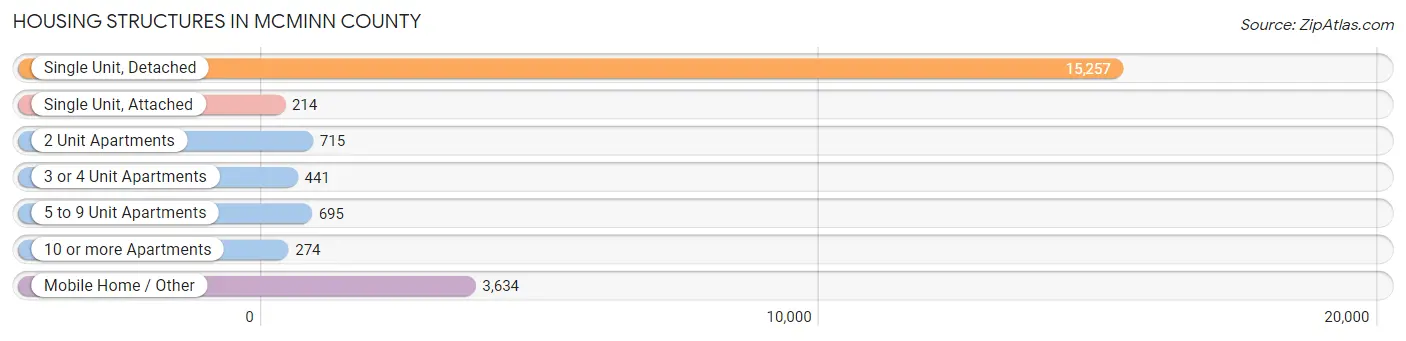
| Structure Type | # Housing Units | % Housing Units |
| Single Unit, Detached | 15,257 | 71.9% |
| Single Unit, Attached | 214 | 1.0% |
| 2 Unit Apartments | 715 | 3.4% |
| 3 or 4 Unit Apartments | 441 | 2.1% |
| 5 to 9 Unit Apartments | 695 | 3.3% |
| 10 or more Apartments | 274 | 1.3% |
| Mobile Home / Other | 3,634 | 17.1% |
| Total | 21,230 | 100.0% |
Housing Structures by Occupancy in McMinn County
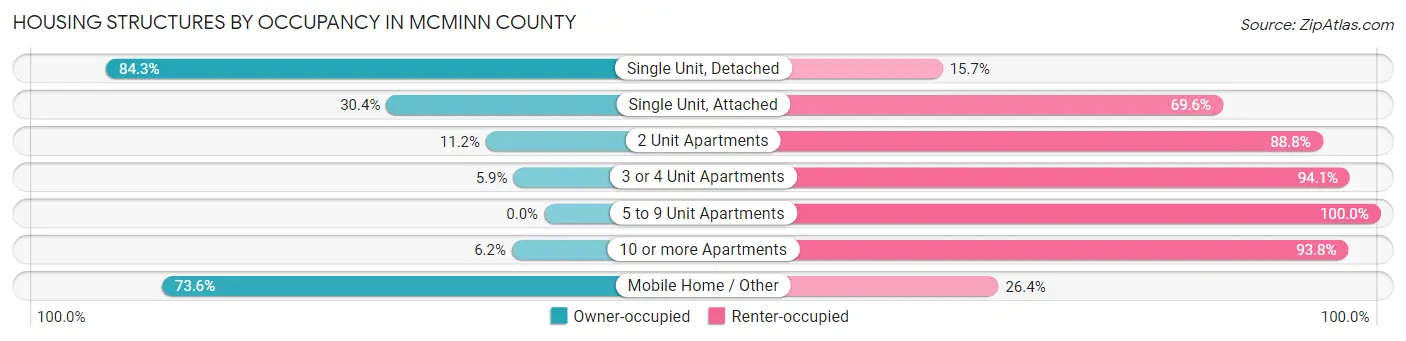
| Structure Type | Owner-occupied | Renter-occupied |
| Single Unit, Detached | 12,862 (84.3%) | 2,395 (15.7%) |
| Single Unit, Attached | 65 (30.4%) | 149 (69.6%) |
| 2 Unit Apartments | 80 (11.2%) | 635 (88.8%) |
| 3 or 4 Unit Apartments | 26 (5.9%) | 415 (94.1%) |
| 5 to 9 Unit Apartments | 0 (0.0%) | 695 (100.0%) |
| 10 or more Apartments | 17 (6.2%) | 257 (93.8%) |
| Mobile Home / Other | 2,673 (73.6%) | 961 (26.4%) |
| Total | 15,723 (74.1%) | 5,507 (25.9%) |
Housing Structures by Number of Rooms in McMinn County
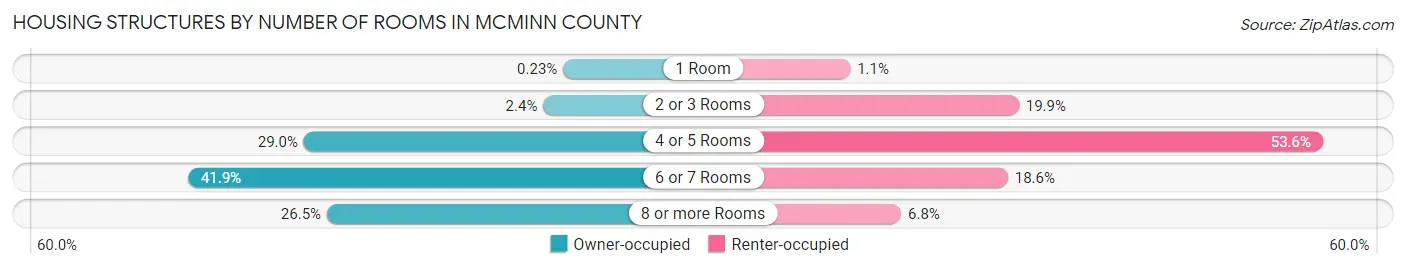
| Number of Rooms | Owner-occupied | Renter-occupied |
| 1 Room | 36 (0.2%) | 63 (1.1%) |
| 2 or 3 Rooms | 383 (2.4%) | 1,093 (19.9%) |
| 4 or 5 Rooms | 4,562 (29.0%) | 2,951 (53.6%) |
| 6 or 7 Rooms | 6,583 (41.9%) | 1,026 (18.6%) |
| 8 or more Rooms | 4,159 (26.5%) | 374 (6.8%) |
| Total | 15,723 (100.0%) | 5,507 (100.0%) |
Housing Structure by Heating Type in McMinn County
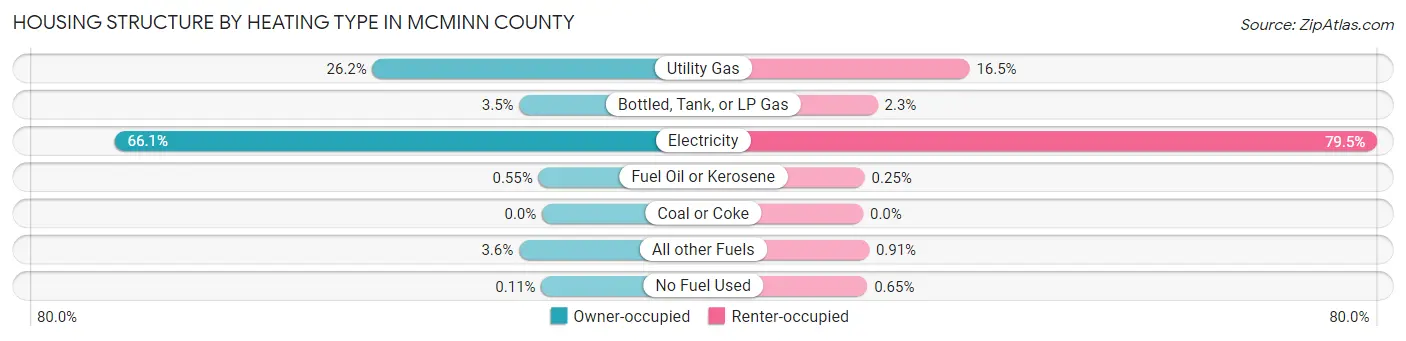
| Heating Type | Owner-occupied | Renter-occupied |
| Utility Gas | 4,120 (26.2%) | 906 (16.5%) |
| Bottled, Tank, or LP Gas | 550 (3.5%) | 124 (2.2%) |
| Electricity | 10,389 (66.1%) | 4,377 (79.5%) |
| Fuel Oil or Kerosene | 86 (0.5%) | 14 (0.3%) |
| Coal or Coke | 0 (0.0%) | 0 (0.0%) |
| All other Fuels | 560 (3.6%) | 50 (0.9%) |
| No Fuel Used | 18 (0.1%) | 36 (0.6%) |
| Total | 15,723 (100.0%) | 5,507 (100.0%) |
Household Vehicle Usage in McMinn County
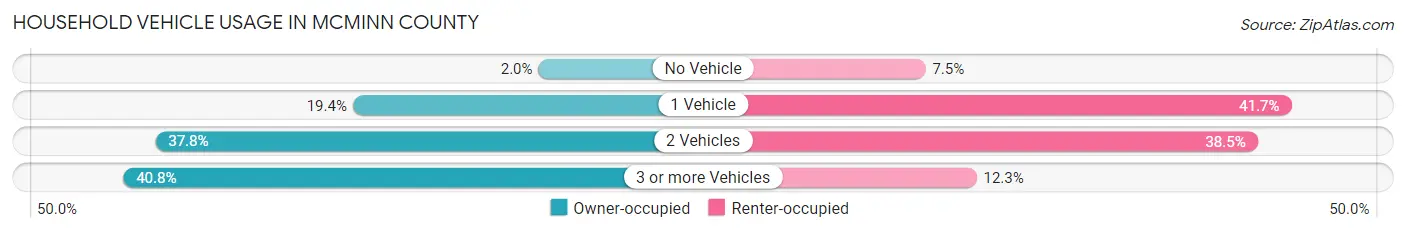
| Vehicles per Household | Owner-occupied | Renter-occupied |
| No Vehicle | 321 (2.0%) | 414 (7.5%) |
| 1 Vehicle | 3,045 (19.4%) | 2,295 (41.7%) |
| 2 Vehicles | 5,943 (37.8%) | 2,121 (38.5%) |
| 3 or more Vehicles | 6,414 (40.8%) | 677 (12.3%) |
| Total | 15,723 (100.0%) | 5,507 (100.0%) |
Real Estate & Mortgages in McMinn County
Real Estate and Mortgage Overview in McMinn County
| Characteristic | Without Mortgage | With Mortgage |
| Housing Units | 7,408 | 8,315 |
| Median Property Value | $166,900 | $180,100 |
| Median Household Income | $50,456 | $1,279 |
| Monthly Housing Costs | $377 | $234 |
| Real Estate Taxes | $645 | $221 |
Property Value by Mortgage Status in McMinn County
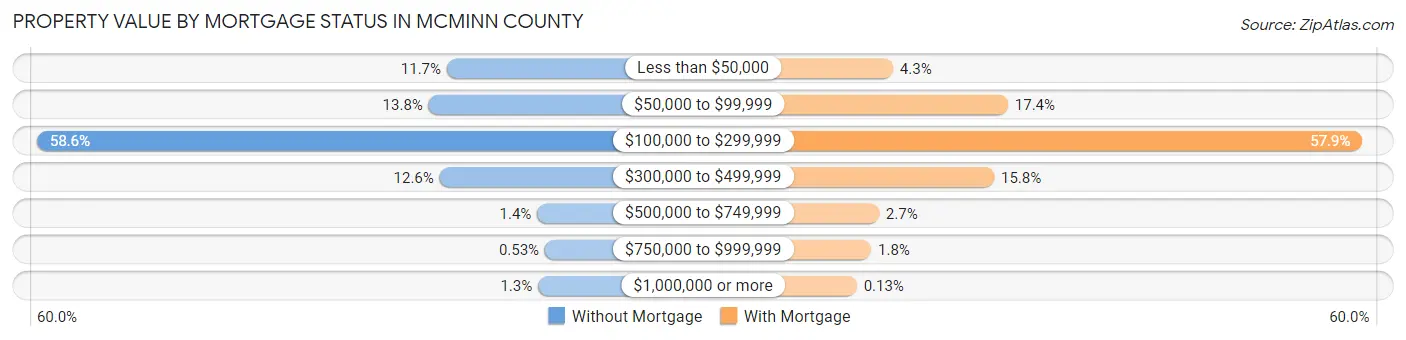
| Property Value | Without Mortgage | With Mortgage |
| Less than $50,000 | 870 (11.7%) | 355 (4.3%) |
| $50,000 to $99,999 | 1,024 (13.8%) | 1,448 (17.4%) |
| $100,000 to $299,999 | 4,341 (58.6%) | 4,815 (57.9%) |
| $300,000 to $499,999 | 931 (12.6%) | 1,316 (15.8%) |
| $500,000 to $749,999 | 105 (1.4%) | 222 (2.7%) |
| $750,000 to $999,999 | 39 (0.5%) | 148 (1.8%) |
| $1,000,000 or more | 98 (1.3%) | 11 (0.1%) |
| Total | 7,408 (100.0%) | 8,315 (100.0%) |
Household Income by Mortgage Status in McMinn County
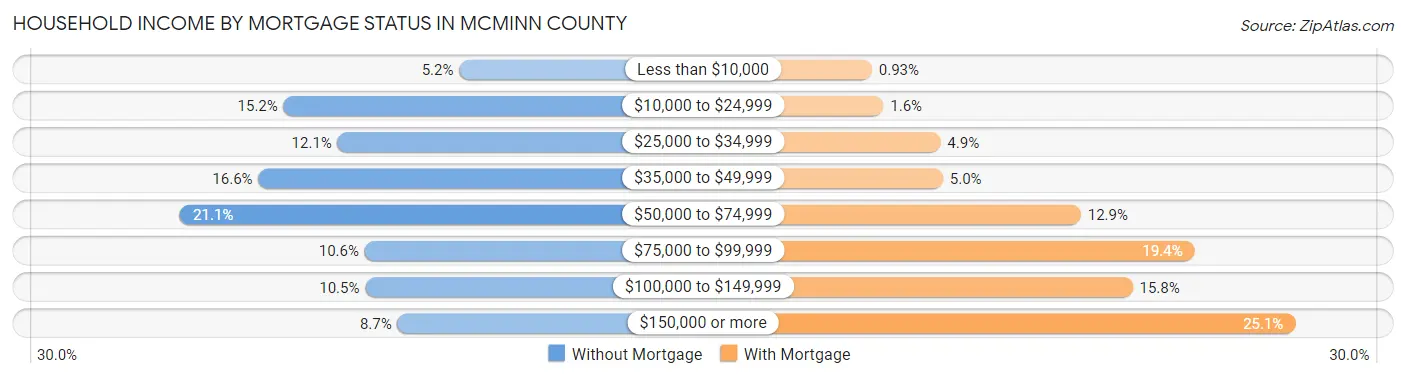
| Household Income | Without Mortgage | With Mortgage |
| Less than $10,000 | 382 (5.2%) | 77 (0.9%) |
| $10,000 to $24,999 | 1,126 (15.2%) | 132 (1.6%) |
| $25,000 to $34,999 | 897 (12.1%) | 403 (4.9%) |
| $35,000 to $49,999 | 1,233 (16.6%) | 415 (5.0%) |
| $50,000 to $74,999 | 1,564 (21.1%) | 1,070 (12.9%) |
| $75,000 to $99,999 | 782 (10.6%) | 1,611 (19.4%) |
| $100,000 to $149,999 | 780 (10.5%) | 1,316 (15.8%) |
| $150,000 or more | 644 (8.7%) | 2,089 (25.1%) |
| Total | 7,408 (100.0%) | 8,315 (100.0%) |
Property Value to Household Income Ratio in McMinn County
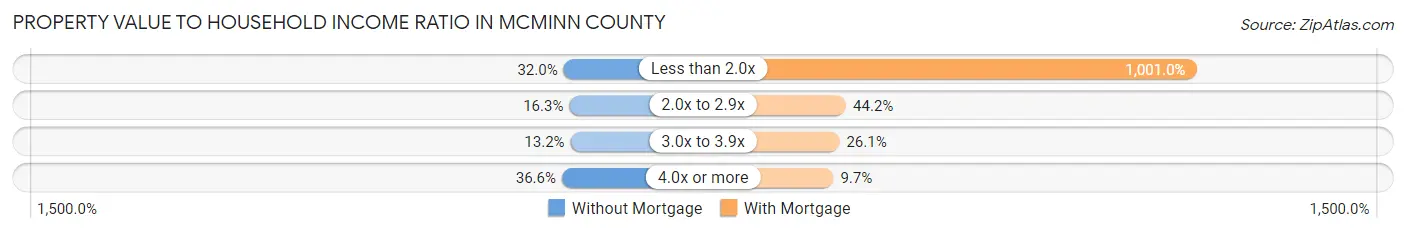
| Value-to-Income Ratio | Without Mortgage | With Mortgage |
| Less than 2.0x | 2,372 (32.0%) | 83,230 (1,001.0%) |
| 2.0x to 2.9x | 1,207 (16.3%) | 3,674 (44.2%) |
| 3.0x to 3.9x | 977 (13.2%) | 2,166 (26.1%) |
| 4.0x or more | 2,714 (36.6%) | 802 (9.7%) |
| Total | 7,408 (100.0%) | 8,315 (100.0%) |
Real Estate Taxes by Mortgage Status in McMinn County
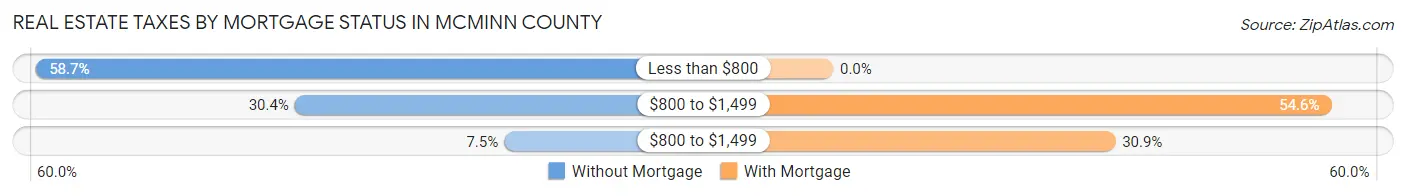
| Property Taxes | Without Mortgage | With Mortgage |
| Less than $800 | 4,350 (58.7%) | 0 (0.0%) |
| $800 to $1,499 | 2,252 (30.4%) | 4,540 (54.6%) |
| $800 to $1,499 | 553 (7.5%) | 2,571 (30.9%) |
| Total | 7,408 (100.0%) | 8,315 (100.0%) |
Health & Disability in McMinn County
Health Insurance Coverage by Age in McMinn County
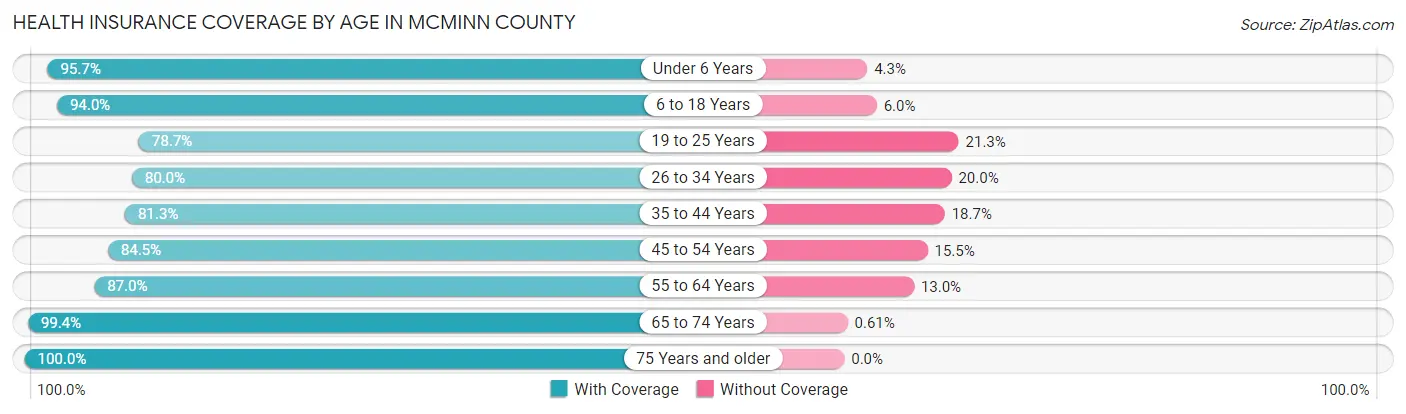
| Age Bracket | With Coverage | Without Coverage |
| Under 6 Years | 3,359 (95.7%) | 150 (4.3%) |
| 6 to 18 Years | 8,104 (94.0%) | 521 (6.0%) |
| 19 to 25 Years | 3,499 (78.7%) | 948 (21.3%) |
| 26 to 34 Years | 4,279 (80.0%) | 1,069 (20.0%) |
| 35 to 44 Years | 4,790 (81.3%) | 1,104 (18.7%) |
| 45 to 54 Years | 5,945 (84.5%) | 1,093 (15.5%) |
| 55 to 64 Years | 6,618 (87.0%) | 988 (13.0%) |
| 65 to 74 Years | 6,032 (99.4%) | 37 (0.6%) |
| 75 Years and older | 4,219 (100.0%) | 0 (0.0%) |
| Total | 46,845 (88.8%) | 5,910 (11.2%) |
Health Insurance Coverage by Citizenship Status in McMinn County
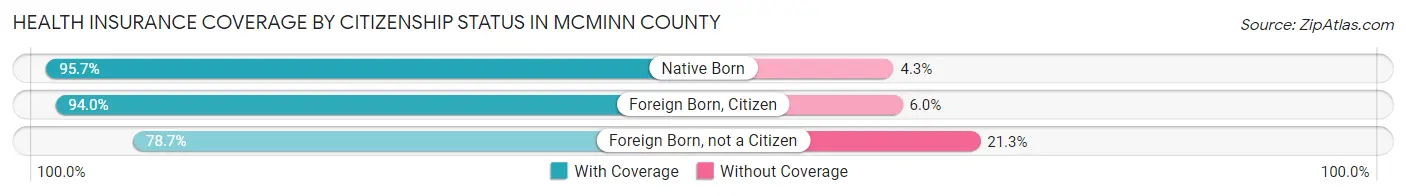
| Citizenship Status | With Coverage | Without Coverage |
| Native Born | 3,359 (95.7%) | 150 (4.3%) |
| Foreign Born, Citizen | 8,104 (94.0%) | 521 (6.0%) |
| Foreign Born, not a Citizen | 3,499 (78.7%) | 948 (21.3%) |
Health Insurance Coverage by Household Income in McMinn County
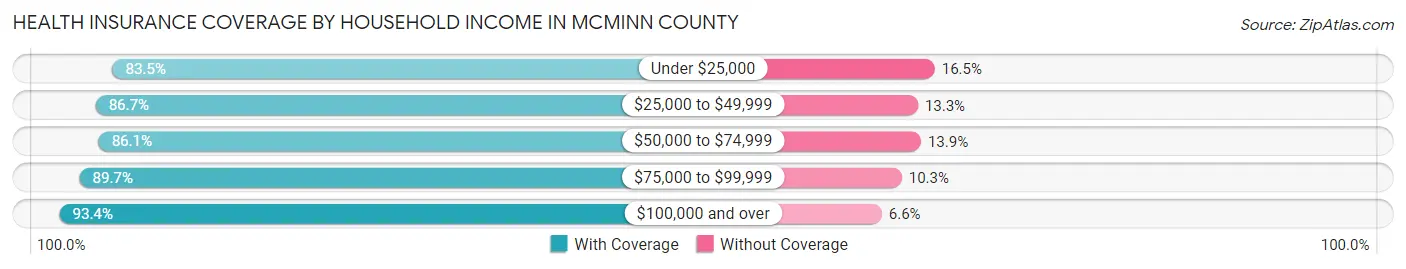
| Household Income | With Coverage | Without Coverage |
| Under $25,000 | 5,627 (83.5%) | 1,111 (16.5%) |
| $25,000 to $49,999 | 9,555 (86.7%) | 1,470 (13.3%) |
| $50,000 to $74,999 | 9,208 (86.1%) | 1,486 (13.9%) |
| $75,000 to $99,999 | 6,462 (89.7%) | 743 (10.3%) |
| $100,000 and over | 15,489 (93.4%) | 1,090 (6.6%) |
Public vs Private Health Insurance Coverage by Age in McMinn County
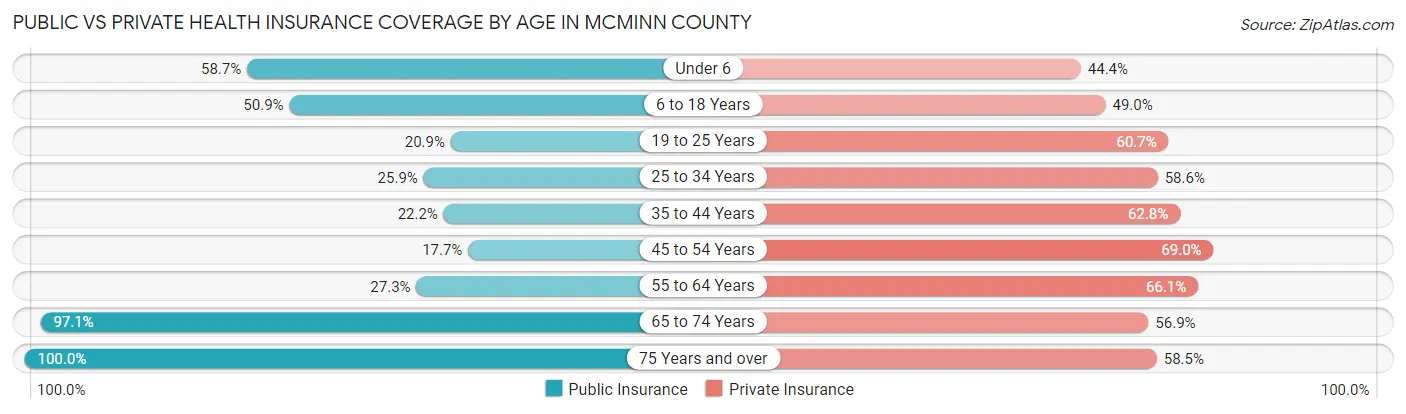
| Age Bracket | Public Insurance | Private Insurance |
| Under 6 | 2,060 (58.7%) | 1,557 (44.4%) |
| 6 to 18 Years | 4,386 (50.8%) | 4,222 (48.9%) |
| 19 to 25 Years | 929 (20.9%) | 2,697 (60.7%) |
| 25 to 34 Years | 1,387 (25.9%) | 3,136 (58.6%) |
| 35 to 44 Years | 1,309 (22.2%) | 3,701 (62.8%) |
| 45 to 54 Years | 1,243 (17.7%) | 4,855 (69.0%) |
| 55 to 64 Years | 2,074 (27.3%) | 5,030 (66.1%) |
| 65 to 74 Years | 5,890 (97.1%) | 3,454 (56.9%) |
| 75 Years and over | 4,219 (100.0%) | 2,467 (58.5%) |
| Total | 23,497 (44.5%) | 31,119 (59.0%) |
Disability Status by Sex by Age in McMinn County
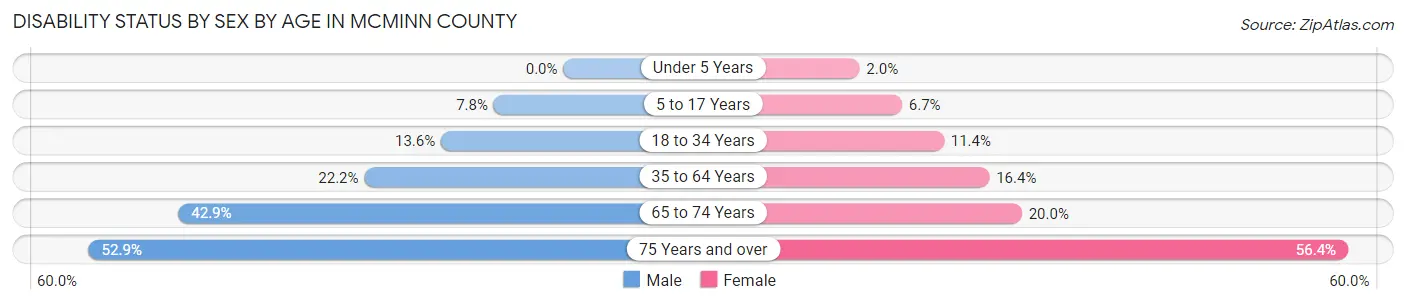
| Age Bracket | Male | Female |
| Under 5 Years | 0 (0.0%) | 28 (2.0%) |
| 5 to 17 Years | 322 (7.7%) | 276 (6.7%) |
| 18 to 34 Years | 725 (13.6%) | 608 (11.4%) |
| 35 to 64 Years | 2,247 (22.2%) | 1,707 (16.4%) |
| 65 to 74 Years | 1,235 (42.9%) | 639 (20.0%) |
| 75 Years and over | 905 (52.9%) | 1,413 (56.4%) |
Disability Class by Sex by Age in McMinn County
Disability Class: Hearing Difficulty
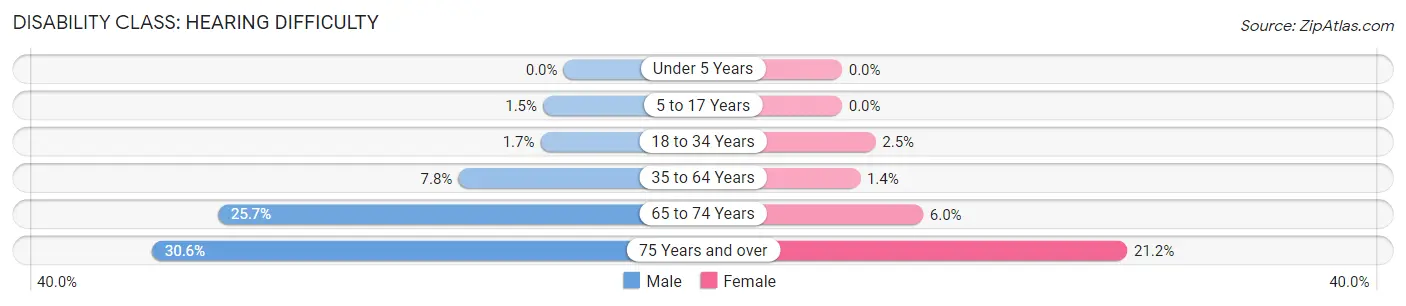
| Age Bracket | Male | Female |
| Under 5 Years | 0 (0.0%) | 0 (0.0%) |
| 5 to 17 Years | 63 (1.5%) | 0 (0.0%) |
| 18 to 34 Years | 91 (1.7%) | 133 (2.5%) |
| 35 to 64 Years | 792 (7.8%) | 140 (1.3%) |
| 65 to 74 Years | 739 (25.7%) | 192 (6.0%) |
| 75 Years and over | 523 (30.5%) | 531 (21.2%) |
Disability Class: Vision Difficulty
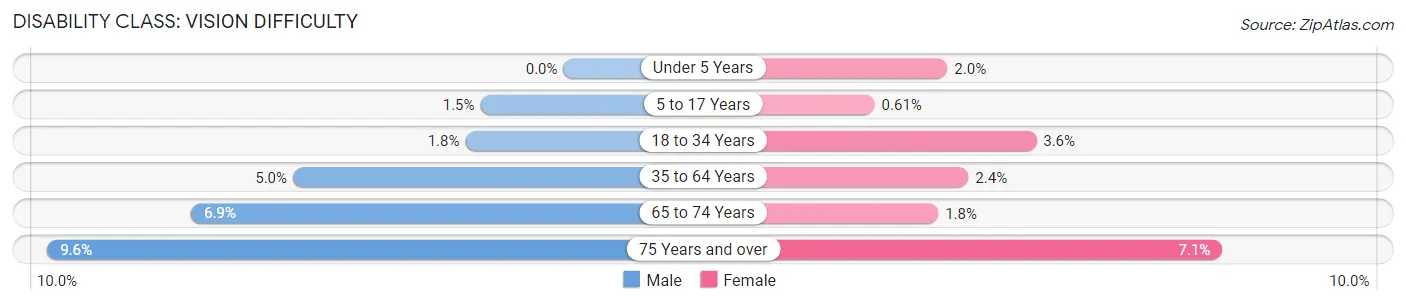
| Age Bracket | Male | Female |
| Under 5 Years | 0 (0.0%) | 28 (2.0%) |
| 5 to 17 Years | 64 (1.5%) | 25 (0.6%) |
| 18 to 34 Years | 97 (1.8%) | 193 (3.6%) |
| 35 to 64 Years | 509 (5.0%) | 244 (2.4%) |
| 65 to 74 Years | 199 (6.9%) | 57 (1.8%) |
| 75 Years and over | 164 (9.6%) | 177 (7.1%) |
Disability Class: Cognitive Difficulty
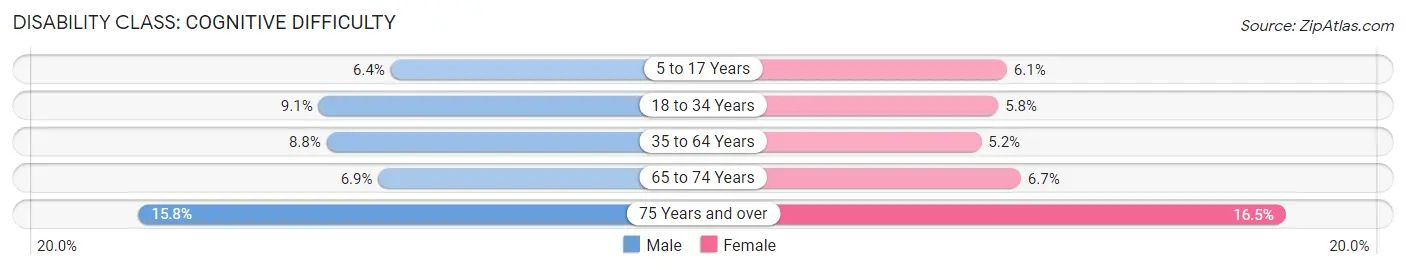
| Age Bracket | Male | Female |
| 5 to 17 Years | 266 (6.4%) | 253 (6.1%) |
| 18 to 34 Years | 484 (9.1%) | 311 (5.8%) |
| 35 to 64 Years | 891 (8.8%) | 538 (5.2%) |
| 65 to 74 Years | 198 (6.9%) | 212 (6.7%) |
| 75 Years and over | 270 (15.8%) | 413 (16.5%) |
Disability Class: Ambulatory Difficulty
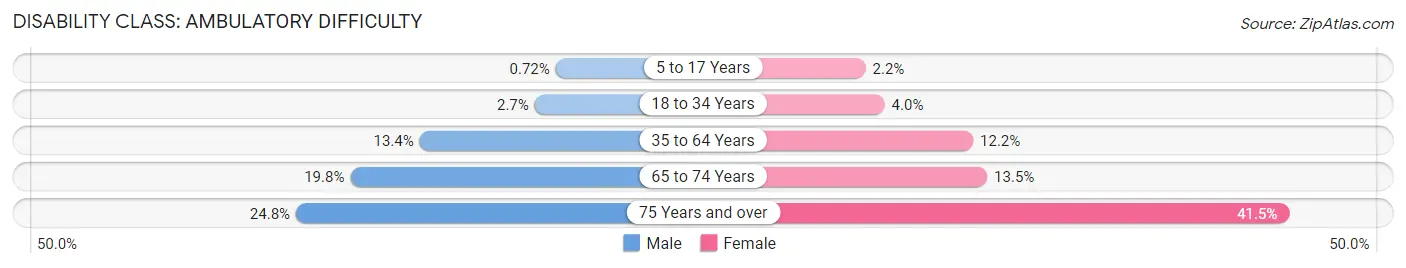
| Age Bracket | Male | Female |
| 5 to 17 Years | 30 (0.7%) | 91 (2.2%) |
| 18 to 34 Years | 142 (2.7%) | 213 (4.0%) |
| 35 to 64 Years | 1,354 (13.4%) | 1,267 (12.2%) |
| 65 to 74 Years | 570 (19.8%) | 430 (13.5%) |
| 75 Years and over | 425 (24.8%) | 1,041 (41.5%) |
Disability Class: Self-Care Difficulty
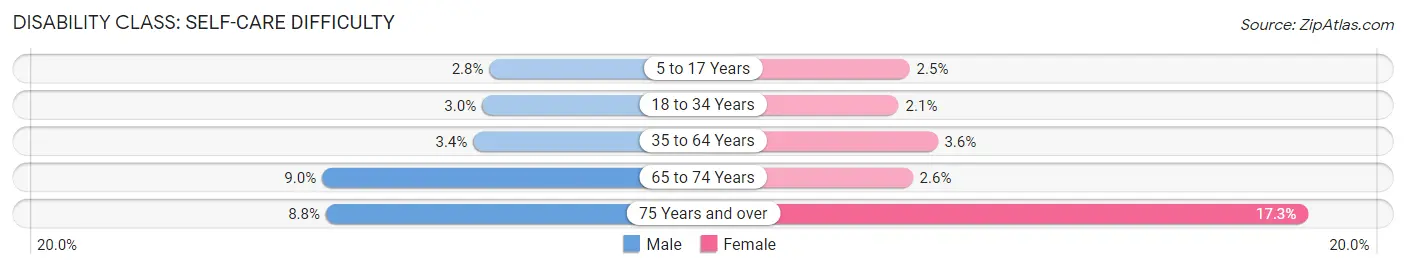
| Age Bracket | Male | Female |
| 5 to 17 Years | 114 (2.8%) | 104 (2.5%) |
| 18 to 34 Years | 161 (3.0%) | 113 (2.1%) |
| 35 to 64 Years | 340 (3.4%) | 369 (3.5%) |
| 65 to 74 Years | 258 (9.0%) | 84 (2.6%) |
| 75 Years and over | 151 (8.8%) | 434 (17.3%) |
Technology Access in McMinn County
Computing Device Access in McMinn County
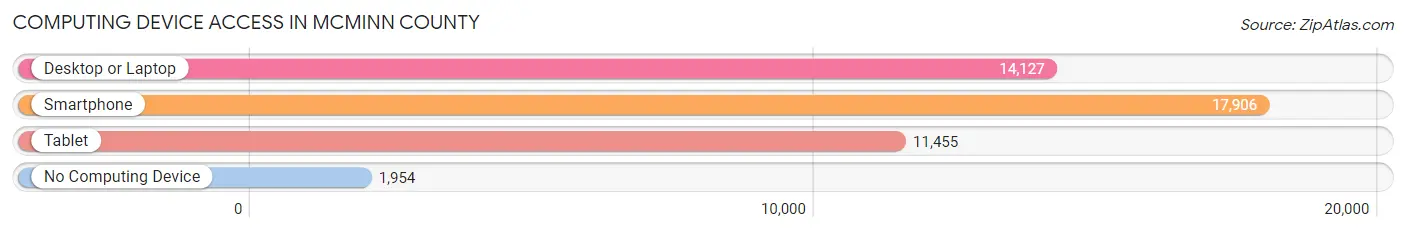
| Device Type | # Households | % Households |
| Desktop or Laptop | 14,127 | 66.5% |
| Smartphone | 17,906 | 84.3% |
| Tablet | 11,455 | 54.0% |
| No Computing Device | 1,954 | 9.2% |
| Total | 21,230 | 100.0% |
Internet Access in McMinn County
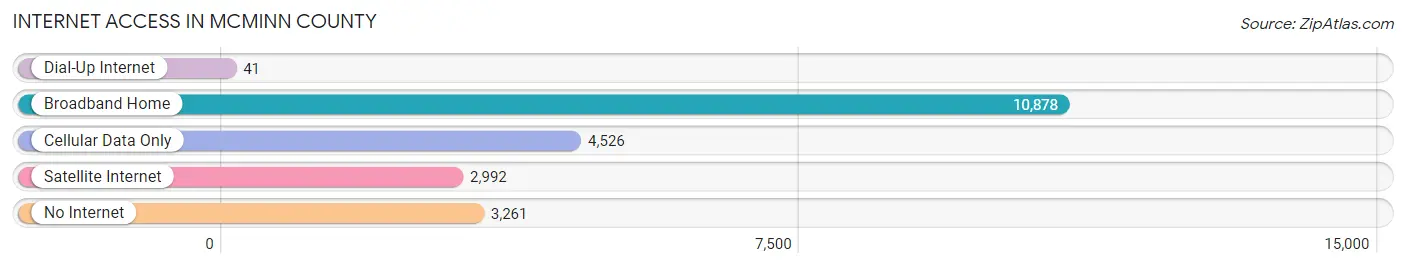
| Internet Type | # Households | % Households |
| Dial-Up Internet | 41 | 0.2% |
| Broadband Home | 10,878 | 51.2% |
| Cellular Data Only | 4,526 | 21.3% |
| Satellite Internet | 2,992 | 14.1% |
| No Internet | 3,261 | 15.4% |
| Total | 21,230 | 100.0% |
McMinn County Summary
McMinn County is located in the southeastern corner of Tennessee, and is part of the Chattanooga Metropolitan Statistical Area. It is bordered by Monroe County to the north, Polk County to the east, Bradley County to the south, and Meigs County to the west. The county seat is Athens, and the largest city is Etowah. The county was established in 1819 and named for Joseph McMinn, the Governor of Tennessee from 1815 to 1821.
History
McMinn County was originally part of the Cherokee Nation, and was part of the Hiwassee Purchase in 1819. The county was established in 1819 and named for Joseph McMinn, the Governor of Tennessee from 1815 to 1821. The first settlers in the county were mostly Scots-Irish and German immigrants. The county was largely agricultural, with cotton and tobacco being the main crops.
During the Civil War, McMinn County was a major center of Confederate activity. The county was the site of the Battle of Athens in 1861, and the Battle of Etowah in 1863. After the war, the county was largely agricultural, with cotton and tobacco being the main crops.
In the late 19th century, the county began to industrialize, with the establishment of several factories. The county was also home to several coal mines, which provided jobs for many of the county's residents.
Geography
McMinn County is located in the southeastern corner of Tennessee, and is part of the Chattanooga Metropolitan Statistical Area. It is bordered by Monroe County to the north, Polk County to the east, Bradley County to the south, and Meigs County to the west. The county has a total area of 517 square miles, of which 514 square miles is land and 3 square miles is water. The county is located in the Appalachian Mountains, and is home to several rivers, including the Hiwassee, Ocoee, and Conasauga.
Economy
McMinn County has a diverse economy, with a mix of manufacturing, agriculture, and tourism. The county is home to several factories, including a General Motors plant in Etowah, and a Tyson Foods plant in Athens. The county is also home to several farms, which produce a variety of crops, including cotton, tobacco, corn, and soybeans.
The county is also home to several tourist attractions, including the Hiwassee River, the Ocoee River, and the Cherokee National Forest. The county is also home to several historic sites, including the Battle of Athens State Historic Site, the Etowah Mounds State Historic Site, and the Hiwassee Wildlife Refuge.
Demographics
As of the 2010 census, there were 52,266 people, 20,845 households, and 14,845 families living in the county. The population density was 101.3 people per square mile. The racial makeup of the county was 94.2% White, 2.7% Black or African American, 0.4% Native American, 0.4% Asian, 0.1% Pacific Islander, 1.2% from other races, and 1.1% from two or more races. Hispanic or Latino of any race were 2.7% of the population.
The median income for a household in the county was $35,945, and the median income for a family was $43,945. The per capita income for the county was $18,945. About 14.2% of families and 17.7% of the population were below the poverty line, including 25.2% of those under age 18 and 13.2% of those age 65 or over.
Common Questions
What is the Total Population of McMinn County?
Total Population of McMinn County is 53,532.
What is the Total Male Population of McMinn County?
Total Male Population of McMinn County is 26,262.
What is the Total Female Population of McMinn County?
Total Female Population of McMinn County is 27,270.
What is the Ratio of Males per 100 Females in McMinn County?
There are 96.30 Males per 100 Females in McMinn County.
What is the Ratio of Females per 100 Males in McMinn County?
There are 103.84 Females per 100 Males in McMinn County.
What is the Median Population Age in McMinn County?
Median Population Age in McMinn County is 42.3 Years.
What is the Average Family Size in McMinn County
Average Family Size in McMinn County is 3.0 People.
What is the Average Household Size in McMinn County
Average Household Size in McMinn County is 2.5 People.
What is Per Capita Income in McMinn County?
Per Capita income in McMinn County is $30,334.
What is the Median Family Income in McMinn County?
Median Family Income in McMinn County is $69,420.
What is the Median Household income in McMinn County?
Median Household Income in McMinn County is $57,982.
What is Income or Wage Gap in McMinn County?
Income or Wage Gap in McMinn County is 36.5%.
Women in McMinn County earn 63.5 cents for every dollar earned by a man.
What is Family Income Deficit in McMinn County?
Family Income Deficit in McMinn County is $12,241.
Families that are below poverty line in McMinn County earn $12,241 less on average than the poverty threshold level.
What is Inequality or Gini Index in McMinn County?
Inequality or Gini Index in McMinn County is 0.45.
How Large is the Labor Force in McMinn County?
There are 24,100 People in the Labor Forcein in McMinn County.
What is the Percentage of People in the Labor Force in McMinn County?
55.0% of People are in the Labor Force in McMinn County.
What is the Unemployment Rate in McMinn County?
Unemployment Rate in McMinn County is 5.3%.