Madison County, TN
Madison County Overview
98,644
TOTAL POPULATION
47,371
MALE POPULATION
51,273
FEMALE POPULATION
92.39
MALES / 100 FEMALES
108.24
FEMALES / 100 MALES
38.4
MEDIAN AGE
3.0
AVG FAMILY SIZE
2.4
AVG HOUSEHOLD SIZE
$31,380
PER CAPITA INCOME
$72,116
AVG FAMILY INCOME
$55,280
AVG HOUSEHOLD INCOME
23.4%
WAGE / INCOME GAP [ % ]
76.6¢/ $1
WAGE / INCOME GAP [ $ ]
$11,954
FAMILY INCOME DEFICIT
0.47
INEQUALITY / GINI INDEX
48,592
LABOR FORCE [ PEOPLE ]
61.1%
PERCENT IN LABOR FORCE
7.4%
UNEMPLOYMENT RATE
Madison County Area Codes
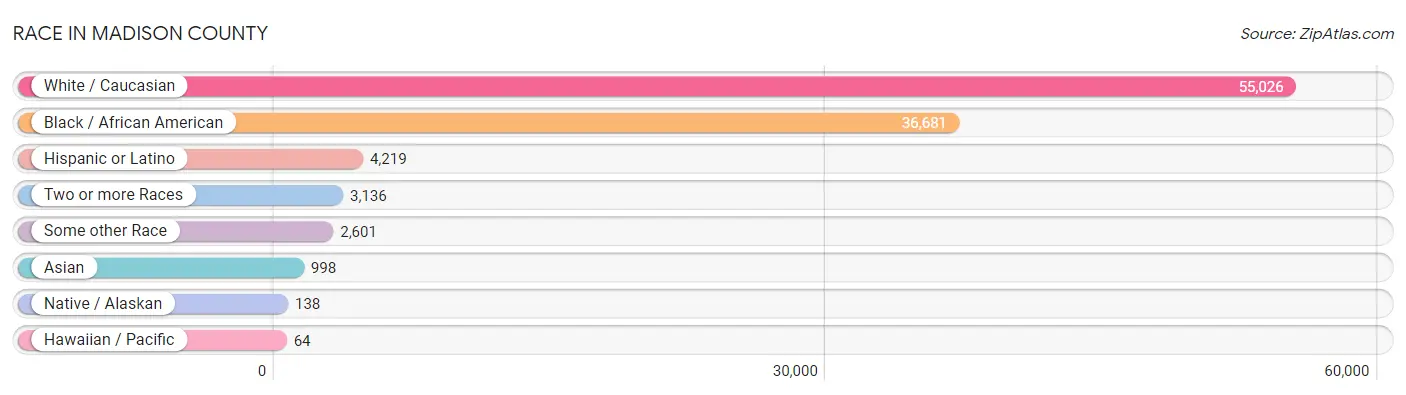
Race in Madison County
The most populous races in Madison County are White / Caucasian (55,026 | 55.8%), Black / African American (36,681 | 37.2%), and Hispanic or Latino (4,219 | 4.3%).
| Race | # Population | % Population |
| Asian | 998 | 1.0% |
| Black / African American | 36,681 | 37.2% |
| Hawaiian / Pacific | 64 | 0.1% |
| Hispanic or Latino | 4,219 | 4.3% |
| Native / Alaskan | 138 | 0.1% |
| White / Caucasian | 55,026 | 55.8% |
| Two or more Races | 3,136 | 3.2% |
| Some other Race | 2,601 | 2.6% |
| Total | 98,644 | 100.0% |
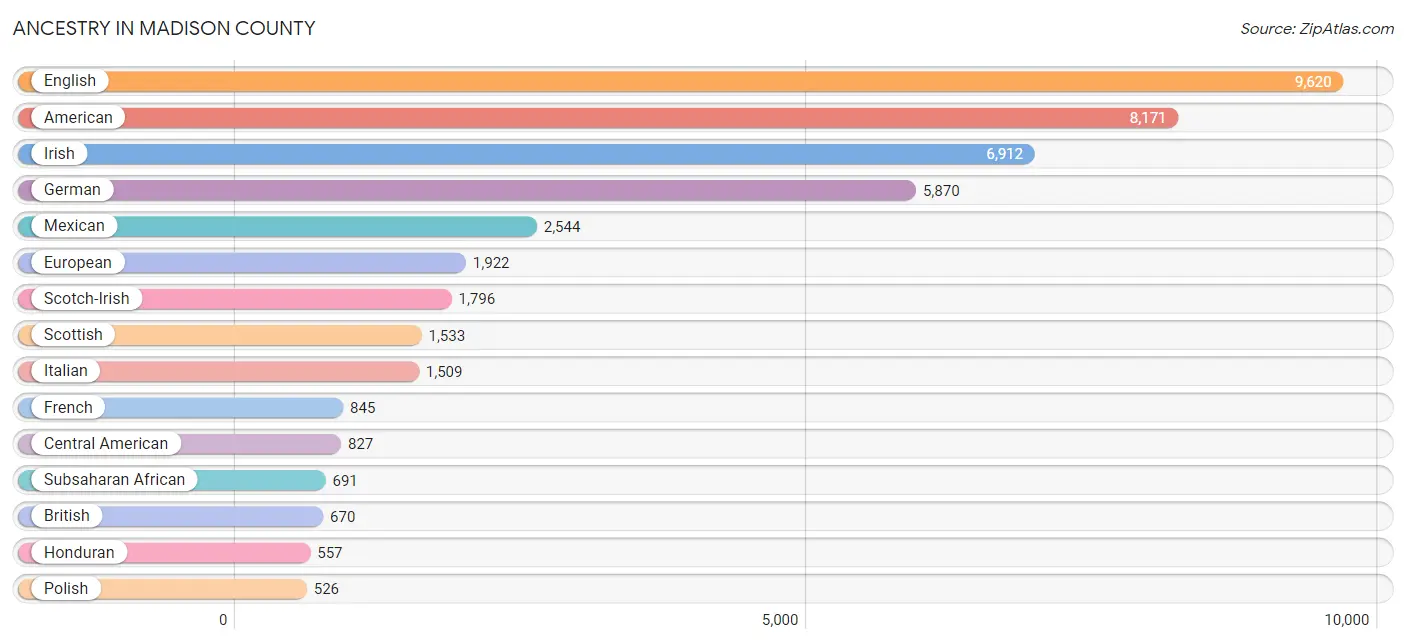
Ancestry in Madison County
The most populous ancestries reported in Madison County are English (9,620 | 9.8%), American (8,171 | 8.3%), Irish (6,912 | 7.0%), German (5,870 | 5.9%), and Mexican (2,544 | 2.6%), together accounting for 33.6% of all Madison County residents.
| Ancestry | # Population | % Population |
| African | 414 | 0.4% |
| Albanian | 191 | 0.2% |
| American | 8,171 | 8.3% |
| Apache | 14 | 0.0% |
| Arab | 59 | 0.1% |
| Argentinean | 25 | 0.0% |
| Armenian | 34 | 0.0% |
| Austrian | 48 | 0.1% |
| Belgian | 8 | 0.0% |
| Belizean | 19 | 0.0% |
| Bhutanese | 92 | 0.1% |
| Blackfeet | 65 | 0.1% |
| Brazilian | 24 | 0.0% |
| British | 670 | 0.7% |
| Burmese | 196 | 0.2% |
| Cajun | 38 | 0.0% |
| Canadian | 86 | 0.1% |
| Central American | 827 | 0.8% |
| Central American Indian | 46 | 0.1% |
| Cherokee | 513 | 0.5% |
| Chickasaw | 3 | 0.0% |
| Choctaw | 10 | 0.0% |
| Colombian | 12 | 0.0% |
| Costa Rican | 8 | 0.0% |
| Croatian | 108 | 0.1% |
| Cuban | 210 | 0.2% |
| Czech | 69 | 0.1% |
| Czechoslovakian | 5 | 0.0% |
| Danish | 58 | 0.1% |
| Dutch | 326 | 0.3% |
| Dutch West Indian | 14 | 0.0% |
| Eastern European | 60 | 0.1% |
| Egyptian | 24 | 0.0% |
| English | 9,620 | 9.8% |
| Ethiopian | 92 | 0.1% |
| European | 1,922 | 1.9% |
| French | 845 | 0.9% |
| French Canadian | 93 | 0.1% |
| German | 5,870 | 5.9% |
| Ghanaian | 13 | 0.0% |
| Greek | 19 | 0.0% |
| Guatemalan | 139 | 0.1% |
| Haitian | 59 | 0.1% |
| Honduran | 557 | 0.6% |
| Hungarian | 63 | 0.1% |
| Indian (Asian) | 162 | 0.2% |
| Iranian | 34 | 0.0% |
| Irish | 6,912 | 7.0% |
| Israeli | 31 | 0.0% |
| Italian | 1,509 | 1.5% |
| Jamaican | 35 | 0.0% |
| Japanese | 20 | 0.0% |
| Korean | 224 | 0.2% |
| Laotian | 7 | 0.0% |
| Latvian | 14 | 0.0% |
| Lebanese | 6 | 0.0% |
| Lithuanian | 5 | 0.0% |
| Mexican | 2,544 | 2.6% |
| Moroccan | 27 | 0.0% |
| Native Hawaiian | 113 | 0.1% |
| Nigerian | 78 | 0.1% |
| Northern European | 66 | 0.1% |
| Norwegian | 286 | 0.3% |
| Osage | 1 | 0.0% |
| Ottawa | 1 | 0.0% |
| Pakistani | 44 | 0.0% |
| Panamanian | 116 | 0.1% |
| Peruvian | 49 | 0.1% |
| Polish | 526 | 0.5% |
| Portuguese | 14 | 0.0% |
| Puerto Rican | 198 | 0.2% |
| Romanian | 55 | 0.1% |
| Russian | 127 | 0.1% |
| Salvadoran | 7 | 0.0% |
| Samoan | 17 | 0.0% |
| Scandinavian | 290 | 0.3% |
| Scotch-Irish | 1,796 | 1.8% |
| Scottish | 1,533 | 1.5% |
| Slavic | 20 | 0.0% |
| Slovak | 24 | 0.0% |
| Slovene | 11 | 0.0% |
| Somali | 64 | 0.1% |
| South American | 86 | 0.1% |
| Spaniard | 110 | 0.1% |
| Spanish | 46 | 0.1% |
| Sri Lankan | 245 | 0.3% |
| Subsaharan African | 691 | 0.7% |
| Swedish | 250 | 0.3% |
| Swiss | 23 | 0.0% |
| Syrian | 2 | 0.0% |
| Thai | 233 | 0.2% |
| Trinidadian and Tobagonian | 7 | 0.0% |
| Ukrainian | 26 | 0.0% |
| Welsh | 259 | 0.3% |
| Yugoslavian | 4 | 0.0% | View All 95 Rows |
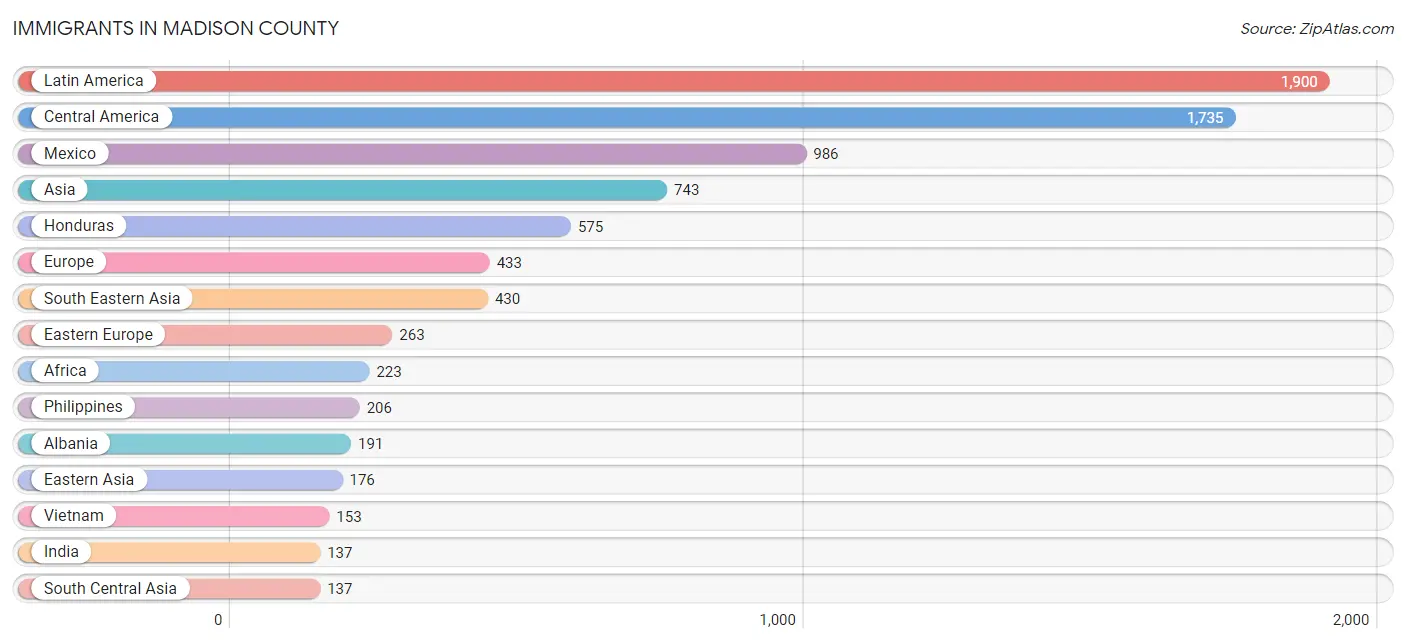
Immigrants in Madison County
The most numerous immigrant groups reported in Madison County came from Latin America (1,900 | 1.9%), Central America (1,735 | 1.8%), Mexico (986 | 1.0%), Asia (743 | 0.7%), and Honduras (575 | 0.6%), together accounting for 6.0% of all Madison County residents.
| Immigration Origin | # Population | % Population |
| Africa | 223 | 0.2% |
| Albania | 191 | 0.2% |
| Argentina | 23 | 0.0% |
| Asia | 743 | 0.7% |
| Brazil | 24 | 0.0% |
| Cambodia | 20 | 0.0% |
| Canada | 37 | 0.0% |
| Caribbean | 50 | 0.1% |
| Central America | 1,735 | 1.8% |
| China | 86 | 0.1% |
| Colombia | 15 | 0.0% |
| Croatia | 7 | 0.0% |
| Cuba | 15 | 0.0% |
| Dominican Republic | 9 | 0.0% |
| Eastern Africa | 102 | 0.1% |
| Eastern Asia | 176 | 0.2% |
| Eastern Europe | 263 | 0.3% |
| Egypt | 15 | 0.0% |
| England | 77 | 0.1% |
| Ethiopia | 68 | 0.1% |
| Europe | 433 | 0.4% |
| Germany | 66 | 0.1% |
| Ghana | 13 | 0.0% |
| Guatemala | 132 | 0.1% |
| Haiti | 19 | 0.0% |
| Honduras | 575 | 0.6% |
| Hong Kong | 11 | 0.0% |
| India | 137 | 0.1% |
| Indonesia | 7 | 0.0% |
| Italy | 4 | 0.0% |
| Japan | 36 | 0.0% |
| Korea | 54 | 0.1% |
| Latin America | 1,900 | 1.9% |
| Latvia | 14 | 0.0% |
| Mexico | 986 | 1.0% |
| Netherlands | 6 | 0.0% |
| Nigeria | 54 | 0.1% |
| Northern Africa | 15 | 0.0% |
| Northern Europe | 94 | 0.1% |
| Panama | 42 | 0.0% |
| Peru | 49 | 0.1% |
| Philippines | 206 | 0.2% |
| Poland | 5 | 0.0% |
| Russia | 42 | 0.0% |
| South America | 115 | 0.1% |
| South Central Asia | 137 | 0.1% |
| South Eastern Asia | 430 | 0.4% |
| Southern Europe | 4 | 0.0% |
| Thailand | 44 | 0.0% |
| Trinidad and Tobago | 7 | 0.0% |
| Venezuela | 4 | 0.0% |
| Vietnam | 153 | 0.2% |
| Western Africa | 67 | 0.1% |
| Western Europe | 72 | 0.1% |
| Zimbabwe | 31 | 0.0% | View All 55 Rows |
Sex and Age in Madison County
Sex and Age in Madison County
The most populous age groups in Madison County are 15 to 19 Years (3,944 | 8.3%) for men and 55 to 59 Years (3,609 | 7.0%) for women.

| Age Bracket | Male | Female |
| Under 5 Years | 2,927 (6.2%) | 2,982 (5.8%) |
| 5 to 9 Years | 3,139 (6.6%) | 3,051 (5.9%) |
| 10 to 14 Years | 3,077 (6.5%) | 2,901 (5.7%) |
| 15 to 19 Years | 3,944 (8.3%) | 3,602 (7.0%) |
| 20 to 24 Years | 2,941 (6.2%) | 3,605 (7.0%) |
| 25 to 29 Years | 3,191 (6.7%) | 3,257 (6.4%) |
| 30 to 34 Years | 3,053 (6.4%) | 3,160 (6.2%) |
| 35 to 39 Years | 3,255 (6.9%) | 2,953 (5.8%) |
| 40 to 44 Years | 2,362 (5.0%) | 2,955 (5.8%) |
| 45 to 49 Years | 2,694 (5.7%) | 2,946 (5.8%) |
| 50 to 54 Years | 2,999 (6.3%) | 3,110 (6.1%) |
| 55 to 59 Years | 2,947 (6.2%) | 3,609 (7.0%) |
| 60 to 64 Years | 3,387 (7.1%) | 3,506 (6.8%) |
| 65 to 69 Years | 2,743 (5.8%) | 3,017 (5.9%) |
| 70 to 74 Years | 2,013 (4.3%) | 2,518 (4.9%) |
| 75 to 79 Years | 1,310 (2.8%) | 1,893 (3.7%) |
| 80 to 84 Years | 851 (1.8%) | 1,135 (2.2%) |
| 85 Years and over | 538 (1.1%) | 1,073 (2.1%) |
| Total | 47,371 (100.0%) | 51,273 (100.0%) |
Families and Households in Madison County
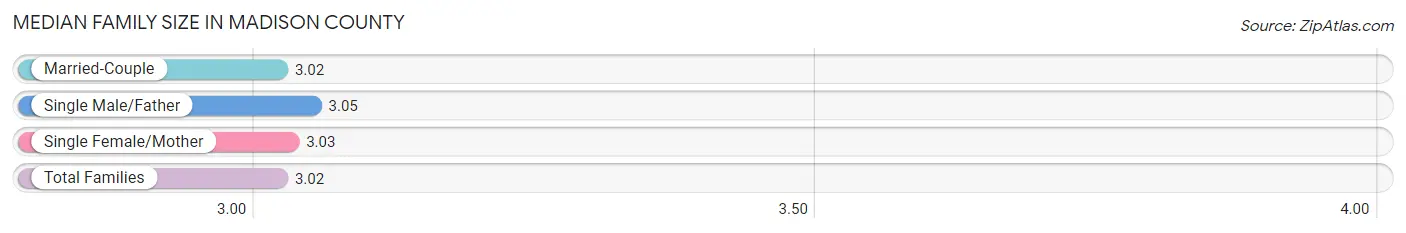
Median Family Size in Madison County
The median family size in Madison County is 3.02 persons per family, with single male/father families (1,893 | 7.5%) accounting for the largest median family size of 3.05 persons per family. On the other hand, married-couple families (16,234 | 64.7%) represent the smallest median family size with 3.02 persons per family.
| Family Type | # Families | Family Size |
| Married-Couple | 16,234 (64.7%) | 3.02 |
| Single Male/Father | 1,893 (7.5%) | 3.05 |
| Single Female/Mother | 6,951 (27.7%) | 3.03 |
| Total Families | 25,078 (100.0%) | 3.02 |
Median Household Size in Madison County
The median household size in Madison County is 2.42 persons per household, with single male/father households (1,893 | 4.8%) accounting for the largest median household size of 3.35 persons per household. non-family households (14,102 | 36.0%) represent the smallest median household size with 1.19 persons per household.
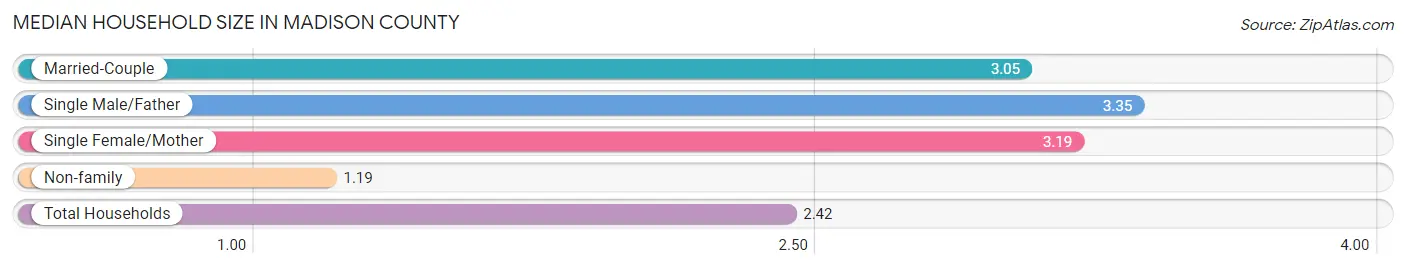
| Household Type | # Households | Household Size |
| Married-Couple | 16,234 (41.4%) | 3.05 |
| Single Male/Father | 1,893 (4.8%) | 3.35 |
| Single Female/Mother | 6,951 (17.7%) | 3.19 |
| Non-family | 14,102 (36.0%) | 1.19 |
| Total Households | 39,180 (100.0%) | 2.42 |
Household Size by Marriage Status in Madison County
Out of a total of 39,180 households in Madison County, 25,078 (64.0%) are family households, while 14,102 (36.0%) are nonfamily households. The most numerous type of family households are 2-person households, comprising 11,951, and the most common type of nonfamily households are 1-person households, comprising 12,381.

| Household Size | Family Households | Nonfamily Households |
| 1-Person Households | - | 12,381 (31.6%) |
| 2-Person Households | 11,951 (30.5%) | 1,513 (3.9%) |
| 3-Person Households | 6,295 (16.1%) | 85 (0.2%) |
| 4-Person Households | 3,631 (9.3%) | 33 (0.1%) |
| 5-Person Households | 2,028 (5.2%) | 42 (0.1%) |
| 6-Person Households | 800 (2.0%) | 48 (0.1%) |
| 7+ Person Households | 373 (0.9%) | 0 (0.0%) |
| Total | 25,078 (64.0%) | 14,102 (36.0%) |
Female Fertility in Madison County
Fertility by Age in Madison County
Average fertility rate in Madison County is 63.0 births per 1,000 women. Women in the age bracket of 20 to 34 years have the highest fertility rate with 134.0 births per 1,000 women. Women in the age bracket of 20 to 34 years acount for 91.9% of all women with births.
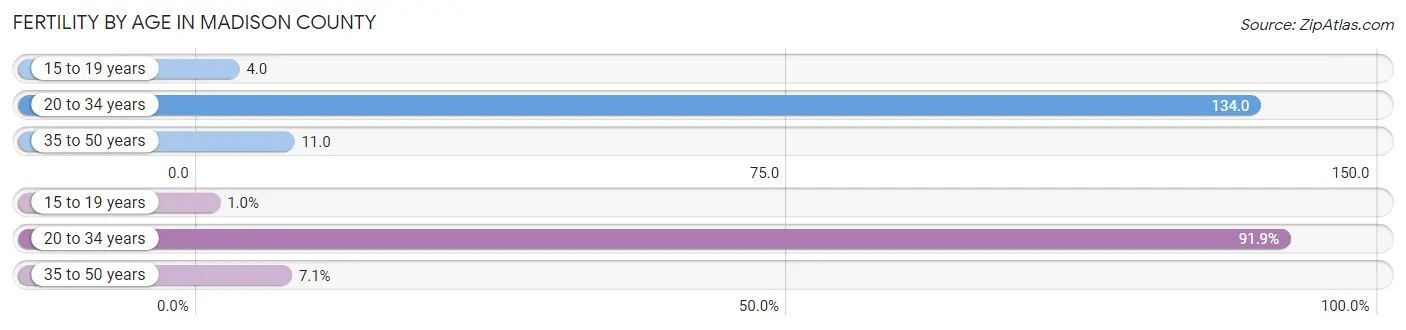
| Age Bracket | Women with Births | Births / 1,000 Women |
| 15 to 19 years | 15 (1.0%) | 4.0 |
| 20 to 34 years | 1,343 (91.9%) | 134.0 |
| 35 to 50 years | 104 (7.1%) | 11.0 |
| Total | 1,462 (100.0%) | 63.0 |
Fertility by Age by Marriage Status in Madison County
68.0% of women with births (1,462) in Madison County are married. The highest percentage of unmarried women with births falls into 15 to 19 years age bracket with 100.0% of them unmarried at the time of birth, while the lowest percentage of unmarried women with births belong to 35 to 50 years age bracket with 17.3% of them unmarried.
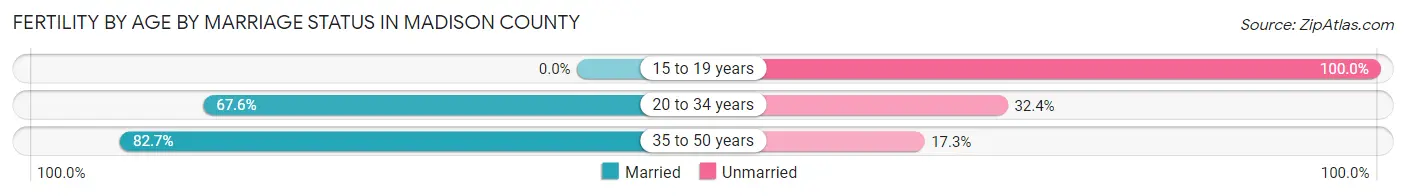
| Age Bracket | Married | Unmarried |
| 15 to 19 years | 0 (0.0%) | 15 (100.0%) |
| 20 to 34 years | 908 (67.6%) | 435 (32.4%) |
| 35 to 50 years | 86 (82.7%) | 18 (17.3%) |
| Total | 994 (68.0%) | 468 (32.0%) |
Fertility by Education in Madison County
Average fertility rate in Madison County is 63.0 births per 1,000 women. Women with the education attainment of graduate degree have the highest fertility rate of 104.0 births per 1,000 women, while women with the education attainment of less than high school have the lowest fertility at 17.0 births per 1,000 women. Women with the education attainment of college or associate's degree represent 48.8% of all women with births.
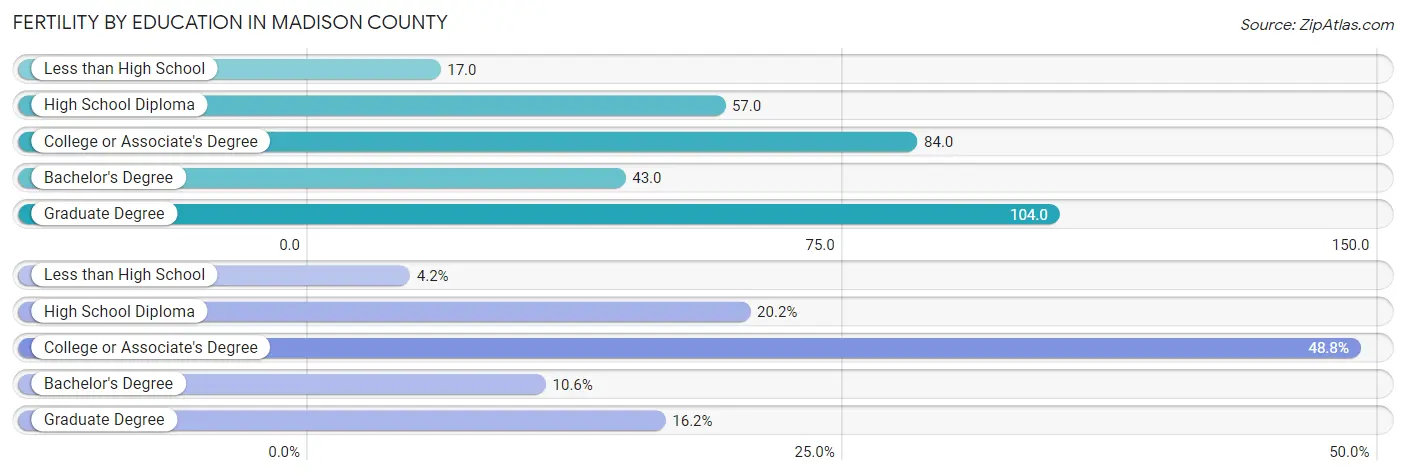
| Educational Attainment | Women with Births | Births / 1,000 Women |
| Less than High School | 62 (4.2%) | 17.0 |
| High School Diploma | 295 (20.2%) | 57.0 |
| College or Associate's Degree | 713 (48.8%) | 84.0 |
| Bachelor's Degree | 155 (10.6%) | 43.0 |
| Graduate Degree | 237 (16.2%) | 104.0 |
| Total | 1,462 (100.0%) | 63.0 |
Fertility by Education by Marriage Status in Madison County
32.0% of women with births in Madison County are unmarried. Women with the educational attainment of bachelor's degree are most likely to be married with 100.0% of them married at childbirth, while women with the educational attainment of high school diploma are least likely to be married with 78.3% of them unmarried at childbirth.
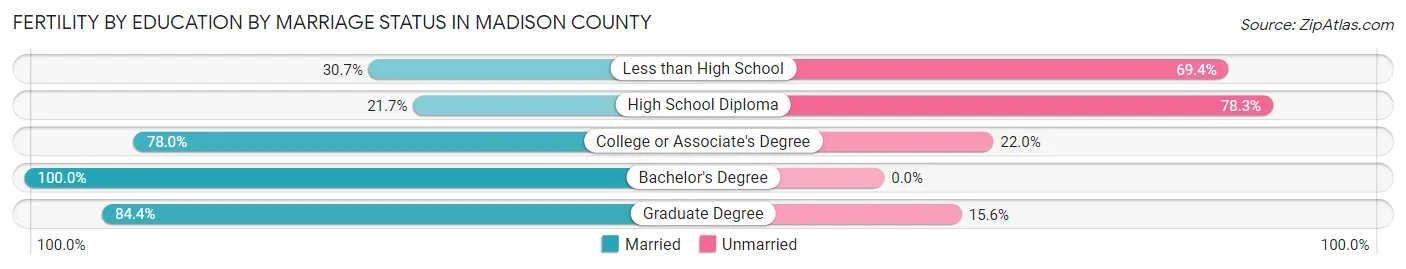
| Educational Attainment | Married | Unmarried |
| Less than High School | 19 (30.6%) | 43 (69.4%) |
| High School Diploma | 64 (21.7%) | 231 (78.3%) |
| College or Associate's Degree | 556 (78.0%) | 157 (22.0%) |
| Bachelor's Degree | 155 (100.0%) | 0 (0.0%) |
| Graduate Degree | 200 (84.4%) | 37 (15.6%) |
| Total | 994 (68.0%) | 468 (32.0%) |
Income in Madison County
Income Overview in Madison County
Per Capita Income in Madison County is $31,380, while median incomes of families and households are $72,116 and $55,280 respectively.
| Characteristic | Number | Measure |
| Per Capita Income | 98,644 | $31,380 |
| Median Family Income | 25,078 | $72,116 |
| Mean Family Income | 25,078 | $91,519 |
| Median Household Income | 39,180 | $55,280 |
| Mean Household Income | 39,180 | $76,310 |
| Income Deficit | 25,078 | $11,954 |
| Wage / Income Gap (%) | 98,644 | 23.37% |
| Wage / Income Gap ($) | 98,644 | 76.63¢ per $1 |
| Gini / Inequality Index | 98,644 | 0.47 |
Earnings by Sex in Madison County
Average Earnings in Madison County are $33,106, $38,380 for men and $29,412 for women, a difference of 23.4%.
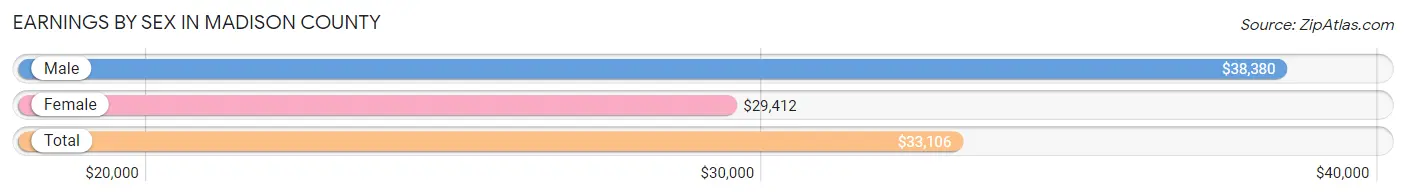
| Sex | Number | Average Earnings |
| Male | 25,003 (49.3%) | $38,380 |
| Female | 25,677 (50.7%) | $29,412 |
| Total | 50,680 (100.0%) | $33,106 |
Earnings by Sex by Income Bracket in Madison County
The most common earnings brackets in Madison County are $100,000+ for men (2,905 | 11.6%) and $25,000 to $29,999 for women (2,295 | 8.9%).
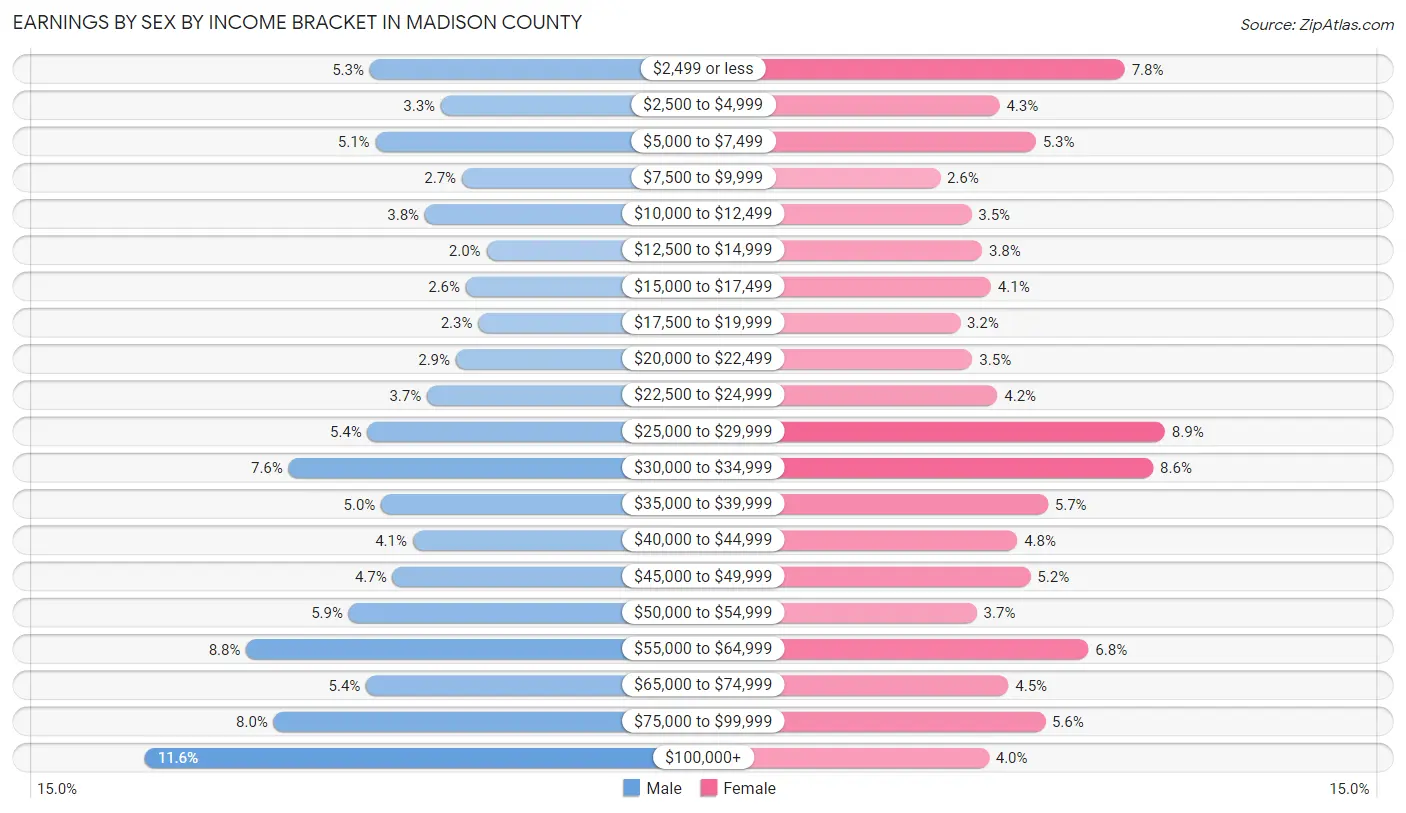
| Income | Male | Female |
| $2,499 or less | 1,324 (5.3%) | 2,005 (7.8%) |
| $2,500 to $4,999 | 825 (3.3%) | 1,102 (4.3%) |
| $5,000 to $7,499 | 1,285 (5.1%) | 1,363 (5.3%) |
| $7,500 to $9,999 | 678 (2.7%) | 672 (2.6%) |
| $10,000 to $12,499 | 938 (3.7%) | 898 (3.5%) |
| $12,500 to $14,999 | 505 (2.0%) | 975 (3.8%) |
| $15,000 to $17,499 | 650 (2.6%) | 1,039 (4.1%) |
| $17,500 to $19,999 | 563 (2.2%) | 816 (3.2%) |
| $20,000 to $22,499 | 721 (2.9%) | 907 (3.5%) |
| $22,500 to $24,999 | 923 (3.7%) | 1,087 (4.2%) |
| $25,000 to $29,999 | 1,341 (5.4%) | 2,295 (8.9%) |
| $30,000 to $34,999 | 1,894 (7.6%) | 2,211 (8.6%) |
| $35,000 to $39,999 | 1,244 (5.0%) | 1,451 (5.7%) |
| $40,000 to $44,999 | 1,023 (4.1%) | 1,229 (4.8%) |
| $45,000 to $49,999 | 1,166 (4.7%) | 1,326 (5.2%) |
| $50,000 to $54,999 | 1,473 (5.9%) | 936 (3.6%) |
| $55,000 to $64,999 | 2,194 (8.8%) | 1,744 (6.8%) |
| $65,000 to $74,999 | 1,350 (5.4%) | 1,166 (4.5%) |
| $75,000 to $99,999 | 2,001 (8.0%) | 1,430 (5.6%) |
| $100,000+ | 2,905 (11.6%) | 1,025 (4.0%) |
| Total | 25,003 (100.0%) | 25,677 (100.0%) |
Earnings by Sex by Educational Attainment in Madison County
Average earnings in Madison County are $46,482 for men and $33,844 for women, a difference of 27.2%. Men with an educational attainment of graduate degree enjoy the highest average annual earnings of $97,992, while those with less than high school education earn the least with $29,349. Women with an educational attainment of graduate degree earn the most with the average annual earnings of $60,339, while those with less than high school education have the smallest earnings of $23,711.
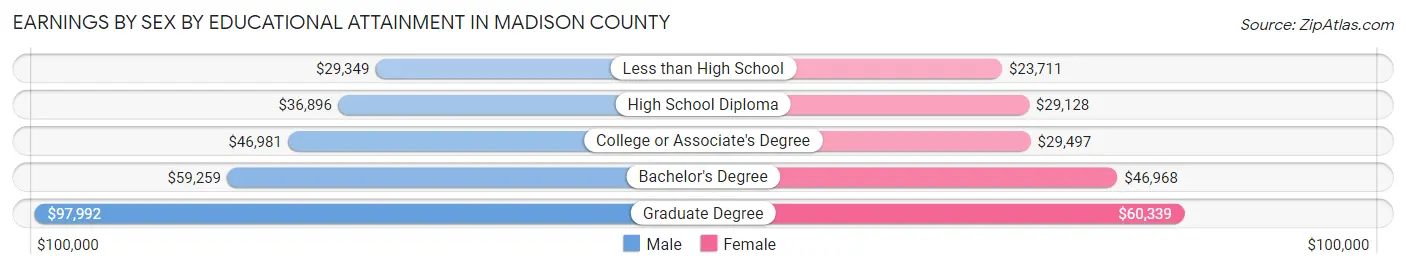
| Educational Attainment | Male Income | Female Income |
| Less than High School | $29,349 | $23,711 |
| High School Diploma | $36,896 | $29,128 |
| College or Associate's Degree | $46,981 | $29,497 |
| Bachelor's Degree | $59,259 | $46,968 |
| Graduate Degree | $97,992 | $60,339 |
| Total | $46,482 | $33,844 |
Family Income in Madison County
Family Income Brackets in Madison County
According to the Madison County family income data, there are 5,041 families falling into the $100,000 to $149,999 income range, which is the most common income bracket and makes up 20.1% of all families. Conversely, the $10,000 to $14,999 income bracket is the least frequent group with only 1,028 families (4.1%) belonging to this category.
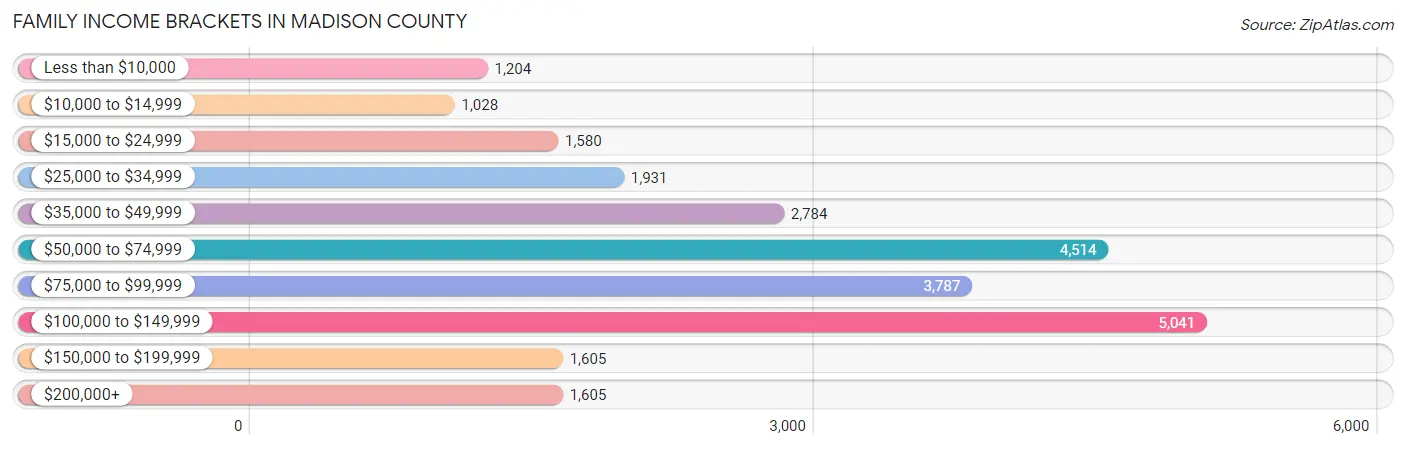
| Income Bracket | # Families | % Families |
| Less than $10,000 | 1,204 | 4.8% |
| $10,000 to $14,999 | 1,028 | 4.1% |
| $15,000 to $24,999 | 1,580 | 6.3% |
| $25,000 to $34,999 | 1,931 | 7.7% |
| $35,000 to $49,999 | 2,784 | 11.1% |
| $50,000 to $74,999 | 4,514 | 18.0% |
| $75,000 to $99,999 | 3,787 | 15.1% |
| $100,000 to $149,999 | 5,041 | 20.1% |
| $150,000 to $199,999 | 1,605 | 6.4% |
| $200,000+ | 1,605 | 6.4% |
Family Income by Famaliy Size in Madison County
7+ person families (308 | 1.2%) account for the highest median family income in Madison County with $111,000 per family, while 2-person families (12,691 | 50.6%) have the highest median income of $32,760 per family member.
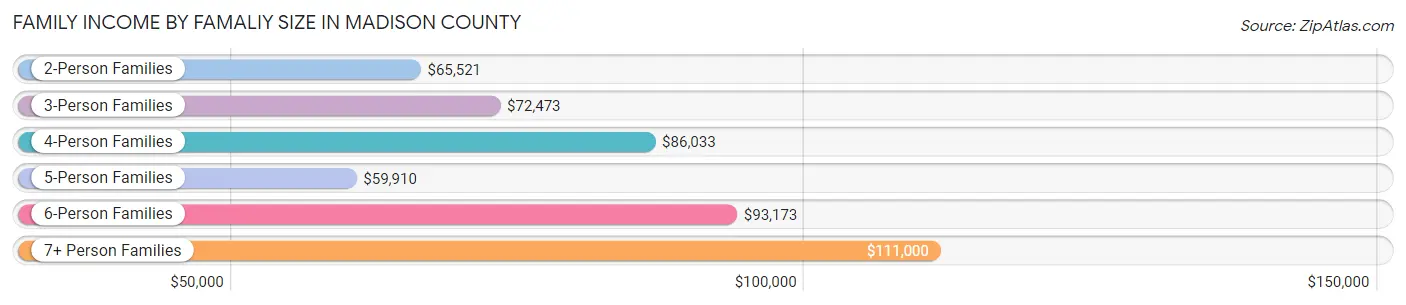
| Income Bracket | # Families | Median Income |
| 2-Person Families | 12,691 (50.6%) | $65,521 |
| 3-Person Families | 6,016 (24.0%) | $72,473 |
| 4-Person Families | 3,529 (14.1%) | $86,033 |
| 5-Person Families | 1,848 (7.4%) | $59,910 |
| 6-Person Families | 686 (2.7%) | $93,173 |
| 7+ Person Families | 308 (1.2%) | $111,000 |
| Total | 25,078 (100.0%) | $72,116 |
Family Income by Number of Earners in Madison County
The median family income in Madison County is $72,116, with families comprising 3+ earners (2,005) having the highest median family income of $114,583, while families with no earners (4,035) have the lowest median family income of $38,283, accounting for 8.0% and 16.1% of families, respectively.
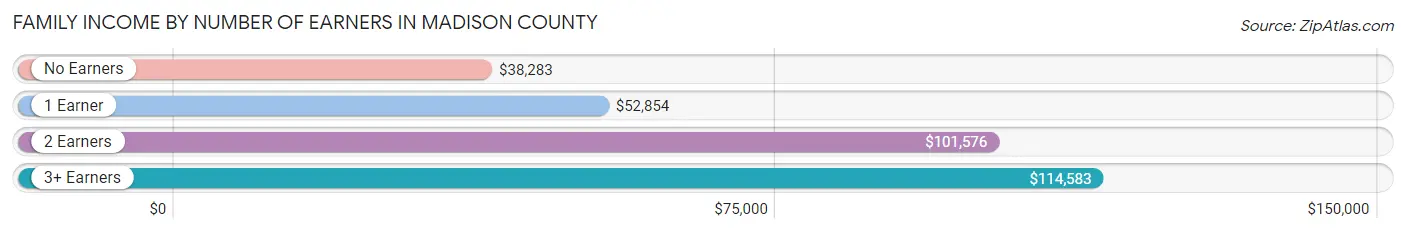
| Number of Earners | # Families | Median Income |
| No Earners | 4,035 (16.1%) | $38,283 |
| 1 Earner | 9,199 (36.7%) | $52,854 |
| 2 Earners | 9,839 (39.2%) | $101,576 |
| 3+ Earners | 2,005 (8.0%) | $114,583 |
| Total | 25,078 (100.0%) | $72,116 |
Household Income in Madison County
Household Income Brackets in Madison County
With 6,974 households falling in the category, the $50,000 to $74,999 income range is the most frequent in Madison County, accounting for 17.8% of all households. In contrast, only 1,802 households (4.6%) fall into the $150,000 to $199,999 income bracket, making it the least populous group.
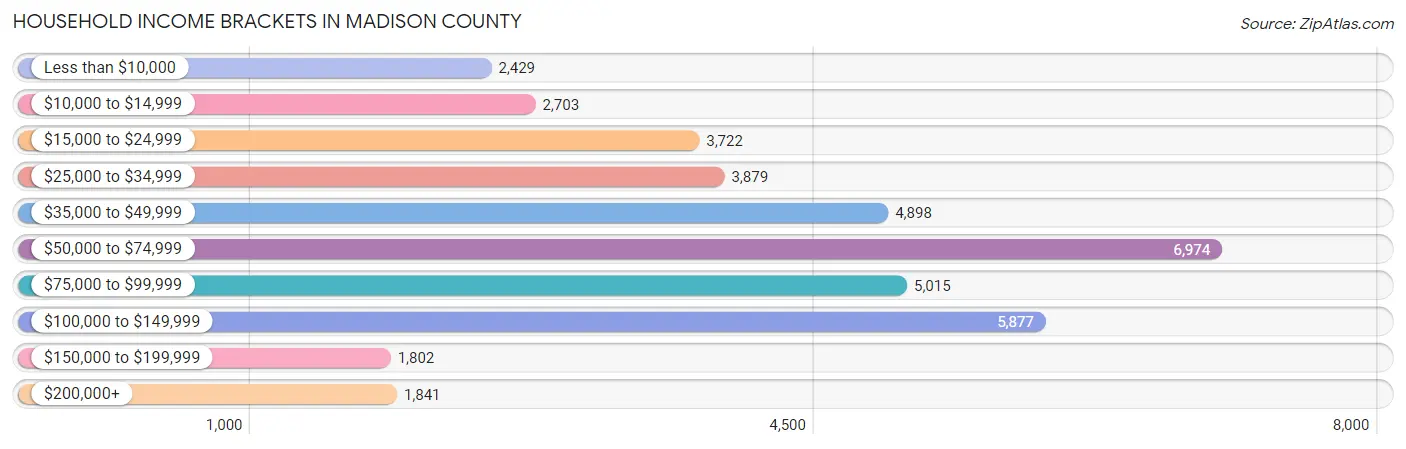
| Income Bracket | # Households | % Households |
| Less than $10,000 | 2,429 | 6.2% |
| $10,000 to $14,999 | 2,703 | 6.9% |
| $15,000 to $24,999 | 3,722 | 9.5% |
| $25,000 to $34,999 | 3,879 | 9.9% |
| $35,000 to $49,999 | 4,898 | 12.5% |
| $50,000 to $74,999 | 6,974 | 17.8% |
| $75,000 to $99,999 | 5,015 | 12.8% |
| $100,000 to $149,999 | 5,877 | 15.0% |
| $150,000 to $199,999 | 1,802 | 4.6% |
| $200,000+ | 1,841 | 4.7% |
Household Income by Householder Age in Madison County
The median household income in Madison County is $55,280, with the highest median household income of $63,660 found in the 45 to 64 years age bracket for the primary householder. A total of 14,546 households (37.1%) fall into this category. Meanwhile, the 15 to 24 years age bracket for the primary householder has the lowest median household income of $38,352, with 1,419 households (3.6%) in this group.
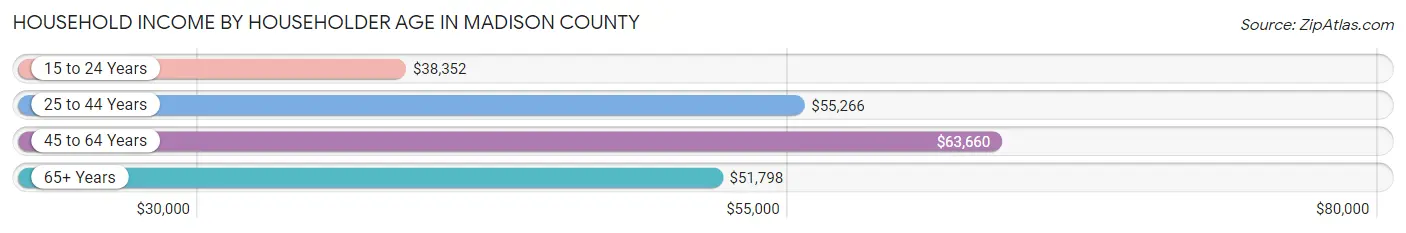
| Income Bracket | # Households | Median Income |
| 15 to 24 Years | 1,419 (3.6%) | $38,352 |
| 25 to 44 Years | 12,179 (31.1%) | $55,266 |
| 45 to 64 Years | 14,546 (37.1%) | $63,660 |
| 65+ Years | 11,036 (28.2%) | $51,798 |
| Total | 39,180 (100.0%) | $55,280 |
Poverty in Madison County
Income Below Poverty by Sex and Age in Madison County
With 17.5% poverty level for males and 18.8% for females among the residents of Madison County, under 5 year old males and 6 to 11 year old females are the most vulnerable to poverty, with 917 males (31.6%) and 1,188 females (35.5%) in their respective age groups living below the poverty level.

| Age Bracket | Male | Female |
| Under 5 Years | 917 (31.6%) | 793 (27.6%) |
| 5 Years | 123 (16.3%) | 148 (15.9%) |
| 6 to 11 Years | 1,161 (31.4%) | 1,188 (35.5%) |
| 12 to 14 Years | 452 (27.2%) | 409 (27.0%) |
| 15 Years | 37 (9.0%) | 142 (22.8%) |
| 16 and 17 Years | 377 (25.6%) | 337 (26.3%) |
| 18 to 24 Years | 969 (25.4%) | 774 (18.7%) |
| 25 to 34 Years | 867 (14.4%) | 1,410 (22.1%) |
| 35 to 44 Years | 1,007 (18.7%) | 1,140 (19.4%) |
| 45 to 54 Years | 723 (12.9%) | 964 (16.0%) |
| 55 to 64 Years | 795 (12.6%) | 856 (12.1%) |
| 65 to 74 Years | 387 (8.4%) | 672 (12.2%) |
| 75 Years and over | 92 (3.5%) | 448 (11.8%) |
| Total | 7,907 (17.5%) | 9,281 (18.8%) |
Income Above Poverty by Sex and Age in Madison County
According to the poverty statistics in Madison County, males aged 75 years and over and females aged 75 years and over are the age groups that are most secure financially, with 96.5% of males and 88.2% of females in these age groups living above the poverty line.
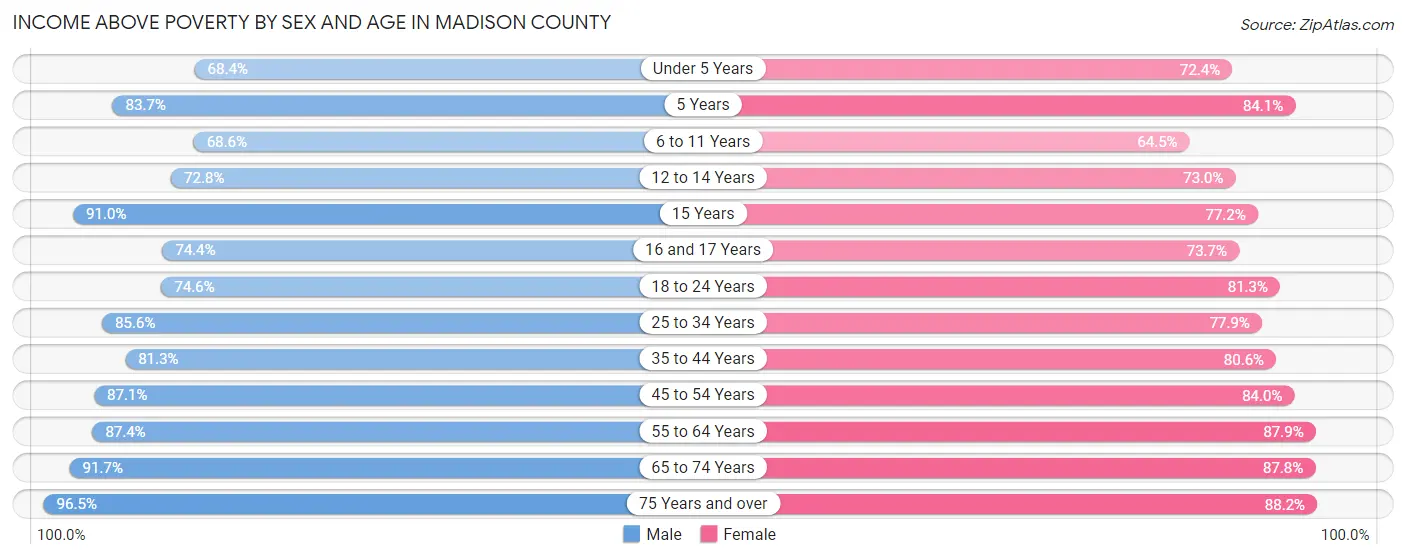
| Age Bracket | Male | Female |
| Under 5 Years | 1,988 (68.4%) | 2,083 (72.4%) |
| 5 Years | 630 (83.7%) | 784 (84.1%) |
| 6 to 11 Years | 2,536 (68.6%) | 2,160 (64.5%) |
| 12 to 14 Years | 1,210 (72.8%) | 1,108 (73.0%) |
| 15 Years | 374 (91.0%) | 480 (77.2%) |
| 16 and 17 Years | 1,098 (74.4%) | 944 (73.7%) |
| 18 to 24 Years | 2,848 (74.6%) | 3,363 (81.3%) |
| 25 to 34 Years | 5,168 (85.6%) | 4,980 (77.9%) |
| 35 to 44 Years | 4,383 (81.3%) | 4,726 (80.6%) |
| 45 to 54 Years | 4,884 (87.1%) | 5,048 (84.0%) |
| 55 to 64 Years | 5,516 (87.4%) | 6,232 (87.9%) |
| 65 to 74 Years | 4,245 (91.6%) | 4,851 (87.8%) |
| 75 Years and over | 2,510 (96.5%) | 3,343 (88.2%) |
| Total | 37,390 (82.5%) | 40,102 (81.2%) |
Income Below Poverty Among Married-Couple Families in Madison County
The poverty statistics for married-couple families in Madison County show that 3.6% or 591 of the total 16,234 families live below the poverty line. Families with 3 or 4 children have the highest poverty rate of 20.3%, comprising of 225 families. On the other hand, families with no children have the lowest poverty rate of 2.1%, which includes 221 families.
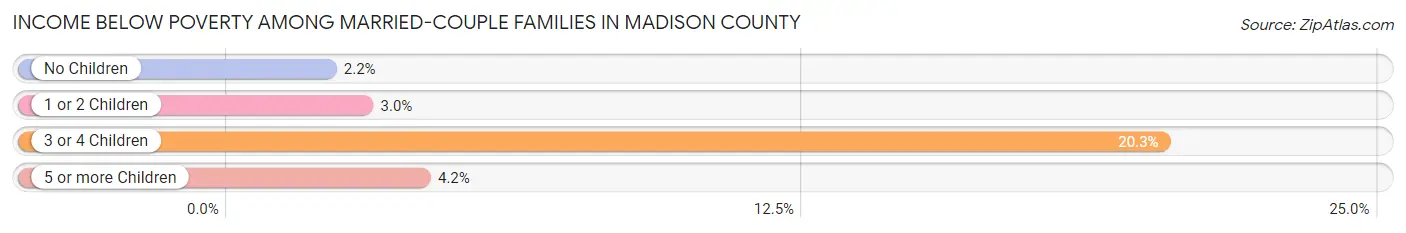
| Children | Above Poverty | Below Poverty |
| No Children | 10,037 (97.9%) | 221 (2.1%) |
| 1 or 2 Children | 4,608 (97.1%) | 140 (2.9%) |
| 3 or 4 Children | 884 (79.7%) | 225 (20.3%) |
| 5 or more Children | 114 (95.8%) | 5 (4.2%) |
| Total | 15,643 (96.4%) | 591 (3.6%) |
Income Below Poverty Among Single-Parent Households in Madison County
According to the poverty data in Madison County, 20.7% or 391 single-father households and 37.5% or 2,608 single-mother households are living below the poverty line. Among single-father households, those with 5 or more children have the highest poverty rate, with 7 households (100.0%) experiencing poverty. Likewise, among single-mother households, those with 5 or more children have the highest poverty rate, with 22 households (100.0%) falling below the poverty line.
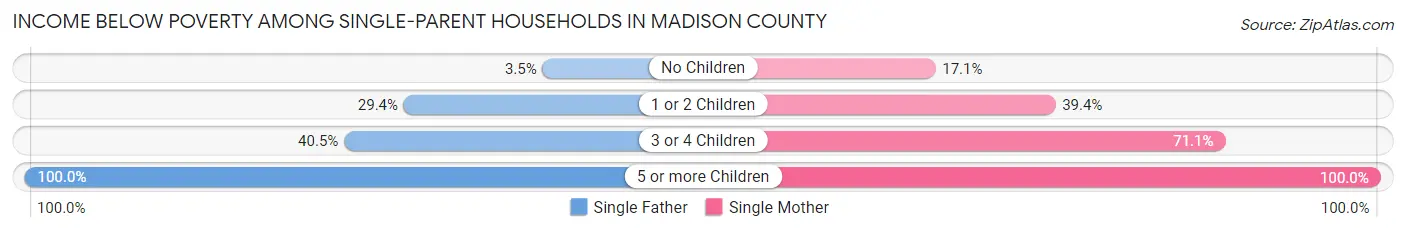
| Children | Single Father | Single Mother |
| No Children | 25 (3.5%) | 390 (17.1%) |
| 1 or 2 Children | 308 (29.4%) | 1,373 (39.4%) |
| 3 or 4 Children | 51 (40.5%) | 823 (71.1%) |
| 5 or more Children | 7 (100.0%) | 22 (100.0%) |
| Total | 391 (20.7%) | 2,608 (37.5%) |
Income Below Poverty Among Married-Couple vs Single-Parent Households in Madison County
The poverty data for Madison County shows that 591 of the married-couple family households (3.6%) and 2,999 of the single-parent households (33.9%) are living below the poverty level. Within the married-couple family households, those with 3 or 4 children have the highest poverty rate, with 225 households (20.3%) falling below the poverty line. Among the single-parent households, those with 5 or more children have the highest poverty rate, with 29 household (100.0%) living below poverty.
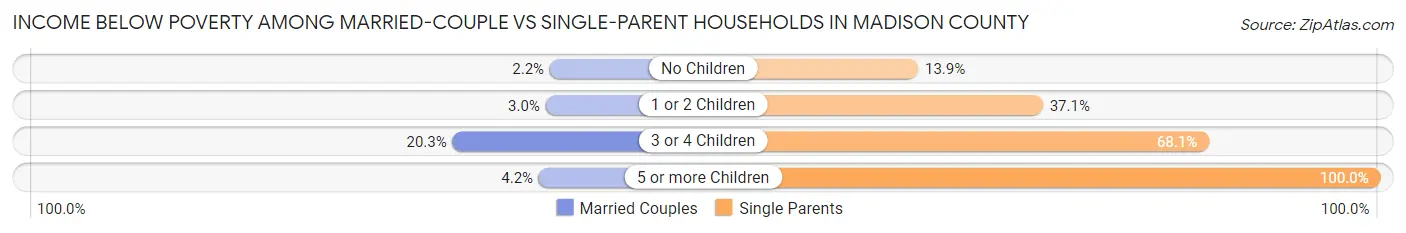
| Children | Married-Couple Families | Single-Parent Households |
| No Children | 221 (2.1%) | 415 (13.9%) |
| 1 or 2 Children | 140 (2.9%) | 1,681 (37.1%) |
| 3 or 4 Children | 225 (20.3%) | 874 (68.1%) |
| 5 or more Children | 5 (4.2%) | 29 (100.0%) |
| Total | 591 (3.6%) | 2,999 (33.9%) |
Employment Characteristics in Madison County
Employment by Class of Employer in Madison County
Among the 44,068 employed individuals in Madison County, private company employees (29,435 | 66.8%), not-for-profit organizations (4,771 | 10.8%), and local government employees (3,308 | 7.5%) make up the most common classes of employment.
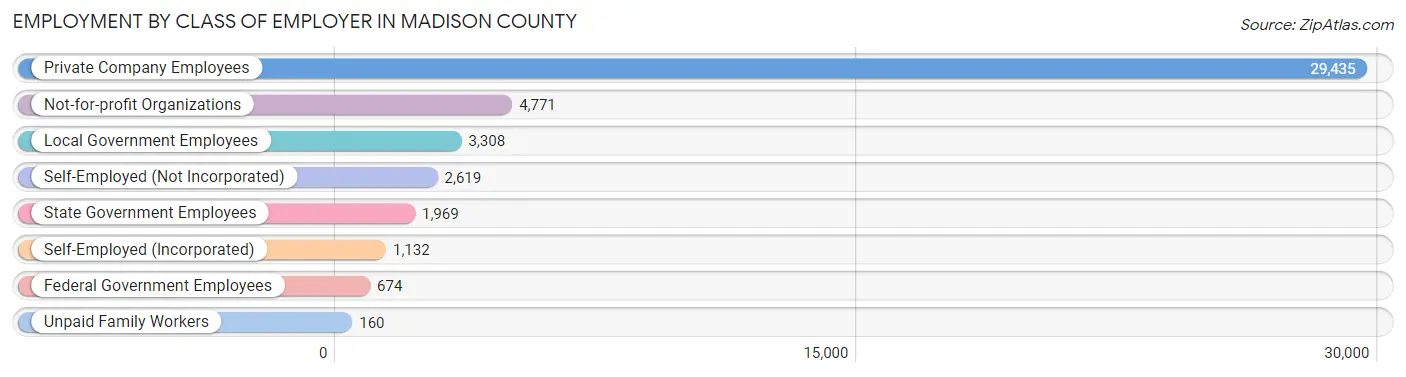
| Employer Class | # Employees | % Employees |
| Private Company Employees | 29,435 | 66.8% |
| Self-Employed (Incorporated) | 1,132 | 2.6% |
| Self-Employed (Not Incorporated) | 2,619 | 5.9% |
| Not-for-profit Organizations | 4,771 | 10.8% |
| Local Government Employees | 3,308 | 7.5% |
| State Government Employees | 1,969 | 4.5% |
| Federal Government Employees | 674 | 1.5% |
| Unpaid Family Workers | 160 | 0.4% |
| Total | 44,068 | 100.0% |
Employment Status by Age in Madison County
According to the labor force statistics for Madison County, out of the total population over 16 years of age (79,529), 61.1% or 48,592 individuals are in the labor force, with 7.4% or 3,596 of them unemployed. The age group with the highest labor force participation rate is 25 to 29 years, with 83.0% or 5,352 individuals in the labor force. Within the labor force, the 16 to 19 years age range has the highest percentage of unemployed individuals, with 16.7% or 510 of them being unemployed.
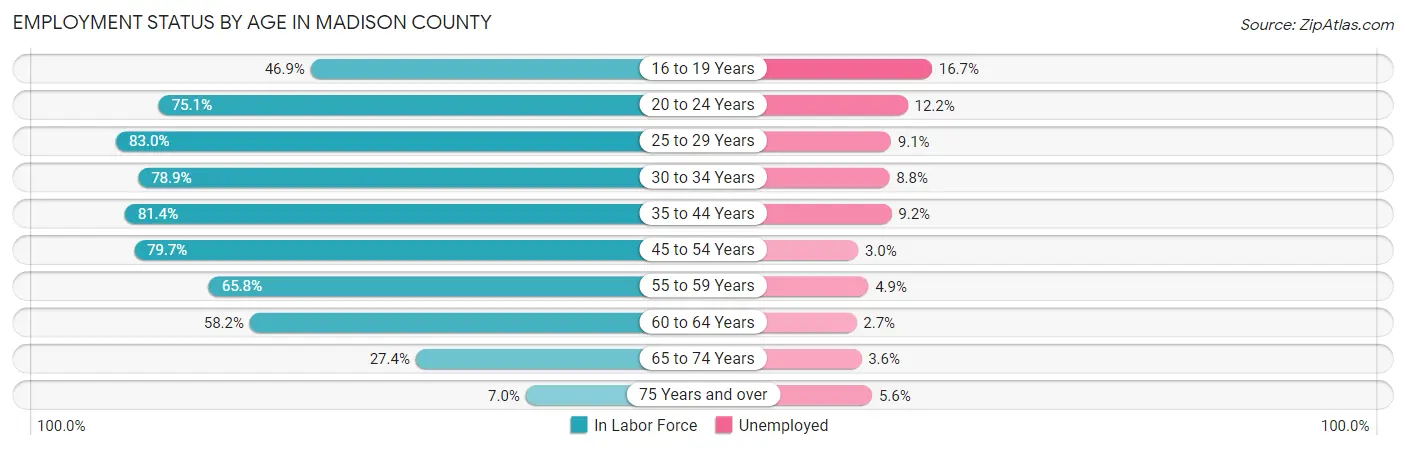
| Age Bracket | In Labor Force | Unemployed |
| 16 to 19 Years | 3,052 (46.9%) | 510 (16.7%) |
| 20 to 24 Years | 4,916 (75.1%) | 600 (12.2%) |
| 25 to 29 Years | 5,352 (83.0%) | 487 (9.1%) |
| 30 to 34 Years | 4,902 (78.9%) | 431 (8.8%) |
| 35 to 44 Years | 9,381 (81.4%) | 863 (9.2%) |
| 45 to 54 Years | 9,364 (79.7%) | 281 (3.0%) |
| 55 to 59 Years | 4,314 (65.8%) | 211 (4.9%) |
| 60 to 64 Years | 4,012 (58.2%) | 108 (2.7%) |
| 65 to 74 Years | 2,820 (27.4%) | 102 (3.6%) |
| 75 Years and over | 476 (7.0%) | 27 (5.6%) |
| Total | 48,592 (61.1%) | 3,596 (7.4%) |
Employment Status by Educational Attainment in Madison County
According to labor force statistics for Madison County, 75.6% of individuals (37,334) out of the total population between 25 and 64 years of age (49,384) are in the labor force, with 6.4% or 2,389 of them being unemployed. The group with the highest labor force participation rate are those with the educational attainment of bachelor's degree or higher, with 87.4% or 11,333 individuals in the labor force. Within the labor force, individuals with high school diploma education have the highest percentage of unemployment, with 8.8% or 1,023 of them being unemployed.
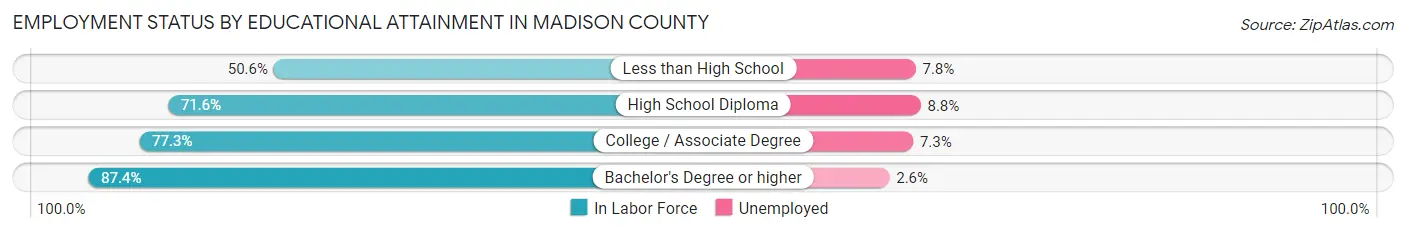
| Educational Attainment | In Labor Force | Unemployed |
| Less than High School | 2,322 (50.6%) | 358 (7.8%) |
| High School Diploma | 11,629 (71.6%) | 1,429 (8.8%) |
| College / Associate Degree | 12,050 (77.3%) | 1,138 (7.3%) |
| Bachelor's Degree or higher | 11,333 (87.4%) | 337 (2.6%) |
| Total | 37,334 (75.6%) | 3,161 (6.4%) |
Employment Occupations by Sex in Madison County
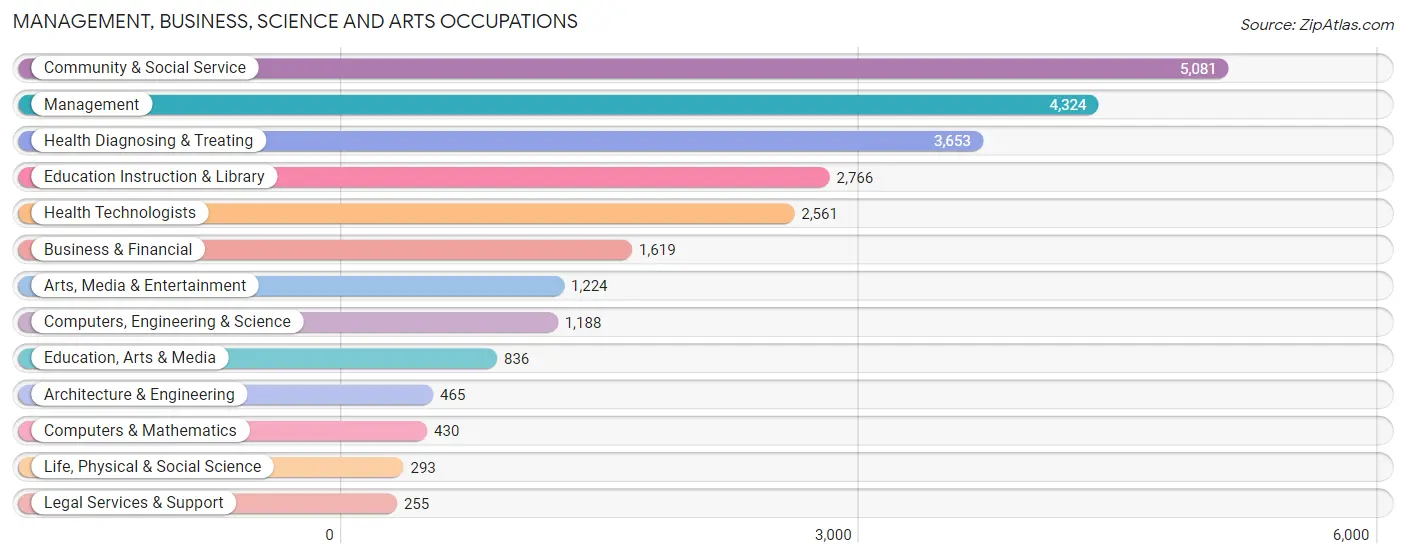
Management, Business, Science and Arts Occupations
The most common Management, Business, Science and Arts occupations in Madison County are Community & Social Service (5,081 | 11.3%), Management (4,324 | 9.6%), Health Diagnosing & Treating (3,653 | 8.1%), Education Instruction & Library (2,766 | 6.2%), and Health Technologists (2,561 | 5.7%).
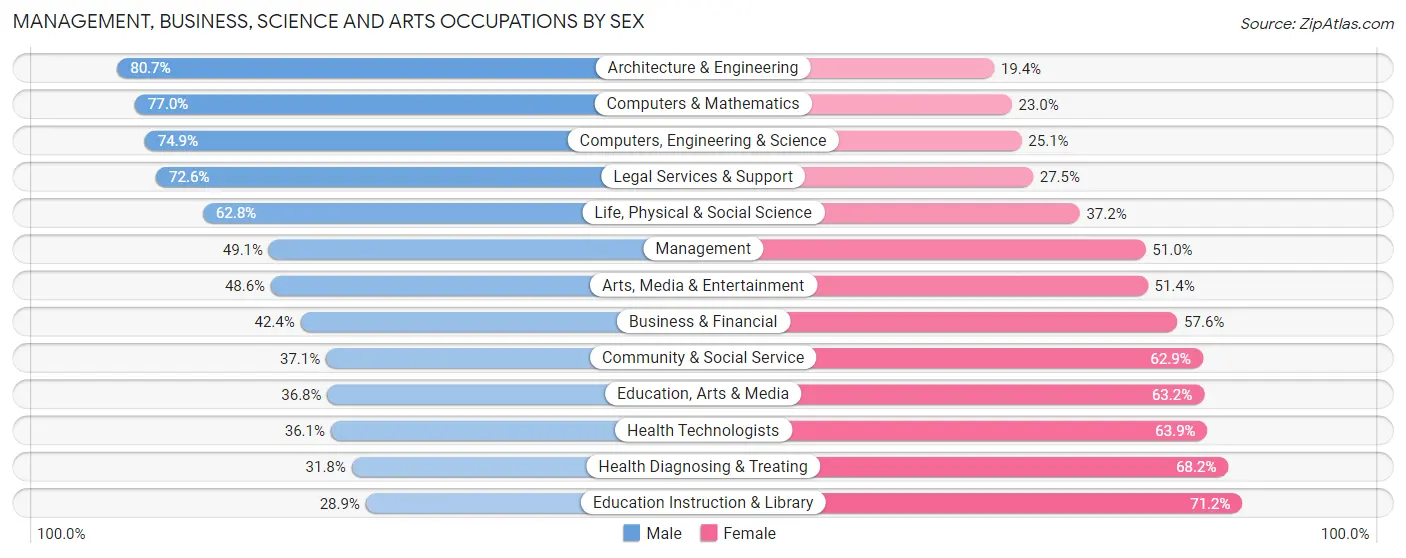
Management, Business, Science and Arts Occupations by Sex
Within the Management, Business, Science and Arts occupations in Madison County, the most male-oriented occupations are Architecture & Engineering (80.6%), Computers & Mathematics (77.0%), and Computers, Engineering & Science (74.9%), while the most female-oriented occupations are Education Instruction & Library (71.2%), Health Diagnosing & Treating (68.2%), and Health Technologists (63.9%).
| Occupation | Male | Female |
| Management | 2,121 (49.0%) | 2,203 (50.9%) |
| Business & Financial | 687 (42.4%) | 932 (57.6%) |
| Computers, Engineering & Science | 890 (74.9%) | 298 (25.1%) |
| Computers & Mathematics | 331 (77.0%) | 99 (23.0%) |
| Architecture & Engineering | 375 (80.6%) | 90 (19.4%) |
| Life, Physical & Social Science | 184 (62.8%) | 109 (37.2%) |
| Community & Social Service | 1,886 (37.1%) | 3,195 (62.9%) |
| Education, Arts & Media | 308 (36.8%) | 528 (63.2%) |
| Legal Services & Support | 185 (72.6%) | 70 (27.5%) |
| Education Instruction & Library | 798 (28.8%) | 1,968 (71.2%) |
| Arts, Media & Entertainment | 595 (48.6%) | 629 (51.4%) |
| Health Diagnosing & Treating | 1,161 (31.8%) | 2,492 (68.2%) |
| Health Technologists | 925 (36.1%) | 1,636 (63.9%) |
| Total (Category) | 6,745 (42.5%) | 9,120 (57.5%) |
| Total (Overall) | 22,129 (49.3%) | 22,768 (50.7%) |
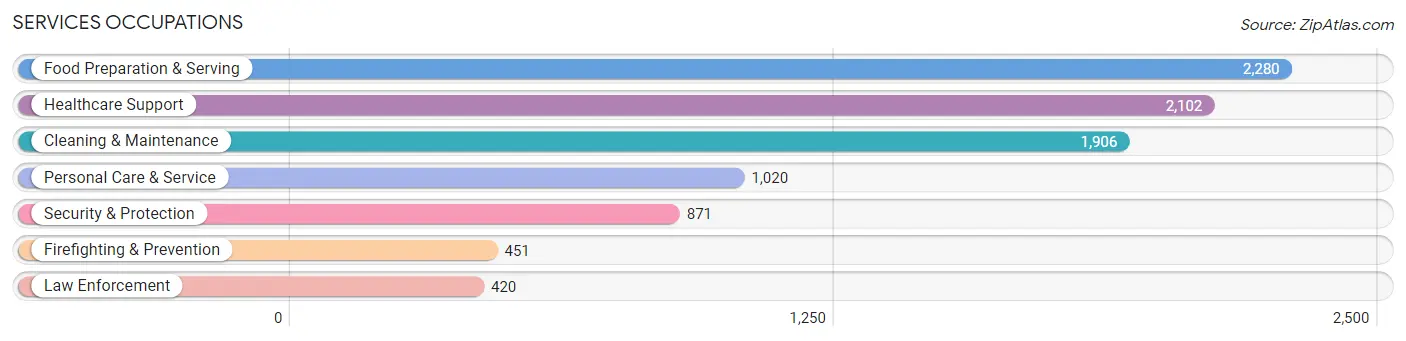
Services Occupations
The most common Services occupations in Madison County are Food Preparation & Serving (2,280 | 5.1%), Healthcare Support (2,102 | 4.7%), Cleaning & Maintenance (1,906 | 4.3%), Personal Care & Service (1,020 | 2.3%), and Security & Protection (871 | 1.9%).
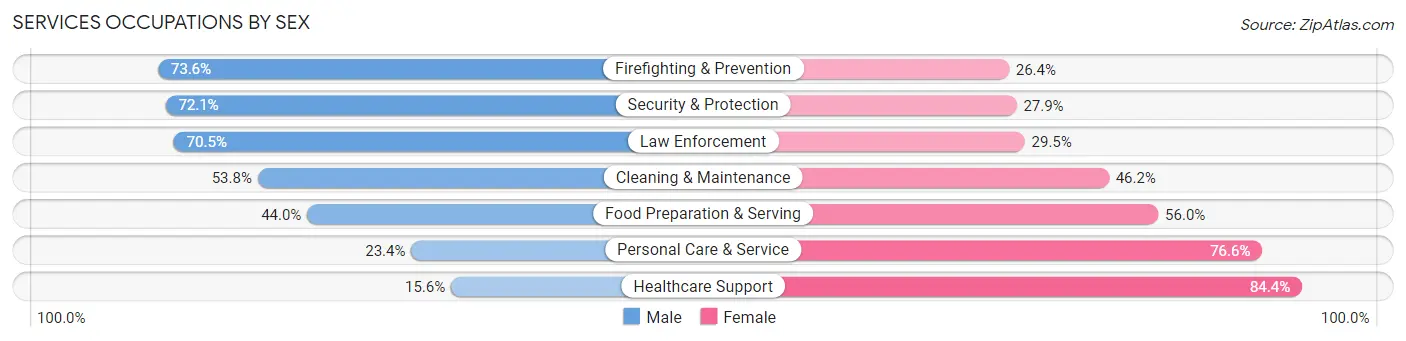
Services Occupations by Sex
Within the Services occupations in Madison County, the most male-oriented occupations are Firefighting & Prevention (73.6%), Security & Protection (72.1%), and Law Enforcement (70.5%), while the most female-oriented occupations are Healthcare Support (84.4%), Personal Care & Service (76.6%), and Food Preparation & Serving (56.0%).
| Occupation | Male | Female |
| Healthcare Support | 327 (15.6%) | 1,775 (84.4%) |
| Security & Protection | 628 (72.1%) | 243 (27.9%) |
| Firefighting & Prevention | 332 (73.6%) | 119 (26.4%) |
| Law Enforcement | 296 (70.5%) | 124 (29.5%) |
| Food Preparation & Serving | 1,004 (44.0%) | 1,276 (56.0%) |
| Cleaning & Maintenance | 1,026 (53.8%) | 880 (46.2%) |
| Personal Care & Service | 239 (23.4%) | 781 (76.6%) |
| Total (Category) | 3,224 (39.4%) | 4,955 (60.6%) |
| Total (Overall) | 22,129 (49.3%) | 22,768 (50.7%) |
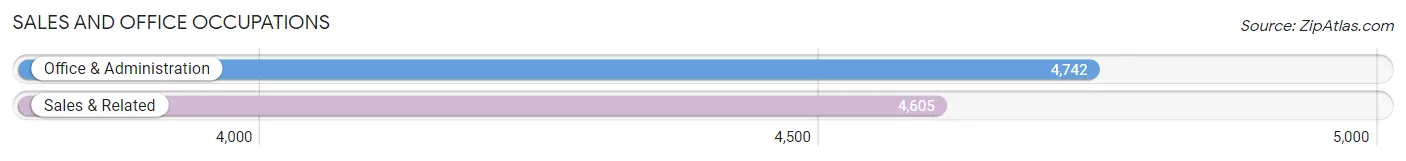
Sales and Office Occupations
The most common Sales and Office occupations in Madison County are Office & Administration (4,742 | 10.6%), and Sales & Related (4,605 | 10.3%).
Sales and Office Occupations by Sex
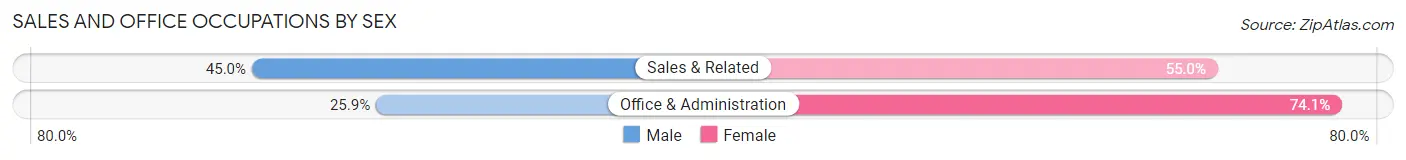
| Occupation | Male | Female |
| Sales & Related | 2,074 (45.0%) | 2,531 (55.0%) |
| Office & Administration | 1,230 (25.9%) | 3,512 (74.1%) |
| Total (Category) | 3,304 (35.3%) | 6,043 (64.6%) |
| Total (Overall) | 22,129 (49.3%) | 22,768 (50.7%) |
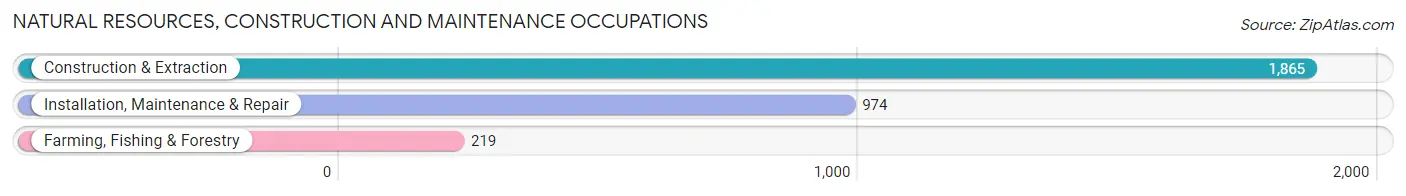
Natural Resources, Construction and Maintenance Occupations
The most common Natural Resources, Construction and Maintenance occupations in Madison County are Construction & Extraction (1,865 | 4.2%), Installation, Maintenance & Repair (974 | 2.2%), and Farming, Fishing & Forestry (219 | 0.5%).
Natural Resources, Construction and Maintenance Occupations by Sex
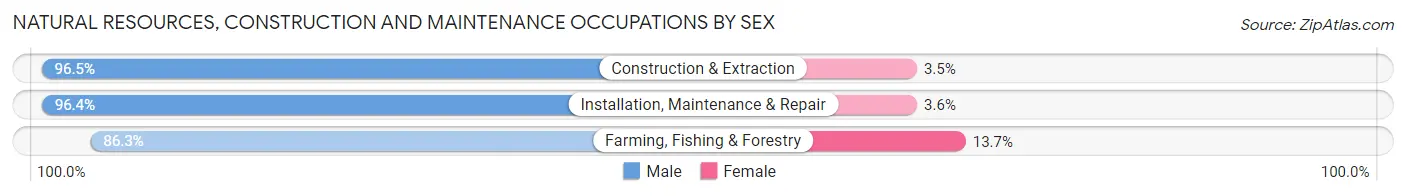
| Occupation | Male | Female |
| Farming, Fishing & Forestry | 189 (86.3%) | 30 (13.7%) |
| Construction & Extraction | 1,799 (96.5%) | 66 (3.5%) |
| Installation, Maintenance & Repair | 939 (96.4%) | 35 (3.6%) |
| Total (Category) | 2,927 (95.7%) | 131 (4.3%) |
| Total (Overall) | 22,129 (49.3%) | 22,768 (50.7%) |
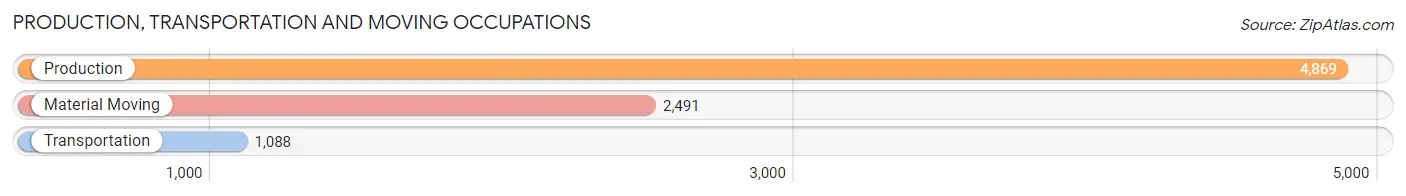
Production, Transportation and Moving Occupations
The most common Production, Transportation and Moving occupations in Madison County are Production (4,869 | 10.8%), Material Moving (2,491 | 5.6%), and Transportation (1,088 | 2.4%).
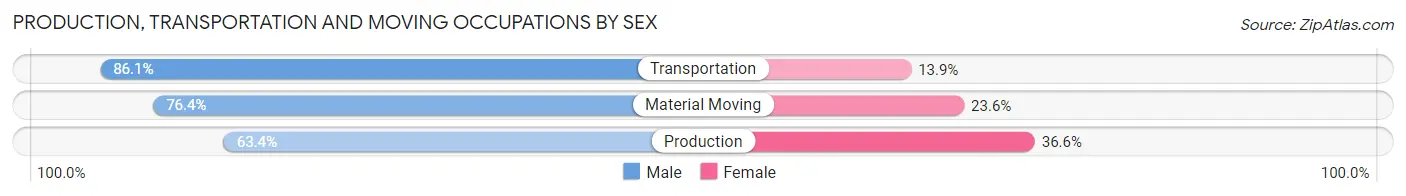
Production, Transportation and Moving Occupations by Sex
| Occupation | Male | Female |
| Production | 3,089 (63.4%) | 1,780 (36.6%) |
| Transportation | 937 (86.1%) | 151 (13.9%) |
| Material Moving | 1,903 (76.4%) | 588 (23.6%) |
| Total (Category) | 5,929 (70.2%) | 2,519 (29.8%) |
| Total (Overall) | 22,129 (49.3%) | 22,768 (50.7%) |
Employment Industries by Sex in Madison County
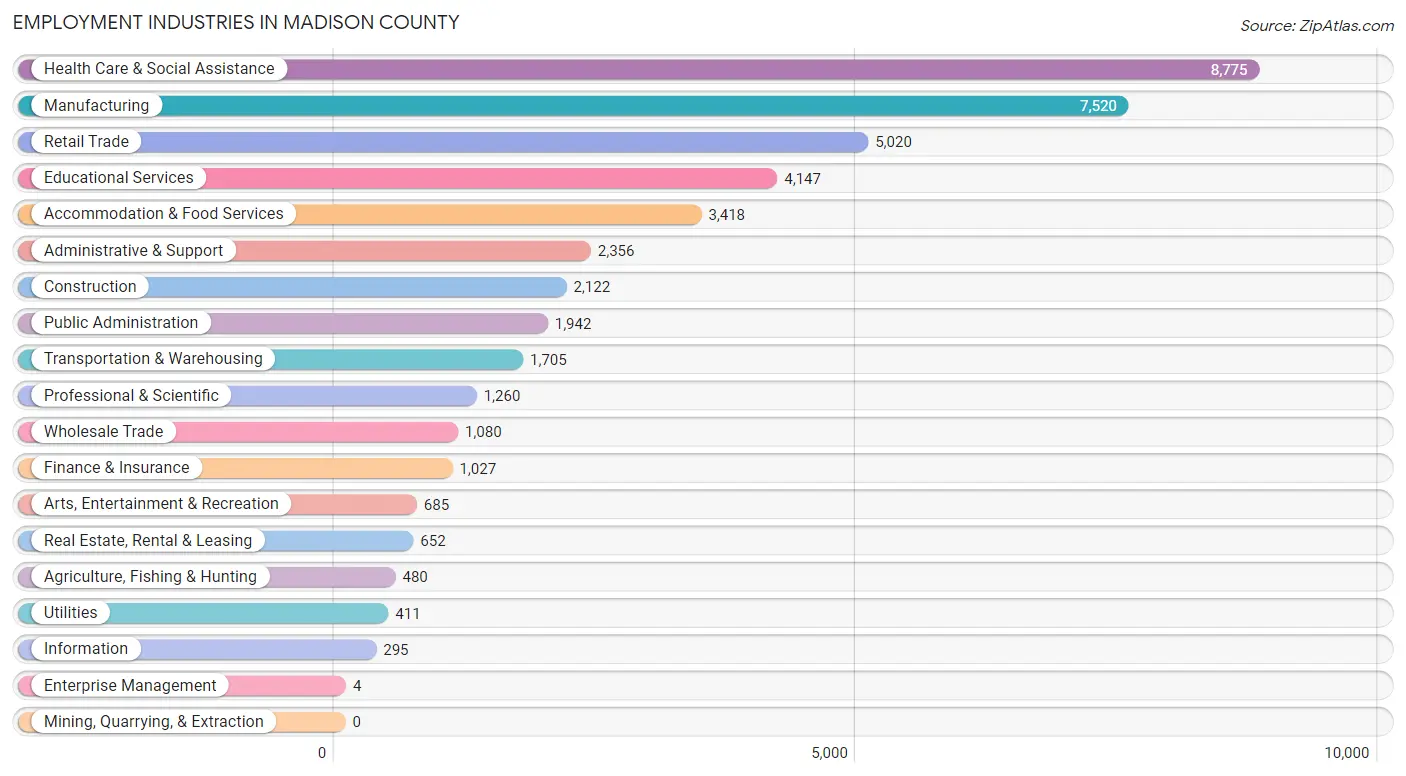
Employment Industries in Madison County
The major employment industries in Madison County include Health Care & Social Assistance (8,775 | 19.5%), Manufacturing (7,520 | 16.8%), Retail Trade (5,020 | 11.2%), Educational Services (4,147 | 9.2%), and Accommodation & Food Services (3,418 | 7.6%).
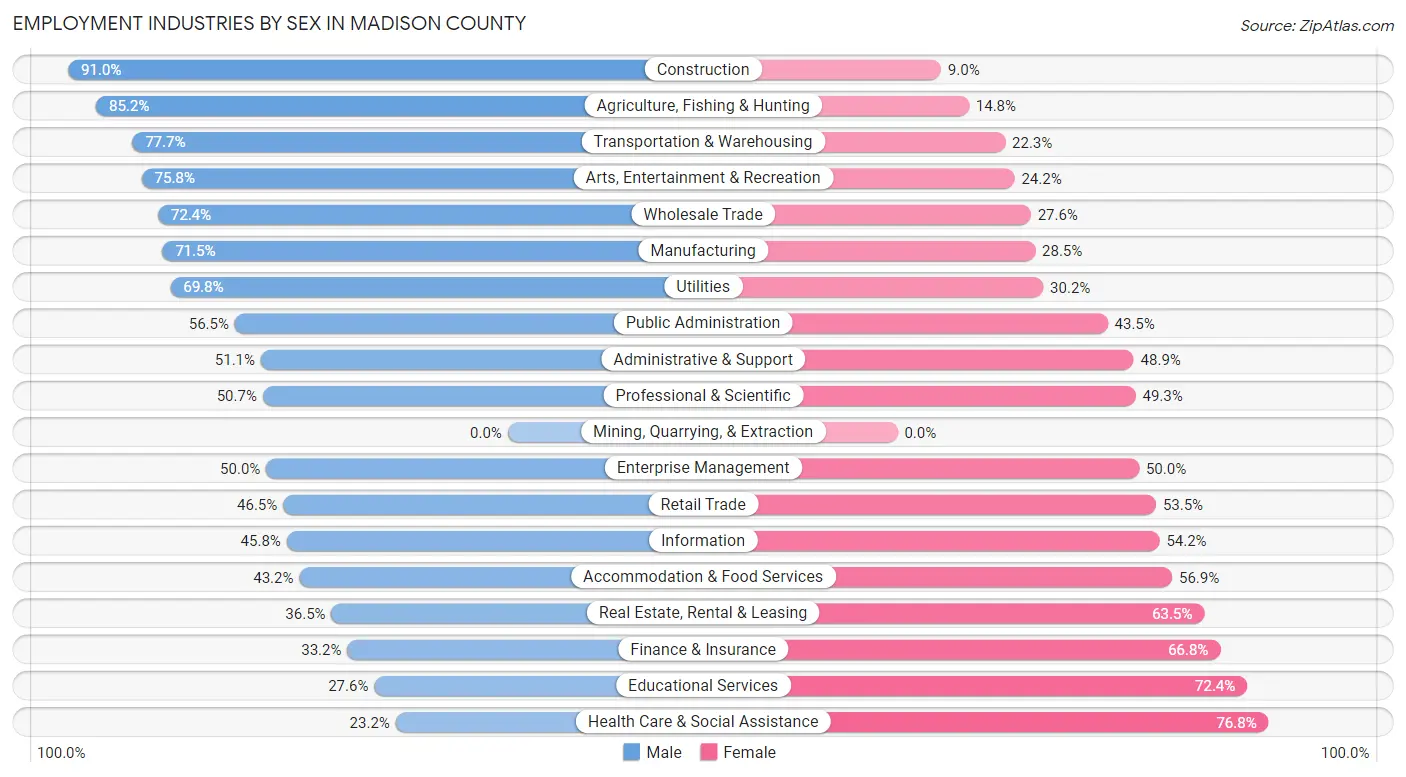
Employment Industries by Sex in Madison County
The Madison County industries that see more men than women are Construction (91.0%), Agriculture, Fishing & Hunting (85.2%), and Transportation & Warehousing (77.7%), whereas the industries that tend to have a higher number of women are Health Care & Social Assistance (76.8%), Educational Services (72.4%), and Finance & Insurance (66.8%).
| Industry | Male | Female |
| Agriculture, Fishing & Hunting | 409 (85.2%) | 71 (14.8%) |
| Mining, Quarrying, & Extraction | 0 (0.0%) | 0 (0.0%) |
| Construction | 1,931 (91.0%) | 191 (9.0%) |
| Manufacturing | 5,377 (71.5%) | 2,143 (28.5%) |
| Wholesale Trade | 782 (72.4%) | 298 (27.6%) |
| Retail Trade | 2,334 (46.5%) | 2,686 (53.5%) |
| Transportation & Warehousing | 1,325 (77.7%) | 380 (22.3%) |
| Utilities | 287 (69.8%) | 124 (30.2%) |
| Information | 135 (45.8%) | 160 (54.2%) |
| Finance & Insurance | 341 (33.2%) | 686 (66.8%) |
| Real Estate, Rental & Leasing | 238 (36.5%) | 414 (63.5%) |
| Professional & Scientific | 639 (50.7%) | 621 (49.3%) |
| Enterprise Management | 2 (50.0%) | 2 (50.0%) |
| Administrative & Support | 1,204 (51.1%) | 1,152 (48.9%) |
| Educational Services | 1,146 (27.6%) | 3,001 (72.4%) |
| Health Care & Social Assistance | 2,036 (23.2%) | 6,739 (76.8%) |
| Arts, Entertainment & Recreation | 519 (75.8%) | 166 (24.2%) |
| Accommodation & Food Services | 1,475 (43.1%) | 1,943 (56.9%) |
| Public Administration | 1,097 (56.5%) | 845 (43.5%) |
| Total | 22,129 (49.3%) | 22,768 (50.7%) |
Education in Madison County
School Enrollment in Madison County
The most common levels of schooling among the 24,272 students in Madison County are college / undergraduate (6,604 | 27.2%), high school (4,779 | 19.7%), and middle school (4,448 | 18.3%).

| School Level | # Students | % Students |
| Nursery / Preschool | 1,927 | 7.9% |
| Kindergarten | 1,110 | 4.6% |
| Elementary School | 4,355 | 17.9% |
| Middle School | 4,448 | 18.3% |
| High School | 4,779 | 19.7% |
| College / Undergraduate | 6,604 | 27.2% |
| Graduate / Professional | 1,049 | 4.3% |
| Total | 24,272 | 100.0% |
School Enrollment by Age by Funding Source in Madison County
Out of a total of 24,272 students who are enrolled in schools in Madison County, 7,015 (28.9%) attend a private institution, while the remaining 17,257 (71.1%) are enrolled in public schools. The age group of 20 to 24 year olds has the highest likelihood of being enrolled in private schools, with 1,497 (52.6% in the age bracket) enrolled. Conversely, the age group of 25 to 34 year olds has the lowest likelihood of being enrolled in a private school, with 1,319 (88.0% in the age bracket) attending a public institution.

| Age Bracket | Public School | Private School |
| 3 to 4 Year Olds | 715 (66.9%) | 354 (33.1%) |
| 5 to 9 Year Old | 4,264 (76.8%) | 1,286 (23.2%) |
| 10 to 14 Year Olds | 4,675 (83.3%) | 940 (16.7%) |
| 15 to 17 Year Olds | 2,620 (70.2%) | 1,115 (29.8%) |
| 18 to 19 Year Olds | 1,425 (51.5%) | 1,342 (48.5%) |
| 20 to 24 Year Olds | 1,348 (47.4%) | 1,497 (52.6%) |
| 25 to 34 Year Olds | 1,319 (88.0%) | 179 (11.9%) |
| 35 Years and over | 887 (74.4%) | 306 (25.7%) |
| Total | 17,257 (71.1%) | 7,015 (28.9%) |
Educational Attainment by Field of Study in Madison County
Business (3,955 | 21.5%), education (2,747 | 15.0%), science & technology (2,203 | 12.0%), bio, nature & agricultural (1,401 | 7.6%), and arts & humanities (1,369 | 7.5%) are the most common fields of study among 18,362 individuals in Madison County who have obtained a bachelor's degree or higher.
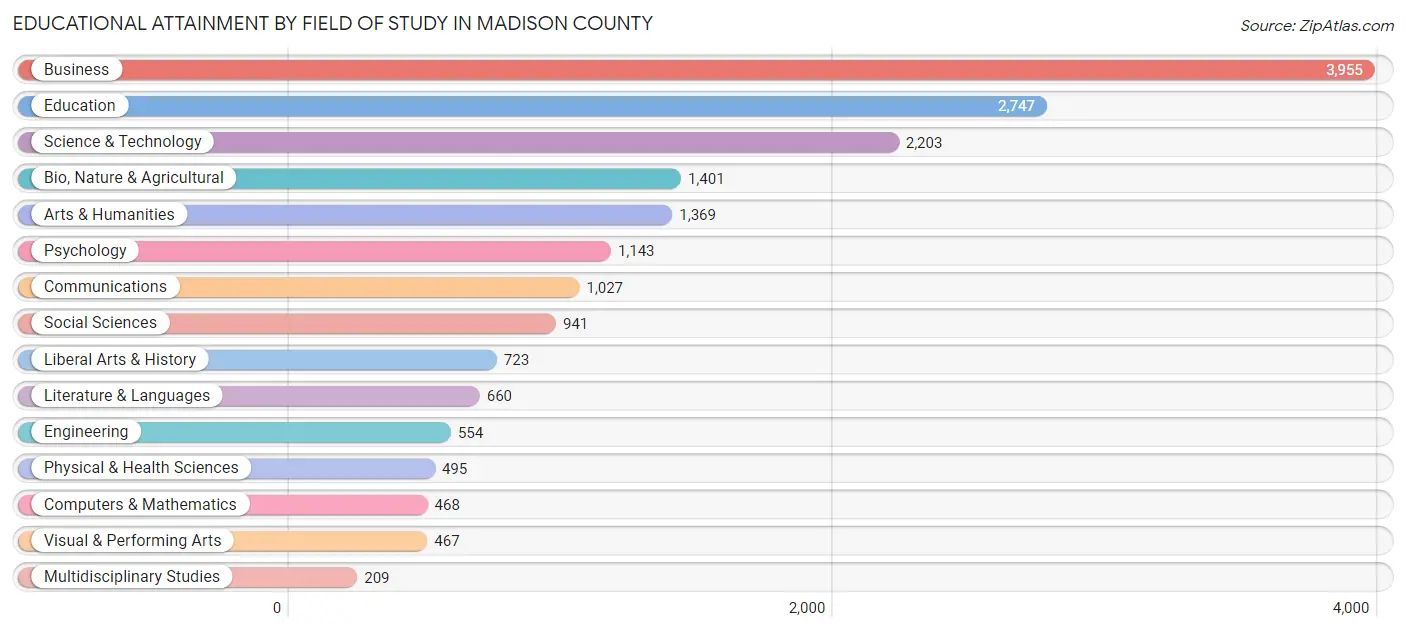
| Field of Study | # Graduates | % Graduates |
| Computers & Mathematics | 468 | 2.5% |
| Bio, Nature & Agricultural | 1,401 | 7.6% |
| Physical & Health Sciences | 495 | 2.7% |
| Psychology | 1,143 | 6.2% |
| Social Sciences | 941 | 5.1% |
| Engineering | 554 | 3.0% |
| Multidisciplinary Studies | 209 | 1.1% |
| Science & Technology | 2,203 | 12.0% |
| Business | 3,955 | 21.5% |
| Education | 2,747 | 15.0% |
| Literature & Languages | 660 | 3.6% |
| Liberal Arts & History | 723 | 3.9% |
| Visual & Performing Arts | 467 | 2.5% |
| Communications | 1,027 | 5.6% |
| Arts & Humanities | 1,369 | 7.5% |
| Total | 18,362 | 100.0% |
Transportation & Commute in Madison County
Vehicle Availability by Sex in Madison County
The most prevalent vehicle ownership categories in Madison County are males with 2 vehicles (8,298, accounting for 38.9%) and females with 2 vehicles (7,753, making up 37.9%).
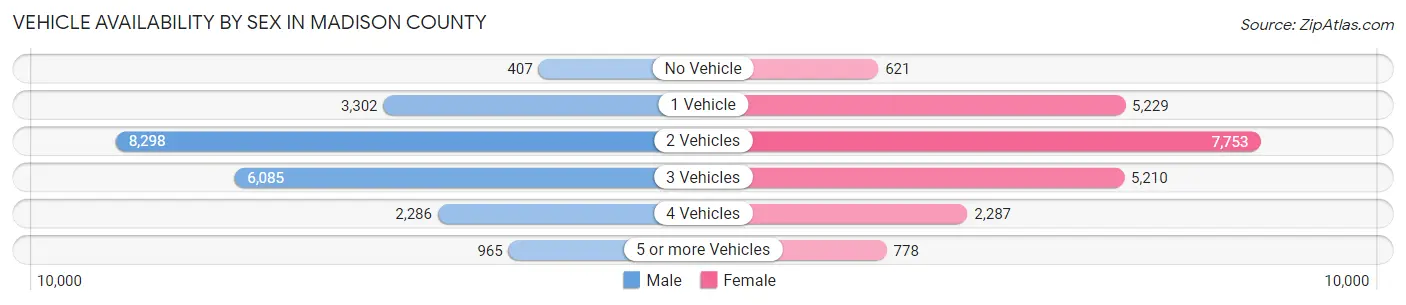
| Vehicles Available | Male | Female |
| No Vehicle | 407 (1.9%) | 621 (2.8%) |
| 1 Vehicle | 3,302 (15.5%) | 5,229 (23.9%) |
| 2 Vehicles | 8,298 (38.9%) | 7,753 (35.4%) |
| 3 Vehicles | 6,085 (28.5%) | 5,210 (23.8%) |
| 4 Vehicles | 2,286 (10.7%) | 2,287 (10.4%) |
| 5 or more Vehicles | 965 (4.5%) | 778 (3.6%) |
| Total | 21,343 (100.0%) | 21,878 (100.0%) |
Commute Time in Madison County
The most frequently occuring commute durations in Madison County are 15 to 19 minutes (10,429 commuters, 25.4%), 10 to 14 minutes (8,726 commuters, 21.2%), and 5 to 9 minutes (5,625 commuters, 13.7%).
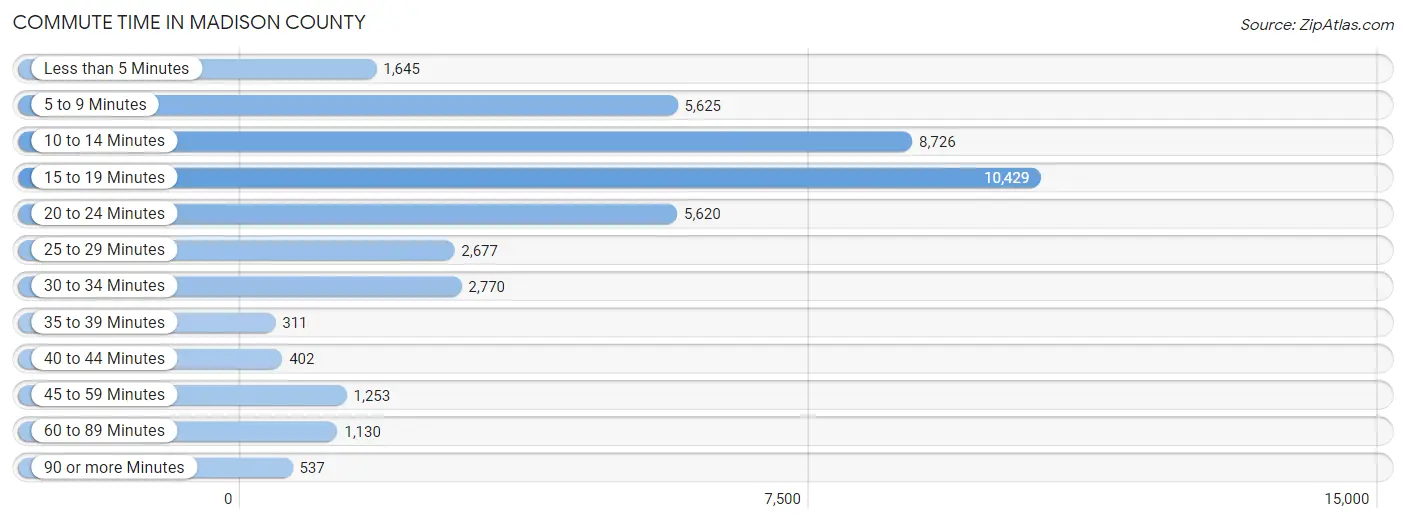
| Commute Time | # Commuters | % Commuters |
| Less than 5 Minutes | 1,645 | 4.0% |
| 5 to 9 Minutes | 5,625 | 13.7% |
| 10 to 14 Minutes | 8,726 | 21.2% |
| 15 to 19 Minutes | 10,429 | 25.4% |
| 20 to 24 Minutes | 5,620 | 13.7% |
| 25 to 29 Minutes | 2,677 | 6.5% |
| 30 to 34 Minutes | 2,770 | 6.7% |
| 35 to 39 Minutes | 311 | 0.8% |
| 40 to 44 Minutes | 402 | 1.0% |
| 45 to 59 Minutes | 1,253 | 3.0% |
| 60 to 89 Minutes | 1,130 | 2.8% |
| 90 or more Minutes | 537 | 1.3% |
Commute Time by Sex in Madison County
The most common commute times in Madison County are 10 to 14 minutes (4,444 commuters, 21.7%) for males and 15 to 19 minutes (6,086 commuters, 29.5%) for females.
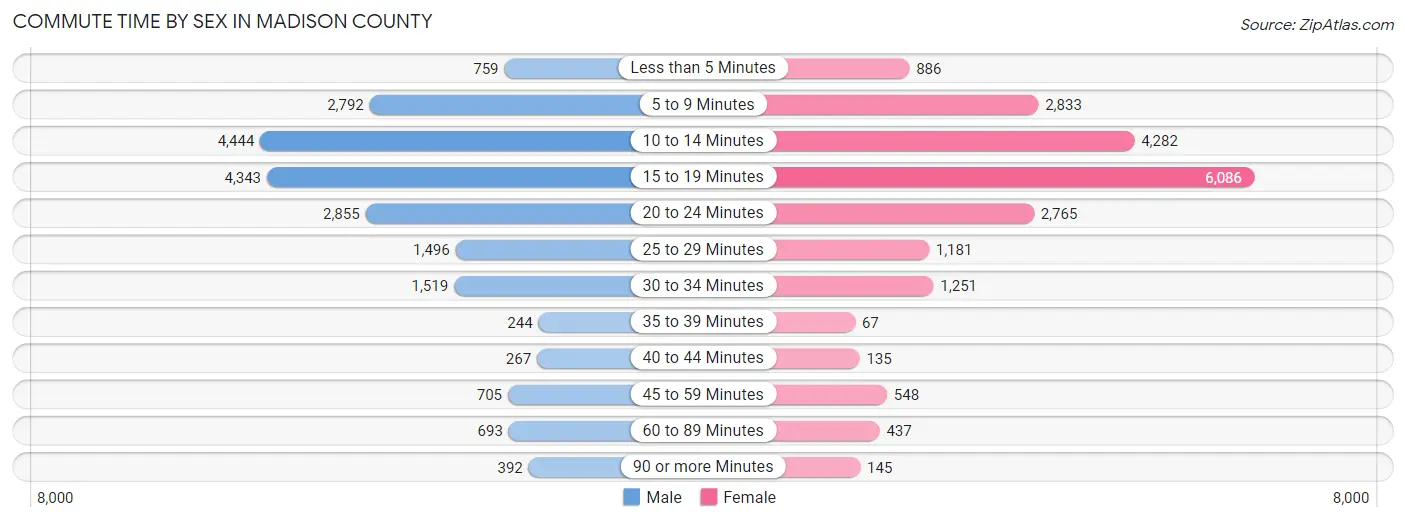
| Commute Time | Male | Female |
| Less than 5 Minutes | 759 (3.7%) | 886 (4.3%) |
| 5 to 9 Minutes | 2,792 (13.6%) | 2,833 (13.7%) |
| 10 to 14 Minutes | 4,444 (21.7%) | 4,282 (20.8%) |
| 15 to 19 Minutes | 4,343 (21.2%) | 6,086 (29.5%) |
| 20 to 24 Minutes | 2,855 (13.9%) | 2,765 (13.4%) |
| 25 to 29 Minutes | 1,496 (7.3%) | 1,181 (5.7%) |
| 30 to 34 Minutes | 1,519 (7.4%) | 1,251 (6.1%) |
| 35 to 39 Minutes | 244 (1.2%) | 67 (0.3%) |
| 40 to 44 Minutes | 267 (1.3%) | 135 (0.6%) |
| 45 to 59 Minutes | 705 (3.4%) | 548 (2.7%) |
| 60 to 89 Minutes | 693 (3.4%) | 437 (2.1%) |
| 90 or more Minutes | 392 (1.9%) | 145 (0.7%) |
Time of Departure to Work by Sex in Madison County
The most frequent times of departure to work in Madison County are 6:00 AM to 6:29 AM (2,651, 12.9%) for males and 7:30 AM to 7:59 AM (3,526, 17.1%) for females.
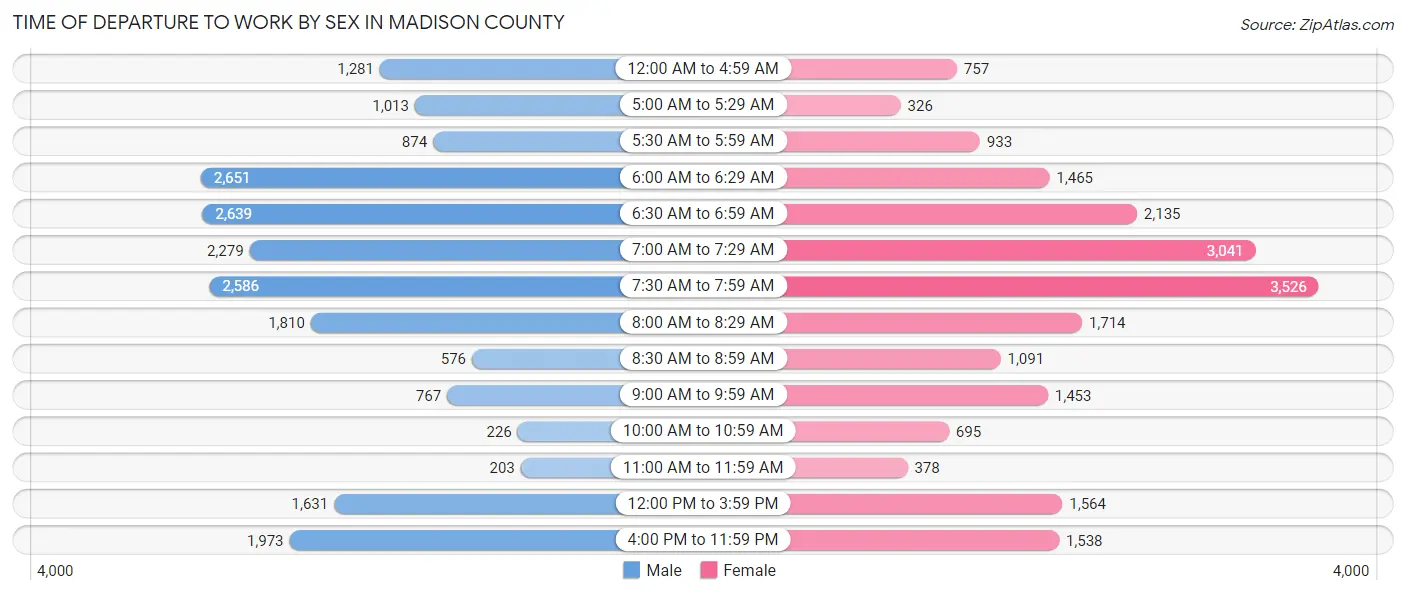
| Time of Departure | Male | Female |
| 12:00 AM to 4:59 AM | 1,281 (6.2%) | 757 (3.7%) |
| 5:00 AM to 5:29 AM | 1,013 (4.9%) | 326 (1.6%) |
| 5:30 AM to 5:59 AM | 874 (4.3%) | 933 (4.5%) |
| 6:00 AM to 6:29 AM | 2,651 (12.9%) | 1,465 (7.1%) |
| 6:30 AM to 6:59 AM | 2,639 (12.9%) | 2,135 (10.4%) |
| 7:00 AM to 7:29 AM | 2,279 (11.1%) | 3,041 (14.7%) |
| 7:30 AM to 7:59 AM | 2,586 (12.6%) | 3,526 (17.1%) |
| 8:00 AM to 8:29 AM | 1,810 (8.8%) | 1,714 (8.3%) |
| 8:30 AM to 8:59 AM | 576 (2.8%) | 1,091 (5.3%) |
| 9:00 AM to 9:59 AM | 767 (3.7%) | 1,453 (7.0%) |
| 10:00 AM to 10:59 AM | 226 (1.1%) | 695 (3.4%) |
| 11:00 AM to 11:59 AM | 203 (1.0%) | 378 (1.8%) |
| 12:00 PM to 3:59 PM | 1,631 (8.0%) | 1,564 (7.6%) |
| 4:00 PM to 11:59 PM | 1,973 (9.6%) | 1,538 (7.5%) |
| Total | 20,509 (100.0%) | 20,616 (100.0%) |
Housing Occupancy in Madison County
Occupancy by Ownership in Madison County
Of the total 39,180 dwellings in Madison County, owner-occupied units account for 24,344 (62.1%), while renter-occupied units make up 14,836 (37.9%).
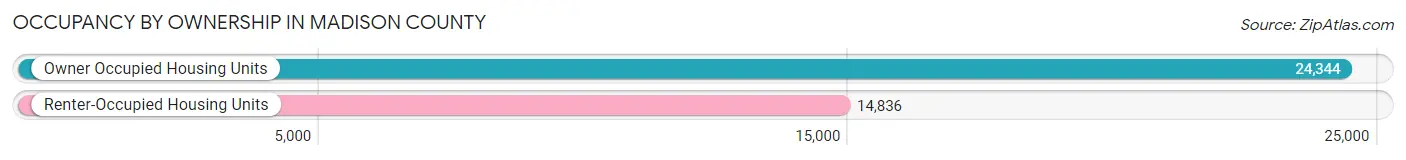
| Occupancy | # Housing Units | % Housing Units |
| Owner Occupied Housing Units | 24,344 | 62.1% |
| Renter-Occupied Housing Units | 14,836 | 37.9% |
| Total Occupied Housing Units | 39,180 | 100.0% |
Occupancy by Household Size in Madison County
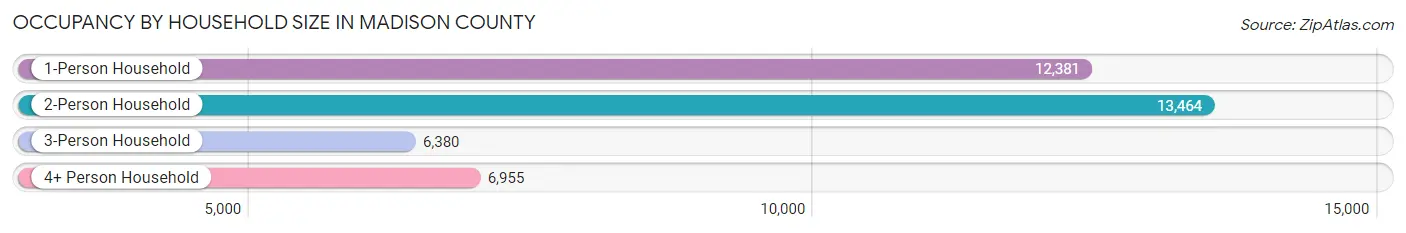
| Household Size | # Housing Units | % Housing Units |
| 1-Person Household | 12,381 | 31.6% |
| 2-Person Household | 13,464 | 34.4% |
| 3-Person Household | 6,380 | 16.3% |
| 4+ Person Household | 6,955 | 17.7% |
| Total Housing Units | 39,180 | 100.0% |
Occupancy by Ownership by Household Size in Madison County
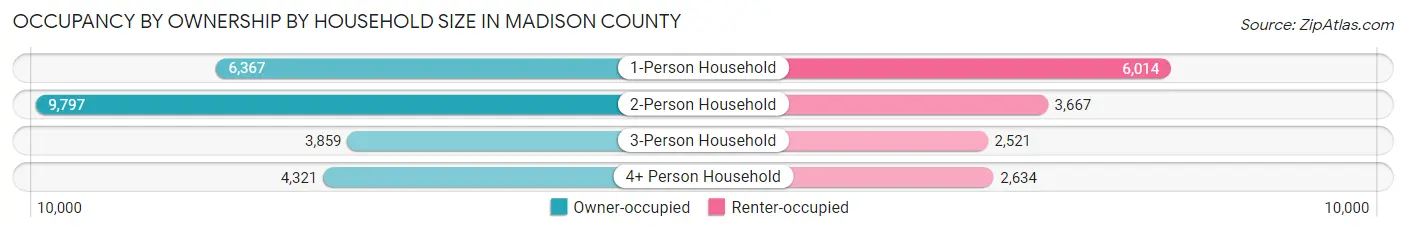
| Household Size | Owner-occupied | Renter-occupied |
| 1-Person Household | 6,367 (51.4%) | 6,014 (48.6%) |
| 2-Person Household | 9,797 (72.8%) | 3,667 (27.2%) |
| 3-Person Household | 3,859 (60.5%) | 2,521 (39.5%) |
| 4+ Person Household | 4,321 (62.1%) | 2,634 (37.9%) |
| Total Housing Units | 24,344 (62.1%) | 14,836 (37.9%) |
Occupancy by Educational Attainment in Madison County
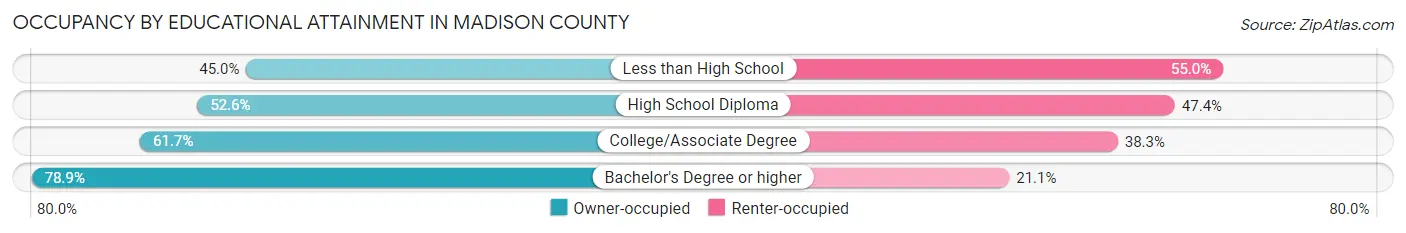
| Household Size | Owner-occupied | Renter-occupied |
| Less than High School | 1,760 (45.0%) | 2,152 (55.0%) |
| High School Diploma | 6,214 (52.6%) | 5,595 (47.4%) |
| College/Associate Degree | 7,650 (61.7%) | 4,755 (38.3%) |
| Bachelor's Degree or higher | 8,720 (78.9%) | 2,334 (21.1%) |
Occupancy by Age of Householder in Madison County
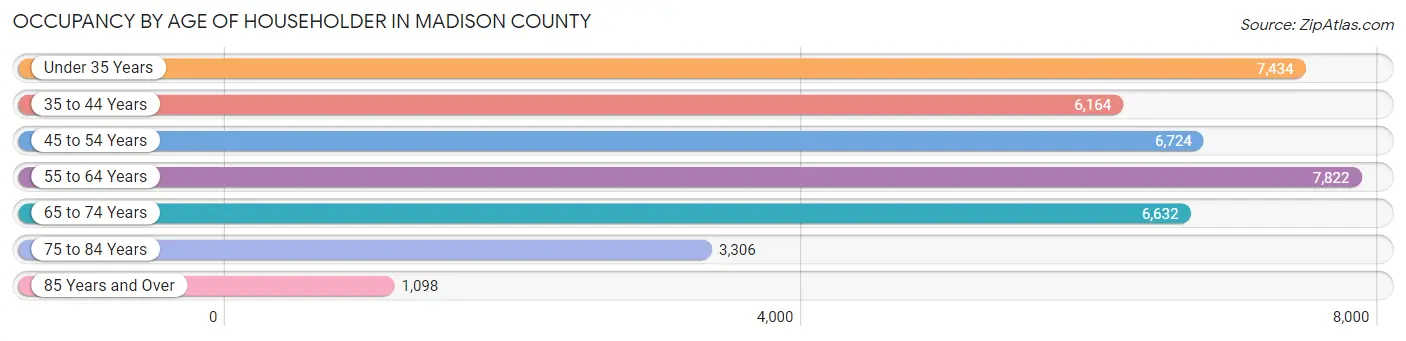
| Age Bracket | # Households | % Households |
| Under 35 Years | 7,434 | 19.0% |
| 35 to 44 Years | 6,164 | 15.7% |
| 45 to 54 Years | 6,724 | 17.2% |
| 55 to 64 Years | 7,822 | 20.0% |
| 65 to 74 Years | 6,632 | 16.9% |
| 75 to 84 Years | 3,306 | 8.4% |
| 85 Years and Over | 1,098 | 2.8% |
| Total | 39,180 | 100.0% |
Housing Finances in Madison County
Median Income by Occupancy in Madison County
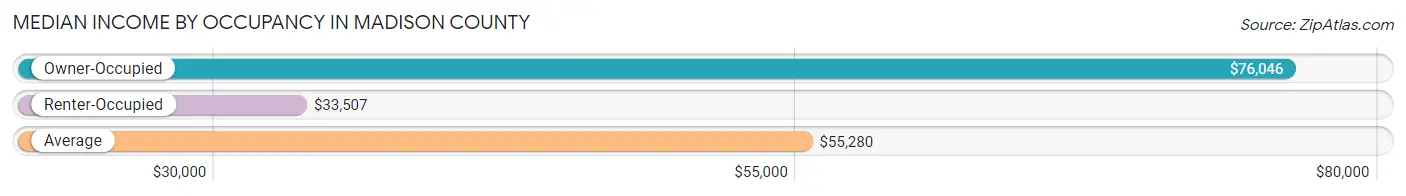
| Occupancy Type | # Households | Median Income |
| Owner-Occupied | 24,344 (62.1%) | $76,046 |
| Renter-Occupied | 14,836 (37.9%) | $33,507 |
| Average | 39,180 (100.0%) | $55,280 |
Occupancy by Householder Income Bracket in Madison County
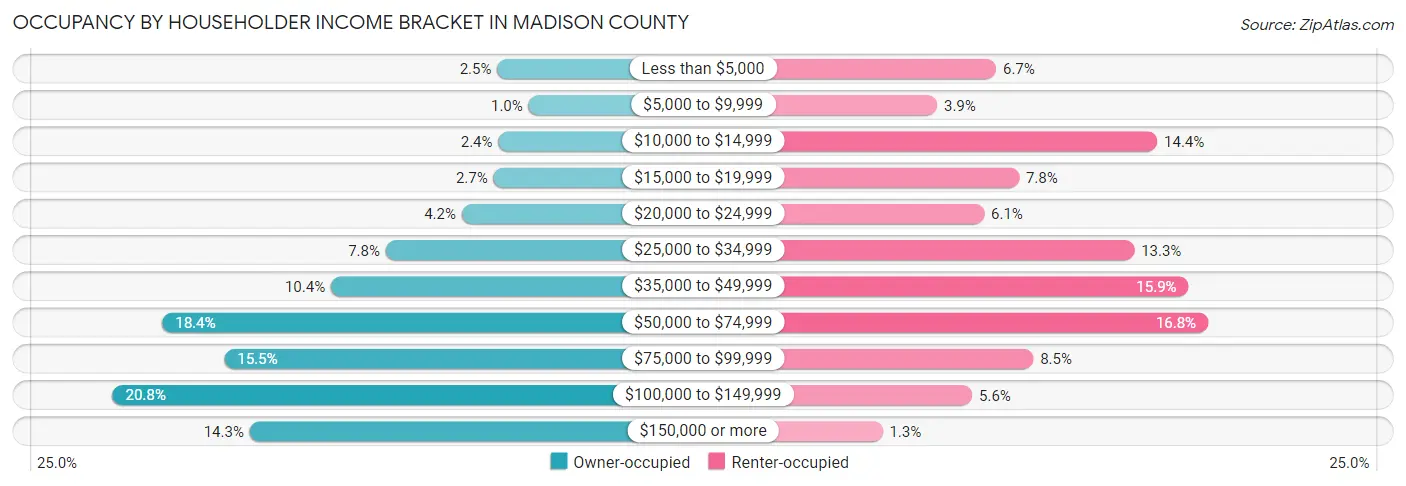
| Income Bracket | Owner-occupied | Renter-occupied |
| Less than $5,000 | 605 (2.5%) | 992 (6.7%) |
| $5,000 to $9,999 | 244 (1.0%) | 576 (3.9%) |
| $10,000 to $14,999 | 593 (2.4%) | 2,130 (14.4%) |
| $15,000 to $19,999 | 649 (2.7%) | 1,154 (7.8%) |
| $20,000 to $24,999 | 1,018 (4.2%) | 908 (6.1%) |
| $25,000 to $34,999 | 1,900 (7.8%) | 1,968 (13.3%) |
| $35,000 to $49,999 | 2,534 (10.4%) | 2,351 (15.9%) |
| $50,000 to $74,999 | 4,488 (18.4%) | 2,489 (16.8%) |
| $75,000 to $99,999 | 3,772 (15.5%) | 1,255 (8.5%) |
| $100,000 to $149,999 | 5,065 (20.8%) | 823 (5.6%) |
| $150,000 or more | 3,476 (14.3%) | 190 (1.3%) |
| Total | 24,344 (100.0%) | 14,836 (100.0%) |
Monthly Housing Cost Tiers in Madison County
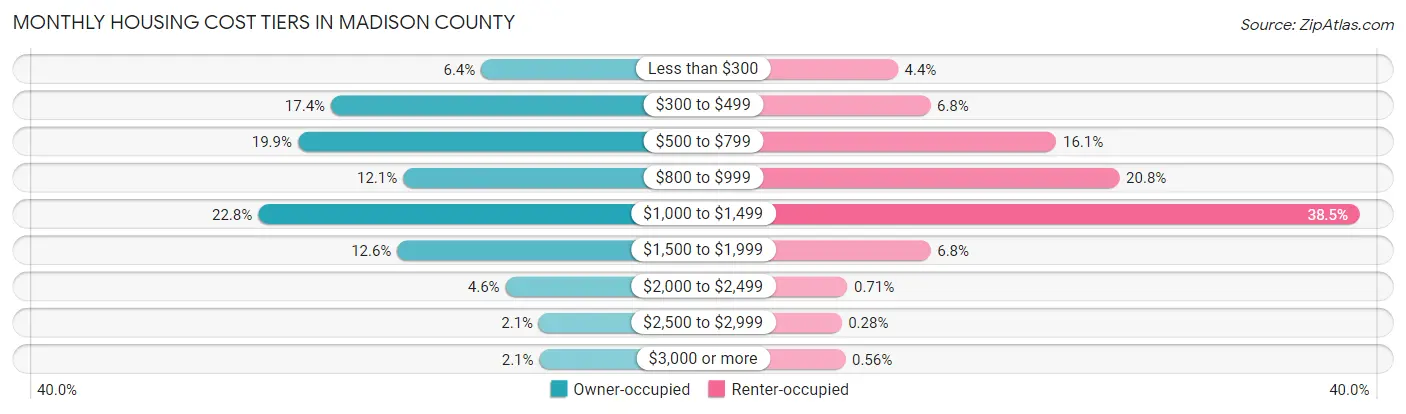
| Monthly Cost | Owner-occupied | Renter-occupied |
| Less than $300 | 1,554 (6.4%) | 657 (4.4%) |
| $300 to $499 | 4,246 (17.4%) | 1,012 (6.8%) |
| $500 to $799 | 4,839 (19.9%) | 2,389 (16.1%) |
| $800 to $999 | 2,952 (12.1%) | 3,079 (20.7%) |
| $1,000 to $1,499 | 5,553 (22.8%) | 5,707 (38.5%) |
| $1,500 to $1,999 | 3,058 (12.6%) | 1,015 (6.8%) |
| $2,000 to $2,499 | 1,117 (4.6%) | 105 (0.7%) |
| $2,500 to $2,999 | 515 (2.1%) | 42 (0.3%) |
| $3,000 or more | 510 (2.1%) | 83 (0.6%) |
| Total | 24,344 (100.0%) | 14,836 (100.0%) |
Physical Housing Characteristics in Madison County
Housing Structures in Madison County
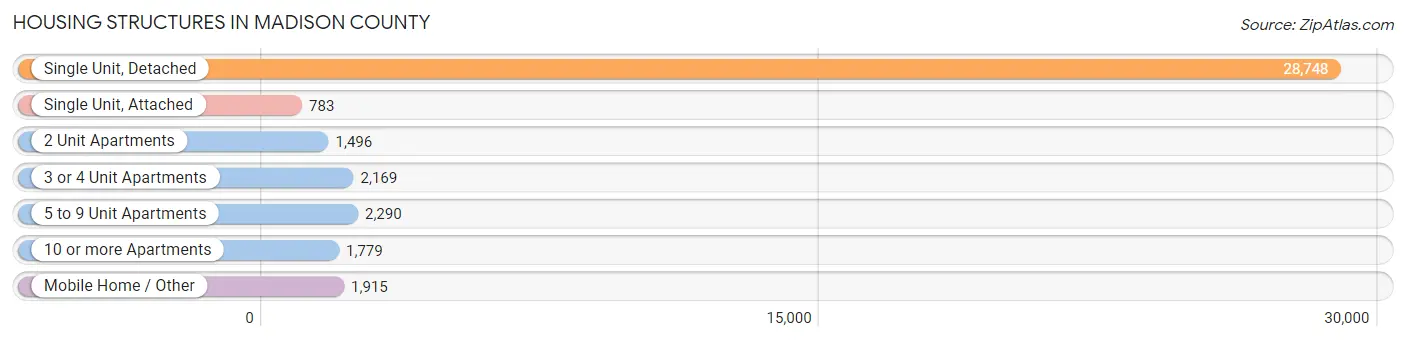
| Structure Type | # Housing Units | % Housing Units |
| Single Unit, Detached | 28,748 | 73.4% |
| Single Unit, Attached | 783 | 2.0% |
| 2 Unit Apartments | 1,496 | 3.8% |
| 3 or 4 Unit Apartments | 2,169 | 5.5% |
| 5 to 9 Unit Apartments | 2,290 | 5.8% |
| 10 or more Apartments | 1,779 | 4.5% |
| Mobile Home / Other | 1,915 | 4.9% |
| Total | 39,180 | 100.0% |
Housing Structures by Occupancy in Madison County
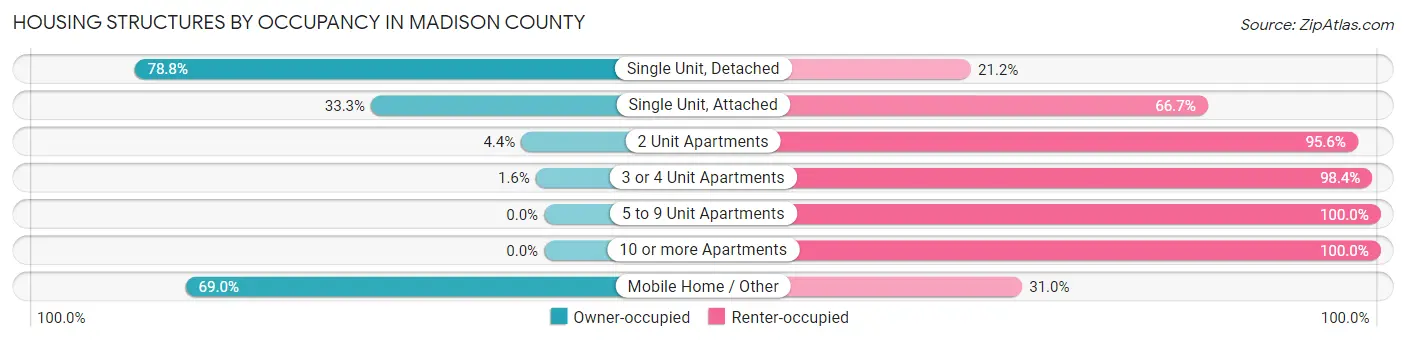
| Structure Type | Owner-occupied | Renter-occupied |
| Single Unit, Detached | 22,661 (78.8%) | 6,087 (21.2%) |
| Single Unit, Attached | 261 (33.3%) | 522 (66.7%) |
| 2 Unit Apartments | 66 (4.4%) | 1,430 (95.6%) |
| 3 or 4 Unit Apartments | 35 (1.6%) | 2,134 (98.4%) |
| 5 to 9 Unit Apartments | 0 (0.0%) | 2,290 (100.0%) |
| 10 or more Apartments | 0 (0.0%) | 1,779 (100.0%) |
| Mobile Home / Other | 1,321 (69.0%) | 594 (31.0%) |
| Total | 24,344 (62.1%) | 14,836 (37.9%) |
Housing Structures by Number of Rooms in Madison County

| Number of Rooms | Owner-occupied | Renter-occupied |
| 1 Room | 80 (0.3%) | 341 (2.3%) |
| 2 or 3 Rooms | 387 (1.6%) | 2,352 (15.9%) |
| 4 or 5 Rooms | 4,991 (20.5%) | 7,190 (48.5%) |
| 6 or 7 Rooms | 10,196 (41.9%) | 4,050 (27.3%) |
| 8 or more Rooms | 8,690 (35.7%) | 903 (6.1%) |
| Total | 24,344 (100.0%) | 14,836 (100.0%) |
Housing Structure by Heating Type in Madison County
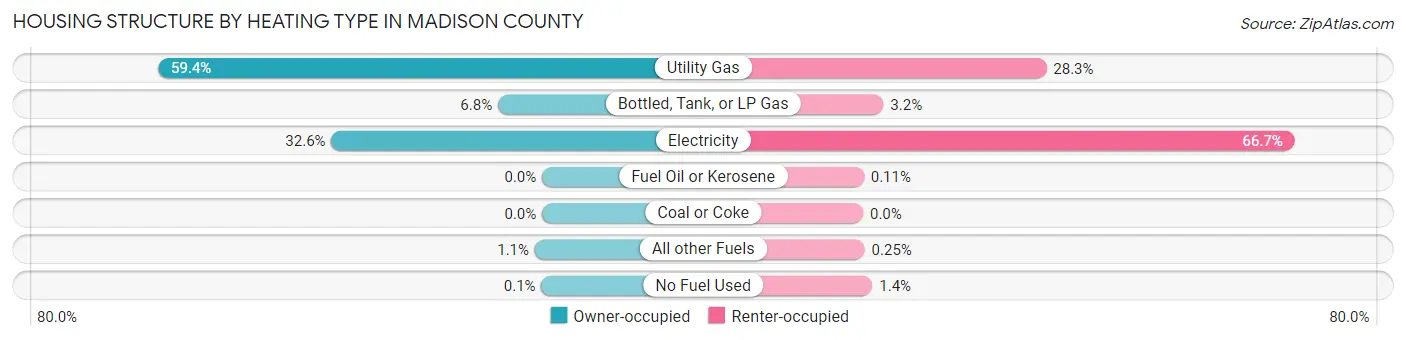
| Heating Type | Owner-occupied | Renter-occupied |
| Utility Gas | 14,457 (59.4%) | 4,204 (28.3%) |
| Bottled, Tank, or LP Gas | 1,660 (6.8%) | 467 (3.2%) |
| Electricity | 7,930 (32.6%) | 9,898 (66.7%) |
| Fuel Oil or Kerosene | 0 (0.0%) | 16 (0.1%) |
| Coal or Coke | 0 (0.0%) | 0 (0.0%) |
| All other Fuels | 273 (1.1%) | 37 (0.3%) |
| No Fuel Used | 24 (0.1%) | 214 (1.4%) |
| Total | 24,344 (100.0%) | 14,836 (100.0%) |
Household Vehicle Usage in Madison County
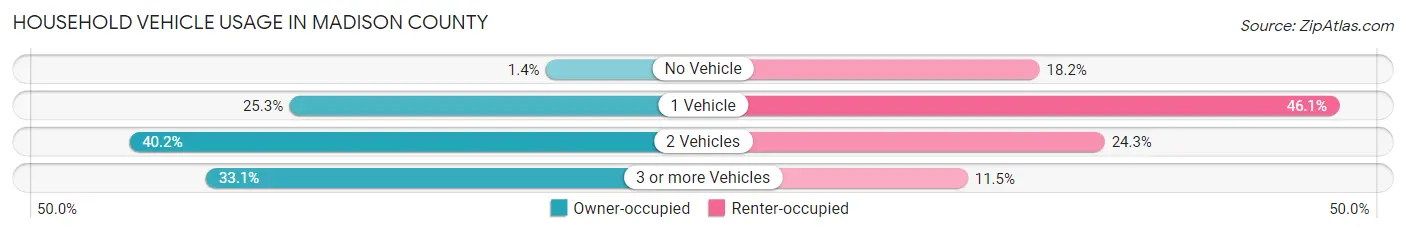
| Vehicles per Household | Owner-occupied | Renter-occupied |
| No Vehicle | 336 (1.4%) | 2,697 (18.2%) |
| 1 Vehicle | 6,165 (25.3%) | 6,840 (46.1%) |
| 2 Vehicles | 9,793 (40.2%) | 3,597 (24.2%) |
| 3 or more Vehicles | 8,050 (33.1%) | 1,702 (11.5%) |
| Total | 24,344 (100.0%) | 14,836 (100.0%) |
Real Estate & Mortgages in Madison County
Real Estate and Mortgage Overview in Madison County
| Characteristic | Without Mortgage | With Mortgage |
| Housing Units | 10,725 | 13,619 |
| Median Property Value | $156,100 | $178,200 |
| Median Household Income | $63,227 | $2,352 |
| Monthly Housing Costs | $487 | $497 |
| Real Estate Taxes | $1,013 | $412 |
Property Value by Mortgage Status in Madison County
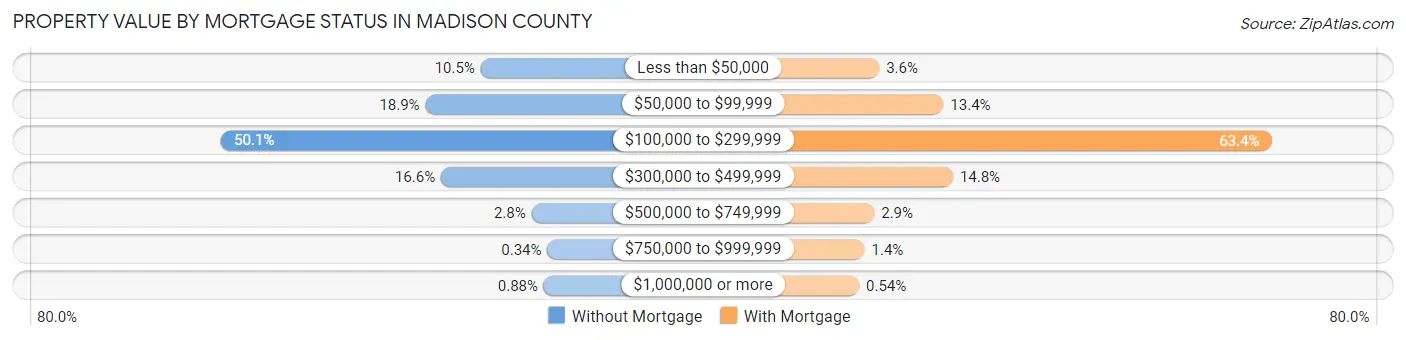
| Property Value | Without Mortgage | With Mortgage |
| Less than $50,000 | 1,126 (10.5%) | 492 (3.6%) |
| $50,000 to $99,999 | 2,029 (18.9%) | 1,824 (13.4%) |
| $100,000 to $299,999 | 5,369 (50.1%) | 8,630 (63.4%) |
| $300,000 to $499,999 | 1,775 (16.6%) | 2,021 (14.8%) |
| $500,000 to $749,999 | 295 (2.8%) | 390 (2.9%) |
| $750,000 to $999,999 | 37 (0.3%) | 188 (1.4%) |
| $1,000,000 or more | 94 (0.9%) | 74 (0.5%) |
| Total | 10,725 (100.0%) | 13,619 (100.0%) |
Household Income by Mortgage Status in Madison County

| Household Income | Without Mortgage | With Mortgage |
| Less than $10,000 | 373 (3.5%) | 192 (1.4%) |
| $10,000 to $24,999 | 1,488 (13.9%) | 476 (3.5%) |
| $25,000 to $34,999 | 961 (9.0%) | 772 (5.7%) |
| $35,000 to $49,999 | 1,292 (12.0%) | 939 (6.9%) |
| $50,000 to $74,999 | 2,289 (21.3%) | 1,242 (9.1%) |
| $75,000 to $99,999 | 1,546 (14.4%) | 2,199 (16.2%) |
| $100,000 to $149,999 | 1,652 (15.4%) | 2,226 (16.3%) |
| $150,000 or more | 1,124 (10.5%) | 3,413 (25.1%) |
| Total | 10,725 (100.0%) | 13,619 (100.0%) |
Property Value to Household Income Ratio in Madison County
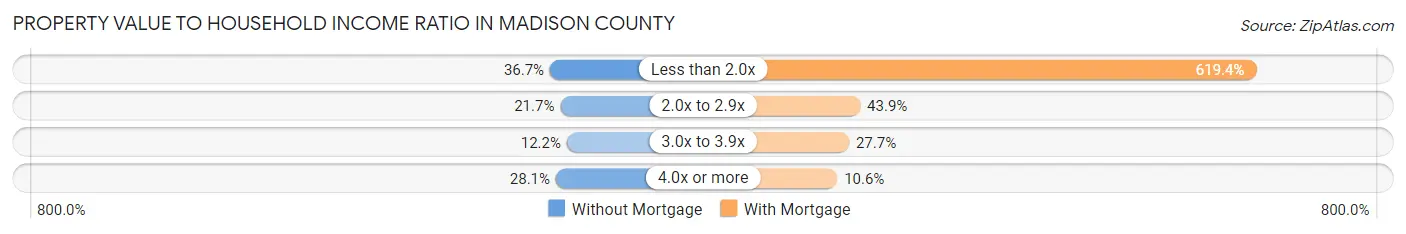
| Value-to-Income Ratio | Without Mortgage | With Mortgage |
| Less than 2.0x | 3,938 (36.7%) | 84,356 (619.4%) |
| 2.0x to 2.9x | 2,332 (21.7%) | 5,983 (43.9%) |
| 3.0x to 3.9x | 1,312 (12.2%) | 3,773 (27.7%) |
| 4.0x or more | 3,016 (28.1%) | 1,440 (10.6%) |
| Total | 10,725 (100.0%) | 13,619 (100.0%) |
Real Estate Taxes by Mortgage Status in Madison County
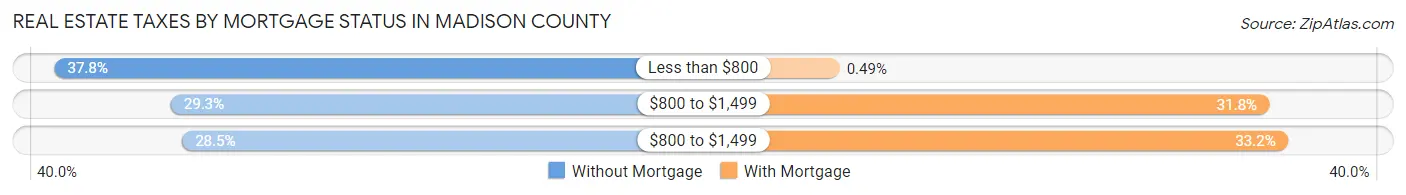
| Property Taxes | Without Mortgage | With Mortgage |
| Less than $800 | 4,055 (37.8%) | 67 (0.5%) |
| $800 to $1,499 | 3,143 (29.3%) | 4,336 (31.8%) |
| $800 to $1,499 | 3,054 (28.5%) | 4,521 (33.2%) |
| Total | 10,725 (100.0%) | 13,619 (100.0%) |
Health & Disability in Madison County
Health Insurance Coverage by Age in Madison County
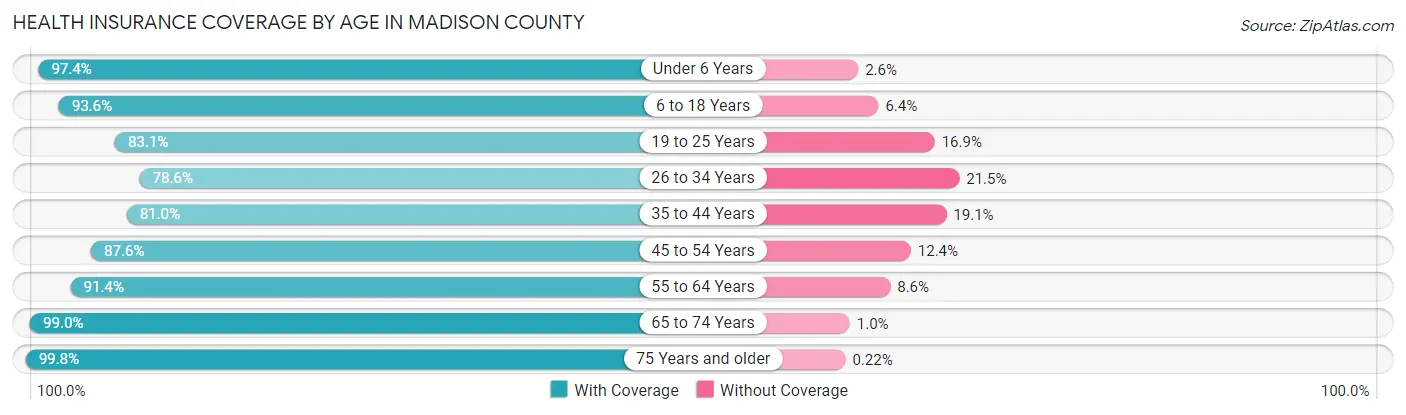
| Age Bracket | With Coverage | Without Coverage |
| Under 6 Years | 7,475 (97.4%) | 199 (2.6%) |
| 6 to 18 Years | 14,722 (93.6%) | 1,004 (6.4%) |
| 19 to 25 Years | 8,236 (83.1%) | 1,670 (16.9%) |
| 26 to 34 Years | 8,731 (78.5%) | 2,384 (21.4%) |
| 35 to 44 Years | 9,095 (80.9%) | 2,141 (19.1%) |
| 45 to 54 Years | 10,177 (87.6%) | 1,442 (12.4%) |
| 55 to 64 Years | 12,250 (91.4%) | 1,149 (8.6%) |
| 65 to 74 Years | 10,049 (99.0%) | 106 (1.0%) |
| 75 Years and older | 6,379 (99.8%) | 14 (0.2%) |
| Total | 87,114 (89.6%) | 10,109 (10.4%) |
Health Insurance Coverage by Citizenship Status in Madison County
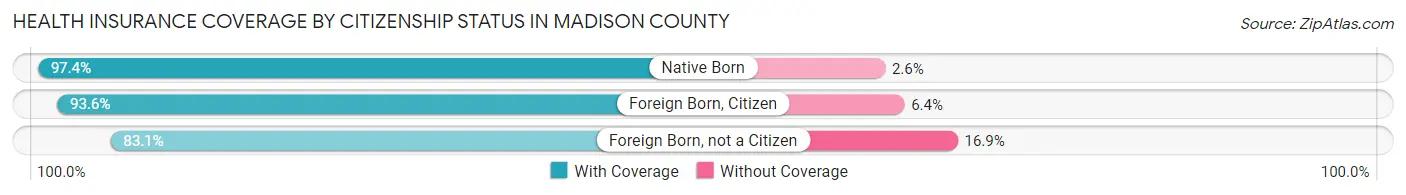
| Citizenship Status | With Coverage | Without Coverage |
| Native Born | 7,475 (97.4%) | 199 (2.6%) |
| Foreign Born, Citizen | 14,722 (93.6%) | 1,004 (6.4%) |
| Foreign Born, not a Citizen | 8,236 (83.1%) | 1,670 (16.9%) |
Health Insurance Coverage by Household Income in Madison County
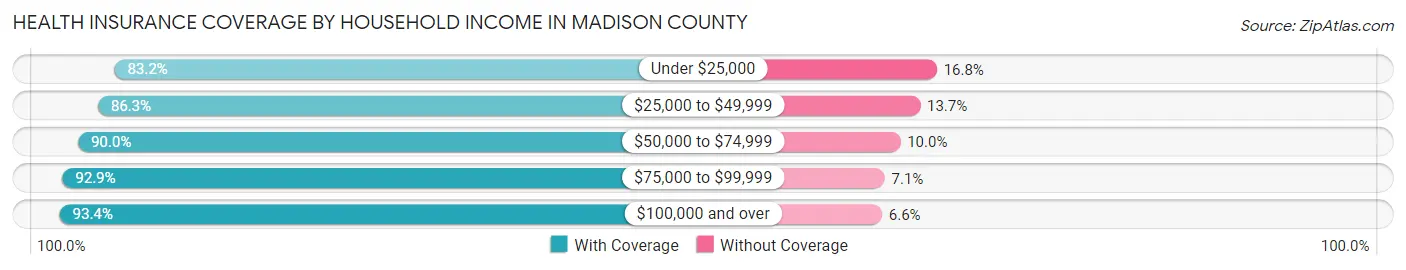
| Household Income | With Coverage | Without Coverage |
| Under $25,000 | 13,469 (83.2%) | 2,727 (16.8%) |
| $25,000 to $49,999 | 16,368 (86.3%) | 2,602 (13.7%) |
| $50,000 to $74,999 | 14,147 (90.0%) | 1,573 (10.0%) |
| $75,000 to $99,999 | 12,732 (92.9%) | 970 (7.1%) |
| $100,000 and over | 28,035 (93.4%) | 1,971 (6.6%) |
Public vs Private Health Insurance Coverage by Age in Madison County
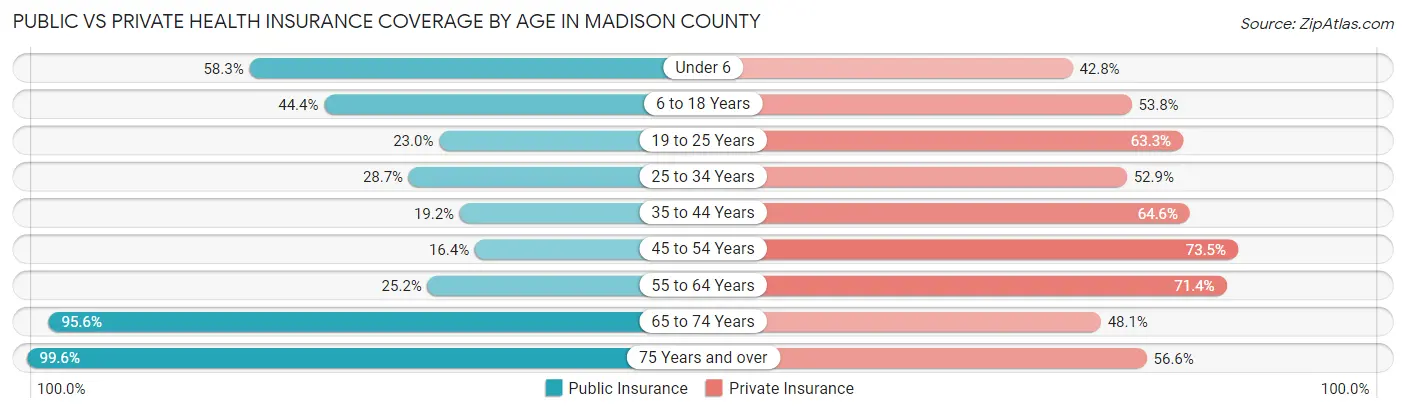
| Age Bracket | Public Insurance | Private Insurance |
| Under 6 | 4,471 (58.3%) | 3,285 (42.8%) |
| 6 to 18 Years | 6,977 (44.4%) | 8,454 (53.8%) |
| 19 to 25 Years | 2,282 (23.0%) | 6,271 (63.3%) |
| 25 to 34 Years | 3,186 (28.7%) | 5,879 (52.9%) |
| 35 to 44 Years | 2,156 (19.2%) | 7,258 (64.6%) |
| 45 to 54 Years | 1,906 (16.4%) | 8,541 (73.5%) |
| 55 to 64 Years | 3,375 (25.2%) | 9,564 (71.4%) |
| 65 to 74 Years | 9,704 (95.6%) | 4,881 (48.1%) |
| 75 Years and over | 6,370 (99.6%) | 3,617 (56.6%) |
| Total | 40,427 (41.6%) | 57,750 (59.4%) |
Disability Status by Sex by Age in Madison County
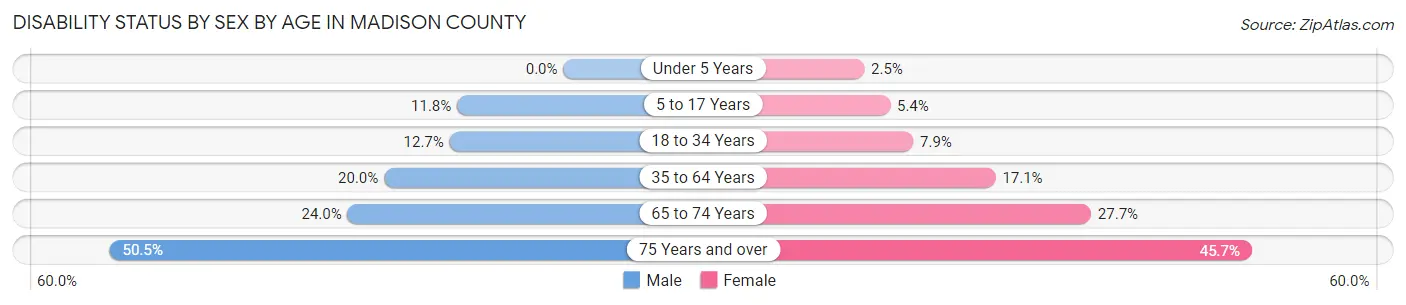
| Age Bracket | Male | Female |
| Under 5 Years | 0 (0.0%) | 74 (2.5%) |
| 5 to 17 Years | 957 (11.8%) | 423 (5.4%) |
| 18 to 34 Years | 1,378 (12.7%) | 927 (7.9%) |
| 35 to 64 Years | 3,451 (20.0%) | 3,245 (17.1%) |
| 65 to 74 Years | 1,113 (24.0%) | 1,532 (27.7%) |
| 75 Years and over | 1,315 (50.5%) | 1,731 (45.7%) |
Disability Class by Sex by Age in Madison County
Disability Class: Hearing Difficulty
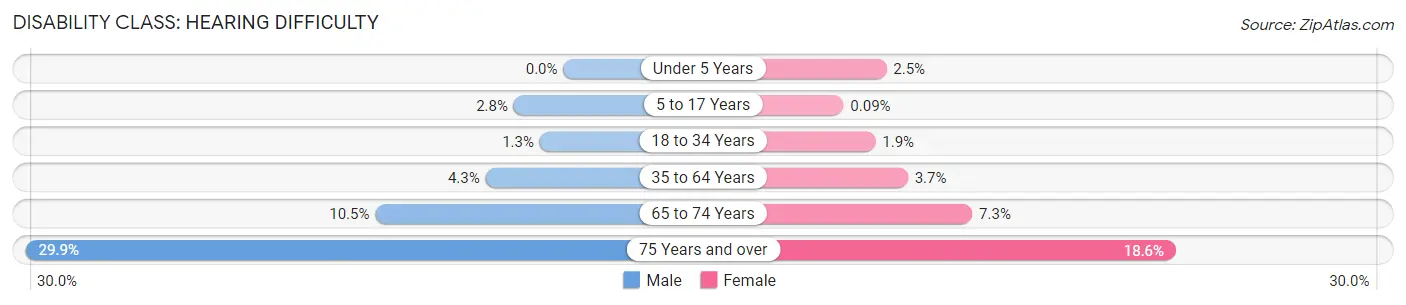
| Age Bracket | Male | Female |
| Under 5 Years | 0 (0.0%) | 74 (2.5%) |
| 5 to 17 Years | 223 (2.8%) | 7 (0.1%) |
| 18 to 34 Years | 142 (1.3%) | 218 (1.9%) |
| 35 to 64 Years | 749 (4.3%) | 697 (3.7%) |
| 65 to 74 Years | 485 (10.5%) | 401 (7.3%) |
| 75 Years and over | 779 (29.9%) | 705 (18.6%) |
Disability Class: Vision Difficulty
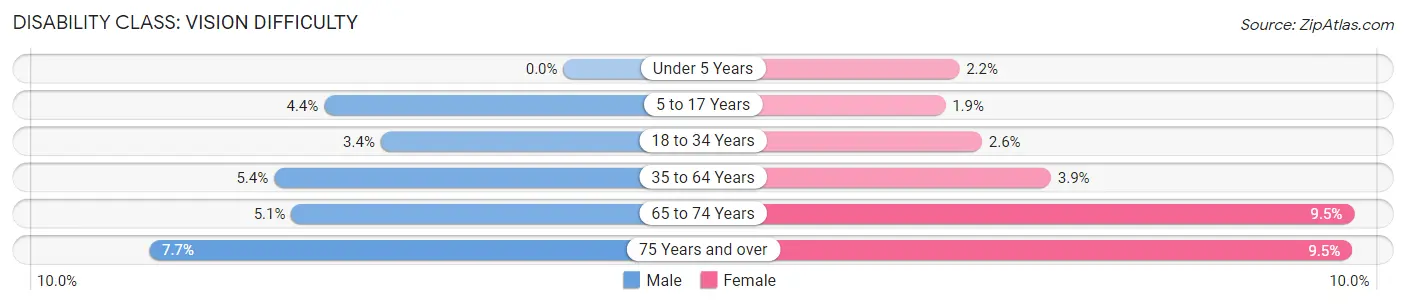
| Age Bracket | Male | Female |
| Under 5 Years | 0 (0.0%) | 65 (2.2%) |
| 5 to 17 Years | 359 (4.4%) | 151 (1.9%) |
| 18 to 34 Years | 369 (3.4%) | 304 (2.6%) |
| 35 to 64 Years | 929 (5.4%) | 736 (3.9%) |
| 65 to 74 Years | 234 (5.1%) | 525 (9.5%) |
| 75 Years and over | 200 (7.7%) | 359 (9.5%) |
Disability Class: Cognitive Difficulty
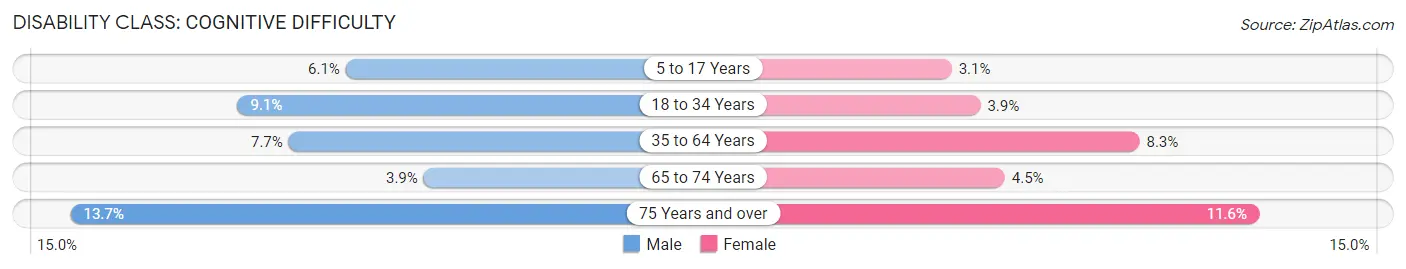
| Age Bracket | Male | Female |
| 5 to 17 Years | 490 (6.1%) | 241 (3.1%) |
| 18 to 34 Years | 986 (9.1%) | 451 (3.9%) |
| 35 to 64 Years | 1,322 (7.6%) | 1,572 (8.3%) |
| 65 to 74 Years | 180 (3.9%) | 251 (4.5%) |
| 75 Years and over | 357 (13.7%) | 440 (11.6%) |
Disability Class: Ambulatory Difficulty
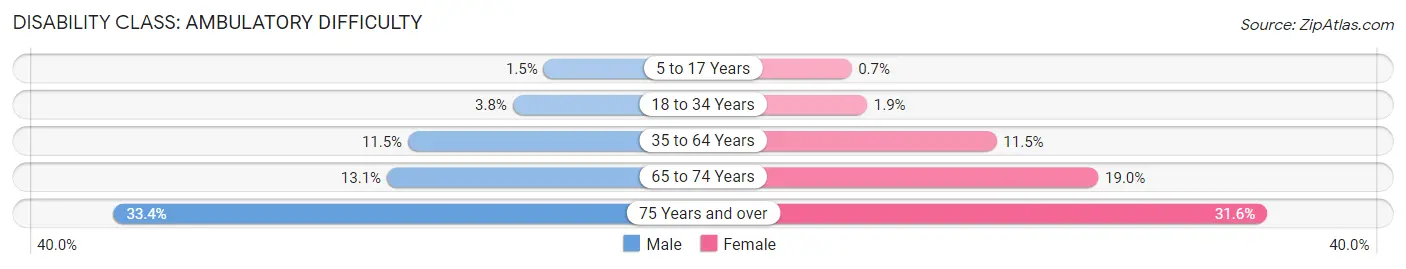
| Age Bracket | Male | Female |
| 5 to 17 Years | 119 (1.5%) | 55 (0.7%) |
| 18 to 34 Years | 409 (3.8%) | 217 (1.9%) |
| 35 to 64 Years | 1,994 (11.5%) | 2,177 (11.5%) |
| 65 to 74 Years | 607 (13.1%) | 1,051 (19.0%) |
| 75 Years and over | 869 (33.4%) | 1,197 (31.6%) |
Disability Class: Self-Care Difficulty

| Age Bracket | Male | Female |
| 5 to 17 Years | 108 (1.3%) | 55 (0.7%) |
| 18 to 34 Years | 264 (2.4%) | 105 (0.9%) |
| 35 to 64 Years | 870 (5.0%) | 471 (2.5%) |
| 65 to 74 Years | 188 (4.1%) | 279 (5.1%) |
| 75 Years and over | 311 (11.9%) | 357 (9.4%) |
Technology Access in Madison County
Computing Device Access in Madison County
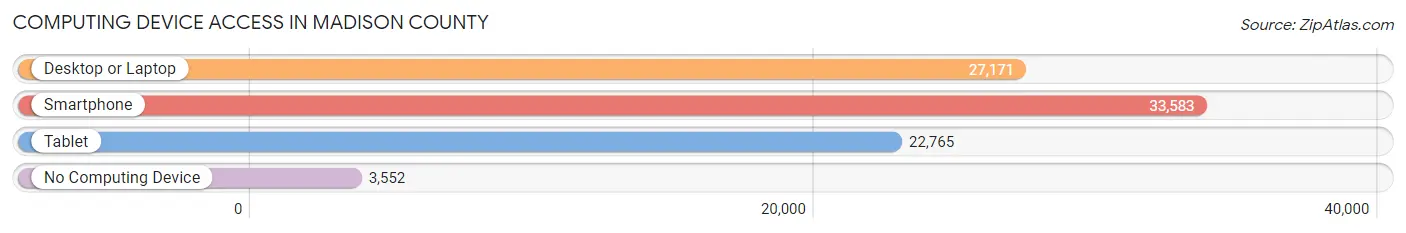
| Device Type | # Households | % Households |
| Desktop or Laptop | 27,171 | 69.4% |
| Smartphone | 33,583 | 85.7% |
| Tablet | 22,765 | 58.1% |
| No Computing Device | 3,552 | 9.1% |
| Total | 39,180 | 100.0% |
Internet Access in Madison County
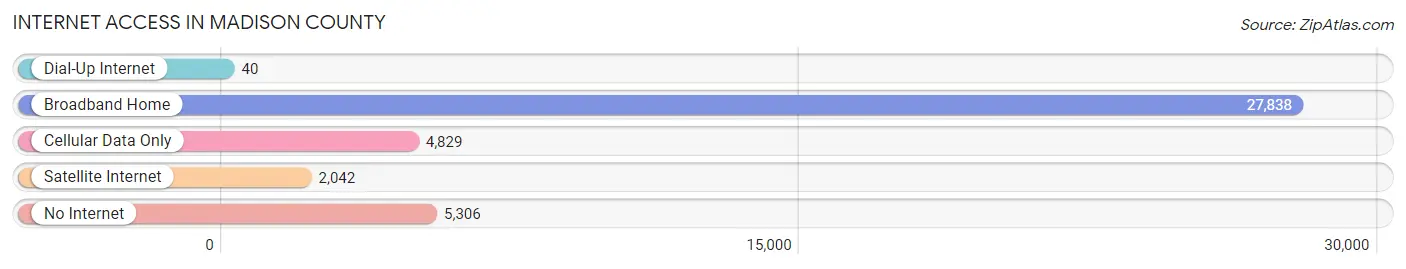
| Internet Type | # Households | % Households |
| Dial-Up Internet | 40 | 0.1% |
| Broadband Home | 27,838 | 71.1% |
| Cellular Data Only | 4,829 | 12.3% |
| Satellite Internet | 2,042 | 5.2% |
| No Internet | 5,306 | 13.5% |
| Total | 39,180 | 100.0% |
Madison County Summary
Madison County is located in the western part of the state of Tennessee, and is part of the Jackson Metropolitan Statistical Area. It is bordered by Haywood County to the north, Hardeman County to the east, Chester County to the south, and Fayette County to the west. The county seat is Jackson, and the county has a total area of 545 square miles.
History
Madison County was established in 1821, and was named after James Madison, the fourth President of the United States. The county was originally part of Hardin County, and was created from parts of Hardin, Haywood, and Chester counties. The county was initially divided into two townships, Jackson and Denmark, and the county seat was established in Jackson.
In the early 19th century, Madison County was a major center of cotton production, and the county was home to several large plantations. The county was also home to several Native American tribes, including the Chickasaw, Choctaw, and Cherokee.
Geography
Madison County is located in the western part of Tennessee, and is part of the Jackson Metropolitan Statistical Area. It is bordered by Haywood County to the north, Hardeman County to the east, Chester County to the south, and Fayette County to the west. The county has a total area of 545 square miles, and is mostly flat, with some rolling hills in the northern part of the county. The county is drained by the Forked Deer River, which flows through the county from north to south.
The county is home to several state parks, including Natchez Trace State Park, which is located in the northern part of the county. The park is home to a variety of wildlife, including deer, turkey, and waterfowl. The park also features several hiking trails, camping sites, and picnic areas.
Economy
The economy of Madison County is largely based on agriculture, manufacturing, and tourism. The county is home to several large agricultural operations, including poultry farms, cattle farms, and vegetable farms. The county is also home to several manufacturing companies, including automotive parts manufacturers, furniture manufacturers, and food processing plants.
The county is also home to several tourist attractions, including the Natchez Trace State Park, the Casey Jones Village, and the International Rock-A-Billy Hall of Fame. The county is also home to several museums, including the Madison County Museum, the West Tennessee Delta Heritage Center, and the Tennessee State Museum.
Demographics
As of the 2010 census, Madison County had a population of 98,294. The racial makeup of the county was 79.2% White, 17.3% African American, 0.4% Native American, 0.7% Asian, 0.1% Pacific Islander, 1.2% from other races, and 1.1% from two or more races. Hispanic or Latino of any race were 2.7% of the population.
The median income for a household in the county was $41,945, and the median income for a family was $50,945. The per capita income for the county was $21,845. About 15.2% of the population was below the poverty line.
Common Questions
What is the Total Population of Madison County?
Total Population of Madison County is 98,644.
What is the Total Male Population of Madison County?
Total Male Population of Madison County is 47,371.
What is the Total Female Population of Madison County?
Total Female Population of Madison County is 51,273.
What is the Ratio of Males per 100 Females in Madison County?
There are 92.39 Males per 100 Females in Madison County.
What is the Ratio of Females per 100 Males in Madison County?
There are 108.24 Females per 100 Males in Madison County.
What is the Median Population Age in Madison County?
Median Population Age in Madison County is 38.4 Years.
What is the Average Family Size in Madison County
Average Family Size in Madison County is 3.0 People.
What is the Average Household Size in Madison County
Average Household Size in Madison County is 2.4 People.
What is Per Capita Income in Madison County?
Per Capita income in Madison County is $31,380.
What is the Median Family Income in Madison County?
Median Family Income in Madison County is $72,116.
What is the Median Household income in Madison County?
Median Household Income in Madison County is $55,280.
What is Income or Wage Gap in Madison County?
Income or Wage Gap in Madison County is 23.4%.
Women in Madison County earn 76.6 cents for every dollar earned by a man.
What is Family Income Deficit in Madison County?
Family Income Deficit in Madison County is $11,954.
Families that are below poverty line in Madison County earn $11,954 less on average than the poverty threshold level.
What is Inequality or Gini Index in Madison County?
Inequality or Gini Index in Madison County is 0.47.
How Large is the Labor Force in Madison County?
There are 48,592 People in the Labor Forcein in Madison County.
What is the Percentage of People in the Labor Force in Madison County?
61.1% of People are in the Labor Force in Madison County.
What is the Unemployment Rate in Madison County?
Unemployment Rate in Madison County is 7.4%.