Loudon County, TN
Loudon County Map
Loudon County Overview
55,507
TOTAL POPULATION
27,335
MALE POPULATION
28,172
FEMALE POPULATION
97.03
MALES / 100 FEMALES
103.06
FEMALES / 100 MALES
48.5
MEDIAN AGE
2.9
AVG FAMILY SIZE
2.5
AVG HOUSEHOLD SIZE
$40,425
PER CAPITA INCOME
$87,660
AVG FAMILY INCOME
$75,008
AVG HOUSEHOLD INCOME
34.5%
WAGE / INCOME GAP [ % ]
65.5¢/ $1
WAGE / INCOME GAP [ $ ]
$9,659
FAMILY INCOME DEFICIT
0.45
INEQUALITY / GINI INDEX
25,257
LABOR FORCE [ PEOPLE ]
54.9%
PERCENT IN LABOR FORCE
3.0%
UNEMPLOYMENT RATE
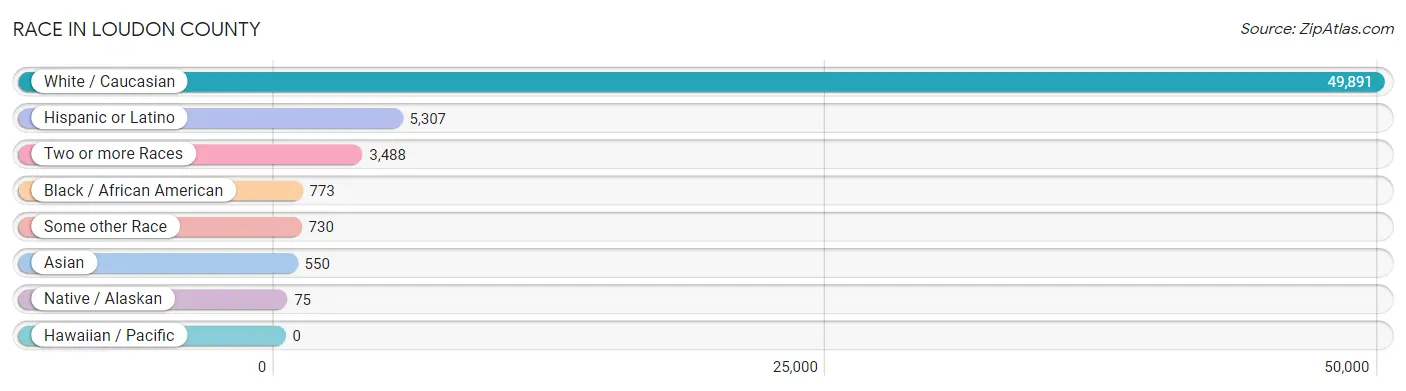
Race in Loudon County
The most populous races in Loudon County are White / Caucasian (49,891 | 89.9%), Hispanic or Latino (5,307 | 9.6%), and Two or more Races (3,488 | 6.3%).
| Race | # Population | % Population |
| Asian | 550 | 1.0% |
| Black / African American | 773 | 1.4% |
| Hawaiian / Pacific | 0 | 0.0% |
| Hispanic or Latino | 5,307 | 9.6% |
| Native / Alaskan | 75 | 0.1% |
| White / Caucasian | 49,891 | 89.9% |
| Two or more Races | 3,488 | 6.3% |
| Some other Race | 730 | 1.3% |
| Total | 55,507 | 100.0% |
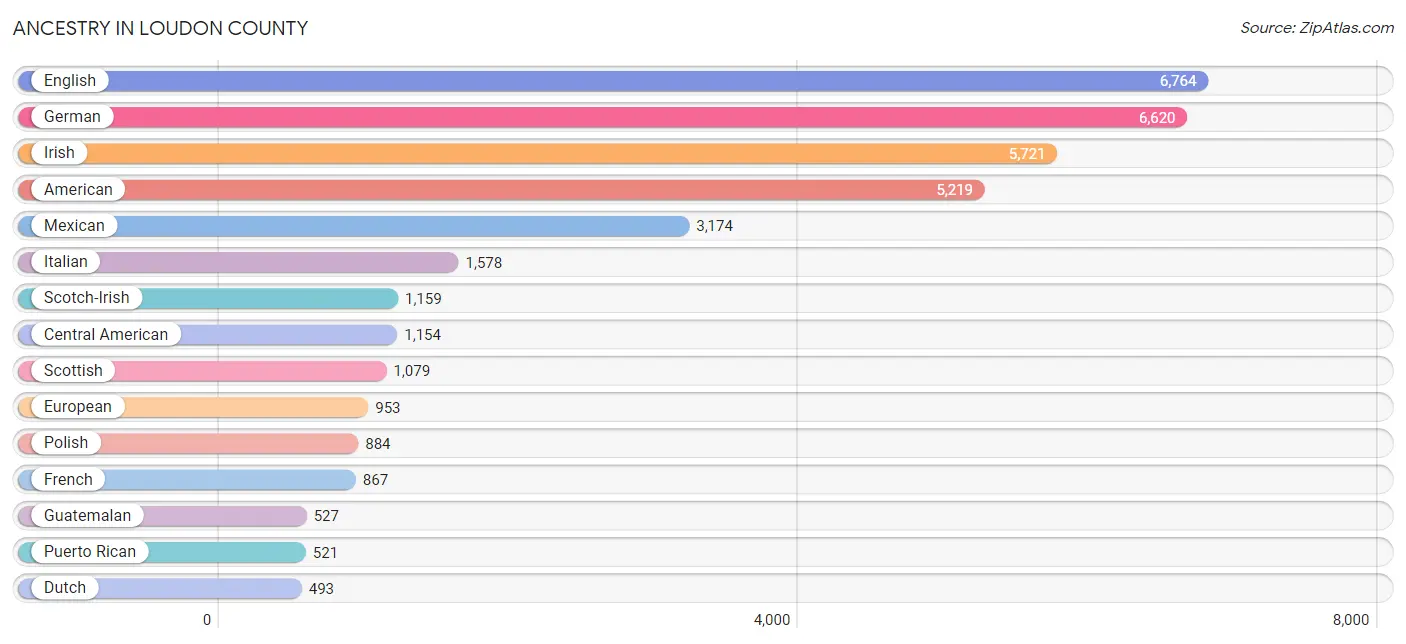
Ancestry in Loudon County
The most populous ancestries reported in Loudon County are English (6,764 | 12.2%), German (6,620 | 11.9%), Irish (5,721 | 10.3%), American (5,219 | 9.4%), and Mexican (3,174 | 5.7%), together accounting for 49.6% of all Loudon County residents.
| Ancestry | # Population | % Population |
| African | 106 | 0.2% |
| American | 5,219 | 9.4% |
| Arab | 137 | 0.3% |
| Argentinean | 7 | 0.0% |
| Australian | 31 | 0.1% |
| Austrian | 211 | 0.4% |
| Belgian | 33 | 0.1% |
| Bhutanese | 23 | 0.0% |
| Blackfeet | 4 | 0.0% |
| Brazilian | 89 | 0.2% |
| British | 383 | 0.7% |
| Bulgarian | 24 | 0.0% |
| Burmese | 41 | 0.1% |
| Canadian | 10 | 0.0% |
| Central American | 1,154 | 2.1% |
| Central American Indian | 15 | 0.0% |
| Cherokee | 342 | 0.6% |
| Chickasaw | 11 | 0.0% |
| Chilean | 4 | 0.0% |
| Colombian | 37 | 0.1% |
| Croatian | 57 | 0.1% |
| Cuban | 115 | 0.2% |
| Czech | 126 | 0.2% |
| Czechoslovakian | 47 | 0.1% |
| Danish | 142 | 0.3% |
| Dominican | 3 | 0.0% |
| Dutch | 493 | 0.9% |
| Dutch West Indian | 8 | 0.0% |
| Eastern European | 64 | 0.1% |
| English | 6,764 | 12.2% |
| European | 953 | 1.7% |
| Filipino | 120 | 0.2% |
| Finnish | 25 | 0.1% |
| French | 867 | 1.6% |
| French Canadian | 132 | 0.2% |
| German | 6,620 | 11.9% |
| Greek | 213 | 0.4% |
| Guatemalan | 527 | 0.9% |
| Haitian | 3 | 0.0% |
| Honduran | 446 | 0.8% |
| Hungarian | 87 | 0.2% |
| Indian (Asian) | 35 | 0.1% |
| Irish | 5,721 | 10.3% |
| Iroquois | 11 | 0.0% |
| Italian | 1,578 | 2.8% |
| Korean | 260 | 0.5% |
| Latvian | 93 | 0.2% |
| Lebanese | 48 | 0.1% |
| Lithuanian | 28 | 0.1% |
| Macedonian | 13 | 0.0% |
| Mexican | 3,174 | 5.7% |
| Mexican American Indian | 64 | 0.1% |
| Navajo | 20 | 0.0% |
| Nicaraguan | 7 | 0.0% |
| Northern European | 86 | 0.2% |
| Norwegian | 340 | 0.6% |
| Pennsylvania German | 15 | 0.0% |
| Polish | 884 | 1.6% |
| Portuguese | 115 | 0.2% |
| Pueblo | 13 | 0.0% |
| Puerto Rican | 521 | 0.9% |
| Romanian | 87 | 0.2% |
| Russian | 85 | 0.2% |
| Salvadoran | 174 | 0.3% |
| Scandinavian | 128 | 0.2% |
| Scotch-Irish | 1,159 | 2.1% |
| Scottish | 1,079 | 1.9% |
| Sioux | 4 | 0.0% |
| Slavic | 39 | 0.1% |
| Slovak | 19 | 0.0% |
| South American | 155 | 0.3% |
| South American Indian | 7 | 0.0% |
| Spaniard | 34 | 0.1% |
| Spanish | 103 | 0.2% |
| Sri Lankan | 46 | 0.1% |
| Subsaharan African | 106 | 0.2% |
| Swedish | 257 | 0.5% |
| Swiss | 103 | 0.2% |
| Syrian | 82 | 0.2% |
| Thai | 71 | 0.1% |
| Ukrainian | 64 | 0.1% |
| Venezuelan | 107 | 0.2% |
| Welsh | 475 | 0.9% |
| Yugoslavian | 7 | 0.0% | View All 84 Rows |
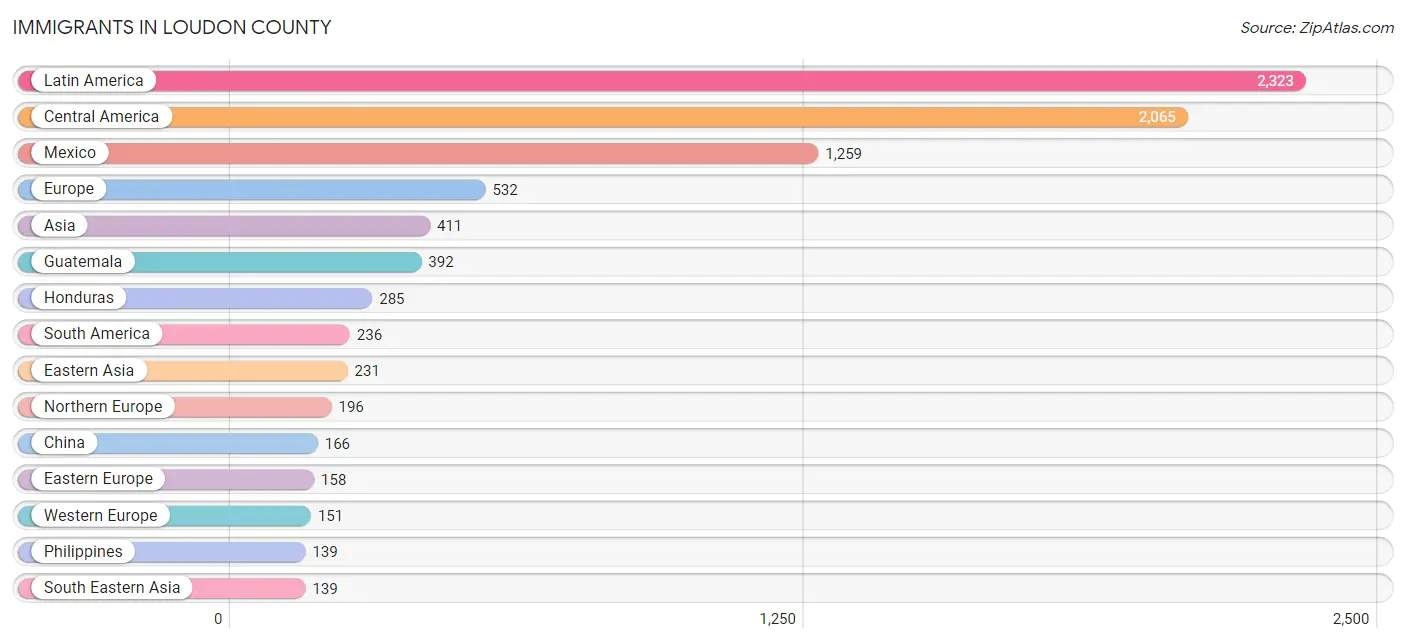
Immigrants in Loudon County
The most numerous immigrant groups reported in Loudon County came from Latin America (2,323 | 4.2%), Central America (2,065 | 3.7%), Mexico (1,259 | 2.3%), Europe (532 | 1.0%), and Asia (411 | 0.7%), together accounting for 11.9% of all Loudon County residents.
| Immigration Origin | # Population | % Population |
| Africa | 15 | 0.0% |
| Argentina | 7 | 0.0% |
| Asia | 411 | 0.7% |
| Australia | 31 | 0.1% |
| Brazil | 35 | 0.1% |
| Canada | 34 | 0.1% |
| Caribbean | 22 | 0.0% |
| Central America | 2,065 | 3.7% |
| China | 166 | 0.3% |
| Colombia | 81 | 0.2% |
| Cuba | 22 | 0.0% |
| Denmark | 34 | 0.1% |
| Eastern Africa | 15 | 0.0% |
| Eastern Asia | 231 | 0.4% |
| Eastern Europe | 158 | 0.3% |
| El Salvador | 129 | 0.2% |
| England | 95 | 0.2% |
| Europe | 532 | 1.0% |
| France | 15 | 0.0% |
| Germany | 136 | 0.3% |
| Greece | 27 | 0.1% |
| Guatemala | 392 | 0.7% |
| Honduras | 285 | 0.5% |
| Hong Kong | 27 | 0.1% |
| India | 40 | 0.1% |
| Ireland | 12 | 0.0% |
| Japan | 24 | 0.0% |
| Kenya | 15 | 0.0% |
| Korea | 41 | 0.1% |
| Latin America | 2,323 | 4.2% |
| Latvia | 93 | 0.2% |
| Mexico | 1,259 | 2.3% |
| Moldova | 22 | 0.0% |
| Northern Europe | 196 | 0.4% |
| Oceania | 31 | 0.1% |
| Pakistan | 1 | 0.0% |
| Philippines | 139 | 0.3% |
| Poland | 7 | 0.0% |
| South America | 236 | 0.4% |
| South Central Asia | 41 | 0.1% |
| South Eastern Asia | 139 | 0.3% |
| Southern Europe | 27 | 0.1% |
| Sweden | 16 | 0.0% |
| Taiwan | 131 | 0.2% |
| Ukraine | 36 | 0.1% |
| Venezuela | 113 | 0.2% |
| Western Europe | 151 | 0.3% | View All 47 Rows |
Sex and Age in Loudon County
Sex and Age in Loudon County
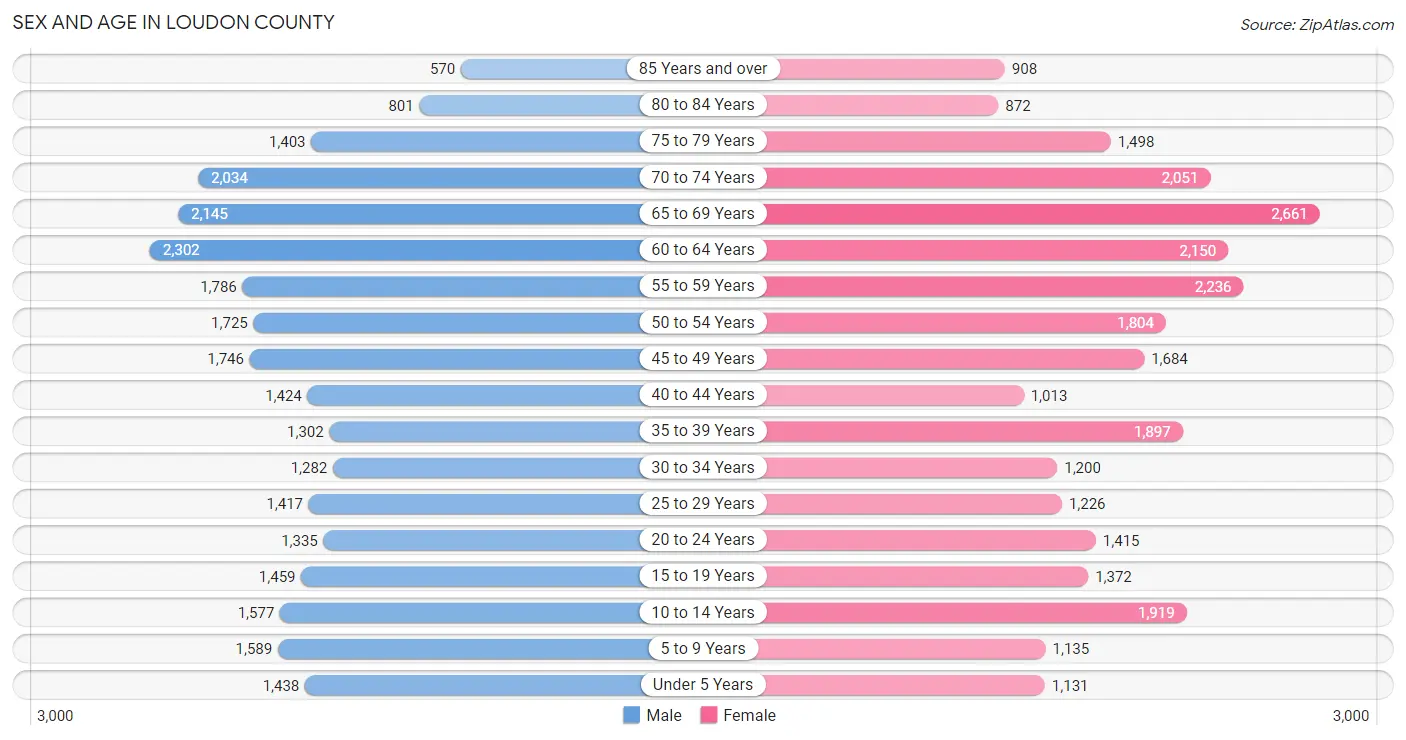
The most populous age groups in Loudon County are 60 to 64 Years (2,302 | 8.4%) for men and 65 to 69 Years (2,661 | 9.5%) for women.
| Age Bracket | Male | Female |
| Under 5 Years | 1,438 (5.3%) | 1,131 (4.0%) |
| 5 to 9 Years | 1,589 (5.8%) | 1,135 (4.0%) |
| 10 to 14 Years | 1,577 (5.8%) | 1,919 (6.8%) |
| 15 to 19 Years | 1,459 (5.3%) | 1,372 (4.9%) |
| 20 to 24 Years | 1,335 (4.9%) | 1,415 (5.0%) |
| 25 to 29 Years | 1,417 (5.2%) | 1,226 (4.3%) |
| 30 to 34 Years | 1,282 (4.7%) | 1,200 (4.3%) |
| 35 to 39 Years | 1,302 (4.8%) | 1,897 (6.7%) |
| 40 to 44 Years | 1,424 (5.2%) | 1,013 (3.6%) |
| 45 to 49 Years | 1,746 (6.4%) | 1,684 (6.0%) |
| 50 to 54 Years | 1,725 (6.3%) | 1,804 (6.4%) |
| 55 to 59 Years | 1,786 (6.5%) | 2,236 (7.9%) |
| 60 to 64 Years | 2,302 (8.4%) | 2,150 (7.6%) |
| 65 to 69 Years | 2,145 (7.9%) | 2,661 (9.5%) |
| 70 to 74 Years | 2,034 (7.4%) | 2,051 (7.3%) |
| 75 to 79 Years | 1,403 (5.1%) | 1,498 (5.3%) |
| 80 to 84 Years | 801 (2.9%) | 872 (3.1%) |
| 85 Years and over | 570 (2.1%) | 908 (3.2%) |
| Total | 27,335 (100.0%) | 28,172 (100.0%) |
Families and Households in Loudon County
Median Family Size in Loudon County
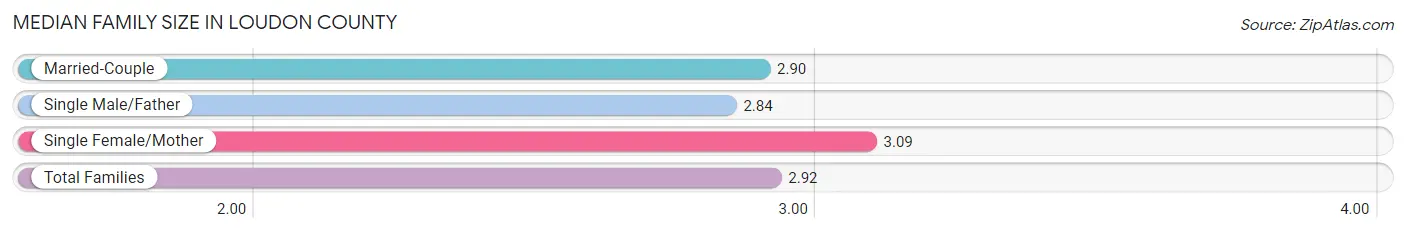
The median family size in Loudon County is 2.92 persons per family, with single female/mother families (1,804 | 11.3%) accounting for the largest median family size of 3.09 persons per family. On the other hand, single male/father families (1,142 | 7.1%) represent the smallest median family size with 2.84 persons per family.
| Family Type | # Families | Family Size |
| Married-Couple | 13,069 (81.6%) | 2.90 |
| Single Male/Father | 1,142 (7.1%) | 2.84 |
| Single Female/Mother | 1,804 (11.3%) | 3.09 |
| Total Families | 16,015 (100.0%) | 2.92 |
Median Household Size in Loudon County
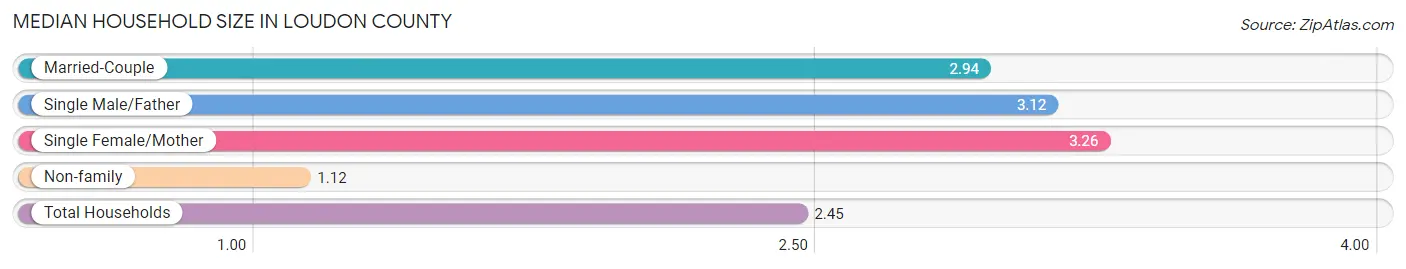
The median household size in Loudon County is 2.45 persons per household, with single female/mother households (1,804 | 8.0%) accounting for the largest median household size of 3.26 persons per household. non-family households (6,472 | 28.8%) represent the smallest median household size with 1.12 persons per household.
| Household Type | # Households | Household Size |
| Married-Couple | 13,069 (58.1%) | 2.94 |
| Single Male/Father | 1,142 (5.1%) | 3.12 |
| Single Female/Mother | 1,804 (8.0%) | 3.26 |
| Non-family | 6,472 (28.8%) | 1.12 |
| Total Households | 22,487 (100.0%) | 2.45 |
Household Size by Marriage Status in Loudon County
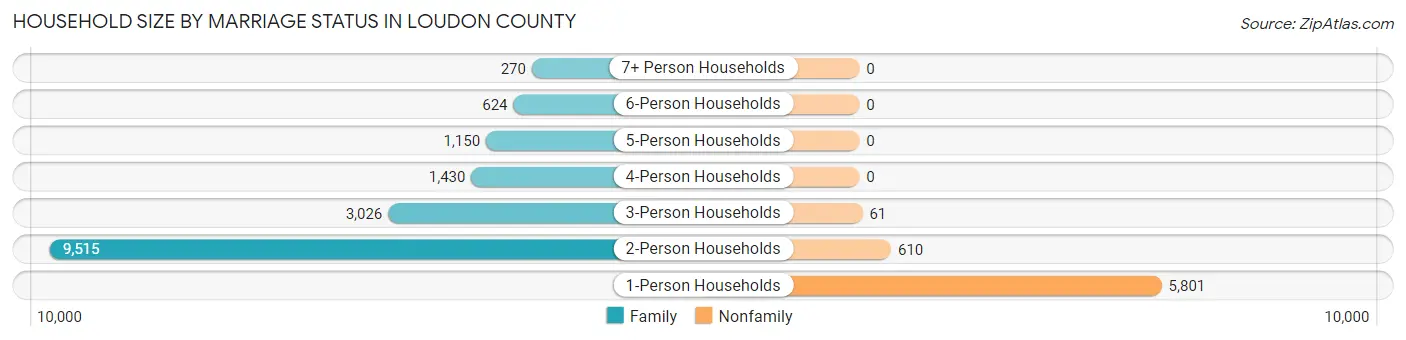
Out of a total of 22,487 households in Loudon County, 16,015 (71.2%) are family households, while 6,472 (28.8%) are nonfamily households. The most numerous type of family households are 2-person households, comprising 9,515, and the most common type of nonfamily households are 1-person households, comprising 5,801.
| Household Size | Family Households | Nonfamily Households |
| 1-Person Households | - | 5,801 (25.8%) |
| 2-Person Households | 9,515 (42.3%) | 610 (2.7%) |
| 3-Person Households | 3,026 (13.5%) | 61 (0.3%) |
| 4-Person Households | 1,430 (6.4%) | 0 (0.0%) |
| 5-Person Households | 1,150 (5.1%) | 0 (0.0%) |
| 6-Person Households | 624 (2.8%) | 0 (0.0%) |
| 7+ Person Households | 270 (1.2%) | 0 (0.0%) |
| Total | 16,015 (71.2%) | 6,472 (28.8%) |
Female Fertility in Loudon County
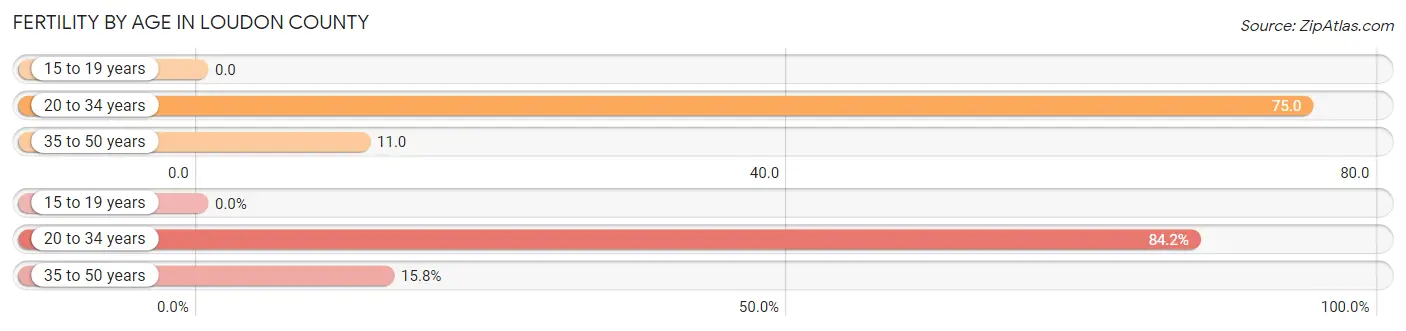
Fertility by Age in Loudon County
Average fertility rate in Loudon County is 34.0 births per 1,000 women. Women in the age bracket of 20 to 34 years have the highest fertility rate with 75.0 births per 1,000 women. Women in the age bracket of 20 to 34 years acount for 84.2% of all women with births.
| Age Bracket | Women with Births | Births / 1,000 Women |
| 15 to 19 years | 0 (0.0%) | 0.0 |
| 20 to 34 years | 288 (84.2%) | 75.0 |
| 35 to 50 years | 54 (15.8%) | 11.0 |
| Total | 342 (100.0%) | 34.0 |
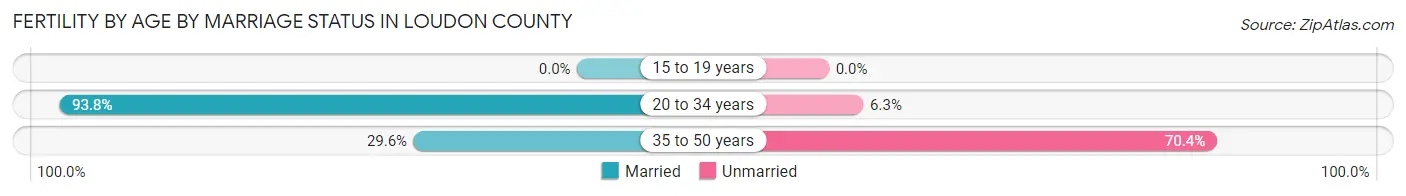
Fertility by Age by Marriage Status in Loudon County
83.6% of women with births (342) in Loudon County are married. The highest percentage of unmarried women with births falls into 35 to 50 years age bracket with 70.4% of them unmarried at the time of birth, while the lowest percentage of unmarried women with births belong to 20 to 34 years age bracket with 6.2% of them unmarried.
| Age Bracket | Married | Unmarried |
| 15 to 19 years | 0 (0.0%) | 0 (0.0%) |
| 20 to 34 years | 270 (93.8%) | 18 (6.2%) |
| 35 to 50 years | 16 (29.6%) | 38 (70.4%) |
| Total | 286 (83.6%) | 56 (16.4%) |
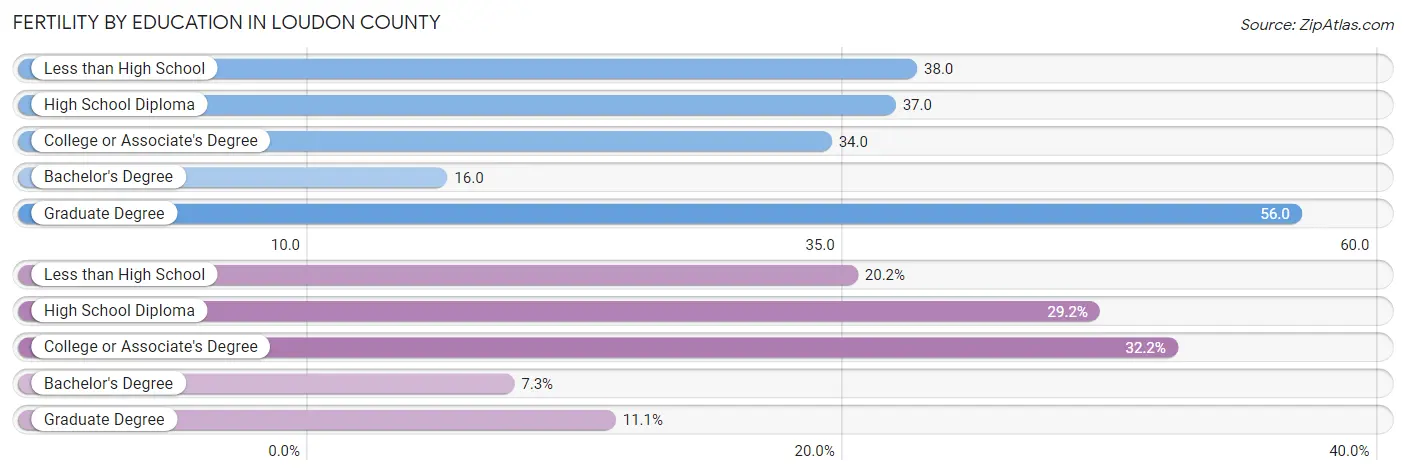
Fertility by Education in Loudon County
Average fertility rate in Loudon County is 34.0 births per 1,000 women. Women with the education attainment of graduate degree have the highest fertility rate of 56.0 births per 1,000 women, while women with the education attainment of bachelor's degree have the lowest fertility at 16.0 births per 1,000 women. Women with the education attainment of college or associate's degree represent 32.2% of all women with births.
| Educational Attainment | Women with Births | Births / 1,000 Women |
| Less than High School | 69 (20.2%) | 38.0 |
| High School Diploma | 100 (29.2%) | 37.0 |
| College or Associate's Degree | 110 (32.2%) | 34.0 |
| Bachelor's Degree | 25 (7.3%) | 16.0 |
| Graduate Degree | 38 (11.1%) | 56.0 |
| Total | 342 (100.0%) | 34.0 |
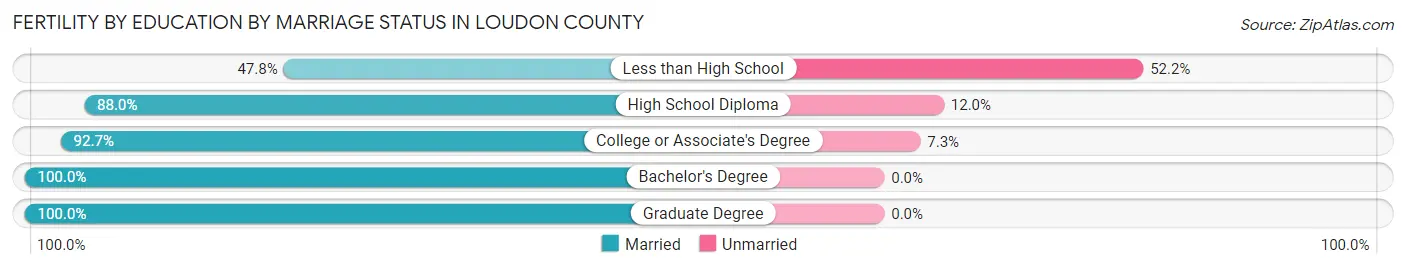
Fertility by Education by Marriage Status in Loudon County
16.4% of women with births in Loudon County are unmarried. Women with the educational attainment of bachelor's degree are most likely to be married with 100.0% of them married at childbirth, while women with the educational attainment of less than high school are least likely to be married with 52.2% of them unmarried at childbirth.
| Educational Attainment | Married | Unmarried |
| Less than High School | 33 (47.8%) | 36 (52.2%) |
| High School Diploma | 88 (88.0%) | 12 (12.0%) |
| College or Associate's Degree | 102 (92.7%) | 8 (7.3%) |
| Bachelor's Degree | 25 (100.0%) | 0 (0.0%) |
| Graduate Degree | 38 (100.0%) | 0 (0.0%) |
| Total | 286 (83.6%) | 56 (16.4%) |
Income in Loudon County
Income Overview in Loudon County
Per Capita Income in Loudon County is $40,425, while median incomes of families and households are $87,660 and $75,008 respectively.
| Characteristic | Number | Measure |
| Per Capita Income | 55,507 | $40,425 |
| Median Family Income | 16,015 | $87,660 |
| Mean Family Income | 16,015 | $111,238 |
| Median Household Income | 22,487 | $75,008 |
| Mean Household Income | 22,487 | $96,654 |
| Income Deficit | 16,015 | $9,659 |
| Wage / Income Gap (%) | 55,507 | 34.51% |
| Wage / Income Gap ($) | 55,507 | 65.49¢ per $1 |
| Gini / Inequality Index | 55,507 | 0.45 |
Earnings by Sex in Loudon County
Average Earnings in Loudon County are $37,432, $45,601 for men and $29,865 for women, a difference of 34.5%.
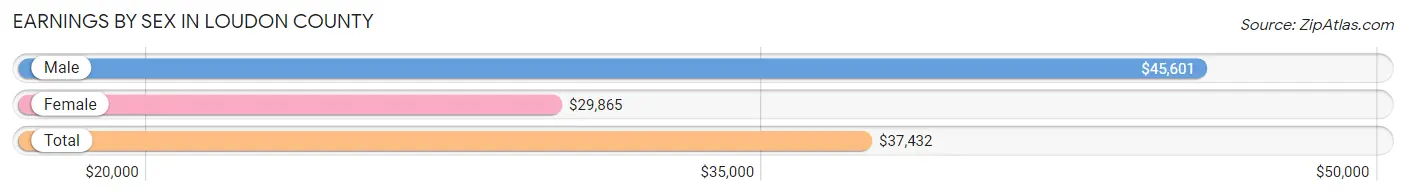
| Sex | Number | Average Earnings |
| Male | 13,906 (53.0%) | $45,601 |
| Female | 12,342 (47.0%) | $29,865 |
| Total | 26,248 (100.0%) | $37,432 |
Earnings by Sex by Income Bracket in Loudon County
The most common earnings brackets in Loudon County are $100,000+ for men (2,254 | 16.2%) and $25,000 to $29,999 for women (1,058 | 8.6%).
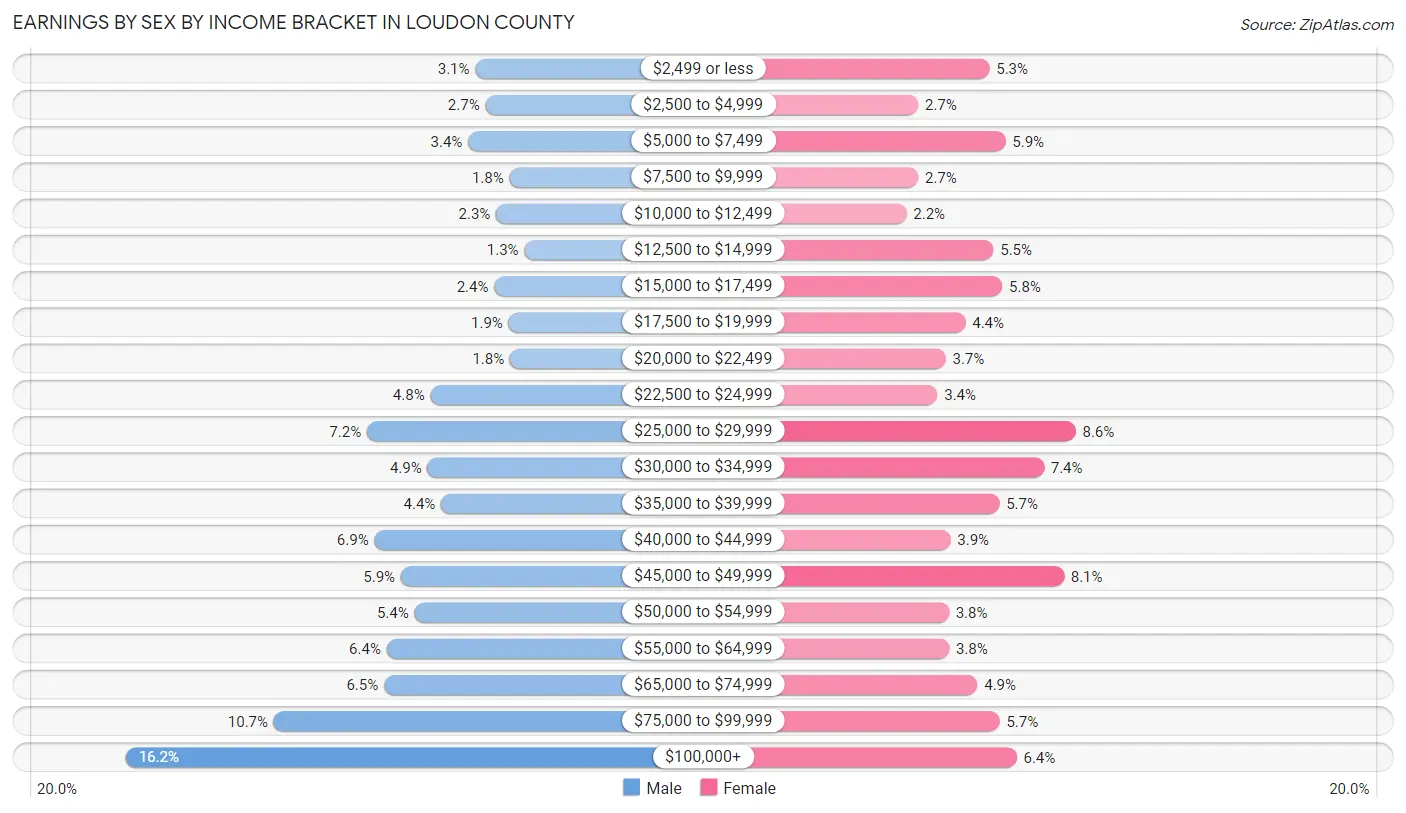
| Income | Male | Female |
| $2,499 or less | 433 (3.1%) | 659 (5.3%) |
| $2,500 to $4,999 | 380 (2.7%) | 330 (2.7%) |
| $5,000 to $7,499 | 470 (3.4%) | 733 (5.9%) |
| $7,500 to $9,999 | 255 (1.8%) | 329 (2.7%) |
| $10,000 to $12,499 | 324 (2.3%) | 275 (2.2%) |
| $12,500 to $14,999 | 176 (1.3%) | 677 (5.5%) |
| $15,000 to $17,499 | 334 (2.4%) | 718 (5.8%) |
| $17,500 to $19,999 | 259 (1.9%) | 548 (4.4%) |
| $20,000 to $22,499 | 252 (1.8%) | 457 (3.7%) |
| $22,500 to $24,999 | 666 (4.8%) | 419 (3.4%) |
| $25,000 to $29,999 | 997 (7.2%) | 1,058 (8.6%) |
| $30,000 to $34,999 | 682 (4.9%) | 911 (7.4%) |
| $35,000 to $39,999 | 611 (4.4%) | 705 (5.7%) |
| $40,000 to $44,999 | 958 (6.9%) | 479 (3.9%) |
| $45,000 to $49,999 | 821 (5.9%) | 1,004 (8.1%) |
| $50,000 to $54,999 | 750 (5.4%) | 472 (3.8%) |
| $55,000 to $64,999 | 894 (6.4%) | 473 (3.8%) |
| $65,000 to $74,999 | 908 (6.5%) | 604 (4.9%) |
| $75,000 to $99,999 | 1,482 (10.7%) | 706 (5.7%) |
| $100,000+ | 2,254 (16.2%) | 785 (6.4%) |
| Total | 13,906 (100.0%) | 12,342 (100.0%) |
Earnings by Sex by Educational Attainment in Loudon County
Average earnings in Loudon County are $50,140 for men and $32,928 for women, a difference of 34.3%. Men with an educational attainment of graduate degree enjoy the highest average annual earnings of $84,038, while those with less than high school education earn the least with $30,183. Women with an educational attainment of graduate degree earn the most with the average annual earnings of $67,589, while those with less than high school education have the smallest earnings of $18,671.
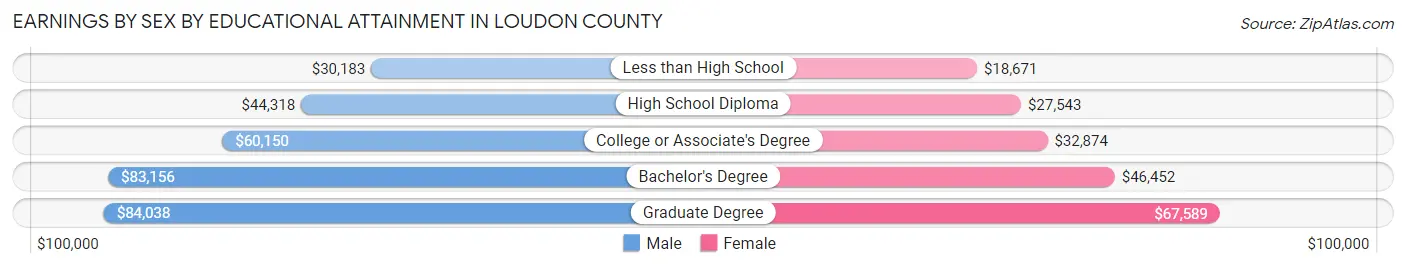
| Educational Attainment | Male Income | Female Income |
| Less than High School | $30,183 | $18,671 |
| High School Diploma | $44,318 | $27,543 |
| College or Associate's Degree | $60,150 | $32,874 |
| Bachelor's Degree | $83,156 | $46,452 |
| Graduate Degree | $84,038 | $67,589 |
| Total | $50,140 | $32,928 |
Family Income in Loudon County
Family Income Brackets in Loudon County
According to the Loudon County family income data, there are 3,619 families falling into the $100,000 to $149,999 income range, which is the most common income bracket and makes up 22.6% of all families. Conversely, the $10,000 to $14,999 income bracket is the least frequent group with only 144 families (0.9%) belonging to this category.
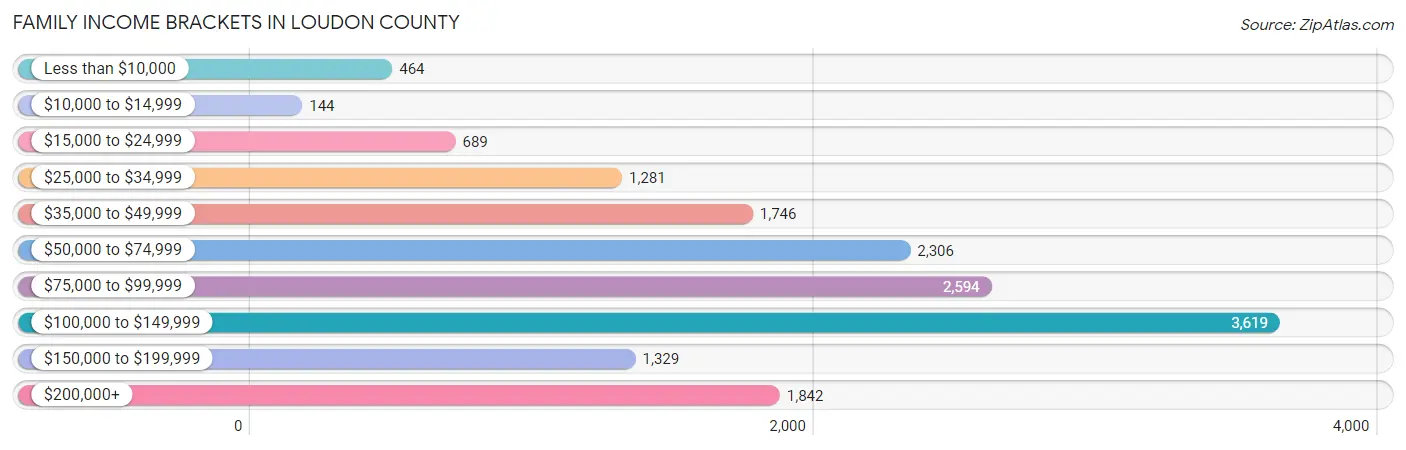
| Income Bracket | # Families | % Families |
| Less than $10,000 | 464 | 2.9% |
| $10,000 to $14,999 | 144 | 0.9% |
| $15,000 to $24,999 | 689 | 4.3% |
| $25,000 to $34,999 | 1,281 | 8.0% |
| $35,000 to $49,999 | 1,746 | 10.9% |
| $50,000 to $74,999 | 2,306 | 14.4% |
| $75,000 to $99,999 | 2,594 | 16.2% |
| $100,000 to $149,999 | 3,619 | 22.6% |
| $150,000 to $199,999 | 1,329 | 8.3% |
| $200,000+ | 1,842 | 11.5% |
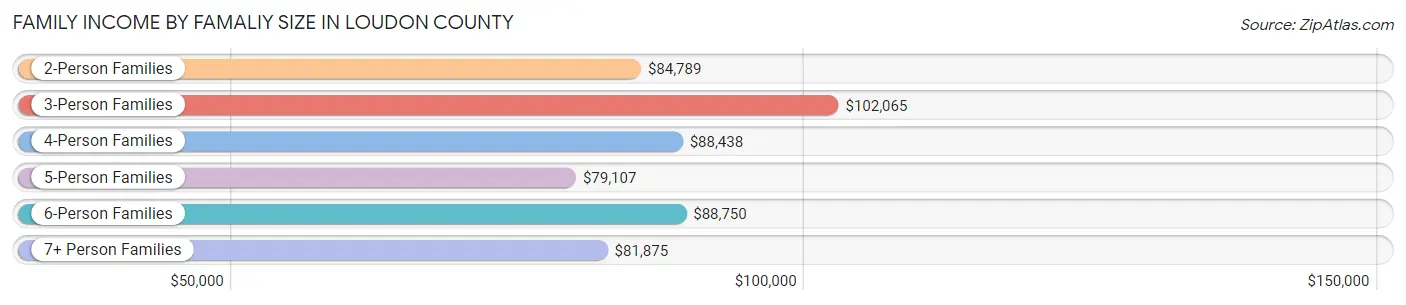
Family Income by Famaliy Size in Loudon County
3-person families (2,760 | 17.2%) account for the highest median family income in Loudon County with $102,065 per family, while 2-person families (9,893 | 61.8%) have the highest median income of $42,394 per family member.
| Income Bracket | # Families | Median Income |
| 2-Person Families | 9,893 (61.8%) | $84,789 |
| 3-Person Families | 2,760 (17.2%) | $102,065 |
| 4-Person Families | 1,533 (9.6%) | $88,438 |
| 5-Person Families | 1,023 (6.4%) | $79,107 |
| 6-Person Families | 584 (3.6%) | $88,750 |
| 7+ Person Families | 222 (1.4%) | $81,875 |
| Total | 16,015 (100.0%) | $87,660 |
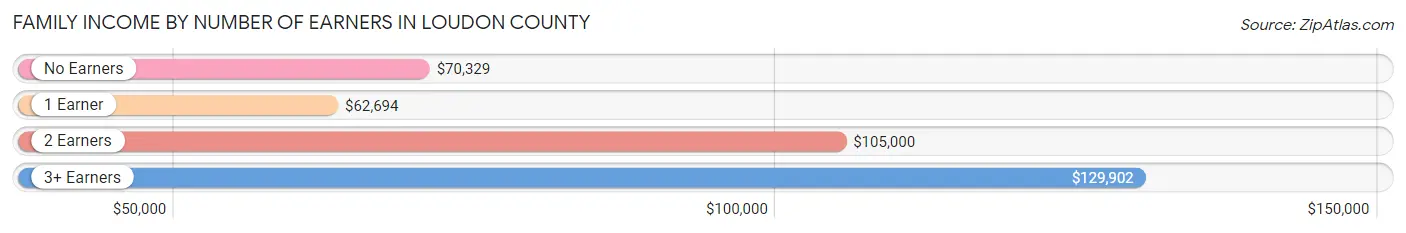
Family Income by Number of Earners in Loudon County
The median family income in Loudon County is $87,660, with families comprising 3+ earners (1,218) having the highest median family income of $129,902, while families with 1 earner (4,490) have the lowest median family income of $62,694, accounting for 7.6% and 28.0% of families, respectively.
| Number of Earners | # Families | Median Income |
| No Earners | 4,263 (26.6%) | $70,329 |
| 1 Earner | 4,490 (28.0%) | $62,694 |
| 2 Earners | 6,044 (37.7%) | $105,000 |
| 3+ Earners | 1,218 (7.6%) | $129,902 |
| Total | 16,015 (100.0%) | $87,660 |
Household Income in Loudon County
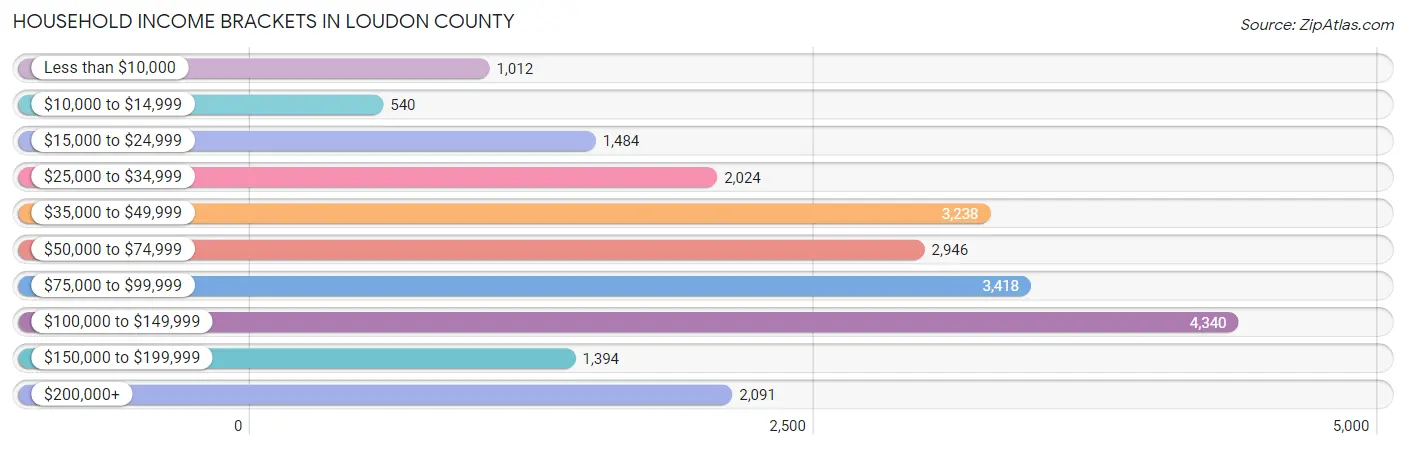
Household Income Brackets in Loudon County
With 4,340 households falling in the category, the $100,000 to $149,999 income range is the most frequent in Loudon County, accounting for 19.3% of all households. In contrast, only 540 households (2.4%) fall into the $10,000 to $14,999 income bracket, making it the least populous group.
| Income Bracket | # Households | % Households |
| Less than $10,000 | 1,012 | 4.5% |
| $10,000 to $14,999 | 540 | 2.4% |
| $15,000 to $24,999 | 1,484 | 6.6% |
| $25,000 to $34,999 | 2,024 | 9.0% |
| $35,000 to $49,999 | 3,238 | 14.4% |
| $50,000 to $74,999 | 2,946 | 13.1% |
| $75,000 to $99,999 | 3,418 | 15.2% |
| $100,000 to $149,999 | 4,340 | 19.3% |
| $150,000 to $199,999 | 1,394 | 6.2% |
| $200,000+ | 2,091 | 9.3% |
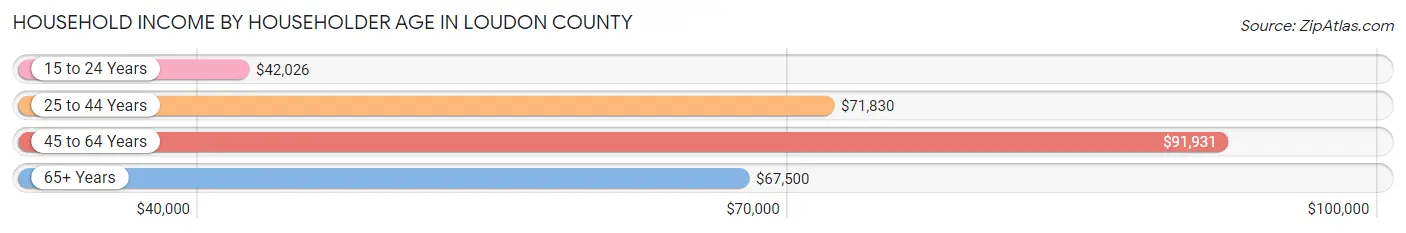
Household Income by Householder Age in Loudon County
The median household income in Loudon County is $75,008, with the highest median household income of $91,931 found in the 45 to 64 years age bracket for the primary householder. A total of 8,227 households (36.6%) fall into this category. Meanwhile, the 15 to 24 years age bracket for the primary householder has the lowest median household income of $42,026, with 405 households (1.8%) in this group.
| Income Bracket | # Households | Median Income |
| 15 to 24 Years | 405 (1.8%) | $42,026 |
| 25 to 44 Years | 4,653 (20.7%) | $71,830 |
| 45 to 64 Years | 8,227 (36.6%) | $91,931 |
| 65+ Years | 9,202 (40.9%) | $67,500 |
| Total | 22,487 (100.0%) | $75,008 |
Poverty in Loudon County
Income Below Poverty by Sex and Age in Loudon County
With 11.5% poverty level for males and 12.1% for females among the residents of Loudon County, 12 to 14 year old males and 15 year old females are the most vulnerable to poverty, with 306 males (33.1%) and 131 females (37.0%) in their respective age groups living below the poverty level.
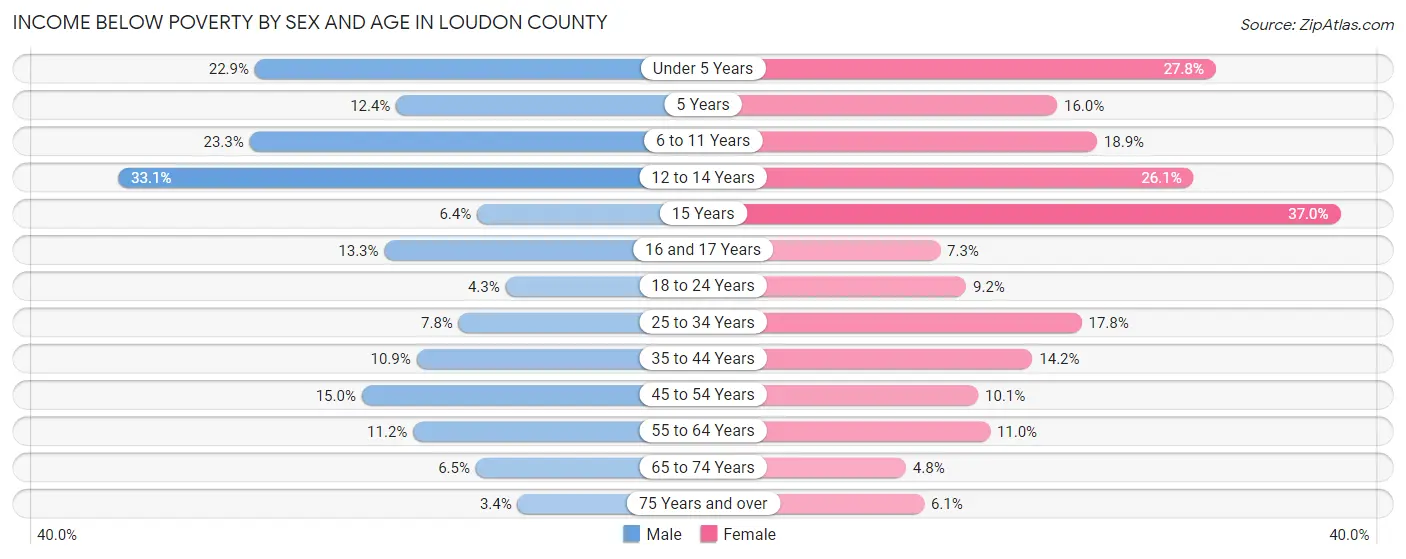
| Age Bracket | Male | Female |
| Under 5 Years | 328 (22.9%) | 314 (27.8%) |
| 5 Years | 51 (12.4%) | 35 (16.0%) |
| 6 to 11 Years | 421 (23.3%) | 316 (18.9%) |
| 12 to 14 Years | 306 (33.1%) | 294 (26.1%) |
| 15 Years | 23 (6.4%) | 131 (37.0%) |
| 16 and 17 Years | 76 (13.3%) | 39 (7.3%) |
| 18 to 24 Years | 79 (4.3%) | 175 (9.2%) |
| 25 to 34 Years | 208 (7.8%) | 429 (17.8%) |
| 35 to 44 Years | 297 (10.9%) | 411 (14.1%) |
| 45 to 54 Years | 519 (15.0%) | 353 (10.1%) |
| 55 to 64 Years | 453 (11.2%) | 481 (11.0%) |
| 65 to 74 Years | 271 (6.5%) | 222 (4.8%) |
| 75 Years and over | 94 (3.4%) | 193 (6.1%) |
| Total | 3,126 (11.5%) | 3,393 (12.1%) |
Income Above Poverty by Sex and Age in Loudon County
According to the poverty statistics in Loudon County, males aged 75 years and over and females aged 65 to 74 years are the age groups that are most secure financially, with 96.6% of males and 95.2% of females in these age groups living above the poverty line.
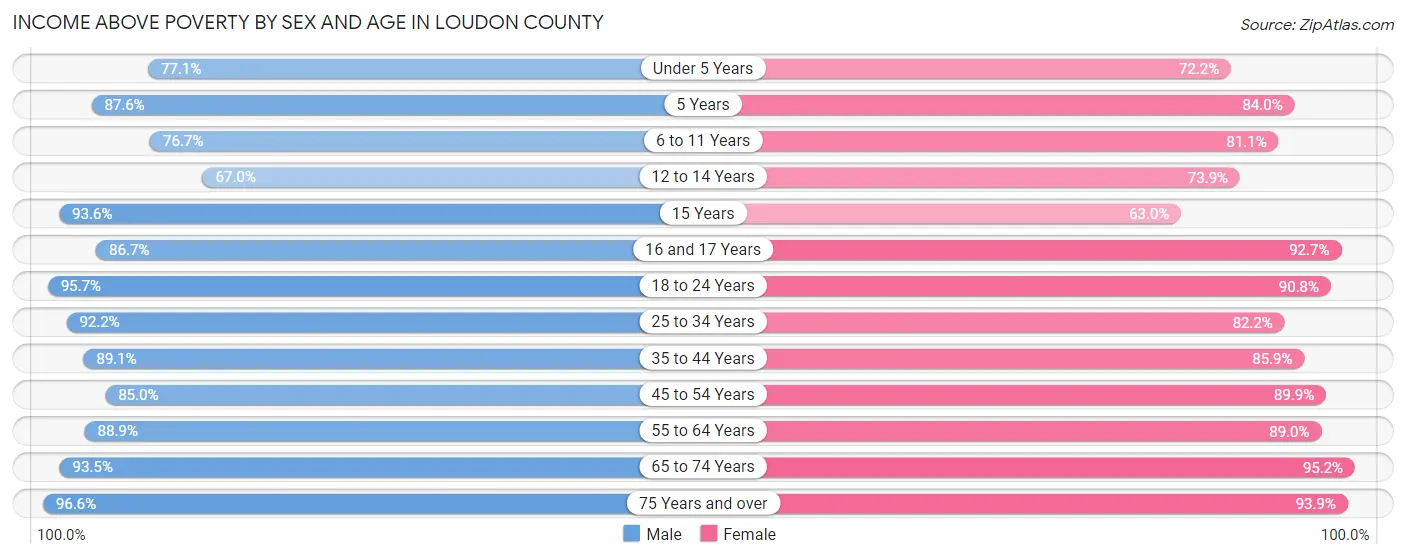
| Age Bracket | Male | Female |
| Under 5 Years | 1,104 (77.1%) | 817 (72.2%) |
| 5 Years | 360 (87.6%) | 184 (84.0%) |
| 6 to 11 Years | 1,386 (76.7%) | 1,352 (81.1%) |
| 12 to 14 Years | 620 (66.9%) | 832 (73.9%) |
| 15 Years | 336 (93.6%) | 223 (63.0%) |
| 16 and 17 Years | 496 (86.7%) | 495 (92.7%) |
| 18 to 24 Years | 1,763 (95.7%) | 1,720 (90.8%) |
| 25 to 34 Years | 2,470 (92.2%) | 1,981 (82.2%) |
| 35 to 44 Years | 2,428 (89.1%) | 2,494 (85.9%) |
| 45 to 54 Years | 2,949 (85.0%) | 3,135 (89.9%) |
| 55 to 64 Years | 3,610 (88.8%) | 3,891 (89.0%) |
| 65 to 74 Years | 3,897 (93.5%) | 4,439 (95.2%) |
| 75 Years and over | 2,668 (96.6%) | 2,971 (93.9%) |
| Total | 24,087 (88.5%) | 24,534 (87.8%) |
Income Below Poverty Among Married-Couple Families in Loudon County
The poverty statistics for married-couple families in Loudon County show that 6.1% or 795 of the total 13,069 families live below the poverty line. Families with 3 or 4 children have the highest poverty rate of 41.8%, comprising of 461 families. On the other hand, families with 1 or 2 children have the lowest poverty rate of 1.0%, which includes 24 families.
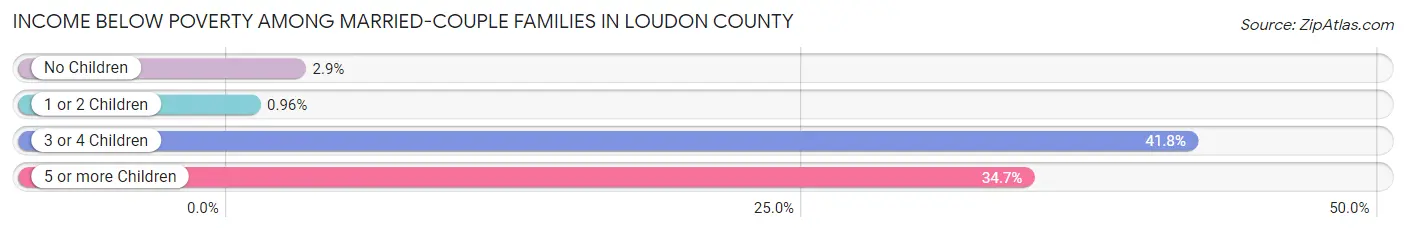
| Children | Above Poverty | Below Poverty |
| No Children | 9,092 (97.1%) | 275 (2.9%) |
| 1 or 2 Children | 2,473 (99.0%) | 24 (1.0%) |
| 3 or 4 Children | 643 (58.2%) | 461 (41.8%) |
| 5 or more Children | 66 (65.3%) | 35 (34.6%) |
| Total | 12,274 (93.9%) | 795 (6.1%) |
Income Below Poverty Among Single-Parent Households in Loudon County
According to the poverty data in Loudon County, 14.6% or 167 single-father households and 23.9% or 431 single-mother households are living below the poverty line. Among single-father households, those with 3 or 4 children have the highest poverty rate, with 54 households (58.7%) experiencing poverty. Likewise, among single-mother households, those with 1 or 2 children have the highest poverty rate, with 304 households (50.2%) falling below the poverty line.
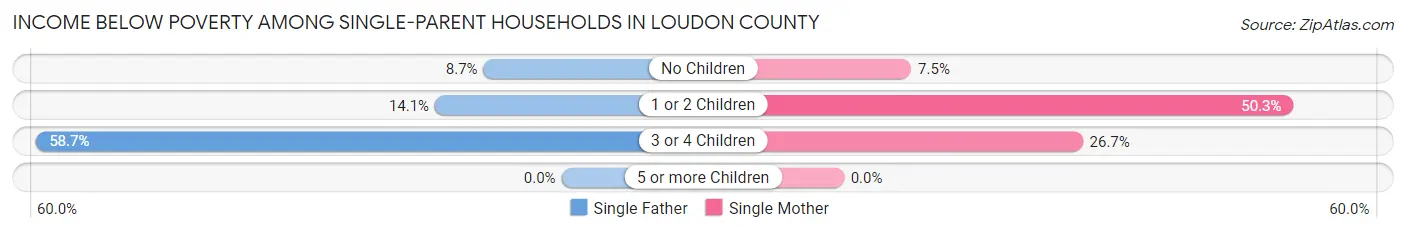
| Children | Single Father | Single Mother |
| No Children | 57 (8.7%) | 76 (7.5%) |
| 1 or 2 Children | 56 (14.1%) | 304 (50.2%) |
| 3 or 4 Children | 54 (58.7%) | 51 (26.7%) |
| 5 or more Children | 0 (0.0%) | 0 (0.0%) |
| Total | 167 (14.6%) | 431 (23.9%) |
Income Below Poverty Among Married-Couple vs Single-Parent Households in Loudon County
The poverty data for Loudon County shows that 795 of the married-couple family households (6.1%) and 598 of the single-parent households (20.3%) are living below the poverty level. Within the married-couple family households, those with 3 or 4 children have the highest poverty rate, with 461 households (41.8%) falling below the poverty line. Among the single-parent households, those with 3 or 4 children have the highest poverty rate, with 105 household (37.1%) living below poverty.
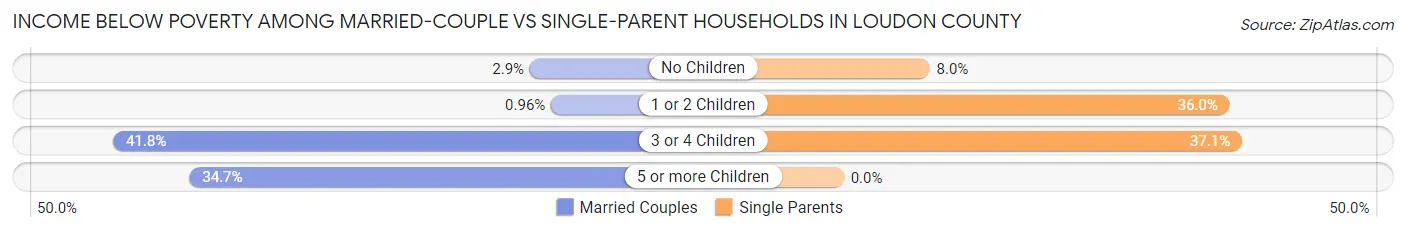
| Children | Married-Couple Families | Single-Parent Households |
| No Children | 275 (2.9%) | 133 (8.0%) |
| 1 or 2 Children | 24 (1.0%) | 360 (36.0%) |
| 3 or 4 Children | 461 (41.8%) | 105 (37.1%) |
| 5 or more Children | 35 (34.6%) | 0 (0.0%) |
| Total | 795 (6.1%) | 598 (20.3%) |
Employment Characteristics in Loudon County
Employment by Class of Employer in Loudon County
Among the 24,262 employed individuals in Loudon County, private company employees (17,045 | 70.3%), not-for-profit organizations (1,815 | 7.5%), and local government employees (1,541 | 6.4%) make up the most common classes of employment.
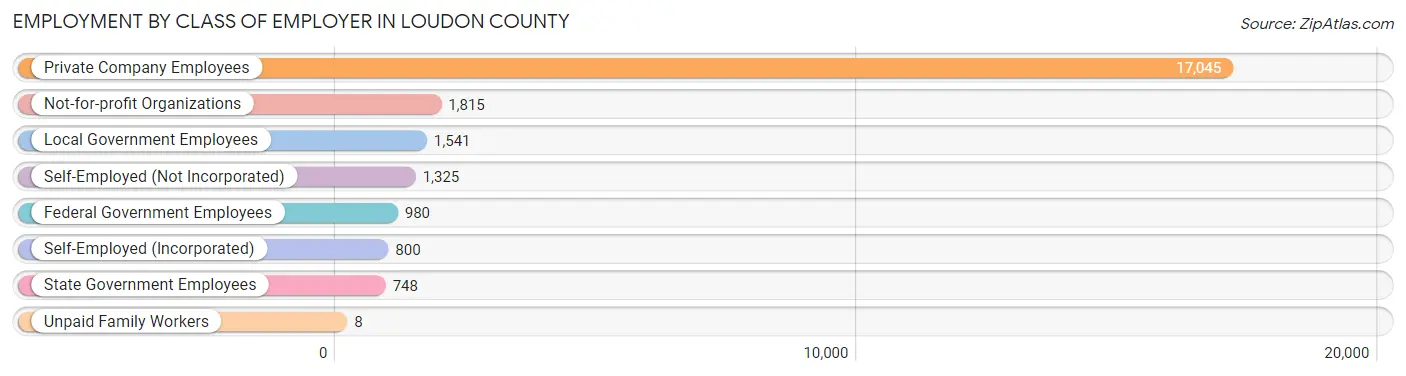
| Employer Class | # Employees | % Employees |
| Private Company Employees | 17,045 | 70.3% |
| Self-Employed (Incorporated) | 800 | 3.3% |
| Self-Employed (Not Incorporated) | 1,325 | 5.5% |
| Not-for-profit Organizations | 1,815 | 7.5% |
| Local Government Employees | 1,541 | 6.4% |
| State Government Employees | 748 | 3.1% |
| Federal Government Employees | 980 | 4.0% |
| Unpaid Family Workers | 8 | 0.0% |
| Total | 24,262 | 100.0% |
Employment Status by Age in Loudon County
According to the labor force statistics for Loudon County, out of the total population over 16 years of age (46,005), 54.9% or 25,257 individuals are in the labor force, with 3.0% or 758 of them unemployed. The age group with the highest labor force participation rate is 25 to 29 years, with 87.0% or 2,299 individuals in the labor force. Within the labor force, the 20 to 24 years age range has the highest percentage of unemployed individuals, with 6.8% or 148 of them being unemployed.
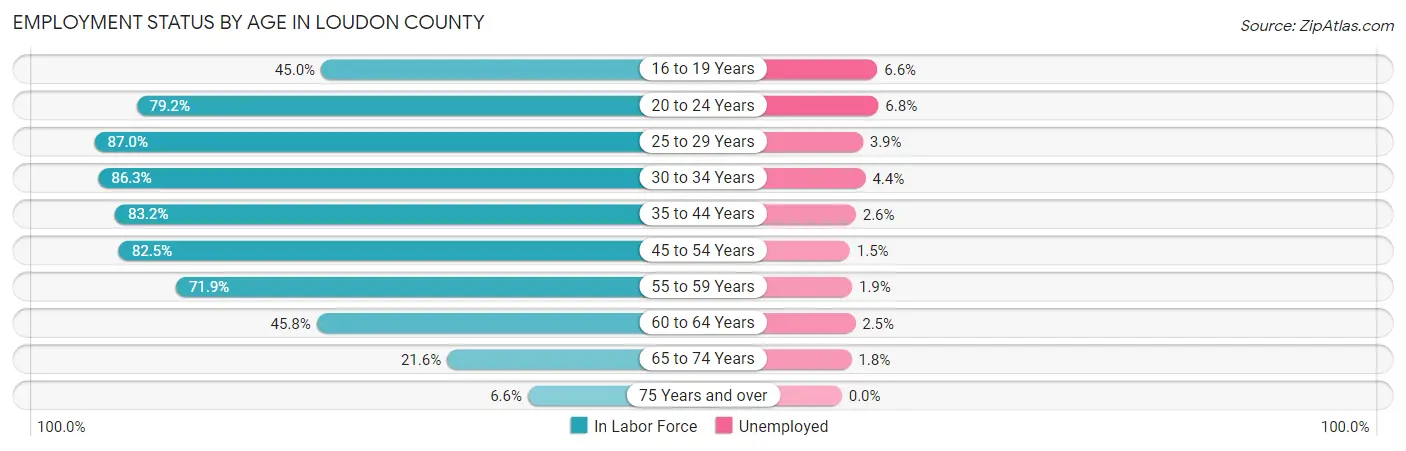
| Age Bracket | In Labor Force | Unemployed |
| 16 to 19 Years | 953 (45.0%) | 63 (6.6%) |
| 20 to 24 Years | 2,178 (79.2%) | 148 (6.8%) |
| 25 to 29 Years | 2,299 (87.0%) | 90 (3.9%) |
| 30 to 34 Years | 2,142 (86.3%) | 94 (4.4%) |
| 35 to 44 Years | 4,689 (83.2%) | 122 (2.6%) |
| 45 to 54 Years | 5,741 (82.5%) | 86 (1.5%) |
| 55 to 59 Years | 2,892 (71.9%) | 55 (1.9%) |
| 60 to 64 Years | 2,039 (45.8%) | 51 (2.5%) |
| 65 to 74 Years | 1,920 (21.6%) | 35 (1.8%) |
| 75 Years and over | 399 (6.6%) | 0 (0.0%) |
| Total | 25,257 (54.9%) | 758 (3.0%) |
Employment Status by Educational Attainment in Loudon County
According to labor force statistics for Loudon County, 75.6% of individuals (19,803) out of the total population between 25 and 64 years of age (26,194) are in the labor force, with 2.5% or 495 of them being unemployed. The group with the highest labor force participation rate are those with the educational attainment of bachelor's degree or higher, with 80.0% or 5,294 individuals in the labor force. Within the labor force, individuals with less than high school education have the highest percentage of unemployment, with 4.5% or 97 of them being unemployed.
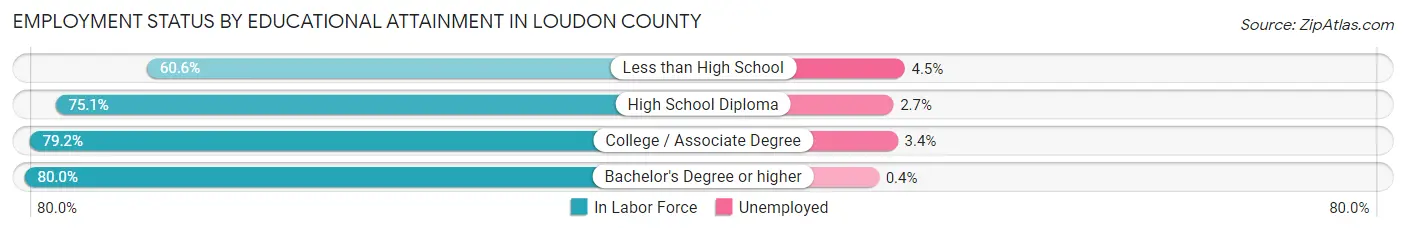
| Educational Attainment | In Labor Force | Unemployed |
| Less than High School | 2,153 (60.6%) | 160 (4.5%) |
| High School Diploma | 6,210 (75.1%) | 223 (2.7%) |
| College / Associate Degree | 6,141 (79.2%) | 264 (3.4%) |
| Bachelor's Degree or higher | 5,294 (80.0%) | 26 (0.4%) |
| Total | 19,803 (75.6%) | 655 (2.5%) |
Employment Occupations by Sex in Loudon County
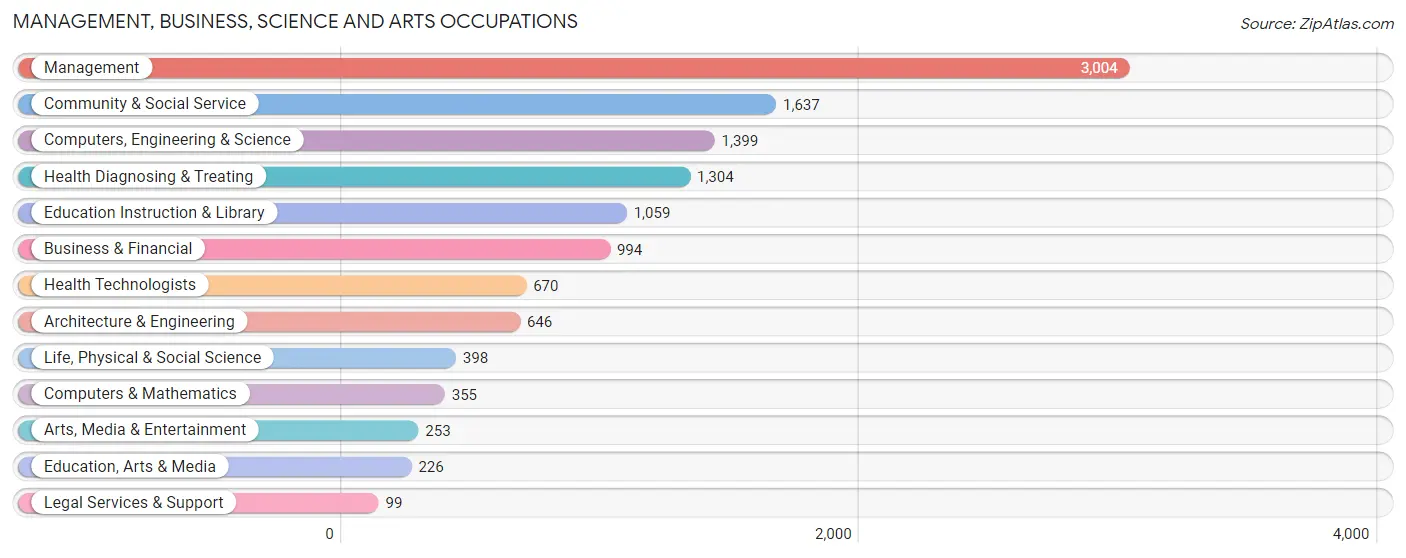
Management, Business, Science and Arts Occupations
The most common Management, Business, Science and Arts occupations in Loudon County are Management (3,004 | 12.3%), Community & Social Service (1,637 | 6.7%), Computers, Engineering & Science (1,399 | 5.7%), Health Diagnosing & Treating (1,304 | 5.3%), and Education Instruction & Library (1,059 | 4.3%).
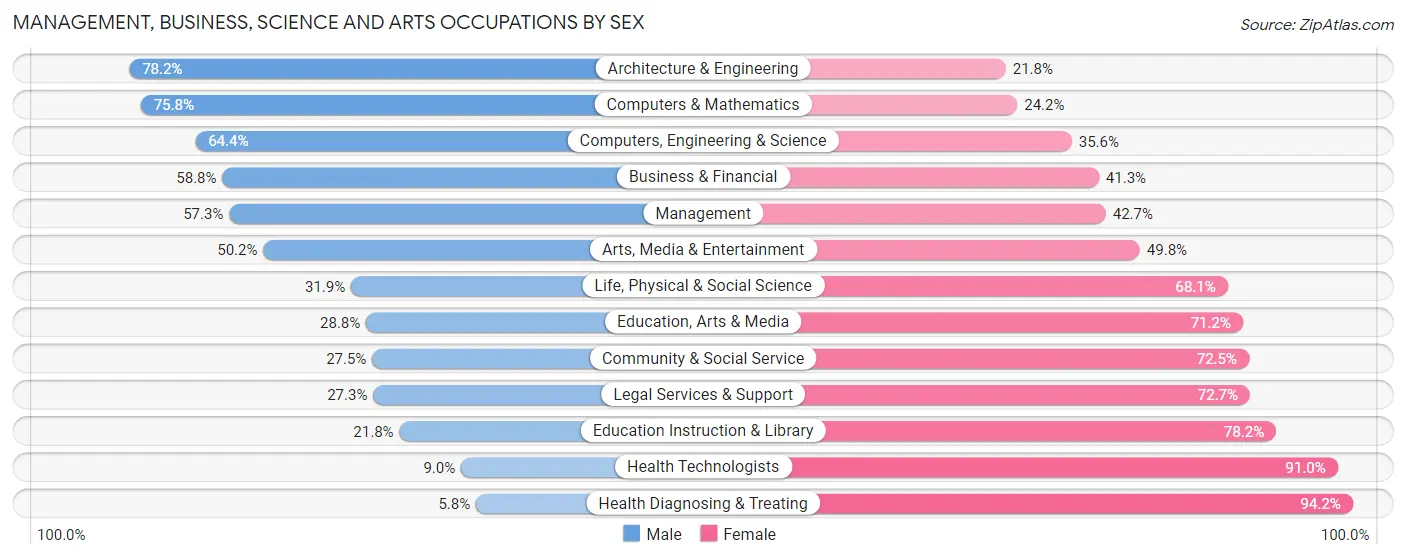
Management, Business, Science and Arts Occupations by Sex
Within the Management, Business, Science and Arts occupations in Loudon County, the most male-oriented occupations are Architecture & Engineering (78.2%), Computers & Mathematics (75.8%), and Computers, Engineering & Science (64.4%), while the most female-oriented occupations are Health Diagnosing & Treating (94.2%), Health Technologists (91.0%), and Education Instruction & Library (78.2%).
| Occupation | Male | Female |
| Management | 1,722 (57.3%) | 1,282 (42.7%) |
| Business & Financial | 584 (58.8%) | 410 (41.2%) |
| Computers, Engineering & Science | 901 (64.4%) | 498 (35.6%) |
| Computers & Mathematics | 269 (75.8%) | 86 (24.2%) |
| Architecture & Engineering | 505 (78.2%) | 141 (21.8%) |
| Life, Physical & Social Science | 127 (31.9%) | 271 (68.1%) |
| Community & Social Service | 450 (27.5%) | 1,187 (72.5%) |
| Education, Arts & Media | 65 (28.8%) | 161 (71.2%) |
| Legal Services & Support | 27 (27.3%) | 72 (72.7%) |
| Education Instruction & Library | 231 (21.8%) | 828 (78.2%) |
| Arts, Media & Entertainment | 127 (50.2%) | 126 (49.8%) |
| Health Diagnosing & Treating | 76 (5.8%) | 1,228 (94.2%) |
| Health Technologists | 60 (9.0%) | 610 (91.0%) |
| Total (Category) | 3,733 (44.8%) | 4,605 (55.2%) |
| Total (Overall) | 13,148 (53.8%) | 11,286 (46.2%) |
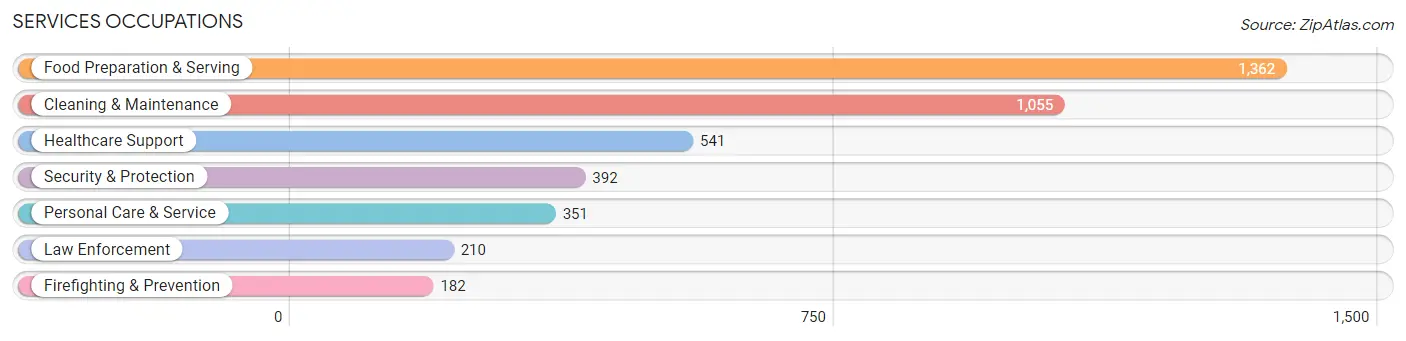
Services Occupations
The most common Services occupations in Loudon County are Food Preparation & Serving (1,362 | 5.6%), Cleaning & Maintenance (1,055 | 4.3%), Healthcare Support (541 | 2.2%), Security & Protection (392 | 1.6%), and Personal Care & Service (351 | 1.4%).
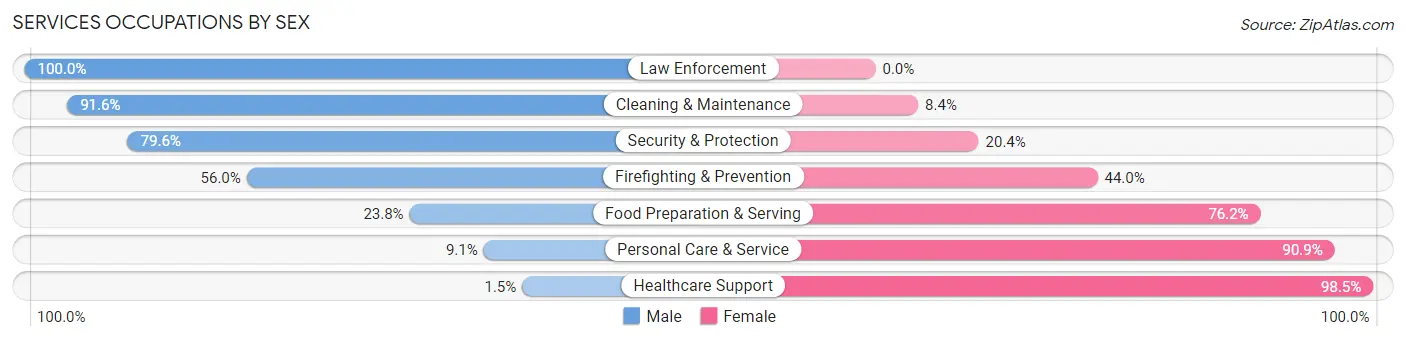
Services Occupations by Sex
Within the Services occupations in Loudon County, the most male-oriented occupations are Law Enforcement (100.0%), Cleaning & Maintenance (91.6%), and Security & Protection (79.6%), while the most female-oriented occupations are Healthcare Support (98.5%), Personal Care & Service (90.9%), and Food Preparation & Serving (76.2%).
| Occupation | Male | Female |
| Healthcare Support | 8 (1.5%) | 533 (98.5%) |
| Security & Protection | 312 (79.6%) | 80 (20.4%) |
| Firefighting & Prevention | 102 (56.0%) | 80 (44.0%) |
| Law Enforcement | 210 (100.0%) | 0 (0.0%) |
| Food Preparation & Serving | 324 (23.8%) | 1,038 (76.2%) |
| Cleaning & Maintenance | 966 (91.6%) | 89 (8.4%) |
| Personal Care & Service | 32 (9.1%) | 319 (90.9%) |
| Total (Category) | 1,642 (44.4%) | 2,059 (55.6%) |
| Total (Overall) | 13,148 (53.8%) | 11,286 (46.2%) |
Sales and Office Occupations
The most common Sales and Office occupations in Loudon County are Office & Administration (3,090 | 12.7%), and Sales & Related (2,215 | 9.1%).

Sales and Office Occupations by Sex

| Occupation | Male | Female |
| Sales & Related | 1,050 (47.4%) | 1,165 (52.6%) |
| Office & Administration | 898 (29.1%) | 2,192 (70.9%) |
| Total (Category) | 1,948 (36.7%) | 3,357 (63.3%) |
| Total (Overall) | 13,148 (53.8%) | 11,286 (46.2%) |
Natural Resources, Construction and Maintenance Occupations
The most common Natural Resources, Construction and Maintenance occupations in Loudon County are Construction & Extraction (1,268 | 5.2%), Installation, Maintenance & Repair (750 | 3.1%), and Farming, Fishing & Forestry (412 | 1.7%).
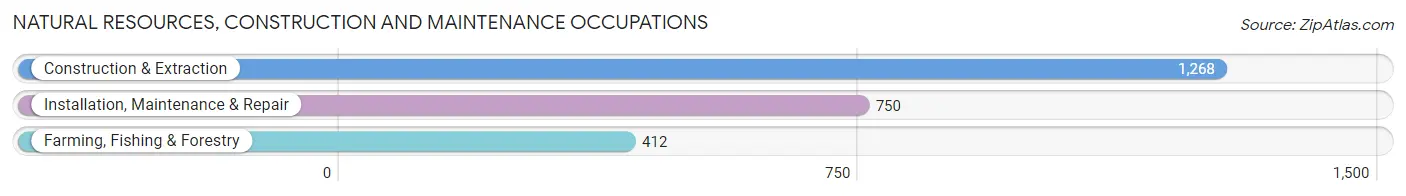
Natural Resources, Construction and Maintenance Occupations by Sex

| Occupation | Male | Female |
| Farming, Fishing & Forestry | 230 (55.8%) | 182 (44.2%) |
| Construction & Extraction | 1,221 (96.3%) | 47 (3.7%) |
| Installation, Maintenance & Repair | 750 (100.0%) | 0 (0.0%) |
| Total (Category) | 2,201 (90.6%) | 229 (9.4%) |
| Total (Overall) | 13,148 (53.8%) | 11,286 (46.2%) |
Production, Transportation and Moving Occupations
The most common Production, Transportation and Moving occupations in Loudon County are Production (2,451 | 10.0%), Material Moving (1,123 | 4.6%), and Transportation (1,086 | 4.4%).
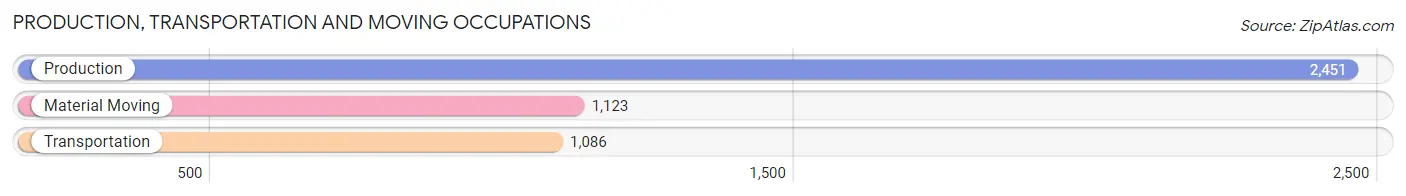
Production, Transportation and Moving Occupations by Sex
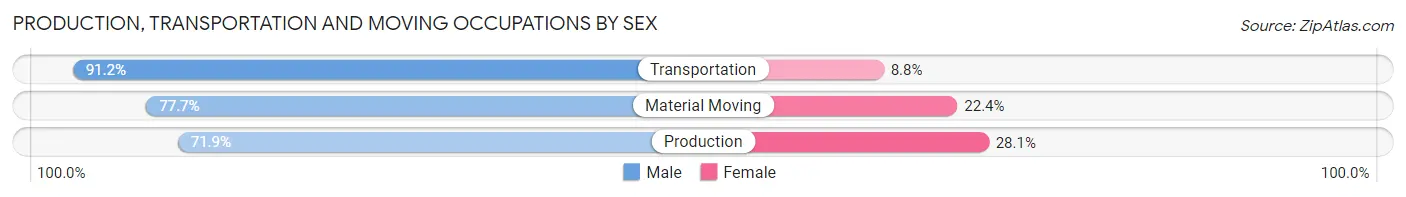
| Occupation | Male | Female |
| Production | 1,762 (71.9%) | 689 (28.1%) |
| Transportation | 990 (91.2%) | 96 (8.8%) |
| Material Moving | 872 (77.6%) | 251 (22.4%) |
| Total (Category) | 3,624 (77.8%) | 1,036 (22.2%) |
| Total (Overall) | 13,148 (53.8%) | 11,286 (46.2%) |
Employment Industries by Sex in Loudon County
Employment Industries in Loudon County
The major employment industries in Loudon County include Manufacturing (4,043 | 16.6%), Retail Trade (3,301 | 13.5%), Health Care & Social Assistance (2,678 | 11.0%), Professional & Scientific (1,710 | 7.0%), and Construction (1,658 | 6.8%).
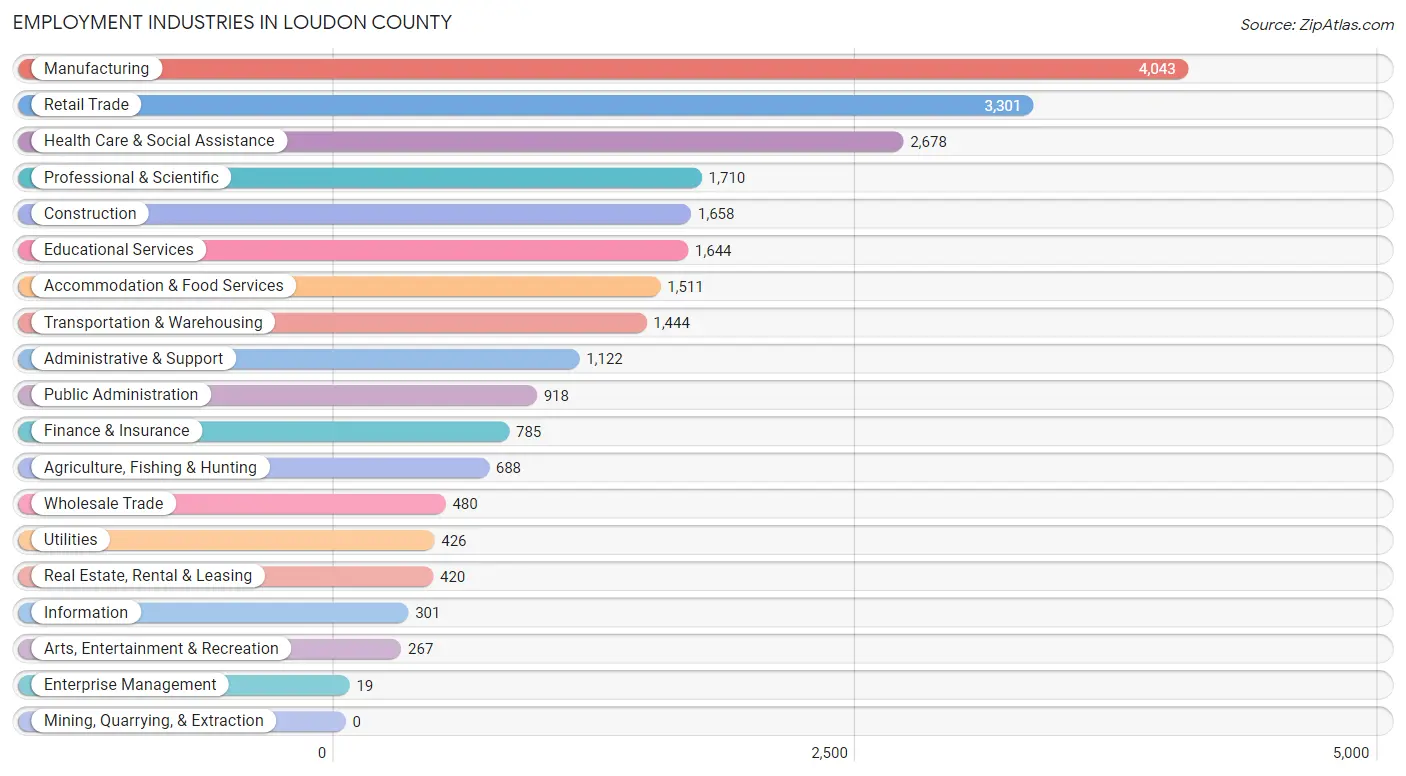
Employment Industries by Sex in Loudon County
The Loudon County industries that see more men than women are Construction (89.0%), Transportation & Warehousing (83.0%), and Utilities (78.6%), whereas the industries that tend to have a higher number of women are Enterprise Management (100.0%), Health Care & Social Assistance (90.8%), and Educational Services (73.7%).
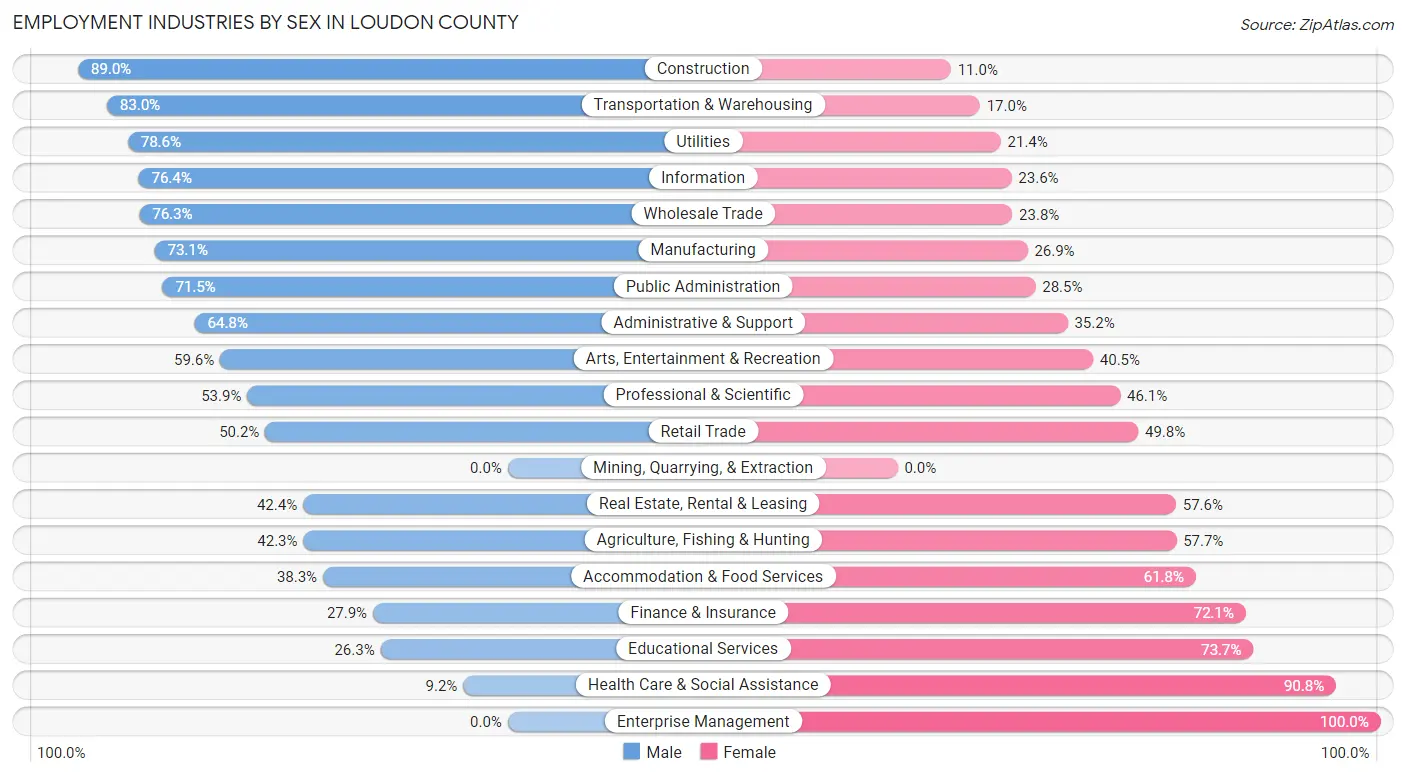
| Industry | Male | Female |
| Agriculture, Fishing & Hunting | 291 (42.3%) | 397 (57.7%) |
| Mining, Quarrying, & Extraction | 0 (0.0%) | 0 (0.0%) |
| Construction | 1,475 (89.0%) | 183 (11.0%) |
| Manufacturing | 2,955 (73.1%) | 1,088 (26.9%) |
| Wholesale Trade | 366 (76.2%) | 114 (23.7%) |
| Retail Trade | 1,657 (50.2%) | 1,644 (49.8%) |
| Transportation & Warehousing | 1,198 (83.0%) | 246 (17.0%) |
| Utilities | 335 (78.6%) | 91 (21.4%) |
| Information | 230 (76.4%) | 71 (23.6%) |
| Finance & Insurance | 219 (27.9%) | 566 (72.1%) |
| Real Estate, Rental & Leasing | 178 (42.4%) | 242 (57.6%) |
| Professional & Scientific | 922 (53.9%) | 788 (46.1%) |
| Enterprise Management | 0 (0.0%) | 19 (100.0%) |
| Administrative & Support | 727 (64.8%) | 395 (35.2%) |
| Educational Services | 433 (26.3%) | 1,211 (73.7%) |
| Health Care & Social Assistance | 247 (9.2%) | 2,431 (90.8%) |
| Arts, Entertainment & Recreation | 159 (59.6%) | 108 (40.5%) |
| Accommodation & Food Services | 578 (38.3%) | 933 (61.8%) |
| Public Administration | 656 (71.5%) | 262 (28.5%) |
| Total | 13,148 (53.8%) | 11,286 (46.2%) |
Education in Loudon County
School Enrollment in Loudon County
The most common levels of schooling among the 10,259 students in Loudon County are middle school (2,710 | 26.4%), high school (2,363 | 23.0%), and elementary school (2,235 | 21.8%).
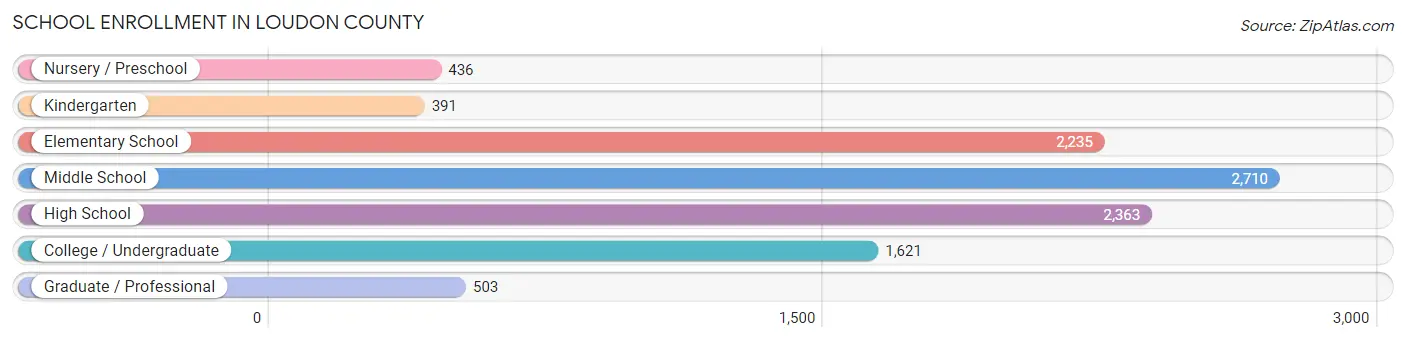
| School Level | # Students | % Students |
| Nursery / Preschool | 436 | 4.3% |
| Kindergarten | 391 | 3.8% |
| Elementary School | 2,235 | 21.8% |
| Middle School | 2,710 | 26.4% |
| High School | 2,363 | 23.0% |
| College / Undergraduate | 1,621 | 15.8% |
| Graduate / Professional | 503 | 4.9% |
| Total | 10,259 | 100.0% |
School Enrollment by Age by Funding Source in Loudon County
Out of a total of 10,259 students who are enrolled in schools in Loudon County, 1,559 (15.2%) attend a private institution, while the remaining 8,700 (84.8%) are enrolled in public schools. The age group of 35 years and over has the highest likelihood of being enrolled in private schools, with 281 (54.5% in the age bracket) enrolled. Conversely, the age group of 18 to 19 year olds has the lowest likelihood of being enrolled in a private school, with 561 (91.8% in the age bracket) attending a public institution.
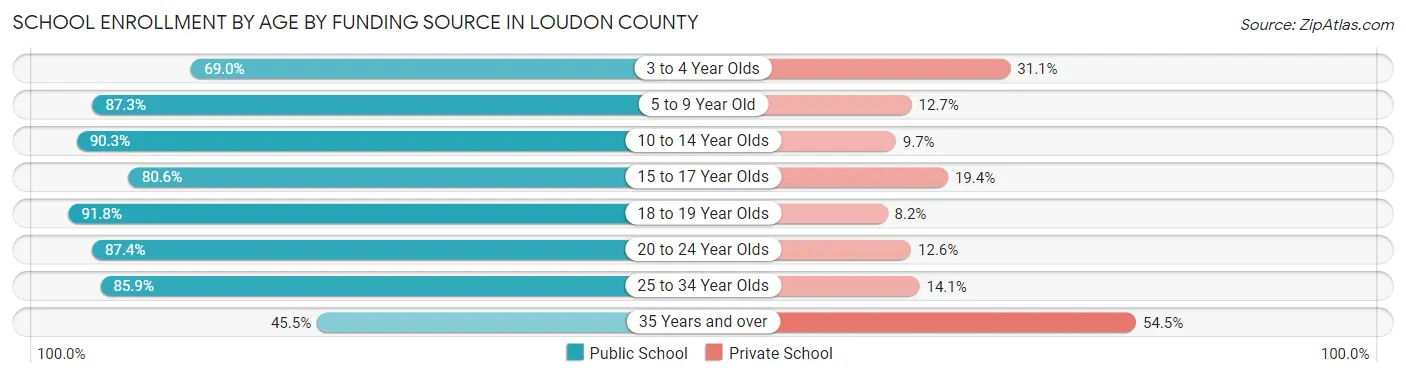
| Age Bracket | Public School | Private School |
| 3 to 4 Year Olds | 171 (69.0%) | 77 (31.0%) |
| 5 to 9 Year Old | 2,090 (87.3%) | 303 (12.7%) |
| 10 to 14 Year Olds | 3,092 (90.3%) | 333 (9.7%) |
| 15 to 17 Year Olds | 1,431 (80.6%) | 345 (19.4%) |
| 18 to 19 Year Olds | 561 (91.8%) | 50 (8.2%) |
| 20 to 24 Year Olds | 794 (87.4%) | 114 (12.6%) |
| 25 to 34 Year Olds | 328 (85.9%) | 54 (14.1%) |
| 35 Years and over | 235 (45.5%) | 281 (54.5%) |
| Total | 8,700 (84.8%) | 1,559 (15.2%) |
Educational Attainment by Field of Study in Loudon County
Business (3,329 | 27.1%), education (1,676 | 13.7%), engineering (1,457 | 11.9%), science & technology (1,234 | 10.1%), and bio, nature & agricultural (685 | 5.6%) are the most common fields of study among 12,282 individuals in Loudon County who have obtained a bachelor's degree or higher.
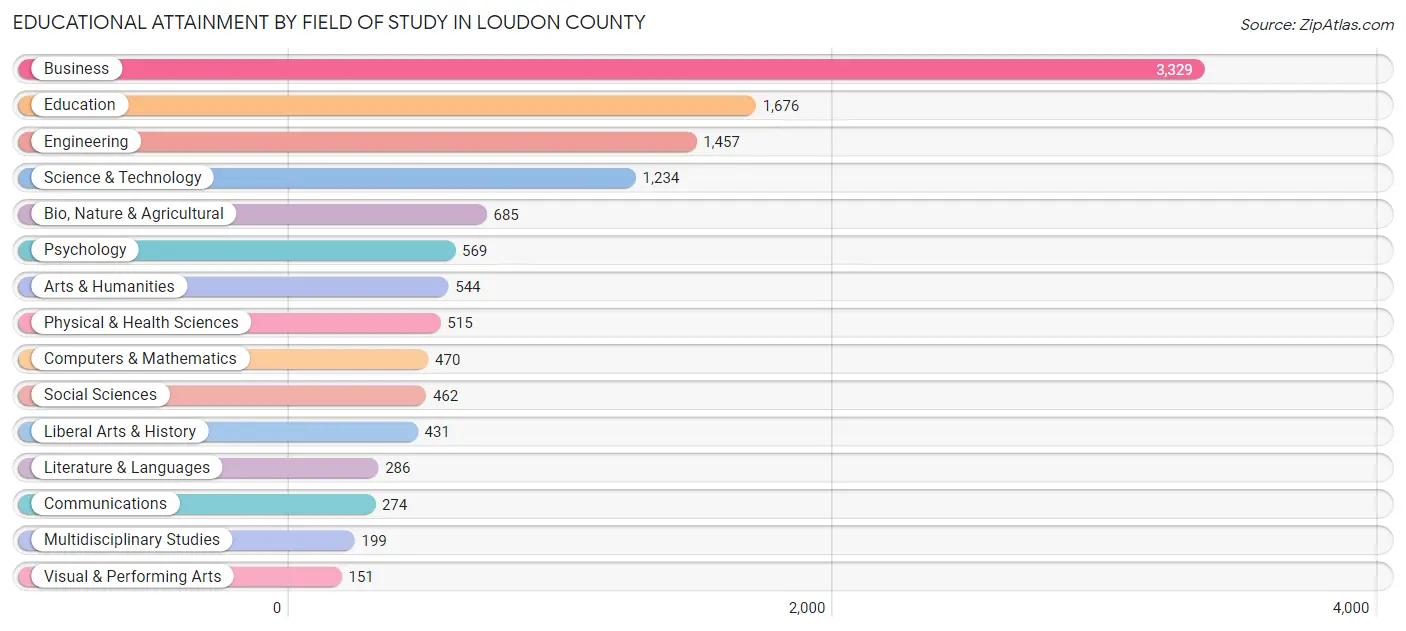
| Field of Study | # Graduates | % Graduates |
| Computers & Mathematics | 470 | 3.8% |
| Bio, Nature & Agricultural | 685 | 5.6% |
| Physical & Health Sciences | 515 | 4.2% |
| Psychology | 569 | 4.6% |
| Social Sciences | 462 | 3.8% |
| Engineering | 1,457 | 11.9% |
| Multidisciplinary Studies | 199 | 1.6% |
| Science & Technology | 1,234 | 10.1% |
| Business | 3,329 | 27.1% |
| Education | 1,676 | 13.7% |
| Literature & Languages | 286 | 2.3% |
| Liberal Arts & History | 431 | 3.5% |
| Visual & Performing Arts | 151 | 1.2% |
| Communications | 274 | 2.2% |
| Arts & Humanities | 544 | 4.4% |
| Total | 12,282 | 100.0% |
Transportation & Commute in Loudon County
Vehicle Availability by Sex in Loudon County
The most prevalent vehicle ownership categories in Loudon County are males with 2 vehicles (4,903, accounting for 37.5%) and females with 2 vehicles (4,436, making up 44.0%).
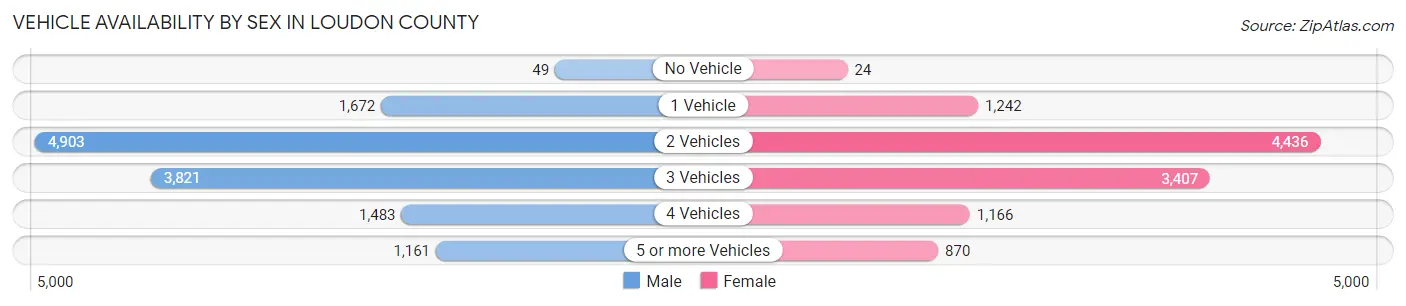
| Vehicles Available | Male | Female |
| No Vehicle | 49 (0.4%) | 24 (0.2%) |
| 1 Vehicle | 1,672 (12.8%) | 1,242 (11.1%) |
| 2 Vehicles | 4,903 (37.5%) | 4,436 (39.8%) |
| 3 Vehicles | 3,821 (29.2%) | 3,407 (30.6%) |
| 4 Vehicles | 1,483 (11.3%) | 1,166 (10.5%) |
| 5 or more Vehicles | 1,161 (8.9%) | 870 (7.8%) |
| Total | 13,089 (100.0%) | 11,145 (100.0%) |
Commute Time in Loudon County
The most frequently occuring commute durations in Loudon County are 15 to 19 minutes (3,708 commuters, 16.9%), 30 to 34 minutes (3,405 commuters, 15.5%), and 10 to 14 minutes (3,224 commuters, 14.7%).
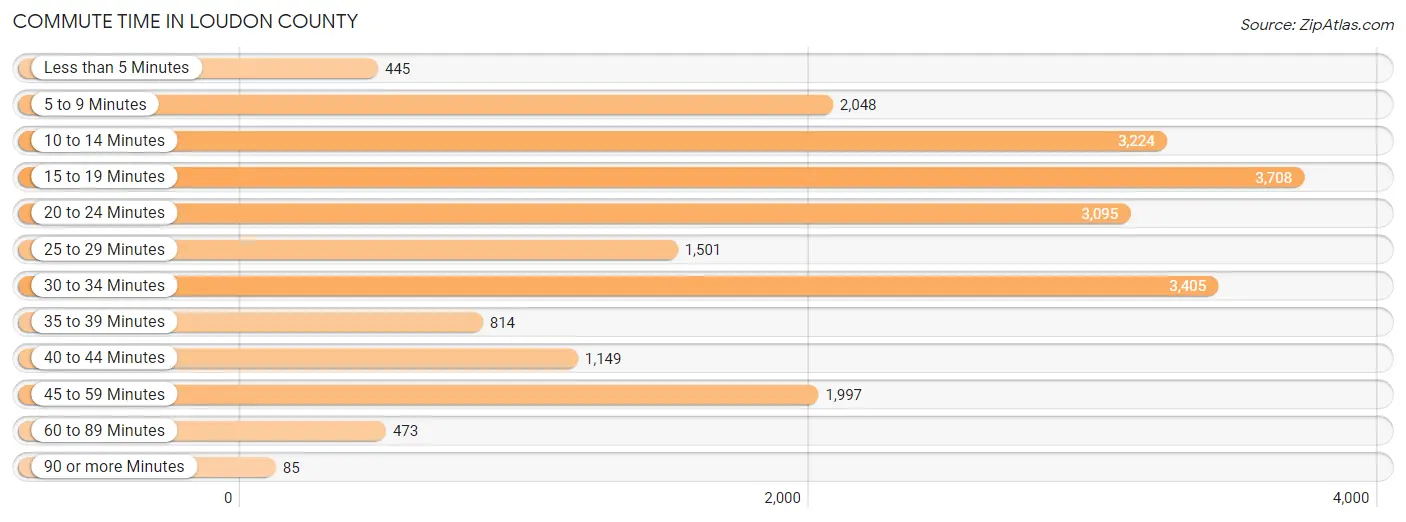
| Commute Time | # Commuters | % Commuters |
| Less than 5 Minutes | 445 | 2.0% |
| 5 to 9 Minutes | 2,048 | 9.3% |
| 10 to 14 Minutes | 3,224 | 14.7% |
| 15 to 19 Minutes | 3,708 | 16.9% |
| 20 to 24 Minutes | 3,095 | 14.1% |
| 25 to 29 Minutes | 1,501 | 6.8% |
| 30 to 34 Minutes | 3,405 | 15.5% |
| 35 to 39 Minutes | 814 | 3.7% |
| 40 to 44 Minutes | 1,149 | 5.2% |
| 45 to 59 Minutes | 1,997 | 9.1% |
| 60 to 89 Minutes | 473 | 2.2% |
| 90 or more Minutes | 85 | 0.4% |
Commute Time by Sex in Loudon County
The most common commute times in Loudon County are 15 to 19 minutes (2,109 commuters, 17.7%) for males and 20 to 24 minutes (1,606 commuters, 16.0%) for females.
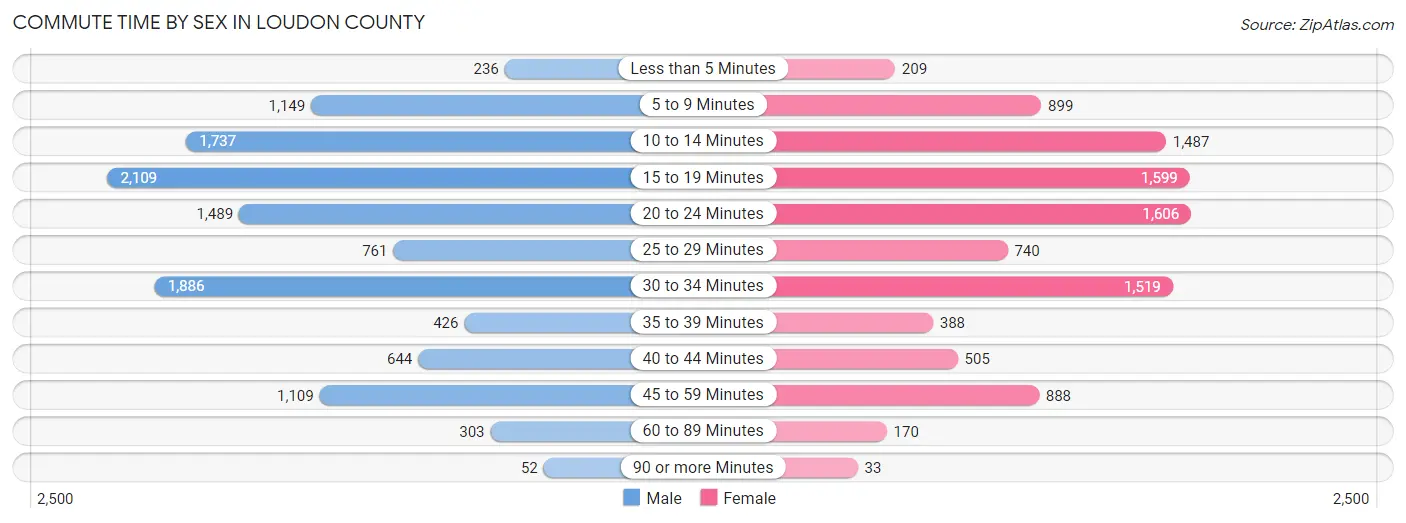
| Commute Time | Male | Female |
| Less than 5 Minutes | 236 (2.0%) | 209 (2.1%) |
| 5 to 9 Minutes | 1,149 (9.7%) | 899 (8.9%) |
| 10 to 14 Minutes | 1,737 (14.6%) | 1,487 (14.8%) |
| 15 to 19 Minutes | 2,109 (17.7%) | 1,599 (15.9%) |
| 20 to 24 Minutes | 1,489 (12.5%) | 1,606 (16.0%) |
| 25 to 29 Minutes | 761 (6.4%) | 740 (7.4%) |
| 30 to 34 Minutes | 1,886 (15.9%) | 1,519 (15.1%) |
| 35 to 39 Minutes | 426 (3.6%) | 388 (3.9%) |
| 40 to 44 Minutes | 644 (5.4%) | 505 (5.0%) |
| 45 to 59 Minutes | 1,109 (9.3%) | 888 (8.8%) |
| 60 to 89 Minutes | 303 (2.5%) | 170 (1.7%) |
| 90 or more Minutes | 52 (0.4%) | 33 (0.3%) |
Time of Departure to Work by Sex in Loudon County
The most frequent times of departure to work in Loudon County are 7:00 AM to 7:29 AM (1,951, 16.4%) for males and 7:00 AM to 7:29 AM (2,084, 20.7%) for females.
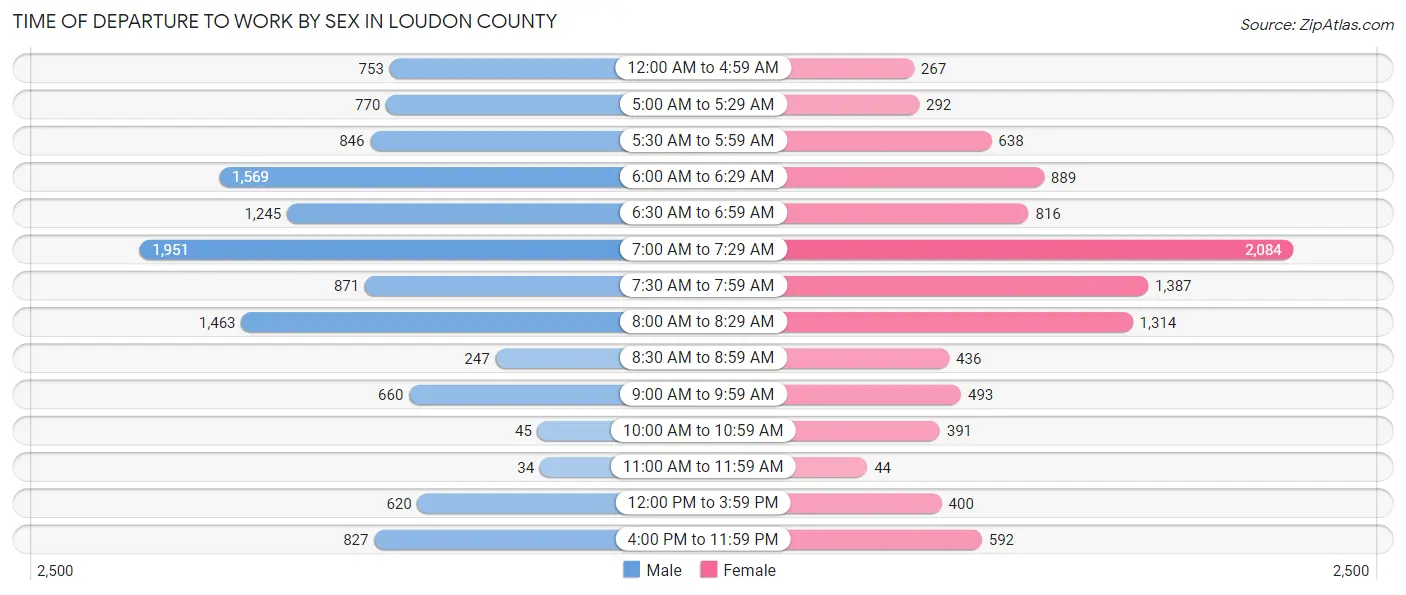
| Time of Departure | Male | Female |
| 12:00 AM to 4:59 AM | 753 (6.3%) | 267 (2.7%) |
| 5:00 AM to 5:29 AM | 770 (6.5%) | 292 (2.9%) |
| 5:30 AM to 5:59 AM | 846 (7.1%) | 638 (6.4%) |
| 6:00 AM to 6:29 AM | 1,569 (13.2%) | 889 (8.8%) |
| 6:30 AM to 6:59 AM | 1,245 (10.5%) | 816 (8.1%) |
| 7:00 AM to 7:29 AM | 1,951 (16.4%) | 2,084 (20.7%) |
| 7:30 AM to 7:59 AM | 871 (7.3%) | 1,387 (13.8%) |
| 8:00 AM to 8:29 AM | 1,463 (12.3%) | 1,314 (13.1%) |
| 8:30 AM to 8:59 AM | 247 (2.1%) | 436 (4.3%) |
| 9:00 AM to 9:59 AM | 660 (5.6%) | 493 (4.9%) |
| 10:00 AM to 10:59 AM | 45 (0.4%) | 391 (3.9%) |
| 11:00 AM to 11:59 AM | 34 (0.3%) | 44 (0.4%) |
| 12:00 PM to 3:59 PM | 620 (5.2%) | 400 (4.0%) |
| 4:00 PM to 11:59 PM | 827 (7.0%) | 592 (5.9%) |
| Total | 11,901 (100.0%) | 10,043 (100.0%) |
Housing Occupancy in Loudon County
Occupancy by Ownership in Loudon County
Of the total 22,487 dwellings in Loudon County, owner-occupied units account for 18,350 (81.6%), while renter-occupied units make up 4,137 (18.4%).
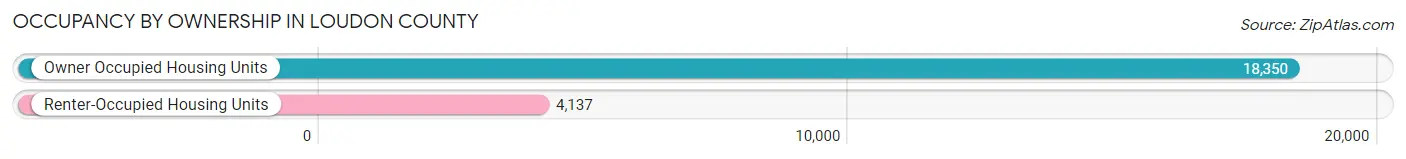
| Occupancy | # Housing Units | % Housing Units |
| Owner Occupied Housing Units | 18,350 | 81.6% |
| Renter-Occupied Housing Units | 4,137 | 18.4% |
| Total Occupied Housing Units | 22,487 | 100.0% |
Occupancy by Household Size in Loudon County
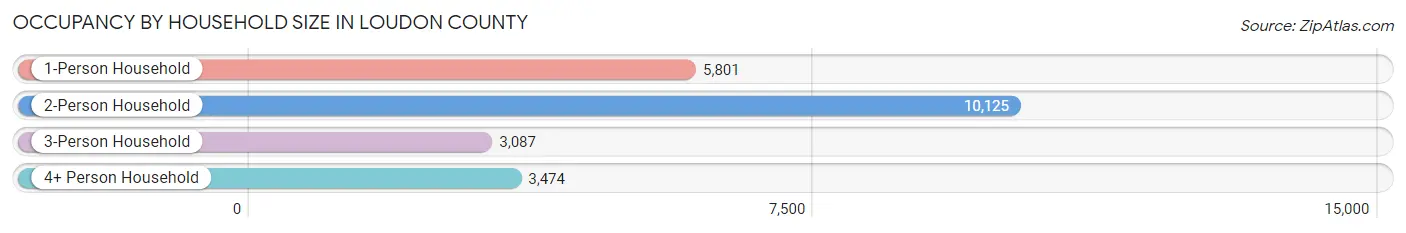
| Household Size | # Housing Units | % Housing Units |
| 1-Person Household | 5,801 | 25.8% |
| 2-Person Household | 10,125 | 45.0% |
| 3-Person Household | 3,087 | 13.7% |
| 4+ Person Household | 3,474 | 15.4% |
| Total Housing Units | 22,487 | 100.0% |
Occupancy by Ownership by Household Size in Loudon County
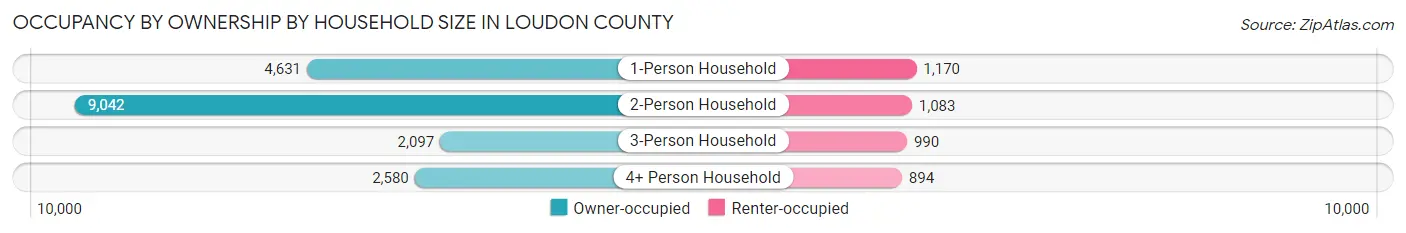
| Household Size | Owner-occupied | Renter-occupied |
| 1-Person Household | 4,631 (79.8%) | 1,170 (20.2%) |
| 2-Person Household | 9,042 (89.3%) | 1,083 (10.7%) |
| 3-Person Household | 2,097 (67.9%) | 990 (32.1%) |
| 4+ Person Household | 2,580 (74.3%) | 894 (25.7%) |
| Total Housing Units | 18,350 (81.6%) | 4,137 (18.4%) |
Occupancy by Educational Attainment in Loudon County
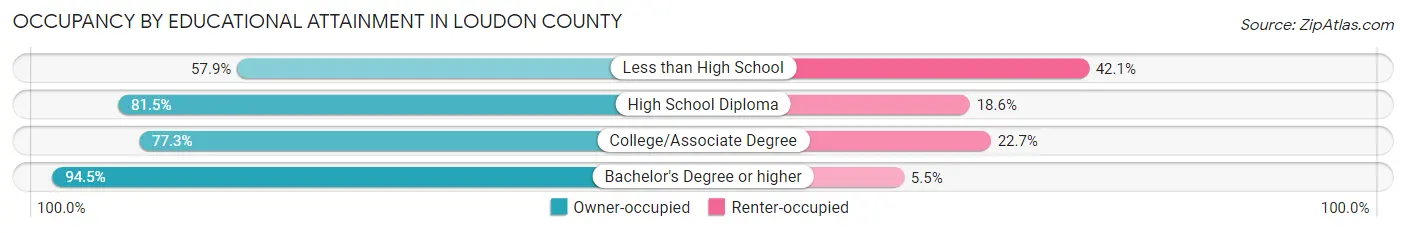
| Household Size | Owner-occupied | Renter-occupied |
| Less than High School | 1,491 (57.9%) | 1,086 (42.1%) |
| High School Diploma | 5,098 (81.5%) | 1,161 (18.5%) |
| College/Associate Degree | 5,116 (77.3%) | 1,503 (22.7%) |
| Bachelor's Degree or higher | 6,645 (94.5%) | 387 (5.5%) |
Occupancy by Age of Householder in Loudon County
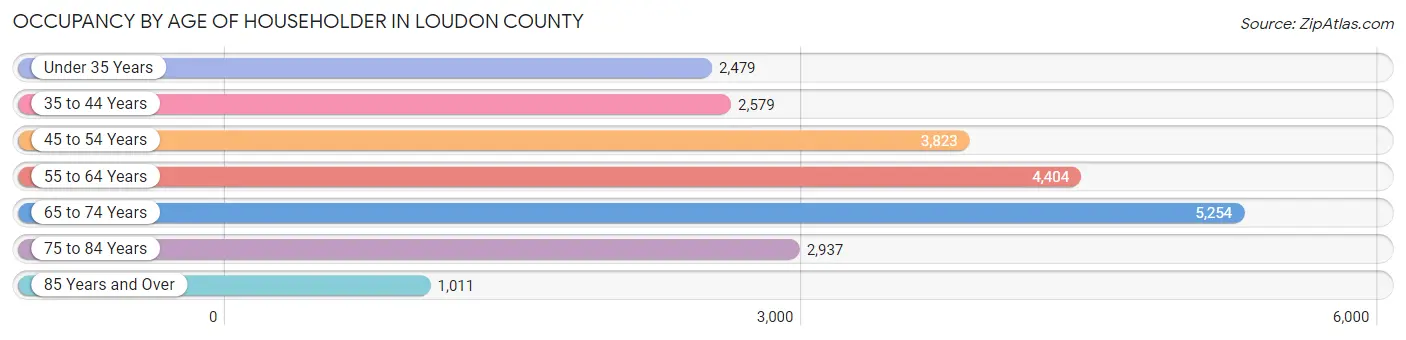
| Age Bracket | # Households | % Households |
| Under 35 Years | 2,479 | 11.0% |
| 35 to 44 Years | 2,579 | 11.5% |
| 45 to 54 Years | 3,823 | 17.0% |
| 55 to 64 Years | 4,404 | 19.6% |
| 65 to 74 Years | 5,254 | 23.4% |
| 75 to 84 Years | 2,937 | 13.1% |
| 85 Years and Over | 1,011 | 4.5% |
| Total | 22,487 | 100.0% |
Housing Finances in Loudon County
Median Income by Occupancy in Loudon County
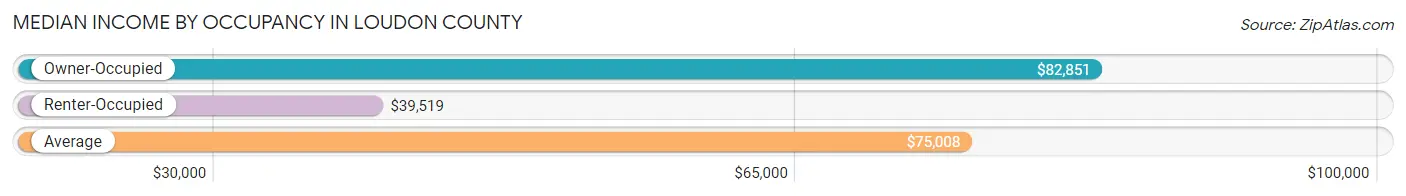
| Occupancy Type | # Households | Median Income |
| Owner-Occupied | 18,350 (81.6%) | $82,851 |
| Renter-Occupied | 4,137 (18.4%) | $39,519 |
| Average | 22,487 (100.0%) | $75,008 |
Occupancy by Householder Income Bracket in Loudon County
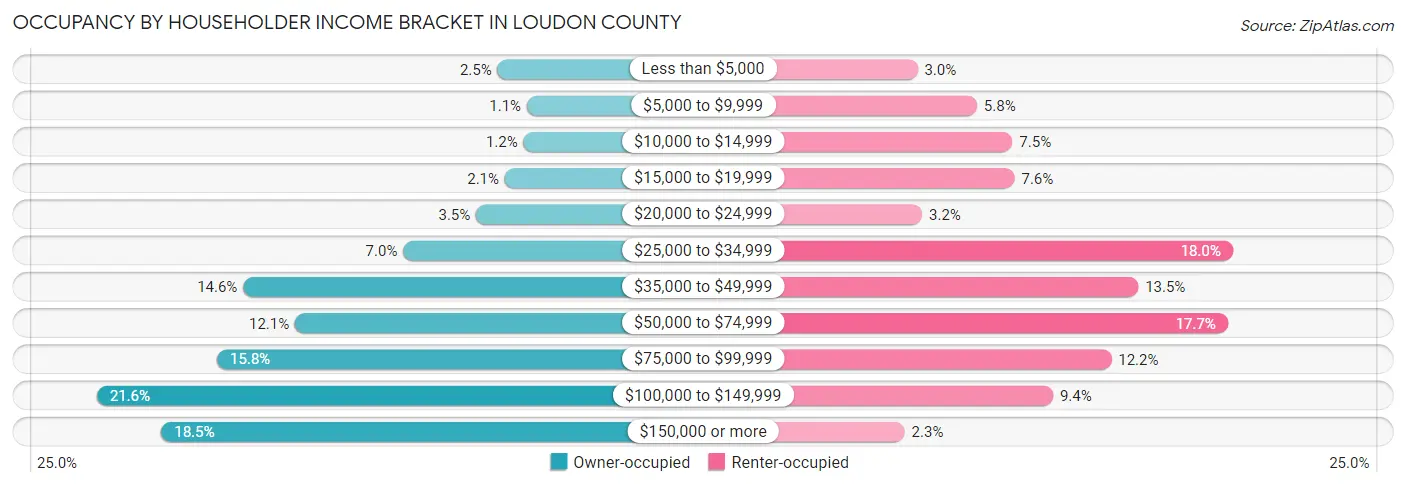
| Income Bracket | Owner-occupied | Renter-occupied |
| Less than $5,000 | 455 (2.5%) | 122 (2.9%) |
| $5,000 to $9,999 | 199 (1.1%) | 239 (5.8%) |
| $10,000 to $14,999 | 228 (1.2%) | 309 (7.5%) |
| $15,000 to $19,999 | 390 (2.1%) | 313 (7.6%) |
| $20,000 to $24,999 | 642 (3.5%) | 131 (3.2%) |
| $25,000 to $34,999 | 1,279 (7.0%) | 743 (18.0%) |
| $35,000 to $49,999 | 2,678 (14.6%) | 557 (13.5%) |
| $50,000 to $74,999 | 2,224 (12.1%) | 733 (17.7%) |
| $75,000 to $99,999 | 2,906 (15.8%) | 504 (12.2%) |
| $100,000 to $149,999 | 3,957 (21.6%) | 389 (9.4%) |
| $150,000 or more | 3,392 (18.5%) | 97 (2.3%) |
| Total | 18,350 (100.0%) | 4,137 (100.0%) |
Monthly Housing Cost Tiers in Loudon County
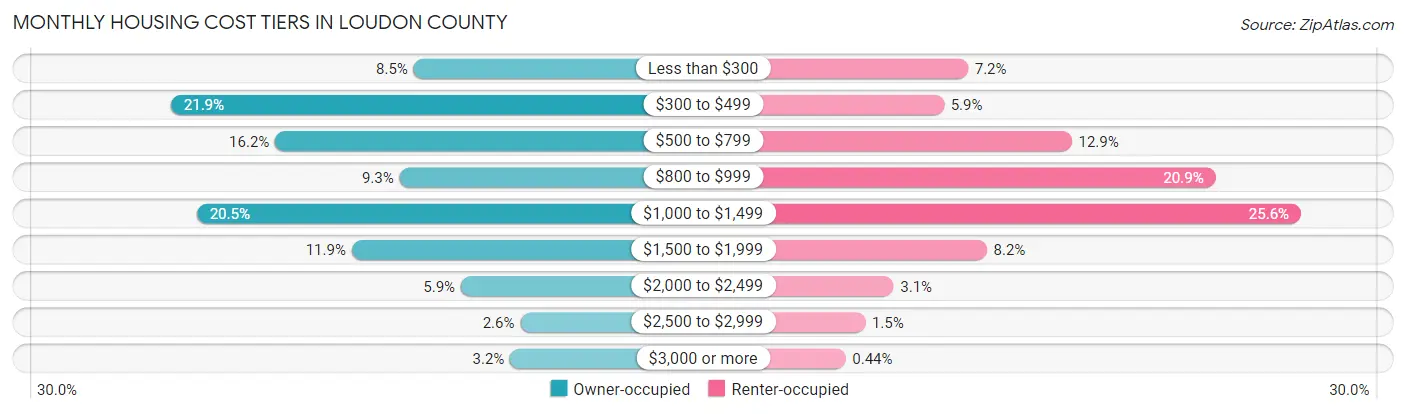
| Monthly Cost | Owner-occupied | Renter-occupied |
| Less than $300 | 1,562 (8.5%) | 298 (7.2%) |
| $300 to $499 | 4,022 (21.9%) | 243 (5.9%) |
| $500 to $799 | 2,965 (16.2%) | 535 (12.9%) |
| $800 to $999 | 1,704 (9.3%) | 864 (20.9%) |
| $1,000 to $1,499 | 3,760 (20.5%) | 1,059 (25.6%) |
| $1,500 to $1,999 | 2,190 (11.9%) | 341 (8.2%) |
| $2,000 to $2,499 | 1,083 (5.9%) | 128 (3.1%) |
| $2,500 to $2,999 | 480 (2.6%) | 63 (1.5%) |
| $3,000 or more | 584 (3.2%) | 18 (0.4%) |
| Total | 18,350 (100.0%) | 4,137 (100.0%) |
Physical Housing Characteristics in Loudon County
Housing Structures in Loudon County
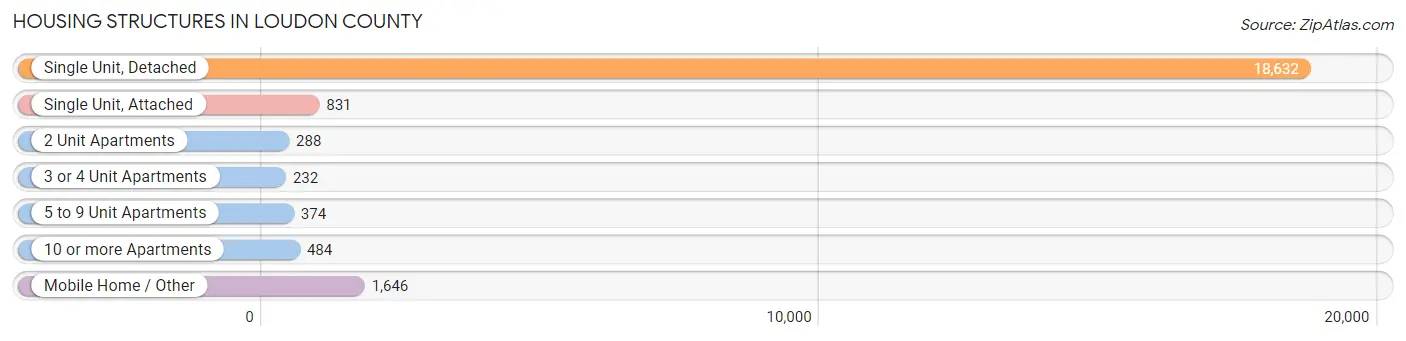
| Structure Type | # Housing Units | % Housing Units |
| Single Unit, Detached | 18,632 | 82.9% |
| Single Unit, Attached | 831 | 3.7% |
| 2 Unit Apartments | 288 | 1.3% |
| 3 or 4 Unit Apartments | 232 | 1.0% |
| 5 to 9 Unit Apartments | 374 | 1.7% |
| 10 or more Apartments | 484 | 2.1% |
| Mobile Home / Other | 1,646 | 7.3% |
| Total | 22,487 | 100.0% |
Housing Structures by Occupancy in Loudon County
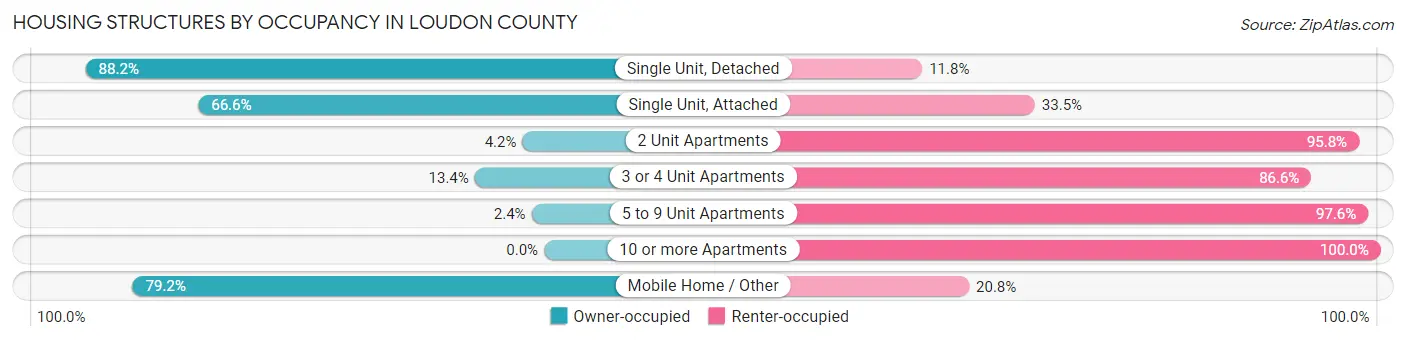
| Structure Type | Owner-occupied | Renter-occupied |
| Single Unit, Detached | 16,441 (88.2%) | 2,191 (11.8%) |
| Single Unit, Attached | 553 (66.5%) | 278 (33.5%) |
| 2 Unit Apartments | 12 (4.2%) | 276 (95.8%) |
| 3 or 4 Unit Apartments | 31 (13.4%) | 201 (86.6%) |
| 5 to 9 Unit Apartments | 9 (2.4%) | 365 (97.6%) |
| 10 or more Apartments | 0 (0.0%) | 484 (100.0%) |
| Mobile Home / Other | 1,304 (79.2%) | 342 (20.8%) |
| Total | 18,350 (81.6%) | 4,137 (18.4%) |
Housing Structures by Number of Rooms in Loudon County
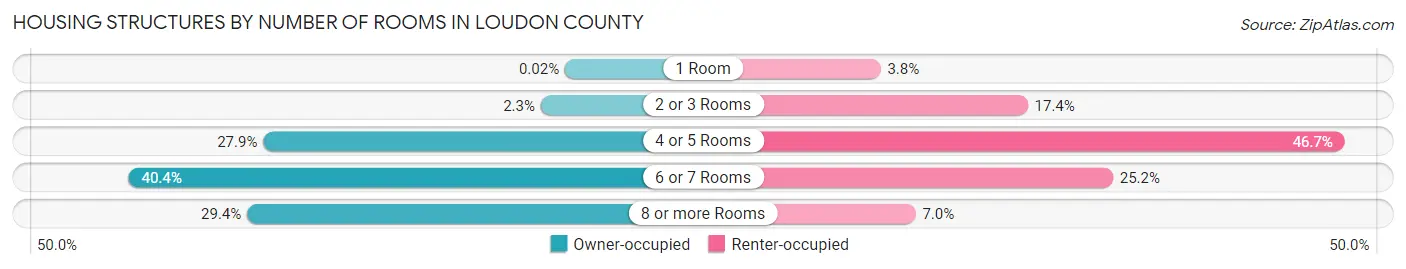
| Number of Rooms | Owner-occupied | Renter-occupied |
| 1 Room | 3 (0.0%) | 155 (3.7%) |
| 2 or 3 Rooms | 415 (2.3%) | 718 (17.4%) |
| 4 or 5 Rooms | 5,125 (27.9%) | 1,931 (46.7%) |
| 6 or 7 Rooms | 7,409 (40.4%) | 1,044 (25.2%) |
| 8 or more Rooms | 5,398 (29.4%) | 289 (7.0%) |
| Total | 18,350 (100.0%) | 4,137 (100.0%) |
Housing Structure by Heating Type in Loudon County
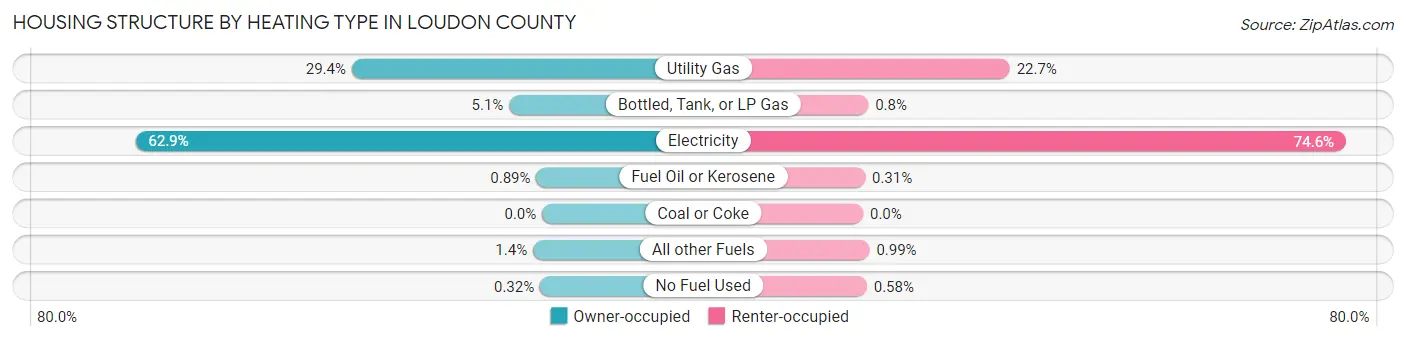
| Heating Type | Owner-occupied | Renter-occupied |
| Utility Gas | 5,398 (29.4%) | 938 (22.7%) |
| Bottled, Tank, or LP Gas | 934 (5.1%) | 33 (0.8%) |
| Electricity | 11,537 (62.9%) | 3,088 (74.6%) |
| Fuel Oil or Kerosene | 164 (0.9%) | 13 (0.3%) |
| Coal or Coke | 0 (0.0%) | 0 (0.0%) |
| All other Fuels | 258 (1.4%) | 41 (1.0%) |
| No Fuel Used | 59 (0.3%) | 24 (0.6%) |
| Total | 18,350 (100.0%) | 4,137 (100.0%) |
Household Vehicle Usage in Loudon County
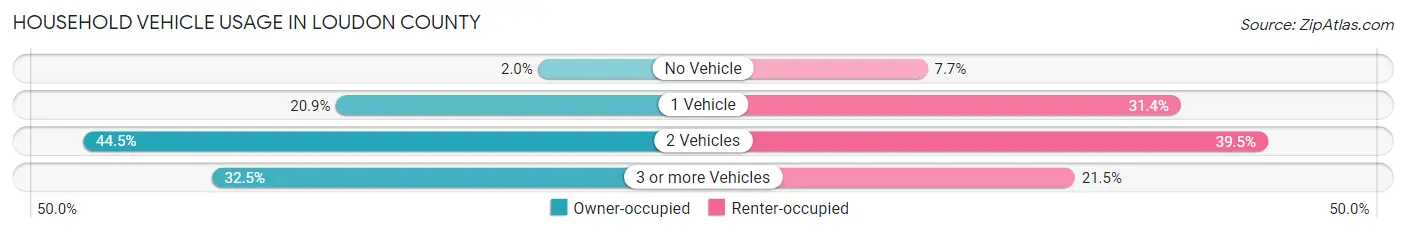
| Vehicles per Household | Owner-occupied | Renter-occupied |
| No Vehicle | 371 (2.0%) | 319 (7.7%) |
| 1 Vehicle | 3,835 (20.9%) | 1,297 (31.4%) |
| 2 Vehicles | 8,172 (44.5%) | 1,633 (39.5%) |
| 3 or more Vehicles | 5,972 (32.5%) | 888 (21.5%) |
| Total | 18,350 (100.0%) | 4,137 (100.0%) |
Real Estate & Mortgages in Loudon County
Real Estate and Mortgage Overview in Loudon County
| Characteristic | Without Mortgage | With Mortgage |
| Housing Units | 8,769 | 9,581 |
| Median Property Value | $275,400 | $257,700 |
| Median Household Income | $69,636 | $2,236 |
| Monthly Housing Costs | $435 | $535 |
| Real Estate Taxes | $1,165 | $321 |
Property Value by Mortgage Status in Loudon County
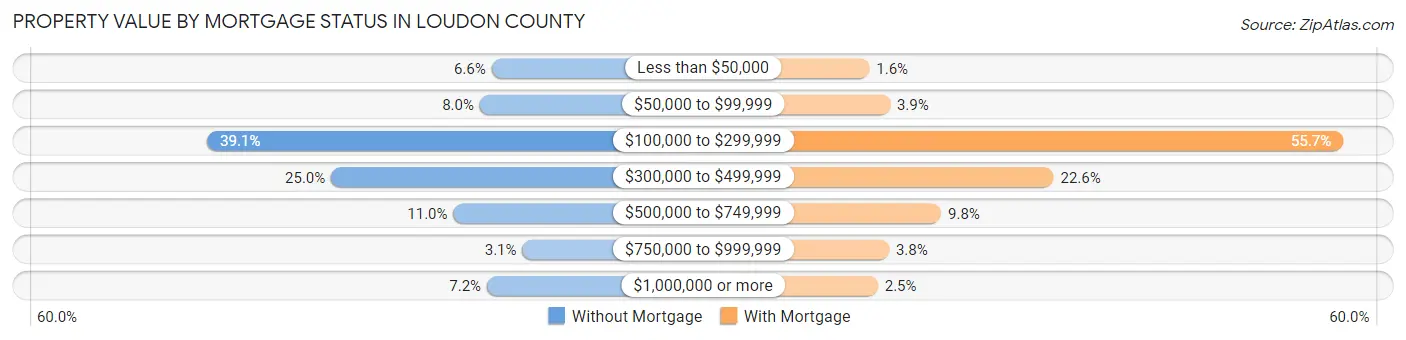
| Property Value | Without Mortgage | With Mortgage |
| Less than $50,000 | 581 (6.6%) | 151 (1.6%) |
| $50,000 to $99,999 | 700 (8.0%) | 377 (3.9%) |
| $100,000 to $299,999 | 3,432 (39.1%) | 5,339 (55.7%) |
| $300,000 to $499,999 | 2,190 (25.0%) | 2,168 (22.6%) |
| $500,000 to $749,999 | 965 (11.0%) | 937 (9.8%) |
| $750,000 to $999,999 | 273 (3.1%) | 366 (3.8%) |
| $1,000,000 or more | 628 (7.2%) | 243 (2.5%) |
| Total | 8,769 (100.0%) | 9,581 (100.0%) |
Household Income by Mortgage Status in Loudon County
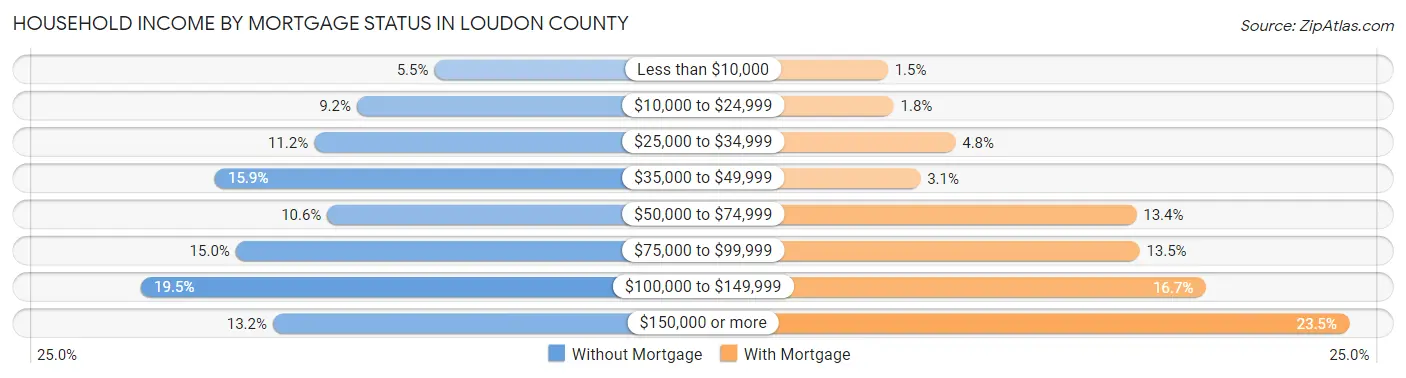
| Household Income | Without Mortgage | With Mortgage |
| Less than $10,000 | 481 (5.5%) | 147 (1.5%) |
| $10,000 to $24,999 | 805 (9.2%) | 173 (1.8%) |
| $25,000 to $34,999 | 984 (11.2%) | 455 (4.8%) |
| $35,000 to $49,999 | 1,397 (15.9%) | 295 (3.1%) |
| $50,000 to $74,999 | 929 (10.6%) | 1,281 (13.4%) |
| $75,000 to $99,999 | 1,311 (14.9%) | 1,295 (13.5%) |
| $100,000 to $149,999 | 1,706 (19.5%) | 1,595 (16.7%) |
| $150,000 or more | 1,156 (13.2%) | 2,251 (23.5%) |
| Total | 8,769 (100.0%) | 9,581 (100.0%) |
Property Value to Household Income Ratio in Loudon County
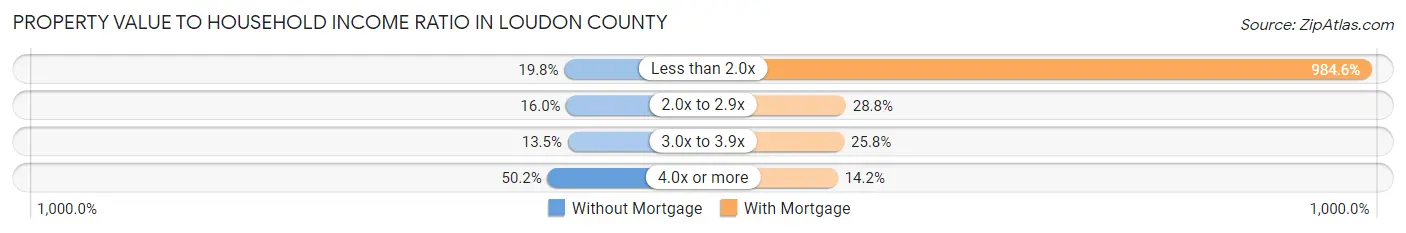
| Value-to-Income Ratio | Without Mortgage | With Mortgage |
| Less than 2.0x | 1,732 (19.8%) | 94,332 (984.6%) |
| 2.0x to 2.9x | 1,402 (16.0%) | 2,760 (28.8%) |
| 3.0x to 3.9x | 1,180 (13.5%) | 2,471 (25.8%) |
| 4.0x or more | 4,402 (50.2%) | 1,357 (14.2%) |
| Total | 8,769 (100.0%) | 9,581 (100.0%) |
Real Estate Taxes by Mortgage Status in Loudon County
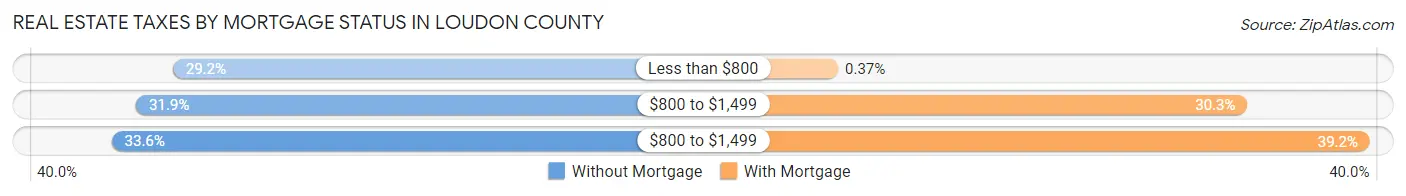
| Property Taxes | Without Mortgage | With Mortgage |
| Less than $800 | 2,558 (29.2%) | 35 (0.4%) |
| $800 to $1,499 | 2,793 (31.9%) | 2,899 (30.3%) |
| $800 to $1,499 | 2,950 (33.6%) | 3,757 (39.2%) |
| Total | 8,769 (100.0%) | 9,581 (100.0%) |
Health & Disability in Loudon County
Health Insurance Coverage by Age in Loudon County
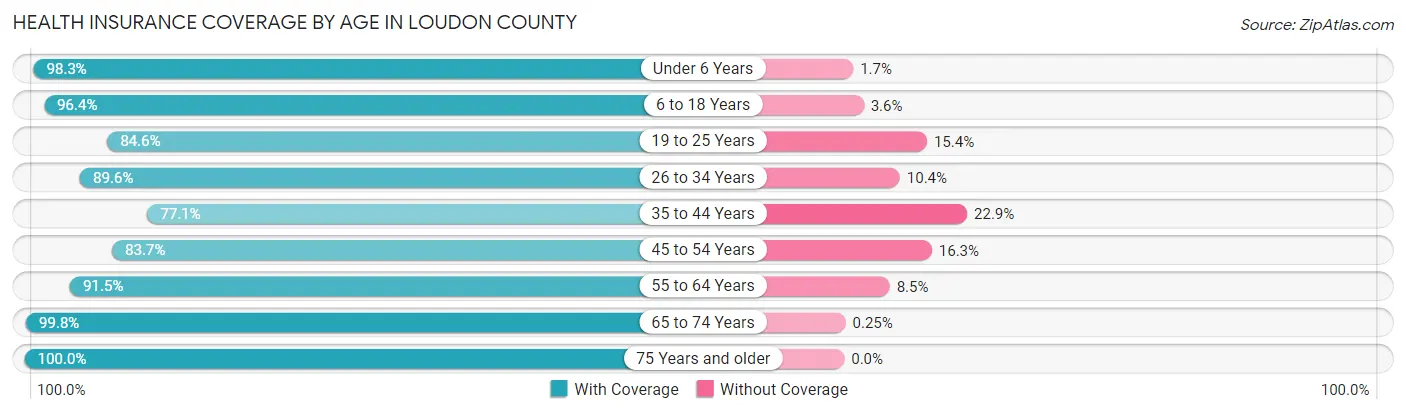
| Age Bracket | With Coverage | Without Coverage |
| Under 6 Years | 3,146 (98.3%) | 53 (1.7%) |
| 6 to 18 Years | 7,745 (96.4%) | 291 (3.6%) |
| 19 to 25 Years | 3,099 (84.6%) | 565 (15.4%) |
| 26 to 34 Years | 4,048 (89.6%) | 468 (10.4%) |
| 35 to 44 Years | 4,330 (77.1%) | 1,286 (22.9%) |
| 45 to 54 Years | 5,820 (83.7%) | 1,136 (16.3%) |
| 55 to 64 Years | 7,680 (91.5%) | 711 (8.5%) |
| 65 to 74 Years | 8,807 (99.8%) | 22 (0.3%) |
| 75 Years and older | 5,926 (100.0%) | 0 (0.0%) |
| Total | 50,601 (91.8%) | 4,532 (8.2%) |
Health Insurance Coverage by Citizenship Status in Loudon County

| Citizenship Status | With Coverage | Without Coverage |
| Native Born | 3,146 (98.3%) | 53 (1.7%) |
| Foreign Born, Citizen | 7,745 (96.4%) | 291 (3.6%) |
| Foreign Born, not a Citizen | 3,099 (84.6%) | 565 (15.4%) |
Health Insurance Coverage by Household Income in Loudon County
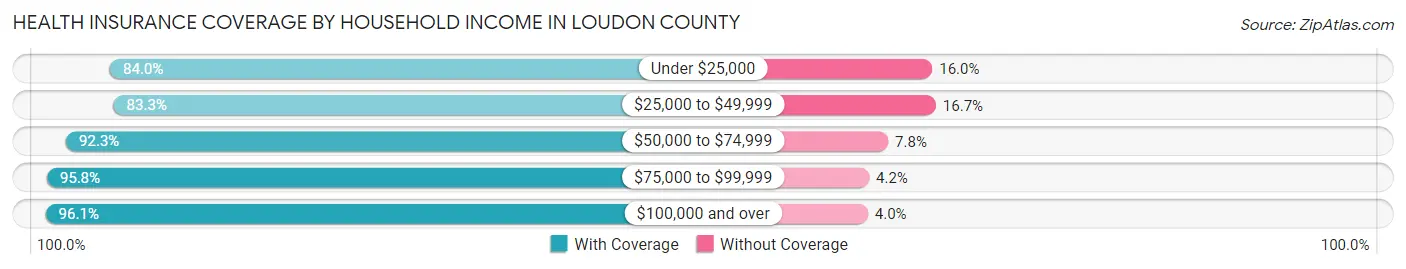
| Household Income | With Coverage | Without Coverage |
| Under $25,000 | 4,271 (84.0%) | 815 (16.0%) |
| $25,000 to $49,999 | 9,327 (83.3%) | 1,869 (16.7%) |
| $50,000 to $74,999 | 6,833 (92.2%) | 574 (7.7%) |
| $75,000 to $99,999 | 8,442 (95.8%) | 368 (4.2%) |
| $100,000 and over | 21,651 (96.1%) | 890 (4.0%) |
Public vs Private Health Insurance Coverage by Age in Loudon County
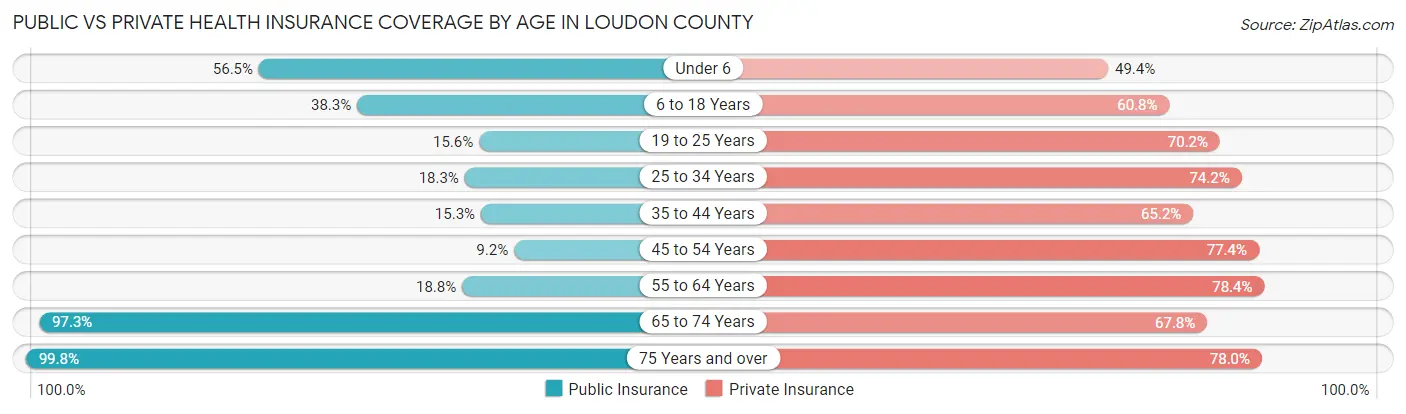
| Age Bracket | Public Insurance | Private Insurance |
| Under 6 | 1,808 (56.5%) | 1,581 (49.4%) |
| 6 to 18 Years | 3,077 (38.3%) | 4,885 (60.8%) |
| 19 to 25 Years | 573 (15.6%) | 2,571 (70.2%) |
| 25 to 34 Years | 827 (18.3%) | 3,350 (74.2%) |
| 35 to 44 Years | 859 (15.3%) | 3,662 (65.2%) |
| 45 to 54 Years | 637 (9.2%) | 5,384 (77.4%) |
| 55 to 64 Years | 1,578 (18.8%) | 6,580 (78.4%) |
| 65 to 74 Years | 8,593 (97.3%) | 5,986 (67.8%) |
| 75 Years and over | 5,913 (99.8%) | 4,620 (78.0%) |
| Total | 23,865 (43.3%) | 38,619 (70.1%) |
Disability Status by Sex by Age in Loudon County
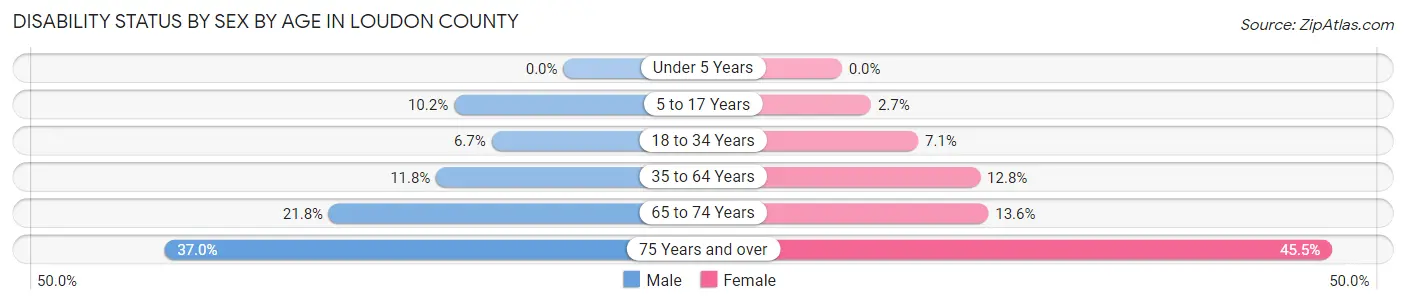
| Age Bracket | Male | Female |
| Under 5 Years | 0 (0.0%) | 0 (0.0%) |
| 5 to 17 Years | 416 (10.2%) | 107 (2.7%) |
| 18 to 34 Years | 300 (6.7%) | 305 (7.1%) |
| 35 to 64 Years | 1,203 (11.8%) | 1,382 (12.8%) |
| 65 to 74 Years | 907 (21.8%) | 634 (13.6%) |
| 75 Years and over | 1,023 (37.0%) | 1,440 (45.5%) |
Disability Class by Sex by Age in Loudon County
Disability Class: Hearing Difficulty
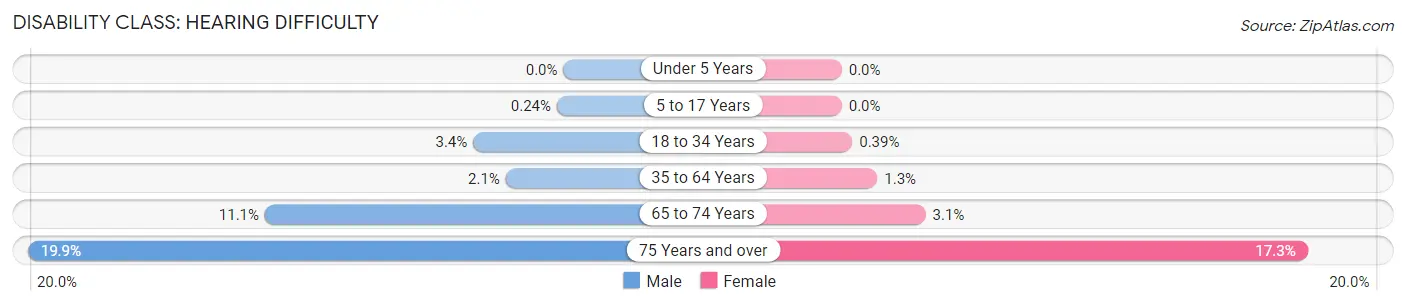
| Age Bracket | Male | Female |
| Under 5 Years | 0 (0.0%) | 0 (0.0%) |
| 5 to 17 Years | 10 (0.2%) | 0 (0.0%) |
| 18 to 34 Years | 151 (3.4%) | 17 (0.4%) |
| 35 to 64 Years | 218 (2.1%) | 142 (1.3%) |
| 65 to 74 Years | 462 (11.1%) | 145 (3.1%) |
| 75 Years and over | 549 (19.9%) | 547 (17.3%) |
Disability Class: Vision Difficulty
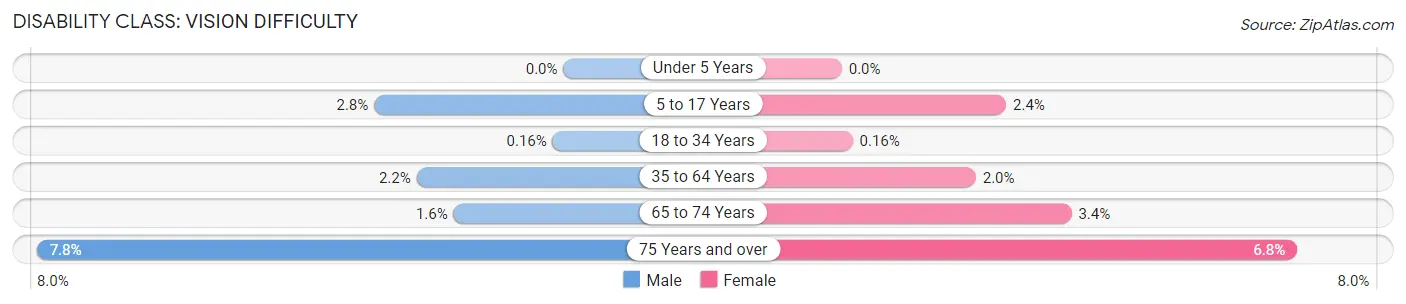
| Age Bracket | Male | Female |
| Under 5 Years | 0 (0.0%) | 0 (0.0%) |
| 5 to 17 Years | 115 (2.8%) | 96 (2.4%) |
| 18 to 34 Years | 7 (0.2%) | 7 (0.2%) |
| 35 to 64 Years | 222 (2.2%) | 214 (2.0%) |
| 65 to 74 Years | 68 (1.6%) | 159 (3.4%) |
| 75 Years and over | 216 (7.8%) | 214 (6.8%) |
Disability Class: Cognitive Difficulty
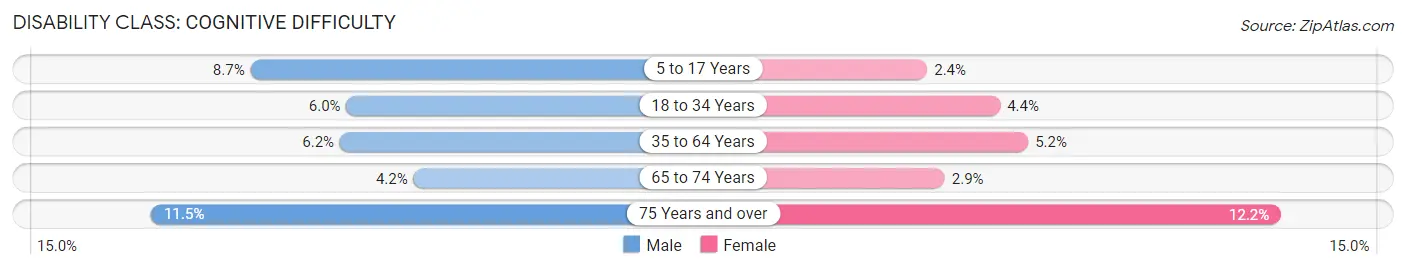
| Age Bracket | Male | Female |
| 5 to 17 Years | 357 (8.7%) | 94 (2.4%) |
| 18 to 34 Years | 272 (6.0%) | 190 (4.4%) |
| 35 to 64 Years | 634 (6.2%) | 559 (5.2%) |
| 65 to 74 Years | 174 (4.2%) | 134 (2.9%) |
| 75 Years and over | 317 (11.5%) | 387 (12.2%) |
Disability Class: Ambulatory Difficulty
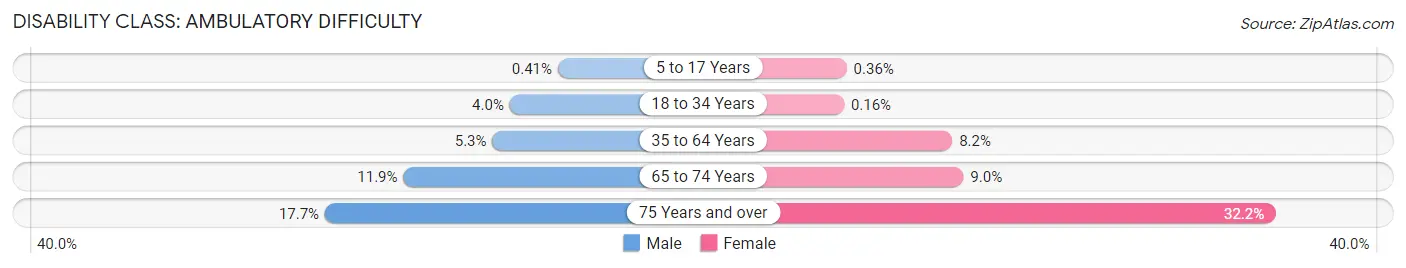
| Age Bracket | Male | Female |
| 5 to 17 Years | 17 (0.4%) | 14 (0.4%) |
| 18 to 34 Years | 179 (4.0%) | 7 (0.2%) |
| 35 to 64 Years | 537 (5.3%) | 883 (8.2%) |
| 65 to 74 Years | 495 (11.9%) | 421 (9.0%) |
| 75 Years and over | 489 (17.7%) | 1,020 (32.2%) |
Disability Class: Self-Care Difficulty
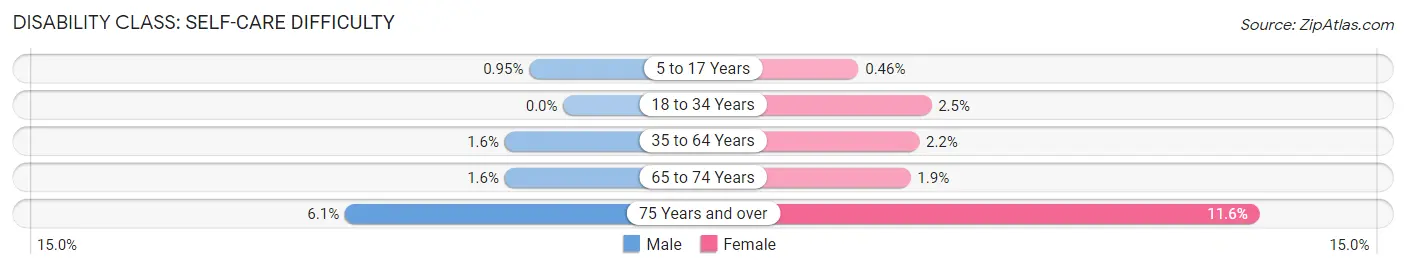
| Age Bracket | Male | Female |
| 5 to 17 Years | 39 (0.9%) | 18 (0.5%) |
| 18 to 34 Years | 0 (0.0%) | 107 (2.5%) |
| 35 to 64 Years | 166 (1.6%) | 231 (2.1%) |
| 65 to 74 Years | 68 (1.6%) | 89 (1.9%) |
| 75 Years and over | 168 (6.1%) | 368 (11.6%) |
Technology Access in Loudon County
Computing Device Access in Loudon County
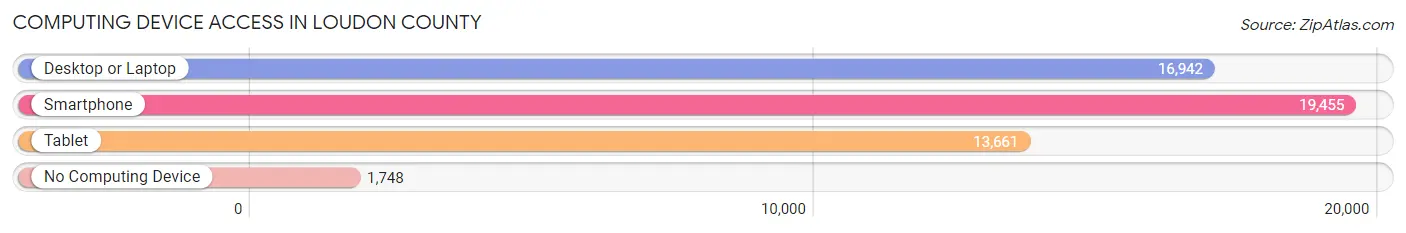
| Device Type | # Households | % Households |
| Desktop or Laptop | 16,942 | 75.3% |
| Smartphone | 19,455 | 86.5% |
| Tablet | 13,661 | 60.8% |
| No Computing Device | 1,748 | 7.8% |
| Total | 22,487 | 100.0% |
Internet Access in Loudon County
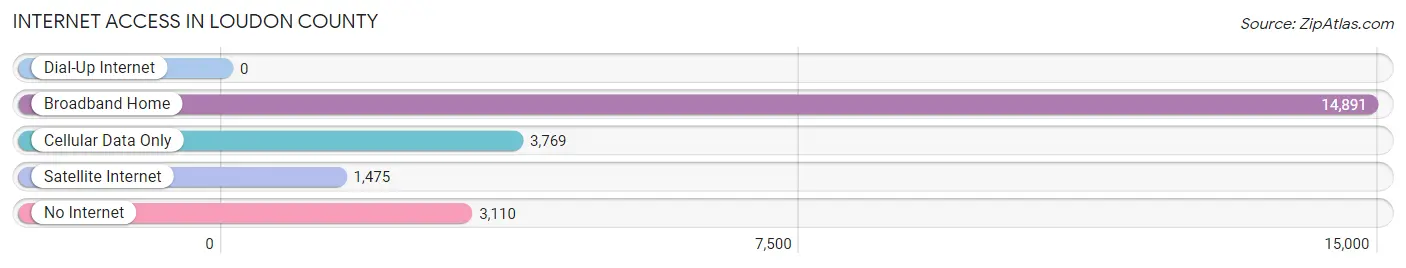
| Internet Type | # Households | % Households |
| Dial-Up Internet | 0 | 0.0% |
| Broadband Home | 14,891 | 66.2% |
| Cellular Data Only | 3,769 | 16.8% |
| Satellite Internet | 1,475 | 6.6% |
| No Internet | 3,110 | 13.8% |
| Total | 22,487 | 100.0% |
Loudon County Summary
Loudon County, Tennessee is located in the eastern part of the state, and is part of the Knoxville Metropolitan Statistical Area. It is bordered by Blount, Monroe, and Roane counties to the north, McMinn and Meigs counties to the east, and Knox and Anderson counties to the south. The county seat is Loudon, and the largest city is Lenoir City.
History
Loudon County was established in 1870 from parts of Roane and Monroe counties. It was named for John Campbell, 4th Earl of Loudoun, who was a British military officer and colonial governor of Virginia. The county was originally part of the Cherokee Nation, and the area was home to several Native American tribes.
The first settlers in the area were mostly Scots-Irish immigrants who arrived in the late 1700s. The county was largely agricultural, and the main crops were corn, wheat, and tobacco. The county was also home to several iron furnaces, which were used to produce iron for the Confederate Army during the Civil War.
Geography
Loudon County is located in the Appalachian Mountains, and is part of the Ridge and Valley region. The county is mostly hilly, with elevations ranging from 800 to 1,400 feet above sea level. The main rivers in the county are the Little Tennessee River, the Clinch River, and the Tellico River. The county is also home to several lakes, including Fort Loudoun Lake, Tellico Lake, and Watts Bar Lake.
Economy
Loudon County’s economy is largely based on agriculture, manufacturing, and tourism. The main crops grown in the county are corn, soybeans, wheat, and hay. The county is also home to several manufacturing plants, including a paper mill, a steel mill, and a plastics plant. Tourism is also an important part of the economy, with visitors coming to the area to enjoy the lakes, rivers, and mountains.
Demographics
As of the 2010 census, Loudon County had a population of 48,556. The population was 87.3% White, 8.2% Hispanic or Latino, 2.2% African American, 0.7% Asian, and 0.6% Native American. The median household income was $45,837, and the median family income was $54,837. The per capita income was $22,845.
Conclusion
Loudon County, Tennessee is a rural county located in the eastern part of the state. It has a rich history, and its economy is largely based on agriculture, manufacturing, and tourism. The population is mostly white, with a small percentage of African American, Hispanic or Latino, Asian, and Native American residents. The county is home to several lakes, rivers, and mountains, making it a popular destination for tourists.
Common Questions
What is the Total Population of Loudon County?
Total Population of Loudon County is 55,507.
What is the Total Male Population of Loudon County?
Total Male Population of Loudon County is 27,335.
What is the Total Female Population of Loudon County?
Total Female Population of Loudon County is 28,172.
What is the Ratio of Males per 100 Females in Loudon County?
There are 97.03 Males per 100 Females in Loudon County.
What is the Ratio of Females per 100 Males in Loudon County?
There are 103.06 Females per 100 Males in Loudon County.
What is the Median Population Age in Loudon County?
Median Population Age in Loudon County is 48.5 Years.
What is the Average Family Size in Loudon County
Average Family Size in Loudon County is 2.9 People.
What is the Average Household Size in Loudon County
Average Household Size in Loudon County is 2.5 People.
What is Per Capita Income in Loudon County?
Per Capita income in Loudon County is $40,425.
What is the Median Family Income in Loudon County?
Median Family Income in Loudon County is $87,660.
What is the Median Household income in Loudon County?
Median Household Income in Loudon County is $75,008.
What is Income or Wage Gap in Loudon County?
Income or Wage Gap in Loudon County is 34.5%.
Women in Loudon County earn 65.5 cents for every dollar earned by a man.
What is Family Income Deficit in Loudon County?
Family Income Deficit in Loudon County is $9,659.
Families that are below poverty line in Loudon County earn $9,659 less on average than the poverty threshold level.
What is Inequality or Gini Index in Loudon County?
Inequality or Gini Index in Loudon County is 0.45.
How Large is the Labor Force in Loudon County?
There are 25,257 People in the Labor Forcein in Loudon County.
What is the Percentage of People in the Labor Force in Loudon County?
54.9% of People are in the Labor Force in Loudon County.
What is the Unemployment Rate in Loudon County?
Unemployment Rate in Loudon County is 3.0%.