Lincoln County, TN
Lincoln County Map
Lincoln County Overview
35,365
TOTAL POPULATION
17,436
MALE POPULATION
17,929
FEMALE POPULATION
97.25
MALES / 100 FEMALES
102.83
FEMALES / 100 MALES
43.2
MEDIAN AGE
3.0
AVG FAMILY SIZE
2.4
AVG HOUSEHOLD SIZE
$32,016
PER CAPITA INCOME
$82,042
AVG FAMILY INCOME
$61,374
AVG HOUSEHOLD INCOME
28.3%
WAGE / INCOME GAP [ % ]
71.7¢/ $1
WAGE / INCOME GAP [ $ ]
$13,309
FAMILY INCOME DEFICIT
0.43
INEQUALITY / GINI INDEX
16,761
LABOR FORCE [ PEOPLE ]
59.2%
PERCENT IN LABOR FORCE
4.3%
UNEMPLOYMENT RATE
Lincoln County Area Codes
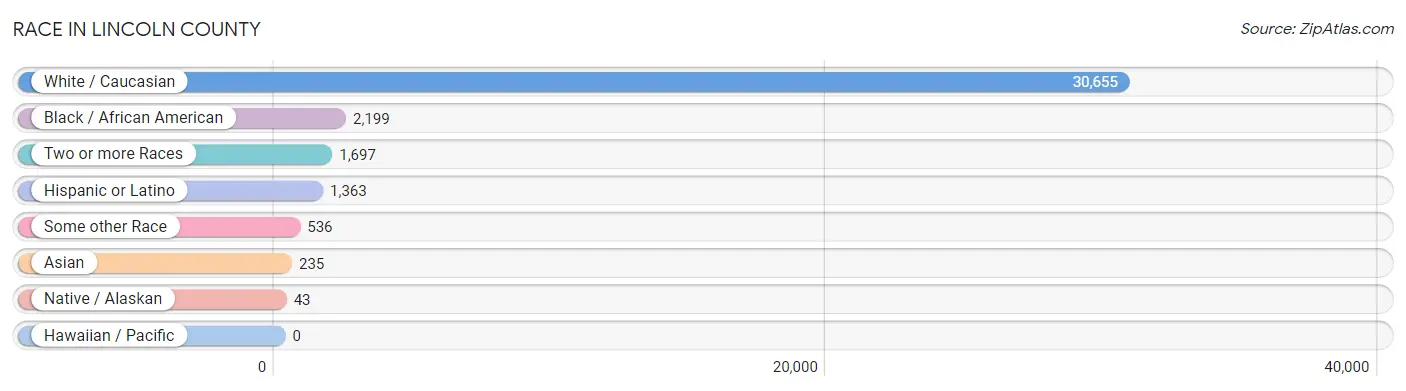
Race in Lincoln County
The most populous races in Lincoln County are White / Caucasian (30,655 | 86.7%), Black / African American (2,199 | 6.2%), and Two or more Races (1,697 | 4.8%).
| Race | # Population | % Population |
| Asian | 235 | 0.7% |
| Black / African American | 2,199 | 6.2% |
| Hawaiian / Pacific | 0 | 0.0% |
| Hispanic or Latino | 1,363 | 3.8% |
| Native / Alaskan | 43 | 0.1% |
| White / Caucasian | 30,655 | 86.7% |
| Two or more Races | 1,697 | 4.8% |
| Some other Race | 536 | 1.5% |
| Total | 35,365 | 100.0% |
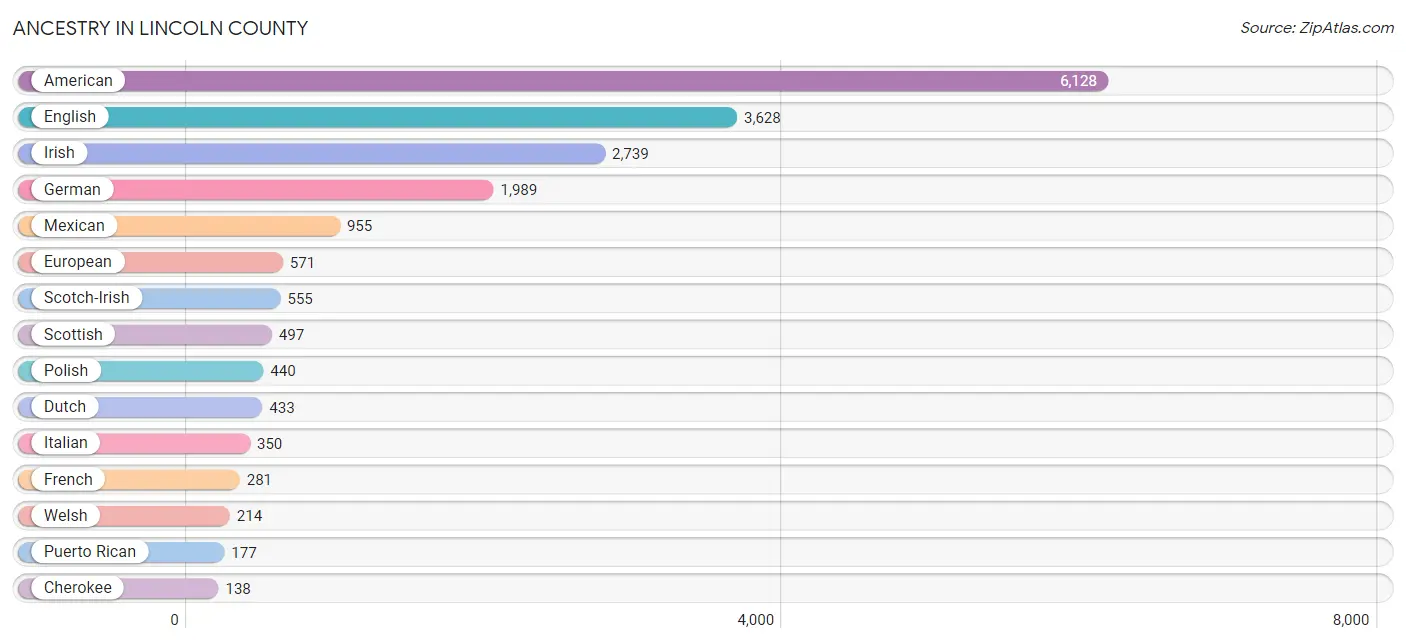
Ancestry in Lincoln County
The most populous ancestries reported in Lincoln County are American (6,128 | 17.3%), English (3,628 | 10.3%), Irish (2,739 | 7.7%), German (1,989 | 5.6%), and Mexican (955 | 2.7%), together accounting for 43.7% of all Lincoln County residents.
| Ancestry | # Population | % Population |
| African | 51 | 0.1% |
| American | 6,128 | 17.3% |
| Arab | 4 | 0.0% |
| Australian | 60 | 0.2% |
| Bhutanese | 2 | 0.0% |
| Blackfeet | 22 | 0.1% |
| British | 83 | 0.2% |
| Burmese | 5 | 0.0% |
| Cajun | 7 | 0.0% |
| Celtic | 11 | 0.0% |
| Cherokee | 138 | 0.4% |
| Chippewa | 2 | 0.0% |
| Choctaw | 8 | 0.0% |
| Creek | 5 | 0.0% |
| Cuban | 8 | 0.0% |
| Czech | 41 | 0.1% |
| Danish | 5 | 0.0% |
| Dutch | 433 | 1.2% |
| Eastern European | 37 | 0.1% |
| English | 3,628 | 10.3% |
| European | 571 | 1.6% |
| French | 281 | 0.8% |
| French Canadian | 97 | 0.3% |
| German | 1,989 | 5.6% |
| Hungarian | 18 | 0.1% |
| Icelander | 5 | 0.0% |
| Indian (Asian) | 13 | 0.0% |
| Irish | 2,739 | 7.7% |
| Italian | 350 | 1.0% |
| Japanese | 10 | 0.0% |
| Korean | 72 | 0.2% |
| Lebanese | 4 | 0.0% |
| Lithuanian | 10 | 0.0% |
| Malaysian | 6 | 0.0% |
| Mexican | 955 | 2.7% |
| Northern European | 30 | 0.1% |
| Norwegian | 116 | 0.3% |
| Pakistani | 87 | 0.3% |
| Paraguayan | 8 | 0.0% |
| Polish | 440 | 1.2% |
| Portuguese | 32 | 0.1% |
| Puerto Rican | 177 | 0.5% |
| Russian | 29 | 0.1% |
| Scandinavian | 102 | 0.3% |
| Scotch-Irish | 555 | 1.6% |
| Scottish | 497 | 1.4% |
| Sioux | 9 | 0.0% |
| South American | 8 | 0.0% |
| Sri Lankan | 36 | 0.1% |
| Subsaharan African | 60 | 0.2% |
| Swedish | 56 | 0.2% |
| Swiss | 11 | 0.0% |
| Thai | 44 | 0.1% |
| Ukrainian | 63 | 0.2% |
| Welsh | 214 | 0.6% | View All 55 Rows |
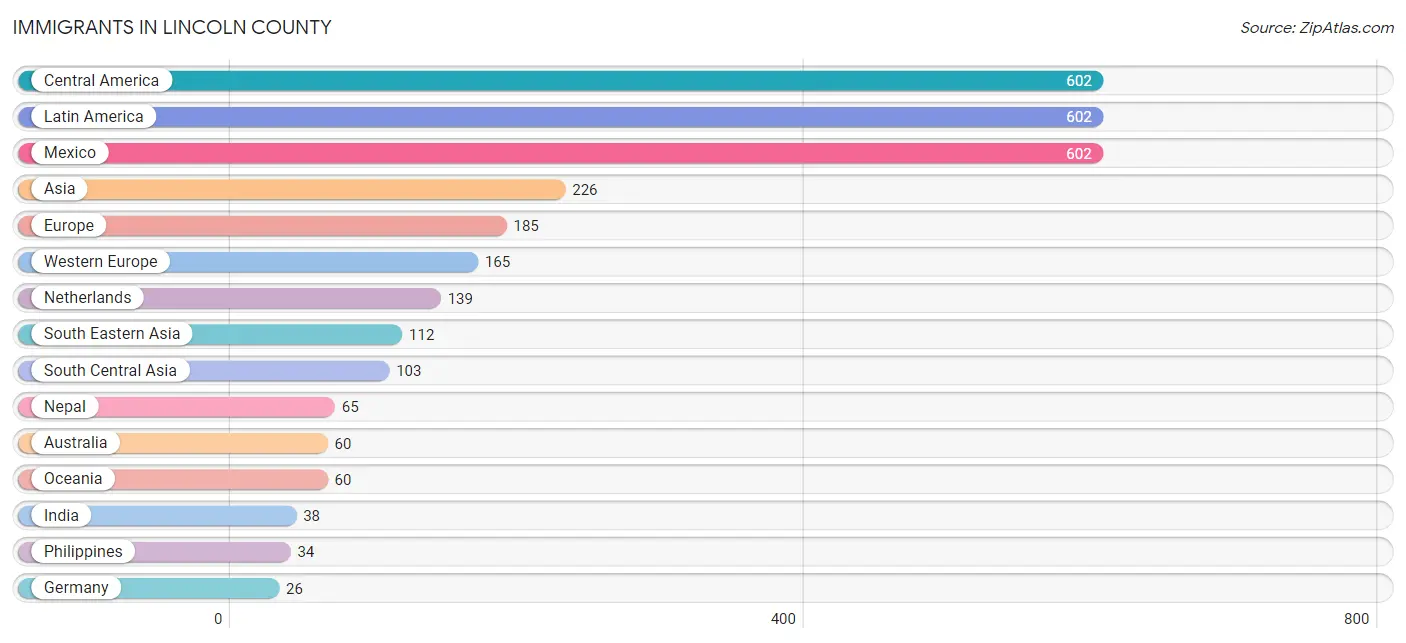
Immigrants in Lincoln County
The most numerous immigrant groups reported in Lincoln County came from Central America (602 | 1.7%), Latin America (602 | 1.7%), Mexico (602 | 1.7%), Asia (226 | 0.6%), and Europe (185 | 0.5%), together accounting for 6.3% of all Lincoln County residents.
| Immigration Origin | # Population | % Population |
| Africa | 13 | 0.0% |
| Asia | 226 | 0.6% |
| Australia | 60 | 0.2% |
| Canada | 5 | 0.0% |
| Central America | 602 | 1.7% |
| China | 4 | 0.0% |
| Eastern Asia | 11 | 0.0% |
| England | 20 | 0.1% |
| Europe | 185 | 0.5% |
| Germany | 26 | 0.1% |
| Hong Kong | 2 | 0.0% |
| India | 38 | 0.1% |
| Indonesia | 17 | 0.1% |
| Japan | 2 | 0.0% |
| Korea | 5 | 0.0% |
| Laos | 2 | 0.0% |
| Latin America | 602 | 1.7% |
| Malaysia | 11 | 0.0% |
| Mexico | 602 | 1.7% |
| Nepal | 65 | 0.2% |
| Netherlands | 139 | 0.4% |
| Northern Europe | 20 | 0.1% |
| Oceania | 60 | 0.2% |
| Philippines | 34 | 0.1% |
| Senegal | 13 | 0.0% |
| South Central Asia | 103 | 0.3% |
| South Eastern Asia | 112 | 0.3% |
| Thailand | 22 | 0.1% |
| Vietnam | 26 | 0.1% |
| Western Africa | 13 | 0.0% |
| Western Europe | 165 | 0.5% | View All 31 Rows |
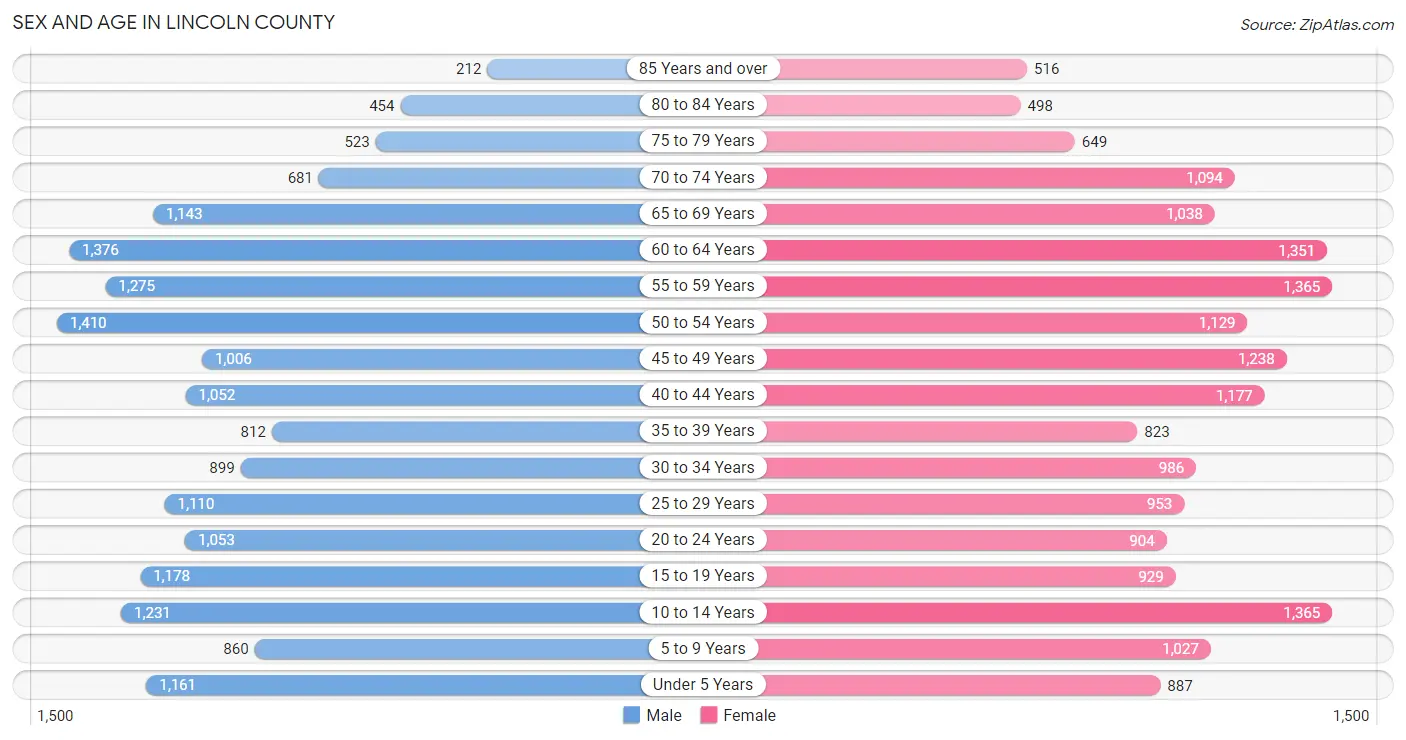
Sex and Age in Lincoln County
Sex and Age in Lincoln County
The most populous age groups in Lincoln County are 50 to 54 Years (1,410 | 8.1%) for men and 10 to 14 Years (1,365 | 7.6%) for women.
| Age Bracket | Male | Female |
| Under 5 Years | 1,161 (6.7%) | 887 (5.0%) |
| 5 to 9 Years | 860 (4.9%) | 1,027 (5.7%) |
| 10 to 14 Years | 1,231 (7.1%) | 1,365 (7.6%) |
| 15 to 19 Years | 1,178 (6.8%) | 929 (5.2%) |
| 20 to 24 Years | 1,053 (6.0%) | 904 (5.0%) |
| 25 to 29 Years | 1,110 (6.4%) | 953 (5.3%) |
| 30 to 34 Years | 899 (5.2%) | 986 (5.5%) |
| 35 to 39 Years | 812 (4.7%) | 823 (4.6%) |
| 40 to 44 Years | 1,052 (6.0%) | 1,177 (6.6%) |
| 45 to 49 Years | 1,006 (5.8%) | 1,238 (6.9%) |
| 50 to 54 Years | 1,410 (8.1%) | 1,129 (6.3%) |
| 55 to 59 Years | 1,275 (7.3%) | 1,365 (7.6%) |
| 60 to 64 Years | 1,376 (7.9%) | 1,351 (7.5%) |
| 65 to 69 Years | 1,143 (6.6%) | 1,038 (5.8%) |
| 70 to 74 Years | 681 (3.9%) | 1,094 (6.1%) |
| 75 to 79 Years | 523 (3.0%) | 649 (3.6%) |
| 80 to 84 Years | 454 (2.6%) | 498 (2.8%) |
| 85 Years and over | 212 (1.2%) | 516 (2.9%) |
| Total | 17,436 (100.0%) | 17,929 (100.0%) |
Families and Households in Lincoln County
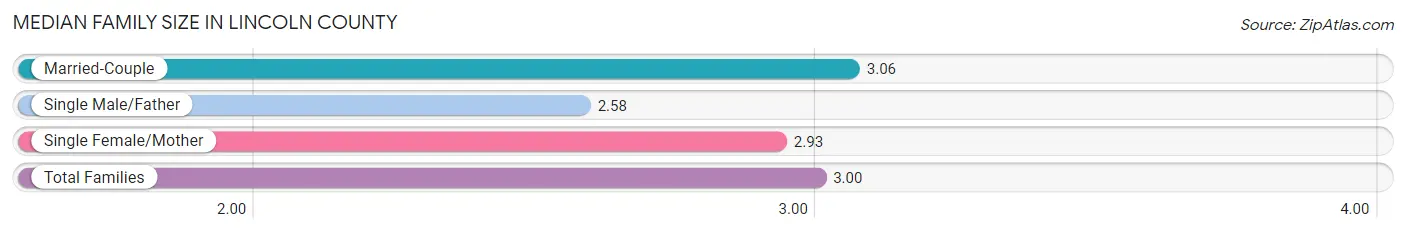
Median Family Size in Lincoln County
The median family size in Lincoln County is 3.00 persons per family, with married-couple families (7,143 | 74.5%) accounting for the largest median family size of 3.06 persons per family. On the other hand, single male/father families (786 | 8.2%) represent the smallest median family size with 2.58 persons per family.
| Family Type | # Families | Family Size |
| Married-Couple | 7,143 (74.5%) | 3.06 |
| Single Male/Father | 786 (8.2%) | 2.58 |
| Single Female/Mother | 1,662 (17.3%) | 2.93 |
| Total Families | 9,591 (100.0%) | 3.00 |
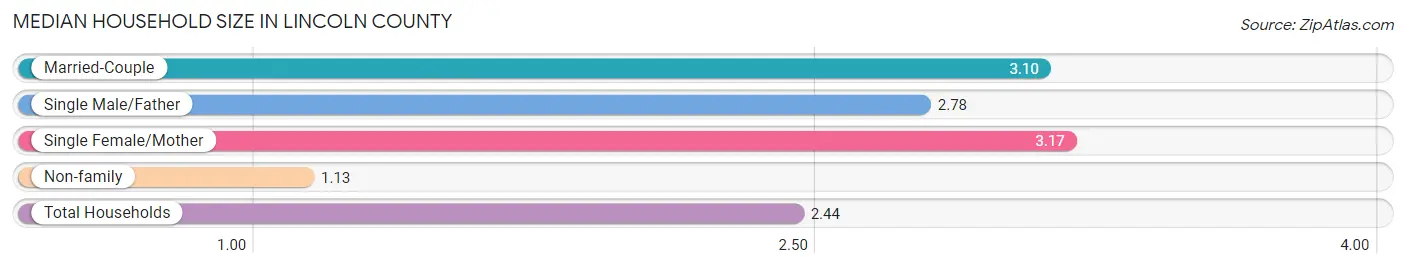
Median Household Size in Lincoln County
The median household size in Lincoln County is 2.44 persons per household, with single female/mother households (1,662 | 11.6%) accounting for the largest median household size of 3.17 persons per household. non-family households (4,713 | 33.0%) represent the smallest median household size with 1.13 persons per household.
| Household Type | # Households | Household Size |
| Married-Couple | 7,143 (49.9%) | 3.10 |
| Single Male/Father | 786 (5.5%) | 2.78 |
| Single Female/Mother | 1,662 (11.6%) | 3.17 |
| Non-family | 4,713 (33.0%) | 1.13 |
| Total Households | 14,304 (100.0%) | 2.44 |
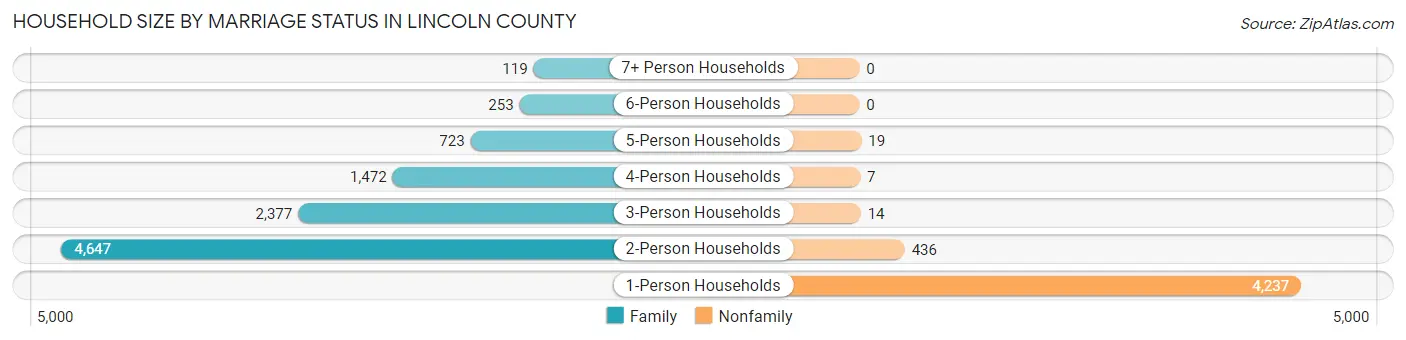
Household Size by Marriage Status in Lincoln County
Out of a total of 14,304 households in Lincoln County, 9,591 (67.0%) are family households, while 4,713 (33.0%) are nonfamily households. The most numerous type of family households are 2-person households, comprising 4,647, and the most common type of nonfamily households are 1-person households, comprising 4,237.
| Household Size | Family Households | Nonfamily Households |
| 1-Person Households | - | 4,237 (29.6%) |
| 2-Person Households | 4,647 (32.5%) | 436 (3.0%) |
| 3-Person Households | 2,377 (16.6%) | 14 (0.1%) |
| 4-Person Households | 1,472 (10.3%) | 7 (0.1%) |
| 5-Person Households | 723 (5.1%) | 19 (0.1%) |
| 6-Person Households | 253 (1.8%) | 0 (0.0%) |
| 7+ Person Households | 119 (0.8%) | 0 (0.0%) |
| Total | 9,591 (67.0%) | 4,713 (33.0%) |
Female Fertility in Lincoln County
Fertility by Age in Lincoln County
Average fertility rate in Lincoln County is 50.0 births per 1,000 women. Women in the age bracket of 20 to 34 years have the highest fertility rate with 91.0 births per 1,000 women. Women in the age bracket of 20 to 34 years acount for 72.6% of all women with births.
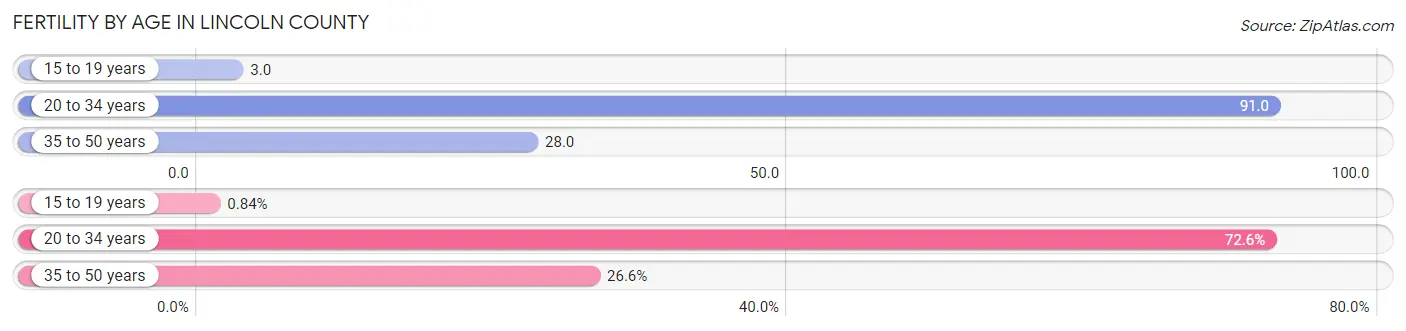
| Age Bracket | Women with Births | Births / 1,000 Women |
| 15 to 19 years | 3 (0.8%) | 3.0 |
| 20 to 34 years | 259 (72.6%) | 91.0 |
| 35 to 50 years | 95 (26.6%) | 28.0 |
| Total | 357 (100.0%) | 50.0 |
Fertility by Age by Marriage Status in Lincoln County
33.1% of women with births (357) in Lincoln County are married. The highest percentage of unmarried women with births falls into 15 to 19 years age bracket with 100.0% of them unmarried at the time of birth, while the lowest percentage of unmarried women with births belong to 20 to 34 years age bracket with 66.4% of them unmarried.
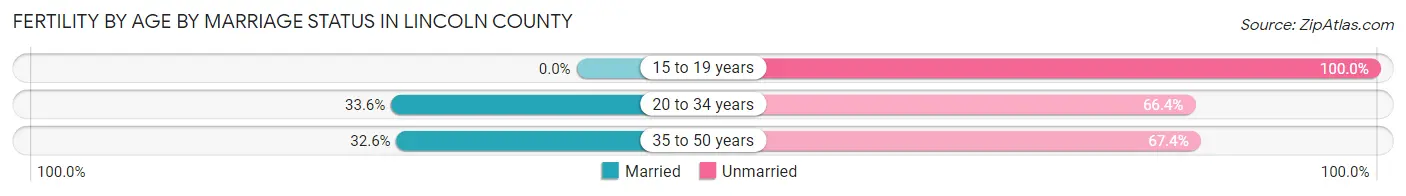
| Age Bracket | Married | Unmarried |
| 15 to 19 years | 0 (0.0%) | 3 (100.0%) |
| 20 to 34 years | 87 (33.6%) | 172 (66.4%) |
| 35 to 50 years | 31 (32.6%) | 64 (67.4%) |
| Total | 118 (33.1%) | 239 (66.9%) |
Fertility by Education in Lincoln County
Average fertility rate in Lincoln County is 50.0 births per 1,000 women. Women with the education attainment of college or associate's degree have the highest fertility rate of 69.0 births per 1,000 women, while women with the education attainment of less than high school have the lowest fertility at 33.0 births per 1,000 women. Women with the education attainment of college or associate's degree represent 45.4% of all women with births.
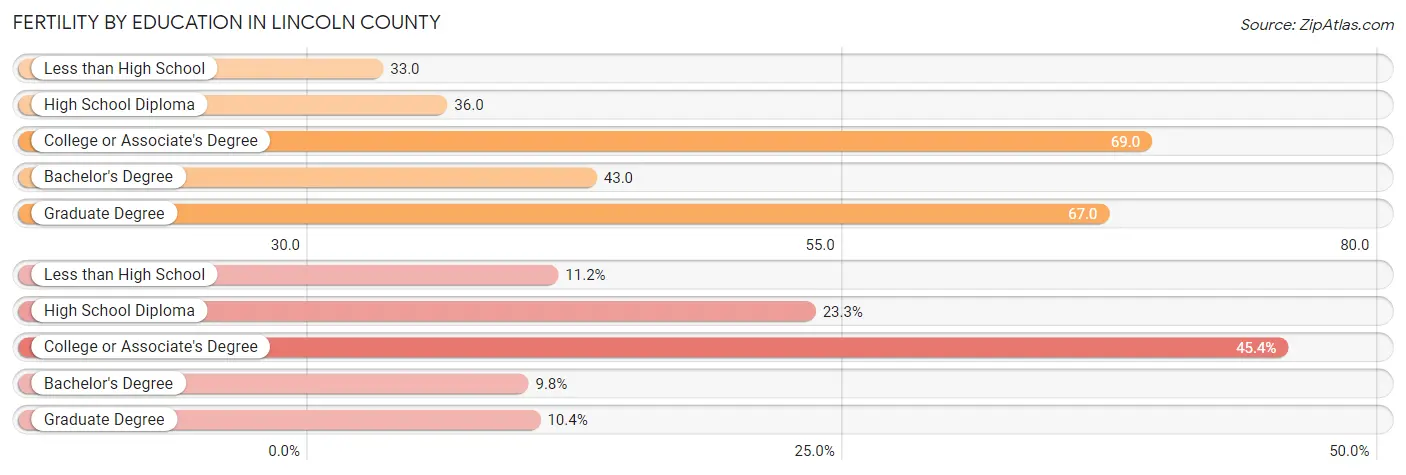
| Educational Attainment | Women with Births | Births / 1,000 Women |
| Less than High School | 40 (11.2%) | 33.0 |
| High School Diploma | 83 (23.3%) | 36.0 |
| College or Associate's Degree | 162 (45.4%) | 69.0 |
| Bachelor's Degree | 35 (9.8%) | 43.0 |
| Graduate Degree | 37 (10.4%) | 67.0 |
| Total | 357 (100.0%) | 50.0 |
Fertility by Education by Marriage Status in Lincoln County
66.9% of women with births in Lincoln County are unmarried. Women with the educational attainment of bachelor's degree are most likely to be married with 100.0% of them married at childbirth, while women with the educational attainment of less than high school are least likely to be married with 100.0% of them unmarried at childbirth.
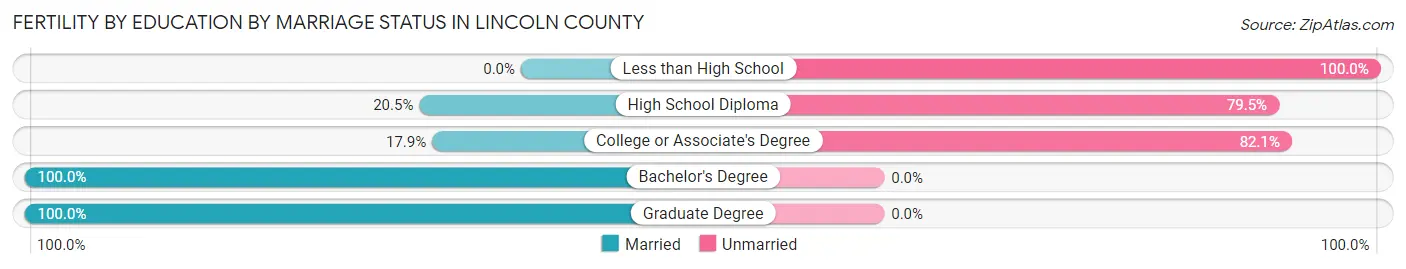
| Educational Attainment | Married | Unmarried |
| Less than High School | 0 (0.0%) | 40 (100.0%) |
| High School Diploma | 17 (20.5%) | 66 (79.5%) |
| College or Associate's Degree | 29 (17.9%) | 133 (82.1%) |
| Bachelor's Degree | 35 (100.0%) | 0 (0.0%) |
| Graduate Degree | 37 (100.0%) | 0 (0.0%) |
| Total | 118 (33.1%) | 239 (66.9%) |
Income in Lincoln County
Income Overview in Lincoln County
Per Capita Income in Lincoln County is $32,016, while median incomes of families and households are $82,042 and $61,374 respectively.
| Characteristic | Number | Measure |
| Per Capita Income | 35,365 | $32,016 |
| Median Family Income | 9,591 | $82,042 |
| Mean Family Income | 9,591 | $92,384 |
| Median Household Income | 14,304 | $61,374 |
| Mean Household Income | 14,304 | $77,234 |
| Income Deficit | 9,591 | $13,309 |
| Wage / Income Gap (%) | 35,365 | 28.31% |
| Wage / Income Gap ($) | 35,365 | 71.69¢ per $1 |
| Gini / Inequality Index | 35,365 | 0.43 |
Earnings by Sex in Lincoln County
Average Earnings in Lincoln County are $40,201, $46,221 for men and $33,135 for women, a difference of 28.3%.
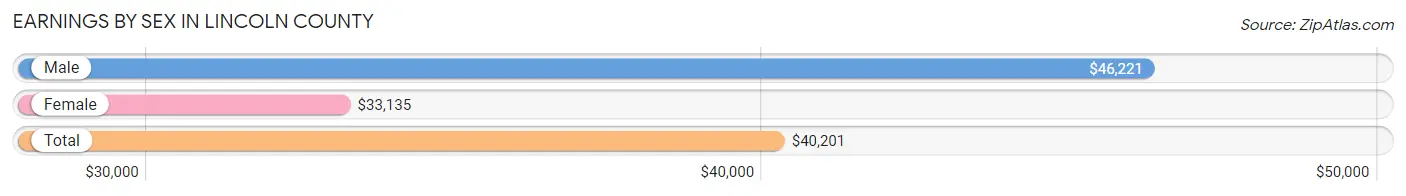
| Sex | Number | Average Earnings |
| Male | 9,653 (55.1%) | $46,221 |
| Female | 7,880 (44.9%) | $33,135 |
| Total | 17,533 (100.0%) | $40,201 |
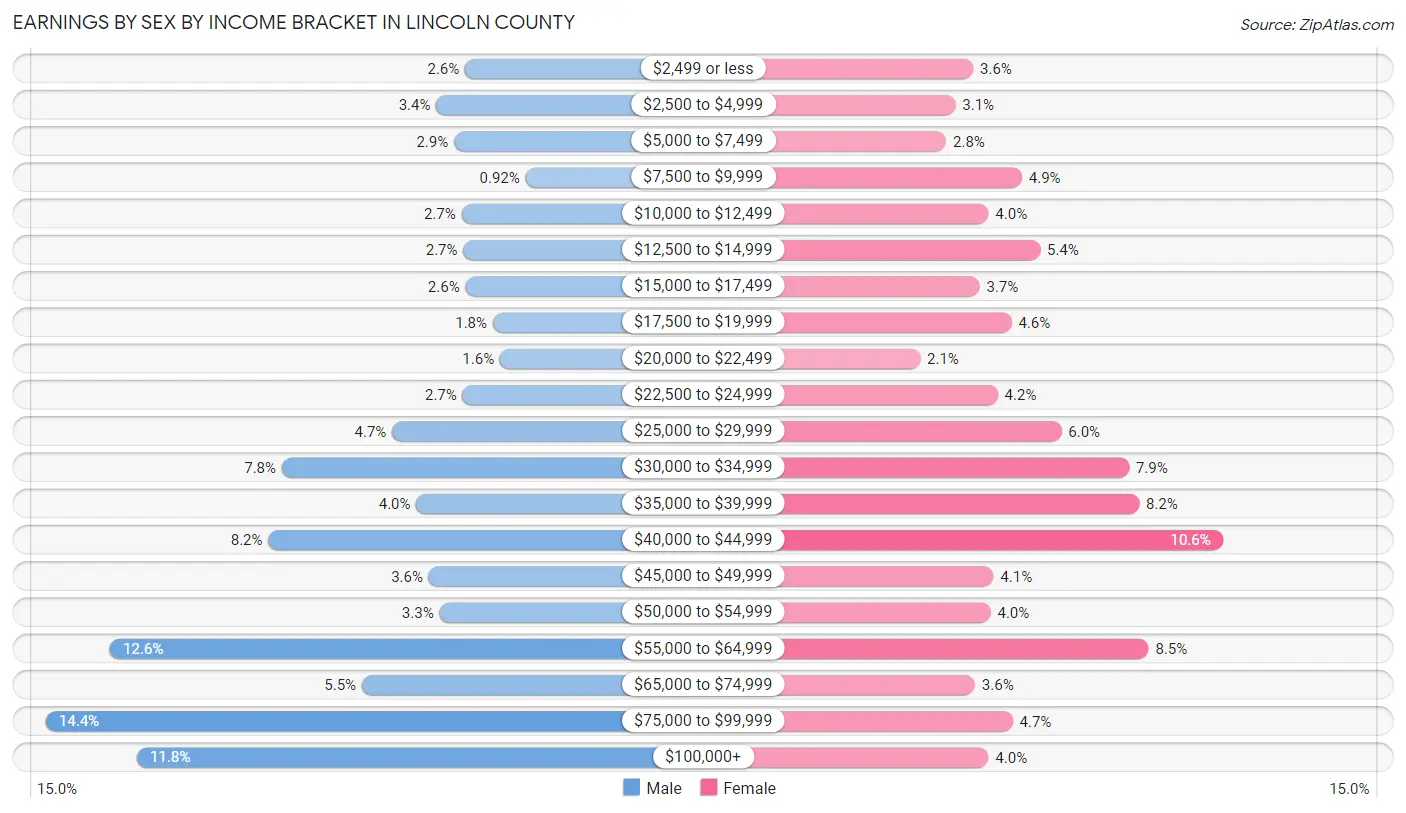
Earnings by Sex by Income Bracket in Lincoln County
The most common earnings brackets in Lincoln County are $75,000 to $99,999 for men (1,390 | 14.4%) and $40,000 to $44,999 for women (832 | 10.6%).
| Income | Male | Female |
| $2,499 or less | 253 (2.6%) | 280 (3.5%) |
| $2,500 to $4,999 | 331 (3.4%) | 240 (3.0%) |
| $5,000 to $7,499 | 283 (2.9%) | 220 (2.8%) |
| $7,500 to $9,999 | 89 (0.9%) | 388 (4.9%) |
| $10,000 to $12,499 | 263 (2.7%) | 314 (4.0%) |
| $12,500 to $14,999 | 258 (2.7%) | 428 (5.4%) |
| $15,000 to $17,499 | 252 (2.6%) | 294 (3.7%) |
| $17,500 to $19,999 | 178 (1.8%) | 365 (4.6%) |
| $20,000 to $22,499 | 158 (1.6%) | 162 (2.1%) |
| $22,500 to $24,999 | 260 (2.7%) | 334 (4.2%) |
| $25,000 to $29,999 | 451 (4.7%) | 475 (6.0%) |
| $30,000 to $34,999 | 750 (7.8%) | 625 (7.9%) |
| $35,000 to $39,999 | 385 (4.0%) | 647 (8.2%) |
| $40,000 to $44,999 | 787 (8.2%) | 832 (10.6%) |
| $45,000 to $49,999 | 351 (3.6%) | 325 (4.1%) |
| $50,000 to $54,999 | 322 (3.3%) | 318 (4.0%) |
| $55,000 to $64,999 | 1,216 (12.6%) | 668 (8.5%) |
| $65,000 to $74,999 | 533 (5.5%) | 284 (3.6%) |
| $75,000 to $99,999 | 1,390 (14.4%) | 367 (4.7%) |
| $100,000+ | 1,143 (11.8%) | 314 (4.0%) |
| Total | 9,653 (100.0%) | 7,880 (100.0%) |
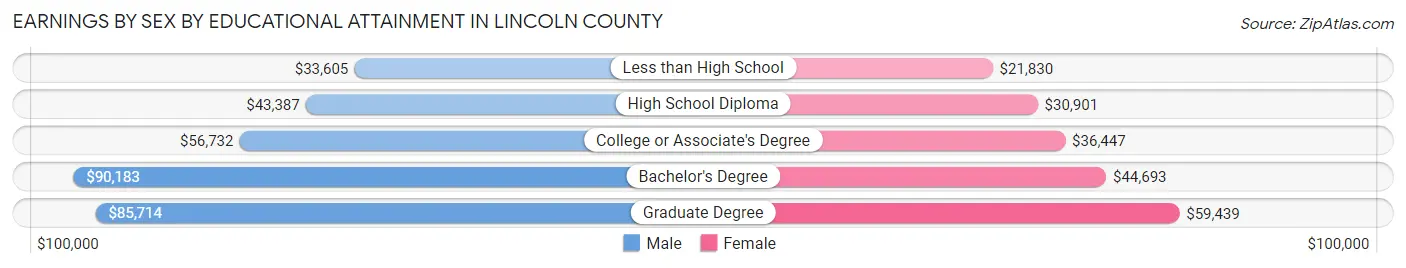
Earnings by Sex by Educational Attainment in Lincoln County
Average earnings in Lincoln County are $54,863 for men and $37,119 for women, a difference of 32.3%. Men with an educational attainment of bachelor's degree enjoy the highest average annual earnings of $90,183, while those with less than high school education earn the least with $33,605. Women with an educational attainment of graduate degree earn the most with the average annual earnings of $59,439, while those with less than high school education have the smallest earnings of $21,830.
| Educational Attainment | Male Income | Female Income |
| Less than High School | $33,605 | $21,830 |
| High School Diploma | $43,387 | $30,901 |
| College or Associate's Degree | $56,732 | $36,447 |
| Bachelor's Degree | $90,183 | $44,693 |
| Graduate Degree | $85,714 | $59,439 |
| Total | $54,863 | $37,119 |
Family Income in Lincoln County
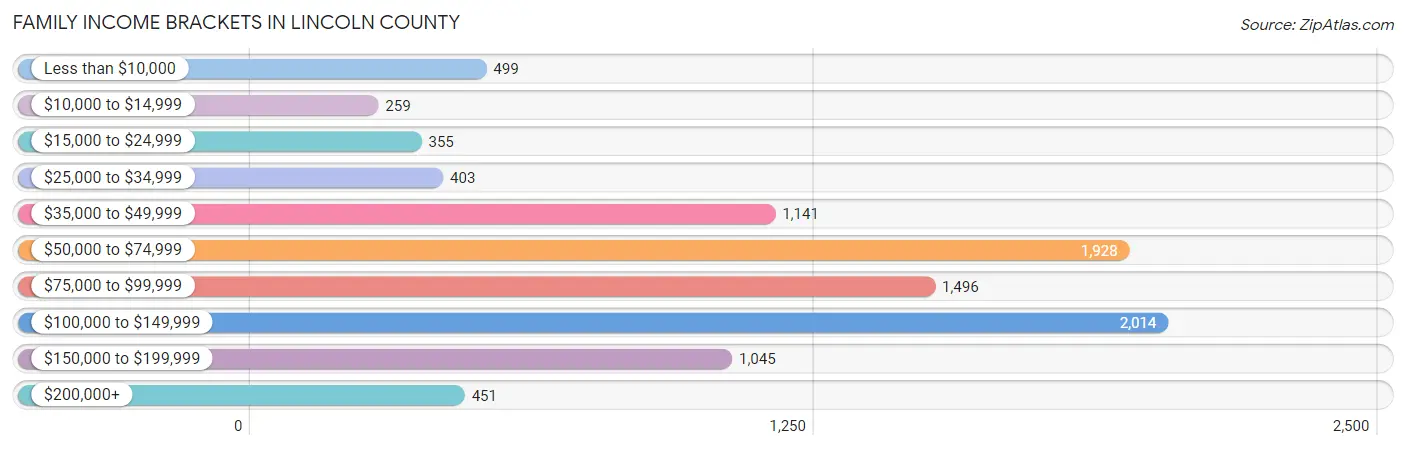
Family Income Brackets in Lincoln County
According to the Lincoln County family income data, there are 2,014 families falling into the $100,000 to $149,999 income range, which is the most common income bracket and makes up 21.0% of all families. Conversely, the $10,000 to $14,999 income bracket is the least frequent group with only 259 families (2.7%) belonging to this category.
| Income Bracket | # Families | % Families |
| Less than $10,000 | 499 | 5.2% |
| $10,000 to $14,999 | 259 | 2.7% |
| $15,000 to $24,999 | 355 | 3.7% |
| $25,000 to $34,999 | 403 | 4.2% |
| $35,000 to $49,999 | 1,141 | 11.9% |
| $50,000 to $74,999 | 1,928 | 20.1% |
| $75,000 to $99,999 | 1,496 | 15.6% |
| $100,000 to $149,999 | 2,014 | 21.0% |
| $150,000 to $199,999 | 1,045 | 10.9% |
| $200,000+ | 451 | 4.7% |
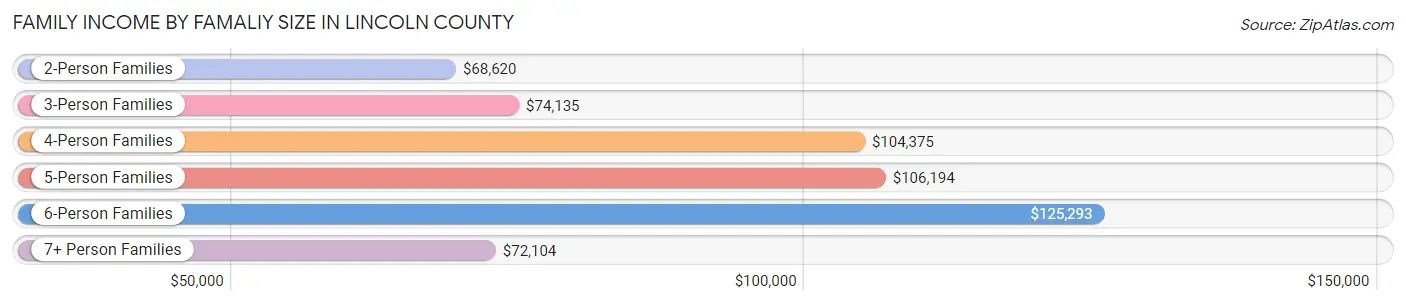
Family Income by Famaliy Size in Lincoln County
6-person families (199 | 2.1%) account for the highest median family income in Lincoln County with $125,293 per family, while 2-person families (4,765 | 49.7%) have the highest median income of $34,310 per family member.
| Income Bracket | # Families | Median Income |
| 2-Person Families | 4,765 (49.7%) | $68,620 |
| 3-Person Families | 2,530 (26.4%) | $74,135 |
| 4-Person Families | 1,326 (13.8%) | $104,375 |
| 5-Person Families | 702 (7.3%) | $106,194 |
| 6-Person Families | 199 (2.1%) | $125,293 |
| 7+ Person Families | 69 (0.7%) | $72,104 |
| Total | 9,591 (100.0%) | $82,042 |
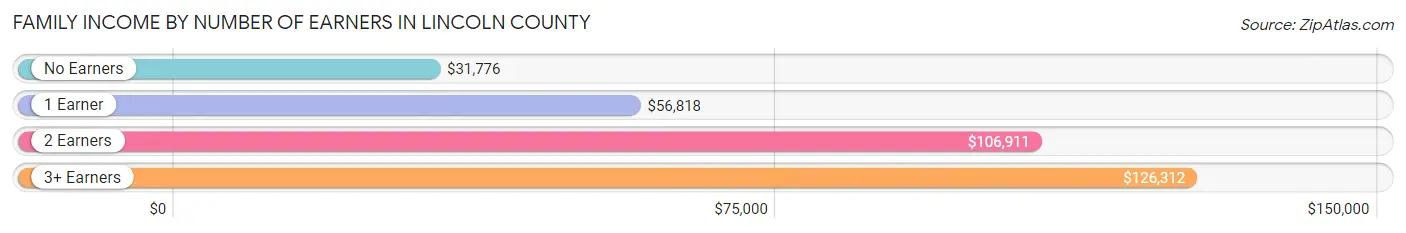
Family Income by Number of Earners in Lincoln County
The median family income in Lincoln County is $82,042, with families comprising 3+ earners (923) having the highest median family income of $126,312, while families with no earners (1,609) have the lowest median family income of $31,776, accounting for 9.6% and 16.8% of families, respectively.
| Number of Earners | # Families | Median Income |
| No Earners | 1,609 (16.8%) | $31,776 |
| 1 Earner | 3,296 (34.4%) | $56,818 |
| 2 Earners | 3,763 (39.2%) | $106,911 |
| 3+ Earners | 923 (9.6%) | $126,312 |
| Total | 9,591 (100.0%) | $82,042 |
Household Income in Lincoln County
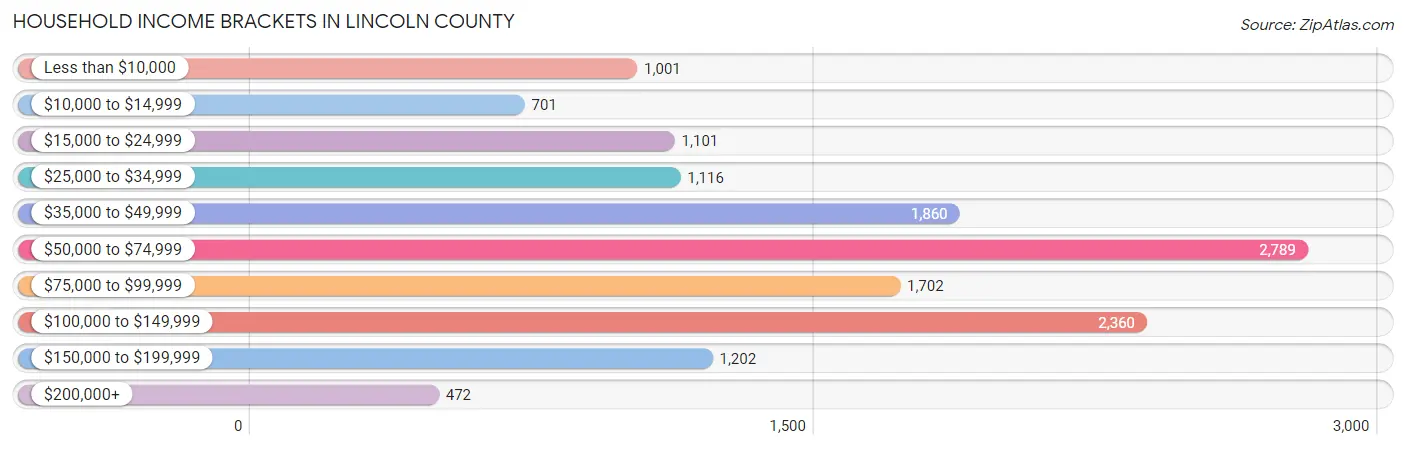
Household Income Brackets in Lincoln County
With 2,789 households falling in the category, the $50,000 to $74,999 income range is the most frequent in Lincoln County, accounting for 19.5% of all households. In contrast, only 472 households (3.3%) fall into the $200,000+ income bracket, making it the least populous group.
| Income Bracket | # Households | % Households |
| Less than $10,000 | 1,001 | 7.0% |
| $10,000 to $14,999 | 701 | 4.9% |
| $15,000 to $24,999 | 1,101 | 7.7% |
| $25,000 to $34,999 | 1,116 | 7.8% |
| $35,000 to $49,999 | 1,860 | 13.0% |
| $50,000 to $74,999 | 2,789 | 19.5% |
| $75,000 to $99,999 | 1,702 | 11.9% |
| $100,000 to $149,999 | 2,360 | 16.5% |
| $150,000 to $199,999 | 1,202 | 8.4% |
| $200,000+ | 472 | 3.3% |
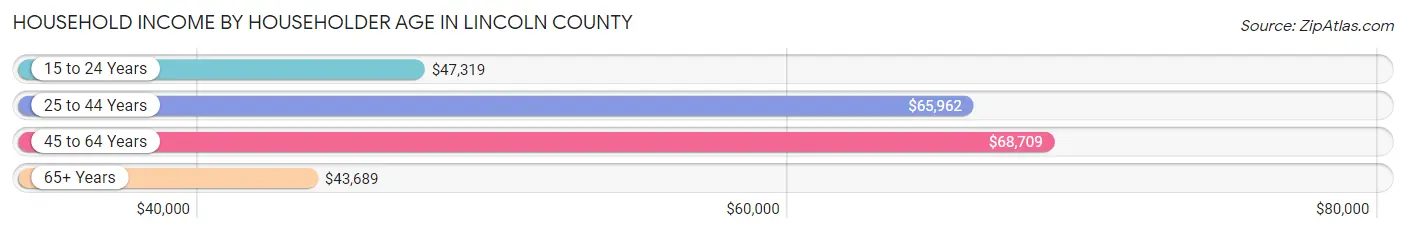
Household Income by Householder Age in Lincoln County
The median household income in Lincoln County is $61,374, with the highest median household income of $68,709 found in the 45 to 64 years age bracket for the primary householder. A total of 5,791 households (40.5%) fall into this category. Meanwhile, the 65+ years age bracket for the primary householder has the lowest median household income of $43,689, with 4,178 households (29.2%) in this group.
| Income Bracket | # Households | Median Income |
| 15 to 24 Years | 493 (3.5%) | $47,319 |
| 25 to 44 Years | 3,842 (26.9%) | $65,962 |
| 45 to 64 Years | 5,791 (40.5%) | $68,709 |
| 65+ Years | 4,178 (29.2%) | $43,689 |
| Total | 14,304 (100.0%) | $61,374 |
Poverty in Lincoln County
Income Below Poverty by Sex and Age in Lincoln County
With 11.2% poverty level for males and 12.7% for females among the residents of Lincoln County, 5 year old males and under 5 year old females are the most vulnerable to poverty, with 48 males (37.8%) and 149 females (18.0%) in their respective age groups living below the poverty level.
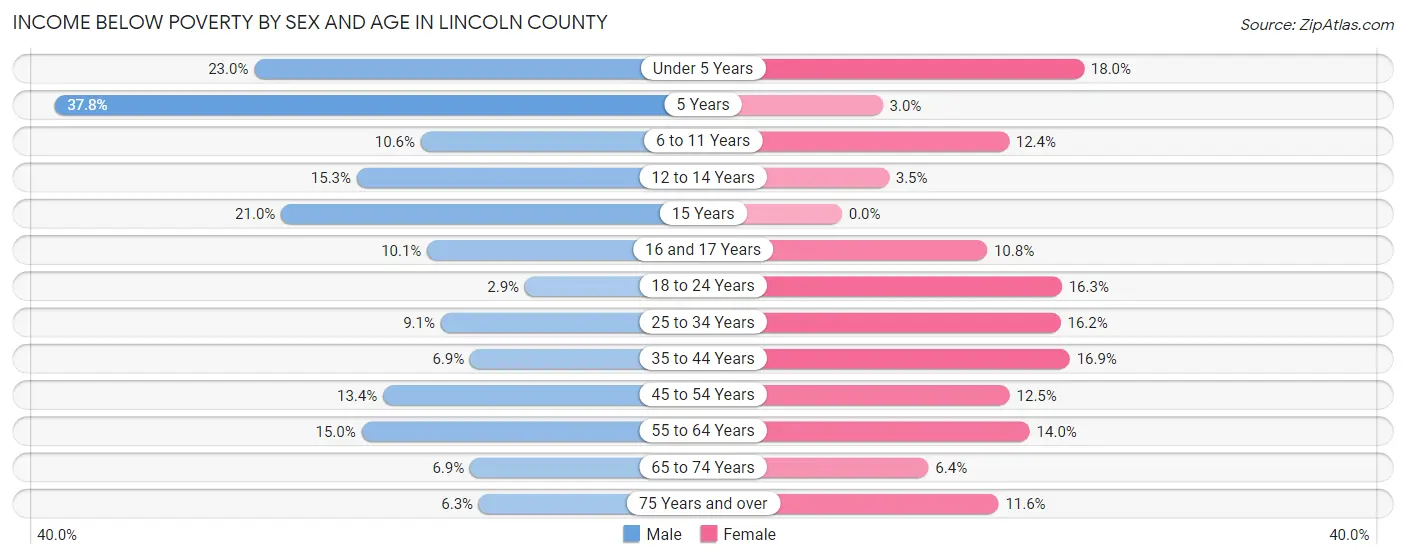
| Age Bracket | Male | Female |
| Under 5 Years | 263 (23.0%) | 149 (18.0%) |
| 5 Years | 48 (37.8%) | 2 (3.0%) |
| 6 to 11 Years | 114 (10.6%) | 182 (12.4%) |
| 12 to 14 Years | 134 (15.3%) | 26 (3.5%) |
| 15 Years | 53 (20.9%) | 0 (0.0%) |
| 16 and 17 Years | 46 (10.1%) | 36 (10.8%) |
| 18 to 24 Years | 42 (2.9%) | 201 (16.3%) |
| 25 to 34 Years | 182 (9.1%) | 314 (16.2%) |
| 35 to 44 Years | 128 (6.9%) | 334 (16.9%) |
| 45 to 54 Years | 321 (13.4%) | 295 (12.5%) |
| 55 to 64 Years | 395 (15.0%) | 379 (14.0%) |
| 65 to 74 Years | 125 (6.9%) | 135 (6.4%) |
| 75 Years and over | 70 (6.3%) | 173 (11.6%) |
| Total | 1,921 (11.2%) | 2,226 (12.7%) |
Income Above Poverty by Sex and Age in Lincoln County
According to the poverty statistics in Lincoln County, males aged 18 to 24 years and females aged 15 years are the age groups that are most secure financially, with 97.2% of males and 100.0% of females in these age groups living above the poverty line.
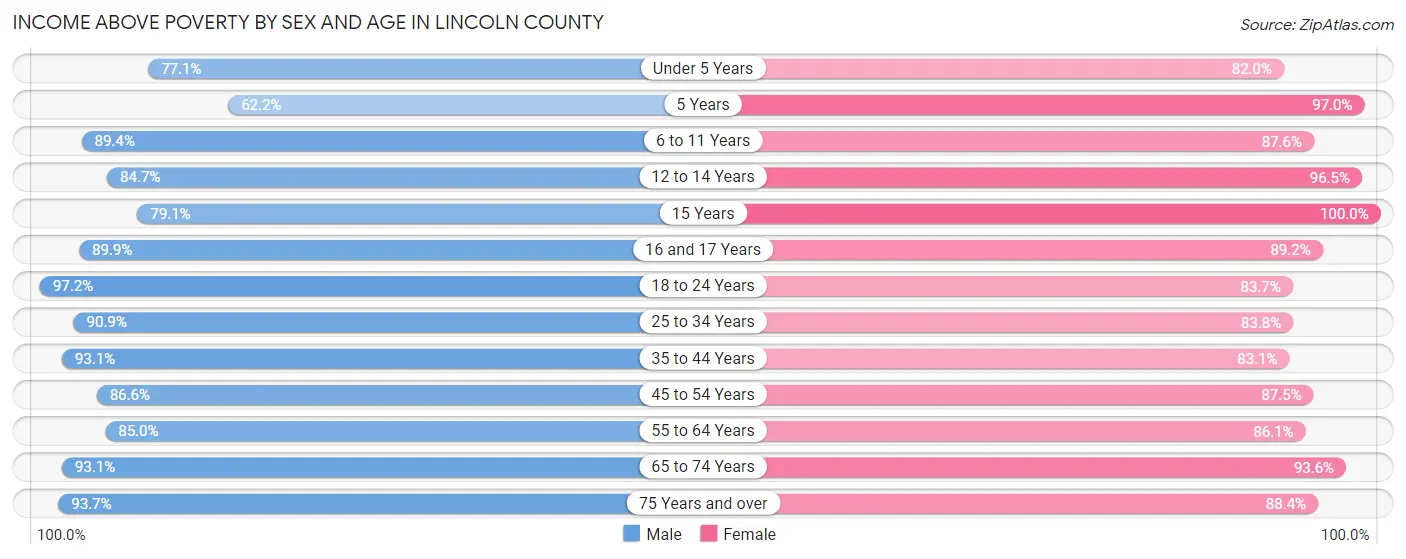
| Age Bracket | Male | Female |
| Under 5 Years | 883 (77.0%) | 680 (82.0%) |
| 5 Years | 79 (62.2%) | 64 (97.0%) |
| 6 to 11 Years | 964 (89.4%) | 1,286 (87.6%) |
| 12 to 14 Years | 740 (84.7%) | 718 (96.5%) |
| 15 Years | 200 (79.0%) | 268 (100.0%) |
| 16 and 17 Years | 409 (89.9%) | 298 (89.2%) |
| 18 to 24 Years | 1,433 (97.2%) | 1,030 (83.7%) |
| 25 to 34 Years | 1,818 (90.9%) | 1,619 (83.8%) |
| 35 to 44 Years | 1,720 (93.1%) | 1,640 (83.1%) |
| 45 to 54 Years | 2,076 (86.6%) | 2,072 (87.5%) |
| 55 to 64 Years | 2,242 (85.0%) | 2,337 (86.1%) |
| 65 to 74 Years | 1,679 (93.1%) | 1,965 (93.6%) |
| 75 Years and over | 1,046 (93.7%) | 1,314 (88.4%) |
| Total | 15,289 (88.8%) | 15,291 (87.3%) |
Income Below Poverty Among Married-Couple Families in Lincoln County
The poverty statistics for married-couple families in Lincoln County show that 6.0% or 427 of the total 7,143 families live below the poverty line. Families with 3 or 4 children have the highest poverty rate of 13.2%, comprising of 71 families. On the other hand, families with 1 or 2 children have the lowest poverty rate of 1.1%, which includes 24 families.
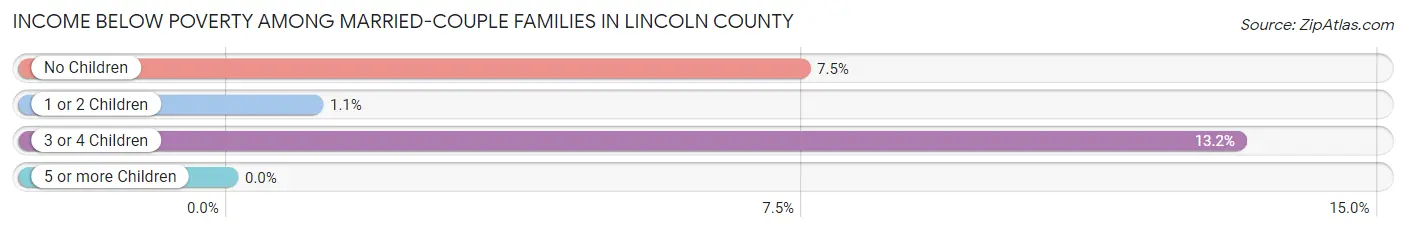
| Children | Above Poverty | Below Poverty |
| No Children | 4,115 (92.5%) | 332 (7.5%) |
| 1 or 2 Children | 2,133 (98.9%) | 24 (1.1%) |
| 3 or 4 Children | 468 (86.8%) | 71 (13.2%) |
| 5 or more Children | 0 (0.0%) | 0 (0.0%) |
| Total | 6,716 (94.0%) | 427 (6.0%) |
Income Below Poverty Among Single-Parent Households in Lincoln County
According to the poverty data in Lincoln County, 5.5% or 43 single-father households and 26.5% or 440 single-mother households are living below the poverty line. Among single-father households, those with 1 or 2 children have the highest poverty rate, with 25 households (6.6%) experiencing poverty. Likewise, among single-mother households, those with 3 or 4 children have the highest poverty rate, with 83 households (43.7%) falling below the poverty line.
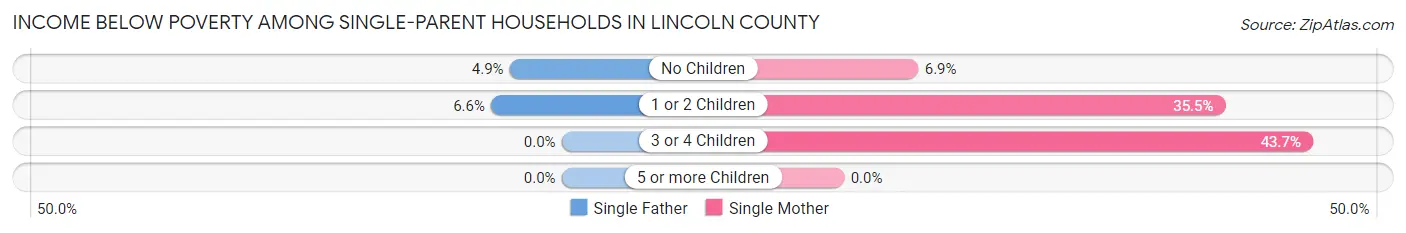
| Children | Single Father | Single Mother |
| No Children | 18 (4.9%) | 40 (6.9%) |
| 1 or 2 Children | 25 (6.6%) | 317 (35.5%) |
| 3 or 4 Children | 0 (0.0%) | 83 (43.7%) |
| 5 or more Children | 0 (0.0%) | 0 (0.0%) |
| Total | 43 (5.5%) | 440 (26.5%) |
Income Below Poverty Among Married-Couple vs Single-Parent Households in Lincoln County
The poverty data for Lincoln County shows that 427 of the married-couple family households (6.0%) and 483 of the single-parent households (19.7%) are living below the poverty level. Within the married-couple family households, those with 3 or 4 children have the highest poverty rate, with 71 households (13.2%) falling below the poverty line. Among the single-parent households, those with 3 or 4 children have the highest poverty rate, with 83 household (36.9%) living below poverty.
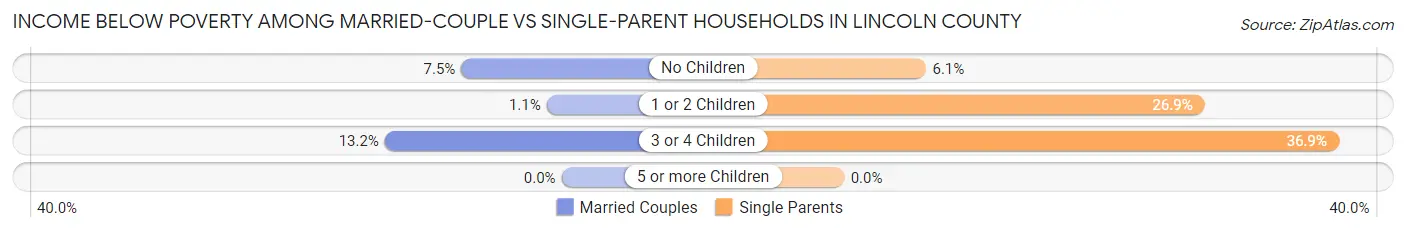
| Children | Married-Couple Families | Single-Parent Households |
| No Children | 332 (7.5%) | 58 (6.1%) |
| 1 or 2 Children | 24 (1.1%) | 342 (26.9%) |
| 3 or 4 Children | 71 (13.2%) | 83 (36.9%) |
| 5 or more Children | 0 (0.0%) | 0 (0.0%) |
| Total | 427 (6.0%) | 483 (19.7%) |
Employment Characteristics in Lincoln County
Employment by Class of Employer in Lincoln County
Among the 15,839 employed individuals in Lincoln County, private company employees (10,802 | 68.2%), local government employees (1,504 | 9.5%), and self-employed (not incorporated) (1,169 | 7.4%) make up the most common classes of employment.
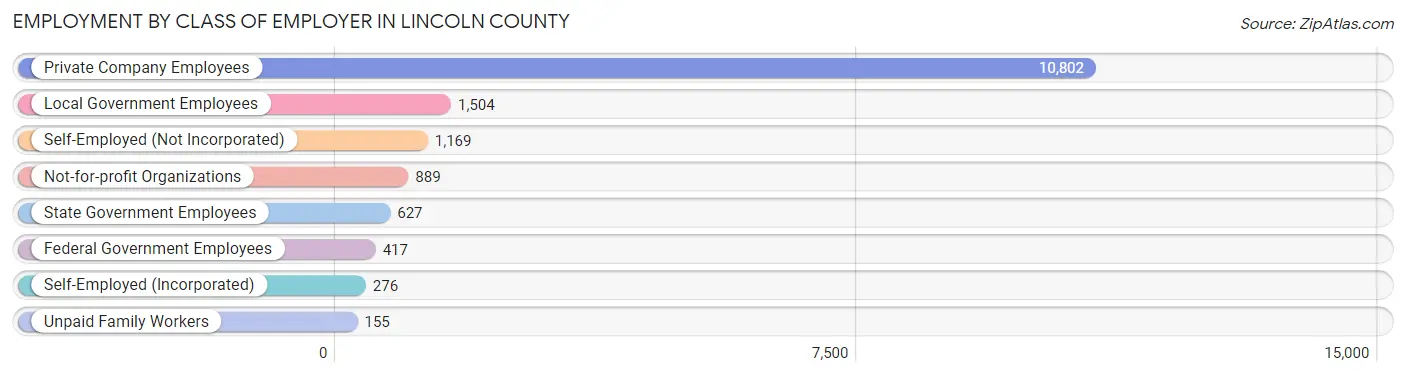
| Employer Class | # Employees | % Employees |
| Private Company Employees | 10,802 | 68.2% |
| Self-Employed (Incorporated) | 276 | 1.7% |
| Self-Employed (Not Incorporated) | 1,169 | 7.4% |
| Not-for-profit Organizations | 889 | 5.6% |
| Local Government Employees | 1,504 | 9.5% |
| State Government Employees | 627 | 4.0% |
| Federal Government Employees | 417 | 2.6% |
| Unpaid Family Workers | 155 | 1.0% |
| Total | 15,839 | 100.0% |
Employment Status by Age in Lincoln County
According to the labor force statistics for Lincoln County, out of the total population over 16 years of age (28,313), 59.2% or 16,761 individuals are in the labor force, with 4.3% or 721 of them unemployed. The age group with the highest labor force participation rate is 30 to 34 years, with 85.3% or 1,608 individuals in the labor force. Within the labor force, the 16 to 19 years age range has the highest percentage of unemployed individuals, with 17.7% or 145 of them being unemployed.
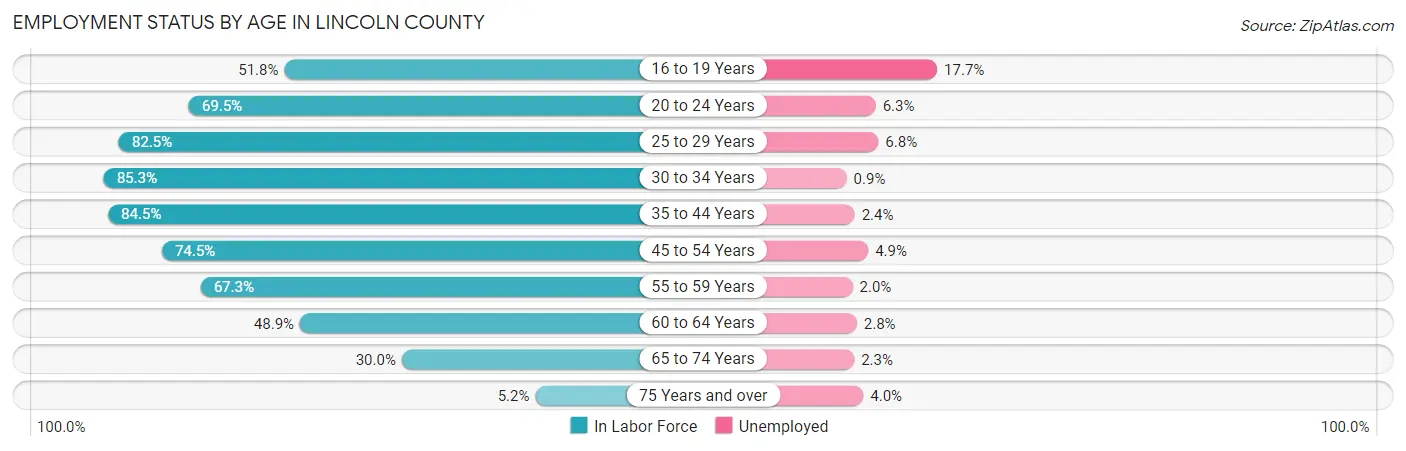
| Age Bracket | In Labor Force | Unemployed |
| 16 to 19 Years | 822 (51.8%) | 145 (17.7%) |
| 20 to 24 Years | 1,360 (69.5%) | 86 (6.3%) |
| 25 to 29 Years | 1,702 (82.5%) | 116 (6.8%) |
| 30 to 34 Years | 1,608 (85.3%) | 14 (0.9%) |
| 35 to 44 Years | 3,265 (84.5%) | 78 (2.4%) |
| 45 to 54 Years | 3,563 (74.5%) | 175 (4.9%) |
| 55 to 59 Years | 1,777 (67.3%) | 36 (2.0%) |
| 60 to 64 Years | 1,334 (48.9%) | 37 (2.8%) |
| 65 to 74 Years | 1,187 (30.0%) | 27 (2.3%) |
| 75 Years and over | 148 (5.2%) | 6 (4.0%) |
| Total | 16,761 (59.2%) | 721 (4.3%) |
Employment Status by Educational Attainment in Lincoln County
According to labor force statistics for Lincoln County, 73.8% of individuals (13,256) out of the total population between 25 and 64 years of age (17,962) are in the labor force, with 3.4% or 451 of them being unemployed. The group with the highest labor force participation rate are those with the educational attainment of bachelor's degree or higher, with 83.4% or 2,932 individuals in the labor force. Within the labor force, individuals with less than high school education have the highest percentage of unemployment, with 6.4% or 45 of them being unemployed.
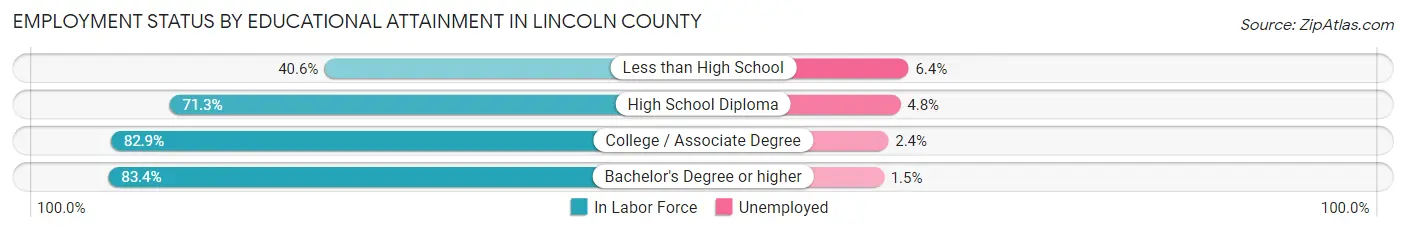
| Educational Attainment | In Labor Force | Unemployed |
| Less than High School | 708 (40.6%) | 112 (6.4%) |
| High School Diploma | 5,681 (71.3%) | 382 (4.8%) |
| College / Associate Degree | 3,925 (82.9%) | 114 (2.4%) |
| Bachelor's Degree or higher | 2,932 (83.4%) | 53 (1.5%) |
| Total | 13,256 (73.8%) | 611 (3.4%) |
Employment Occupations by Sex in Lincoln County
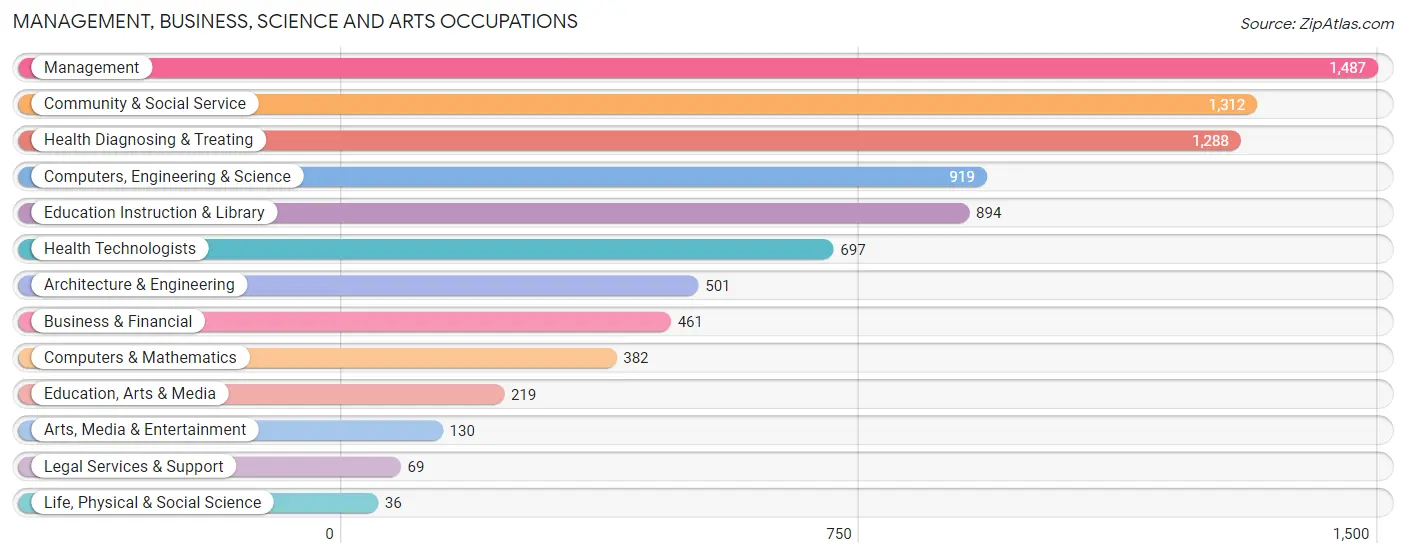
Management, Business, Science and Arts Occupations
The most common Management, Business, Science and Arts occupations in Lincoln County are Management (1,487 | 9.3%), Community & Social Service (1,312 | 8.2%), Health Diagnosing & Treating (1,288 | 8.0%), Computers, Engineering & Science (919 | 5.7%), and Education Instruction & Library (894 | 5.6%).
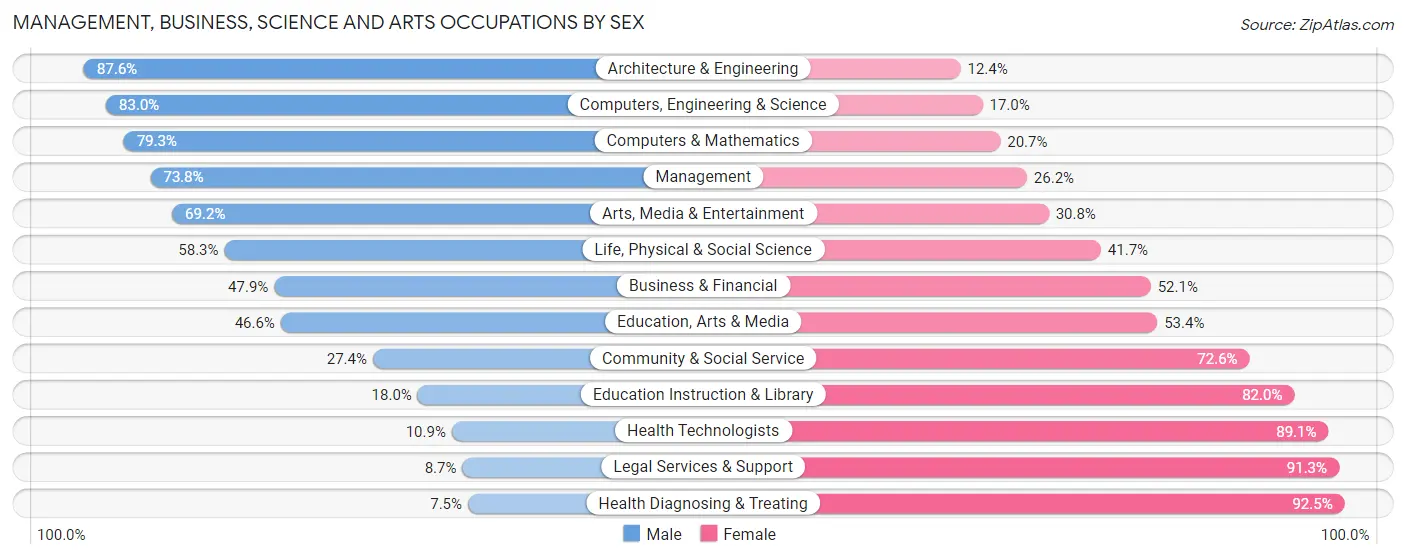
Management, Business, Science and Arts Occupations by Sex
Within the Management, Business, Science and Arts occupations in Lincoln County, the most male-oriented occupations are Architecture & Engineering (87.6%), Computers, Engineering & Science (83.0%), and Computers & Mathematics (79.3%), while the most female-oriented occupations are Health Diagnosing & Treating (92.5%), Legal Services & Support (91.3%), and Health Technologists (89.1%).
| Occupation | Male | Female |
| Management | 1,097 (73.8%) | 390 (26.2%) |
| Business & Financial | 221 (47.9%) | 240 (52.1%) |
| Computers, Engineering & Science | 763 (83.0%) | 156 (17.0%) |
| Computers & Mathematics | 303 (79.3%) | 79 (20.7%) |
| Architecture & Engineering | 439 (87.6%) | 62 (12.4%) |
| Life, Physical & Social Science | 21 (58.3%) | 15 (41.7%) |
| Community & Social Service | 359 (27.4%) | 953 (72.6%) |
| Education, Arts & Media | 102 (46.6%) | 117 (53.4%) |
| Legal Services & Support | 6 (8.7%) | 63 (91.3%) |
| Education Instruction & Library | 161 (18.0%) | 733 (82.0%) |
| Arts, Media & Entertainment | 90 (69.2%) | 40 (30.8%) |
| Health Diagnosing & Treating | 97 (7.5%) | 1,191 (92.5%) |
| Health Technologists | 76 (10.9%) | 621 (89.1%) |
| Total (Category) | 2,537 (46.4%) | 2,930 (53.6%) |
| Total (Overall) | 8,784 (54.8%) | 7,251 (45.2%) |
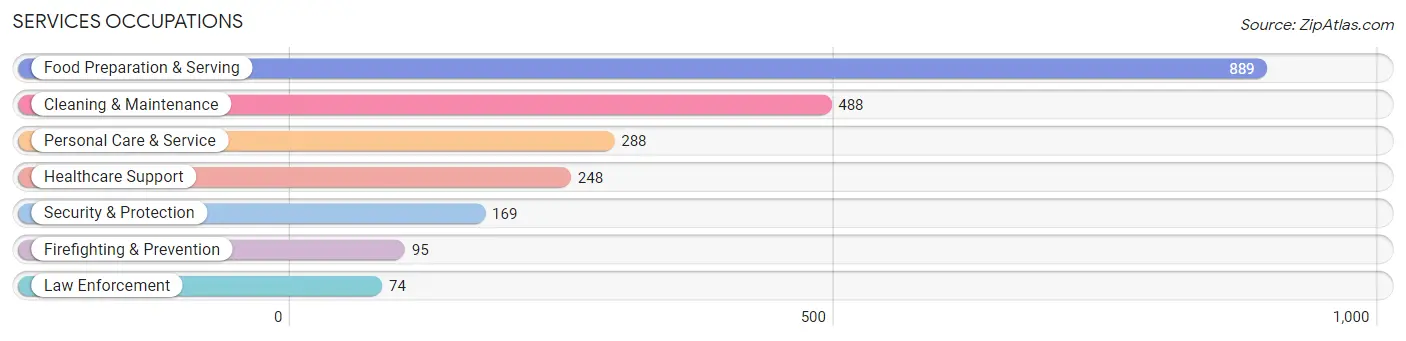
Services Occupations
The most common Services occupations in Lincoln County are Food Preparation & Serving (889 | 5.5%), Cleaning & Maintenance (488 | 3.0%), Personal Care & Service (288 | 1.8%), Healthcare Support (248 | 1.5%), and Security & Protection (169 | 1.1%).
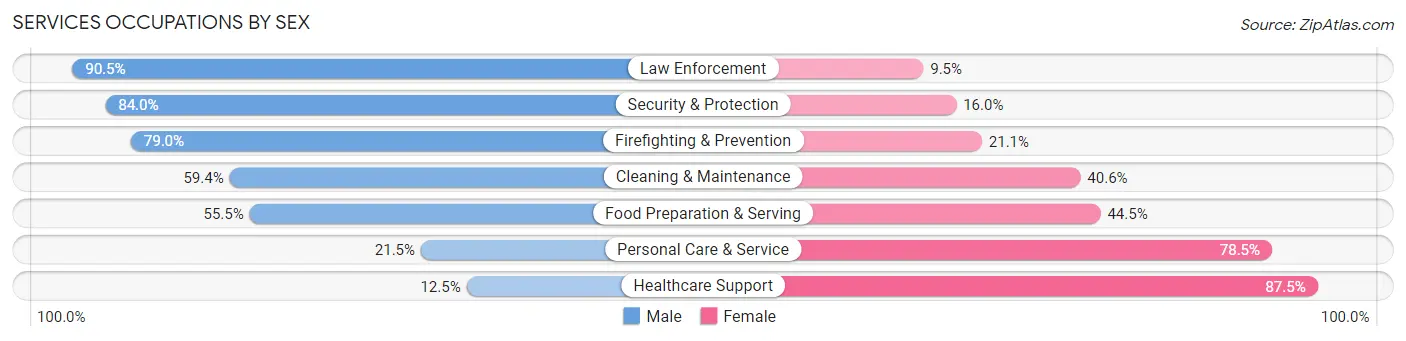
Services Occupations by Sex
Within the Services occupations in Lincoln County, the most male-oriented occupations are Law Enforcement (90.5%), Security & Protection (84.0%), and Firefighting & Prevention (78.9%), while the most female-oriented occupations are Healthcare Support (87.5%), Personal Care & Service (78.5%), and Food Preparation & Serving (44.5%).
| Occupation | Male | Female |
| Healthcare Support | 31 (12.5%) | 217 (87.5%) |
| Security & Protection | 142 (84.0%) | 27 (16.0%) |
| Firefighting & Prevention | 75 (78.9%) | 20 (21.0%) |
| Law Enforcement | 67 (90.5%) | 7 (9.5%) |
| Food Preparation & Serving | 493 (55.5%) | 396 (44.5%) |
| Cleaning & Maintenance | 290 (59.4%) | 198 (40.6%) |
| Personal Care & Service | 62 (21.5%) | 226 (78.5%) |
| Total (Category) | 1,018 (48.9%) | 1,064 (51.1%) |
| Total (Overall) | 8,784 (54.8%) | 7,251 (45.2%) |
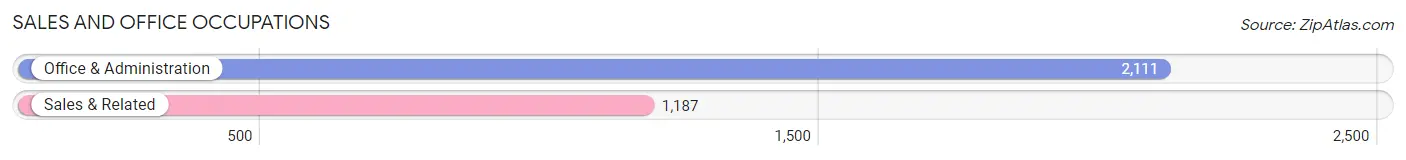
Sales and Office Occupations
The most common Sales and Office occupations in Lincoln County are Office & Administration (2,111 | 13.2%), and Sales & Related (1,187 | 7.4%).
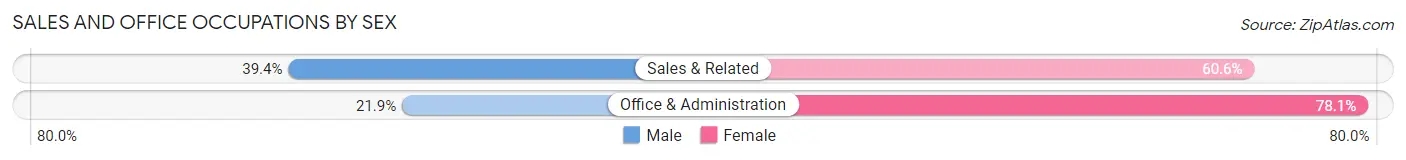
Sales and Office Occupations by Sex
| Occupation | Male | Female |
| Sales & Related | 468 (39.4%) | 719 (60.6%) |
| Office & Administration | 463 (21.9%) | 1,648 (78.1%) |
| Total (Category) | 931 (28.2%) | 2,367 (71.8%) |
| Total (Overall) | 8,784 (54.8%) | 7,251 (45.2%) |
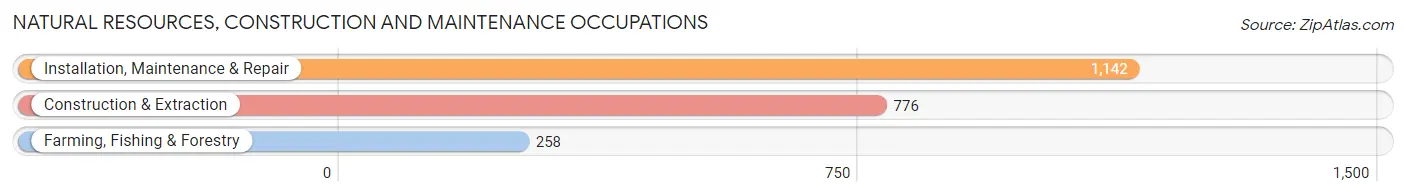
Natural Resources, Construction and Maintenance Occupations
The most common Natural Resources, Construction and Maintenance occupations in Lincoln County are Installation, Maintenance & Repair (1,142 | 7.1%), Construction & Extraction (776 | 4.8%), and Farming, Fishing & Forestry (258 | 1.6%).
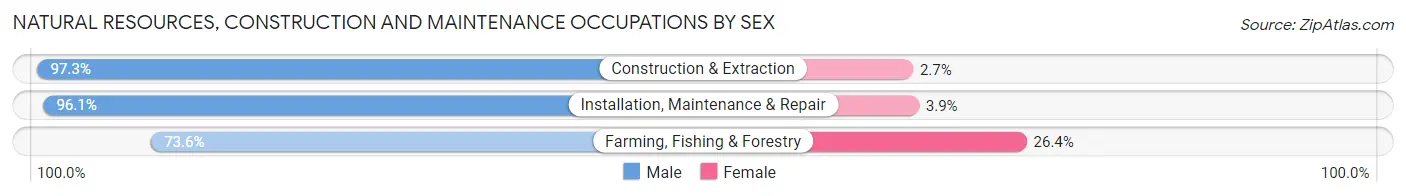
Natural Resources, Construction and Maintenance Occupations by Sex
| Occupation | Male | Female |
| Farming, Fishing & Forestry | 190 (73.6%) | 68 (26.4%) |
| Construction & Extraction | 755 (97.3%) | 21 (2.7%) |
| Installation, Maintenance & Repair | 1,097 (96.1%) | 45 (3.9%) |
| Total (Category) | 2,042 (93.8%) | 134 (6.2%) |
| Total (Overall) | 8,784 (54.8%) | 7,251 (45.2%) |
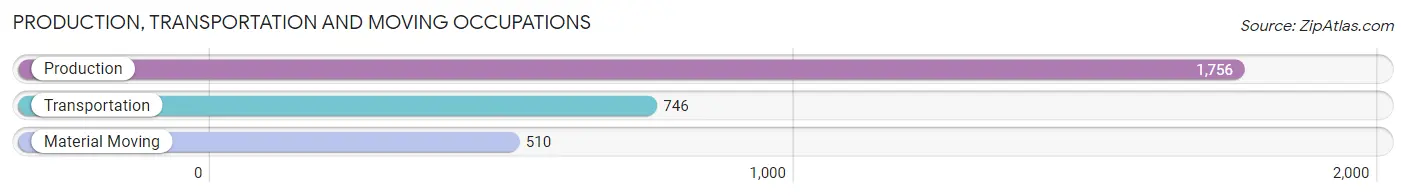
Production, Transportation and Moving Occupations
The most common Production, Transportation and Moving occupations in Lincoln County are Production (1,756 | 11.0%), Transportation (746 | 4.6%), and Material Moving (510 | 3.2%).
Production, Transportation and Moving Occupations by Sex
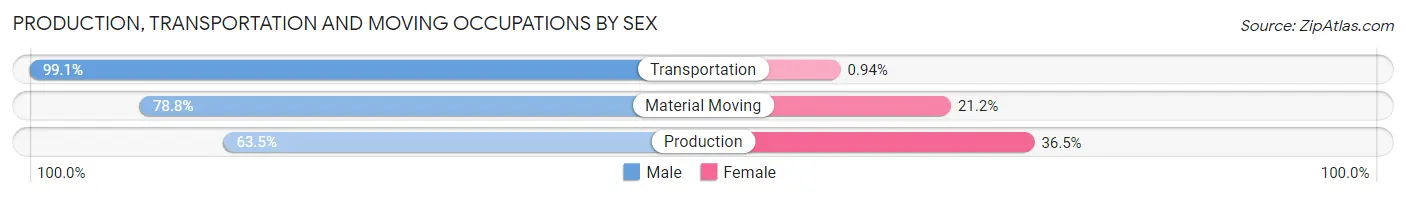
| Occupation | Male | Female |
| Production | 1,115 (63.5%) | 641 (36.5%) |
| Transportation | 739 (99.1%) | 7 (0.9%) |
| Material Moving | 402 (78.8%) | 108 (21.2%) |
| Total (Category) | 2,256 (74.9%) | 756 (25.1%) |
| Total (Overall) | 8,784 (54.8%) | 7,251 (45.2%) |
Employment Industries by Sex in Lincoln County
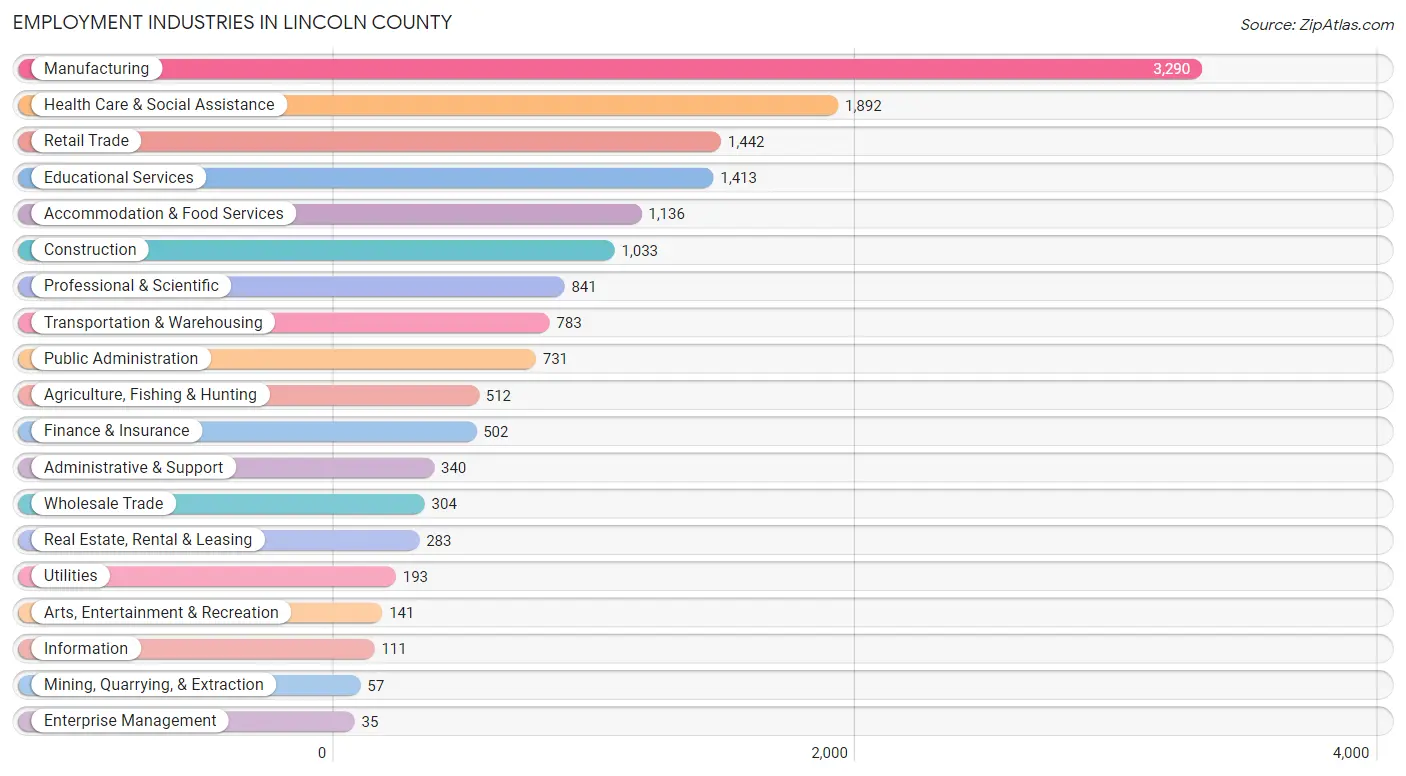
Employment Industries in Lincoln County
The major employment industries in Lincoln County include Manufacturing (3,290 | 20.5%), Health Care & Social Assistance (1,892 | 11.8%), Retail Trade (1,442 | 9.0%), Educational Services (1,413 | 8.8%), and Accommodation & Food Services (1,136 | 7.1%).
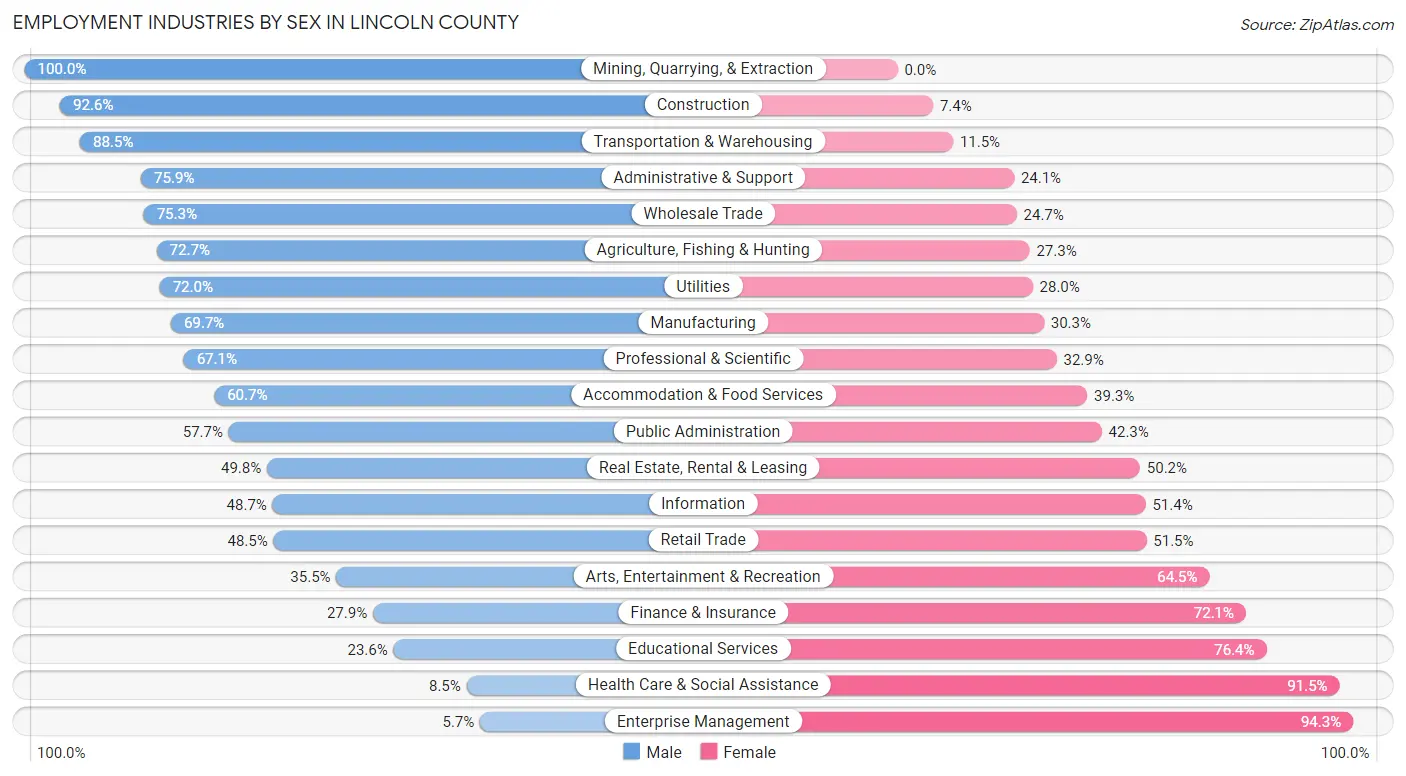
Employment Industries by Sex in Lincoln County
The Lincoln County industries that see more men than women are Mining, Quarrying, & Extraction (100.0%), Construction (92.6%), and Transportation & Warehousing (88.5%), whereas the industries that tend to have a higher number of women are Enterprise Management (94.3%), Health Care & Social Assistance (91.5%), and Educational Services (76.4%).
| Industry | Male | Female |
| Agriculture, Fishing & Hunting | 372 (72.7%) | 140 (27.3%) |
| Mining, Quarrying, & Extraction | 57 (100.0%) | 0 (0.0%) |
| Construction | 957 (92.6%) | 76 (7.4%) |
| Manufacturing | 2,293 (69.7%) | 997 (30.3%) |
| Wholesale Trade | 229 (75.3%) | 75 (24.7%) |
| Retail Trade | 699 (48.5%) | 743 (51.5%) |
| Transportation & Warehousing | 693 (88.5%) | 90 (11.5%) |
| Utilities | 139 (72.0%) | 54 (28.0%) |
| Information | 54 (48.6%) | 57 (51.3%) |
| Finance & Insurance | 140 (27.9%) | 362 (72.1%) |
| Real Estate, Rental & Leasing | 141 (49.8%) | 142 (50.2%) |
| Professional & Scientific | 564 (67.1%) | 277 (32.9%) |
| Enterprise Management | 2 (5.7%) | 33 (94.3%) |
| Administrative & Support | 258 (75.9%) | 82 (24.1%) |
| Educational Services | 334 (23.6%) | 1,079 (76.4%) |
| Health Care & Social Assistance | 161 (8.5%) | 1,731 (91.5%) |
| Arts, Entertainment & Recreation | 50 (35.5%) | 91 (64.5%) |
| Accommodation & Food Services | 690 (60.7%) | 446 (39.3%) |
| Public Administration | 422 (57.7%) | 309 (42.3%) |
| Total | 8,784 (54.8%) | 7,251 (45.2%) |
Education in Lincoln County
School Enrollment in Lincoln County
The most common levels of schooling among the 7,787 students in Lincoln County are middle school (2,087 | 26.8%), high school (1,797 | 23.1%), and elementary school (1,729 | 22.2%).
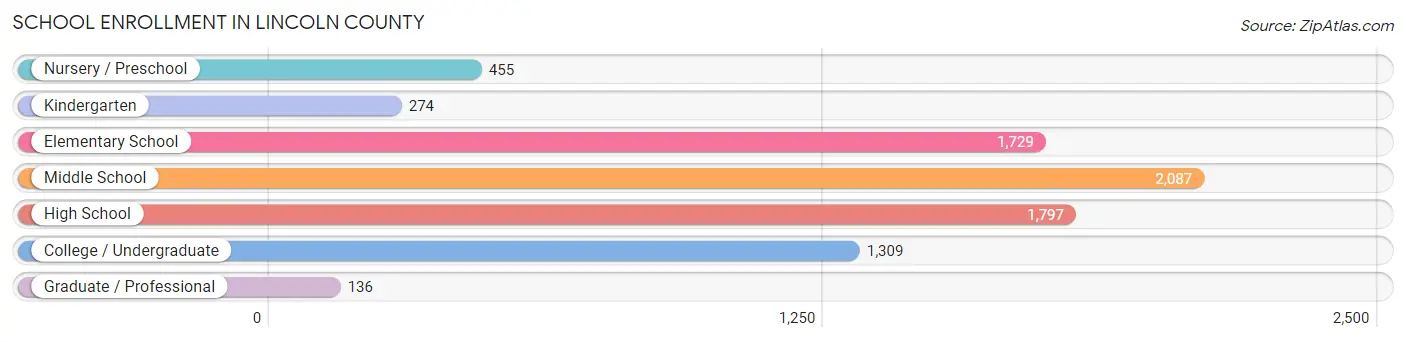
| School Level | # Students | % Students |
| Nursery / Preschool | 455 | 5.8% |
| Kindergarten | 274 | 3.5% |
| Elementary School | 1,729 | 22.2% |
| Middle School | 2,087 | 26.8% |
| High School | 1,797 | 23.1% |
| College / Undergraduate | 1,309 | 16.8% |
| Graduate / Professional | 136 | 1.8% |
| Total | 7,787 | 100.0% |
School Enrollment by Age by Funding Source in Lincoln County
Out of a total of 7,787 students who are enrolled in schools in Lincoln County, 709 (9.1%) attend a private institution, while the remaining 7,078 (90.9%) are enrolled in public schools. The age group of 18 to 19 year olds has the highest likelihood of being enrolled in private schools, with 91 (16.5% in the age bracket) enrolled. Conversely, the age group of 3 to 4 year olds has the lowest likelihood of being enrolled in a private school, with 411 (97.6% in the age bracket) attending a public institution.
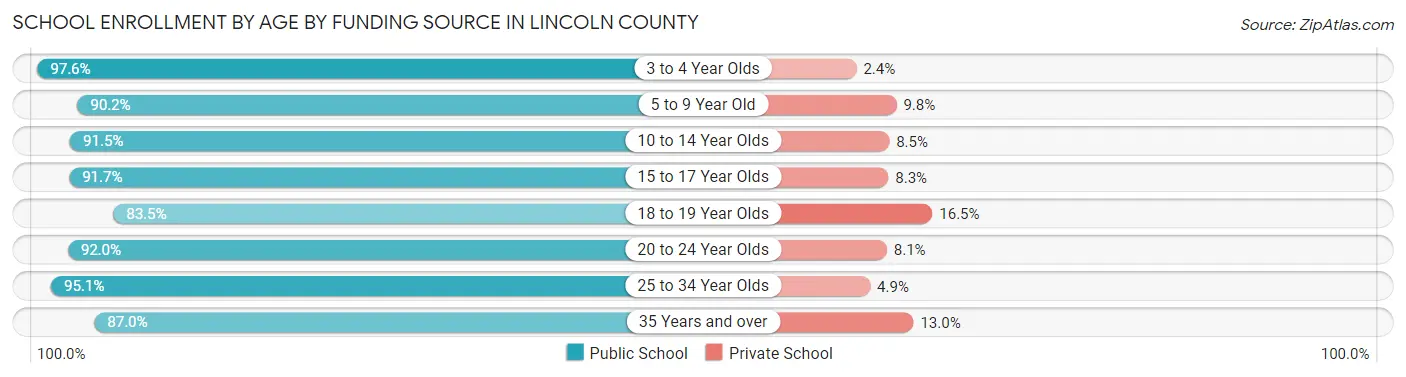
| Age Bracket | Public School | Private School |
| 3 to 4 Year Olds | 411 (97.6%) | 10 (2.4%) |
| 5 to 9 Year Old | 1,633 (90.2%) | 178 (9.8%) |
| 10 to 14 Year Olds | 2,372 (91.5%) | 220 (8.5%) |
| 15 to 17 Year Olds | 1,201 (91.7%) | 109 (8.3%) |
| 18 to 19 Year Olds | 460 (83.5%) | 91 (16.5%) |
| 20 to 24 Year Olds | 628 (91.9%) | 55 (8.1%) |
| 25 to 34 Year Olds | 135 (95.1%) | 7 (4.9%) |
| 35 Years and over | 241 (87.0%) | 36 (13.0%) |
| Total | 7,078 (90.9%) | 709 (9.1%) |
Educational Attainment by Field of Study in Lincoln County
Education (928 | 18.3%), business (817 | 16.2%), science & technology (661 | 13.1%), engineering (500 | 9.9%), and social sciences (412 | 8.1%) are the most common fields of study among 5,059 individuals in Lincoln County who have obtained a bachelor's degree or higher.
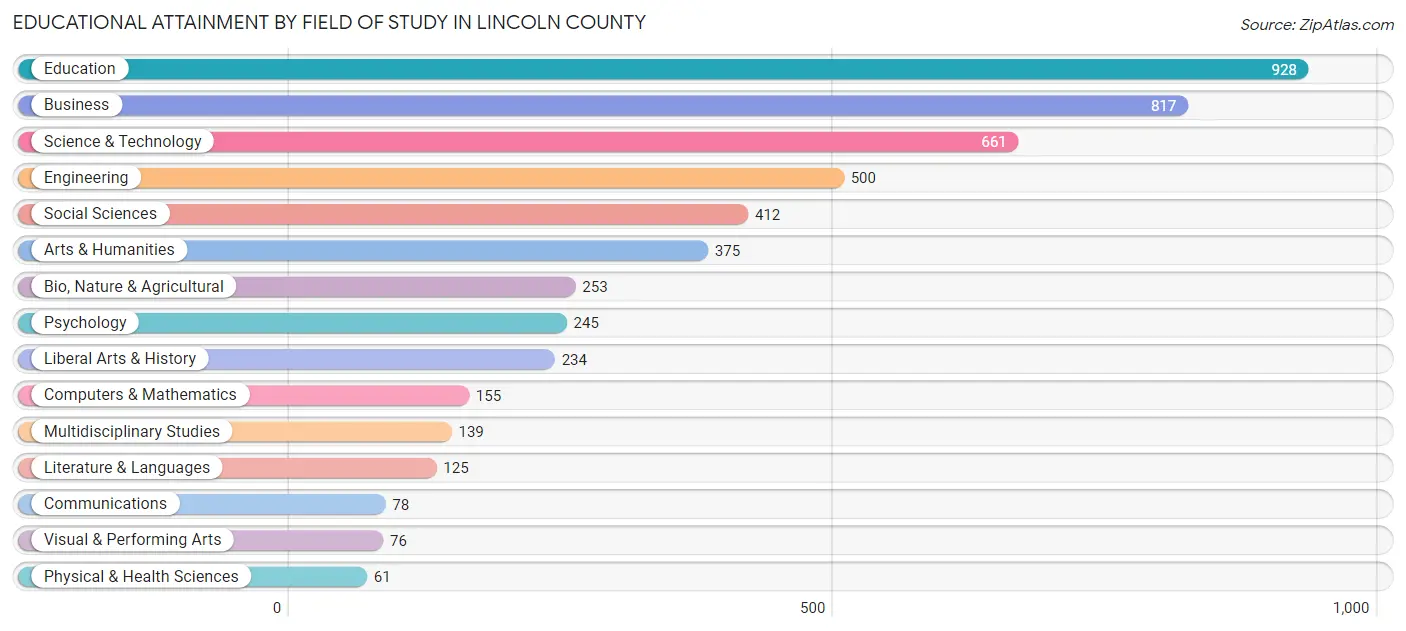
| Field of Study | # Graduates | % Graduates |
| Computers & Mathematics | 155 | 3.1% |
| Bio, Nature & Agricultural | 253 | 5.0% |
| Physical & Health Sciences | 61 | 1.2% |
| Psychology | 245 | 4.8% |
| Social Sciences | 412 | 8.1% |
| Engineering | 500 | 9.9% |
| Multidisciplinary Studies | 139 | 2.8% |
| Science & Technology | 661 | 13.1% |
| Business | 817 | 16.2% |
| Education | 928 | 18.3% |
| Literature & Languages | 125 | 2.5% |
| Liberal Arts & History | 234 | 4.6% |
| Visual & Performing Arts | 76 | 1.5% |
| Communications | 78 | 1.5% |
| Arts & Humanities | 375 | 7.4% |
| Total | 5,059 | 100.0% |
Transportation & Commute in Lincoln County
Vehicle Availability by Sex in Lincoln County
The most prevalent vehicle ownership categories in Lincoln County are males with 2 vehicles (2,992, accounting for 34.7%) and females with 2 vehicles (2,640, making up 41.5%).
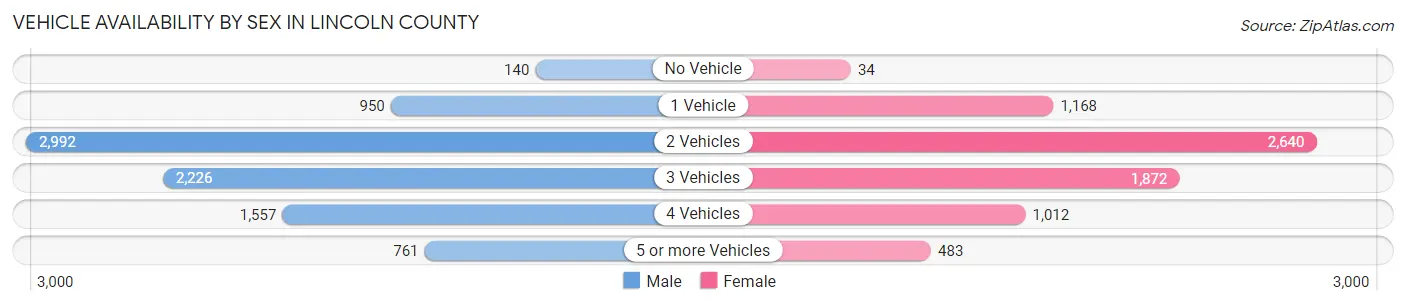
| Vehicles Available | Male | Female |
| No Vehicle | 140 (1.6%) | 34 (0.5%) |
| 1 Vehicle | 950 (11.0%) | 1,168 (16.2%) |
| 2 Vehicles | 2,992 (34.7%) | 2,640 (36.6%) |
| 3 Vehicles | 2,226 (25.8%) | 1,872 (26.0%) |
| 4 Vehicles | 1,557 (18.0%) | 1,012 (14.0%) |
| 5 or more Vehicles | 761 (8.8%) | 483 (6.7%) |
| Total | 8,626 (100.0%) | 7,209 (100.0%) |
Commute Time in Lincoln County
The most frequently occuring commute durations in Lincoln County are 15 to 19 minutes (2,307 commuters, 15.5%), 10 to 14 minutes (2,021 commuters, 13.6%), and 45 to 59 minutes (1,969 commuters, 13.3%).
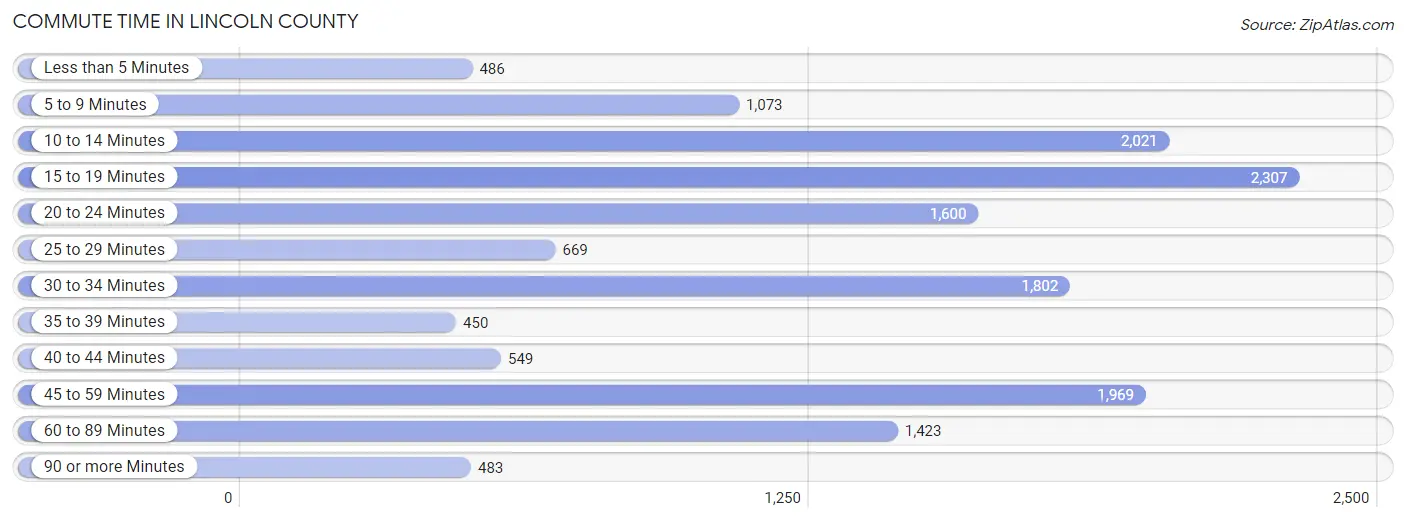
| Commute Time | # Commuters | % Commuters |
| Less than 5 Minutes | 486 | 3.3% |
| 5 to 9 Minutes | 1,073 | 7.2% |
| 10 to 14 Minutes | 2,021 | 13.6% |
| 15 to 19 Minutes | 2,307 | 15.5% |
| 20 to 24 Minutes | 1,600 | 10.8% |
| 25 to 29 Minutes | 669 | 4.5% |
| 30 to 34 Minutes | 1,802 | 12.1% |
| 35 to 39 Minutes | 450 | 3.0% |
| 40 to 44 Minutes | 549 | 3.7% |
| 45 to 59 Minutes | 1,969 | 13.3% |
| 60 to 89 Minutes | 1,423 | 9.6% |
| 90 or more Minutes | 483 | 3.3% |
Commute Time by Sex in Lincoln County
The most common commute times in Lincoln County are 45 to 59 minutes (1,334 commuters, 16.1%) for males and 15 to 19 minutes (1,141 commuters, 17.4%) for females.
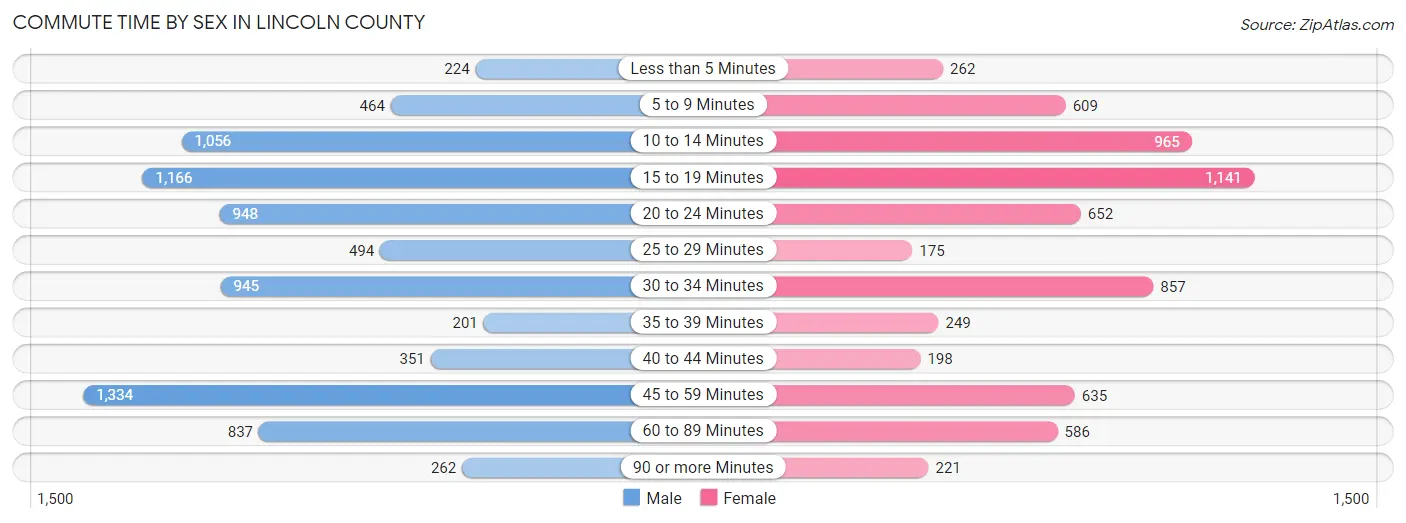
| Commute Time | Male | Female |
| Less than 5 Minutes | 224 (2.7%) | 262 (4.0%) |
| 5 to 9 Minutes | 464 (5.6%) | 609 (9.3%) |
| 10 to 14 Minutes | 1,056 (12.8%) | 965 (14.7%) |
| 15 to 19 Minutes | 1,166 (14.1%) | 1,141 (17.4%) |
| 20 to 24 Minutes | 948 (11.5%) | 652 (10.0%) |
| 25 to 29 Minutes | 494 (6.0%) | 175 (2.7%) |
| 30 to 34 Minutes | 945 (11.4%) | 857 (13.1%) |
| 35 to 39 Minutes | 201 (2.4%) | 249 (3.8%) |
| 40 to 44 Minutes | 351 (4.2%) | 198 (3.0%) |
| 45 to 59 Minutes | 1,334 (16.1%) | 635 (9.7%) |
| 60 to 89 Minutes | 837 (10.1%) | 586 (8.9%) |
| 90 or more Minutes | 262 (3.2%) | 221 (3.4%) |
Time of Departure to Work by Sex in Lincoln County
The most frequent times of departure to work in Lincoln County are 6:00 AM to 6:29 AM (1,114, 13.5%) for males and 7:00 AM to 7:29 AM (1,246, 19.0%) for females.
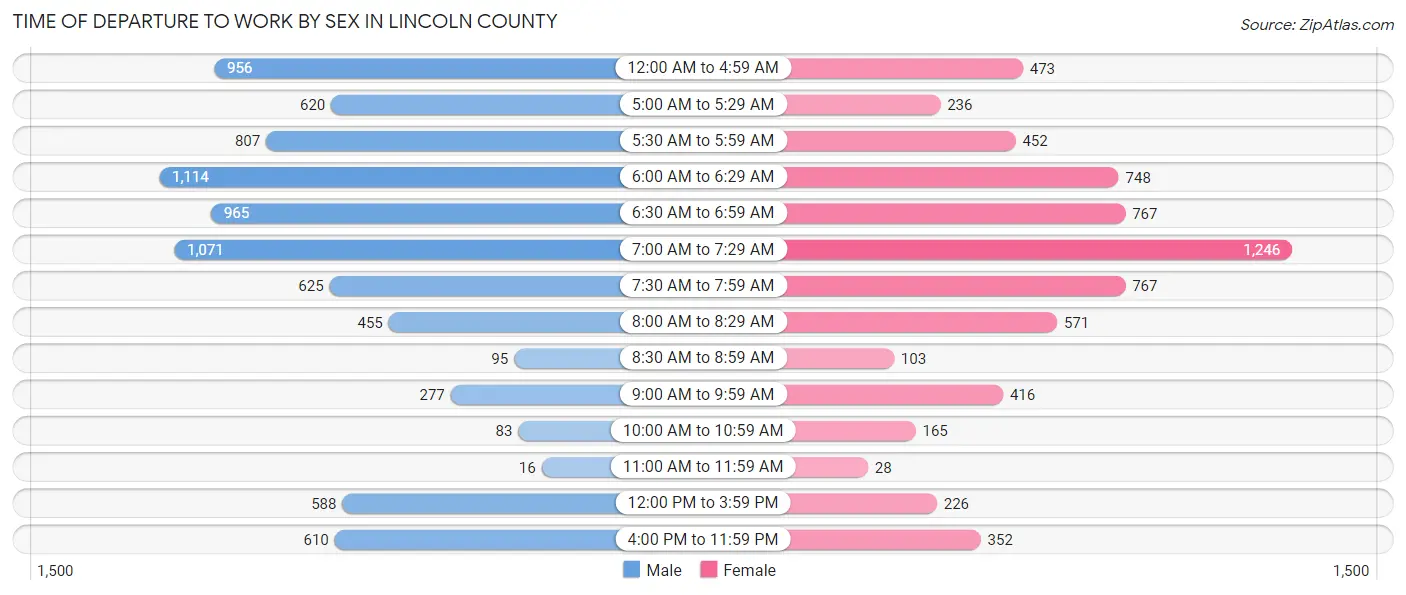
| Time of Departure | Male | Female |
| 12:00 AM to 4:59 AM | 956 (11.5%) | 473 (7.2%) |
| 5:00 AM to 5:29 AM | 620 (7.5%) | 236 (3.6%) |
| 5:30 AM to 5:59 AM | 807 (9.7%) | 452 (6.9%) |
| 6:00 AM to 6:29 AM | 1,114 (13.5%) | 748 (11.4%) |
| 6:30 AM to 6:59 AM | 965 (11.7%) | 767 (11.7%) |
| 7:00 AM to 7:29 AM | 1,071 (12.9%) | 1,246 (19.0%) |
| 7:30 AM to 7:59 AM | 625 (7.5%) | 767 (11.7%) |
| 8:00 AM to 8:29 AM | 455 (5.5%) | 571 (8.7%) |
| 8:30 AM to 8:59 AM | 95 (1.1%) | 103 (1.6%) |
| 9:00 AM to 9:59 AM | 277 (3.3%) | 416 (6.4%) |
| 10:00 AM to 10:59 AM | 83 (1.0%) | 165 (2.5%) |
| 11:00 AM to 11:59 AM | 16 (0.2%) | 28 (0.4%) |
| 12:00 PM to 3:59 PM | 588 (7.1%) | 226 (3.5%) |
| 4:00 PM to 11:59 PM | 610 (7.4%) | 352 (5.4%) |
| Total | 8,282 (100.0%) | 6,550 (100.0%) |
Housing Occupancy in Lincoln County
Occupancy by Ownership in Lincoln County
Of the total 14,304 dwellings in Lincoln County, owner-occupied units account for 10,918 (76.3%), while renter-occupied units make up 3,386 (23.7%).
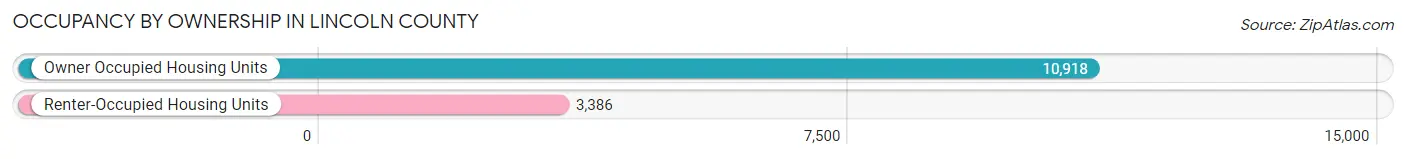
| Occupancy | # Housing Units | % Housing Units |
| Owner Occupied Housing Units | 10,918 | 76.3% |
| Renter-Occupied Housing Units | 3,386 | 23.7% |
| Total Occupied Housing Units | 14,304 | 100.0% |
Occupancy by Household Size in Lincoln County
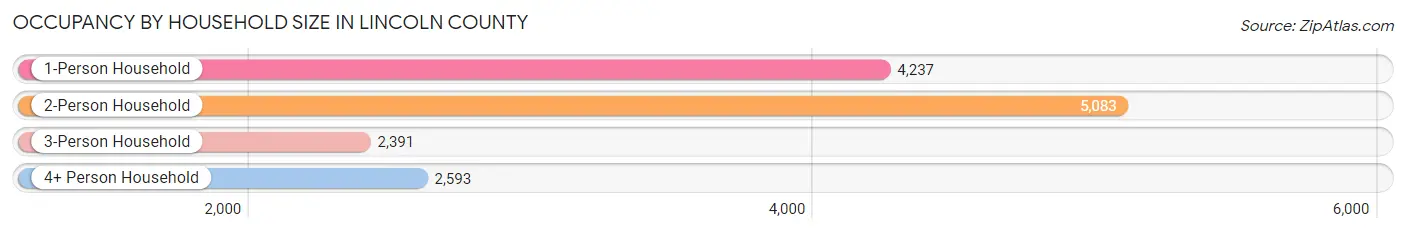
| Household Size | # Housing Units | % Housing Units |
| 1-Person Household | 4,237 | 29.6% |
| 2-Person Household | 5,083 | 35.5% |
| 3-Person Household | 2,391 | 16.7% |
| 4+ Person Household | 2,593 | 18.1% |
| Total Housing Units | 14,304 | 100.0% |
Occupancy by Ownership by Household Size in Lincoln County
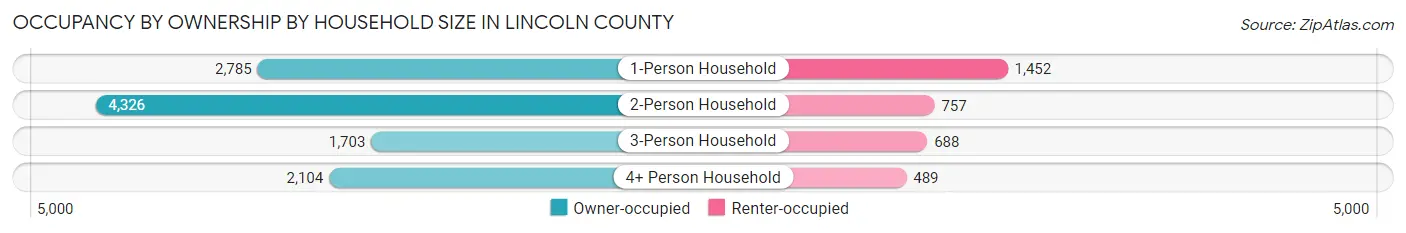
| Household Size | Owner-occupied | Renter-occupied |
| 1-Person Household | 2,785 (65.7%) | 1,452 (34.3%) |
| 2-Person Household | 4,326 (85.1%) | 757 (14.9%) |
| 3-Person Household | 1,703 (71.2%) | 688 (28.8%) |
| 4+ Person Household | 2,104 (81.1%) | 489 (18.9%) |
| Total Housing Units | 10,918 (76.3%) | 3,386 (23.7%) |
Occupancy by Educational Attainment in Lincoln County
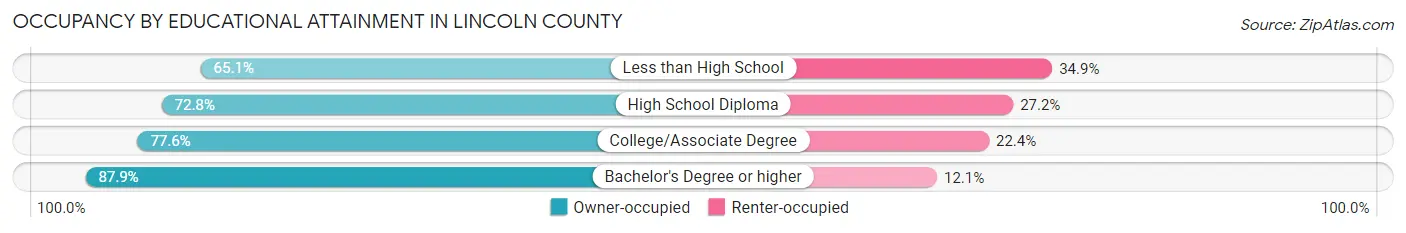
| Household Size | Owner-occupied | Renter-occupied |
| Less than High School | 1,063 (65.1%) | 570 (34.9%) |
| High School Diploma | 4,422 (72.8%) | 1,650 (27.2%) |
| College/Associate Degree | 2,781 (77.6%) | 802 (22.4%) |
| Bachelor's Degree or higher | 2,652 (87.9%) | 364 (12.1%) |
Occupancy by Age of Householder in Lincoln County
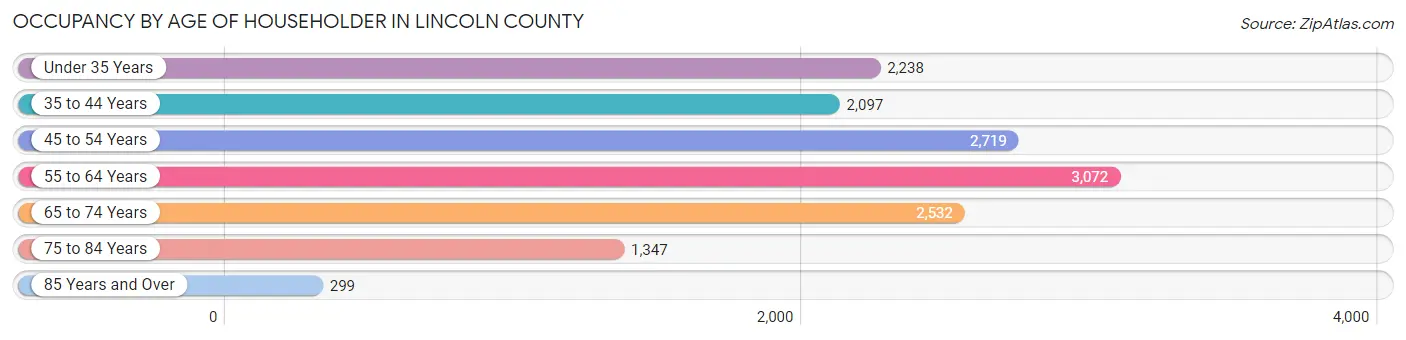
| Age Bracket | # Households | % Households |
| Under 35 Years | 2,238 | 15.7% |
| 35 to 44 Years | 2,097 | 14.7% |
| 45 to 54 Years | 2,719 | 19.0% |
| 55 to 64 Years | 3,072 | 21.5% |
| 65 to 74 Years | 2,532 | 17.7% |
| 75 to 84 Years | 1,347 | 9.4% |
| 85 Years and Over | 299 | 2.1% |
| Total | 14,304 | 100.0% |
Housing Finances in Lincoln County
Median Income by Occupancy in Lincoln County
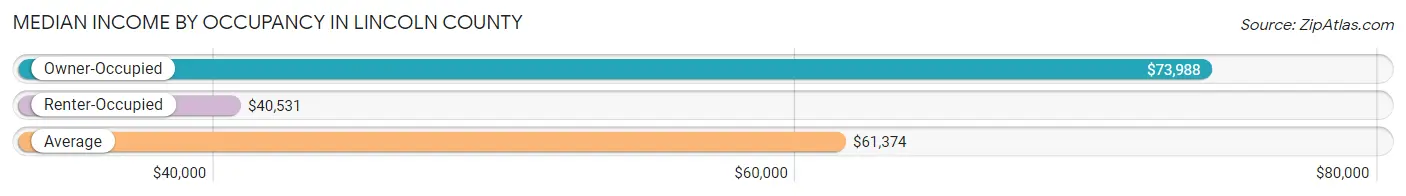
| Occupancy Type | # Households | Median Income |
| Owner-Occupied | 10,918 (76.3%) | $73,988 |
| Renter-Occupied | 3,386 (23.7%) | $40,531 |
| Average | 14,304 (100.0%) | $61,374 |
Occupancy by Householder Income Bracket in Lincoln County
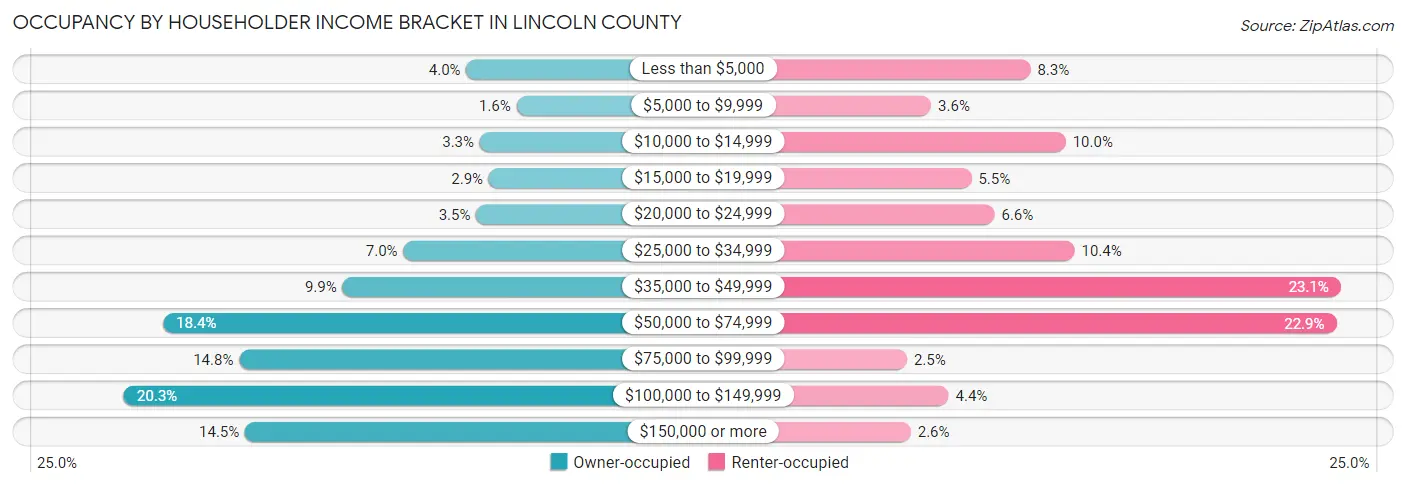
| Income Bracket | Owner-occupied | Renter-occupied |
| Less than $5,000 | 432 (4.0%) | 282 (8.3%) |
| $5,000 to $9,999 | 171 (1.6%) | 122 (3.6%) |
| $10,000 to $14,999 | 363 (3.3%) | 339 (10.0%) |
| $15,000 to $19,999 | 315 (2.9%) | 187 (5.5%) |
| $20,000 to $24,999 | 381 (3.5%) | 224 (6.6%) |
| $25,000 to $34,999 | 760 (7.0%) | 353 (10.4%) |
| $35,000 to $49,999 | 1,077 (9.9%) | 782 (23.1%) |
| $50,000 to $74,999 | 2,009 (18.4%) | 775 (22.9%) |
| $75,000 to $99,999 | 1,614 (14.8%) | 83 (2.5%) |
| $100,000 to $149,999 | 2,213 (20.3%) | 150 (4.4%) |
| $150,000 or more | 1,583 (14.5%) | 89 (2.6%) |
| Total | 10,918 (100.0%) | 3,386 (100.0%) |
Monthly Housing Cost Tiers in Lincoln County
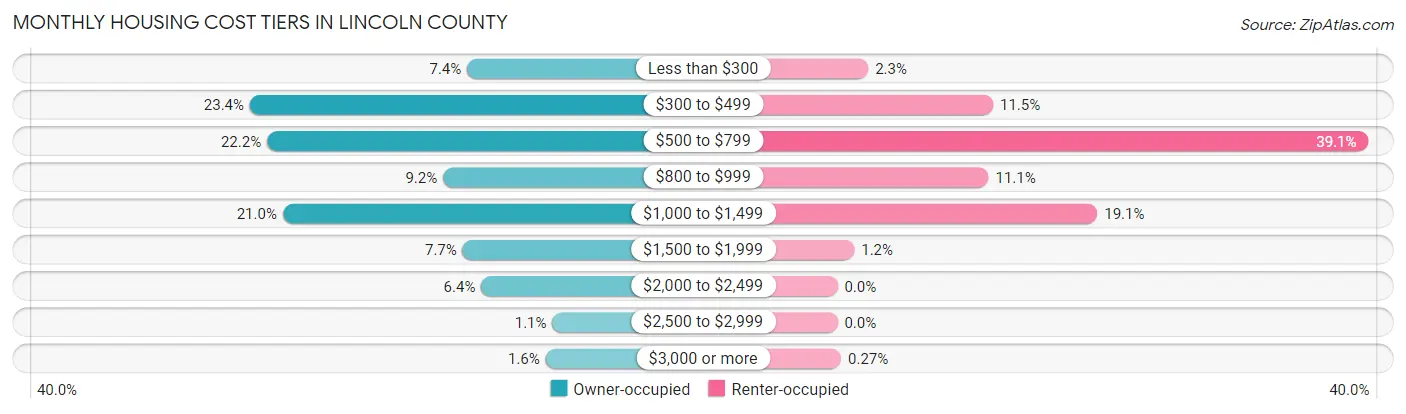
| Monthly Cost | Owner-occupied | Renter-occupied |
| Less than $300 | 809 (7.4%) | 77 (2.3%) |
| $300 to $499 | 2,556 (23.4%) | 388 (11.5%) |
| $500 to $799 | 2,418 (22.2%) | 1,324 (39.1%) |
| $800 to $999 | 1,002 (9.2%) | 377 (11.1%) |
| $1,000 to $1,499 | 2,292 (21.0%) | 648 (19.1%) |
| $1,500 to $1,999 | 845 (7.7%) | 42 (1.2%) |
| $2,000 to $2,499 | 695 (6.4%) | 0 (0.0%) |
| $2,500 to $2,999 | 123 (1.1%) | 0 (0.0%) |
| $3,000 or more | 178 (1.6%) | 9 (0.3%) |
| Total | 10,918 (100.0%) | 3,386 (100.0%) |
Physical Housing Characteristics in Lincoln County
Housing Structures in Lincoln County
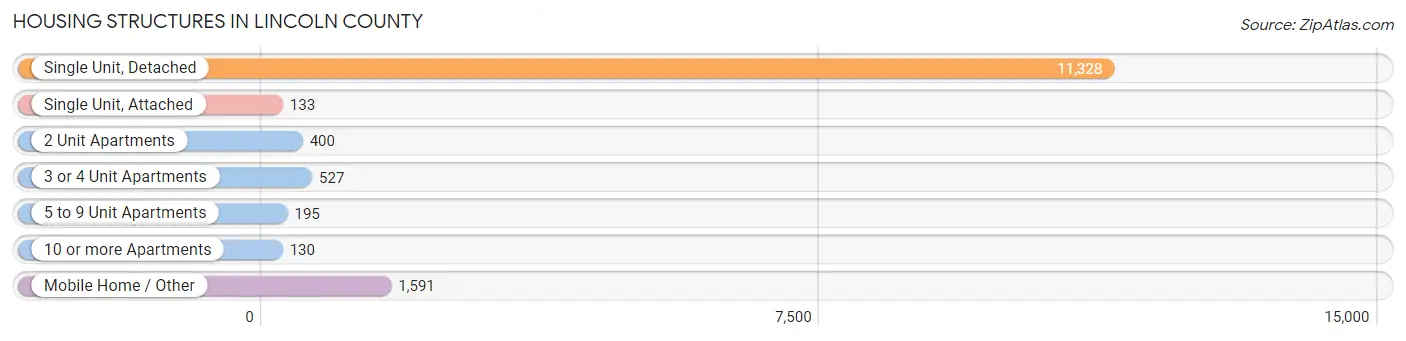
| Structure Type | # Housing Units | % Housing Units |
| Single Unit, Detached | 11,328 | 79.2% |
| Single Unit, Attached | 133 | 0.9% |
| 2 Unit Apartments | 400 | 2.8% |
| 3 or 4 Unit Apartments | 527 | 3.7% |
| 5 to 9 Unit Apartments | 195 | 1.4% |
| 10 or more Apartments | 130 | 0.9% |
| Mobile Home / Other | 1,591 | 11.1% |
| Total | 14,304 | 100.0% |
Housing Structures by Occupancy in Lincoln County
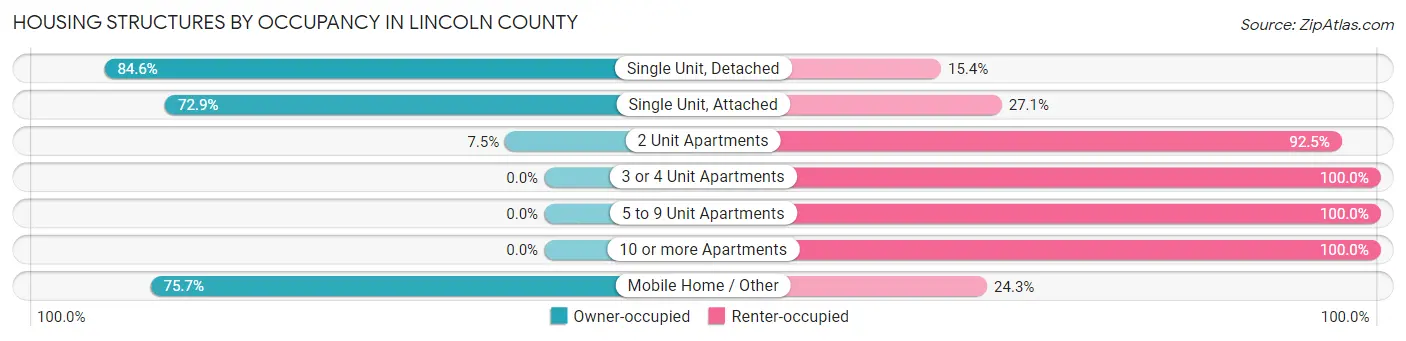
| Structure Type | Owner-occupied | Renter-occupied |
| Single Unit, Detached | 9,586 (84.6%) | 1,742 (15.4%) |
| Single Unit, Attached | 97 (72.9%) | 36 (27.1%) |
| 2 Unit Apartments | 30 (7.5%) | 370 (92.5%) |
| 3 or 4 Unit Apartments | 0 (0.0%) | 527 (100.0%) |
| 5 to 9 Unit Apartments | 0 (0.0%) | 195 (100.0%) |
| 10 or more Apartments | 0 (0.0%) | 130 (100.0%) |
| Mobile Home / Other | 1,205 (75.7%) | 386 (24.3%) |
| Total | 10,918 (76.3%) | 3,386 (23.7%) |
Housing Structures by Number of Rooms in Lincoln County
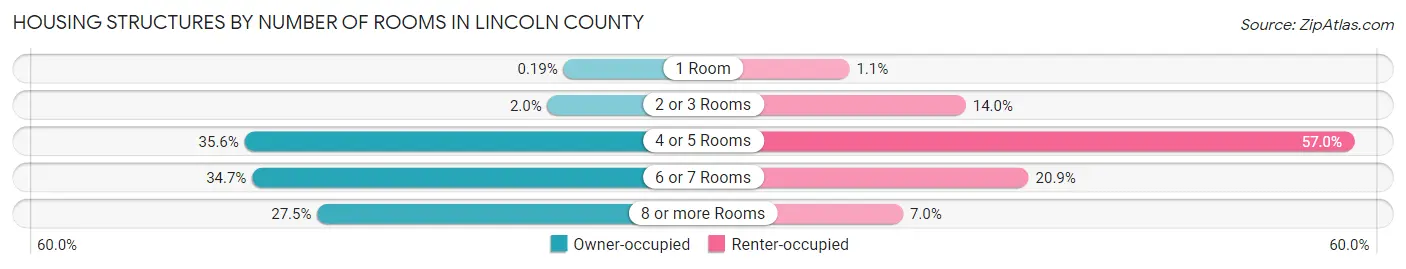
| Number of Rooms | Owner-occupied | Renter-occupied |
| 1 Room | 21 (0.2%) | 36 (1.1%) |
| 2 or 3 Rooms | 214 (2.0%) | 473 (14.0%) |
| 4 or 5 Rooms | 3,885 (35.6%) | 1,931 (57.0%) |
| 6 or 7 Rooms | 3,793 (34.7%) | 709 (20.9%) |
| 8 or more Rooms | 3,005 (27.5%) | 237 (7.0%) |
| Total | 10,918 (100.0%) | 3,386 (100.0%) |
Housing Structure by Heating Type in Lincoln County
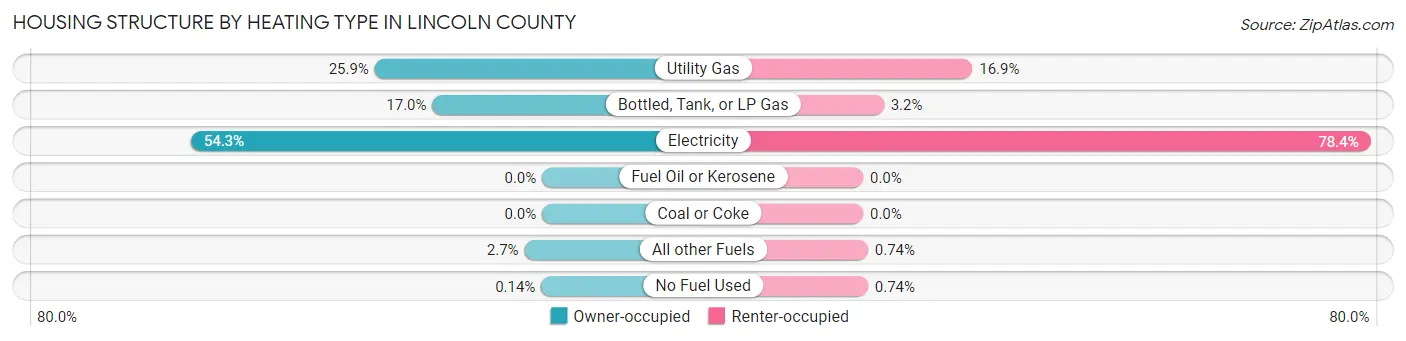
| Heating Type | Owner-occupied | Renter-occupied |
| Utility Gas | 2,826 (25.9%) | 572 (16.9%) |
| Bottled, Tank, or LP Gas | 1,852 (17.0%) | 108 (3.2%) |
| Electricity | 5,927 (54.3%) | 2,656 (78.4%) |
| Fuel Oil or Kerosene | 0 (0.0%) | 0 (0.0%) |
| Coal or Coke | 0 (0.0%) | 0 (0.0%) |
| All other Fuels | 298 (2.7%) | 25 (0.7%) |
| No Fuel Used | 15 (0.1%) | 25 (0.7%) |
| Total | 10,918 (100.0%) | 3,386 (100.0%) |
Household Vehicle Usage in Lincoln County
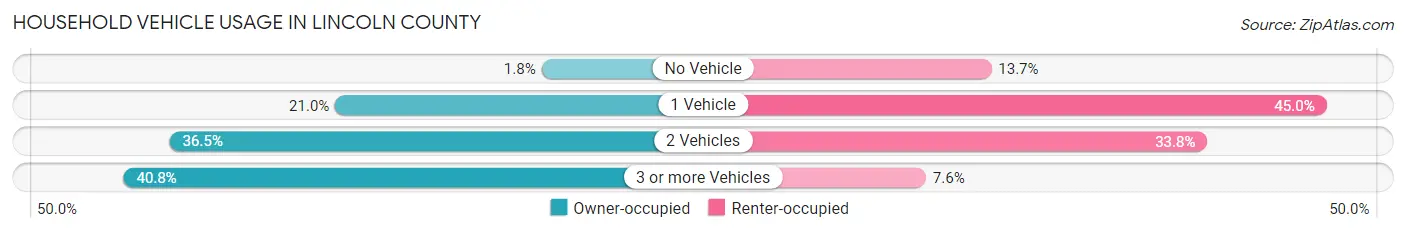
| Vehicles per Household | Owner-occupied | Renter-occupied |
| No Vehicle | 191 (1.8%) | 463 (13.7%) |
| 1 Vehicle | 2,294 (21.0%) | 1,522 (45.0%) |
| 2 Vehicles | 3,982 (36.5%) | 1,145 (33.8%) |
| 3 or more Vehicles | 4,451 (40.8%) | 256 (7.6%) |
| Total | 10,918 (100.0%) | 3,386 (100.0%) |
Real Estate & Mortgages in Lincoln County
Real Estate and Mortgage Overview in Lincoln County
| Characteristic | Without Mortgage | With Mortgage |
| Housing Units | 5,347 | 5,571 |
| Median Property Value | $181,800 | $189,300 |
| Median Household Income | $59,207 | $1,154 |
| Monthly Housing Costs | $455 | $178 |
| Real Estate Taxes | $928 | $200 |
Property Value by Mortgage Status in Lincoln County
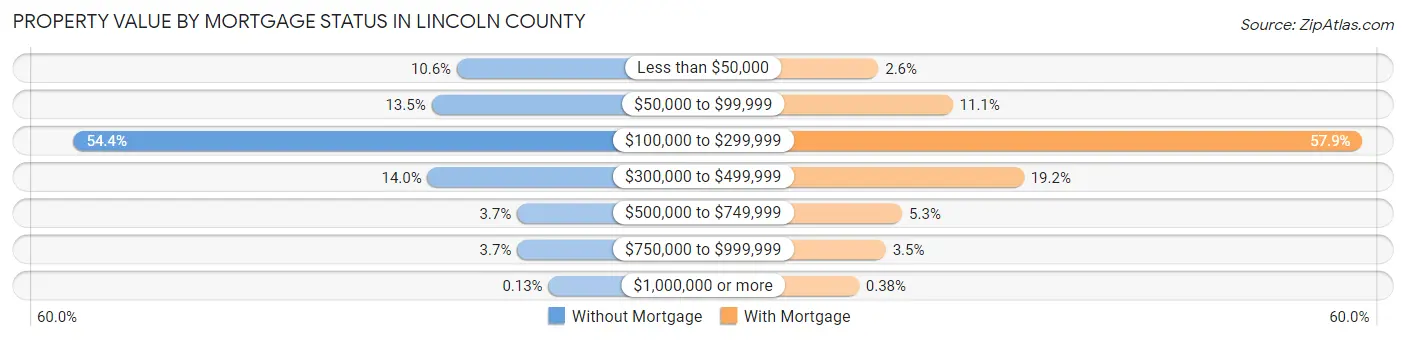
| Property Value | Without Mortgage | With Mortgage |
| Less than $50,000 | 566 (10.6%) | 145 (2.6%) |
| $50,000 to $99,999 | 722 (13.5%) | 618 (11.1%) |
| $100,000 to $299,999 | 2,909 (54.4%) | 3,227 (57.9%) |
| $300,000 to $499,999 | 746 (14.0%) | 1,071 (19.2%) |
| $500,000 to $749,999 | 199 (3.7%) | 297 (5.3%) |
| $750,000 to $999,999 | 198 (3.7%) | 192 (3.5%) |
| $1,000,000 or more | 7 (0.1%) | 21 (0.4%) |
| Total | 5,347 (100.0%) | 5,571 (100.0%) |
Household Income by Mortgage Status in Lincoln County

| Household Income | Without Mortgage | With Mortgage |
| Less than $10,000 | 352 (6.6%) | 55 (1.0%) |
| $10,000 to $24,999 | 710 (13.3%) | 251 (4.5%) |
| $25,000 to $34,999 | 502 (9.4%) | 349 (6.3%) |
| $35,000 to $49,999 | 757 (14.2%) | 258 (4.6%) |
| $50,000 to $74,999 | 906 (16.9%) | 320 (5.7%) |
| $75,000 to $99,999 | 679 (12.7%) | 1,103 (19.8%) |
| $100,000 to $149,999 | 1,012 (18.9%) | 935 (16.8%) |
| $150,000 or more | 429 (8.0%) | 1,201 (21.6%) |
| Total | 5,347 (100.0%) | 5,571 (100.0%) |
Property Value to Household Income Ratio in Lincoln County
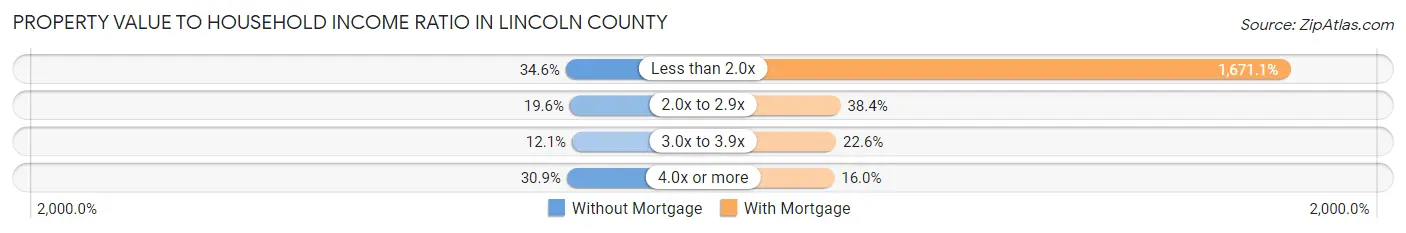
| Value-to-Income Ratio | Without Mortgage | With Mortgage |
| Less than 2.0x | 1,849 (34.6%) | 93,096 (1,671.1%) |
| 2.0x to 2.9x | 1,050 (19.6%) | 2,138 (38.4%) |
| 3.0x to 3.9x | 646 (12.1%) | 1,258 (22.6%) |
| 4.0x or more | 1,650 (30.9%) | 889 (16.0%) |
| Total | 5,347 (100.0%) | 5,571 (100.0%) |
Real Estate Taxes by Mortgage Status in Lincoln County
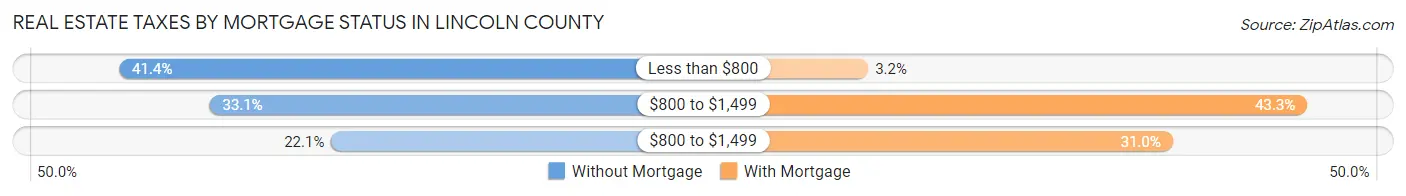
| Property Taxes | Without Mortgage | With Mortgage |
| Less than $800 | 2,212 (41.4%) | 179 (3.2%) |
| $800 to $1,499 | 1,771 (33.1%) | 2,412 (43.3%) |
| $800 to $1,499 | 1,181 (22.1%) | 1,728 (31.0%) |
| Total | 5,347 (100.0%) | 5,571 (100.0%) |
Health & Disability in Lincoln County
Health Insurance Coverage by Age in Lincoln County
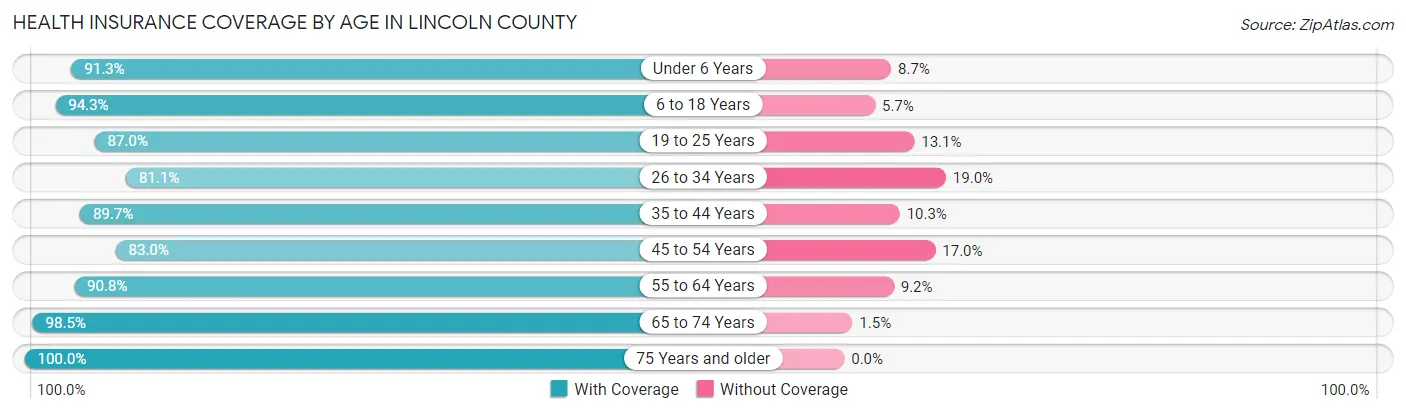
| Age Bracket | With Coverage | Without Coverage |
| Under 6 Years | 2,049 (91.3%) | 196 (8.7%) |
| 6 to 18 Years | 5,746 (94.3%) | 349 (5.7%) |
| 19 to 25 Years | 2,159 (87.0%) | 324 (13.1%) |
| 26 to 34 Years | 2,964 (81.0%) | 693 (19.0%) |
| 35 to 44 Years | 3,420 (89.7%) | 394 (10.3%) |
| 45 to 54 Years | 3,955 (83.0%) | 809 (17.0%) |
| 55 to 64 Years | 4,859 (90.8%) | 494 (9.2%) |
| 65 to 74 Years | 3,845 (98.5%) | 59 (1.5%) |
| 75 Years and older | 2,603 (100.0%) | 0 (0.0%) |
| Total | 31,600 (90.5%) | 3,318 (9.5%) |
Health Insurance Coverage by Citizenship Status in Lincoln County
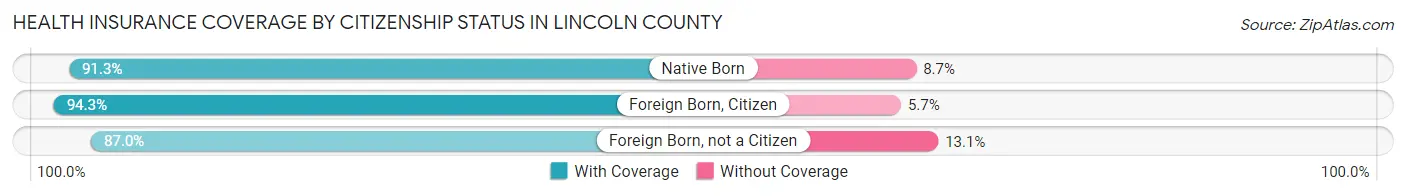
| Citizenship Status | With Coverage | Without Coverage |
| Native Born | 2,049 (91.3%) | 196 (8.7%) |
| Foreign Born, Citizen | 5,746 (94.3%) | 349 (5.7%) |
| Foreign Born, not a Citizen | 2,159 (87.0%) | 324 (13.1%) |
Health Insurance Coverage by Household Income in Lincoln County
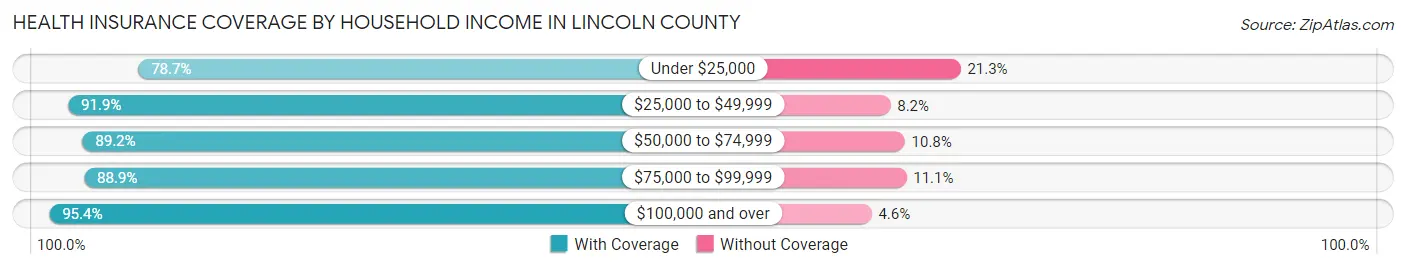
| Household Income | With Coverage | Without Coverage |
| Under $25,000 | 3,386 (78.7%) | 916 (21.3%) |
| $25,000 to $49,999 | 5,591 (91.8%) | 496 (8.2%) |
| $50,000 to $74,999 | 6,495 (89.2%) | 789 (10.8%) |
| $75,000 to $99,999 | 4,228 (88.9%) | 530 (11.1%) |
| $100,000 and over | 11,887 (95.4%) | 576 (4.6%) |
Public vs Private Health Insurance Coverage by Age in Lincoln County
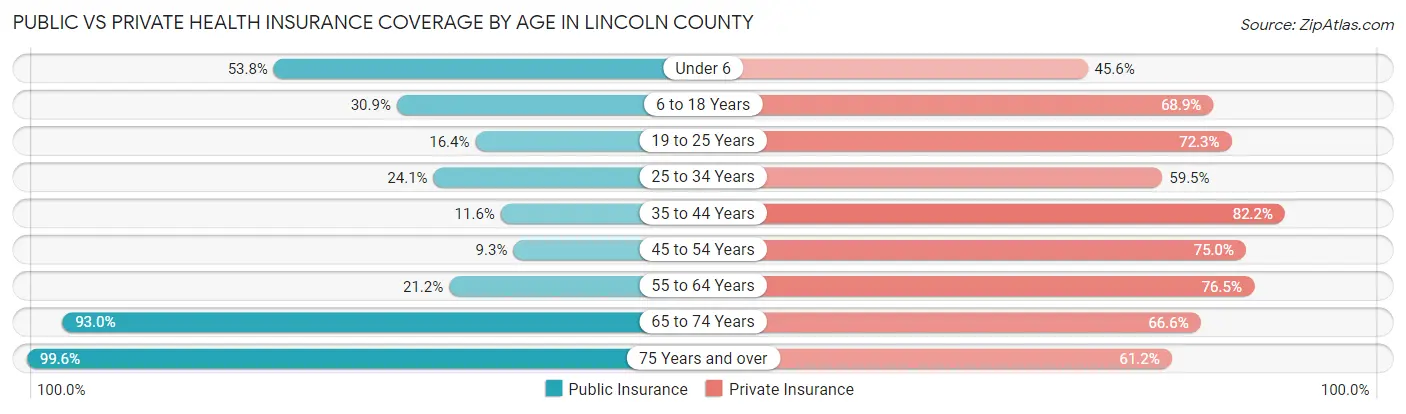
| Age Bracket | Public Insurance | Private Insurance |
| Under 6 | 1,207 (53.8%) | 1,024 (45.6%) |
| 6 to 18 Years | 1,885 (30.9%) | 4,201 (68.9%) |
| 19 to 25 Years | 406 (16.4%) | 1,795 (72.3%) |
| 25 to 34 Years | 882 (24.1%) | 2,176 (59.5%) |
| 35 to 44 Years | 444 (11.6%) | 3,136 (82.2%) |
| 45 to 54 Years | 443 (9.3%) | 3,572 (75.0%) |
| 55 to 64 Years | 1,136 (21.2%) | 4,093 (76.5%) |
| 65 to 74 Years | 3,631 (93.0%) | 2,599 (66.6%) |
| 75 Years and over | 2,592 (99.6%) | 1,593 (61.2%) |
| Total | 12,626 (36.2%) | 24,189 (69.3%) |
Disability Status by Sex by Age in Lincoln County
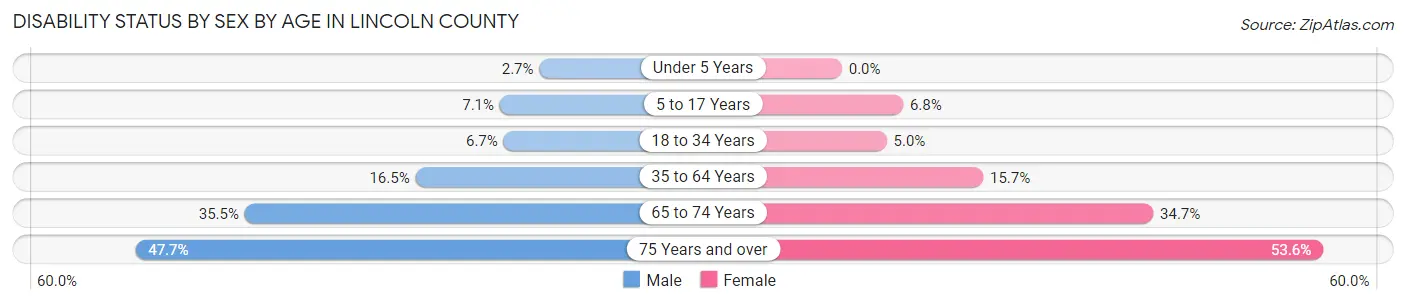
| Age Bracket | Male | Female |
| Under 5 Years | 31 (2.7%) | 0 (0.0%) |
| 5 to 17 Years | 198 (7.1%) | 204 (6.8%) |
| 18 to 34 Years | 231 (6.7%) | 158 (5.0%) |
| 35 to 64 Years | 1,132 (16.5%) | 1,110 (15.7%) |
| 65 to 74 Years | 640 (35.5%) | 728 (34.7%) |
| 75 Years and over | 532 (47.7%) | 797 (53.6%) |
Disability Class by Sex by Age in Lincoln County
Disability Class: Hearing Difficulty
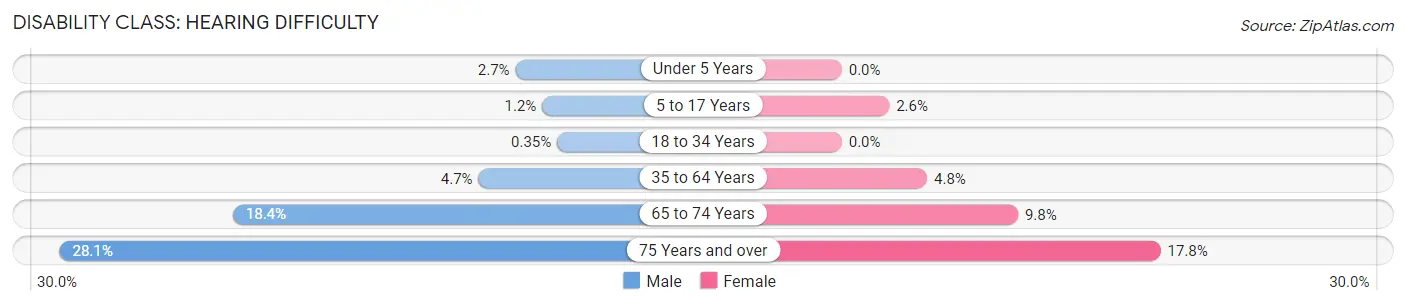
| Age Bracket | Male | Female |
| Under 5 Years | 31 (2.7%) | 0 (0.0%) |
| 5 to 17 Years | 33 (1.2%) | 79 (2.6%) |
| 18 to 34 Years | 12 (0.4%) | 0 (0.0%) |
| 35 to 64 Years | 325 (4.7%) | 335 (4.8%) |
| 65 to 74 Years | 332 (18.4%) | 206 (9.8%) |
| 75 Years and over | 313 (28.1%) | 264 (17.7%) |
Disability Class: Vision Difficulty
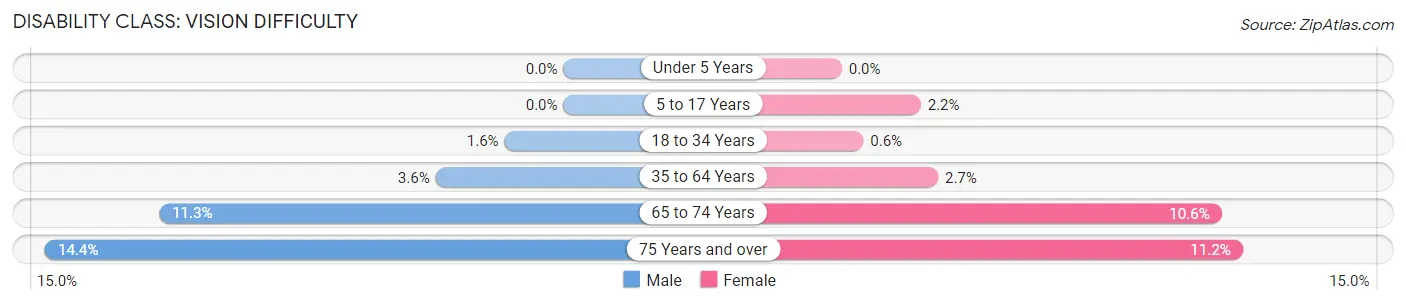
| Age Bracket | Male | Female |
| Under 5 Years | 0 (0.0%) | 0 (0.0%) |
| 5 to 17 Years | 0 (0.0%) | 66 (2.2%) |
| 18 to 34 Years | 57 (1.6%) | 19 (0.6%) |
| 35 to 64 Years | 245 (3.6%) | 189 (2.7%) |
| 65 to 74 Years | 203 (11.3%) | 222 (10.6%) |
| 75 Years and over | 161 (14.4%) | 166 (11.2%) |
Disability Class: Cognitive Difficulty
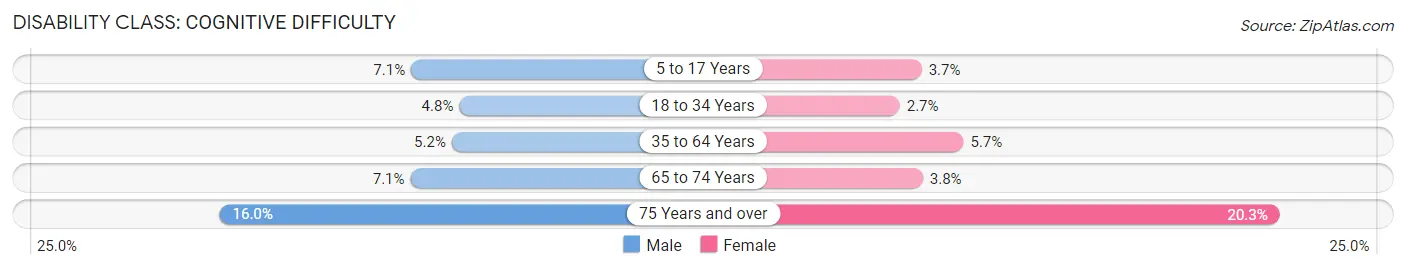
| Age Bracket | Male | Female |
| 5 to 17 Years | 198 (7.1%) | 111 (3.7%) |
| 18 to 34 Years | 168 (4.8%) | 85 (2.7%) |
| 35 to 64 Years | 356 (5.2%) | 399 (5.7%) |
| 65 to 74 Years | 128 (7.1%) | 79 (3.8%) |
| 75 Years and over | 178 (16.0%) | 302 (20.3%) |
Disability Class: Ambulatory Difficulty
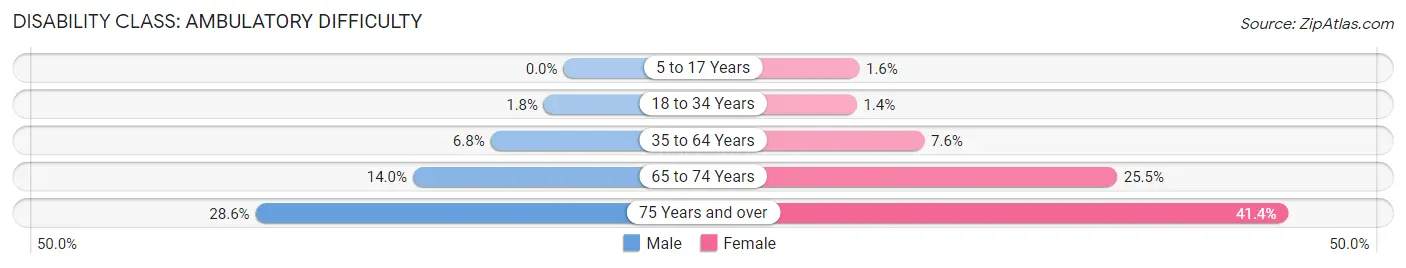
| Age Bracket | Male | Female |
| 5 to 17 Years | 0 (0.0%) | 48 (1.6%) |
| 18 to 34 Years | 63 (1.8%) | 43 (1.4%) |
| 35 to 64 Years | 465 (6.8%) | 539 (7.6%) |
| 65 to 74 Years | 252 (14.0%) | 536 (25.5%) |
| 75 Years and over | 319 (28.6%) | 616 (41.4%) |
Disability Class: Self-Care Difficulty
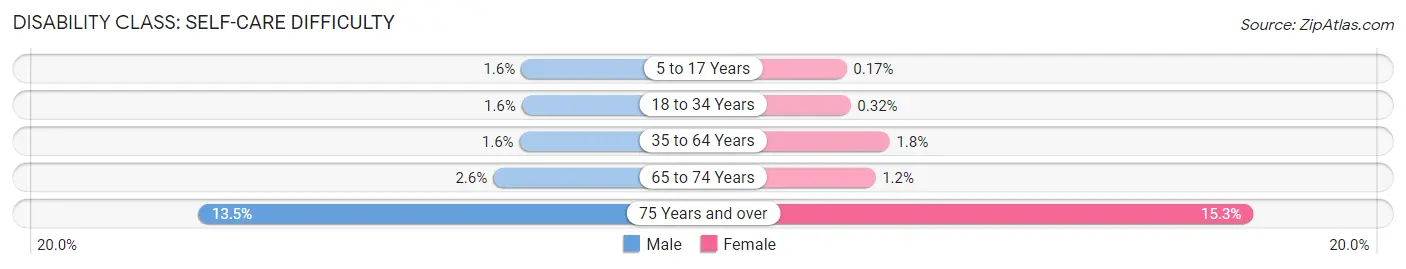
| Age Bracket | Male | Female |
| 5 to 17 Years | 44 (1.6%) | 5 (0.2%) |
| 18 to 34 Years | 54 (1.5%) | 10 (0.3%) |
| 35 to 64 Years | 112 (1.6%) | 125 (1.8%) |
| 65 to 74 Years | 47 (2.6%) | 26 (1.2%) |
| 75 Years and over | 151 (13.5%) | 227 (15.3%) |
Technology Access in Lincoln County
Computing Device Access in Lincoln County
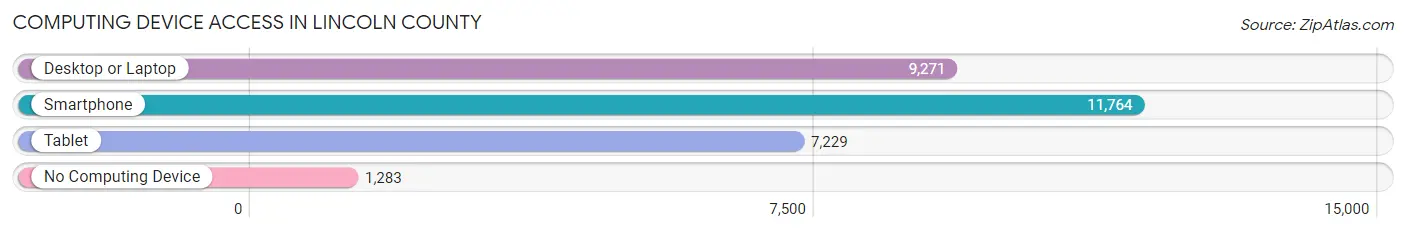
| Device Type | # Households | % Households |
| Desktop or Laptop | 9,271 | 64.8% |
| Smartphone | 11,764 | 82.2% |
| Tablet | 7,229 | 50.5% |
| No Computing Device | 1,283 | 9.0% |
| Total | 14,304 | 100.0% |
Internet Access in Lincoln County
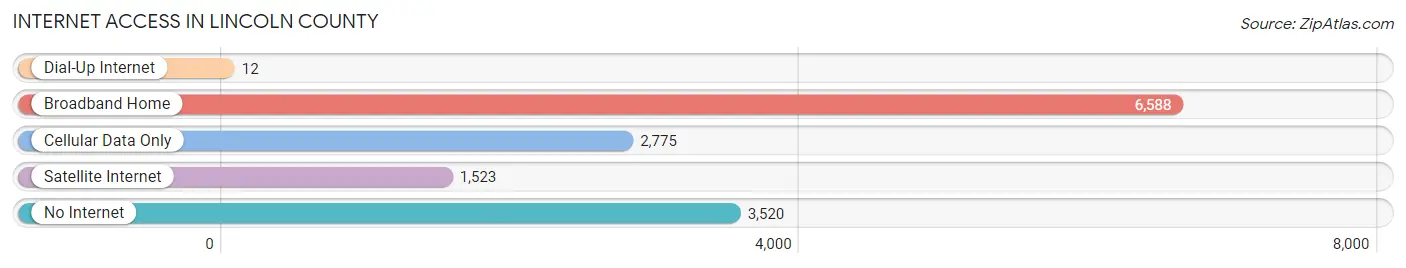
| Internet Type | # Households | % Households |
| Dial-Up Internet | 12 | 0.1% |
| Broadband Home | 6,588 | 46.1% |
| Cellular Data Only | 2,775 | 19.4% |
| Satellite Internet | 1,523 | 10.6% |
| No Internet | 3,520 | 24.6% |
| Total | 14,304 | 100.0% |
Lincoln County Summary
Lincoln County is located in the southeastern part of Tennessee, and is part of the Fayetteville-Lincoln County Metropolitan Statistical Area. It is bordered by Moore County to the north, Franklin County to the east, Marshall County to the south, and Giles County to the west. The county seat is Fayetteville, and the largest city is Fayetteville. The county was named after Major General Benjamin Lincoln, who served in the American Revolutionary War.
Geography
Lincoln County covers an area of 545 square miles, and is located in the Highland Rim region of Tennessee. The county is mostly hilly, with the highest point being the summit of Short Mountain, which has an elevation of 1,890 feet. The county is drained by the Elk River, which flows through the county from north to south. Other major waterways in the county include the Mulberry Fork, the Big Creek, and the Little Creek.
The county is mostly rural, with the majority of the population living in small towns and rural areas. The largest city in the county is Fayetteville, which has a population of 7,890. Other major towns in the county include Flintville, Mulberry, and Petersburg.
Economy
The economy of Lincoln County is largely based on agriculture and manufacturing. The county is home to several large farms, which produce a variety of crops, including corn, soybeans, wheat, and hay. The county is also home to several manufacturing companies, which produce a variety of products, including furniture, clothing, and automotive parts.
The county is also home to several tourist attractions, including the Jack Daniel's Distillery, the Fayetteville Historic District, and the Lincoln County Museum. These attractions bring in a significant amount of tourism revenue to the county.
Demographics
As of the 2010 census, the population of Lincoln County was 33,361. The population is mostly white (94.2%), with small percentages of African Americans (3.3%), Hispanics (1.2%), and Asians (0.5%). The median household income in the county is $41,945, and the median home value is $117,400.
The county is served by the Lincoln County School District, which consists of 11 elementary schools, four middle schools, and two high schools. The county is also home to several higher education institutions, including Motlow State Community College and the University of Tennessee at Martin.
Conclusion
Lincoln County is a rural county located in the southeastern part of Tennessee. The county is mostly hilly, and is home to several large farms and manufacturing companies. The county is also home to several tourist attractions, which bring in a significant amount of tourism revenue. The population of the county is mostly white, and the median household income is $41,945. The county is served by the Lincoln County School District, and is home to several higher education institutions.
Common Questions
What is the Total Population of Lincoln County?
Total Population of Lincoln County is 35,365.
What is the Total Male Population of Lincoln County?
Total Male Population of Lincoln County is 17,436.
What is the Total Female Population of Lincoln County?
Total Female Population of Lincoln County is 17,929.
What is the Ratio of Males per 100 Females in Lincoln County?
There are 97.25 Males per 100 Females in Lincoln County.
What is the Ratio of Females per 100 Males in Lincoln County?
There are 102.83 Females per 100 Males in Lincoln County.
What is the Median Population Age in Lincoln County?
Median Population Age in Lincoln County is 43.2 Years.
What is the Average Family Size in Lincoln County
Average Family Size in Lincoln County is 3.0 People.
What is the Average Household Size in Lincoln County
Average Household Size in Lincoln County is 2.4 People.
What is Per Capita Income in Lincoln County?
Per Capita income in Lincoln County is $32,016.
What is the Median Family Income in Lincoln County?
Median Family Income in Lincoln County is $82,042.
What is the Median Household income in Lincoln County?
Median Household Income in Lincoln County is $61,374.
What is Income or Wage Gap in Lincoln County?
Income or Wage Gap in Lincoln County is 28.3%.
Women in Lincoln County earn 71.7 cents for every dollar earned by a man.
What is Family Income Deficit in Lincoln County?
Family Income Deficit in Lincoln County is $13,309.
Families that are below poverty line in Lincoln County earn $13,309 less on average than the poverty threshold level.
What is Inequality or Gini Index in Lincoln County?
Inequality or Gini Index in Lincoln County is 0.43.
How Large is the Labor Force in Lincoln County?
There are 16,761 People in the Labor Forcein in Lincoln County.
What is the Percentage of People in the Labor Force in Lincoln County?
59.2% of People are in the Labor Force in Lincoln County.
What is the Unemployment Rate in Lincoln County?
Unemployment Rate in Lincoln County is 4.3%.