Lauderdale County, TN
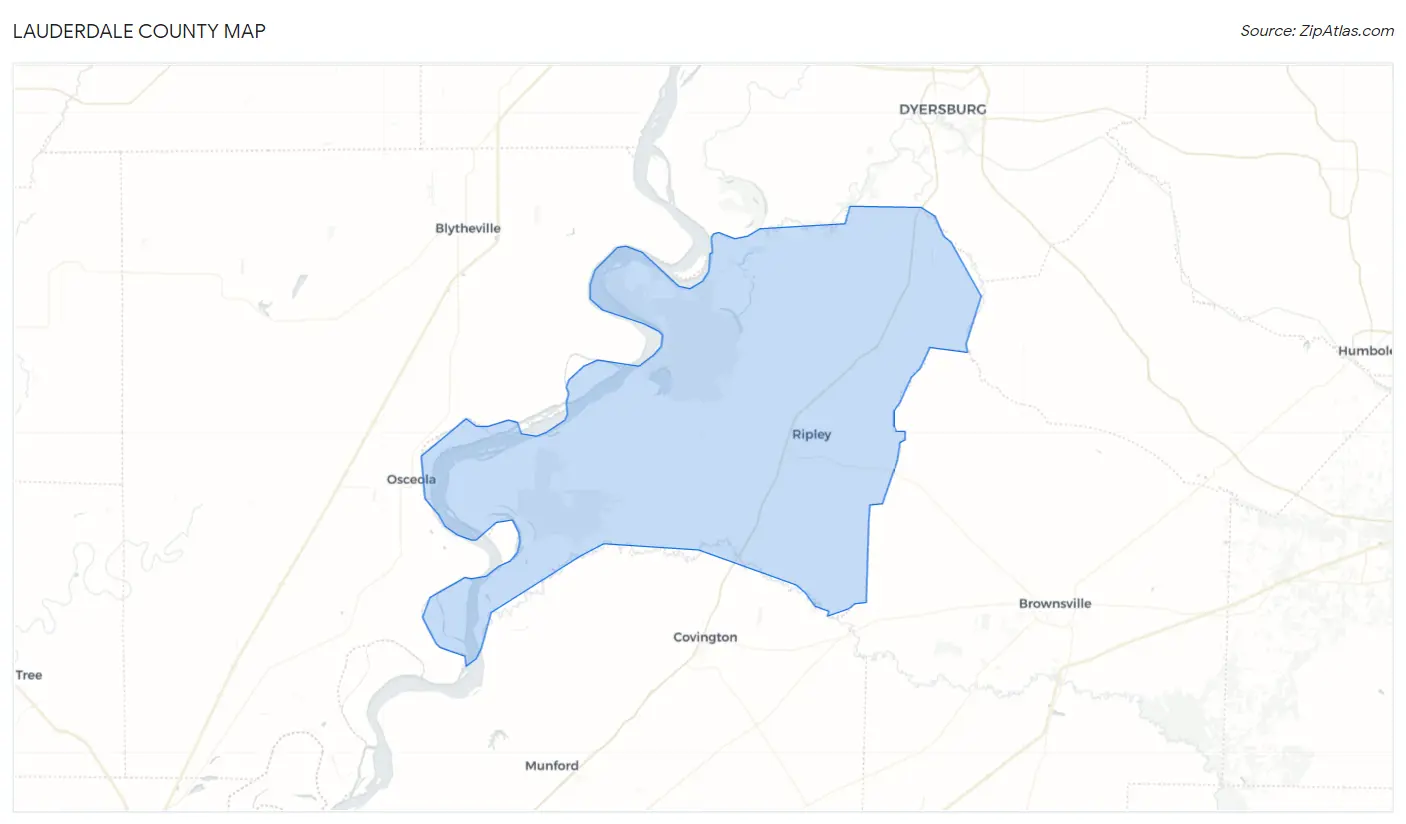
Lauderdale County Map
Lauderdale County Overview
25,171
TOTAL POPULATION
13,008
MALE POPULATION
12,163
FEMALE POPULATION
106.95
MALES / 100 FEMALES
93.50
FEMALES / 100 MALES
38.9
MEDIAN AGE
3.1
AVG FAMILY SIZE
2.5
AVG HOUSEHOLD SIZE
$24,358
PER CAPITA INCOME
$55,679
AVG FAMILY INCOME
$46,702
AVG HOUSEHOLD INCOME
25.1%
WAGE / INCOME GAP [ % ]
74.9¢/ $1
WAGE / INCOME GAP [ $ ]
$12,053
FAMILY INCOME DEFICIT
0.45
INEQUALITY / GINI INDEX
9,899
LABOR FORCE [ PEOPLE ]
49.1%
PERCENT IN LABOR FORCE
6.1%
UNEMPLOYMENT RATE
Lauderdale County Area Codes
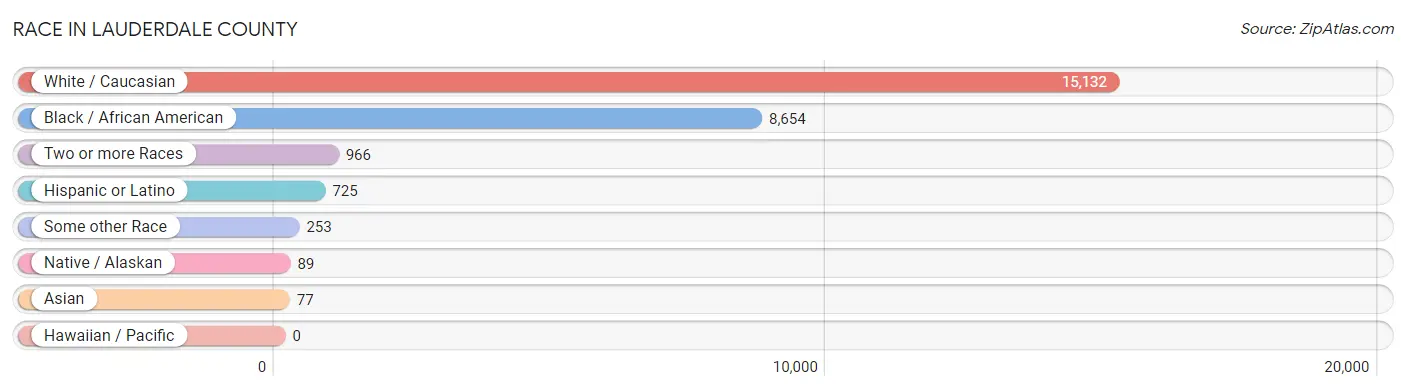
Race in Lauderdale County
The most populous races in Lauderdale County are White / Caucasian (15,132 | 60.1%), Black / African American (8,654 | 34.4%), and Two or more Races (966 | 3.8%).
| Race | # Population | % Population |
| Asian | 77 | 0.3% |
| Black / African American | 8,654 | 34.4% |
| Hawaiian / Pacific | 0 | 0.0% |
| Hispanic or Latino | 725 | 2.9% |
| Native / Alaskan | 89 | 0.4% |
| White / Caucasian | 15,132 | 60.1% |
| Two or more Races | 966 | 3.8% |
| Some other Race | 253 | 1.0% |
| Total | 25,171 | 100.0% |
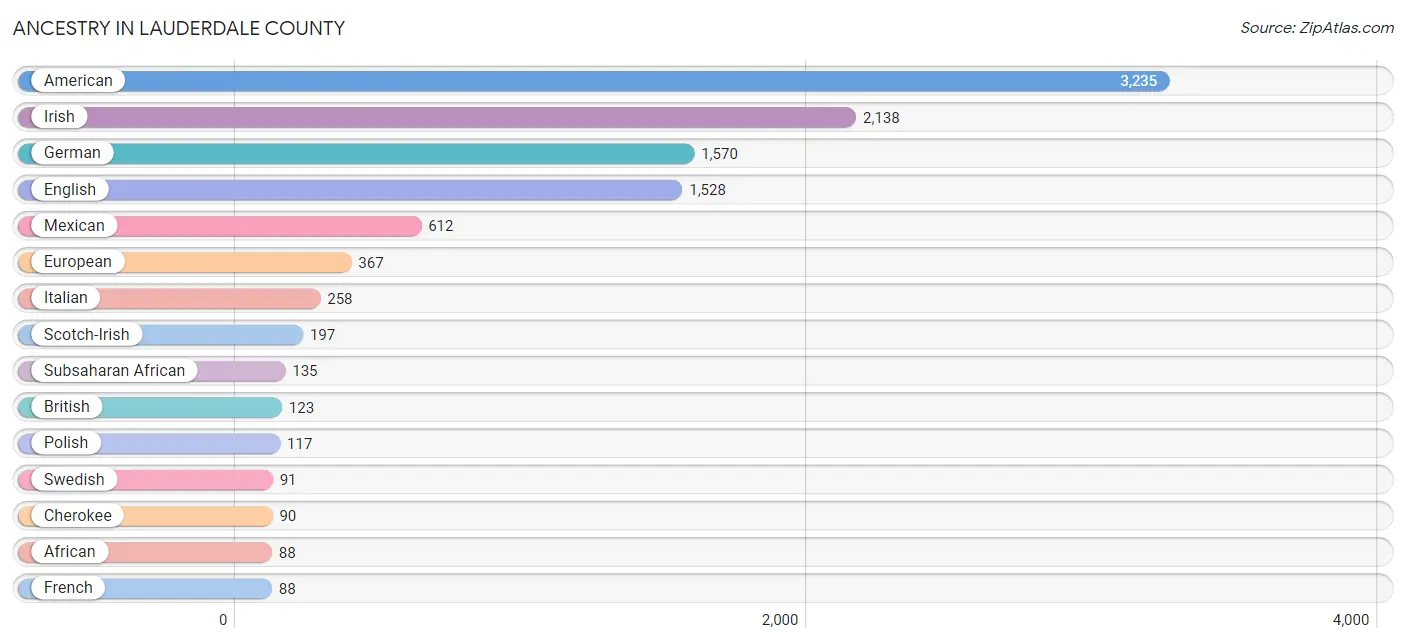
Ancestry in Lauderdale County
The most populous ancestries reported in Lauderdale County are American (3,235 | 12.9%), Irish (2,138 | 8.5%), German (1,570 | 6.2%), English (1,528 | 6.1%), and Mexican (612 | 2.4%), together accounting for 36.1% of all Lauderdale County residents.
| Ancestry | # Population | % Population |
| African | 88 | 0.4% |
| Aleut | 26 | 0.1% |
| American | 3,235 | 12.9% |
| Apache | 19 | 0.1% |
| Arab | 16 | 0.1% |
| Bhutanese | 44 | 0.2% |
| Blackfeet | 8 | 0.0% |
| British | 123 | 0.5% |
| Burmese | 9 | 0.0% |
| Cajun | 5 | 0.0% |
| Celtic | 5 | 0.0% |
| Central American | 19 | 0.1% |
| Cherokee | 90 | 0.4% |
| Choctaw | 54 | 0.2% |
| Cuban | 28 | 0.1% |
| Czech | 19 | 0.1% |
| Czechoslovakian | 6 | 0.0% |
| Dominican | 12 | 0.1% |
| Dutch | 39 | 0.2% |
| English | 1,528 | 6.1% |
| European | 367 | 1.5% |
| Finnish | 6 | 0.0% |
| French | 88 | 0.4% |
| French Canadian | 18 | 0.1% |
| German | 1,570 | 6.2% |
| Honduran | 19 | 0.1% |
| Hungarian | 11 | 0.0% |
| Indian (Asian) | 38 | 0.2% |
| Irish | 2,138 | 8.5% |
| Iroquois | 12 | 0.1% |
| Israeli | 6 | 0.0% |
| Italian | 258 | 1.0% |
| Jamaican | 5 | 0.0% |
| Korean | 20 | 0.1% |
| Mexican | 612 | 2.4% |
| Nigerian | 47 | 0.2% |
| Northern European | 3 | 0.0% |
| Norwegian | 50 | 0.2% |
| Palestinian | 10 | 0.0% |
| Polish | 117 | 0.5% |
| Portuguese | 7 | 0.0% |
| Puerto Rican | 48 | 0.2% |
| Russian | 61 | 0.2% |
| Scandinavian | 36 | 0.1% |
| Scotch-Irish | 197 | 0.8% |
| Scottish | 68 | 0.3% |
| Sierra Leonean | 39 | 0.2% |
| Sri Lankan | 34 | 0.1% |
| Subsaharan African | 135 | 0.5% |
| Swedish | 91 | 0.4% |
| Welsh | 71 | 0.3% | View All 51 Rows |
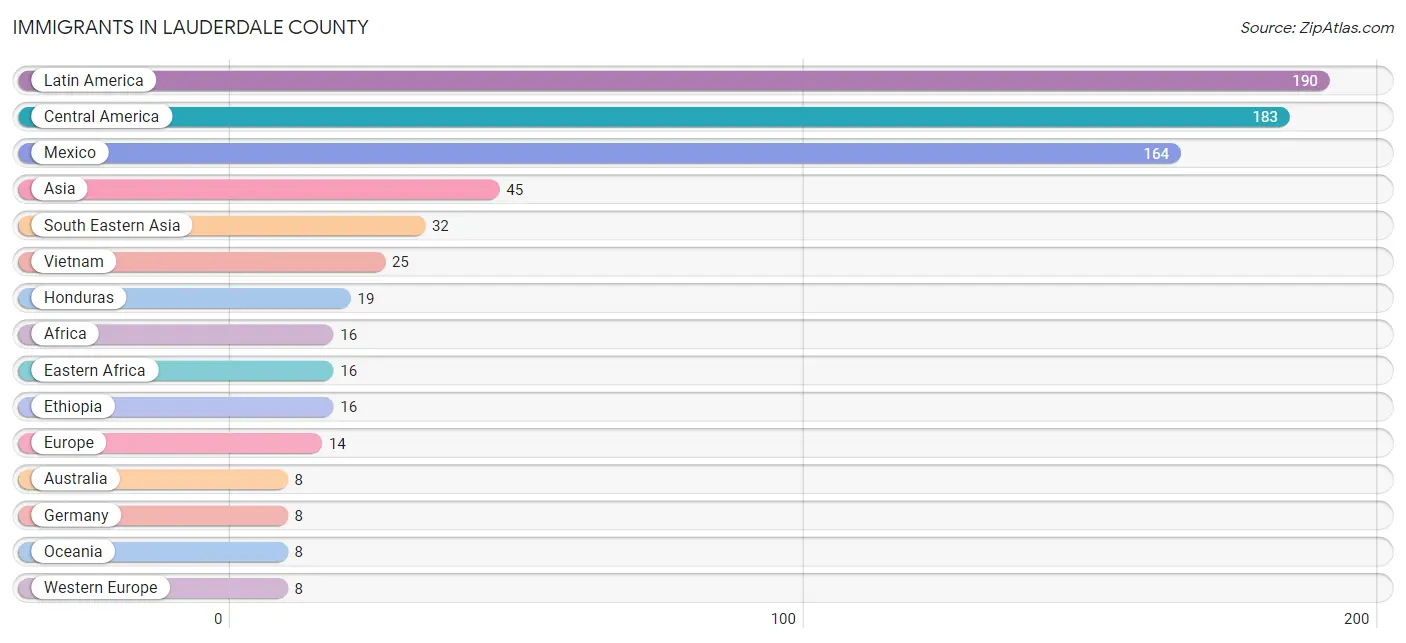
Immigrants in Lauderdale County
The most numerous immigrant groups reported in Lauderdale County came from Latin America (190 | 0.7%), Central America (183 | 0.7%), Mexico (164 | 0.6%), Asia (45 | 0.2%), and South Eastern Asia (32 | 0.1%), together accounting for 2.4% of all Lauderdale County residents.
| Immigration Origin | # Population | % Population |
| Africa | 16 | 0.1% |
| Asia | 45 | 0.2% |
| Australia | 8 | 0.0% |
| Caribbean | 7 | 0.0% |
| Central America | 183 | 0.7% |
| China | 7 | 0.0% |
| Dominican Republic | 7 | 0.0% |
| Eastern Africa | 16 | 0.1% |
| Eastern Asia | 7 | 0.0% |
| Ethiopia | 16 | 0.1% |
| Europe | 14 | 0.1% |
| Germany | 8 | 0.0% |
| Honduras | 19 | 0.1% |
| Israel | 6 | 0.0% |
| Latin America | 190 | 0.7% |
| Mexico | 164 | 0.6% |
| Northern Europe | 6 | 0.0% |
| Oceania | 8 | 0.0% |
| Philippines | 7 | 0.0% |
| South Eastern Asia | 32 | 0.1% |
| Vietnam | 25 | 0.1% |
| Western Asia | 6 | 0.0% |
| Western Europe | 8 | 0.0% | View All 23 Rows |
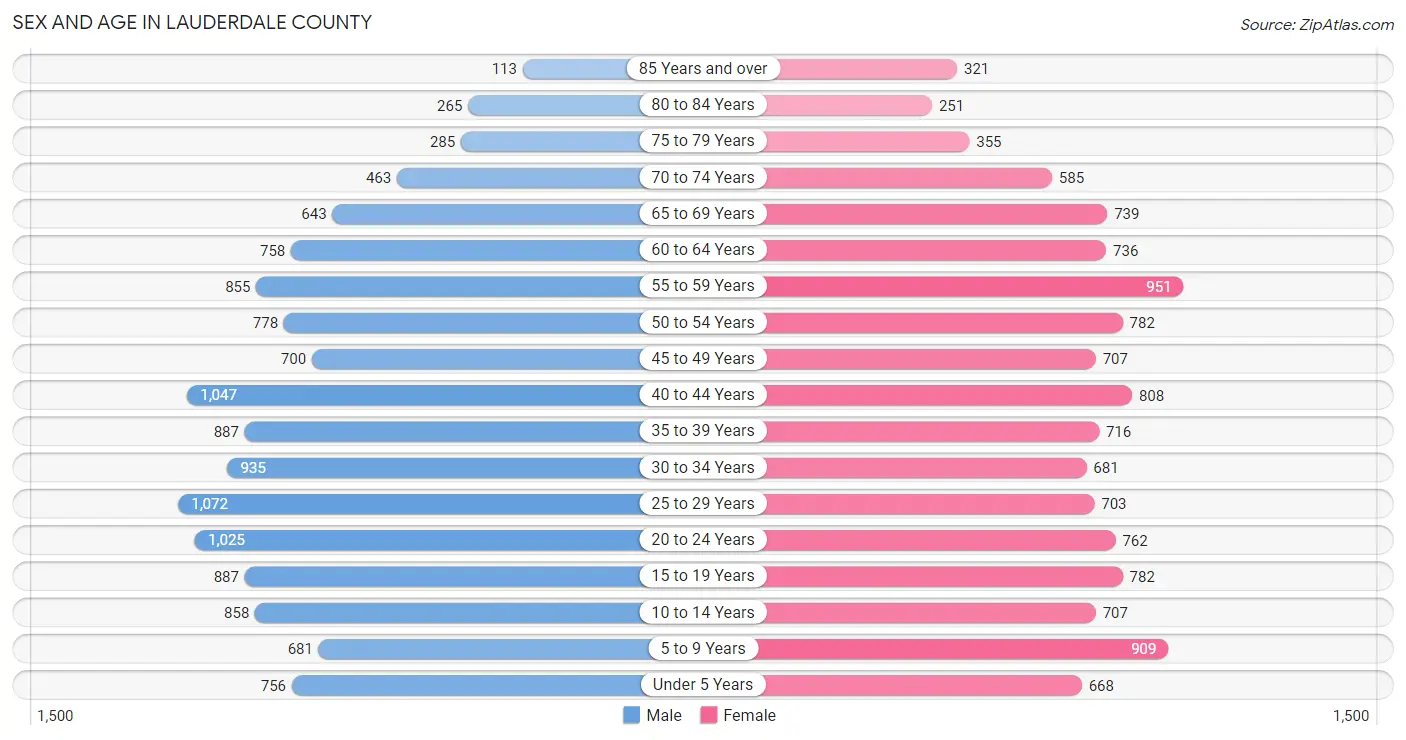
Sex and Age in Lauderdale County
Sex and Age in Lauderdale County
The most populous age groups in Lauderdale County are 25 to 29 Years (1,072 | 8.2%) for men and 55 to 59 Years (951 | 7.8%) for women.
| Age Bracket | Male | Female |
| Under 5 Years | 756 (5.8%) | 668 (5.5%) |
| 5 to 9 Years | 681 (5.2%) | 909 (7.5%) |
| 10 to 14 Years | 858 (6.6%) | 707 (5.8%) |
| 15 to 19 Years | 887 (6.8%) | 782 (6.4%) |
| 20 to 24 Years | 1,025 (7.9%) | 762 (6.3%) |
| 25 to 29 Years | 1,072 (8.2%) | 703 (5.8%) |
| 30 to 34 Years | 935 (7.2%) | 681 (5.6%) |
| 35 to 39 Years | 887 (6.8%) | 716 (5.9%) |
| 40 to 44 Years | 1,047 (8.1%) | 808 (6.6%) |
| 45 to 49 Years | 700 (5.4%) | 707 (5.8%) |
| 50 to 54 Years | 778 (6.0%) | 782 (6.4%) |
| 55 to 59 Years | 855 (6.6%) | 951 (7.8%) |
| 60 to 64 Years | 758 (5.8%) | 736 (6.0%) |
| 65 to 69 Years | 643 (4.9%) | 739 (6.1%) |
| 70 to 74 Years | 463 (3.6%) | 585 (4.8%) |
| 75 to 79 Years | 285 (2.2%) | 355 (2.9%) |
| 80 to 84 Years | 265 (2.0%) | 251 (2.1%) |
| 85 Years and over | 113 (0.9%) | 321 (2.6%) |
| Total | 13,008 (100.0%) | 12,163 (100.0%) |
Families and Households in Lauderdale County
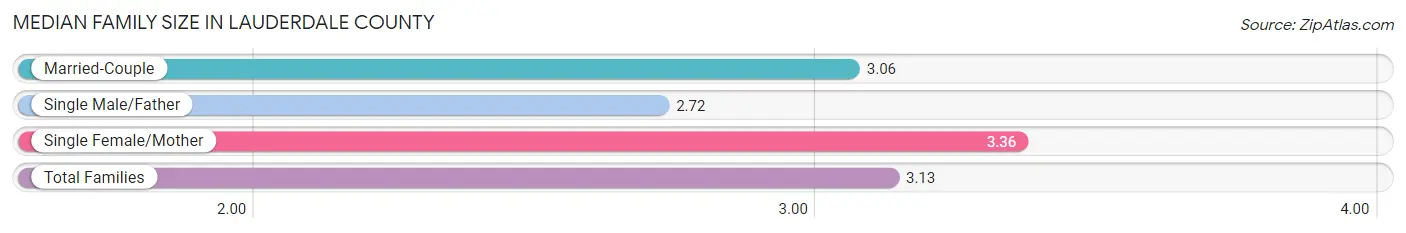
Median Family Size in Lauderdale County
The median family size in Lauderdale County is 3.13 persons per family, with single female/mother families (1,859 | 31.5%) accounting for the largest median family size of 3.36 persons per family. On the other hand, single male/father families (296 | 5.0%) represent the smallest median family size with 2.72 persons per family.
| Family Type | # Families | Family Size |
| Married-Couple | 3,747 (63.5%) | 3.06 |
| Single Male/Father | 296 (5.0%) | 2.72 |
| Single Female/Mother | 1,859 (31.5%) | 3.36 |
| Total Families | 5,902 (100.0%) | 3.13 |
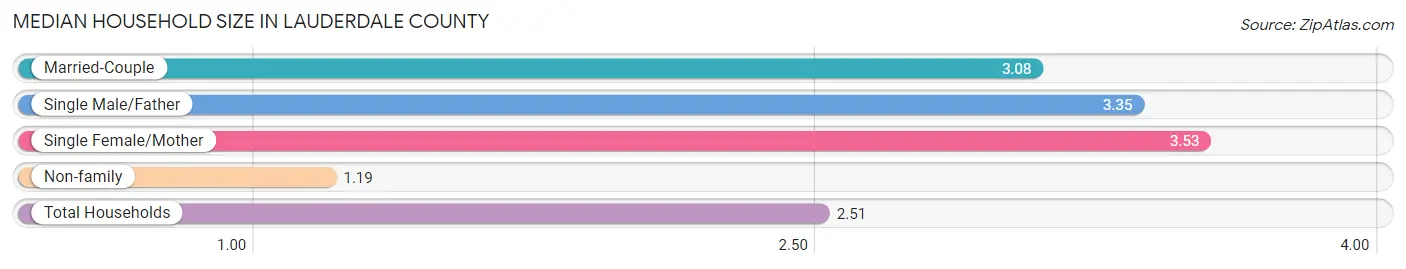
Median Household Size in Lauderdale County
The median household size in Lauderdale County is 2.51 persons per household, with single female/mother households (1,859 | 20.4%) accounting for the largest median household size of 3.53 persons per household. non-family households (3,225 | 35.3%) represent the smallest median household size with 1.19 persons per household.
| Household Type | # Households | Household Size |
| Married-Couple | 3,747 (41.0%) | 3.08 |
| Single Male/Father | 296 (3.2%) | 3.35 |
| Single Female/Mother | 1,859 (20.4%) | 3.53 |
| Non-family | 3,225 (35.3%) | 1.19 |
| Total Households | 9,127 (100.0%) | 2.51 |
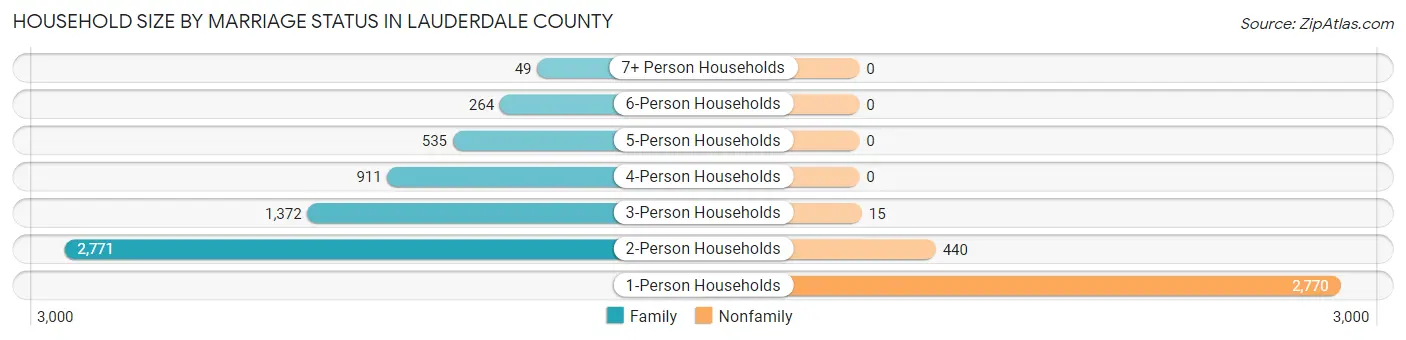
Household Size by Marriage Status in Lauderdale County
Out of a total of 9,127 households in Lauderdale County, 5,902 (64.7%) are family households, while 3,225 (35.3%) are nonfamily households. The most numerous type of family households are 2-person households, comprising 2,771, and the most common type of nonfamily households are 1-person households, comprising 2,770.
| Household Size | Family Households | Nonfamily Households |
| 1-Person Households | - | 2,770 (30.3%) |
| 2-Person Households | 2,771 (30.4%) | 440 (4.8%) |
| 3-Person Households | 1,372 (15.0%) | 15 (0.2%) |
| 4-Person Households | 911 (10.0%) | 0 (0.0%) |
| 5-Person Households | 535 (5.9%) | 0 (0.0%) |
| 6-Person Households | 264 (2.9%) | 0 (0.0%) |
| 7+ Person Households | 49 (0.5%) | 0 (0.0%) |
| Total | 5,902 (64.7%) | 3,225 (35.3%) |
Female Fertility in Lauderdale County
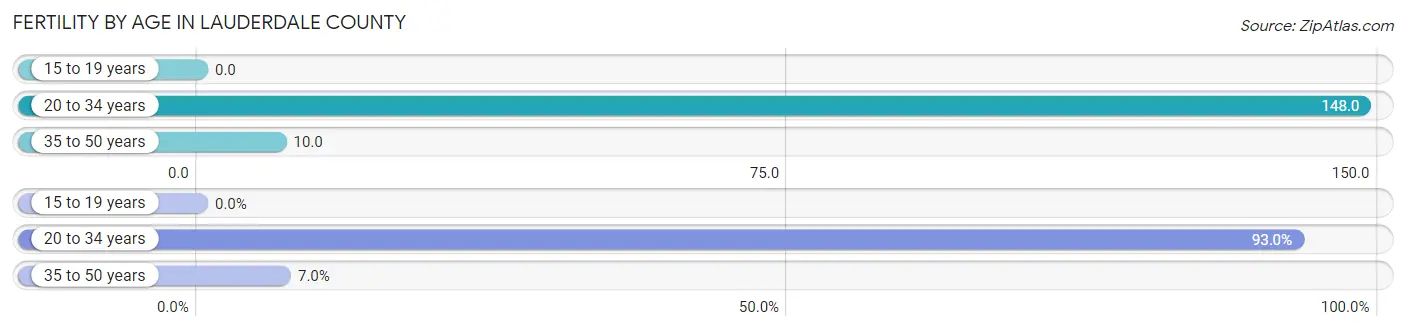
Fertility by Age in Lauderdale County
Average fertility rate in Lauderdale County is 64.0 births per 1,000 women. Women in the age bracket of 20 to 34 years have the highest fertility rate with 148.0 births per 1,000 women. Women in the age bracket of 20 to 34 years acount for 93.0% of all women with births.
| Age Bracket | Women with Births | Births / 1,000 Women |
| 15 to 19 years | 0 (0.0%) | 0.0 |
| 20 to 34 years | 317 (93.0%) | 148.0 |
| 35 to 50 years | 24 (7.0%) | 10.0 |
| Total | 341 (100.0%) | 64.0 |
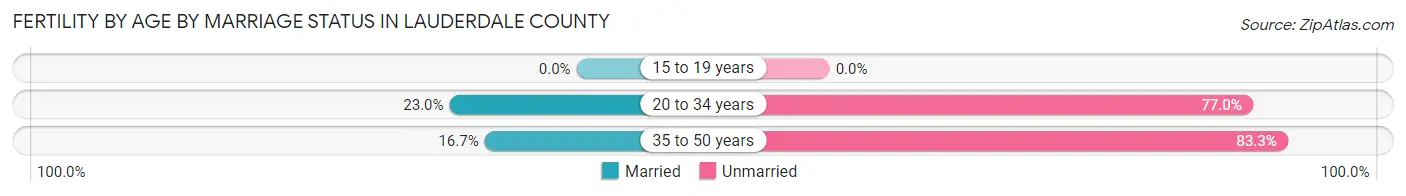
Fertility by Age by Marriage Status in Lauderdale County
22.6% of women with births (341) in Lauderdale County are married. The highest percentage of unmarried women with births falls into 35 to 50 years age bracket with 83.3% of them unmarried at the time of birth, while the lowest percentage of unmarried women with births belong to 20 to 34 years age bracket with 77.0% of them unmarried.
| Age Bracket | Married | Unmarried |
| 15 to 19 years | 0 (0.0%) | 0 (0.0%) |
| 20 to 34 years | 73 (23.0%) | 244 (77.0%) |
| 35 to 50 years | 4 (16.7%) | 20 (83.3%) |
| Total | 77 (22.6%) | 264 (77.4%) |
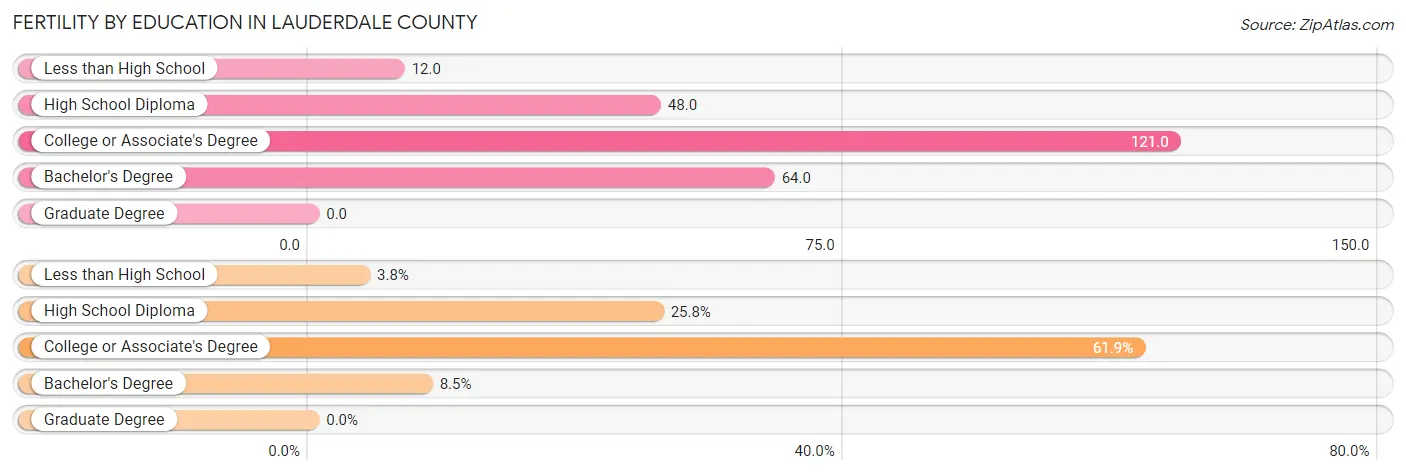
Fertility by Education in Lauderdale County
| Educational Attainment | Women with Births | Births / 1,000 Women |
| Less than High School | 13 (3.8%) | 12.0 |
| High School Diploma | 88 (25.8%) | 48.0 |
| College or Associate's Degree | 211 (61.9%) | 121.0 |
| Bachelor's Degree | 29 (8.5%) | 64.0 |
| Graduate Degree | 0 (0.0%) | 0.0 |
| Total | 341 (100.0%) | 64.0 |
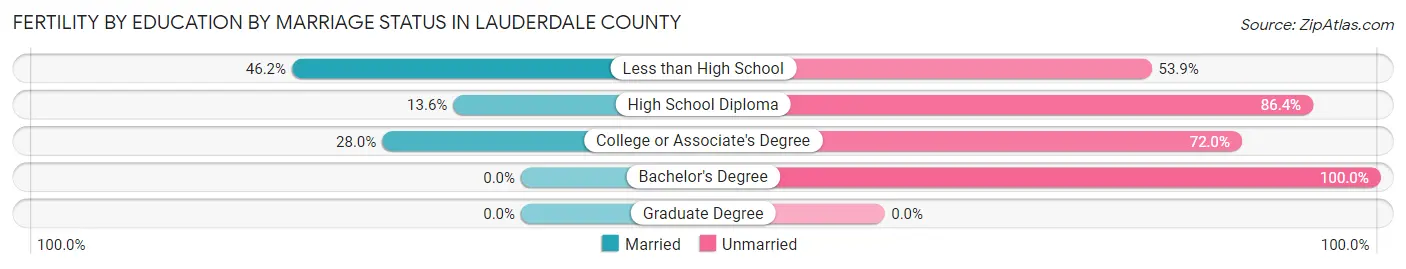
Fertility by Education by Marriage Status in Lauderdale County
77.4% of women with births in Lauderdale County are unmarried. Women with the educational attainment of less than high school are most likely to be married with 46.2% of them married at childbirth, while women with the educational attainment of bachelor's degree are least likely to be married with 100.0% of them unmarried at childbirth.
| Educational Attainment | Married | Unmarried |
| Less than High School | 6 (46.2%) | 7 (53.8%) |
| High School Diploma | 12 (13.6%) | 76 (86.4%) |
| College or Associate's Degree | 59 (28.0%) | 152 (72.0%) |
| Bachelor's Degree | 0 (0.0%) | 29 (100.0%) |
| Graduate Degree | 0 (0.0%) | 0 (0.0%) |
| Total | 77 (22.6%) | 264 (77.4%) |
Income in Lauderdale County
Income Overview in Lauderdale County
Per Capita Income in Lauderdale County is $24,358, while median incomes of families and households are $55,679 and $46,702 respectively.
| Characteristic | Number | Measure |
| Per Capita Income | 25,171 | $24,358 |
| Median Family Income | 5,902 | $55,679 |
| Mean Family Income | 5,902 | $69,504 |
| Median Household Income | 9,127 | $46,702 |
| Mean Household Income | 9,127 | $61,805 |
| Income Deficit | 5,902 | $12,053 |
| Wage / Income Gap (%) | 25,171 | 25.06% |
| Wage / Income Gap ($) | 25,171 | 74.94¢ per $1 |
| Gini / Inequality Index | 25,171 | 0.45 |
Earnings by Sex in Lauderdale County
Average Earnings in Lauderdale County are $35,824, $40,900 for men and $30,651 for women, a difference of 25.1%.
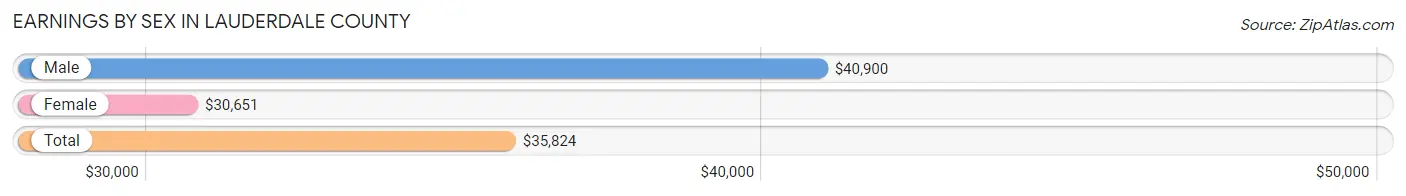
| Sex | Number | Average Earnings |
| Male | 5,780 (54.0%) | $40,900 |
| Female | 4,913 (46.0%) | $30,651 |
| Total | 10,693 (100.0%) | $35,824 |
Earnings by Sex by Income Bracket in Lauderdale County
The most common earnings brackets in Lauderdale County are $40,000 to $44,999 for men (558 | 9.7%) and $30,000 to $34,999 for women (538 | 11.0%).
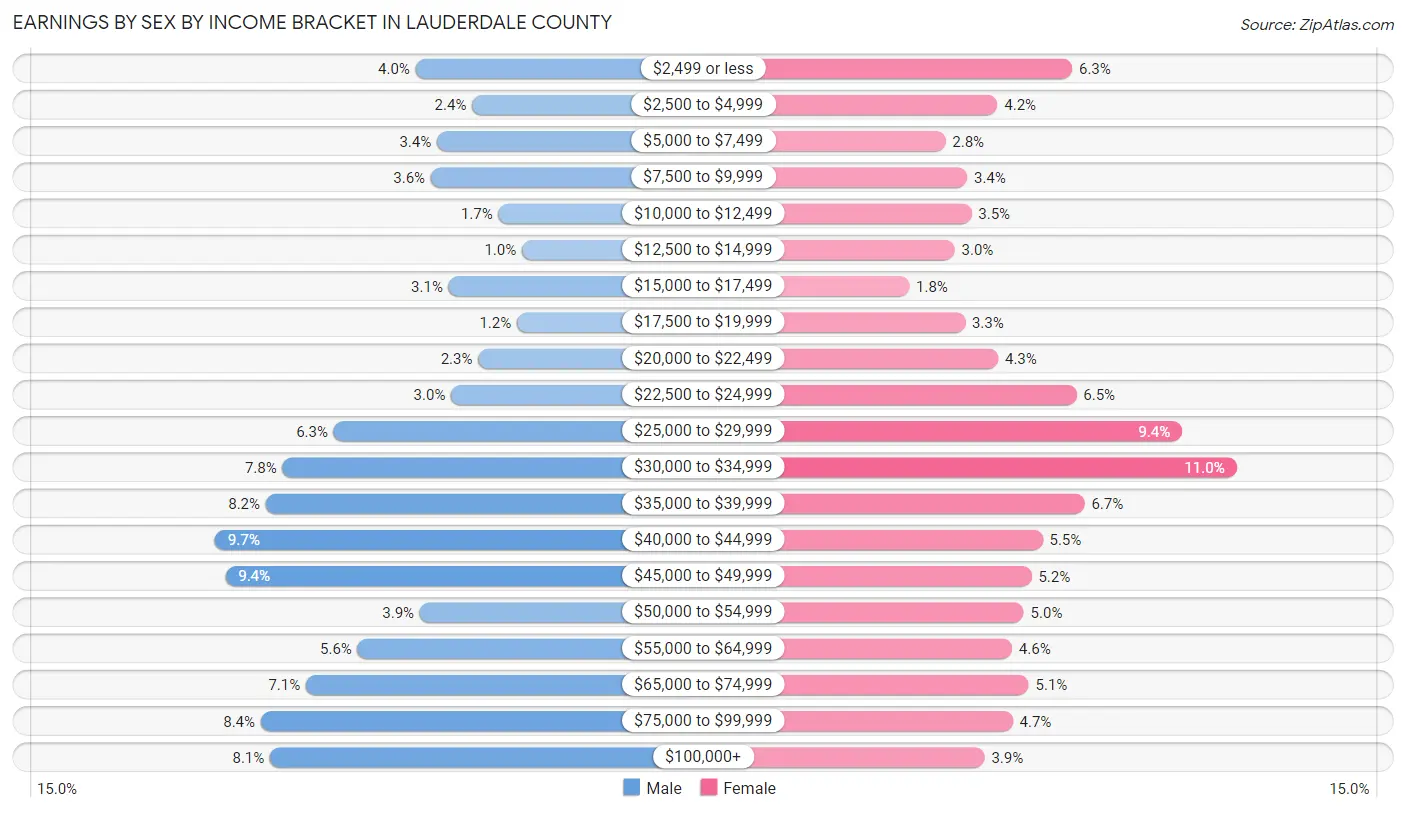
| Income | Male | Female |
| $2,499 or less | 232 (4.0%) | 311 (6.3%) |
| $2,500 to $4,999 | 140 (2.4%) | 208 (4.2%) |
| $5,000 to $7,499 | 197 (3.4%) | 136 (2.8%) |
| $7,500 to $9,999 | 207 (3.6%) | 166 (3.4%) |
| $10,000 to $12,499 | 97 (1.7%) | 172 (3.5%) |
| $12,500 to $14,999 | 59 (1.0%) | 149 (3.0%) |
| $15,000 to $17,499 | 178 (3.1%) | 86 (1.8%) |
| $17,500 to $19,999 | 67 (1.2%) | 163 (3.3%) |
| $20,000 to $22,499 | 130 (2.2%) | 209 (4.3%) |
| $22,500 to $24,999 | 174 (3.0%) | 317 (6.5%) |
| $25,000 to $29,999 | 365 (6.3%) | 463 (9.4%) |
| $30,000 to $34,999 | 448 (7.7%) | 538 (11.0%) |
| $35,000 to $39,999 | 475 (8.2%) | 328 (6.7%) |
| $40,000 to $44,999 | 558 (9.7%) | 270 (5.5%) |
| $45,000 to $49,999 | 541 (9.4%) | 255 (5.2%) |
| $50,000 to $54,999 | 225 (3.9%) | 244 (5.0%) |
| $55,000 to $64,999 | 326 (5.6%) | 228 (4.6%) |
| $65,000 to $74,999 | 410 (7.1%) | 251 (5.1%) |
| $75,000 to $99,999 | 483 (8.4%) | 229 (4.7%) |
| $100,000+ | 468 (8.1%) | 190 (3.9%) |
| Total | 5,780 (100.0%) | 4,913 (100.0%) |
Earnings by Sex by Educational Attainment in Lauderdale County
Average earnings in Lauderdale County are $44,329 for men and $32,718 for women, a difference of 26.2%. Men with an educational attainment of college or associate's degree enjoy the highest average annual earnings of $47,143, while those with less than high school education earn the least with $28,235. Women with an educational attainment of graduate degree earn the most with the average annual earnings of $61,635, while those with less than high school education have the smallest earnings of $24,872.
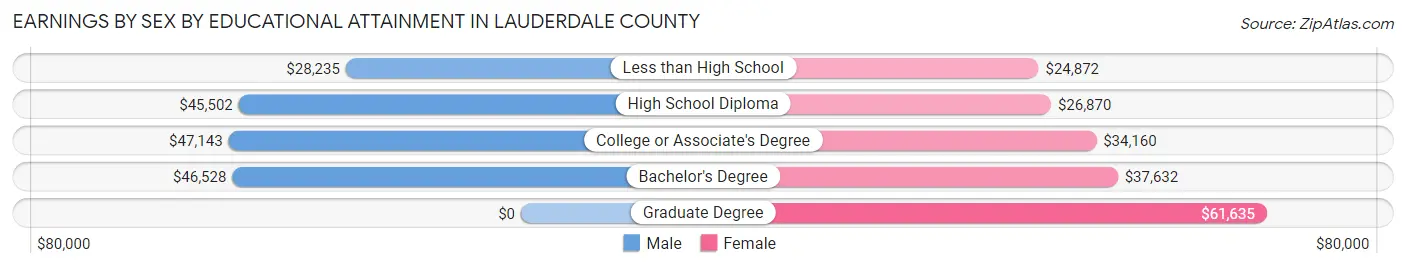
| Educational Attainment | Male Income | Female Income |
| Less than High School | $28,235 | $24,872 |
| High School Diploma | $45,502 | $26,870 |
| College or Associate's Degree | $47,143 | $34,160 |
| Bachelor's Degree | $46,528 | $37,632 |
| Graduate Degree | - | - |
| Total | $44,329 | $32,718 |
Family Income in Lauderdale County
Family Income Brackets in Lauderdale County
According to the Lauderdale County family income data, there are 1,139 families falling into the $50,000 to $74,999 income range, which is the most common income bracket and makes up 19.3% of all families. Conversely, the $150,000 to $199,999 income bracket is the least frequent group with only 230 families (3.9%) belonging to this category.
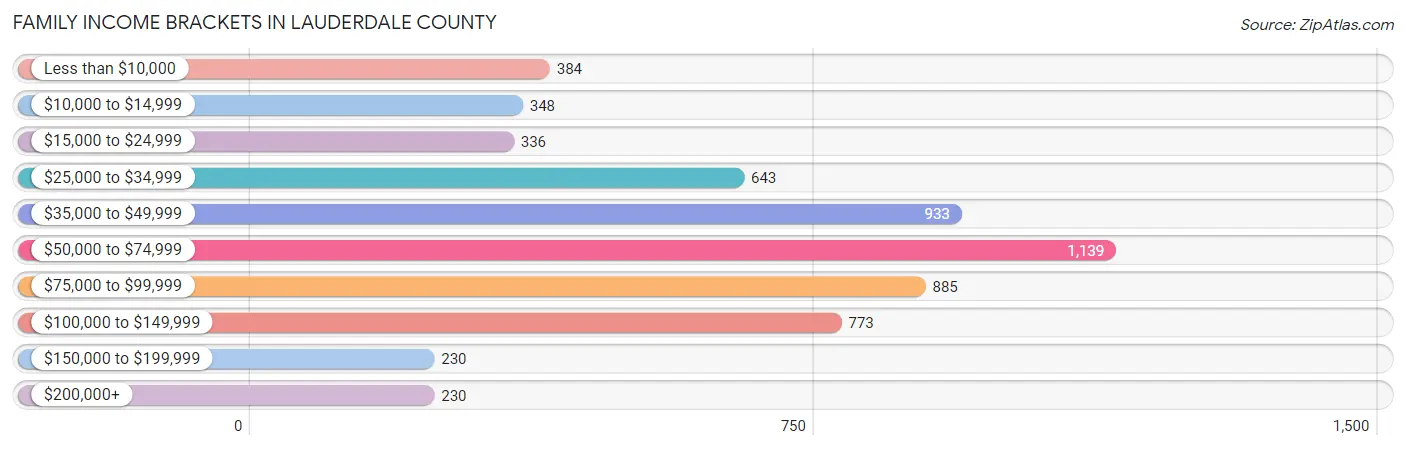
| Income Bracket | # Families | % Families |
| Less than $10,000 | 384 | 6.5% |
| $10,000 to $14,999 | 348 | 5.9% |
| $15,000 to $24,999 | 336 | 5.7% |
| $25,000 to $34,999 | 643 | 10.9% |
| $35,000 to $49,999 | 933 | 15.8% |
| $50,000 to $74,999 | 1,139 | 19.3% |
| $75,000 to $99,999 | 885 | 15.0% |
| $100,000 to $149,999 | 773 | 13.1% |
| $150,000 to $199,999 | 230 | 3.9% |
| $200,000+ | 230 | 3.9% |
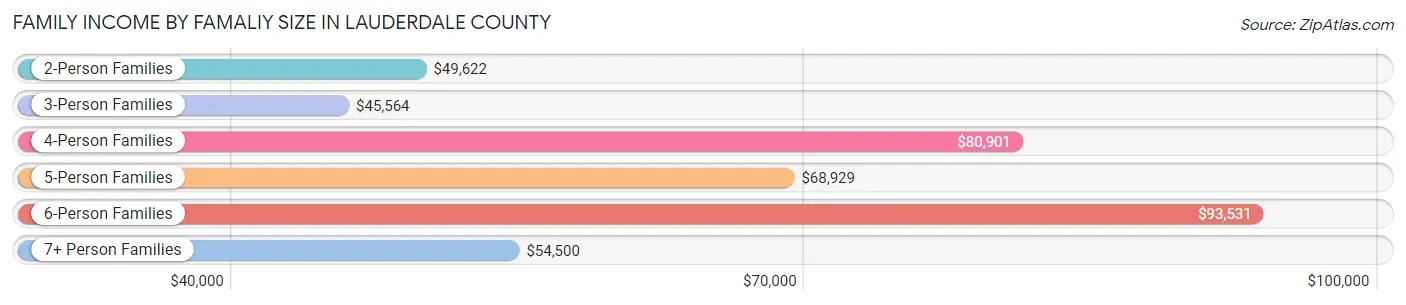
Family Income by Famaliy Size in Lauderdale County
6-person families (221 | 3.7%) account for the highest median family income in Lauderdale County with $93,531 per family, while 2-person families (2,949 | 50.0%) have the highest median income of $24,811 per family member.
| Income Bracket | # Families | Median Income |
| 2-Person Families | 2,949 (50.0%) | $49,622 |
| 3-Person Families | 1,353 (22.9%) | $45,564 |
| 4-Person Families | 817 (13.8%) | $80,901 |
| 5-Person Families | 524 (8.9%) | $68,929 |
| 6-Person Families | 221 (3.7%) | $93,531 |
| 7+ Person Families | 38 (0.6%) | $54,500 |
| Total | 5,902 (100.0%) | $55,679 |
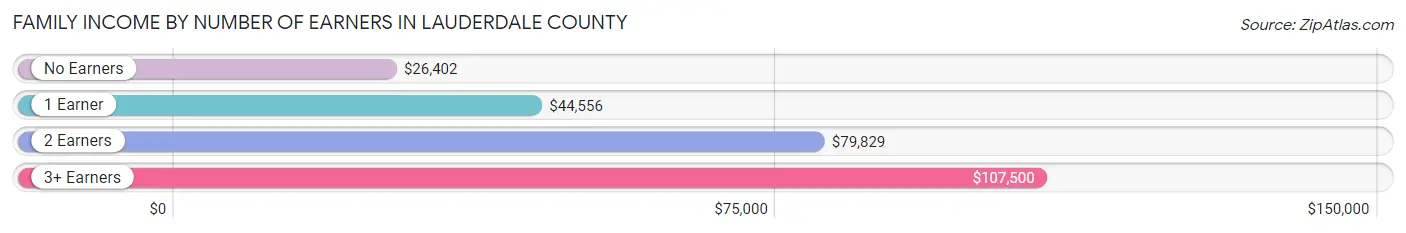
Family Income by Number of Earners in Lauderdale County
The median family income in Lauderdale County is $55,679, with families comprising 3+ earners (398) having the highest median family income of $107,500, while families with no earners (1,228) have the lowest median family income of $26,402, accounting for 6.7% and 20.8% of families, respectively.
| Number of Earners | # Families | Median Income |
| No Earners | 1,228 (20.8%) | $26,402 |
| 1 Earner | 2,097 (35.5%) | $44,556 |
| 2 Earners | 2,179 (36.9%) | $79,829 |
| 3+ Earners | 398 (6.7%) | $107,500 |
| Total | 5,902 (100.0%) | $55,679 |
Household Income in Lauderdale County
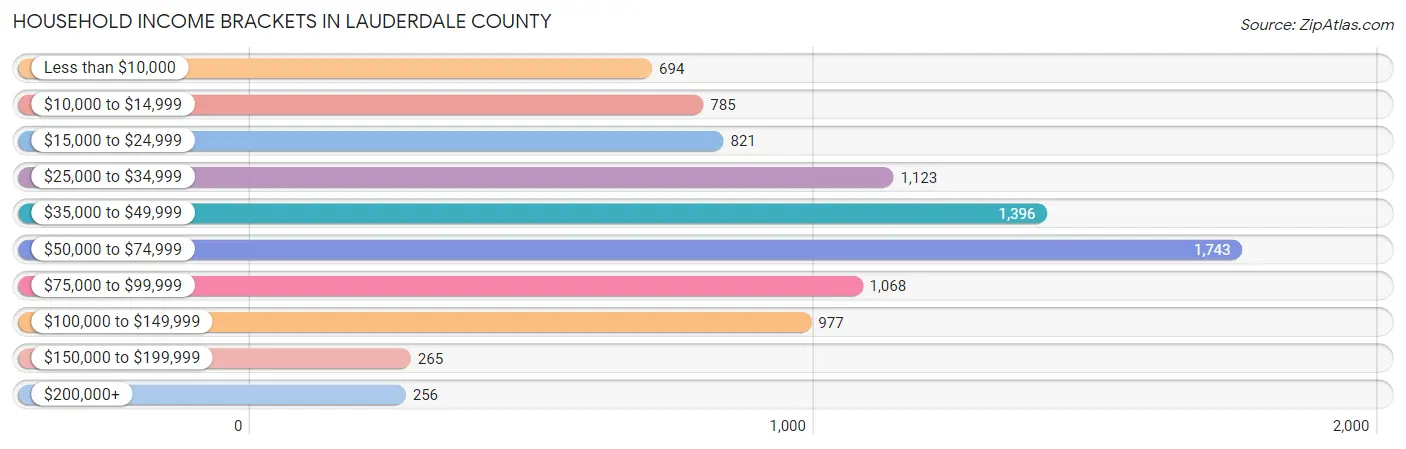
Household Income Brackets in Lauderdale County
With 1,743 households falling in the category, the $50,000 to $74,999 income range is the most frequent in Lauderdale County, accounting for 19.1% of all households. In contrast, only 256 households (2.8%) fall into the $200,000+ income bracket, making it the least populous group.
| Income Bracket | # Households | % Households |
| Less than $10,000 | 694 | 7.6% |
| $10,000 to $14,999 | 785 | 8.6% |
| $15,000 to $24,999 | 821 | 9.0% |
| $25,000 to $34,999 | 1,123 | 12.3% |
| $35,000 to $49,999 | 1,396 | 15.3% |
| $50,000 to $74,999 | 1,743 | 19.1% |
| $75,000 to $99,999 | 1,068 | 11.7% |
| $100,000 to $149,999 | 977 | 10.7% |
| $150,000 to $199,999 | 265 | 2.9% |
| $200,000+ | 256 | 2.8% |
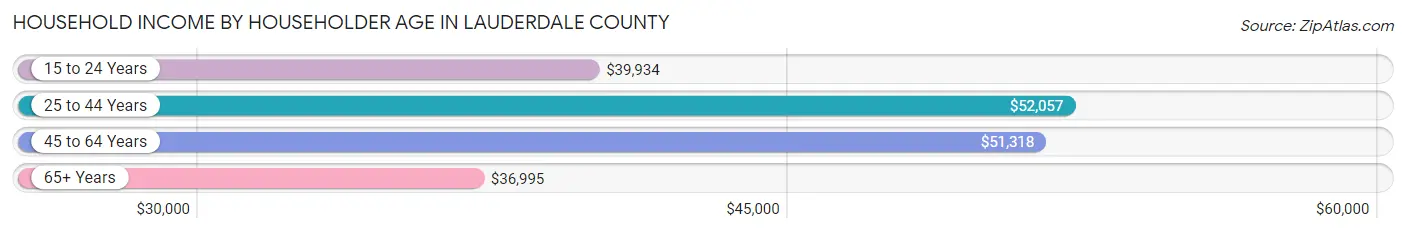
Household Income by Householder Age in Lauderdale County
The median household income in Lauderdale County is $46,702, with the highest median household income of $52,057 found in the 25 to 44 years age bracket for the primary householder. A total of 2,734 households (30.0%) fall into this category. Meanwhile, the 65+ years age bracket for the primary householder has the lowest median household income of $36,995, with 2,349 households (25.7%) in this group.
| Income Bracket | # Households | Median Income |
| 15 to 24 Years | 591 (6.5%) | $39,934 |
| 25 to 44 Years | 2,734 (30.0%) | $52,057 |
| 45 to 64 Years | 3,453 (37.8%) | $51,318 |
| 65+ Years | 2,349 (25.7%) | $36,995 |
| Total | 9,127 (100.0%) | $46,702 |
Poverty in Lauderdale County
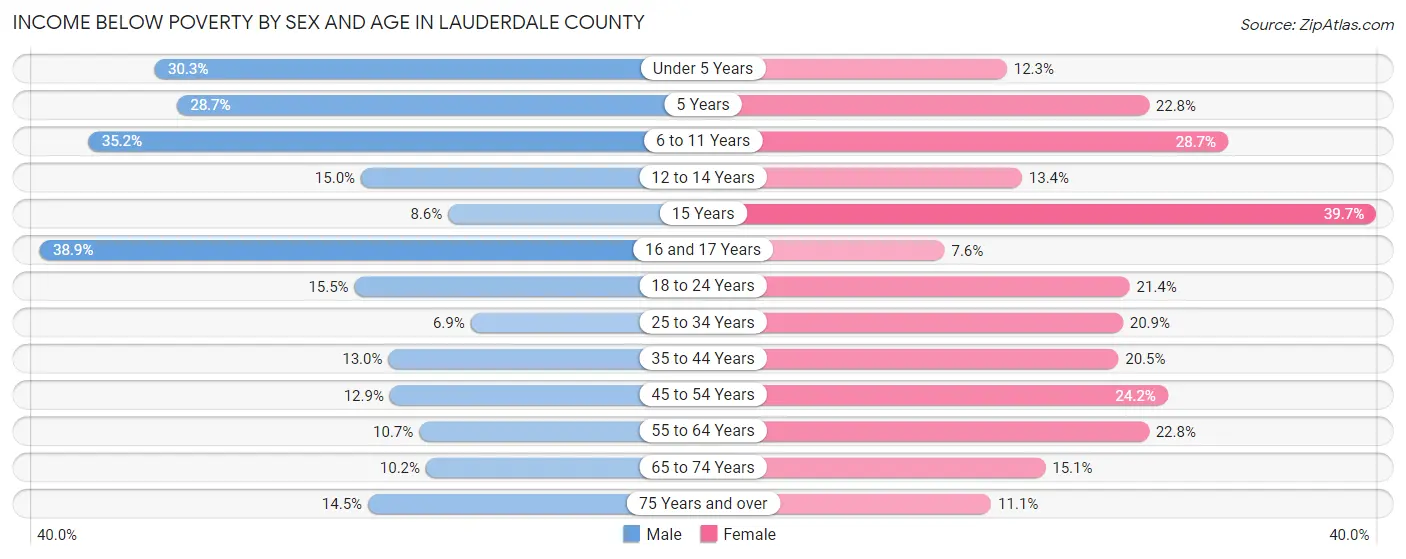
Income Below Poverty by Sex and Age in Lauderdale County
With 15.9% poverty level for males and 20.0% for females among the residents of Lauderdale County, 16 and 17 year old males and 15 year old females are the most vulnerable to poverty, with 101 males (38.9%) and 69 females (39.7%) in their respective age groups living below the poverty level.
| Age Bracket | Male | Female |
| Under 5 Years | 224 (30.3%) | 81 (12.2%) |
| 5 Years | 47 (28.7%) | 44 (22.8%) |
| 6 to 11 Years | 328 (35.2%) | 290 (28.7%) |
| 12 to 14 Years | 66 (15.0%) | 54 (13.4%) |
| 15 Years | 22 (8.6%) | 69 (39.7%) |
| 16 and 17 Years | 101 (38.9%) | 27 (7.6%) |
| 18 to 24 Years | 186 (15.5%) | 209 (21.4%) |
| 25 to 34 Years | 90 (6.9%) | 256 (20.9%) |
| 35 to 44 Years | 203 (13.0%) | 288 (20.5%) |
| 45 to 54 Years | 161 (12.9%) | 344 (24.2%) |
| 55 to 64 Years | 155 (10.7%) | 377 (22.8%) |
| 65 to 74 Years | 108 (10.2%) | 197 (15.1%) |
| 75 Years and over | 94 (14.5%) | 97 (11.1%) |
| Total | 1,785 (15.9%) | 2,333 (20.0%) |
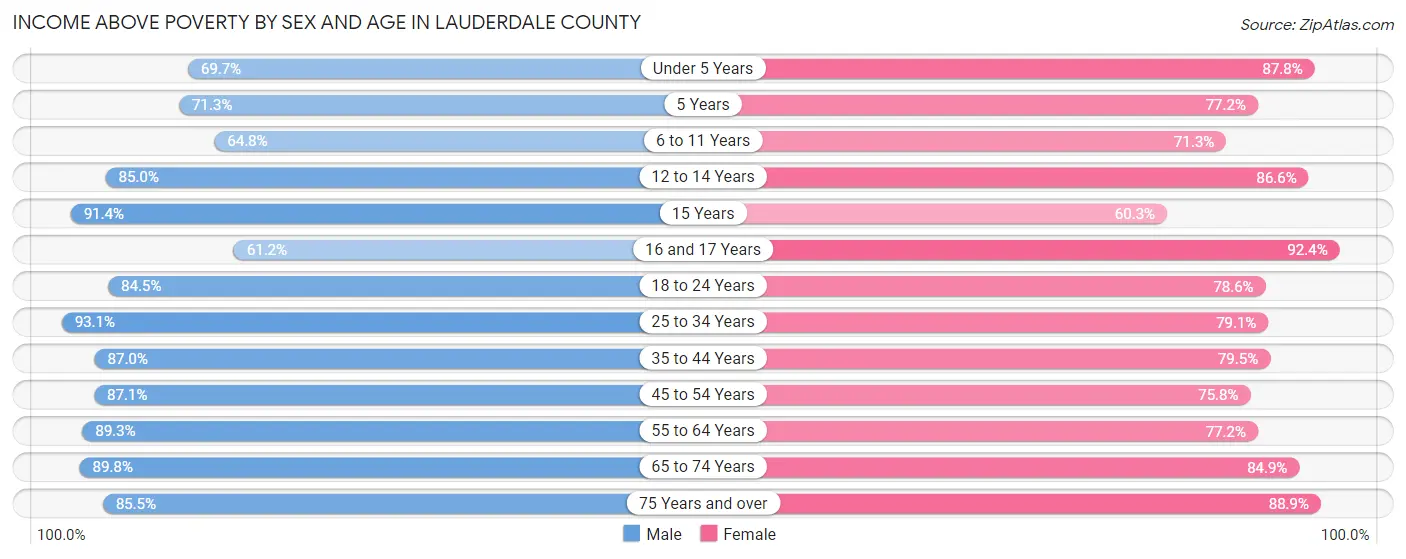
Income Above Poverty by Sex and Age in Lauderdale County
According to the poverty statistics in Lauderdale County, males aged 25 to 34 years and females aged 16 and 17 years are the age groups that are most secure financially, with 93.1% of males and 92.4% of females in these age groups living above the poverty line.
| Age Bracket | Male | Female |
| Under 5 Years | 515 (69.7%) | 580 (87.7%) |
| 5 Years | 117 (71.3%) | 149 (77.2%) |
| 6 to 11 Years | 603 (64.8%) | 722 (71.3%) |
| 12 to 14 Years | 373 (85.0%) | 350 (86.6%) |
| 15 Years | 235 (91.4%) | 105 (60.3%) |
| 16 and 17 Years | 159 (61.2%) | 327 (92.4%) |
| 18 to 24 Years | 1,013 (84.5%) | 769 (78.6%) |
| 25 to 34 Years | 1,216 (93.1%) | 971 (79.1%) |
| 35 to 44 Years | 1,359 (87.0%) | 1,115 (79.5%) |
| 45 to 54 Years | 1,088 (87.1%) | 1,078 (75.8%) |
| 55 to 64 Years | 1,292 (89.3%) | 1,277 (77.2%) |
| 65 to 74 Years | 950 (89.8%) | 1,107 (84.9%) |
| 75 Years and over | 554 (85.5%) | 778 (88.9%) |
| Total | 9,474 (84.2%) | 9,328 (80.0%) |
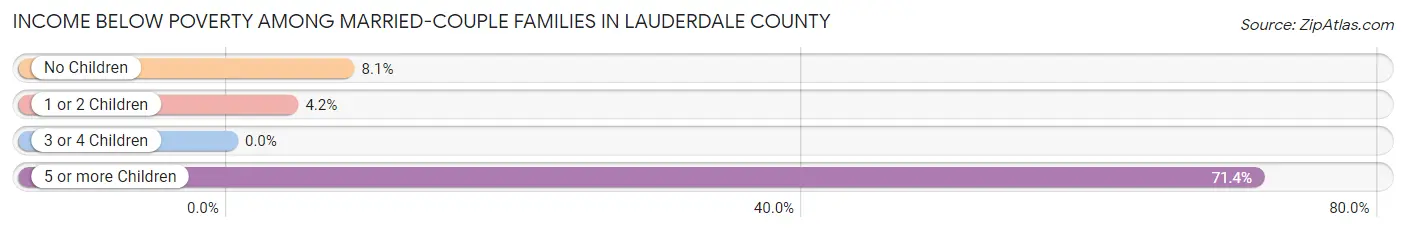
Income Below Poverty Among Married-Couple Families in Lauderdale County
The poverty statistics for married-couple families in Lauderdale County show that 6.8% or 254 of the total 3,747 families live below the poverty line. Families with 5 or more children have the highest poverty rate of 71.4%, comprising of 15 families. On the other hand, families with 3 or 4 children have the lowest poverty rate of 0.0%, which includes 0 families.
| Children | Above Poverty | Below Poverty |
| No Children | 2,285 (91.9%) | 202 (8.1%) |
| 1 or 2 Children | 841 (95.8%) | 37 (4.2%) |
| 3 or 4 Children | 361 (100.0%) | 0 (0.0%) |
| 5 or more Children | 6 (28.6%) | 15 (71.4%) |
| Total | 3,493 (93.2%) | 254 (6.8%) |
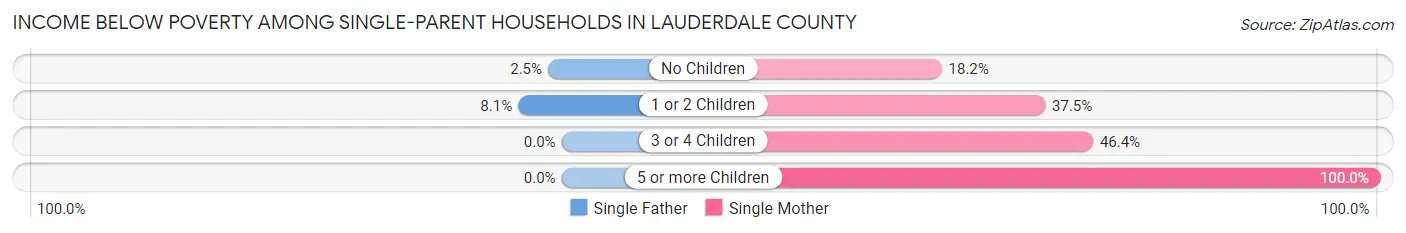
Income Below Poverty Among Single-Parent Households in Lauderdale County
According to the poverty data in Lauderdale County, 6.4% or 19 single-father households and 33.5% or 623 single-mother households are living below the poverty line. Among single-father households, those with 1 or 2 children have the highest poverty rate, with 17 households (8.1%) experiencing poverty. Likewise, among single-mother households, those with 5 or more children have the highest poverty rate, with 24 households (100.0%) falling below the poverty line.
| Children | Single Father | Single Mother |
| No Children | 2 (2.5%) | 106 (18.2%) |
| 1 or 2 Children | 17 (8.1%) | 376 (37.5%) |
| 3 or 4 Children | 0 (0.0%) | 117 (46.4%) |
| 5 or more Children | 0 (0.0%) | 24 (100.0%) |
| Total | 19 (6.4%) | 623 (33.5%) |
Income Below Poverty Among Married-Couple vs Single-Parent Households in Lauderdale County
The poverty data for Lauderdale County shows that 254 of the married-couple family households (6.8%) and 642 of the single-parent households (29.8%) are living below the poverty level. Within the married-couple family households, those with 5 or more children have the highest poverty rate, with 15 households (71.4%) falling below the poverty line. Among the single-parent households, those with 5 or more children have the highest poverty rate, with 24 household (100.0%) living below poverty.
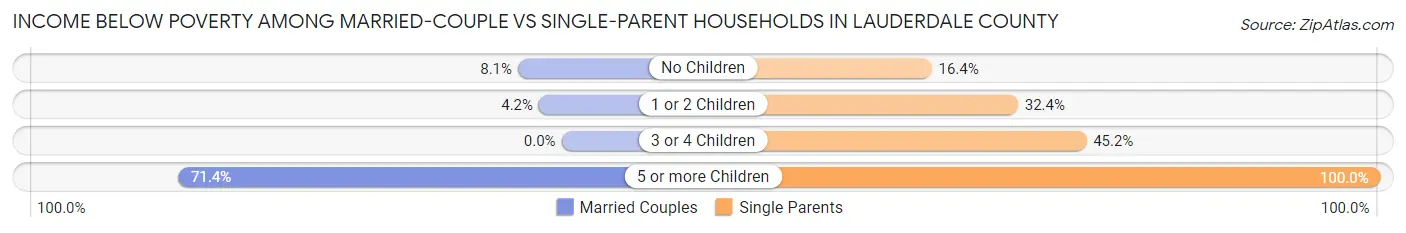
| Children | Married-Couple Families | Single-Parent Households |
| No Children | 202 (8.1%) | 108 (16.4%) |
| 1 or 2 Children | 37 (4.2%) | 393 (32.4%) |
| 3 or 4 Children | 0 (0.0%) | 117 (45.2%) |
| 5 or more Children | 15 (71.4%) | 24 (100.0%) |
| Total | 254 (6.8%) | 642 (29.8%) |
Employment Characteristics in Lauderdale County
Employment by Class of Employer in Lauderdale County
Among the 9,045 employed individuals in Lauderdale County, private company employees (6,420 | 71.0%), local government employees (707 | 7.8%), and state government employees (675 | 7.5%) make up the most common classes of employment.
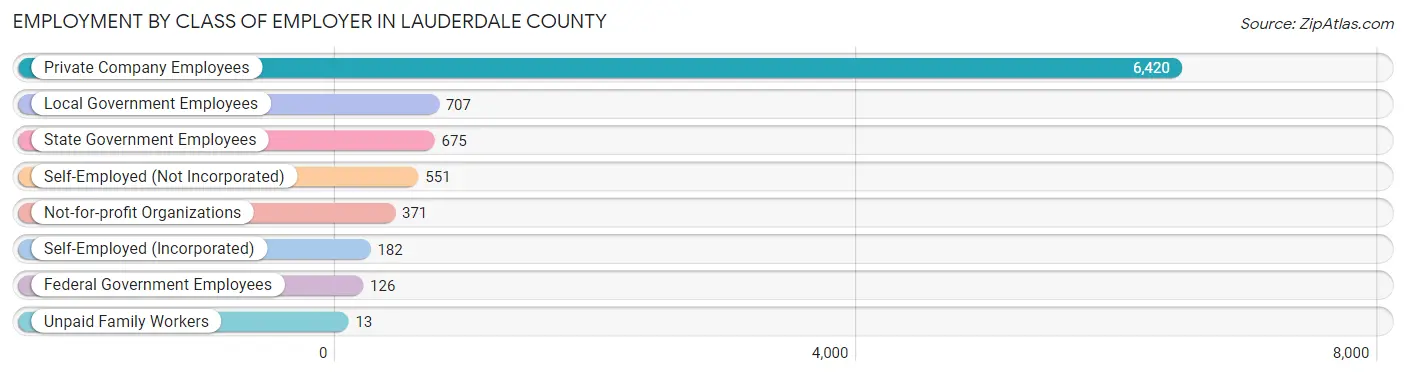
| Employer Class | # Employees | % Employees |
| Private Company Employees | 6,420 | 71.0% |
| Self-Employed (Incorporated) | 182 | 2.0% |
| Self-Employed (Not Incorporated) | 551 | 6.1% |
| Not-for-profit Organizations | 371 | 4.1% |
| Local Government Employees | 707 | 7.8% |
| State Government Employees | 675 | 7.5% |
| Federal Government Employees | 126 | 1.4% |
| Unpaid Family Workers | 13 | 0.1% |
| Total | 9,045 | 100.0% |
Employment Status by Age in Lauderdale County
According to the labor force statistics for Lauderdale County, out of the total population over 16 years of age (20,161), 49.1% or 9,899 individuals are in the labor force, with 6.1% or 604 of them unemployed. The age group with the highest labor force participation rate is 35 to 44 years, with 66.5% or 2,300 individuals in the labor force. Within the labor force, the 16 to 19 years age range has the highest percentage of unemployed individuals, with 20.9% or 107 of them being unemployed.
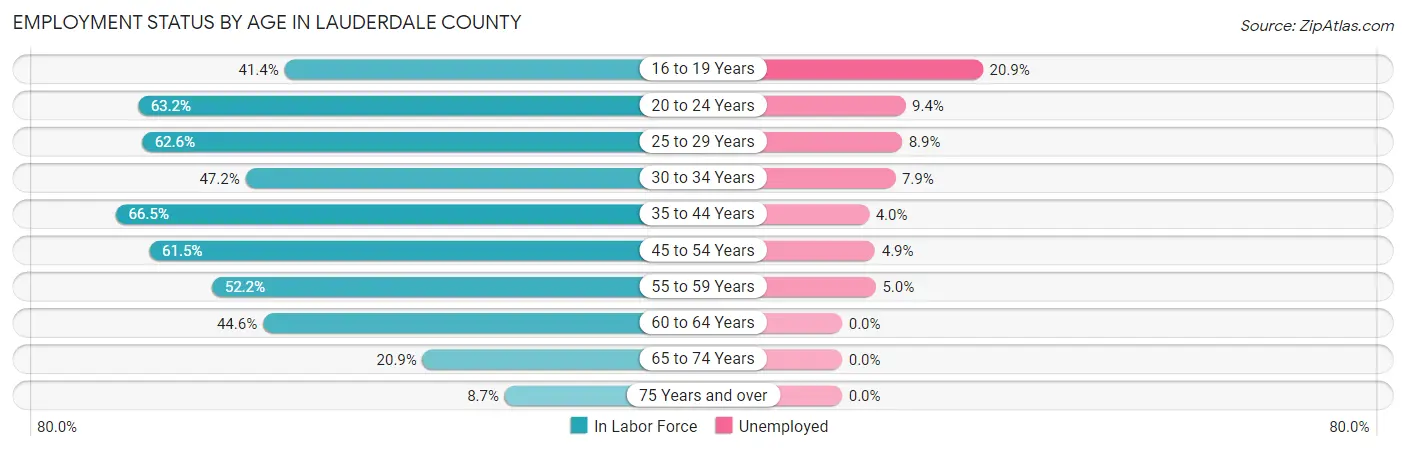
| Age Bracket | In Labor Force | Unemployed |
| 16 to 19 Years | 513 (41.4%) | 107 (20.9%) |
| 20 to 24 Years | 1,129 (63.2%) | 106 (9.4%) |
| 25 to 29 Years | 1,111 (62.6%) | 99 (8.9%) |
| 30 to 34 Years | 763 (47.2%) | 60 (7.9%) |
| 35 to 44 Years | 2,300 (66.5%) | 92 (4.0%) |
| 45 to 54 Years | 1,825 (61.5%) | 89 (4.9%) |
| 55 to 59 Years | 943 (52.2%) | 47 (5.0%) |
| 60 to 64 Years | 666 (44.6%) | 0 (0.0%) |
| 65 to 74 Years | 508 (20.9%) | 0 (0.0%) |
| 75 Years and over | 138 (8.7%) | 0 (0.0%) |
| Total | 9,899 (49.1%) | 604 (6.1%) |
Employment Status by Educational Attainment in Lauderdale County
According to labor force statistics for Lauderdale County, 58.0% of individuals (7,607) out of the total population between 25 and 64 years of age (13,116) are in the labor force, with 5.1% or 388 of them being unemployed. The group with the highest labor force participation rate are those with the educational attainment of bachelor's degree or higher, with 88.1% or 1,170 individuals in the labor force. Within the labor force, individuals with less than high school education have the highest percentage of unemployment, with 6.8% or 50 of them being unemployed.
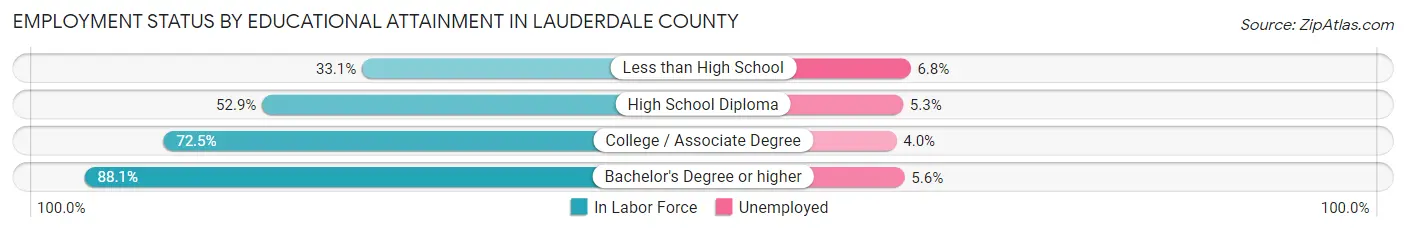
| Educational Attainment | In Labor Force | Unemployed |
| Less than High School | 737 (33.1%) | 151 (6.8%) |
| High School Diploma | 3,334 (52.9%) | 334 (5.3%) |
| College / Associate Degree | 2,364 (72.5%) | 130 (4.0%) |
| Bachelor's Degree or higher | 1,170 (88.1%) | 74 (5.6%) |
| Total | 7,607 (58.0%) | 669 (5.1%) |
Employment Occupations by Sex in Lauderdale County
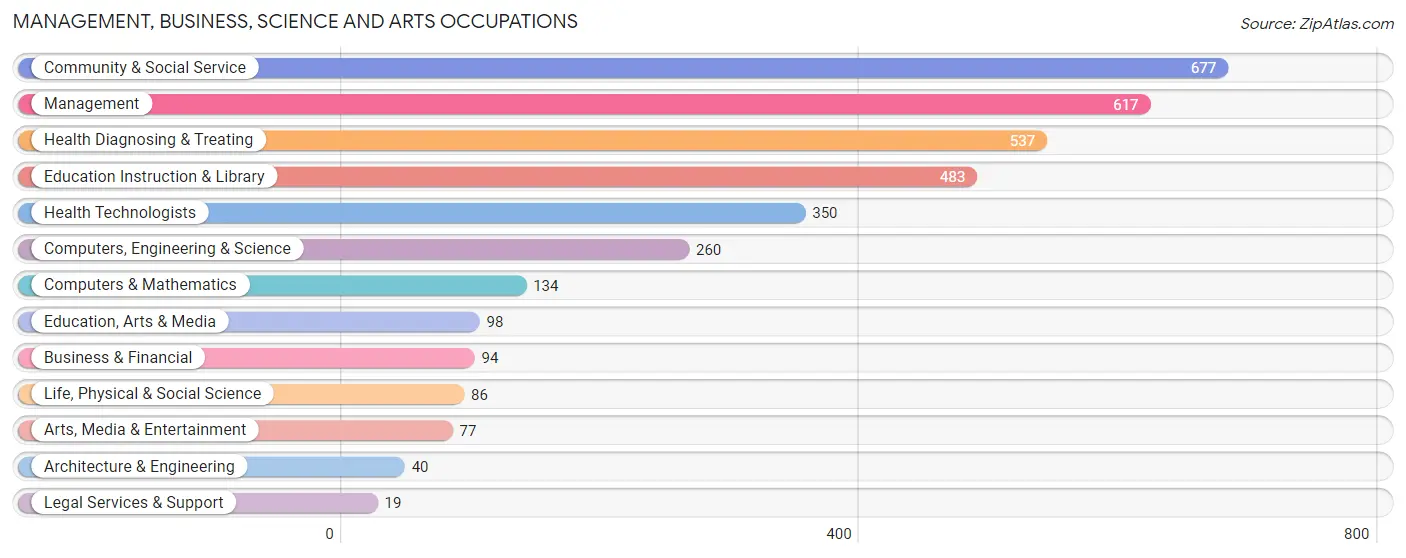
Management, Business, Science and Arts Occupations
The most common Management, Business, Science and Arts occupations in Lauderdale County are Community & Social Service (677 | 7.3%), Management (617 | 6.6%), Health Diagnosing & Treating (537 | 5.8%), Education Instruction & Library (483 | 5.2%), and Health Technologists (350 | 3.8%).
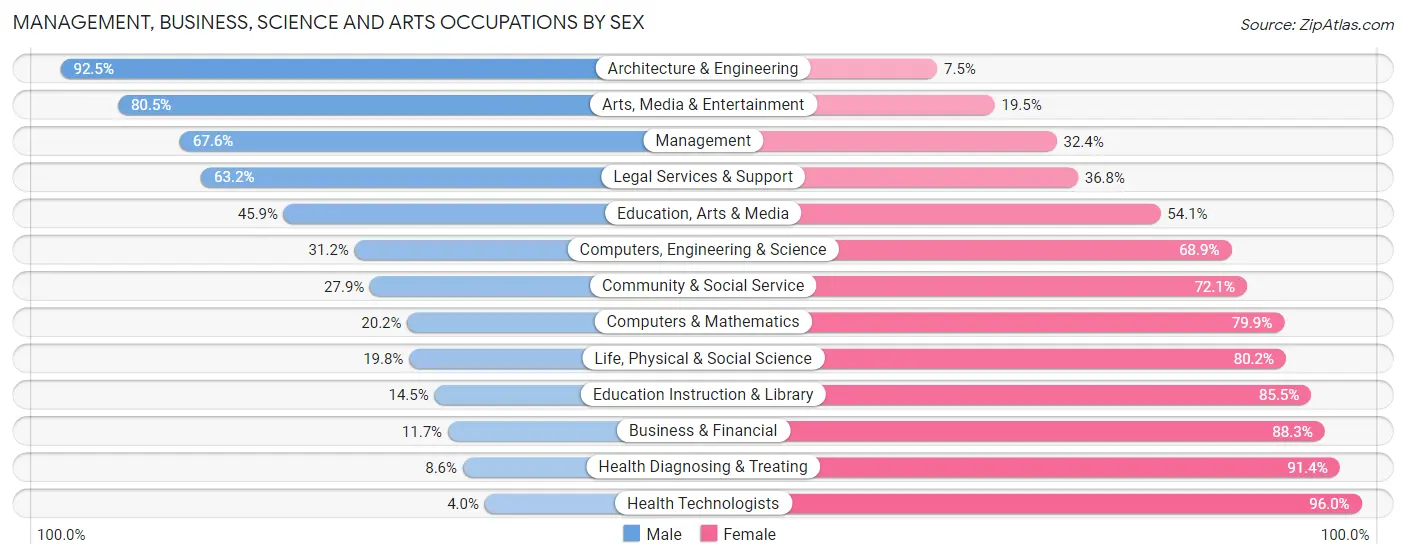
Management, Business, Science and Arts Occupations by Sex
Within the Management, Business, Science and Arts occupations in Lauderdale County, the most male-oriented occupations are Architecture & Engineering (92.5%), Arts, Media & Entertainment (80.5%), and Management (67.6%), while the most female-oriented occupations are Health Technologists (96.0%), Health Diagnosing & Treating (91.4%), and Business & Financial (88.3%).
| Occupation | Male | Female |
| Management | 417 (67.6%) | 200 (32.4%) |
| Business & Financial | 11 (11.7%) | 83 (88.3%) |
| Computers, Engineering & Science | 81 (31.1%) | 179 (68.9%) |
| Computers & Mathematics | 27 (20.2%) | 107 (79.8%) |
| Architecture & Engineering | 37 (92.5%) | 3 (7.5%) |
| Life, Physical & Social Science | 17 (19.8%) | 69 (80.2%) |
| Community & Social Service | 189 (27.9%) | 488 (72.1%) |
| Education, Arts & Media | 45 (45.9%) | 53 (54.1%) |
| Legal Services & Support | 12 (63.2%) | 7 (36.8%) |
| Education Instruction & Library | 70 (14.5%) | 413 (85.5%) |
| Arts, Media & Entertainment | 62 (80.5%) | 15 (19.5%) |
| Health Diagnosing & Treating | 46 (8.6%) | 491 (91.4%) |
| Health Technologists | 14 (4.0%) | 336 (96.0%) |
| Total (Category) | 744 (34.1%) | 1,441 (65.9%) |
| Total (Overall) | 5,028 (54.1%) | 4,267 (45.9%) |
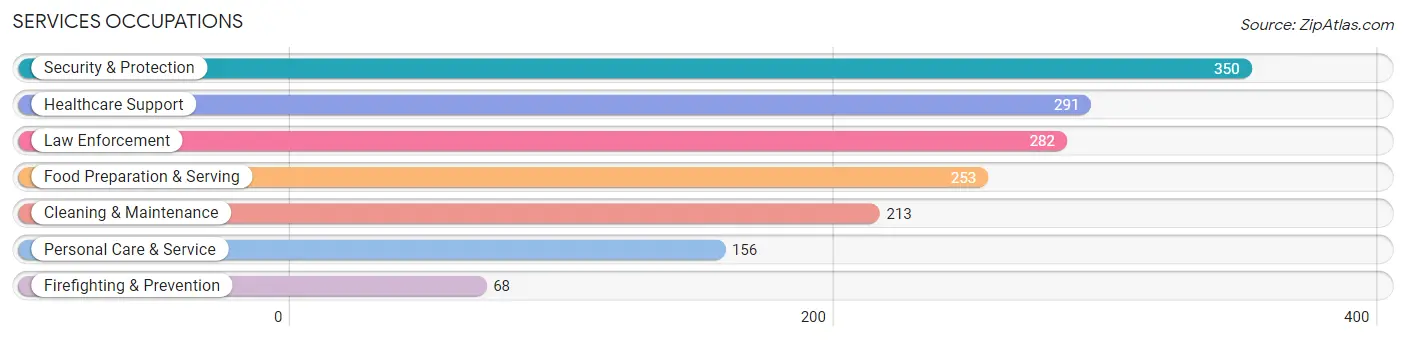
Services Occupations
The most common Services occupations in Lauderdale County are Security & Protection (350 | 3.8%), Healthcare Support (291 | 3.1%), Law Enforcement (282 | 3.0%), Food Preparation & Serving (253 | 2.7%), and Cleaning & Maintenance (213 | 2.3%).
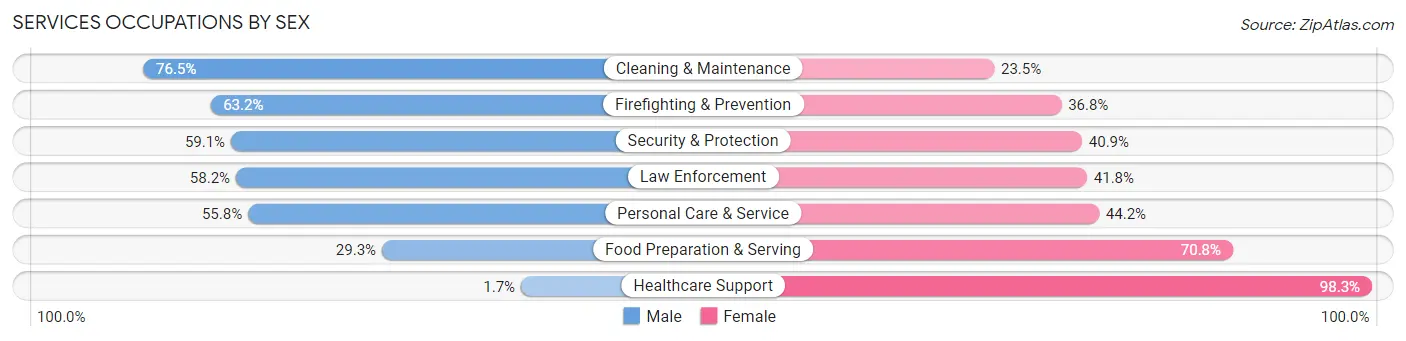
Services Occupations by Sex
Within the Services occupations in Lauderdale County, the most male-oriented occupations are Cleaning & Maintenance (76.5%), Firefighting & Prevention (63.2%), and Security & Protection (59.1%), while the most female-oriented occupations are Healthcare Support (98.3%), Food Preparation & Serving (70.8%), and Personal Care & Service (44.2%).
| Occupation | Male | Female |
| Healthcare Support | 5 (1.7%) | 286 (98.3%) |
| Security & Protection | 207 (59.1%) | 143 (40.9%) |
| Firefighting & Prevention | 43 (63.2%) | 25 (36.8%) |
| Law Enforcement | 164 (58.2%) | 118 (41.8%) |
| Food Preparation & Serving | 74 (29.2%) | 179 (70.8%) |
| Cleaning & Maintenance | 163 (76.5%) | 50 (23.5%) |
| Personal Care & Service | 87 (55.8%) | 69 (44.2%) |
| Total (Category) | 536 (42.4%) | 727 (57.6%) |
| Total (Overall) | 5,028 (54.1%) | 4,267 (45.9%) |
Sales and Office Occupations
The most common Sales and Office occupations in Lauderdale County are Office & Administration (984 | 10.6%), and Sales & Related (762 | 8.2%).
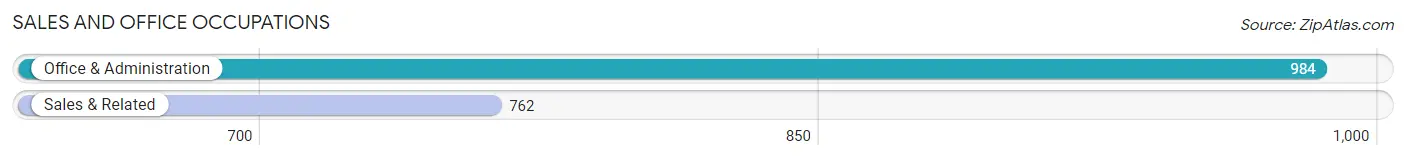
Sales and Office Occupations by Sex
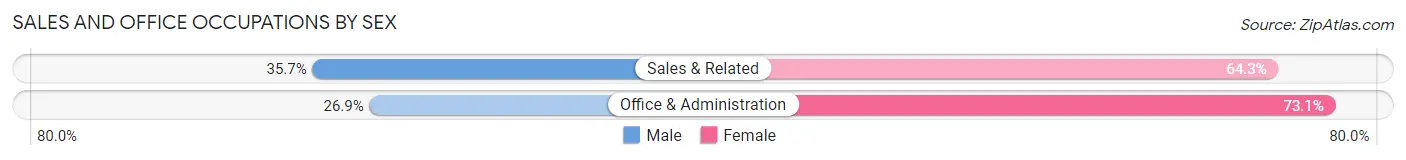
| Occupation | Male | Female |
| Sales & Related | 272 (35.7%) | 490 (64.3%) |
| Office & Administration | 265 (26.9%) | 719 (73.1%) |
| Total (Category) | 537 (30.8%) | 1,209 (69.2%) |
| Total (Overall) | 5,028 (54.1%) | 4,267 (45.9%) |
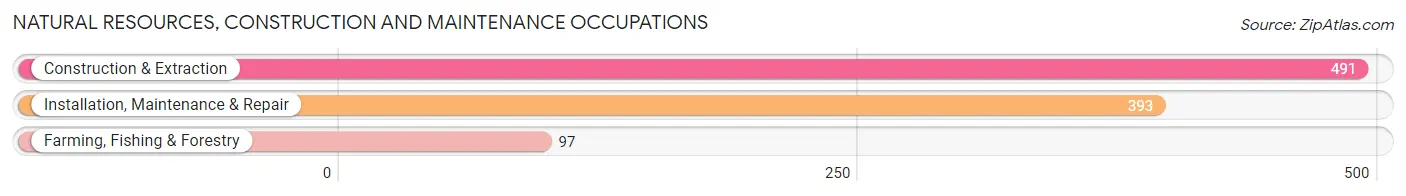
Natural Resources, Construction and Maintenance Occupations
The most common Natural Resources, Construction and Maintenance occupations in Lauderdale County are Construction & Extraction (491 | 5.3%), Installation, Maintenance & Repair (393 | 4.2%), and Farming, Fishing & Forestry (97 | 1.0%).
Natural Resources, Construction and Maintenance Occupations by Sex
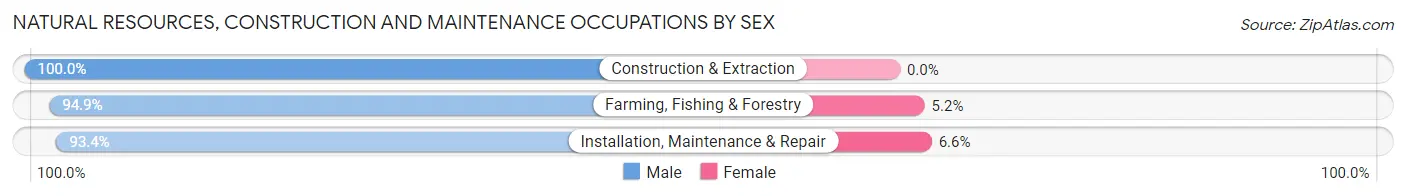
| Occupation | Male | Female |
| Farming, Fishing & Forestry | 92 (94.9%) | 5 (5.1%) |
| Construction & Extraction | 491 (100.0%) | 0 (0.0%) |
| Installation, Maintenance & Repair | 367 (93.4%) | 26 (6.6%) |
| Total (Category) | 950 (96.8%) | 31 (3.2%) |
| Total (Overall) | 5,028 (54.1%) | 4,267 (45.9%) |
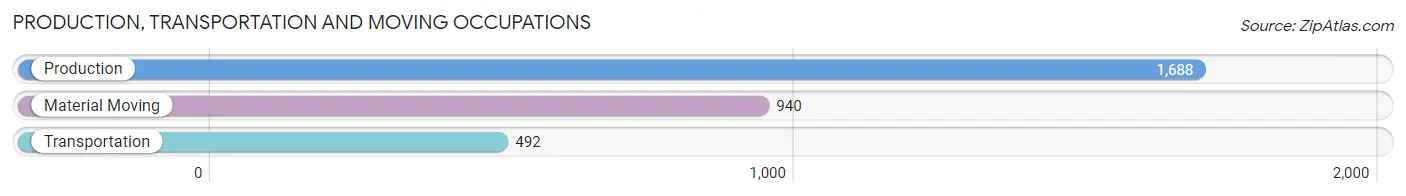
Production, Transportation and Moving Occupations
The most common Production, Transportation and Moving occupations in Lauderdale County are Production (1,688 | 18.2%), Material Moving (940 | 10.1%), and Transportation (492 | 5.3%).
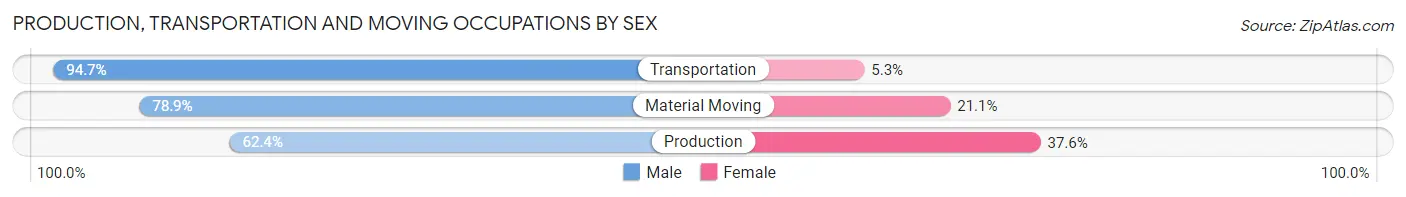
Production, Transportation and Moving Occupations by Sex
| Occupation | Male | Female |
| Production | 1,053 (62.4%) | 635 (37.6%) |
| Transportation | 466 (94.7%) | 26 (5.3%) |
| Material Moving | 742 (78.9%) | 198 (21.1%) |
| Total (Category) | 2,261 (72.5%) | 859 (27.5%) |
| Total (Overall) | 5,028 (54.1%) | 4,267 (45.9%) |
Employment Industries by Sex in Lauderdale County
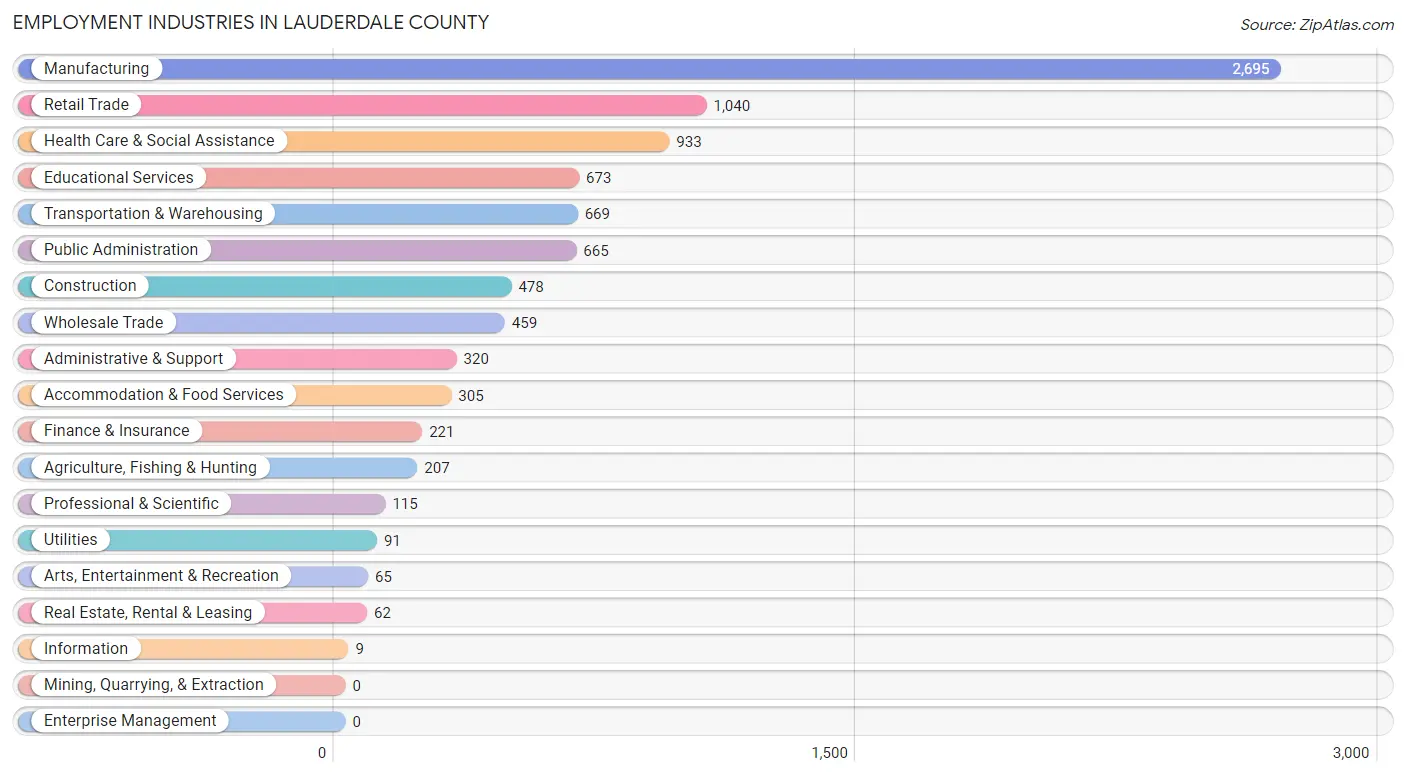
Employment Industries in Lauderdale County
The major employment industries in Lauderdale County include Manufacturing (2,695 | 29.0%), Retail Trade (1,040 | 11.2%), Health Care & Social Assistance (933 | 10.0%), Educational Services (673 | 7.2%), and Transportation & Warehousing (669 | 7.2%).
Employment Industries by Sex in Lauderdale County
The Lauderdale County industries that see more men than women are Construction (94.6%), Transportation & Warehousing (89.1%), and Real Estate, Rental & Leasing (83.9%), whereas the industries that tend to have a higher number of women are Information (100.0%), Health Care & Social Assistance (88.4%), and Finance & Insurance (88.2%).

| Industry | Male | Female |
| Agriculture, Fishing & Hunting | 154 (74.4%) | 53 (25.6%) |
| Mining, Quarrying, & Extraction | 0 (0.0%) | 0 (0.0%) |
| Construction | 452 (94.6%) | 26 (5.4%) |
| Manufacturing | 1,842 (68.3%) | 853 (31.7%) |
| Wholesale Trade | 331 (72.1%) | 128 (27.9%) |
| Retail Trade | 500 (48.1%) | 540 (51.9%) |
| Transportation & Warehousing | 596 (89.1%) | 73 (10.9%) |
| Utilities | 11 (12.1%) | 80 (87.9%) |
| Information | 0 (0.0%) | 9 (100.0%) |
| Finance & Insurance | 26 (11.8%) | 195 (88.2%) |
| Real Estate, Rental & Leasing | 52 (83.9%) | 10 (16.1%) |
| Professional & Scientific | 58 (50.4%) | 57 (49.6%) |
| Enterprise Management | 0 (0.0%) | 0 (0.0%) |
| Administrative & Support | 120 (37.5%) | 200 (62.5%) |
| Educational Services | 142 (21.1%) | 531 (78.9%) |
| Health Care & Social Assistance | 108 (11.6%) | 825 (88.4%) |
| Arts, Entertainment & Recreation | 19 (29.2%) | 46 (70.8%) |
| Accommodation & Food Services | 130 (42.6%) | 175 (57.4%) |
| Public Administration | 330 (49.6%) | 335 (50.4%) |
| Total | 5,028 (54.1%) | 4,267 (45.9%) |
Education in Lauderdale County
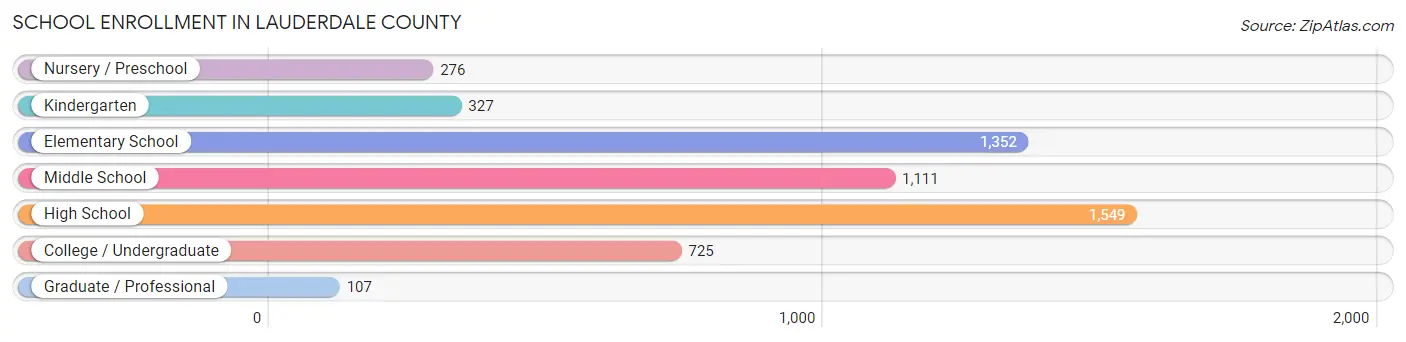
School Enrollment in Lauderdale County
The most common levels of schooling among the 5,447 students in Lauderdale County are high school (1,549 | 28.4%), elementary school (1,352 | 24.8%), and middle school (1,111 | 20.4%).
| School Level | # Students | % Students |
| Nursery / Preschool | 276 | 5.1% |
| Kindergarten | 327 | 6.0% |
| Elementary School | 1,352 | 24.8% |
| Middle School | 1,111 | 20.4% |
| High School | 1,549 | 28.4% |
| College / Undergraduate | 725 | 13.3% |
| Graduate / Professional | 107 | 2.0% |
| Total | 5,447 | 100.0% |
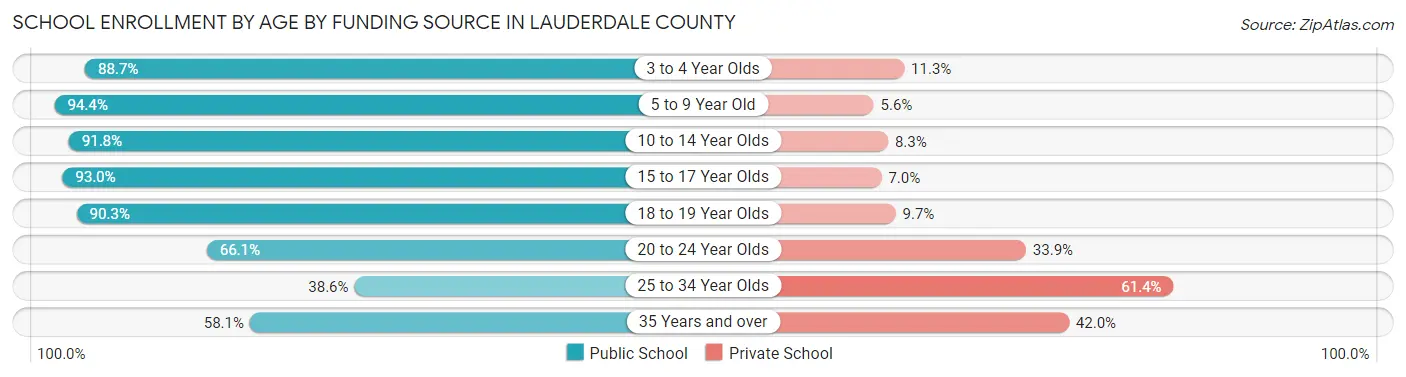
School Enrollment by Age by Funding Source in Lauderdale County
Out of a total of 5,447 students who are enrolled in schools in Lauderdale County, 730 (13.4%) attend a private institution, while the remaining 4,717 (86.6%) are enrolled in public schools. The age group of 25 to 34 year olds has the highest likelihood of being enrolled in private schools, with 164 (61.4% in the age bracket) enrolled. Conversely, the age group of 5 to 9 year old has the lowest likelihood of being enrolled in a private school, with 1,405 (94.4% in the age bracket) attending a public institution.
| Age Bracket | Public School | Private School |
| 3 to 4 Year Olds | 189 (88.7%) | 24 (11.3%) |
| 5 to 9 Year Old | 1,405 (94.4%) | 83 (5.6%) |
| 10 to 14 Year Olds | 1,401 (91.7%) | 126 (8.3%) |
| 15 to 17 Year Olds | 937 (93.0%) | 71 (7.0%) |
| 18 to 19 Year Olds | 308 (90.3%) | 33 (9.7%) |
| 20 to 24 Year Olds | 181 (66.1%) | 93 (33.9%) |
| 25 to 34 Year Olds | 103 (38.6%) | 164 (61.4%) |
| 35 Years and over | 191 (58.1%) | 138 (41.9%) |
| Total | 4,717 (86.6%) | 730 (13.4%) |
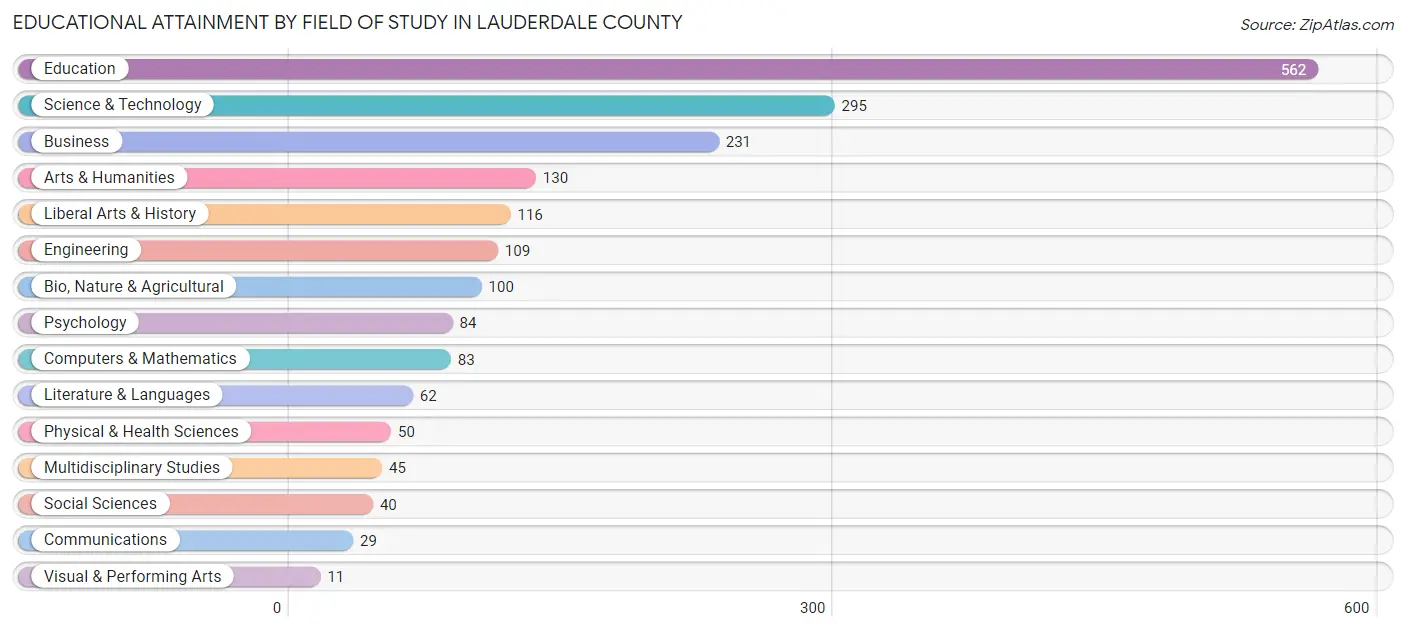
Educational Attainment by Field of Study in Lauderdale County
Education (562 | 28.9%), science & technology (295 | 15.1%), business (231 | 11.9%), arts & humanities (130 | 6.7%), and liberal arts & history (116 | 6.0%) are the most common fields of study among 1,947 individuals in Lauderdale County who have obtained a bachelor's degree or higher.
| Field of Study | # Graduates | % Graduates |
| Computers & Mathematics | 83 | 4.3% |
| Bio, Nature & Agricultural | 100 | 5.1% |
| Physical & Health Sciences | 50 | 2.6% |
| Psychology | 84 | 4.3% |
| Social Sciences | 40 | 2.1% |
| Engineering | 109 | 5.6% |
| Multidisciplinary Studies | 45 | 2.3% |
| Science & Technology | 295 | 15.1% |
| Business | 231 | 11.9% |
| Education | 562 | 28.9% |
| Literature & Languages | 62 | 3.2% |
| Liberal Arts & History | 116 | 6.0% |
| Visual & Performing Arts | 11 | 0.6% |
| Communications | 29 | 1.5% |
| Arts & Humanities | 130 | 6.7% |
| Total | 1,947 | 100.0% |
Transportation & Commute in Lauderdale County
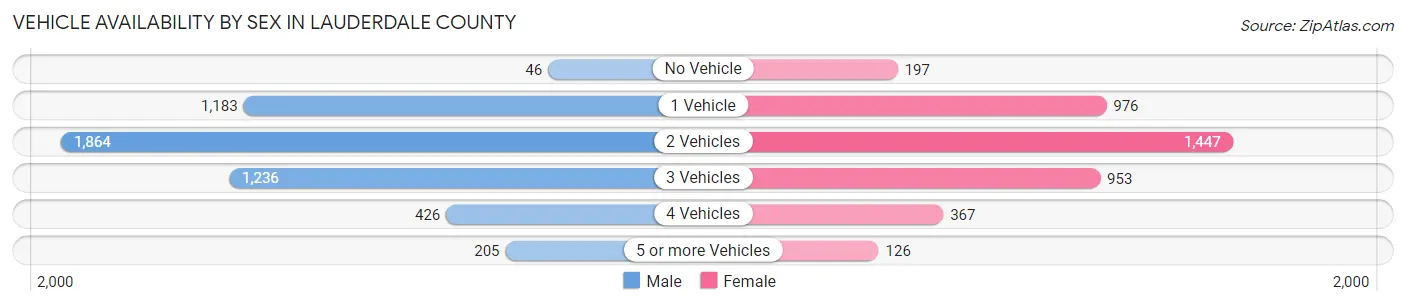
Vehicle Availability by Sex in Lauderdale County
The most prevalent vehicle ownership categories in Lauderdale County are males with 2 vehicles (1,864, accounting for 37.6%) and females with 2 vehicles (1,447, making up 45.8%).
| Vehicles Available | Male | Female |
| No Vehicle | 46 (0.9%) | 197 (4.9%) |
| 1 Vehicle | 1,183 (23.8%) | 976 (24.0%) |
| 2 Vehicles | 1,864 (37.6%) | 1,447 (35.6%) |
| 3 Vehicles | 1,236 (24.9%) | 953 (23.4%) |
| 4 Vehicles | 426 (8.6%) | 367 (9.0%) |
| 5 or more Vehicles | 205 (4.1%) | 126 (3.1%) |
| Total | 4,960 (100.0%) | 4,066 (100.0%) |
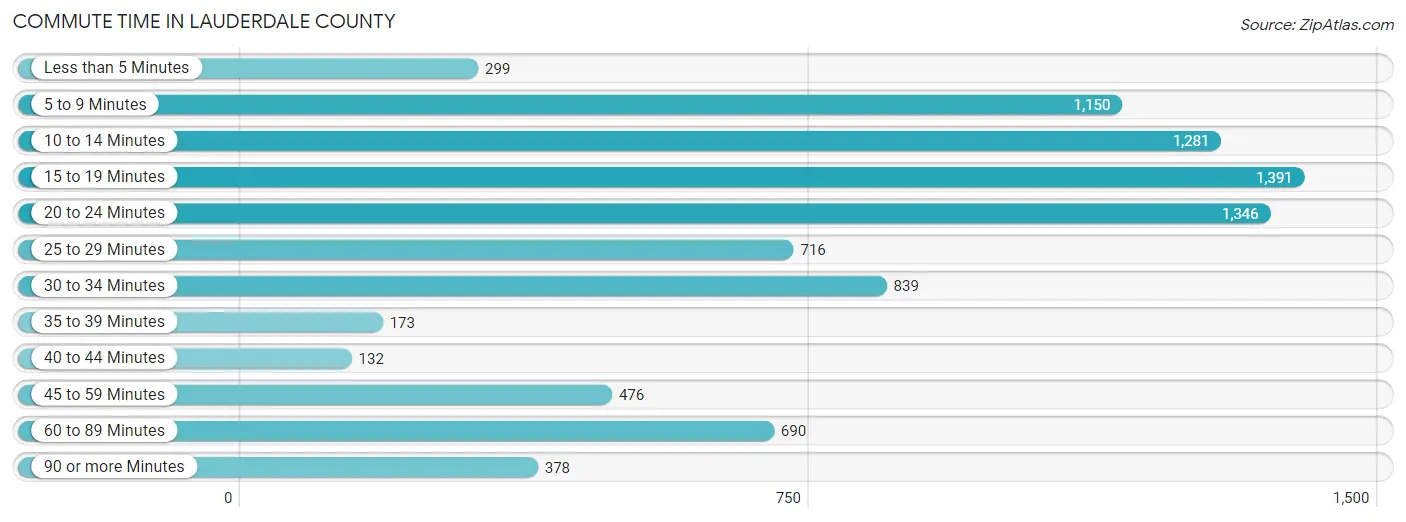
Commute Time in Lauderdale County
The most frequently occuring commute durations in Lauderdale County are 15 to 19 minutes (1,391 commuters, 15.7%), 20 to 24 minutes (1,346 commuters, 15.2%), and 10 to 14 minutes (1,281 commuters, 14.4%).
| Commute Time | # Commuters | % Commuters |
| Less than 5 Minutes | 299 | 3.4% |
| 5 to 9 Minutes | 1,150 | 13.0% |
| 10 to 14 Minutes | 1,281 | 14.4% |
| 15 to 19 Minutes | 1,391 | 15.7% |
| 20 to 24 Minutes | 1,346 | 15.2% |
| 25 to 29 Minutes | 716 | 8.1% |
| 30 to 34 Minutes | 839 | 9.5% |
| 35 to 39 Minutes | 173 | 1.9% |
| 40 to 44 Minutes | 132 | 1.5% |
| 45 to 59 Minutes | 476 | 5.4% |
| 60 to 89 Minutes | 690 | 7.8% |
| 90 or more Minutes | 378 | 4.3% |
Commute Time by Sex in Lauderdale County
The most common commute times in Lauderdale County are 15 to 19 minutes (748 commuters, 15.3%) for males and 10 to 14 minutes (732 commuters, 18.4%) for females.
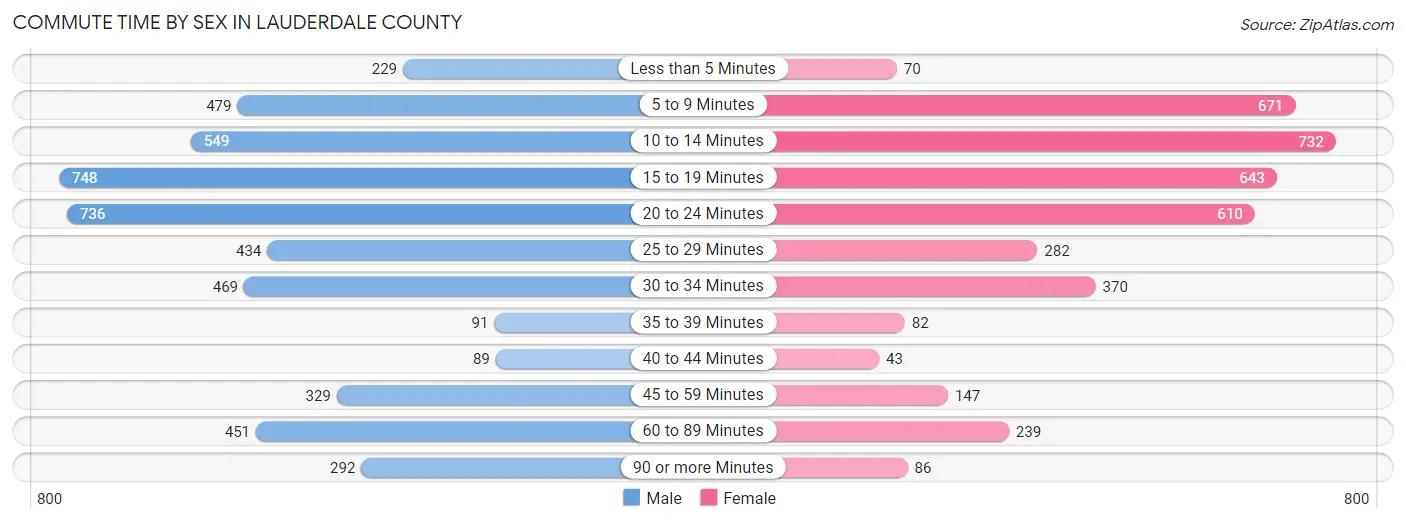
| Commute Time | Male | Female |
| Less than 5 Minutes | 229 (4.7%) | 70 (1.8%) |
| 5 to 9 Minutes | 479 (9.8%) | 671 (16.9%) |
| 10 to 14 Minutes | 549 (11.2%) | 732 (18.4%) |
| 15 to 19 Minutes | 748 (15.3%) | 643 (16.2%) |
| 20 to 24 Minutes | 736 (15.0%) | 610 (15.3%) |
| 25 to 29 Minutes | 434 (8.9%) | 282 (7.1%) |
| 30 to 34 Minutes | 469 (9.6%) | 370 (9.3%) |
| 35 to 39 Minutes | 91 (1.9%) | 82 (2.1%) |
| 40 to 44 Minutes | 89 (1.8%) | 43 (1.1%) |
| 45 to 59 Minutes | 329 (6.7%) | 147 (3.7%) |
| 60 to 89 Minutes | 451 (9.2%) | 239 (6.0%) |
| 90 or more Minutes | 292 (6.0%) | 86 (2.2%) |
Time of Departure to Work by Sex in Lauderdale County
The most frequent times of departure to work in Lauderdale County are 6:00 AM to 6:29 AM (723, 14.8%) for males and 7:00 AM to 7:29 AM (839, 21.1%) for females.
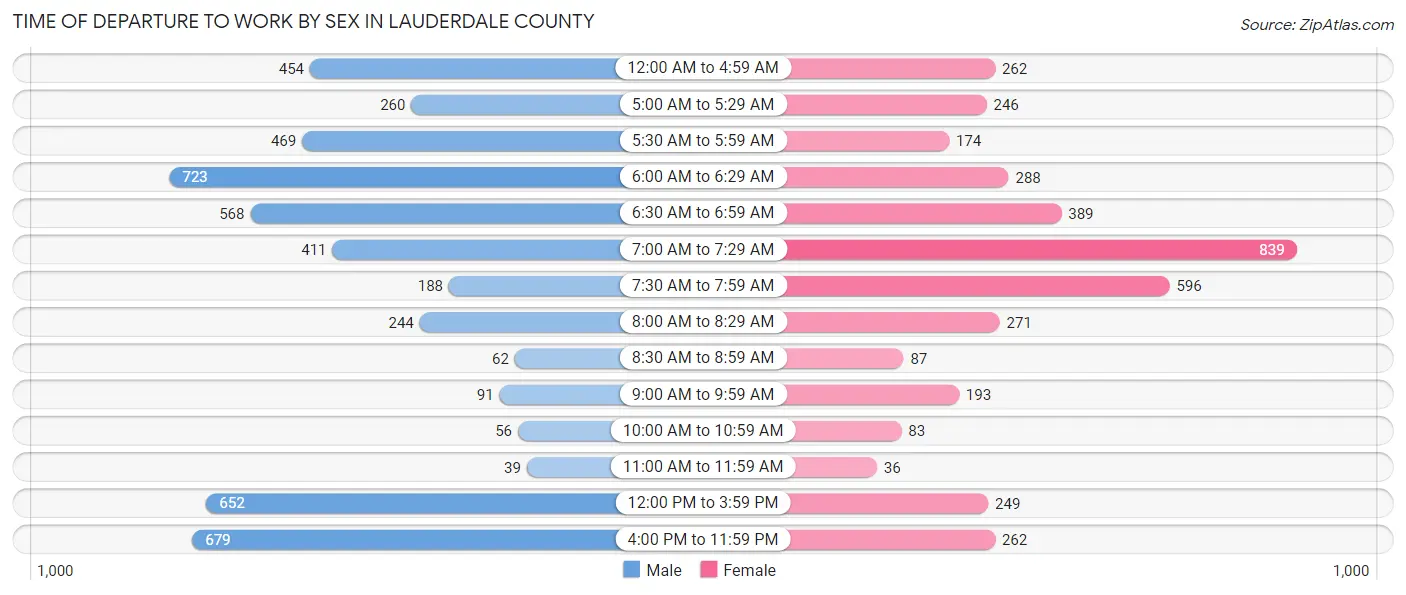
| Time of Departure | Male | Female |
| 12:00 AM to 4:59 AM | 454 (9.3%) | 262 (6.6%) |
| 5:00 AM to 5:29 AM | 260 (5.3%) | 246 (6.2%) |
| 5:30 AM to 5:59 AM | 469 (9.6%) | 174 (4.4%) |
| 6:00 AM to 6:29 AM | 723 (14.8%) | 288 (7.2%) |
| 6:30 AM to 6:59 AM | 568 (11.6%) | 389 (9.8%) |
| 7:00 AM to 7:29 AM | 411 (8.4%) | 839 (21.1%) |
| 7:30 AM to 7:59 AM | 188 (3.8%) | 596 (15.0%) |
| 8:00 AM to 8:29 AM | 244 (5.0%) | 271 (6.8%) |
| 8:30 AM to 8:59 AM | 62 (1.3%) | 87 (2.2%) |
| 9:00 AM to 9:59 AM | 91 (1.9%) | 193 (4.9%) |
| 10:00 AM to 10:59 AM | 56 (1.1%) | 83 (2.1%) |
| 11:00 AM to 11:59 AM | 39 (0.8%) | 36 (0.9%) |
| 12:00 PM to 3:59 PM | 652 (13.3%) | 249 (6.3%) |
| 4:00 PM to 11:59 PM | 679 (13.9%) | 262 (6.6%) |
| Total | 4,896 (100.0%) | 3,975 (100.0%) |
Housing Occupancy in Lauderdale County
Occupancy by Ownership in Lauderdale County
Of the total 9,127 dwellings in Lauderdale County, owner-occupied units account for 5,661 (62.0%), while renter-occupied units make up 3,466 (38.0%).
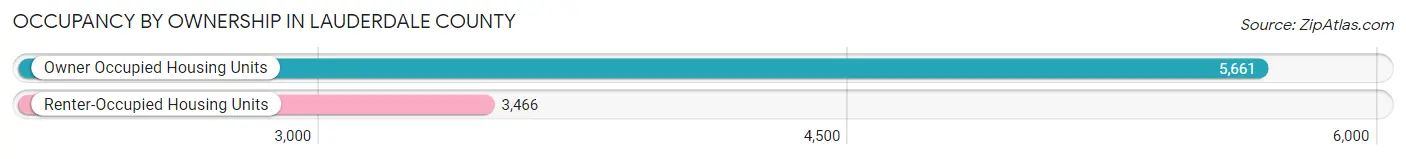
| Occupancy | # Housing Units | % Housing Units |
| Owner Occupied Housing Units | 5,661 | 62.0% |
| Renter-Occupied Housing Units | 3,466 | 38.0% |
| Total Occupied Housing Units | 9,127 | 100.0% |
Occupancy by Household Size in Lauderdale County
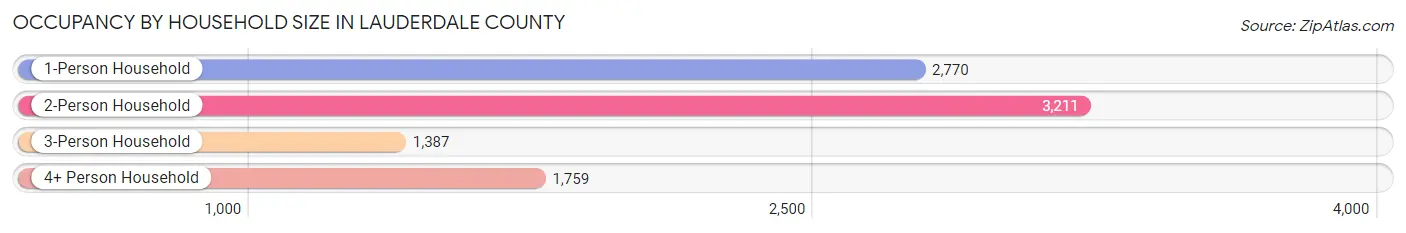
| Household Size | # Housing Units | % Housing Units |
| 1-Person Household | 2,770 | 30.3% |
| 2-Person Household | 3,211 | 35.2% |
| 3-Person Household | 1,387 | 15.2% |
| 4+ Person Household | 1,759 | 19.3% |
| Total Housing Units | 9,127 | 100.0% |
Occupancy by Ownership by Household Size in Lauderdale County
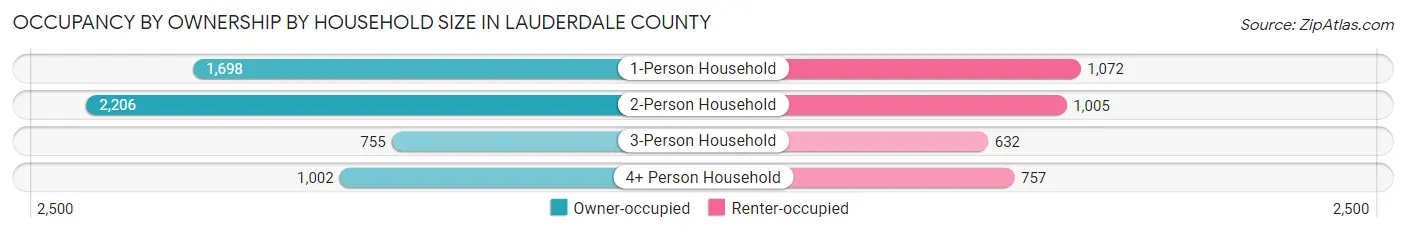
| Household Size | Owner-occupied | Renter-occupied |
| 1-Person Household | 1,698 (61.3%) | 1,072 (38.7%) |
| 2-Person Household | 2,206 (68.7%) | 1,005 (31.3%) |
| 3-Person Household | 755 (54.4%) | 632 (45.6%) |
| 4+ Person Household | 1,002 (57.0%) | 757 (43.0%) |
| Total Housing Units | 5,661 (62.0%) | 3,466 (38.0%) |
Occupancy by Educational Attainment in Lauderdale County
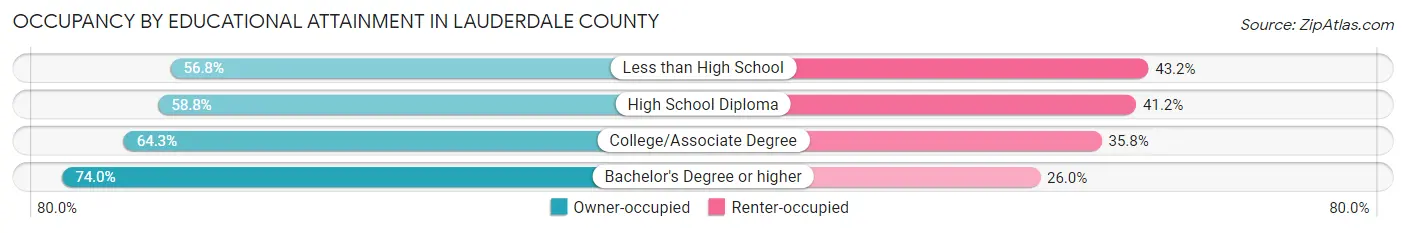
| Household Size | Owner-occupied | Renter-occupied |
| Less than High School | 727 (56.8%) | 552 (43.2%) |
| High School Diploma | 2,348 (58.8%) | 1,647 (41.2%) |
| College/Associate Degree | 1,749 (64.2%) | 973 (35.7%) |
| Bachelor's Degree or higher | 837 (74.0%) | 294 (26.0%) |
Occupancy by Age of Householder in Lauderdale County
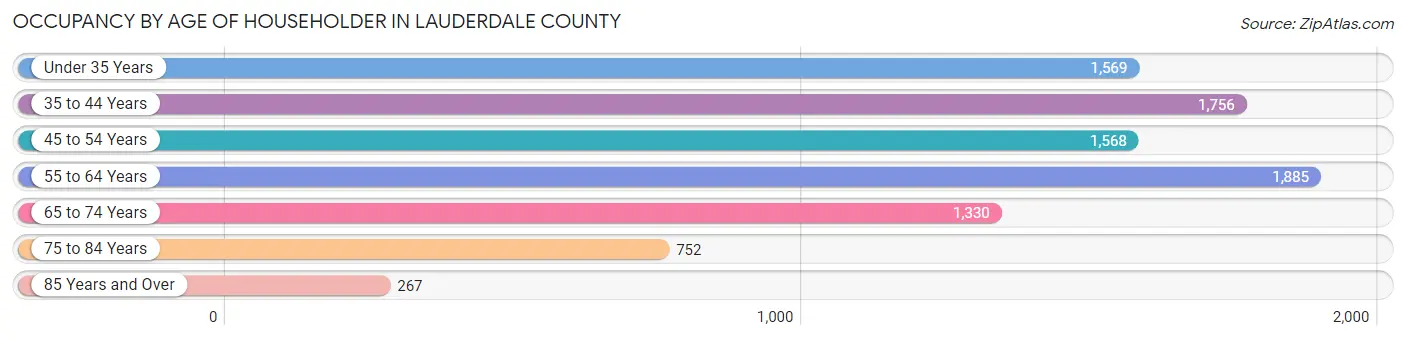
| Age Bracket | # Households | % Households |
| Under 35 Years | 1,569 | 17.2% |
| 35 to 44 Years | 1,756 | 19.2% |
| 45 to 54 Years | 1,568 | 17.2% |
| 55 to 64 Years | 1,885 | 20.6% |
| 65 to 74 Years | 1,330 | 14.6% |
| 75 to 84 Years | 752 | 8.2% |
| 85 Years and Over | 267 | 2.9% |
| Total | 9,127 | 100.0% |
Housing Finances in Lauderdale County
Median Income by Occupancy in Lauderdale County
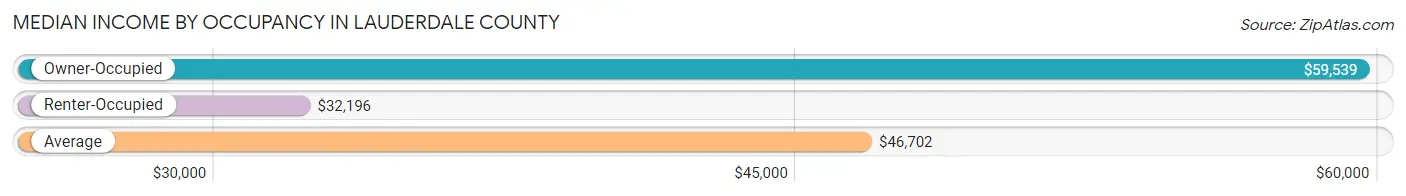
| Occupancy Type | # Households | Median Income |
| Owner-Occupied | 5,661 (62.0%) | $59,539 |
| Renter-Occupied | 3,466 (38.0%) | $32,196 |
| Average | 9,127 (100.0%) | $46,702 |
Occupancy by Householder Income Bracket in Lauderdale County
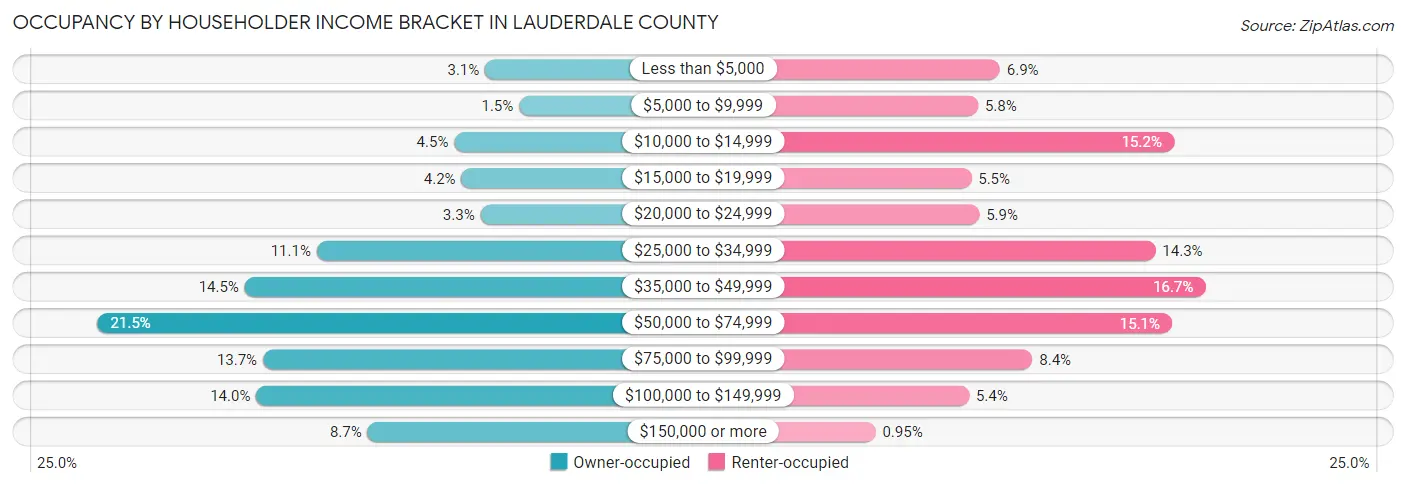
| Income Bracket | Owner-occupied | Renter-occupied |
| Less than $5,000 | 174 (3.1%) | 238 (6.9%) |
| $5,000 to $9,999 | 82 (1.5%) | 202 (5.8%) |
| $10,000 to $14,999 | 257 (4.5%) | 525 (15.1%) |
| $15,000 to $19,999 | 238 (4.2%) | 191 (5.5%) |
| $20,000 to $24,999 | 186 (3.3%) | 204 (5.9%) |
| $25,000 to $34,999 | 628 (11.1%) | 495 (14.3%) |
| $35,000 to $49,999 | 822 (14.5%) | 577 (16.7%) |
| $50,000 to $74,999 | 1,219 (21.5%) | 522 (15.1%) |
| $75,000 to $99,999 | 773 (13.7%) | 292 (8.4%) |
| $100,000 to $149,999 | 791 (14.0%) | 187 (5.4%) |
| $150,000 or more | 491 (8.7%) | 33 (0.9%) |
| Total | 5,661 (100.0%) | 3,466 (100.0%) |
Monthly Housing Cost Tiers in Lauderdale County
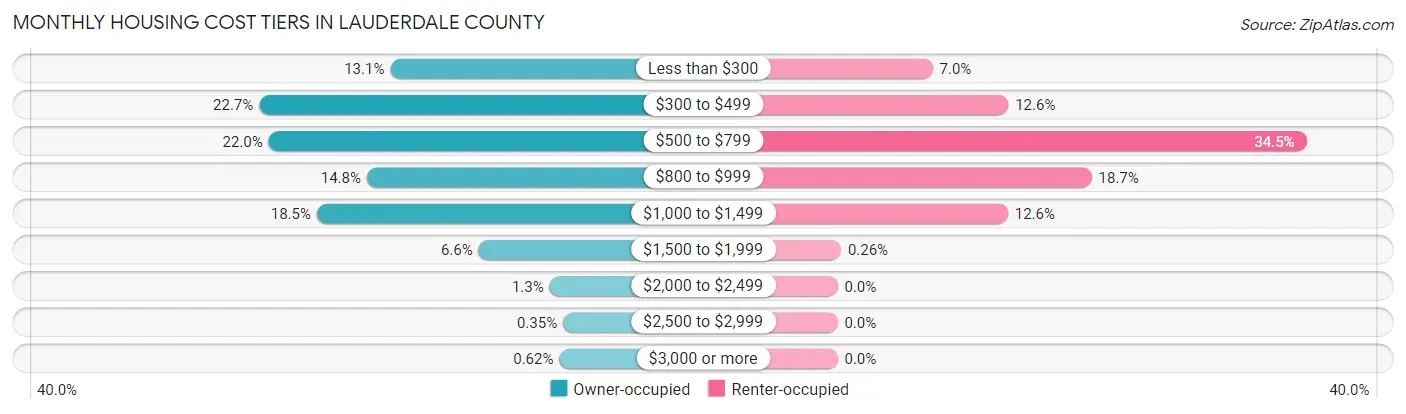
| Monthly Cost | Owner-occupied | Renter-occupied |
| Less than $300 | 740 (13.1%) | 243 (7.0%) |
| $300 to $499 | 1,287 (22.7%) | 436 (12.6%) |
| $500 to $799 | 1,247 (22.0%) | 1,197 (34.5%) |
| $800 to $999 | 838 (14.8%) | 649 (18.7%) |
| $1,000 to $1,499 | 1,046 (18.5%) | 435 (12.6%) |
| $1,500 to $1,999 | 372 (6.6%) | 9 (0.3%) |
| $2,000 to $2,499 | 76 (1.3%) | 0 (0.0%) |
| $2,500 to $2,999 | 20 (0.4%) | 0 (0.0%) |
| $3,000 or more | 35 (0.6%) | 0 (0.0%) |
| Total | 5,661 (100.0%) | 3,466 (100.0%) |
Physical Housing Characteristics in Lauderdale County
Housing Structures in Lauderdale County
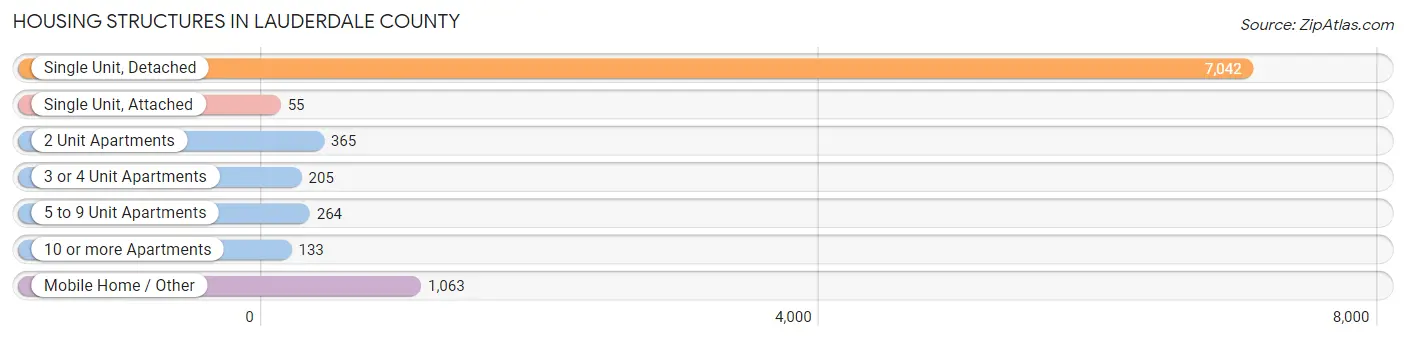
| Structure Type | # Housing Units | % Housing Units |
| Single Unit, Detached | 7,042 | 77.2% |
| Single Unit, Attached | 55 | 0.6% |
| 2 Unit Apartments | 365 | 4.0% |
| 3 or 4 Unit Apartments | 205 | 2.2% |
| 5 to 9 Unit Apartments | 264 | 2.9% |
| 10 or more Apartments | 133 | 1.5% |
| Mobile Home / Other | 1,063 | 11.7% |
| Total | 9,127 | 100.0% |
Housing Structures by Occupancy in Lauderdale County
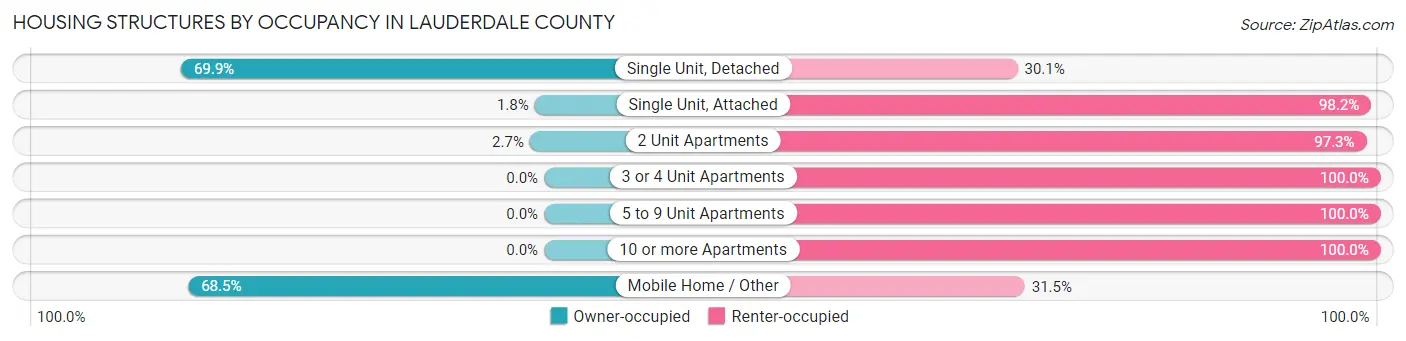
| Structure Type | Owner-occupied | Renter-occupied |
| Single Unit, Detached | 4,922 (69.9%) | 2,120 (30.1%) |
| Single Unit, Attached | 1 (1.8%) | 54 (98.2%) |
| 2 Unit Apartments | 10 (2.7%) | 355 (97.3%) |
| 3 or 4 Unit Apartments | 0 (0.0%) | 205 (100.0%) |
| 5 to 9 Unit Apartments | 0 (0.0%) | 264 (100.0%) |
| 10 or more Apartments | 0 (0.0%) | 133 (100.0%) |
| Mobile Home / Other | 728 (68.5%) | 335 (31.5%) |
| Total | 5,661 (62.0%) | 3,466 (38.0%) |
Housing Structures by Number of Rooms in Lauderdale County
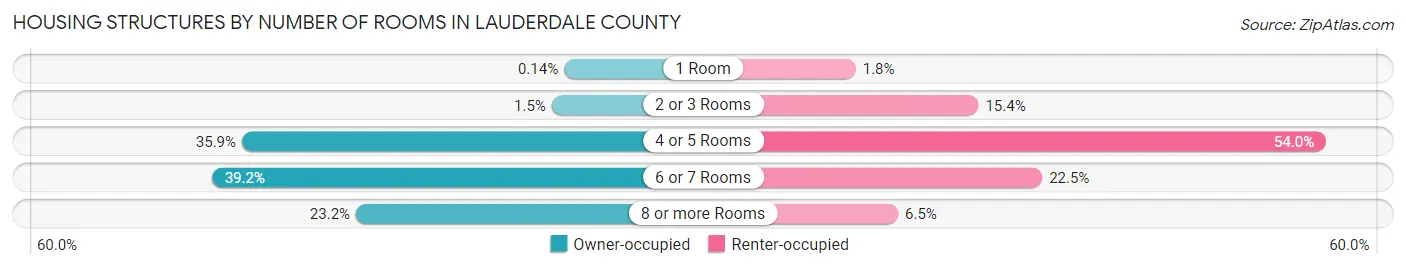
| Number of Rooms | Owner-occupied | Renter-occupied |
| 1 Room | 8 (0.1%) | 61 (1.8%) |
| 2 or 3 Rooms | 85 (1.5%) | 533 (15.4%) |
| 4 or 5 Rooms | 2,032 (35.9%) | 1,870 (53.9%) |
| 6 or 7 Rooms | 2,221 (39.2%) | 778 (22.5%) |
| 8 or more Rooms | 1,315 (23.2%) | 224 (6.5%) |
| Total | 5,661 (100.0%) | 3,466 (100.0%) |
Housing Structure by Heating Type in Lauderdale County
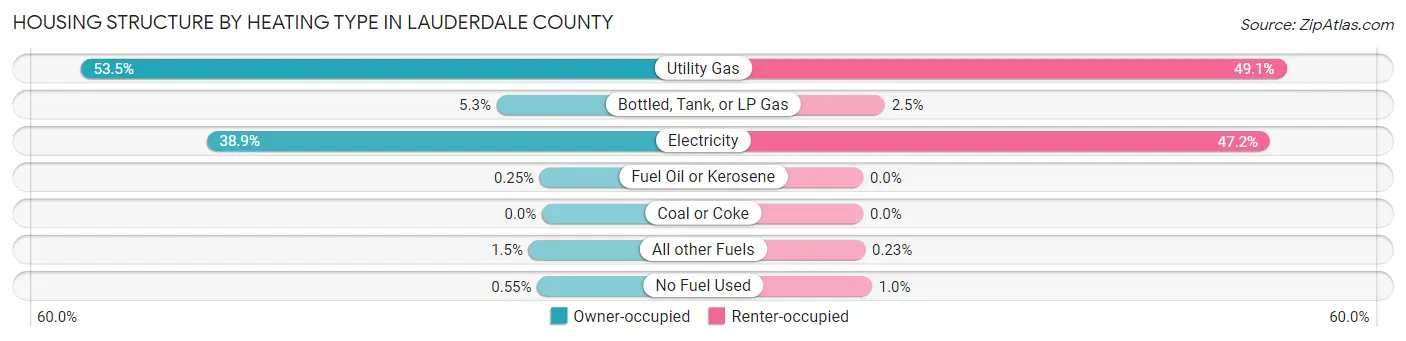
| Heating Type | Owner-occupied | Renter-occupied |
| Utility Gas | 3,029 (53.5%) | 1,701 (49.1%) |
| Bottled, Tank, or LP Gas | 298 (5.3%) | 87 (2.5%) |
| Electricity | 2,202 (38.9%) | 1,635 (47.2%) |
| Fuel Oil or Kerosene | 14 (0.3%) | 0 (0.0%) |
| Coal or Coke | 0 (0.0%) | 0 (0.0%) |
| All other Fuels | 87 (1.5%) | 8 (0.2%) |
| No Fuel Used | 31 (0.5%) | 35 (1.0%) |
| Total | 5,661 (100.0%) | 3,466 (100.0%) |
Household Vehicle Usage in Lauderdale County
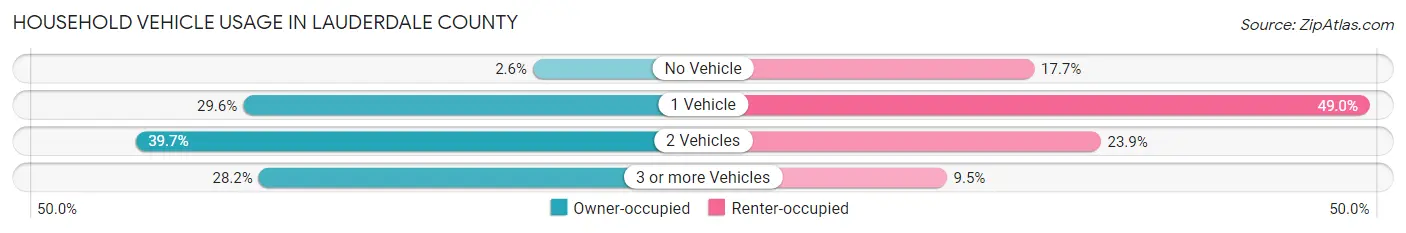
| Vehicles per Household | Owner-occupied | Renter-occupied |
| No Vehicle | 145 (2.6%) | 612 (17.7%) |
| 1 Vehicle | 1,676 (29.6%) | 1,698 (49.0%) |
| 2 Vehicles | 2,246 (39.7%) | 827 (23.9%) |
| 3 or more Vehicles | 1,594 (28.2%) | 329 (9.5%) |
| Total | 5,661 (100.0%) | 3,466 (100.0%) |
Real Estate & Mortgages in Lauderdale County
Real Estate and Mortgage Overview in Lauderdale County
| Characteristic | Without Mortgage | With Mortgage |
| Housing Units | 2,954 | 2,707 |
| Median Property Value | $101,800 | $127,600 |
| Median Household Income | $50,139 | $282 |
| Monthly Housing Costs | $408 | $35 |
| Real Estate Taxes | $740 | $45 |
Property Value by Mortgage Status in Lauderdale County
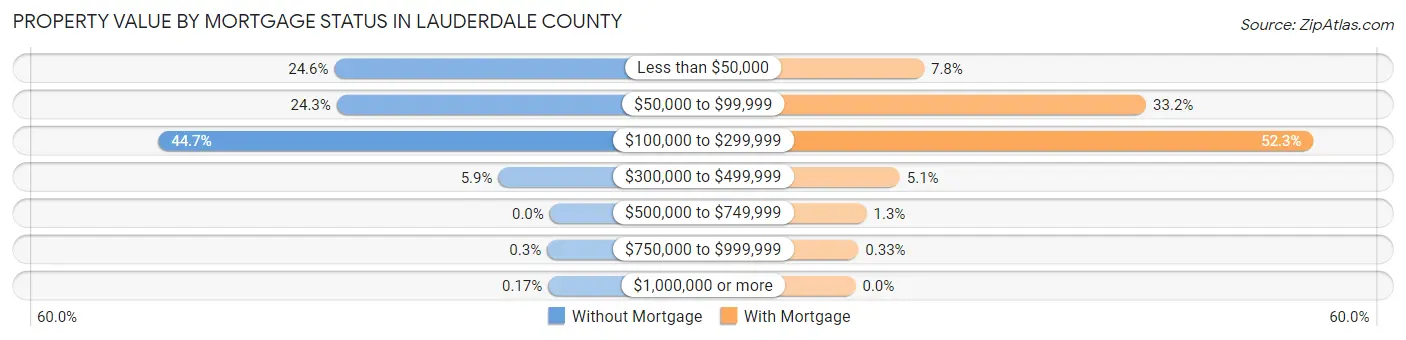
| Property Value | Without Mortgage | With Mortgage |
| Less than $50,000 | 727 (24.6%) | 212 (7.8%) |
| $50,000 to $99,999 | 719 (24.3%) | 899 (33.2%) |
| $100,000 to $299,999 | 1,321 (44.7%) | 1,416 (52.3%) |
| $300,000 to $499,999 | 173 (5.9%) | 137 (5.1%) |
| $500,000 to $749,999 | 0 (0.0%) | 34 (1.3%) |
| $750,000 to $999,999 | 9 (0.3%) | 9 (0.3%) |
| $1,000,000 or more | 5 (0.2%) | 0 (0.0%) |
| Total | 2,954 (100.0%) | 2,707 (100.0%) |
Household Income by Mortgage Status in Lauderdale County
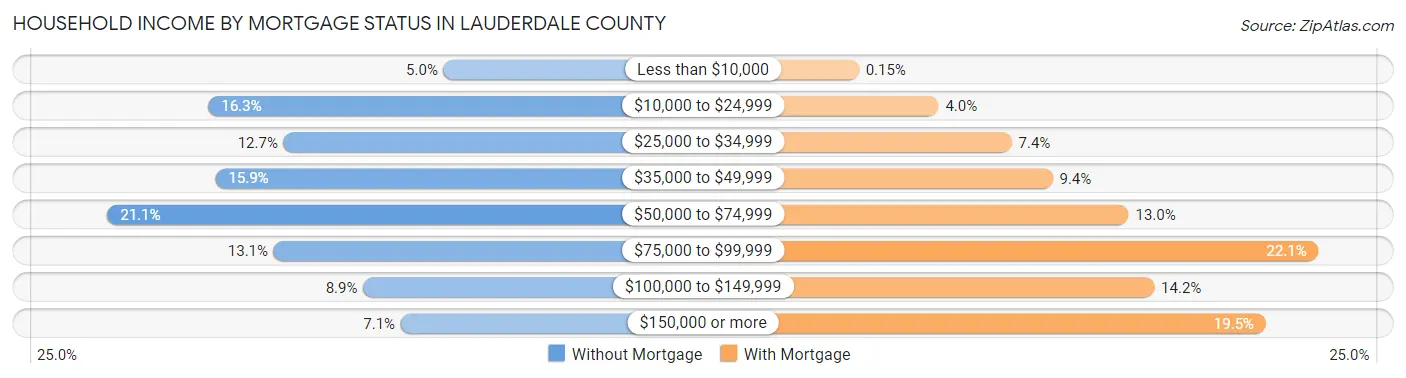
| Household Income | Without Mortgage | With Mortgage |
| Less than $10,000 | 149 (5.0%) | 4 (0.2%) |
| $10,000 to $24,999 | 480 (16.3%) | 107 (4.0%) |
| $25,000 to $34,999 | 374 (12.7%) | 201 (7.4%) |
| $35,000 to $49,999 | 470 (15.9%) | 254 (9.4%) |
| $50,000 to $74,999 | 622 (21.1%) | 352 (13.0%) |
| $75,000 to $99,999 | 388 (13.1%) | 597 (22.1%) |
| $100,000 to $149,999 | 262 (8.9%) | 385 (14.2%) |
| $150,000 or more | 209 (7.1%) | 529 (19.5%) |
| Total | 2,954 (100.0%) | 2,707 (100.0%) |
Property Value to Household Income Ratio in Lauderdale County
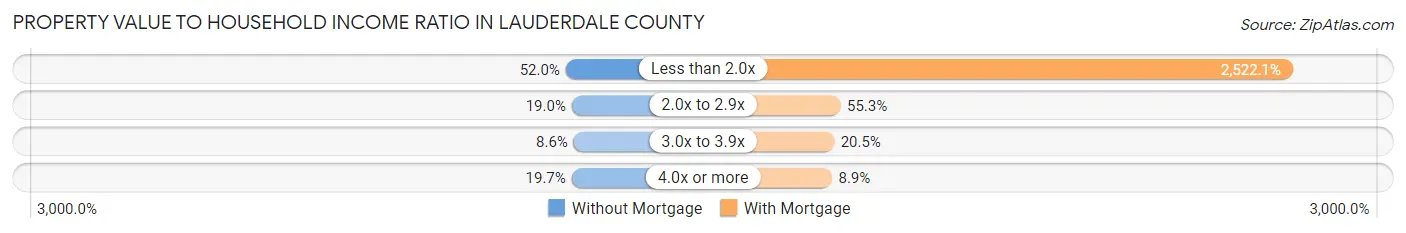
| Value-to-Income Ratio | Without Mortgage | With Mortgage |
| Less than 2.0x | 1,535 (52.0%) | 68,274 (2,522.1%) |
| 2.0x to 2.9x | 561 (19.0%) | 1,496 (55.3%) |
| 3.0x to 3.9x | 253 (8.6%) | 556 (20.5%) |
| 4.0x or more | 583 (19.7%) | 241 (8.9%) |
| Total | 2,954 (100.0%) | 2,707 (100.0%) |
Real Estate Taxes by Mortgage Status in Lauderdale County
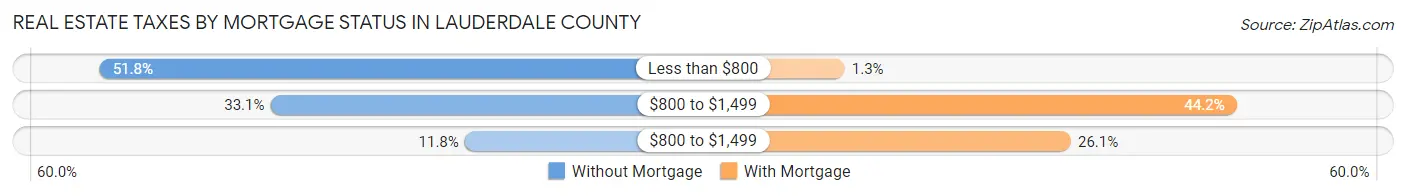
| Property Taxes | Without Mortgage | With Mortgage |
| Less than $800 | 1,529 (51.8%) | 35 (1.3%) |
| $800 to $1,499 | 977 (33.1%) | 1,197 (44.2%) |
| $800 to $1,499 | 348 (11.8%) | 706 (26.1%) |
| Total | 2,954 (100.0%) | 2,707 (100.0%) |
Health & Disability in Lauderdale County
Health Insurance Coverage by Age in Lauderdale County
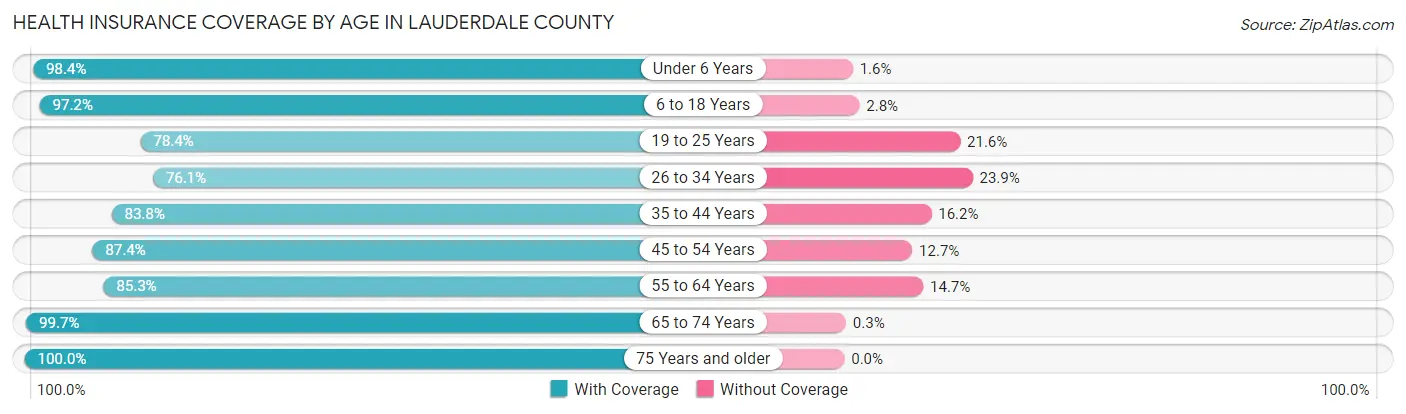
| Age Bracket | With Coverage | Without Coverage |
| Under 6 Years | 1,753 (98.4%) | 28 (1.6%) |
| 6 to 18 Years | 4,074 (97.2%) | 118 (2.8%) |
| 19 to 25 Years | 1,662 (78.4%) | 458 (21.6%) |
| 26 to 34 Years | 1,705 (76.1%) | 536 (23.9%) |
| 35 to 44 Years | 2,484 (83.8%) | 481 (16.2%) |
| 45 to 54 Years | 2,333 (87.4%) | 338 (12.7%) |
| 55 to 64 Years | 2,645 (85.3%) | 456 (14.7%) |
| 65 to 74 Years | 2,355 (99.7%) | 7 (0.3%) |
| 75 Years and older | 1,523 (100.0%) | 0 (0.0%) |
| Total | 20,534 (89.4%) | 2,422 (10.5%) |
Health Insurance Coverage by Citizenship Status in Lauderdale County
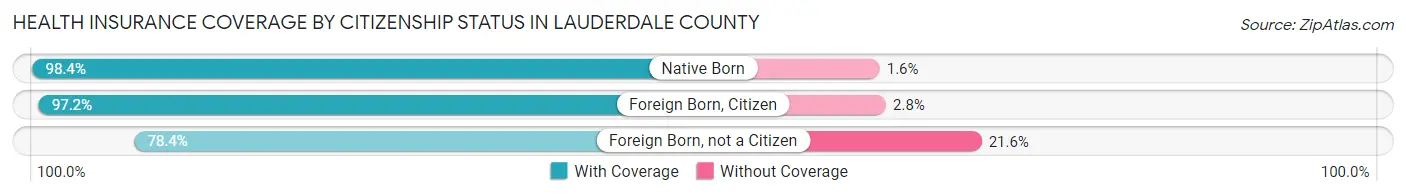
| Citizenship Status | With Coverage | Without Coverage |
| Native Born | 1,753 (98.4%) | 28 (1.6%) |
| Foreign Born, Citizen | 4,074 (97.2%) | 118 (2.8%) |
| Foreign Born, not a Citizen | 1,662 (78.4%) | 458 (21.6%) |
Health Insurance Coverage by Household Income in Lauderdale County
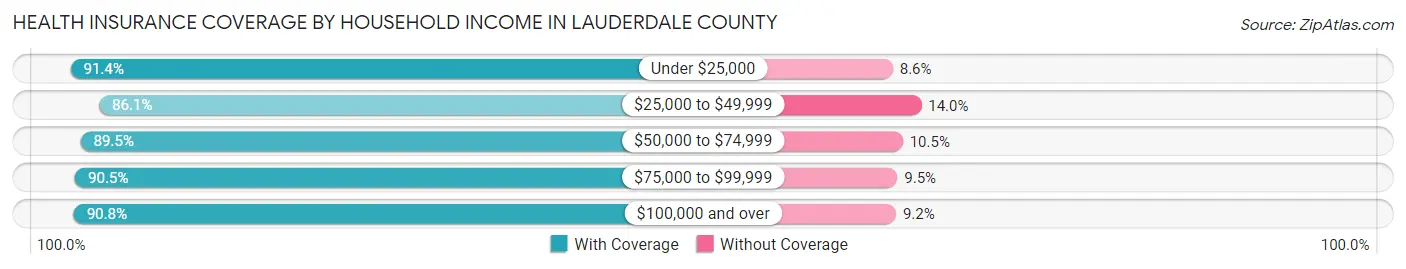
| Household Income | With Coverage | Without Coverage |
| Under $25,000 | 3,808 (91.4%) | 359 (8.6%) |
| $25,000 to $49,999 | 4,724 (86.1%) | 766 (14.0%) |
| $50,000 to $74,999 | 4,030 (89.5%) | 472 (10.5%) |
| $75,000 to $99,999 | 3,478 (90.5%) | 364 (9.5%) |
| $100,000 and over | 4,475 (90.8%) | 454 (9.2%) |
Public vs Private Health Insurance Coverage by Age in Lauderdale County

| Age Bracket | Public Insurance | Private Insurance |
| Under 6 | 1,014 (56.9%) | 942 (52.9%) |
| 6 to 18 Years | 2,385 (56.9%) | 2,064 (49.2%) |
| 19 to 25 Years | 464 (21.9%) | 1,265 (59.7%) |
| 25 to 34 Years | 477 (21.3%) | 1,257 (56.1%) |
| 35 to 44 Years | 786 (26.5%) | 1,832 (61.8%) |
| 45 to 54 Years | 583 (21.8%) | 1,810 (67.8%) |
| 55 to 64 Years | 1,130 (36.4%) | 1,722 (55.5%) |
| 65 to 74 Years | 2,304 (97.5%) | 1,307 (55.3%) |
| 75 Years and over | 1,523 (100.0%) | 839 (55.1%) |
| Total | 10,666 (46.5%) | 13,038 (56.8%) |
Disability Status by Sex by Age in Lauderdale County
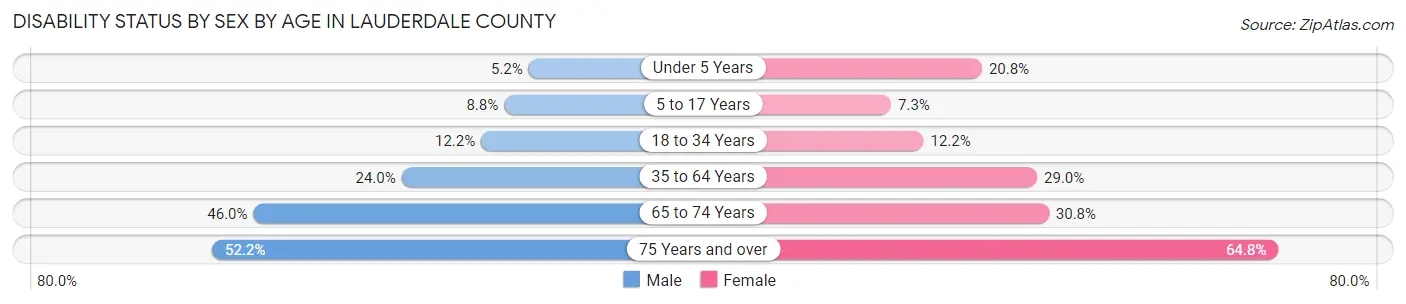
| Age Bracket | Male | Female |
| Under 5 Years | 39 (5.2%) | 139 (20.8%) |
| 5 to 17 Years | 181 (8.8%) | 157 (7.3%) |
| 18 to 34 Years | 306 (12.2%) | 268 (12.1%) |
| 35 to 64 Years | 1,023 (24.0%) | 1,299 (29.0%) |
| 65 to 74 Years | 487 (46.0%) | 401 (30.7%) |
| 75 Years and over | 338 (52.2%) | 567 (64.8%) |
Disability Class by Sex by Age in Lauderdale County
Disability Class: Hearing Difficulty
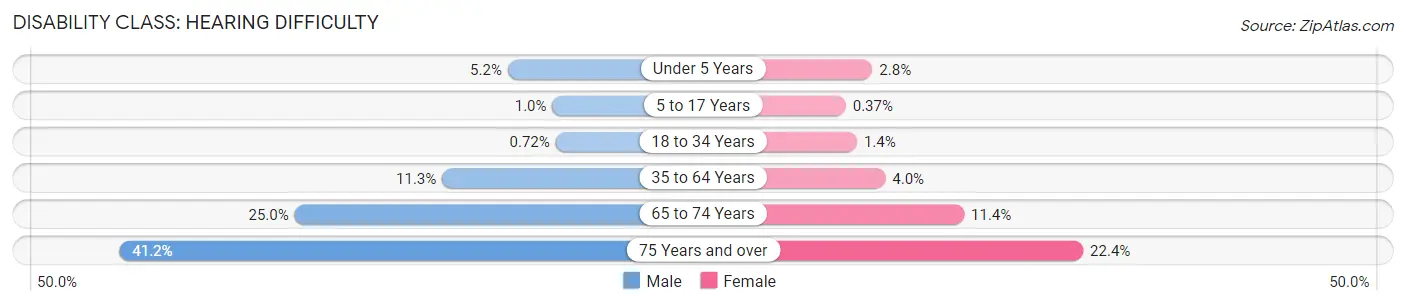
| Age Bracket | Male | Female |
| Under 5 Years | 39 (5.2%) | 19 (2.8%) |
| 5 to 17 Years | 21 (1.0%) | 8 (0.4%) |
| 18 to 34 Years | 18 (0.7%) | 31 (1.4%) |
| 35 to 64 Years | 479 (11.3%) | 181 (4.0%) |
| 65 to 74 Years | 264 (24.9%) | 148 (11.4%) |
| 75 Years and over | 267 (41.2%) | 196 (22.4%) |
Disability Class: Vision Difficulty
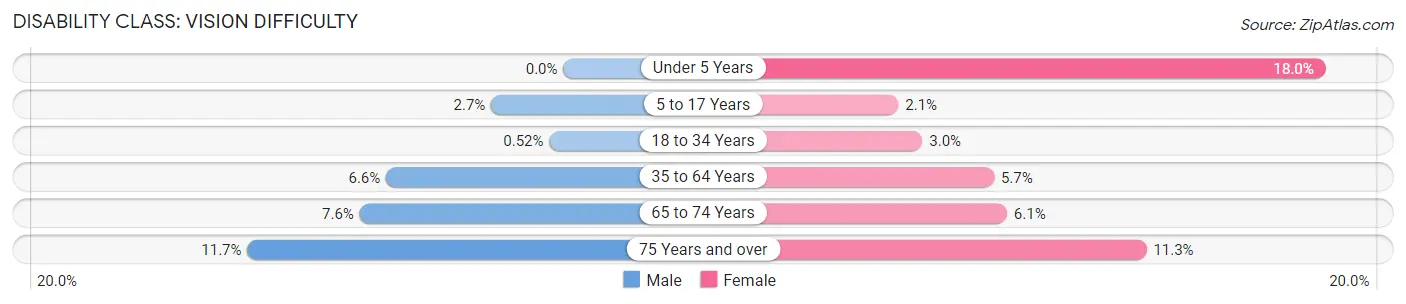
| Age Bracket | Male | Female |
| Under 5 Years | 0 (0.0%) | 120 (18.0%) |
| 5 to 17 Years | 55 (2.7%) | 45 (2.1%) |
| 18 to 34 Years | 13 (0.5%) | 66 (3.0%) |
| 35 to 64 Years | 280 (6.6%) | 253 (5.7%) |
| 65 to 74 Years | 80 (7.6%) | 80 (6.1%) |
| 75 Years and over | 76 (11.7%) | 99 (11.3%) |
Disability Class: Cognitive Difficulty
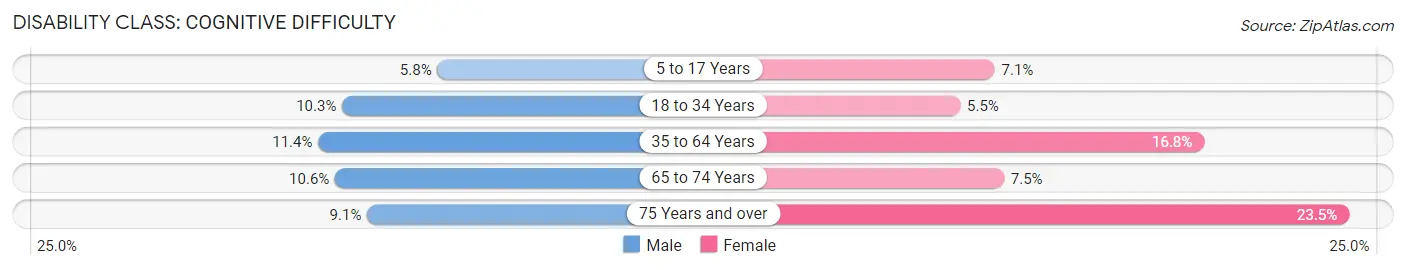
| Age Bracket | Male | Female |
| 5 to 17 Years | 120 (5.8%) | 152 (7.1%) |
| 18 to 34 Years | 257 (10.3%) | 121 (5.5%) |
| 35 to 64 Years | 484 (11.4%) | 753 (16.8%) |
| 65 to 74 Years | 112 (10.6%) | 98 (7.5%) |
| 75 Years and over | 59 (9.1%) | 206 (23.5%) |
Disability Class: Ambulatory Difficulty
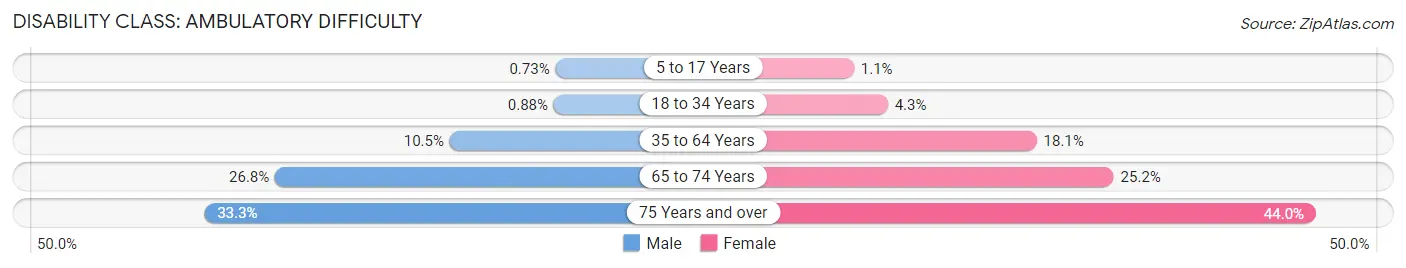
| Age Bracket | Male | Female |
| 5 to 17 Years | 15 (0.7%) | 24 (1.1%) |
| 18 to 34 Years | 22 (0.9%) | 94 (4.3%) |
| 35 to 64 Years | 449 (10.5%) | 810 (18.1%) |
| 65 to 74 Years | 283 (26.8%) | 329 (25.2%) |
| 75 Years and over | 216 (33.3%) | 385 (44.0%) |
Disability Class: Self-Care Difficulty
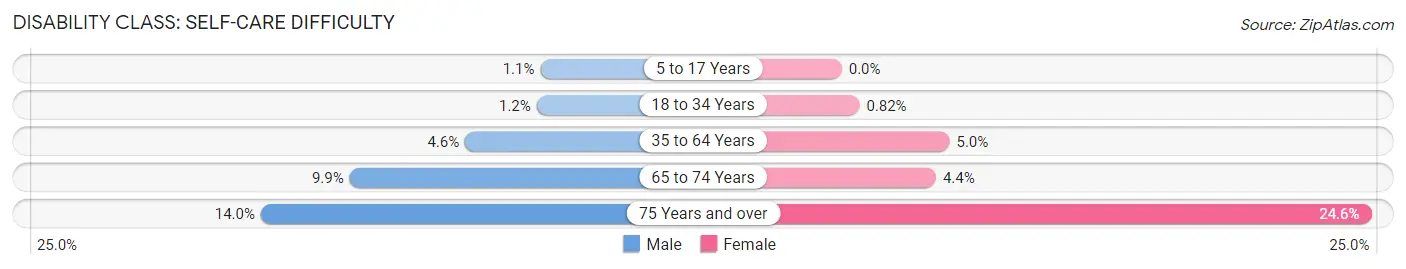
| Age Bracket | Male | Female |
| 5 to 17 Years | 22 (1.1%) | 0 (0.0%) |
| 18 to 34 Years | 31 (1.2%) | 18 (0.8%) |
| 35 to 64 Years | 194 (4.6%) | 224 (5.0%) |
| 65 to 74 Years | 105 (9.9%) | 57 (4.4%) |
| 75 Years and over | 91 (14.0%) | 215 (24.6%) |
Technology Access in Lauderdale County
Computing Device Access in Lauderdale County
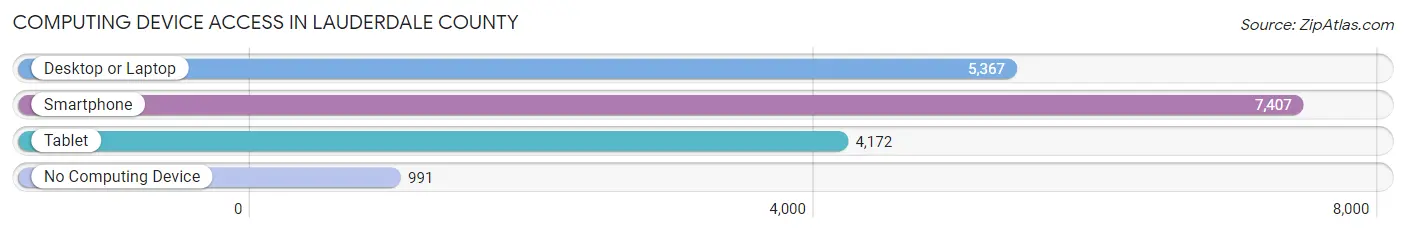
| Device Type | # Households | % Households |
| Desktop or Laptop | 5,367 | 58.8% |
| Smartphone | 7,407 | 81.1% |
| Tablet | 4,172 | 45.7% |
| No Computing Device | 991 | 10.9% |
| Total | 9,127 | 100.0% |
Internet Access in Lauderdale County
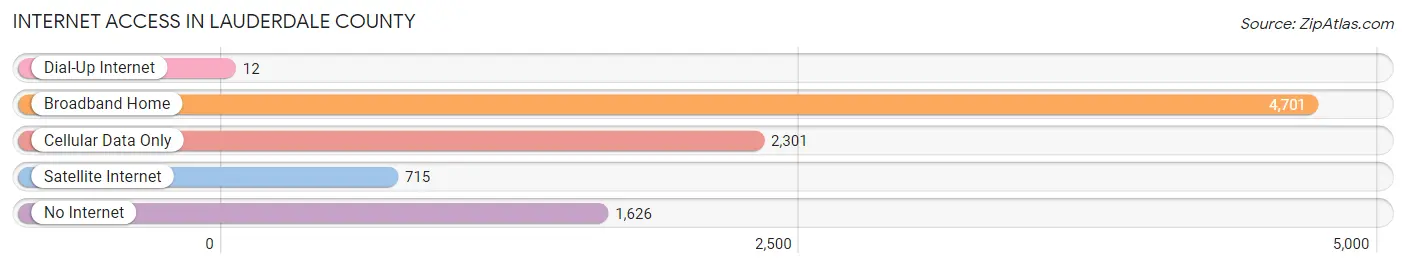
| Internet Type | # Households | % Households |
| Dial-Up Internet | 12 | 0.1% |
| Broadband Home | 4,701 | 51.5% |
| Cellular Data Only | 2,301 | 25.2% |
| Satellite Internet | 715 | 7.8% |
| No Internet | 1,626 | 17.8% |
| Total | 9,127 | 100.0% |
Lauderdale County Summary
Lauderdale County is located in the western part of the state of Tennessee, in the United States. It is bordered by the states of Mississippi and Alabama, and is part of the Jackson metropolitan area. The county seat is Ripley, and the largest city is Halls. As of the 2010 census, the population was 27,815.
Geography
Lauderdale County is located in the western part of Tennessee, in the United States. It is bordered by the states of Mississippi and Alabama, and is part of the Jackson metropolitan area. The county has a total area of 545 square miles, of which 544 square miles is land and 1.2 square miles is water. The terrain is mostly flat, with some rolling hills in the northern part of the county. The county is drained by the Hatchie River, which flows through the center of the county.
Climate
Lauderdale County has a humid subtropical climate, with hot, humid summers and mild winters. The average annual temperature is 64°F, and the average annual precipitation is 48 inches.
Demographics
As of the 2010 census, there were 27,815 people, 10,845 households, and 7,717 families residing in the county. The population density was 51 people per square mile. The racial makeup of the county was 79.2% White, 18.2% African American, 0.3% Native American, 0.3% Asian, 0.1% Pacific Islander, 0.7% from other races, and 1.2% from two or more races. Hispanic or Latino of any race were 1.7% of the population.
Economy
Lauderdale County has a diverse economy, with a mix of manufacturing, agriculture, and services. The county is home to several large manufacturing companies, including the Ripley Manufacturing Company, which produces automotive parts, and the Halls Manufacturing Company, which produces furniture. Agriculture is also an important part of the economy, with soybeans, corn, and cotton being the main crops. The county also has a thriving tourism industry, with several popular attractions, such as the Hatchie National Wildlife Refuge and the Lauderdale County Museum.
Conclusion
Lauderdale County is a diverse county located in the western part of Tennessee. It is bordered by the states of Mississippi and Alabama, and is part of the Jackson metropolitan area. The county has a total area of 545 square miles, and a population of 27,815 as of the 2010 census. The county has a humid subtropical climate, with hot, humid summers and mild winters. The economy of the county is diverse, with a mix of manufacturing, agriculture, and services. Tourism is also an important part of the economy, with several popular attractions.
Common Questions
What is the Total Population of Lauderdale County?
Total Population of Lauderdale County is 25,171.
What is the Total Male Population of Lauderdale County?
Total Male Population of Lauderdale County is 13,008.
What is the Total Female Population of Lauderdale County?
Total Female Population of Lauderdale County is 12,163.
What is the Ratio of Males per 100 Females in Lauderdale County?
There are 106.95 Males per 100 Females in Lauderdale County.
What is the Ratio of Females per 100 Males in Lauderdale County?
There are 93.50 Females per 100 Males in Lauderdale County.
What is the Median Population Age in Lauderdale County?
Median Population Age in Lauderdale County is 38.9 Years.
What is the Average Family Size in Lauderdale County
Average Family Size in Lauderdale County is 3.1 People.
What is the Average Household Size in Lauderdale County
Average Household Size in Lauderdale County is 2.5 People.
What is Per Capita Income in Lauderdale County?
Per Capita income in Lauderdale County is $24,358.
What is the Median Family Income in Lauderdale County?
Median Family Income in Lauderdale County is $55,679.
What is the Median Household income in Lauderdale County?
Median Household Income in Lauderdale County is $46,702.
What is Income or Wage Gap in Lauderdale County?
Income or Wage Gap in Lauderdale County is 25.1%.
Women in Lauderdale County earn 74.9 cents for every dollar earned by a man.
What is Family Income Deficit in Lauderdale County?
Family Income Deficit in Lauderdale County is $12,053.
Families that are below poverty line in Lauderdale County earn $12,053 less on average than the poverty threshold level.
What is Inequality or Gini Index in Lauderdale County?
Inequality or Gini Index in Lauderdale County is 0.45.
How Large is the Labor Force in Lauderdale County?
There are 9,899 People in the Labor Forcein in Lauderdale County.
What is the Percentage of People in the Labor Force in Lauderdale County?
49.1% of People are in the Labor Force in Lauderdale County.
What is the Unemployment Rate in Lauderdale County?
Unemployment Rate in Lauderdale County is 6.1%.