Lake County, TN
Lake County Map
Lake County Overview
6,898
TOTAL POPULATION
4,382
MALE POPULATION
2,516
FEMALE POPULATION
174.17
MALES / 100 FEMALES
57.42
FEMALES / 100 MALES
41.8
MEDIAN AGE
3.3
AVG FAMILY SIZE
2.3
AVG HOUSEHOLD SIZE
$19,695
PER CAPITA INCOME
$45,250
AVG FAMILY INCOME
$32,064
AVG HOUSEHOLD INCOME
0.9%
WAGE / INCOME GAP [ % ]
99.1¢/ $1
WAGE / INCOME GAP [ $ ]
$17,932
FAMILY INCOME DEFICIT
0.57
INEQUALITY / GINI INDEX
1,848
LABOR FORCE [ PEOPLE ]
30.7%
PERCENT IN LABOR FORCE
7.0%
UNEMPLOYMENT RATE
Lake County Area Codes
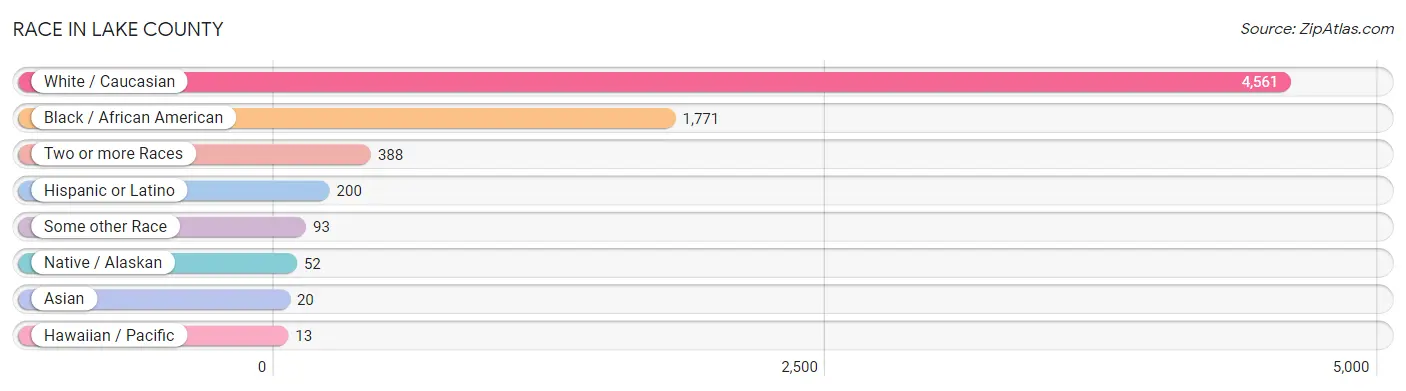
Race in Lake County
The most populous races in Lake County are White / Caucasian (4,561 | 66.1%), Black / African American (1,771 | 25.7%), and Two or more Races (388 | 5.6%).
| Race | # Population | % Population |
| Asian | 20 | 0.3% |
| Black / African American | 1,771 | 25.7% |
| Hawaiian / Pacific | 13 | 0.2% |
| Hispanic or Latino | 200 | 2.9% |
| Native / Alaskan | 52 | 0.7% |
| White / Caucasian | 4,561 | 66.1% |
| Two or more Races | 388 | 5.6% |
| Some other Race | 93 | 1.3% |
| Total | 6,898 | 100.0% |
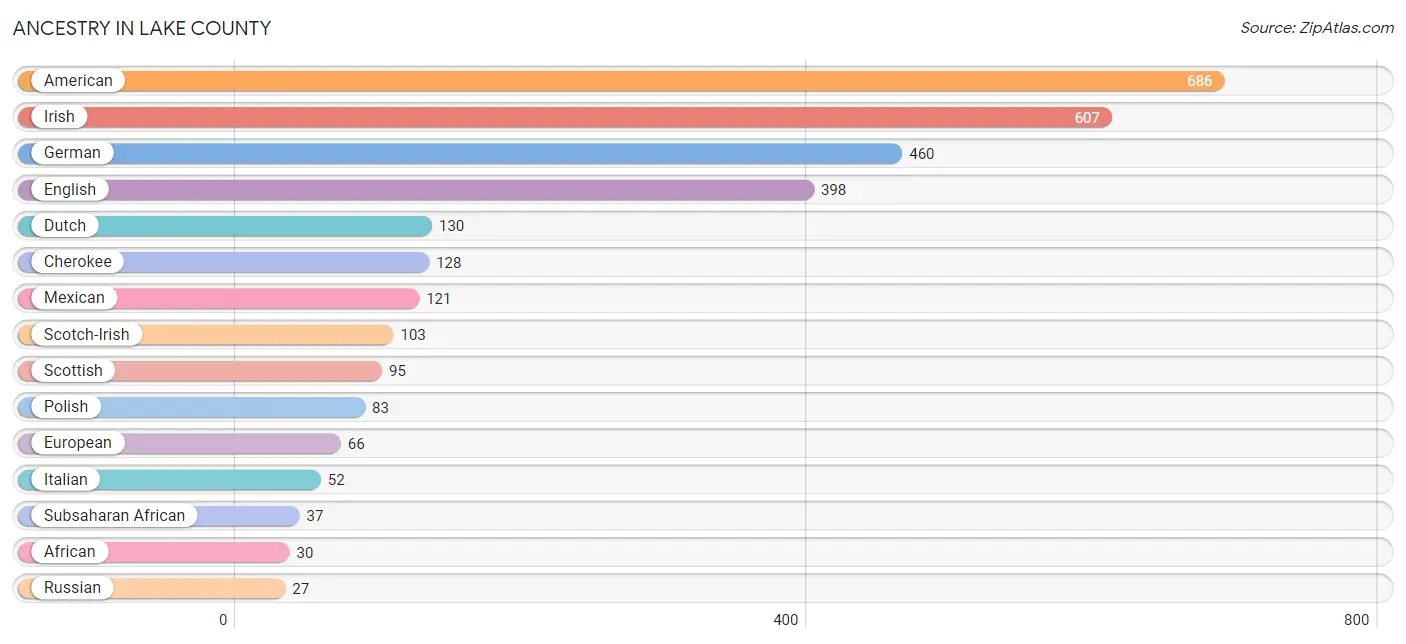
Ancestry in Lake County
The most populous ancestries reported in Lake County are American (686 | 9.9%), Irish (607 | 8.8%), German (460 | 6.7%), English (398 | 5.8%), and Dutch (130 | 1.9%), together accounting for 33.1% of all Lake County residents.
| Ancestry | # Population | % Population |
| African | 30 | 0.4% |
| Alsatian | 6 | 0.1% |
| American | 686 | 9.9% |
| Burmese | 2 | 0.0% |
| Central American | 15 | 0.2% |
| Central American Indian | 3 | 0.0% |
| Cherokee | 128 | 1.9% |
| Choctaw | 18 | 0.3% |
| Cuban | 4 | 0.1% |
| Dutch | 130 | 1.9% |
| English | 398 | 5.8% |
| European | 66 | 1.0% |
| French | 19 | 0.3% |
| German | 460 | 6.7% |
| Greek | 8 | 0.1% |
| Haitian | 18 | 0.3% |
| Honduran | 7 | 0.1% |
| Indian (Asian) | 18 | 0.3% |
| Irish | 607 | 8.8% |
| Italian | 52 | 0.7% |
| Mexican | 121 | 1.8% |
| Mexican American Indian | 3 | 0.0% |
| Native Hawaiian | 5 | 0.1% |
| Nigerian | 7 | 0.1% |
| Polish | 83 | 1.2% |
| Puerto Rican | 14 | 0.2% |
| Russian | 27 | 0.4% |
| Scotch-Irish | 103 | 1.5% |
| Scottish | 95 | 1.4% |
| South American | 27 | 0.4% |
| Sri Lankan | 1 | 0.0% |
| Subsaharan African | 37 | 0.5% |
| Swedish | 8 | 0.1% |
| Venezuelan | 27 | 0.4% | View All 34 Rows |
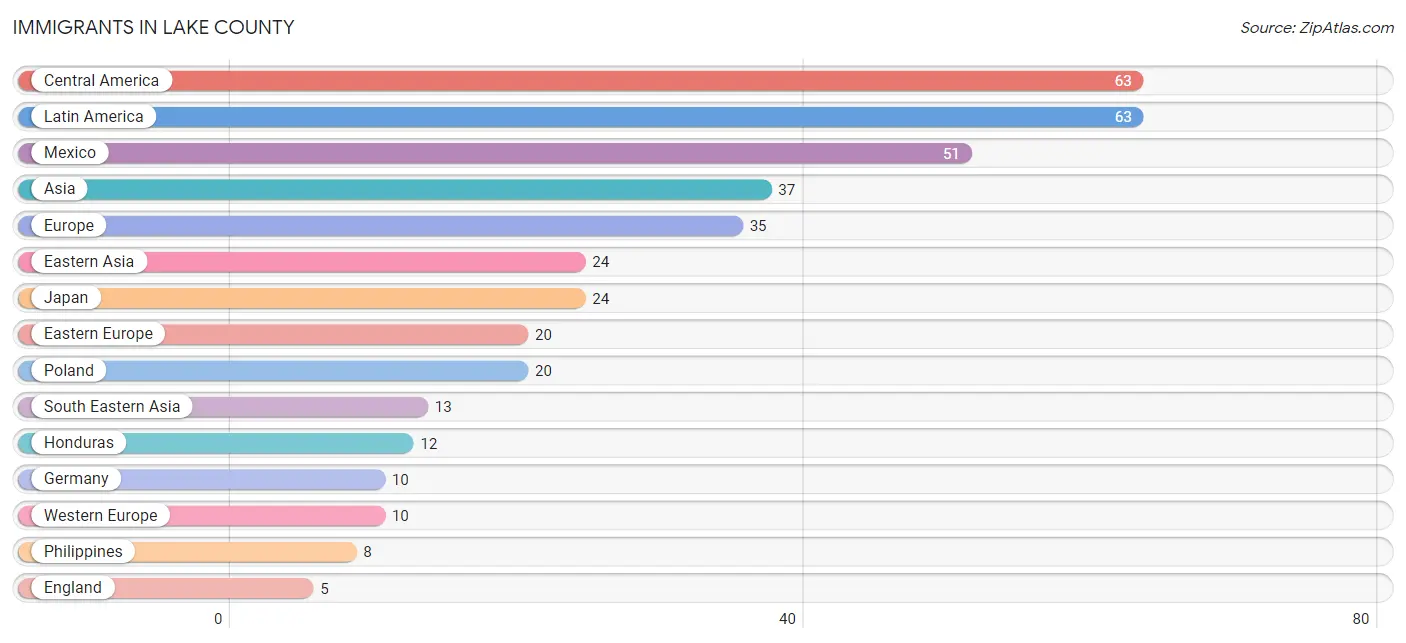
Immigrants in Lake County
The most numerous immigrant groups reported in Lake County came from Central America (63 | 0.9%), Latin America (63 | 0.9%), Mexico (51 | 0.7%), Asia (37 | 0.5%), and Europe (35 | 0.5%), together accounting for 3.6% of all Lake County residents.
| Immigration Origin | # Population | % Population |
| Asia | 37 | 0.5% |
| Central America | 63 | 0.9% |
| Eastern Asia | 24 | 0.4% |
| Eastern Europe | 20 | 0.3% |
| England | 5 | 0.1% |
| Europe | 35 | 0.5% |
| Germany | 10 | 0.1% |
| Honduras | 12 | 0.2% |
| Japan | 24 | 0.4% |
| Laos | 5 | 0.1% |
| Latin America | 63 | 0.9% |
| Mexico | 51 | 0.7% |
| Northern Europe | 5 | 0.1% |
| Philippines | 8 | 0.1% |
| Poland | 20 | 0.3% |
| South Eastern Asia | 13 | 0.2% |
| Western Europe | 10 | 0.1% | View All 17 Rows |
Sex and Age in Lake County
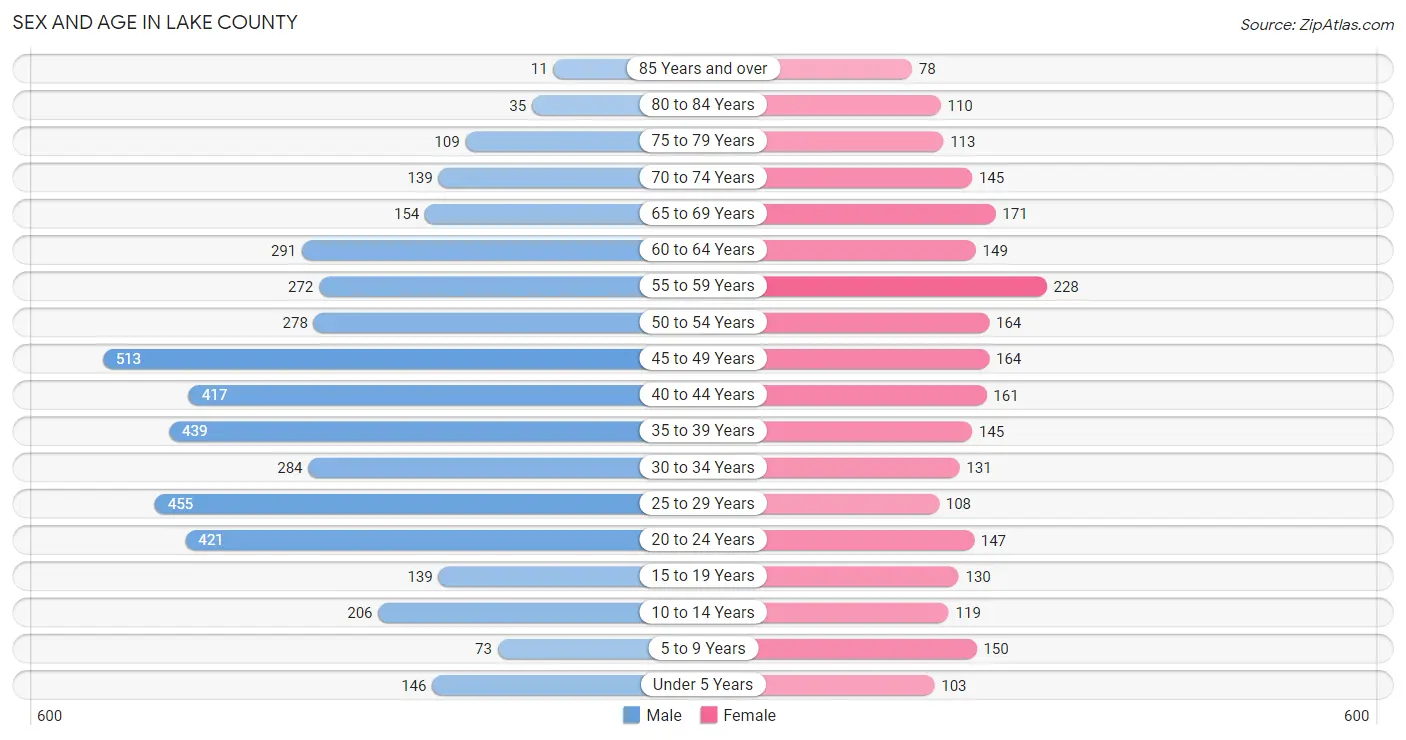
Sex and Age in Lake County
The most populous age groups in Lake County are 45 to 49 Years (513 | 11.7%) for men and 55 to 59 Years (228 | 9.1%) for women.
| Age Bracket | Male | Female |
| Under 5 Years | 146 (3.3%) | 103 (4.1%) |
| 5 to 9 Years | 73 (1.7%) | 150 (6.0%) |
| 10 to 14 Years | 206 (4.7%) | 119 (4.7%) |
| 15 to 19 Years | 139 (3.2%) | 130 (5.2%) |
| 20 to 24 Years | 421 (9.6%) | 147 (5.8%) |
| 25 to 29 Years | 455 (10.4%) | 108 (4.3%) |
| 30 to 34 Years | 284 (6.5%) | 131 (5.2%) |
| 35 to 39 Years | 439 (10.0%) | 145 (5.8%) |
| 40 to 44 Years | 417 (9.5%) | 161 (6.4%) |
| 45 to 49 Years | 513 (11.7%) | 164 (6.5%) |
| 50 to 54 Years | 278 (6.3%) | 164 (6.5%) |
| 55 to 59 Years | 272 (6.2%) | 228 (9.1%) |
| 60 to 64 Years | 291 (6.6%) | 149 (5.9%) |
| 65 to 69 Years | 154 (3.5%) | 171 (6.8%) |
| 70 to 74 Years | 139 (3.2%) | 145 (5.8%) |
| 75 to 79 Years | 109 (2.5%) | 113 (4.5%) |
| 80 to 84 Years | 35 (0.8%) | 110 (4.4%) |
| 85 Years and over | 11 (0.3%) | 78 (3.1%) |
| Total | 4,382 (100.0%) | 2,516 (100.0%) |
Families and Households in Lake County
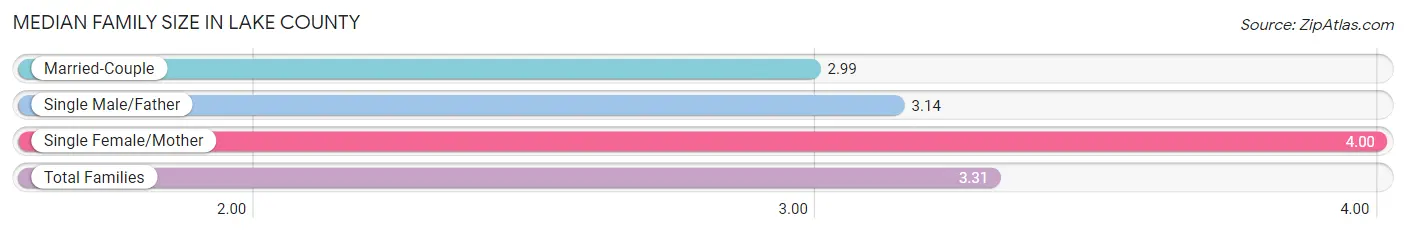
Median Family Size in Lake County
The median family size in Lake County is 3.31 persons per family, with single female/mother families (323 | 31.6%) accounting for the largest median family size of 4 persons per family. On the other hand, married-couple families (664 | 65.0%) represent the smallest median family size with 2.99 persons per family.
| Family Type | # Families | Family Size |
| Married-Couple | 664 (65.0%) | 2.99 |
| Single Male/Father | 35 (3.4%) | 3.14 |
| Single Female/Mother | 323 (31.6%) | 4.00 |
| Total Families | 1,022 (100.0%) | 3.31 |
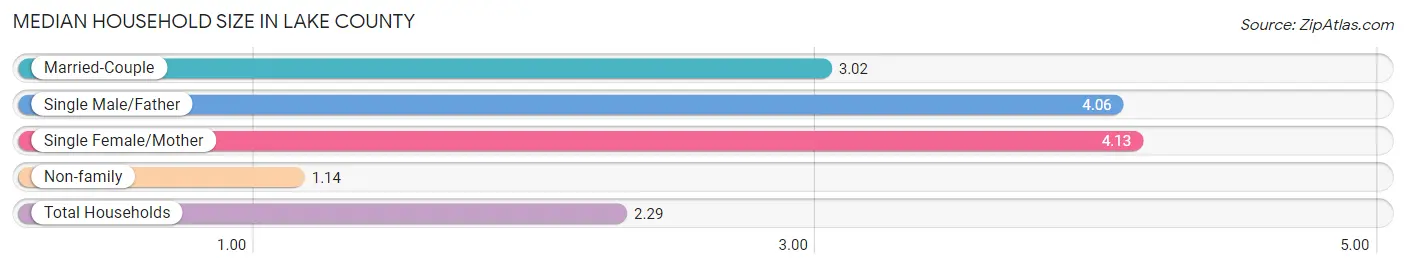
Median Household Size in Lake County
The median household size in Lake County is 2.29 persons per household, with single female/mother households (323 | 16.1%) accounting for the largest median household size of 4.13 persons per household. non-family households (991 | 49.2%) represent the smallest median household size with 1.14 persons per household.
| Household Type | # Households | Household Size |
| Married-Couple | 664 (33.0%) | 3.02 |
| Single Male/Father | 35 (1.7%) | 4.06 |
| Single Female/Mother | 323 (16.1%) | 4.13 |
| Non-family | 991 (49.2%) | 1.14 |
| Total Households | 2,013 (100.0%) | 2.29 |
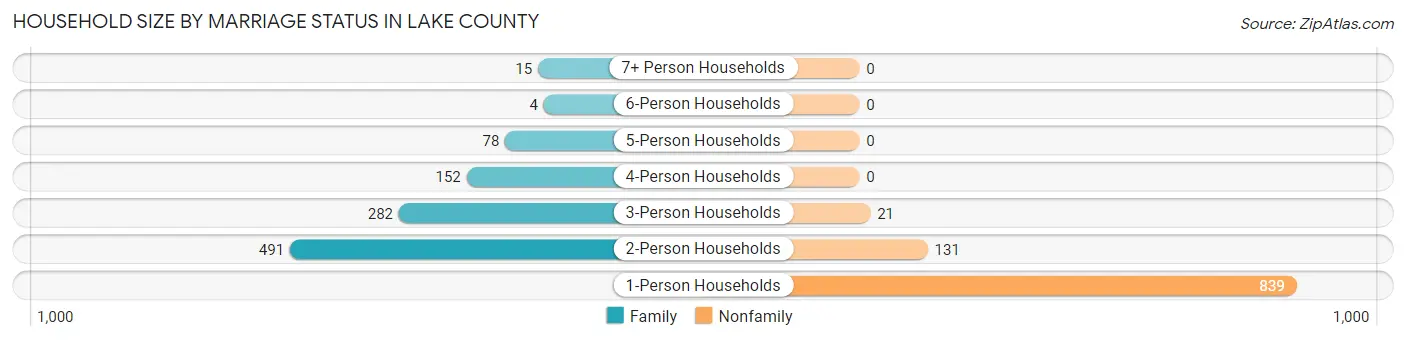
Household Size by Marriage Status in Lake County
Out of a total of 2,013 households in Lake County, 1,022 (50.8%) are family households, while 991 (49.2%) are nonfamily households. The most numerous type of family households are 2-person households, comprising 491, and the most common type of nonfamily households are 1-person households, comprising 839.
| Household Size | Family Households | Nonfamily Households |
| 1-Person Households | - | 839 (41.7%) |
| 2-Person Households | 491 (24.4%) | 131 (6.5%) |
| 3-Person Households | 282 (14.0%) | 21 (1.0%) |
| 4-Person Households | 152 (7.5%) | 0 (0.0%) |
| 5-Person Households | 78 (3.9%) | 0 (0.0%) |
| 6-Person Households | 4 (0.2%) | 0 (0.0%) |
| 7+ Person Households | 15 (0.7%) | 0 (0.0%) |
| Total | 1,022 (50.8%) | 991 (49.2%) |
Female Fertility in Lake County
Fertility by Age in Lake County
Average fertility rate in Lake County is 97.0 births per 1,000 women. Women in the age bracket of 20 to 34 years have the highest fertility rate with 176.0 births per 1,000 women. Women in the age bracket of 20 to 34 years acount for 70.8% of all women with births.
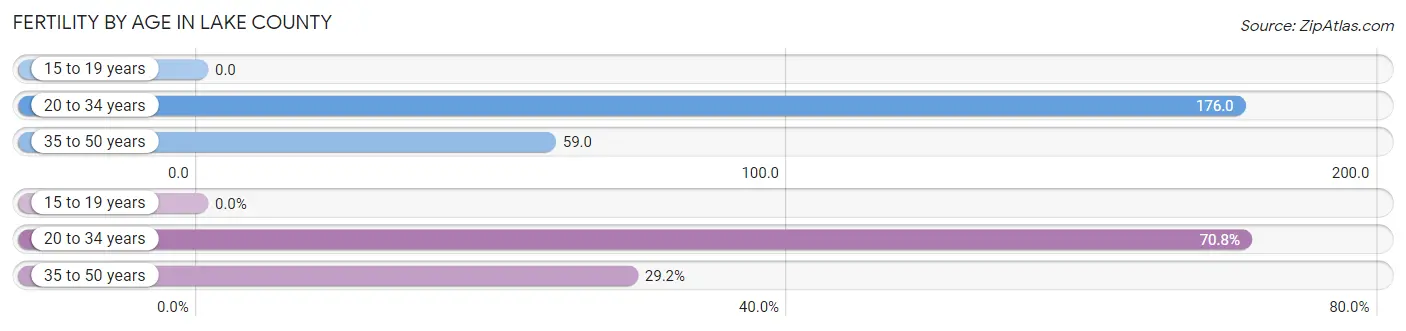
| Age Bracket | Women with Births | Births / 1,000 Women |
| 15 to 19 years | 0 (0.0%) | 0.0 |
| 20 to 34 years | 68 (70.8%) | 176.0 |
| 35 to 50 years | 28 (29.2%) | 59.0 |
| Total | 96 (100.0%) | 97.0 |
Fertility by Age by Marriage Status in Lake County
29.2% of women with births (96) in Lake County are married. The highest percentage of unmarried women with births falls into 20 to 34 years age bracket with 100.0% of them unmarried at the time of birth, while the lowest percentage of unmarried women with births belong to 35 to 50 years age bracket with 0.0% of them unmarried.
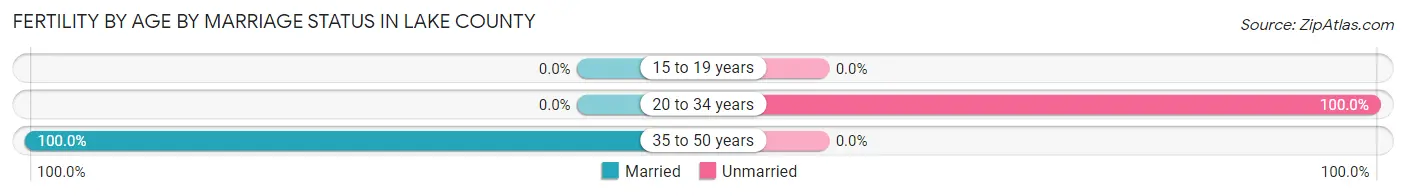
| Age Bracket | Married | Unmarried |
| 15 to 19 years | 0 (0.0%) | 0 (0.0%) |
| 20 to 34 years | 0 (0.0%) | 68 (100.0%) |
| 35 to 50 years | 28 (100.0%) | 0 (0.0%) |
| Total | 28 (29.2%) | 68 (70.8%) |
Fertility by Education in Lake County
Average fertility rate in Lake County is 97.0 births per 1,000 women. Women with the education attainment of bachelor's degree have the highest fertility rate of 242.0 births per 1,000 women, while women with the education attainment of high school diploma have the lowest fertility at 55.0 births per 1,000 women. Women with the education attainment of college or associate's degree represent 36.5% of all women with births.
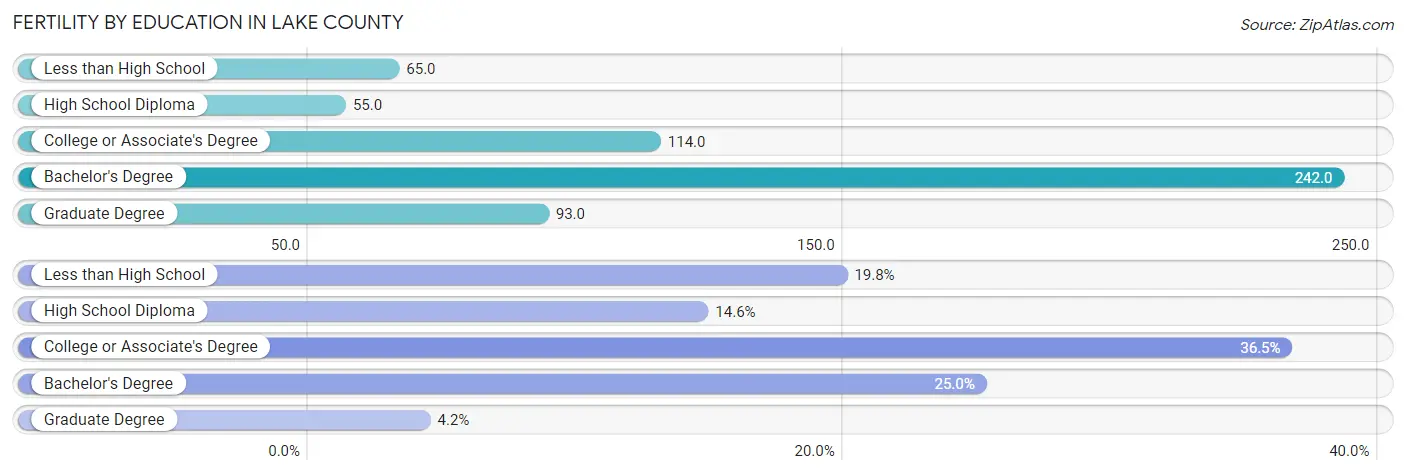
| Educational Attainment | Women with Births | Births / 1,000 Women |
| Less than High School | 19 (19.8%) | 65.0 |
| High School Diploma | 14 (14.6%) | 55.0 |
| College or Associate's Degree | 35 (36.5%) | 114.0 |
| Bachelor's Degree | 24 (25.0%) | 242.0 |
| Graduate Degree | 4 (4.2%) | 93.0 |
| Total | 96 (100.0%) | 97.0 |
Fertility by Education by Marriage Status in Lake County
70.8% of women with births in Lake County are unmarried. Women with the educational attainment of high school diploma are most likely to be married with 100.0% of them married at childbirth, while women with the educational attainment of less than high school are least likely to be married with 100.0% of them unmarried at childbirth.
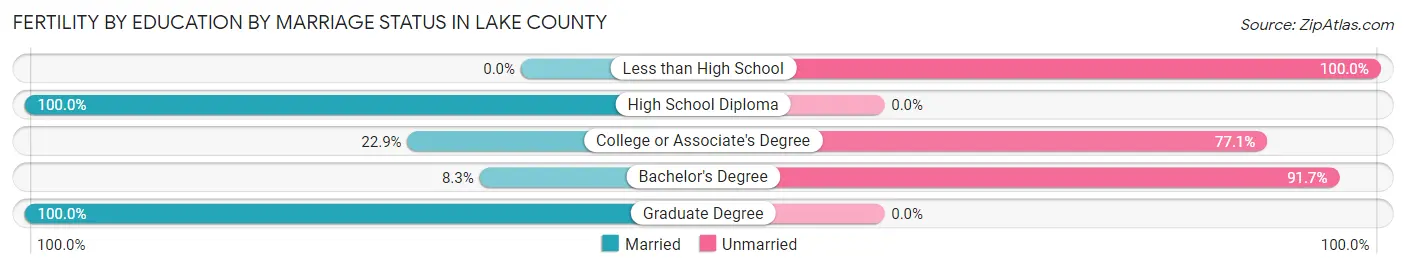
| Educational Attainment | Married | Unmarried |
| Less than High School | 0 (0.0%) | 19 (100.0%) |
| High School Diploma | 14 (100.0%) | 0 (0.0%) |
| College or Associate's Degree | 8 (22.9%) | 27 (77.1%) |
| Bachelor's Degree | 2 (8.3%) | 22 (91.7%) |
| Graduate Degree | 4 (100.0%) | 0 (0.0%) |
| Total | 28 (29.2%) | 68 (70.8%) |
Income in Lake County
Income Overview in Lake County
Per Capita Income in Lake County is $19,695, while median incomes of families and households are $45,250 and $32,064 respectively.
| Characteristic | Number | Measure |
| Per Capita Income | 6,898 | $19,695 |
| Median Family Income | 1,022 | $45,250 |
| Mean Family Income | 1,022 | $68,014 |
| Median Household Income | 2,013 | $32,064 |
| Mean Household Income | 2,013 | $53,918 |
| Income Deficit | 1,022 | $17,932 |
| Wage / Income Gap (%) | 6,898 | 0.88% |
| Wage / Income Gap ($) | 6,898 | 99.12¢ per $1 |
| Gini / Inequality Index | 6,898 | 0.57 |
Earnings by Sex in Lake County
Average Earnings in Lake County are $23,869, $23,984 for men and $23,772 for women, a difference of 0.9%.
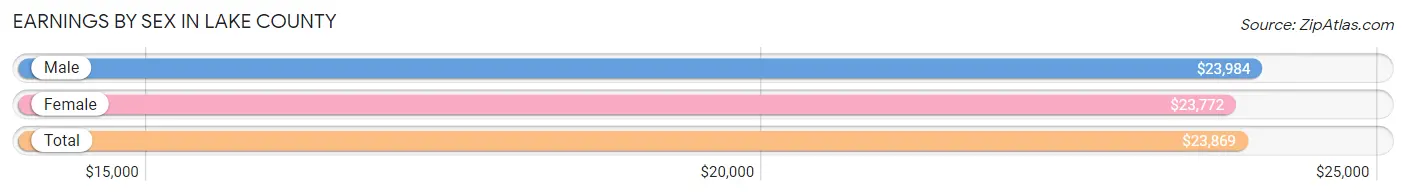
| Sex | Number | Average Earnings |
| Male | 1,125 (52.1%) | $23,984 |
| Female | 1,036 (47.9%) | $23,772 |
| Total | 2,161 (100.0%) | $23,869 |
Earnings by Sex by Income Bracket in Lake County
The most common earnings brackets in Lake County are $100,000+ for men (134 | 11.9%) and $15,000 to $17,499 for women (147 | 14.2%).
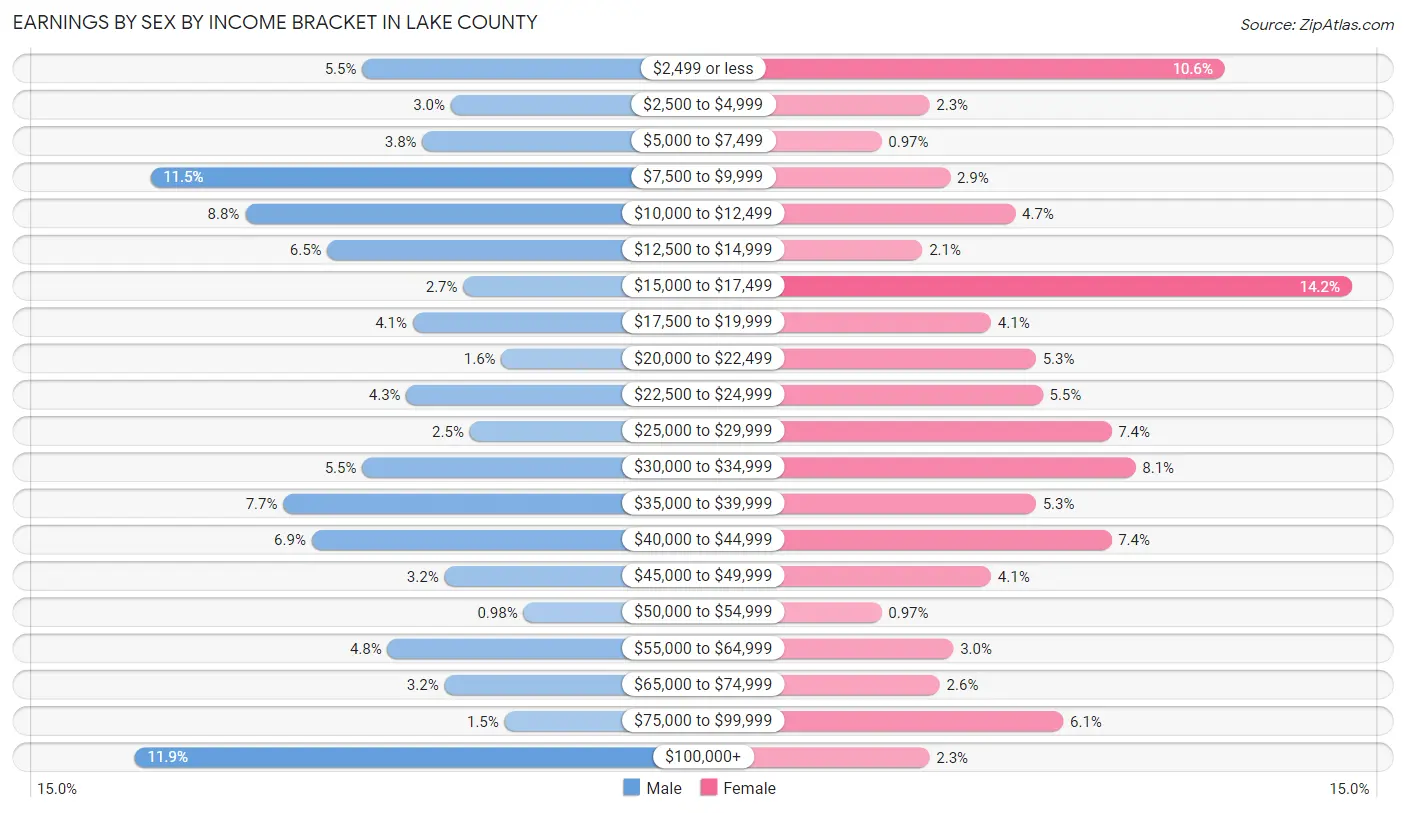
| Income | Male | Female |
| $2,499 or less | 62 (5.5%) | 110 (10.6%) |
| $2,500 to $4,999 | 34 (3.0%) | 24 (2.3%) |
| $5,000 to $7,499 | 43 (3.8%) | 10 (1.0%) |
| $7,500 to $9,999 | 129 (11.5%) | 30 (2.9%) |
| $10,000 to $12,499 | 99 (8.8%) | 49 (4.7%) |
| $12,500 to $14,999 | 73 (6.5%) | 22 (2.1%) |
| $15,000 to $17,499 | 30 (2.7%) | 147 (14.2%) |
| $17,500 to $19,999 | 46 (4.1%) | 42 (4.1%) |
| $20,000 to $22,499 | 18 (1.6%) | 55 (5.3%) |
| $22,500 to $24,999 | 48 (4.3%) | 57 (5.5%) |
| $25,000 to $29,999 | 28 (2.5%) | 77 (7.4%) |
| $30,000 to $34,999 | 62 (5.5%) | 84 (8.1%) |
| $35,000 to $39,999 | 87 (7.7%) | 55 (5.3%) |
| $40,000 to $44,999 | 78 (6.9%) | 77 (7.4%) |
| $45,000 to $49,999 | 36 (3.2%) | 42 (4.1%) |
| $50,000 to $54,999 | 11 (1.0%) | 10 (1.0%) |
| $55,000 to $64,999 | 54 (4.8%) | 31 (3.0%) |
| $65,000 to $74,999 | 36 (3.2%) | 27 (2.6%) |
| $75,000 to $99,999 | 17 (1.5%) | 63 (6.1%) |
| $100,000+ | 134 (11.9%) | 24 (2.3%) |
| Total | 1,125 (100.0%) | 1,036 (100.0%) |
Earnings by Sex by Educational Attainment in Lake County
Average earnings in Lake County are $33,219 for men and $28,589 for women, a difference of 13.9%. Men with an educational attainment of graduate degree enjoy the highest average annual earnings of $156,081, while those with bachelor's degree education earn the least with $32,212. Women with an educational attainment of graduate degree earn the most with the average annual earnings of $57,083, while those with less than high school education have the smallest earnings of $18,611.
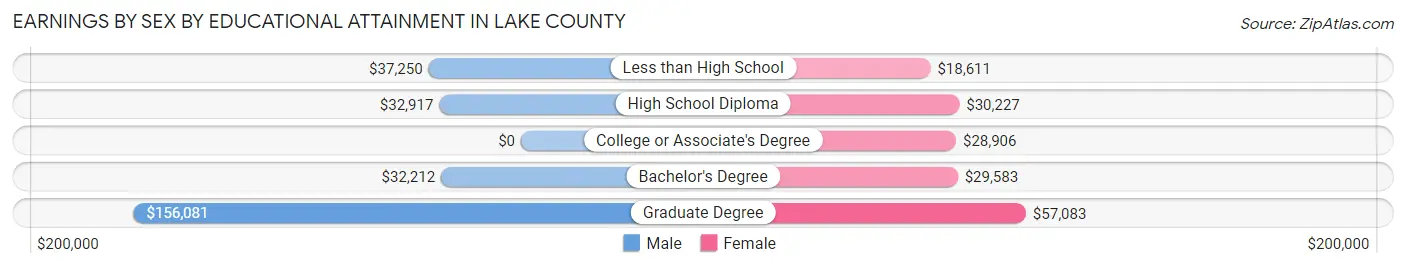
| Educational Attainment | Male Income | Female Income |
| Less than High School | $37,250 | $18,611 |
| High School Diploma | $32,917 | $30,227 |
| College or Associate's Degree | - | - |
| Bachelor's Degree | $32,212 | $29,583 |
| Graduate Degree | $156,081 | $57,083 |
| Total | $33,219 | $28,589 |
Family Income in Lake County
Family Income Brackets in Lake County
According to the Lake County family income data, there are 204 families falling into the $50,000 to $74,999 income range, which is the most common income bracket and makes up 20.0% of all families. Conversely, the $200,000+ income bracket is the least frequent group with only 39 families (3.8%) belonging to this category.

| Income Bracket | # Families | % Families |
| Less than $10,000 | 158 | 15.5% |
| $10,000 to $14,999 | 71 | 6.9% |
| $15,000 to $24,999 | 74 | 7.2% |
| $25,000 to $34,999 | 128 | 12.5% |
| $35,000 to $49,999 | 110 | 10.8% |
| $50,000 to $74,999 | 204 | 20.0% |
| $75,000 to $99,999 | 100 | 9.8% |
| $100,000 to $149,999 | 97 | 9.5% |
| $150,000 to $199,999 | 41 | 4.0% |
| $200,000+ | 39 | 3.8% |
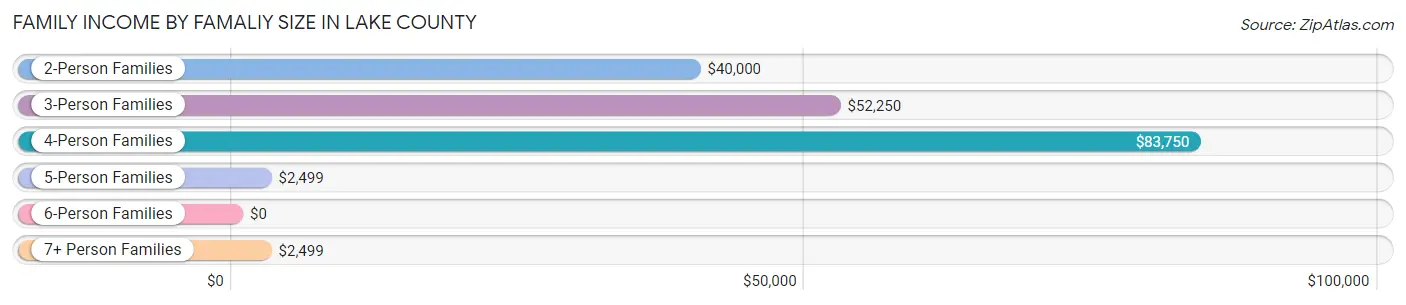
Family Income by Famaliy Size in Lake County
4-person families (153 | 15.0%) account for the highest median family income in Lake County with $83,750 per family, while 4-person families (153 | 15.0%) have the highest median income of $20,938 per family member.
| Income Bracket | # Families | Median Income |
| 2-Person Families | 534 (52.2%) | $40,000 |
| 3-Person Families | 245 (24.0%) | $52,250 |
| 4-Person Families | 153 (15.0%) | $83,750 |
| 5-Person Families | 71 (7.0%) | $2,499 |
| 6-Person Families | 4 (0.4%) | $0 |
| 7+ Person Families | 15 (1.5%) | $2,499 |
| Total | 1,022 (100.0%) | $45,250 |
Family Income by Number of Earners in Lake County
The median family income in Lake County is $45,250, with families comprising 3+ earners (41) having the highest median family income of $101,250, while families with no earners (356) have the lowest median family income of $12,034, accounting for 4.0% and 34.8% of families, respectively.
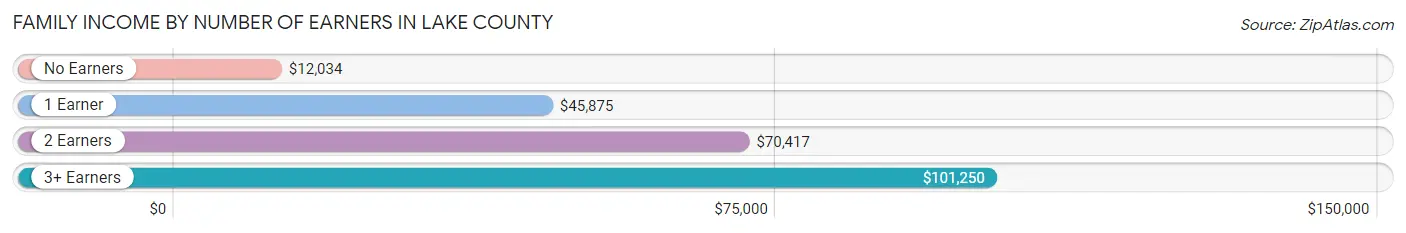
| Number of Earners | # Families | Median Income |
| No Earners | 356 (34.8%) | $12,034 |
| 1 Earner | 335 (32.8%) | $45,875 |
| 2 Earners | 290 (28.4%) | $70,417 |
| 3+ Earners | 41 (4.0%) | $101,250 |
| Total | 1,022 (100.0%) | $45,250 |
Household Income in Lake County
Household Income Brackets in Lake County
With 368 households falling in the category, the less than $10,000 income range is the most frequent in Lake County, accounting for 18.3% of all households. In contrast, only 40 households (2.0%) fall into the $200,000+ income bracket, making it the least populous group.
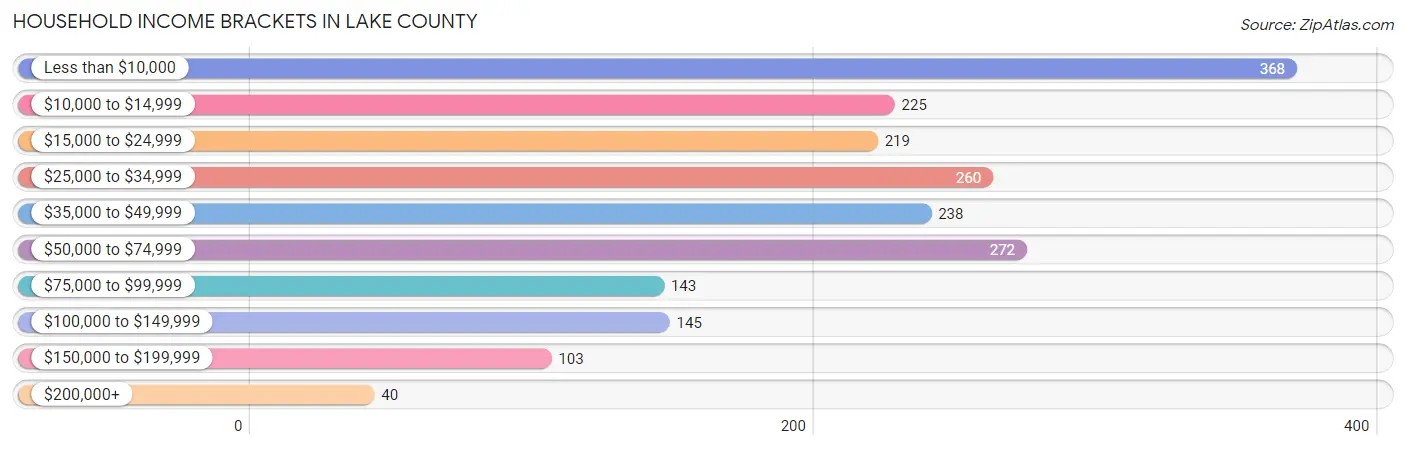
| Income Bracket | # Households | % Households |
| Less than $10,000 | 368 | 18.3% |
| $10,000 to $14,999 | 225 | 11.2% |
| $15,000 to $24,999 | 219 | 10.9% |
| $25,000 to $34,999 | 260 | 12.9% |
| $35,000 to $49,999 | 238 | 11.8% |
| $50,000 to $74,999 | 272 | 13.5% |
| $75,000 to $99,999 | 143 | 7.1% |
| $100,000 to $149,999 | 145 | 7.2% |
| $150,000 to $199,999 | 103 | 5.1% |
| $200,000+ | 40 | 2.0% |
Household Income by Householder Age in Lake County
The median household income in Lake County is $32,064, with the highest median household income of $37,639 found in the 65+ years age bracket for the primary householder. A total of 565 households (28.1%) fall into this category. Meanwhile, the 15 to 24 years age bracket for the primary householder has the lowest median household income of $0, with 114 households (5.7%) in this group.
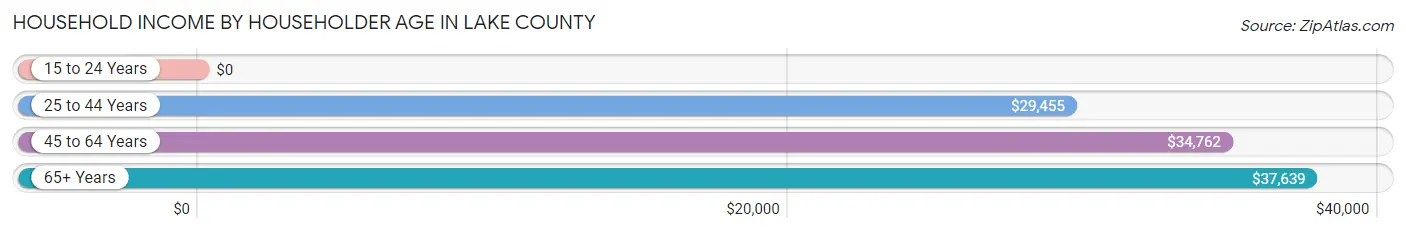
| Income Bracket | # Households | Median Income |
| 15 to 24 Years | 114 (5.7%) | $0 |
| 25 to 44 Years | 534 (26.5%) | $29,455 |
| 45 to 64 Years | 800 (39.7%) | $34,762 |
| 65+ Years | 565 (28.1%) | $37,639 |
| Total | 2,013 (100.0%) | $32,064 |
Poverty in Lake County
Income Below Poverty by Sex and Age in Lake County
With 26.8% poverty level for males and 28.9% for females among the residents of Lake County, under 5 year old males and 6 to 11 year old females are the most vulnerable to poverty, with 84 males (64.6%) and 93 females (62.0%) in their respective age groups living below the poverty level.

| Age Bracket | Male | Female |
| Under 5 Years | 84 (64.6%) | 21 (20.4%) |
| 5 Years | 0 (0.0%) | 0 (0.0%) |
| 6 to 11 Years | 44 (32.6%) | 93 (62.0%) |
| 12 to 14 Years | 40 (29.2%) | 41 (39.4%) |
| 15 Years | 20 (35.7%) | 3 (11.5%) |
| 16 and 17 Years | 0 (0.0%) | 17 (35.4%) |
| 18 to 24 Years | 10 (5.0%) | 120 (59.1%) |
| 25 to 34 Years | 97 (32.6%) | 77 (32.2%) |
| 35 to 44 Years | 41 (18.5%) | 103 (33.7%) |
| 45 to 54 Years | 47 (17.6%) | 59 (18.0%) |
| 55 to 64 Years | 155 (43.9%) | 114 (31.0%) |
| 65 to 74 Years | 23 (10.7%) | 37 (12.6%) |
| 75 Years and over | 21 (20.4%) | 14 (6.0%) |
| Total | 582 (26.8%) | 699 (28.9%) |
Income Above Poverty by Sex and Age in Lake County
According to the poverty statistics in Lake County, males aged 16 and 17 years and females aged 5 years are the age groups that are most secure financially, with 100.0% of males and 100.0% of females in these age groups living above the poverty line.
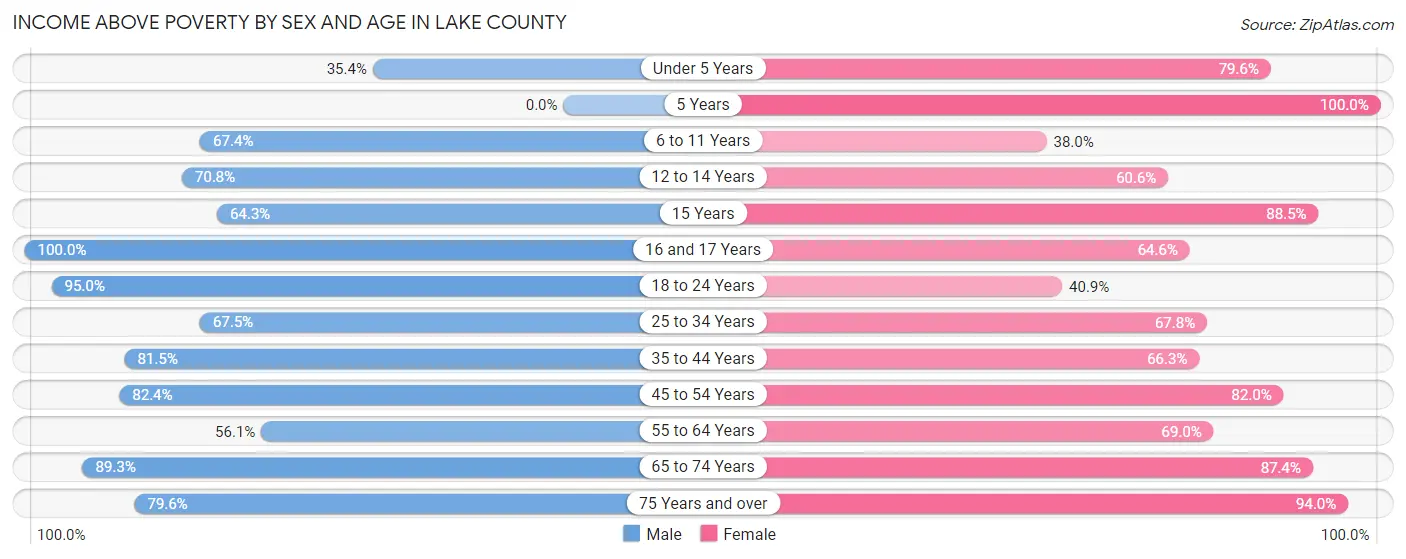
| Age Bracket | Male | Female |
| Under 5 Years | 46 (35.4%) | 82 (79.6%) |
| 5 Years | 0 (0.0%) | 15 (100.0%) |
| 6 to 11 Years | 91 (67.4%) | 57 (38.0%) |
| 12 to 14 Years | 97 (70.8%) | 63 (60.6%) |
| 15 Years | 36 (64.3%) | 23 (88.5%) |
| 16 and 17 Years | 56 (100.0%) | 31 (64.6%) |
| 18 to 24 Years | 190 (95.0%) | 83 (40.9%) |
| 25 to 34 Years | 201 (67.4%) | 162 (67.8%) |
| 35 to 44 Years | 180 (81.5%) | 203 (66.3%) |
| 45 to 54 Years | 220 (82.4%) | 269 (82.0%) |
| 55 to 64 Years | 198 (56.1%) | 254 (69.0%) |
| 65 to 74 Years | 191 (89.2%) | 257 (87.4%) |
| 75 Years and over | 82 (79.6%) | 218 (94.0%) |
| Total | 1,588 (73.2%) | 1,717 (71.1%) |
Income Below Poverty Among Married-Couple Families in Lake County
The poverty statistics for married-couple families in Lake County show that 19.6% or 130 of the total 664 families live below the poverty line. Families with 3 or 4 children have the highest poverty rate of 87.9%, comprising of 58 families. On the other hand, families with 1 or 2 children have the lowest poverty rate of 4.1%, which includes 8 families.
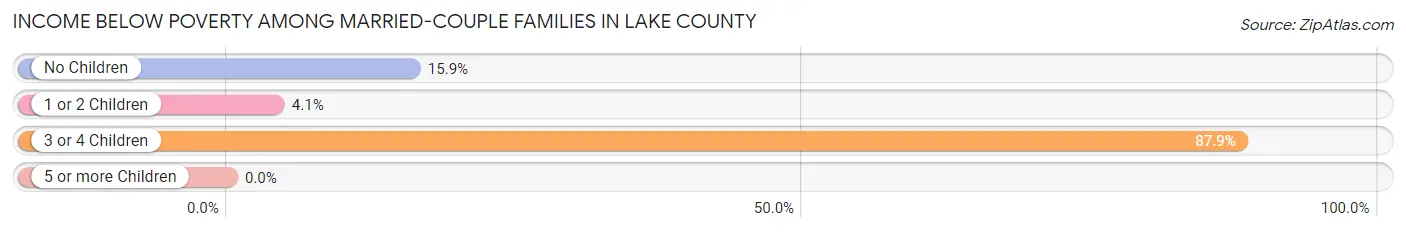
| Children | Above Poverty | Below Poverty |
| No Children | 338 (84.1%) | 64 (15.9%) |
| 1 or 2 Children | 188 (95.9%) | 8 (4.1%) |
| 3 or 4 Children | 8 (12.1%) | 58 (87.9%) |
| 5 or more Children | 0 (0.0%) | 0 (0.0%) |
| Total | 534 (80.4%) | 130 (19.6%) |
Income Below Poverty Among Single-Parent Households in Lake County
According to the poverty data in Lake County, 54.3% or 19 single-father households and 38.4% or 124 single-mother households are living below the poverty line. Among single-father households, those with 1 or 2 children have the highest poverty rate, with 17 households (94.4%) experiencing poverty. Likewise, among single-mother households, those with 5 or more children have the highest poverty rate, with 10 households (83.3%) falling below the poverty line.
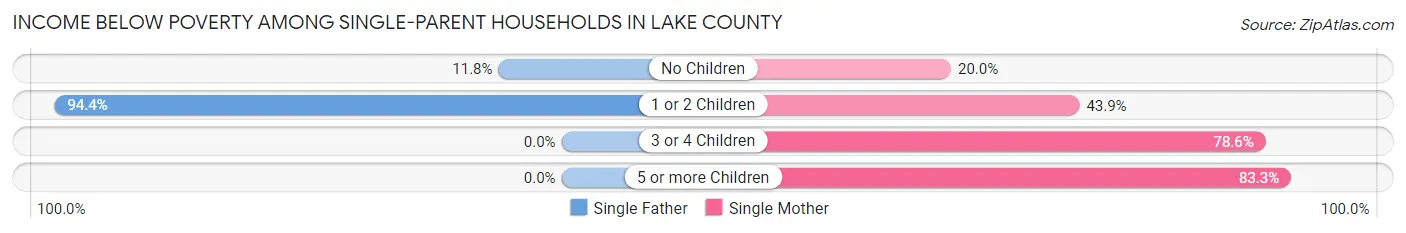
| Children | Single Father | Single Mother |
| No Children | 2 (11.8%) | 27 (20.0%) |
| 1 or 2 Children | 17 (94.4%) | 65 (43.9%) |
| 3 or 4 Children | 0 (0.0%) | 22 (78.6%) |
| 5 or more Children | 0 (0.0%) | 10 (83.3%) |
| Total | 19 (54.3%) | 124 (38.4%) |
Income Below Poverty Among Married-Couple vs Single-Parent Households in Lake County
The poverty data for Lake County shows that 130 of the married-couple family households (19.6%) and 143 of the single-parent households (39.9%) are living below the poverty level. Within the married-couple family households, those with 3 or 4 children have the highest poverty rate, with 58 households (87.9%) falling below the poverty line. Among the single-parent households, those with 5 or more children have the highest poverty rate, with 10 household (83.3%) living below poverty.
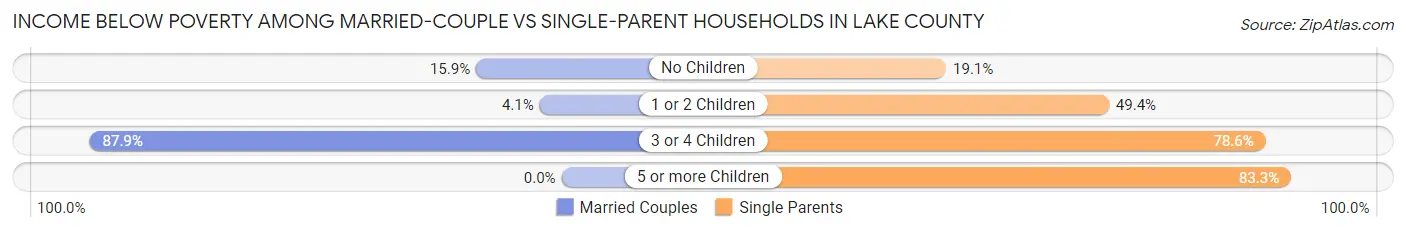
| Children | Married-Couple Families | Single-Parent Households |
| No Children | 64 (15.9%) | 29 (19.1%) |
| 1 or 2 Children | 8 (4.1%) | 82 (49.4%) |
| 3 or 4 Children | 58 (87.9%) | 22 (78.6%) |
| 5 or more Children | 0 (0.0%) | 10 (83.3%) |
| Total | 130 (19.6%) | 143 (39.9%) |
Employment Characteristics in Lake County
Employment by Class of Employer in Lake County
Among the 1,710 employed individuals in Lake County, private company employees (903 | 52.8%), state government employees (252 | 14.7%), and self-employed (not incorporated) (166 | 9.7%) make up the most common classes of employment.
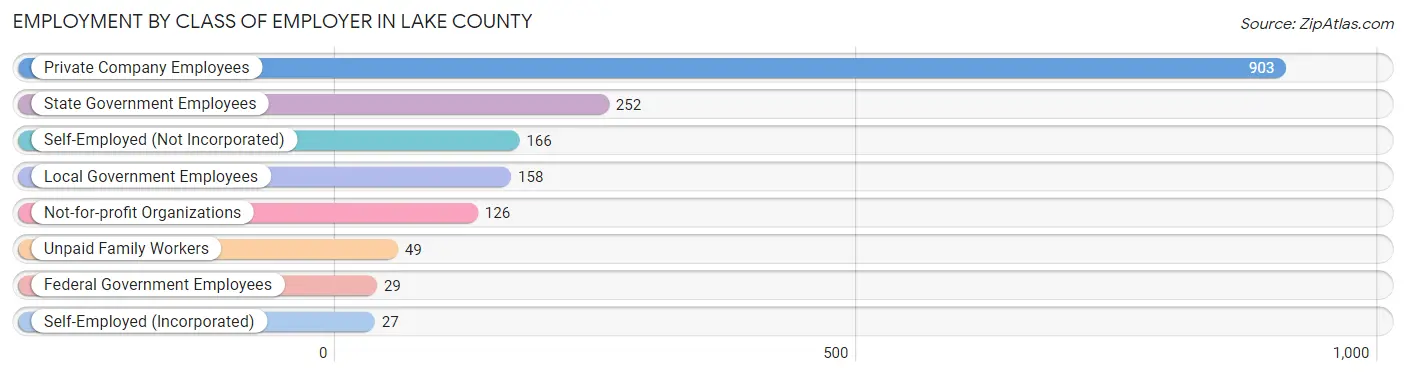
| Employer Class | # Employees | % Employees |
| Private Company Employees | 903 | 52.8% |
| Self-Employed (Incorporated) | 27 | 1.6% |
| Self-Employed (Not Incorporated) | 166 | 9.7% |
| Not-for-profit Organizations | 126 | 7.4% |
| Local Government Employees | 158 | 9.2% |
| State Government Employees | 252 | 14.7% |
| Federal Government Employees | 29 | 1.7% |
| Unpaid Family Workers | 49 | 2.9% |
| Total | 1,710 | 100.0% |
Employment Status by Age in Lake County
According to the labor force statistics for Lake County, out of the total population over 16 years of age (6,018), 30.7% or 1,848 individuals are in the labor force, with 7.0% or 129 of them unemployed. The age group with the highest labor force participation rate is 55 to 59 years, with 46.4% or 232 individuals in the labor force. Within the labor force, the 25 to 29 years age range has the highest percentage of unemployed individuals, with 19.9% or 40 of them being unemployed.
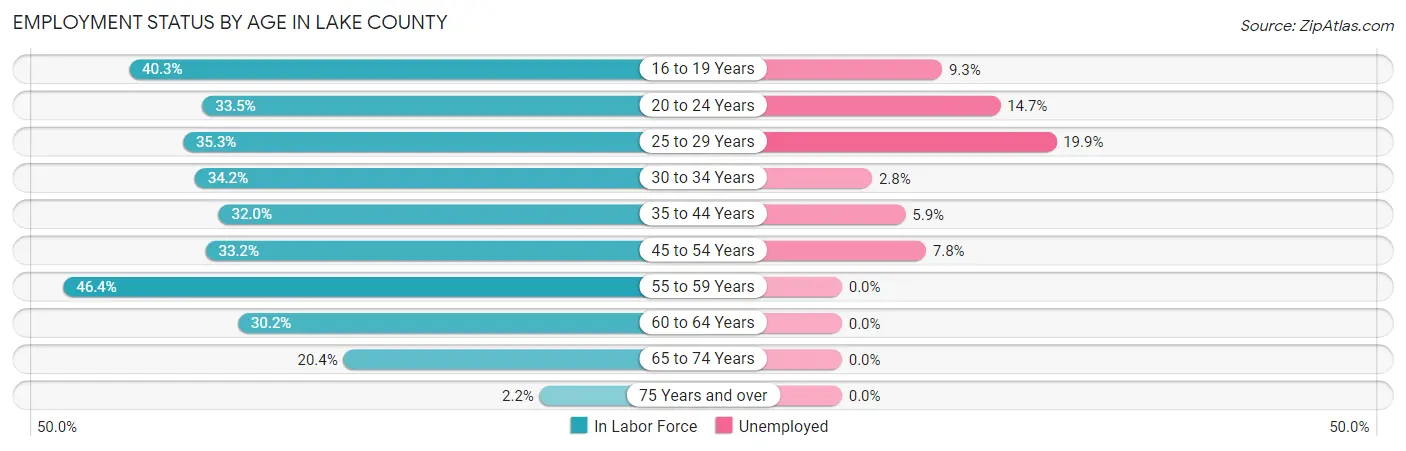
| Age Bracket | In Labor Force | Unemployed |
| 16 to 19 Years | 75 (40.3%) | 7 (9.3%) |
| 20 to 24 Years | 190 (33.5%) | 28 (14.7%) |
| 25 to 29 Years | 199 (35.3%) | 40 (19.9%) |
| 30 to 34 Years | 142 (34.2%) | 4 (2.8%) |
| 35 to 44 Years | 372 (32.0%) | 22 (5.9%) |
| 45 to 54 Years | 372 (33.2%) | 29 (7.8%) |
| 55 to 59 Years | 232 (46.4%) | 0 (0.0%) |
| 60 to 64 Years | 133 (30.2%) | 0 (0.0%) |
| 65 to 74 Years | 124 (20.4%) | 0 (0.0%) |
| 75 Years and over | 10 (2.2%) | 0 (0.0%) |
| Total | 1,848 (30.7%) | 129 (7.0%) |
Employment Status by Educational Attainment in Lake County
According to labor force statistics for Lake County, 34.5% of individuals (1,449) out of the total population between 25 and 64 years of age (4,199) are in the labor force, with 6.5% or 94 of them being unemployed. The group with the highest labor force participation rate are those with the educational attainment of bachelor's degree or higher, with 76.9% or 266 individuals in the labor force. Within the labor force, individuals with bachelor's degree or higher education have the highest percentage of unemployment, with 11.3% or 30 of them being unemployed.
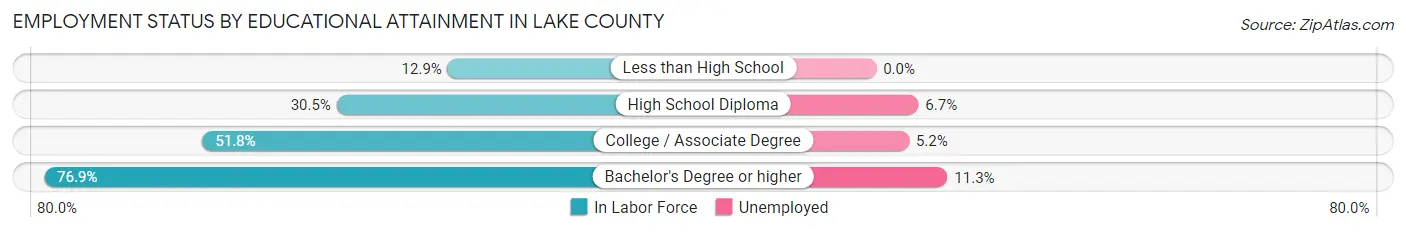
| Educational Attainment | In Labor Force | Unemployed |
| Less than High School | 135 (12.9%) | 0 (0.0%) |
| High School Diploma | 579 (30.5%) | 127 (6.7%) |
| College / Associate Degree | 469 (51.8%) | 47 (5.2%) |
| Bachelor's Degree or higher | 266 (76.9%) | 39 (11.3%) |
| Total | 1,449 (34.5%) | 273 (6.5%) |
Employment Occupations by Sex in Lake County
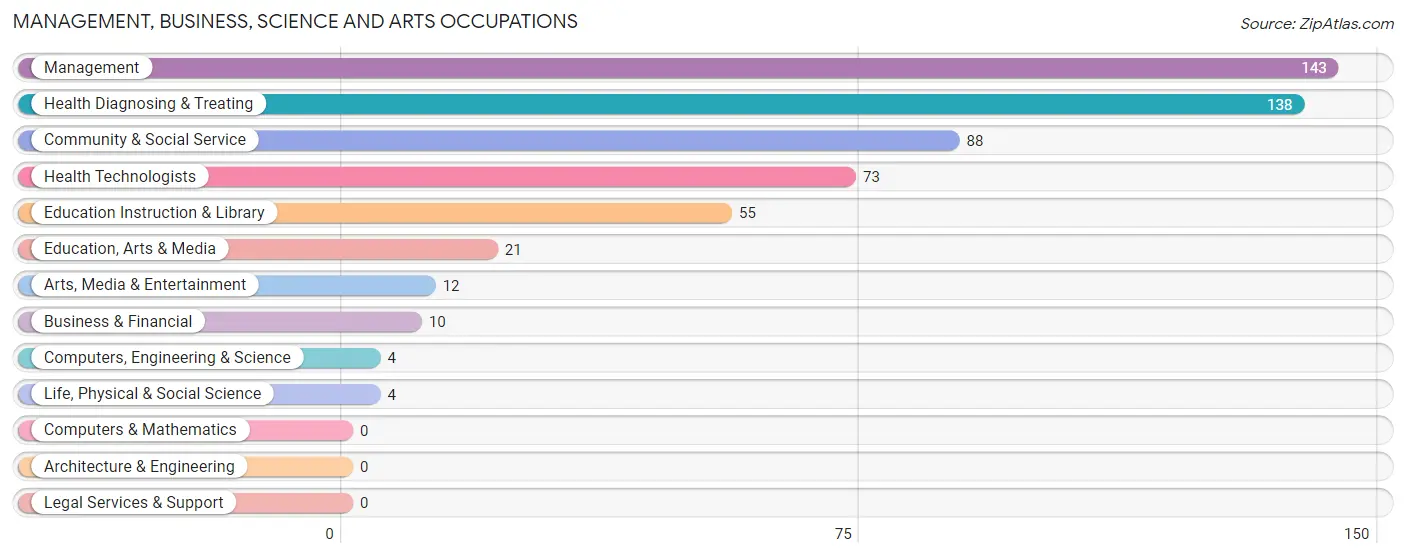
Management, Business, Science and Arts Occupations
The most common Management, Business, Science and Arts occupations in Lake County are Management (143 | 8.4%), Health Diagnosing & Treating (138 | 8.1%), Community & Social Service (88 | 5.1%), Health Technologists (73 | 4.3%), and Education Instruction & Library (55 | 3.2%).
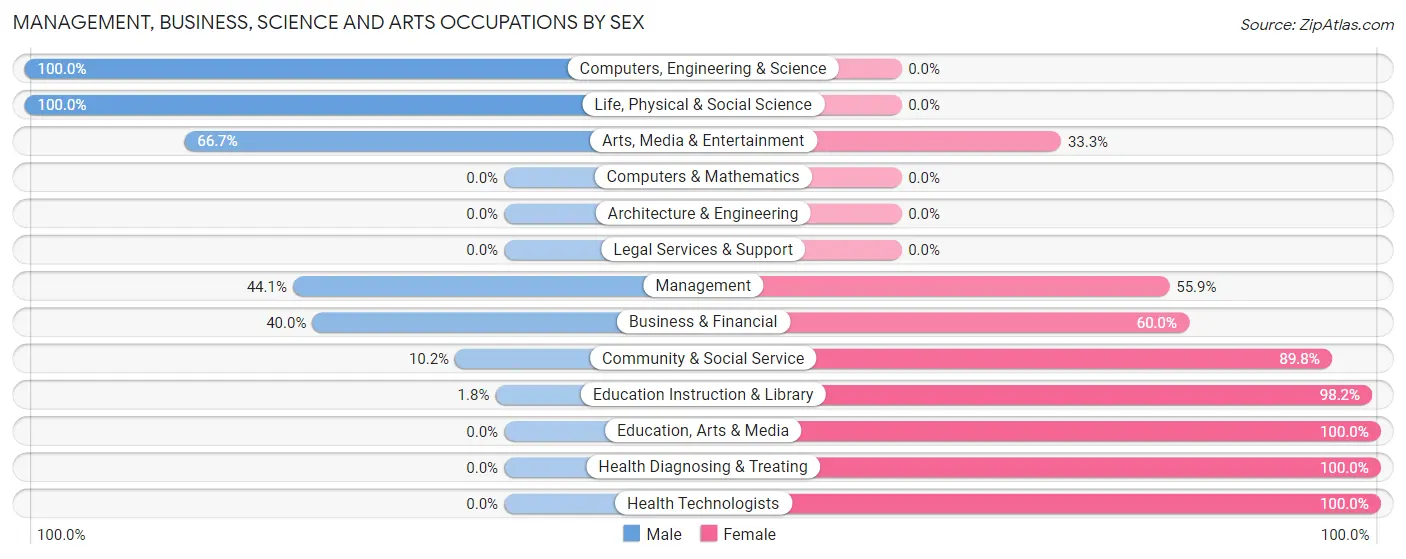
Management, Business, Science and Arts Occupations by Sex
Within the Management, Business, Science and Arts occupations in Lake County, the most male-oriented occupations are Computers, Engineering & Science (100.0%), Life, Physical & Social Science (100.0%), and Arts, Media & Entertainment (66.7%), while the most female-oriented occupations are Education, Arts & Media (100.0%), Health Diagnosing & Treating (100.0%), and Health Technologists (100.0%).
| Occupation | Male | Female |
| Management | 63 (44.1%) | 80 (55.9%) |
| Business & Financial | 4 (40.0%) | 6 (60.0%) |
| Computers, Engineering & Science | 4 (100.0%) | 0 (0.0%) |
| Computers & Mathematics | 0 (0.0%) | 0 (0.0%) |
| Architecture & Engineering | 0 (0.0%) | 0 (0.0%) |
| Life, Physical & Social Science | 4 (100.0%) | 0 (0.0%) |
| Community & Social Service | 9 (10.2%) | 79 (89.8%) |
| Education, Arts & Media | 0 (0.0%) | 21 (100.0%) |
| Legal Services & Support | 0 (0.0%) | 0 (0.0%) |
| Education Instruction & Library | 1 (1.8%) | 54 (98.2%) |
| Arts, Media & Entertainment | 8 (66.7%) | 4 (33.3%) |
| Health Diagnosing & Treating | 0 (0.0%) | 138 (100.0%) |
| Health Technologists | 0 (0.0%) | 73 (100.0%) |
| Total (Category) | 80 (20.9%) | 303 (79.1%) |
| Total (Overall) | 832 (48.6%) | 880 (51.4%) |
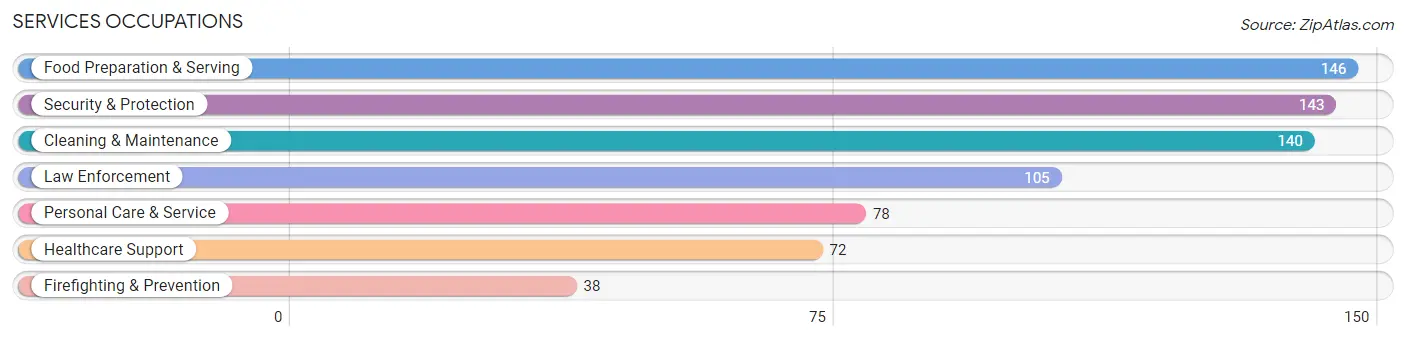
Services Occupations
The most common Services occupations in Lake County are Food Preparation & Serving (146 | 8.5%), Security & Protection (143 | 8.4%), Cleaning & Maintenance (140 | 8.2%), Law Enforcement (105 | 6.1%), and Personal Care & Service (78 | 4.6%).
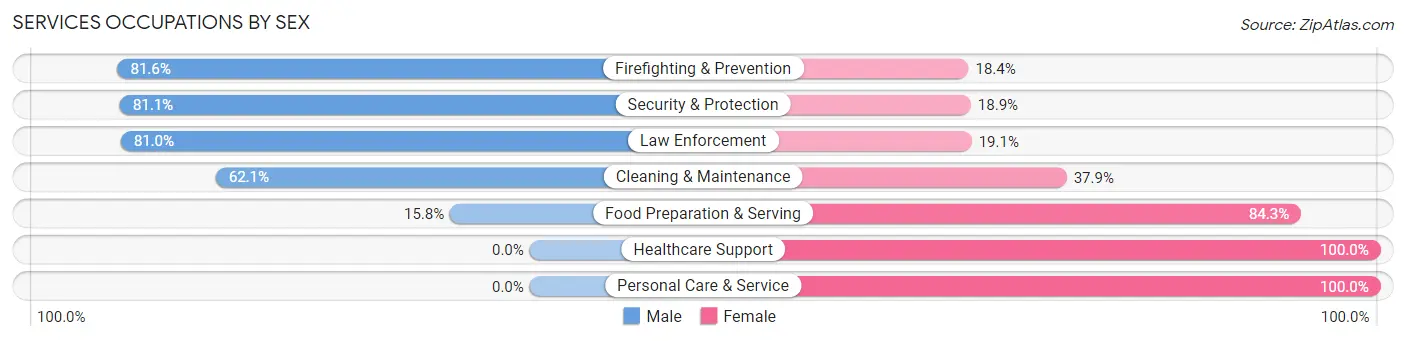
Services Occupations by Sex
Within the Services occupations in Lake County, the most male-oriented occupations are Firefighting & Prevention (81.6%), Security & Protection (81.1%), and Law Enforcement (80.9%), while the most female-oriented occupations are Healthcare Support (100.0%), Personal Care & Service (100.0%), and Food Preparation & Serving (84.3%).
| Occupation | Male | Female |
| Healthcare Support | 0 (0.0%) | 72 (100.0%) |
| Security & Protection | 116 (81.1%) | 27 (18.9%) |
| Firefighting & Prevention | 31 (81.6%) | 7 (18.4%) |
| Law Enforcement | 85 (80.9%) | 20 (19.1%) |
| Food Preparation & Serving | 23 (15.8%) | 123 (84.3%) |
| Cleaning & Maintenance | 87 (62.1%) | 53 (37.9%) |
| Personal Care & Service | 0 (0.0%) | 78 (100.0%) |
| Total (Category) | 226 (39.0%) | 353 (61.0%) |
| Total (Overall) | 832 (48.6%) | 880 (51.4%) |
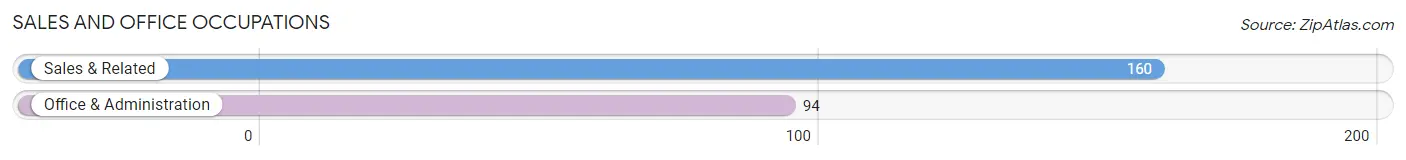
Sales and Office Occupations
The most common Sales and Office occupations in Lake County are Sales & Related (160 | 9.3%), and Office & Administration (94 | 5.5%).
Sales and Office Occupations by Sex
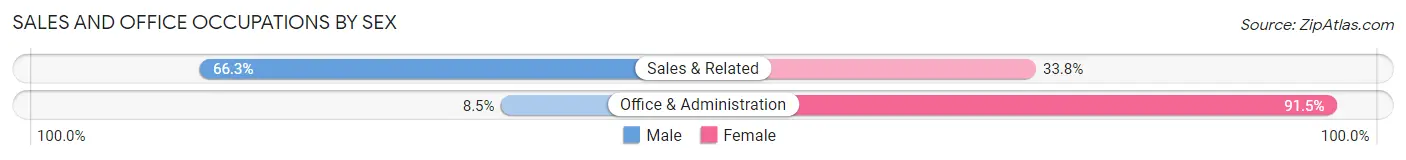
| Occupation | Male | Female |
| Sales & Related | 106 (66.2%) | 54 (33.8%) |
| Office & Administration | 8 (8.5%) | 86 (91.5%) |
| Total (Category) | 114 (44.9%) | 140 (55.1%) |
| Total (Overall) | 832 (48.6%) | 880 (51.4%) |
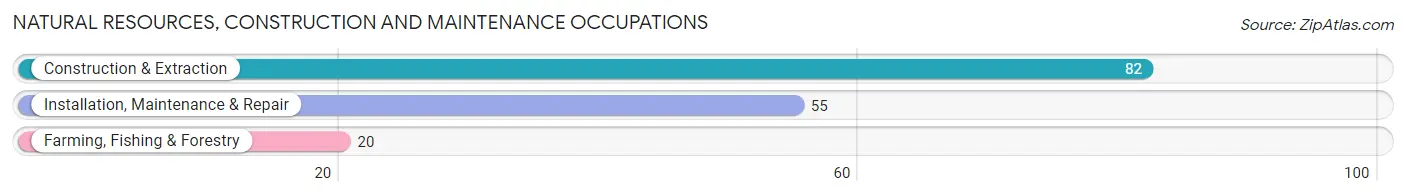
Natural Resources, Construction and Maintenance Occupations
The most common Natural Resources, Construction and Maintenance occupations in Lake County are Construction & Extraction (82 | 4.8%), Installation, Maintenance & Repair (55 | 3.2%), and Farming, Fishing & Forestry (20 | 1.2%).
Natural Resources, Construction and Maintenance Occupations by Sex
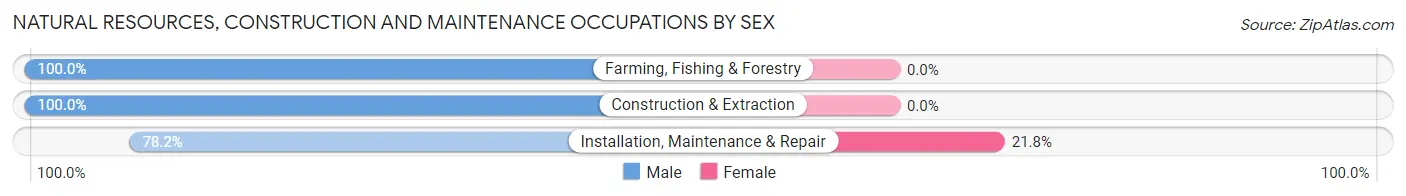
| Occupation | Male | Female |
| Farming, Fishing & Forestry | 20 (100.0%) | 0 (0.0%) |
| Construction & Extraction | 82 (100.0%) | 0 (0.0%) |
| Installation, Maintenance & Repair | 43 (78.2%) | 12 (21.8%) |
| Total (Category) | 145 (92.4%) | 12 (7.6%) |
| Total (Overall) | 832 (48.6%) | 880 (51.4%) |
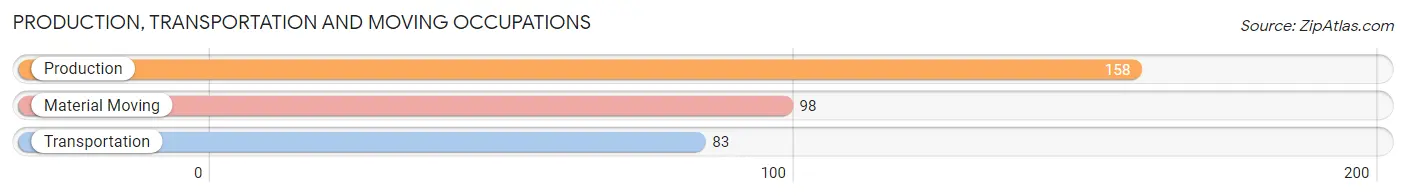
Production, Transportation and Moving Occupations
The most common Production, Transportation and Moving occupations in Lake County are Production (158 | 9.2%), Material Moving (98 | 5.7%), and Transportation (83 | 4.9%).
Production, Transportation and Moving Occupations by Sex
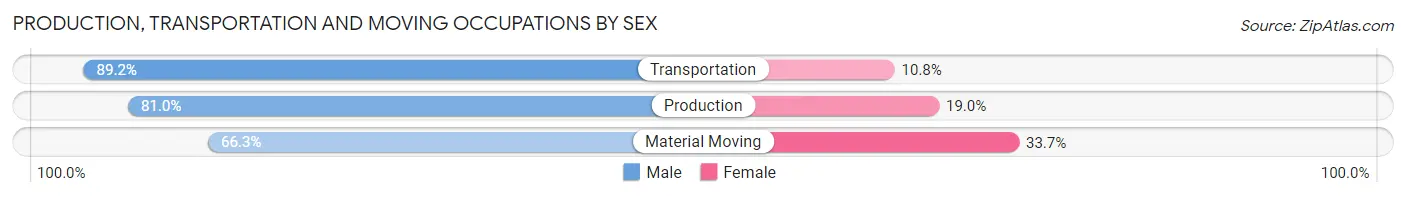
| Occupation | Male | Female |
| Production | 128 (81.0%) | 30 (19.0%) |
| Transportation | 74 (89.2%) | 9 (10.8%) |
| Material Moving | 65 (66.3%) | 33 (33.7%) |
| Total (Category) | 267 (78.8%) | 72 (21.2%) |
| Total (Overall) | 832 (48.6%) | 880 (51.4%) |
Employment Industries by Sex in Lake County
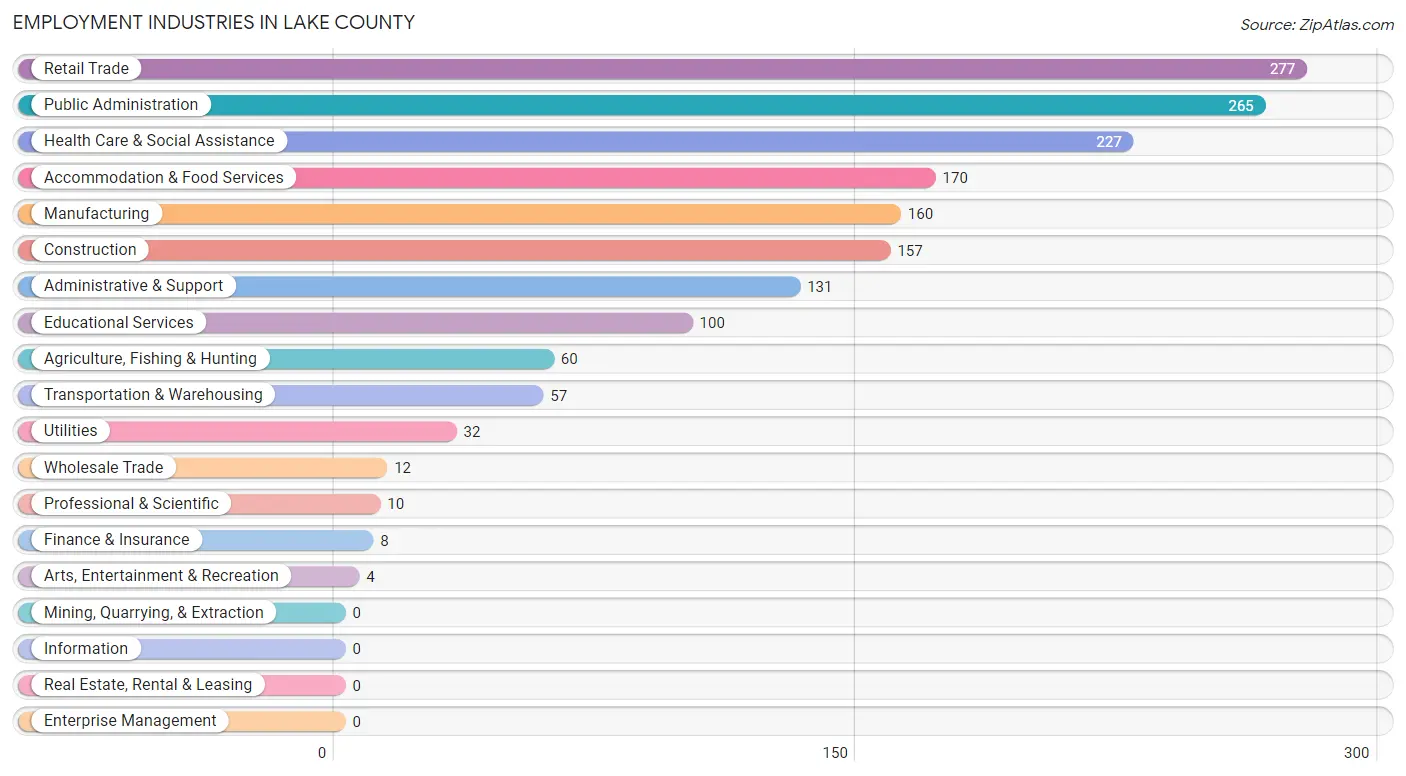
Employment Industries in Lake County
The major employment industries in Lake County include Retail Trade (277 | 16.2%), Public Administration (265 | 15.5%), Health Care & Social Assistance (227 | 13.3%), Accommodation & Food Services (170 | 9.9%), and Manufacturing (160 | 9.3%).
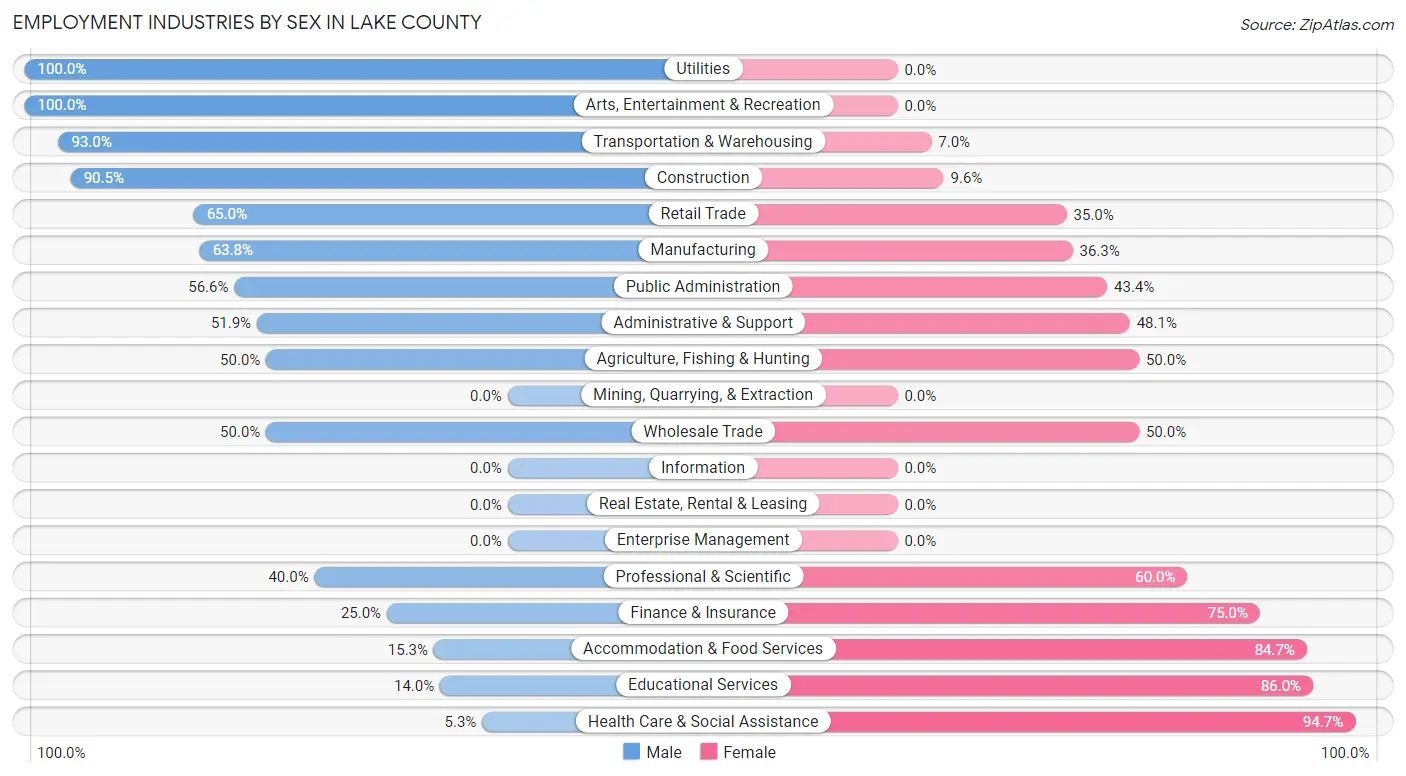
Employment Industries by Sex in Lake County
The Lake County industries that see more men than women are Utilities (100.0%), Arts, Entertainment & Recreation (100.0%), and Transportation & Warehousing (93.0%), whereas the industries that tend to have a higher number of women are Health Care & Social Assistance (94.7%), Educational Services (86.0%), and Accommodation & Food Services (84.7%).
| Industry | Male | Female |
| Agriculture, Fishing & Hunting | 30 (50.0%) | 30 (50.0%) |
| Mining, Quarrying, & Extraction | 0 (0.0%) | 0 (0.0%) |
| Construction | 142 (90.4%) | 15 (9.6%) |
| Manufacturing | 102 (63.7%) | 58 (36.2%) |
| Wholesale Trade | 6 (50.0%) | 6 (50.0%) |
| Retail Trade | 180 (65.0%) | 97 (35.0%) |
| Transportation & Warehousing | 53 (93.0%) | 4 (7.0%) |
| Utilities | 32 (100.0%) | 0 (0.0%) |
| Information | 0 (0.0%) | 0 (0.0%) |
| Finance & Insurance | 2 (25.0%) | 6 (75.0%) |
| Real Estate, Rental & Leasing | 0 (0.0%) | 0 (0.0%) |
| Professional & Scientific | 4 (40.0%) | 6 (60.0%) |
| Enterprise Management | 0 (0.0%) | 0 (0.0%) |
| Administrative & Support | 68 (51.9%) | 63 (48.1%) |
| Educational Services | 14 (14.0%) | 86 (86.0%) |
| Health Care & Social Assistance | 12 (5.3%) | 215 (94.7%) |
| Arts, Entertainment & Recreation | 4 (100.0%) | 0 (0.0%) |
| Accommodation & Food Services | 26 (15.3%) | 144 (84.7%) |
| Public Administration | 150 (56.6%) | 115 (43.4%) |
| Total | 832 (48.6%) | 880 (51.4%) |
Education in Lake County
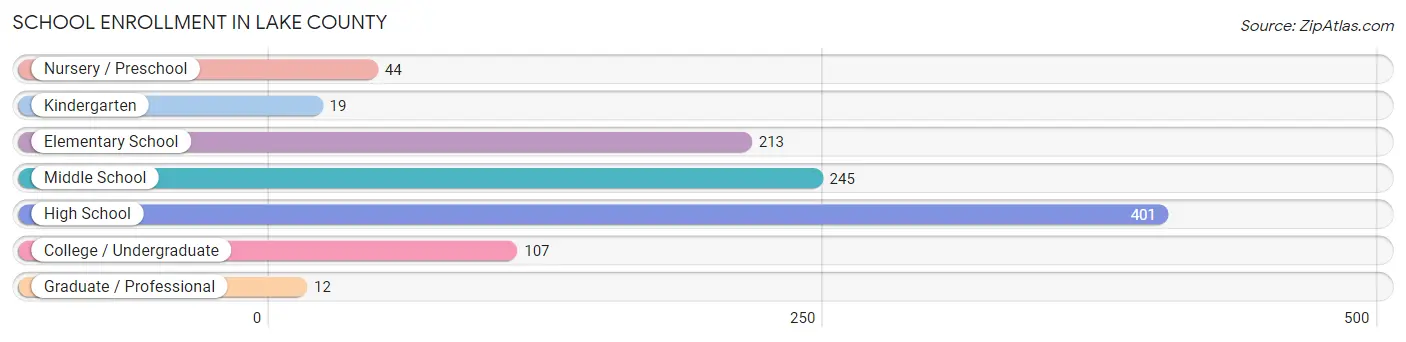
School Enrollment in Lake County
The most common levels of schooling among the 1,041 students in Lake County are high school (401 | 38.5%), middle school (245 | 23.5%), and elementary school (213 | 20.5%).
| School Level | # Students | % Students |
| Nursery / Preschool | 44 | 4.2% |
| Kindergarten | 19 | 1.8% |
| Elementary School | 213 | 20.5% |
| Middle School | 245 | 23.5% |
| High School | 401 | 38.5% |
| College / Undergraduate | 107 | 10.3% |
| Graduate / Professional | 12 | 1.1% |
| Total | 1,041 | 100.0% |
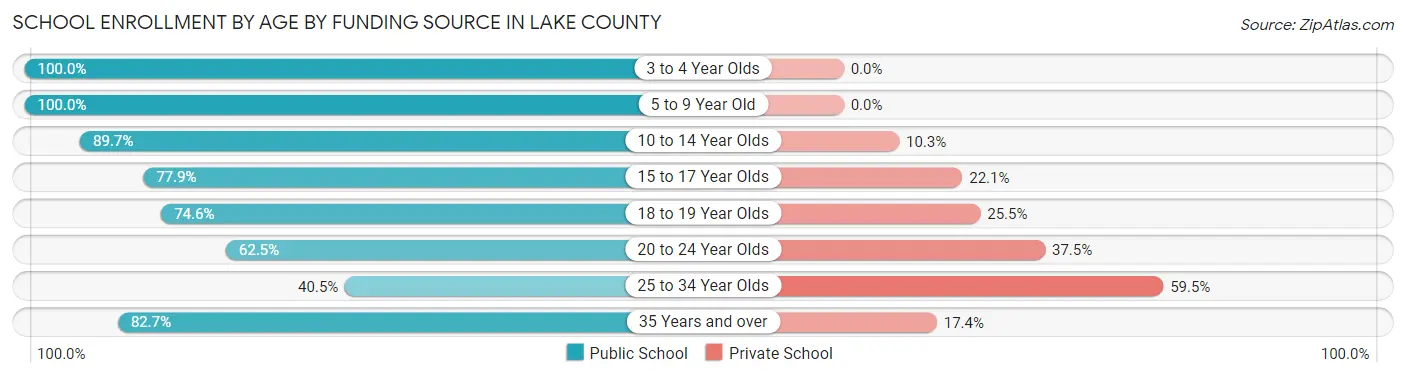
School Enrollment by Age by Funding Source in Lake County
Out of a total of 1,041 students who are enrolled in schools in Lake County, 174 (16.7%) attend a private institution, while the remaining 867 (83.3%) are enrolled in public schools. The age group of 25 to 34 year olds has the highest likelihood of being enrolled in private schools, with 50 (59.5% in the age bracket) enrolled. Conversely, the age group of 3 to 4 year olds has the lowest likelihood of being enrolled in a private school, with 37 (100.0% in the age bracket) attending a public institution.
| Age Bracket | Public School | Private School |
| 3 to 4 Year Olds | 37 (100.0%) | 0 (0.0%) |
| 5 to 9 Year Old | 220 (100.0%) | 0 (0.0%) |
| 10 to 14 Year Olds | 278 (89.7%) | 32 (10.3%) |
| 15 to 17 Year Olds | 141 (77.9%) | 40 (22.1%) |
| 18 to 19 Year Olds | 41 (74.6%) | 14 (25.5%) |
| 20 to 24 Year Olds | 35 (62.5%) | 21 (37.5%) |
| 25 to 34 Year Olds | 34 (40.5%) | 50 (59.5%) |
| 35 Years and over | 81 (82.7%) | 17 (17.3%) |
| Total | 867 (83.3%) | 174 (16.7%) |
Educational Attainment by Field of Study in Lake County
Education (146 | 25.0%), science & technology (96 | 16.4%), bio, nature & agricultural (78 | 13.3%), arts & humanities (66 | 11.3%), and business (51 | 8.7%) are the most common fields of study among 585 individuals in Lake County who have obtained a bachelor's degree or higher.

| Field of Study | # Graduates | % Graduates |
| Computers & Mathematics | 9 | 1.5% |
| Bio, Nature & Agricultural | 78 | 13.3% |
| Physical & Health Sciences | 14 | 2.4% |
| Psychology | 37 | 6.3% |
| Social Sciences | 14 | 2.4% |
| Engineering | 15 | 2.6% |
| Multidisciplinary Studies | 22 | 3.8% |
| Science & Technology | 96 | 16.4% |
| Business | 51 | 8.7% |
| Education | 146 | 25.0% |
| Literature & Languages | 6 | 1.0% |
| Liberal Arts & History | 31 | 5.3% |
| Visual & Performing Arts | 0 | 0.0% |
| Communications | 0 | 0.0% |
| Arts & Humanities | 66 | 11.3% |
| Total | 585 | 100.0% |
Transportation & Commute in Lake County
Vehicle Availability by Sex in Lake County
The most prevalent vehicle ownership categories in Lake County are males with 2 vehicles (296, accounting for 35.4%) and females with 2 vehicles (308, making up 33.9%).
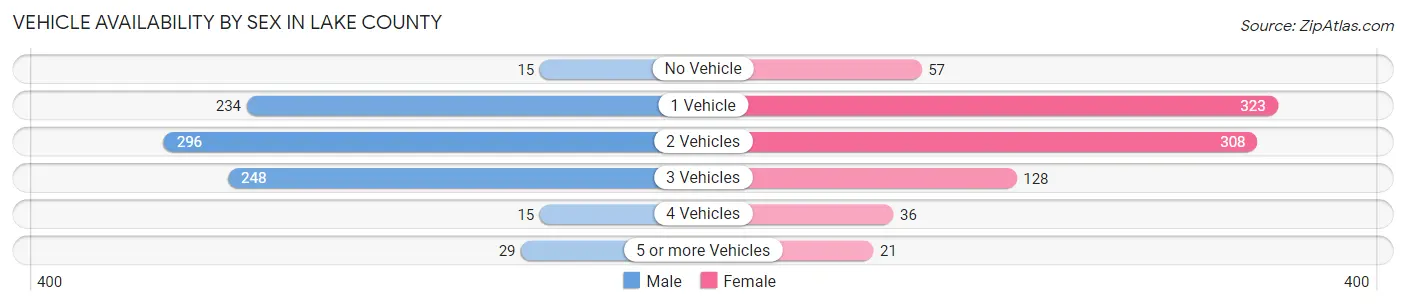
| Vehicles Available | Male | Female |
| No Vehicle | 15 (1.8%) | 57 (6.5%) |
| 1 Vehicle | 234 (28.0%) | 323 (37.0%) |
| 2 Vehicles | 296 (35.4%) | 308 (35.3%) |
| 3 Vehicles | 248 (29.6%) | 128 (14.7%) |
| 4 Vehicles | 15 (1.8%) | 36 (4.1%) |
| 5 or more Vehicles | 29 (3.5%) | 21 (2.4%) |
| Total | 837 (100.0%) | 873 (100.0%) |
Commute Time in Lake County
The most frequently occuring commute durations in Lake County are 10 to 14 minutes (312 commuters, 18.5%), 5 to 9 minutes (310 commuters, 18.4%), and 30 to 34 minutes (270 commuters, 16.0%).
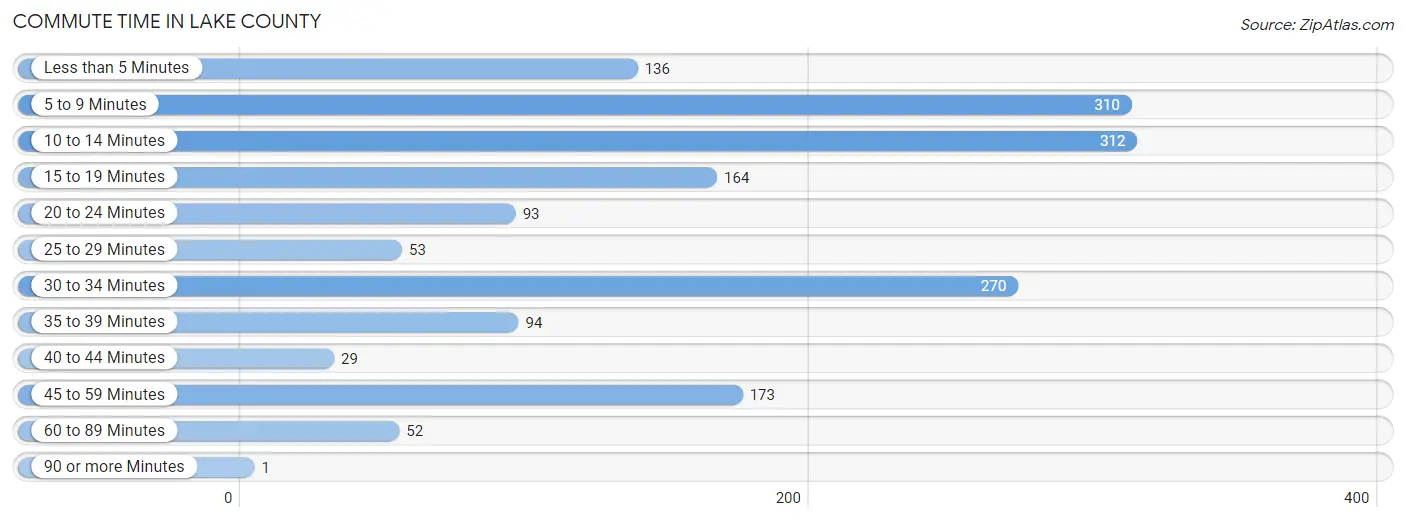
| Commute Time | # Commuters | % Commuters |
| Less than 5 Minutes | 136 | 8.1% |
| 5 to 9 Minutes | 310 | 18.4% |
| 10 to 14 Minutes | 312 | 18.5% |
| 15 to 19 Minutes | 164 | 9.7% |
| 20 to 24 Minutes | 93 | 5.5% |
| 25 to 29 Minutes | 53 | 3.1% |
| 30 to 34 Minutes | 270 | 16.0% |
| 35 to 39 Minutes | 94 | 5.6% |
| 40 to 44 Minutes | 29 | 1.7% |
| 45 to 59 Minutes | 173 | 10.2% |
| 60 to 89 Minutes | 52 | 3.1% |
| 90 or more Minutes | 1 | 0.1% |
Commute Time by Sex in Lake County
The most common commute times in Lake County are 5 to 9 minutes (188 commuters, 22.8%) for males and 10 to 14 minutes (199 commuters, 23.1%) for females.
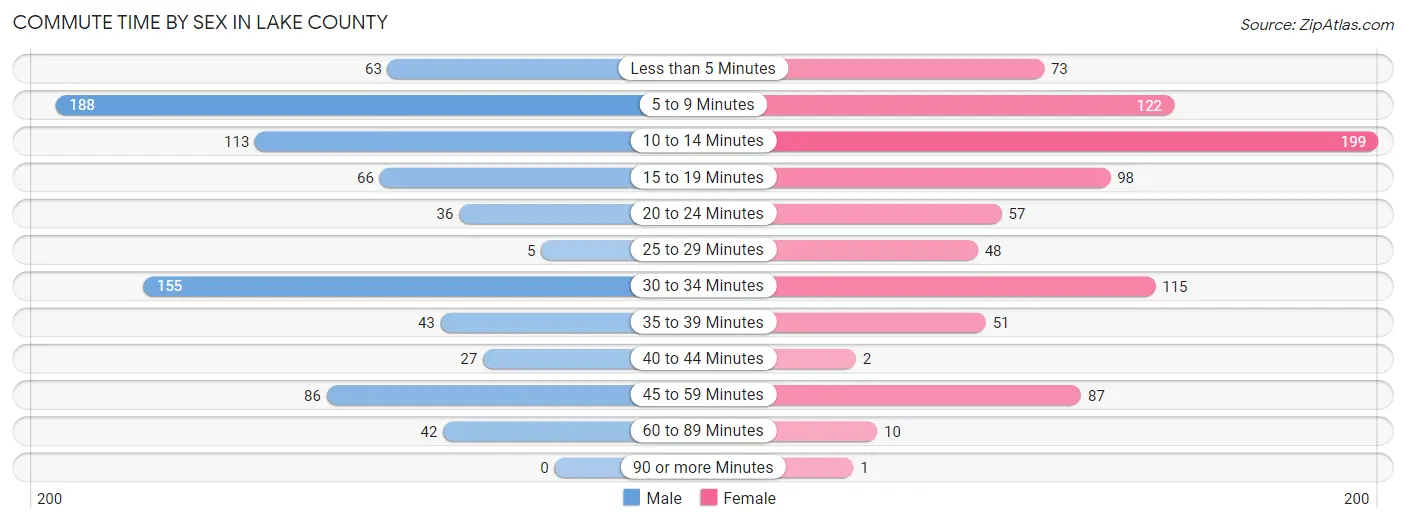
| Commute Time | Male | Female |
| Less than 5 Minutes | 63 (7.6%) | 73 (8.5%) |
| 5 to 9 Minutes | 188 (22.8%) | 122 (14.1%) |
| 10 to 14 Minutes | 113 (13.7%) | 199 (23.1%) |
| 15 to 19 Minutes | 66 (8.0%) | 98 (11.4%) |
| 20 to 24 Minutes | 36 (4.4%) | 57 (6.6%) |
| 25 to 29 Minutes | 5 (0.6%) | 48 (5.6%) |
| 30 to 34 Minutes | 155 (18.8%) | 115 (13.3%) |
| 35 to 39 Minutes | 43 (5.2%) | 51 (5.9%) |
| 40 to 44 Minutes | 27 (3.3%) | 2 (0.2%) |
| 45 to 59 Minutes | 86 (10.4%) | 87 (10.1%) |
| 60 to 89 Minutes | 42 (5.1%) | 10 (1.2%) |
| 90 or more Minutes | 0 (0.0%) | 1 (0.1%) |
Time of Departure to Work by Sex in Lake County
The most frequent times of departure to work in Lake County are 12:00 AM to 4:59 AM (140, 17.0%) for males and 7:00 AM to 7:29 AM (141, 16.3%) for females.
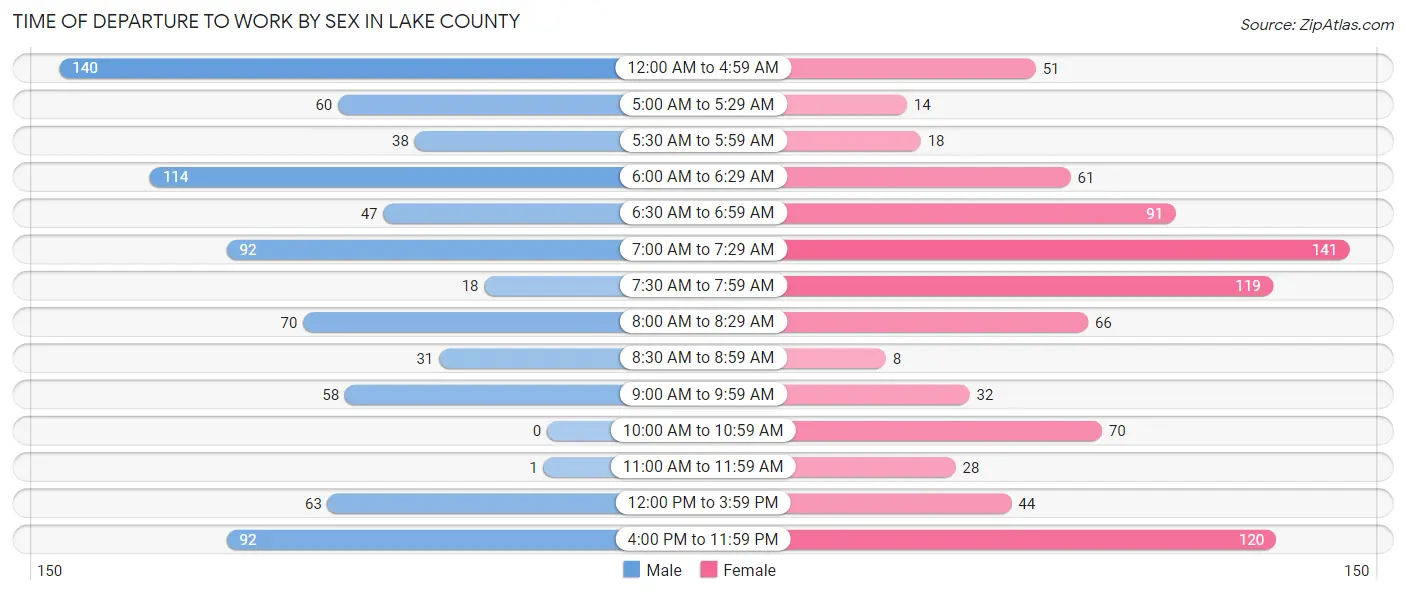
| Time of Departure | Male | Female |
| 12:00 AM to 4:59 AM | 140 (17.0%) | 51 (5.9%) |
| 5:00 AM to 5:29 AM | 60 (7.3%) | 14 (1.6%) |
| 5:30 AM to 5:59 AM | 38 (4.6%) | 18 (2.1%) |
| 6:00 AM to 6:29 AM | 114 (13.8%) | 61 (7.1%) |
| 6:30 AM to 6:59 AM | 47 (5.7%) | 91 (10.5%) |
| 7:00 AM to 7:29 AM | 92 (11.2%) | 141 (16.3%) |
| 7:30 AM to 7:59 AM | 18 (2.2%) | 119 (13.8%) |
| 8:00 AM to 8:29 AM | 70 (8.5%) | 66 (7.6%) |
| 8:30 AM to 8:59 AM | 31 (3.8%) | 8 (0.9%) |
| 9:00 AM to 9:59 AM | 58 (7.0%) | 32 (3.7%) |
| 10:00 AM to 10:59 AM | 0 (0.0%) | 70 (8.1%) |
| 11:00 AM to 11:59 AM | 1 (0.1%) | 28 (3.2%) |
| 12:00 PM to 3:59 PM | 63 (7.6%) | 44 (5.1%) |
| 4:00 PM to 11:59 PM | 92 (11.2%) | 120 (13.9%) |
| Total | 824 (100.0%) | 863 (100.0%) |
Housing Occupancy in Lake County
Occupancy by Ownership in Lake County
Of the total 2,013 dwellings in Lake County, owner-occupied units account for 935 (46.5%), while renter-occupied units make up 1,078 (53.5%).
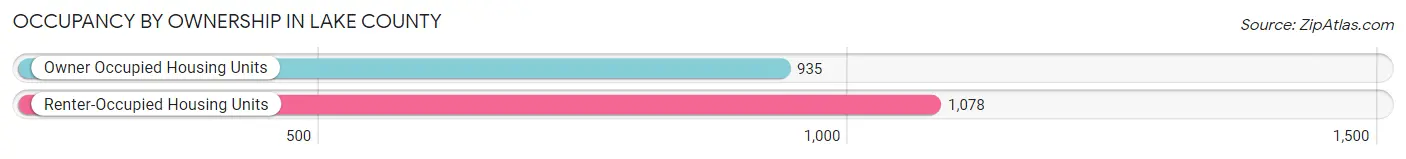
| Occupancy | # Housing Units | % Housing Units |
| Owner Occupied Housing Units | 935 | 46.5% |
| Renter-Occupied Housing Units | 1,078 | 53.5% |
| Total Occupied Housing Units | 2,013 | 100.0% |
Occupancy by Household Size in Lake County
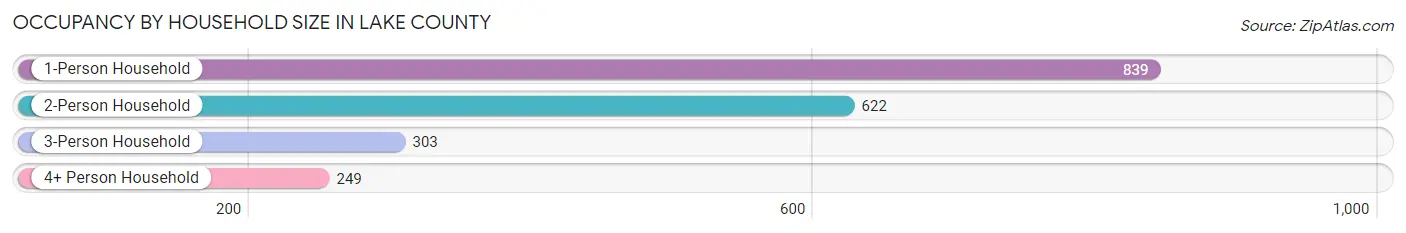
| Household Size | # Housing Units | % Housing Units |
| 1-Person Household | 839 | 41.7% |
| 2-Person Household | 622 | 30.9% |
| 3-Person Household | 303 | 15.0% |
| 4+ Person Household | 249 | 12.4% |
| Total Housing Units | 2,013 | 100.0% |
Occupancy by Ownership by Household Size in Lake County
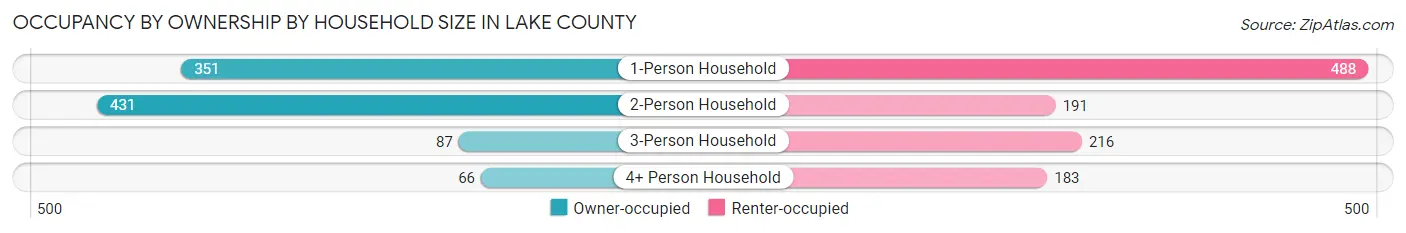
| Household Size | Owner-occupied | Renter-occupied |
| 1-Person Household | 351 (41.8%) | 488 (58.2%) |
| 2-Person Household | 431 (69.3%) | 191 (30.7%) |
| 3-Person Household | 87 (28.7%) | 216 (71.3%) |
| 4+ Person Household | 66 (26.5%) | 183 (73.5%) |
| Total Housing Units | 935 (46.5%) | 1,078 (53.5%) |
Occupancy by Educational Attainment in Lake County
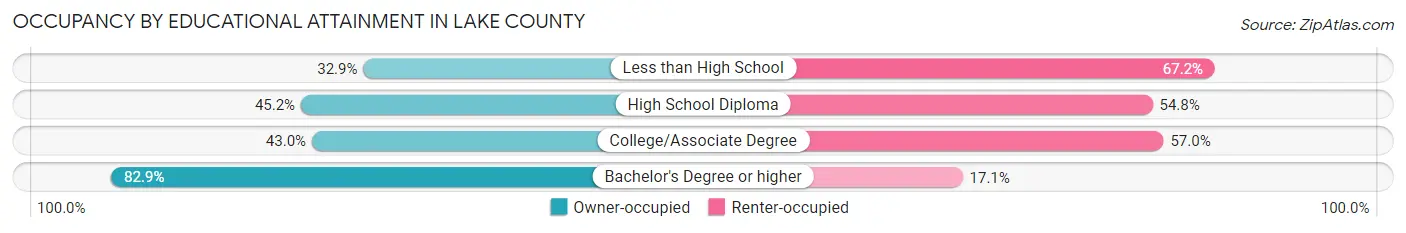
| Household Size | Owner-occupied | Renter-occupied |
| Less than High School | 182 (32.9%) | 372 (67.1%) |
| High School Diploma | 283 (45.2%) | 343 (54.8%) |
| College/Associate Degree | 238 (43.0%) | 315 (57.0%) |
| Bachelor's Degree or higher | 232 (82.9%) | 48 (17.1%) |
Occupancy by Age of Householder in Lake County
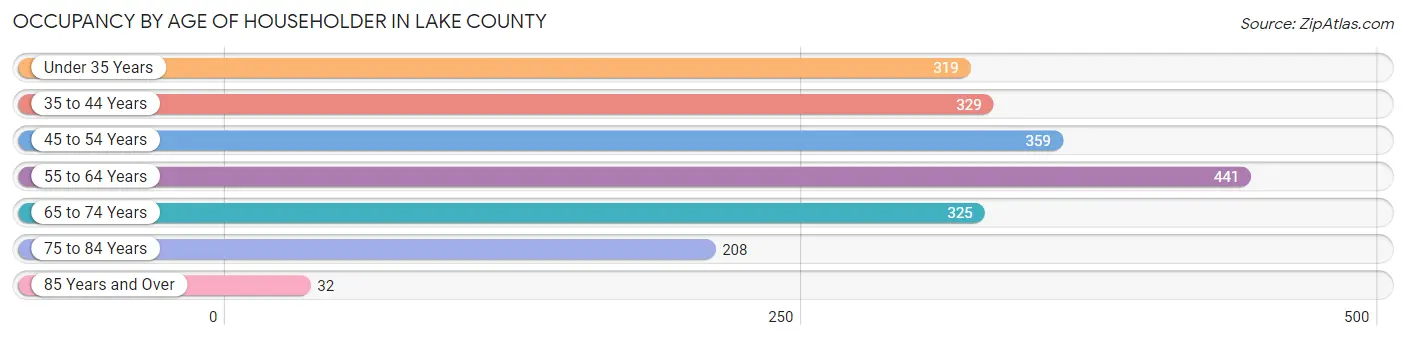
| Age Bracket | # Households | % Households |
| Under 35 Years | 319 | 15.9% |
| 35 to 44 Years | 329 | 16.3% |
| 45 to 54 Years | 359 | 17.8% |
| 55 to 64 Years | 441 | 21.9% |
| 65 to 74 Years | 325 | 16.2% |
| 75 to 84 Years | 208 | 10.3% |
| 85 Years and Over | 32 | 1.6% |
| Total | 2,013 | 100.0% |
Housing Finances in Lake County
Median Income by Occupancy in Lake County
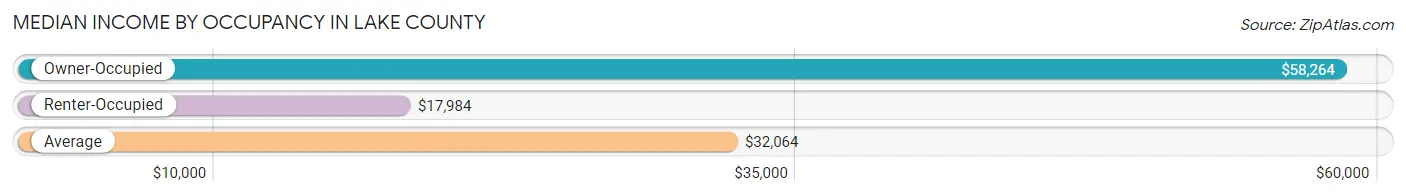
| Occupancy Type | # Households | Median Income |
| Owner-Occupied | 935 (46.5%) | $58,264 |
| Renter-Occupied | 1,078 (53.5%) | $17,984 |
| Average | 2,013 (100.0%) | $32,064 |
Occupancy by Householder Income Bracket in Lake County
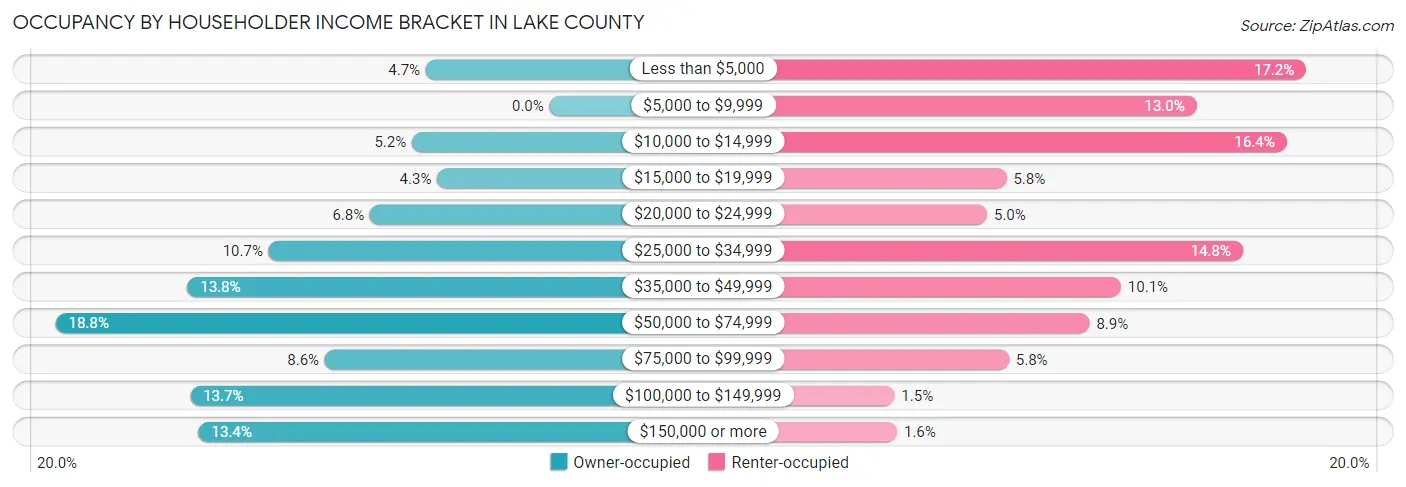
| Income Bracket | Owner-occupied | Renter-occupied |
| Less than $5,000 | 44 (4.7%) | 185 (17.2%) |
| $5,000 to $9,999 | 0 (0.0%) | 140 (13.0%) |
| $10,000 to $14,999 | 49 (5.2%) | 177 (16.4%) |
| $15,000 to $19,999 | 40 (4.3%) | 62 (5.8%) |
| $20,000 to $24,999 | 64 (6.8%) | 54 (5.0%) |
| $25,000 to $34,999 | 100 (10.7%) | 159 (14.7%) |
| $35,000 to $49,999 | 129 (13.8%) | 109 (10.1%) |
| $50,000 to $74,999 | 176 (18.8%) | 96 (8.9%) |
| $75,000 to $99,999 | 80 (8.6%) | 63 (5.8%) |
| $100,000 to $149,999 | 128 (13.7%) | 16 (1.5%) |
| $150,000 or more | 125 (13.4%) | 17 (1.6%) |
| Total | 935 (100.0%) | 1,078 (100.0%) |
Monthly Housing Cost Tiers in Lake County
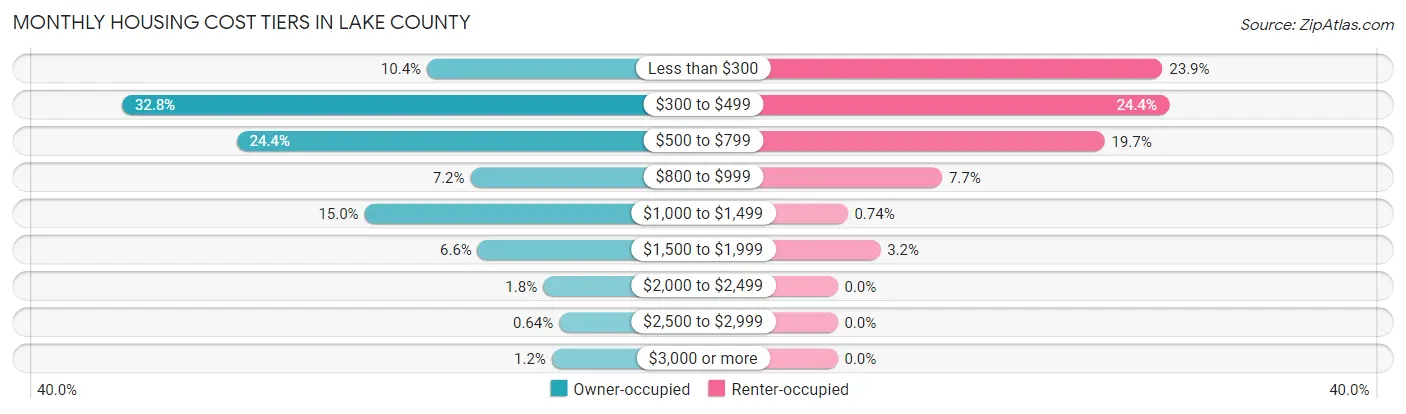
| Monthly Cost | Owner-occupied | Renter-occupied |
| Less than $300 | 97 (10.4%) | 258 (23.9%) |
| $300 to $499 | 307 (32.8%) | 263 (24.4%) |
| $500 to $799 | 228 (24.4%) | 212 (19.7%) |
| $800 to $999 | 67 (7.2%) | 83 (7.7%) |
| $1,000 to $1,499 | 140 (15.0%) | 8 (0.7%) |
| $1,500 to $1,999 | 62 (6.6%) | 34 (3.2%) |
| $2,000 to $2,499 | 17 (1.8%) | 0 (0.0%) |
| $2,500 to $2,999 | 6 (0.6%) | 0 (0.0%) |
| $3,000 or more | 11 (1.2%) | 0 (0.0%) |
| Total | 935 (100.0%) | 1,078 (100.0%) |
Physical Housing Characteristics in Lake County
Housing Structures in Lake County
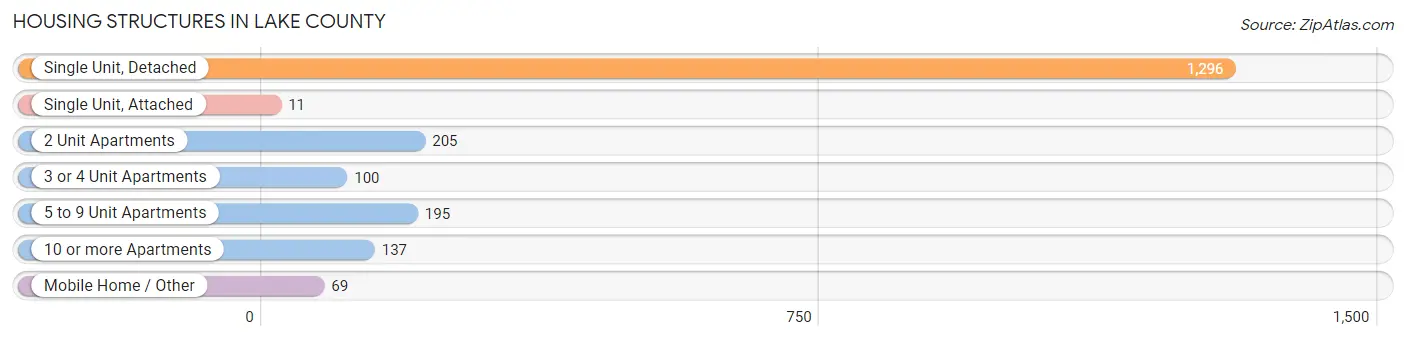
| Structure Type | # Housing Units | % Housing Units |
| Single Unit, Detached | 1,296 | 64.4% |
| Single Unit, Attached | 11 | 0.5% |
| 2 Unit Apartments | 205 | 10.2% |
| 3 or 4 Unit Apartments | 100 | 5.0% |
| 5 to 9 Unit Apartments | 195 | 9.7% |
| 10 or more Apartments | 137 | 6.8% |
| Mobile Home / Other | 69 | 3.4% |
| Total | 2,013 | 100.0% |
Housing Structures by Occupancy in Lake County
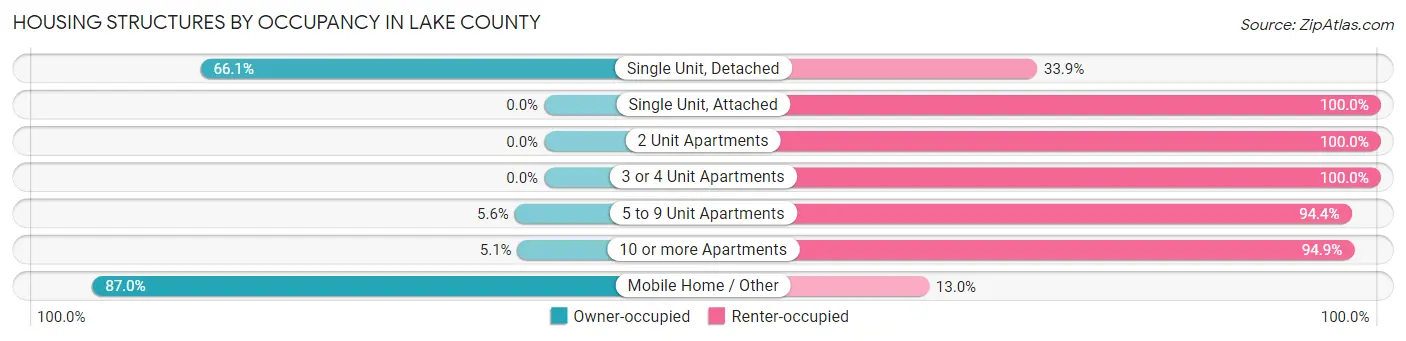
| Structure Type | Owner-occupied | Renter-occupied |
| Single Unit, Detached | 857 (66.1%) | 439 (33.9%) |
| Single Unit, Attached | 0 (0.0%) | 11 (100.0%) |
| 2 Unit Apartments | 0 (0.0%) | 205 (100.0%) |
| 3 or 4 Unit Apartments | 0 (0.0%) | 100 (100.0%) |
| 5 to 9 Unit Apartments | 11 (5.6%) | 184 (94.4%) |
| 10 or more Apartments | 7 (5.1%) | 130 (94.9%) |
| Mobile Home / Other | 60 (87.0%) | 9 (13.0%) |
| Total | 935 (46.5%) | 1,078 (53.5%) |
Housing Structures by Number of Rooms in Lake County
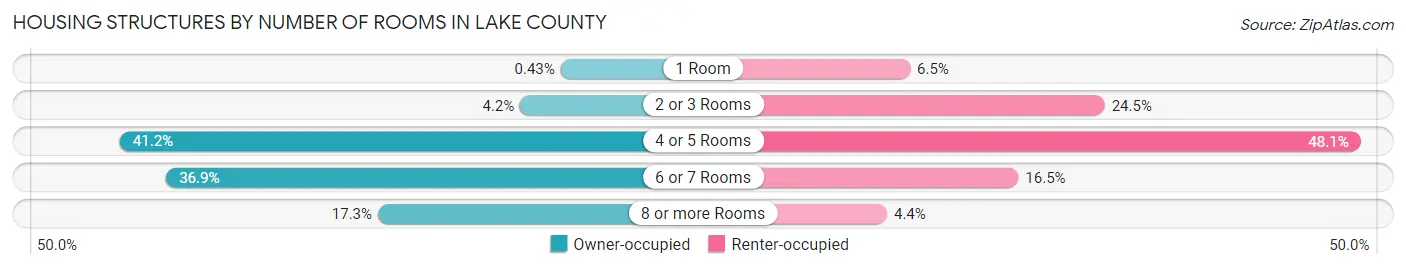
| Number of Rooms | Owner-occupied | Renter-occupied |
| 1 Room | 4 (0.4%) | 70 (6.5%) |
| 2 or 3 Rooms | 39 (4.2%) | 264 (24.5%) |
| 4 or 5 Rooms | 385 (41.2%) | 519 (48.1%) |
| 6 or 7 Rooms | 345 (36.9%) | 178 (16.5%) |
| 8 or more Rooms | 162 (17.3%) | 47 (4.4%) |
| Total | 935 (100.0%) | 1,078 (100.0%) |
Housing Structure by Heating Type in Lake County
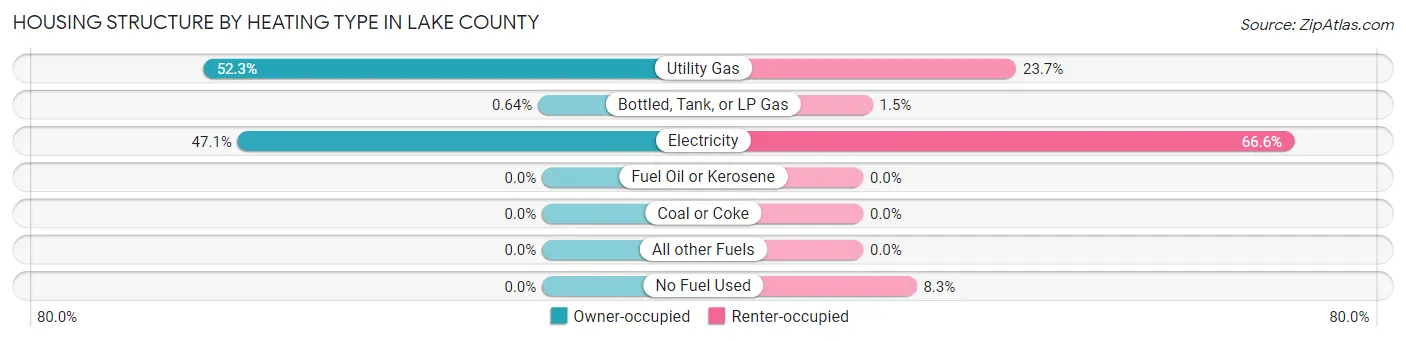
| Heating Type | Owner-occupied | Renter-occupied |
| Utility Gas | 489 (52.3%) | 255 (23.6%) |
| Bottled, Tank, or LP Gas | 6 (0.6%) | 16 (1.5%) |
| Electricity | 440 (47.1%) | 718 (66.6%) |
| Fuel Oil or Kerosene | 0 (0.0%) | 0 (0.0%) |
| Coal or Coke | 0 (0.0%) | 0 (0.0%) |
| All other Fuels | 0 (0.0%) | 0 (0.0%) |
| No Fuel Used | 0 (0.0%) | 89 (8.3%) |
| Total | 935 (100.0%) | 1,078 (100.0%) |
Household Vehicle Usage in Lake County
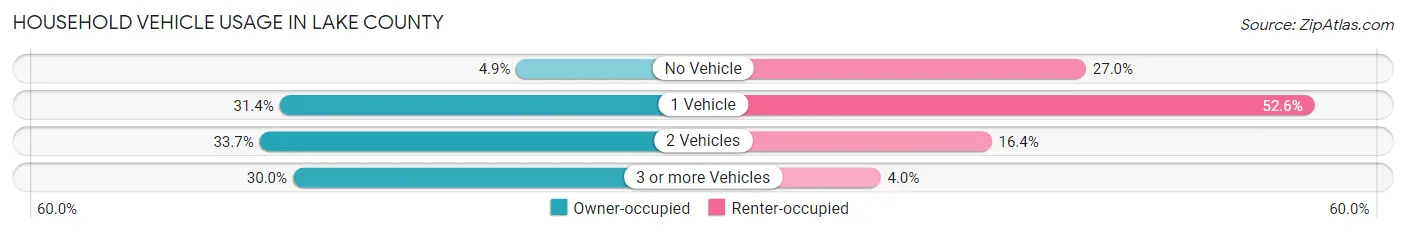
| Vehicles per Household | Owner-occupied | Renter-occupied |
| No Vehicle | 46 (4.9%) | 291 (27.0%) |
| 1 Vehicle | 294 (31.4%) | 567 (52.6%) |
| 2 Vehicles | 315 (33.7%) | 177 (16.4%) |
| 3 or more Vehicles | 280 (29.9%) | 43 (4.0%) |
| Total | 935 (100.0%) | 1,078 (100.0%) |
Real Estate & Mortgages in Lake County
Real Estate and Mortgage Overview in Lake County
| Characteristic | Without Mortgage | With Mortgage |
| Housing Units | 584 | 351 |
| Median Property Value | $125,500 | $110,100 |
| Median Household Income | $46,786 | $18 |
| Monthly Housing Costs | $399 | $11 |
| Real Estate Taxes | $724 | $17 |
Property Value by Mortgage Status in Lake County
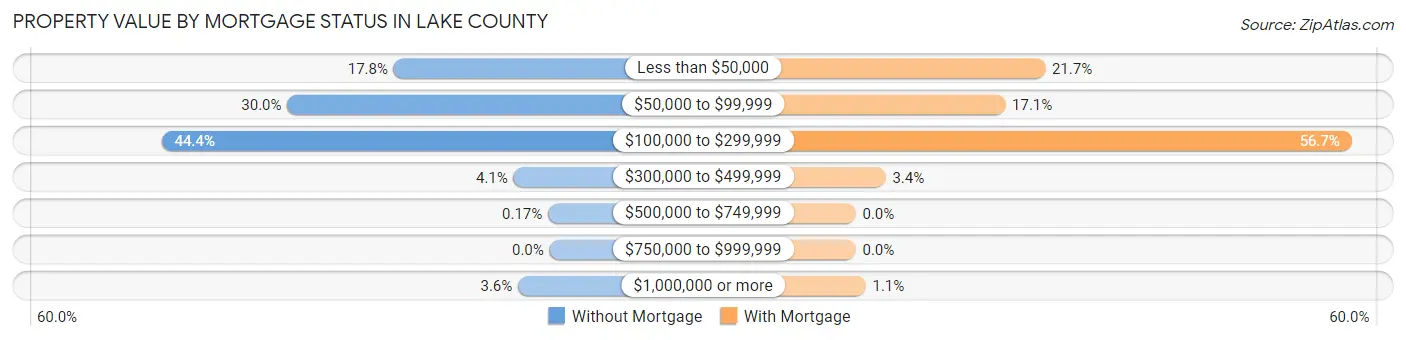
| Property Value | Without Mortgage | With Mortgage |
| Less than $50,000 | 104 (17.8%) | 76 (21.6%) |
| $50,000 to $99,999 | 175 (30.0%) | 60 (17.1%) |
| $100,000 to $299,999 | 259 (44.4%) | 199 (56.7%) |
| $300,000 to $499,999 | 24 (4.1%) | 12 (3.4%) |
| $500,000 to $749,999 | 1 (0.2%) | 0 (0.0%) |
| $750,000 to $999,999 | 0 (0.0%) | 0 (0.0%) |
| $1,000,000 or more | 21 (3.6%) | 4 (1.1%) |
| Total | 584 (100.0%) | 351 (100.0%) |
Household Income by Mortgage Status in Lake County
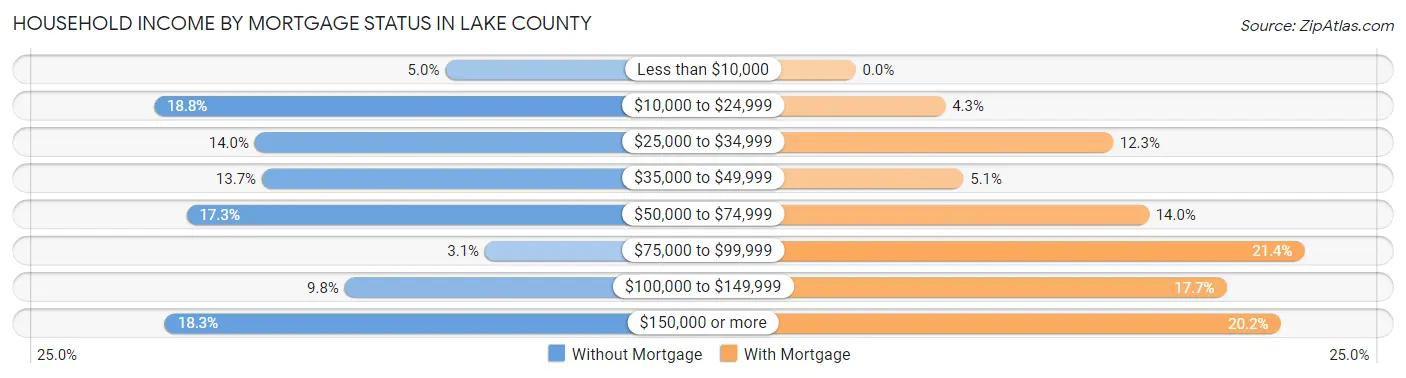
| Household Income | Without Mortgage | With Mortgage |
| Less than $10,000 | 29 (5.0%) | 0 (0.0%) |
| $10,000 to $24,999 | 110 (18.8%) | 15 (4.3%) |
| $25,000 to $34,999 | 82 (14.0%) | 43 (12.2%) |
| $35,000 to $49,999 | 80 (13.7%) | 18 (5.1%) |
| $50,000 to $74,999 | 101 (17.3%) | 49 (14.0%) |
| $75,000 to $99,999 | 18 (3.1%) | 75 (21.4%) |
| $100,000 to $149,999 | 57 (9.8%) | 62 (17.7%) |
| $150,000 or more | 107 (18.3%) | 71 (20.2%) |
| Total | 584 (100.0%) | 351 (100.0%) |
Property Value to Household Income Ratio in Lake County
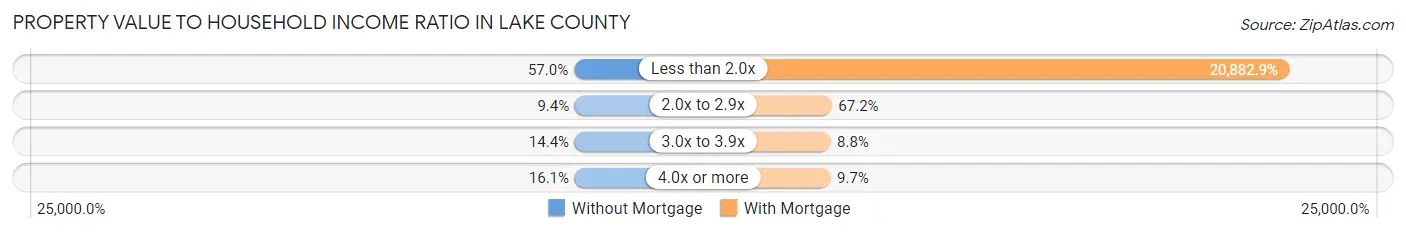
| Value-to-Income Ratio | Without Mortgage | With Mortgage |
| Less than 2.0x | 333 (57.0%) | 73,299 (20,882.9%) |
| 2.0x to 2.9x | 55 (9.4%) | 236 (67.2%) |
| 3.0x to 3.9x | 84 (14.4%) | 31 (8.8%) |
| 4.0x or more | 94 (16.1%) | 34 (9.7%) |
| Total | 584 (100.0%) | 351 (100.0%) |
Real Estate Taxes by Mortgage Status in Lake County
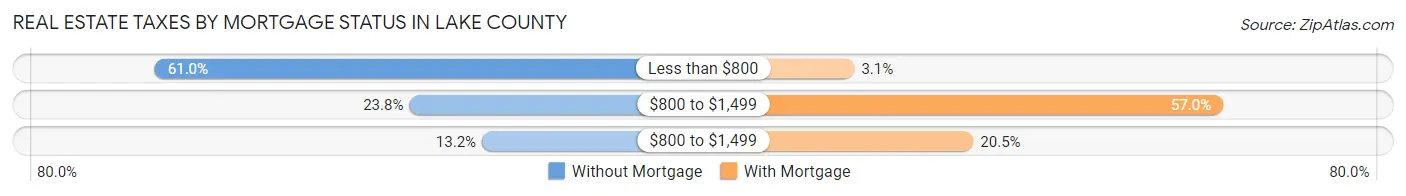
| Property Taxes | Without Mortgage | With Mortgage |
| Less than $800 | 356 (61.0%) | 11 (3.1%) |
| $800 to $1,499 | 139 (23.8%) | 200 (57.0%) |
| $800 to $1,499 | 77 (13.2%) | 72 (20.5%) |
| Total | 584 (100.0%) | 351 (100.0%) |
Health & Disability in Lake County
Health Insurance Coverage by Age in Lake County
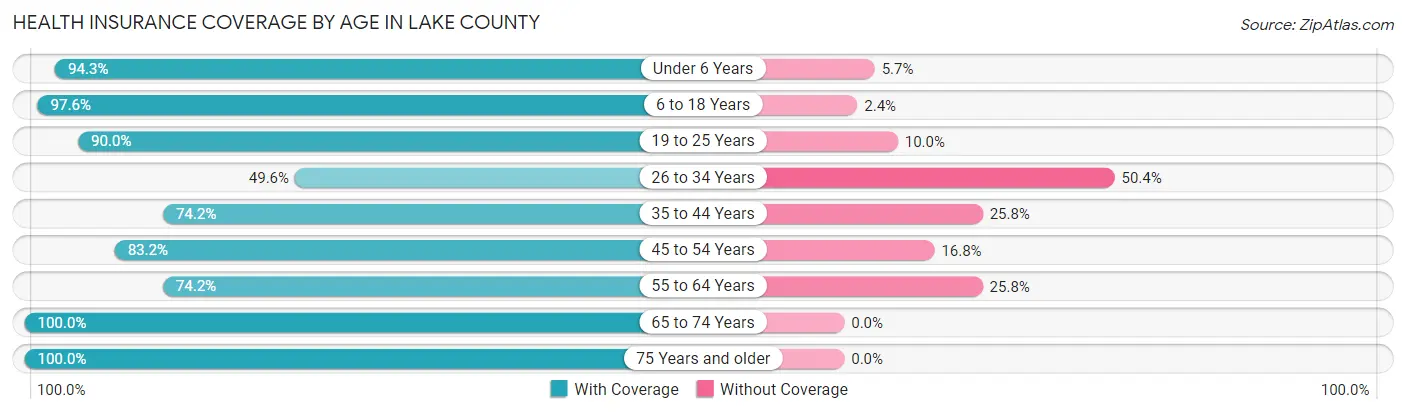
| Age Bracket | With Coverage | Without Coverage |
| Under 6 Years | 249 (94.3%) | 15 (5.7%) |
| 6 to 18 Years | 760 (97.6%) | 19 (2.4%) |
| 19 to 25 Years | 334 (90.0%) | 37 (10.0%) |
| 26 to 34 Years | 246 (49.6%) | 250 (50.4%) |
| 35 to 44 Years | 391 (74.2%) | 136 (25.8%) |
| 45 to 54 Years | 495 (83.2%) | 100 (16.8%) |
| 55 to 64 Years | 535 (74.2%) | 186 (25.8%) |
| 65 to 74 Years | 508 (100.0%) | 0 (0.0%) |
| 75 Years and older | 335 (100.0%) | 0 (0.0%) |
| Total | 3,853 (83.8%) | 743 (16.2%) |
Health Insurance Coverage by Citizenship Status in Lake County
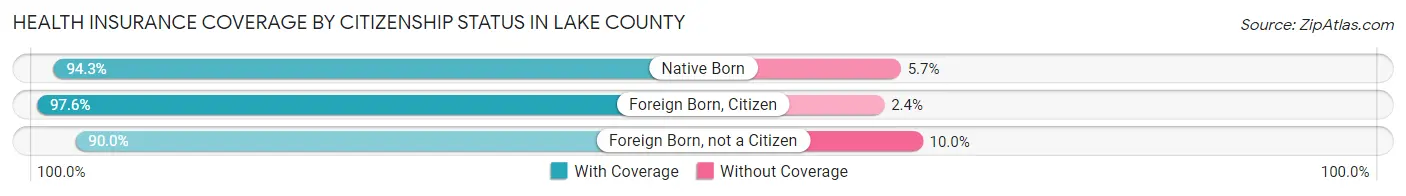
| Citizenship Status | With Coverage | Without Coverage |
| Native Born | 249 (94.3%) | 15 (5.7%) |
| Foreign Born, Citizen | 760 (97.6%) | 19 (2.4%) |
| Foreign Born, not a Citizen | 334 (90.0%) | 37 (10.0%) |
Health Insurance Coverage by Household Income in Lake County
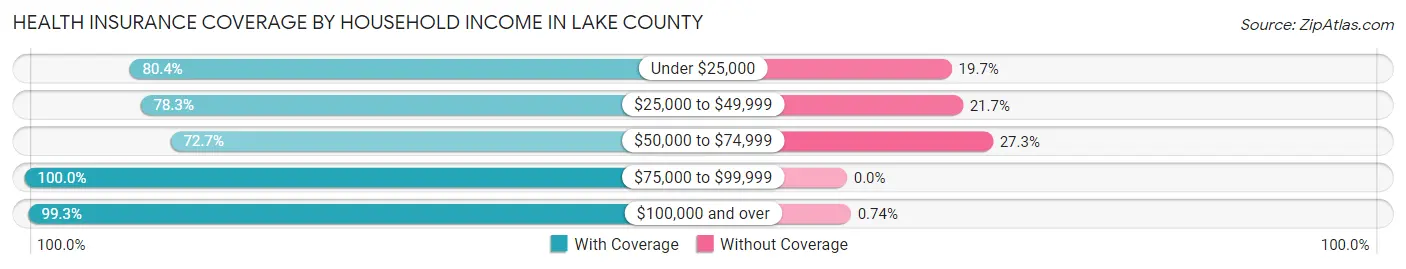
| Household Income | With Coverage | Without Coverage |
| Under $25,000 | 1,112 (80.3%) | 272 (19.7%) |
| $25,000 to $49,999 | 876 (78.3%) | 243 (21.7%) |
| $50,000 to $74,999 | 590 (72.7%) | 222 (27.3%) |
| $75,000 to $99,999 | 473 (100.0%) | 0 (0.0%) |
| $100,000 and over | 802 (99.3%) | 6 (0.7%) |
Public vs Private Health Insurance Coverage by Age in Lake County
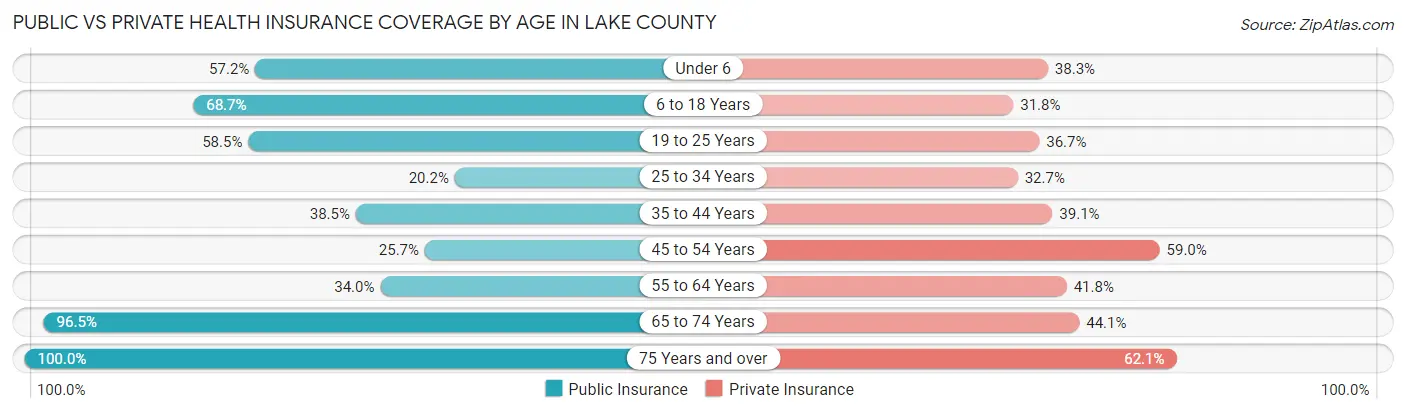
| Age Bracket | Public Insurance | Private Insurance |
| Under 6 | 151 (57.2%) | 101 (38.3%) |
| 6 to 18 Years | 535 (68.7%) | 248 (31.8%) |
| 19 to 25 Years | 217 (58.5%) | 136 (36.7%) |
| 25 to 34 Years | 100 (20.2%) | 162 (32.7%) |
| 35 to 44 Years | 203 (38.5%) | 206 (39.1%) |
| 45 to 54 Years | 153 (25.7%) | 351 (59.0%) |
| 55 to 64 Years | 245 (34.0%) | 301 (41.7%) |
| 65 to 74 Years | 490 (96.5%) | 224 (44.1%) |
| 75 Years and over | 335 (100.0%) | 208 (62.1%) |
| Total | 2,429 (52.8%) | 1,937 (42.1%) |
Disability Status by Sex by Age in Lake County
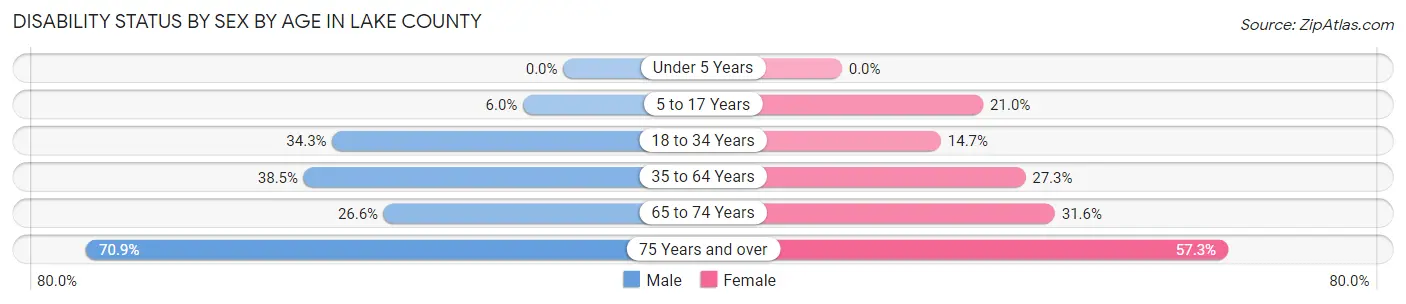
| Age Bracket | Male | Female |
| Under 5 Years | 0 (0.0%) | 0 (0.0%) |
| 5 to 17 Years | 23 (6.0%) | 72 (21.0%) |
| 18 to 34 Years | 168 (34.3%) | 65 (14.7%) |
| 35 to 64 Years | 324 (38.5%) | 273 (27.3%) |
| 65 to 74 Years | 57 (26.6%) | 93 (31.6%) |
| 75 Years and over | 73 (70.9%) | 133 (57.3%) |
Disability Class by Sex by Age in Lake County
Disability Class: Hearing Difficulty
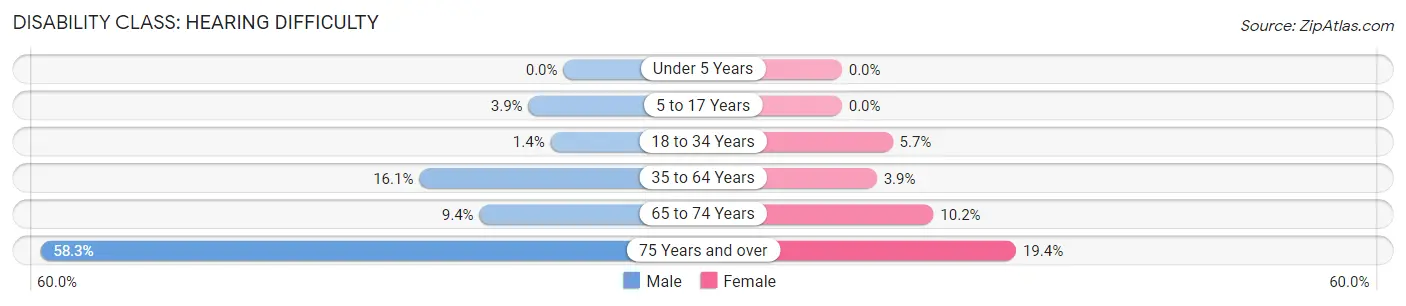
| Age Bracket | Male | Female |
| Under 5 Years | 0 (0.0%) | 0 (0.0%) |
| 5 to 17 Years | 15 (3.9%) | 0 (0.0%) |
| 18 to 34 Years | 7 (1.4%) | 25 (5.7%) |
| 35 to 64 Years | 135 (16.1%) | 39 (3.9%) |
| 65 to 74 Years | 20 (9.3%) | 30 (10.2%) |
| 75 Years and over | 60 (58.3%) | 45 (19.4%) |
Disability Class: Vision Difficulty
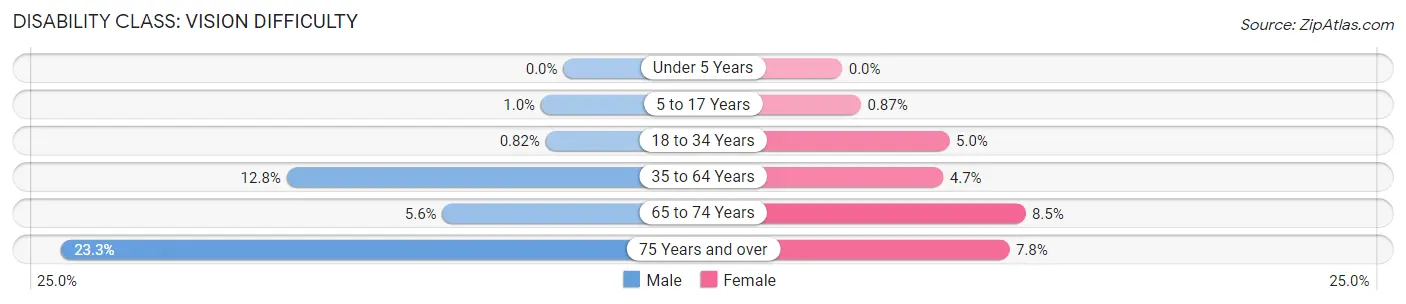
| Age Bracket | Male | Female |
| Under 5 Years | 0 (0.0%) | 0 (0.0%) |
| 5 to 17 Years | 4 (1.0%) | 3 (0.9%) |
| 18 to 34 Years | 4 (0.8%) | 22 (5.0%) |
| 35 to 64 Years | 108 (12.8%) | 47 (4.7%) |
| 65 to 74 Years | 12 (5.6%) | 25 (8.5%) |
| 75 Years and over | 24 (23.3%) | 18 (7.8%) |
Disability Class: Cognitive Difficulty
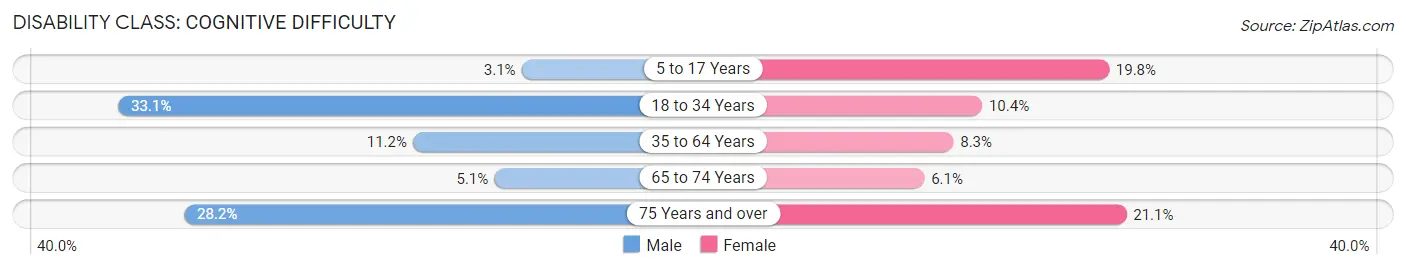
| Age Bracket | Male | Female |
| 5 to 17 Years | 12 (3.1%) | 68 (19.8%) |
| 18 to 34 Years | 162 (33.1%) | 46 (10.4%) |
| 35 to 64 Years | 94 (11.2%) | 83 (8.3%) |
| 65 to 74 Years | 11 (5.1%) | 18 (6.1%) |
| 75 Years and over | 29 (28.2%) | 49 (21.1%) |
Disability Class: Ambulatory Difficulty
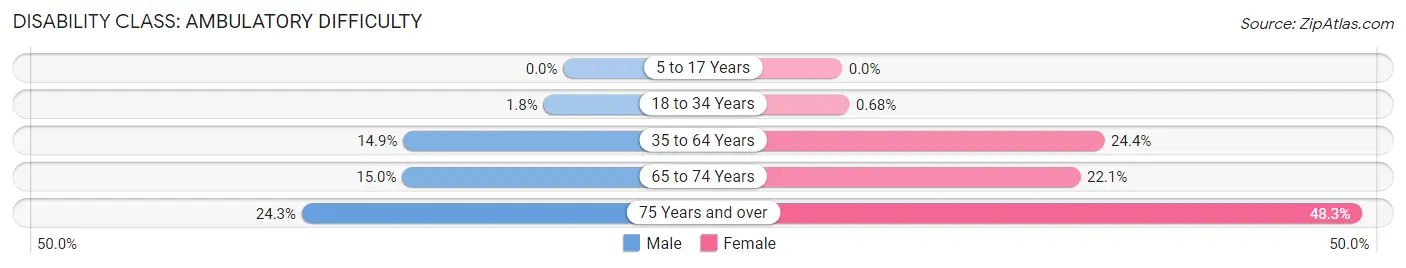
| Age Bracket | Male | Female |
| 5 to 17 Years | 0 (0.0%) | 0 (0.0%) |
| 18 to 34 Years | 9 (1.8%) | 3 (0.7%) |
| 35 to 64 Years | 125 (14.9%) | 244 (24.3%) |
| 65 to 74 Years | 32 (14.9%) | 65 (22.1%) |
| 75 Years and over | 25 (24.3%) | 112 (48.3%) |
Disability Class: Self-Care Difficulty
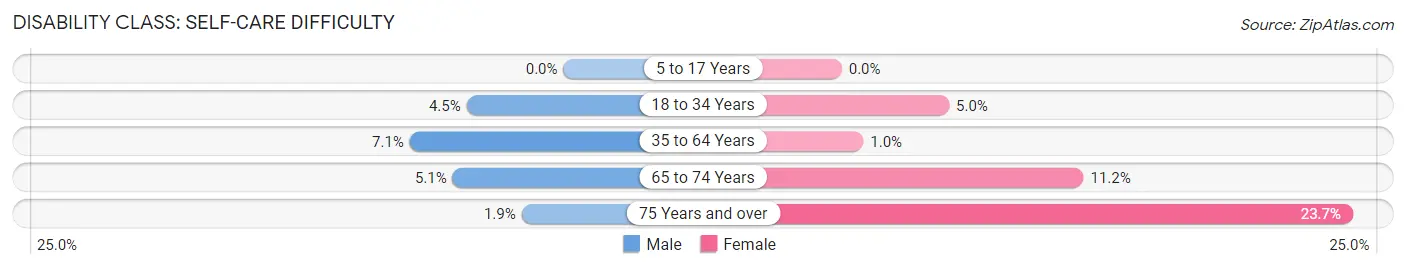
| Age Bracket | Male | Female |
| 5 to 17 Years | 0 (0.0%) | 0 (0.0%) |
| 18 to 34 Years | 22 (4.5%) | 22 (5.0%) |
| 35 to 64 Years | 60 (7.1%) | 10 (1.0%) |
| 65 to 74 Years | 11 (5.1%) | 33 (11.2%) |
| 75 Years and over | 2 (1.9%) | 55 (23.7%) |
Technology Access in Lake County
Computing Device Access in Lake County
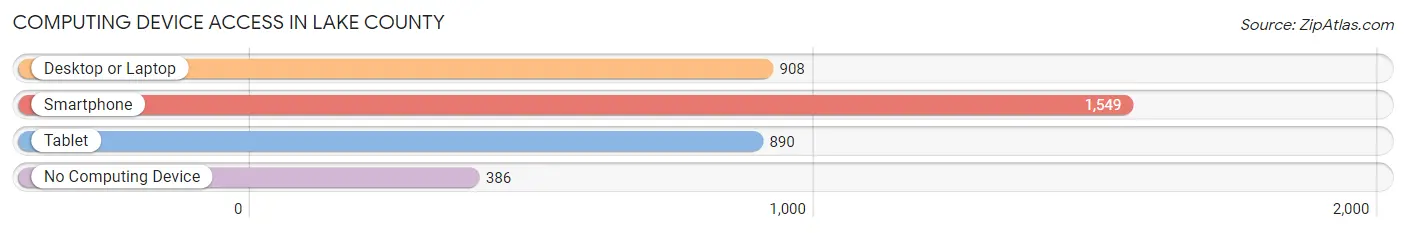
| Device Type | # Households | % Households |
| Desktop or Laptop | 908 | 45.1% |
| Smartphone | 1,549 | 76.9% |
| Tablet | 890 | 44.2% |
| No Computing Device | 386 | 19.2% |
| Total | 2,013 | 100.0% |
Internet Access in Lake County
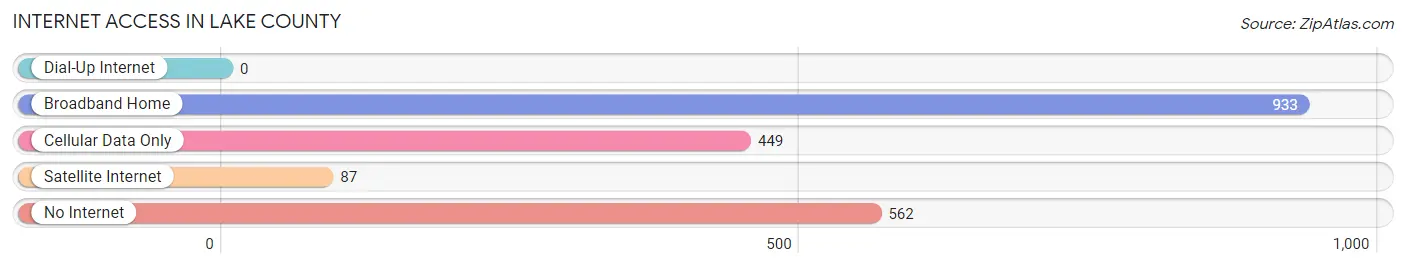
| Internet Type | # Households | % Households |
| Dial-Up Internet | 0 | 0.0% |
| Broadband Home | 933 | 46.4% |
| Cellular Data Only | 449 | 22.3% |
| Satellite Internet | 87 | 4.3% |
| No Internet | 562 | 27.9% |
| Total | 2,013 | 100.0% |
Lake County Summary
Lake County is located in the western part of Tennessee, in the United States. It is bordered by the states of Kentucky and Mississippi, and is part of the Jackson Metropolitan Statistical Area. The county seat is Tiptonville, and the largest city is Tiptonville. As of the 2010 census, the population was 7,832.
Geography
Lake County is located in the western part of Tennessee, in the United States. It is bordered by the states of Kentucky and Mississippi, and is part of the Jackson Metropolitan Statistical Area. The county has a total area of 517 square miles, of which 514 square miles is land and 3 square miles (0.6%) is water. The county is located in the western part of the state, and is bordered by Obion County to the north, Dyer County to the east, Lauderdale County, Mississippi to the south, and Fulton County, Kentucky to the west.
The county is mostly flat, with some rolling hills in the northern and western parts. The highest point in the county is located in the northwest corner, at an elevation of 590 feet. The county is drained by the Obion River, which flows through the county from north to south.
History
Lake County was created in 1870 from parts of Obion and Dyer counties. It was named for the many lakes in the area, including Reelfoot Lake, which was formed by an earthquake in 1811.
The county was originally home to the Chickasaw and Choctaw Native American tribes. The first European settlers arrived in the area in the early 1800s, and the county was officially organized in 1870.
The county was largely agricultural in the late 19th and early 20th centuries, with cotton and tobacco being the main crops. The county also had a thriving timber industry, and the town of Tiptonville was a major port on the Mississippi River.
Economy
The economy of Lake County is largely based on agriculture and tourism. The county is home to several large farms, which produce cotton, soybeans, corn, and other crops. The county also has a thriving timber industry, and the town of Tiptonville is a major port on the Mississippi River.
Tourism is also an important part of the economy. Reelfoot Lake, located in the northern part of the county, is a popular destination for fishing, boating, and other outdoor activities. The lake is also home to a variety of wildlife, including bald eagles, ospreys, and other birds.
Demographics
As of the 2010 census, there were 7,832 people, 2,945 households, and 2,092 families living in the county. The population density was 15.3 people per square mile. There were 3,521 housing units at an average density of 6.9 per square mile. The racial makeup of the county was 79.2% White, 17.7% African American, 0.3% Native American, 0.2% Asian, 0.1% Pacific Islander, 0.7% from other races, and 1.9% from two or more races. Hispanic or Latino of any race were 2.2% of the population.
The median income for a household in the county was $30,945, and the median income for a family was $37,917. Males had a median income of $30,945 versus $21,917 for females. The per capita income for the county was $15,845. About 16.2% of families and 19.2% of the population were below the poverty line, including 25.2% of those under age 18 and 16.2% of those age 65 or over.
Common Questions
What is the Total Population of Lake County?
Total Population of Lake County is 6,898.
What is the Total Male Population of Lake County?
Total Male Population of Lake County is 4,382.
What is the Total Female Population of Lake County?
Total Female Population of Lake County is 2,516.
What is the Ratio of Males per 100 Females in Lake County?
There are 174.17 Males per 100 Females in Lake County.
What is the Ratio of Females per 100 Males in Lake County?
There are 57.42 Females per 100 Males in Lake County.
What is the Median Population Age in Lake County?
Median Population Age in Lake County is 41.8 Years.
What is the Average Family Size in Lake County
Average Family Size in Lake County is 3.3 People.
What is the Average Household Size in Lake County
Average Household Size in Lake County is 2.3 People.
What is Per Capita Income in Lake County?
Per Capita income in Lake County is $19,695.
What is the Median Family Income in Lake County?
Median Family Income in Lake County is $45,250.
What is the Median Household income in Lake County?
Median Household Income in Lake County is $32,064.
What is Income or Wage Gap in Lake County?
Income or Wage Gap in Lake County is 0.9%.
Women in Lake County earn 99.1 cents for every dollar earned by a man.
What is Family Income Deficit in Lake County?
Family Income Deficit in Lake County is $17,932.
Families that are below poverty line in Lake County earn $17,932 less on average than the poverty threshold level.
What is Inequality or Gini Index in Lake County?
Inequality or Gini Index in Lake County is 0.57.
How Large is the Labor Force in Lake County?
There are 1,848 People in the Labor Forcein in Lake County.
What is the Percentage of People in the Labor Force in Lake County?
30.7% of People are in the Labor Force in Lake County.
What is the Unemployment Rate in Lake County?
Unemployment Rate in Lake County is 7.0%.