Knox County, TN
Knox County Map
Knox County Overview
481,406
TOTAL POPULATION
235,988
MALE POPULATION
245,418
FEMALE POPULATION
96.16
MALES / 100 FEMALES
104.00
FEMALES / 100 MALES
37.4
MEDIAN AGE
3.0
AVG FAMILY SIZE
2.4
AVG HOUSEHOLD SIZE
$39,608
PER CAPITA INCOME
$89,788
AVG FAMILY INCOME
$68,580
AVG HOUSEHOLD INCOME
27.5%
WAGE / INCOME GAP [ % ]
72.5¢/ $1
WAGE / INCOME GAP [ $ ]
$10,386
FAMILY INCOME DEFICIT
0.48
INEQUALITY / GINI INDEX
252,461
LABOR FORCE [ PEOPLE ]
64.2%
PERCENT IN LABOR FORCE
3.8%
UNEMPLOYMENT RATE
Knox County Area Codes
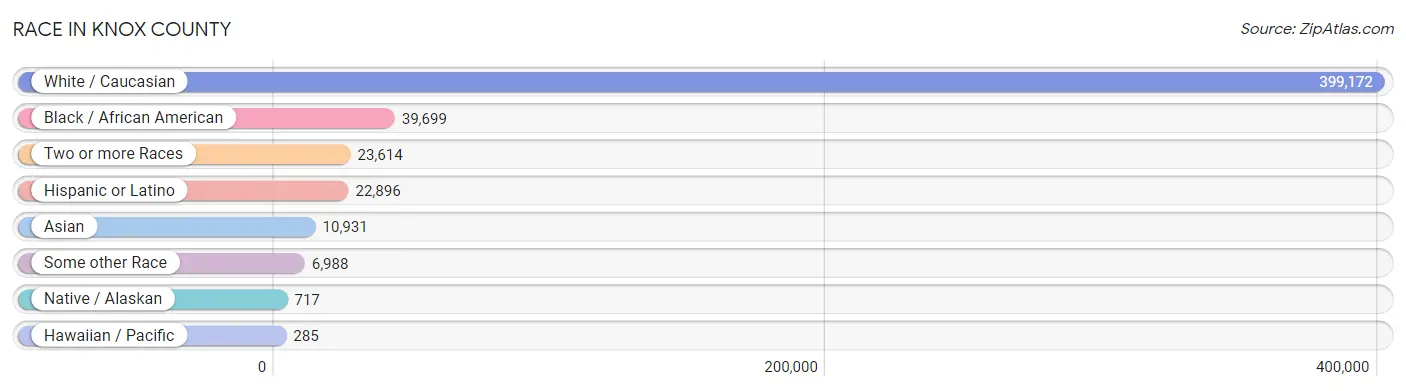
Race in Knox County
The most populous races in Knox County are White / Caucasian (399,172 | 82.9%), Black / African American (39,699 | 8.3%), and Two or more Races (23,614 | 4.9%).
| Race | # Population | % Population |
| Asian | 10,931 | 2.3% |
| Black / African American | 39,699 | 8.3% |
| Hawaiian / Pacific | 285 | 0.1% |
| Hispanic or Latino | 22,896 | 4.8% |
| Native / Alaskan | 717 | 0.2% |
| White / Caucasian | 399,172 | 82.9% |
| Two or more Races | 23,614 | 4.9% |
| Some other Race | 6,988 | 1.5% |
| Total | 481,406 | 100.0% |
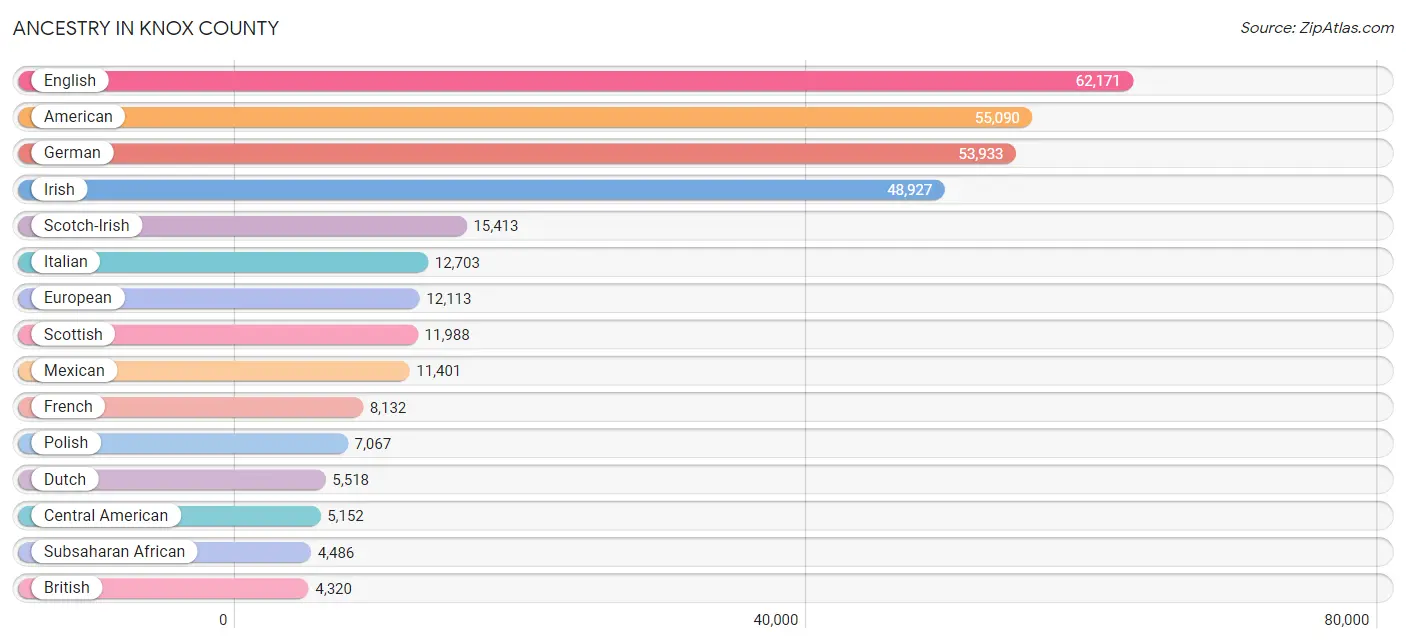
Ancestry in Knox County
The most populous ancestries reported in Knox County are English (62,171 | 12.9%), American (55,090 | 11.4%), German (53,933 | 11.2%), Irish (48,927 | 10.2%), and Scotch-Irish (15,413 | 3.2%), together accounting for 48.9% of all Knox County residents.
| Ancestry | # Population | % Population |
| Afghan | 52 | 0.0% |
| African | 2,343 | 0.5% |
| Alaskan Athabascan | 5 | 0.0% |
| Albanian | 22 | 0.0% |
| Aleut | 9 | 0.0% |
| Alsatian | 9 | 0.0% |
| American | 55,090 | 11.4% |
| Apache | 63 | 0.0% |
| Arab | 3,748 | 0.8% |
| Argentinean | 311 | 0.1% |
| Armenian | 103 | 0.0% |
| Assyrian / Chaldean / Syriac | 20 | 0.0% |
| Australian | 88 | 0.0% |
| Austrian | 885 | 0.2% |
| Bahamian | 48 | 0.0% |
| Bangladeshi | 61 | 0.0% |
| Basque | 19 | 0.0% |
| Belgian | 80 | 0.0% |
| Belizean | 42 | 0.0% |
| Bhutanese | 1,011 | 0.2% |
| Blackfeet | 149 | 0.0% |
| Bolivian | 76 | 0.0% |
| Brazilian | 197 | 0.0% |
| British | 4,320 | 0.9% |
| British West Indian | 117 | 0.0% |
| Bulgarian | 78 | 0.0% |
| Burmese | 1,489 | 0.3% |
| Cajun | 134 | 0.0% |
| Cambodian | 8 | 0.0% |
| Canadian | 450 | 0.1% |
| Cape Verdean | 35 | 0.0% |
| Celtic | 124 | 0.0% |
| Central American | 5,152 | 1.1% |
| Central American Indian | 82 | 0.0% |
| Cherokee | 1,879 | 0.4% |
| Chickasaw | 43 | 0.0% |
| Chilean | 117 | 0.0% |
| Chippewa | 29 | 0.0% |
| Choctaw | 134 | 0.0% |
| Colombian | 782 | 0.2% |
| Comanche | 13 | 0.0% |
| Costa Rican | 48 | 0.0% |
| Creek | 31 | 0.0% |
| Croatian | 147 | 0.0% |
| Cuban | 1,120 | 0.2% |
| Cypriot | 10 | 0.0% |
| Czech | 801 | 0.2% |
| Czechoslovakian | 141 | 0.0% |
| Danish | 998 | 0.2% |
| Delaware | 8 | 0.0% |
| Dominican | 103 | 0.0% |
| Dutch | 5,518 | 1.1% |
| Dutch West Indian | 128 | 0.0% |
| Eastern European | 1,369 | 0.3% |
| Ecuadorian | 73 | 0.0% |
| Egyptian | 314 | 0.1% |
| English | 62,171 | 12.9% |
| Estonian | 91 | 0.0% |
| Ethiopian | 151 | 0.0% |
| European | 12,113 | 2.5% |
| Filipino | 345 | 0.1% |
| Finnish | 423 | 0.1% |
| French | 8,132 | 1.7% |
| French American Indian | 73 | 0.0% |
| French Canadian | 1,495 | 0.3% |
| German | 53,933 | 11.2% |
| German Russian | 11 | 0.0% |
| Ghanaian | 201 | 0.0% |
| Greek | 1,455 | 0.3% |
| Guamanian / Chamorro | 178 | 0.0% |
| Guatemalan | 3,110 | 0.6% |
| Guyanese | 104 | 0.0% |
| Haitian | 129 | 0.0% |
| Honduran | 1,017 | 0.2% |
| Hungarian | 1,372 | 0.3% |
| Icelander | 18 | 0.0% |
| Indian (Asian) | 2,920 | 0.6% |
| Indonesian | 2 | 0.0% |
| Inupiat | 10 | 0.0% |
| Iranian | 710 | 0.2% |
| Iraqi | 831 | 0.2% |
| Irish | 48,927 | 10.2% |
| Iroquois | 5 | 0.0% |
| Israeli | 36 | 0.0% |
| Italian | 12,703 | 2.6% |
| Jamaican | 182 | 0.0% |
| Japanese | 111 | 0.0% |
| Jordanian | 270 | 0.1% |
| Kenyan | 52 | 0.0% |
| Korean | 1,872 | 0.4% |
| Laotian | 85 | 0.0% |
| Latvian | 17 | 0.0% |
| Lebanese | 1,020 | 0.2% |
| Liberian | 8 | 0.0% |
| Lithuanian | 406 | 0.1% |
| Lumbee | 52 | 0.0% |
| Luxembourger | 33 | 0.0% |
| Macedonian | 15 | 0.0% |
| Malaysian | 110 | 0.0% |
| Maltese | 60 | 0.0% |
| Menominee | 6 | 0.0% |
| Mexican | 11,401 | 2.4% |
| Mexican American Indian | 47 | 0.0% |
| Mongolian | 99 | 0.0% |
| Moroccan | 107 | 0.0% |
| Native Hawaiian | 415 | 0.1% |
| Navajo | 63 | 0.0% |
| New Zealander | 35 | 0.0% |
| Nicaraguan | 77 | 0.0% |
| Nigerian | 308 | 0.1% |
| Northern European | 599 | 0.1% |
| Norwegian | 2,799 | 0.6% |
| Osage | 3 | 0.0% |
| Pakistani | 263 | 0.1% |
| Palestinian | 525 | 0.1% |
| Panamanian | 368 | 0.1% |
| Paraguayan | 1 | 0.0% |
| Pennsylvania German | 60 | 0.0% |
| Peruvian | 125 | 0.0% |
| Polish | 7,067 | 1.5% |
| Portuguese | 425 | 0.1% |
| Potawatomi | 32 | 0.0% |
| Puerto Rican | 1,874 | 0.4% |
| Romanian | 829 | 0.2% |
| Russian | 1,879 | 0.4% |
| Salvadoran | 532 | 0.1% |
| Samoan | 172 | 0.0% |
| Scandinavian | 1,202 | 0.3% |
| Scotch-Irish | 15,413 | 3.2% |
| Scottish | 11,988 | 2.5% |
| Seminole | 21 | 0.0% |
| Senegalese | 21 | 0.0% |
| Serbian | 27 | 0.0% |
| Sioux | 54 | 0.0% |
| Slavic | 152 | 0.0% |
| Slovak | 649 | 0.1% |
| Slovene | 224 | 0.1% |
| Somali | 34 | 0.0% |
| South African | 97 | 0.0% |
| South American | 1,695 | 0.4% |
| Spaniard | 371 | 0.1% |
| Spanish | 295 | 0.1% |
| Sri Lankan | 1,353 | 0.3% |
| Subsaharan African | 4,486 | 0.9% |
| Sudanese | 94 | 0.0% |
| Swedish | 2,629 | 0.5% |
| Swiss | 1,372 | 0.3% |
| Syrian | 107 | 0.0% |
| Thai | 3,883 | 0.8% |
| Tlingit-Haida | 2 | 0.0% |
| Turkish | 114 | 0.0% |
| Ugandan | 102 | 0.0% |
| Ukrainian | 1,045 | 0.2% |
| Uruguayan | 4 | 0.0% |
| Venezuelan | 206 | 0.0% |
| Vietnamese | 154 | 0.0% |
| Welsh | 4,191 | 0.9% |
| West Indian | 63 | 0.0% |
| Yugoslavian | 414 | 0.1% |
| Zimbabwean | 25 | 0.0% | View All 160 Rows |
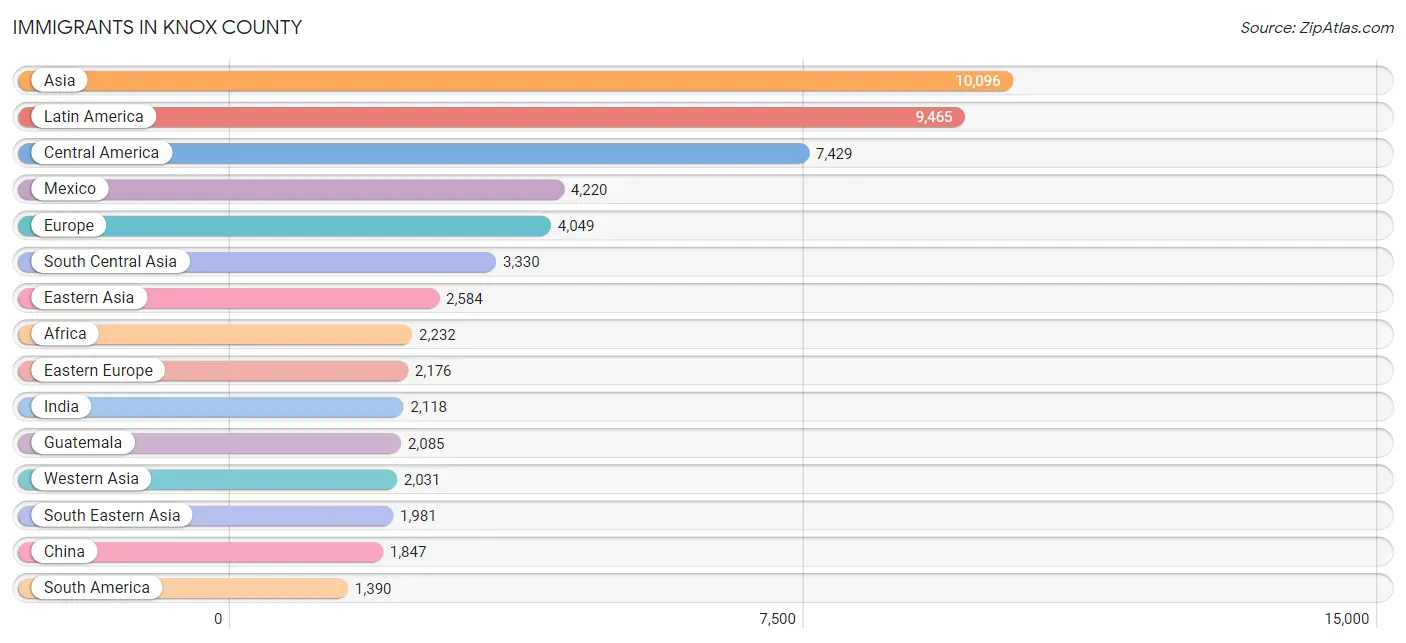
Immigrants in Knox County
The most numerous immigrant groups reported in Knox County came from Asia (10,096 | 2.1%), Latin America (9,465 | 2.0%), Central America (7,429 | 1.5%), Mexico (4,220 | 0.9%), and Europe (4,049 | 0.8%), together accounting for 7.3% of all Knox County residents.
| Immigration Origin | # Population | % Population |
| Afghanistan | 102 | 0.0% |
| Africa | 2,232 | 0.5% |
| Argentina | 303 | 0.1% |
| Armenia | 19 | 0.0% |
| Asia | 10,096 | 2.1% |
| Australia | 34 | 0.0% |
| Austria | 32 | 0.0% |
| Bahamas | 7 | 0.0% |
| Bangladesh | 161 | 0.0% |
| Belize | 29 | 0.0% |
| Bolivia | 72 | 0.0% |
| Bosnia and Herzegovina | 200 | 0.0% |
| Brazil | 172 | 0.0% |
| Bulgaria | 51 | 0.0% |
| Cambodia | 43 | 0.0% |
| Cameroon | 106 | 0.0% |
| Canada | 748 | 0.2% |
| Caribbean | 646 | 0.1% |
| Central America | 7,429 | 1.5% |
| Chile | 63 | 0.0% |
| China | 1,847 | 0.4% |
| Colombia | 435 | 0.1% |
| Congo | 157 | 0.0% |
| Costa Rica | 21 | 0.0% |
| Cuba | 355 | 0.1% |
| Czechoslovakia | 60 | 0.0% |
| Denmark | 16 | 0.0% |
| Dominican Republic | 40 | 0.0% |
| Eastern Africa | 544 | 0.1% |
| Eastern Asia | 2,584 | 0.5% |
| Eastern Europe | 2,176 | 0.4% |
| Ecuador | 26 | 0.0% |
| Egypt | 113 | 0.0% |
| El Salvador | 250 | 0.1% |
| England | 344 | 0.1% |
| Ethiopia | 82 | 0.0% |
| Europe | 4,049 | 0.8% |
| France | 16 | 0.0% |
| Germany | 542 | 0.1% |
| Ghana | 52 | 0.0% |
| Greece | 207 | 0.0% |
| Guatemala | 2,085 | 0.4% |
| Guyana | 35 | 0.0% |
| Haiti | 60 | 0.0% |
| Honduras | 729 | 0.2% |
| Hong Kong | 51 | 0.0% |
| Hungary | 69 | 0.0% |
| India | 2,118 | 0.4% |
| Indonesia | 60 | 0.0% |
| Iran | 466 | 0.1% |
| Iraq | 1,235 | 0.3% |
| Ireland | 19 | 0.0% |
| Israel | 108 | 0.0% |
| Italy | 105 | 0.0% |
| Jamaica | 134 | 0.0% |
| Japan | 156 | 0.0% |
| Jordan | 163 | 0.0% |
| Kazakhstan | 18 | 0.0% |
| Kenya | 63 | 0.0% |
| Korea | 581 | 0.1% |
| Kuwait | 35 | 0.0% |
| Laos | 30 | 0.0% |
| Latin America | 9,465 | 2.0% |
| Latvia | 19 | 0.0% |
| Lebanon | 261 | 0.1% |
| Liberia | 44 | 0.0% |
| Malaysia | 82 | 0.0% |
| Mexico | 4,220 | 0.9% |
| Middle Africa | 453 | 0.1% |
| Moldova | 376 | 0.1% |
| Morocco | 68 | 0.0% |
| Nepal | 51 | 0.0% |
| Netherlands | 9 | 0.0% |
| Nicaragua | 34 | 0.0% |
| Nigeria | 95 | 0.0% |
| North Macedonia | 8 | 0.0% |
| Northern Africa | 404 | 0.1% |
| Northern Europe | 920 | 0.2% |
| Oceania | 77 | 0.0% |
| Pakistan | 203 | 0.0% |
| Panama | 61 | 0.0% |
| Peru | 59 | 0.0% |
| Philippines | 771 | 0.2% |
| Poland | 168 | 0.0% |
| Portugal | 9 | 0.0% |
| Romania | 318 | 0.1% |
| Russia | 427 | 0.1% |
| Saudi Arabia | 114 | 0.0% |
| Scotland | 66 | 0.0% |
| Senegal | 129 | 0.0% |
| Sierra Leone | 16 | 0.0% |
| Somalia | 18 | 0.0% |
| South Africa | 204 | 0.0% |
| South America | 1,390 | 0.3% |
| South Central Asia | 3,330 | 0.7% |
| South Eastern Asia | 1,981 | 0.4% |
| Southern Europe | 331 | 0.1% |
| Spain | 10 | 0.0% |
| Sri Lanka | 80 | 0.0% |
| Sudan | 107 | 0.0% |
| Sweden | 157 | 0.0% |
| Switzerland | 17 | 0.0% |
| Taiwan | 429 | 0.1% |
| Thailand | 131 | 0.0% |
| Trinidad and Tobago | 11 | 0.0% |
| Turkey | 76 | 0.0% |
| Uganda | 87 | 0.0% |
| Ukraine | 283 | 0.1% |
| Uruguay | 4 | 0.0% |
| Uzbekistan | 131 | 0.0% |
| Venezuela | 221 | 0.1% |
| Vietnam | 862 | 0.2% |
| West Indies | 38 | 0.0% |
| Western Africa | 416 | 0.1% |
| Western Asia | 2,031 | 0.4% |
| Western Europe | 622 | 0.1% |
| Zaire | 190 | 0.0% |
| Zimbabwe | 15 | 0.0% | View All 118 Rows |
Sex and Age in Knox County
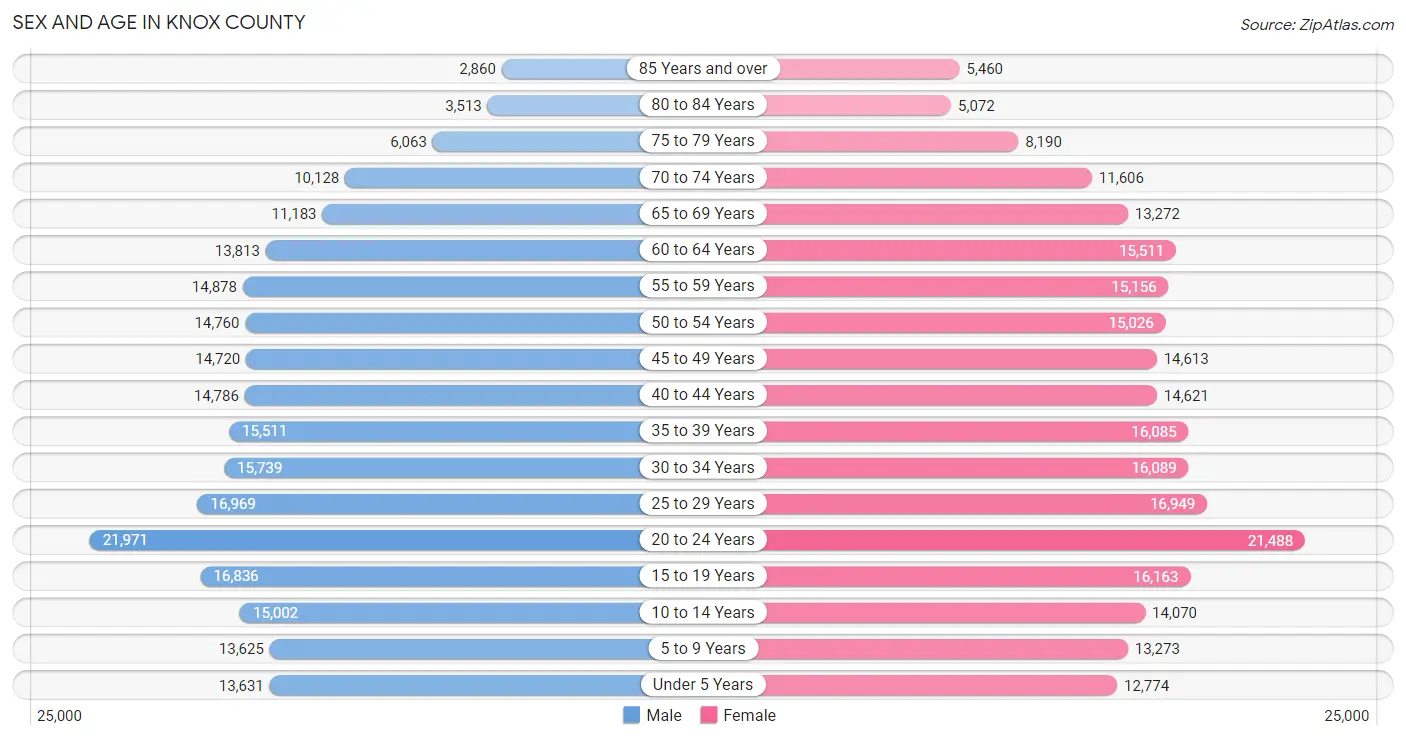
Sex and Age in Knox County
The most populous age groups in Knox County are 20 to 24 Years (21,971 | 9.3%) for men and 20 to 24 Years (21,488 | 8.8%) for women.
| Age Bracket | Male | Female |
| Under 5 Years | 13,631 (5.8%) | 12,774 (5.2%) |
| 5 to 9 Years | 13,625 (5.8%) | 13,273 (5.4%) |
| 10 to 14 Years | 15,002 (6.4%) | 14,070 (5.7%) |
| 15 to 19 Years | 16,836 (7.1%) | 16,163 (6.6%) |
| 20 to 24 Years | 21,971 (9.3%) | 21,488 (8.8%) |
| 25 to 29 Years | 16,969 (7.2%) | 16,949 (6.9%) |
| 30 to 34 Years | 15,739 (6.7%) | 16,089 (6.6%) |
| 35 to 39 Years | 15,511 (6.6%) | 16,085 (6.6%) |
| 40 to 44 Years | 14,786 (6.3%) | 14,621 (6.0%) |
| 45 to 49 Years | 14,720 (6.2%) | 14,613 (5.9%) |
| 50 to 54 Years | 14,760 (6.2%) | 15,026 (6.1%) |
| 55 to 59 Years | 14,878 (6.3%) | 15,156 (6.2%) |
| 60 to 64 Years | 13,813 (5.9%) | 15,511 (6.3%) |
| 65 to 69 Years | 11,183 (4.7%) | 13,272 (5.4%) |
| 70 to 74 Years | 10,128 (4.3%) | 11,606 (4.7%) |
| 75 to 79 Years | 6,063 (2.6%) | 8,190 (3.3%) |
| 80 to 84 Years | 3,513 (1.5%) | 5,072 (2.1%) |
| 85 Years and over | 2,860 (1.2%) | 5,460 (2.2%) |
| Total | 235,988 (100.0%) | 245,418 (100.0%) |
Families and Households in Knox County
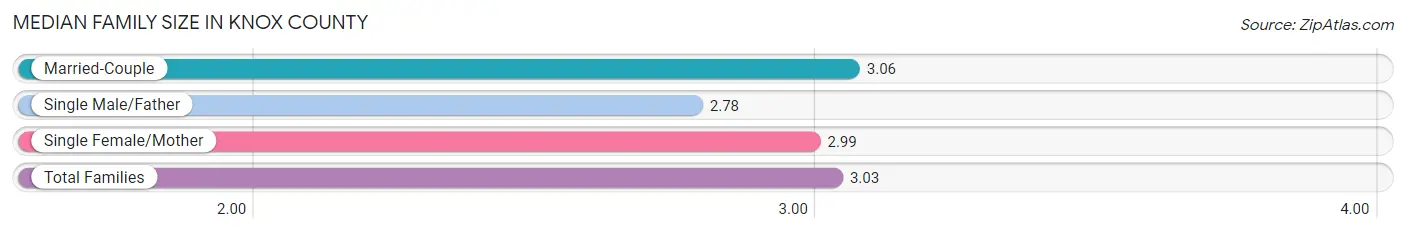
Median Family Size in Knox County
The median family size in Knox County is 3.03 persons per family, with married-couple families (90,464 | 76.1%) accounting for the largest median family size of 3.06 persons per family. On the other hand, single male/father families (7,541 | 6.3%) represent the smallest median family size with 2.78 persons per family.
| Family Type | # Families | Family Size |
| Married-Couple | 90,464 (76.1%) | 3.06 |
| Single Male/Father | 7,541 (6.3%) | 2.78 |
| Single Female/Mother | 20,908 (17.6%) | 2.99 |
| Total Families | 118,913 (100.0%) | 3.03 |
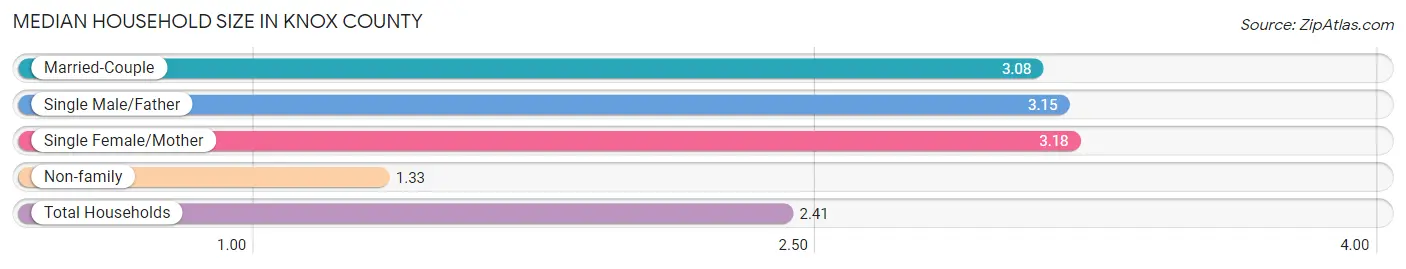
Median Household Size in Knox County
The median household size in Knox County is 2.41 persons per household, with single female/mother households (20,908 | 10.7%) accounting for the largest median household size of 3.18 persons per household. non-family households (75,929 | 39.0%) represent the smallest median household size with 1.33 persons per household.
| Household Type | # Households | Household Size |
| Married-Couple | 90,464 (46.4%) | 3.08 |
| Single Male/Father | 7,541 (3.9%) | 3.15 |
| Single Female/Mother | 20,908 (10.7%) | 3.18 |
| Non-family | 75,929 (39.0%) | 1.33 |
| Total Households | 194,842 (100.0%) | 2.41 |
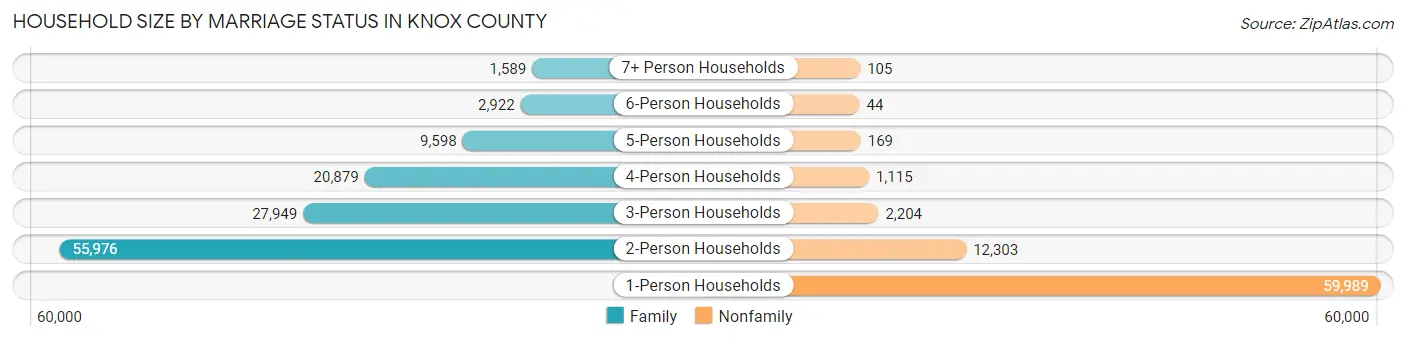
Household Size by Marriage Status in Knox County
Out of a total of 194,842 households in Knox County, 118,913 (61.0%) are family households, while 75,929 (39.0%) are nonfamily households. The most numerous type of family households are 2-person households, comprising 55,976, and the most common type of nonfamily households are 1-person households, comprising 59,989.
| Household Size | Family Households | Nonfamily Households |
| 1-Person Households | - | 59,989 (30.8%) |
| 2-Person Households | 55,976 (28.7%) | 12,303 (6.3%) |
| 3-Person Households | 27,949 (14.3%) | 2,204 (1.1%) |
| 4-Person Households | 20,879 (10.7%) | 1,115 (0.6%) |
| 5-Person Households | 9,598 (4.9%) | 169 (0.1%) |
| 6-Person Households | 2,922 (1.5%) | 44 (0.0%) |
| 7+ Person Households | 1,589 (0.8%) | 105 (0.1%) |
| Total | 118,913 (61.0%) | 75,929 (39.0%) |
Female Fertility in Knox County
Fertility by Age in Knox County
Average fertility rate in Knox County is 42.0 births per 1,000 women. Women in the age bracket of 20 to 34 years have the highest fertility rate with 66.0 births per 1,000 women. Women in the age bracket of 20 to 34 years acount for 71.6% of all women with births.
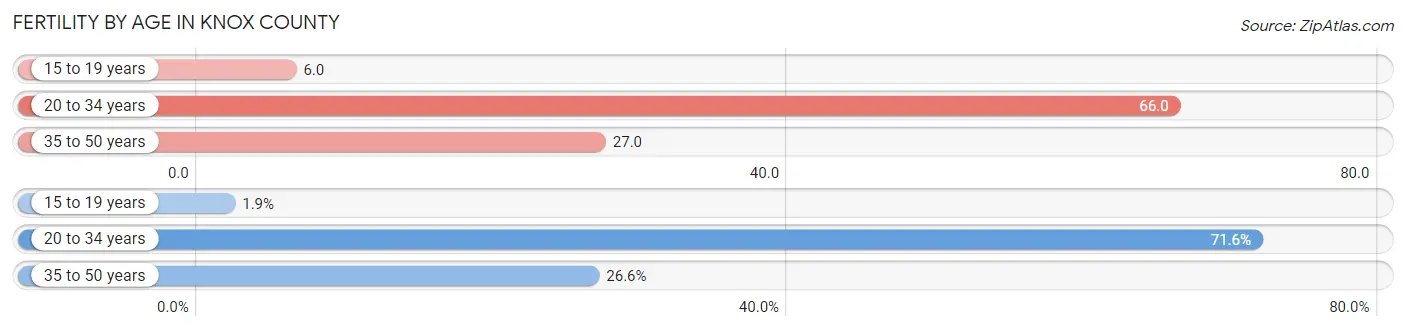
| Age Bracket | Women with Births | Births / 1,000 Women |
| 15 to 19 years | 93 (1.8%) | 6.0 |
| 20 to 34 years | 3,592 (71.6%) | 66.0 |
| 35 to 50 years | 1,333 (26.6%) | 27.0 |
| Total | 5,018 (100.0%) | 42.0 |
Fertility by Age by Marriage Status in Knox County
77.8% of women with births (5,018) in Knox County are married. The highest percentage of unmarried women with births falls into 15 to 19 years age bracket with 100.0% of them unmarried at the time of birth, while the lowest percentage of unmarried women with births belong to 35 to 50 years age bracket with 7.9% of them unmarried.
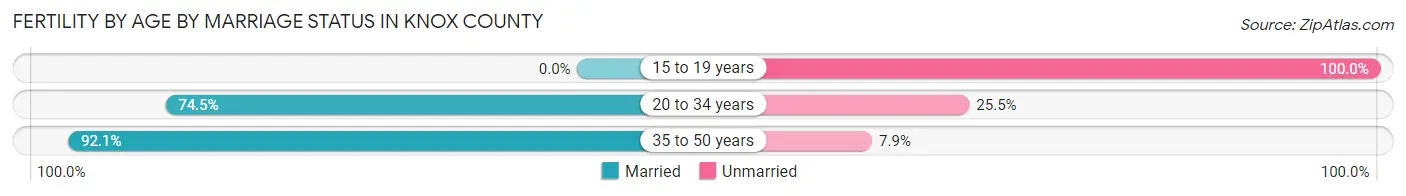
| Age Bracket | Married | Unmarried |
| 15 to 19 years | 0 (0.0%) | 93 (100.0%) |
| 20 to 34 years | 2,676 (74.5%) | 916 (25.5%) |
| 35 to 50 years | 1,228 (92.1%) | 105 (7.9%) |
| Total | 3,904 (77.8%) | 1,114 (22.2%) |
Fertility by Education in Knox County
Average fertility rate in Knox County is 42.0 births per 1,000 women. Women with the education attainment of graduate degree have the highest fertility rate of 59.0 births per 1,000 women, while women with the education attainment of less than high school have the lowest fertility at 25.0 births per 1,000 women. Women with the education attainment of bachelor's degree represent 31.5% of all women with births.
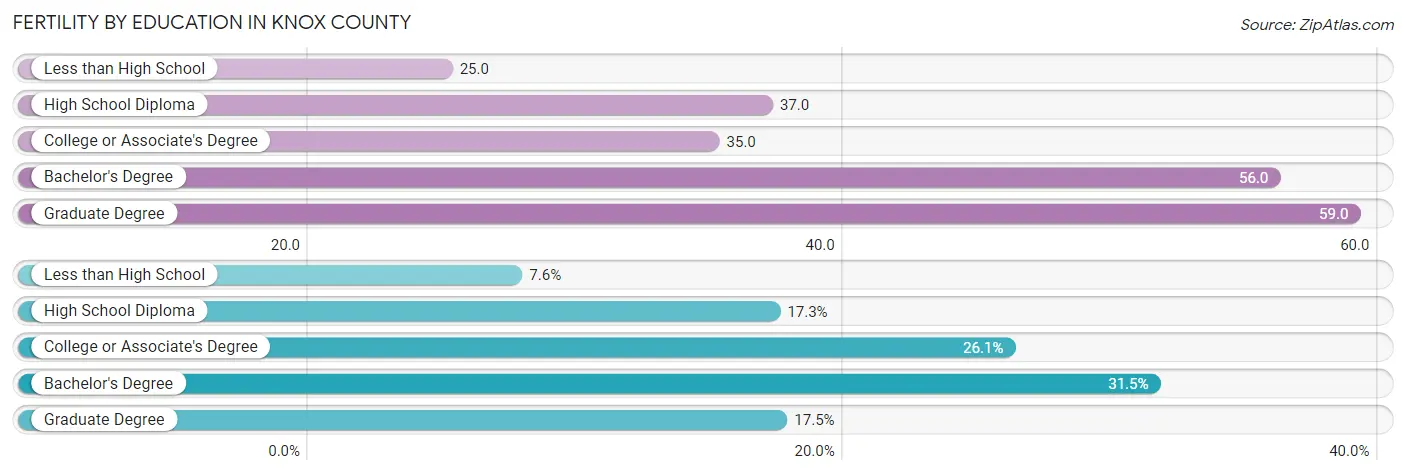
| Educational Attainment | Women with Births | Births / 1,000 Women |
| Less than High School | 382 (7.6%) | 25.0 |
| High School Diploma | 867 (17.3%) | 37.0 |
| College or Associate's Degree | 1,308 (26.1%) | 35.0 |
| Bachelor's Degree | 1,581 (31.5%) | 56.0 |
| Graduate Degree | 880 (17.5%) | 59.0 |
| Total | 5,018 (100.0%) | 42.0 |
Fertility by Education by Marriage Status in Knox County
22.2% of women with births in Knox County are unmarried. Women with the educational attainment of graduate degree are most likely to be married with 95.6% of them married at childbirth, while women with the educational attainment of high school diploma are least likely to be married with 54.0% of them unmarried at childbirth.
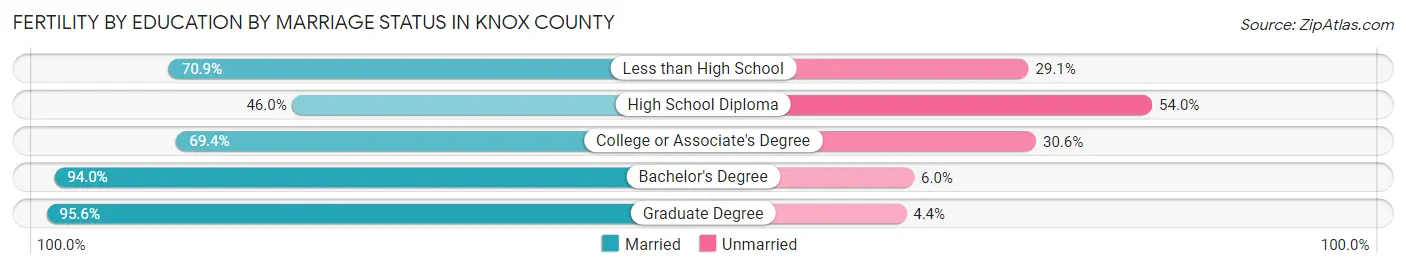
| Educational Attainment | Married | Unmarried |
| Less than High School | 271 (70.9%) | 111 (29.1%) |
| High School Diploma | 399 (46.0%) | 468 (54.0%) |
| College or Associate's Degree | 908 (69.4%) | 400 (30.6%) |
| Bachelor's Degree | 1,486 (94.0%) | 95 (6.0%) |
| Graduate Degree | 841 (95.6%) | 39 (4.4%) |
| Total | 3,904 (77.8%) | 1,114 (22.2%) |
Income in Knox County
Income Overview in Knox County
Per Capita Income in Knox County is $39,608, while median incomes of families and households are $89,788 and $68,580 respectively.
| Characteristic | Number | Measure |
| Per Capita Income | 481,406 | $39,608 |
| Median Family Income | 118,913 | $89,788 |
| Mean Family Income | 118,913 | $118,433 |
| Median Household Income | 194,842 | $68,580 |
| Mean Household Income | 194,842 | $95,220 |
| Income Deficit | 118,913 | $10,386 |
| Wage / Income Gap (%) | 481,406 | 27.47% |
| Wage / Income Gap ($) | 481,406 | 72.53¢ per $1 |
| Gini / Inequality Index | 481,406 | 0.48 |
Earnings by Sex in Knox County
Average Earnings in Knox County are $39,481, $46,137 for men and $33,465 for women, a difference of 27.5%.
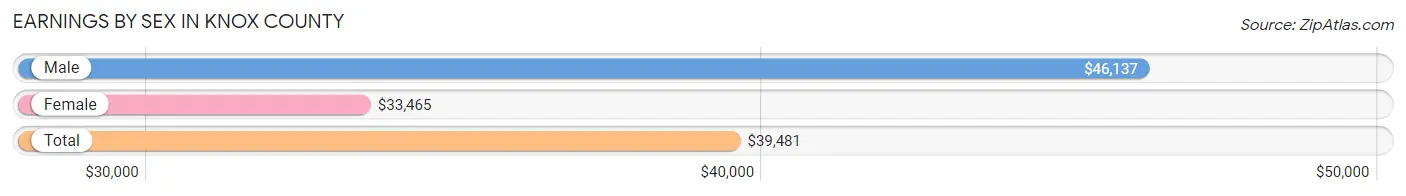
| Sex | Number | Average Earnings |
| Male | 138,379 (52.4%) | $46,137 |
| Female | 125,798 (47.6%) | $33,465 |
| Total | 264,177 (100.0%) | $39,481 |
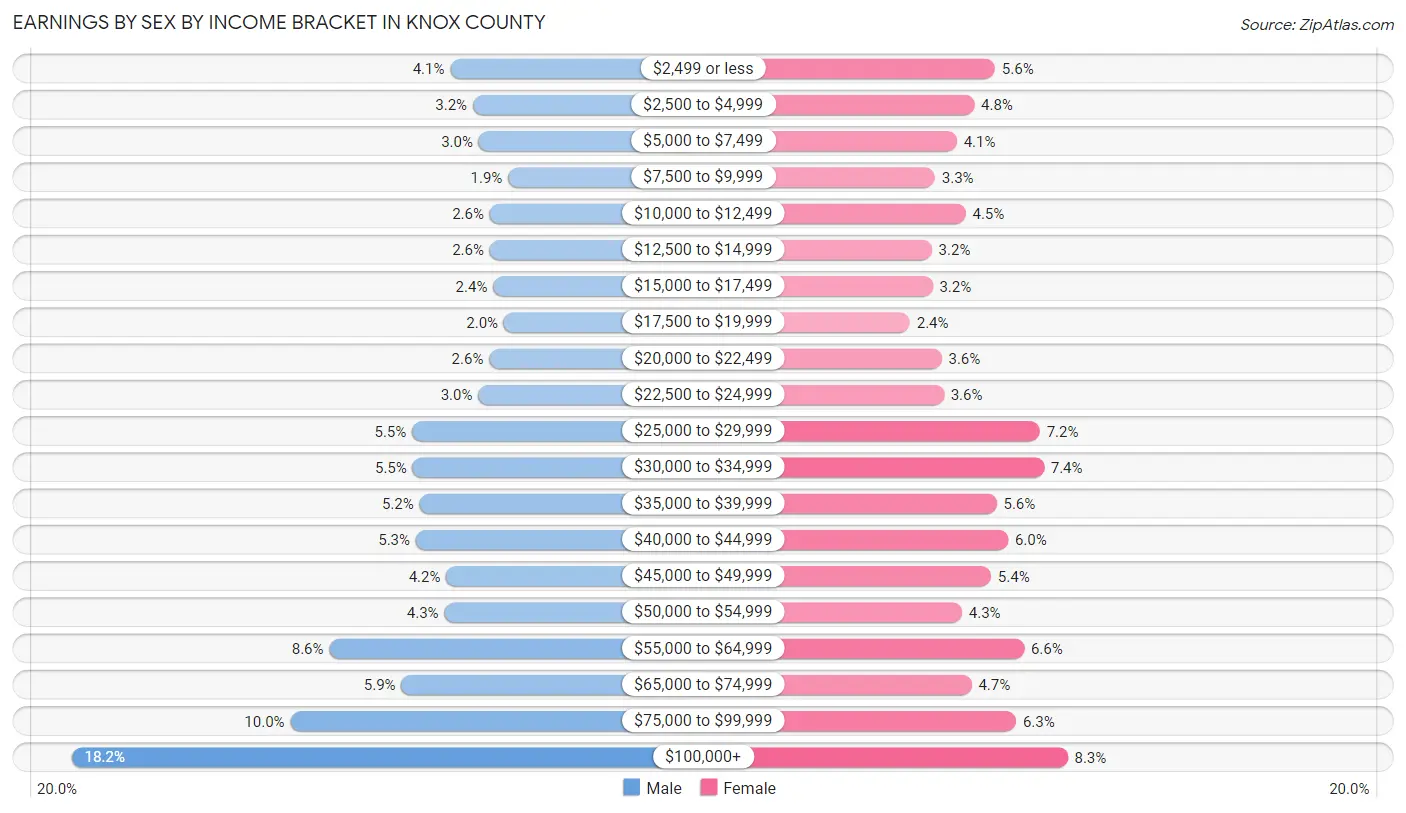
Earnings by Sex by Income Bracket in Knox County
The most common earnings brackets in Knox County are $100,000+ for men (25,237 | 18.2%) and $100,000+ for women (10,403 | 8.3%).
| Income | Male | Female |
| $2,499 or less | 5,600 (4.1%) | 6,985 (5.6%) |
| $2,500 to $4,999 | 4,424 (3.2%) | 5,999 (4.8%) |
| $5,000 to $7,499 | 4,117 (3.0%) | 5,182 (4.1%) |
| $7,500 to $9,999 | 2,596 (1.9%) | 4,148 (3.3%) |
| $10,000 to $12,499 | 3,563 (2.6%) | 5,593 (4.4%) |
| $12,500 to $14,999 | 3,551 (2.6%) | 3,999 (3.2%) |
| $15,000 to $17,499 | 3,379 (2.4%) | 4,037 (3.2%) |
| $17,500 to $19,999 | 2,825 (2.0%) | 2,972 (2.4%) |
| $20,000 to $22,499 | 3,582 (2.6%) | 4,463 (3.5%) |
| $22,500 to $24,999 | 4,147 (3.0%) | 4,562 (3.6%) |
| $25,000 to $29,999 | 7,582 (5.5%) | 9,098 (7.2%) |
| $30,000 to $34,999 | 7,551 (5.5%) | 9,287 (7.4%) |
| $35,000 to $39,999 | 7,201 (5.2%) | 7,059 (5.6%) |
| $40,000 to $44,999 | 7,384 (5.3%) | 7,594 (6.0%) |
| $45,000 to $49,999 | 5,817 (4.2%) | 6,794 (5.4%) |
| $50,000 to $54,999 | 5,913 (4.3%) | 5,416 (4.3%) |
| $55,000 to $64,999 | 11,879 (8.6%) | 8,349 (6.6%) |
| $65,000 to $74,999 | 8,142 (5.9%) | 5,881 (4.7%) |
| $75,000 to $99,999 | 13,889 (10.0%) | 7,977 (6.3%) |
| $100,000+ | 25,237 (18.2%) | 10,403 (8.3%) |
| Total | 138,379 (100.0%) | 125,798 (100.0%) |
Earnings by Sex by Educational Attainment in Knox County
Average earnings in Knox County are $55,665 for men and $39,928 for women, a difference of 28.3%. Men with an educational attainment of graduate degree enjoy the highest average annual earnings of $98,160, while those with less than high school education earn the least with $29,933. Women with an educational attainment of graduate degree earn the most with the average annual earnings of $63,419, while those with less than high school education have the smallest earnings of $20,746.
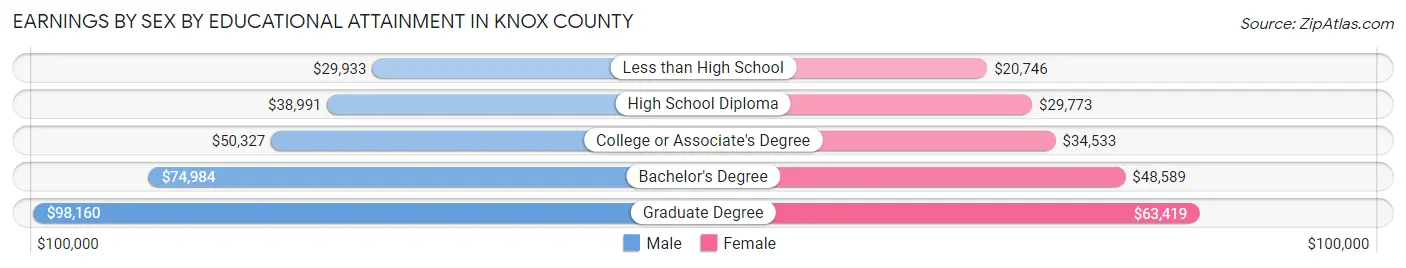
| Educational Attainment | Male Income | Female Income |
| Less than High School | $29,933 | $20,746 |
| High School Diploma | $38,991 | $29,773 |
| College or Associate's Degree | $50,327 | $34,533 |
| Bachelor's Degree | $74,984 | $48,589 |
| Graduate Degree | $98,160 | $63,419 |
| Total | $55,665 | $39,928 |
Family Income in Knox County
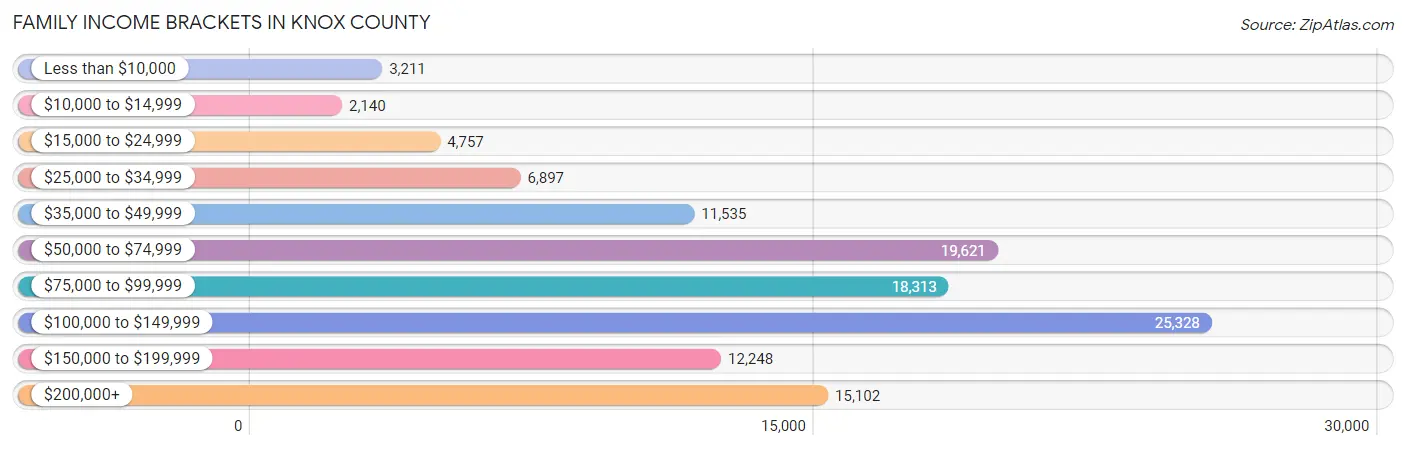
Family Income Brackets in Knox County
According to the Knox County family income data, there are 25,328 families falling into the $100,000 to $149,999 income range, which is the most common income bracket and makes up 21.3% of all families. Conversely, the $10,000 to $14,999 income bracket is the least frequent group with only 2,140 families (1.8%) belonging to this category.
| Income Bracket | # Families | % Families |
| Less than $10,000 | 3,211 | 2.7% |
| $10,000 to $14,999 | 2,140 | 1.8% |
| $15,000 to $24,999 | 4,757 | 4.0% |
| $25,000 to $34,999 | 6,897 | 5.8% |
| $35,000 to $49,999 | 11,535 | 9.7% |
| $50,000 to $74,999 | 19,621 | 16.5% |
| $75,000 to $99,999 | 18,313 | 15.4% |
| $100,000 to $149,999 | 25,328 | 21.3% |
| $150,000 to $199,999 | 12,248 | 10.3% |
| $200,000+ | 15,102 | 12.7% |
Family Income by Famaliy Size in Knox County
6-person families (2,666 | 2.2%) account for the highest median family income in Knox County with $112,530 per family, while 2-person families (59,088 | 49.7%) have the highest median income of $40,072 per family member.
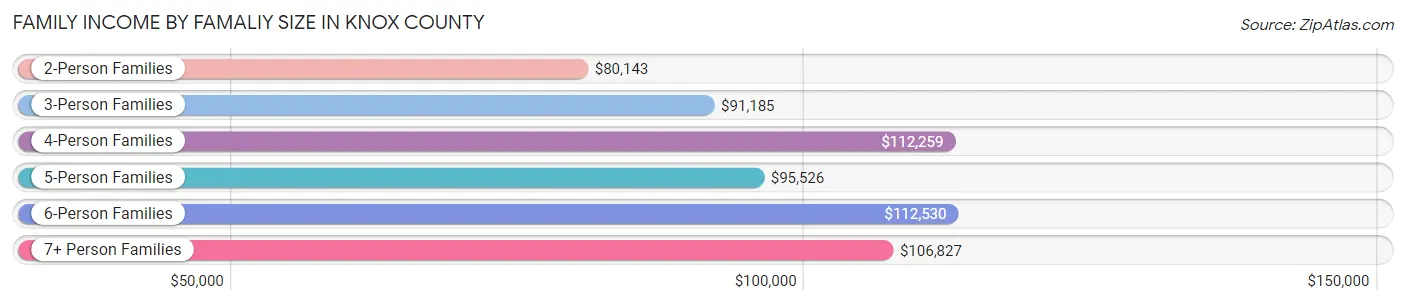
| Income Bracket | # Families | Median Income |
| 2-Person Families | 59,088 (49.7%) | $80,143 |
| 3-Person Families | 27,188 (22.9%) | $91,185 |
| 4-Person Families | 19,714 (16.6%) | $112,259 |
| 5-Person Families | 8,978 (7.5%) | $95,526 |
| 6-Person Families | 2,666 (2.2%) | $112,530 |
| 7+ Person Families | 1,279 (1.1%) | $106,827 |
| Total | 118,913 (100.0%) | $89,788 |
Family Income by Number of Earners in Knox County
The median family income in Knox County is $89,788, with families comprising 3+ earners (11,140) having the highest median family income of $140,310, while families with no earners (17,291) have the lowest median family income of $52,247, accounting for 9.4% and 14.5% of families, respectively.
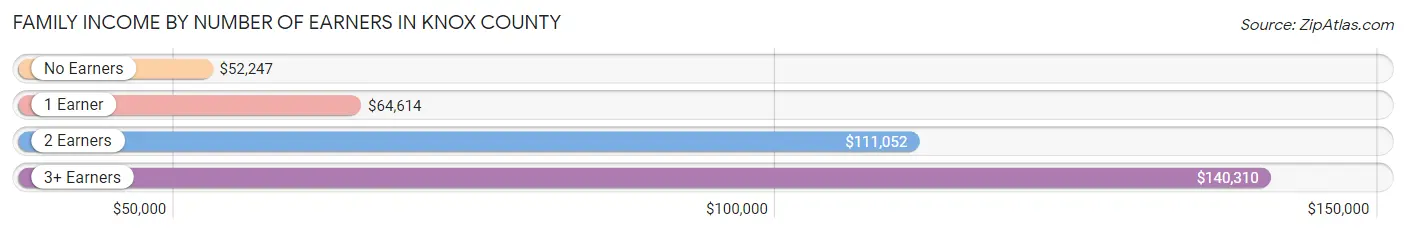
| Number of Earners | # Families | Median Income |
| No Earners | 17,291 (14.5%) | $52,247 |
| 1 Earner | 38,301 (32.2%) | $64,614 |
| 2 Earners | 52,181 (43.9%) | $111,052 |
| 3+ Earners | 11,140 (9.4%) | $140,310 |
| Total | 118,913 (100.0%) | $89,788 |
Household Income in Knox County
Household Income Brackets in Knox County
With 33,123 households falling in the category, the $50,000 to $74,999 income range is the most frequent in Knox County, accounting for 17.0% of all households. In contrast, only 8,183 households (4.2%) fall into the $10,000 to $14,999 income bracket, making it the least populous group.
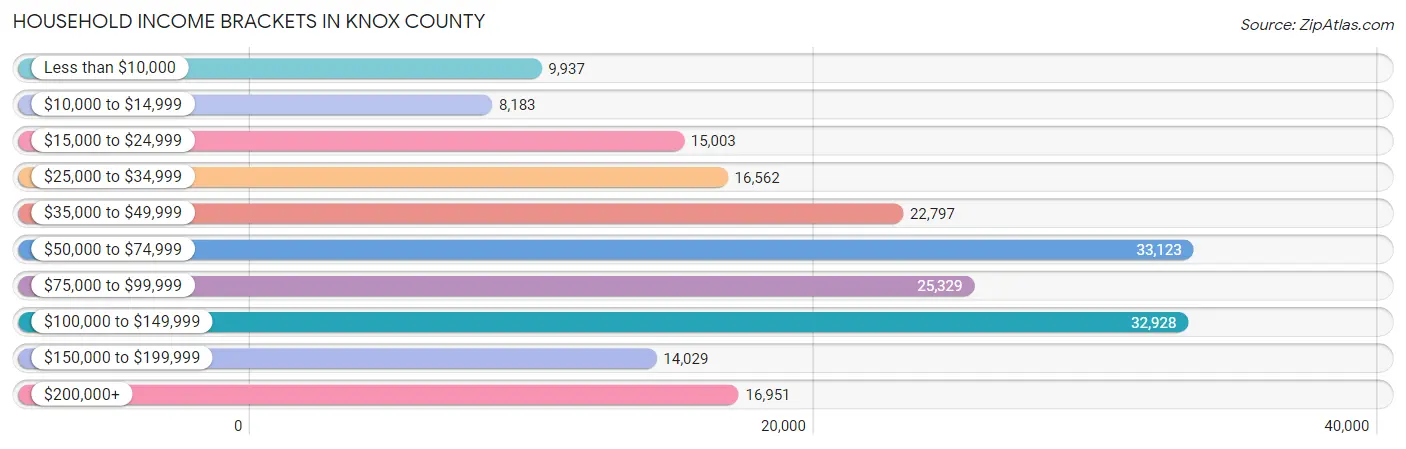
| Income Bracket | # Households | % Households |
| Less than $10,000 | 9,937 | 5.1% |
| $10,000 to $14,999 | 8,183 | 4.2% |
| $15,000 to $24,999 | 15,003 | 7.7% |
| $25,000 to $34,999 | 16,562 | 8.5% |
| $35,000 to $49,999 | 22,797 | 11.7% |
| $50,000 to $74,999 | 33,123 | 17.0% |
| $75,000 to $99,999 | 25,329 | 13.0% |
| $100,000 to $149,999 | 32,928 | 16.9% |
| $150,000 to $199,999 | 14,029 | 7.2% |
| $200,000+ | 16,951 | 8.7% |
Household Income by Householder Age in Knox County
The median household income in Knox County is $68,580, with the highest median household income of $84,777 found in the 45 to 64 years age bracket for the primary householder. A total of 68,195 households (35.0%) fall into this category. Meanwhile, the 15 to 24 years age bracket for the primary householder has the lowest median household income of $33,527, with 13,457 households (6.9%) in this group.
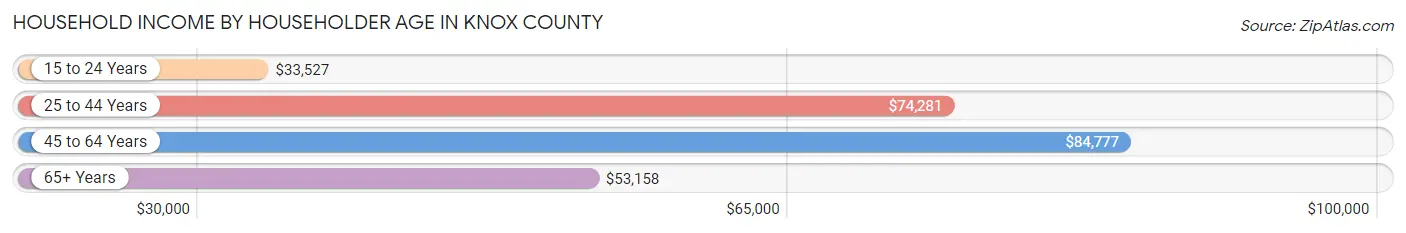
| Income Bracket | # Households | Median Income |
| 15 to 24 Years | 13,457 (6.9%) | $33,527 |
| 25 to 44 Years | 63,801 (32.7%) | $74,281 |
| 45 to 64 Years | 68,195 (35.0%) | $84,777 |
| 65+ Years | 49,389 (25.4%) | $53,158 |
| Total | 194,842 (100.0%) | $68,580 |
Poverty in Knox County
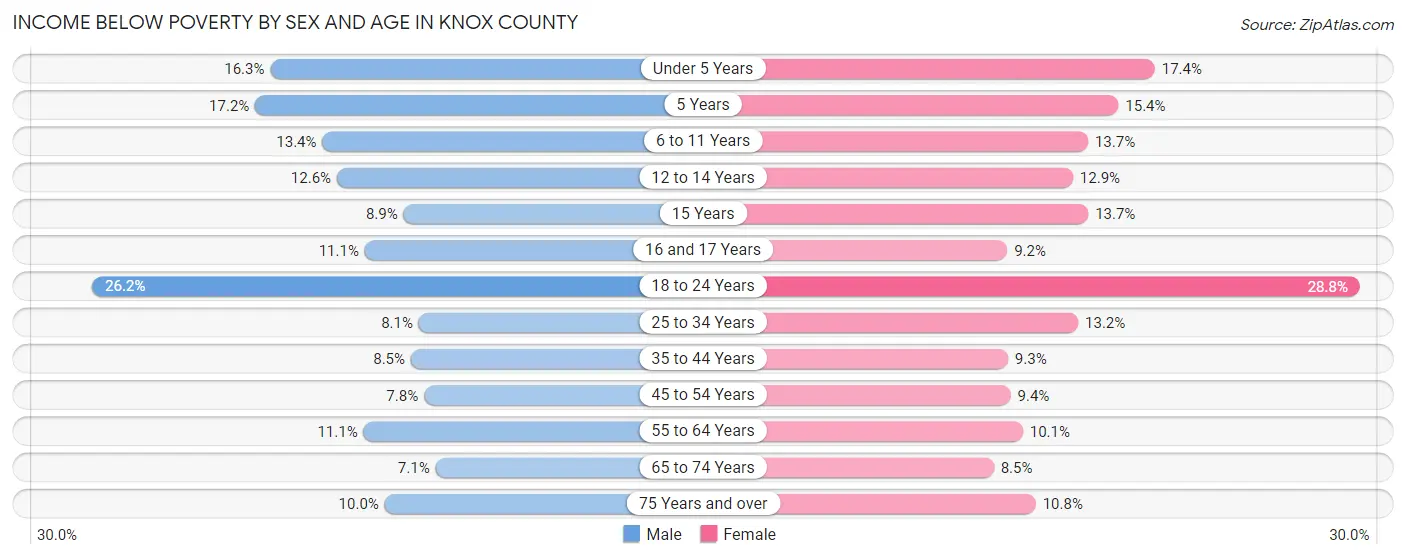
Income Below Poverty by Sex and Age in Knox County
With 11.8% poverty level for males and 13.0% for females among the residents of Knox County, 18 to 24 year old males and 18 to 24 year old females are the most vulnerable to poverty, with 6,957 males (26.2%) and 7,223 females (28.8%) in their respective age groups living below the poverty level.
| Age Bracket | Male | Female |
| Under 5 Years | 2,200 (16.3%) | 2,173 (17.4%) |
| 5 Years | 396 (17.2%) | 412 (15.4%) |
| 6 to 11 Years | 2,330 (13.4%) | 2,164 (13.7%) |
| 12 to 14 Years | 1,072 (12.6%) | 1,064 (12.9%) |
| 15 Years | 269 (8.9%) | 377 (13.7%) |
| 16 and 17 Years | 661 (11.1%) | 532 (9.2%) |
| 18 to 24 Years | 6,957 (26.2%) | 7,223 (28.8%) |
| 25 to 34 Years | 2,599 (8.1%) | 4,335 (13.2%) |
| 35 to 44 Years | 2,541 (8.5%) | 2,833 (9.2%) |
| 45 to 54 Years | 2,280 (7.8%) | 2,774 (9.4%) |
| 55 to 64 Years | 3,179 (11.1%) | 3,082 (10.1%) |
| 65 to 74 Years | 1,514 (7.1%) | 2,082 (8.5%) |
| 75 Years and over | 1,197 (10.0%) | 1,921 (10.8%) |
| Total | 27,195 (11.8%) | 30,972 (13.0%) |
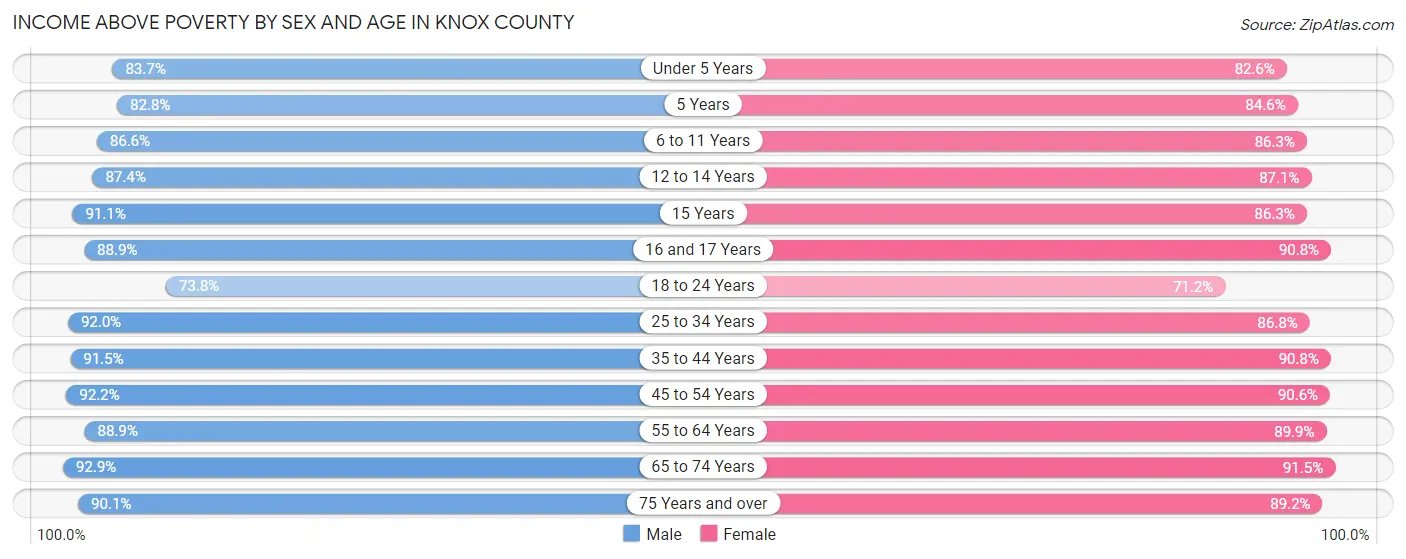
Income Above Poverty by Sex and Age in Knox County
According to the poverty statistics in Knox County, males aged 65 to 74 years and females aged 65 to 74 years are the age groups that are most secure financially, with 92.9% of males and 91.5% of females in these age groups living above the poverty line.
| Age Bracket | Male | Female |
| Under 5 Years | 11,284 (83.7%) | 10,292 (82.6%) |
| 5 Years | 1,912 (82.8%) | 2,263 (84.6%) |
| 6 to 11 Years | 15,034 (86.6%) | 13,620 (86.3%) |
| 12 to 14 Years | 7,429 (87.4%) | 7,205 (87.1%) |
| 15 Years | 2,754 (91.1%) | 2,370 (86.3%) |
| 16 and 17 Years | 5,313 (88.9%) | 5,245 (90.8%) |
| 18 to 24 Years | 19,559 (73.8%) | 17,819 (71.2%) |
| 25 to 34 Years | 29,702 (91.9%) | 28,609 (86.8%) |
| 35 to 44 Years | 27,402 (91.5%) | 27,807 (90.7%) |
| 45 to 54 Years | 27,083 (92.2%) | 26,741 (90.6%) |
| 55 to 64 Years | 25,382 (88.9%) | 27,507 (89.9%) |
| 65 to 74 Years | 19,739 (92.9%) | 22,529 (91.5%) |
| 75 Years and over | 10,834 (90.0%) | 15,858 (89.2%) |
| Total | 203,427 (88.2%) | 207,865 (87.0%) |
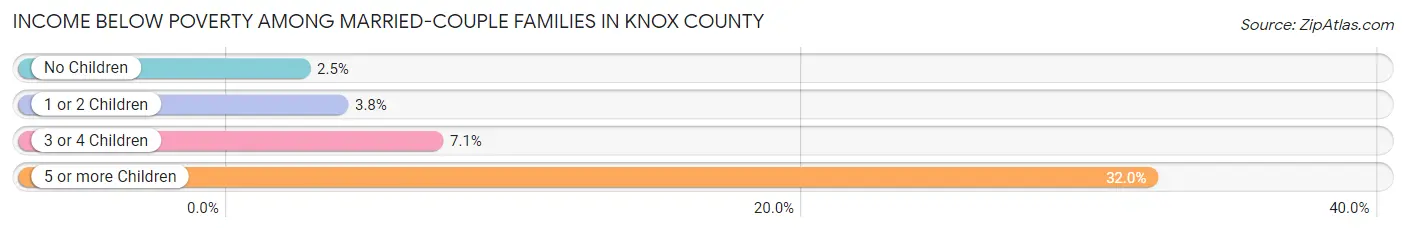
Income Below Poverty Among Married-Couple Families in Knox County
The poverty statistics for married-couple families in Knox County show that 3.5% or 3,157 of the total 90,464 families live below the poverty line. Families with 5 or more children have the highest poverty rate of 32.0%, comprising of 206 families. On the other hand, families with no children have the lowest poverty rate of 2.5%, which includes 1,352 families.
| Children | Above Poverty | Below Poverty |
| No Children | 52,603 (97.5%) | 1,352 (2.5%) |
| 1 or 2 Children | 27,988 (96.2%) | 1,116 (3.8%) |
| 3 or 4 Children | 6,279 (92.9%) | 483 (7.1%) |
| 5 or more Children | 437 (68.0%) | 206 (32.0%) |
| Total | 87,307 (96.5%) | 3,157 (3.5%) |
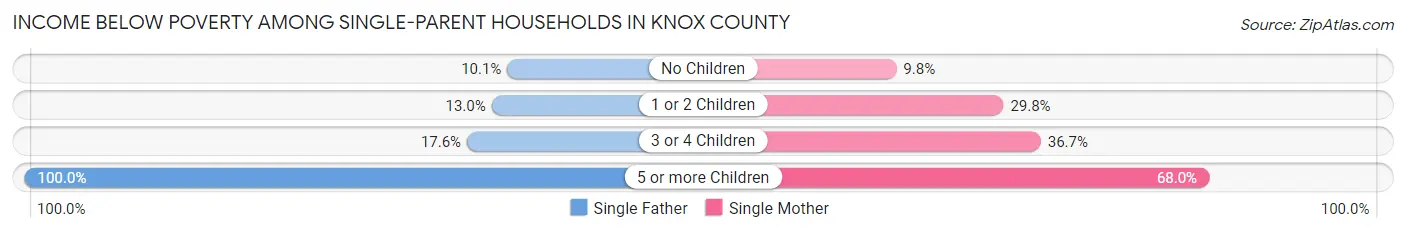
Income Below Poverty Among Single-Parent Households in Knox County
According to the poverty data in Knox County, 12.4% or 932 single-father households and 23.7% or 4,947 single-mother households are living below the poverty line. Among single-father households, those with 5 or more children have the highest poverty rate, with 32 households (100.0%) experiencing poverty. Likewise, among single-mother households, those with 5 or more children have the highest poverty rate, with 83 households (68.0%) falling below the poverty line.
| Children | Single Father | Single Mother |
| No Children | 346 (10.1%) | 738 (9.8%) |
| 1 or 2 Children | 470 (13.0%) | 3,200 (29.8%) |
| 3 or 4 Children | 84 (17.6%) | 926 (36.7%) |
| 5 or more Children | 32 (100.0%) | 83 (68.0%) |
| Total | 932 (12.4%) | 4,947 (23.7%) |
Income Below Poverty Among Married-Couple vs Single-Parent Households in Knox County
The poverty data for Knox County shows that 3,157 of the married-couple family households (3.5%) and 5,879 of the single-parent households (20.7%) are living below the poverty level. Within the married-couple family households, those with 5 or more children have the highest poverty rate, with 206 households (32.0%) falling below the poverty line. Among the single-parent households, those with 5 or more children have the highest poverty rate, with 115 household (74.7%) living below poverty.
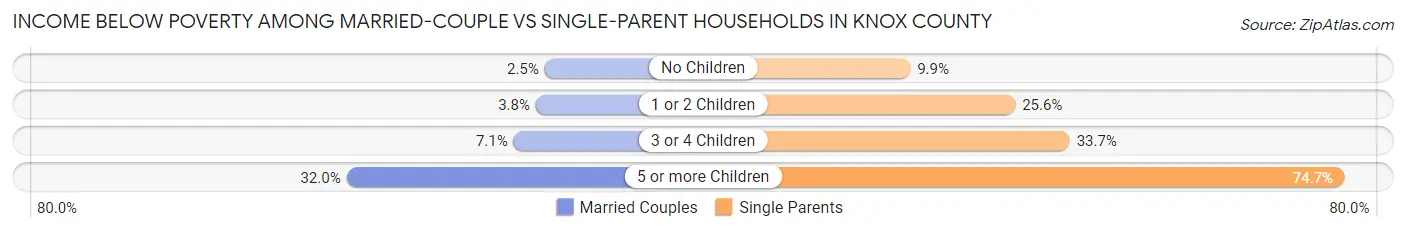
| Children | Married-Couple Families | Single-Parent Households |
| No Children | 1,352 (2.5%) | 1,084 (9.9%) |
| 1 or 2 Children | 1,116 (3.8%) | 3,670 (25.6%) |
| 3 or 4 Children | 483 (7.1%) | 1,010 (33.7%) |
| 5 or more Children | 206 (32.0%) | 115 (74.7%) |
| Total | 3,157 (3.5%) | 5,879 (20.7%) |
Employment Characteristics in Knox County
Employment by Class of Employer in Knox County
Among the 238,588 employed individuals in Knox County, private company employees (164,267 | 68.9%), not-for-profit organizations (20,191 | 8.5%), and state government employees (14,005 | 5.9%) make up the most common classes of employment.
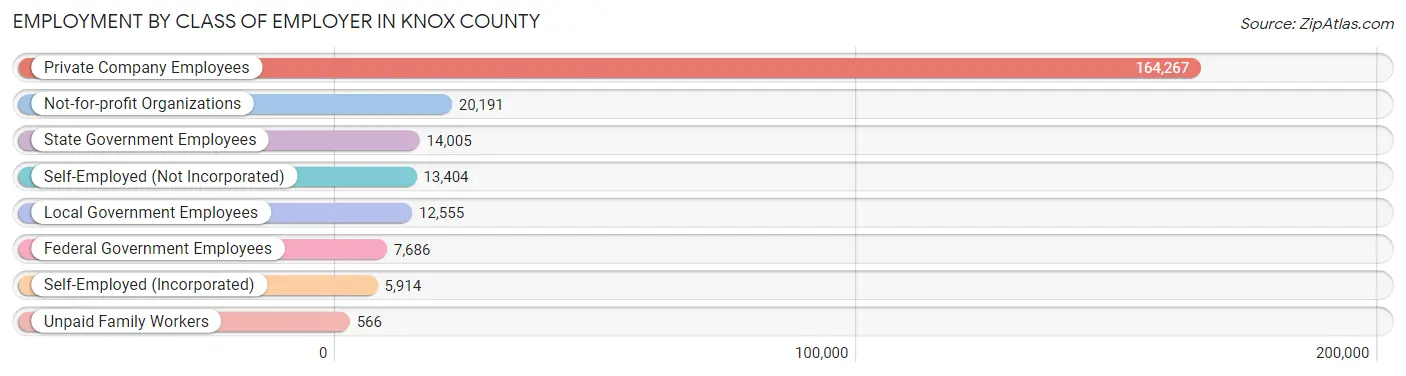
| Employer Class | # Employees | % Employees |
| Private Company Employees | 164,267 | 68.9% |
| Self-Employed (Incorporated) | 5,914 | 2.5% |
| Self-Employed (Not Incorporated) | 13,404 | 5.6% |
| Not-for-profit Organizations | 20,191 | 8.5% |
| Local Government Employees | 12,555 | 5.3% |
| State Government Employees | 14,005 | 5.9% |
| Federal Government Employees | 7,686 | 3.2% |
| Unpaid Family Workers | 566 | 0.2% |
| Total | 238,588 | 100.0% |
Employment Status by Age in Knox County
According to the labor force statistics for Knox County, out of the total population over 16 years of age (393,242), 64.2% or 252,461 individuals are in the labor force, with 3.8% or 9,594 of them unemployed. The age group with the highest labor force participation rate is 25 to 29 years, with 85.3% or 28,932 individuals in the labor force. Within the labor force, the 16 to 19 years age range has the highest percentage of unemployed individuals, with 11.1% or 1,266 of them being unemployed.
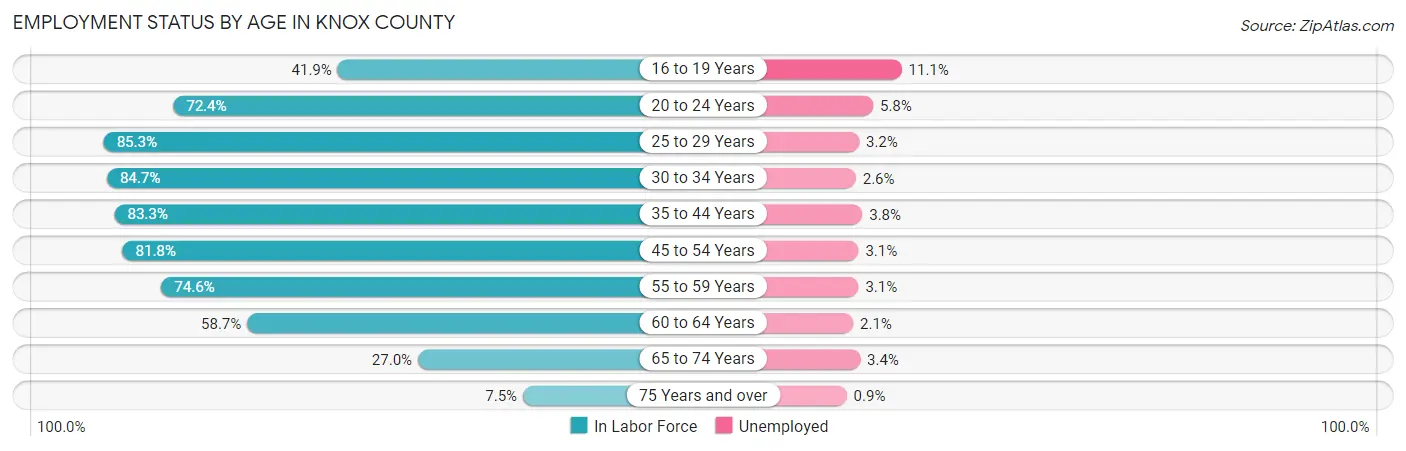
| Age Bracket | In Labor Force | Unemployed |
| 16 to 19 Years | 11,401 (41.9%) | 1,266 (11.1%) |
| 20 to 24 Years | 31,464 (72.4%) | 1,825 (5.8%) |
| 25 to 29 Years | 28,932 (85.3%) | 926 (3.2%) |
| 30 to 34 Years | 26,958 (84.7%) | 701 (2.6%) |
| 35 to 44 Years | 50,815 (83.3%) | 1,931 (3.8%) |
| 45 to 54 Years | 48,359 (81.8%) | 1,499 (3.1%) |
| 55 to 59 Years | 22,405 (74.6%) | 695 (3.1%) |
| 60 to 64 Years | 17,213 (58.7%) | 361 (2.1%) |
| 65 to 74 Years | 12,471 (27.0%) | 424 (3.4%) |
| 75 Years and over | 2,337 (7.5%) | 21 (0.9%) |
| Total | 252,461 (64.2%) | 9,594 (3.8%) |
Employment Status by Educational Attainment in Knox County
According to labor force statistics for Knox County, 79.4% of individuals (194,709) out of the total population between 25 and 64 years of age (245,226) are in the labor force, with 3.1% or 6,036 of them being unemployed. The group with the highest labor force participation rate are those with the educational attainment of bachelor's degree or higher, with 86.5% or 86,844 individuals in the labor force. Within the labor force, individuals with less than high school education have the highest percentage of unemployment, with 6.8% or 680 of them being unemployed.
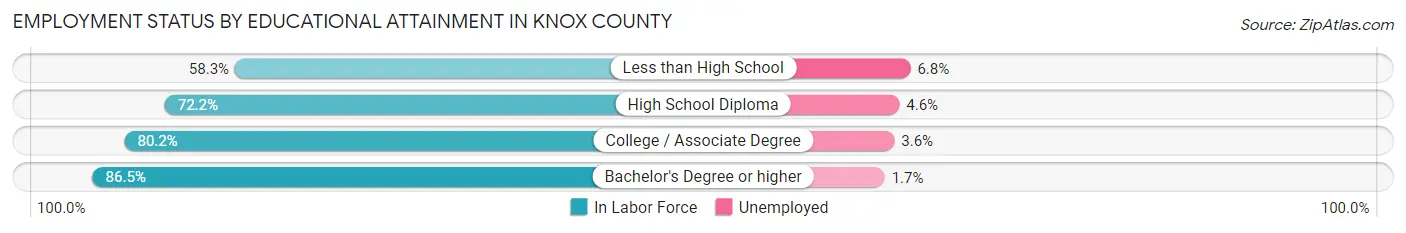
| Educational Attainment | In Labor Force | Unemployed |
| Less than High School | 9,996 (58.3%) | 1,166 (6.8%) |
| High School Diploma | 41,297 (72.2%) | 2,631 (4.6%) |
| College / Associate Degree | 56,528 (80.2%) | 2,537 (3.6%) |
| Bachelor's Degree or higher | 86,844 (86.5%) | 1,707 (1.7%) |
| Total | 194,709 (79.4%) | 7,602 (3.1%) |
Employment Occupations by Sex in Knox County
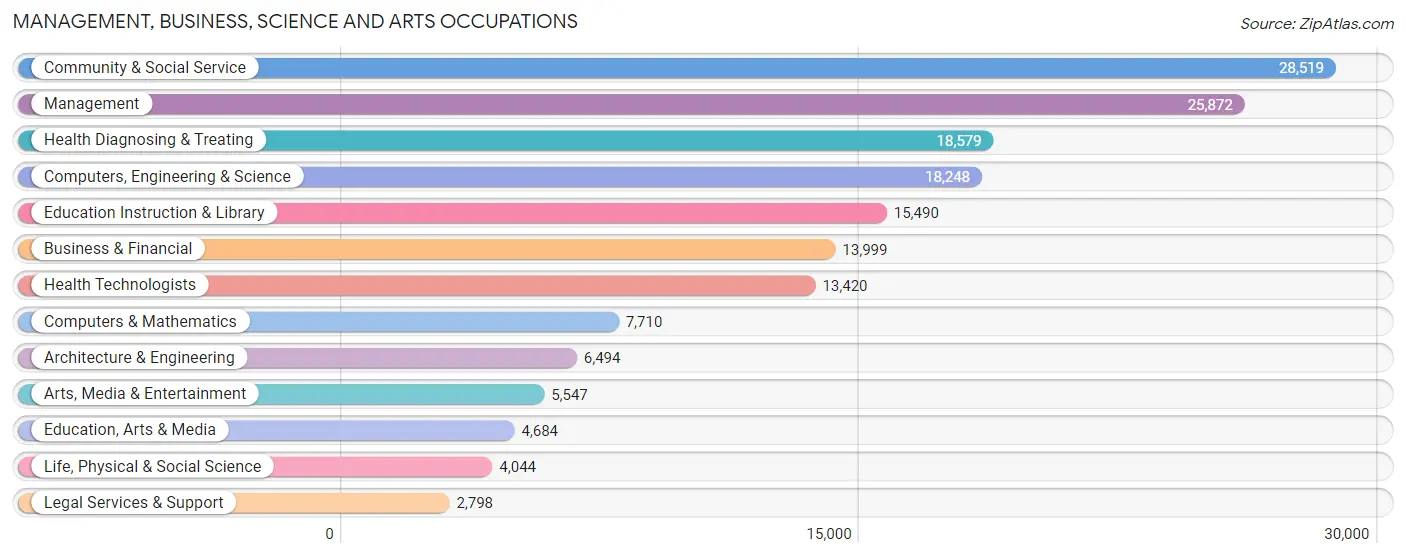
Management, Business, Science and Arts Occupations
The most common Management, Business, Science and Arts occupations in Knox County are Community & Social Service (28,519 | 11.8%), Management (25,872 | 10.7%), Health Diagnosing & Treating (18,579 | 7.7%), Computers, Engineering & Science (18,248 | 7.5%), and Education Instruction & Library (15,490 | 6.4%).
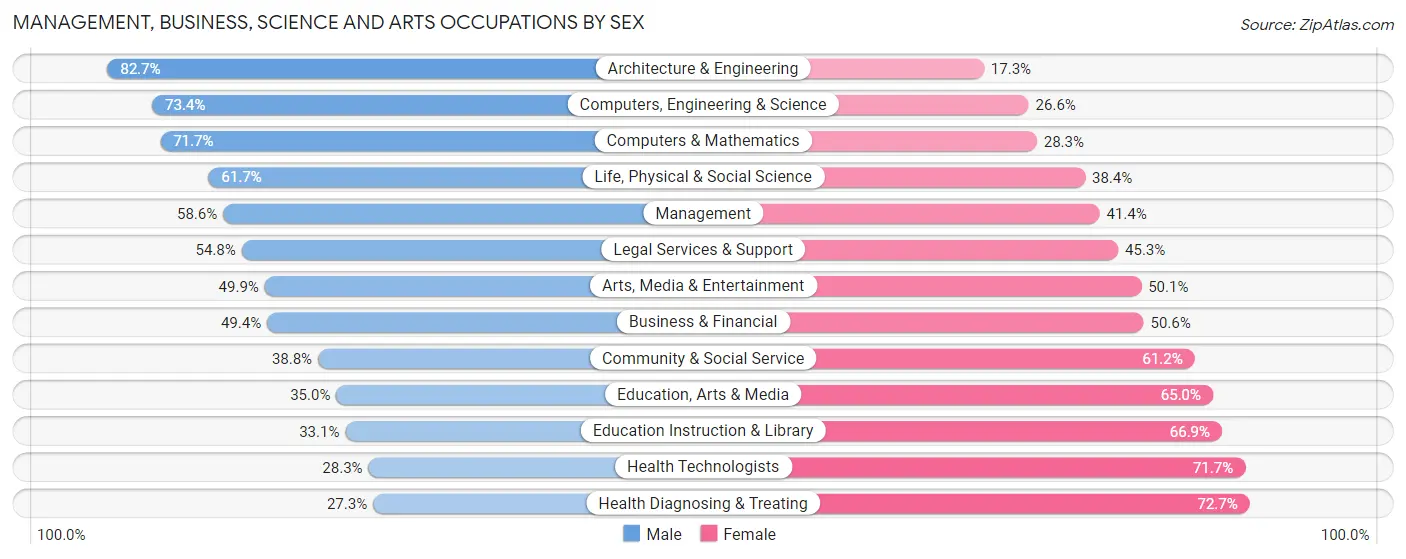
Management, Business, Science and Arts Occupations by Sex
Within the Management, Business, Science and Arts occupations in Knox County, the most male-oriented occupations are Architecture & Engineering (82.7%), Computers, Engineering & Science (73.4%), and Computers & Mathematics (71.7%), while the most female-oriented occupations are Health Diagnosing & Treating (72.7%), Health Technologists (71.7%), and Education Instruction & Library (66.9%).
| Occupation | Male | Female |
| Management | 15,163 (58.6%) | 10,709 (41.4%) |
| Business & Financial | 6,921 (49.4%) | 7,078 (50.6%) |
| Computers, Engineering & Science | 13,395 (73.4%) | 4,853 (26.6%) |
| Computers & Mathematics | 5,529 (71.7%) | 2,181 (28.3%) |
| Architecture & Engineering | 5,373 (82.7%) | 1,121 (17.3%) |
| Life, Physical & Social Science | 2,493 (61.7%) | 1,551 (38.4%) |
| Community & Social Service | 11,068 (38.8%) | 17,451 (61.2%) |
| Education, Arts & Media | 1,639 (35.0%) | 3,045 (65.0%) |
| Legal Services & Support | 1,532 (54.7%) | 1,266 (45.3%) |
| Education Instruction & Library | 5,128 (33.1%) | 10,362 (66.9%) |
| Arts, Media & Entertainment | 2,769 (49.9%) | 2,778 (50.1%) |
| Health Diagnosing & Treating | 5,077 (27.3%) | 13,502 (72.7%) |
| Health Technologists | 3,795 (28.3%) | 9,625 (71.7%) |
| Total (Category) | 51,624 (49.1%) | 53,593 (50.9%) |
| Total (Overall) | 127,619 (52.7%) | 114,727 (47.3%) |
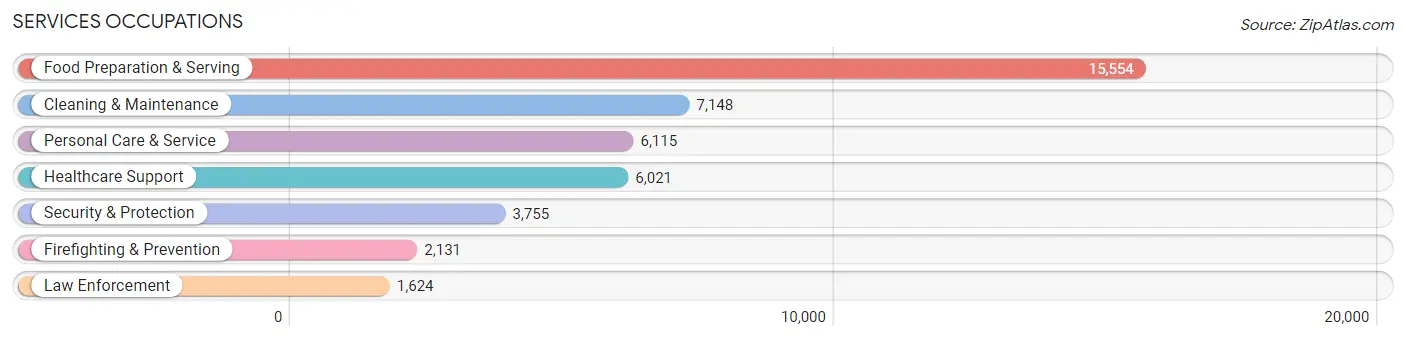
Services Occupations
The most common Services occupations in Knox County are Food Preparation & Serving (15,554 | 6.4%), Cleaning & Maintenance (7,148 | 2.9%), Personal Care & Service (6,115 | 2.5%), Healthcare Support (6,021 | 2.5%), and Security & Protection (3,755 | 1.5%).
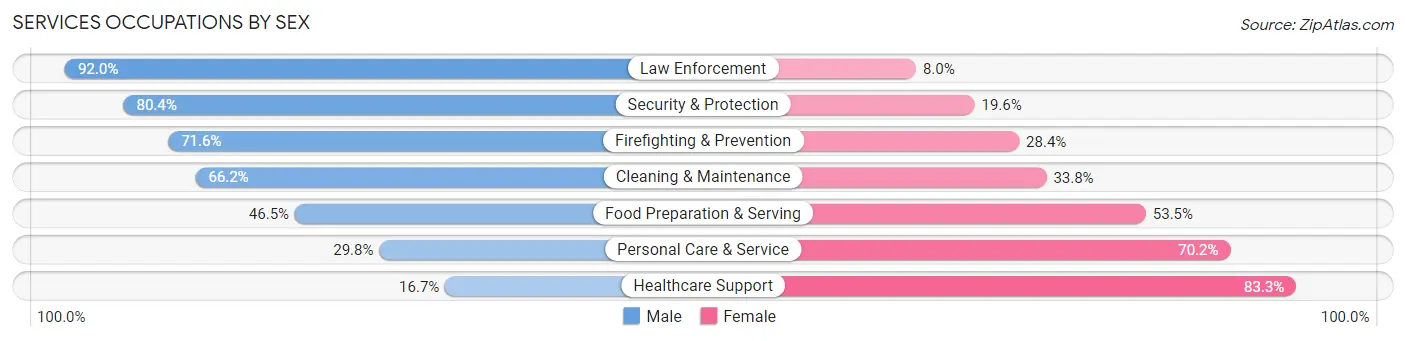
Services Occupations by Sex
Within the Services occupations in Knox County, the most male-oriented occupations are Law Enforcement (92.0%), Security & Protection (80.4%), and Firefighting & Prevention (71.6%), while the most female-oriented occupations are Healthcare Support (83.3%), Personal Care & Service (70.2%), and Food Preparation & Serving (53.5%).
| Occupation | Male | Female |
| Healthcare Support | 1,007 (16.7%) | 5,014 (83.3%) |
| Security & Protection | 3,019 (80.4%) | 736 (19.6%) |
| Firefighting & Prevention | 1,525 (71.6%) | 606 (28.4%) |
| Law Enforcement | 1,494 (92.0%) | 130 (8.0%) |
| Food Preparation & Serving | 7,228 (46.5%) | 8,326 (53.5%) |
| Cleaning & Maintenance | 4,729 (66.2%) | 2,419 (33.8%) |
| Personal Care & Service | 1,820 (29.8%) | 4,295 (70.2%) |
| Total (Category) | 17,803 (46.1%) | 20,790 (53.9%) |
| Total (Overall) | 127,619 (52.7%) | 114,727 (47.3%) |
Sales and Office Occupations
The most common Sales and Office occupations in Knox County are Office & Administration (27,980 | 11.6%), and Sales & Related (26,912 | 11.1%).
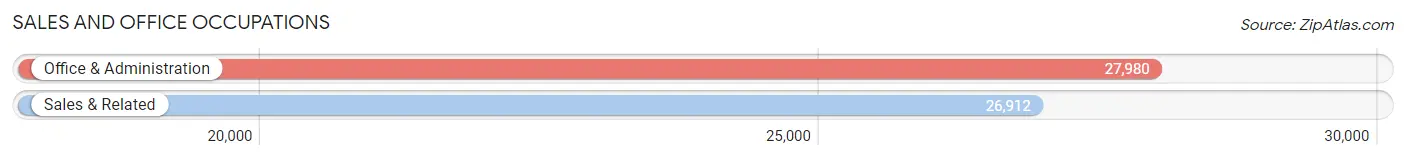
Sales and Office Occupations by Sex
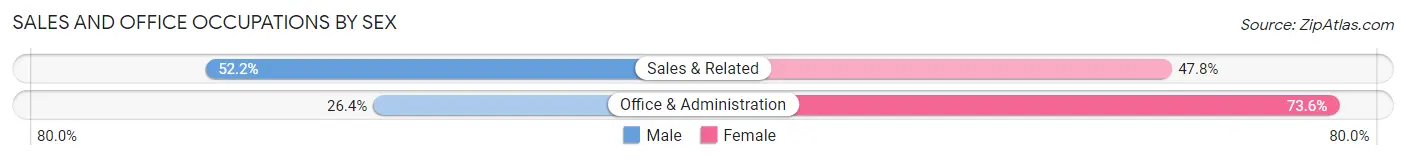
| Occupation | Male | Female |
| Sales & Related | 14,051 (52.2%) | 12,861 (47.8%) |
| Office & Administration | 7,385 (26.4%) | 20,595 (73.6%) |
| Total (Category) | 21,436 (39.1%) | 33,456 (61.0%) |
| Total (Overall) | 127,619 (52.7%) | 114,727 (47.3%) |
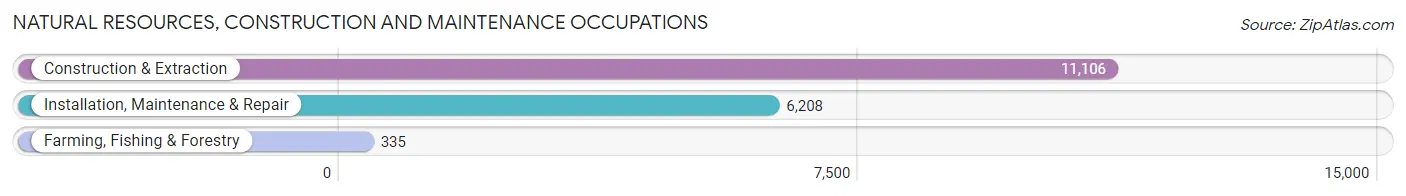
Natural Resources, Construction and Maintenance Occupations
The most common Natural Resources, Construction and Maintenance occupations in Knox County are Construction & Extraction (11,106 | 4.6%), Installation, Maintenance & Repair (6,208 | 2.6%), and Farming, Fishing & Forestry (335 | 0.1%).
Natural Resources, Construction and Maintenance Occupations by Sex
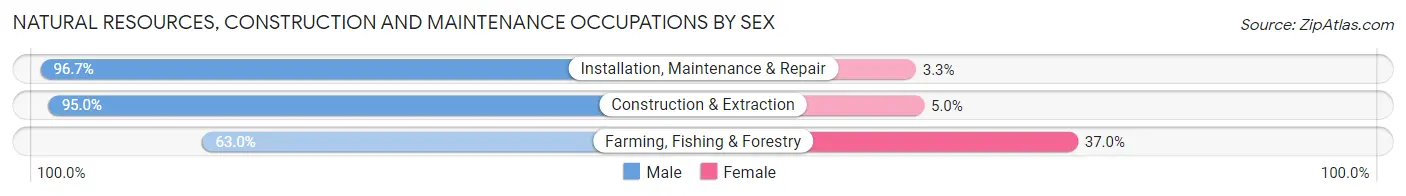
| Occupation | Male | Female |
| Farming, Fishing & Forestry | 211 (63.0%) | 124 (37.0%) |
| Construction & Extraction | 10,548 (95.0%) | 558 (5.0%) |
| Installation, Maintenance & Repair | 6,003 (96.7%) | 205 (3.3%) |
| Total (Category) | 16,762 (95.0%) | 887 (5.0%) |
| Total (Overall) | 127,619 (52.7%) | 114,727 (47.3%) |
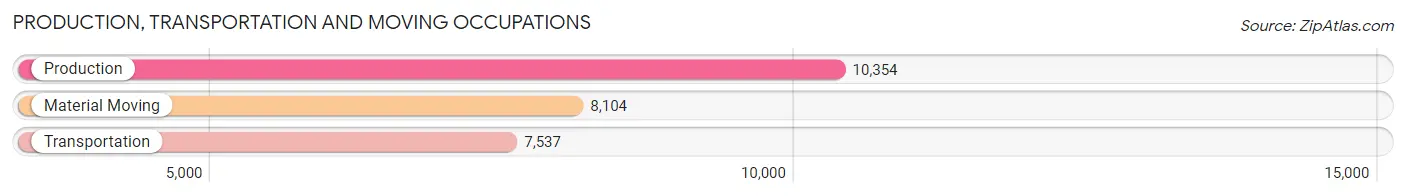
Production, Transportation and Moving Occupations
The most common Production, Transportation and Moving occupations in Knox County are Production (10,354 | 4.3%), Material Moving (8,104 | 3.3%), and Transportation (7,537 | 3.1%).
Production, Transportation and Moving Occupations by Sex
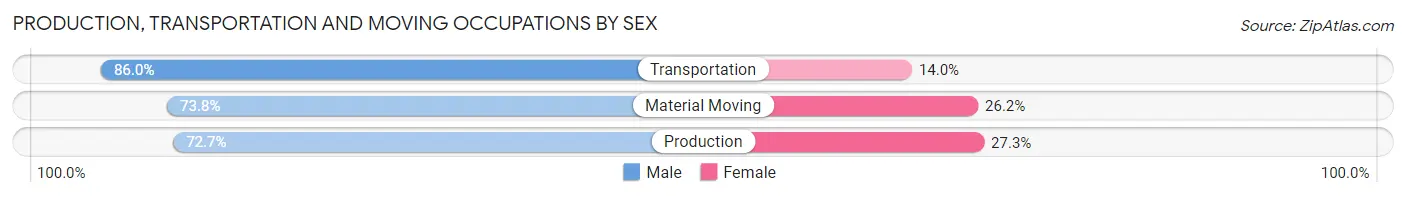
| Occupation | Male | Female |
| Production | 7,530 (72.7%) | 2,824 (27.3%) |
| Transportation | 6,480 (86.0%) | 1,057 (14.0%) |
| Material Moving | 5,984 (73.8%) | 2,120 (26.2%) |
| Total (Category) | 19,994 (76.9%) | 6,001 (23.1%) |
| Total (Overall) | 127,619 (52.7%) | 114,727 (47.3%) |
Employment Industries by Sex in Knox County
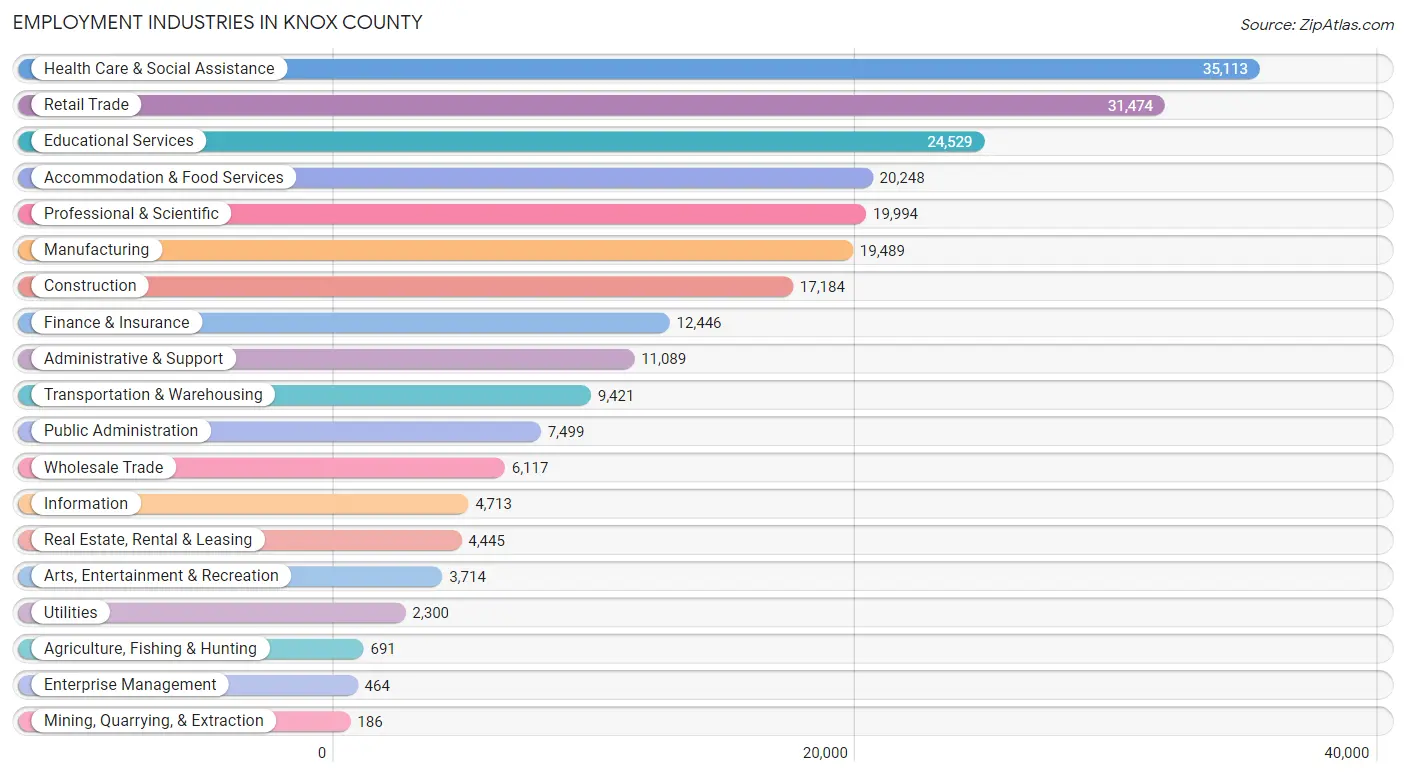
Employment Industries in Knox County
The major employment industries in Knox County include Health Care & Social Assistance (35,113 | 14.5%), Retail Trade (31,474 | 13.0%), Educational Services (24,529 | 10.1%), Accommodation & Food Services (20,248 | 8.4%), and Professional & Scientific (19,994 | 8.3%).
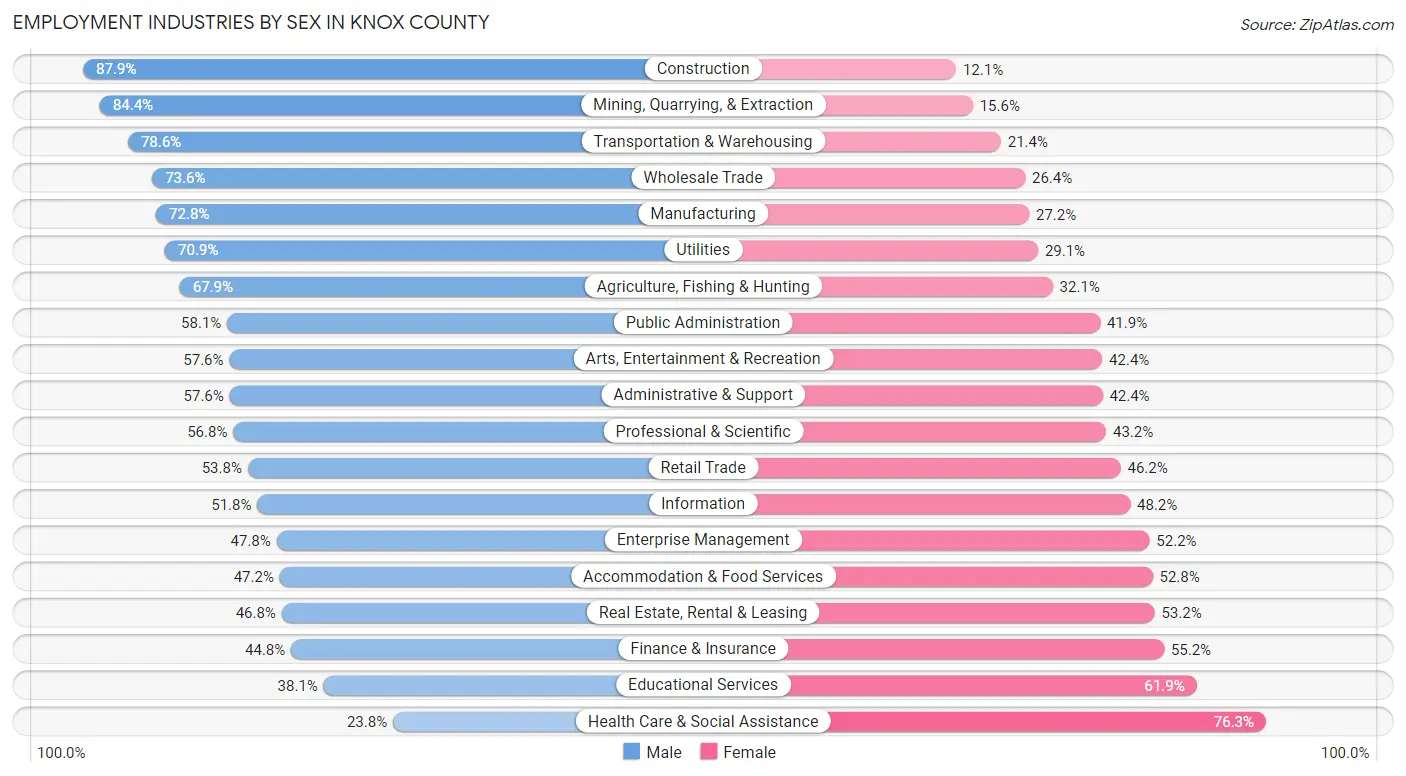
Employment Industries by Sex in Knox County
The Knox County industries that see more men than women are Construction (87.9%), Mining, Quarrying, & Extraction (84.4%), and Transportation & Warehousing (78.6%), whereas the industries that tend to have a higher number of women are Health Care & Social Assistance (76.2%), Educational Services (61.9%), and Finance & Insurance (55.2%).
| Industry | Male | Female |
| Agriculture, Fishing & Hunting | 469 (67.9%) | 222 (32.1%) |
| Mining, Quarrying, & Extraction | 157 (84.4%) | 29 (15.6%) |
| Construction | 15,101 (87.9%) | 2,083 (12.1%) |
| Manufacturing | 14,181 (72.8%) | 5,308 (27.2%) |
| Wholesale Trade | 4,501 (73.6%) | 1,616 (26.4%) |
| Retail Trade | 16,935 (53.8%) | 14,539 (46.2%) |
| Transportation & Warehousing | 7,405 (78.6%) | 2,016 (21.4%) |
| Utilities | 1,631 (70.9%) | 669 (29.1%) |
| Information | 2,443 (51.8%) | 2,270 (48.2%) |
| Finance & Insurance | 5,579 (44.8%) | 6,867 (55.2%) |
| Real Estate, Rental & Leasing | 2,080 (46.8%) | 2,365 (53.2%) |
| Professional & Scientific | 11,361 (56.8%) | 8,633 (43.2%) |
| Enterprise Management | 222 (47.8%) | 242 (52.2%) |
| Administrative & Support | 6,383 (57.6%) | 4,706 (42.4%) |
| Educational Services | 9,345 (38.1%) | 15,184 (61.9%) |
| Health Care & Social Assistance | 8,339 (23.7%) | 26,774 (76.2%) |
| Arts, Entertainment & Recreation | 2,140 (57.6%) | 1,574 (42.4%) |
| Accommodation & Food Services | 9,556 (47.2%) | 10,692 (52.8%) |
| Public Administration | 4,355 (58.1%) | 3,144 (41.9%) |
| Total | 127,619 (52.7%) | 114,727 (47.3%) |
Education in Knox County
School Enrollment in Knox County
The most common levels of schooling among the 122,286 students in Knox County are college / undergraduate (34,736 | 28.4%), high school (23,109 | 18.9%), and middle school (22,118 | 18.1%).
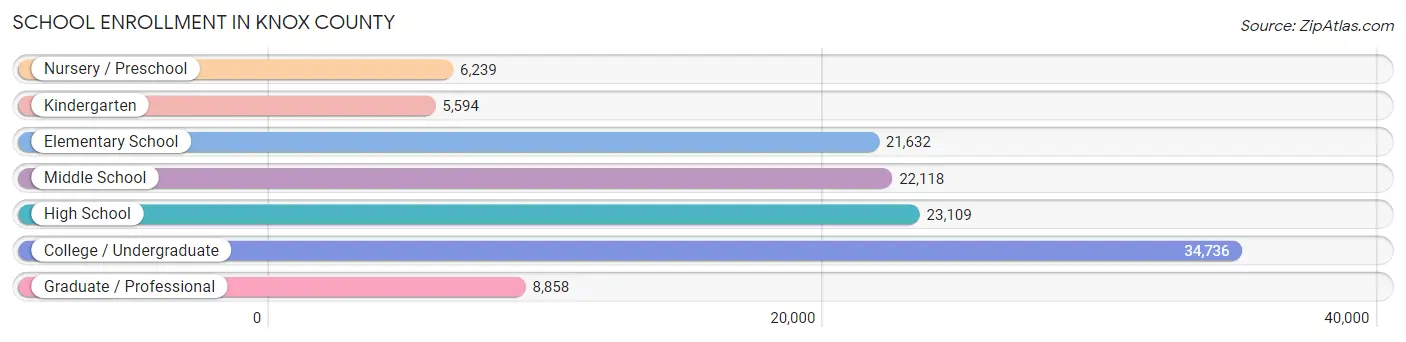
| School Level | # Students | % Students |
| Nursery / Preschool | 6,239 | 5.1% |
| Kindergarten | 5,594 | 4.6% |
| Elementary School | 21,632 | 17.7% |
| Middle School | 22,118 | 18.1% |
| High School | 23,109 | 18.9% |
| College / Undergraduate | 34,736 | 28.4% |
| Graduate / Professional | 8,858 | 7.2% |
| Total | 122,286 | 100.0% |
School Enrollment by Age by Funding Source in Knox County
Out of a total of 122,286 students who are enrolled in schools in Knox County, 21,645 (17.7%) attend a private institution, while the remaining 100,641 (82.3%) are enrolled in public schools. The age group of 3 to 4 year olds has the highest likelihood of being enrolled in private schools, with 2,454 (50.2% in the age bracket) enrolled. Conversely, the age group of 18 to 19 year olds has the lowest likelihood of being enrolled in a private school, with 11,308 (91.7% in the age bracket) attending a public institution.
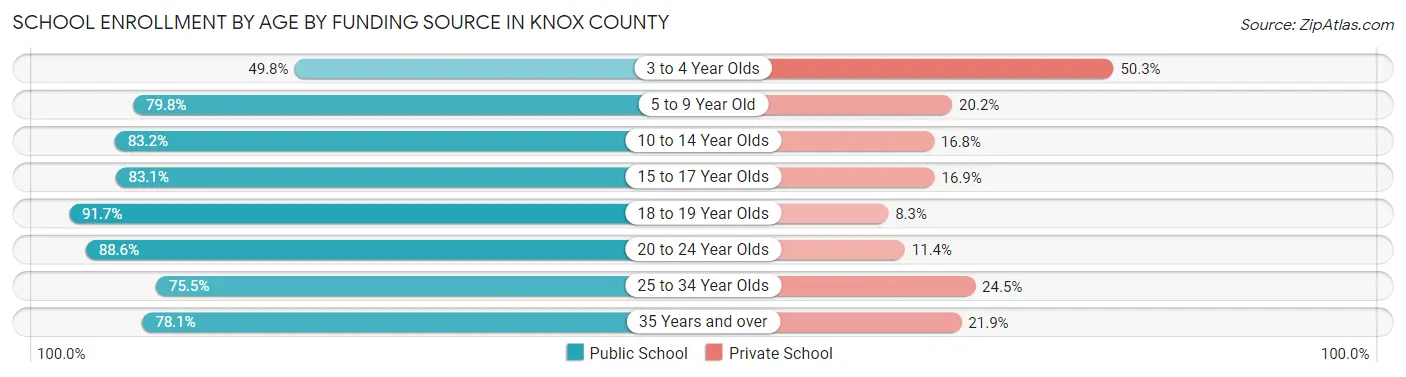
| Age Bracket | Public School | Private School |
| 3 to 4 Year Olds | 2,430 (49.7%) | 2,454 (50.2%) |
| 5 to 9 Year Old | 19,999 (79.8%) | 5,065 (20.2%) |
| 10 to 14 Year Olds | 23,472 (83.2%) | 4,739 (16.8%) |
| 15 to 17 Year Olds | 14,158 (83.1%) | 2,888 (16.9%) |
| 18 to 19 Year Olds | 11,308 (91.7%) | 1,023 (8.3%) |
| 20 to 24 Year Olds | 19,957 (88.6%) | 2,569 (11.4%) |
| 25 to 34 Year Olds | 5,549 (75.5%) | 1,800 (24.5%) |
| 35 Years and over | 3,806 (78.1%) | 1,069 (21.9%) |
| Total | 100,641 (82.3%) | 21,645 (17.7%) |
Educational Attainment by Field of Study in Knox County
Business (25,999 | 19.1%), education (14,343 | 10.5%), science & technology (14,134 | 10.4%), engineering (12,264 | 9.0%), and bio, nature & agricultural (10,502 | 7.7%) are the most common fields of study among 136,335 individuals in Knox County who have obtained a bachelor's degree or higher.
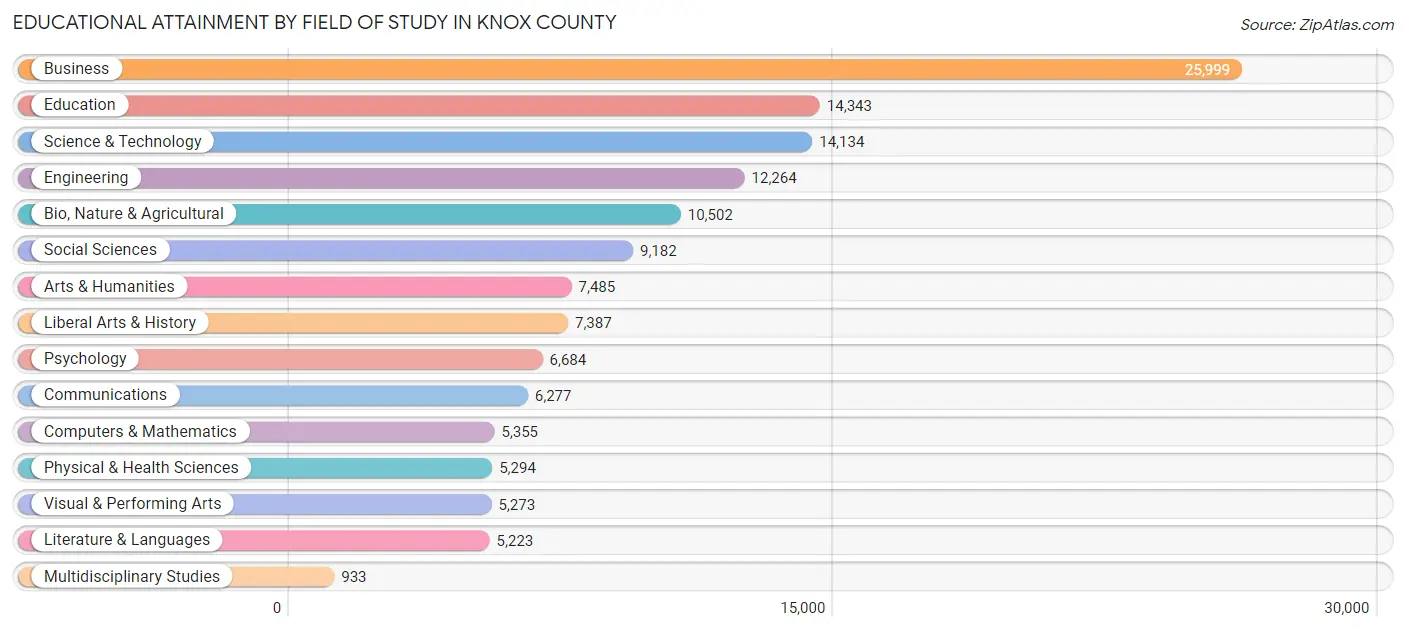
| Field of Study | # Graduates | % Graduates |
| Computers & Mathematics | 5,355 | 3.9% |
| Bio, Nature & Agricultural | 10,502 | 7.7% |
| Physical & Health Sciences | 5,294 | 3.9% |
| Psychology | 6,684 | 4.9% |
| Social Sciences | 9,182 | 6.7% |
| Engineering | 12,264 | 9.0% |
| Multidisciplinary Studies | 933 | 0.7% |
| Science & Technology | 14,134 | 10.4% |
| Business | 25,999 | 19.1% |
| Education | 14,343 | 10.5% |
| Literature & Languages | 5,223 | 3.8% |
| Liberal Arts & History | 7,387 | 5.4% |
| Visual & Performing Arts | 5,273 | 3.9% |
| Communications | 6,277 | 4.6% |
| Arts & Humanities | 7,485 | 5.5% |
| Total | 136,335 | 100.0% |
Transportation & Commute in Knox County
Vehicle Availability by Sex in Knox County
The most prevalent vehicle ownership categories in Knox County are males with 2 vehicles (56,565, accounting for 45.2%) and females with 2 vehicles (48,321, making up 51.1%).
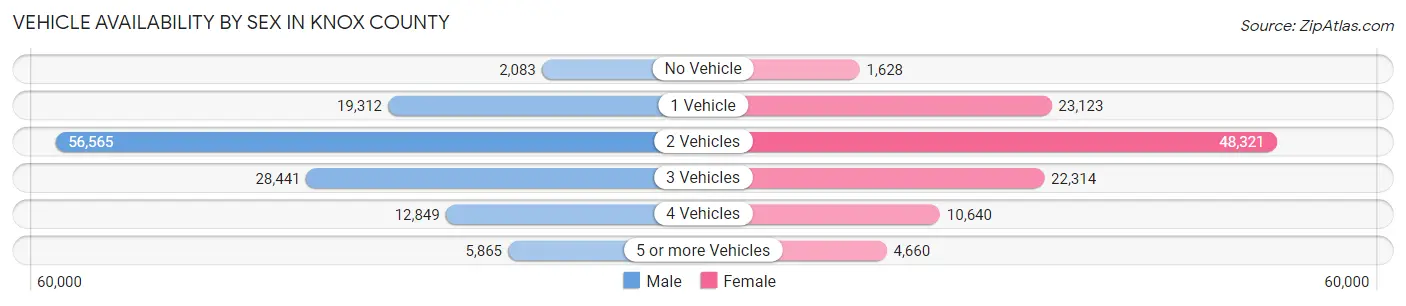
| Vehicles Available | Male | Female |
| No Vehicle | 2,083 (1.7%) | 1,628 (1.5%) |
| 1 Vehicle | 19,312 (15.4%) | 23,123 (20.9%) |
| 2 Vehicles | 56,565 (45.2%) | 48,321 (43.7%) |
| 3 Vehicles | 28,441 (22.7%) | 22,314 (20.2%) |
| 4 Vehicles | 12,849 (10.3%) | 10,640 (9.6%) |
| 5 or more Vehicles | 5,865 (4.7%) | 4,660 (4.2%) |
| Total | 125,115 (100.0%) | 110,686 (100.0%) |
Commute Time in Knox County
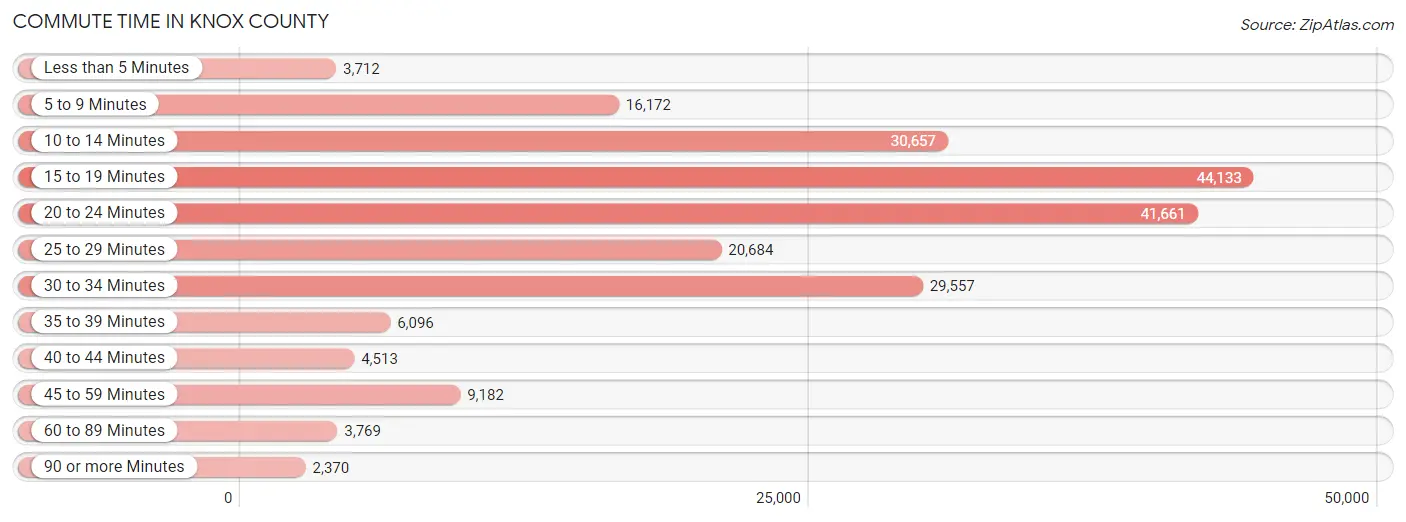
The most frequently occuring commute durations in Knox County are 15 to 19 minutes (44,133 commuters, 20.8%), 20 to 24 minutes (41,661 commuters, 19.6%), and 10 to 14 minutes (30,657 commuters, 14.4%).
| Commute Time | # Commuters | % Commuters |
| Less than 5 Minutes | 3,712 | 1.8% |
| 5 to 9 Minutes | 16,172 | 7.6% |
| 10 to 14 Minutes | 30,657 | 14.4% |
| 15 to 19 Minutes | 44,133 | 20.8% |
| 20 to 24 Minutes | 41,661 | 19.6% |
| 25 to 29 Minutes | 20,684 | 9.7% |
| 30 to 34 Minutes | 29,557 | 13.9% |
| 35 to 39 Minutes | 6,096 | 2.9% |
| 40 to 44 Minutes | 4,513 | 2.1% |
| 45 to 59 Minutes | 9,182 | 4.3% |
| 60 to 89 Minutes | 3,769 | 1.8% |
| 90 or more Minutes | 2,370 | 1.1% |
Commute Time by Sex in Knox County
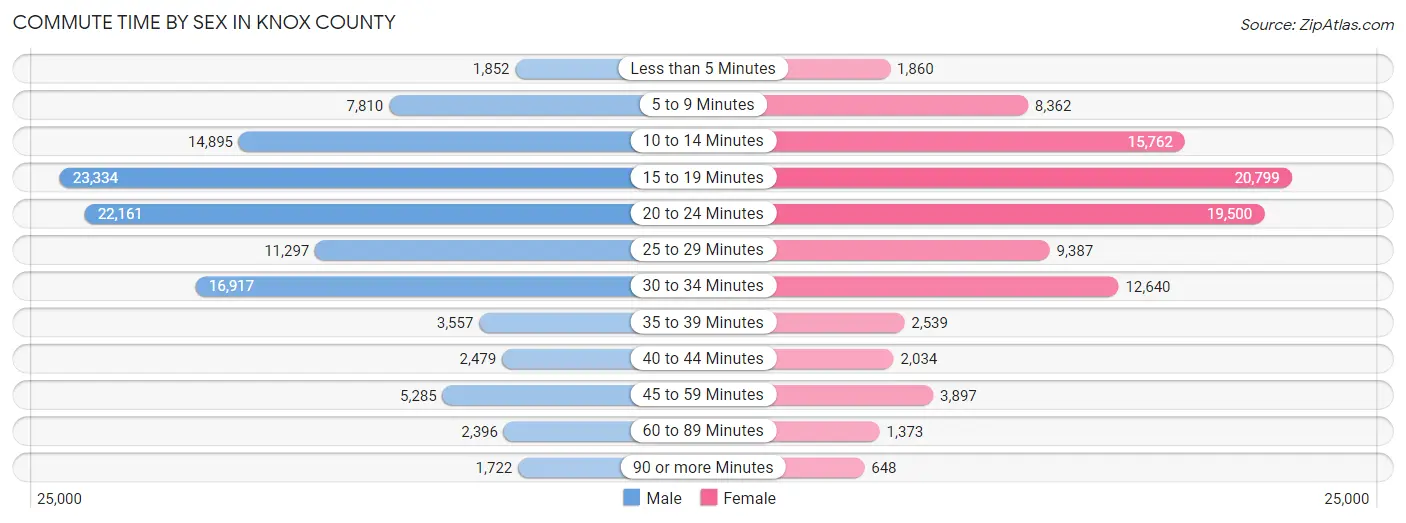
The most common commute times in Knox County are 15 to 19 minutes (23,334 commuters, 20.5%) for males and 15 to 19 minutes (20,799 commuters, 21.0%) for females.
| Commute Time | Male | Female |
| Less than 5 Minutes | 1,852 (1.6%) | 1,860 (1.9%) |
| 5 to 9 Minutes | 7,810 (6.9%) | 8,362 (8.5%) |
| 10 to 14 Minutes | 14,895 (13.1%) | 15,762 (16.0%) |
| 15 to 19 Minutes | 23,334 (20.5%) | 20,799 (21.0%) |
| 20 to 24 Minutes | 22,161 (19.5%) | 19,500 (19.7%) |
| 25 to 29 Minutes | 11,297 (9.9%) | 9,387 (9.5%) |
| 30 to 34 Minutes | 16,917 (14.9%) | 12,640 (12.8%) |
| 35 to 39 Minutes | 3,557 (3.1%) | 2,539 (2.6%) |
| 40 to 44 Minutes | 2,479 (2.2%) | 2,034 (2.1%) |
| 45 to 59 Minutes | 5,285 (4.6%) | 3,897 (3.9%) |
| 60 to 89 Minutes | 2,396 (2.1%) | 1,373 (1.4%) |
| 90 or more Minutes | 1,722 (1.5%) | 648 (0.7%) |
Time of Departure to Work by Sex in Knox County
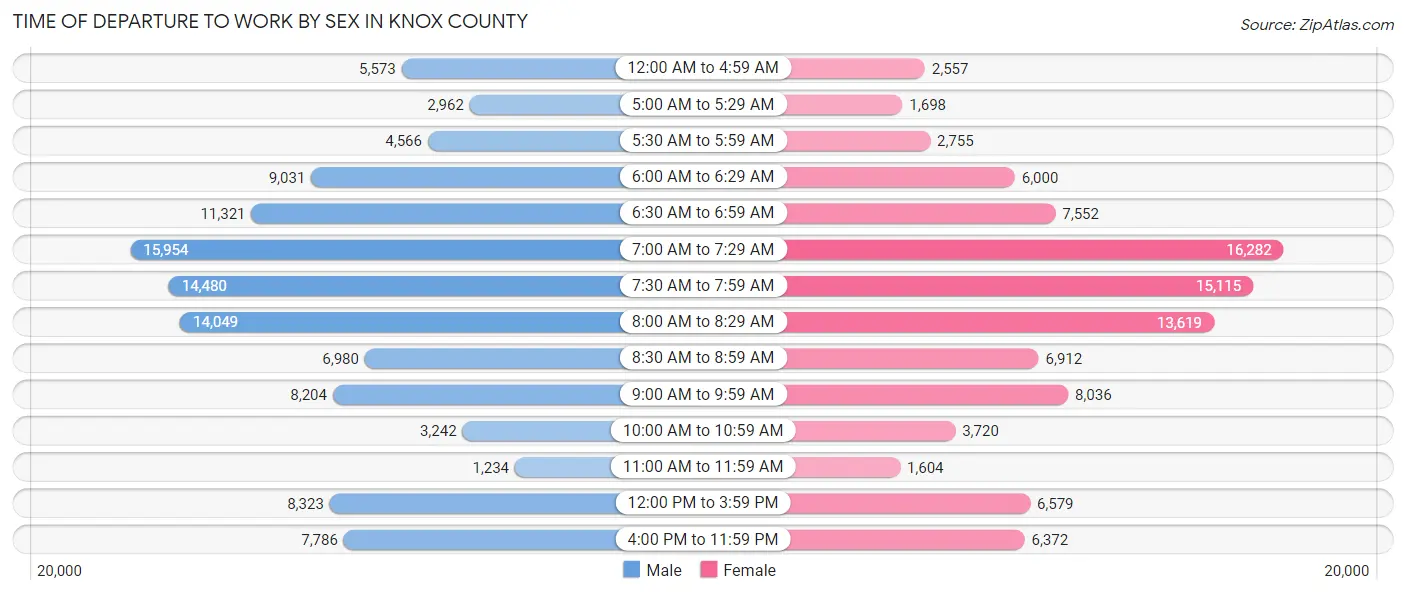
The most frequent times of departure to work in Knox County are 7:00 AM to 7:29 AM (15,954, 14.0%) for males and 7:00 AM to 7:29 AM (16,282, 16.5%) for females.
| Time of Departure | Male | Female |
| 12:00 AM to 4:59 AM | 5,573 (4.9%) | 2,557 (2.6%) |
| 5:00 AM to 5:29 AM | 2,962 (2.6%) | 1,698 (1.7%) |
| 5:30 AM to 5:59 AM | 4,566 (4.0%) | 2,755 (2.8%) |
| 6:00 AM to 6:29 AM | 9,031 (7.9%) | 6,000 (6.1%) |
| 6:30 AM to 6:59 AM | 11,321 (10.0%) | 7,552 (7.6%) |
| 7:00 AM to 7:29 AM | 15,954 (14.0%) | 16,282 (16.5%) |
| 7:30 AM to 7:59 AM | 14,480 (12.7%) | 15,115 (15.3%) |
| 8:00 AM to 8:29 AM | 14,049 (12.4%) | 13,619 (13.8%) |
| 8:30 AM to 8:59 AM | 6,980 (6.1%) | 6,912 (7.0%) |
| 9:00 AM to 9:59 AM | 8,204 (7.2%) | 8,036 (8.1%) |
| 10:00 AM to 10:59 AM | 3,242 (2.9%) | 3,720 (3.8%) |
| 11:00 AM to 11:59 AM | 1,234 (1.1%) | 1,604 (1.6%) |
| 12:00 PM to 3:59 PM | 8,323 (7.3%) | 6,579 (6.7%) |
| 4:00 PM to 11:59 PM | 7,786 (6.9%) | 6,372 (6.5%) |
| Total | 113,705 (100.0%) | 98,801 (100.0%) |
Housing Occupancy in Knox County
Occupancy by Ownership in Knox County
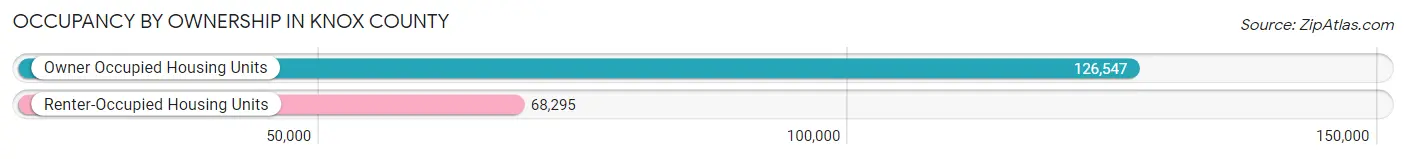
Of the total 194,842 dwellings in Knox County, owner-occupied units account for 126,547 (64.9%), while renter-occupied units make up 68,295 (35.0%).
| Occupancy | # Housing Units | % Housing Units |
| Owner Occupied Housing Units | 126,547 | 64.9% |
| Renter-Occupied Housing Units | 68,295 | 35.0% |
| Total Occupied Housing Units | 194,842 | 100.0% |
Occupancy by Household Size in Knox County
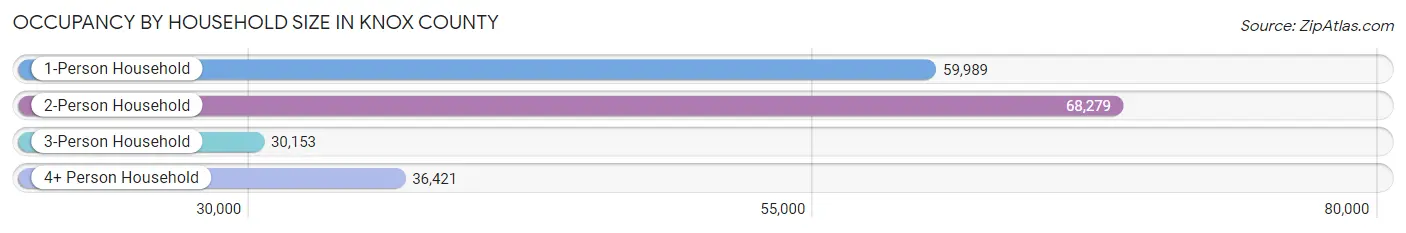
| Household Size | # Housing Units | % Housing Units |
| 1-Person Household | 59,989 | 30.8% |
| 2-Person Household | 68,279 | 35.0% |
| 3-Person Household | 30,153 | 15.5% |
| 4+ Person Household | 36,421 | 18.7% |
| Total Housing Units | 194,842 | 100.0% |
Occupancy by Ownership by Household Size in Knox County
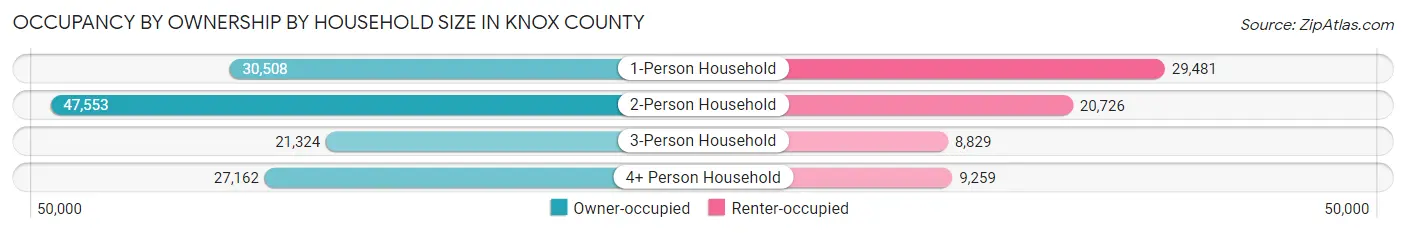
| Household Size | Owner-occupied | Renter-occupied |
| 1-Person Household | 30,508 (50.9%) | 29,481 (49.1%) |
| 2-Person Household | 47,553 (69.7%) | 20,726 (30.3%) |
| 3-Person Household | 21,324 (70.7%) | 8,829 (29.3%) |
| 4+ Person Household | 27,162 (74.6%) | 9,259 (25.4%) |
| Total Housing Units | 126,547 (64.9%) | 68,295 (35.0%) |
Occupancy by Educational Attainment in Knox County
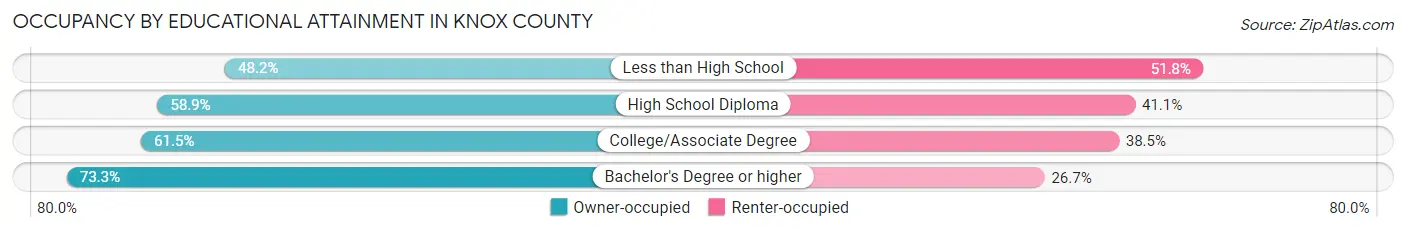
| Household Size | Owner-occupied | Renter-occupied |
| Less than High School | 6,202 (48.2%) | 6,668 (51.8%) |
| High School Diploma | 25,015 (58.9%) | 17,423 (41.1%) |
| College/Associate Degree | 36,307 (61.5%) | 22,709 (38.5%) |
| Bachelor's Degree or higher | 59,023 (73.3%) | 21,495 (26.7%) |
Occupancy by Age of Householder in Knox County
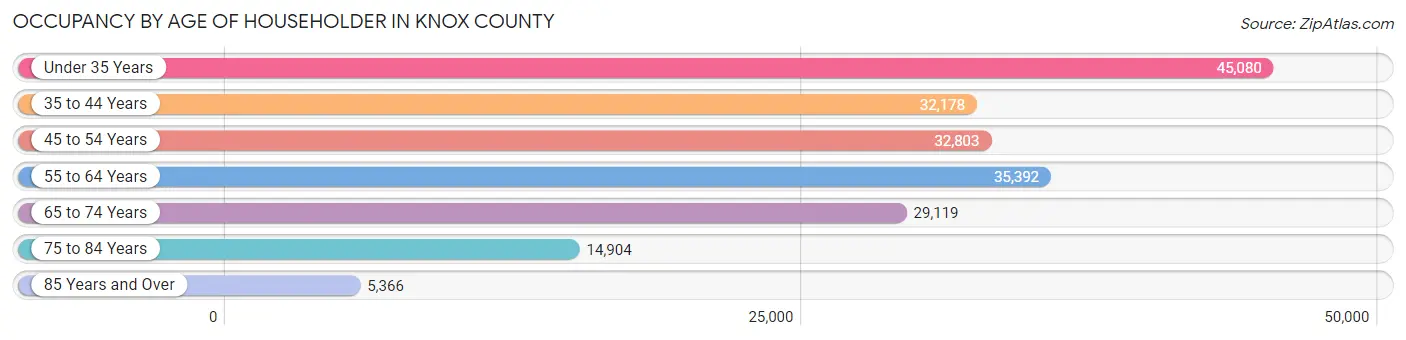
| Age Bracket | # Households | % Households |
| Under 35 Years | 45,080 | 23.1% |
| 35 to 44 Years | 32,178 | 16.5% |
| 45 to 54 Years | 32,803 | 16.8% |
| 55 to 64 Years | 35,392 | 18.2% |
| 65 to 74 Years | 29,119 | 14.9% |
| 75 to 84 Years | 14,904 | 7.6% |
| 85 Years and Over | 5,366 | 2.8% |
| Total | 194,842 | 100.0% |
Housing Finances in Knox County
Median Income by Occupancy in Knox County
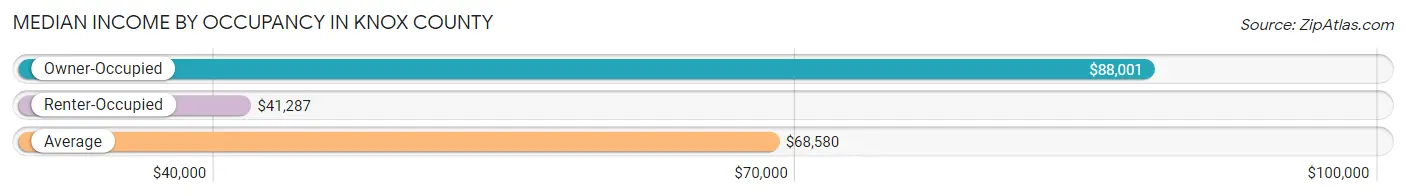
| Occupancy Type | # Households | Median Income |
| Owner-Occupied | 126,547 (64.9%) | $88,001 |
| Renter-Occupied | 68,295 (35.0%) | $41,287 |
| Average | 194,842 (100.0%) | $68,580 |
Occupancy by Householder Income Bracket in Knox County
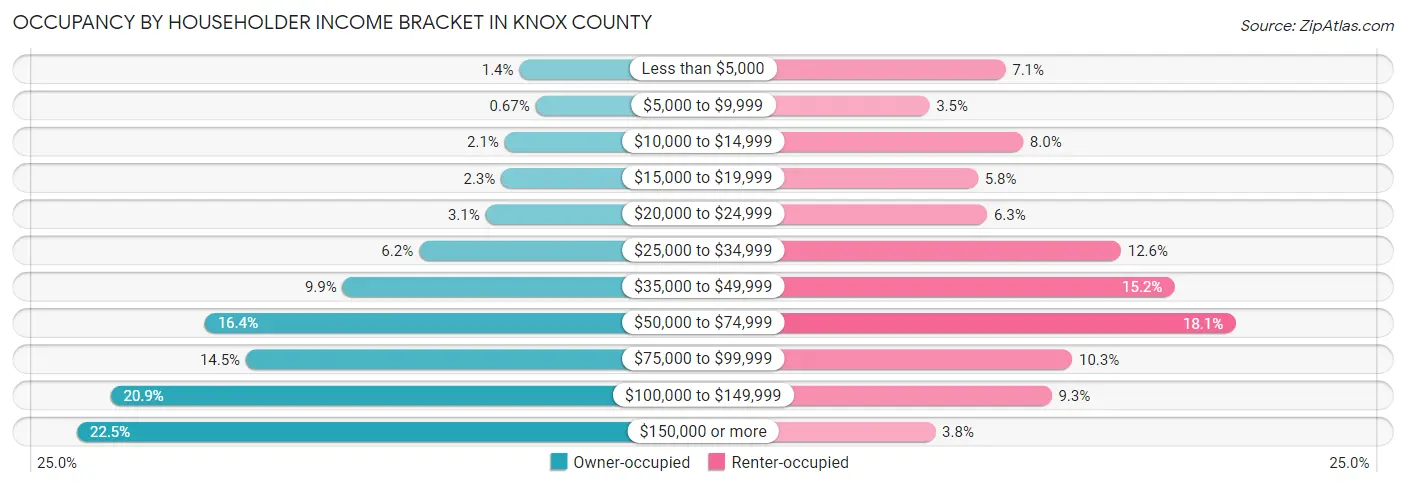
| Income Bracket | Owner-occupied | Renter-occupied |
| Less than $5,000 | 1,821 (1.4%) | 4,869 (7.1%) |
| $5,000 to $9,999 | 848 (0.7%) | 2,400 (3.5%) |
| $10,000 to $14,999 | 2,712 (2.1%) | 5,442 (8.0%) |
| $15,000 to $19,999 | 2,920 (2.3%) | 3,976 (5.8%) |
| $20,000 to $24,999 | 3,859 (3.0%) | 4,276 (6.3%) |
| $25,000 to $34,999 | 7,876 (6.2%) | 8,623 (12.6%) |
| $35,000 to $49,999 | 12,482 (9.9%) | 10,362 (15.2%) |
| $50,000 to $74,999 | 20,781 (16.4%) | 12,340 (18.1%) |
| $75,000 to $99,999 | 18,300 (14.5%) | 7,043 (10.3%) |
| $100,000 to $149,999 | 26,463 (20.9%) | 6,375 (9.3%) |
| $150,000 or more | 28,485 (22.5%) | 2,589 (3.8%) |
| Total | 126,547 (100.0%) | 68,295 (100.0%) |
Monthly Housing Cost Tiers in Knox County
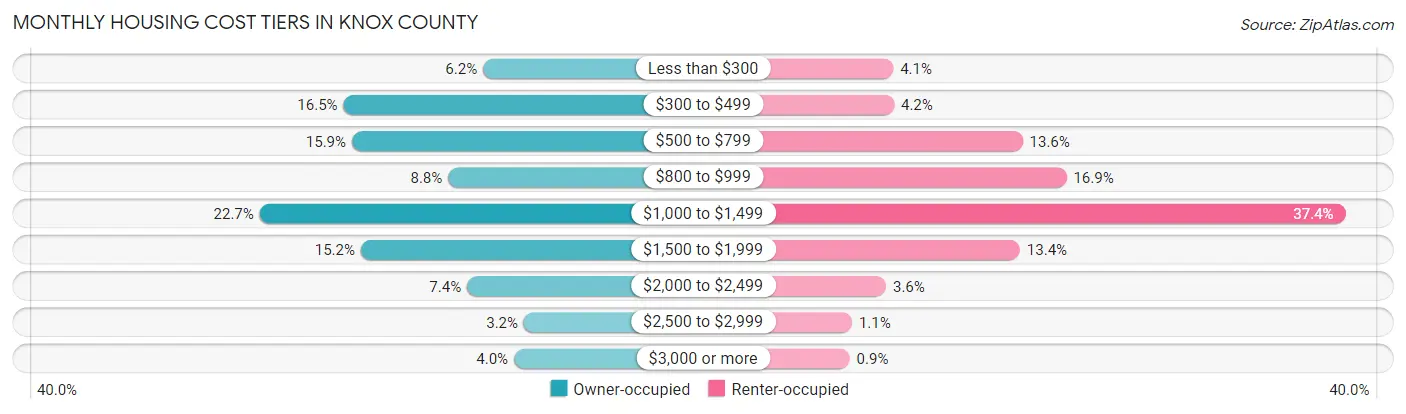
| Monthly Cost | Owner-occupied | Renter-occupied |
| Less than $300 | 7,896 (6.2%) | 2,808 (4.1%) |
| $300 to $499 | 20,906 (16.5%) | 2,848 (4.2%) |
| $500 to $799 | 20,115 (15.9%) | 9,313 (13.6%) |
| $800 to $999 | 11,155 (8.8%) | 11,519 (16.9%) |
| $1,000 to $1,499 | 28,709 (22.7%) | 25,551 (37.4%) |
| $1,500 to $1,999 | 19,282 (15.2%) | 9,177 (13.4%) |
| $2,000 to $2,499 | 9,388 (7.4%) | 2,448 (3.6%) |
| $2,500 to $2,999 | 4,083 (3.2%) | 732 (1.1%) |
| $3,000 or more | 5,013 (4.0%) | 616 (0.9%) |
| Total | 126,547 (100.0%) | 68,295 (100.0%) |
Physical Housing Characteristics in Knox County
Housing Structures in Knox County
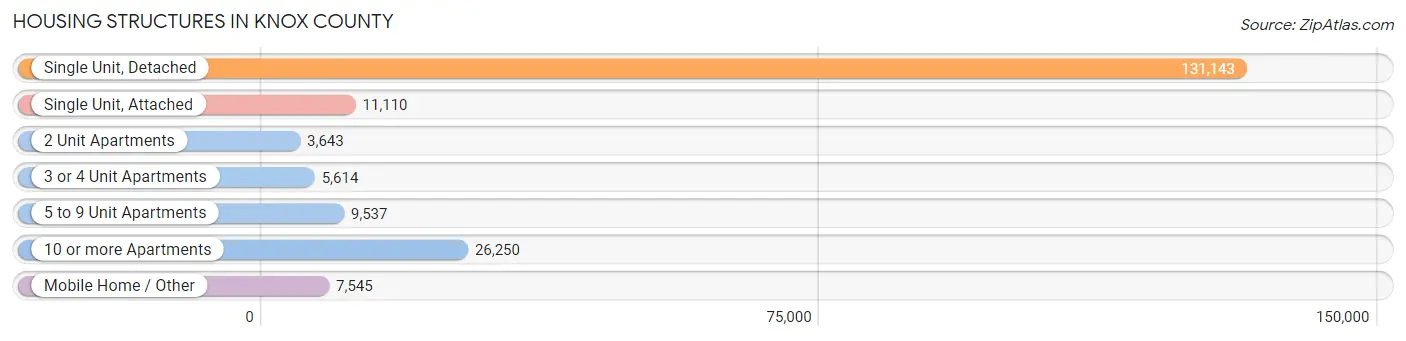
| Structure Type | # Housing Units | % Housing Units |
| Single Unit, Detached | 131,143 | 67.3% |
| Single Unit, Attached | 11,110 | 5.7% |
| 2 Unit Apartments | 3,643 | 1.9% |
| 3 or 4 Unit Apartments | 5,614 | 2.9% |
| 5 to 9 Unit Apartments | 9,537 | 4.9% |
| 10 or more Apartments | 26,250 | 13.5% |
| Mobile Home / Other | 7,545 | 3.9% |
| Total | 194,842 | 100.0% |
Housing Structures by Occupancy in Knox County
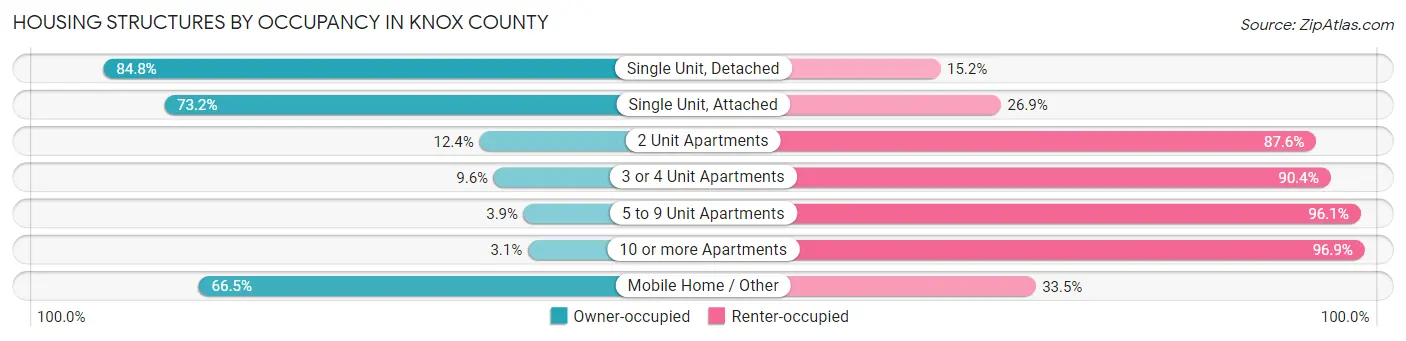
| Structure Type | Owner-occupied | Renter-occupied |
| Single Unit, Detached | 111,239 (84.8%) | 19,904 (15.2%) |
| Single Unit, Attached | 8,127 (73.2%) | 2,983 (26.9%) |
| 2 Unit Apartments | 452 (12.4%) | 3,191 (87.6%) |
| 3 or 4 Unit Apartments | 541 (9.6%) | 5,073 (90.4%) |
| 5 to 9 Unit Apartments | 369 (3.9%) | 9,168 (96.1%) |
| 10 or more Apartments | 802 (3.1%) | 25,448 (96.9%) |
| Mobile Home / Other | 5,017 (66.5%) | 2,528 (33.5%) |
| Total | 126,547 (64.9%) | 68,295 (35.0%) |
Housing Structures by Number of Rooms in Knox County
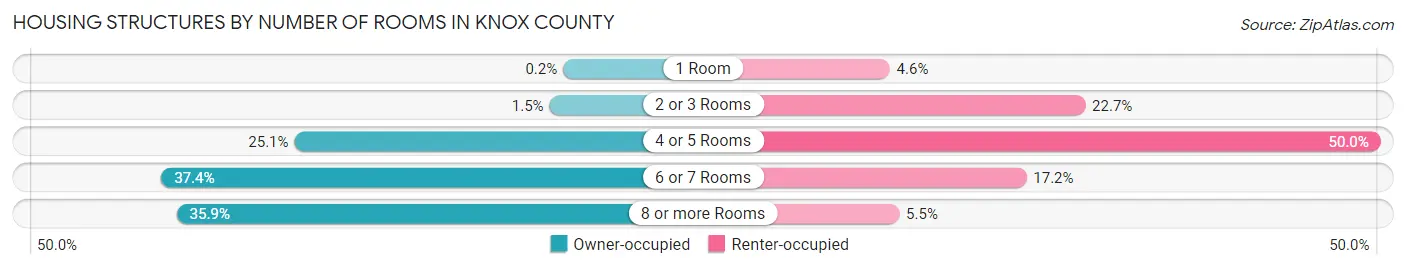
| Number of Rooms | Owner-occupied | Renter-occupied |
| 1 Room | 252 (0.2%) | 3,143 (4.6%) |
| 2 or 3 Rooms | 1,842 (1.5%) | 15,486 (22.7%) |
| 4 or 5 Rooms | 31,700 (25.1%) | 34,147 (50.0%) |
| 6 or 7 Rooms | 47,275 (37.4%) | 11,775 (17.2%) |
| 8 or more Rooms | 45,478 (35.9%) | 3,744 (5.5%) |
| Total | 126,547 (100.0%) | 68,295 (100.0%) |
Housing Structure by Heating Type in Knox County
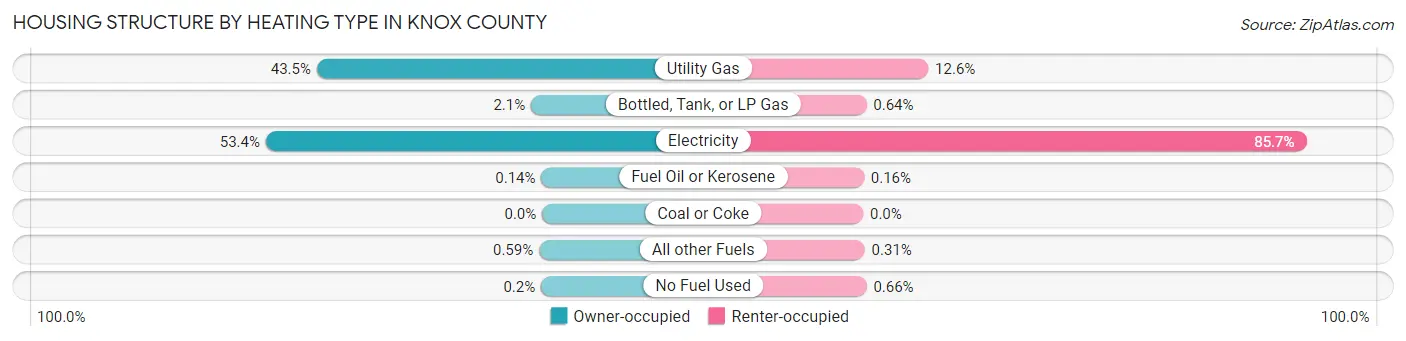
| Heating Type | Owner-occupied | Renter-occupied |
| Utility Gas | 55,100 (43.5%) | 8,594 (12.6%) |
| Bottled, Tank, or LP Gas | 2,698 (2.1%) | 436 (0.6%) |
| Electricity | 67,578 (53.4%) | 58,497 (85.7%) |
| Fuel Oil or Kerosene | 177 (0.1%) | 106 (0.2%) |
| Coal or Coke | 0 (0.0%) | 0 (0.0%) |
| All other Fuels | 744 (0.6%) | 214 (0.3%) |
| No Fuel Used | 250 (0.2%) | 448 (0.7%) |
| Total | 126,547 (100.0%) | 68,295 (100.0%) |
Household Vehicle Usage in Knox County
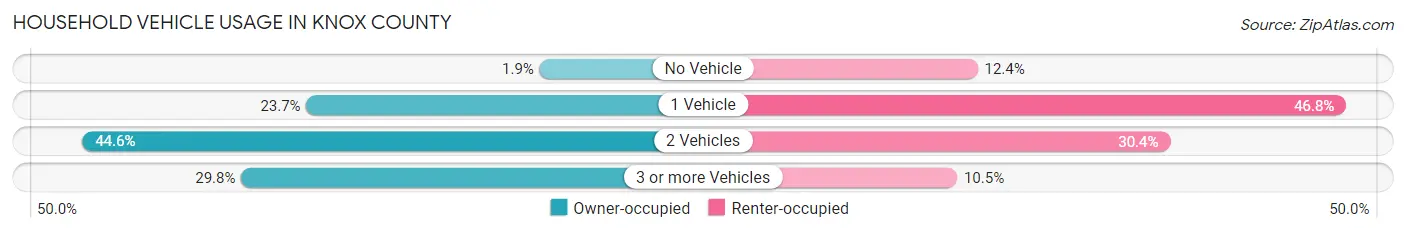
| Vehicles per Household | Owner-occupied | Renter-occupied |
| No Vehicle | 2,435 (1.9%) | 8,452 (12.4%) |
| 1 Vehicle | 29,979 (23.7%) | 31,958 (46.8%) |
| 2 Vehicles | 56,463 (44.6%) | 20,740 (30.4%) |
| 3 or more Vehicles | 37,670 (29.8%) | 7,145 (10.5%) |
| Total | 126,547 (100.0%) | 68,295 (100.0%) |
Real Estate & Mortgages in Knox County
Real Estate and Mortgage Overview in Knox County
| Characteristic | Without Mortgage | With Mortgage |
| Housing Units | 48,595 | 77,952 |
| Median Property Value | $228,900 | $261,600 |
| Median Household Income | $67,536 | $20,315 |
| Monthly Housing Costs | $460 | $4,958 |
| Real Estate Taxes | $1,230 | $1,934 |
Property Value by Mortgage Status in Knox County
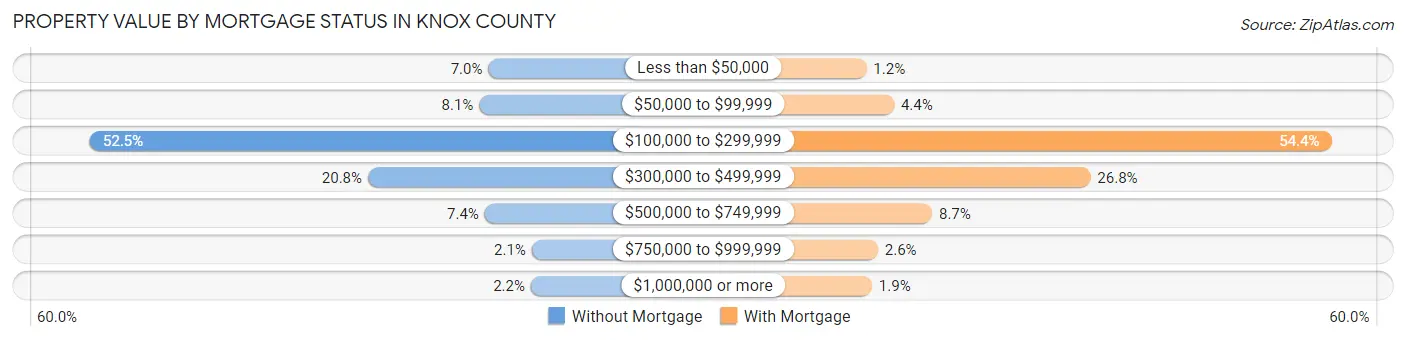
| Property Value | Without Mortgage | With Mortgage |
| Less than $50,000 | 3,407 (7.0%) | 966 (1.2%) |
| $50,000 to $99,999 | 3,911 (8.1%) | 3,419 (4.4%) |
| $100,000 to $299,999 | 25,533 (52.5%) | 42,389 (54.4%) |
| $300,000 to $499,999 | 10,094 (20.8%) | 20,920 (26.8%) |
| $500,000 to $749,999 | 3,607 (7.4%) | 6,813 (8.7%) |
| $750,000 to $999,999 | 996 (2.1%) | 1,985 (2.5%) |
| $1,000,000 or more | 1,047 (2.1%) | 1,460 (1.9%) |
| Total | 48,595 (100.0%) | 77,952 (100.0%) |
Household Income by Mortgage Status in Knox County
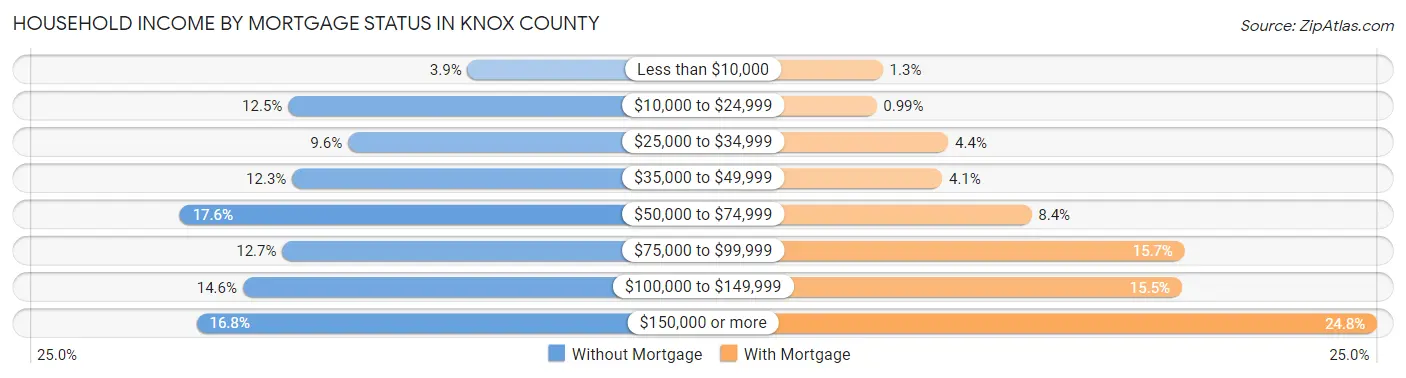
| Household Income | Without Mortgage | With Mortgage |
| Less than $10,000 | 1,898 (3.9%) | 1,007 (1.3%) |
| $10,000 to $24,999 | 6,052 (12.4%) | 771 (1.0%) |
| $25,000 to $34,999 | 4,666 (9.6%) | 3,439 (4.4%) |
| $35,000 to $49,999 | 5,960 (12.3%) | 3,210 (4.1%) |
| $50,000 to $74,999 | 8,560 (17.6%) | 6,522 (8.4%) |
| $75,000 to $99,999 | 6,188 (12.7%) | 12,221 (15.7%) |
| $100,000 to $149,999 | 7,101 (14.6%) | 12,112 (15.5%) |
| $150,000 or more | 8,170 (16.8%) | 19,362 (24.8%) |
| Total | 48,595 (100.0%) | 77,952 (100.0%) |
Property Value to Household Income Ratio in Knox County
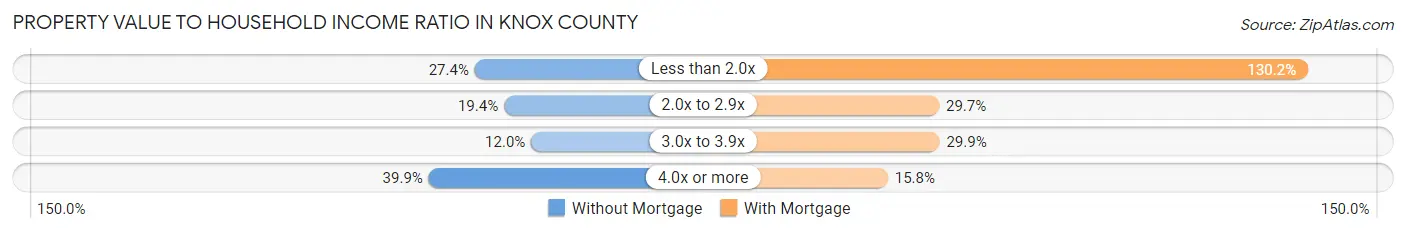
| Value-to-Income Ratio | Without Mortgage | With Mortgage |
| Less than 2.0x | 13,307 (27.4%) | 101,506 (130.2%) |
| 2.0x to 2.9x | 9,432 (19.4%) | 23,169 (29.7%) |
| 3.0x to 3.9x | 5,829 (12.0%) | 23,265 (29.8%) |
| 4.0x or more | 19,402 (39.9%) | 12,295 (15.8%) |
| Total | 48,595 (100.0%) | 77,952 (100.0%) |
Real Estate Taxes by Mortgage Status in Knox County
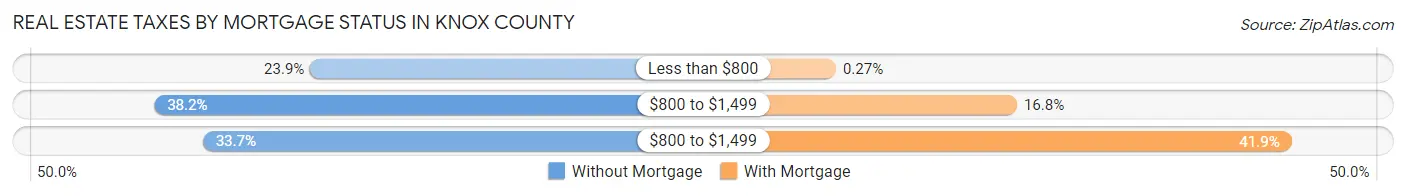
| Property Taxes | Without Mortgage | With Mortgage |
| Less than $800 | 11,622 (23.9%) | 208 (0.3%) |
| $800 to $1,499 | 18,544 (38.2%) | 13,098 (16.8%) |
| $800 to $1,499 | 16,393 (33.7%) | 32,635 (41.9%) |
| Total | 48,595 (100.0%) | 77,952 (100.0%) |
Health & Disability in Knox County
Health Insurance Coverage by Age in Knox County
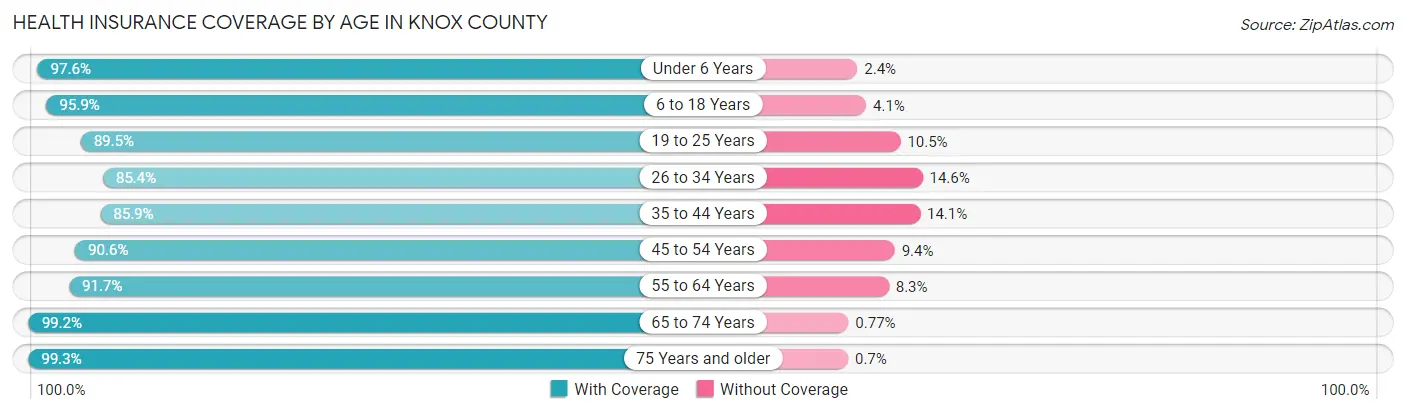
| Age Bracket | With Coverage | Without Coverage |
| Under 6 Years | 30,765 (97.6%) | 769 (2.4%) |
| 6 to 18 Years | 72,242 (95.9%) | 3,065 (4.1%) |
| 19 to 25 Years | 52,642 (89.5%) | 6,155 (10.5%) |
| 26 to 34 Years | 49,534 (85.4%) | 8,462 (14.6%) |
| 35 to 44 Years | 51,958 (85.9%) | 8,548 (14.1%) |
| 45 to 54 Years | 53,277 (90.6%) | 5,534 (9.4%) |
| 55 to 64 Years | 54,247 (91.7%) | 4,903 (8.3%) |
| 65 to 74 Years | 45,512 (99.2%) | 352 (0.8%) |
| 75 Years and older | 29,600 (99.3%) | 210 (0.7%) |
| Total | 439,777 (92.0%) | 37,998 (8.0%) |
Health Insurance Coverage by Citizenship Status in Knox County
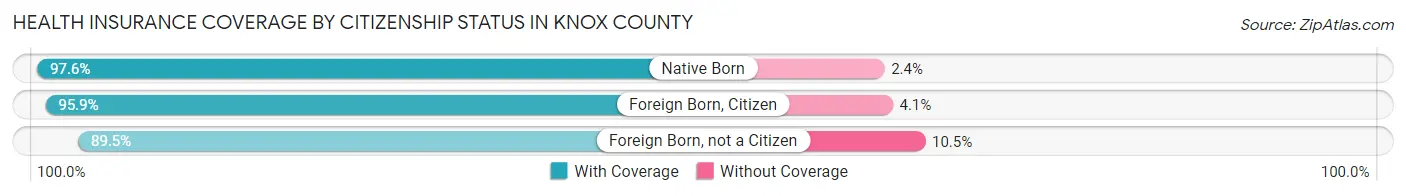
| Citizenship Status | With Coverage | Without Coverage |
| Native Born | 30,765 (97.6%) | 769 (2.4%) |
| Foreign Born, Citizen | 72,242 (95.9%) | 3,065 (4.1%) |
| Foreign Born, not a Citizen | 52,642 (89.5%) | 6,155 (10.5%) |
Health Insurance Coverage by Household Income in Knox County
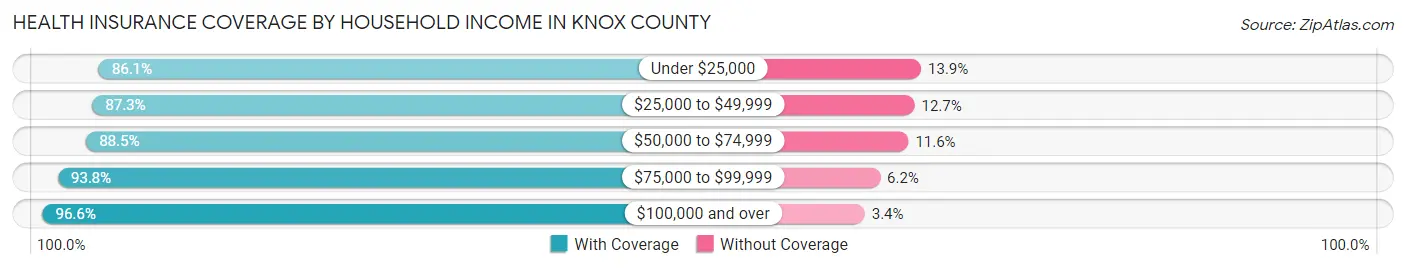
| Household Income | With Coverage | Without Coverage |
| Under $25,000 | 46,160 (86.1%) | 7,463 (13.9%) |
| $25,000 to $49,999 | 70,045 (87.3%) | 10,190 (12.7%) |
| $50,000 to $74,999 | 67,684 (88.4%) | 8,842 (11.6%) |
| $75,000 to $99,999 | 63,464 (93.8%) | 4,226 (6.2%) |
| $100,000 and over | 184,502 (96.6%) | 6,444 (3.4%) |
Public vs Private Health Insurance Coverage by Age in Knox County
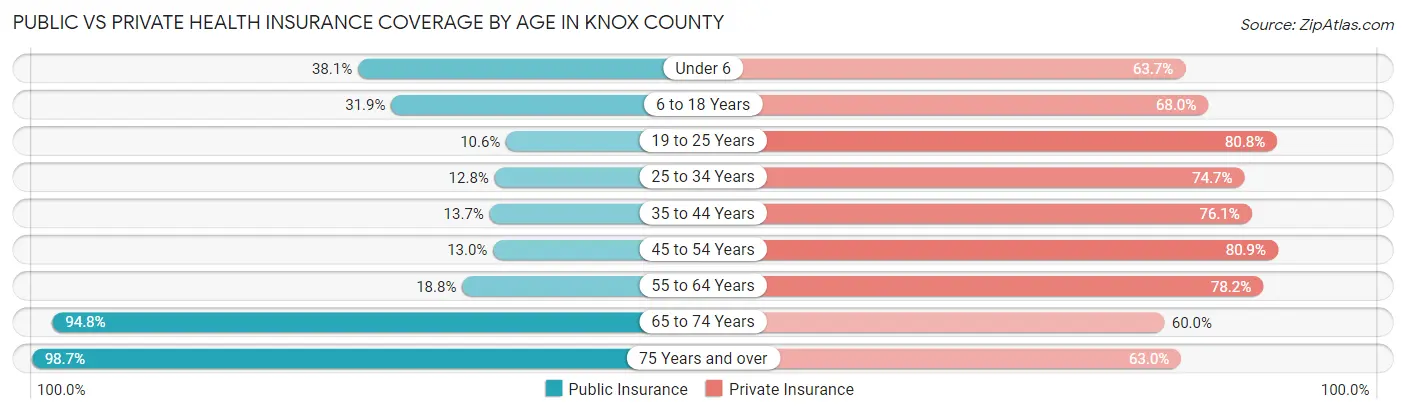
| Age Bracket | Public Insurance | Private Insurance |
| Under 6 | 12,020 (38.1%) | 20,089 (63.7%) |
| 6 to 18 Years | 24,054 (31.9%) | 51,202 (68.0%) |
| 19 to 25 Years | 6,239 (10.6%) | 47,509 (80.8%) |
| 25 to 34 Years | 7,395 (12.8%) | 43,334 (74.7%) |
| 35 to 44 Years | 8,276 (13.7%) | 46,028 (76.1%) |
| 45 to 54 Years | 7,658 (13.0%) | 47,591 (80.9%) |
| 55 to 64 Years | 11,105 (18.8%) | 46,242 (78.2%) |
| 65 to 74 Years | 43,497 (94.8%) | 27,496 (60.0%) |
| 75 Years and over | 29,413 (98.7%) | 18,774 (63.0%) |
| Total | 149,657 (31.3%) | 348,265 (72.9%) |
Disability Status by Sex by Age in Knox County
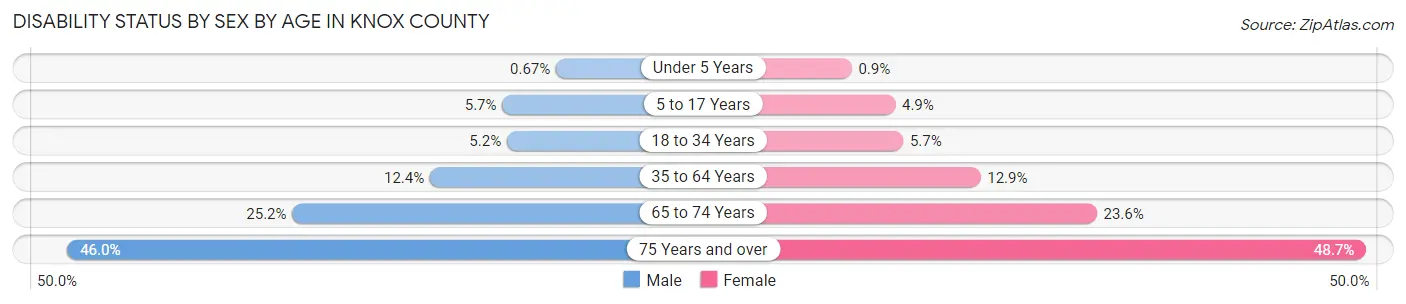
| Age Bracket | Male | Female |
| Under 5 Years | 92 (0.7%) | 115 (0.9%) |
| 5 to 17 Years | 2,130 (5.7%) | 1,773 (4.9%) |
| 18 to 34 Years | 3,232 (5.2%) | 3,519 (5.7%) |
| 35 to 64 Years | 10,860 (12.4%) | 11,655 (12.9%) |
| 65 to 74 Years | 5,345 (25.2%) | 5,819 (23.6%) |
| 75 Years and over | 5,539 (46.0%) | 8,652 (48.7%) |
Disability Class by Sex by Age in Knox County
Disability Class: Hearing Difficulty
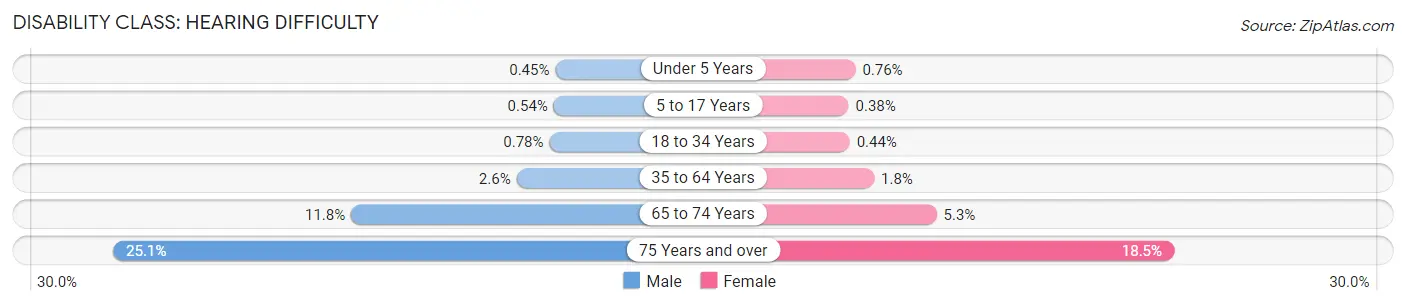
| Age Bracket | Male | Female |
| Under 5 Years | 62 (0.4%) | 97 (0.8%) |
| 5 to 17 Years | 203 (0.5%) | 137 (0.4%) |
| 18 to 34 Years | 480 (0.8%) | 271 (0.4%) |
| 35 to 64 Years | 2,293 (2.6%) | 1,628 (1.8%) |
| 65 to 74 Years | 2,512 (11.8%) | 1,300 (5.3%) |
| 75 Years and over | 3,016 (25.1%) | 3,287 (18.5%) |
Disability Class: Vision Difficulty
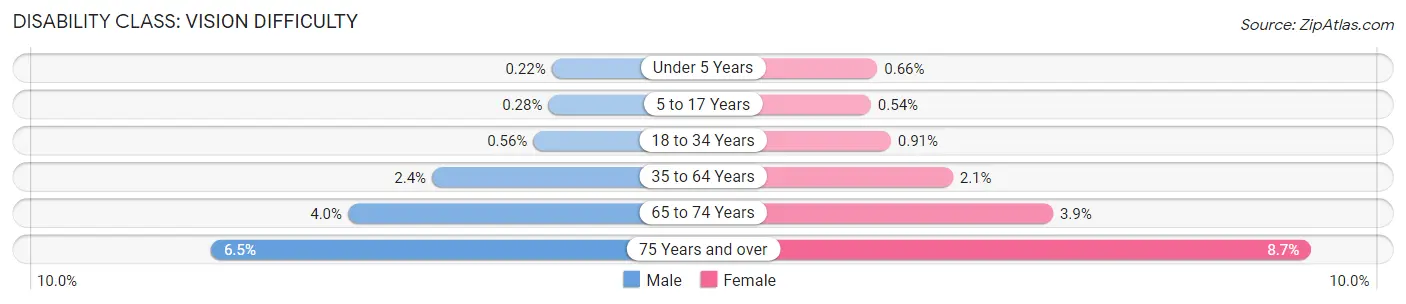
| Age Bracket | Male | Female |
| Under 5 Years | 30 (0.2%) | 84 (0.7%) |
| 5 to 17 Years | 104 (0.3%) | 194 (0.5%) |
| 18 to 34 Years | 345 (0.6%) | 566 (0.9%) |
| 35 to 64 Years | 2,143 (2.4%) | 1,869 (2.1%) |
| 65 to 74 Years | 850 (4.0%) | 964 (3.9%) |
| 75 Years and over | 787 (6.5%) | 1,548 (8.7%) |
Disability Class: Cognitive Difficulty
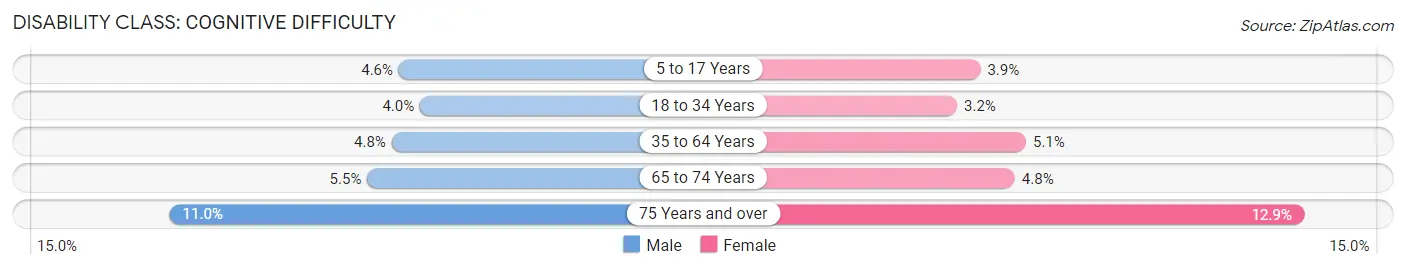
| Age Bracket | Male | Female |
| 5 to 17 Years | 1,722 (4.6%) | 1,383 (3.9%) |
| 18 to 34 Years | 2,468 (4.0%) | 1,990 (3.2%) |
| 35 to 64 Years | 4,198 (4.8%) | 4,648 (5.1%) |
| 65 to 74 Years | 1,161 (5.5%) | 1,187 (4.8%) |
| 75 Years and over | 1,318 (11.0%) | 2,287 (12.9%) |
Disability Class: Ambulatory Difficulty
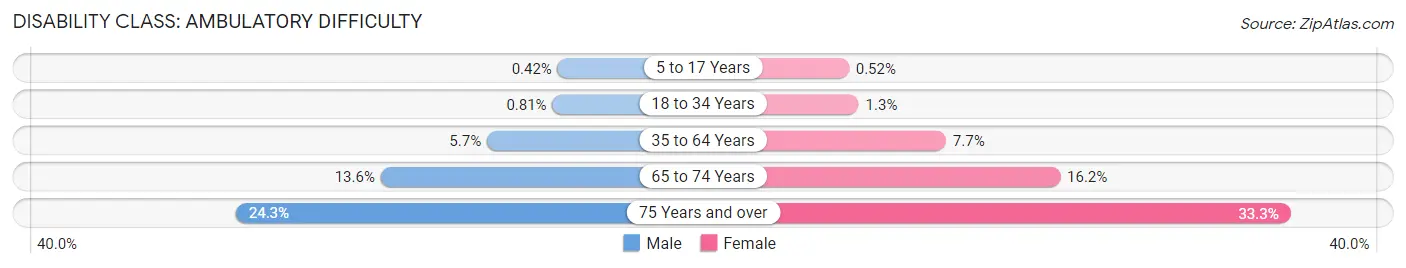
| Age Bracket | Male | Female |
| 5 to 17 Years | 159 (0.4%) | 188 (0.5%) |
| 18 to 34 Years | 500 (0.8%) | 772 (1.3%) |
| 35 to 64 Years | 4,977 (5.7%) | 7,014 (7.7%) |
| 65 to 74 Years | 2,882 (13.6%) | 3,990 (16.2%) |
| 75 Years and over | 2,925 (24.3%) | 5,923 (33.3%) |
Disability Class: Self-Care Difficulty
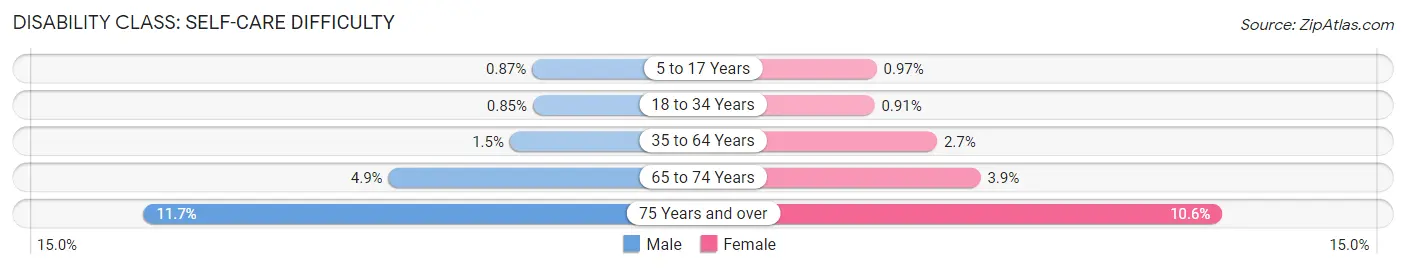
| Age Bracket | Male | Female |
| 5 to 17 Years | 326 (0.9%) | 347 (1.0%) |
| 18 to 34 Years | 525 (0.9%) | 565 (0.9%) |
| 35 to 64 Years | 1,312 (1.5%) | 2,406 (2.6%) |
| 65 to 74 Years | 1,035 (4.9%) | 949 (3.9%) |
| 75 Years and over | 1,407 (11.7%) | 1,882 (10.6%) |
Technology Access in Knox County
Computing Device Access in Knox County
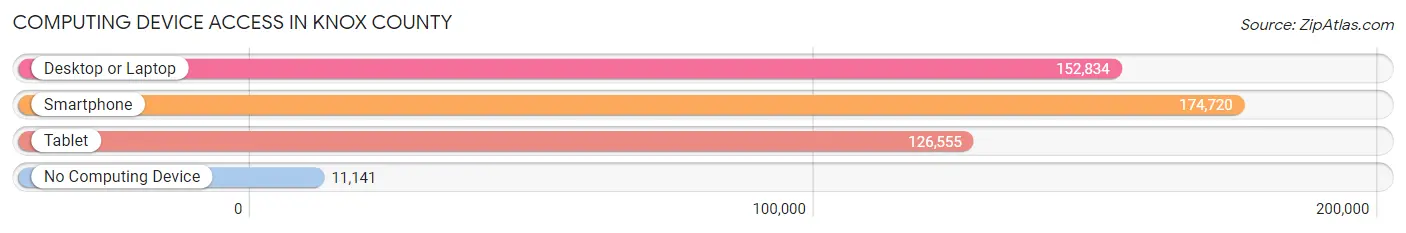
| Device Type | # Households | % Households |
| Desktop or Laptop | 152,834 | 78.4% |
| Smartphone | 174,720 | 89.7% |
| Tablet | 126,555 | 64.9% |
| No Computing Device | 11,141 | 5.7% |
| Total | 194,842 | 100.0% |
Internet Access in Knox County
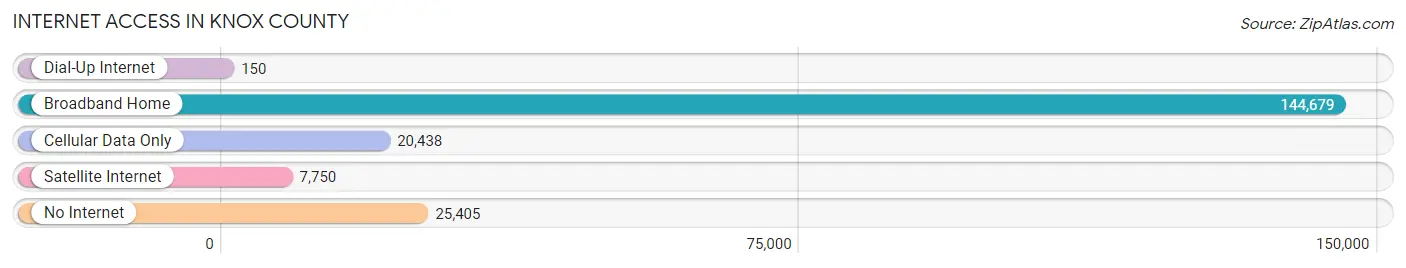
| Internet Type | # Households | % Households |
| Dial-Up Internet | 150 | 0.1% |
| Broadband Home | 144,679 | 74.3% |
| Cellular Data Only | 20,438 | 10.5% |
| Satellite Internet | 7,750 | 4.0% |
| No Internet | 25,405 | 13.0% |
| Total | 194,842 | 100.0% |
Knox County Summary
Knox County, Tennessee is located in the eastern part of the state and is part of the Knoxville Metropolitan Statistical Area. It is bordered by Anderson, Blount, Loudon, Roane, and Sevier counties. The county seat is Knoxville, which is also the state’s third-largest city. Knox County is home to the University of Tennessee, the Great Smoky Mountains National Park, and the Knoxville Zoo.
History
Knox County was established in 1792 and named after Henry Knox, the first Secretary of War under President George Washington. The county was originally part of the Southwest Territory, which was created in 1790. The county was divided into two parts in 1796, with the eastern part becoming Blount County and the western part remaining Knox County.
The county was home to several Native American tribes, including the Cherokee, Creek, and Chickasaw. The first European settlers arrived in the area in the late 1700s. The county was home to several Revolutionary War battles, including the Battle of Fort Southwest Point in 1793.
In the early 1800s, Knox County was home to several prominent families, including the Blounts, the McMahons, and the Whites. The county was also home to several prominent politicians, including Andrew Jackson, who served as the county’s first representative in the Tennessee General Assembly.
The county was also home to several prominent businesses, including the Knoxville Iron Works, which was established in 1810. The county was also home to several prominent educational institutions, including the University of Tennessee, which was established in 1794.
Geography
Knox County is located in the eastern part of Tennessee and is part of the Knoxville Metropolitan Statistical Area. The county is bordered by Anderson, Blount, Loudon, Roane, and Sevier counties. The county has a total area of 517 square miles, of which 514 square miles is land and 3 square miles is water.
The county is located in the Appalachian Mountains and is home to several mountain ranges, including the Great Smoky Mountains, the Unicoi Mountains, and the Cumberland Mountains. The county is also home to several rivers, including the French Broad River, the Little Tennessee River, and the Clinch River.
Economy
Knox County has a diverse economy that is driven by several industries, including manufacturing, healthcare, education, and tourism. The county is home to several major employers, including the University of Tennessee, the Knoxville Zoo, and the Great Smoky Mountains National Park.
The county is also home to several major manufacturing companies, including Denso Manufacturing Tennessee, Inc., which produces automotive parts, and the Knoxville Iron Works, which produces steel products. The county is also home to several healthcare providers, including the University of Tennessee Medical Center and the East Tennessee Children’s Hospital.
Demographics
As of the 2010 census, the population of Knox County was 432,226, making it the third-most populous county in Tennessee. The population density was 845 people per square mile. The racial makeup of the county was 79.2% White, 15.3% African American, 0.5% Native American, 2.2% Asian, 0.1% Pacific Islander, 1.2% from other races, and 1.6% from two or more races.
The median income for a household in the county was $45,945 and the median income for a family was $54,817. The per capita income for the county was $25,945. About 11.2% of the population was below the poverty line.
Common Questions
What is the Total Population of Knox County?
Total Population of Knox County is 481,406.
What is the Total Male Population of Knox County?
Total Male Population of Knox County is 235,988.
What is the Total Female Population of Knox County?
Total Female Population of Knox County is 245,418.
What is the Ratio of Males per 100 Females in Knox County?
There are 96.16 Males per 100 Females in Knox County.
What is the Ratio of Females per 100 Males in Knox County?
There are 104.00 Females per 100 Males in Knox County.
What is the Median Population Age in Knox County?
Median Population Age in Knox County is 37.4 Years.
What is the Average Family Size in Knox County
Average Family Size in Knox County is 3.0 People.
What is the Average Household Size in Knox County
Average Household Size in Knox County is 2.4 People.
What is Per Capita Income in Knox County?
Per Capita income in Knox County is $39,608.
What is the Median Family Income in Knox County?
Median Family Income in Knox County is $89,788.
What is the Median Household income in Knox County?
Median Household Income in Knox County is $68,580.
What is Income or Wage Gap in Knox County?
Income or Wage Gap in Knox County is 27.5%.
Women in Knox County earn 72.5 cents for every dollar earned by a man.
What is Family Income Deficit in Knox County?
Family Income Deficit in Knox County is $10,386.
Families that are below poverty line in Knox County earn $10,386 less on average than the poverty threshold level.
What is Inequality or Gini Index in Knox County?
Inequality or Gini Index in Knox County is 0.48.
How Large is the Labor Force in Knox County?
There are 252,461 People in the Labor Forcein in Knox County.
What is the Percentage of People in the Labor Force in Knox County?
64.2% of People are in the Labor Force in Knox County.
What is the Unemployment Rate in Knox County?
Unemployment Rate in Knox County is 3.8%.