Jackson County, TN
Jackson County Map
Jackson County Overview
11,730
TOTAL POPULATION
5,944
MALE POPULATION
5,786
FEMALE POPULATION
102.73
MALES / 100 FEMALES
97.34
FEMALES / 100 MALES
47.3
MEDIAN AGE
3.3
AVG FAMILY SIZE
2.5
AVG HOUSEHOLD SIZE
$25,534
PER CAPITA INCOME
$64,938
AVG FAMILY INCOME
$42,357
AVG HOUSEHOLD INCOME
36.5%
WAGE / INCOME GAP [ % ]
63.5¢/ $1
WAGE / INCOME GAP [ $ ]
$9,197
FAMILY INCOME DEFICIT
0.46
INEQUALITY / GINI INDEX
5,166
LABOR FORCE [ PEOPLE ]
51.8%
PERCENT IN LABOR FORCE
7.2%
UNEMPLOYMENT RATE
Jackson County Area Codes
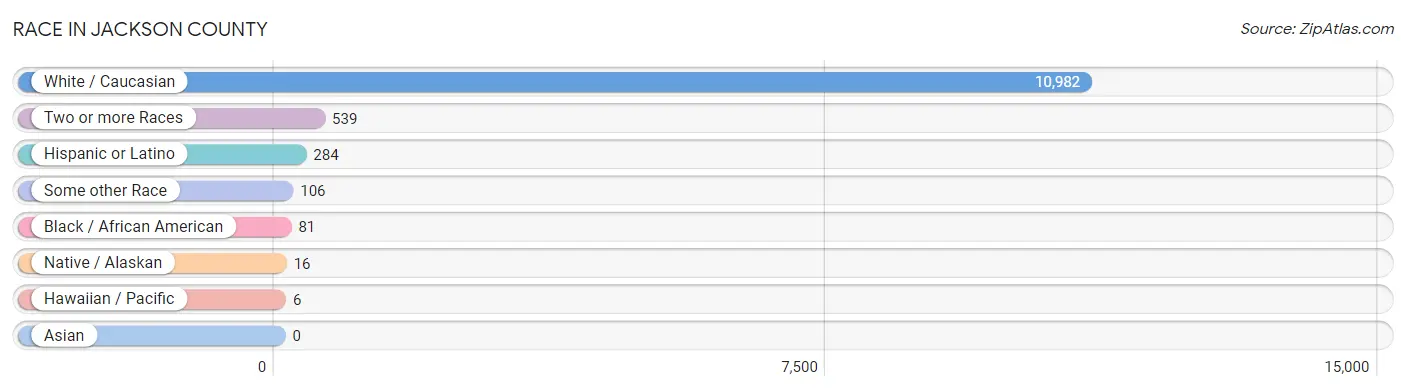
Race in Jackson County
The most populous races in Jackson County are White / Caucasian (10,982 | 93.6%), Two or more Races (539 | 4.6%), and Hispanic or Latino (284 | 2.4%).
| Race | # Population | % Population |
| Asian | 0 | 0.0% |
| Black / African American | 81 | 0.7% |
| Hawaiian / Pacific | 6 | 0.1% |
| Hispanic or Latino | 284 | 2.4% |
| Native / Alaskan | 16 | 0.1% |
| White / Caucasian | 10,982 | 93.6% |
| Two or more Races | 539 | 4.6% |
| Some other Race | 106 | 0.9% |
| Total | 11,730 | 100.0% |
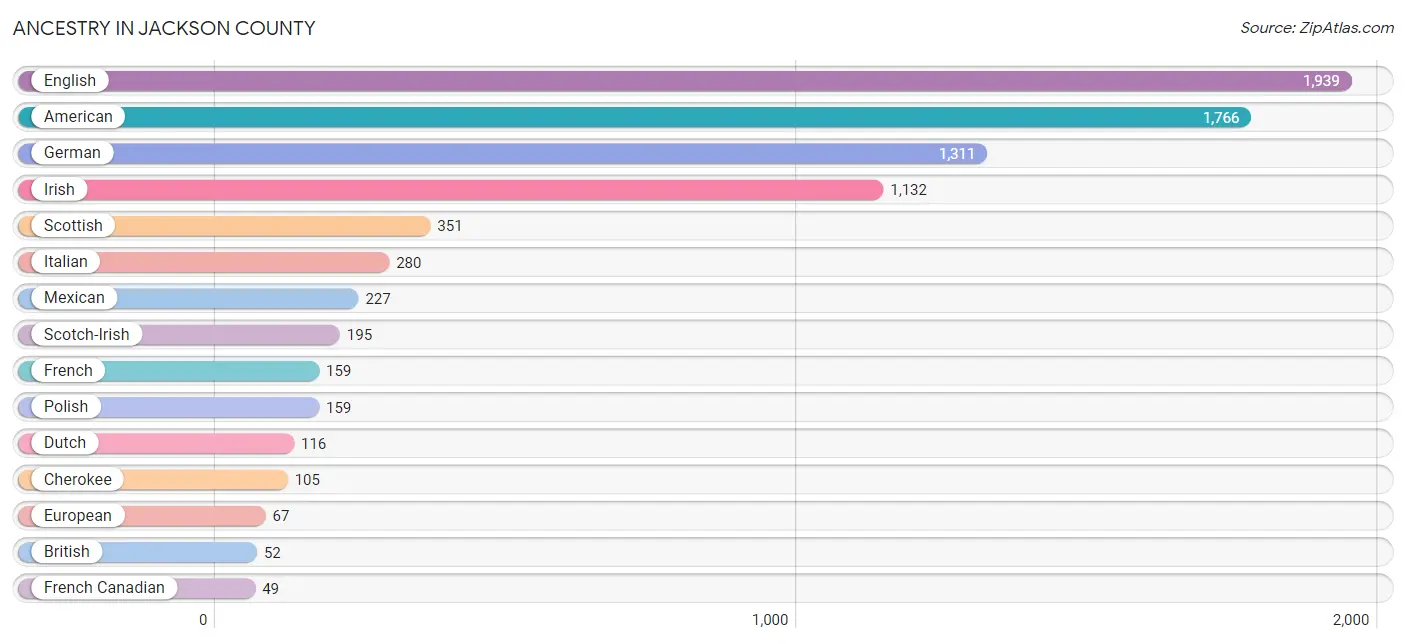
Ancestry in Jackson County
The most populous ancestries reported in Jackson County are English (1,939 | 16.5%), American (1,766 | 15.1%), German (1,311 | 11.2%), Irish (1,132 | 9.7%), and Scottish (351 | 3.0%), together accounting for 55.4% of all Jackson County residents.
| Ancestry | # Population | % Population |
| African | 6 | 0.1% |
| American | 1,766 | 15.1% |
| Apache | 5 | 0.0% |
| British | 52 | 0.4% |
| Canadian | 13 | 0.1% |
| Central American | 16 | 0.1% |
| Cherokee | 105 | 0.9% |
| Colombian | 8 | 0.1% |
| Costa Rican | 16 | 0.1% |
| Creek | 1 | 0.0% |
| Czech | 17 | 0.1% |
| Dominican | 7 | 0.1% |
| Dutch | 116 | 1.0% |
| Eastern European | 10 | 0.1% |
| English | 1,939 | 16.5% |
| European | 67 | 0.6% |
| Finnish | 20 | 0.2% |
| French | 159 | 1.4% |
| French Canadian | 49 | 0.4% |
| German | 1,311 | 11.2% |
| Greek | 8 | 0.1% |
| Hungarian | 29 | 0.3% |
| Irish | 1,132 | 9.7% |
| Italian | 280 | 2.4% |
| Mexican | 227 | 1.9% |
| Norwegian | 24 | 0.2% |
| Pennsylvania German | 30 | 0.3% |
| Polish | 159 | 1.4% |
| Puerto Rican | 9 | 0.1% |
| Samoan | 6 | 0.1% |
| Scandinavian | 14 | 0.1% |
| Scotch-Irish | 195 | 1.7% |
| Scottish | 351 | 3.0% |
| Sioux | 9 | 0.1% |
| South American | 10 | 0.1% |
| Spanish | 15 | 0.1% |
| Subsaharan African | 6 | 0.1% |
| Swedish | 47 | 0.4% |
| Swiss | 6 | 0.1% |
| Ukrainian | 5 | 0.0% |
| Venezuelan | 2 | 0.0% |
| Welsh | 32 | 0.3% |
| Yugoslavian | 38 | 0.3% | View All 43 Rows |
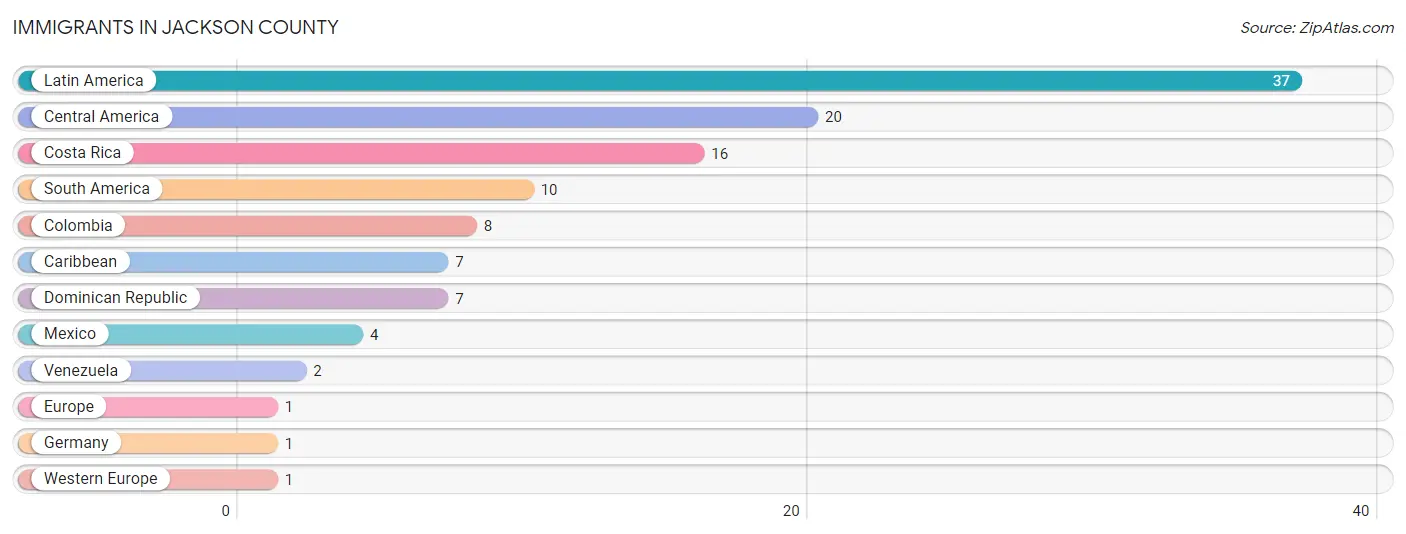
Immigrants in Jackson County
The most numerous immigrant groups reported in Jackson County came from Latin America (37 | 0.3%), Central America (20 | 0.2%), Costa Rica (16 | 0.1%), South America (10 | 0.1%), and Colombia (8 | 0.1%), together accounting for 0.8% of all Jackson County residents.
| Immigration Origin | # Population | % Population |
| Caribbean | 7 | 0.1% |
| Central America | 20 | 0.2% |
| Colombia | 8 | 0.1% |
| Costa Rica | 16 | 0.1% |
| Dominican Republic | 7 | 0.1% |
| Europe | 1 | 0.0% |
| Germany | 1 | 0.0% |
| Latin America | 37 | 0.3% |
| Mexico | 4 | 0.0% |
| South America | 10 | 0.1% |
| Venezuela | 2 | 0.0% |
| Western Europe | 1 | 0.0% | View All 12 Rows |
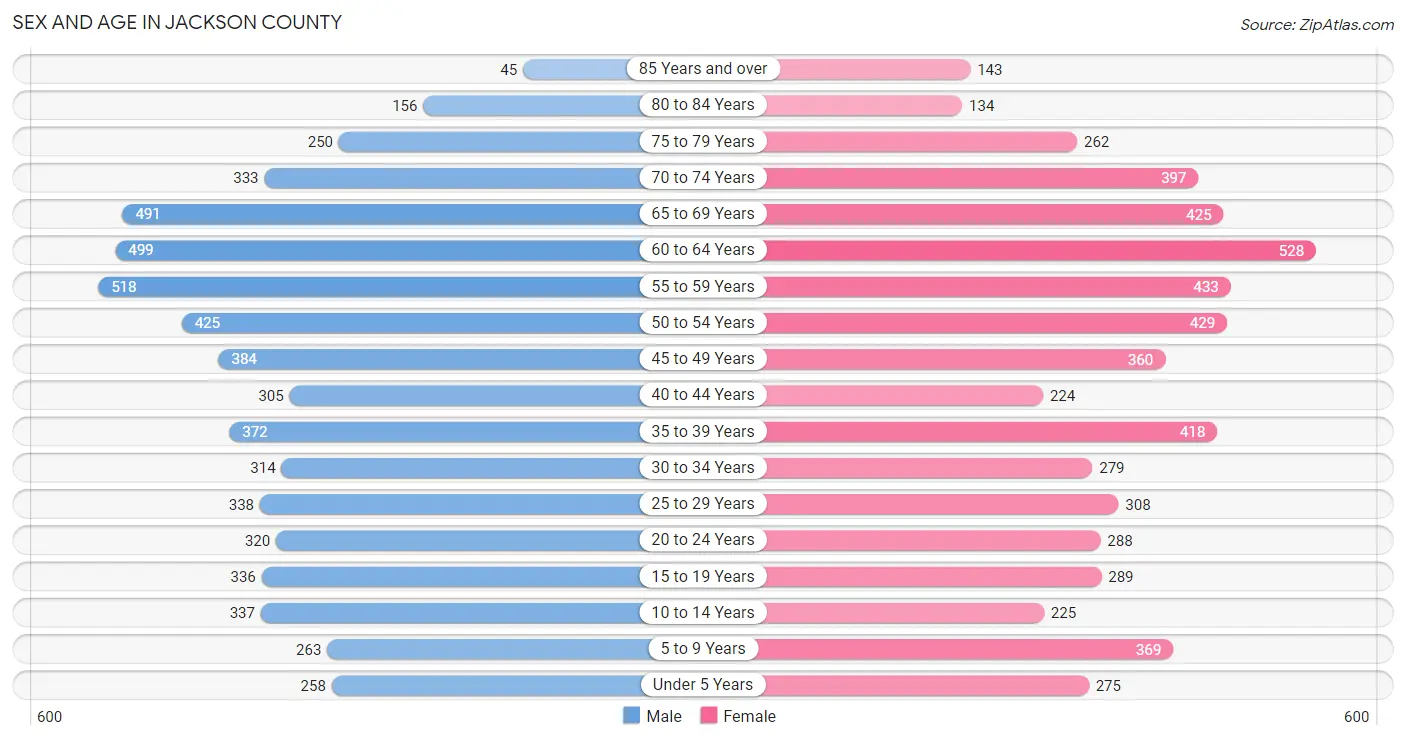
Sex and Age in Jackson County
Sex and Age in Jackson County
The most populous age groups in Jackson County are 55 to 59 Years (518 | 8.7%) for men and 60 to 64 Years (528 | 9.1%) for women.
| Age Bracket | Male | Female |
| Under 5 Years | 258 (4.3%) | 275 (4.8%) |
| 5 to 9 Years | 263 (4.4%) | 369 (6.4%) |
| 10 to 14 Years | 337 (5.7%) | 225 (3.9%) |
| 15 to 19 Years | 336 (5.7%) | 289 (5.0%) |
| 20 to 24 Years | 320 (5.4%) | 288 (5.0%) |
| 25 to 29 Years | 338 (5.7%) | 308 (5.3%) |
| 30 to 34 Years | 314 (5.3%) | 279 (4.8%) |
| 35 to 39 Years | 372 (6.3%) | 418 (7.2%) |
| 40 to 44 Years | 305 (5.1%) | 224 (3.9%) |
| 45 to 49 Years | 384 (6.5%) | 360 (6.2%) |
| 50 to 54 Years | 425 (7.1%) | 429 (7.4%) |
| 55 to 59 Years | 518 (8.7%) | 433 (7.5%) |
| 60 to 64 Years | 499 (8.4%) | 528 (9.1%) |
| 65 to 69 Years | 491 (8.3%) | 425 (7.3%) |
| 70 to 74 Years | 333 (5.6%) | 397 (6.9%) |
| 75 to 79 Years | 250 (4.2%) | 262 (4.5%) |
| 80 to 84 Years | 156 (2.6%) | 134 (2.3%) |
| 85 Years and over | 45 (0.8%) | 143 (2.5%) |
| Total | 5,944 (100.0%) | 5,786 (100.0%) |
Families and Households in Jackson County
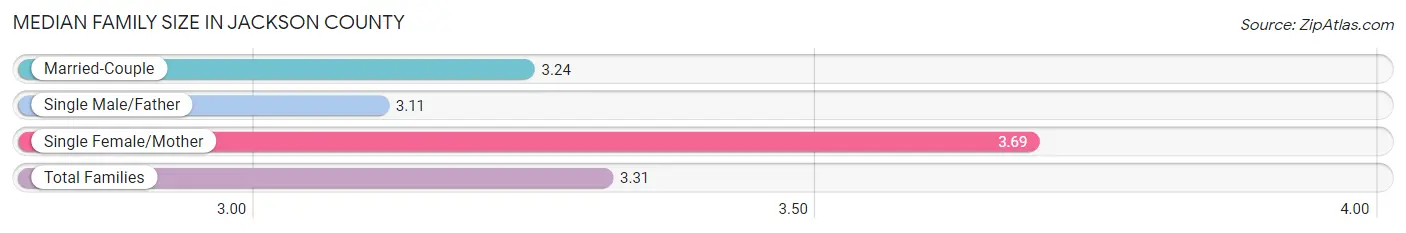
Median Family Size in Jackson County
The median family size in Jackson County is 3.31 persons per family, with single female/mother families (442 | 15.9%) accounting for the largest median family size of 3.69 persons per family. On the other hand, single male/father families (194 | 7.0%) represent the smallest median family size with 3.11 persons per family.
| Family Type | # Families | Family Size |
| Married-Couple | 2,140 (77.1%) | 3.24 |
| Single Male/Father | 194 (7.0%) | 3.11 |
| Single Female/Mother | 442 (15.9%) | 3.69 |
| Total Families | 2,776 (100.0%) | 3.31 |
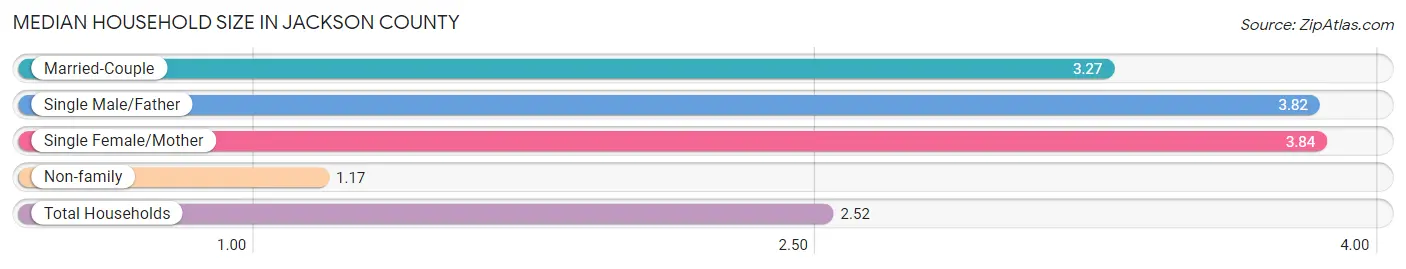
Median Household Size in Jackson County
The median household size in Jackson County is 2.52 persons per household, with single female/mother households (442 | 9.7%) accounting for the largest median household size of 3.84 persons per household. non-family households (1,793 | 39.2%) represent the smallest median household size with 1.17 persons per household.
| Household Type | # Households | Household Size |
| Married-Couple | 2,140 (46.8%) | 3.27 |
| Single Male/Father | 194 (4.3%) | 3.82 |
| Single Female/Mother | 442 (9.7%) | 3.84 |
| Non-family | 1,793 (39.2%) | 1.17 |
| Total Households | 4,569 (100.0%) | 2.52 |
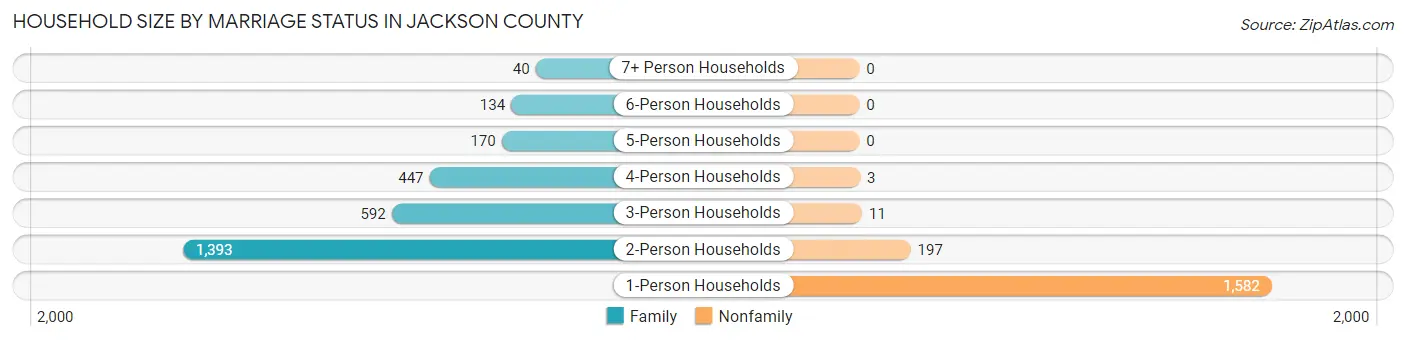
Household Size by Marriage Status in Jackson County
Out of a total of 4,569 households in Jackson County, 2,776 (60.8%) are family households, while 1,793 (39.2%) are nonfamily households. The most numerous type of family households are 2-person households, comprising 1,393, and the most common type of nonfamily households are 1-person households, comprising 1,582.
| Household Size | Family Households | Nonfamily Households |
| 1-Person Households | - | 1,582 (34.6%) |
| 2-Person Households | 1,393 (30.5%) | 197 (4.3%) |
| 3-Person Households | 592 (13.0%) | 11 (0.2%) |
| 4-Person Households | 447 (9.8%) | 3 (0.1%) |
| 5-Person Households | 170 (3.7%) | 0 (0.0%) |
| 6-Person Households | 134 (2.9%) | 0 (0.0%) |
| 7+ Person Households | 40 (0.9%) | 0 (0.0%) |
| Total | 2,776 (60.8%) | 1,793 (39.2%) |
Female Fertility in Jackson County
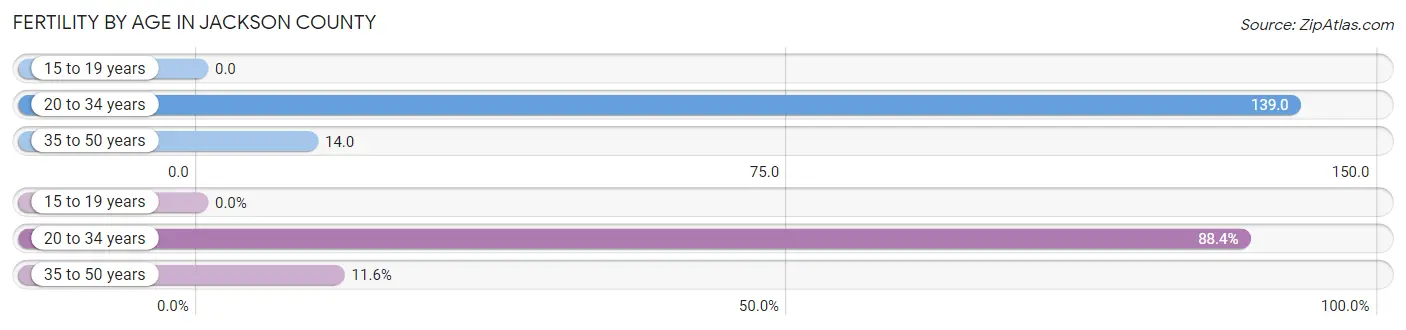
Fertility by Age in Jackson County
Average fertility rate in Jackson County is 61.0 births per 1,000 women. Women in the age bracket of 20 to 34 years have the highest fertility rate with 139.0 births per 1,000 women. Women in the age bracket of 20 to 34 years acount for 88.4% of all women with births.
| Age Bracket | Women with Births | Births / 1,000 Women |
| 15 to 19 years | 0 (0.0%) | 0.0 |
| 20 to 34 years | 122 (88.4%) | 139.0 |
| 35 to 50 years | 16 (11.6%) | 14.0 |
| Total | 138 (100.0%) | 61.0 |
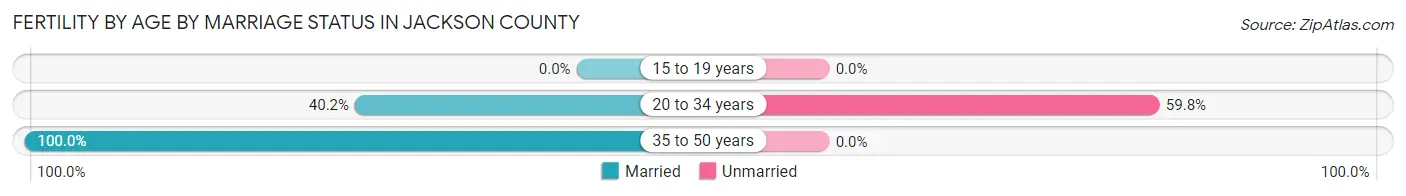
Fertility by Age by Marriage Status in Jackson County
47.1% of women with births (138) in Jackson County are married. The highest percentage of unmarried women with births falls into 20 to 34 years age bracket with 59.8% of them unmarried at the time of birth, while the lowest percentage of unmarried women with births belong to 35 to 50 years age bracket with 0.0% of them unmarried.
| Age Bracket | Married | Unmarried |
| 15 to 19 years | 0 (0.0%) | 0 (0.0%) |
| 20 to 34 years | 49 (40.2%) | 73 (59.8%) |
| 35 to 50 years | 16 (100.0%) | 0 (0.0%) |
| Total | 65 (47.1%) | 73 (52.9%) |
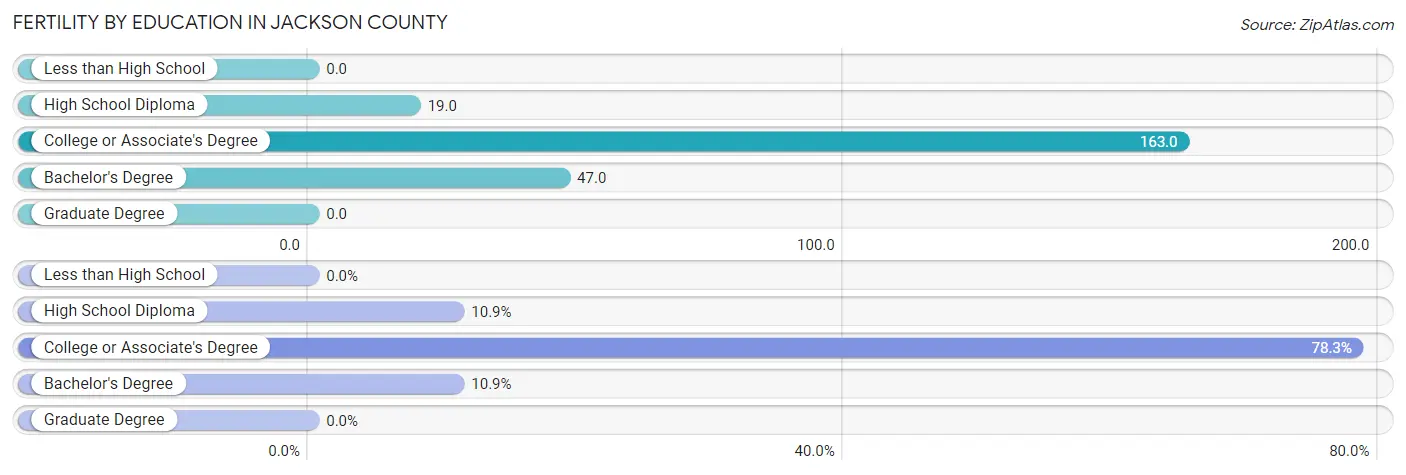
Fertility by Education in Jackson County
| Educational Attainment | Women with Births | Births / 1,000 Women |
| Less than High School | 0 (0.0%) | 0.0 |
| High School Diploma | 15 (10.9%) | 19.0 |
| College or Associate's Degree | 108 (78.3%) | 163.0 |
| Bachelor's Degree | 15 (10.9%) | 47.0 |
| Graduate Degree | 0 (0.0%) | 0.0 |
| Total | 138 (100.0%) | 61.0 |
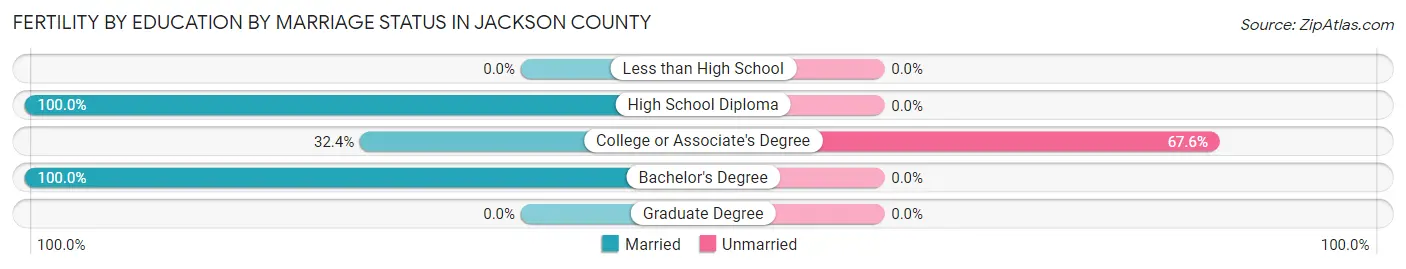
Fertility by Education by Marriage Status in Jackson County
52.9% of women with births in Jackson County are unmarried. Women with the educational attainment of high school diploma are most likely to be married with 100.0% of them married at childbirth, while women with the educational attainment of college or associate's degree are least likely to be married with 67.6% of them unmarried at childbirth.
| Educational Attainment | Married | Unmarried |
| Less than High School | 0 (0.0%) | 0 (0.0%) |
| High School Diploma | 15 (100.0%) | 0 (0.0%) |
| College or Associate's Degree | 35 (32.4%) | 73 (67.6%) |
| Bachelor's Degree | 15 (100.0%) | 0 (0.0%) |
| Graduate Degree | 0 (0.0%) | 0 (0.0%) |
| Total | 65 (47.1%) | 73 (52.9%) |
Income in Jackson County
Income Overview in Jackson County
Per Capita Income in Jackson County is $25,534, while median incomes of families and households are $64,938 and $42,357 respectively.
| Characteristic | Number | Measure |
| Per Capita Income | 11,730 | $25,534 |
| Median Family Income | 2,776 | $64,938 |
| Mean Family Income | 2,776 | $76,757 |
| Median Household Income | 4,569 | $42,357 |
| Mean Household Income | 4,569 | $59,307 |
| Income Deficit | 2,776 | $9,197 |
| Wage / Income Gap (%) | 11,730 | 36.55% |
| Wage / Income Gap ($) | 11,730 | 63.45¢ per $1 |
| Gini / Inequality Index | 11,730 | 0.46 |
Earnings by Sex in Jackson County
Average Earnings in Jackson County are $27,904, $37,281 for men and $23,656 for women, a difference of 36.5%.
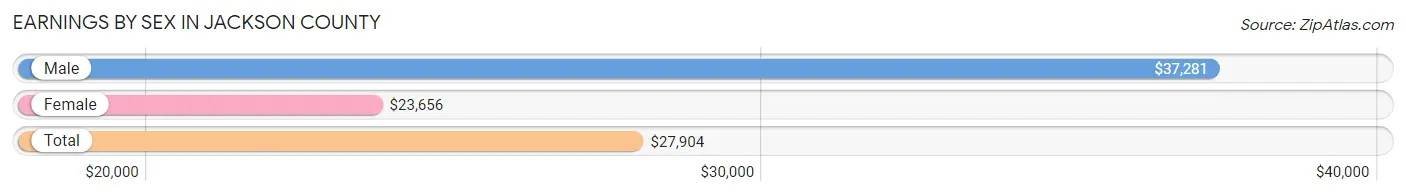
| Sex | Number | Average Earnings |
| Male | 2,815 (52.7%) | $37,281 |
| Female | 2,531 (47.3%) | $23,656 |
| Total | 5,346 (100.0%) | $27,904 |
Earnings by Sex by Income Bracket in Jackson County
The most common earnings brackets in Jackson County are $20,000 to $22,499 for men (300 | 10.7%) and $25,000 to $29,999 for women (247 | 9.8%).
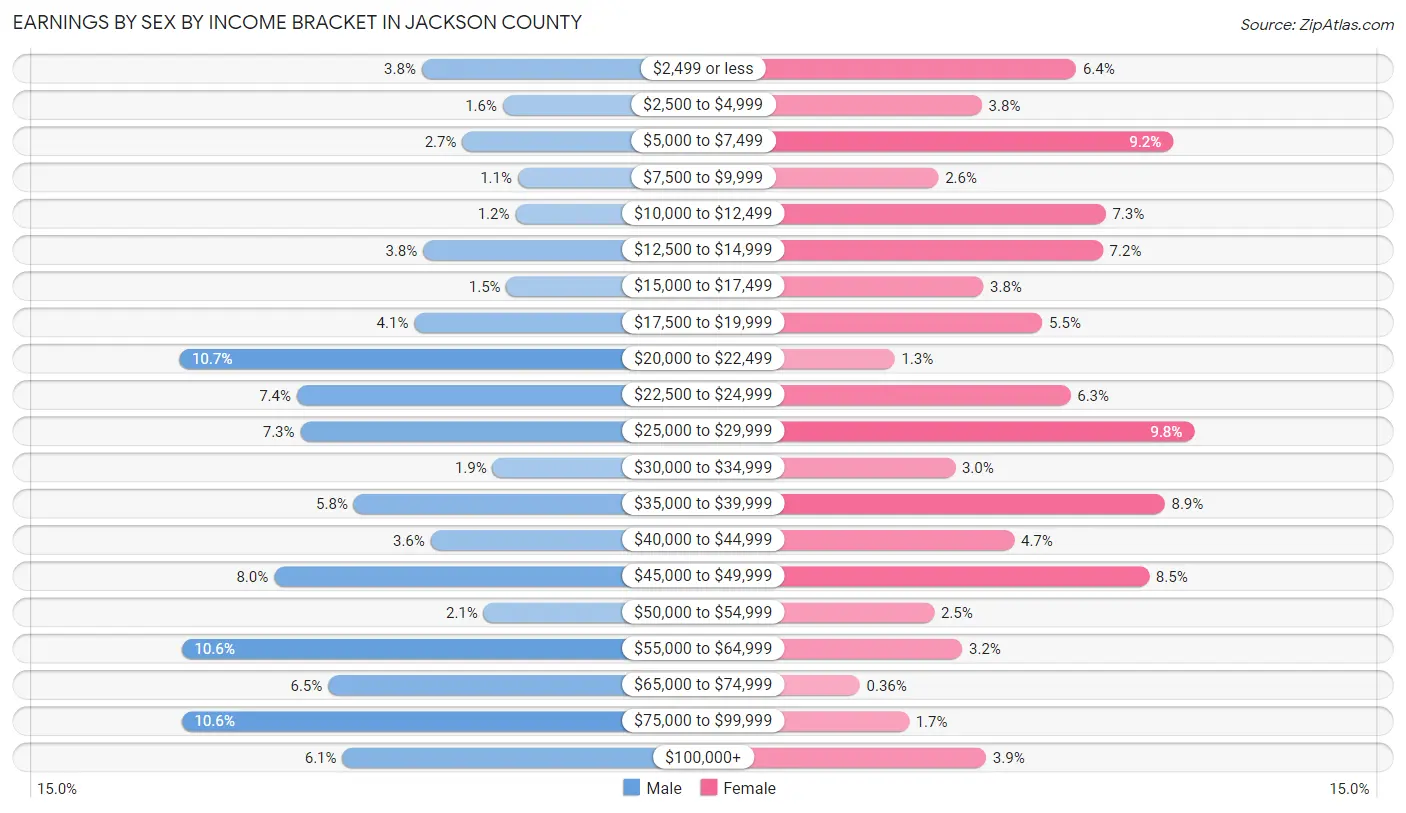
| Income | Male | Female |
| $2,499 or less | 108 (3.8%) | 163 (6.4%) |
| $2,500 to $4,999 | 44 (1.6%) | 96 (3.8%) |
| $5,000 to $7,499 | 76 (2.7%) | 232 (9.2%) |
| $7,500 to $9,999 | 32 (1.1%) | 65 (2.6%) |
| $10,000 to $12,499 | 34 (1.2%) | 184 (7.3%) |
| $12,500 to $14,999 | 107 (3.8%) | 182 (7.2%) |
| $15,000 to $17,499 | 41 (1.5%) | 97 (3.8%) |
| $17,500 to $19,999 | 114 (4.1%) | 139 (5.5%) |
| $20,000 to $22,499 | 300 (10.7%) | 34 (1.3%) |
| $22,500 to $24,999 | 207 (7.3%) | 159 (6.3%) |
| $25,000 to $29,999 | 204 (7.2%) | 247 (9.8%) |
| $30,000 to $34,999 | 52 (1.8%) | 77 (3.0%) |
| $35,000 to $39,999 | 162 (5.8%) | 226 (8.9%) |
| $40,000 to $44,999 | 101 (3.6%) | 119 (4.7%) |
| $45,000 to $49,999 | 225 (8.0%) | 215 (8.5%) |
| $50,000 to $54,999 | 59 (2.1%) | 62 (2.5%) |
| $55,000 to $64,999 | 298 (10.6%) | 82 (3.2%) |
| $65,000 to $74,999 | 182 (6.5%) | 9 (0.4%) |
| $75,000 to $99,999 | 298 (10.6%) | 44 (1.7%) |
| $100,000+ | 171 (6.1%) | 99 (3.9%) |
| Total | 2,815 (100.0%) | 2,531 (100.0%) |
Earnings by Sex by Educational Attainment in Jackson County
Average earnings in Jackson County are $45,187 for men and $26,691 for women, a difference of 40.9%. Men with an educational attainment of graduate degree enjoy the highest average annual earnings of $111,250, while those with less than high school education earn the least with $21,843. Women with an educational attainment of graduate degree earn the most with the average annual earnings of $52,500, while those with college or associate's degree education have the smallest earnings of $14,311.
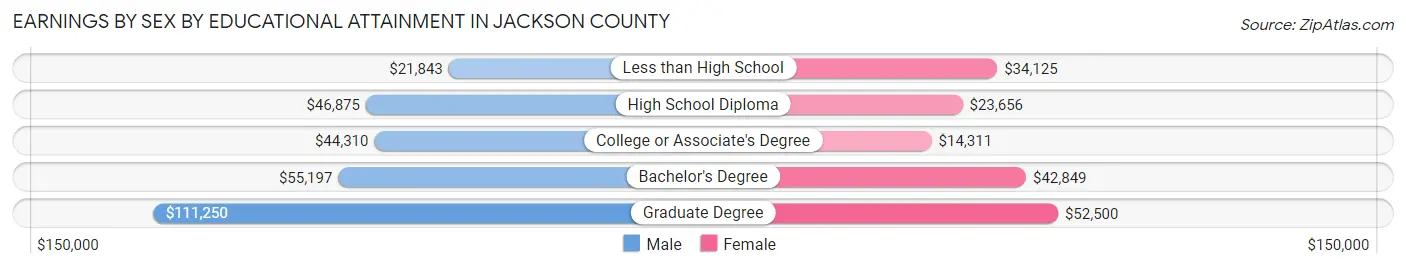
| Educational Attainment | Male Income | Female Income |
| Less than High School | $21,843 | $34,125 |
| High School Diploma | $46,875 | $23,656 |
| College or Associate's Degree | $44,310 | $14,311 |
| Bachelor's Degree | $55,197 | $42,849 |
| Graduate Degree | $111,250 | $52,500 |
| Total | $45,187 | $26,691 |
Family Income in Jackson County
Family Income Brackets in Jackson County
According to the Jackson County family income data, there are 569 families falling into the $100,000 to $149,999 income range, which is the most common income bracket and makes up 20.5% of all families. Conversely, the $10,000 to $14,999 income bracket is the least frequent group with only 53 families (1.9%) belonging to this category.
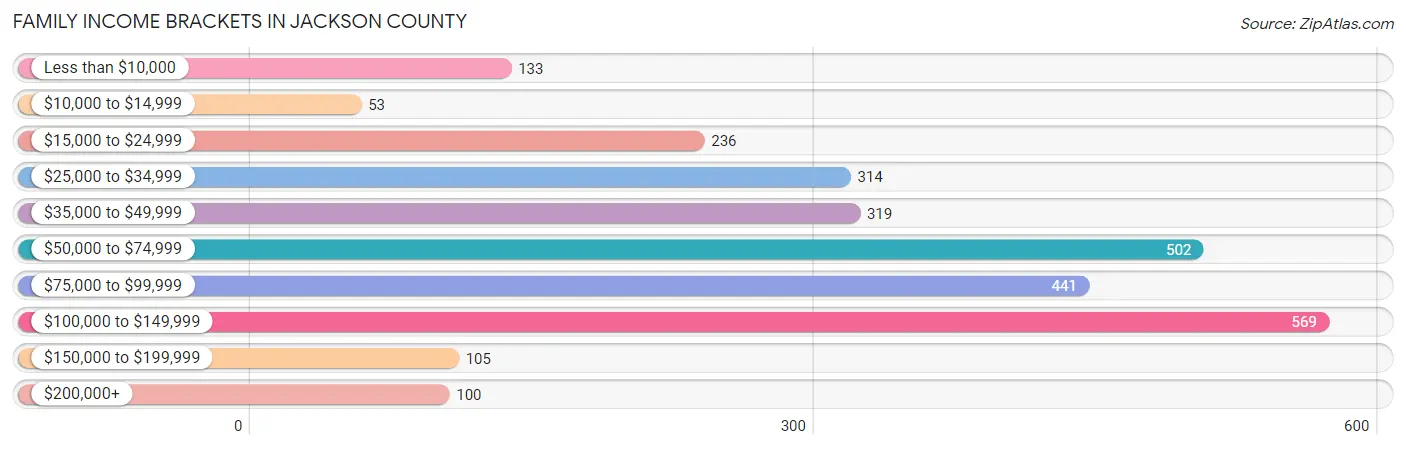
| Income Bracket | # Families | % Families |
| Less than $10,000 | 133 | 4.8% |
| $10,000 to $14,999 | 53 | 1.9% |
| $15,000 to $24,999 | 236 | 8.5% |
| $25,000 to $34,999 | 314 | 11.3% |
| $35,000 to $49,999 | 319 | 11.5% |
| $50,000 to $74,999 | 502 | 18.1% |
| $75,000 to $99,999 | 441 | 15.9% |
| $100,000 to $149,999 | 569 | 20.5% |
| $150,000 to $199,999 | 105 | 3.8% |
| $200,000+ | 100 | 3.6% |
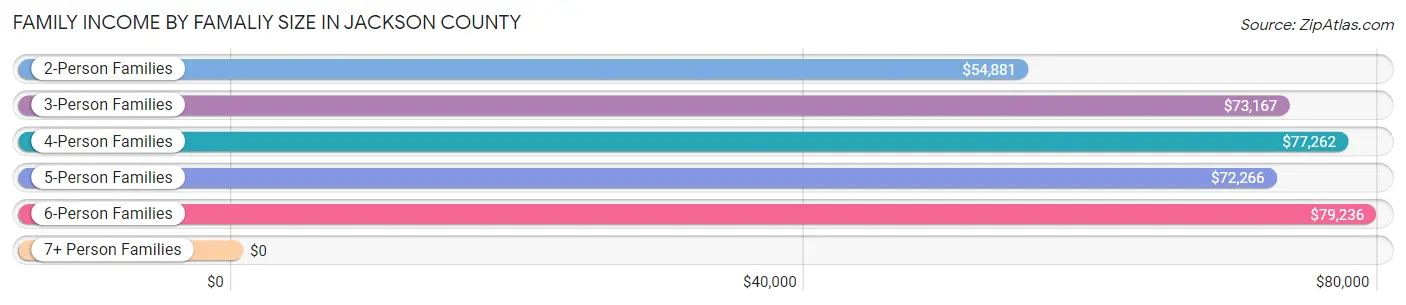
Family Income by Famaliy Size in Jackson County
6-person families (114 | 4.1%) account for the highest median family income in Jackson County with $79,236 per family, while 2-person families (1,456 | 52.4%) have the highest median income of $27,440 per family member.
| Income Bracket | # Families | Median Income |
| 2-Person Families | 1,456 (52.4%) | $54,881 |
| 3-Person Families | 554 (20.0%) | $73,167 |
| 4-Person Families | 462 (16.6%) | $77,262 |
| 5-Person Families | 171 (6.2%) | $72,266 |
| 6-Person Families | 114 (4.1%) | $79,236 |
| 7+ Person Families | 19 (0.7%) | $0 |
| Total | 2,776 (100.0%) | $64,938 |
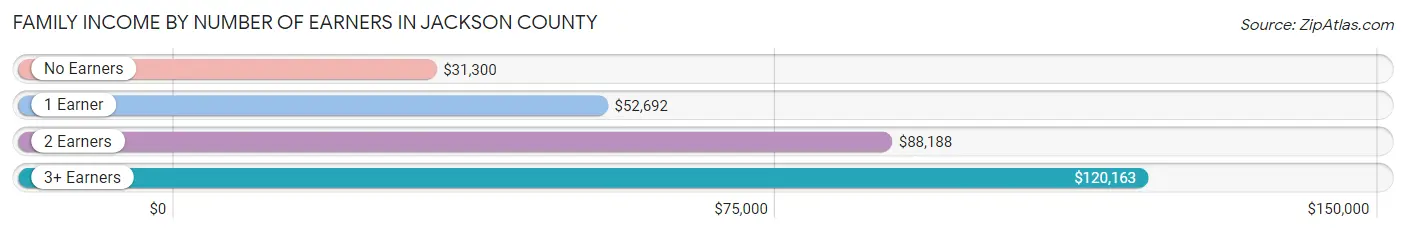
Family Income by Number of Earners in Jackson County
The median family income in Jackson County is $64,938, with families comprising 3+ earners (273) having the highest median family income of $120,163, while families with no earners (662) have the lowest median family income of $31,300, accounting for 9.8% and 23.8% of families, respectively.
| Number of Earners | # Families | Median Income |
| No Earners | 662 (23.8%) | $31,300 |
| 1 Earner | 920 (33.1%) | $52,692 |
| 2 Earners | 921 (33.2%) | $88,188 |
| 3+ Earners | 273 (9.8%) | $120,163 |
| Total | 2,776 (100.0%) | $64,938 |
Household Income in Jackson County
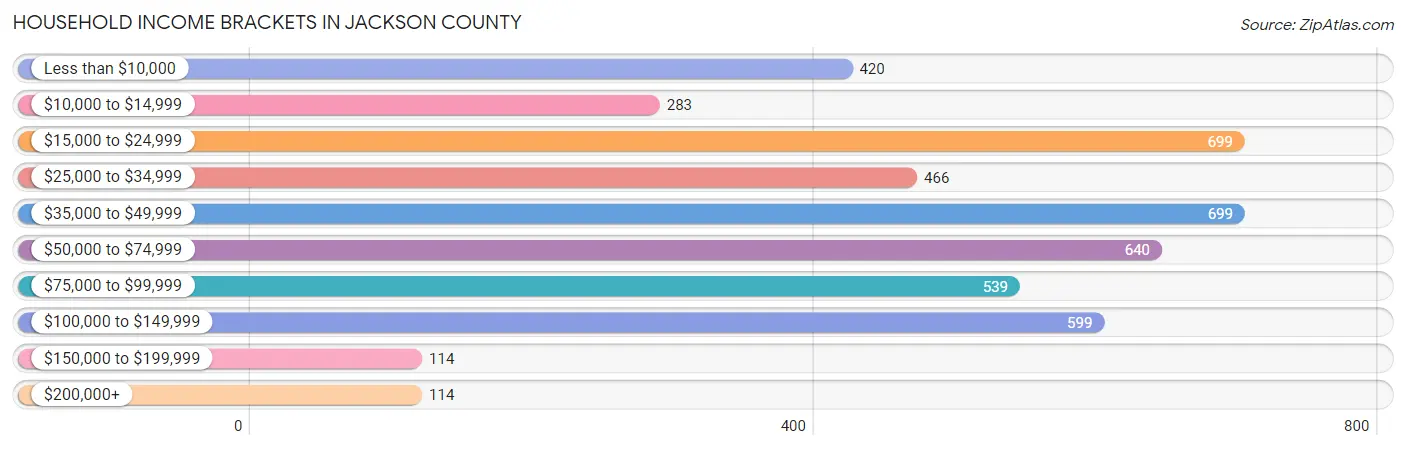
Household Income Brackets in Jackson County
With 699 households falling in the category, the $15,000 to $24,999 income range is the most frequent in Jackson County, accounting for 15.3% of all households. In contrast, only 114 households (2.5%) fall into the $150,000 to $199,999 income bracket, making it the least populous group.
| Income Bracket | # Households | % Households |
| Less than $10,000 | 420 | 9.2% |
| $10,000 to $14,999 | 283 | 6.2% |
| $15,000 to $24,999 | 699 | 15.3% |
| $25,000 to $34,999 | 466 | 10.2% |
| $35,000 to $49,999 | 699 | 15.3% |
| $50,000 to $74,999 | 640 | 14.0% |
| $75,000 to $99,999 | 539 | 11.8% |
| $100,000 to $149,999 | 599 | 13.1% |
| $150,000 to $199,999 | 114 | 2.5% |
| $200,000+ | 114 | 2.5% |
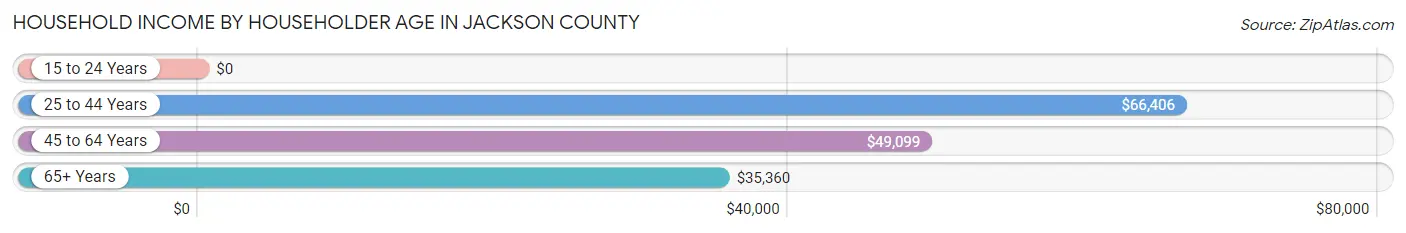
Household Income by Householder Age in Jackson County
The median household income in Jackson County is $42,357, with the highest median household income of $66,406 found in the 25 to 44 years age bracket for the primary householder. A total of 1,006 households (22.0%) fall into this category. Meanwhile, the 15 to 24 years age bracket for the primary householder has the lowest median household income of $0, with 23 households (0.5%) in this group.
| Income Bracket | # Households | Median Income |
| 15 to 24 Years | 23 (0.5%) | $0 |
| 25 to 44 Years | 1,006 (22.0%) | $66,406 |
| 45 to 64 Years | 1,825 (39.9%) | $49,099 |
| 65+ Years | 1,715 (37.5%) | $35,360 |
| Total | 4,569 (100.0%) | $42,357 |
Poverty in Jackson County
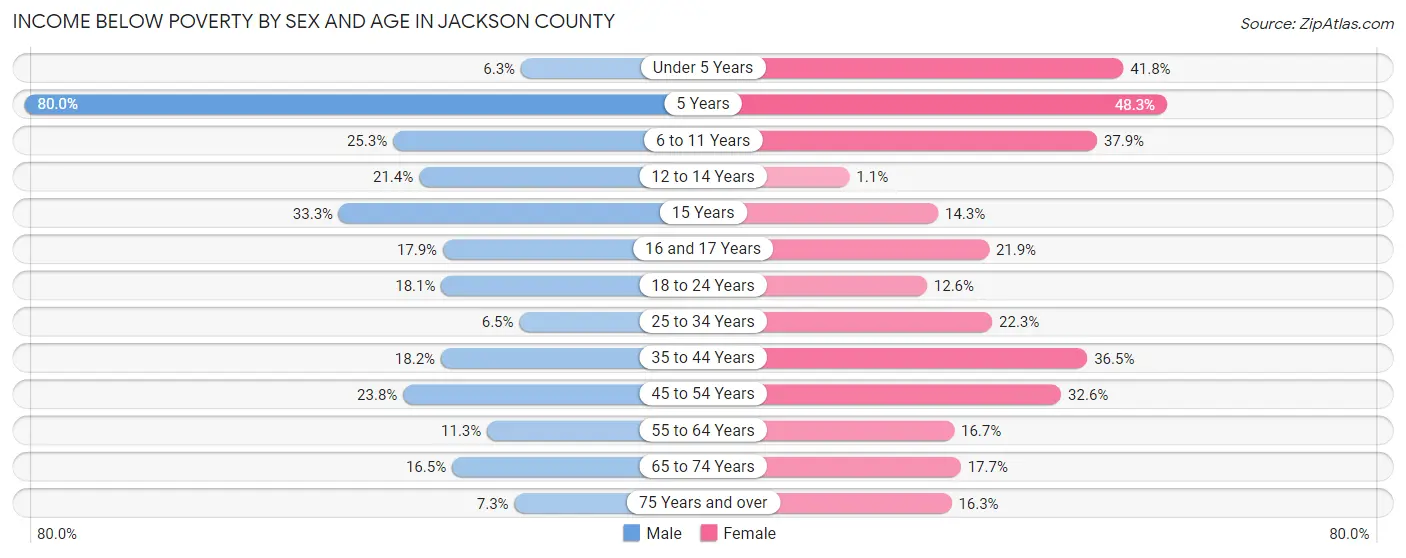
Income Below Poverty by Sex and Age in Jackson County
With 15.5% poverty level for males and 23.9% for females among the residents of Jackson County, 5 year old males and 5 year old females are the most vulnerable to poverty, with 4 males (80.0%) and 14 females (48.3%) in their respective age groups living below the poverty level.
| Age Bracket | Male | Female |
| Under 5 Years | 15 (6.3%) | 115 (41.8%) |
| 5 Years | 4 (80.0%) | 14 (48.3%) |
| 6 to 11 Years | 85 (25.3%) | 147 (37.9%) |
| 12 to 14 Years | 48 (21.4%) | 2 (1.1%) |
| 15 Years | 3 (33.3%) | 3 (14.3%) |
| 16 and 17 Years | 32 (17.9%) | 33 (21.8%) |
| 18 to 24 Years | 81 (18.1%) | 49 (12.6%) |
| 25 to 34 Years | 41 (6.5%) | 129 (22.3%) |
| 35 to 44 Years | 120 (18.2%) | 234 (36.4%) |
| 45 to 54 Years | 186 (23.8%) | 257 (32.6%) |
| 55 to 64 Years | 115 (11.3%) | 160 (16.7%) |
| 65 to 74 Years | 132 (16.5%) | 145 (17.7%) |
| 75 Years and over | 32 (7.3%) | 84 (16.3%) |
| Total | 894 (15.5%) | 1,372 (23.9%) |
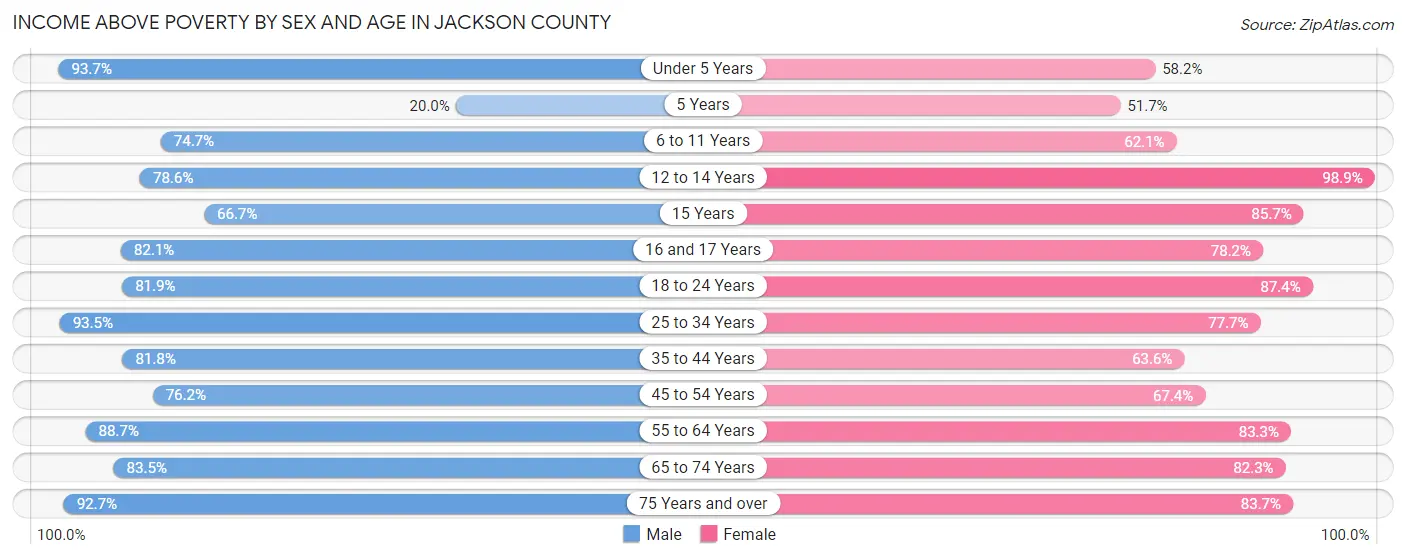
Income Above Poverty by Sex and Age in Jackson County
According to the poverty statistics in Jackson County, males aged under 5 years and females aged 12 to 14 years are the age groups that are most secure financially, with 93.7% of males and 98.9% of females in these age groups living above the poverty line.
| Age Bracket | Male | Female |
| Under 5 Years | 223 (93.7%) | 160 (58.2%) |
| 5 Years | 1 (20.0%) | 15 (51.7%) |
| 6 to 11 Years | 251 (74.7%) | 241 (62.1%) |
| 12 to 14 Years | 176 (78.6%) | 175 (98.9%) |
| 15 Years | 6 (66.7%) | 18 (85.7%) |
| 16 and 17 Years | 147 (82.1%) | 118 (78.1%) |
| 18 to 24 Years | 366 (81.9%) | 339 (87.4%) |
| 25 to 34 Years | 587 (93.5%) | 449 (77.7%) |
| 35 to 44 Years | 540 (81.8%) | 408 (63.5%) |
| 45 to 54 Years | 596 (76.2%) | 532 (67.4%) |
| 55 to 64 Years | 901 (88.7%) | 800 (83.3%) |
| 65 to 74 Years | 666 (83.5%) | 676 (82.3%) |
| 75 Years and over | 408 (92.7%) | 432 (83.7%) |
| Total | 4,868 (84.5%) | 4,363 (76.1%) |
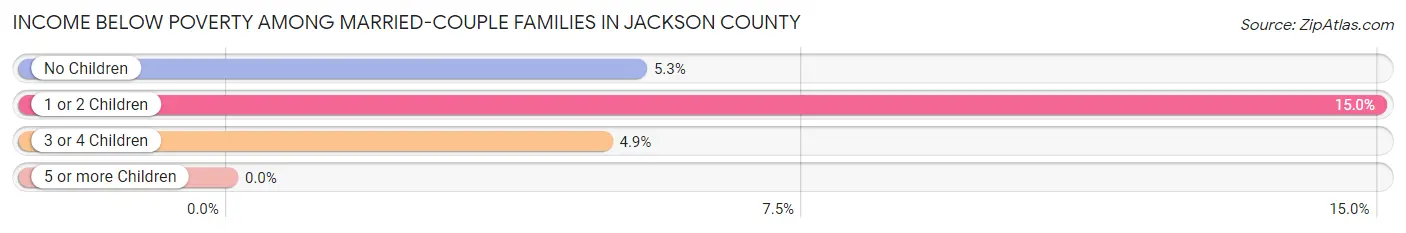
Income Below Poverty Among Married-Couple Families in Jackson County
The poverty statistics for married-couple families in Jackson County show that 7.5% or 161 of the total 2,140 families live below the poverty line. Families with 1 or 2 children have the highest poverty rate of 15.0%, comprising of 75 families. On the other hand, families with 5 or more children have the lowest poverty rate of 0.0%, which includes 0 families.
| Children | Above Poverty | Below Poverty |
| No Children | 1,364 (94.7%) | 77 (5.3%) |
| 1 or 2 Children | 425 (85.0%) | 75 (15.0%) |
| 3 or 4 Children | 175 (95.1%) | 9 (4.9%) |
| 5 or more Children | 15 (100.0%) | 0 (0.0%) |
| Total | 1,979 (92.5%) | 161 (7.5%) |
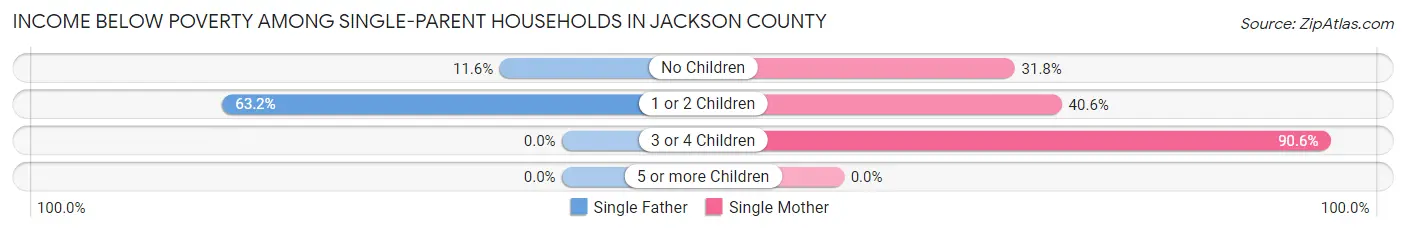
Income Below Poverty Among Single-Parent Households in Jackson County
According to the poverty data in Jackson County, 33.5% or 65 single-father households and 43.0% or 190 single-mother households are living below the poverty line. Among single-father households, those with 1 or 2 children have the highest poverty rate, with 60 households (63.2%) experiencing poverty. Likewise, among single-mother households, those with 3 or 4 children have the highest poverty rate, with 58 households (90.6%) falling below the poverty line.
| Children | Single Father | Single Mother |
| No Children | 5 (11.6%) | 78 (31.8%) |
| 1 or 2 Children | 60 (63.2%) | 54 (40.6%) |
| 3 or 4 Children | 0 (0.0%) | 58 (90.6%) |
| 5 or more Children | 0 (0.0%) | 0 (0.0%) |
| Total | 65 (33.5%) | 190 (43.0%) |
Income Below Poverty Among Married-Couple vs Single-Parent Households in Jackson County
The poverty data for Jackson County shows that 161 of the married-couple family households (7.5%) and 255 of the single-parent households (40.1%) are living below the poverty level. Within the married-couple family households, those with 1 or 2 children have the highest poverty rate, with 75 households (15.0%) falling below the poverty line. Among the single-parent households, those with 1 or 2 children have the highest poverty rate, with 114 household (50.0%) living below poverty.
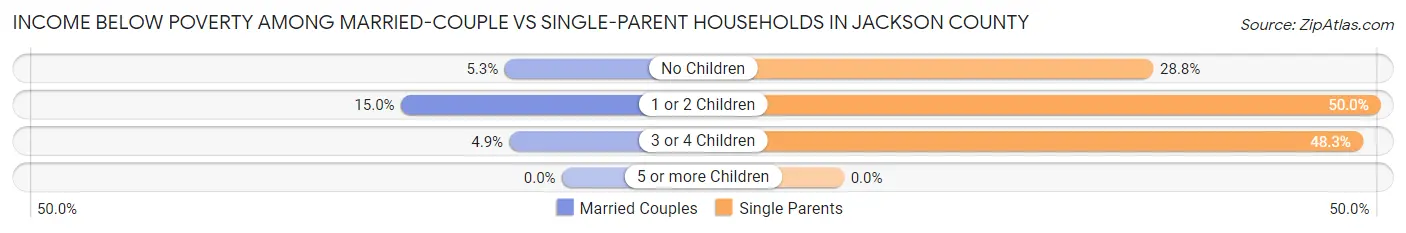
| Children | Married-Couple Families | Single-Parent Households |
| No Children | 77 (5.3%) | 83 (28.8%) |
| 1 or 2 Children | 75 (15.0%) | 114 (50.0%) |
| 3 or 4 Children | 9 (4.9%) | 58 (48.3%) |
| 5 or more Children | 0 (0.0%) | 0 (0.0%) |
| Total | 161 (7.5%) | 255 (40.1%) |
Employment Characteristics in Jackson County
Employment by Class of Employer in Jackson County
Among the 4,704 employed individuals in Jackson County, private company employees (3,218 | 68.4%), self-employed (not incorporated) (414 | 8.8%), and local government employees (386 | 8.2%) make up the most common classes of employment.
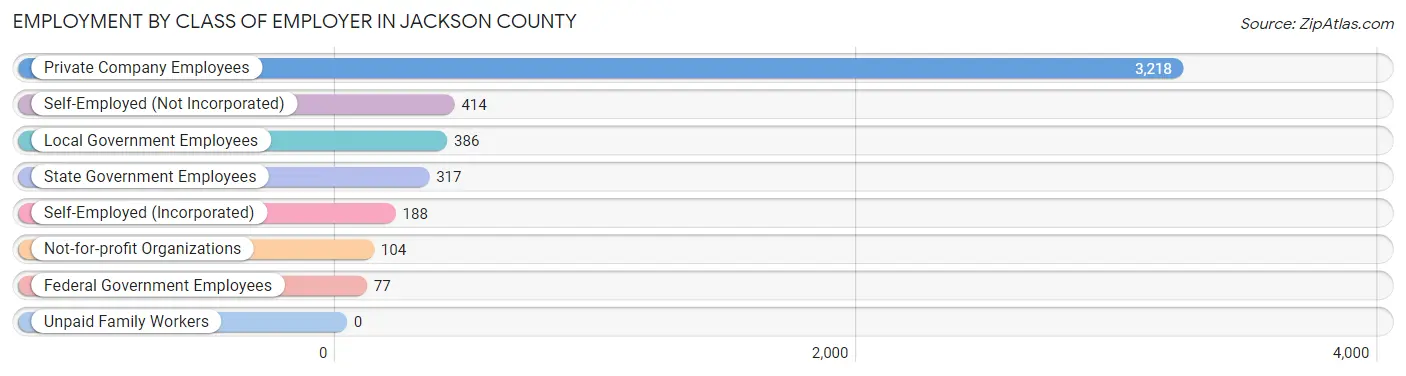
| Employer Class | # Employees | % Employees |
| Private Company Employees | 3,218 | 68.4% |
| Self-Employed (Incorporated) | 188 | 4.0% |
| Self-Employed (Not Incorporated) | 414 | 8.8% |
| Not-for-profit Organizations | 104 | 2.2% |
| Local Government Employees | 386 | 8.2% |
| State Government Employees | 317 | 6.7% |
| Federal Government Employees | 77 | 1.6% |
| Unpaid Family Workers | 0 | 0.0% |
| Total | 4,704 | 100.0% |
Employment Status by Age in Jackson County
According to the labor force statistics for Jackson County, out of the total population over 16 years of age (9,973), 51.8% or 5,166 individuals are in the labor force, with 7.2% or 372 of them unemployed. The age group with the highest labor force participation rate is 25 to 29 years, with 83.3% or 538 individuals in the labor force. Within the labor force, the 20 to 24 years age range has the highest percentage of unemployed individuals, with 27.1% or 117 of them being unemployed.
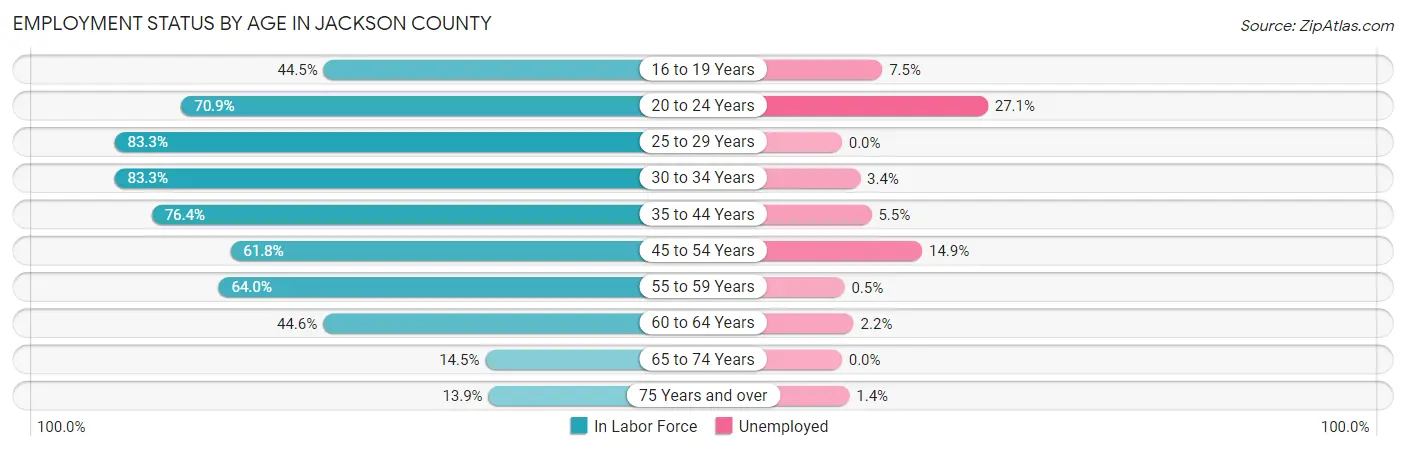
| Age Bracket | In Labor Force | Unemployed |
| 16 to 19 Years | 265 (44.5%) | 20 (7.5%) |
| 20 to 24 Years | 431 (70.9%) | 117 (27.1%) |
| 25 to 29 Years | 538 (83.3%) | 0 (0.0%) |
| 30 to 34 Years | 494 (83.3%) | 17 (3.4%) |
| 35 to 44 Years | 1,008 (76.4%) | 55 (5.5%) |
| 45 to 54 Years | 988 (61.8%) | 147 (14.9%) |
| 55 to 59 Years | 609 (64.0%) | 3 (0.5%) |
| 60 to 64 Years | 458 (44.6%) | 10 (2.2%) |
| 65 to 74 Years | 239 (14.5%) | 0 (0.0%) |
| 75 Years and over | 138 (13.9%) | 2 (1.4%) |
| Total | 5,166 (51.8%) | 372 (7.2%) |
Employment Status by Educational Attainment in Jackson County
According to labor force statistics for Jackson County, 66.8% of individuals (4,098) out of the total population between 25 and 64 years of age (6,134) are in the labor force, with 5.7% or 234 of them being unemployed. The group with the highest labor force participation rate are those with the educational attainment of bachelor's degree or higher, with 78.4% or 695 individuals in the labor force. Within the labor force, individuals with less than high school education have the highest percentage of unemployment, with 7.0% or 32 of them being unemployed.
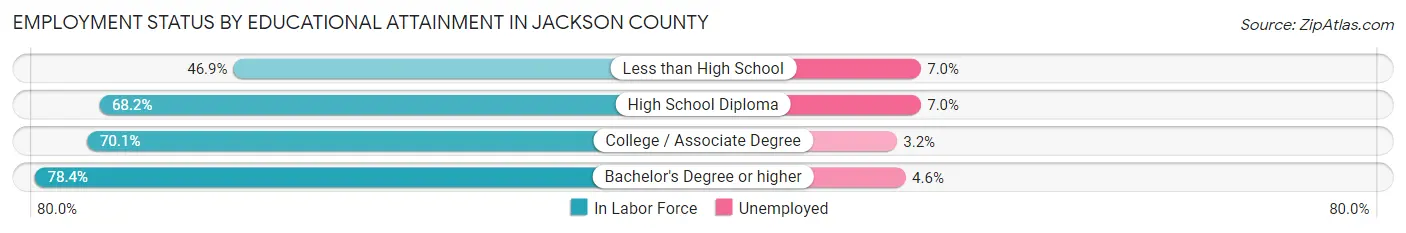
| Educational Attainment | In Labor Force | Unemployed |
| Less than High School | 454 (46.9%) | 68 (7.0%) |
| High School Diploma | 1,924 (68.2%) | 197 (7.0%) |
| College / Associate Degree | 1,023 (70.1%) | 47 (3.2%) |
| Bachelor's Degree or higher | 695 (78.4%) | 41 (4.6%) |
| Total | 4,098 (66.8%) | 350 (5.7%) |
Employment Occupations by Sex in Jackson County
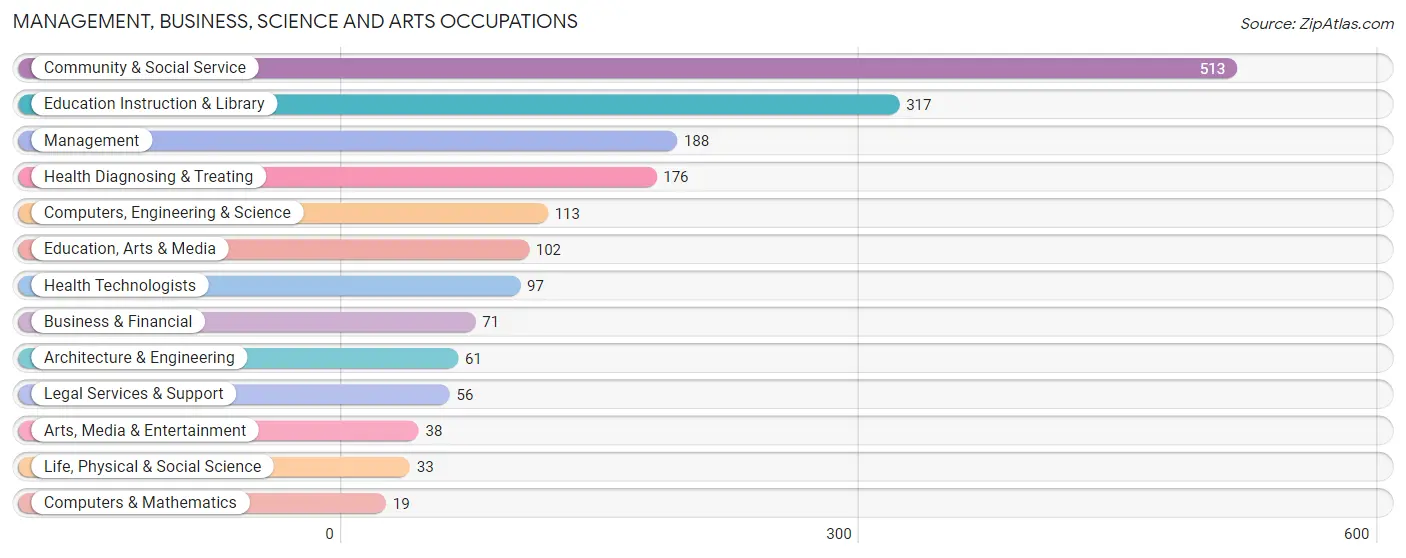
Management, Business, Science and Arts Occupations
The most common Management, Business, Science and Arts occupations in Jackson County are Community & Social Service (513 | 10.7%), Education Instruction & Library (317 | 6.6%), Management (188 | 3.9%), Health Diagnosing & Treating (176 | 3.7%), and Computers, Engineering & Science (113 | 2.4%).
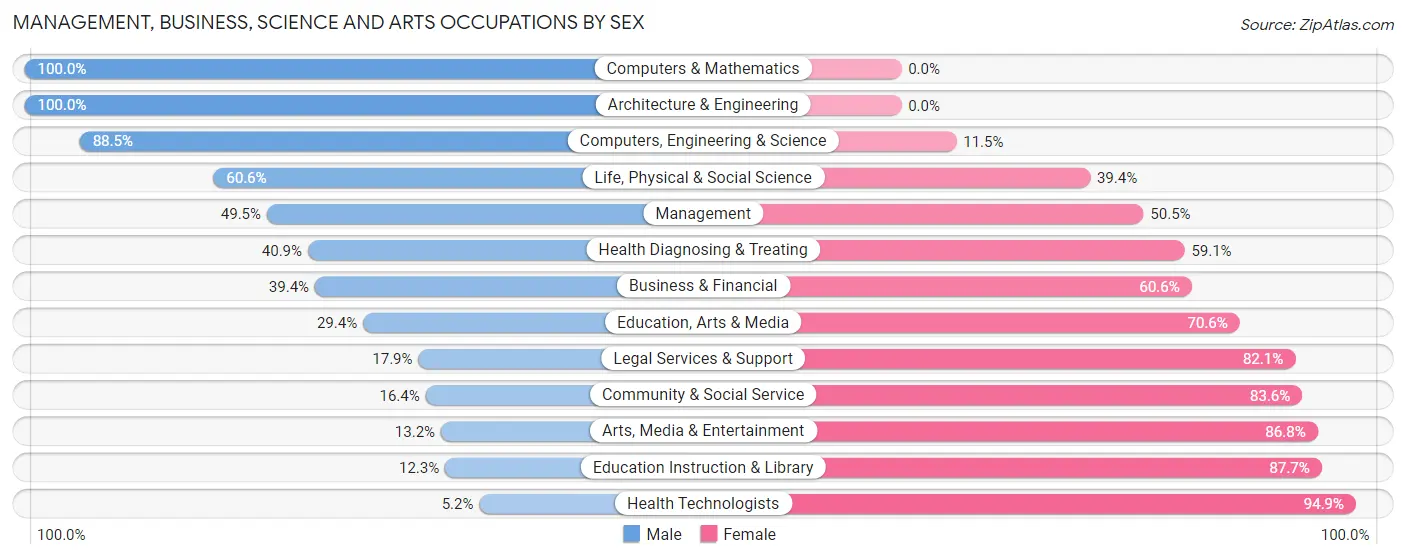
Management, Business, Science and Arts Occupations by Sex
Within the Management, Business, Science and Arts occupations in Jackson County, the most male-oriented occupations are Computers & Mathematics (100.0%), Architecture & Engineering (100.0%), and Computers, Engineering & Science (88.5%), while the most female-oriented occupations are Health Technologists (94.9%), Education Instruction & Library (87.7%), and Arts, Media & Entertainment (86.8%).
| Occupation | Male | Female |
| Management | 93 (49.5%) | 95 (50.5%) |
| Business & Financial | 28 (39.4%) | 43 (60.6%) |
| Computers, Engineering & Science | 100 (88.5%) | 13 (11.5%) |
| Computers & Mathematics | 19 (100.0%) | 0 (0.0%) |
| Architecture & Engineering | 61 (100.0%) | 0 (0.0%) |
| Life, Physical & Social Science | 20 (60.6%) | 13 (39.4%) |
| Community & Social Service | 84 (16.4%) | 429 (83.6%) |
| Education, Arts & Media | 30 (29.4%) | 72 (70.6%) |
| Legal Services & Support | 10 (17.9%) | 46 (82.1%) |
| Education Instruction & Library | 39 (12.3%) | 278 (87.7%) |
| Arts, Media & Entertainment | 5 (13.2%) | 33 (86.8%) |
| Health Diagnosing & Treating | 72 (40.9%) | 104 (59.1%) |
| Health Technologists | 5 (5.1%) | 92 (94.9%) |
| Total (Category) | 377 (35.5%) | 684 (64.5%) |
| Total (Overall) | 2,594 (54.1%) | 2,202 (45.9%) |
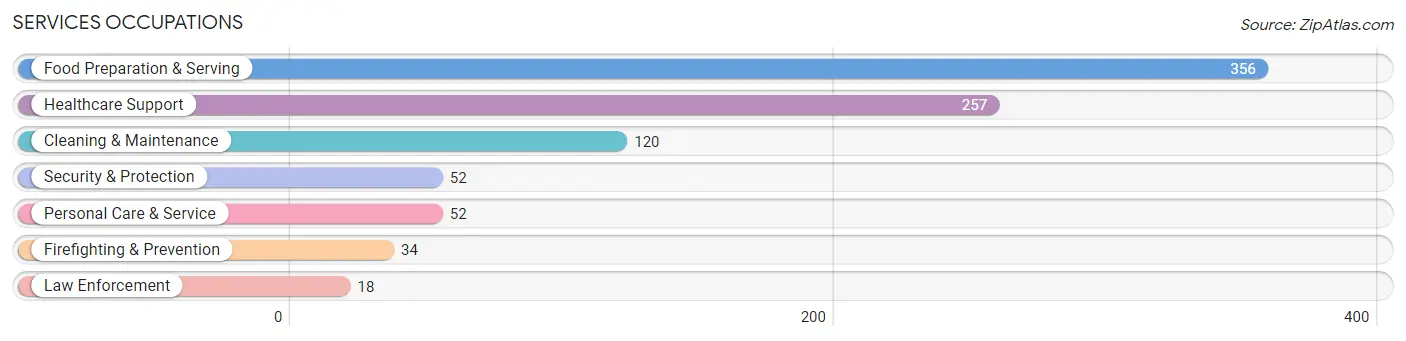
Services Occupations
The most common Services occupations in Jackson County are Food Preparation & Serving (356 | 7.4%), Healthcare Support (257 | 5.4%), Cleaning & Maintenance (120 | 2.5%), Security & Protection (52 | 1.1%), and Personal Care & Service (52 | 1.1%).
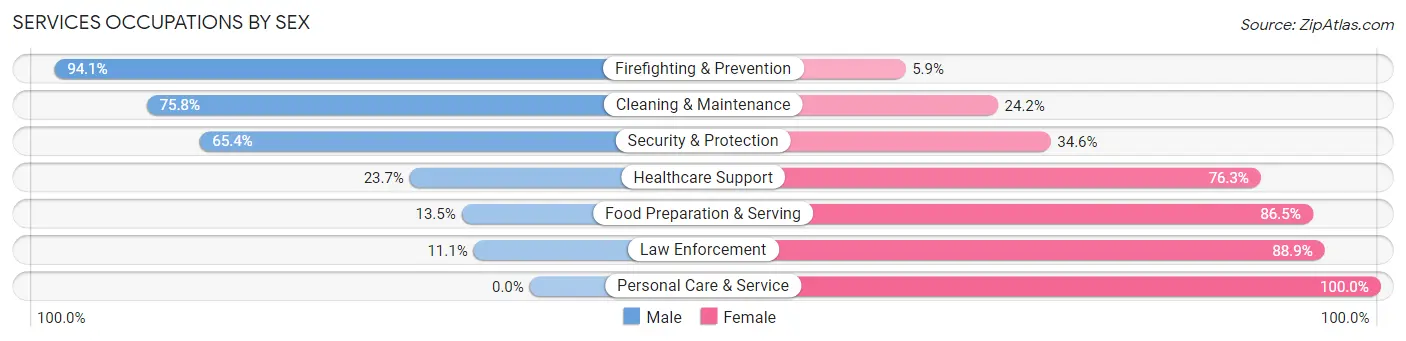
Services Occupations by Sex
Within the Services occupations in Jackson County, the most male-oriented occupations are Firefighting & Prevention (94.1%), Cleaning & Maintenance (75.8%), and Security & Protection (65.4%), while the most female-oriented occupations are Personal Care & Service (100.0%), Law Enforcement (88.9%), and Food Preparation & Serving (86.5%).
| Occupation | Male | Female |
| Healthcare Support | 61 (23.7%) | 196 (76.3%) |
| Security & Protection | 34 (65.4%) | 18 (34.6%) |
| Firefighting & Prevention | 32 (94.1%) | 2 (5.9%) |
| Law Enforcement | 2 (11.1%) | 16 (88.9%) |
| Food Preparation & Serving | 48 (13.5%) | 308 (86.5%) |
| Cleaning & Maintenance | 91 (75.8%) | 29 (24.2%) |
| Personal Care & Service | 0 (0.0%) | 52 (100.0%) |
| Total (Category) | 234 (28.0%) | 603 (72.0%) |
| Total (Overall) | 2,594 (54.1%) | 2,202 (45.9%) |
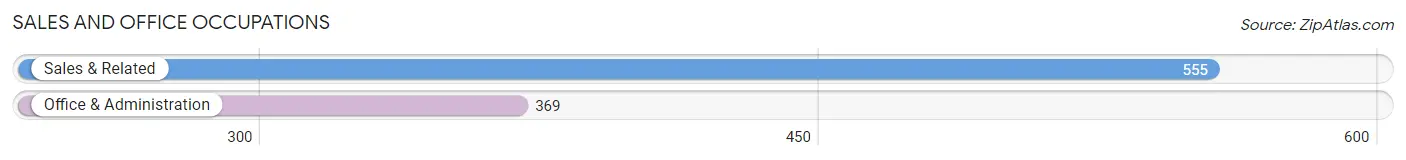
Sales and Office Occupations
The most common Sales and Office occupations in Jackson County are Sales & Related (555 | 11.6%), and Office & Administration (369 | 7.7%).
Sales and Office Occupations by Sex

| Occupation | Male | Female |
| Sales & Related | 256 (46.1%) | 299 (53.9%) |
| Office & Administration | 52 (14.1%) | 317 (85.9%) |
| Total (Category) | 308 (33.3%) | 616 (66.7%) |
| Total (Overall) | 2,594 (54.1%) | 2,202 (45.9%) |
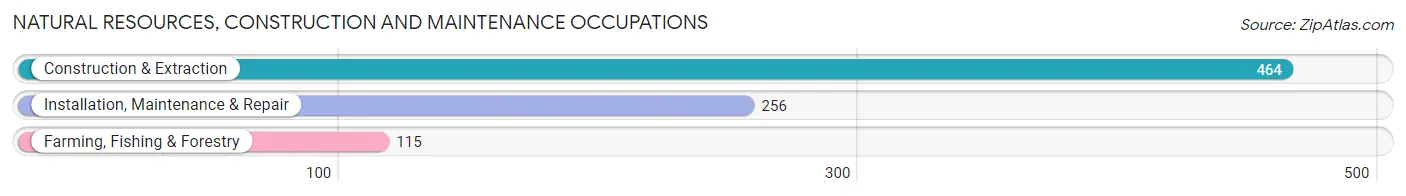
Natural Resources, Construction and Maintenance Occupations
The most common Natural Resources, Construction and Maintenance occupations in Jackson County are Construction & Extraction (464 | 9.7%), Installation, Maintenance & Repair (256 | 5.3%), and Farming, Fishing & Forestry (115 | 2.4%).
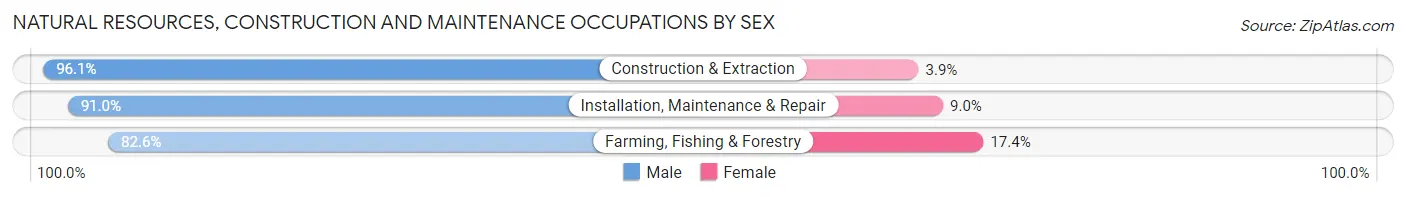
Natural Resources, Construction and Maintenance Occupations by Sex
| Occupation | Male | Female |
| Farming, Fishing & Forestry | 95 (82.6%) | 20 (17.4%) |
| Construction & Extraction | 446 (96.1%) | 18 (3.9%) |
| Installation, Maintenance & Repair | 233 (91.0%) | 23 (9.0%) |
| Total (Category) | 774 (92.7%) | 61 (7.3%) |
| Total (Overall) | 2,594 (54.1%) | 2,202 (45.9%) |
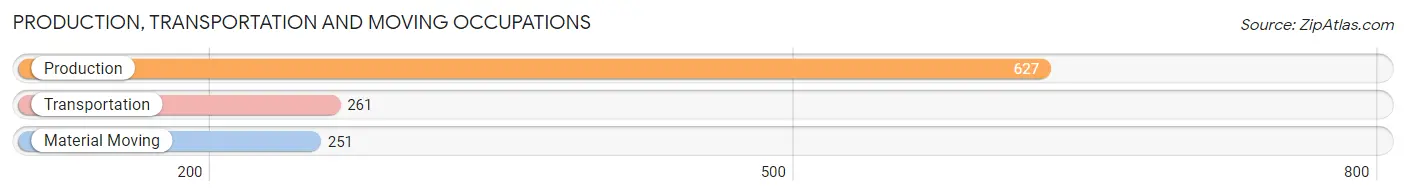
Production, Transportation and Moving Occupations
The most common Production, Transportation and Moving occupations in Jackson County are Production (627 | 13.1%), Transportation (261 | 5.4%), and Material Moving (251 | 5.2%).
Production, Transportation and Moving Occupations by Sex
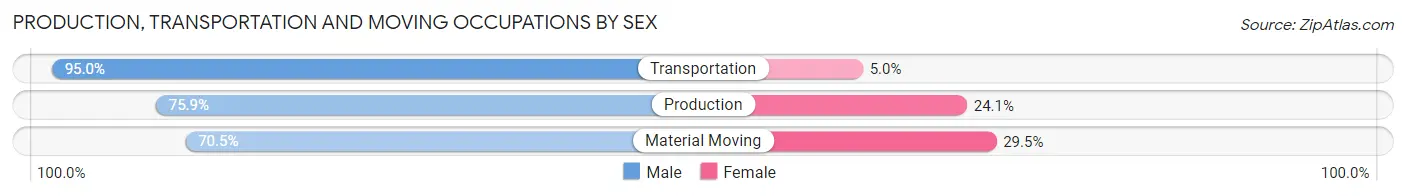
| Occupation | Male | Female |
| Production | 476 (75.9%) | 151 (24.1%) |
| Transportation | 248 (95.0%) | 13 (5.0%) |
| Material Moving | 177 (70.5%) | 74 (29.5%) |
| Total (Category) | 901 (79.1%) | 238 (20.9%) |
| Total (Overall) | 2,594 (54.1%) | 2,202 (45.9%) |
Employment Industries by Sex in Jackson County
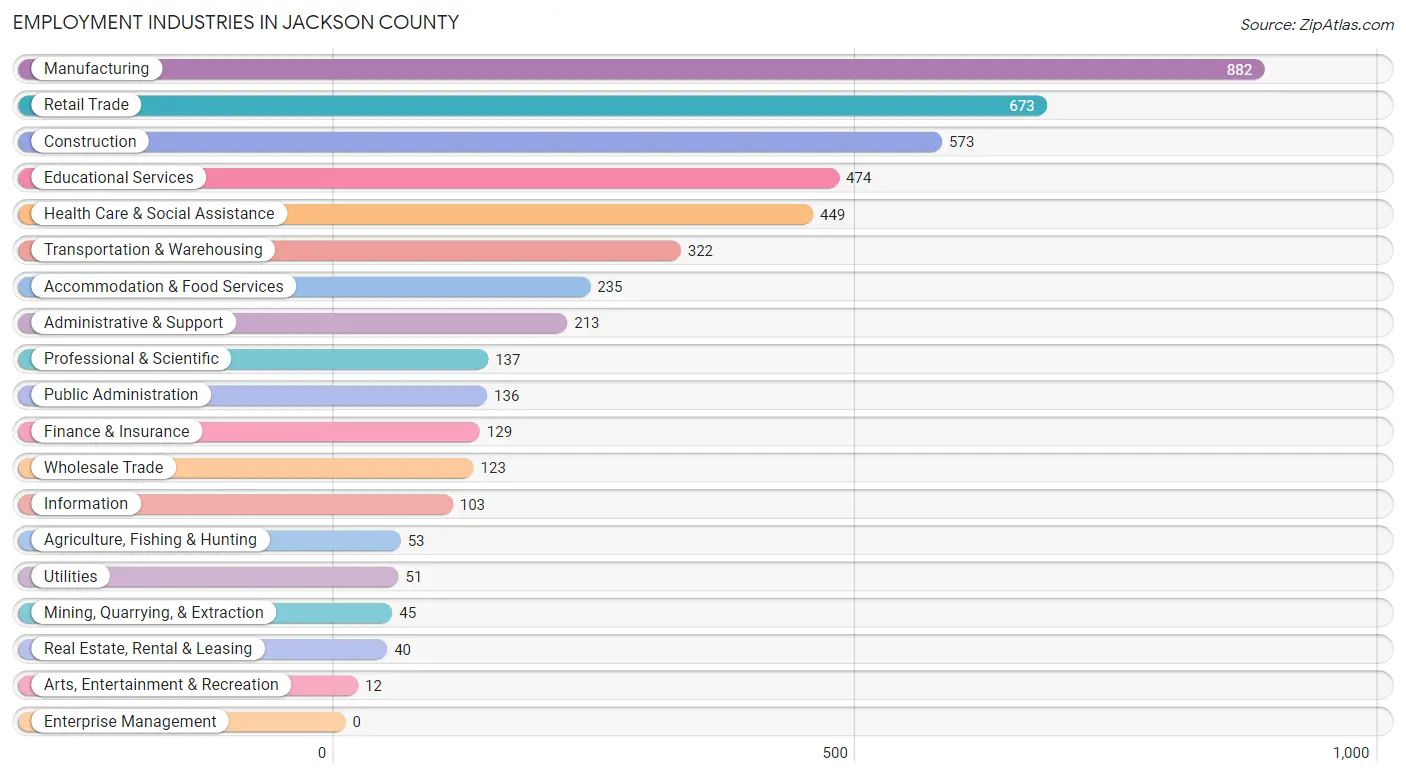
Employment Industries in Jackson County
The major employment industries in Jackson County include Manufacturing (882 | 18.4%), Retail Trade (673 | 14.0%), Construction (573 | 11.9%), Educational Services (474 | 9.9%), and Health Care & Social Assistance (449 | 9.4%).
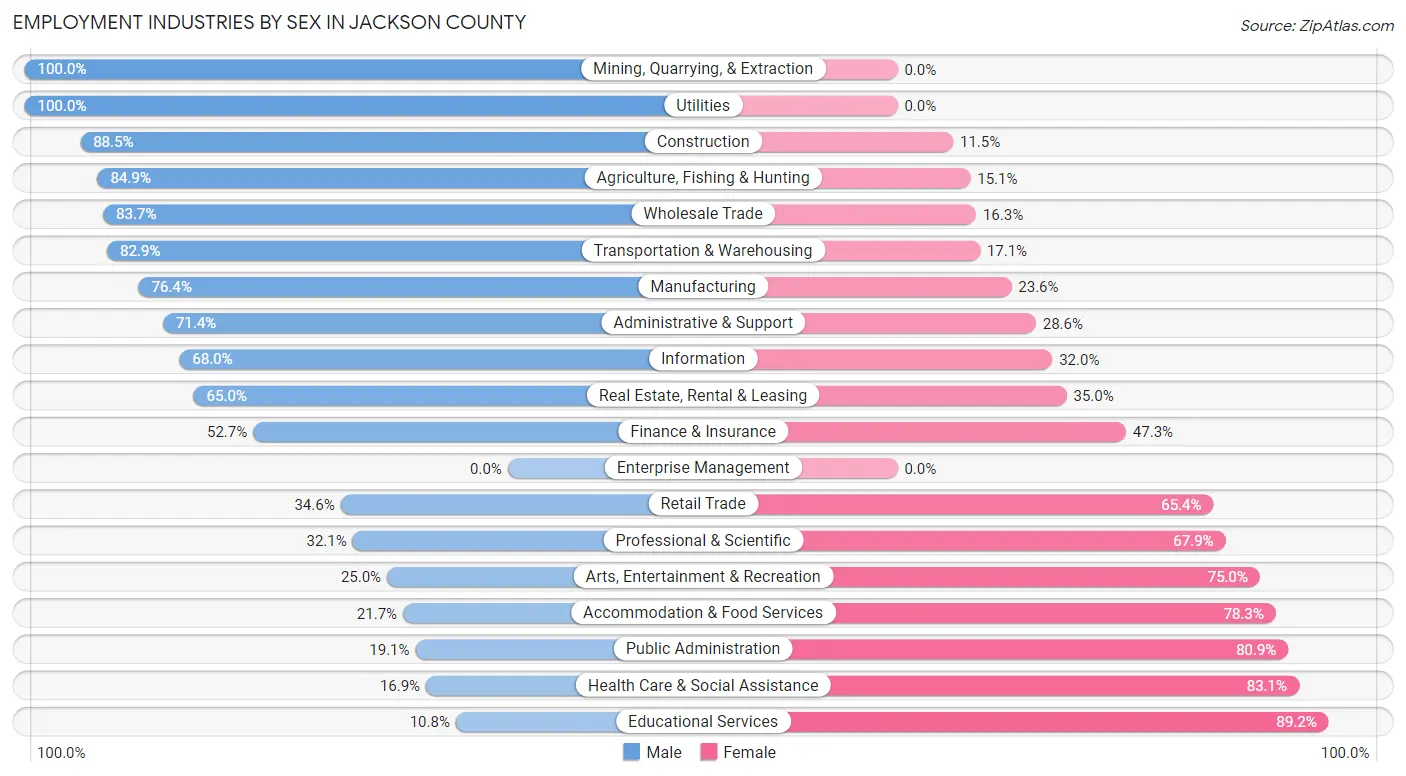
Employment Industries by Sex in Jackson County
The Jackson County industries that see more men than women are Mining, Quarrying, & Extraction (100.0%), Utilities (100.0%), and Construction (88.5%), whereas the industries that tend to have a higher number of women are Educational Services (89.2%), Health Care & Social Assistance (83.1%), and Public Administration (80.9%).
| Industry | Male | Female |
| Agriculture, Fishing & Hunting | 45 (84.9%) | 8 (15.1%) |
| Mining, Quarrying, & Extraction | 45 (100.0%) | 0 (0.0%) |
| Construction | 507 (88.5%) | 66 (11.5%) |
| Manufacturing | 674 (76.4%) | 208 (23.6%) |
| Wholesale Trade | 103 (83.7%) | 20 (16.3%) |
| Retail Trade | 233 (34.6%) | 440 (65.4%) |
| Transportation & Warehousing | 267 (82.9%) | 55 (17.1%) |
| Utilities | 51 (100.0%) | 0 (0.0%) |
| Information | 70 (68.0%) | 33 (32.0%) |
| Finance & Insurance | 68 (52.7%) | 61 (47.3%) |
| Real Estate, Rental & Leasing | 26 (65.0%) | 14 (35.0%) |
| Professional & Scientific | 44 (32.1%) | 93 (67.9%) |
| Enterprise Management | 0 (0.0%) | 0 (0.0%) |
| Administrative & Support | 152 (71.4%) | 61 (28.6%) |
| Educational Services | 51 (10.8%) | 423 (89.2%) |
| Health Care & Social Assistance | 76 (16.9%) | 373 (83.1%) |
| Arts, Entertainment & Recreation | 3 (25.0%) | 9 (75.0%) |
| Accommodation & Food Services | 51 (21.7%) | 184 (78.3%) |
| Public Administration | 26 (19.1%) | 110 (80.9%) |
| Total | 2,594 (54.1%) | 2,202 (45.9%) |
Education in Jackson County
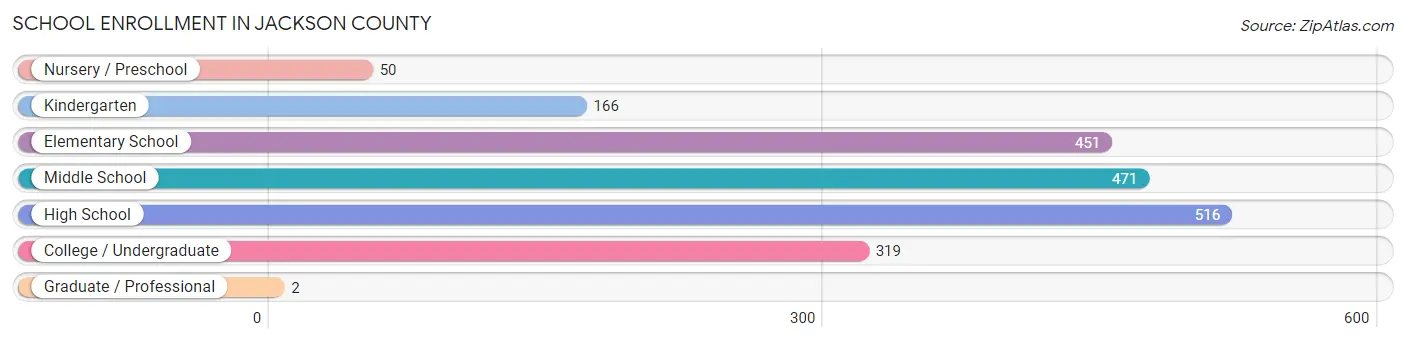
School Enrollment in Jackson County
The most common levels of schooling among the 1,975 students in Jackson County are high school (516 | 26.1%), middle school (471 | 23.8%), and elementary school (451 | 22.8%).
| School Level | # Students | % Students |
| Nursery / Preschool | 50 | 2.5% |
| Kindergarten | 166 | 8.4% |
| Elementary School | 451 | 22.8% |
| Middle School | 471 | 23.8% |
| High School | 516 | 26.1% |
| College / Undergraduate | 319 | 16.2% |
| Graduate / Professional | 2 | 0.1% |
| Total | 1,975 | 100.0% |
School Enrollment by Age by Funding Source in Jackson County
Out of a total of 1,975 students who are enrolled in schools in Jackson County, 259 (13.1%) attend a private institution, while the remaining 1,716 (86.9%) are enrolled in public schools. The age group of 18 to 19 year olds has the highest likelihood of being enrolled in private schools, with 53 (30.3% in the age bracket) enrolled. Conversely, the age group of 35 years and over has the lowest likelihood of being enrolled in a private school, with 14 (100.0% in the age bracket) attending a public institution.
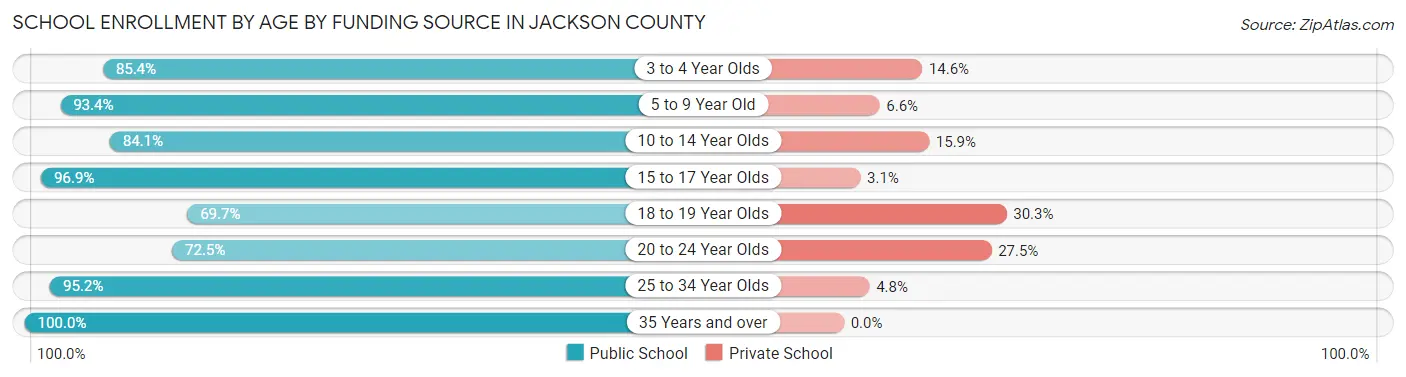
| Age Bracket | Public School | Private School |
| 3 to 4 Year Olds | 41 (85.4%) | 7 (14.6%) |
| 5 to 9 Year Old | 534 (93.4%) | 38 (6.6%) |
| 10 to 14 Year Olds | 456 (84.1%) | 86 (15.9%) |
| 15 to 17 Year Olds | 349 (96.9%) | 11 (3.1%) |
| 18 to 19 Year Olds | 122 (69.7%) | 53 (30.3%) |
| 20 to 24 Year Olds | 161 (72.5%) | 61 (27.5%) |
| 25 to 34 Year Olds | 40 (95.2%) | 2 (4.8%) |
| 35 Years and over | 14 (100.0%) | 0 (0.0%) |
| Total | 1,716 (86.9%) | 259 (13.1%) |
Educational Attainment by Field of Study in Jackson County
Education (317 | 24.2%), business (189 | 14.4%), arts & humanities (147 | 11.2%), social sciences (107 | 8.2%), and bio, nature & agricultural (105 | 8.0%) are the most common fields of study among 1,310 individuals in Jackson County who have obtained a bachelor's degree or higher.
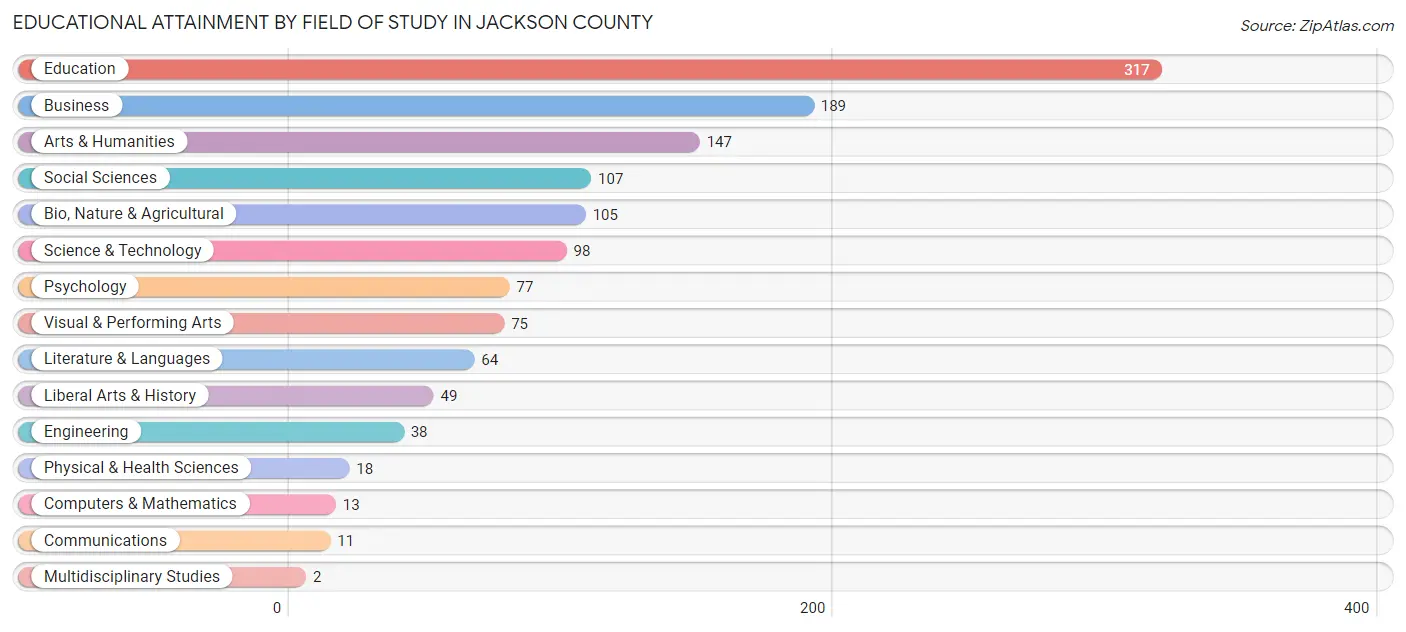
| Field of Study | # Graduates | % Graduates |
| Computers & Mathematics | 13 | 1.0% |
| Bio, Nature & Agricultural | 105 | 8.0% |
| Physical & Health Sciences | 18 | 1.4% |
| Psychology | 77 | 5.9% |
| Social Sciences | 107 | 8.2% |
| Engineering | 38 | 2.9% |
| Multidisciplinary Studies | 2 | 0.2% |
| Science & Technology | 98 | 7.5% |
| Business | 189 | 14.4% |
| Education | 317 | 24.2% |
| Literature & Languages | 64 | 4.9% |
| Liberal Arts & History | 49 | 3.7% |
| Visual & Performing Arts | 75 | 5.7% |
| Communications | 11 | 0.8% |
| Arts & Humanities | 147 | 11.2% |
| Total | 1,310 | 100.0% |
Transportation & Commute in Jackson County
Vehicle Availability by Sex in Jackson County
The most prevalent vehicle ownership categories in Jackson County are males with 3 vehicles (792, accounting for 30.9%) and females with 3 vehicles (580, making up 37.0%).
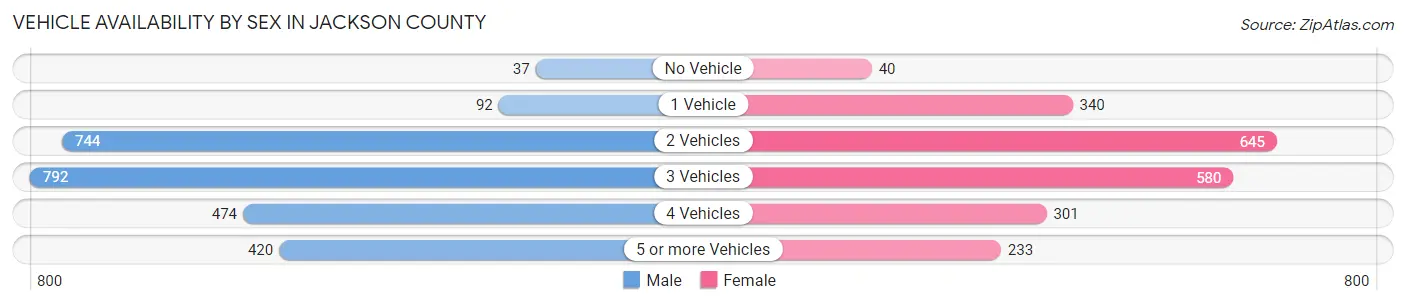
| Vehicles Available | Male | Female |
| No Vehicle | 37 (1.5%) | 40 (1.9%) |
| 1 Vehicle | 92 (3.6%) | 340 (15.9%) |
| 2 Vehicles | 744 (29.1%) | 645 (30.1%) |
| 3 Vehicles | 792 (30.9%) | 580 (27.1%) |
| 4 Vehicles | 474 (18.5%) | 301 (14.1%) |
| 5 or more Vehicles | 420 (16.4%) | 233 (10.9%) |
| Total | 2,559 (100.0%) | 2,139 (100.0%) |
Commute Time in Jackson County
The most frequently occuring commute durations in Jackson County are 30 to 34 minutes (848 commuters, 19.1%), 20 to 24 minutes (696 commuters, 15.6%), and 15 to 19 minutes (512 commuters, 11.5%).
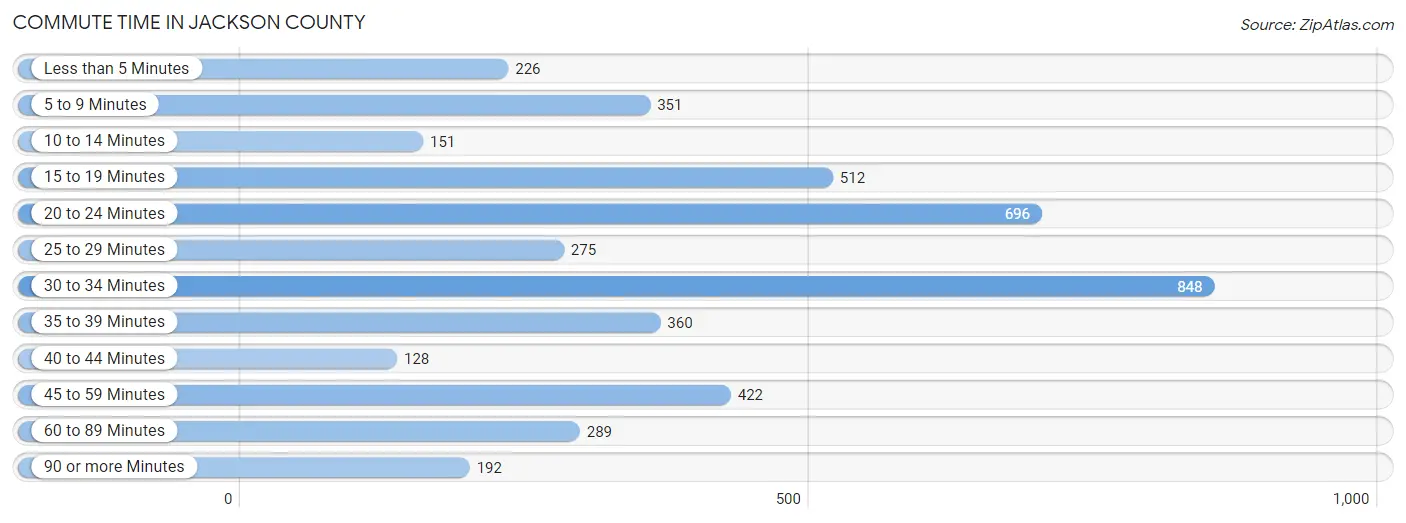
| Commute Time | # Commuters | % Commuters |
| Less than 5 Minutes | 226 | 5.1% |
| 5 to 9 Minutes | 351 | 7.9% |
| 10 to 14 Minutes | 151 | 3.4% |
| 15 to 19 Minutes | 512 | 11.5% |
| 20 to 24 Minutes | 696 | 15.6% |
| 25 to 29 Minutes | 275 | 6.2% |
| 30 to 34 Minutes | 848 | 19.1% |
| 35 to 39 Minutes | 360 | 8.1% |
| 40 to 44 Minutes | 128 | 2.9% |
| 45 to 59 Minutes | 422 | 9.5% |
| 60 to 89 Minutes | 289 | 6.5% |
| 90 or more Minutes | 192 | 4.3% |
Commute Time by Sex in Jackson County
The most common commute times in Jackson County are 30 to 34 minutes (509 commuters, 21.1%) for males and 20 to 24 minutes (393 commuters, 19.3%) for females.
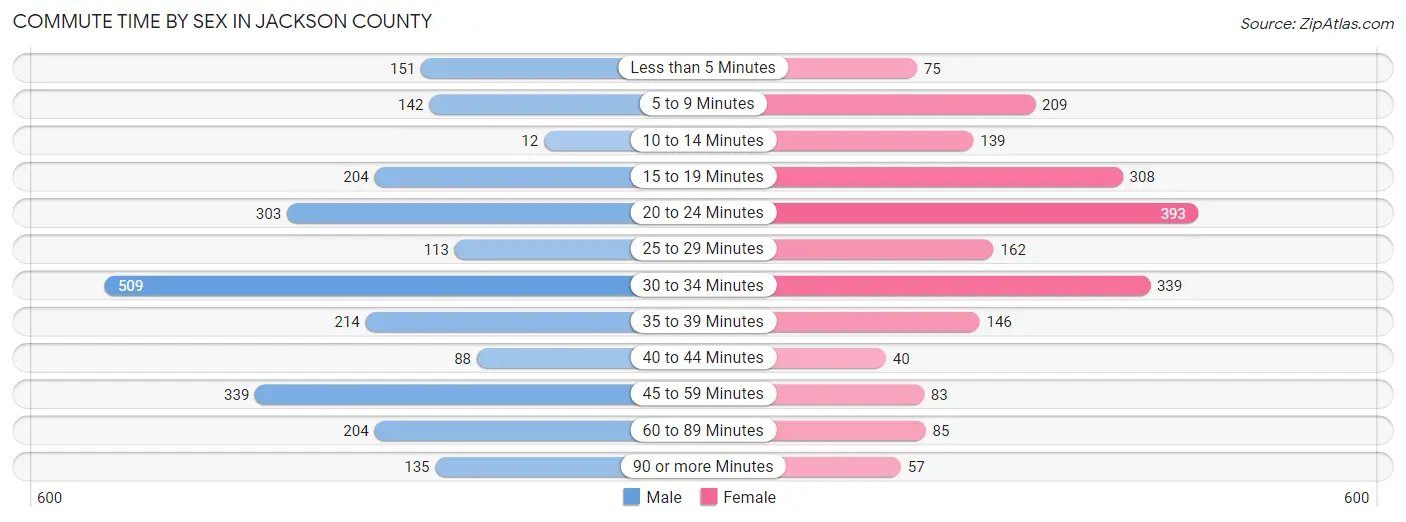
| Commute Time | Male | Female |
| Less than 5 Minutes | 151 (6.3%) | 75 (3.7%) |
| 5 to 9 Minutes | 142 (5.9%) | 209 (10.3%) |
| 10 to 14 Minutes | 12 (0.5%) | 139 (6.8%) |
| 15 to 19 Minutes | 204 (8.5%) | 308 (15.1%) |
| 20 to 24 Minutes | 303 (12.6%) | 393 (19.3%) |
| 25 to 29 Minutes | 113 (4.7%) | 162 (8.0%) |
| 30 to 34 Minutes | 509 (21.1%) | 339 (16.7%) |
| 35 to 39 Minutes | 214 (8.9%) | 146 (7.2%) |
| 40 to 44 Minutes | 88 (3.6%) | 40 (2.0%) |
| 45 to 59 Minutes | 339 (14.0%) | 83 (4.1%) |
| 60 to 89 Minutes | 204 (8.5%) | 85 (4.2%) |
| 90 or more Minutes | 135 (5.6%) | 57 (2.8%) |
Time of Departure to Work by Sex in Jackson County
The most frequent times of departure to work in Jackson County are 7:00 AM to 7:29 AM (379, 15.7%) for males and 7:30 AM to 7:59 AM (296, 14.5%) for females.
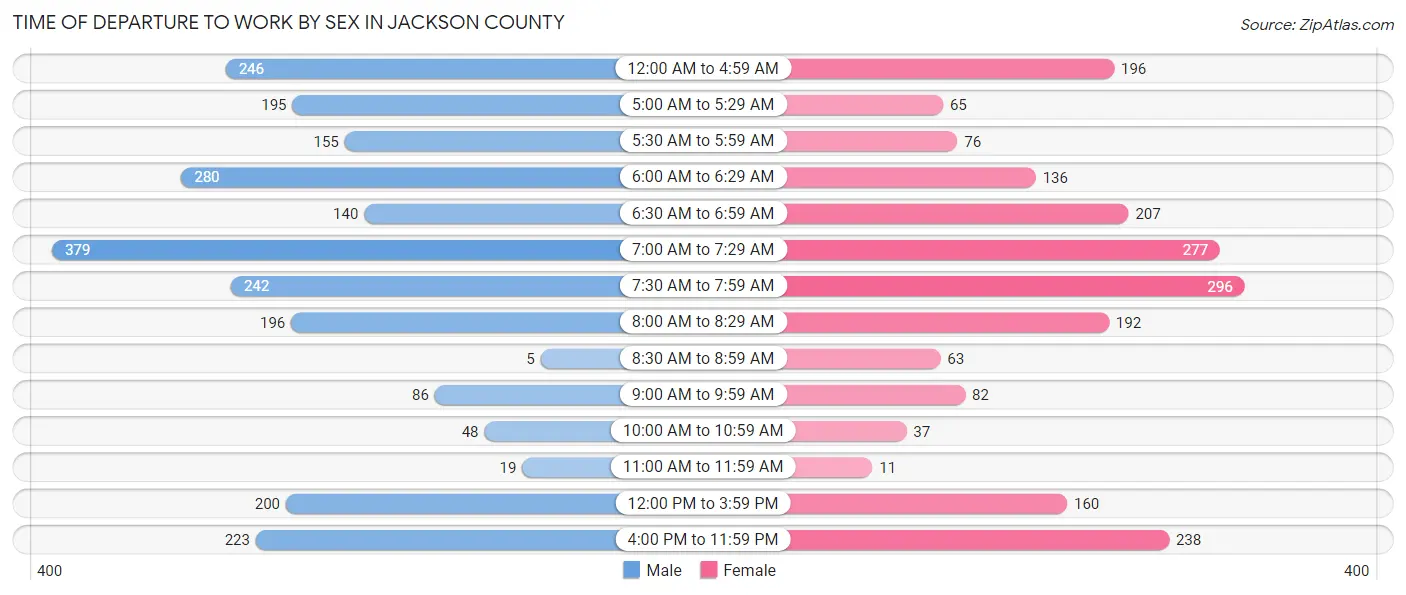
| Time of Departure | Male | Female |
| 12:00 AM to 4:59 AM | 246 (10.2%) | 196 (9.6%) |
| 5:00 AM to 5:29 AM | 195 (8.1%) | 65 (3.2%) |
| 5:30 AM to 5:59 AM | 155 (6.4%) | 76 (3.7%) |
| 6:00 AM to 6:29 AM | 280 (11.6%) | 136 (6.7%) |
| 6:30 AM to 6:59 AM | 140 (5.8%) | 207 (10.2%) |
| 7:00 AM to 7:29 AM | 379 (15.7%) | 277 (13.6%) |
| 7:30 AM to 7:59 AM | 242 (10.0%) | 296 (14.5%) |
| 8:00 AM to 8:29 AM | 196 (8.1%) | 192 (9.4%) |
| 8:30 AM to 8:59 AM | 5 (0.2%) | 63 (3.1%) |
| 9:00 AM to 9:59 AM | 86 (3.6%) | 82 (4.0%) |
| 10:00 AM to 10:59 AM | 48 (2.0%) | 37 (1.8%) |
| 11:00 AM to 11:59 AM | 19 (0.8%) | 11 (0.5%) |
| 12:00 PM to 3:59 PM | 200 (8.3%) | 160 (7.9%) |
| 4:00 PM to 11:59 PM | 223 (9.2%) | 238 (11.7%) |
| Total | 2,414 (100.0%) | 2,036 (100.0%) |
Housing Occupancy in Jackson County
Occupancy by Ownership in Jackson County
Of the total 4,569 dwellings in Jackson County, owner-occupied units account for 3,792 (83.0%), while renter-occupied units make up 777 (17.0%).
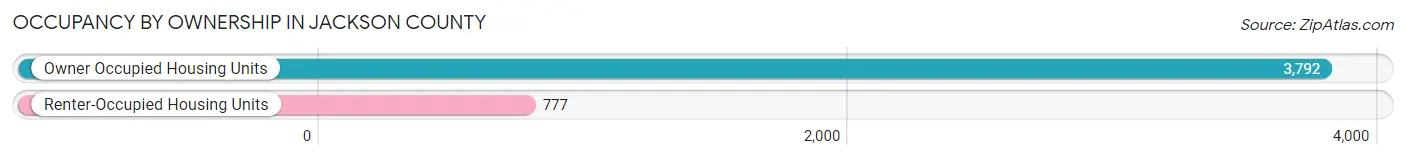
| Occupancy | # Housing Units | % Housing Units |
| Owner Occupied Housing Units | 3,792 | 83.0% |
| Renter-Occupied Housing Units | 777 | 17.0% |
| Total Occupied Housing Units | 4,569 | 100.0% |
Occupancy by Household Size in Jackson County
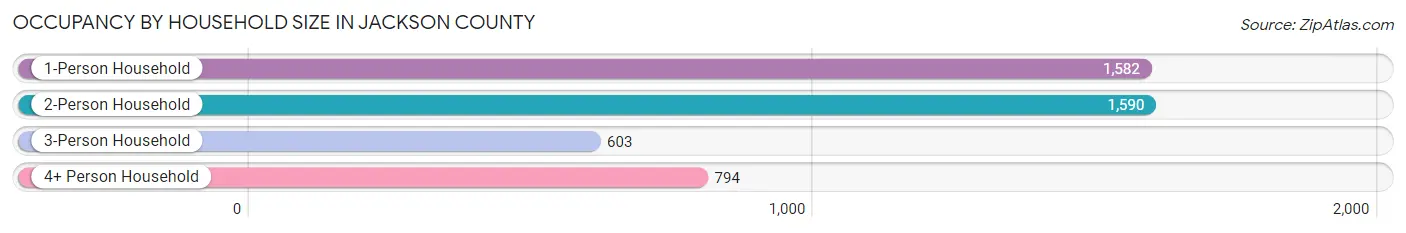
| Household Size | # Housing Units | % Housing Units |
| 1-Person Household | 1,582 | 34.6% |
| 2-Person Household | 1,590 | 34.8% |
| 3-Person Household | 603 | 13.2% |
| 4+ Person Household | 794 | 17.4% |
| Total Housing Units | 4,569 | 100.0% |
Occupancy by Ownership by Household Size in Jackson County
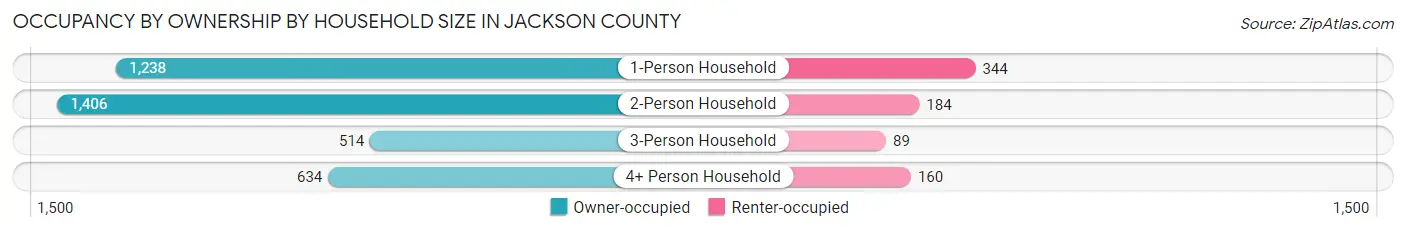
| Household Size | Owner-occupied | Renter-occupied |
| 1-Person Household | 1,238 (78.3%) | 344 (21.7%) |
| 2-Person Household | 1,406 (88.4%) | 184 (11.6%) |
| 3-Person Household | 514 (85.2%) | 89 (14.8%) |
| 4+ Person Household | 634 (79.8%) | 160 (20.2%) |
| Total Housing Units | 3,792 (83.0%) | 777 (17.0%) |
Occupancy by Educational Attainment in Jackson County

| Household Size | Owner-occupied | Renter-occupied |
| Less than High School | 732 (86.2%) | 117 (13.8%) |
| High School Diploma | 1,737 (84.7%) | 314 (15.3%) |
| College/Associate Degree | 717 (70.8%) | 296 (29.2%) |
| Bachelor's Degree or higher | 606 (92.4%) | 50 (7.6%) |
Occupancy by Age of Householder in Jackson County
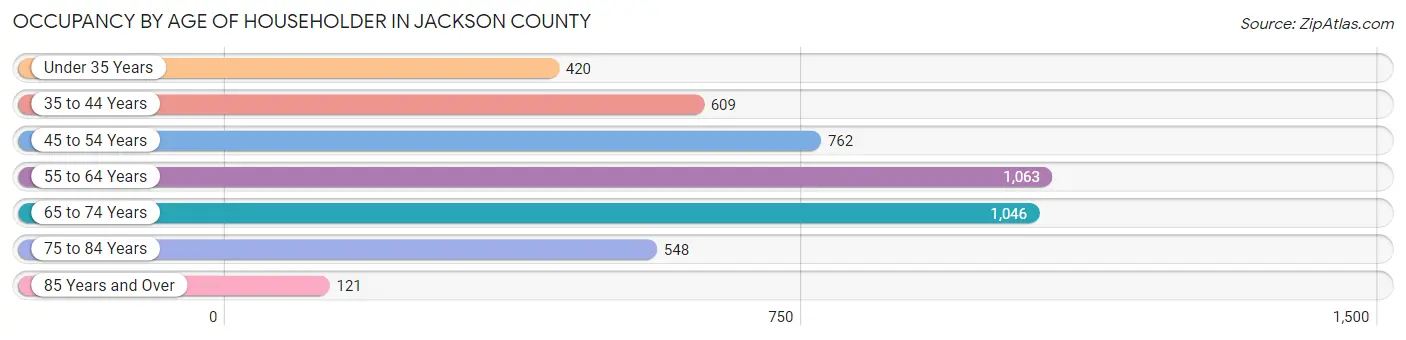
| Age Bracket | # Households | % Households |
| Under 35 Years | 420 | 9.2% |
| 35 to 44 Years | 609 | 13.3% |
| 45 to 54 Years | 762 | 16.7% |
| 55 to 64 Years | 1,063 | 23.3% |
| 65 to 74 Years | 1,046 | 22.9% |
| 75 to 84 Years | 548 | 12.0% |
| 85 Years and Over | 121 | 2.6% |
| Total | 4,569 | 100.0% |
Housing Finances in Jackson County
Median Income by Occupancy in Jackson County
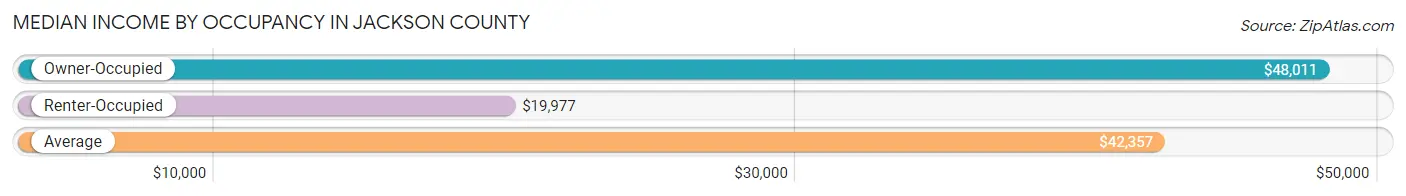
| Occupancy Type | # Households | Median Income |
| Owner-Occupied | 3,792 (83.0%) | $48,011 |
| Renter-Occupied | 777 (17.0%) | $19,977 |
| Average | 4,569 (100.0%) | $42,357 |
Occupancy by Householder Income Bracket in Jackson County
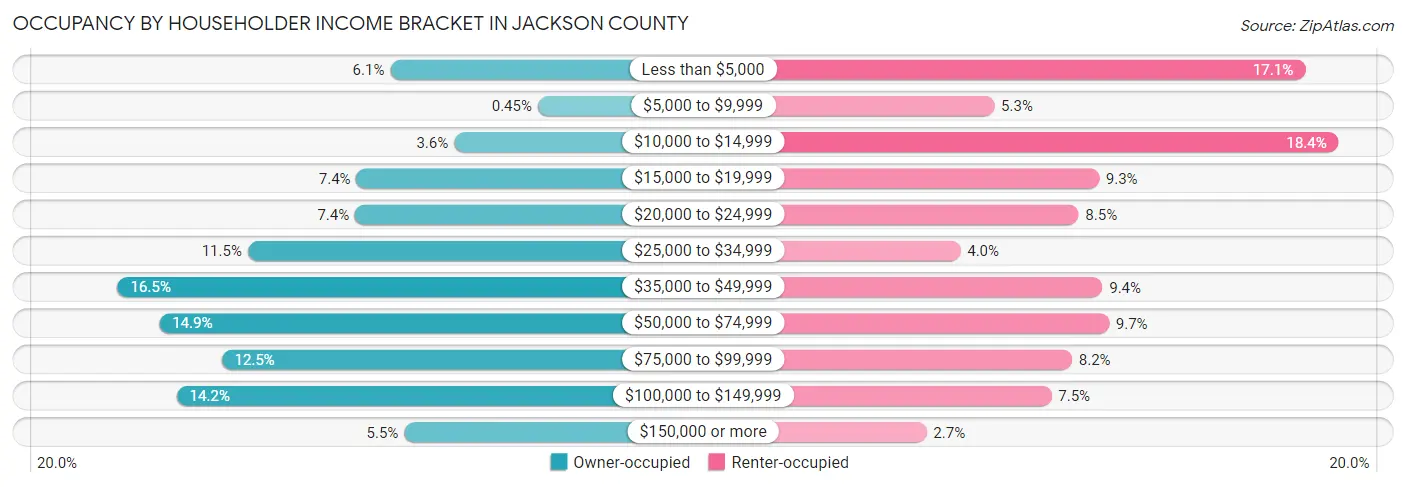
| Income Bracket | Owner-occupied | Renter-occupied |
| Less than $5,000 | 230 (6.1%) | 133 (17.1%) |
| $5,000 to $9,999 | 17 (0.4%) | 41 (5.3%) |
| $10,000 to $14,999 | 138 (3.6%) | 143 (18.4%) |
| $15,000 to $19,999 | 279 (7.4%) | 72 (9.3%) |
| $20,000 to $24,999 | 281 (7.4%) | 66 (8.5%) |
| $25,000 to $34,999 | 436 (11.5%) | 31 (4.0%) |
| $35,000 to $49,999 | 624 (16.5%) | 73 (9.4%) |
| $50,000 to $74,999 | 564 (14.9%) | 75 (9.7%) |
| $75,000 to $99,999 | 474 (12.5%) | 64 (8.2%) |
| $100,000 to $149,999 | 539 (14.2%) | 58 (7.5%) |
| $150,000 or more | 210 (5.5%) | 21 (2.7%) |
| Total | 3,792 (100.0%) | 777 (100.0%) |
Monthly Housing Cost Tiers in Jackson County
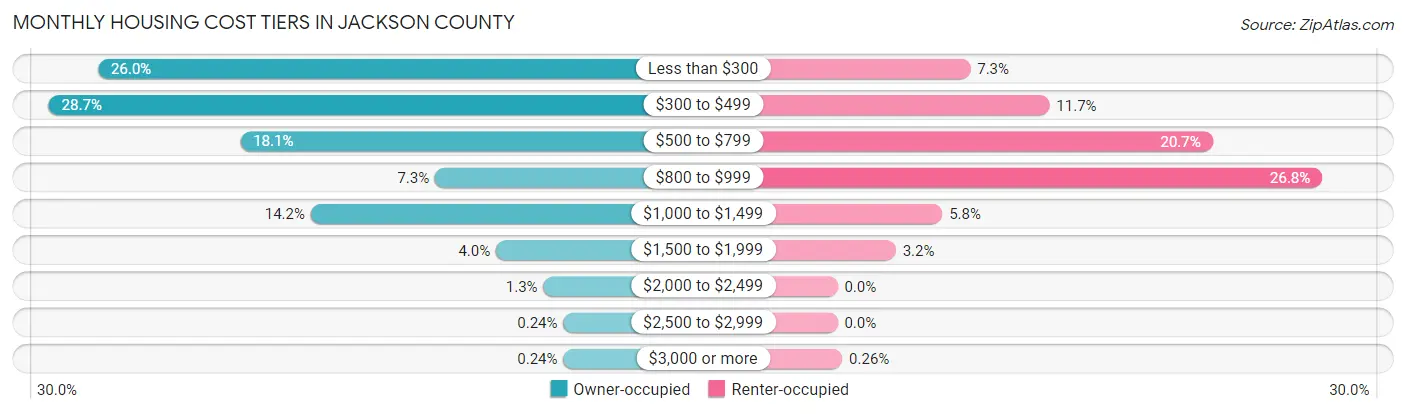
| Monthly Cost | Owner-occupied | Renter-occupied |
| Less than $300 | 984 (26.0%) | 57 (7.3%) |
| $300 to $499 | 1,087 (28.7%) | 91 (11.7%) |
| $500 to $799 | 686 (18.1%) | 161 (20.7%) |
| $800 to $999 | 278 (7.3%) | 208 (26.8%) |
| $1,000 to $1,499 | 538 (14.2%) | 45 (5.8%) |
| $1,500 to $1,999 | 150 (4.0%) | 25 (3.2%) |
| $2,000 to $2,499 | 51 (1.3%) | 0 (0.0%) |
| $2,500 to $2,999 | 9 (0.2%) | 0 (0.0%) |
| $3,000 or more | 9 (0.2%) | 2 (0.3%) |
| Total | 3,792 (100.0%) | 777 (100.0%) |
Physical Housing Characteristics in Jackson County
Housing Structures in Jackson County
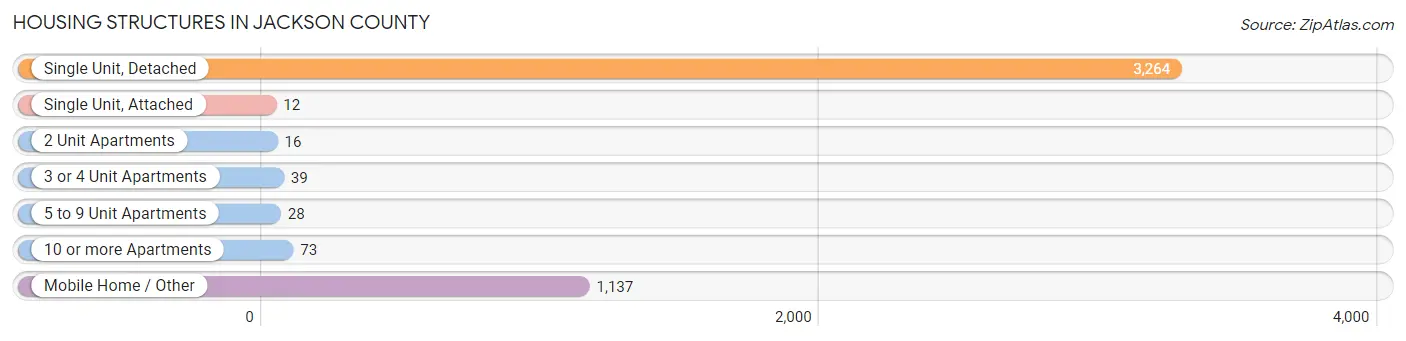
| Structure Type | # Housing Units | % Housing Units |
| Single Unit, Detached | 3,264 | 71.4% |
| Single Unit, Attached | 12 | 0.3% |
| 2 Unit Apartments | 16 | 0.4% |
| 3 or 4 Unit Apartments | 39 | 0.9% |
| 5 to 9 Unit Apartments | 28 | 0.6% |
| 10 or more Apartments | 73 | 1.6% |
| Mobile Home / Other | 1,137 | 24.9% |
| Total | 4,569 | 100.0% |
Housing Structures by Occupancy in Jackson County
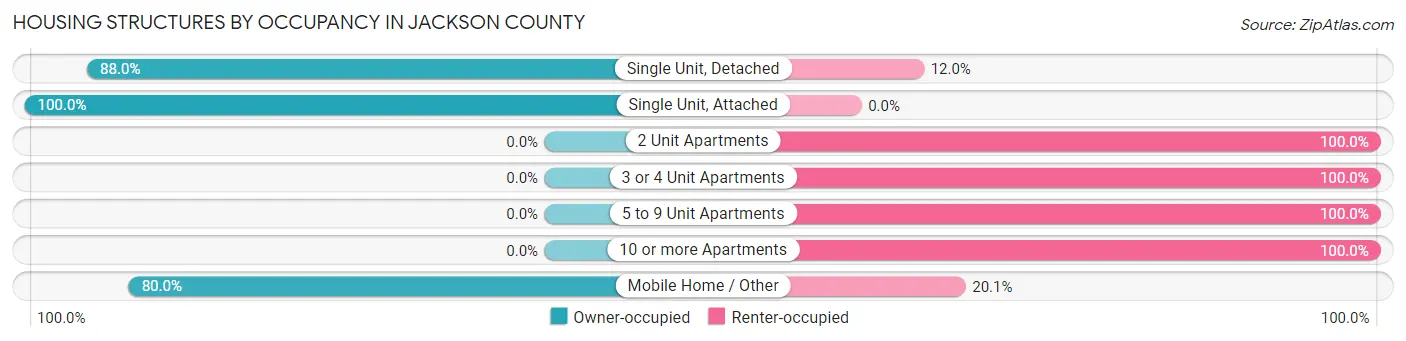
| Structure Type | Owner-occupied | Renter-occupied |
| Single Unit, Detached | 2,871 (88.0%) | 393 (12.0%) |
| Single Unit, Attached | 12 (100.0%) | 0 (0.0%) |
| 2 Unit Apartments | 0 (0.0%) | 16 (100.0%) |
| 3 or 4 Unit Apartments | 0 (0.0%) | 39 (100.0%) |
| 5 to 9 Unit Apartments | 0 (0.0%) | 28 (100.0%) |
| 10 or more Apartments | 0 (0.0%) | 73 (100.0%) |
| Mobile Home / Other | 909 (79.9%) | 228 (20.1%) |
| Total | 3,792 (83.0%) | 777 (17.0%) |
Housing Structures by Number of Rooms in Jackson County
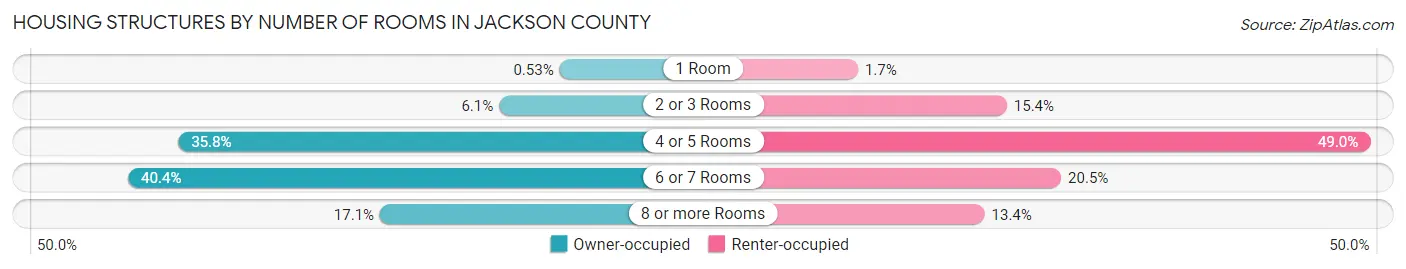
| Number of Rooms | Owner-occupied | Renter-occupied |
| 1 Room | 20 (0.5%) | 13 (1.7%) |
| 2 or 3 Rooms | 232 (6.1%) | 120 (15.4%) |
| 4 or 5 Rooms | 1,357 (35.8%) | 381 (49.0%) |
| 6 or 7 Rooms | 1,533 (40.4%) | 159 (20.5%) |
| 8 or more Rooms | 650 (17.1%) | 104 (13.4%) |
| Total | 3,792 (100.0%) | 777 (100.0%) |
Housing Structure by Heating Type in Jackson County
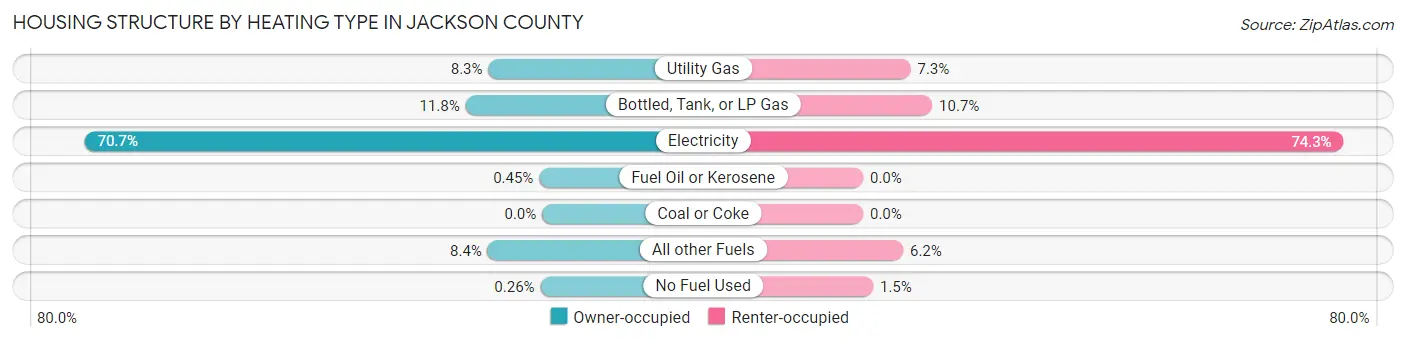
| Heating Type | Owner-occupied | Renter-occupied |
| Utility Gas | 315 (8.3%) | 57 (7.3%) |
| Bottled, Tank, or LP Gas | 449 (11.8%) | 83 (10.7%) |
| Electricity | 2,682 (70.7%) | 577 (74.3%) |
| Fuel Oil or Kerosene | 17 (0.4%) | 0 (0.0%) |
| Coal or Coke | 0 (0.0%) | 0 (0.0%) |
| All other Fuels | 319 (8.4%) | 48 (6.2%) |
| No Fuel Used | 10 (0.3%) | 12 (1.5%) |
| Total | 3,792 (100.0%) | 777 (100.0%) |
Household Vehicle Usage in Jackson County
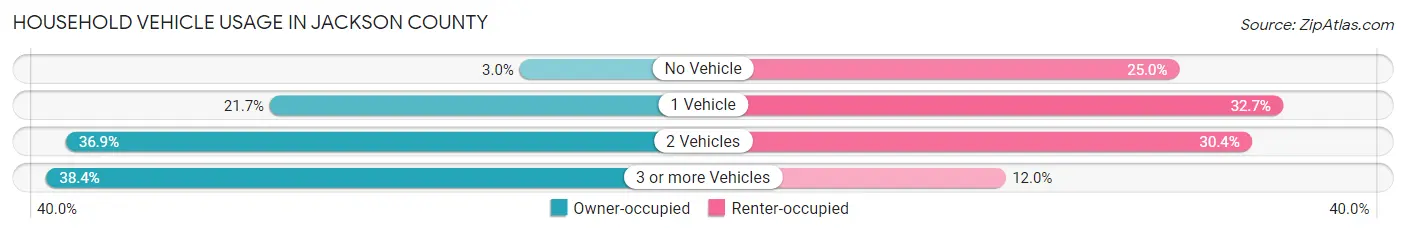
| Vehicles per Household | Owner-occupied | Renter-occupied |
| No Vehicle | 115 (3.0%) | 194 (25.0%) |
| 1 Vehicle | 822 (21.7%) | 254 (32.7%) |
| 2 Vehicles | 1,400 (36.9%) | 236 (30.4%) |
| 3 or more Vehicles | 1,455 (38.4%) | 93 (12.0%) |
| Total | 3,792 (100.0%) | 777 (100.0%) |
Real Estate & Mortgages in Jackson County
Real Estate and Mortgage Overview in Jackson County
| Characteristic | Without Mortgage | With Mortgage |
| Housing Units | 2,516 | 1,276 |
| Median Property Value | $109,000 | $161,000 |
| Median Household Income | $38,915 | $97 |
| Monthly Housing Costs | $353 | $9 |
| Real Estate Taxes | $610 | $31 |
Property Value by Mortgage Status in Jackson County
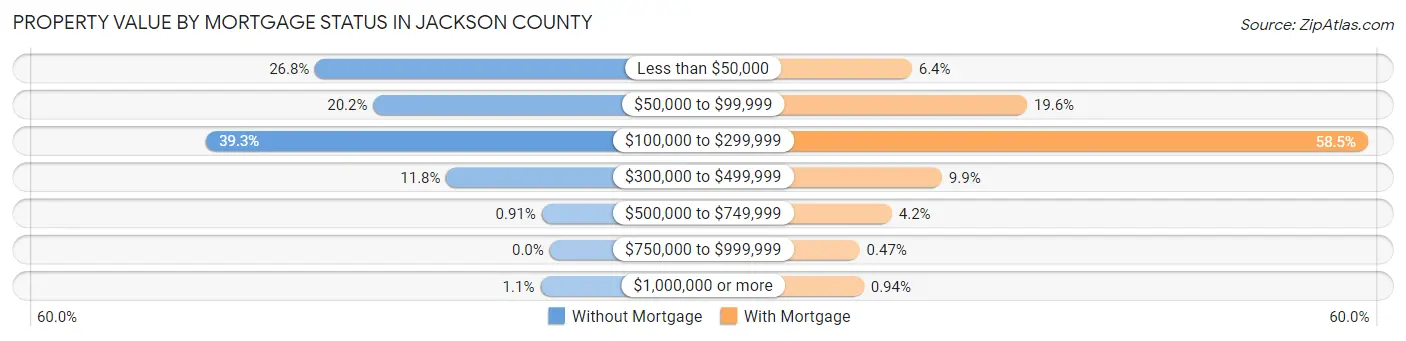
| Property Value | Without Mortgage | With Mortgage |
| Less than $50,000 | 674 (26.8%) | 82 (6.4%) |
| $50,000 to $99,999 | 507 (20.2%) | 250 (19.6%) |
| $100,000 to $299,999 | 988 (39.3%) | 747 (58.5%) |
| $300,000 to $499,999 | 297 (11.8%) | 126 (9.9%) |
| $500,000 to $749,999 | 23 (0.9%) | 53 (4.2%) |
| $750,000 to $999,999 | 0 (0.0%) | 6 (0.5%) |
| $1,000,000 or more | 27 (1.1%) | 12 (0.9%) |
| Total | 2,516 (100.0%) | 1,276 (100.0%) |
Household Income by Mortgage Status in Jackson County
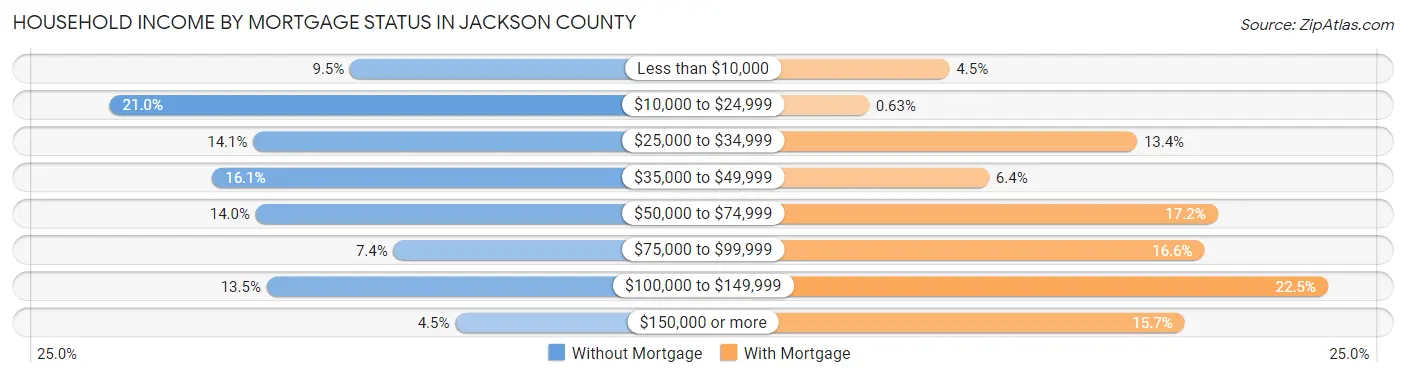
| Household Income | Without Mortgage | With Mortgage |
| Less than $10,000 | 239 (9.5%) | 57 (4.5%) |
| $10,000 to $24,999 | 527 (20.9%) | 8 (0.6%) |
| $25,000 to $34,999 | 355 (14.1%) | 171 (13.4%) |
| $35,000 to $49,999 | 404 (16.1%) | 81 (6.4%) |
| $50,000 to $74,999 | 352 (14.0%) | 220 (17.2%) |
| $75,000 to $99,999 | 187 (7.4%) | 212 (16.6%) |
| $100,000 to $149,999 | 339 (13.5%) | 287 (22.5%) |
| $150,000 or more | 113 (4.5%) | 200 (15.7%) |
| Total | 2,516 (100.0%) | 1,276 (100.0%) |
Property Value to Household Income Ratio in Jackson County
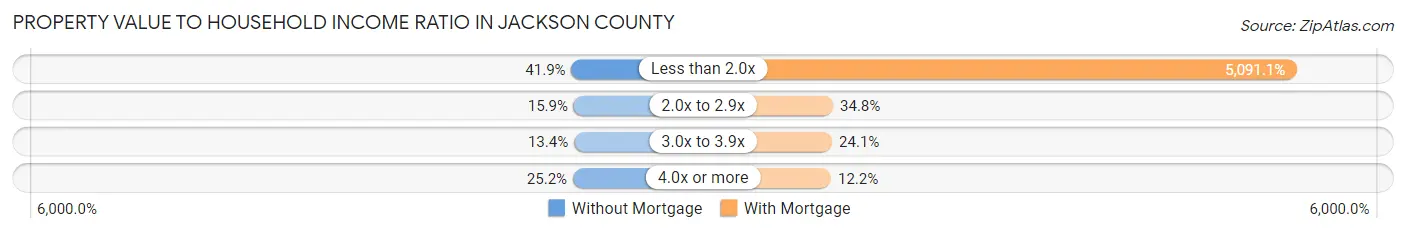
| Value-to-Income Ratio | Without Mortgage | With Mortgage |
| Less than 2.0x | 1,054 (41.9%) | 64,962 (5,091.1%) |
| 2.0x to 2.9x | 400 (15.9%) | 444 (34.8%) |
| 3.0x to 3.9x | 336 (13.4%) | 308 (24.1%) |
| 4.0x or more | 634 (25.2%) | 155 (12.1%) |
| Total | 2,516 (100.0%) | 1,276 (100.0%) |
Real Estate Taxes by Mortgage Status in Jackson County
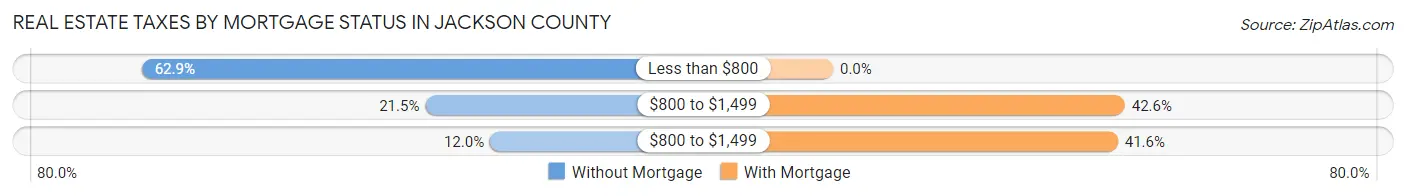
| Property Taxes | Without Mortgage | With Mortgage |
| Less than $800 | 1,582 (62.9%) | 0 (0.0%) |
| $800 to $1,499 | 540 (21.5%) | 544 (42.6%) |
| $800 to $1,499 | 302 (12.0%) | 531 (41.6%) |
| Total | 2,516 (100.0%) | 1,276 (100.0%) |
Health & Disability in Jackson County
Health Insurance Coverage by Age in Jackson County
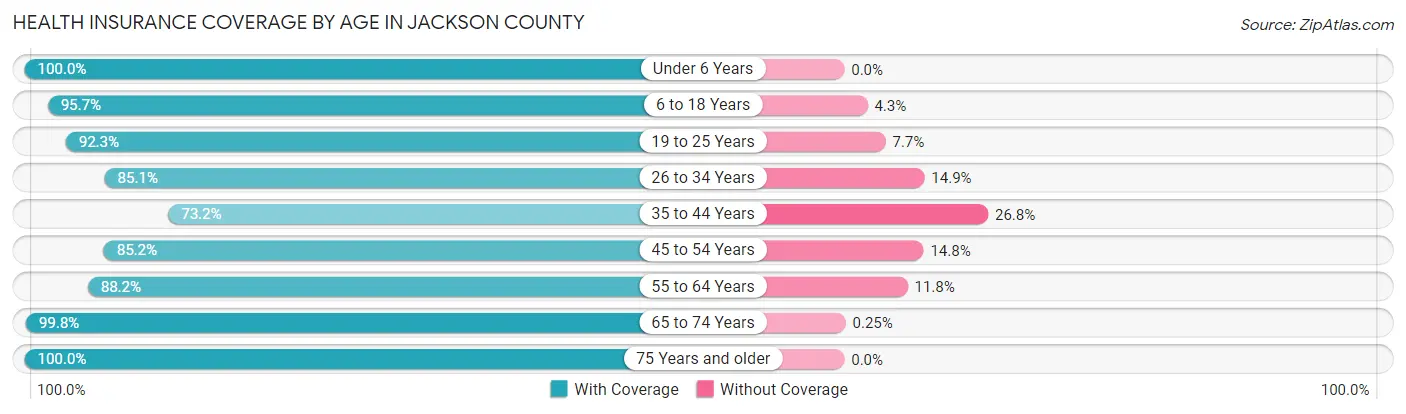
| Age Bracket | With Coverage | Without Coverage |
| Under 6 Years | 585 (100.0%) | 0 (0.0%) |
| 6 to 18 Years | 1,530 (95.7%) | 69 (4.3%) |
| 19 to 25 Years | 732 (92.3%) | 61 (7.7%) |
| 26 to 34 Years | 979 (85.1%) | 172 (14.9%) |
| 35 to 44 Years | 953 (73.2%) | 349 (26.8%) |
| 45 to 54 Years | 1,339 (85.2%) | 232 (14.8%) |
| 55 to 64 Years | 1,743 (88.2%) | 233 (11.8%) |
| 65 to 74 Years | 1,615 (99.8%) | 4 (0.3%) |
| 75 Years and older | 956 (100.0%) | 0 (0.0%) |
| Total | 10,432 (90.3%) | 1,120 (9.7%) |
Health Insurance Coverage by Citizenship Status in Jackson County
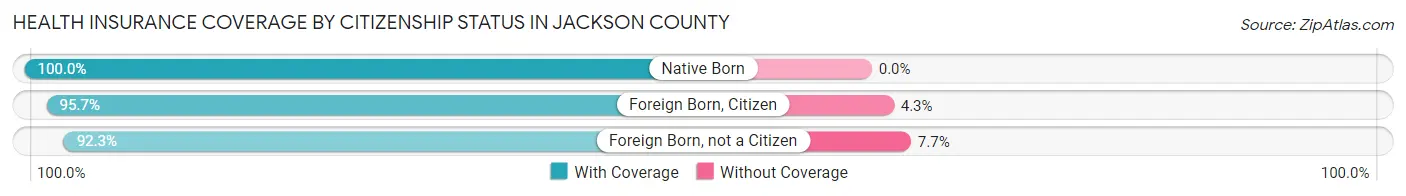
| Citizenship Status | With Coverage | Without Coverage |
| Native Born | 585 (100.0%) | 0 (0.0%) |
| Foreign Born, Citizen | 1,530 (95.7%) | 69 (4.3%) |
| Foreign Born, not a Citizen | 732 (92.3%) | 61 (7.7%) |
Health Insurance Coverage by Household Income in Jackson County
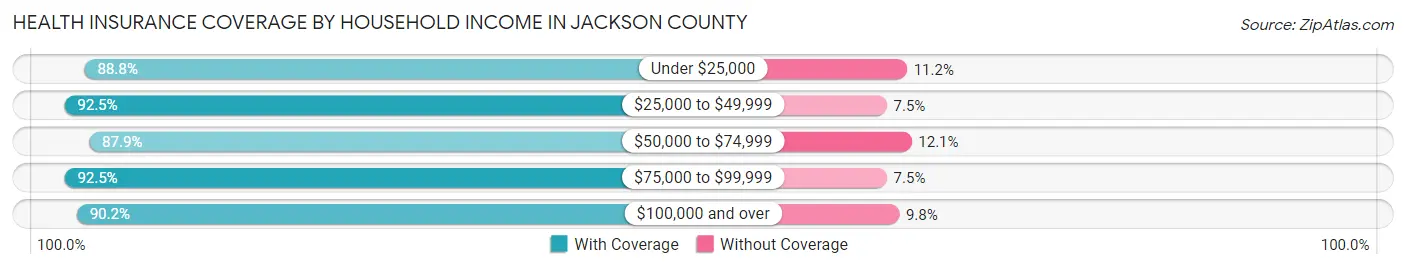
| Household Income | With Coverage | Without Coverage |
| Under $25,000 | 2,158 (88.8%) | 273 (11.2%) |
| $25,000 to $49,999 | 2,271 (92.5%) | 183 (7.5%) |
| $50,000 to $74,999 | 1,663 (87.9%) | 229 (12.1%) |
| $75,000 to $99,999 | 1,572 (92.5%) | 127 (7.5%) |
| $100,000 and over | 2,760 (90.2%) | 299 (9.8%) |
Public vs Private Health Insurance Coverage by Age in Jackson County
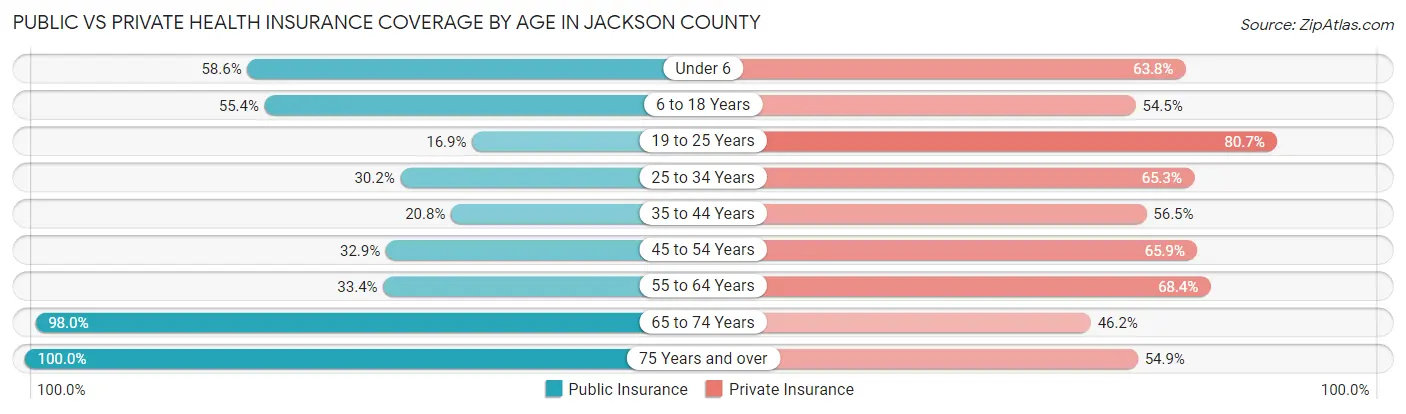
| Age Bracket | Public Insurance | Private Insurance |
| Under 6 | 343 (58.6%) | 373 (63.8%) |
| 6 to 18 Years | 886 (55.4%) | 872 (54.5%) |
| 19 to 25 Years | 134 (16.9%) | 640 (80.7%) |
| 25 to 34 Years | 348 (30.2%) | 752 (65.3%) |
| 35 to 44 Years | 271 (20.8%) | 736 (56.5%) |
| 45 to 54 Years | 517 (32.9%) | 1,035 (65.9%) |
| 55 to 64 Years | 660 (33.4%) | 1,351 (68.4%) |
| 65 to 74 Years | 1,587 (98.0%) | 748 (46.2%) |
| 75 Years and over | 956 (100.0%) | 525 (54.9%) |
| Total | 5,702 (49.4%) | 7,032 (60.9%) |
Disability Status by Sex by Age in Jackson County
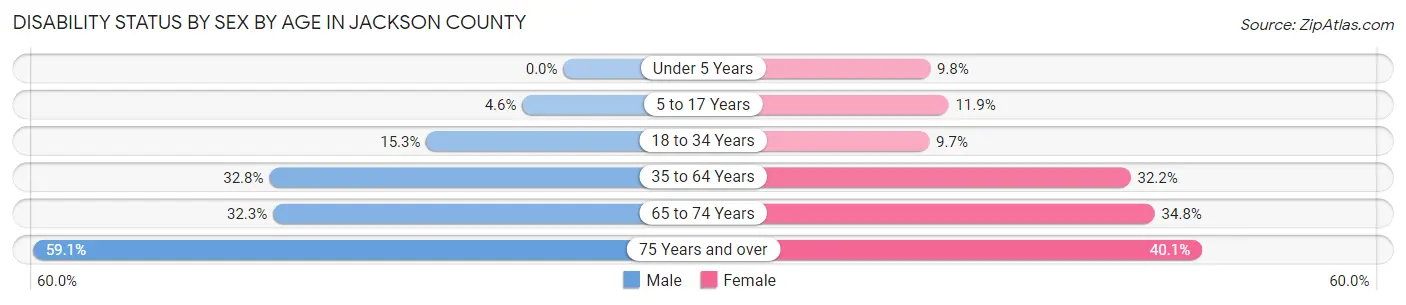
| Age Bracket | Male | Female |
| Under 5 Years | 0 (0.0%) | 27 (9.8%) |
| 5 to 17 Years | 36 (4.6%) | 91 (11.9%) |
| 18 to 34 Years | 164 (15.3%) | 94 (9.7%) |
| 35 to 64 Years | 805 (32.8%) | 769 (32.2%) |
| 65 to 74 Years | 258 (32.3%) | 286 (34.8%) |
| 75 Years and over | 260 (59.1%) | 207 (40.1%) |
Disability Class by Sex by Age in Jackson County
Disability Class: Hearing Difficulty
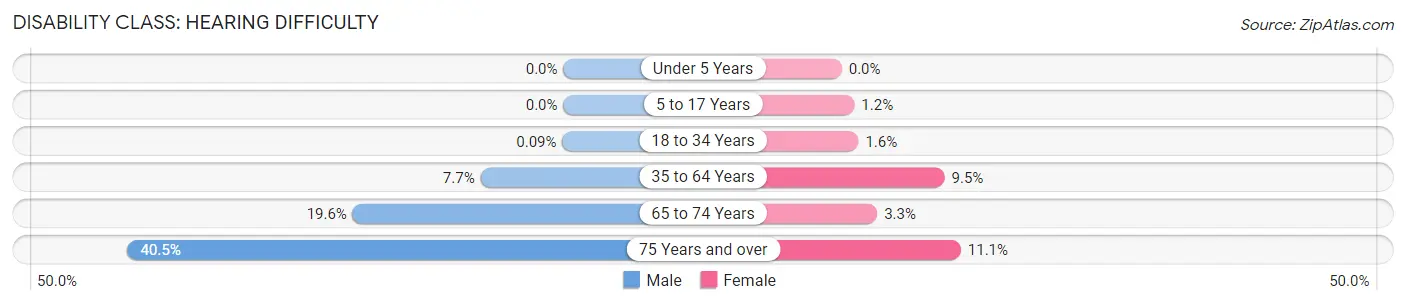
| Age Bracket | Male | Female |
| Under 5 Years | 0 (0.0%) | 0 (0.0%) |
| 5 to 17 Years | 0 (0.0%) | 9 (1.2%) |
| 18 to 34 Years | 1 (0.1%) | 15 (1.5%) |
| 35 to 64 Years | 189 (7.7%) | 228 (9.5%) |
| 65 to 74 Years | 156 (19.6%) | 27 (3.3%) |
| 75 Years and over | 178 (40.5%) | 57 (11.1%) |
Disability Class: Vision Difficulty
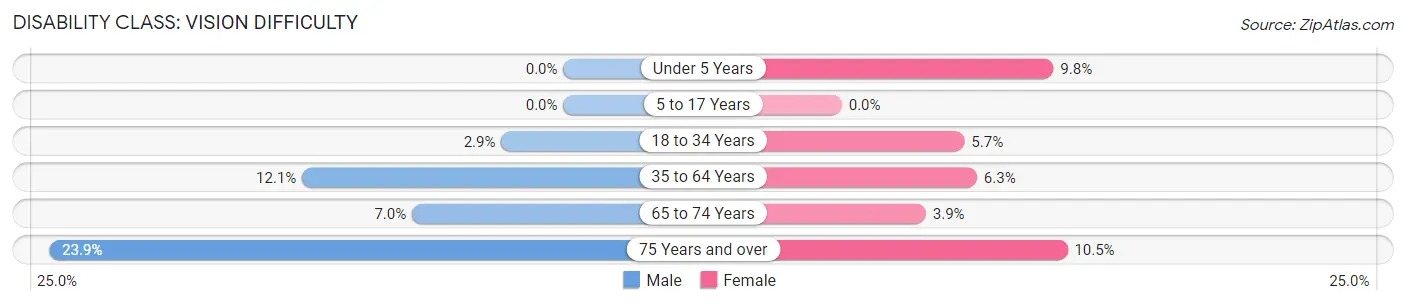
| Age Bracket | Male | Female |
| Under 5 Years | 0 (0.0%) | 27 (9.8%) |
| 5 to 17 Years | 0 (0.0%) | 0 (0.0%) |
| 18 to 34 Years | 31 (2.9%) | 55 (5.7%) |
| 35 to 64 Years | 298 (12.1%) | 150 (6.3%) |
| 65 to 74 Years | 56 (7.0%) | 32 (3.9%) |
| 75 Years and over | 105 (23.9%) | 54 (10.5%) |
Disability Class: Cognitive Difficulty
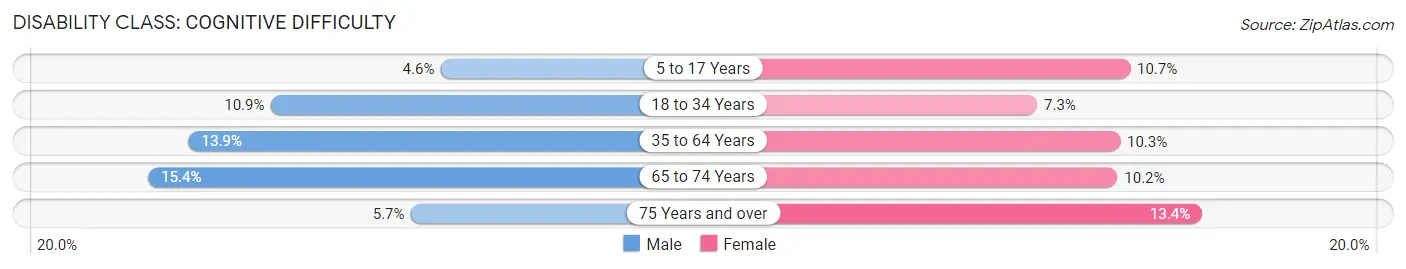
| Age Bracket | Male | Female |
| 5 to 17 Years | 36 (4.6%) | 82 (10.7%) |
| 18 to 34 Years | 117 (10.9%) | 70 (7.2%) |
| 35 to 64 Years | 342 (13.9%) | 247 (10.3%) |
| 65 to 74 Years | 123 (15.4%) | 84 (10.2%) |
| 75 Years and over | 25 (5.7%) | 69 (13.4%) |
Disability Class: Ambulatory Difficulty
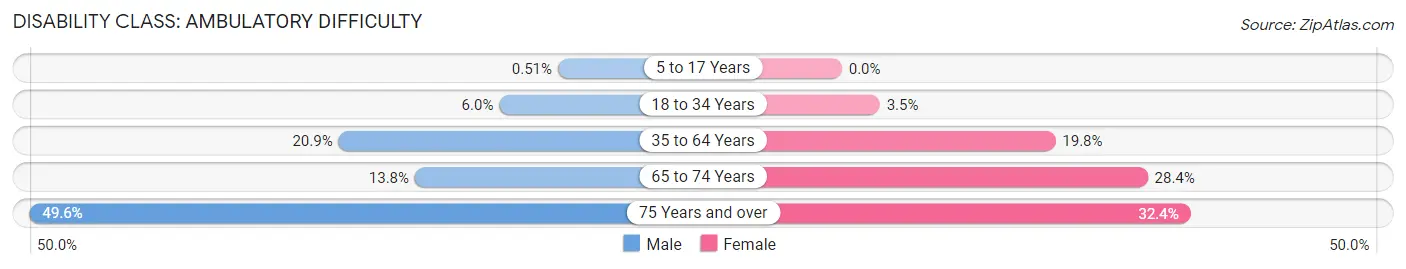
| Age Bracket | Male | Female |
| 5 to 17 Years | 4 (0.5%) | 0 (0.0%) |
| 18 to 34 Years | 64 (5.9%) | 34 (3.5%) |
| 35 to 64 Years | 513 (20.9%) | 474 (19.8%) |
| 65 to 74 Years | 110 (13.8%) | 233 (28.4%) |
| 75 Years and over | 218 (49.5%) | 167 (32.4%) |
Disability Class: Self-Care Difficulty
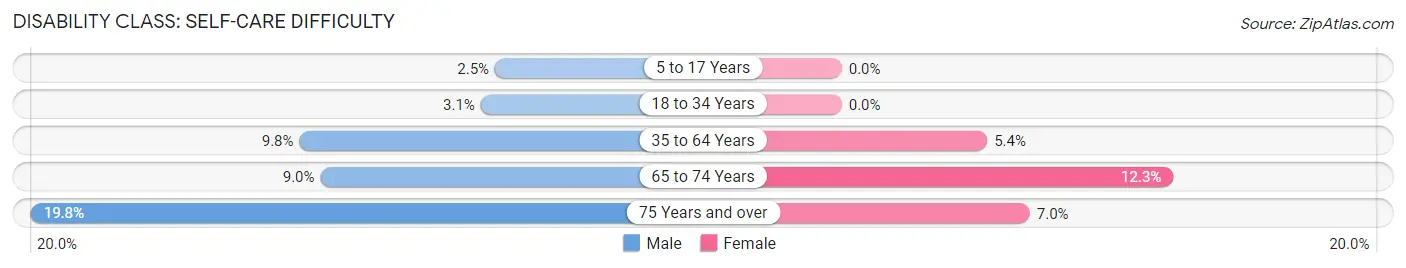
| Age Bracket | Male | Female |
| 5 to 17 Years | 20 (2.5%) | 0 (0.0%) |
| 18 to 34 Years | 33 (3.1%) | 0 (0.0%) |
| 35 to 64 Years | 241 (9.8%) | 129 (5.4%) |
| 65 to 74 Years | 72 (9.0%) | 101 (12.3%) |
| 75 Years and over | 87 (19.8%) | 36 (7.0%) |
Technology Access in Jackson County
Computing Device Access in Jackson County
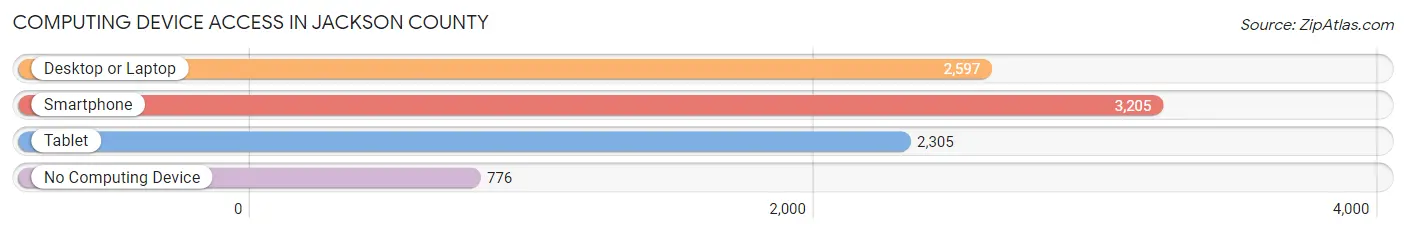
| Device Type | # Households | % Households |
| Desktop or Laptop | 2,597 | 56.8% |
| Smartphone | 3,205 | 70.2% |
| Tablet | 2,305 | 50.4% |
| No Computing Device | 776 | 17.0% |
| Total | 4,569 | 100.0% |
Internet Access in Jackson County
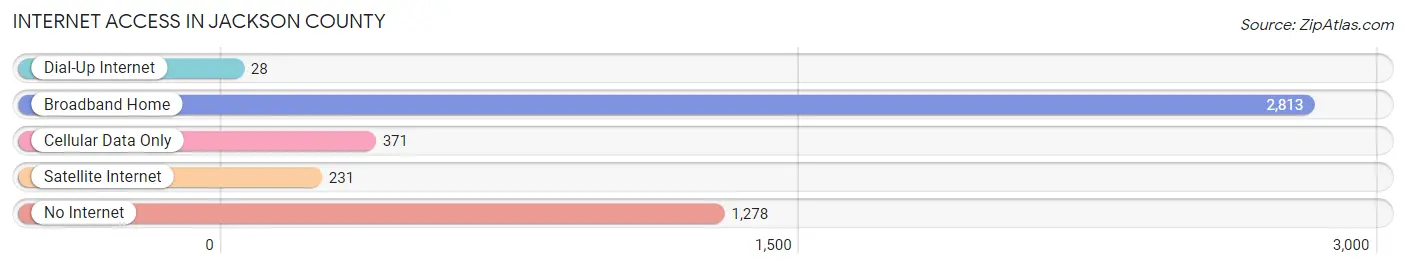
| Internet Type | # Households | % Households |
| Dial-Up Internet | 28 | 0.6% |
| Broadband Home | 2,813 | 61.6% |
| Cellular Data Only | 371 | 8.1% |
| Satellite Internet | 231 | 5.1% |
| No Internet | 1,278 | 28.0% |
| Total | 4,569 | 100.0% |
Jackson County Summary
Jackson County is located in the northeastern corner of Tennessee, and is part of the Appalachian region. It is bordered by Kentucky to the north, Virginia to the east, and North Carolina to the south. The county seat is Gainesboro, and the largest city is Cookeville. The county was established in 1801 and named for Andrew Jackson, who later became the seventh President of the United States.
Geography
Jackson County is located in the Cumberland Plateau region of Tennessee. The county is mostly mountainous, with elevations ranging from 1,000 to 2,000 feet above sea level. The highest point in the county is the summit of Big Mountain, which has an elevation of 2,039 feet. The county is drained by the Caney Fork River, which flows through the center of the county. Other major waterways include the Roaring River, the Collins River, and the Calfkiller River.
The county is mostly forested, with the majority of the land being covered in hardwood and pine trees. There are also several small lakes and ponds scattered throughout the county.
Demographics
As of the 2010 census, Jackson County had a population of 116,638. The population was spread out with 24.3% under the age of 18, 8.7% from 18 to 24, 28.2% from 25 to 44, 24.2% from 45 to 64, and 14.6% who were 65 years of age or older. The median age was 37.4 years.
The racial makeup of the county was 92.2% White, 4.2% African American, 0.3% Native American, 1.2% Asian, 0.1% Pacific Islander, 0.7% from other races, and 1.3% from two or more races. Hispanic or Latino of any race were 2.2% of the population.
Economy
Jackson County has a diverse economy, with a mix of manufacturing, agriculture, and tourism. The county is home to several large manufacturing companies, including Whirlpool, Bridgestone, and General Motors. Agriculture is also an important part of the economy, with the county producing a variety of crops, including corn, soybeans, wheat, and hay.
Tourism is also an important part of the economy, with the county being home to several state parks, including Cummins Falls State Park, Burgess Falls State Park, and Rock Island State Park. The county also has several wineries and distilleries, as well as a variety of outdoor activities, such as hiking, fishing, and camping.
Conclusion
Jackson County is a rural county located in the northeastern corner of Tennessee. It is mostly mountainous, with elevations ranging from 1,000 to 2,000 feet above sea level. The county has a diverse economy, with a mix of manufacturing, agriculture, and tourism. The population of the county is 116,638, and is mostly White, with a small percentage of African American, Native American, Asian, and Pacific Islander residents. Jackson County is home to several state parks, wineries, and distilleries, as well as a variety of outdoor activities.
Common Questions
What is the Total Population of Jackson County?
Total Population of Jackson County is 11,730.
What is the Total Male Population of Jackson County?
Total Male Population of Jackson County is 5,944.
What is the Total Female Population of Jackson County?
Total Female Population of Jackson County is 5,786.
What is the Ratio of Males per 100 Females in Jackson County?
There are 102.73 Males per 100 Females in Jackson County.
What is the Ratio of Females per 100 Males in Jackson County?
There are 97.34 Females per 100 Males in Jackson County.
What is the Median Population Age in Jackson County?
Median Population Age in Jackson County is 47.3 Years.
What is the Average Family Size in Jackson County
Average Family Size in Jackson County is 3.3 People.
What is the Average Household Size in Jackson County
Average Household Size in Jackson County is 2.5 People.
What is Per Capita Income in Jackson County?
Per Capita income in Jackson County is $25,534.
What is the Median Family Income in Jackson County?
Median Family Income in Jackson County is $64,938.
What is the Median Household income in Jackson County?
Median Household Income in Jackson County is $42,357.
What is Income or Wage Gap in Jackson County?
Income or Wage Gap in Jackson County is 36.5%.
Women in Jackson County earn 63.5 cents for every dollar earned by a man.
What is Family Income Deficit in Jackson County?
Family Income Deficit in Jackson County is $9,197.
Families that are below poverty line in Jackson County earn $9,197 less on average than the poverty threshold level.
What is Inequality or Gini Index in Jackson County?
Inequality or Gini Index in Jackson County is 0.46.
How Large is the Labor Force in Jackson County?
There are 5,166 People in the Labor Forcein in Jackson County.
What is the Percentage of People in the Labor Force in Jackson County?
51.8% of People are in the Labor Force in Jackson County.
What is the Unemployment Rate in Jackson County?
Unemployment Rate in Jackson County is 7.2%.