Humphreys County, TN
Humphreys County Map

Humphreys County Overview
19,032
TOTAL POPULATION
9,527
MALE POPULATION
9,505
FEMALE POPULATION
100.23
MALES / 100 FEMALES
99.77
FEMALES / 100 MALES
43.0
MEDIAN AGE
3.4
AVG FAMILY SIZE
2.8
AVG HOUSEHOLD SIZE
$29,561
PER CAPITA INCOME
$69,817
AVG FAMILY INCOME
$54,185
AVG HOUSEHOLD INCOME
41.3%
WAGE / INCOME GAP [ % ]
58.7¢/ $1
WAGE / INCOME GAP [ $ ]
0.42
INEQUALITY / GINI INDEX
8,714
LABOR FORCE [ PEOPLE ]
56.4%
PERCENT IN LABOR FORCE
10.2%
UNEMPLOYMENT RATE
Humphreys County Area Codes
Race in Humphreys County
The most populous races in Humphreys County are White / Caucasian (17,358 | 91.2%), Two or more Races (901 | 4.7%), and Hispanic or Latino (517 | 2.7%).

| Race | # Population | % Population |
| Asian | 146 | 0.8% |
| Black / African American | 237 | 1.3% |
| Hawaiian / Pacific | 0 | 0.0% |
| Hispanic or Latino | 517 | 2.7% |
| Native / Alaskan | 34 | 0.2% |
| White / Caucasian | 17,358 | 91.2% |
| Two or more Races | 901 | 4.7% |
| Some other Race | 356 | 1.9% |
| Total | 19,032 | 100.0% |
Ancestry in Humphreys County
The most populous ancestries reported in Humphreys County are American (3,407 | 17.9%), English (2,632 | 13.8%), Irish (1,692 | 8.9%), German (814 | 4.3%), and Scottish (511 | 2.7%), together accounting for 47.6% of all Humphreys County residents.

| Ancestry | # Population | % Population |
| American | 3,407 | 17.9% |
| Arab | 8 | 0.0% |
| Argentinean | 9 | 0.1% |
| Australian | 16 | 0.1% |
| Belgian | 80 | 0.4% |
| Bhutanese | 6 | 0.0% |
| British | 28 | 0.2% |
| Cajun | 4 | 0.0% |
| Central American | 4 | 0.0% |
| Cherokee | 124 | 0.6% |
| Chippewa | 1 | 0.0% |
| Choctaw | 9 | 0.1% |
| Cuban | 79 | 0.4% |
| Czech | 21 | 0.1% |
| Dominican | 13 | 0.1% |
| Dutch | 93 | 0.5% |
| Eastern European | 2 | 0.0% |
| English | 2,632 | 13.8% |
| European | 281 | 1.5% |
| Finnish | 83 | 0.4% |
| French | 101 | 0.5% |
| French Canadian | 92 | 0.5% |
| German | 814 | 4.3% |
| Greek | 13 | 0.1% |
| Haitian | 9 | 0.1% |
| Honduran | 4 | 0.0% |
| Hungarian | 156 | 0.8% |
| Indian (Asian) | 22 | 0.1% |
| Irish | 1,692 | 8.9% |
| Iroquois | 1 | 0.0% |
| Italian | 141 | 0.7% |
| Korean | 131 | 0.7% |
| Lebanese | 8 | 0.0% |
| Mexican | 212 | 1.1% |
| Northern European | 24 | 0.1% |
| Norwegian | 111 | 0.6% |
| Peruvian | 44 | 0.2% |
| Polish | 281 | 1.5% |
| Portuguese | 23 | 0.1% |
| Puerto Rican | 30 | 0.2% |
| Romanian | 12 | 0.1% |
| Russian | 52 | 0.3% |
| Scandinavian | 3 | 0.0% |
| Scotch-Irish | 330 | 1.7% |
| Scottish | 511 | 2.7% |
| Sioux | 1 | 0.0% |
| South American | 74 | 0.4% |
| Spaniard | 15 | 0.1% |
| Swedish | 34 | 0.2% |
| Swiss | 9 | 0.1% |
| Ukrainian | 18 | 0.1% |
| Venezuelan | 21 | 0.1% |
| Welsh | 50 | 0.3% | View All 53 Rows |
Immigrants in Humphreys County
The most numerous immigrant groups reported in Humphreys County came from Asia (141 | 0.7%), Philippines (136 | 0.7%), South Eastern Asia (136 | 0.7%), Latin America (100 | 0.5%), and Europe (96 | 0.5%), together accounting for 3.2% of all Humphreys County residents.

| Immigration Origin | # Population | % Population |
| Asia | 141 | 0.7% |
| Australia | 6 | 0.0% |
| Brazil | 15 | 0.1% |
| Canada | 42 | 0.2% |
| Caribbean | 3 | 0.0% |
| Central America | 60 | 0.3% |
| Colombia | 1 | 0.0% |
| Dominican Republic | 3 | 0.0% |
| Eastern Asia | 5 | 0.0% |
| Eastern Europe | 9 | 0.1% |
| Europe | 96 | 0.5% |
| France | 4 | 0.0% |
| Germany | 67 | 0.4% |
| Korea | 5 | 0.0% |
| Latin America | 100 | 0.5% |
| Mexico | 60 | 0.3% |
| Northern Europe | 16 | 0.1% |
| Oceania | 6 | 0.0% |
| Philippines | 136 | 0.7% |
| Russia | 9 | 0.1% |
| South America | 37 | 0.2% |
| South Eastern Asia | 136 | 0.7% |
| Venezuela | 21 | 0.1% |
| Western Europe | 71 | 0.4% | View All 24 Rows |
Sex and Age in Humphreys County
Sex and Age in Humphreys County
The most populous age groups in Humphreys County are 10 to 14 Years (913 | 9.6%) for men and 55 to 59 Years (749 | 7.9%) for women.
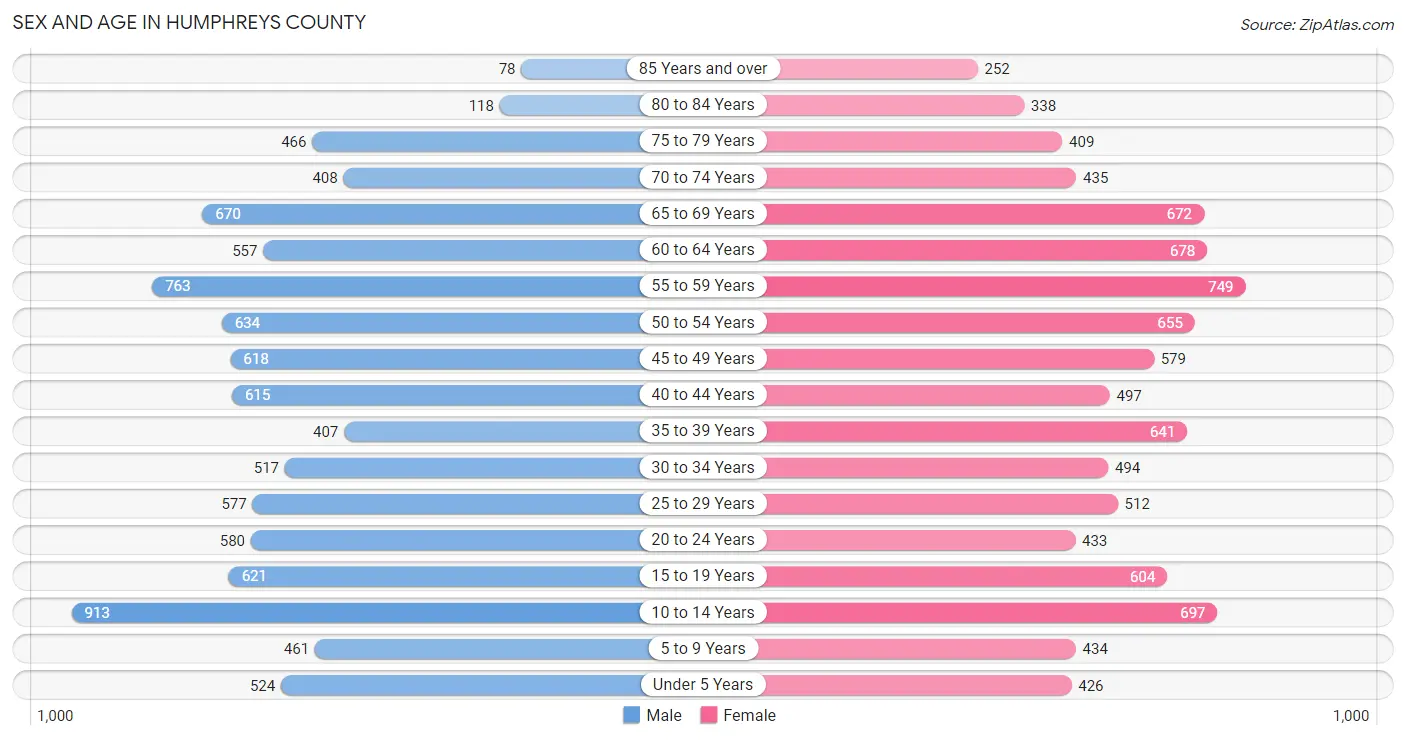
| Age Bracket | Male | Female |
| Under 5 Years | 524 (5.5%) | 426 (4.5%) |
| 5 to 9 Years | 461 (4.8%) | 434 (4.6%) |
| 10 to 14 Years | 913 (9.6%) | 697 (7.3%) |
| 15 to 19 Years | 621 (6.5%) | 604 (6.4%) |
| 20 to 24 Years | 580 (6.1%) | 433 (4.6%) |
| 25 to 29 Years | 577 (6.1%) | 512 (5.4%) |
| 30 to 34 Years | 517 (5.4%) | 494 (5.2%) |
| 35 to 39 Years | 407 (4.3%) | 641 (6.7%) |
| 40 to 44 Years | 615 (6.5%) | 497 (5.2%) |
| 45 to 49 Years | 618 (6.5%) | 579 (6.1%) |
| 50 to 54 Years | 634 (6.7%) | 655 (6.9%) |
| 55 to 59 Years | 763 (8.0%) | 749 (7.9%) |
| 60 to 64 Years | 557 (5.9%) | 678 (7.1%) |
| 65 to 69 Years | 670 (7.0%) | 672 (7.1%) |
| 70 to 74 Years | 408 (4.3%) | 435 (4.6%) |
| 75 to 79 Years | 466 (4.9%) | 409 (4.3%) |
| 80 to 84 Years | 118 (1.2%) | 338 (3.6%) |
| 85 Years and over | 78 (0.8%) | 252 (2.6%) |
| Total | 9,527 (100.0%) | 9,505 (100.0%) |
Families and Households in Humphreys County
Median Family Size in Humphreys County
The median family size in Humphreys County is 3.41 persons per family, with single female/mother families (606 | 13.3%) accounting for the largest median family size of 4.83 persons per family. On the other hand, single male/father families (300 | 6.6%) represent the smallest median family size with 3.10 persons per family.
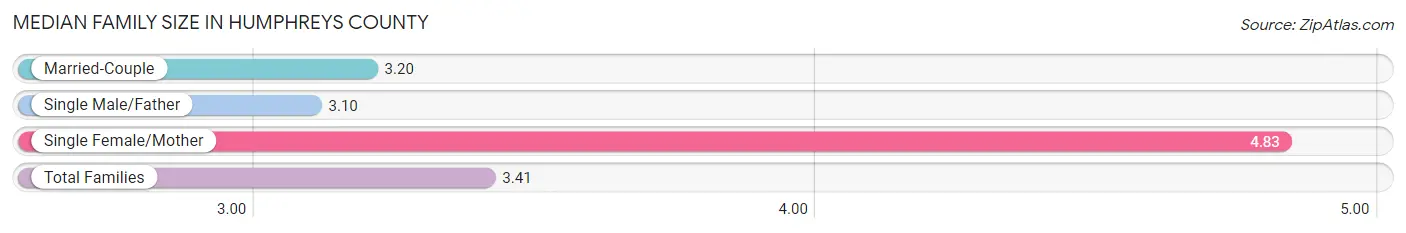
| Family Type | # Families | Family Size |
| Married-Couple | 3,665 (80.2%) | 3.20 |
| Single Male/Father | 300 (6.6%) | 3.10 |
| Single Female/Mother | 606 (13.3%) | 4.83 |
| Total Families | 4,571 (100.0%) | 3.41 |
Median Household Size in Humphreys County
The median household size in Humphreys County is 2.79 persons per household, with single female/mother households (606 | 9.0%) accounting for the largest median household size of 5.02 persons per household. non-family households (2,144 | 31.9%) represent the smallest median household size with 1.20 persons per household.
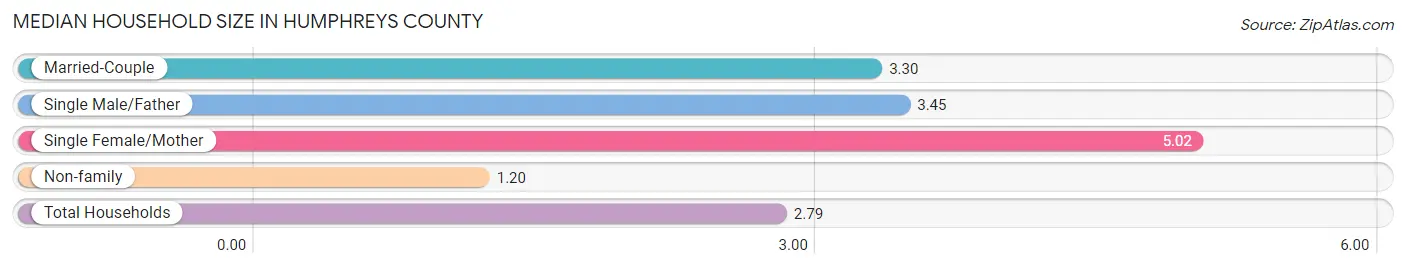
| Household Type | # Households | Household Size |
| Married-Couple | 3,665 (54.6%) | 3.30 |
| Single Male/Father | 300 (4.5%) | 3.45 |
| Single Female/Mother | 606 (9.0%) | 5.02 |
| Non-family | 2,144 (31.9%) | 1.20 |
| Total Households | 6,715 (100.0%) | 2.79 |
Household Size by Marriage Status in Humphreys County
Out of a total of 6,715 households in Humphreys County, 4,571 (68.1%) are family households, while 2,144 (31.9%) are nonfamily households. The most numerous type of family households are 2-person households, comprising 2,788, and the most common type of nonfamily households are 1-person households, comprising 1,843.
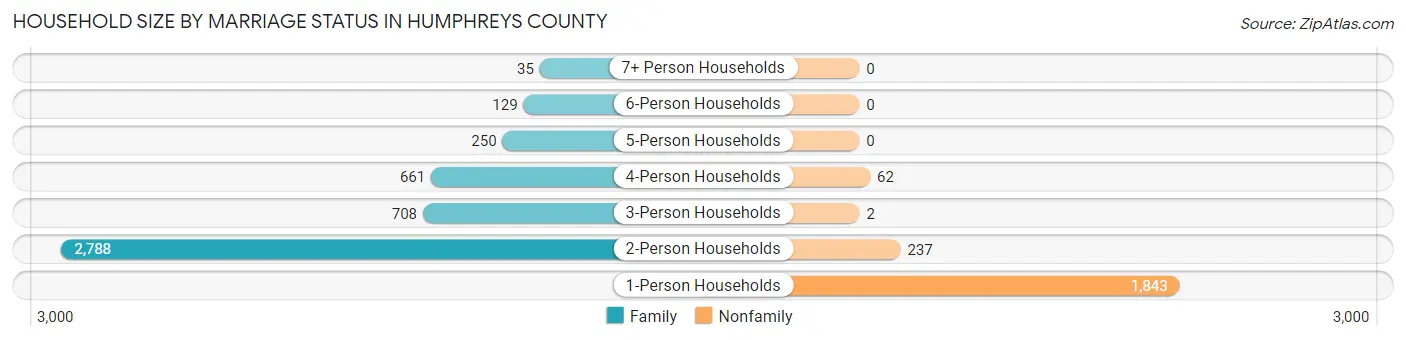
| Household Size | Family Households | Nonfamily Households |
| 1-Person Households | - | 1,843 (27.5%) |
| 2-Person Households | 2,788 (41.5%) | 237 (3.5%) |
| 3-Person Households | 708 (10.5%) | 2 (0.0%) |
| 4-Person Households | 661 (9.8%) | 62 (0.9%) |
| 5-Person Households | 250 (3.7%) | 0 (0.0%) |
| 6-Person Households | 129 (1.9%) | 0 (0.0%) |
| 7+ Person Households | 35 (0.5%) | 0 (0.0%) |
| Total | 4,571 (68.1%) | 2,144 (31.9%) |
Female Fertility in Humphreys County
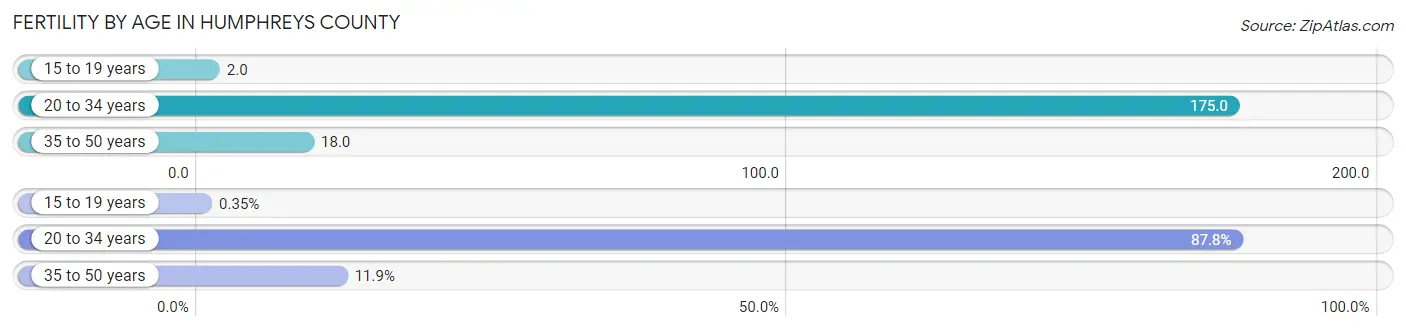
Fertility by Age in Humphreys County
Average fertility rate in Humphreys County is 73.0 births per 1,000 women. Women in the age bracket of 20 to 34 years have the highest fertility rate with 175.0 births per 1,000 women. Women in the age bracket of 20 to 34 years acount for 87.8% of all women with births.
| Age Bracket | Women with Births | Births / 1,000 Women |
| 15 to 19 years | 1 (0.4%) | 2.0 |
| 20 to 34 years | 252 (87.8%) | 175.0 |
| 35 to 50 years | 34 (11.8%) | 18.0 |
| Total | 287 (100.0%) | 73.0 |
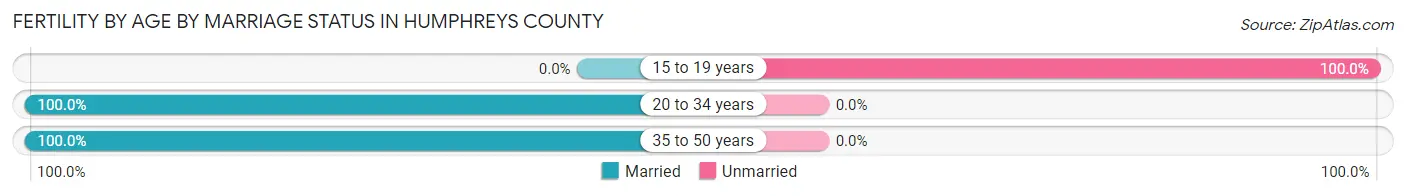
Fertility by Age by Marriage Status in Humphreys County
99.7% of women with births (287) in Humphreys County are married. The highest percentage of unmarried women with births falls into 15 to 19 years age bracket with 100.0% of them unmarried at the time of birth, while the lowest percentage of unmarried women with births belong to 20 to 34 years age bracket with 0.0% of them unmarried.
| Age Bracket | Married | Unmarried |
| 15 to 19 years | 0 (0.0%) | 1 (100.0%) |
| 20 to 34 years | 252 (100.0%) | 0 (0.0%) |
| 35 to 50 years | 34 (100.0%) | 0 (0.0%) |
| Total | 286 (99.7%) | 1 (0.4%) |
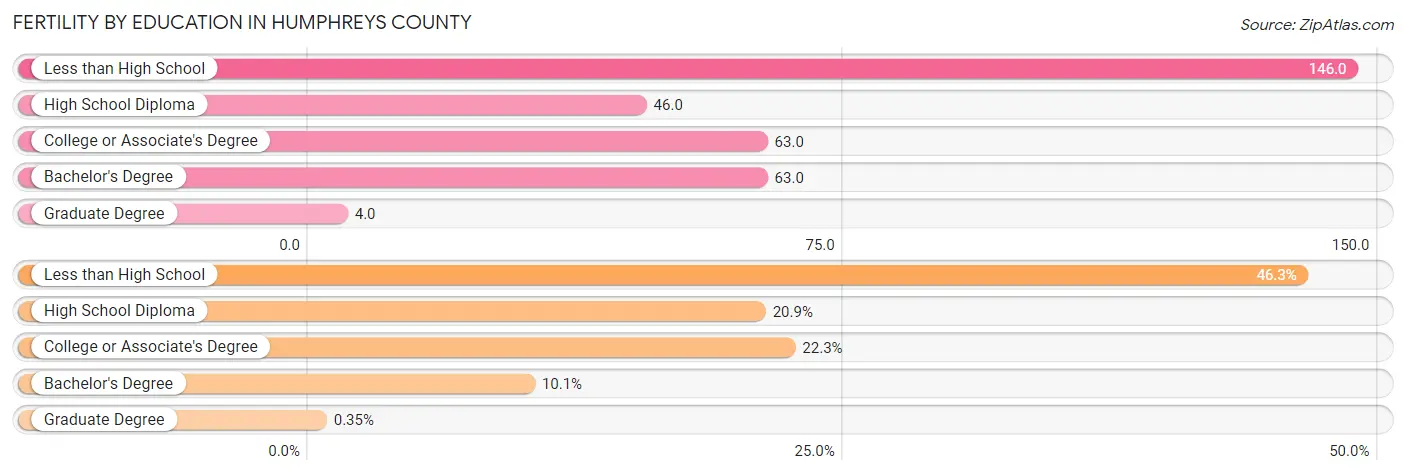
Fertility by Education in Humphreys County
Average fertility rate in Humphreys County is 73.0 births per 1,000 women. Women with the education attainment of less than high school have the highest fertility rate of 146.0 births per 1,000 women, while women with the education attainment of graduate degree have the lowest fertility at 4.0 births per 1,000 women. Women with the education attainment of less than high school represent 46.3% of all women with births.
| Educational Attainment | Women with Births | Births / 1,000 Women |
| Less than High School | 133 (46.3%) | 146.0 |
| High School Diploma | 60 (20.9%) | 46.0 |
| College or Associate's Degree | 64 (22.3%) | 63.0 |
| Bachelor's Degree | 29 (10.1%) | 63.0 |
| Graduate Degree | 1 (0.4%) | 4.0 |
| Total | 287 (100.0%) | 73.0 |
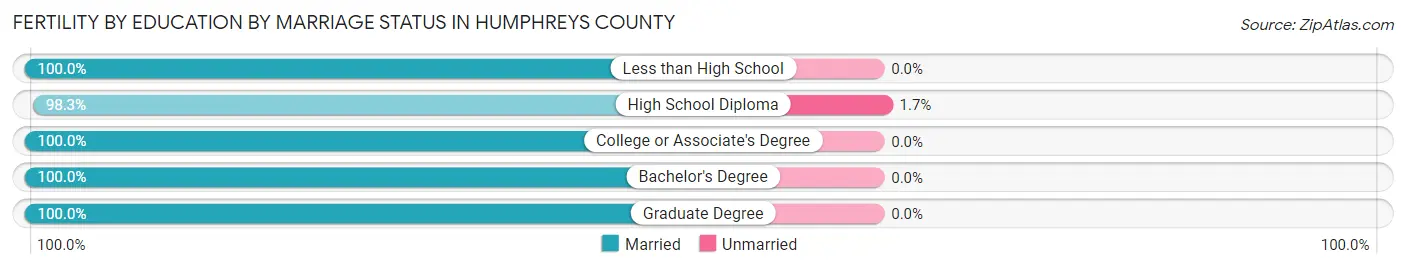
Fertility by Education by Marriage Status in Humphreys County
0.4% of women with births in Humphreys County are unmarried. Women with the educational attainment of less than high school are most likely to be married with 100.0% of them married at childbirth, while women with the educational attainment of high school diploma are least likely to be married with 1.7% of them unmarried at childbirth.
| Educational Attainment | Married | Unmarried |
| Less than High School | 133 (100.0%) | 0 (0.0%) |
| High School Diploma | 59 (98.3%) | 1 (1.7%) |
| College or Associate's Degree | 64 (100.0%) | 0 (0.0%) |
| Bachelor's Degree | 29 (100.0%) | 0 (0.0%) |
| Graduate Degree | 1 (100.0%) | 0 (0.0%) |
| Total | 286 (99.7%) | 1 (0.4%) |
Income in Humphreys County
Income Overview in Humphreys County
Per Capita Income in Humphreys County is $29,561, while median incomes of families and households are $69,817 and $54,185 respectively.
| Characteristic | Number | Measure |
| Per Capita Income | 19,032 | $29,561 |
| Median Family Income | 4,571 | $69,817 |
| Mean Family Income | 4,571 | $83,586 |
| Median Household Income | 6,715 | $54,185 |
| Mean Household Income | 6,715 | $73,417 |
| Income Deficit | 4,571 | $0 |
| Wage / Income Gap (%) | 19,032 | 41.33% |
| Wage / Income Gap ($) | 19,032 | 58.67¢ per $1 |
| Gini / Inequality Index | 19,032 | 0.42 |
Earnings by Sex in Humphreys County
Average Earnings in Humphreys County are $30,655, $41,887 for men and $24,576 for women, a difference of 41.3%.
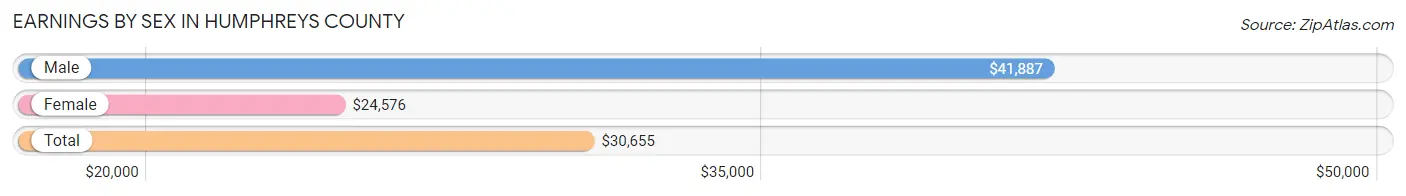
| Sex | Number | Average Earnings |
| Male | 4,443 (50.7%) | $41,887 |
| Female | 4,322 (49.3%) | $24,576 |
| Total | 8,765 (100.0%) | $30,655 |
Earnings by Sex by Income Bracket in Humphreys County
The most common earnings brackets in Humphreys County are $55,000 to $64,999 for men (581 | 13.1%) and $25,000 to $29,999 for women (632 | 14.6%).
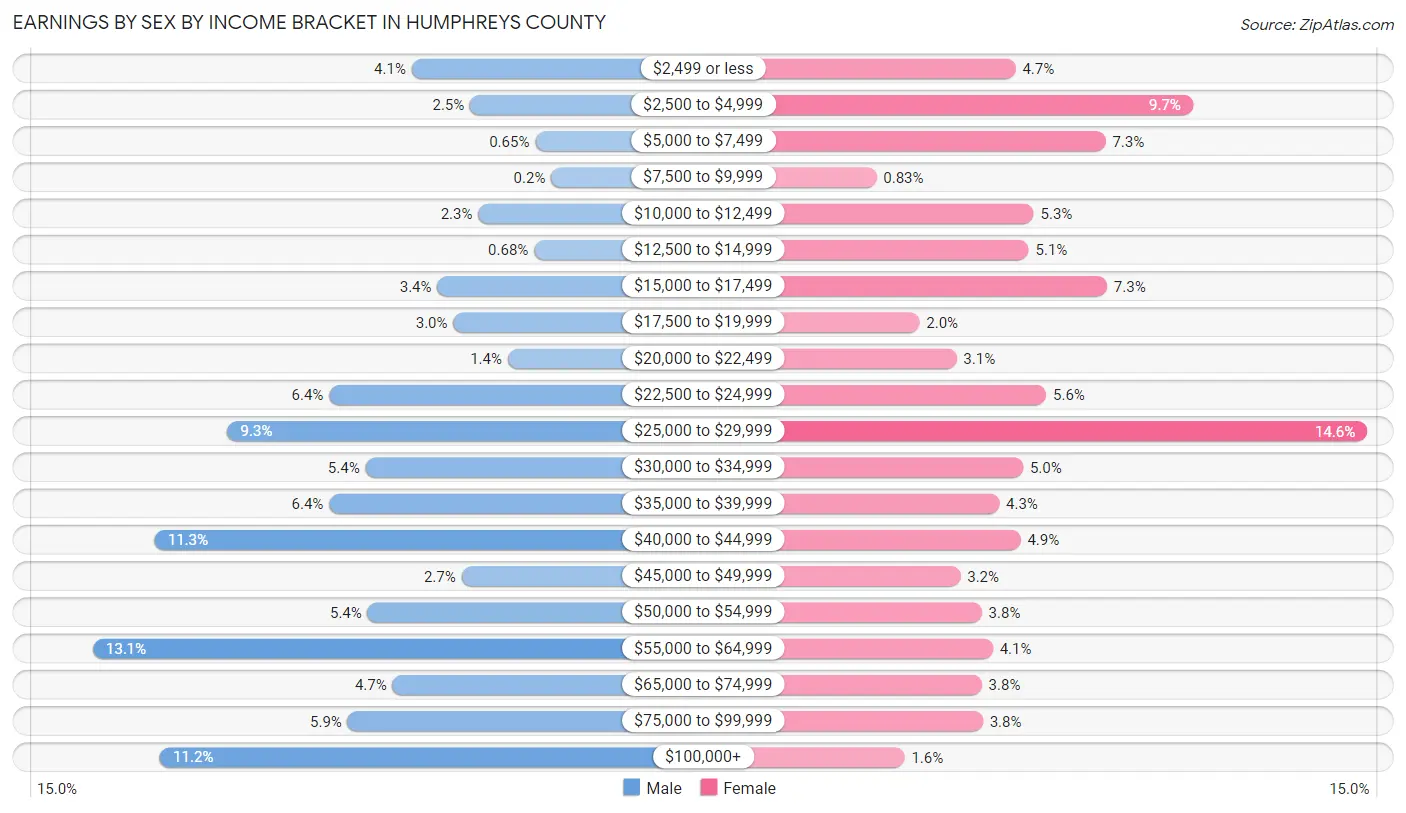
| Income | Male | Female |
| $2,499 or less | 183 (4.1%) | 205 (4.7%) |
| $2,500 to $4,999 | 110 (2.5%) | 420 (9.7%) |
| $5,000 to $7,499 | 29 (0.6%) | 314 (7.3%) |
| $7,500 to $9,999 | 9 (0.2%) | 36 (0.8%) |
| $10,000 to $12,499 | 100 (2.2%) | 227 (5.2%) |
| $12,500 to $14,999 | 30 (0.7%) | 221 (5.1%) |
| $15,000 to $17,499 | 151 (3.4%) | 316 (7.3%) |
| $17,500 to $19,999 | 131 (2.9%) | 88 (2.0%) |
| $20,000 to $22,499 | 63 (1.4%) | 133 (3.1%) |
| $22,500 to $24,999 | 286 (6.4%) | 242 (5.6%) |
| $25,000 to $29,999 | 413 (9.3%) | 632 (14.6%) |
| $30,000 to $34,999 | 241 (5.4%) | 214 (5.0%) |
| $35,000 to $39,999 | 286 (6.4%) | 185 (4.3%) |
| $40,000 to $44,999 | 504 (11.3%) | 211 (4.9%) |
| $45,000 to $49,999 | 121 (2.7%) | 138 (3.2%) |
| $50,000 to $54,999 | 238 (5.4%) | 164 (3.8%) |
| $55,000 to $64,999 | 581 (13.1%) | 177 (4.1%) |
| $65,000 to $74,999 | 207 (4.7%) | 164 (3.8%) |
| $75,000 to $99,999 | 263 (5.9%) | 165 (3.8%) |
| $100,000+ | 497 (11.2%) | 70 (1.6%) |
| Total | 4,443 (100.0%) | 4,322 (100.0%) |
Earnings by Sex by Educational Attainment in Humphreys County
Average earnings in Humphreys County are $44,106 for men and $27,841 for women, a difference of 36.9%. Men with an educational attainment of bachelor's degree enjoy the highest average annual earnings of $62,537, while those with less than high school education earn the least with $29,674. Women with an educational attainment of graduate degree earn the most with the average annual earnings of $56,500, while those with college or associate's degree education have the smallest earnings of $24,023.
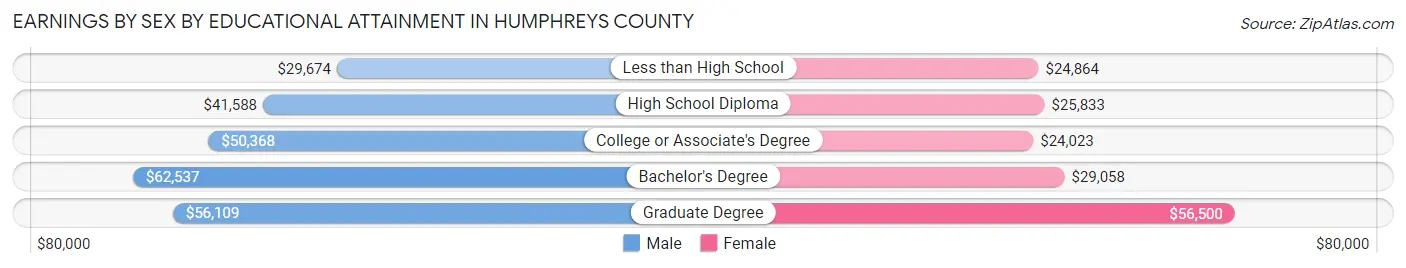
| Educational Attainment | Male Income | Female Income |
| Less than High School | $29,674 | $24,864 |
| High School Diploma | $41,588 | $25,833 |
| College or Associate's Degree | $50,368 | $24,023 |
| Bachelor's Degree | $62,537 | $29,058 |
| Graduate Degree | $56,109 | $56,500 |
| Total | $44,106 | $27,841 |
Family Income in Humphreys County
Family Income Brackets in Humphreys County
According to the Humphreys County family income data, there are 1,097 families falling into the $50,000 to $74,999 income range, which is the most common income bracket and makes up 24.0% of all families. Conversely, the $10,000 to $14,999 income bracket is the least frequent group with only 50 families (1.1%) belonging to this category.

| Income Bracket | # Families | % Families |
| Less than $10,000 | 101 | 2.2% |
| $10,000 to $14,999 | 50 | 1.1% |
| $15,000 to $24,999 | 169 | 3.7% |
| $25,000 to $34,999 | 485 | 10.6% |
| $35,000 to $49,999 | 608 | 13.3% |
| $50,000 to $74,999 | 1,097 | 24.0% |
| $75,000 to $99,999 | 736 | 16.1% |
| $100,000 to $149,999 | 891 | 19.5% |
| $150,000 to $199,999 | 251 | 5.5% |
| $200,000+ | 178 | 3.9% |
Family Income by Famaliy Size in Humphreys County
3-person families (751 | 16.4%) account for the highest median family income in Humphreys County with $80,592 per family, while 2-person families (2,823 | 61.8%) have the highest median income of $31,692 per family member.
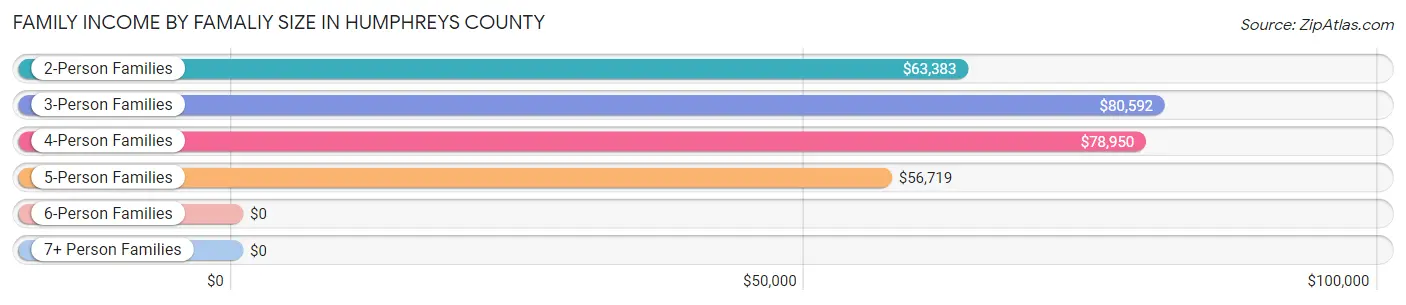
| Income Bracket | # Families | Median Income |
| 2-Person Families | 2,823 (61.8%) | $63,383 |
| 3-Person Families | 751 (16.4%) | $80,592 |
| 4-Person Families | 617 (13.5%) | $78,950 |
| 5-Person Families | 259 (5.7%) | $56,719 |
| 6-Person Families | 116 (2.5%) | $0 |
| 7+ Person Families | 5 (0.1%) | $0 |
| Total | 4,571 (100.0%) | $69,817 |
Family Income by Number of Earners in Humphreys County
The median family income in Humphreys County is $69,817, with families comprising 3+ earners (297) having the highest median family income of $100,664, while families with 1 earner (1,408) have the lowest median family income of $47,038, accounting for 6.5% and 30.8% of families, respectively.
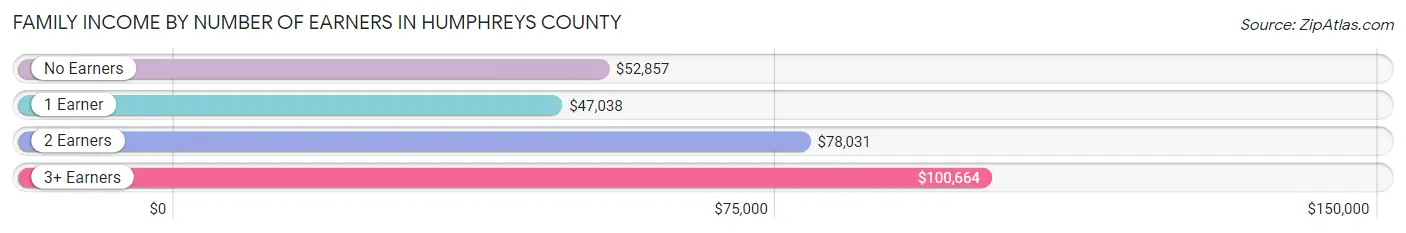
| Number of Earners | # Families | Median Income |
| No Earners | 1,050 (23.0%) | $52,857 |
| 1 Earner | 1,408 (30.8%) | $47,038 |
| 2 Earners | 1,816 (39.7%) | $78,031 |
| 3+ Earners | 297 (6.5%) | $100,664 |
| Total | 4,571 (100.0%) | $69,817 |
Household Income in Humphreys County
Household Income Brackets in Humphreys County
With 1,430 households falling in the category, the $50,000 to $74,999 income range is the most frequent in Humphreys County, accounting for 21.3% of all households. In contrast, only 175 households (2.6%) fall into the less than $10,000 income bracket, making it the least populous group.

| Income Bracket | # Households | % Households |
| Less than $10,000 | 175 | 2.6% |
| $10,000 to $14,999 | 242 | 3.6% |
| $15,000 to $24,999 | 571 | 8.5% |
| $25,000 to $34,999 | 792 | 11.8% |
| $35,000 to $49,999 | 1,148 | 17.1% |
| $50,000 to $74,999 | 1,430 | 21.3% |
| $75,000 to $99,999 | 880 | 13.1% |
| $100,000 to $149,999 | 913 | 13.6% |
| $150,000 to $199,999 | 342 | 5.1% |
| $200,000+ | 222 | 3.3% |
Household Income by Householder Age in Humphreys County
The median household income in Humphreys County is $54,185, with the highest median household income of $62,901 found in the 45 to 64 years age bracket for the primary householder. A total of 2,351 households (35.0%) fall into this category. Meanwhile, the 15 to 24 years age bracket for the primary householder has the lowest median household income of $35,896, with 184 households (2.7%) in this group.
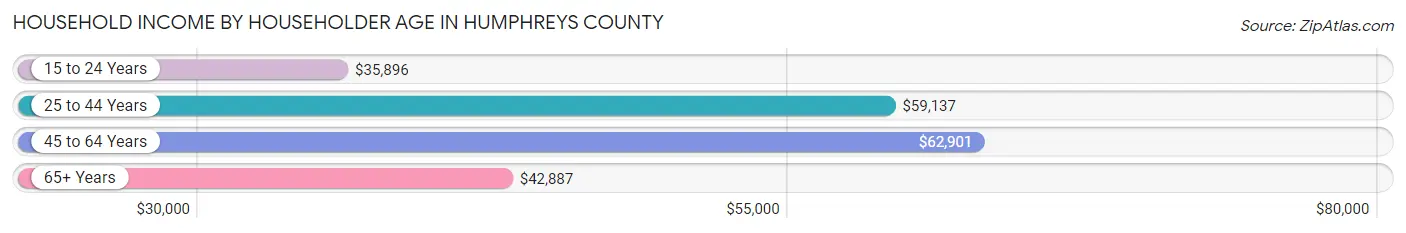
| Income Bracket | # Households | Median Income |
| 15 to 24 Years | 184 (2.7%) | $35,896 |
| 25 to 44 Years | 1,703 (25.4%) | $59,137 |
| 45 to 64 Years | 2,351 (35.0%) | $62,901 |
| 65+ Years | 2,477 (36.9%) | $42,887 |
| Total | 6,715 (100.0%) | $54,185 |
Poverty in Humphreys County
Income Below Poverty by Sex and Age in Humphreys County
With 10.1% poverty level for males and 14.0% for females among the residents of Humphreys County, 5 year old males and 5 year old females are the most vulnerable to poverty, with 34 males (26.8%) and 46 females (73.0%) in their respective age groups living below the poverty level.

| Age Bracket | Male | Female |
| Under 5 Years | 89 (17.3%) | 42 (9.9%) |
| 5 Years | 34 (26.8%) | 46 (73.0%) |
| 6 to 11 Years | 134 (21.6%) | 121 (21.4%) |
| 12 to 14 Years | 11 (2.2%) | 104 (27.4%) |
| 15 Years | 0 (0.0%) | 36 (67.9%) |
| 16 and 17 Years | 16 (5.4%) | 31 (11.6%) |
| 18 to 24 Years | 169 (22.5%) | 107 (14.9%) |
| 25 to 34 Years | 85 (7.9%) | 209 (20.8%) |
| 35 to 44 Years | 113 (11.2%) | 145 (12.7%) |
| 45 to 54 Years | 19 (1.5%) | 41 (3.3%) |
| 55 to 64 Years | 167 (12.7%) | 208 (14.6%) |
| 65 to 74 Years | 66 (6.1%) | 88 (8.1%) |
| 75 Years and over | 31 (4.7%) | 121 (12.8%) |
| Total | 934 (10.1%) | 1,299 (14.0%) |
Income Above Poverty by Sex and Age in Humphreys County
According to the poverty statistics in Humphreys County, males aged 15 years and females aged 45 to 54 years are the age groups that are most secure financially, with 100.0% of males and 96.7% of females in these age groups living above the poverty line.
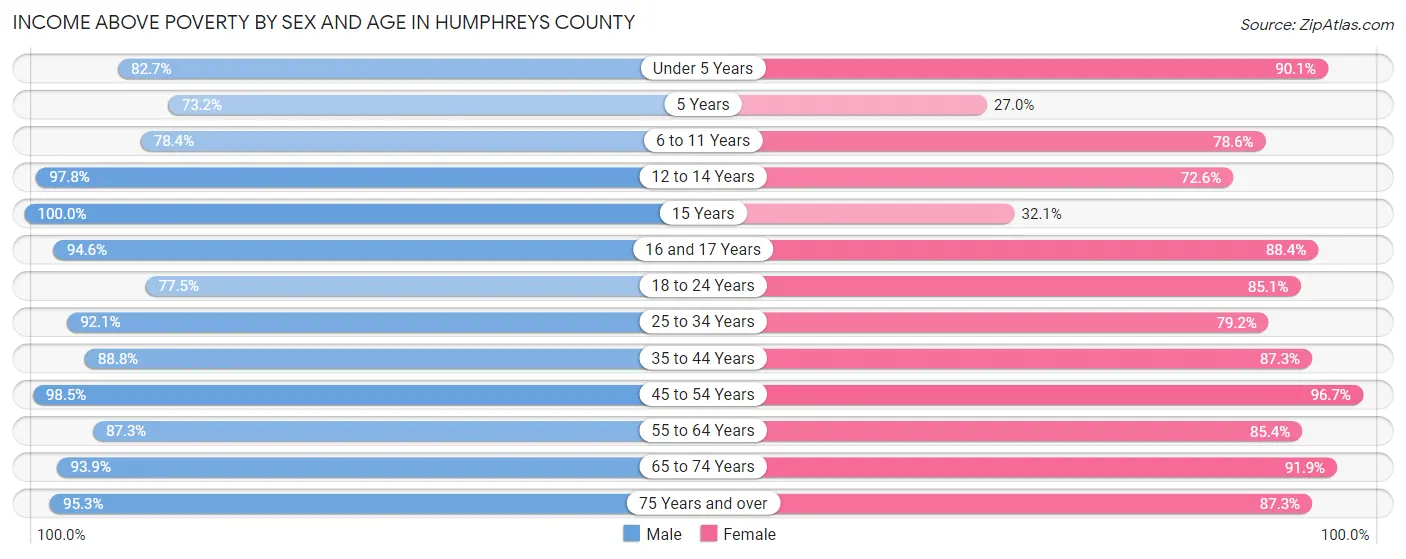
| Age Bracket | Male | Female |
| Under 5 Years | 424 (82.7%) | 384 (90.1%) |
| 5 Years | 93 (73.2%) | 17 (27.0%) |
| 6 to 11 Years | 487 (78.4%) | 445 (78.6%) |
| 12 to 14 Years | 489 (97.8%) | 276 (72.6%) |
| 15 Years | 62 (100.0%) | 17 (32.1%) |
| 16 and 17 Years | 279 (94.6%) | 236 (88.4%) |
| 18 to 24 Years | 583 (77.5%) | 609 (85.1%) |
| 25 to 34 Years | 988 (92.1%) | 797 (79.2%) |
| 35 to 44 Years | 896 (88.8%) | 993 (87.3%) |
| 45 to 54 Years | 1,206 (98.5%) | 1,193 (96.7%) |
| 55 to 64 Years | 1,149 (87.3%) | 1,219 (85.4%) |
| 65 to 74 Years | 1,012 (93.9%) | 998 (91.9%) |
| 75 Years and over | 623 (95.3%) | 828 (87.3%) |
| Total | 8,291 (89.9%) | 8,012 (86.1%) |
Income Below Poverty Among Married-Couple Families in Humphreys County
The poverty statistics for married-couple families in Humphreys County show that 3.3% or 119 of the total 3,665 families live below the poverty line. Families with 3 or 4 children have the highest poverty rate of 8.0%, comprising of 18 families. On the other hand, families with 5 or more children have the lowest poverty rate of 0.0%, which includes 0 families.
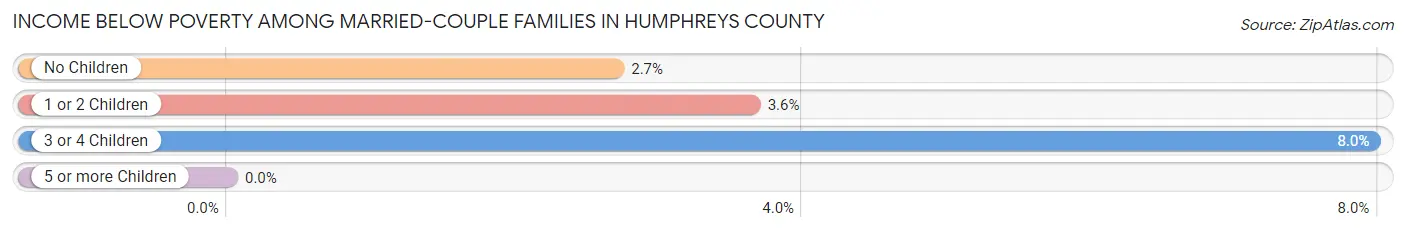
| Children | Above Poverty | Below Poverty |
| No Children | 2,459 (97.3%) | 68 (2.7%) |
| 1 or 2 Children | 874 (96.4%) | 33 (3.6%) |
| 3 or 4 Children | 208 (92.0%) | 18 (8.0%) |
| 5 or more Children | 5 (100.0%) | 0 (0.0%) |
| Total | 3,546 (96.8%) | 119 (3.3%) |
Income Below Poverty Among Single-Parent Households in Humphreys County
According to the poverty data in Humphreys County, 3.3% or 10 single-father households and 33.3% or 202 single-mother households are living below the poverty line. Among single-father households, those with 1 or 2 children have the highest poverty rate, with 10 households (6.7%) experiencing poverty. Likewise, among single-mother households, those with 1 or 2 children have the highest poverty rate, with 103 households (51.5%) falling below the poverty line.
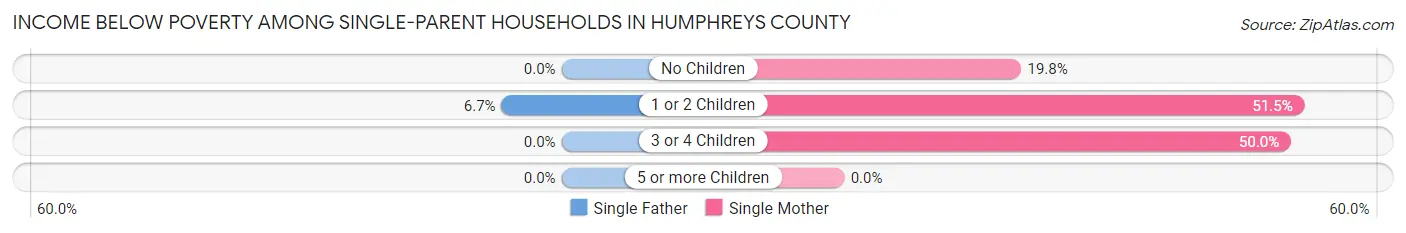
| Children | Single Father | Single Mother |
| No Children | 0 (0.0%) | 68 (19.8%) |
| 1 or 2 Children | 10 (6.7%) | 103 (51.5%) |
| 3 or 4 Children | 0 (0.0%) | 31 (50.0%) |
| 5 or more Children | 0 (0.0%) | 0 (0.0%) |
| Total | 10 (3.3%) | 202 (33.3%) |
Income Below Poverty Among Married-Couple vs Single-Parent Households in Humphreys County
The poverty data for Humphreys County shows that 119 of the married-couple family households (3.3%) and 212 of the single-parent households (23.4%) are living below the poverty level. Within the married-couple family households, those with 3 or 4 children have the highest poverty rate, with 18 households (8.0%) falling below the poverty line. Among the single-parent households, those with 3 or 4 children have the highest poverty rate, with 31 household (50.0%) living below poverty.

| Children | Married-Couple Families | Single-Parent Households |
| No Children | 68 (2.7%) | 68 (13.7%) |
| 1 or 2 Children | 33 (3.6%) | 113 (32.4%) |
| 3 or 4 Children | 18 (8.0%) | 31 (50.0%) |
| 5 or more Children | 0 (0.0%) | 0 (0.0%) |
| Total | 119 (3.3%) | 212 (23.4%) |
Employment Characteristics in Humphreys County
Employment by Class of Employer in Humphreys County
Among the 7,773 employed individuals in Humphreys County, private company employees (4,986 | 64.1%), local government employees (842 | 10.8%), and self-employed (not incorporated) (695 | 8.9%) make up the most common classes of employment.

| Employer Class | # Employees | % Employees |
| Private Company Employees | 4,986 | 64.1% |
| Self-Employed (Incorporated) | 216 | 2.8% |
| Self-Employed (Not Incorporated) | 695 | 8.9% |
| Not-for-profit Organizations | 509 | 6.6% |
| Local Government Employees | 842 | 10.8% |
| State Government Employees | 285 | 3.7% |
| Federal Government Employees | 199 | 2.6% |
| Unpaid Family Workers | 41 | 0.5% |
| Total | 7,773 | 100.0% |
Employment Status by Age in Humphreys County
According to the labor force statistics for Humphreys County, out of the total population over 16 years of age (15,450), 56.4% or 8,714 individuals are in the labor force, with 10.2% or 889 of them unemployed. The age group with the highest labor force participation rate is 30 to 34 years, with 90.3% or 913 individuals in the labor force. Within the labor force, the 25 to 29 years age range has the highest percentage of unemployed individuals, with 34.8% or 332 of them being unemployed.
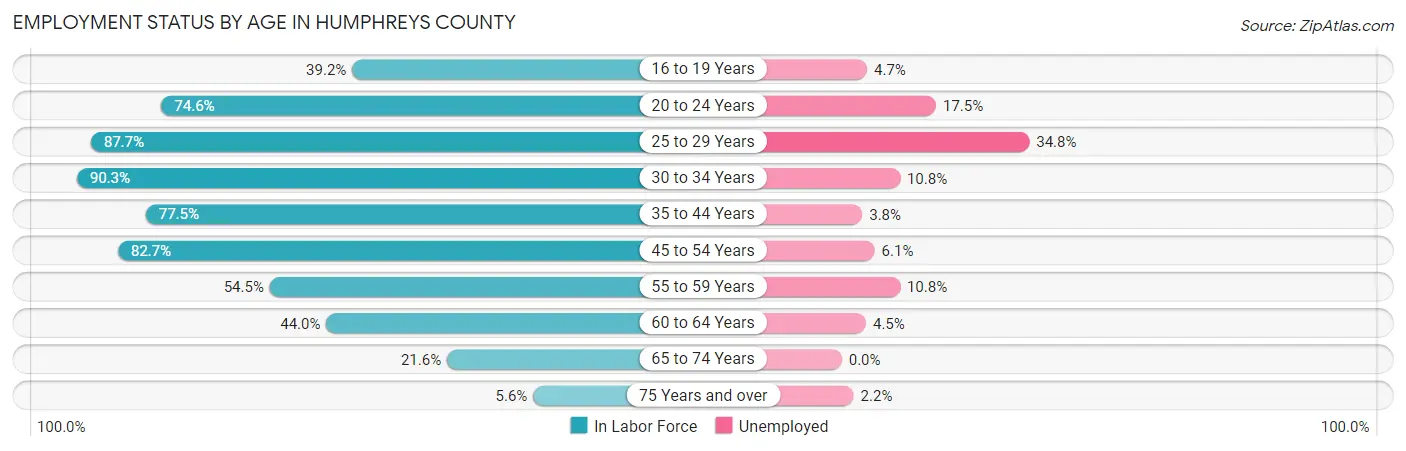
| Age Bracket | In Labor Force | Unemployed |
| 16 to 19 Years | 430 (39.2%) | 20 (4.7%) |
| 20 to 24 Years | 756 (74.6%) | 132 (17.5%) |
| 25 to 29 Years | 955 (87.7%) | 332 (34.8%) |
| 30 to 34 Years | 913 (90.3%) | 99 (10.8%) |
| 35 to 44 Years | 1,674 (77.5%) | 64 (3.8%) |
| 45 to 54 Years | 2,056 (82.7%) | 125 (6.1%) |
| 55 to 59 Years | 824 (54.5%) | 89 (10.8%) |
| 60 to 64 Years | 543 (44.0%) | 24 (4.5%) |
| 65 to 74 Years | 472 (21.6%) | 0 (0.0%) |
| 75 Years and over | 93 (5.6%) | 2 (2.2%) |
| Total | 8,714 (56.4%) | 889 (10.2%) |
Employment Status by Educational Attainment in Humphreys County
According to labor force statistics for Humphreys County, 73.4% of individuals (6,968) out of the total population between 25 and 64 years of age (9,493) are in the labor force, with 10.5% or 732 of them being unemployed. The group with the highest labor force participation rate are those with the educational attainment of bachelor's degree or higher, with 92.4% or 1,454 individuals in the labor force. Within the labor force, individuals with less than high school education have the highest percentage of unemployment, with 19.1% or 113 of them being unemployed.
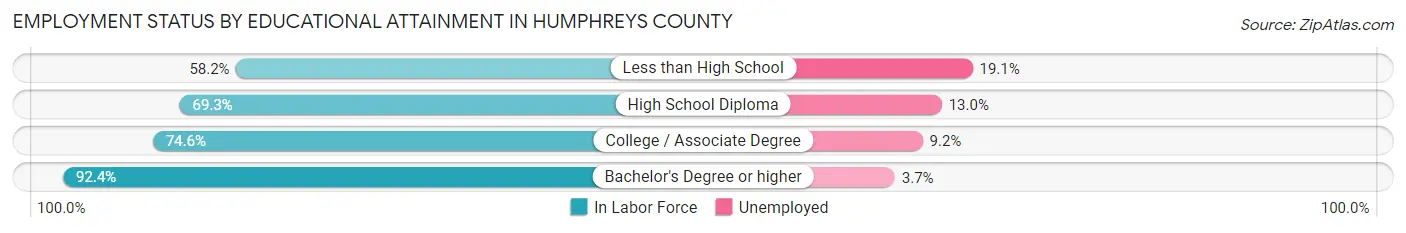
| Educational Attainment | In Labor Force | Unemployed |
| Less than High School | 591 (58.2%) | 194 (19.1%) |
| High School Diploma | 3,029 (69.3%) | 568 (13.0%) |
| College / Associate Degree | 1,889 (74.6%) | 233 (9.2%) |
| Bachelor's Degree or higher | 1,454 (92.4%) | 58 (3.7%) |
| Total | 6,968 (73.4%) | 997 (10.5%) |
Employment Occupations by Sex in Humphreys County
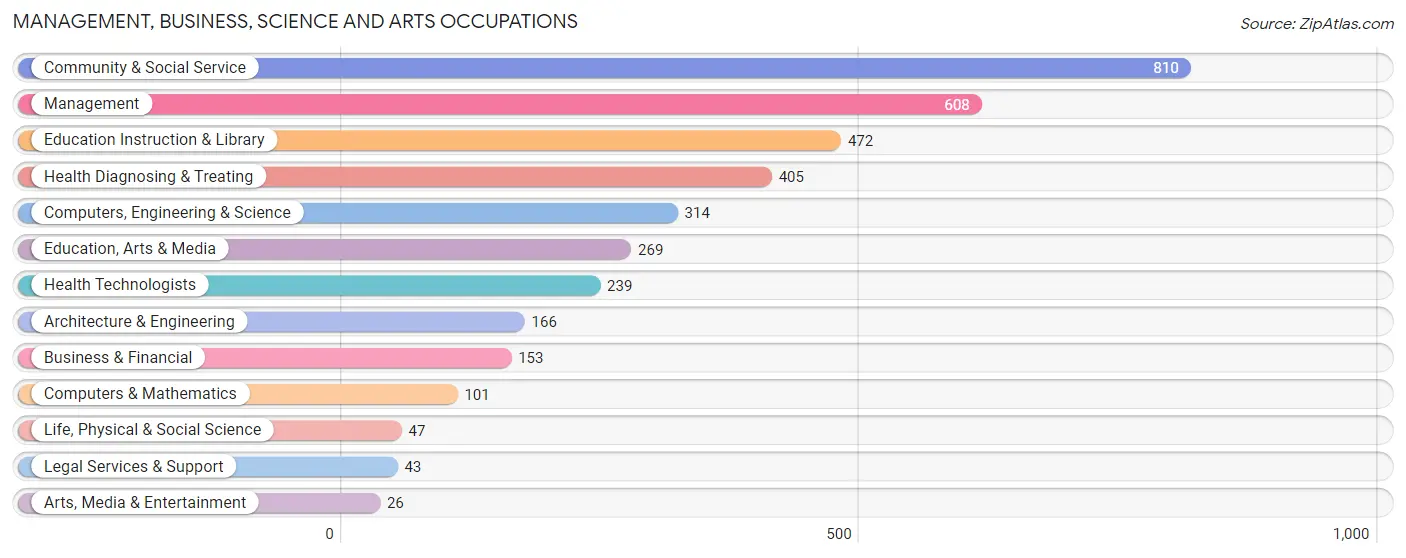
Management, Business, Science and Arts Occupations
The most common Management, Business, Science and Arts occupations in Humphreys County are Community & Social Service (810 | 10.4%), Management (608 | 7.8%), Education Instruction & Library (472 | 6.1%), Health Diagnosing & Treating (405 | 5.2%), and Computers, Engineering & Science (314 | 4.0%).
Management, Business, Science and Arts Occupations by Sex
Within the Management, Business, Science and Arts occupations in Humphreys County, the most male-oriented occupations are Legal Services & Support (100.0%), Arts, Media & Entertainment (100.0%), and Computers & Mathematics (91.1%), while the most female-oriented occupations are Education, Arts & Media (87.4%), Education Instruction & Library (87.1%), and Community & Social Service (79.7%).

| Occupation | Male | Female |
| Management | 485 (79.8%) | 123 (20.2%) |
| Business & Financial | 79 (51.6%) | 74 (48.4%) |
| Computers, Engineering & Science | 226 (72.0%) | 88 (28.0%) |
| Computers & Mathematics | 92 (91.1%) | 9 (8.9%) |
| Architecture & Engineering | 97 (58.4%) | 69 (41.6%) |
| Life, Physical & Social Science | 37 (78.7%) | 10 (21.3%) |
| Community & Social Service | 164 (20.3%) | 646 (79.7%) |
| Education, Arts & Media | 34 (12.6%) | 235 (87.4%) |
| Legal Services & Support | 43 (100.0%) | 0 (0.0%) |
| Education Instruction & Library | 61 (12.9%) | 411 (87.1%) |
| Arts, Media & Entertainment | 26 (100.0%) | 0 (0.0%) |
| Health Diagnosing & Treating | 94 (23.2%) | 311 (76.8%) |
| Health Technologists | 72 (30.1%) | 167 (69.9%) |
| Total (Category) | 1,048 (45.8%) | 1,242 (54.2%) |
| Total (Overall) | 4,114 (52.8%) | 3,679 (47.2%) |
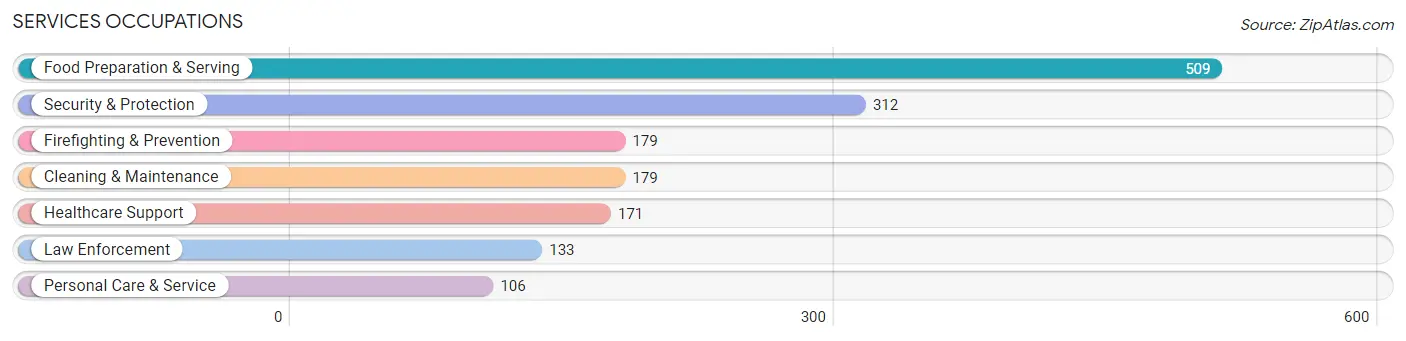
Services Occupations
The most common Services occupations in Humphreys County are Food Preparation & Serving (509 | 6.5%), Security & Protection (312 | 4.0%), Firefighting & Prevention (179 | 2.3%), Cleaning & Maintenance (179 | 2.3%), and Healthcare Support (171 | 2.2%).
Services Occupations by Sex
Within the Services occupations in Humphreys County, the most male-oriented occupations are Law Enforcement (100.0%), Cleaning & Maintenance (88.3%), and Security & Protection (73.4%), while the most female-oriented occupations are Food Preparation & Serving (87.2%), Healthcare Support (86.6%), and Personal Care & Service (84.9%).

| Occupation | Male | Female |
| Healthcare Support | 23 (13.5%) | 148 (86.6%) |
| Security & Protection | 229 (73.4%) | 83 (26.6%) |
| Firefighting & Prevention | 96 (53.6%) | 83 (46.4%) |
| Law Enforcement | 133 (100.0%) | 0 (0.0%) |
| Food Preparation & Serving | 65 (12.8%) | 444 (87.2%) |
| Cleaning & Maintenance | 158 (88.3%) | 21 (11.7%) |
| Personal Care & Service | 16 (15.1%) | 90 (84.9%) |
| Total (Category) | 491 (38.5%) | 786 (61.6%) |
| Total (Overall) | 4,114 (52.8%) | 3,679 (47.2%) |
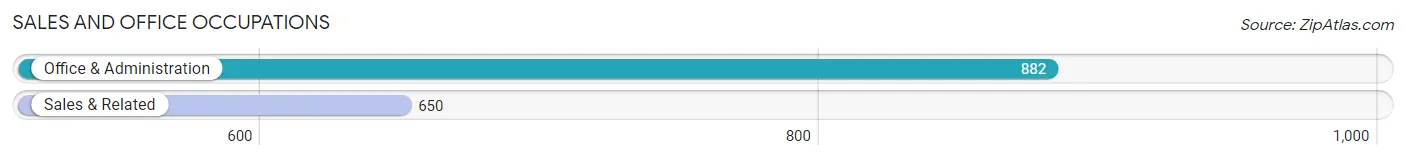
Sales and Office Occupations
The most common Sales and Office occupations in Humphreys County are Office & Administration (882 | 11.3%), and Sales & Related (650 | 8.3%).
Sales and Office Occupations by Sex
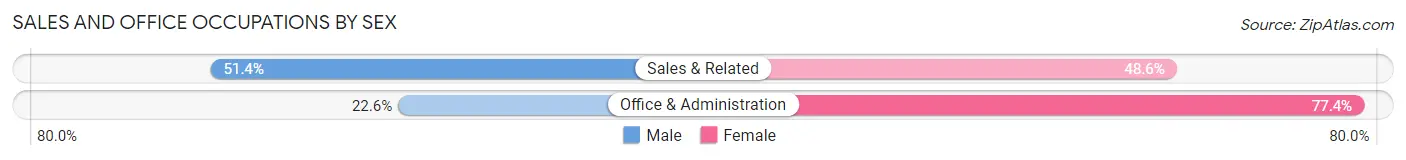
| Occupation | Male | Female |
| Sales & Related | 334 (51.4%) | 316 (48.6%) |
| Office & Administration | 199 (22.6%) | 683 (77.4%) |
| Total (Category) | 533 (34.8%) | 999 (65.2%) |
| Total (Overall) | 4,114 (52.8%) | 3,679 (47.2%) |
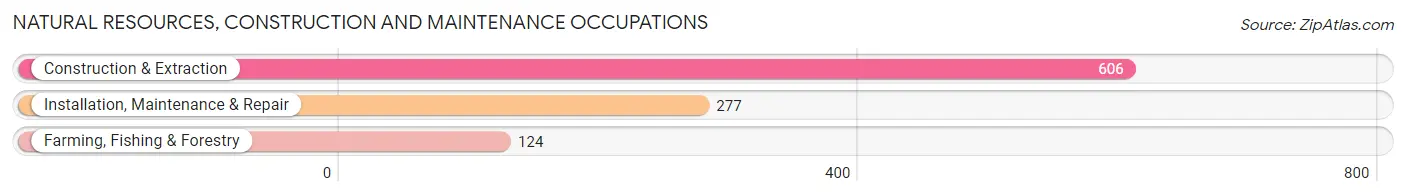
Natural Resources, Construction and Maintenance Occupations
The most common Natural Resources, Construction and Maintenance occupations in Humphreys County are Construction & Extraction (606 | 7.8%), Installation, Maintenance & Repair (277 | 3.5%), and Farming, Fishing & Forestry (124 | 1.6%).
Natural Resources, Construction and Maintenance Occupations by Sex
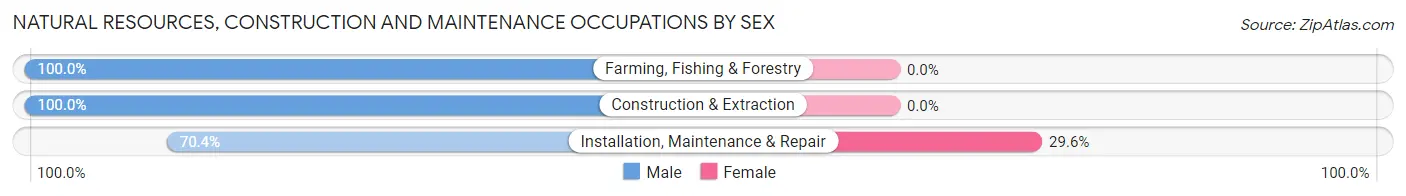
| Occupation | Male | Female |
| Farming, Fishing & Forestry | 124 (100.0%) | 0 (0.0%) |
| Construction & Extraction | 606 (100.0%) | 0 (0.0%) |
| Installation, Maintenance & Repair | 195 (70.4%) | 82 (29.6%) |
| Total (Category) | 925 (91.9%) | 82 (8.1%) |
| Total (Overall) | 4,114 (52.8%) | 3,679 (47.2%) |
Production, Transportation and Moving Occupations
The most common Production, Transportation and Moving occupations in Humphreys County are Production (1,254 | 16.1%), Material Moving (370 | 4.8%), and Transportation (63 | 0.8%).

Production, Transportation and Moving Occupations by Sex
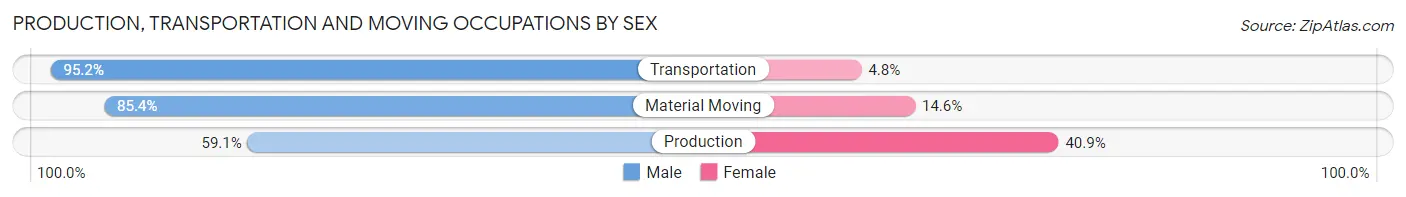
| Occupation | Male | Female |
| Production | 741 (59.1%) | 513 (40.9%) |
| Transportation | 60 (95.2%) | 3 (4.8%) |
| Material Moving | 316 (85.4%) | 54 (14.6%) |
| Total (Category) | 1,117 (66.2%) | 570 (33.8%) |
| Total (Overall) | 4,114 (52.8%) | 3,679 (47.2%) |
Employment Industries by Sex in Humphreys County
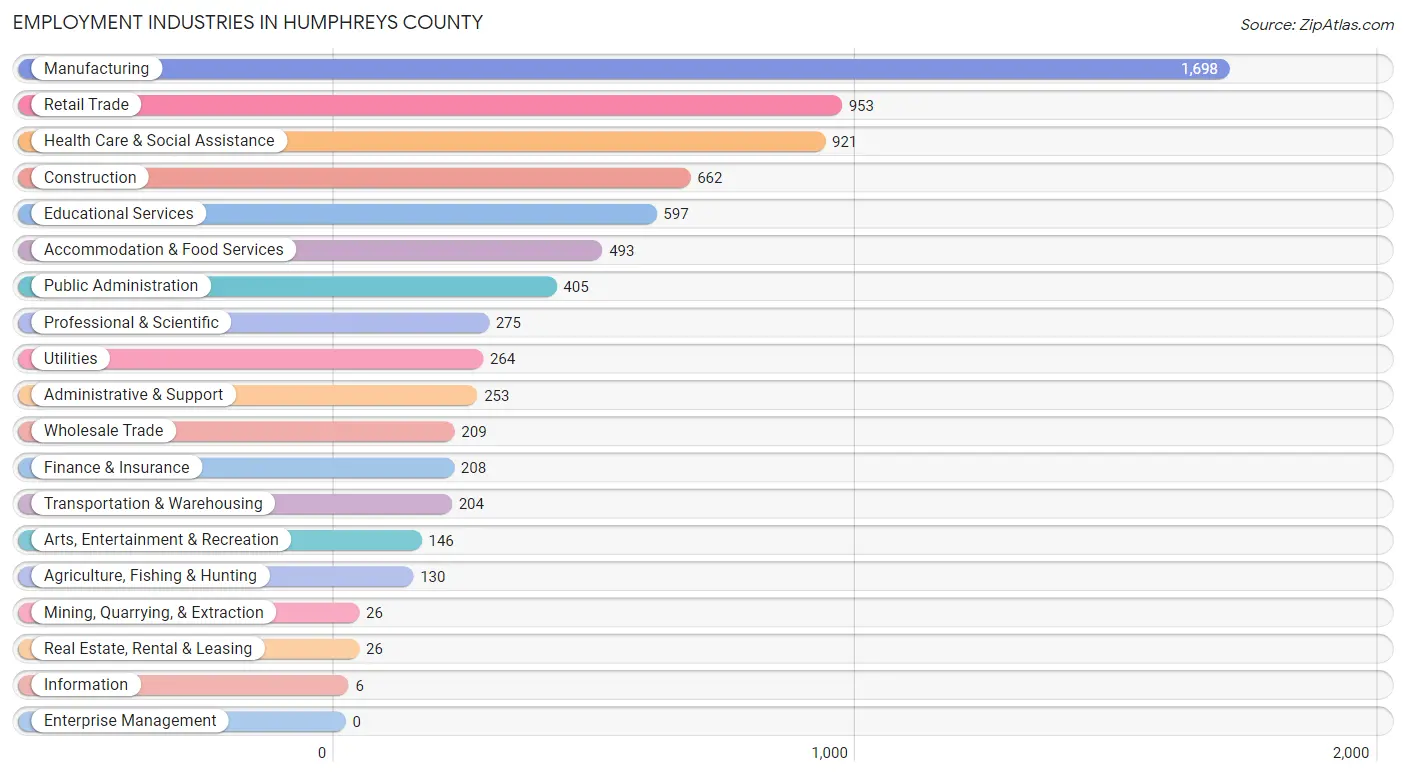
Employment Industries in Humphreys County
The major employment industries in Humphreys County include Manufacturing (1,698 | 21.8%), Retail Trade (953 | 12.2%), Health Care & Social Assistance (921 | 11.8%), Construction (662 | 8.5%), and Educational Services (597 | 7.7%).
Employment Industries by Sex in Humphreys County
The Humphreys County industries that see more men than women are Information (100.0%), Utilities (97.4%), and Construction (97.1%), whereas the industries that tend to have a higher number of women are Educational Services (86.4%), Health Care & Social Assistance (81.5%), and Accommodation & Food Services (78.1%).
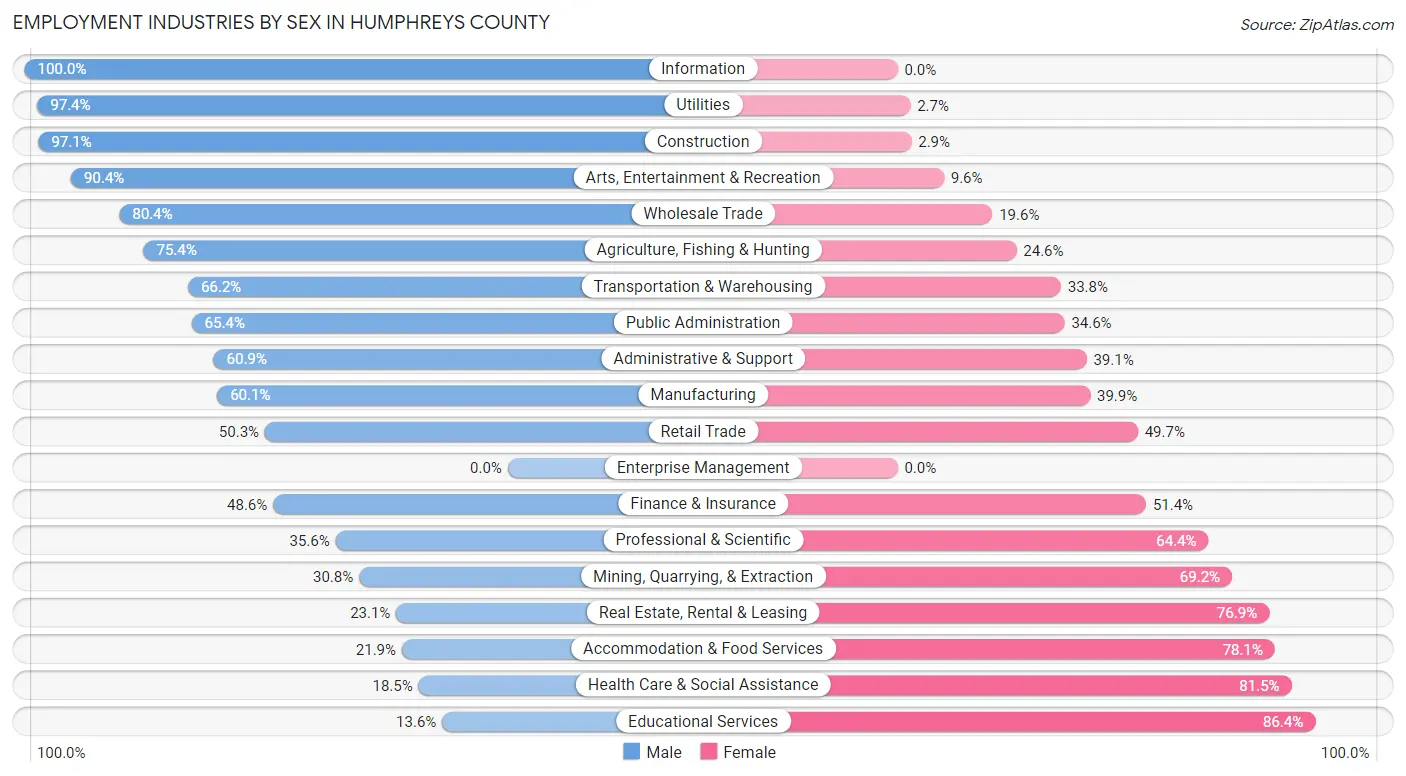
| Industry | Male | Female |
| Agriculture, Fishing & Hunting | 98 (75.4%) | 32 (24.6%) |
| Mining, Quarrying, & Extraction | 8 (30.8%) | 18 (69.2%) |
| Construction | 643 (97.1%) | 19 (2.9%) |
| Manufacturing | 1,021 (60.1%) | 677 (39.9%) |
| Wholesale Trade | 168 (80.4%) | 41 (19.6%) |
| Retail Trade | 479 (50.3%) | 474 (49.7%) |
| Transportation & Warehousing | 135 (66.2%) | 69 (33.8%) |
| Utilities | 257 (97.4%) | 7 (2.6%) |
| Information | 6 (100.0%) | 0 (0.0%) |
| Finance & Insurance | 101 (48.6%) | 107 (51.4%) |
| Real Estate, Rental & Leasing | 6 (23.1%) | 20 (76.9%) |
| Professional & Scientific | 98 (35.6%) | 177 (64.4%) |
| Enterprise Management | 0 (0.0%) | 0 (0.0%) |
| Administrative & Support | 154 (60.9%) | 99 (39.1%) |
| Educational Services | 81 (13.6%) | 516 (86.4%) |
| Health Care & Social Assistance | 170 (18.5%) | 751 (81.5%) |
| Arts, Entertainment & Recreation | 132 (90.4%) | 14 (9.6%) |
| Accommodation & Food Services | 108 (21.9%) | 385 (78.1%) |
| Public Administration | 265 (65.4%) | 140 (34.6%) |
| Total | 4,114 (52.8%) | 3,679 (47.2%) |
Education in Humphreys County
School Enrollment in Humphreys County
The most common levels of schooling among the 4,056 students in Humphreys County are middle school (1,206 | 29.7%), high school (1,165 | 28.7%), and elementary school (832 | 20.5%).
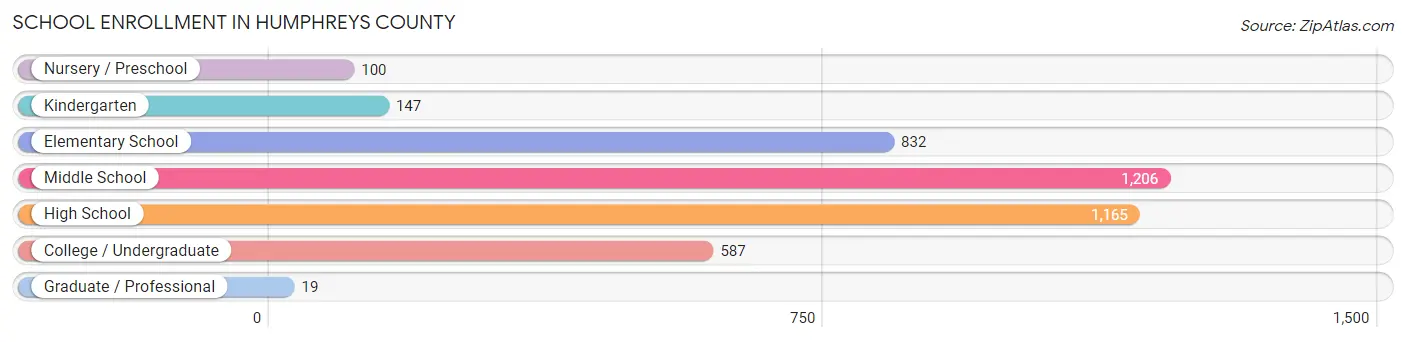
| School Level | # Students | % Students |
| Nursery / Preschool | 100 | 2.5% |
| Kindergarten | 147 | 3.6% |
| Elementary School | 832 | 20.5% |
| Middle School | 1,206 | 29.7% |
| High School | 1,165 | 28.7% |
| College / Undergraduate | 587 | 14.5% |
| Graduate / Professional | 19 | 0.5% |
| Total | 4,056 | 100.0% |
School Enrollment by Age by Funding Source in Humphreys County
Out of a total of 4,056 students who are enrolled in schools in Humphreys County, 568 (14.0%) attend a private institution, while the remaining 3,488 (86.0%) are enrolled in public schools. The age group of 35 years and over has the highest likelihood of being enrolled in private schools, with 39 (33.1% in the age bracket) enrolled. Conversely, the age group of 3 to 4 year olds has the lowest likelihood of being enrolled in a private school, with 37 (100.0% in the age bracket) attending a public institution.
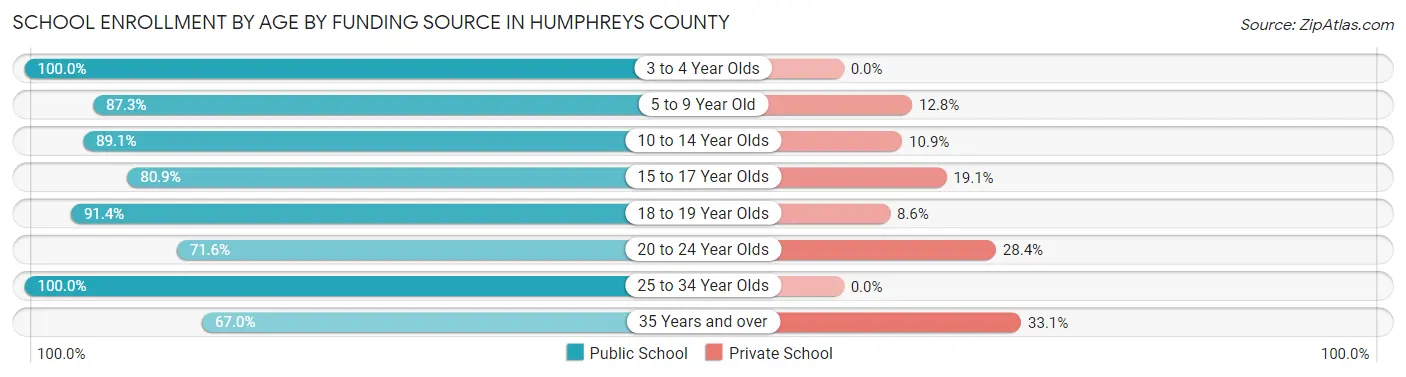
| Age Bracket | Public School | Private School |
| 3 to 4 Year Olds | 37 (100.0%) | 0 (0.0%) |
| 5 to 9 Year Old | 712 (87.3%) | 104 (12.8%) |
| 10 to 14 Year Olds | 1,408 (89.1%) | 172 (10.9%) |
| 15 to 17 Year Olds | 600 (80.9%) | 142 (19.1%) |
| 18 to 19 Year Olds | 370 (91.4%) | 35 (8.6%) |
| 20 to 24 Year Olds | 192 (71.6%) | 76 (28.4%) |
| 25 to 34 Year Olds | 90 (100.0%) | 0 (0.0%) |
| 35 Years and over | 79 (66.9%) | 39 (33.1%) |
| Total | 3,488 (86.0%) | 568 (14.0%) |
Educational Attainment by Field of Study in Humphreys County
Business (558 | 23.0%), education (395 | 16.3%), science & technology (318 | 13.1%), bio, nature & agricultural (201 | 8.3%), and arts & humanities (153 | 6.3%) are the most common fields of study among 2,424 individuals in Humphreys County who have obtained a bachelor's degree or higher.

| Field of Study | # Graduates | % Graduates |
| Computers & Mathematics | 67 | 2.8% |
| Bio, Nature & Agricultural | 201 | 8.3% |
| Physical & Health Sciences | 89 | 3.7% |
| Psychology | 72 | 3.0% |
| Social Sciences | 60 | 2.5% |
| Engineering | 139 | 5.7% |
| Multidisciplinary Studies | 13 | 0.5% |
| Science & Technology | 318 | 13.1% |
| Business | 558 | 23.0% |
| Education | 395 | 16.3% |
| Literature & Languages | 109 | 4.5% |
| Liberal Arts & History | 149 | 6.1% |
| Visual & Performing Arts | 66 | 2.7% |
| Communications | 35 | 1.4% |
| Arts & Humanities | 153 | 6.3% |
| Total | 2,424 | 100.0% |
Transportation & Commute in Humphreys County
Vehicle Availability by Sex in Humphreys County
The most prevalent vehicle ownership categories in Humphreys County are males with 2 vehicles (1,511, accounting for 36.6%) and females with 2 vehicles (963, making up 41.4%).
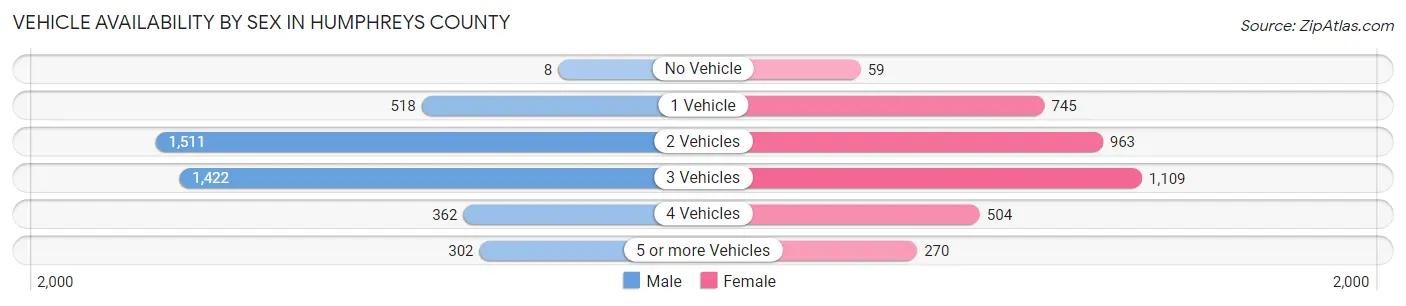
| Vehicles Available | Male | Female |
| No Vehicle | 8 (0.2%) | 59 (1.6%) |
| 1 Vehicle | 518 (12.6%) | 745 (20.4%) |
| 2 Vehicles | 1,511 (36.6%) | 963 (26.4%) |
| 3 Vehicles | 1,422 (34.5%) | 1,109 (30.4%) |
| 4 Vehicles | 362 (8.8%) | 504 (13.8%) |
| 5 or more Vehicles | 302 (7.3%) | 270 (7.4%) |
| Total | 4,123 (100.0%) | 3,650 (100.0%) |
Commute Time in Humphreys County
The most frequently occuring commute durations in Humphreys County are 5 to 9 minutes (1,025 commuters, 13.7%), 20 to 24 minutes (999 commuters, 13.3%), and 60 to 89 minutes (951 commuters, 12.7%).
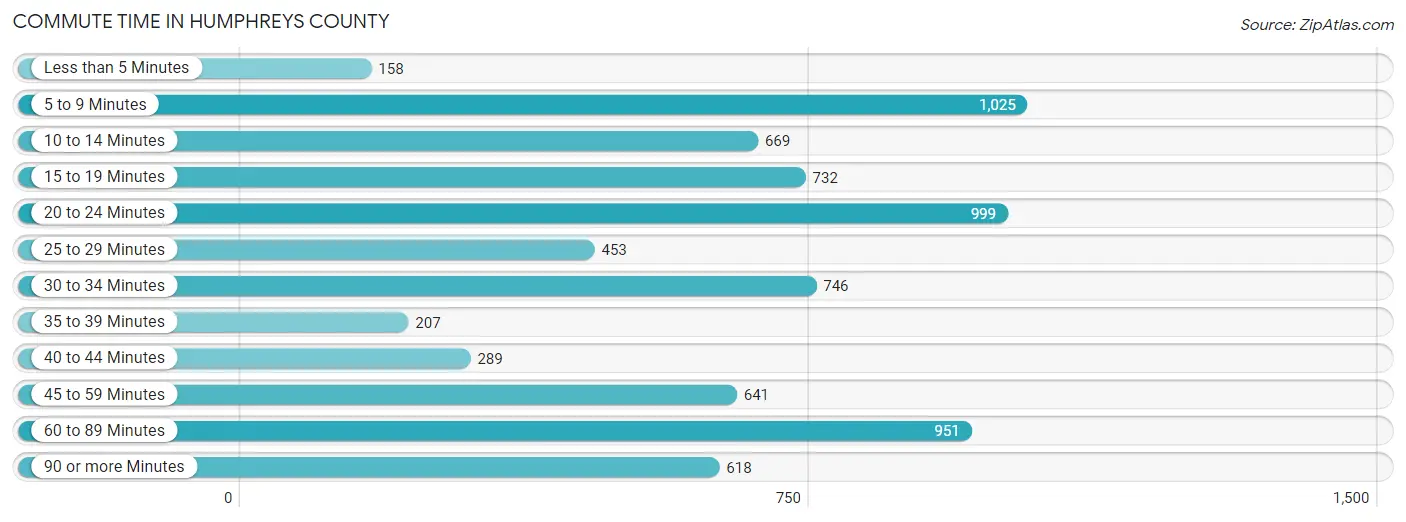
| Commute Time | # Commuters | % Commuters |
| Less than 5 Minutes | 158 | 2.1% |
| 5 to 9 Minutes | 1,025 | 13.7% |
| 10 to 14 Minutes | 669 | 8.9% |
| 15 to 19 Minutes | 732 | 9.8% |
| 20 to 24 Minutes | 999 | 13.3% |
| 25 to 29 Minutes | 453 | 6.0% |
| 30 to 34 Minutes | 746 | 10.0% |
| 35 to 39 Minutes | 207 | 2.8% |
| 40 to 44 Minutes | 289 | 3.9% |
| 45 to 59 Minutes | 641 | 8.6% |
| 60 to 89 Minutes | 951 | 12.7% |
| 90 or more Minutes | 618 | 8.3% |
Commute Time by Sex in Humphreys County
The most common commute times in Humphreys County are 60 to 89 minutes (705 commuters, 17.7%) for males and 20 to 24 minutes (620 commuters, 17.6%) for females.
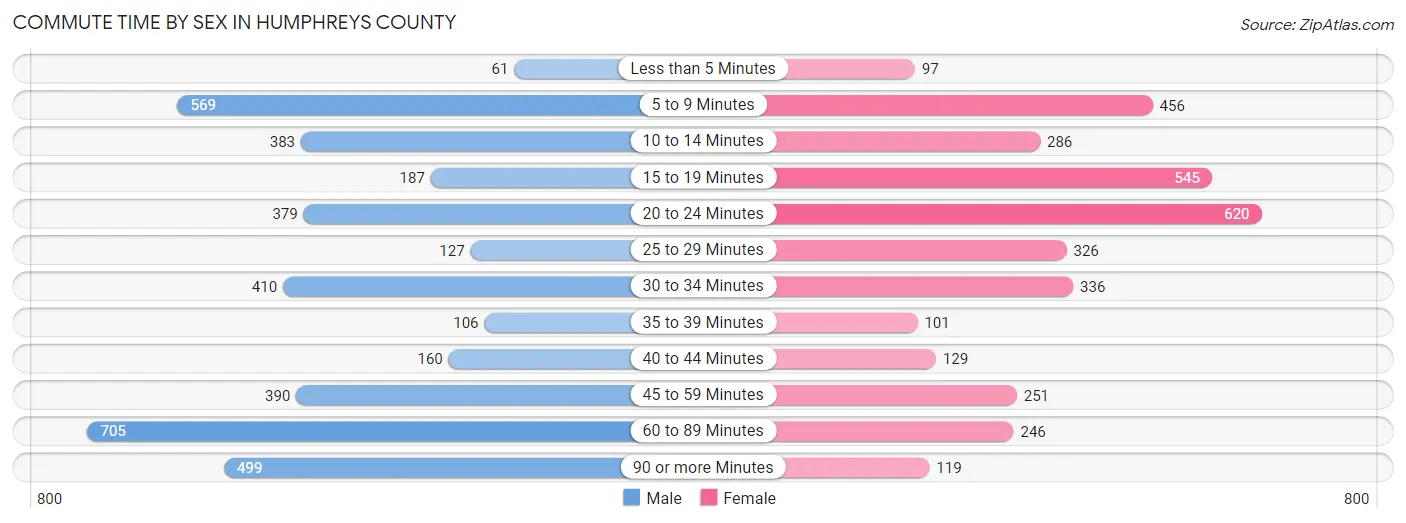
| Commute Time | Male | Female |
| Less than 5 Minutes | 61 (1.5%) | 97 (2.8%) |
| 5 to 9 Minutes | 569 (14.3%) | 456 (13.0%) |
| 10 to 14 Minutes | 383 (9.6%) | 286 (8.1%) |
| 15 to 19 Minutes | 187 (4.7%) | 545 (15.5%) |
| 20 to 24 Minutes | 379 (9.5%) | 620 (17.6%) |
| 25 to 29 Minutes | 127 (3.2%) | 326 (9.3%) |
| 30 to 34 Minutes | 410 (10.3%) | 336 (9.6%) |
| 35 to 39 Minutes | 106 (2.7%) | 101 (2.9%) |
| 40 to 44 Minutes | 160 (4.0%) | 129 (3.7%) |
| 45 to 59 Minutes | 390 (9.8%) | 251 (7.1%) |
| 60 to 89 Minutes | 705 (17.7%) | 246 (7.0%) |
| 90 or more Minutes | 499 (12.6%) | 119 (3.4%) |
Time of Departure to Work by Sex in Humphreys County
The most frequent times of departure to work in Humphreys County are 5:00 AM to 5:29 AM (571, 14.4%) for males and 7:30 AM to 7:59 AM (726, 20.7%) for females.
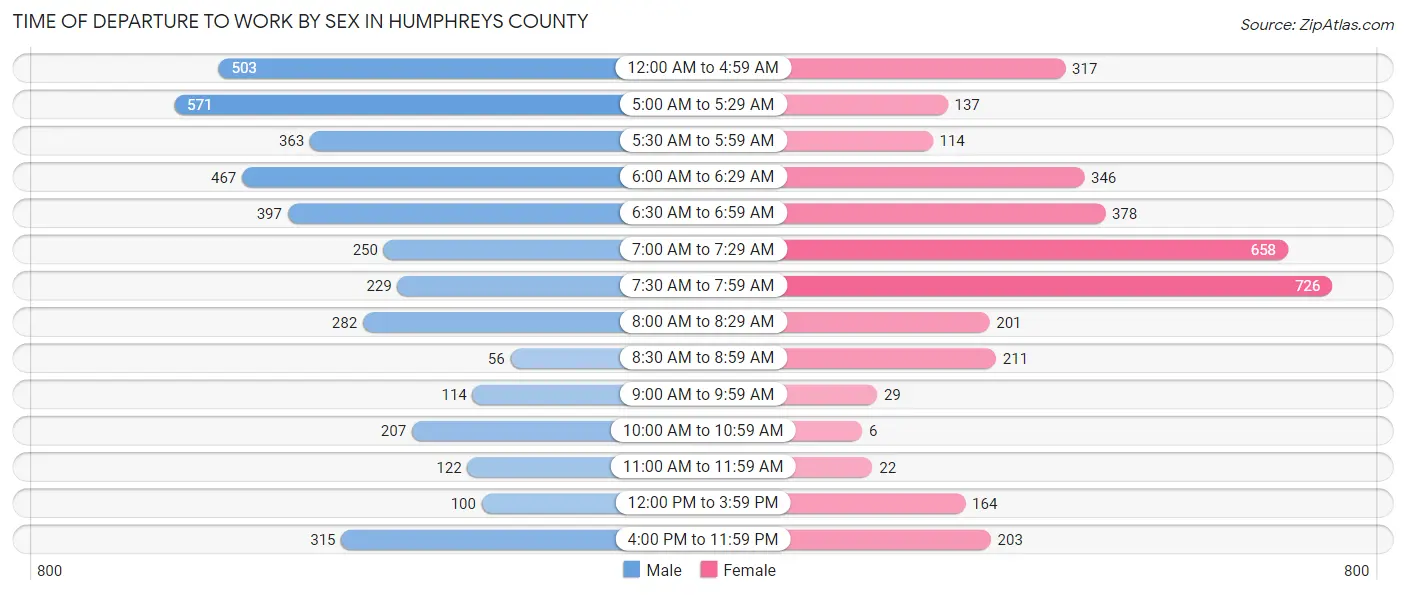
| Time of Departure | Male | Female |
| 12:00 AM to 4:59 AM | 503 (12.7%) | 317 (9.0%) |
| 5:00 AM to 5:29 AM | 571 (14.4%) | 137 (3.9%) |
| 5:30 AM to 5:59 AM | 363 (9.1%) | 114 (3.3%) |
| 6:00 AM to 6:29 AM | 467 (11.7%) | 346 (9.9%) |
| 6:30 AM to 6:59 AM | 397 (10.0%) | 378 (10.8%) |
| 7:00 AM to 7:29 AM | 250 (6.3%) | 658 (18.7%) |
| 7:30 AM to 7:59 AM | 229 (5.8%) | 726 (20.7%) |
| 8:00 AM to 8:29 AM | 282 (7.1%) | 201 (5.7%) |
| 8:30 AM to 8:59 AM | 56 (1.4%) | 211 (6.0%) |
| 9:00 AM to 9:59 AM | 114 (2.9%) | 29 (0.8%) |
| 10:00 AM to 10:59 AM | 207 (5.2%) | 6 (0.2%) |
| 11:00 AM to 11:59 AM | 122 (3.1%) | 22 (0.6%) |
| 12:00 PM to 3:59 PM | 100 (2.5%) | 164 (4.7%) |
| 4:00 PM to 11:59 PM | 315 (7.9%) | 203 (5.8%) |
| Total | 3,976 (100.0%) | 3,512 (100.0%) |
Housing Occupancy in Humphreys County
Occupancy by Ownership in Humphreys County
Of the total 6,715 dwellings in Humphreys County, owner-occupied units account for 5,318 (79.2%), while renter-occupied units make up 1,397 (20.8%).
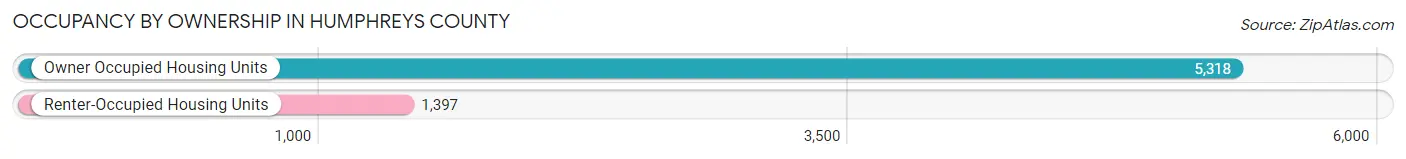
| Occupancy | # Housing Units | % Housing Units |
| Owner Occupied Housing Units | 5,318 | 79.2% |
| Renter-Occupied Housing Units | 1,397 | 20.8% |
| Total Occupied Housing Units | 6,715 | 100.0% |
Occupancy by Household Size in Humphreys County
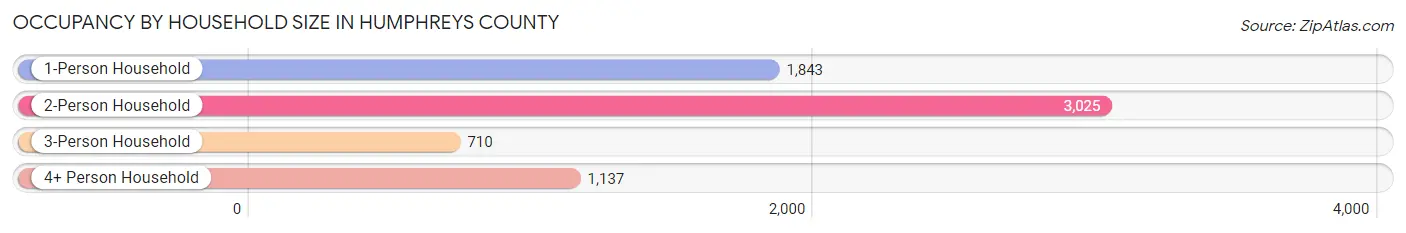
| Household Size | # Housing Units | % Housing Units |
| 1-Person Household | 1,843 | 27.5% |
| 2-Person Household | 3,025 | 45.1% |
| 3-Person Household | 710 | 10.6% |
| 4+ Person Household | 1,137 | 16.9% |
| Total Housing Units | 6,715 | 100.0% |
Occupancy by Ownership by Household Size in Humphreys County
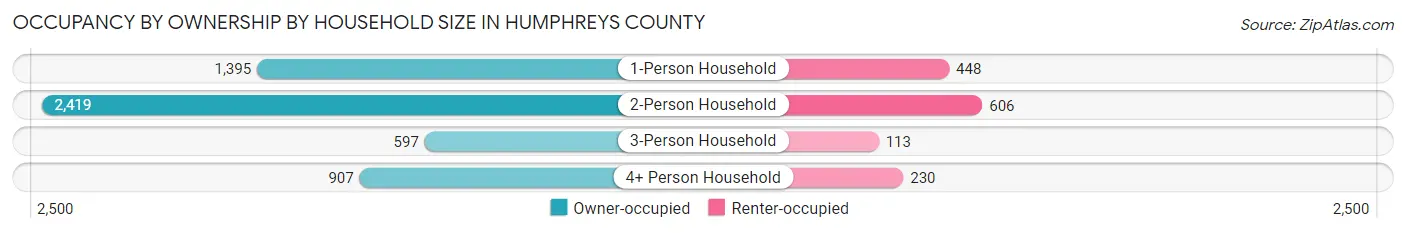
| Household Size | Owner-occupied | Renter-occupied |
| 1-Person Household | 1,395 (75.7%) | 448 (24.3%) |
| 2-Person Household | 2,419 (80.0%) | 606 (20.0%) |
| 3-Person Household | 597 (84.1%) | 113 (15.9%) |
| 4+ Person Household | 907 (79.8%) | 230 (20.2%) |
| Total Housing Units | 5,318 (79.2%) | 1,397 (20.8%) |
Occupancy by Educational Attainment in Humphreys County

| Household Size | Owner-occupied | Renter-occupied |
| Less than High School | 481 (63.3%) | 279 (36.7%) |
| High School Diploma | 2,292 (83.4%) | 457 (16.6%) |
| College/Associate Degree | 1,457 (73.9%) | 514 (26.1%) |
| Bachelor's Degree or higher | 1,088 (88.1%) | 147 (11.9%) |
Occupancy by Age of Householder in Humphreys County
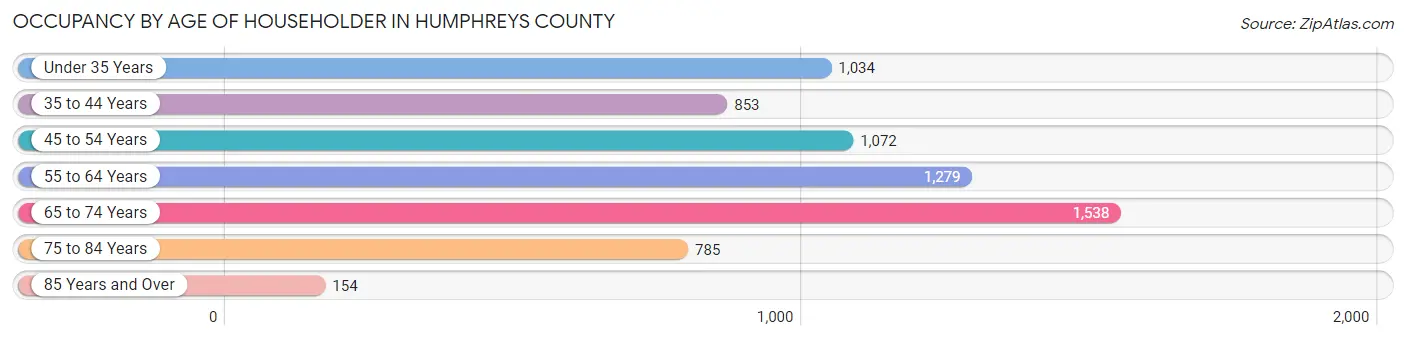
| Age Bracket | # Households | % Households |
| Under 35 Years | 1,034 | 15.4% |
| 35 to 44 Years | 853 | 12.7% |
| 45 to 54 Years | 1,072 | 16.0% |
| 55 to 64 Years | 1,279 | 19.1% |
| 65 to 74 Years | 1,538 | 22.9% |
| 75 to 84 Years | 785 | 11.7% |
| 85 Years and Over | 154 | 2.3% |
| Total | 6,715 | 100.0% |
Housing Finances in Humphreys County
Median Income by Occupancy in Humphreys County
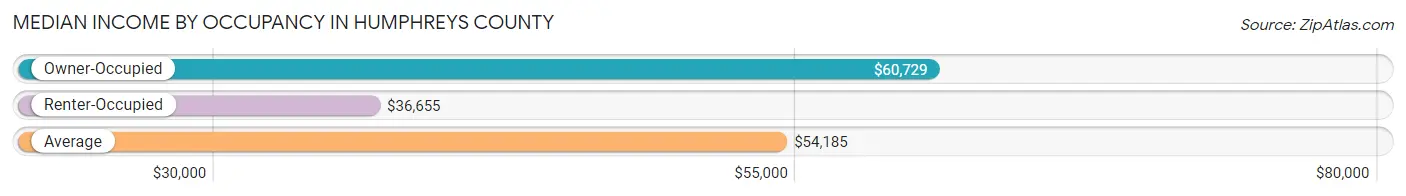
| Occupancy Type | # Households | Median Income |
| Owner-Occupied | 5,318 (79.2%) | $60,729 |
| Renter-Occupied | 1,397 (20.8%) | $36,655 |
| Average | 6,715 (100.0%) | $54,185 |
Occupancy by Householder Income Bracket in Humphreys County
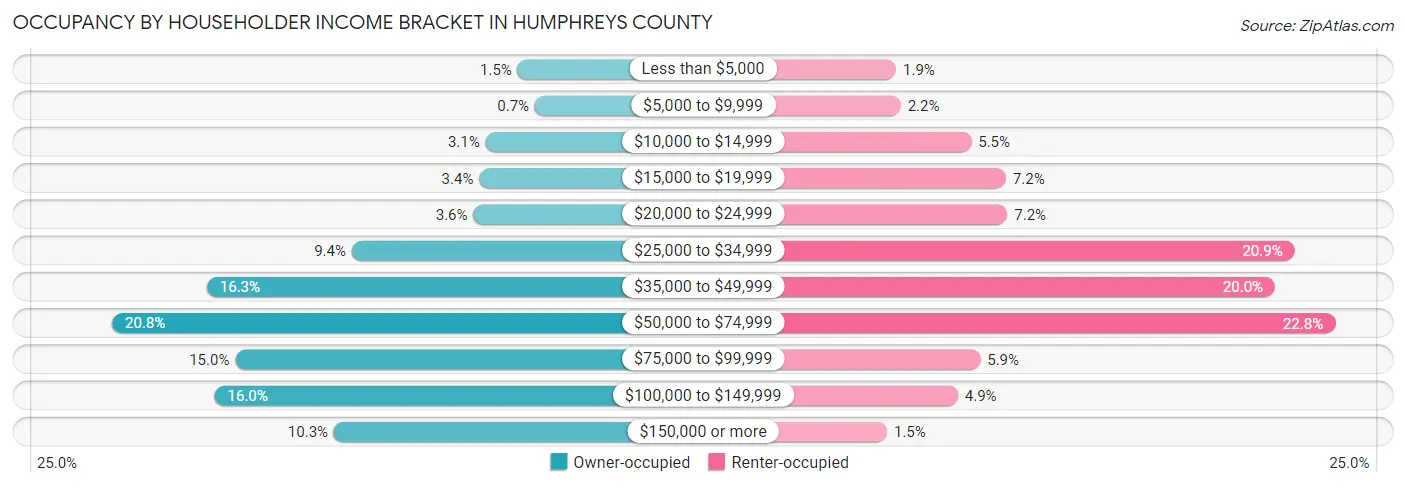
| Income Bracket | Owner-occupied | Renter-occupied |
| Less than $5,000 | 81 (1.5%) | 27 (1.9%) |
| $5,000 to $9,999 | 37 (0.7%) | 30 (2.1%) |
| $10,000 to $14,999 | 162 (3.0%) | 77 (5.5%) |
| $15,000 to $19,999 | 178 (3.4%) | 100 (7.2%) |
| $20,000 to $24,999 | 193 (3.6%) | 101 (7.2%) |
| $25,000 to $34,999 | 501 (9.4%) | 292 (20.9%) |
| $35,000 to $49,999 | 868 (16.3%) | 279 (20.0%) |
| $50,000 to $74,999 | 1,108 (20.8%) | 319 (22.8%) |
| $75,000 to $99,999 | 796 (15.0%) | 83 (5.9%) |
| $100,000 to $149,999 | 848 (16.0%) | 68 (4.9%) |
| $150,000 or more | 546 (10.3%) | 21 (1.5%) |
| Total | 5,318 (100.0%) | 1,397 (100.0%) |
Monthly Housing Cost Tiers in Humphreys County
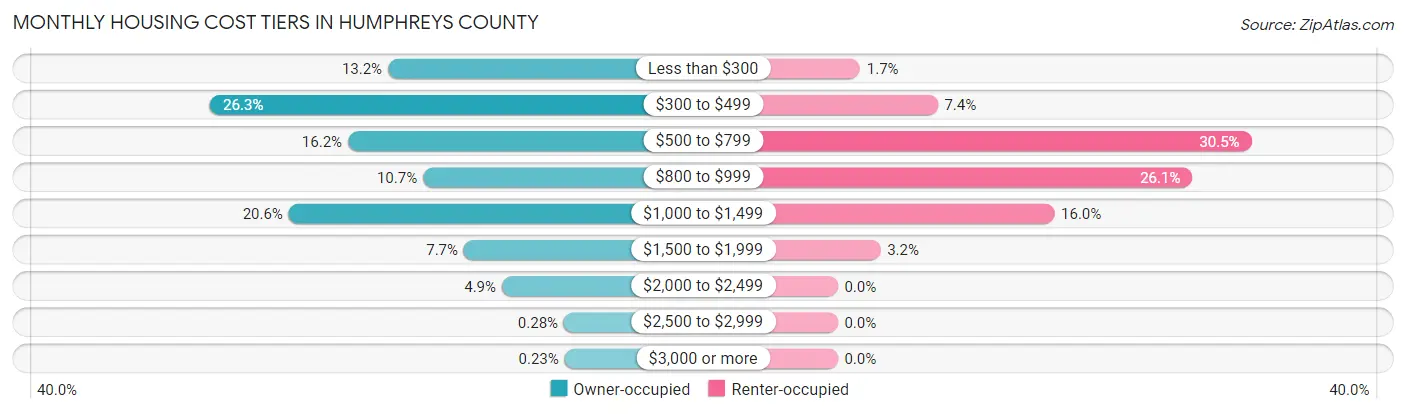
| Monthly Cost | Owner-occupied | Renter-occupied |
| Less than $300 | 704 (13.2%) | 23 (1.7%) |
| $300 to $499 | 1,401 (26.3%) | 103 (7.4%) |
| $500 to $799 | 861 (16.2%) | 426 (30.5%) |
| $800 to $999 | 567 (10.7%) | 365 (26.1%) |
| $1,000 to $1,499 | 1,093 (20.5%) | 223 (16.0%) |
| $1,500 to $1,999 | 407 (7.6%) | 44 (3.2%) |
| $2,000 to $2,499 | 258 (4.9%) | 0 (0.0%) |
| $2,500 to $2,999 | 15 (0.3%) | 0 (0.0%) |
| $3,000 or more | 12 (0.2%) | 0 (0.0%) |
| Total | 5,318 (100.0%) | 1,397 (100.0%) |
Physical Housing Characteristics in Humphreys County
Housing Structures in Humphreys County
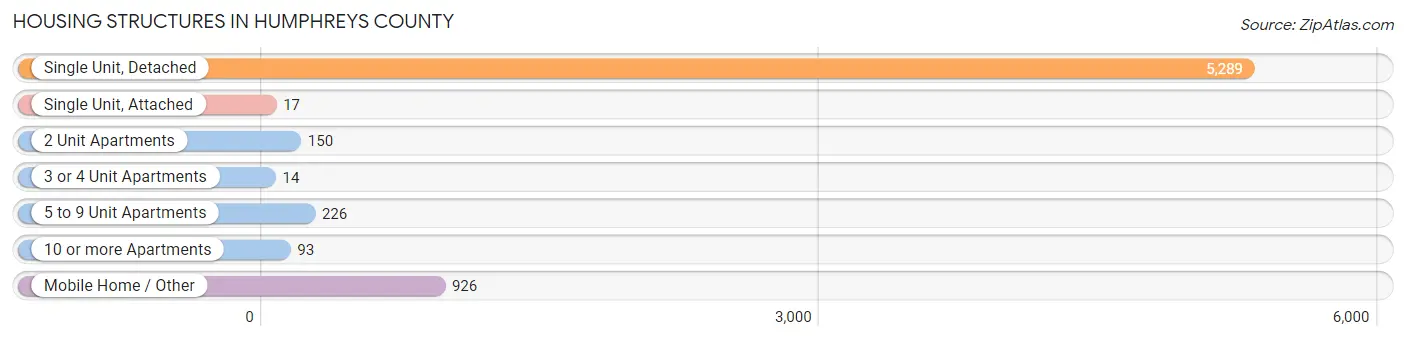
| Structure Type | # Housing Units | % Housing Units |
| Single Unit, Detached | 5,289 | 78.8% |
| Single Unit, Attached | 17 | 0.3% |
| 2 Unit Apartments | 150 | 2.2% |
| 3 or 4 Unit Apartments | 14 | 0.2% |
| 5 to 9 Unit Apartments | 226 | 3.4% |
| 10 or more Apartments | 93 | 1.4% |
| Mobile Home / Other | 926 | 13.8% |
| Total | 6,715 | 100.0% |
Housing Structures by Occupancy in Humphreys County

| Structure Type | Owner-occupied | Renter-occupied |
| Single Unit, Detached | 4,703 (88.9%) | 586 (11.1%) |
| Single Unit, Attached | 14 (82.4%) | 3 (17.6%) |
| 2 Unit Apartments | 27 (18.0%) | 123 (82.0%) |
| 3 or 4 Unit Apartments | 0 (0.0%) | 14 (100.0%) |
| 5 to 9 Unit Apartments | 5 (2.2%) | 221 (97.8%) |
| 10 or more Apartments | 0 (0.0%) | 93 (100.0%) |
| Mobile Home / Other | 569 (61.5%) | 357 (38.6%) |
| Total | 5,318 (79.2%) | 1,397 (20.8%) |
Housing Structures by Number of Rooms in Humphreys County
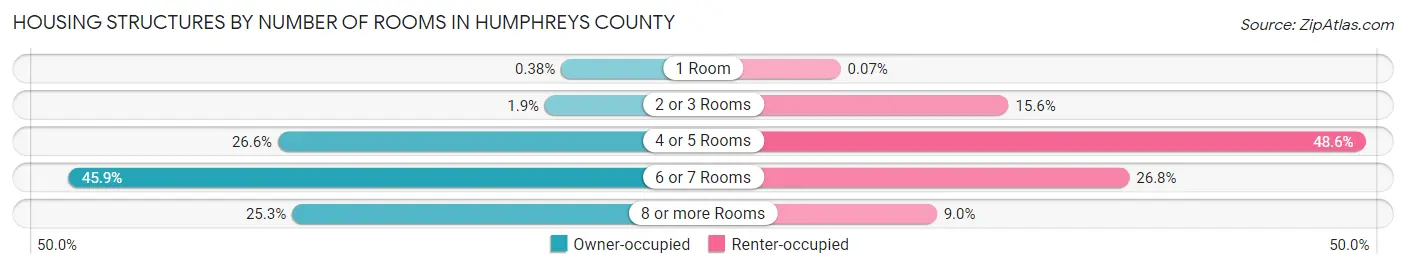
| Number of Rooms | Owner-occupied | Renter-occupied |
| 1 Room | 20 (0.4%) | 1 (0.1%) |
| 2 or 3 Rooms | 100 (1.9%) | 218 (15.6%) |
| 4 or 5 Rooms | 1,413 (26.6%) | 679 (48.6%) |
| 6 or 7 Rooms | 2,441 (45.9%) | 374 (26.8%) |
| 8 or more Rooms | 1,344 (25.3%) | 125 (8.9%) |
| Total | 5,318 (100.0%) | 1,397 (100.0%) |
Housing Structure by Heating Type in Humphreys County

| Heating Type | Owner-occupied | Renter-occupied |
| Utility Gas | 2,956 (55.6%) | 472 (33.8%) |
| Bottled, Tank, or LP Gas | 160 (3.0%) | 1 (0.1%) |
| Electricity | 2,052 (38.6%) | 904 (64.7%) |
| Fuel Oil or Kerosene | 0 (0.0%) | 6 (0.4%) |
| Coal or Coke | 0 (0.0%) | 0 (0.0%) |
| All other Fuels | 142 (2.7%) | 14 (1.0%) |
| No Fuel Used | 8 (0.2%) | 0 (0.0%) |
| Total | 5,318 (100.0%) | 1,397 (100.0%) |
Household Vehicle Usage in Humphreys County
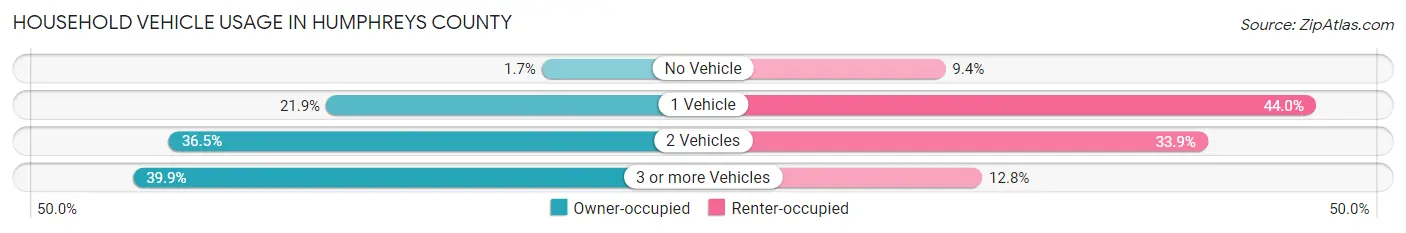
| Vehicles per Household | Owner-occupied | Renter-occupied |
| No Vehicle | 92 (1.7%) | 131 (9.4%) |
| 1 Vehicle | 1,163 (21.9%) | 614 (44.0%) |
| 2 Vehicles | 1,943 (36.5%) | 473 (33.9%) |
| 3 or more Vehicles | 2,120 (39.9%) | 179 (12.8%) |
| Total | 5,318 (100.0%) | 1,397 (100.0%) |
Real Estate & Mortgages in Humphreys County
Real Estate and Mortgage Overview in Humphreys County
| Characteristic | Without Mortgage | With Mortgage |
| Housing Units | 2,885 | 2,433 |
| Median Property Value | $158,700 | $191,300 |
| Median Household Income | $51,740 | $338 |
| Monthly Housing Costs | $399 | $12 |
| Real Estate Taxes | $821 | $58 |
Property Value by Mortgage Status in Humphreys County

| Property Value | Without Mortgage | With Mortgage |
| Less than $50,000 | 433 (15.0%) | 40 (1.6%) |
| $50,000 to $99,999 | 515 (17.8%) | 256 (10.5%) |
| $100,000 to $299,999 | 1,488 (51.6%) | 1,563 (64.2%) |
| $300,000 to $499,999 | 261 (9.0%) | 459 (18.9%) |
| $500,000 to $749,999 | 91 (3.2%) | 105 (4.3%) |
| $750,000 to $999,999 | 58 (2.0%) | 5 (0.2%) |
| $1,000,000 or more | 39 (1.3%) | 5 (0.2%) |
| Total | 2,885 (100.0%) | 2,433 (100.0%) |
Household Income by Mortgage Status in Humphreys County
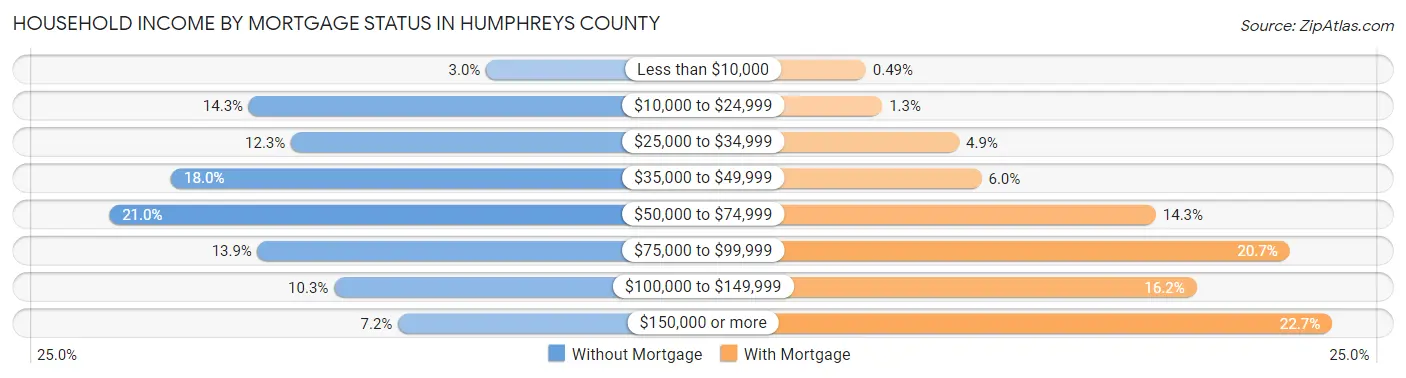
| Household Income | Without Mortgage | With Mortgage |
| Less than $10,000 | 87 (3.0%) | 12 (0.5%) |
| $10,000 to $24,999 | 413 (14.3%) | 31 (1.3%) |
| $25,000 to $34,999 | 355 (12.3%) | 120 (4.9%) |
| $35,000 to $49,999 | 520 (18.0%) | 146 (6.0%) |
| $50,000 to $74,999 | 605 (21.0%) | 348 (14.3%) |
| $75,000 to $99,999 | 401 (13.9%) | 503 (20.7%) |
| $100,000 to $149,999 | 296 (10.3%) | 395 (16.2%) |
| $150,000 or more | 208 (7.2%) | 552 (22.7%) |
| Total | 2,885 (100.0%) | 2,433 (100.0%) |
Property Value to Household Income Ratio in Humphreys County
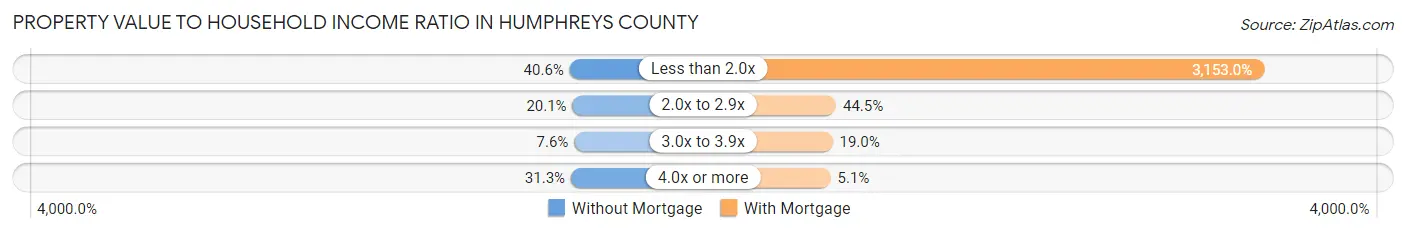
| Value-to-Income Ratio | Without Mortgage | With Mortgage |
| Less than 2.0x | 1,170 (40.6%) | 76,713 (3,153.0%) |
| 2.0x to 2.9x | 580 (20.1%) | 1,082 (44.5%) |
| 3.0x to 3.9x | 218 (7.6%) | 463 (19.0%) |
| 4.0x or more | 903 (31.3%) | 123 (5.1%) |
| Total | 2,885 (100.0%) | 2,433 (100.0%) |
Real Estate Taxes by Mortgage Status in Humphreys County
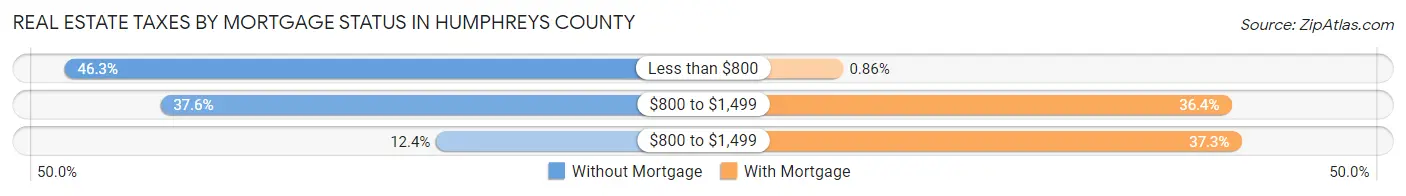
| Property Taxes | Without Mortgage | With Mortgage |
| Less than $800 | 1,337 (46.3%) | 21 (0.9%) |
| $800 to $1,499 | 1,085 (37.6%) | 885 (36.4%) |
| $800 to $1,499 | 358 (12.4%) | 907 (37.3%) |
| Total | 2,885 (100.0%) | 2,433 (100.0%) |
Health & Disability in Humphreys County
Health Insurance Coverage by Age in Humphreys County
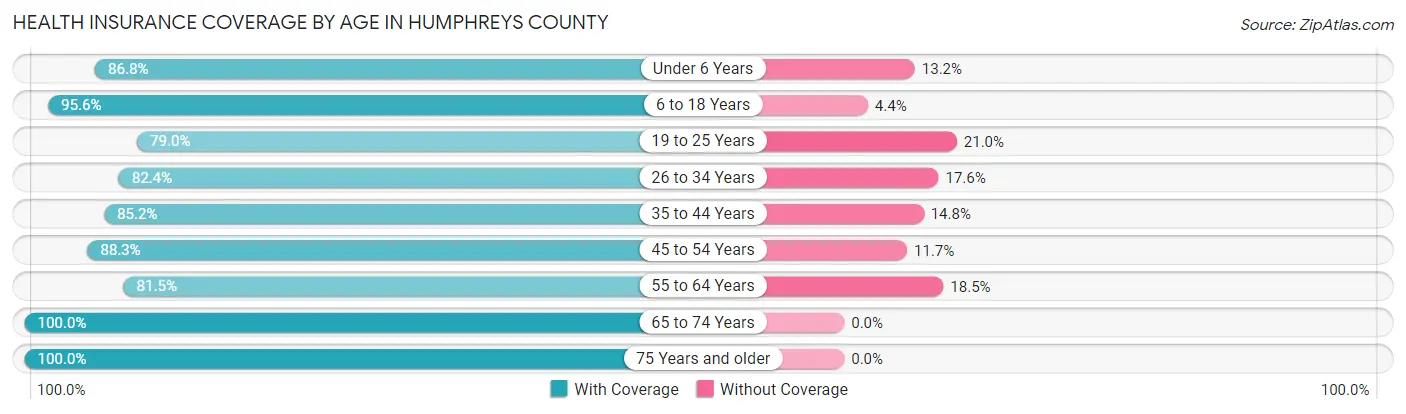
| Age Bracket | With Coverage | Without Coverage |
| Under 6 Years | 990 (86.8%) | 150 (13.2%) |
| 6 to 18 Years | 3,108 (95.6%) | 143 (4.4%) |
| 19 to 25 Years | 1,009 (79.0%) | 268 (21.0%) |
| 26 to 34 Years | 1,619 (82.4%) | 345 (17.6%) |
| 35 to 44 Years | 1,829 (85.2%) | 318 (14.8%) |
| 45 to 54 Years | 2,171 (88.3%) | 288 (11.7%) |
| 55 to 64 Years | 2,224 (81.5%) | 504 (18.5%) |
| 65 to 74 Years | 2,164 (100.0%) | 0 (0.0%) |
| 75 Years and older | 1,603 (100.0%) | 0 (0.0%) |
| Total | 16,717 (89.2%) | 2,016 (10.8%) |
Health Insurance Coverage by Citizenship Status in Humphreys County
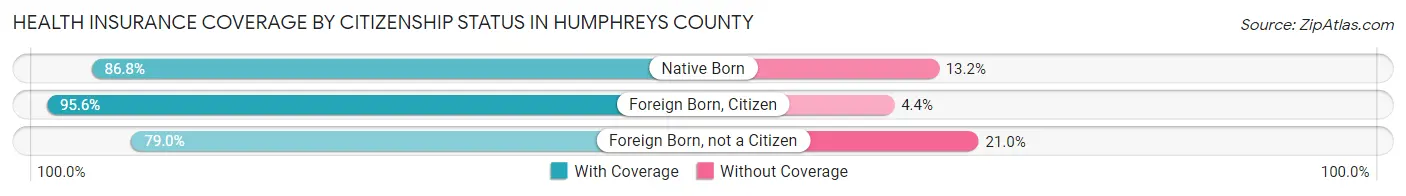
| Citizenship Status | With Coverage | Without Coverage |
| Native Born | 990 (86.8%) | 150 (13.2%) |
| Foreign Born, Citizen | 3,108 (95.6%) | 143 (4.4%) |
| Foreign Born, not a Citizen | 1,009 (79.0%) | 268 (21.0%) |
Health Insurance Coverage by Household Income in Humphreys County

| Household Income | With Coverage | Without Coverage |
| Under $25,000 | 1,897 (87.4%) | 273 (12.6%) |
| $25,000 to $49,999 | 3,995 (89.0%) | 493 (11.0%) |
| $50,000 to $74,999 | 3,247 (81.8%) | 724 (18.2%) |
| $75,000 to $99,999 | 2,370 (92.7%) | 187 (7.3%) |
| $100,000 and over | 5,165 (93.9%) | 336 (6.1%) |
Public vs Private Health Insurance Coverage by Age in Humphreys County
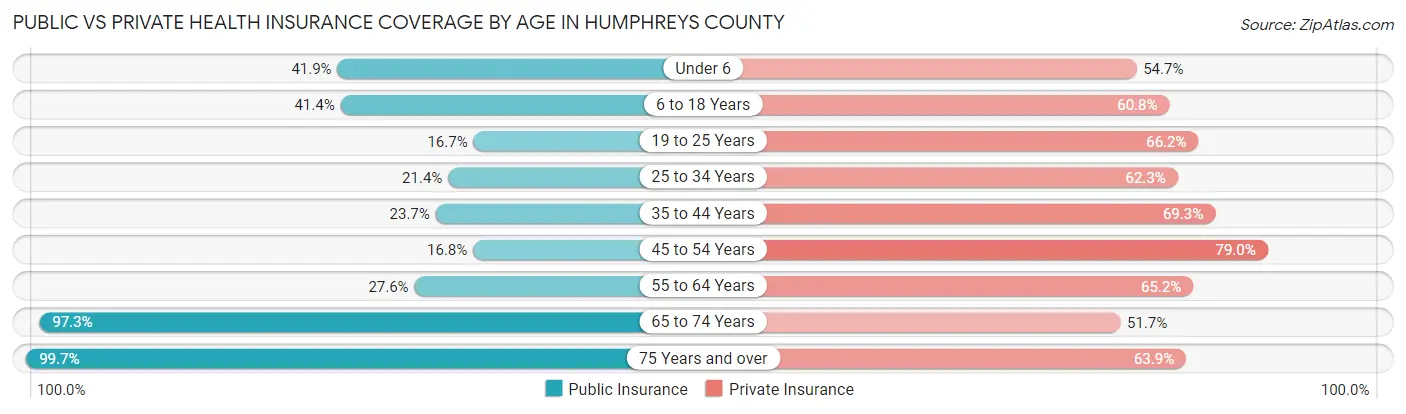
| Age Bracket | Public Insurance | Private Insurance |
| Under 6 | 478 (41.9%) | 623 (54.6%) |
| 6 to 18 Years | 1,345 (41.4%) | 1,976 (60.8%) |
| 19 to 25 Years | 213 (16.7%) | 845 (66.2%) |
| 25 to 34 Years | 420 (21.4%) | 1,224 (62.3%) |
| 35 to 44 Years | 509 (23.7%) | 1,487 (69.3%) |
| 45 to 54 Years | 412 (16.8%) | 1,943 (79.0%) |
| 55 to 64 Years | 754 (27.6%) | 1,779 (65.2%) |
| 65 to 74 Years | 2,105 (97.3%) | 1,118 (51.7%) |
| 75 Years and over | 1,598 (99.7%) | 1,024 (63.9%) |
| Total | 7,834 (41.8%) | 12,019 (64.2%) |
Disability Status by Sex by Age in Humphreys County
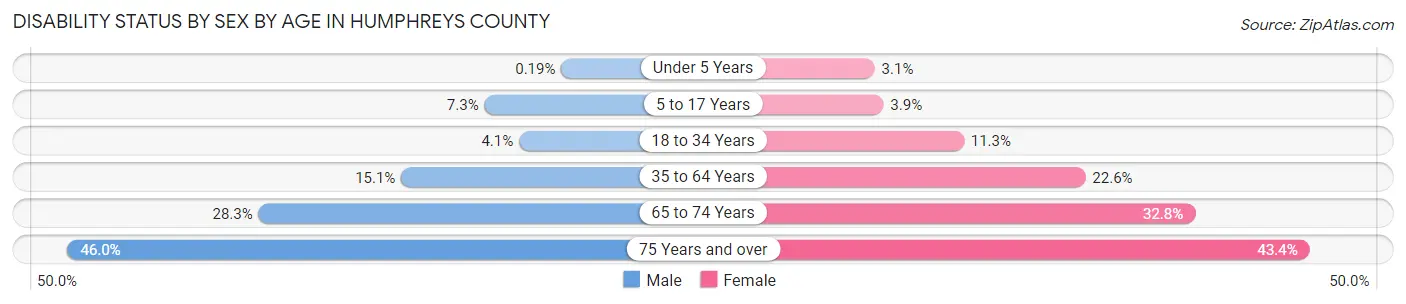
| Age Bracket | Male | Female |
| Under 5 Years | 1 (0.2%) | 13 (3.0%) |
| 5 to 17 Years | 125 (7.3%) | 56 (3.9%) |
| 18 to 34 Years | 74 (4.1%) | 195 (11.3%) |
| 35 to 64 Years | 532 (15.0%) | 859 (22.6%) |
| 65 to 74 Years | 305 (28.3%) | 356 (32.8%) |
| 75 Years and over | 301 (46.0%) | 412 (43.4%) |
Disability Class by Sex by Age in Humphreys County
Disability Class: Hearing Difficulty
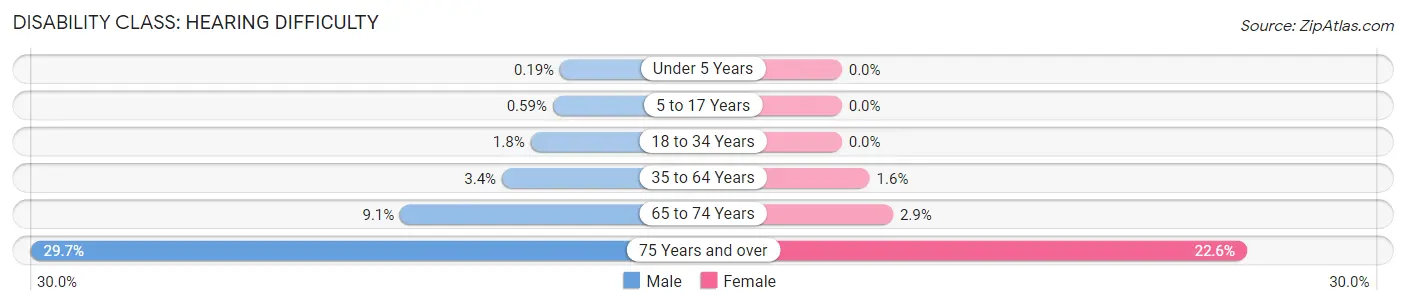
| Age Bracket | Male | Female |
| Under 5 Years | 1 (0.2%) | 0 (0.0%) |
| 5 to 17 Years | 10 (0.6%) | 0 (0.0%) |
| 18 to 34 Years | 33 (1.8%) | 0 (0.0%) |
| 35 to 64 Years | 121 (3.4%) | 59 (1.5%) |
| 65 to 74 Years | 98 (9.1%) | 31 (2.9%) |
| 75 Years and over | 194 (29.7%) | 214 (22.6%) |
Disability Class: Vision Difficulty
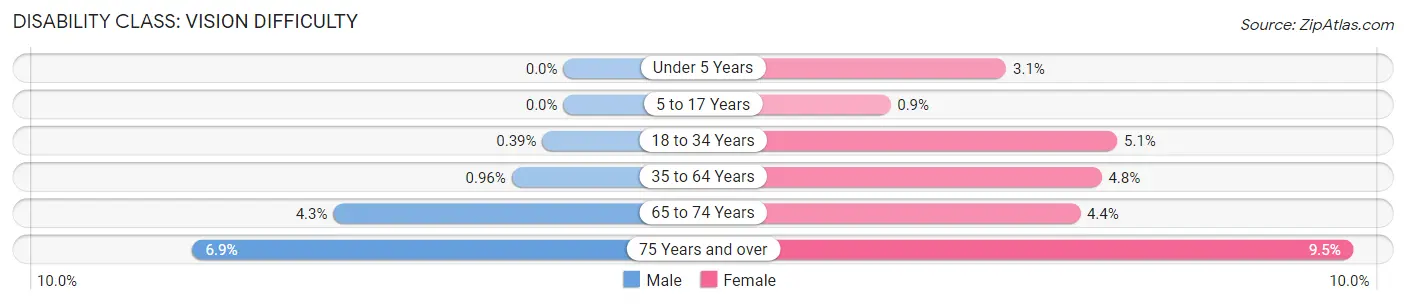
| Age Bracket | Male | Female |
| Under 5 Years | 0 (0.0%) | 13 (3.0%) |
| 5 to 17 Years | 0 (0.0%) | 13 (0.9%) |
| 18 to 34 Years | 7 (0.4%) | 88 (5.1%) |
| 35 to 64 Years | 34 (1.0%) | 183 (4.8%) |
| 65 to 74 Years | 46 (4.3%) | 48 (4.4%) |
| 75 Years and over | 45 (6.9%) | 90 (9.5%) |
Disability Class: Cognitive Difficulty
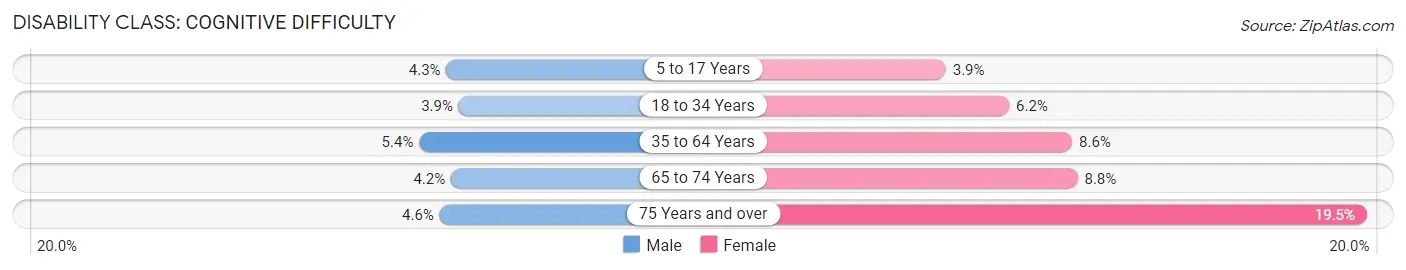
| Age Bracket | Male | Female |
| 5 to 17 Years | 74 (4.3%) | 56 (3.9%) |
| 18 to 34 Years | 70 (3.9%) | 107 (6.2%) |
| 35 to 64 Years | 189 (5.3%) | 325 (8.6%) |
| 65 to 74 Years | 45 (4.2%) | 95 (8.7%) |
| 75 Years and over | 30 (4.6%) | 185 (19.5%) |
Disability Class: Ambulatory Difficulty

| Age Bracket | Male | Female |
| 5 to 17 Years | 0 (0.0%) | 0 (0.0%) |
| 18 to 34 Years | 6 (0.3%) | 0 (0.0%) |
| 35 to 64 Years | 230 (6.5%) | 693 (18.2%) |
| 65 to 74 Years | 149 (13.8%) | 295 (27.2%) |
| 75 Years and over | 107 (16.4%) | 352 (37.1%) |
Disability Class: Self-Care Difficulty
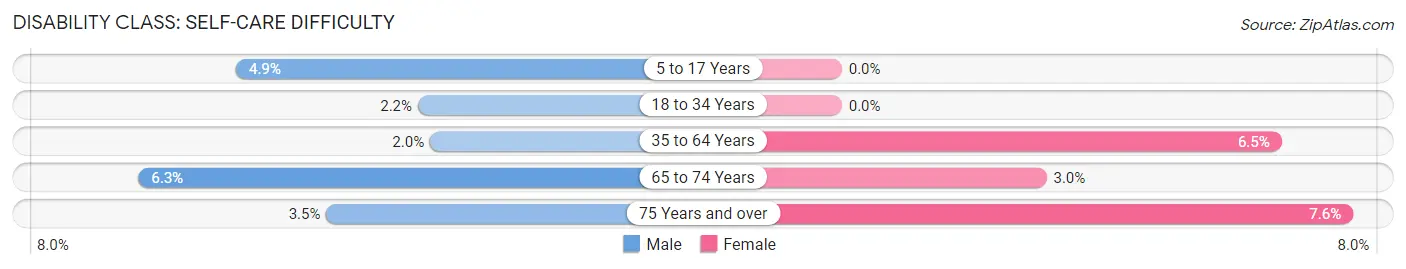
| Age Bracket | Male | Female |
| 5 to 17 Years | 83 (4.9%) | 0 (0.0%) |
| 18 to 34 Years | 39 (2.2%) | 0 (0.0%) |
| 35 to 64 Years | 70 (2.0%) | 248 (6.5%) |
| 65 to 74 Years | 68 (6.3%) | 33 (3.0%) |
| 75 Years and over | 23 (3.5%) | 72 (7.6%) |
Technology Access in Humphreys County
Computing Device Access in Humphreys County
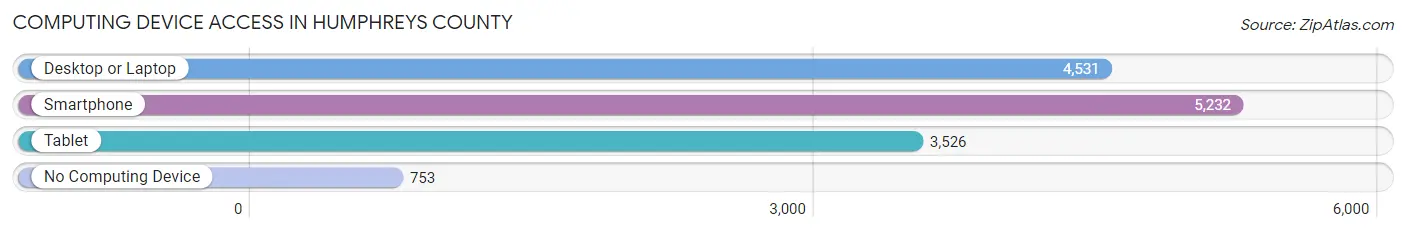
| Device Type | # Households | % Households |
| Desktop or Laptop | 4,531 | 67.5% |
| Smartphone | 5,232 | 77.9% |
| Tablet | 3,526 | 52.5% |
| No Computing Device | 753 | 11.2% |
| Total | 6,715 | 100.0% |
Internet Access in Humphreys County
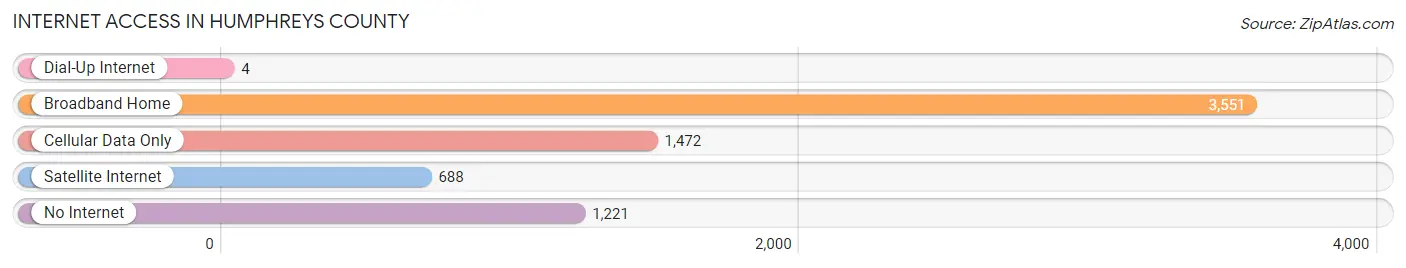
| Internet Type | # Households | % Households |
| Dial-Up Internet | 4 | 0.1% |
| Broadband Home | 3,551 | 52.9% |
| Cellular Data Only | 1,472 | 21.9% |
| Satellite Internet | 688 | 10.2% |
| No Internet | 1,221 | 18.2% |
| Total | 6,715 | 100.0% |
Humphreys County Summary
Humphreys County is located in the western part of the state of Tennessee, in the United States. It is bordered by Dickson, Houston, and Stewart counties to the north, Benton and Carroll counties to the east, Decatur County to the south, and Henry County to the west. The county seat is Waverly, and the largest city is Waverly. The county was created in 1809 and named for Andrew Jackson's brother-in-law, Major George Humphreys.
Geography
Humphreys County is located in the western part of Tennessee, in the United States. It is bordered by Dickson, Houston, and Stewart counties to the north, Benton and Carroll counties to the east, Decatur County to the south, and Henry County to the west. The county has a total area of 517 square miles, of which 514 square miles is land and 3 square miles (0.6%) is water. The county is located in the Central Basin of Tennessee, and is drained by the Tennessee River and its tributaries. The terrain is mostly rolling hills, with some flat areas in the western part of the county. The highest point in the county is located in the northwest corner, at an elevation of 830 feet above sea level.
Demographics
As of the 2010 United States Census, there were 18,538 people, 7,093 households, and 5,072 families residing in the county. The population density was 36.2 people per square mile. There were 8,093 housing units at an average density of 15.8 per square mile. The racial makeup of the county was 87.2% White, 9.7% Black or African American, 0.3% Native American, 0.3% Asian, 0.1% Pacific Islander, 1.2% from other races, and 1.3% from two or more races. 2.7% of the population were Hispanic or Latino of any race.
Economy
Humphreys County has a diverse economy, with a mix of agriculture, manufacturing, and services. The county is home to several large manufacturing companies, including Bridgestone, Nissan, and Tyson Foods. Agriculture is also an important part of the economy, with the county producing corn, soybeans, wheat, hay, and other crops. The county also has a thriving tourism industry, with several popular attractions, including the Humphreys County Museum, the Waverly Historic District, and the Tennessee River Museum.
The county's unemployment rate was 4.2% in 2019, lower than the state average of 4.5%. The median household income was $41,845 in 2019, lower than the state average of $50,845. The poverty rate was 19.2%, higher than the state average of 14.7%.
Conclusion
Humphreys County is located in the western part of Tennessee, in the United States. It is bordered by Dickson, Houston, and Stewart counties to the north, Benton and Carroll counties to the east, Decatur County to the south, and Henry County to the west. The county has a total area of 517 square miles, of which 514 square miles is land and 3 square miles (0.6%) is water. As of the 2010 United States Census, there were 18,538 people, 7,093 households, and 5,072 families residing in the county. The county has a diverse economy, with a mix of agriculture, manufacturing, and services. The county's unemployment rate was 4.2% in 2019, lower than the state average of 4.5%. The median household income was $41,845 in 2019, lower than the state average of $50,845. The poverty rate was 19.2%, higher than the state average of 14.7%.
Common Questions
What is the Total Population of Humphreys County?
Total Population of Humphreys County is 19,032.
What is the Total Male Population of Humphreys County?
Total Male Population of Humphreys County is 9,527.
What is the Total Female Population of Humphreys County?
Total Female Population of Humphreys County is 9,505.
What is the Ratio of Males per 100 Females in Humphreys County?
There are 100.23 Males per 100 Females in Humphreys County.
What is the Ratio of Females per 100 Males in Humphreys County?
There are 99.77 Females per 100 Males in Humphreys County.
What is the Median Population Age in Humphreys County?
Median Population Age in Humphreys County is 43.0 Years.
What is the Average Family Size in Humphreys County
Average Family Size in Humphreys County is 3.4 People.
What is the Average Household Size in Humphreys County
Average Household Size in Humphreys County is 2.8 People.
What is Per Capita Income in Humphreys County?
Per Capita income in Humphreys County is $29,561.
What is the Median Family Income in Humphreys County?
Median Family Income in Humphreys County is $69,817.
What is the Median Household income in Humphreys County?
Median Household Income in Humphreys County is $54,185.
What is Income or Wage Gap in Humphreys County?
Income or Wage Gap in Humphreys County is 41.3%.
Women in Humphreys County earn 58.7 cents for every dollar earned by a man.
What is Inequality or Gini Index in Humphreys County?
Inequality or Gini Index in Humphreys County is 0.42.
How Large is the Labor Force in Humphreys County?
There are 8,714 People in the Labor Forcein in Humphreys County.
What is the Percentage of People in the Labor Force in Humphreys County?
56.4% of People are in the Labor Force in Humphreys County.
What is the Unemployment Rate in Humphreys County?
Unemployment Rate in Humphreys County is 10.2%.