Houston County, TN
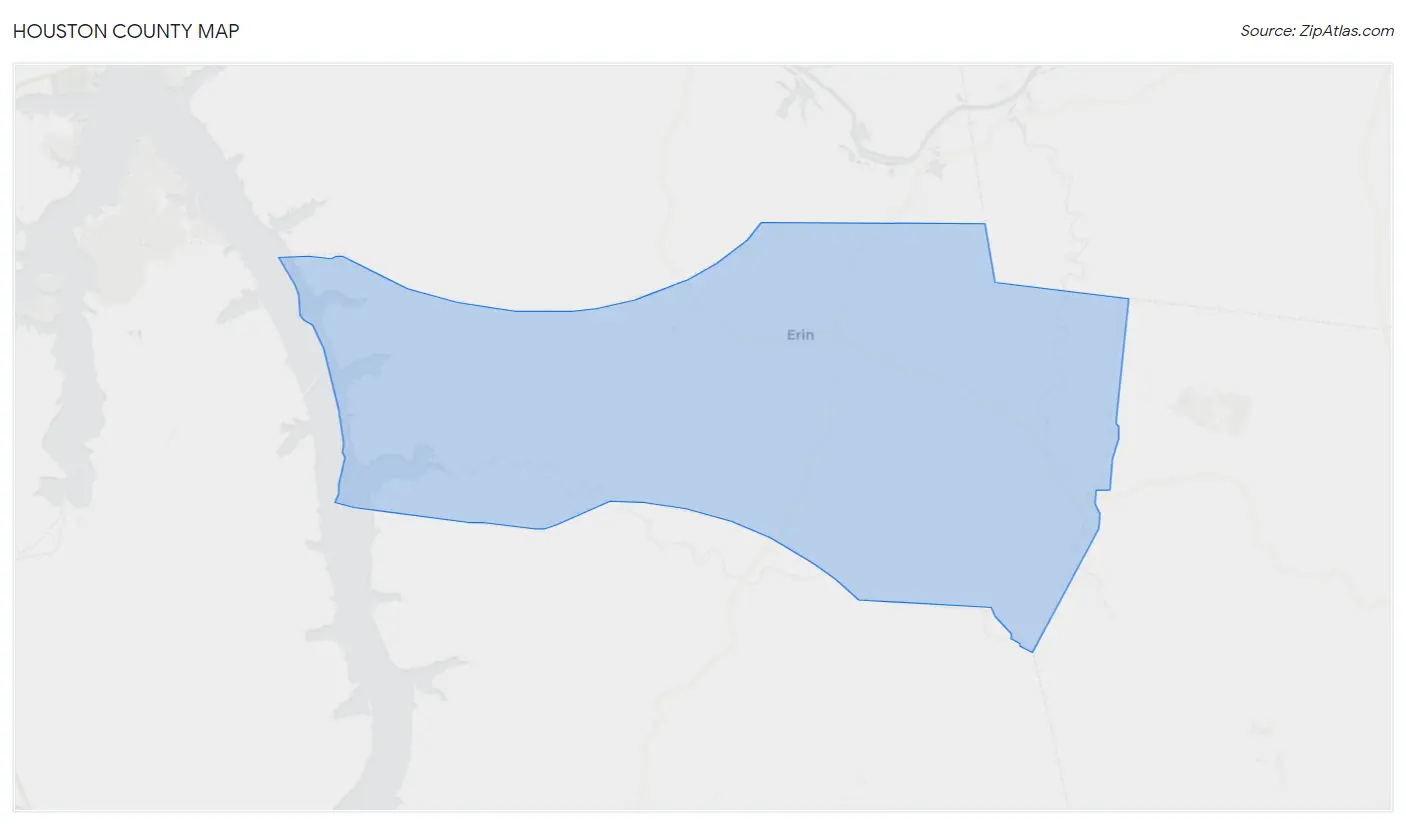
Houston County Map
Houston County Overview
8,253
TOTAL POPULATION
4,108
MALE POPULATION
4,145
FEMALE POPULATION
99.11
MALES / 100 FEMALES
100.90
FEMALES / 100 MALES
44.1
MEDIAN AGE
3.4
AVG FAMILY SIZE
2.7
AVG HOUSEHOLD SIZE
$27,053
PER CAPITA INCOME
$73,000
AVG FAMILY INCOME
$51,544
AVG HOUSEHOLD INCOME
35.8%
WAGE / INCOME GAP [ % ]
64.2¢/ $1
WAGE / INCOME GAP [ $ ]
$8,747
FAMILY INCOME DEFICIT
0.43
INEQUALITY / GINI INDEX
3,448
LABOR FORCE [ PEOPLE ]
50.9%
PERCENT IN LABOR FORCE
4.2%
UNEMPLOYMENT RATE
Houston County Area Codes
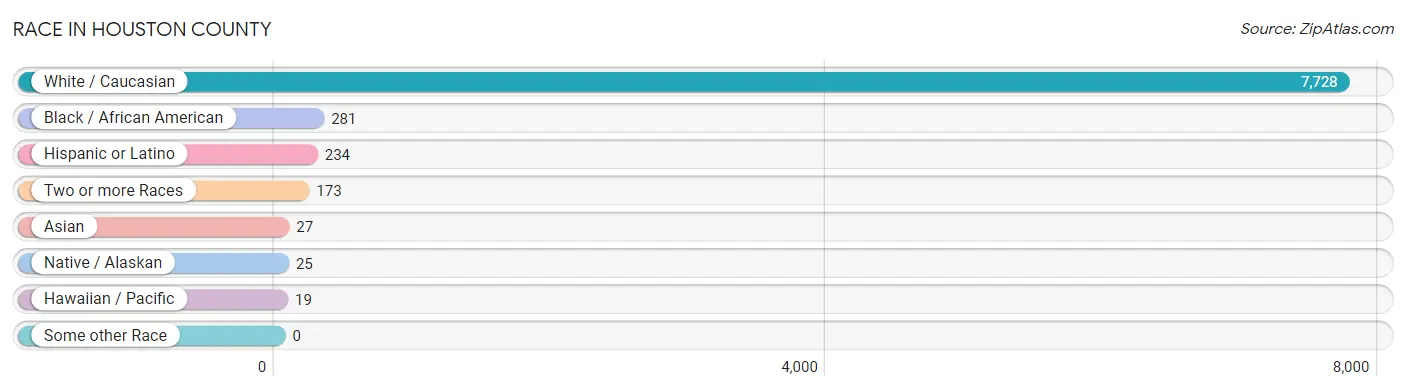
Race in Houston County
The most populous races in Houston County are White / Caucasian (7,728 | 93.6%), Black / African American (281 | 3.4%), and Hispanic or Latino (234 | 2.8%).
| Race | # Population | % Population |
| Asian | 27 | 0.3% |
| Black / African American | 281 | 3.4% |
| Hawaiian / Pacific | 19 | 0.2% |
| Hispanic or Latino | 234 | 2.8% |
| Native / Alaskan | 25 | 0.3% |
| White / Caucasian | 7,728 | 93.6% |
| Two or more Races | 173 | 2.1% |
| Some other Race | 0 | 0.0% |
| Total | 8,253 | 100.0% |
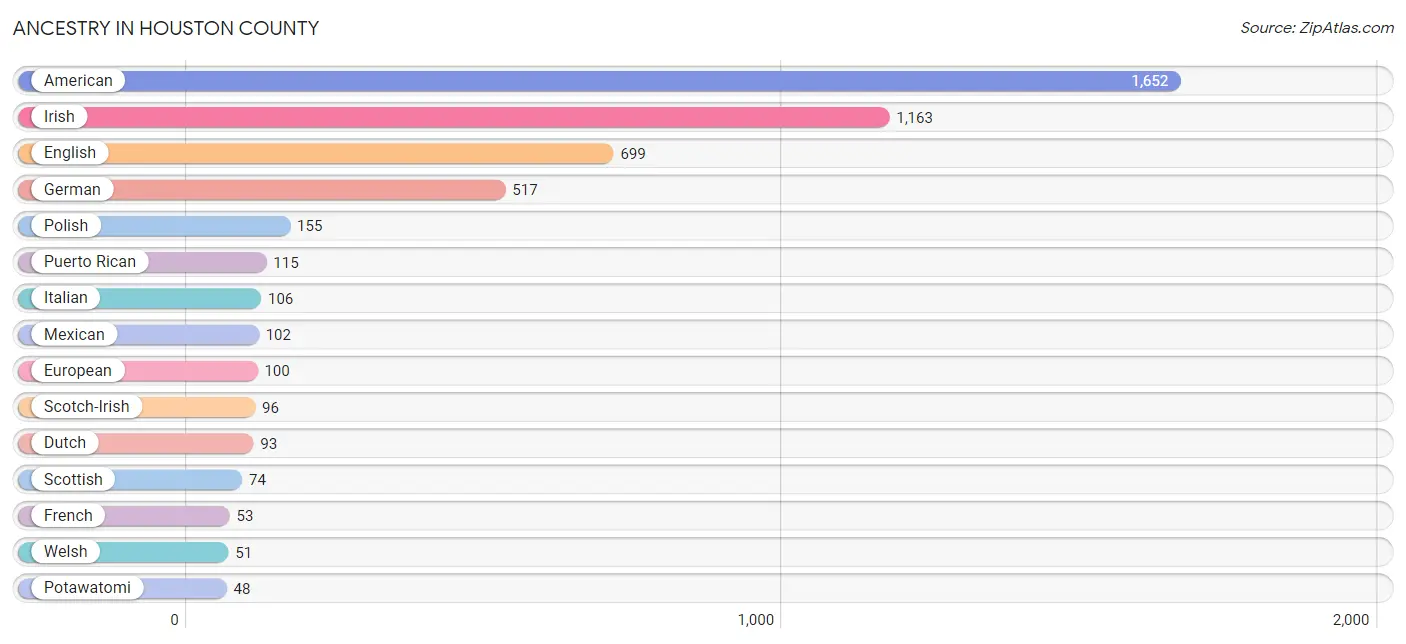
Ancestry in Houston County
The most populous ancestries reported in Houston County are American (1,652 | 20.0%), Irish (1,163 | 14.1%), English (699 | 8.5%), German (517 | 6.3%), and Polish (155 | 1.9%), together accounting for 50.7% of all Houston County residents.
| Ancestry | # Population | % Population |
| African | 42 | 0.5% |
| American | 1,652 | 20.0% |
| Arab | 7 | 0.1% |
| Bhutanese | 43 | 0.5% |
| British | 22 | 0.3% |
| Canadian | 13 | 0.2% |
| Central American | 2 | 0.0% |
| Cherokee | 25 | 0.3% |
| Comanche | 3 | 0.0% |
| Creek | 12 | 0.2% |
| Czech | 4 | 0.1% |
| Czechoslovakian | 5 | 0.1% |
| Danish | 4 | 0.1% |
| Dutch | 93 | 1.1% |
| English | 699 | 8.5% |
| European | 100 | 1.2% |
| French | 53 | 0.6% |
| German | 517 | 6.3% |
| Guamanian / Chamorro | 19 | 0.2% |
| Guatemalan | 2 | 0.0% |
| Haitian | 4 | 0.1% |
| Indian (Asian) | 27 | 0.3% |
| Irish | 1,163 | 14.1% |
| Italian | 106 | 1.3% |
| Lithuanian | 11 | 0.1% |
| Mexican | 102 | 1.2% |
| Northern European | 1 | 0.0% |
| Norwegian | 25 | 0.3% |
| Peruvian | 15 | 0.2% |
| Polish | 155 | 1.9% |
| Portuguese | 5 | 0.1% |
| Potawatomi | 48 | 0.6% |
| Puerto Rican | 115 | 1.4% |
| Romanian | 29 | 0.4% |
| Russian | 11 | 0.1% |
| Scotch-Irish | 96 | 1.2% |
| Scottish | 74 | 0.9% |
| South American | 15 | 0.2% |
| South American Indian | 15 | 0.2% |
| Subsaharan African | 42 | 0.5% |
| Swedish | 15 | 0.2% |
| Welsh | 51 | 0.6% | View All 42 Rows |
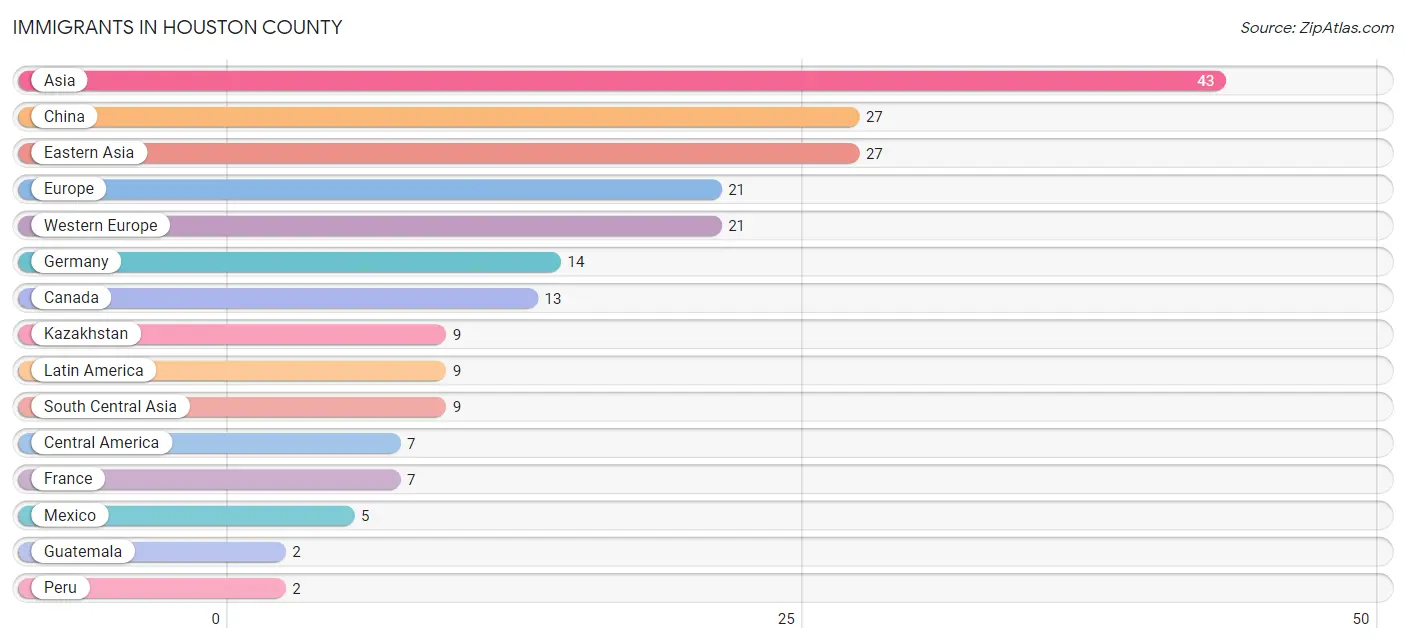
Immigrants in Houston County
The most numerous immigrant groups reported in Houston County came from Asia (43 | 0.5%), China (27 | 0.3%), Eastern Asia (27 | 0.3%), Europe (21 | 0.3%), and Western Europe (21 | 0.3%), together accounting for 1.7% of all Houston County residents.
| Immigration Origin | # Population | % Population |
| Asia | 43 | 0.5% |
| Canada | 13 | 0.2% |
| Central America | 7 | 0.1% |
| China | 27 | 0.3% |
| Eastern Asia | 27 | 0.3% |
| Europe | 21 | 0.3% |
| France | 7 | 0.1% |
| Germany | 14 | 0.2% |
| Guatemala | 2 | 0.0% |
| Kazakhstan | 9 | 0.1% |
| Latin America | 9 | 0.1% |
| Mexico | 5 | 0.1% |
| Peru | 2 | 0.0% |
| South America | 2 | 0.0% |
| South Central Asia | 9 | 0.1% |
| Western Europe | 21 | 0.3% | View All 16 Rows |
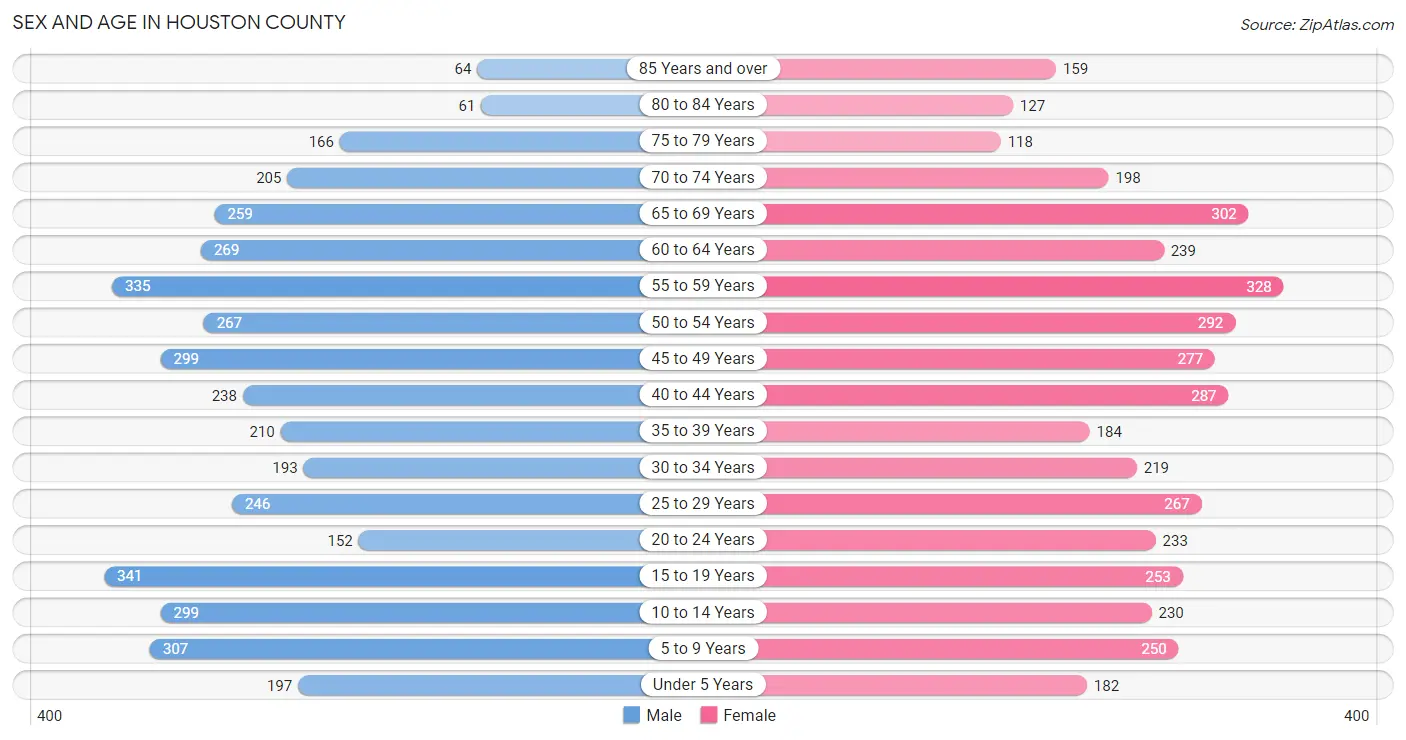
Sex and Age in Houston County
Sex and Age in Houston County
The most populous age groups in Houston County are 15 to 19 Years (341 | 8.3%) for men and 55 to 59 Years (328 | 7.9%) for women.
| Age Bracket | Male | Female |
| Under 5 Years | 197 (4.8%) | 182 (4.4%) |
| 5 to 9 Years | 307 (7.5%) | 250 (6.0%) |
| 10 to 14 Years | 299 (7.3%) | 230 (5.6%) |
| 15 to 19 Years | 341 (8.3%) | 253 (6.1%) |
| 20 to 24 Years | 152 (3.7%) | 233 (5.6%) |
| 25 to 29 Years | 246 (6.0%) | 267 (6.4%) |
| 30 to 34 Years | 193 (4.7%) | 219 (5.3%) |
| 35 to 39 Years | 210 (5.1%) | 184 (4.4%) |
| 40 to 44 Years | 238 (5.8%) | 287 (6.9%) |
| 45 to 49 Years | 299 (7.3%) | 277 (6.7%) |
| 50 to 54 Years | 267 (6.5%) | 292 (7.0%) |
| 55 to 59 Years | 335 (8.2%) | 328 (7.9%) |
| 60 to 64 Years | 269 (6.6%) | 239 (5.8%) |
| 65 to 69 Years | 259 (6.3%) | 302 (7.3%) |
| 70 to 74 Years | 205 (5.0%) | 198 (4.8%) |
| 75 to 79 Years | 166 (4.0%) | 118 (2.9%) |
| 80 to 84 Years | 61 (1.5%) | 127 (3.1%) |
| 85 Years and over | 64 (1.6%) | 159 (3.8%) |
| Total | 4,108 (100.0%) | 4,145 (100.0%) |
Families and Households in Houston County
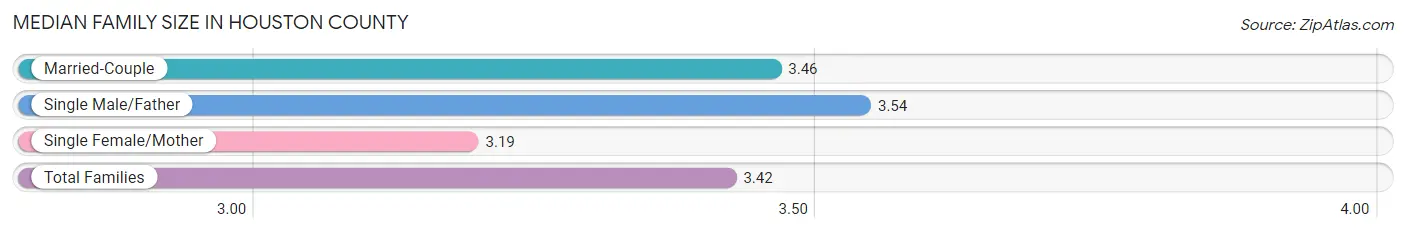
Median Family Size in Houston County
The median family size in Houston County is 3.42 persons per family, with single male/father families (145 | 7.8%) accounting for the largest median family size of 3.54 persons per family. On the other hand, single female/mother families (305 | 16.4%) represent the smallest median family size with 3.19 persons per family.
| Family Type | # Families | Family Size |
| Married-Couple | 1,412 (75.8%) | 3.46 |
| Single Male/Father | 145 (7.8%) | 3.54 |
| Single Female/Mother | 305 (16.4%) | 3.19 |
| Total Families | 1,862 (100.0%) | 3.42 |
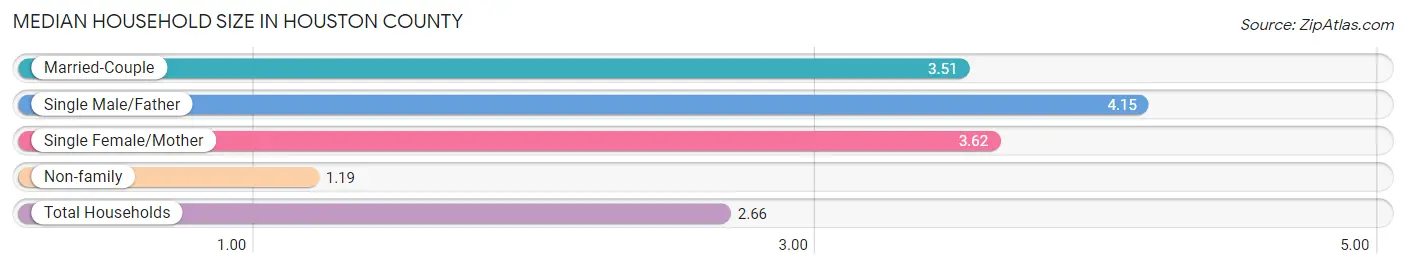
Median Household Size in Houston County
The median household size in Houston County is 2.66 persons per household, with single male/father households (145 | 4.8%) accounting for the largest median household size of 4.15 persons per household. non-family households (1,164 | 38.5%) represent the smallest median household size with 1.19 persons per household.
| Household Type | # Households | Household Size |
| Married-Couple | 1,412 (46.7%) | 3.51 |
| Single Male/Father | 145 (4.8%) | 4.15 |
| Single Female/Mother | 305 (10.1%) | 3.62 |
| Non-family | 1,164 (38.5%) | 1.19 |
| Total Households | 3,026 (100.0%) | 2.66 |
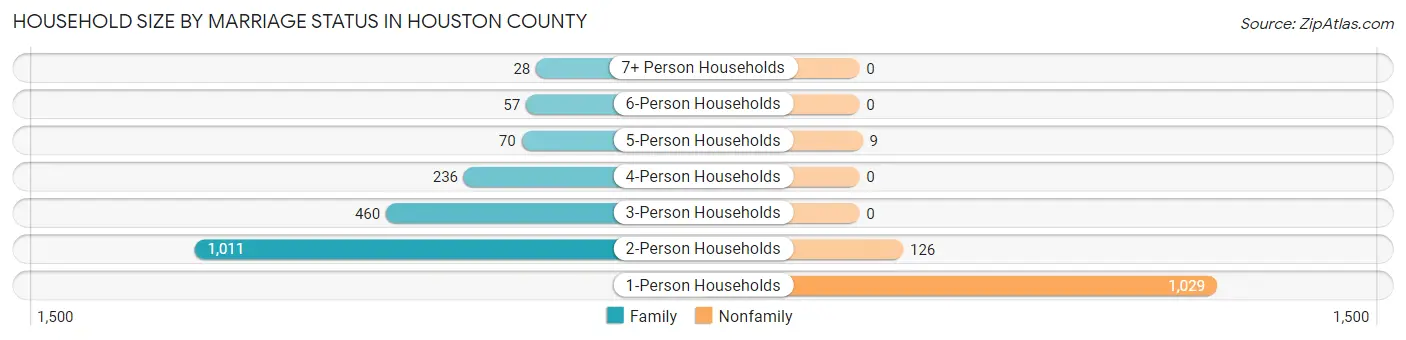
Household Size by Marriage Status in Houston County
Out of a total of 3,026 households in Houston County, 1,862 (61.5%) are family households, while 1,164 (38.5%) are nonfamily households. The most numerous type of family households are 2-person households, comprising 1,011, and the most common type of nonfamily households are 1-person households, comprising 1,029.
| Household Size | Family Households | Nonfamily Households |
| 1-Person Households | - | 1,029 (34.0%) |
| 2-Person Households | 1,011 (33.4%) | 126 (4.2%) |
| 3-Person Households | 460 (15.2%) | 0 (0.0%) |
| 4-Person Households | 236 (7.8%) | 0 (0.0%) |
| 5-Person Households | 70 (2.3%) | 9 (0.3%) |
| 6-Person Households | 57 (1.9%) | 0 (0.0%) |
| 7+ Person Households | 28 (0.9%) | 0 (0.0%) |
| Total | 1,862 (61.5%) | 1,164 (38.5%) |
Female Fertility in Houston County
Fertility by Age in Houston County
Average fertility rate in Houston County is 52.0 births per 1,000 women. Women in the age bracket of 35 to 50 years have the highest fertility rate with 59.0 births per 1,000 women. Women in the age bracket of 35 to 50 years acount for 52.1% of all women with births.
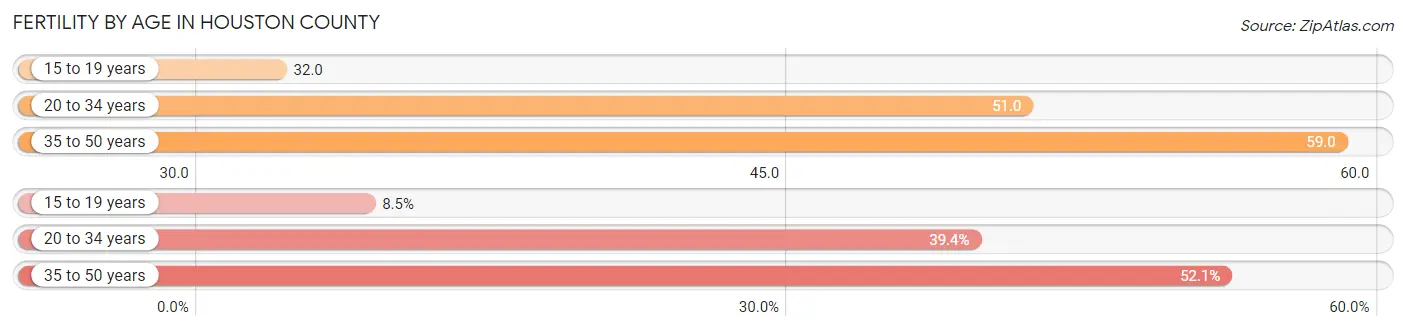
| Age Bracket | Women with Births | Births / 1,000 Women |
| 15 to 19 years | 8 (8.5%) | 32.0 |
| 20 to 34 years | 37 (39.4%) | 51.0 |
| 35 to 50 years | 49 (52.1%) | 59.0 |
| Total | 94 (100.0%) | 52.0 |
Fertility by Age by Marriage Status in Houston County
58.5% of women with births (94) in Houston County are married. The highest percentage of unmarried women with births falls into 15 to 19 years age bracket with 100.0% of them unmarried at the time of birth, while the lowest percentage of unmarried women with births belong to 35 to 50 years age bracket with 0.0% of them unmarried.
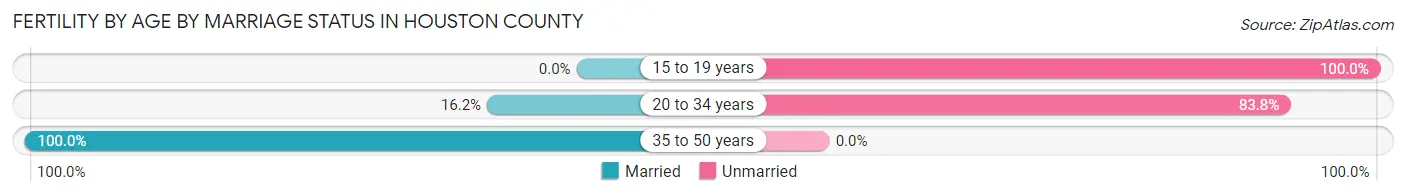
| Age Bracket | Married | Unmarried |
| 15 to 19 years | 0 (0.0%) | 8 (100.0%) |
| 20 to 34 years | 6 (16.2%) | 31 (83.8%) |
| 35 to 50 years | 49 (100.0%) | 0 (0.0%) |
| Total | 55 (58.5%) | 39 (41.5%) |
Fertility by Education in Houston County
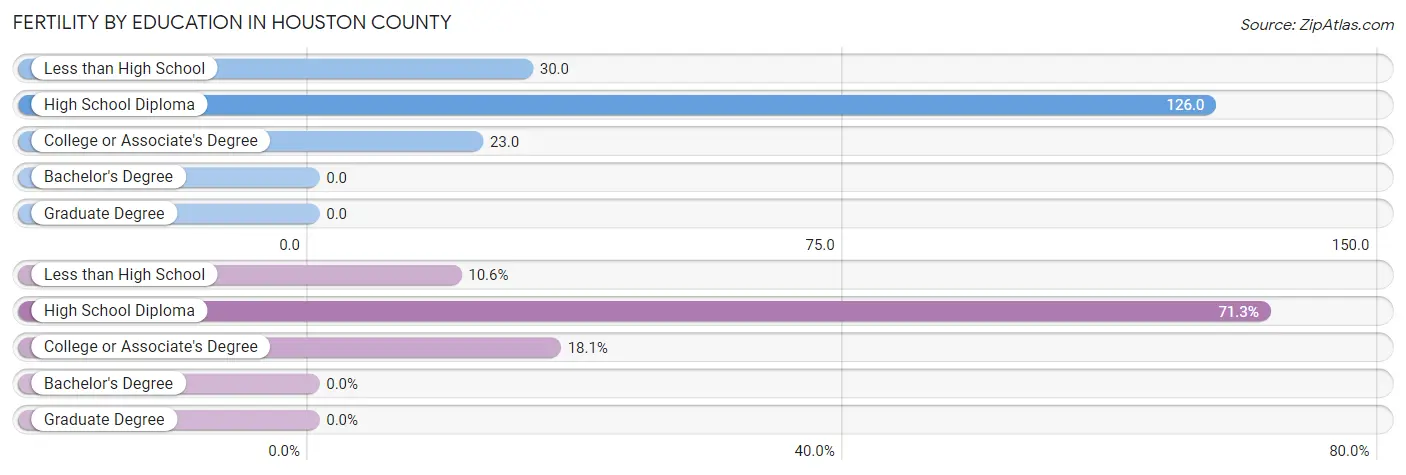
| Educational Attainment | Women with Births | Births / 1,000 Women |
| Less than High School | 10 (10.6%) | 30.0 |
| High School Diploma | 67 (71.3%) | 126.0 |
| College or Associate's Degree | 17 (18.1%) | 23.0 |
| Bachelor's Degree | 0 (0.0%) | 0.0 |
| Graduate Degree | 0 (0.0%) | 0.0 |
| Total | 94 (100.0%) | 52.0 |
Fertility by Education by Marriage Status in Houston County
41.5% of women with births in Houston County are unmarried. Women with the educational attainment of college or associate's degree are most likely to be married with 100.0% of them married at childbirth, while women with the educational attainment of less than high school are least likely to be married with 100.0% of them unmarried at childbirth.
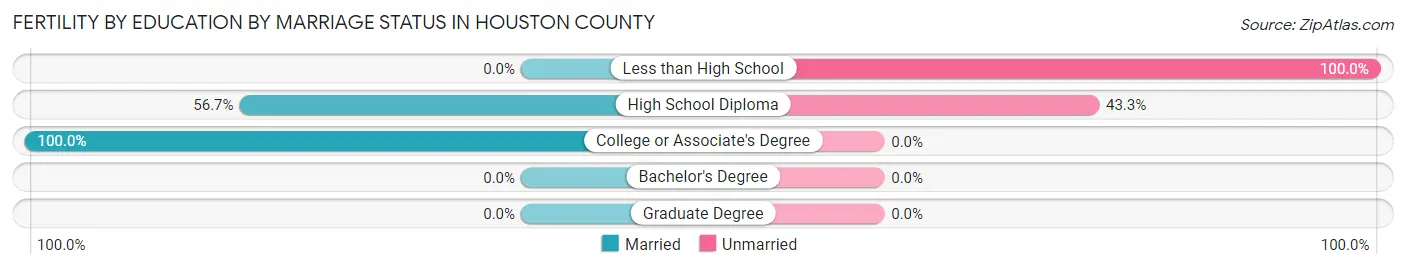
| Educational Attainment | Married | Unmarried |
| Less than High School | 0 (0.0%) | 10 (100.0%) |
| High School Diploma | 38 (56.7%) | 29 (43.3%) |
| College or Associate's Degree | 17 (100.0%) | 0 (0.0%) |
| Bachelor's Degree | 0 (0.0%) | 0 (0.0%) |
| Graduate Degree | 0 (0.0%) | 0 (0.0%) |
| Total | 55 (58.5%) | 39 (41.5%) |
Income in Houston County
Income Overview in Houston County
Per Capita Income in Houston County is $27,053, while median incomes of families and households are $73,000 and $51,544 respectively.
| Characteristic | Number | Measure |
| Per Capita Income | 8,253 | $27,053 |
| Median Family Income | 1,862 | $73,000 |
| Mean Family Income | 1,862 | $81,574 |
| Median Household Income | 3,026 | $51,544 |
| Mean Household Income | 3,026 | $63,800 |
| Income Deficit | 1,862 | $8,747 |
| Wage / Income Gap (%) | 8,253 | 35.82% |
| Wage / Income Gap ($) | 8,253 | 64.18¢ per $1 |
| Gini / Inequality Index | 8,253 | 0.43 |
Earnings by Sex in Houston County
Average Earnings in Houston County are $31,923, $42,286 for men and $27,139 for women, a difference of 35.8%.
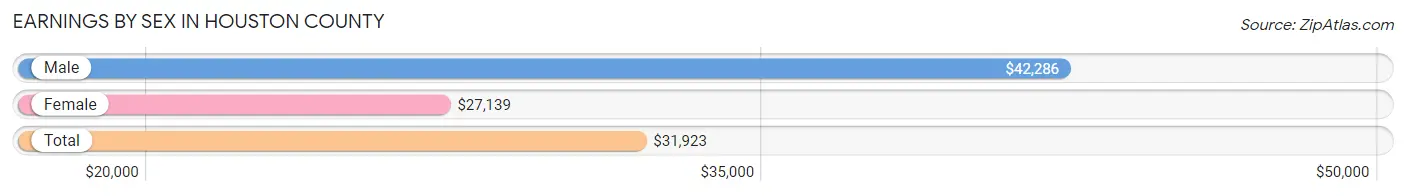
| Sex | Number | Average Earnings |
| Male | 1,848 (49.2%) | $42,286 |
| Female | 1,909 (50.8%) | $27,139 |
| Total | 3,757 (100.0%) | $31,923 |
Earnings by Sex by Income Bracket in Houston County
The most common earnings brackets in Houston County are $100,000+ for men (212 | 11.5%) and $2,499 or less for women (202 | 10.6%).
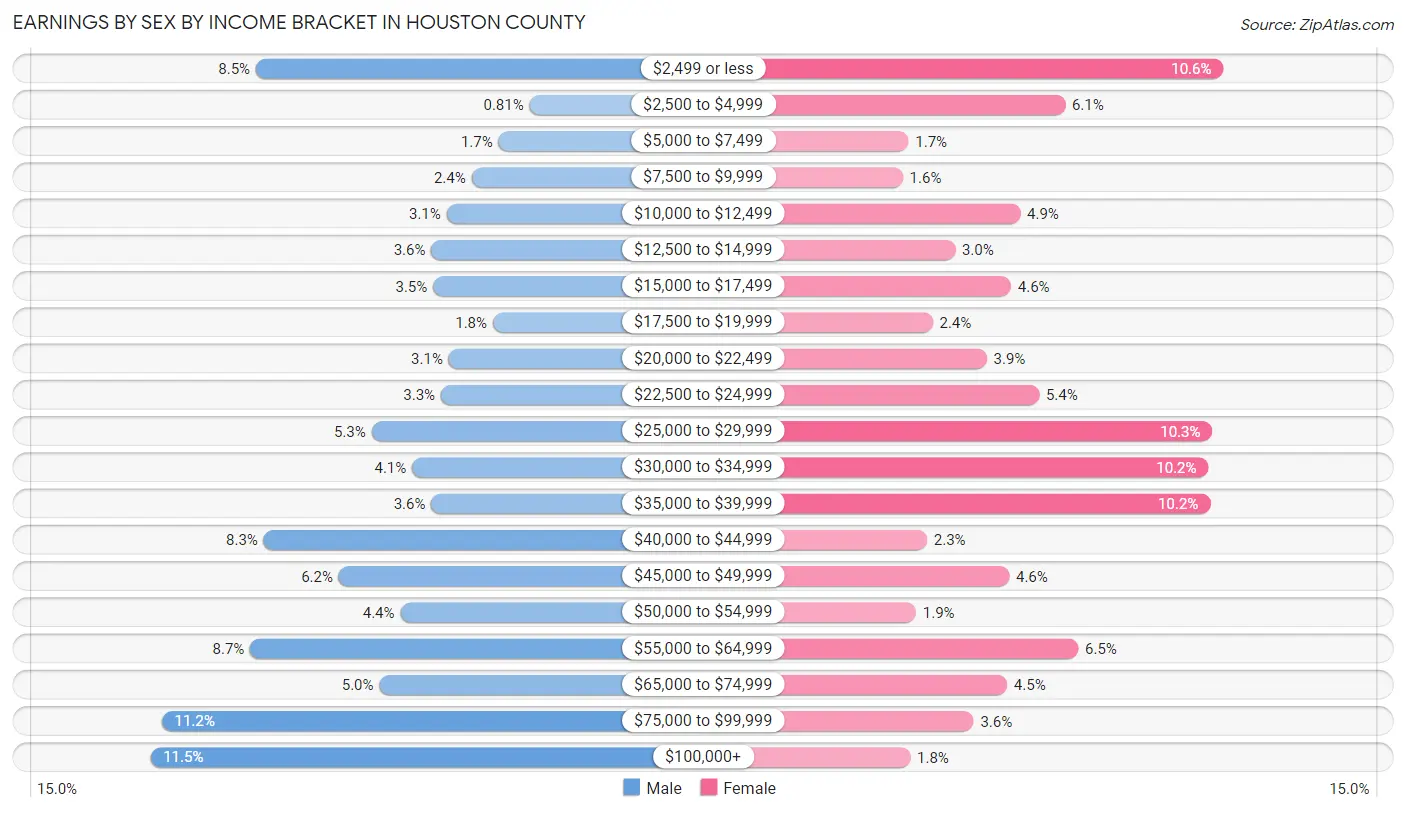
| Income | Male | Female |
| $2,499 or less | 157 (8.5%) | 202 (10.6%) |
| $2,500 to $4,999 | 15 (0.8%) | 117 (6.1%) |
| $5,000 to $7,499 | 31 (1.7%) | 33 (1.7%) |
| $7,500 to $9,999 | 45 (2.4%) | 30 (1.6%) |
| $10,000 to $12,499 | 58 (3.1%) | 93 (4.9%) |
| $12,500 to $14,999 | 66 (3.6%) | 58 (3.0%) |
| $15,000 to $17,499 | 65 (3.5%) | 88 (4.6%) |
| $17,500 to $19,999 | 34 (1.8%) | 46 (2.4%) |
| $20,000 to $22,499 | 57 (3.1%) | 75 (3.9%) |
| $22,500 to $24,999 | 61 (3.3%) | 103 (5.4%) |
| $25,000 to $29,999 | 97 (5.2%) | 196 (10.3%) |
| $30,000 to $34,999 | 76 (4.1%) | 194 (10.2%) |
| $35,000 to $39,999 | 66 (3.6%) | 195 (10.2%) |
| $40,000 to $44,999 | 153 (8.3%) | 43 (2.2%) |
| $45,000 to $49,999 | 114 (6.2%) | 87 (4.6%) |
| $50,000 to $54,999 | 82 (4.4%) | 37 (1.9%) |
| $55,000 to $64,999 | 160 (8.7%) | 124 (6.5%) |
| $65,000 to $74,999 | 93 (5.0%) | 86 (4.5%) |
| $75,000 to $99,999 | 206 (11.2%) | 68 (3.6%) |
| $100,000+ | 212 (11.5%) | 34 (1.8%) |
| Total | 1,848 (100.0%) | 1,909 (100.0%) |
Earnings by Sex by Educational Attainment in Houston County
Average earnings in Houston County are $46,771 for men and $30,841 for women, a difference of 34.1%. Men with an educational attainment of graduate degree enjoy the highest average annual earnings of $101,042, while those with bachelor's degree education earn the least with $40,938. Women with an educational attainment of graduate degree earn the most with the average annual earnings of $61,154, while those with less than high school education have the smallest earnings of $22,308.
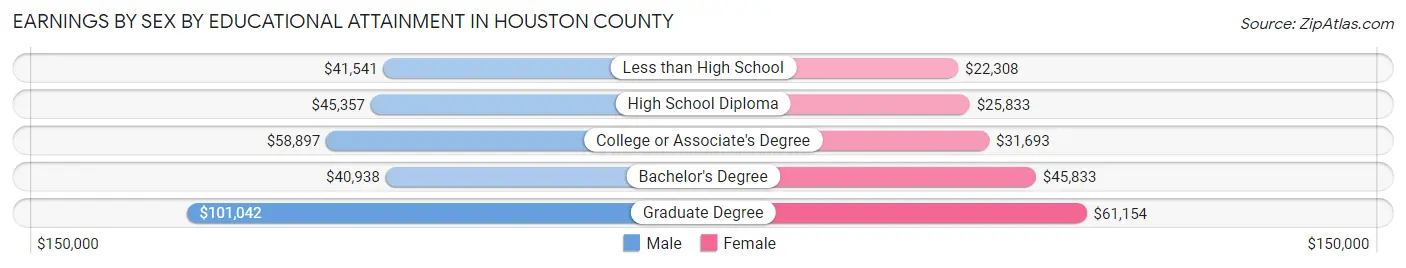
| Educational Attainment | Male Income | Female Income |
| Less than High School | $41,541 | $22,308 |
| High School Diploma | $45,357 | $25,833 |
| College or Associate's Degree | $58,897 | $31,693 |
| Bachelor's Degree | $40,938 | $45,833 |
| Graduate Degree | $101,042 | $61,154 |
| Total | $46,771 | $30,841 |
Family Income in Houston County
Family Income Brackets in Houston County
According to the Houston County family income data, there are 406 families falling into the $75,000 to $99,999 income range, which is the most common income bracket and makes up 21.8% of all families. Conversely, the $10,000 to $14,999 income bracket is the least frequent group with only 19 families (1.0%) belonging to this category.
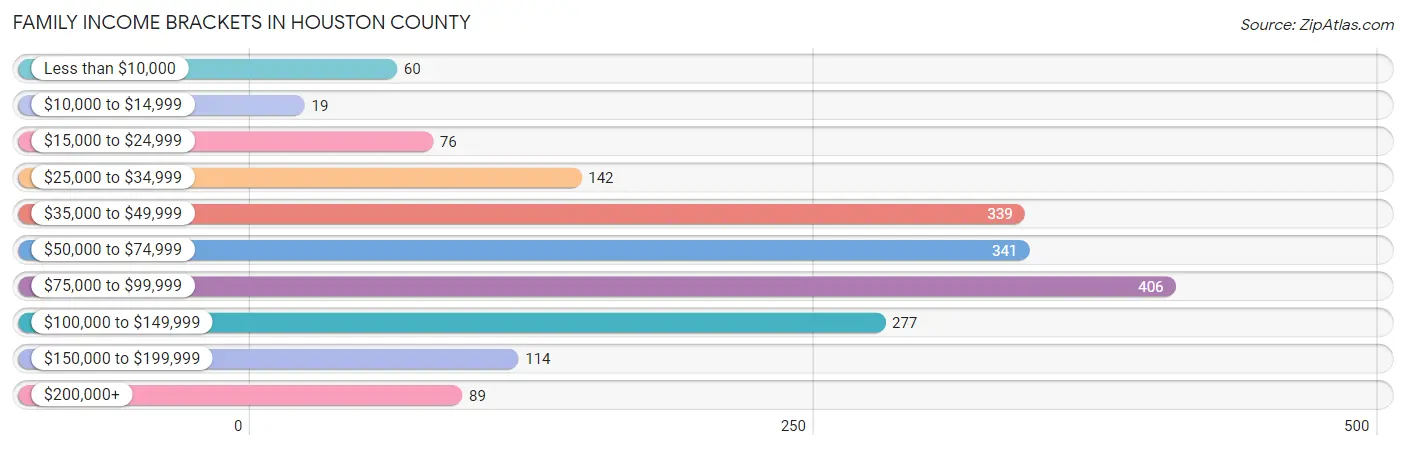
| Income Bracket | # Families | % Families |
| Less than $10,000 | 60 | 3.2% |
| $10,000 to $14,999 | 19 | 1.0% |
| $15,000 to $24,999 | 76 | 4.1% |
| $25,000 to $34,999 | 142 | 7.6% |
| $35,000 to $49,999 | 339 | 18.2% |
| $50,000 to $74,999 | 341 | 18.3% |
| $75,000 to $99,999 | 406 | 21.8% |
| $100,000 to $149,999 | 277 | 14.9% |
| $150,000 to $199,999 | 114 | 6.1% |
| $200,000+ | 89 | 4.8% |
Family Income by Famaliy Size in Houston County
7+ person families (19 | 1.0%) account for the highest median family income in Houston County with $162,625 per family, while 2-person families (1,110 | 59.6%) have the highest median income of $30,860 per family member.
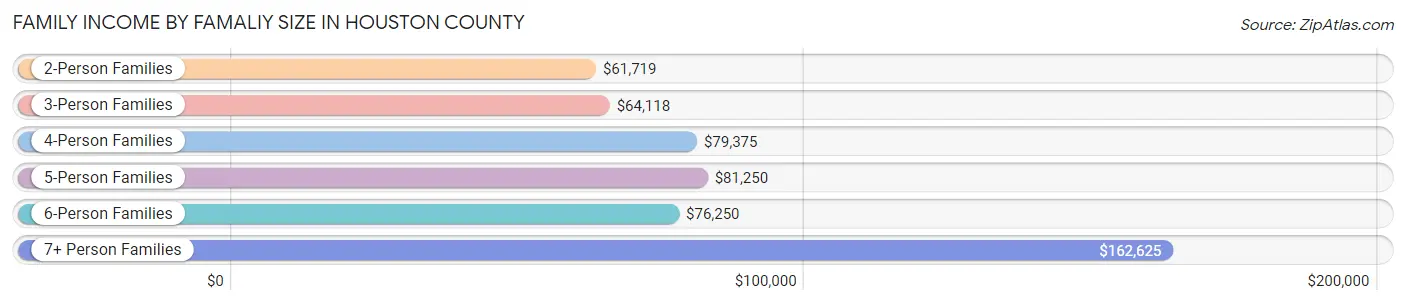
| Income Bracket | # Families | Median Income |
| 2-Person Families | 1,110 (59.6%) | $61,719 |
| 3-Person Families | 412 (22.1%) | $64,118 |
| 4-Person Families | 195 (10.5%) | $79,375 |
| 5-Person Families | 65 (3.5%) | $81,250 |
| 6-Person Families | 61 (3.3%) | $76,250 |
| 7+ Person Families | 19 (1.0%) | $162,625 |
| Total | 1,862 (100.0%) | $73,000 |
Family Income by Number of Earners in Houston County
The median family income in Houston County is $73,000, with families comprising 3+ earners (156) having the highest median family income of $122,500, while families with no earners (382) have the lowest median family income of $42,143, accounting for 8.4% and 20.5% of families, respectively.
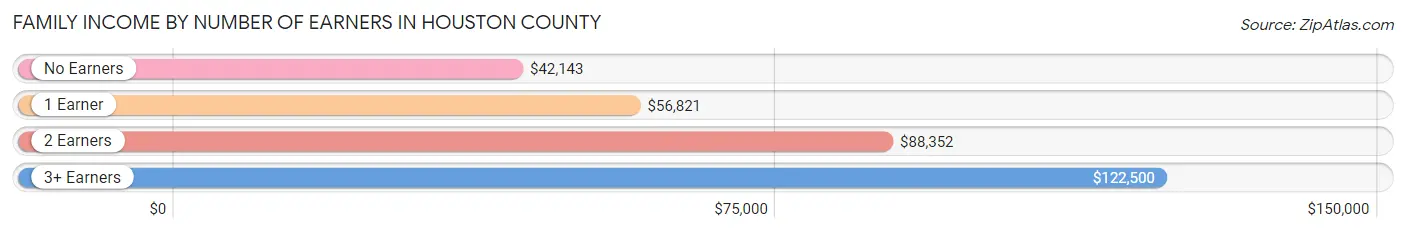
| Number of Earners | # Families | Median Income |
| No Earners | 382 (20.5%) | $42,143 |
| 1 Earner | 815 (43.8%) | $56,821 |
| 2 Earners | 509 (27.3%) | $88,352 |
| 3+ Earners | 156 (8.4%) | $122,500 |
| Total | 1,862 (100.0%) | $73,000 |
Household Income in Houston County
Household Income Brackets in Houston County
With 602 households falling in the category, the $50,000 to $74,999 income range is the most frequent in Houston County, accounting for 19.9% of all households. In contrast, only 91 households (3.0%) fall into the $200,000+ income bracket, making it the least populous group.
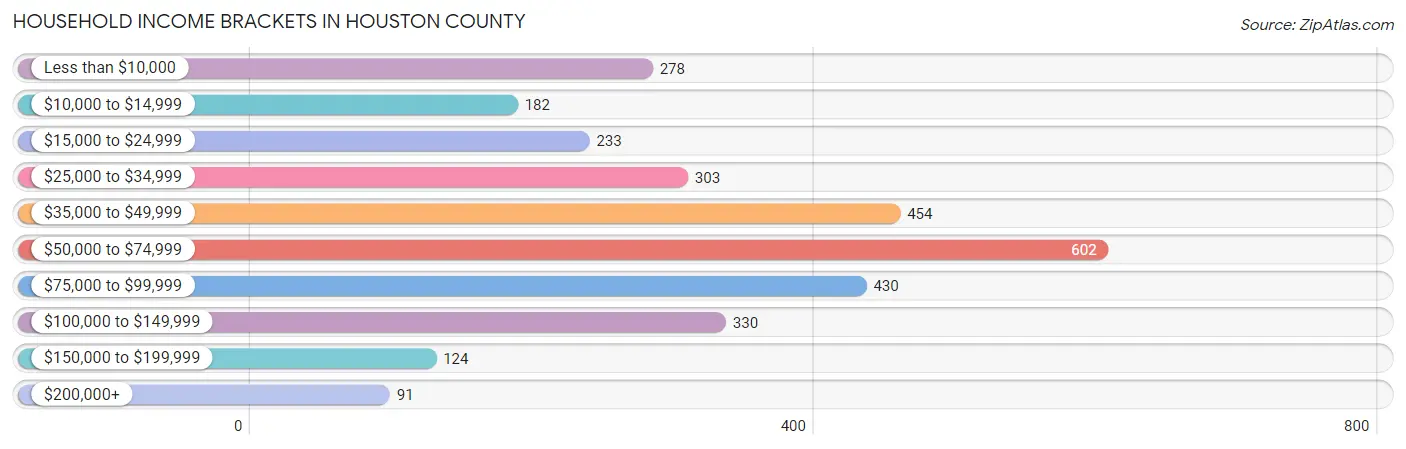
| Income Bracket | # Households | % Households |
| Less than $10,000 | 278 | 9.2% |
| $10,000 to $14,999 | 182 | 6.0% |
| $15,000 to $24,999 | 233 | 7.7% |
| $25,000 to $34,999 | 303 | 10.0% |
| $35,000 to $49,999 | 454 | 15.0% |
| $50,000 to $74,999 | 602 | 19.9% |
| $75,000 to $99,999 | 430 | 14.2% |
| $100,000 to $149,999 | 330 | 10.9% |
| $150,000 to $199,999 | 124 | 4.1% |
| $200,000+ | 91 | 3.0% |
Household Income by Householder Age in Houston County
The median household income in Houston County is $51,544, with the highest median household income of $73,350 found in the 25 to 44 years age bracket for the primary householder. A total of 665 households (22.0%) fall into this category. Meanwhile, the 65+ years age bracket for the primary householder has the lowest median household income of $43,125, with 937 households (31.0%) in this group.
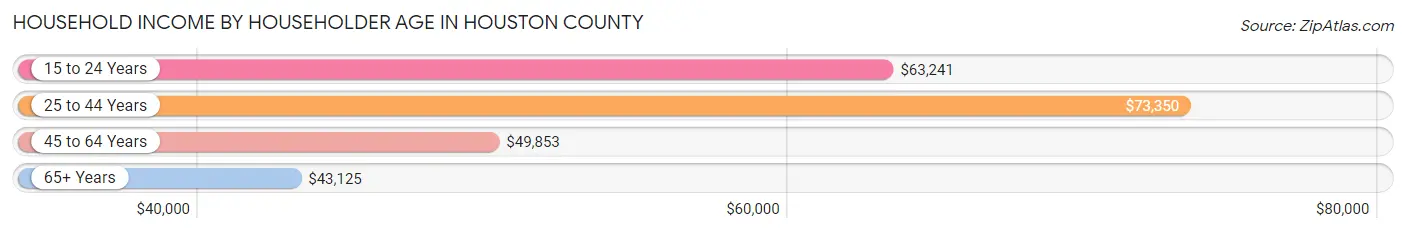
| Income Bracket | # Households | Median Income |
| 15 to 24 Years | 62 (2.1%) | $63,241 |
| 25 to 44 Years | 665 (22.0%) | $73,350 |
| 45 to 64 Years | 1,362 (45.0%) | $49,853 |
| 65+ Years | 937 (31.0%) | $43,125 |
| Total | 3,026 (100.0%) | $51,544 |
Poverty in Houston County
Income Below Poverty by Sex and Age in Houston County
With 12.0% poverty level for males and 14.8% for females among the residents of Houston County, 6 to 11 year old males and 16 and 17 year old females are the most vulnerable to poverty, with 60 males (18.2%) and 42 females (29.0%) in their respective age groups living below the poverty level.
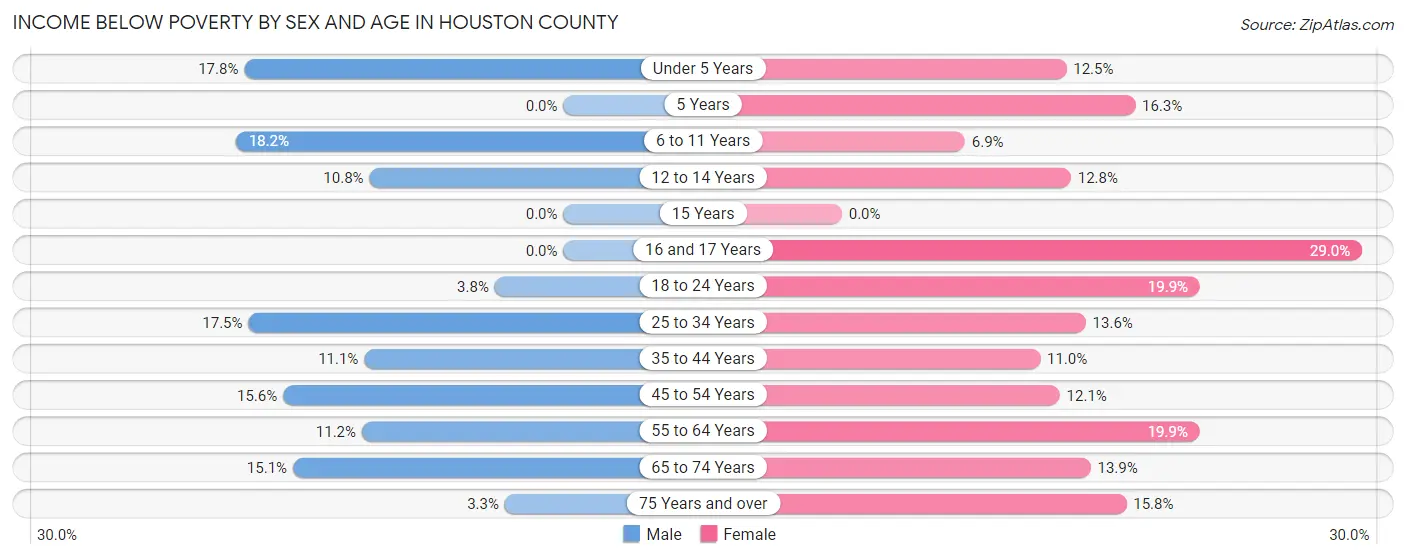
| Age Bracket | Male | Female |
| Under 5 Years | 35 (17.8%) | 20 (12.5%) |
| 5 Years | 0 (0.0%) | 8 (16.3%) |
| 6 to 11 Years | 60 (18.2%) | 20 (6.9%) |
| 12 to 14 Years | 19 (10.8%) | 13 (12.8%) |
| 15 Years | 0 (0.0%) | 0 (0.0%) |
| 16 and 17 Years | 0 (0.0%) | 42 (29.0%) |
| 18 to 24 Years | 12 (3.8%) | 68 (19.9%) |
| 25 to 34 Years | 74 (17.5%) | 66 (13.6%) |
| 35 to 44 Years | 48 (11.1%) | 52 (11.0%) |
| 45 to 54 Years | 86 (15.6%) | 69 (12.1%) |
| 55 to 64 Years | 66 (11.2%) | 113 (19.9%) |
| 65 to 74 Years | 64 (15.1%) | 68 (13.9%) |
| 75 Years and over | 9 (3.3%) | 54 (15.8%) |
| Total | 473 (12.0%) | 593 (14.8%) |
Income Above Poverty by Sex and Age in Houston County
According to the poverty statistics in Houston County, males aged 5 years and females aged 6 to 11 years are the age groups that are most secure financially, with 100.0% of males and 93.1% of females in these age groups living above the poverty line.
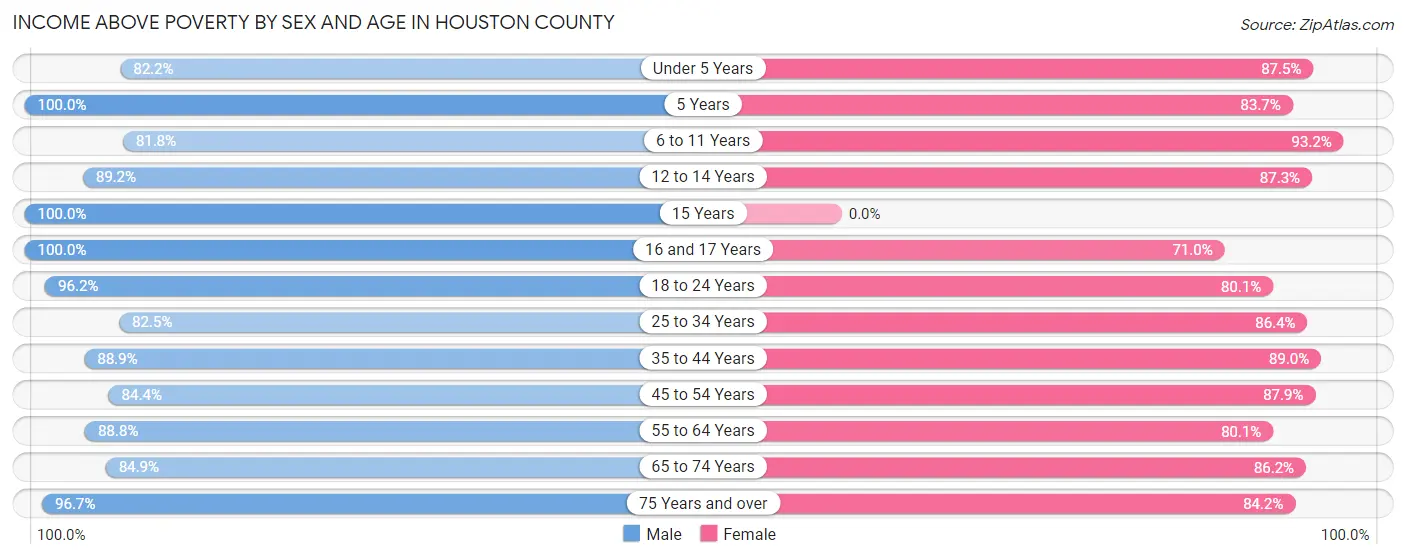
| Age Bracket | Male | Female |
| Under 5 Years | 162 (82.2%) | 140 (87.5%) |
| 5 Years | 62 (100.0%) | 41 (83.7%) |
| 6 to 11 Years | 269 (81.8%) | 272 (93.1%) |
| 12 to 14 Years | 157 (89.2%) | 89 (87.3%) |
| 15 Years | 14 (100.0%) | 0 (0.0%) |
| 16 and 17 Years | 165 (100.0%) | 103 (71.0%) |
| 18 to 24 Years | 302 (96.2%) | 273 (80.1%) |
| 25 to 34 Years | 348 (82.5%) | 420 (86.4%) |
| 35 to 44 Years | 385 (88.9%) | 419 (89.0%) |
| 45 to 54 Years | 465 (84.4%) | 500 (87.9%) |
| 55 to 64 Years | 522 (88.8%) | 454 (80.1%) |
| 65 to 74 Years | 361 (84.9%) | 423 (86.2%) |
| 75 Years and over | 267 (96.7%) | 287 (84.2%) |
| Total | 3,479 (88.0%) | 3,421 (85.2%) |
Income Below Poverty Among Married-Couple Families in Houston County
The poverty statistics for married-couple families in Houston County show that 4.5% or 63 of the total 1,412 families live below the poverty line. Families with 5 or more children have the highest poverty rate of 100.0%, comprising of 3 families. On the other hand, families with no children have the lowest poverty rate of 3.4%, which includes 33 families.
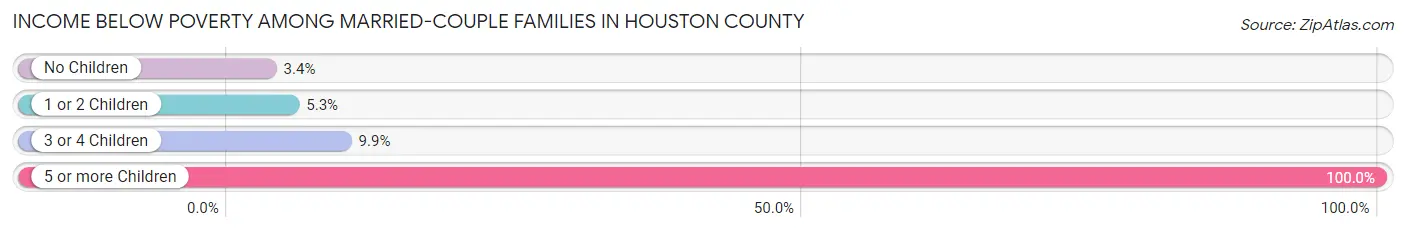
| Children | Above Poverty | Below Poverty |
| No Children | 948 (96.6%) | 33 (3.4%) |
| 1 or 2 Children | 319 (94.7%) | 18 (5.3%) |
| 3 or 4 Children | 82 (90.1%) | 9 (9.9%) |
| 5 or more Children | 0 (0.0%) | 3 (100.0%) |
| Total | 1,349 (95.5%) | 63 (4.5%) |
Income Below Poverty Among Single-Parent Households in Houston County
According to the poverty data in Houston County, 23.4% or 34 single-father households and 13.1% or 40 single-mother households are living below the poverty line. Among single-father households, those with 1 or 2 children have the highest poverty rate, with 24 households (30.8%) experiencing poverty. Likewise, among single-mother households, those with 1 or 2 children have the highest poverty rate, with 30 households (17.9%) falling below the poverty line.
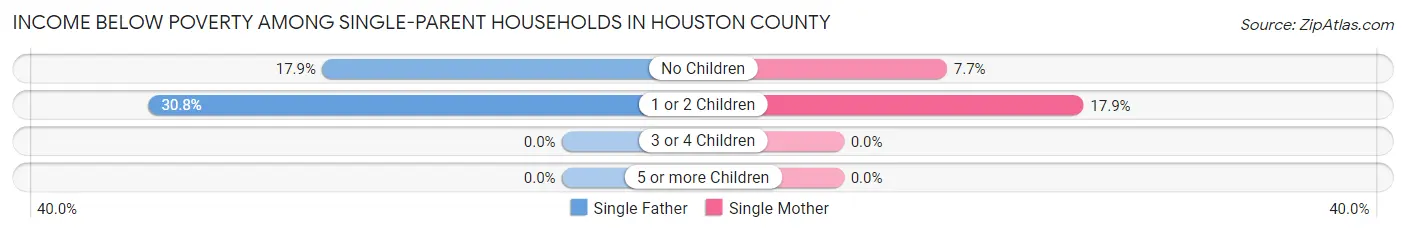
| Children | Single Father | Single Mother |
| No Children | 10 (17.9%) | 10 (7.7%) |
| 1 or 2 Children | 24 (30.8%) | 30 (17.9%) |
| 3 or 4 Children | 0 (0.0%) | 0 (0.0%) |
| 5 or more Children | 0 (0.0%) | 0 (0.0%) |
| Total | 34 (23.4%) | 40 (13.1%) |
Income Below Poverty Among Married-Couple vs Single-Parent Households in Houston County
The poverty data for Houston County shows that 63 of the married-couple family households (4.5%) and 74 of the single-parent households (16.4%) are living below the poverty level. Within the married-couple family households, those with 5 or more children have the highest poverty rate, with 3 households (100.0%) falling below the poverty line. Among the single-parent households, those with 1 or 2 children have the highest poverty rate, with 54 household (22.0%) living below poverty.
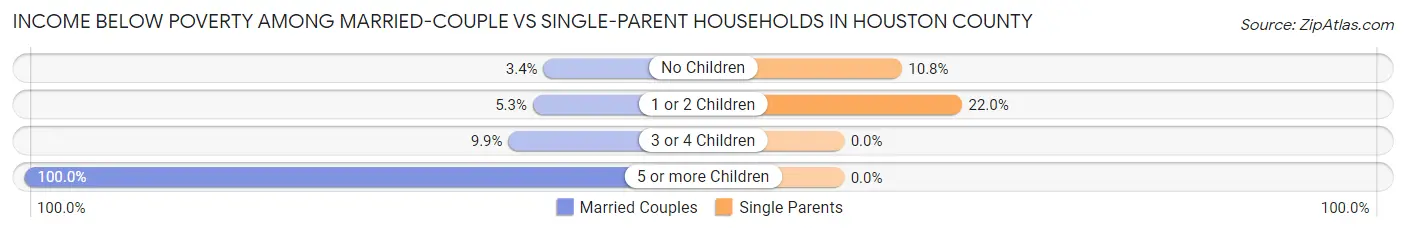
| Children | Married-Couple Families | Single-Parent Households |
| No Children | 33 (3.4%) | 20 (10.7%) |
| 1 or 2 Children | 18 (5.3%) | 54 (22.0%) |
| 3 or 4 Children | 9 (9.9%) | 0 (0.0%) |
| 5 or more Children | 3 (100.0%) | 0 (0.0%) |
| Total | 63 (4.5%) | 74 (16.4%) |
Employment Characteristics in Houston County
Employment by Class of Employer in Houston County
Among the 3,171 employed individuals in Houston County, private company employees (2,092 | 66.0%), local government employees (477 | 15.0%), and self-employed (not incorporated) (234 | 7.4%) make up the most common classes of employment.
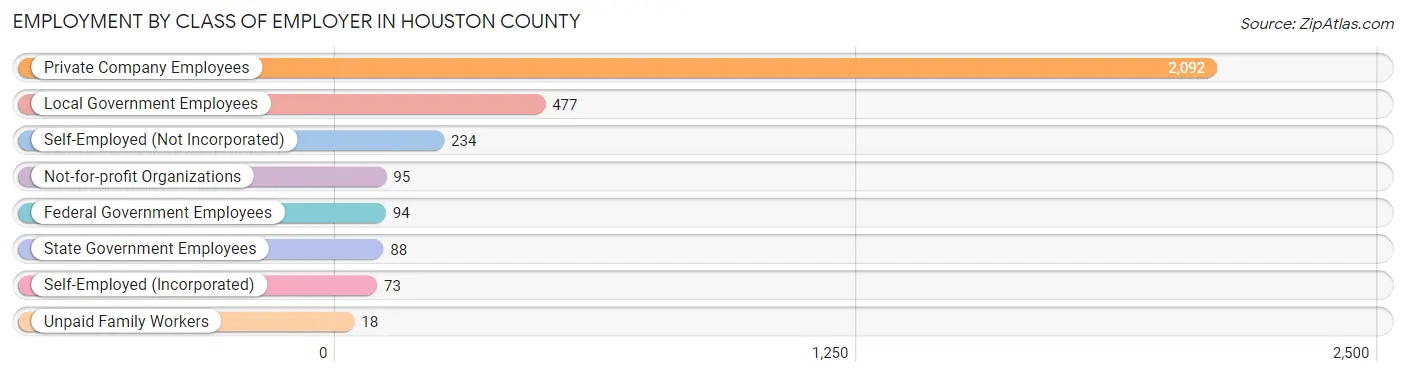
| Employer Class | # Employees | % Employees |
| Private Company Employees | 2,092 | 66.0% |
| Self-Employed (Incorporated) | 73 | 2.3% |
| Self-Employed (Not Incorporated) | 234 | 7.4% |
| Not-for-profit Organizations | 95 | 3.0% |
| Local Government Employees | 477 | 15.0% |
| State Government Employees | 88 | 2.8% |
| Federal Government Employees | 94 | 3.0% |
| Unpaid Family Workers | 18 | 0.6% |
| Total | 3,171 | 100.0% |
Employment Status by Age in Houston County
According to the labor force statistics for Houston County, out of the total population over 16 years of age (6,774), 50.9% or 3,448 individuals are in the labor force, with 4.2% or 145 of them unemployed. The age group with the highest labor force participation rate is 25 to 29 years, with 84.8% or 435 individuals in the labor force. Within the labor force, the 65 to 74 years age range has the highest percentage of unemployed individuals, with 17.6% or 18 of them being unemployed.

| Age Bracket | In Labor Force | Unemployed |
| 16 to 19 Years | 239 (41.2%) | 10 (4.2%) |
| 20 to 24 Years | 268 (69.6%) | 27 (10.1%) |
| 25 to 29 Years | 435 (84.8%) | 7 (1.6%) |
| 30 to 34 Years | 315 (76.5%) | 6 (1.9%) |
| 35 to 44 Years | 607 (66.1%) | 0 (0.0%) |
| 45 to 54 Years | 819 (72.2%) | 25 (3.1%) |
| 55 to 59 Years | 393 (59.3%) | 27 (6.9%) |
| 60 to 64 Years | 246 (48.4%) | 25 (10.2%) |
| 65 to 74 Years | 102 (10.6%) | 18 (17.6%) |
| 75 Years and over | 21 (3.0%) | 0 (0.0%) |
| Total | 3,448 (50.9%) | 145 (4.2%) |
Employment Status by Educational Attainment in Houston County
According to labor force statistics for Houston County, 67.8% of individuals (2,814) out of the total population between 25 and 64 years of age (4,150) are in the labor force, with 3.2% or 90 of them being unemployed. The group with the highest labor force participation rate are those with the educational attainment of bachelor's degree or higher, with 80.4% or 409 individuals in the labor force. Within the labor force, individuals with bachelor's degree or higher education have the highest percentage of unemployment, with 4.0% or 16 of them being unemployed.
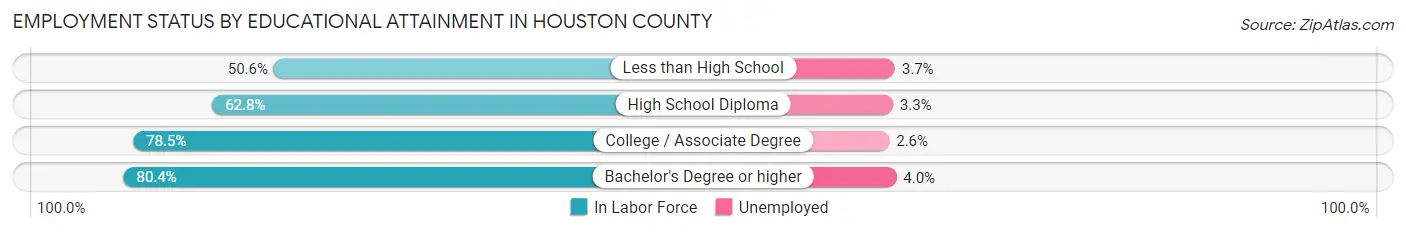
| Educational Attainment | In Labor Force | Unemployed |
| Less than High School | 300 (50.6%) | 22 (3.7%) |
| High School Diploma | 1,149 (62.8%) | 60 (3.3%) |
| College / Associate Degree | 957 (78.5%) | 32 (2.6%) |
| Bachelor's Degree or higher | 409 (80.4%) | 20 (4.0%) |
| Total | 2,814 (67.8%) | 133 (3.2%) |
Employment Occupations by Sex in Houston County
Management, Business, Science and Arts Occupations
The most common Management, Business, Science and Arts occupations in Houston County are Management (306 | 9.3%), Health Diagnosing & Treating (204 | 6.2%), Community & Social Service (183 | 5.6%), Education Instruction & Library (132 | 4.0%), and Computers, Engineering & Science (86 | 2.6%).
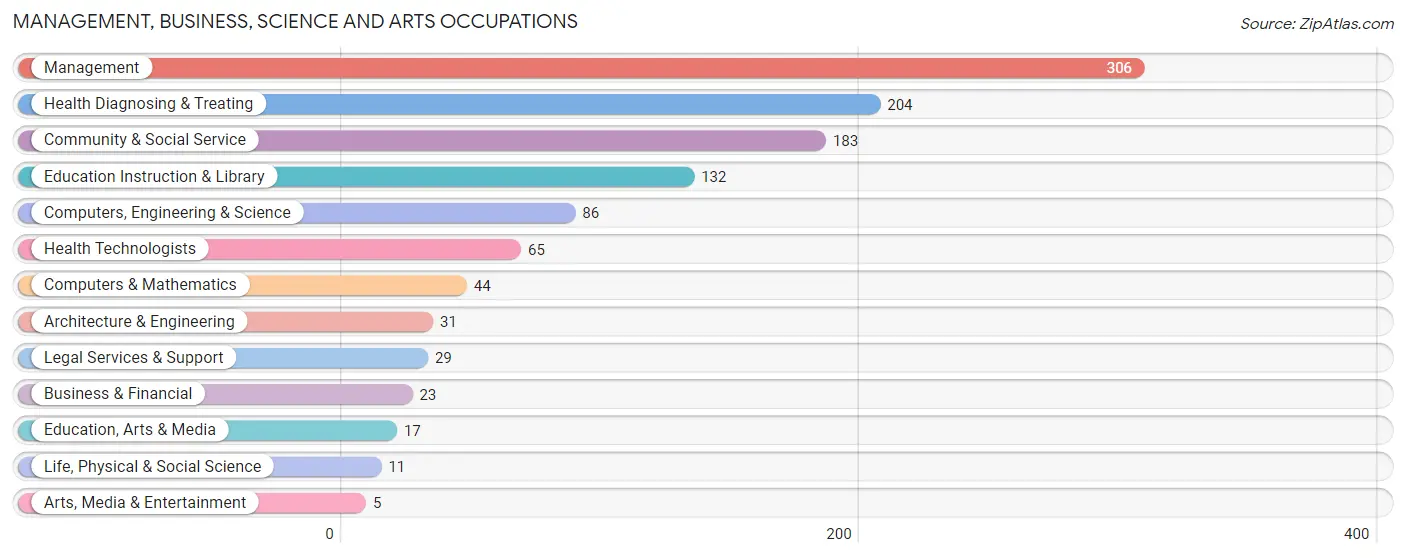
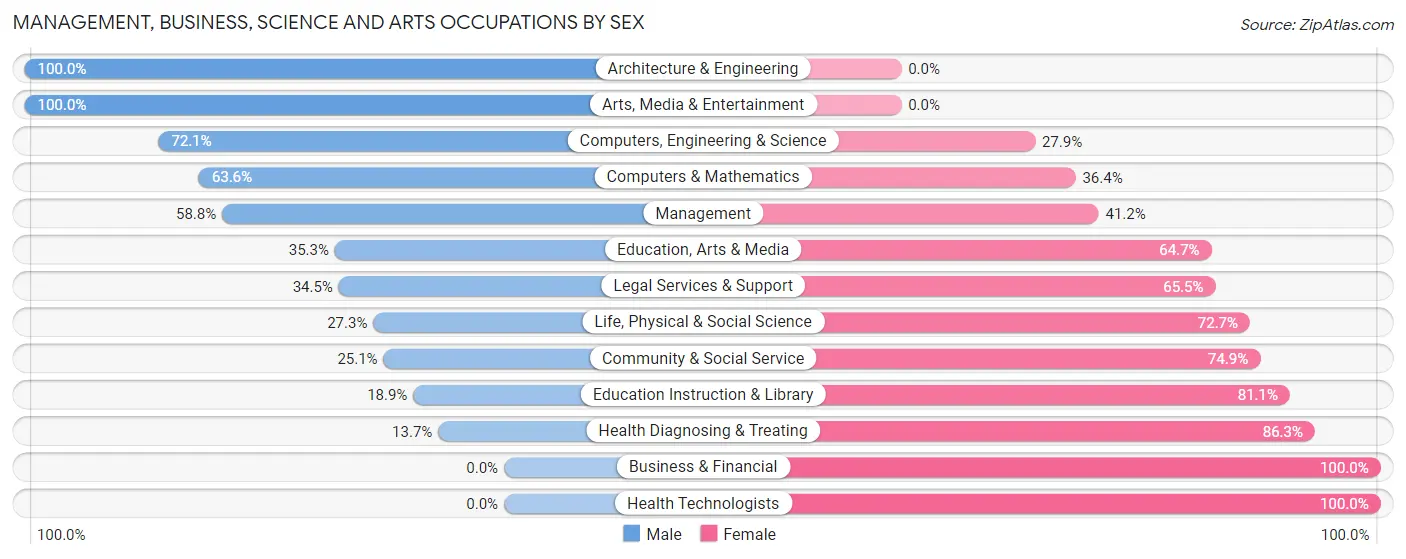
Management, Business, Science and Arts Occupations by Sex
Within the Management, Business, Science and Arts occupations in Houston County, the most male-oriented occupations are Architecture & Engineering (100.0%), Arts, Media & Entertainment (100.0%), and Computers, Engineering & Science (72.1%), while the most female-oriented occupations are Business & Financial (100.0%), Health Technologists (100.0%), and Health Diagnosing & Treating (86.3%).
| Occupation | Male | Female |
| Management | 180 (58.8%) | 126 (41.2%) |
| Business & Financial | 0 (0.0%) | 23 (100.0%) |
| Computers, Engineering & Science | 62 (72.1%) | 24 (27.9%) |
| Computers & Mathematics | 28 (63.6%) | 16 (36.4%) |
| Architecture & Engineering | 31 (100.0%) | 0 (0.0%) |
| Life, Physical & Social Science | 3 (27.3%) | 8 (72.7%) |
| Community & Social Service | 46 (25.1%) | 137 (74.9%) |
| Education, Arts & Media | 6 (35.3%) | 11 (64.7%) |
| Legal Services & Support | 10 (34.5%) | 19 (65.5%) |
| Education Instruction & Library | 25 (18.9%) | 107 (81.1%) |
| Arts, Media & Entertainment | 5 (100.0%) | 0 (0.0%) |
| Health Diagnosing & Treating | 28 (13.7%) | 176 (86.3%) |
| Health Technologists | 0 (0.0%) | 65 (100.0%) |
| Total (Category) | 316 (39.4%) | 486 (60.6%) |
| Total (Overall) | 1,594 (48.5%) | 1,694 (51.5%) |
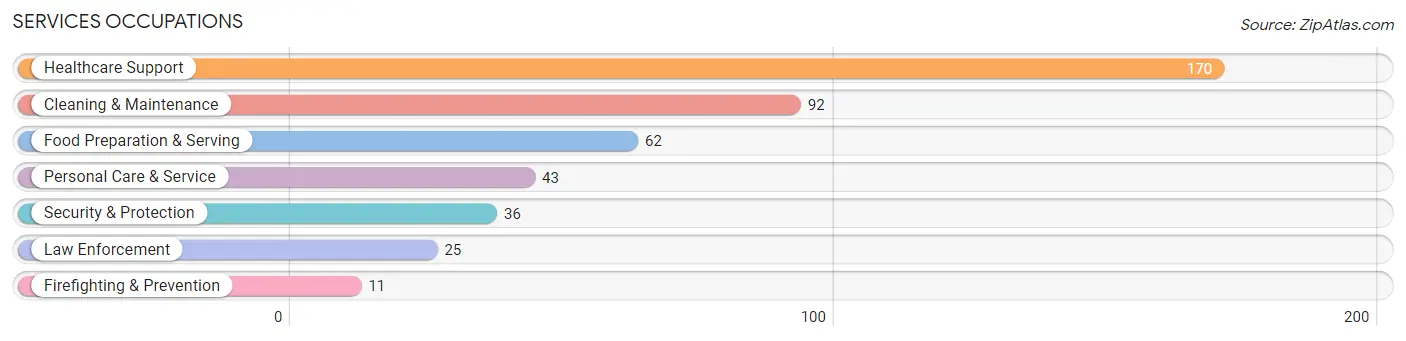
Services Occupations
The most common Services occupations in Houston County are Healthcare Support (170 | 5.2%), Cleaning & Maintenance (92 | 2.8%), Food Preparation & Serving (62 | 1.9%), Personal Care & Service (43 | 1.3%), and Security & Protection (36 | 1.1%).
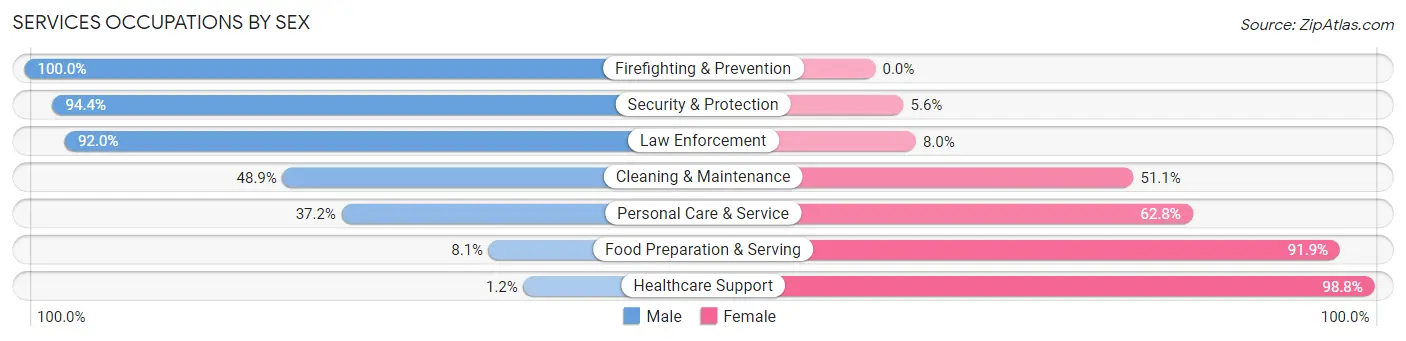
Services Occupations by Sex
Within the Services occupations in Houston County, the most male-oriented occupations are Firefighting & Prevention (100.0%), Security & Protection (94.4%), and Law Enforcement (92.0%), while the most female-oriented occupations are Healthcare Support (98.8%), Food Preparation & Serving (91.9%), and Personal Care & Service (62.8%).
| Occupation | Male | Female |
| Healthcare Support | 2 (1.2%) | 168 (98.8%) |
| Security & Protection | 34 (94.4%) | 2 (5.6%) |
| Firefighting & Prevention | 11 (100.0%) | 0 (0.0%) |
| Law Enforcement | 23 (92.0%) | 2 (8.0%) |
| Food Preparation & Serving | 5 (8.1%) | 57 (91.9%) |
| Cleaning & Maintenance | 45 (48.9%) | 47 (51.1%) |
| Personal Care & Service | 16 (37.2%) | 27 (62.8%) |
| Total (Category) | 102 (25.3%) | 301 (74.7%) |
| Total (Overall) | 1,594 (48.5%) | 1,694 (51.5%) |
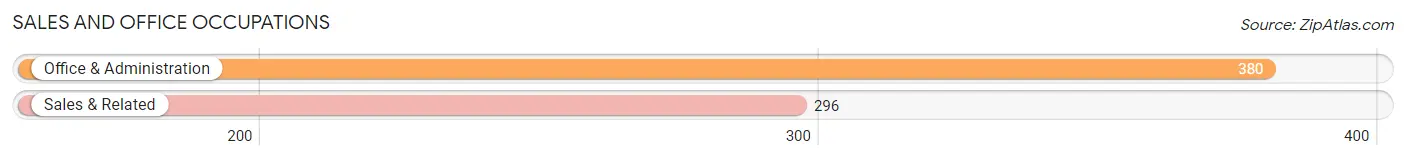
Sales and Office Occupations
The most common Sales and Office occupations in Houston County are Office & Administration (380 | 11.6%), and Sales & Related (296 | 9.0%).
Sales and Office Occupations by Sex

| Occupation | Male | Female |
| Sales & Related | 81 (27.4%) | 215 (72.6%) |
| Office & Administration | 42 (11.1%) | 338 (88.9%) |
| Total (Category) | 123 (18.2%) | 553 (81.8%) |
| Total (Overall) | 1,594 (48.5%) | 1,694 (51.5%) |
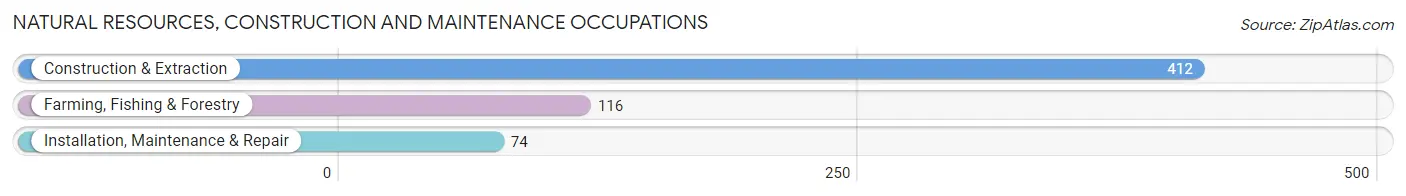
Natural Resources, Construction and Maintenance Occupations
The most common Natural Resources, Construction and Maintenance occupations in Houston County are Construction & Extraction (412 | 12.5%), Farming, Fishing & Forestry (116 | 3.5%), and Installation, Maintenance & Repair (74 | 2.2%).
Natural Resources, Construction and Maintenance Occupations by Sex
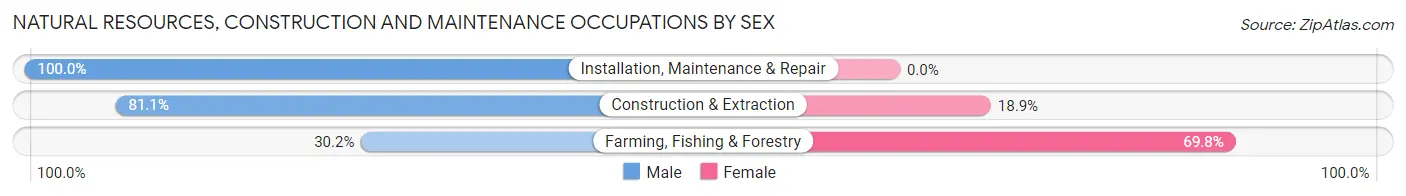
| Occupation | Male | Female |
| Farming, Fishing & Forestry | 35 (30.2%) | 81 (69.8%) |
| Construction & Extraction | 334 (81.1%) | 78 (18.9%) |
| Installation, Maintenance & Repair | 74 (100.0%) | 0 (0.0%) |
| Total (Category) | 443 (73.6%) | 159 (26.4%) |
| Total (Overall) | 1,594 (48.5%) | 1,694 (51.5%) |
Production, Transportation and Moving Occupations
The most common Production, Transportation and Moving occupations in Houston County are Production (539 | 16.4%), Material Moving (167 | 5.1%), and Transportation (99 | 3.0%).

Production, Transportation and Moving Occupations by Sex
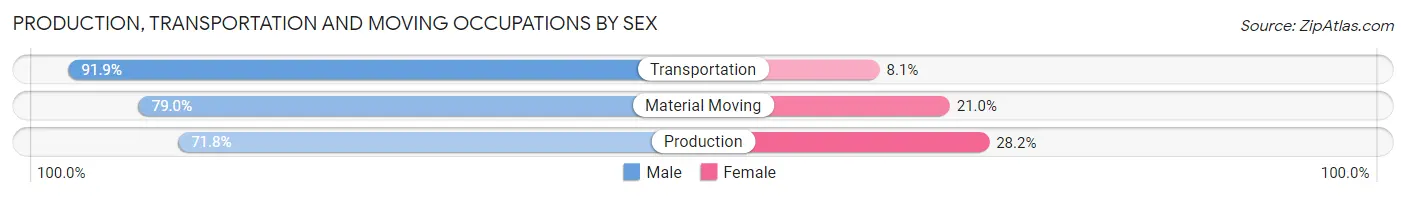
| Occupation | Male | Female |
| Production | 387 (71.8%) | 152 (28.2%) |
| Transportation | 91 (91.9%) | 8 (8.1%) |
| Material Moving | 132 (79.0%) | 35 (21.0%) |
| Total (Category) | 610 (75.8%) | 195 (24.2%) |
| Total (Overall) | 1,594 (48.5%) | 1,694 (51.5%) |
Employment Industries by Sex in Houston County
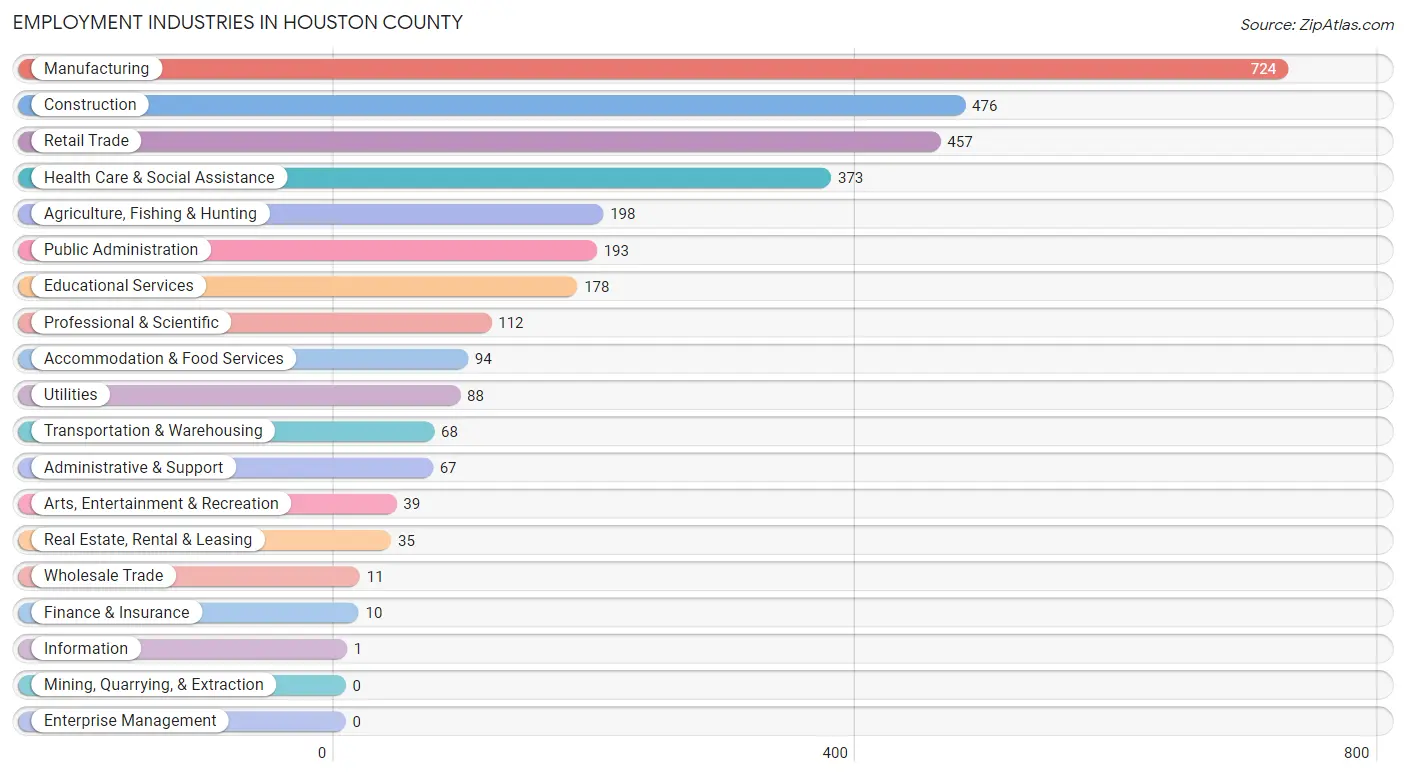
Employment Industries in Houston County
The major employment industries in Houston County include Manufacturing (724 | 22.0%), Construction (476 | 14.5%), Retail Trade (457 | 13.9%), Health Care & Social Assistance (373 | 11.3%), and Agriculture, Fishing & Hunting (198 | 6.0%).
Employment Industries by Sex in Houston County
The Houston County industries that see more men than women are Wholesale Trade (100.0%), Information (100.0%), and Construction (85.1%), whereas the industries that tend to have a higher number of women are Finance & Insurance (100.0%), Health Care & Social Assistance (90.9%), and Educational Services (83.7%).
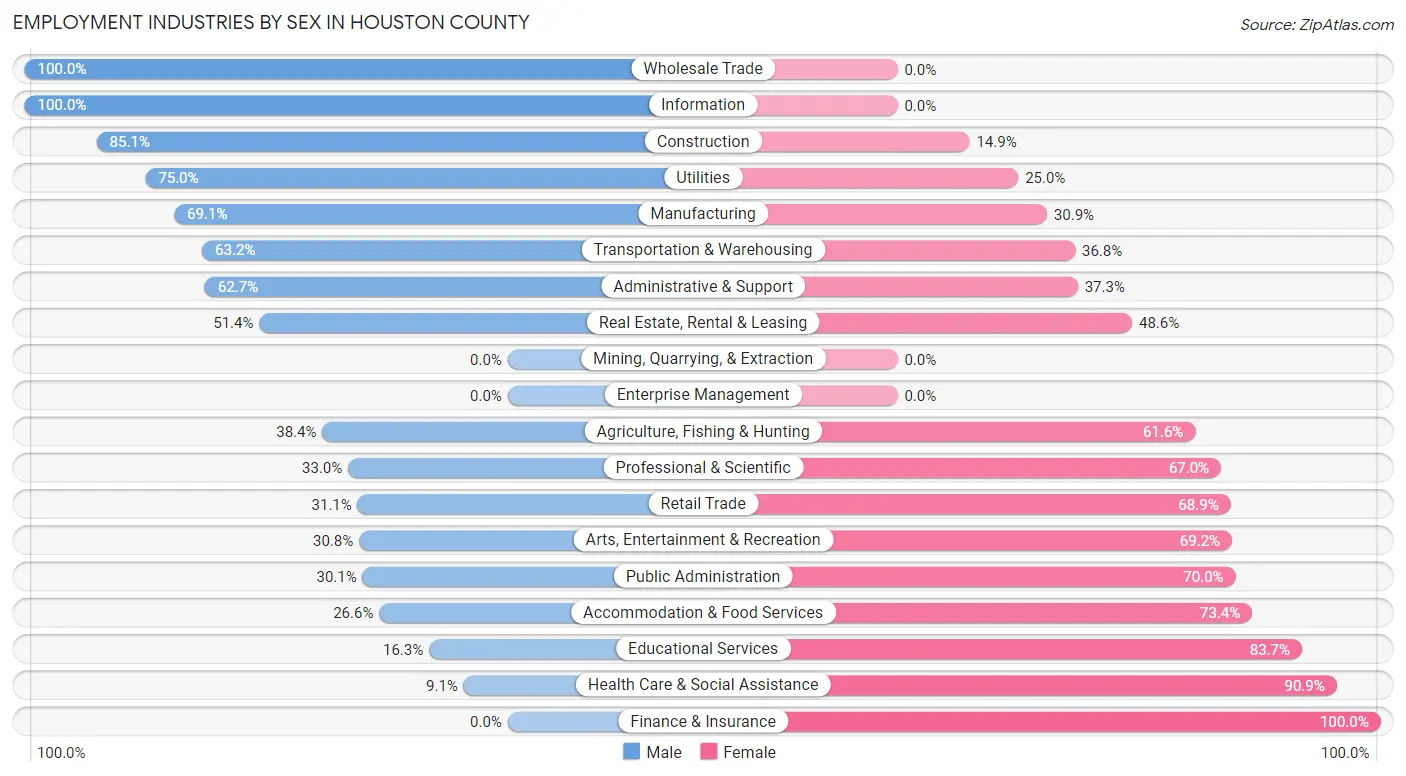
| Industry | Male | Female |
| Agriculture, Fishing & Hunting | 76 (38.4%) | 122 (61.6%) |
| Mining, Quarrying, & Extraction | 0 (0.0%) | 0 (0.0%) |
| Construction | 405 (85.1%) | 71 (14.9%) |
| Manufacturing | 500 (69.1%) | 224 (30.9%) |
| Wholesale Trade | 11 (100.0%) | 0 (0.0%) |
| Retail Trade | 142 (31.1%) | 315 (68.9%) |
| Transportation & Warehousing | 43 (63.2%) | 25 (36.8%) |
| Utilities | 66 (75.0%) | 22 (25.0%) |
| Information | 1 (100.0%) | 0 (0.0%) |
| Finance & Insurance | 0 (0.0%) | 10 (100.0%) |
| Real Estate, Rental & Leasing | 18 (51.4%) | 17 (48.6%) |
| Professional & Scientific | 37 (33.0%) | 75 (67.0%) |
| Enterprise Management | 0 (0.0%) | 0 (0.0%) |
| Administrative & Support | 42 (62.7%) | 25 (37.3%) |
| Educational Services | 29 (16.3%) | 149 (83.7%) |
| Health Care & Social Assistance | 34 (9.1%) | 339 (90.9%) |
| Arts, Entertainment & Recreation | 12 (30.8%) | 27 (69.2%) |
| Accommodation & Food Services | 25 (26.6%) | 69 (73.4%) |
| Public Administration | 58 (30.0%) | 135 (70.0%) |
| Total | 1,594 (48.5%) | 1,694 (51.5%) |
Education in Houston County
School Enrollment in Houston County
The most common levels of schooling among the 1,857 students in Houston County are high school (514 | 27.7%), elementary school (479 | 25.8%), and middle school (376 | 20.3%).

| School Level | # Students | % Students |
| Nursery / Preschool | 97 | 5.2% |
| Kindergarten | 99 | 5.3% |
| Elementary School | 479 | 25.8% |
| Middle School | 376 | 20.3% |
| High School | 514 | 27.7% |
| College / Undergraduate | 249 | 13.4% |
| Graduate / Professional | 43 | 2.3% |
| Total | 1,857 | 100.0% |
School Enrollment by Age by Funding Source in Houston County
Out of a total of 1,857 students who are enrolled in schools in Houston County, 178 (9.6%) attend a private institution, while the remaining 1,679 (90.4%) are enrolled in public schools. The age group of 25 to 34 year olds has the highest likelihood of being enrolled in private schools, with 20 (33.9% in the age bracket) enrolled. Conversely, the age group of 15 to 17 year olds has the lowest likelihood of being enrolled in a private school, with 306 (95.3% in the age bracket) attending a public institution.
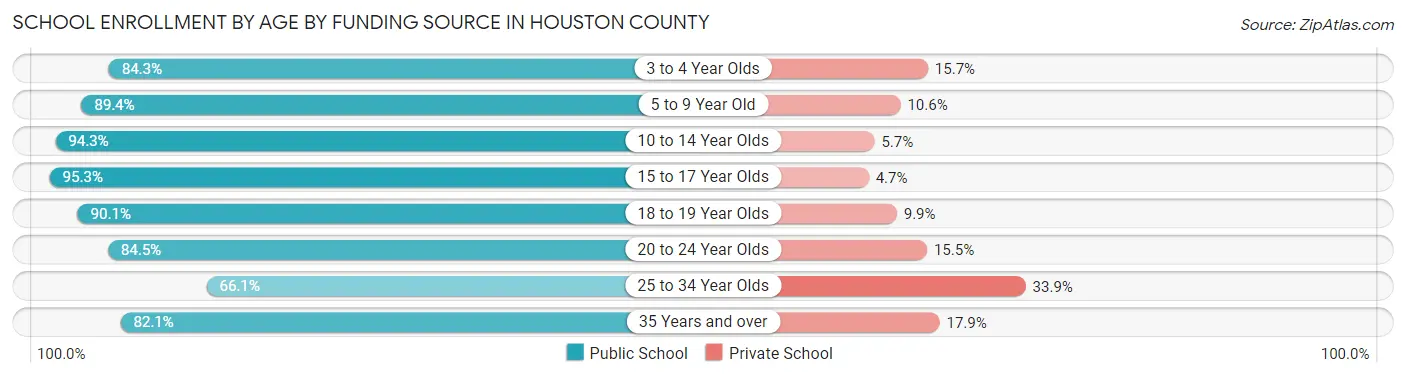
| Age Bracket | Public School | Private School |
| 3 to 4 Year Olds | 43 (84.3%) | 8 (15.7%) |
| 5 to 9 Year Old | 465 (89.4%) | 55 (10.6%) |
| 10 to 14 Year Olds | 494 (94.3%) | 30 (5.7%) |
| 15 to 17 Year Olds | 306 (95.3%) | 15 (4.7%) |
| 18 to 19 Year Olds | 164 (90.1%) | 18 (9.9%) |
| 20 to 24 Year Olds | 98 (84.5%) | 18 (15.5%) |
| 25 to 34 Year Olds | 39 (66.1%) | 20 (33.9%) |
| 35 Years and over | 69 (82.1%) | 15 (17.9%) |
| Total | 1,679 (90.4%) | 178 (9.6%) |
Educational Attainment by Field of Study in Houston County
Business (152 | 20.3%), education (151 | 20.1%), science & technology (82 | 10.9%), social sciences (69 | 9.2%), and liberal arts & history (63 | 8.4%) are the most common fields of study among 750 individuals in Houston County who have obtained a bachelor's degree or higher.
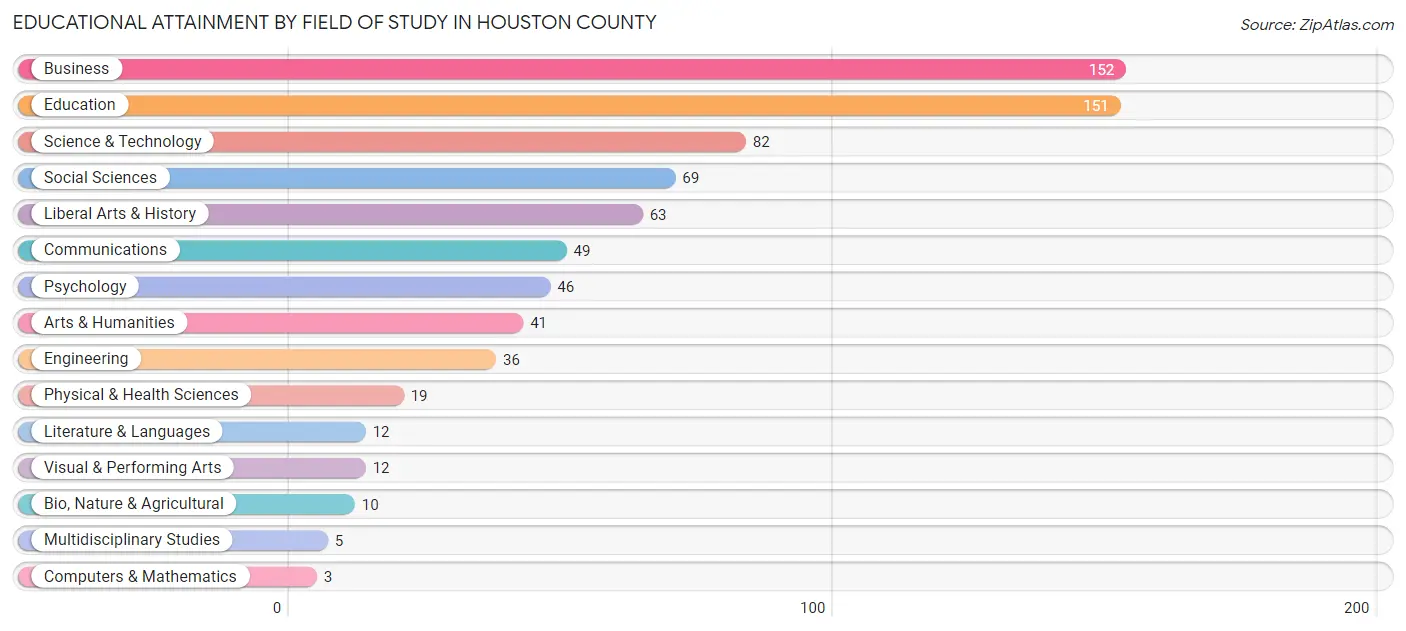
| Field of Study | # Graduates | % Graduates |
| Computers & Mathematics | 3 | 0.4% |
| Bio, Nature & Agricultural | 10 | 1.3% |
| Physical & Health Sciences | 19 | 2.5% |
| Psychology | 46 | 6.1% |
| Social Sciences | 69 | 9.2% |
| Engineering | 36 | 4.8% |
| Multidisciplinary Studies | 5 | 0.7% |
| Science & Technology | 82 | 10.9% |
| Business | 152 | 20.3% |
| Education | 151 | 20.1% |
| Literature & Languages | 12 | 1.6% |
| Liberal Arts & History | 63 | 8.4% |
| Visual & Performing Arts | 12 | 1.6% |
| Communications | 49 | 6.5% |
| Arts & Humanities | 41 | 5.5% |
| Total | 750 | 100.0% |
Transportation & Commute in Houston County
Vehicle Availability by Sex in Houston County
The most prevalent vehicle ownership categories in Houston County are males with 2 vehicles (508, accounting for 33.3%) and females with 2 vehicles (402, making up 31.0%).
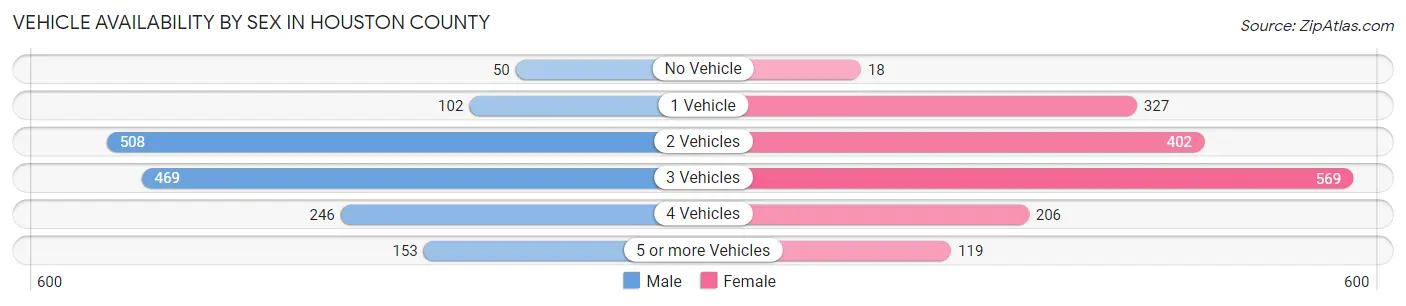
| Vehicles Available | Male | Female |
| No Vehicle | 50 (3.3%) | 18 (1.1%) |
| 1 Vehicle | 102 (6.7%) | 327 (19.9%) |
| 2 Vehicles | 508 (33.3%) | 402 (24.5%) |
| 3 Vehicles | 469 (30.7%) | 569 (34.7%) |
| 4 Vehicles | 246 (16.1%) | 206 (12.6%) |
| 5 or more Vehicles | 153 (10.0%) | 119 (7.2%) |
| Total | 1,528 (100.0%) | 1,641 (100.0%) |
Commute Time in Houston County
The most frequently occuring commute durations in Houston County are 45 to 59 minutes (453 commuters, 14.6%), 60 to 89 minutes (420 commuters, 13.5%), and 20 to 24 minutes (356 commuters, 11.5%).
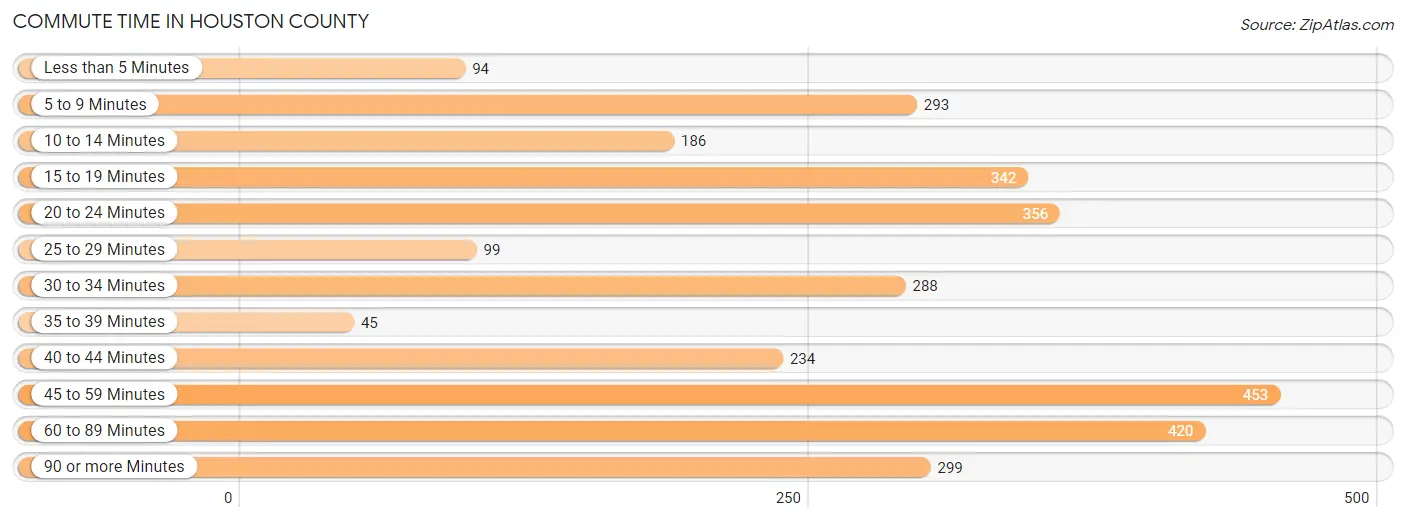
| Commute Time | # Commuters | % Commuters |
| Less than 5 Minutes | 94 | 3.0% |
| 5 to 9 Minutes | 293 | 9.4% |
| 10 to 14 Minutes | 186 | 6.0% |
| 15 to 19 Minutes | 342 | 11.0% |
| 20 to 24 Minutes | 356 | 11.5% |
| 25 to 29 Minutes | 99 | 3.2% |
| 30 to 34 Minutes | 288 | 9.3% |
| 35 to 39 Minutes | 45 | 1.5% |
| 40 to 44 Minutes | 234 | 7.5% |
| 45 to 59 Minutes | 453 | 14.6% |
| 60 to 89 Minutes | 420 | 13.5% |
| 90 or more Minutes | 299 | 9.6% |
Commute Time by Sex in Houston County
The most common commute times in Houston County are 45 to 59 minutes (289 commuters, 19.1%) for males and 60 to 89 minutes (240 commuters, 15.0%) for females.
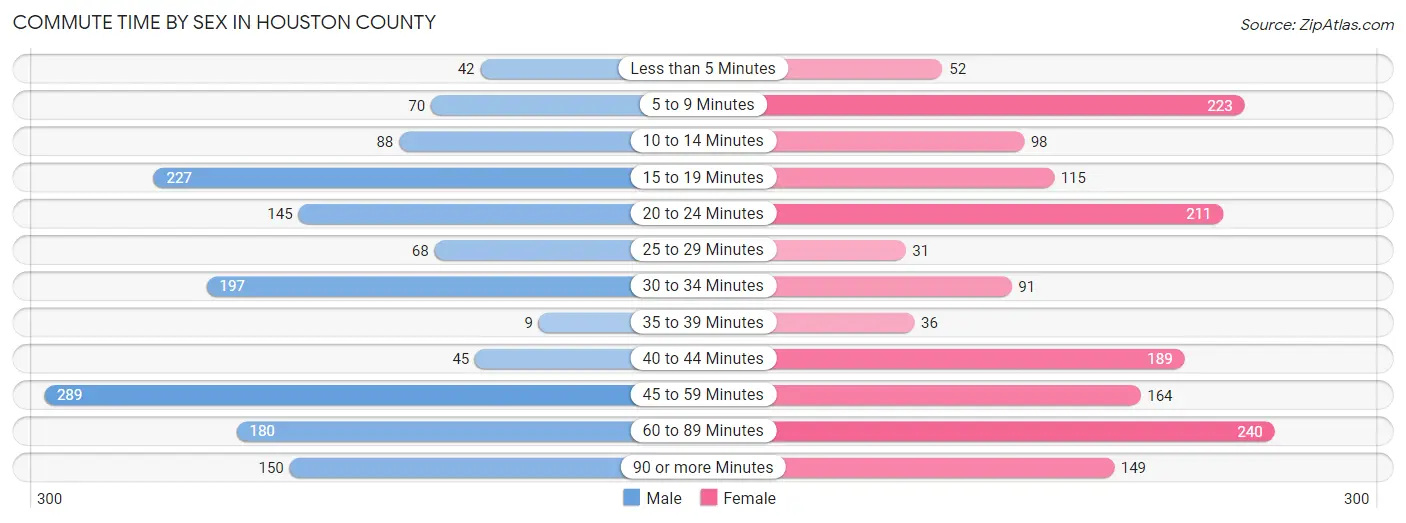
| Commute Time | Male | Female |
| Less than 5 Minutes | 42 (2.8%) | 52 (3.3%) |
| 5 to 9 Minutes | 70 (4.6%) | 223 (14.0%) |
| 10 to 14 Minutes | 88 (5.8%) | 98 (6.1%) |
| 15 to 19 Minutes | 227 (15.0%) | 115 (7.2%) |
| 20 to 24 Minutes | 145 (9.6%) | 211 (13.2%) |
| 25 to 29 Minutes | 68 (4.5%) | 31 (1.9%) |
| 30 to 34 Minutes | 197 (13.1%) | 91 (5.7%) |
| 35 to 39 Minutes | 9 (0.6%) | 36 (2.2%) |
| 40 to 44 Minutes | 45 (3.0%) | 189 (11.8%) |
| 45 to 59 Minutes | 289 (19.1%) | 164 (10.3%) |
| 60 to 89 Minutes | 180 (11.9%) | 240 (15.0%) |
| 90 or more Minutes | 150 (9.9%) | 149 (9.3%) |
Time of Departure to Work by Sex in Houston County
The most frequent times of departure to work in Houston County are 6:00 AM to 6:29 AM (366, 24.2%) for males and 6:30 AM to 6:59 AM (239, 14.9%) for females.
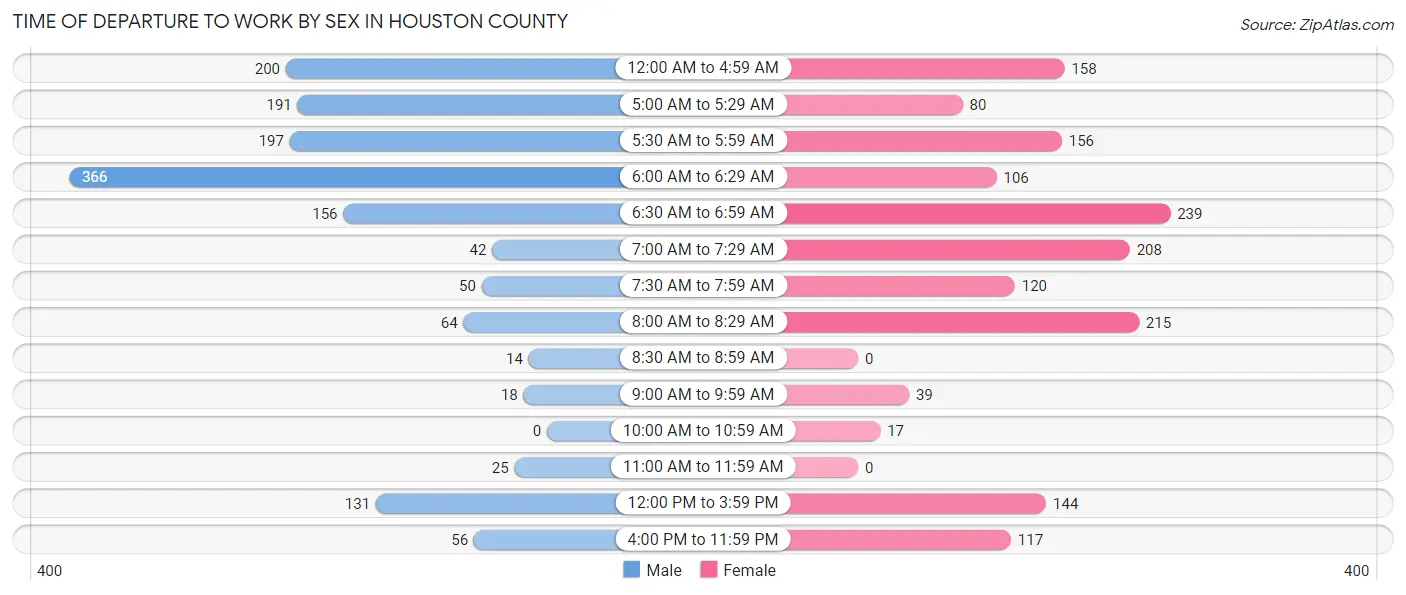
| Time of Departure | Male | Female |
| 12:00 AM to 4:59 AM | 200 (13.3%) | 158 (9.9%) |
| 5:00 AM to 5:29 AM | 191 (12.7%) | 80 (5.0%) |
| 5:30 AM to 5:59 AM | 197 (13.1%) | 156 (9.8%) |
| 6:00 AM to 6:29 AM | 366 (24.2%) | 106 (6.6%) |
| 6:30 AM to 6:59 AM | 156 (10.3%) | 239 (14.9%) |
| 7:00 AM to 7:29 AM | 42 (2.8%) | 208 (13.0%) |
| 7:30 AM to 7:59 AM | 50 (3.3%) | 120 (7.5%) |
| 8:00 AM to 8:29 AM | 64 (4.2%) | 215 (13.5%) |
| 8:30 AM to 8:59 AM | 14 (0.9%) | 0 (0.0%) |
| 9:00 AM to 9:59 AM | 18 (1.2%) | 39 (2.4%) |
| 10:00 AM to 10:59 AM | 0 (0.0%) | 17 (1.1%) |
| 11:00 AM to 11:59 AM | 25 (1.7%) | 0 (0.0%) |
| 12:00 PM to 3:59 PM | 131 (8.7%) | 144 (9.0%) |
| 4:00 PM to 11:59 PM | 56 (3.7%) | 117 (7.3%) |
| Total | 1,510 (100.0%) | 1,599 (100.0%) |
Housing Occupancy in Houston County
Occupancy by Ownership in Houston County
Of the total 3,026 dwellings in Houston County, owner-occupied units account for 2,422 (80.0%), while renter-occupied units make up 604 (20.0%).
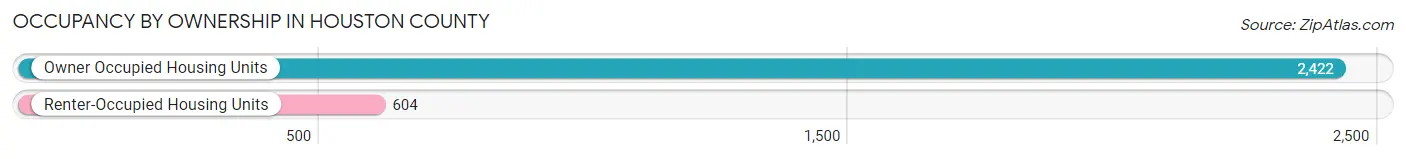
| Occupancy | # Housing Units | % Housing Units |
| Owner Occupied Housing Units | 2,422 | 80.0% |
| Renter-Occupied Housing Units | 604 | 20.0% |
| Total Occupied Housing Units | 3,026 | 100.0% |
Occupancy by Household Size in Houston County
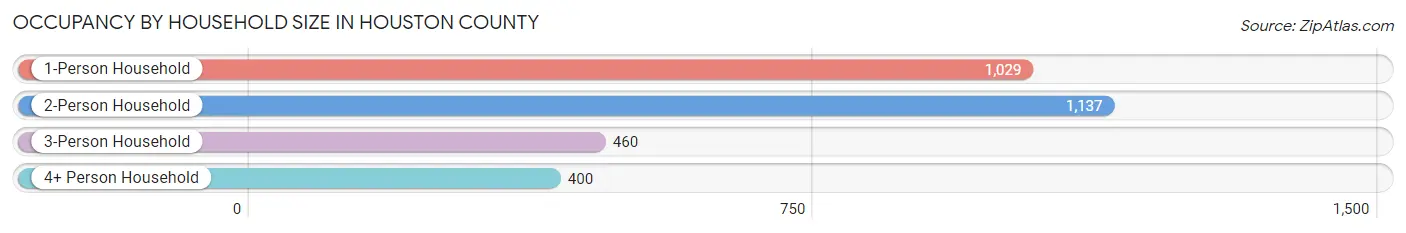
| Household Size | # Housing Units | % Housing Units |
| 1-Person Household | 1,029 | 34.0% |
| 2-Person Household | 1,137 | 37.6% |
| 3-Person Household | 460 | 15.2% |
| 4+ Person Household | 400 | 13.2% |
| Total Housing Units | 3,026 | 100.0% |
Occupancy by Ownership by Household Size in Houston County
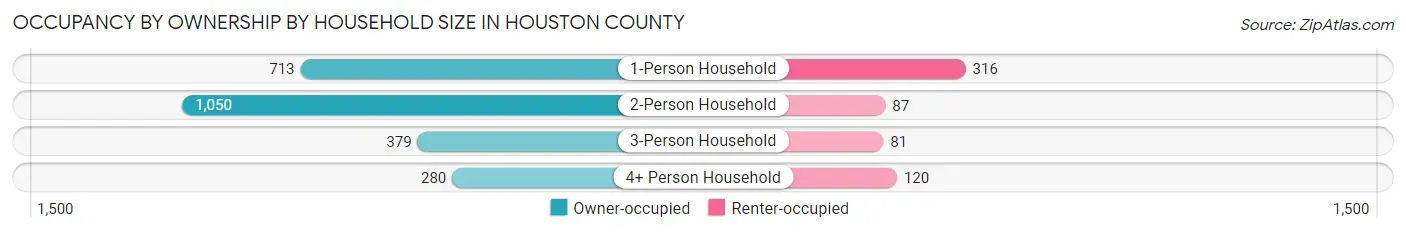
| Household Size | Owner-occupied | Renter-occupied |
| 1-Person Household | 713 (69.3%) | 316 (30.7%) |
| 2-Person Household | 1,050 (92.3%) | 87 (7.6%) |
| 3-Person Household | 379 (82.4%) | 81 (17.6%) |
| 4+ Person Household | 280 (70.0%) | 120 (30.0%) |
| Total Housing Units | 2,422 (80.0%) | 604 (20.0%) |
Occupancy by Educational Attainment in Houston County
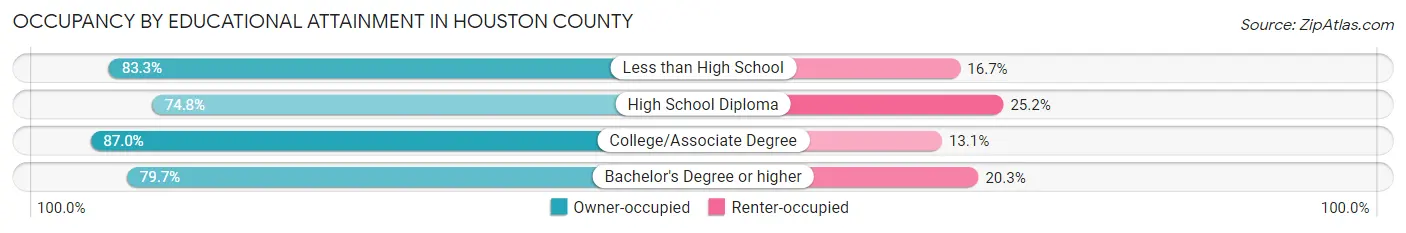
| Household Size | Owner-occupied | Renter-occupied |
| Less than High School | 369 (83.3%) | 74 (16.7%) |
| High School Diploma | 1,001 (74.8%) | 338 (25.2%) |
| College/Associate Degree | 726 (87.0%) | 109 (13.1%) |
| Bachelor's Degree or higher | 326 (79.7%) | 83 (20.3%) |
Occupancy by Age of Householder in Houston County
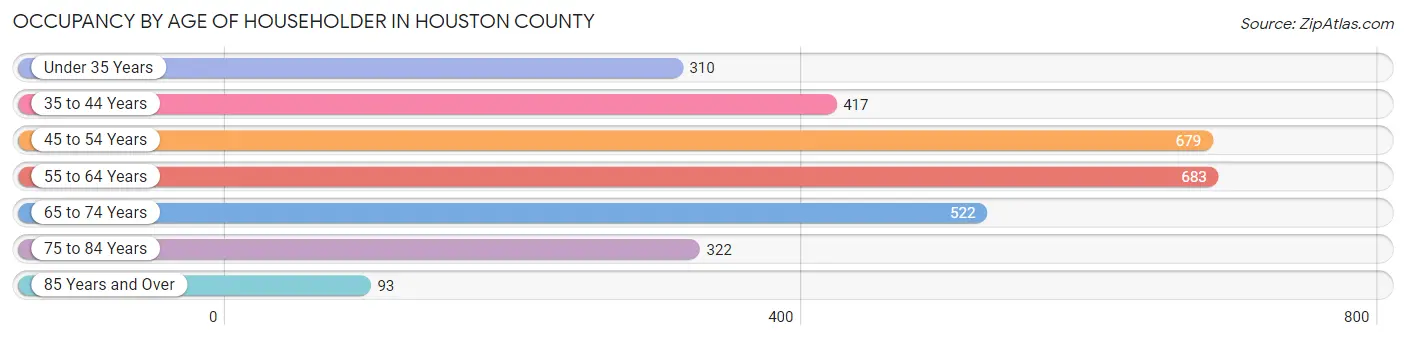
| Age Bracket | # Households | % Households |
| Under 35 Years | 310 | 10.2% |
| 35 to 44 Years | 417 | 13.8% |
| 45 to 54 Years | 679 | 22.4% |
| 55 to 64 Years | 683 | 22.6% |
| 65 to 74 Years | 522 | 17.2% |
| 75 to 84 Years | 322 | 10.6% |
| 85 Years and Over | 93 | 3.1% |
| Total | 3,026 | 100.0% |
Housing Finances in Houston County
Median Income by Occupancy in Houston County
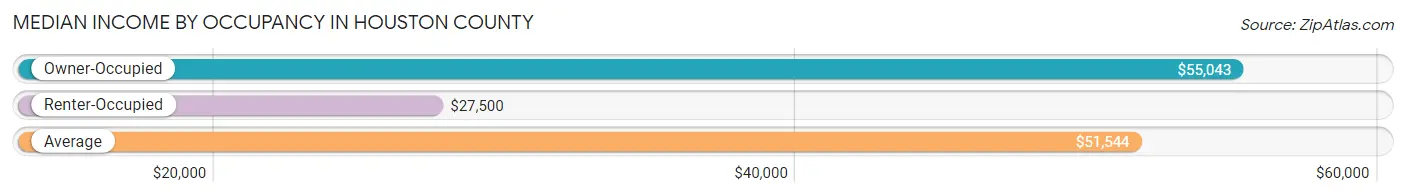
| Occupancy Type | # Households | Median Income |
| Owner-Occupied | 2,422 (80.0%) | $55,043 |
| Renter-Occupied | 604 (20.0%) | $27,500 |
| Average | 3,026 (100.0%) | $51,544 |
Occupancy by Householder Income Bracket in Houston County
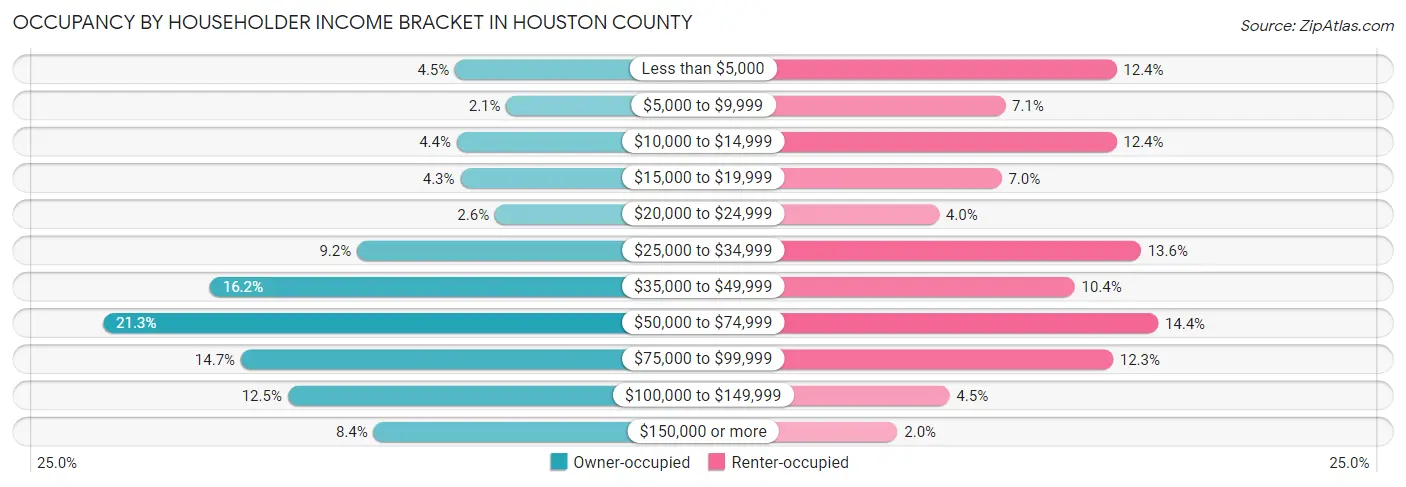
| Income Bracket | Owner-occupied | Renter-occupied |
| Less than $5,000 | 109 (4.5%) | 75 (12.4%) |
| $5,000 to $9,999 | 50 (2.1%) | 43 (7.1%) |
| $10,000 to $14,999 | 107 (4.4%) | 75 (12.4%) |
| $15,000 to $19,999 | 103 (4.3%) | 42 (7.0%) |
| $20,000 to $24,999 | 63 (2.6%) | 24 (4.0%) |
| $25,000 to $34,999 | 222 (9.2%) | 82 (13.6%) |
| $35,000 to $49,999 | 392 (16.2%) | 63 (10.4%) |
| $50,000 to $74,999 | 515 (21.3%) | 87 (14.4%) |
| $75,000 to $99,999 | 356 (14.7%) | 74 (12.2%) |
| $100,000 to $149,999 | 302 (12.5%) | 27 (4.5%) |
| $150,000 or more | 203 (8.4%) | 12 (2.0%) |
| Total | 2,422 (100.0%) | 604 (100.0%) |
Monthly Housing Cost Tiers in Houston County
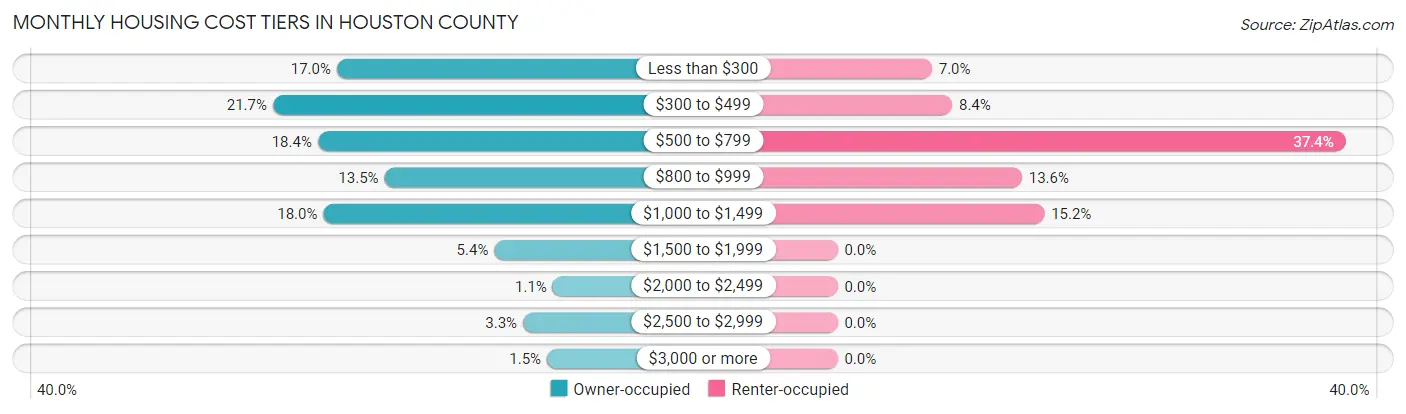
| Monthly Cost | Owner-occupied | Renter-occupied |
| Less than $300 | 412 (17.0%) | 42 (7.0%) |
| $300 to $499 | 526 (21.7%) | 51 (8.4%) |
| $500 to $799 | 446 (18.4%) | 226 (37.4%) |
| $800 to $999 | 327 (13.5%) | 82 (13.6%) |
| $1,000 to $1,499 | 436 (18.0%) | 92 (15.2%) |
| $1,500 to $1,999 | 131 (5.4%) | 0 (0.0%) |
| $2,000 to $2,499 | 27 (1.1%) | 0 (0.0%) |
| $2,500 to $2,999 | 80 (3.3%) | 0 (0.0%) |
| $3,000 or more | 37 (1.5%) | 0 (0.0%) |
| Total | 2,422 (100.0%) | 604 (100.0%) |
Physical Housing Characteristics in Houston County
Housing Structures in Houston County
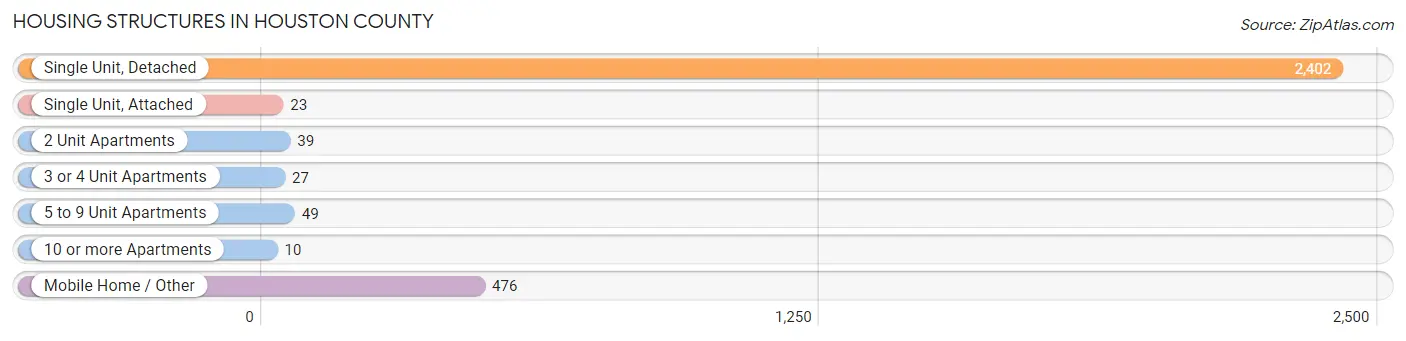
| Structure Type | # Housing Units | % Housing Units |
| Single Unit, Detached | 2,402 | 79.4% |
| Single Unit, Attached | 23 | 0.8% |
| 2 Unit Apartments | 39 | 1.3% |
| 3 or 4 Unit Apartments | 27 | 0.9% |
| 5 to 9 Unit Apartments | 49 | 1.6% |
| 10 or more Apartments | 10 | 0.3% |
| Mobile Home / Other | 476 | 15.7% |
| Total | 3,026 | 100.0% |
Housing Structures by Occupancy in Houston County
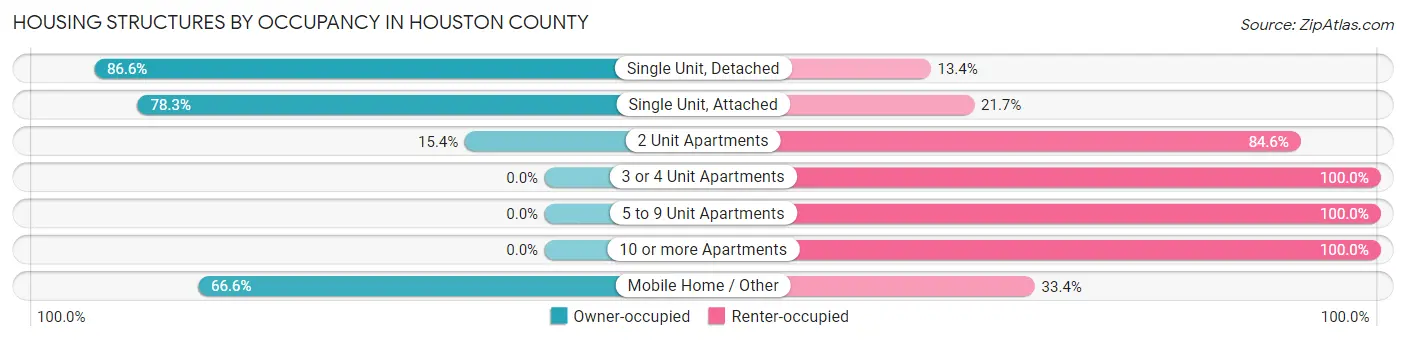
| Structure Type | Owner-occupied | Renter-occupied |
| Single Unit, Detached | 2,081 (86.6%) | 321 (13.4%) |
| Single Unit, Attached | 18 (78.3%) | 5 (21.7%) |
| 2 Unit Apartments | 6 (15.4%) | 33 (84.6%) |
| 3 or 4 Unit Apartments | 0 (0.0%) | 27 (100.0%) |
| 5 to 9 Unit Apartments | 0 (0.0%) | 49 (100.0%) |
| 10 or more Apartments | 0 (0.0%) | 10 (100.0%) |
| Mobile Home / Other | 317 (66.6%) | 159 (33.4%) |
| Total | 2,422 (80.0%) | 604 (20.0%) |
Housing Structures by Number of Rooms in Houston County
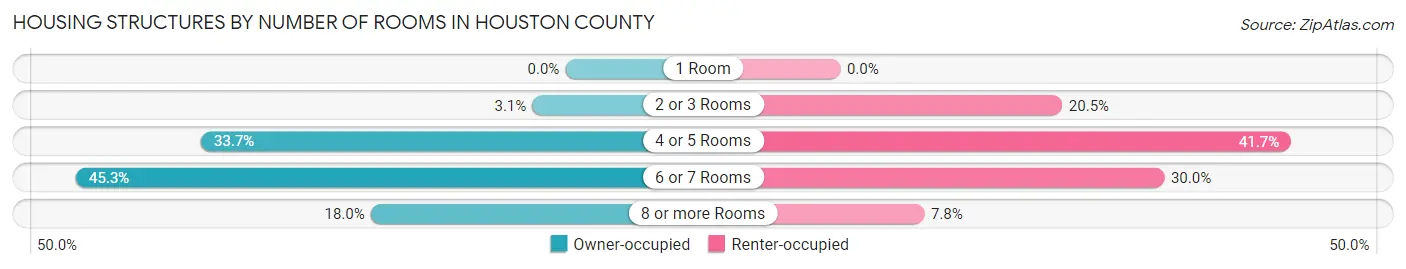
| Number of Rooms | Owner-occupied | Renter-occupied |
| 1 Room | 0 (0.0%) | 0 (0.0%) |
| 2 or 3 Rooms | 74 (3.1%) | 124 (20.5%) |
| 4 or 5 Rooms | 816 (33.7%) | 252 (41.7%) |
| 6 or 7 Rooms | 1,096 (45.3%) | 181 (30.0%) |
| 8 or more Rooms | 436 (18.0%) | 47 (7.8%) |
| Total | 2,422 (100.0%) | 604 (100.0%) |
Housing Structure by Heating Type in Houston County
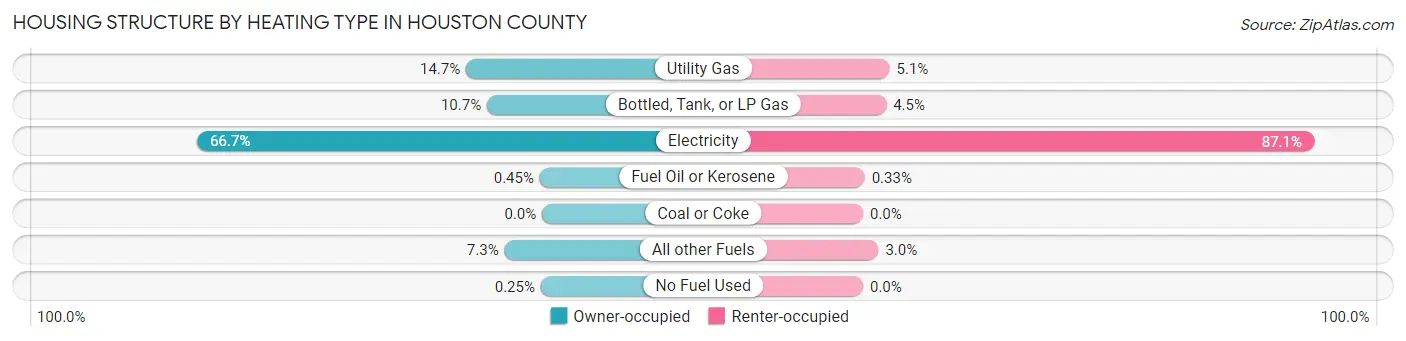
| Heating Type | Owner-occupied | Renter-occupied |
| Utility Gas | 356 (14.7%) | 31 (5.1%) |
| Bottled, Tank, or LP Gas | 258 (10.6%) | 27 (4.5%) |
| Electricity | 1,615 (66.7%) | 526 (87.1%) |
| Fuel Oil or Kerosene | 11 (0.4%) | 2 (0.3%) |
| Coal or Coke | 0 (0.0%) | 0 (0.0%) |
| All other Fuels | 176 (7.3%) | 18 (3.0%) |
| No Fuel Used | 6 (0.3%) | 0 (0.0%) |
| Total | 2,422 (100.0%) | 604 (100.0%) |
Household Vehicle Usage in Houston County
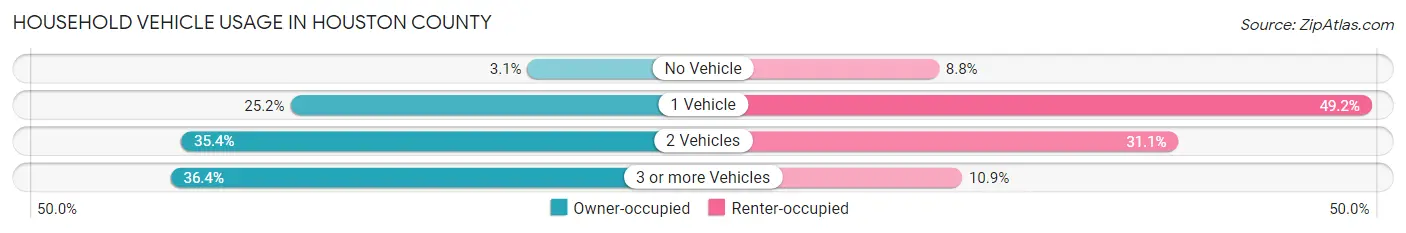
| Vehicles per Household | Owner-occupied | Renter-occupied |
| No Vehicle | 74 (3.1%) | 53 (8.8%) |
| 1 Vehicle | 610 (25.2%) | 297 (49.2%) |
| 2 Vehicles | 857 (35.4%) | 188 (31.1%) |
| 3 or more Vehicles | 881 (36.4%) | 66 (10.9%) |
| Total | 2,422 (100.0%) | 604 (100.0%) |
Real Estate & Mortgages in Houston County
Real Estate and Mortgage Overview in Houston County
| Characteristic | Without Mortgage | With Mortgage |
| Housing Units | 1,422 | 1,000 |
| Median Property Value | $119,500 | $173,100 |
| Median Household Income | $49,777 | $122 |
| Monthly Housing Costs | $394 | $37 |
| Real Estate Taxes | $781 | $17 |
Property Value by Mortgage Status in Houston County
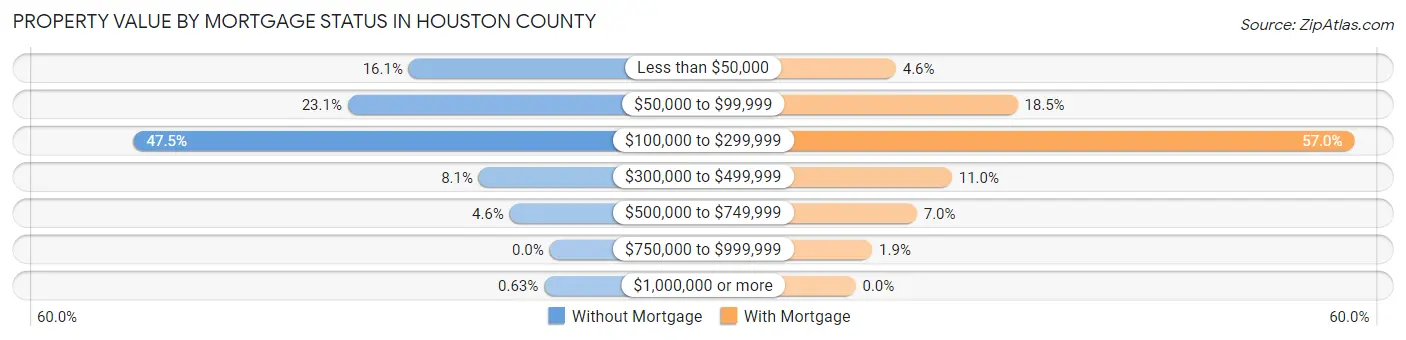
| Property Value | Without Mortgage | With Mortgage |
| Less than $50,000 | 229 (16.1%) | 46 (4.6%) |
| $50,000 to $99,999 | 328 (23.1%) | 185 (18.5%) |
| $100,000 to $299,999 | 676 (47.5%) | 570 (57.0%) |
| $300,000 to $499,999 | 115 (8.1%) | 110 (11.0%) |
| $500,000 to $749,999 | 65 (4.6%) | 70 (7.0%) |
| $750,000 to $999,999 | 0 (0.0%) | 19 (1.9%) |
| $1,000,000 or more | 9 (0.6%) | 0 (0.0%) |
| Total | 1,422 (100.0%) | 1,000 (100.0%) |
Household Income by Mortgage Status in Houston County
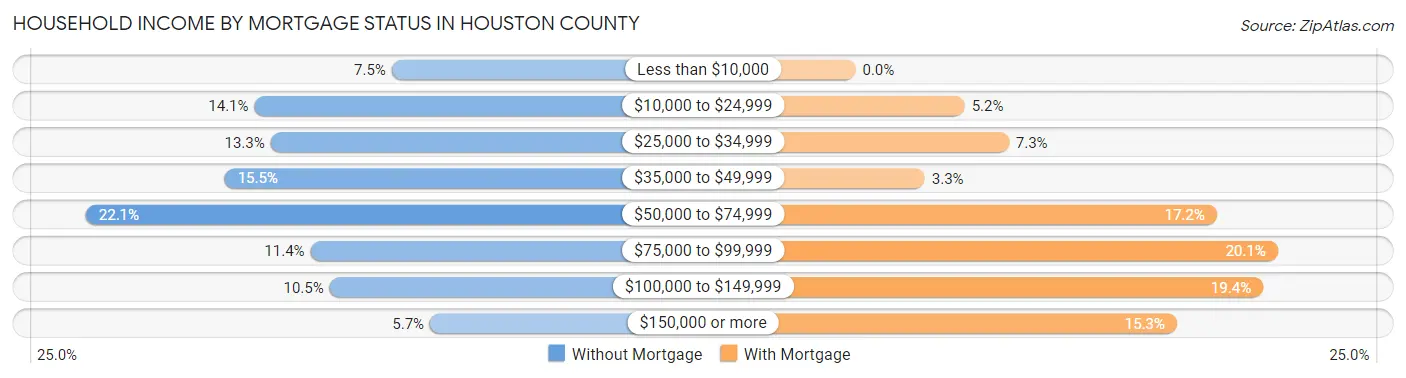
| Household Income | Without Mortgage | With Mortgage |
| Less than $10,000 | 107 (7.5%) | 0 (0.0%) |
| $10,000 to $24,999 | 200 (14.1%) | 52 (5.2%) |
| $25,000 to $34,999 | 189 (13.3%) | 73 (7.3%) |
| $35,000 to $49,999 | 220 (15.5%) | 33 (3.3%) |
| $50,000 to $74,999 | 314 (22.1%) | 172 (17.2%) |
| $75,000 to $99,999 | 162 (11.4%) | 201 (20.1%) |
| $100,000 to $149,999 | 149 (10.5%) | 194 (19.4%) |
| $150,000 or more | 81 (5.7%) | 153 (15.3%) |
| Total | 1,422 (100.0%) | 1,000 (100.0%) |
Property Value to Household Income Ratio in Houston County
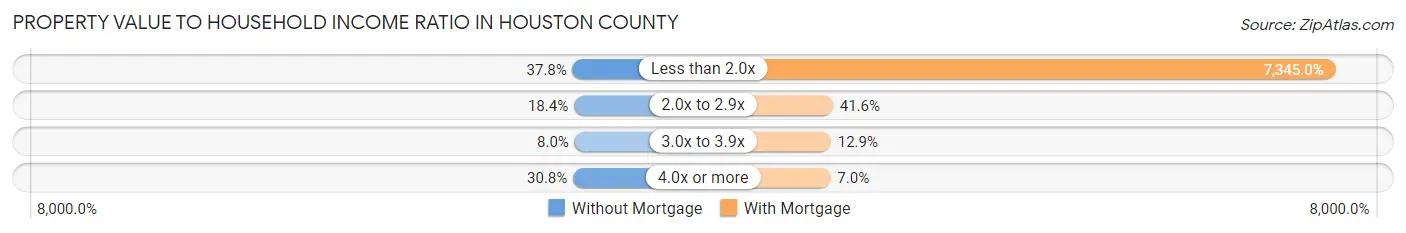
| Value-to-Income Ratio | Without Mortgage | With Mortgage |
| Less than 2.0x | 537 (37.8%) | 73,450 (7,345.0%) |
| 2.0x to 2.9x | 262 (18.4%) | 416 (41.6%) |
| 3.0x to 3.9x | 114 (8.0%) | 129 (12.9%) |
| 4.0x or more | 438 (30.8%) | 70 (7.0%) |
| Total | 1,422 (100.0%) | 1,000 (100.0%) |
Real Estate Taxes by Mortgage Status in Houston County
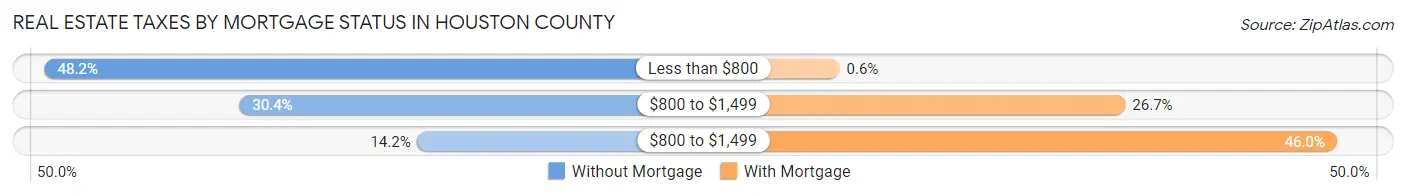
| Property Taxes | Without Mortgage | With Mortgage |
| Less than $800 | 685 (48.2%) | 6 (0.6%) |
| $800 to $1,499 | 432 (30.4%) | 267 (26.7%) |
| $800 to $1,499 | 202 (14.2%) | 460 (46.0%) |
| Total | 1,422 (100.0%) | 1,000 (100.0%) |
Health & Disability in Houston County
Health Insurance Coverage by Age in Houston County
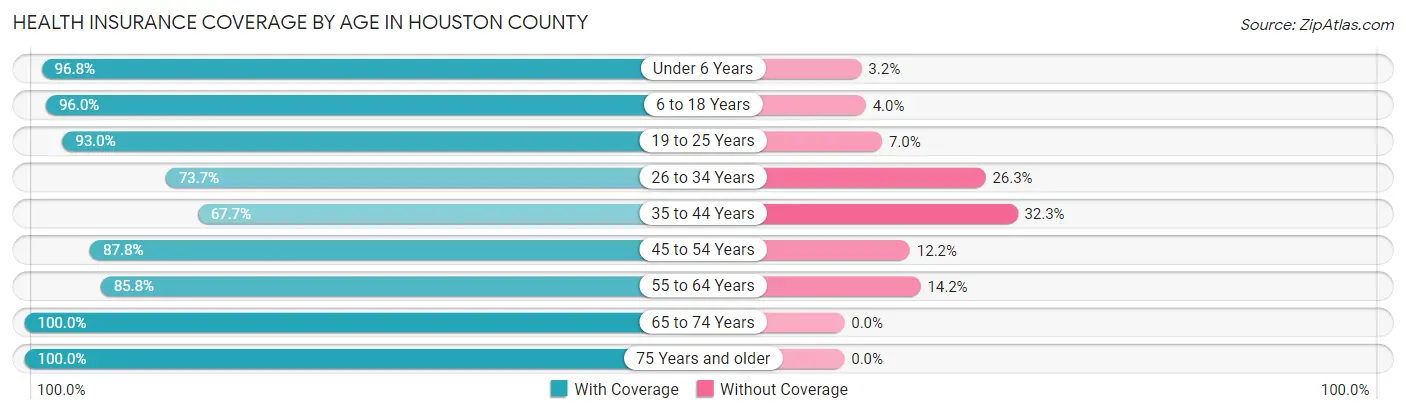
| Age Bracket | With Coverage | Without Coverage |
| Under 6 Years | 485 (96.8%) | 16 (3.2%) |
| 6 to 18 Years | 1,394 (96.0%) | 58 (4.0%) |
| 19 to 25 Years | 541 (93.0%) | 41 (7.0%) |
| 26 to 34 Years | 602 (73.7%) | 215 (26.3%) |
| 35 to 44 Years | 604 (67.7%) | 288 (32.3%) |
| 45 to 54 Years | 983 (87.8%) | 137 (12.2%) |
| 55 to 64 Years | 991 (85.8%) | 164 (14.2%) |
| 65 to 74 Years | 916 (100.0%) | 0 (0.0%) |
| 75 Years and older | 617 (100.0%) | 0 (0.0%) |
| Total | 7,133 (88.6%) | 919 (11.4%) |
Health Insurance Coverage by Citizenship Status in Houston County
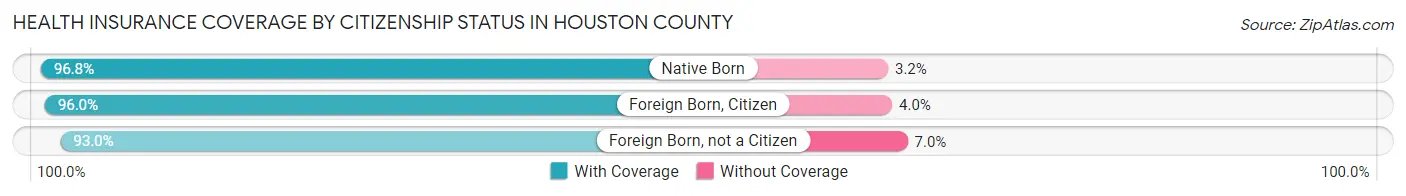
| Citizenship Status | With Coverage | Without Coverage |
| Native Born | 485 (96.8%) | 16 (3.2%) |
| Foreign Born, Citizen | 1,394 (96.0%) | 58 (4.0%) |
| Foreign Born, not a Citizen | 541 (93.0%) | 41 (7.0%) |
Health Insurance Coverage by Household Income in Houston County
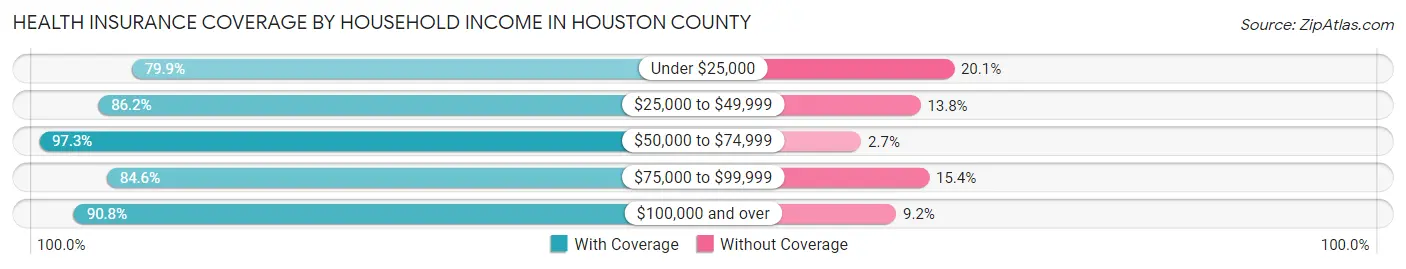
| Household Income | With Coverage | Without Coverage |
| Under $25,000 | 828 (79.9%) | 208 (20.1%) |
| $25,000 to $49,999 | 1,455 (86.2%) | 233 (13.8%) |
| $50,000 to $74,999 | 1,553 (97.3%) | 43 (2.7%) |
| $75,000 to $99,999 | 1,213 (84.6%) | 221 (15.4%) |
| $100,000 and over | 2,066 (90.8%) | 210 (9.2%) |
Public vs Private Health Insurance Coverage by Age in Houston County
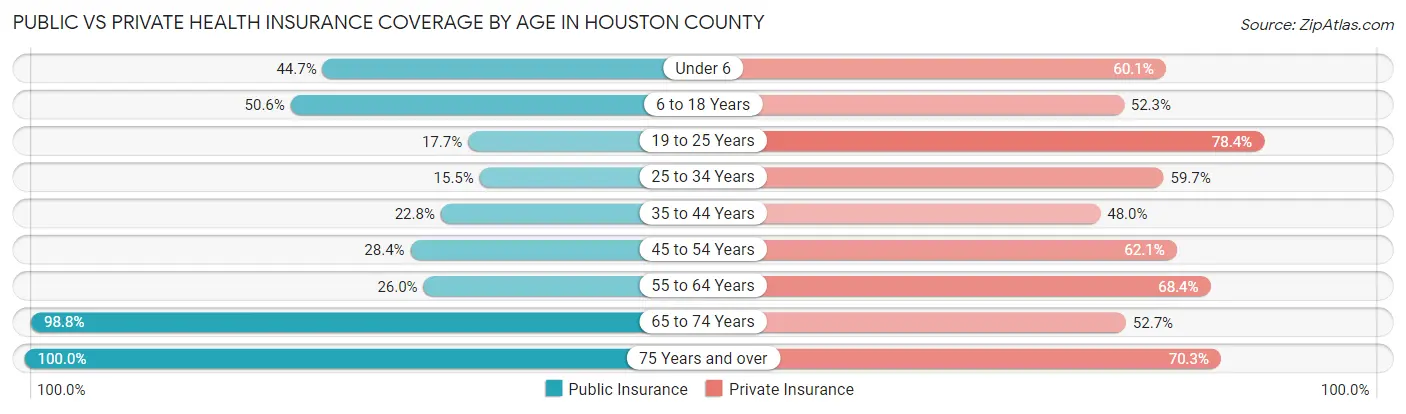
| Age Bracket | Public Insurance | Private Insurance |
| Under 6 | 224 (44.7%) | 301 (60.1%) |
| 6 to 18 Years | 735 (50.6%) | 760 (52.3%) |
| 19 to 25 Years | 103 (17.7%) | 456 (78.3%) |
| 25 to 34 Years | 127 (15.5%) | 488 (59.7%) |
| 35 to 44 Years | 203 (22.8%) | 428 (48.0%) |
| 45 to 54 Years | 318 (28.4%) | 696 (62.1%) |
| 55 to 64 Years | 300 (26.0%) | 790 (68.4%) |
| 65 to 74 Years | 905 (98.8%) | 483 (52.7%) |
| 75 Years and over | 617 (100.0%) | 434 (70.3%) |
| Total | 3,532 (43.9%) | 4,836 (60.1%) |
Disability Status by Sex by Age in Houston County
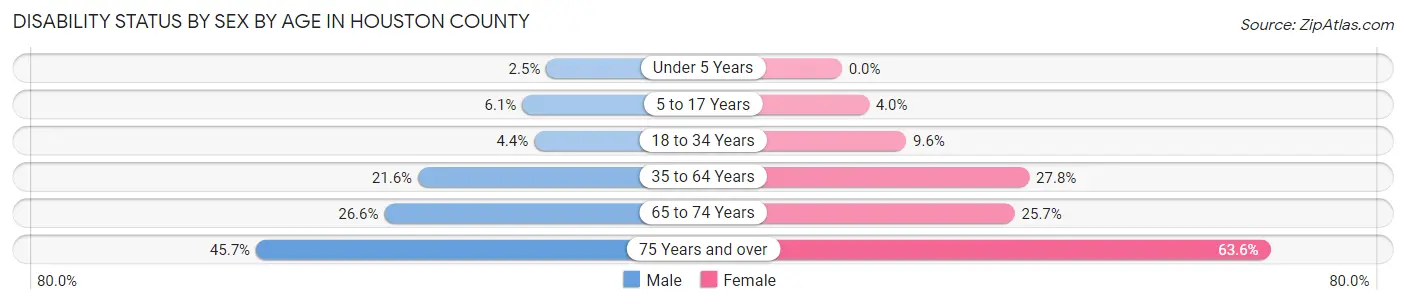
| Age Bracket | Male | Female |
| Under 5 Years | 5 (2.5%) | 0 (0.0%) |
| 5 to 17 Years | 48 (6.1%) | 25 (4.0%) |
| 18 to 34 Years | 32 (4.3%) | 79 (9.6%) |
| 35 to 64 Years | 337 (21.6%) | 447 (27.8%) |
| 65 to 74 Years | 113 (26.6%) | 126 (25.7%) |
| 75 Years and over | 126 (45.7%) | 217 (63.6%) |
Disability Class by Sex by Age in Houston County
Disability Class: Hearing Difficulty
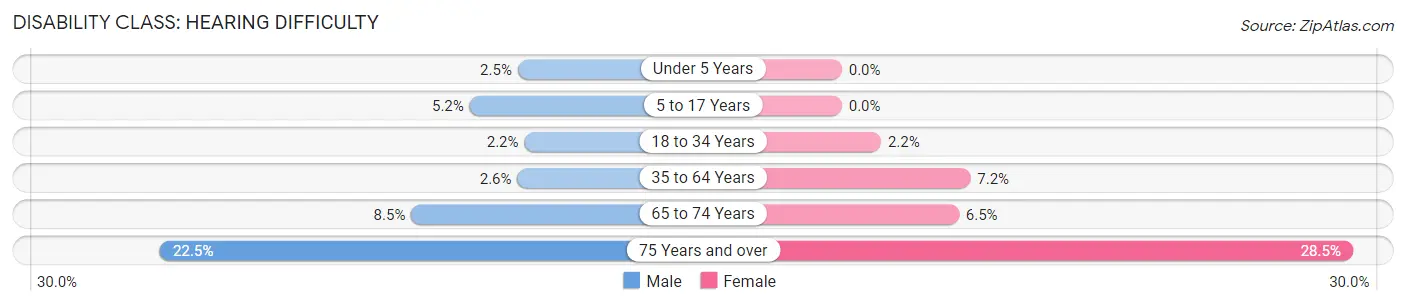
| Age Bracket | Male | Female |
| Under 5 Years | 5 (2.5%) | 0 (0.0%) |
| 5 to 17 Years | 41 (5.2%) | 0 (0.0%) |
| 18 to 34 Years | 16 (2.2%) | 18 (2.2%) |
| 35 to 64 Years | 40 (2.6%) | 115 (7.2%) |
| 65 to 74 Years | 36 (8.5%) | 32 (6.5%) |
| 75 Years and over | 62 (22.5%) | 97 (28.4%) |
Disability Class: Vision Difficulty
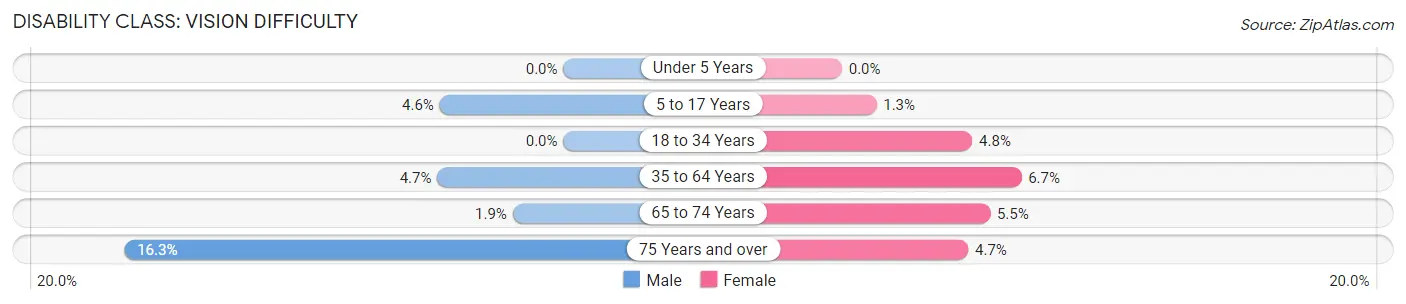
| Age Bracket | Male | Female |
| Under 5 Years | 0 (0.0%) | 0 (0.0%) |
| 5 to 17 Years | 36 (4.6%) | 8 (1.3%) |
| 18 to 34 Years | 0 (0.0%) | 40 (4.8%) |
| 35 to 64 Years | 73 (4.7%) | 107 (6.7%) |
| 65 to 74 Years | 8 (1.9%) | 27 (5.5%) |
| 75 Years and over | 45 (16.3%) | 16 (4.7%) |
Disability Class: Cognitive Difficulty
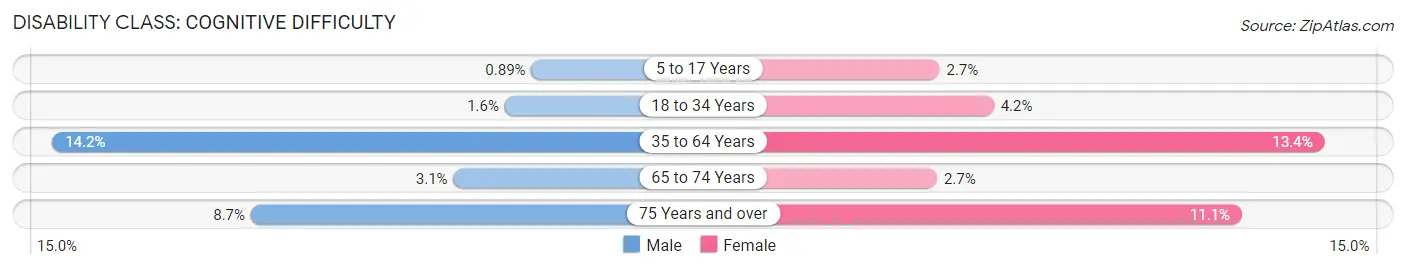
| Age Bracket | Male | Female |
| 5 to 17 Years | 7 (0.9%) | 17 (2.7%) |
| 18 to 34 Years | 12 (1.6%) | 35 (4.2%) |
| 35 to 64 Years | 222 (14.2%) | 216 (13.4%) |
| 65 to 74 Years | 13 (3.1%) | 13 (2.6%) |
| 75 Years and over | 24 (8.7%) | 38 (11.1%) |
Disability Class: Ambulatory Difficulty
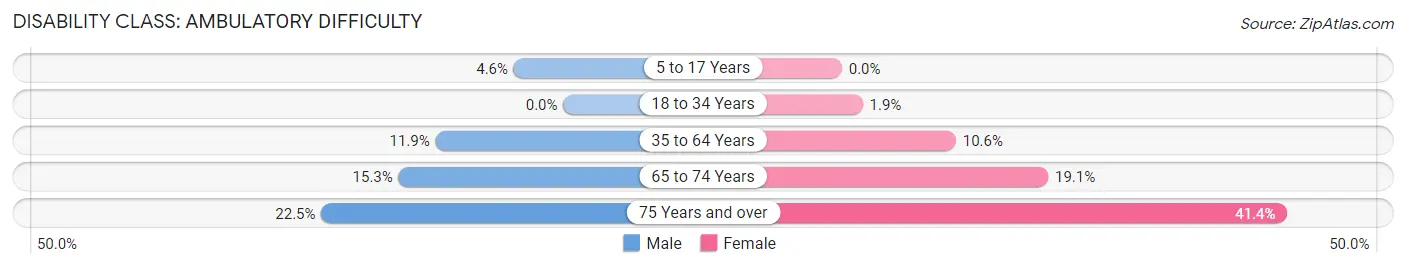
| Age Bracket | Male | Female |
| 5 to 17 Years | 36 (4.6%) | 0 (0.0%) |
| 18 to 34 Years | 0 (0.0%) | 16 (1.9%) |
| 35 to 64 Years | 185 (11.9%) | 170 (10.6%) |
| 65 to 74 Years | 65 (15.3%) | 94 (19.1%) |
| 75 Years and over | 62 (22.5%) | 141 (41.3%) |
Disability Class: Self-Care Difficulty
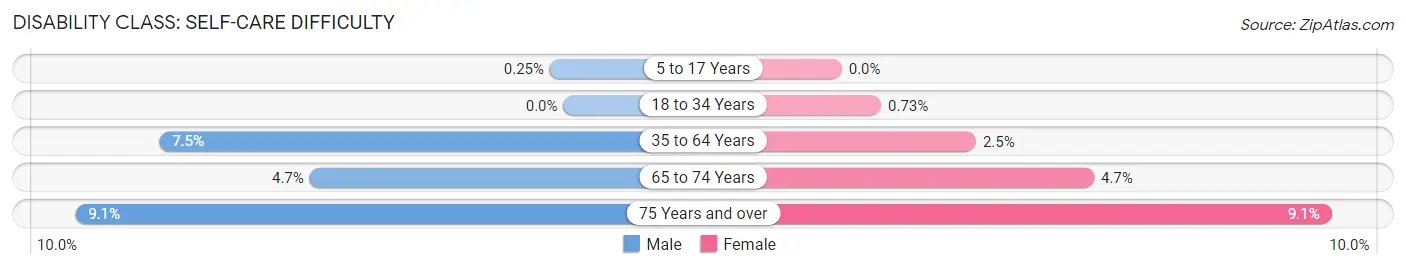
| Age Bracket | Male | Female |
| 5 to 17 Years | 2 (0.3%) | 0 (0.0%) |
| 18 to 34 Years | 0 (0.0%) | 6 (0.7%) |
| 35 to 64 Years | 117 (7.5%) | 40 (2.5%) |
| 65 to 74 Years | 20 (4.7%) | 23 (4.7%) |
| 75 Years and over | 25 (9.1%) | 31 (9.1%) |
Technology Access in Houston County
Computing Device Access in Houston County
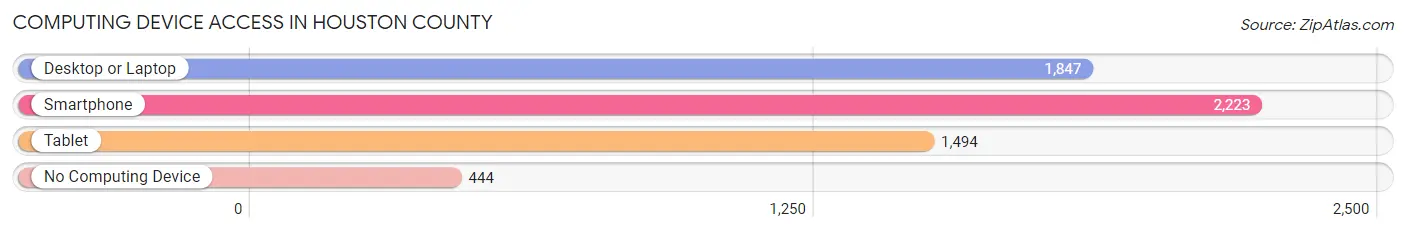
| Device Type | # Households | % Households |
| Desktop or Laptop | 1,847 | 61.0% |
| Smartphone | 2,223 | 73.5% |
| Tablet | 1,494 | 49.4% |
| No Computing Device | 444 | 14.7% |
| Total | 3,026 | 100.0% |
Internet Access in Houston County
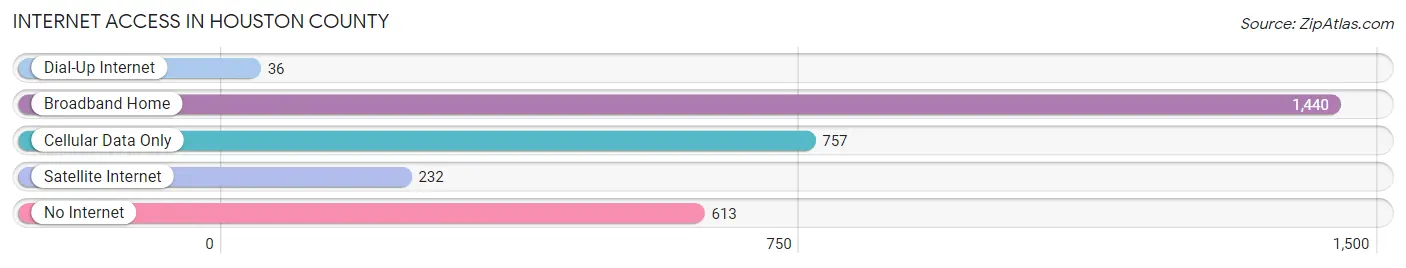
| Internet Type | # Households | % Households |
| Dial-Up Internet | 36 | 1.2% |
| Broadband Home | 1,440 | 47.6% |
| Cellular Data Only | 757 | 25.0% |
| Satellite Internet | 232 | 7.7% |
| No Internet | 613 | 20.3% |
| Total | 3,026 | 100.0% |
Houston County Summary
History
Located in the northwest corner of Tennessee, Houston County was established in 1871 and named after Sam Houston, the first president of the Republic of Texas. The county was formed from parts of Stewart, Humphreys, and Montgomery counties. The county seat is Erin, which was founded in 1876.
The area that is now Houston County was originally inhabited by Native Americans, including the Chickasaw, Cherokee, and Shawnee tribes. The first European settlers arrived in the area in the late 1700s. The county was largely agricultural, with cotton and tobacco being the main crops.
In the early 1900s, the county experienced a period of growth and development. The Tennessee Central Railway was built through the county in 1902, connecting it to other parts of the state. This allowed for the development of new towns and industries, such as the Houston Manufacturing Company, which was established in Erin in 1906.
Geography
Houston County is located in the northwest corner of Tennessee, bordering Kentucky to the north and the Tennessee River to the west. The county covers an area of 517 square miles and is home to a population of approximately 10,000 people.
The terrain of the county is mostly flat, with some rolling hills in the northern and western parts. The county is drained by the Tennessee River and its tributaries, including the Caney Fork, Big Sandy, and Little Sandy rivers. The county is also home to several lakes, including Lake Houston, Lake Barkley, and Lake Tansi.
Economy
Houston County is largely rural, with agriculture being the main economic activity. The county is home to several large farms, which produce a variety of crops, including cotton, soybeans, corn, and wheat. Livestock production is also important, with cattle, hogs, and poultry being the main animals raised.
The county is also home to several manufacturing companies, including the Houston Manufacturing Company, which produces furniture and other wood products. Other industries in the county include tourism, retail, and healthcare.
Demographics
As of the 2010 census, the population of Houston County was 10,093. The racial makeup of the county was 95.3% White, 2.2% African American, 0.4% Native American, 0.3% Asian, 0.2% Pacific Islander, 0.7% from other races, and 0.9% from two or more races. Hispanic or Latino of any race were 1.7% of the population.
The median household income in the county was $37,945, and the median family income was $45,945. The per capita income was $19,945. About 15.3% of the population was below the poverty line.
Common Questions
What is the Total Population of Houston County?
Total Population of Houston County is 8,253.
What is the Total Male Population of Houston County?
Total Male Population of Houston County is 4,108.
What is the Total Female Population of Houston County?
Total Female Population of Houston County is 4,145.
What is the Ratio of Males per 100 Females in Houston County?
There are 99.11 Males per 100 Females in Houston County.
What is the Ratio of Females per 100 Males in Houston County?
There are 100.90 Females per 100 Males in Houston County.
What is the Median Population Age in Houston County?
Median Population Age in Houston County is 44.1 Years.
What is the Average Family Size in Houston County
Average Family Size in Houston County is 3.4 People.
What is the Average Household Size in Houston County
Average Household Size in Houston County is 2.7 People.
What is Per Capita Income in Houston County?
Per Capita income in Houston County is $27,053.
What is the Median Family Income in Houston County?
Median Family Income in Houston County is $73,000.
What is the Median Household income in Houston County?
Median Household Income in Houston County is $51,544.
What is Income or Wage Gap in Houston County?
Income or Wage Gap in Houston County is 35.8%.
Women in Houston County earn 64.2 cents for every dollar earned by a man.
What is Family Income Deficit in Houston County?
Family Income Deficit in Houston County is $8,747.
Families that are below poverty line in Houston County earn $8,747 less on average than the poverty threshold level.
What is Inequality or Gini Index in Houston County?
Inequality or Gini Index in Houston County is 0.43.
How Large is the Labor Force in Houston County?
There are 3,448 People in the Labor Forcein in Houston County.
What is the Percentage of People in the Labor Force in Houston County?
50.9% of People are in the Labor Force in Houston County.
What is the Unemployment Rate in Houston County?
Unemployment Rate in Houston County is 4.2%.