Henderson County, TN
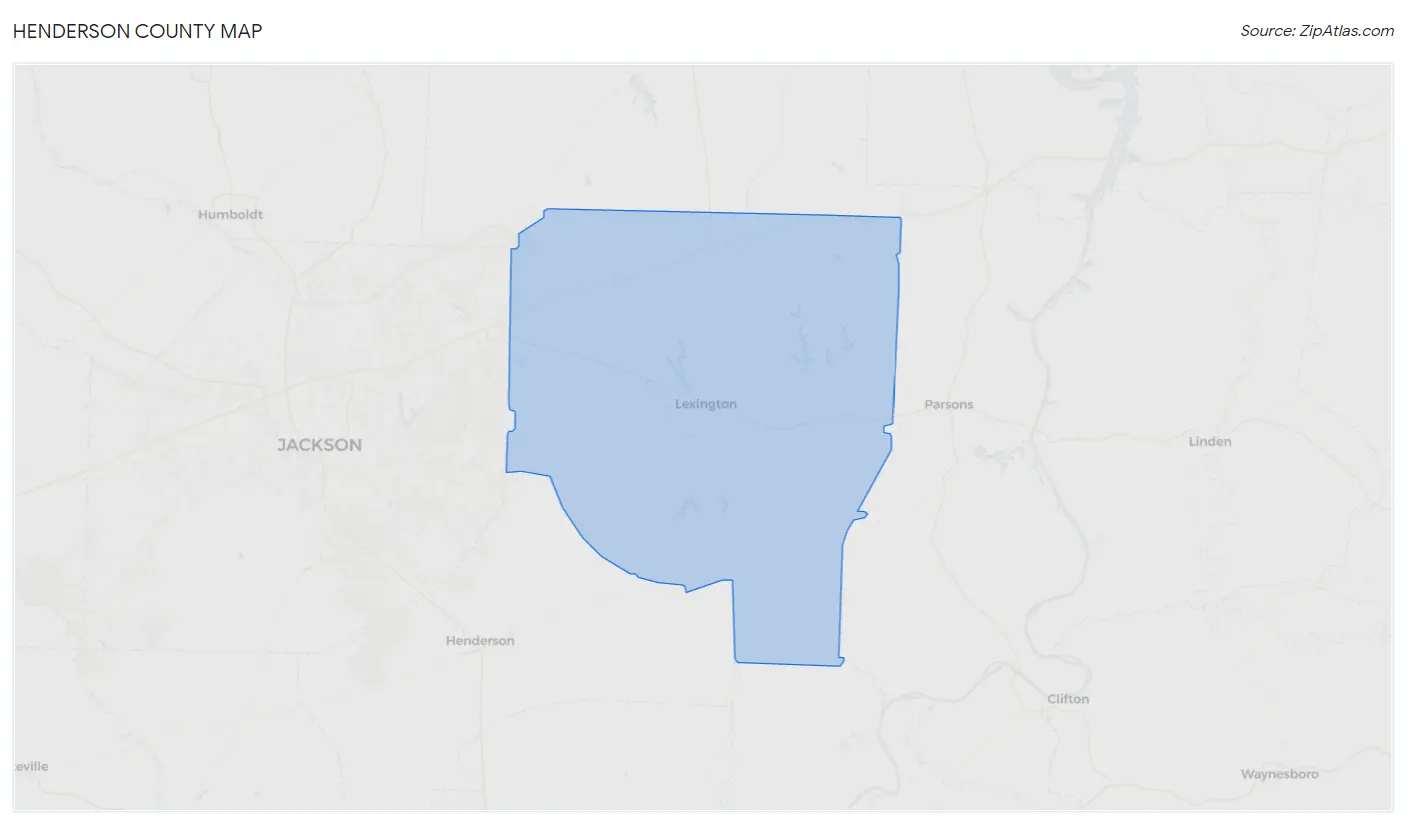
Henderson County Map
Henderson County Overview
27,845
TOTAL POPULATION
13,729
MALE POPULATION
14,116
FEMALE POPULATION
97.26
MALES / 100 FEMALES
102.82
FEMALES / 100 MALES
40.7
MEDIAN AGE
3.2
AVG FAMILY SIZE
2.6
AVG HOUSEHOLD SIZE
$25,873
PER CAPITA INCOME
$67,725
AVG FAMILY INCOME
$51,576
AVG HOUSEHOLD INCOME
29.7%
WAGE / INCOME GAP [ % ]
70.3¢/ $1
WAGE / INCOME GAP [ $ ]
$10,973
FAMILY INCOME DEFICIT
0.44
INEQUALITY / GINI INDEX
12,261
LABOR FORCE [ PEOPLE ]
54.7%
PERCENT IN LABOR FORCE
5.4%
UNEMPLOYMENT RATE
Henderson County Area Codes
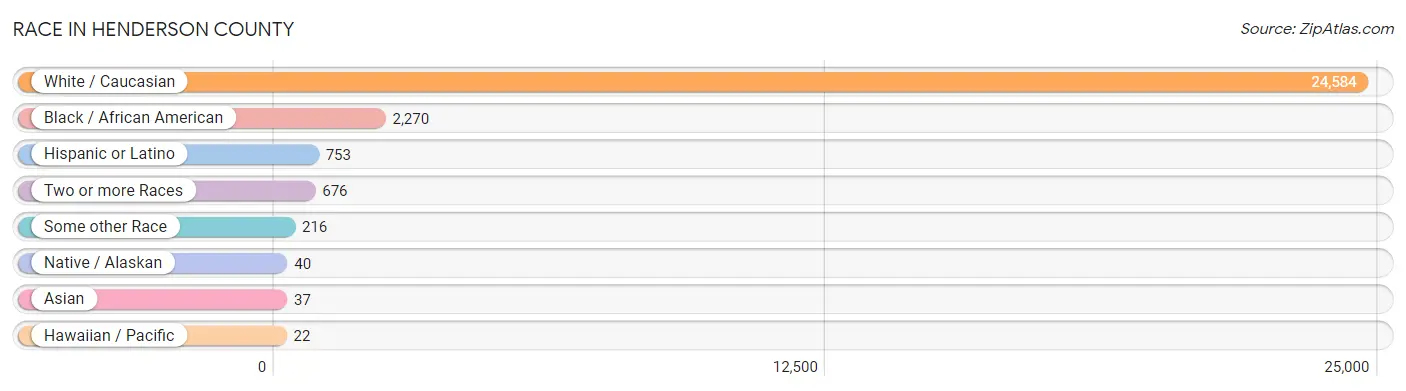
Race in Henderson County
The most populous races in Henderson County are White / Caucasian (24,584 | 88.3%), Black / African American (2,270 | 8.2%), and Hispanic or Latino (753 | 2.7%).
| Race | # Population | % Population |
| Asian | 37 | 0.1% |
| Black / African American | 2,270 | 8.2% |
| Hawaiian / Pacific | 22 | 0.1% |
| Hispanic or Latino | 753 | 2.7% |
| Native / Alaskan | 40 | 0.1% |
| White / Caucasian | 24,584 | 88.3% |
| Two or more Races | 676 | 2.4% |
| Some other Race | 216 | 0.8% |
| Total | 27,845 | 100.0% |
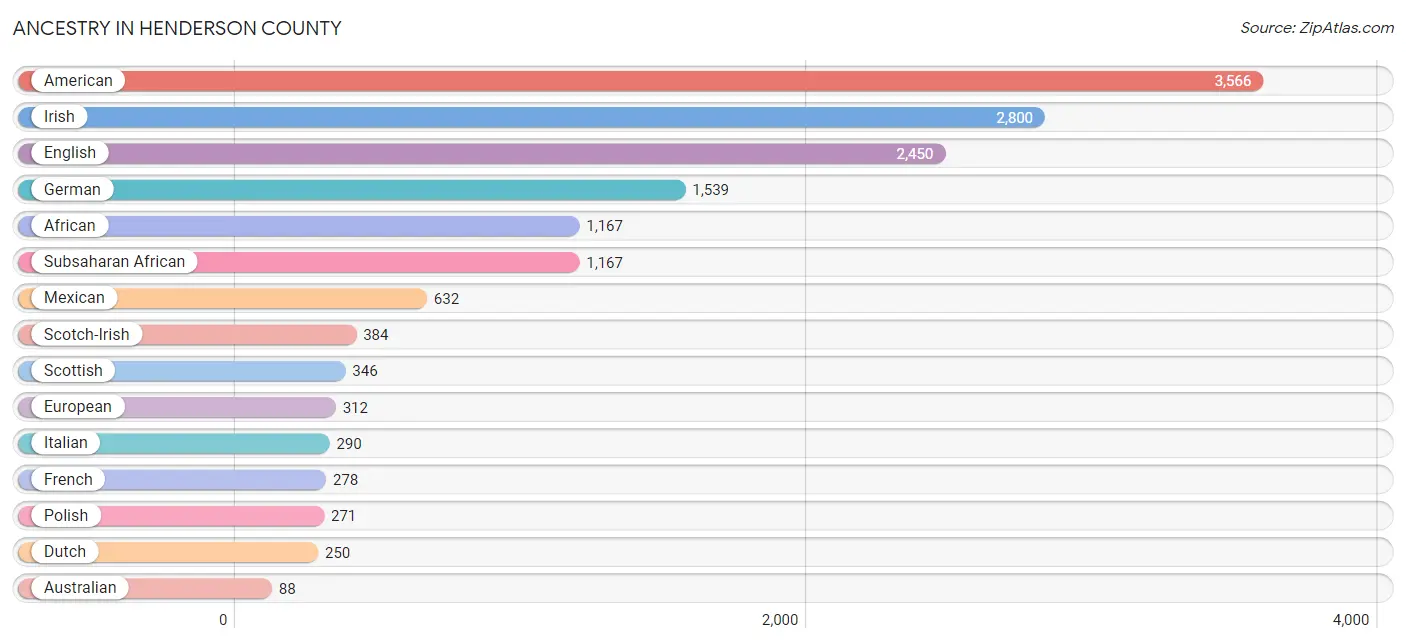
Ancestry in Henderson County
The most populous ancestries reported in Henderson County are American (3,566 | 12.8%), Irish (2,800 | 10.1%), English (2,450 | 8.8%), German (1,539 | 5.5%), and African (1,167 | 4.2%), together accounting for 41.4% of all Henderson County residents.
| Ancestry | # Population | % Population |
| African | 1,167 | 4.2% |
| American | 3,566 | 12.8% |
| Apache | 1 | 0.0% |
| Arab | 33 | 0.1% |
| Australian | 88 | 0.3% |
| Bhutanese | 1 | 0.0% |
| Blackfeet | 32 | 0.1% |
| British | 46 | 0.2% |
| Burmese | 2 | 0.0% |
| Canadian | 41 | 0.2% |
| Celtic | 6 | 0.0% |
| Cherokee | 60 | 0.2% |
| Chippewa | 52 | 0.2% |
| Choctaw | 11 | 0.0% |
| Comanche | 1 | 0.0% |
| Croatian | 14 | 0.1% |
| Cuban | 51 | 0.2% |
| Czech | 20 | 0.1% |
| Dutch | 250 | 0.9% |
| Egyptian | 1 | 0.0% |
| English | 2,450 | 8.8% |
| European | 312 | 1.1% |
| French | 278 | 1.0% |
| French Canadian | 15 | 0.1% |
| German | 1,539 | 5.5% |
| Hungarian | 15 | 0.1% |
| Indian (Asian) | 35 | 0.1% |
| Iranian | 64 | 0.2% |
| Irish | 2,800 | 10.1% |
| Italian | 290 | 1.0% |
| Lebanese | 32 | 0.1% |
| Mexican | 632 | 2.3% |
| Northern European | 46 | 0.2% |
| Norwegian | 51 | 0.2% |
| Polish | 271 | 1.0% |
| Puerto Rican | 30 | 0.1% |
| Samoan | 22 | 0.1% |
| Scandinavian | 1 | 0.0% |
| Scotch-Irish | 384 | 1.4% |
| Scottish | 346 | 1.2% |
| Sioux | 2 | 0.0% |
| South American | 6 | 0.0% |
| Spaniard | 1 | 0.0% |
| Subsaharan African | 1,167 | 4.2% |
| Swedish | 77 | 0.3% |
| Welsh | 45 | 0.2% | View All 46 Rows |
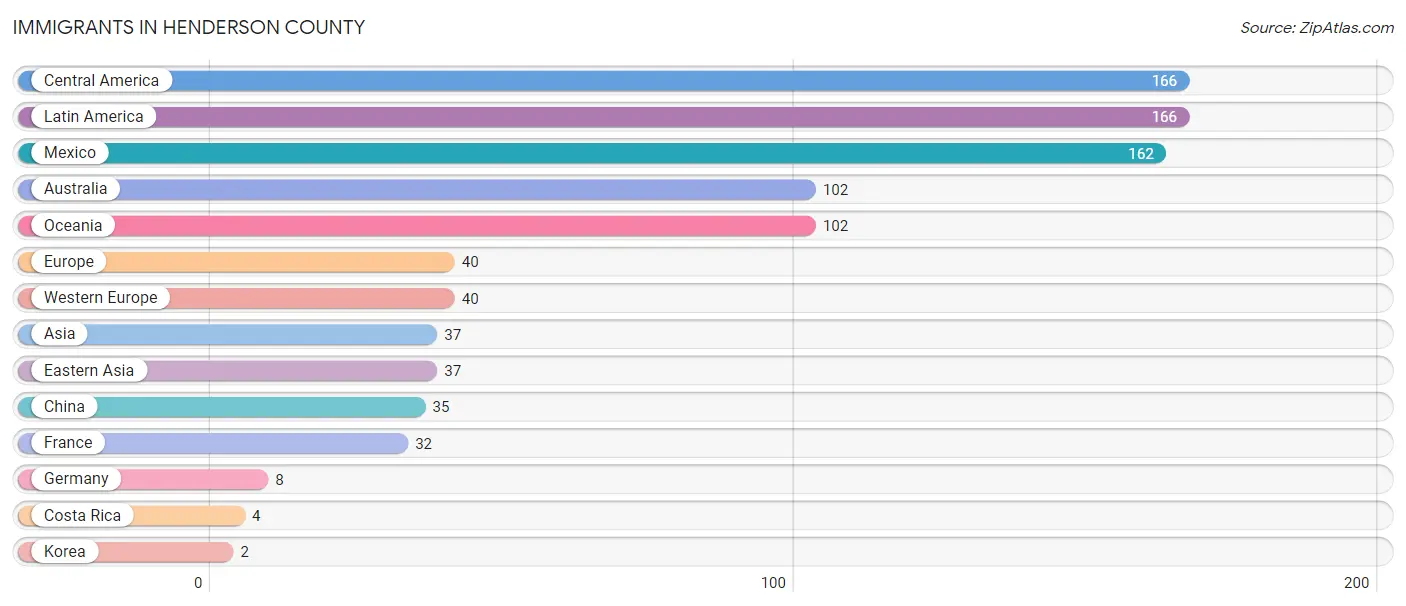
Immigrants in Henderson County
The most numerous immigrant groups reported in Henderson County came from Central America (166 | 0.6%), Latin America (166 | 0.6%), Mexico (162 | 0.6%), Australia (102 | 0.4%), and Oceania (102 | 0.4%), together accounting for 2.5% of all Henderson County residents.
| Immigration Origin | # Population | % Population |
| Asia | 37 | 0.1% |
| Australia | 102 | 0.4% |
| Central America | 166 | 0.6% |
| China | 35 | 0.1% |
| Costa Rica | 4 | 0.0% |
| Eastern Asia | 37 | 0.1% |
| Europe | 40 | 0.1% |
| France | 32 | 0.1% |
| Germany | 8 | 0.0% |
| Korea | 2 | 0.0% |
| Latin America | 166 | 0.6% |
| Mexico | 162 | 0.6% |
| Oceania | 102 | 0.4% |
| Western Europe | 40 | 0.1% | View All 14 Rows |
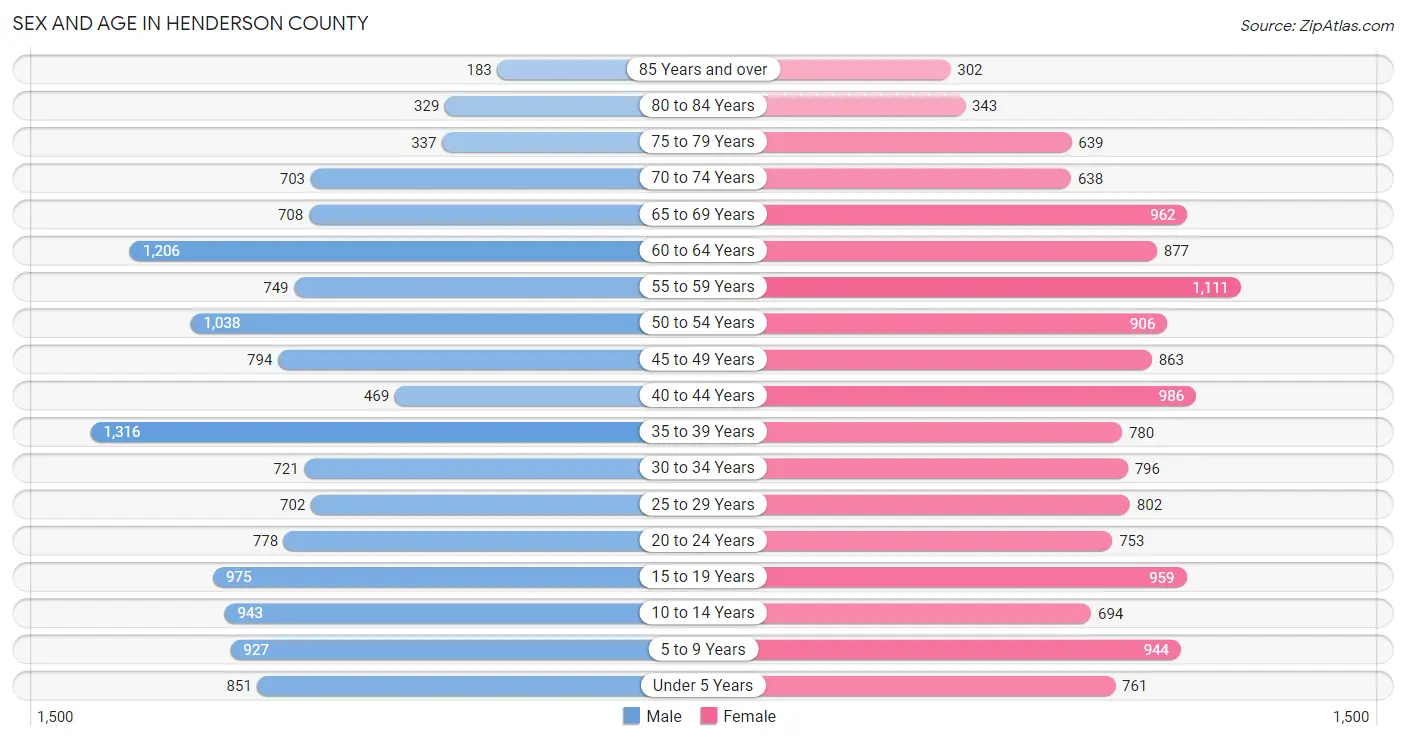
Sex and Age in Henderson County
Sex and Age in Henderson County
The most populous age groups in Henderson County are 35 to 39 Years (1,316 | 9.6%) for men and 55 to 59 Years (1,111 | 7.9%) for women.
| Age Bracket | Male | Female |
| Under 5 Years | 851 (6.2%) | 761 (5.4%) |
| 5 to 9 Years | 927 (6.8%) | 944 (6.7%) |
| 10 to 14 Years | 943 (6.9%) | 694 (4.9%) |
| 15 to 19 Years | 975 (7.1%) | 959 (6.8%) |
| 20 to 24 Years | 778 (5.7%) | 753 (5.3%) |
| 25 to 29 Years | 702 (5.1%) | 802 (5.7%) |
| 30 to 34 Years | 721 (5.2%) | 796 (5.6%) |
| 35 to 39 Years | 1,316 (9.6%) | 780 (5.5%) |
| 40 to 44 Years | 469 (3.4%) | 986 (7.0%) |
| 45 to 49 Years | 794 (5.8%) | 863 (6.1%) |
| 50 to 54 Years | 1,038 (7.6%) | 906 (6.4%) |
| 55 to 59 Years | 749 (5.5%) | 1,111 (7.9%) |
| 60 to 64 Years | 1,206 (8.8%) | 877 (6.2%) |
| 65 to 69 Years | 708 (5.2%) | 962 (6.8%) |
| 70 to 74 Years | 703 (5.1%) | 638 (4.5%) |
| 75 to 79 Years | 337 (2.5%) | 639 (4.5%) |
| 80 to 84 Years | 329 (2.4%) | 343 (2.4%) |
| 85 Years and over | 183 (1.3%) | 302 (2.1%) |
| Total | 13,729 (100.0%) | 14,116 (100.0%) |
Families and Households in Henderson County
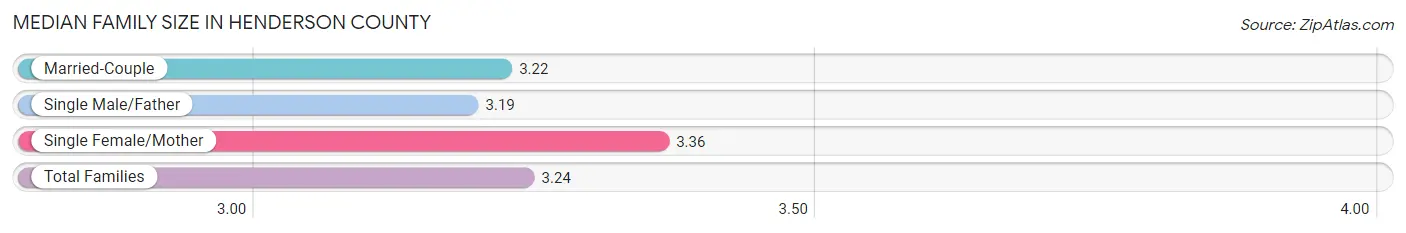
Median Family Size in Henderson County
The median family size in Henderson County is 3.24 persons per family, with single female/mother families (1,051 | 15.1%) accounting for the largest median family size of 3.36 persons per family. On the other hand, single male/father families (612 | 8.8%) represent the smallest median family size with 3.19 persons per family.
| Family Type | # Families | Family Size |
| Married-Couple | 5,282 (76.0%) | 3.22 |
| Single Male/Father | 612 (8.8%) | 3.19 |
| Single Female/Mother | 1,051 (15.1%) | 3.36 |
| Total Families | 6,945 (100.0%) | 3.24 |
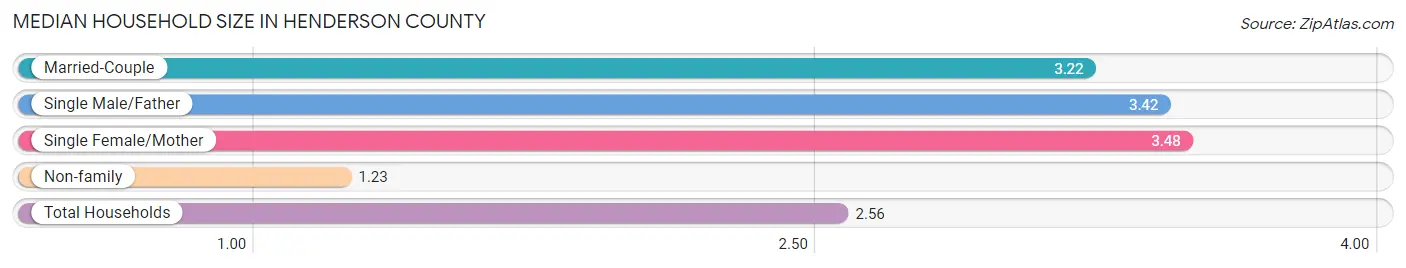
Median Household Size in Henderson County
The median household size in Henderson County is 2.56 persons per household, with single female/mother households (1,051 | 9.8%) accounting for the largest median household size of 3.48 persons per household. non-family households (3,792 | 35.3%) represent the smallest median household size with 1.23 persons per household.
| Household Type | # Households | Household Size |
| Married-Couple | 5,282 (49.2%) | 3.22 |
| Single Male/Father | 612 (5.7%) | 3.42 |
| Single Female/Mother | 1,051 (9.8%) | 3.48 |
| Non-family | 3,792 (35.3%) | 1.23 |
| Total Households | 10,737 (100.0%) | 2.56 |
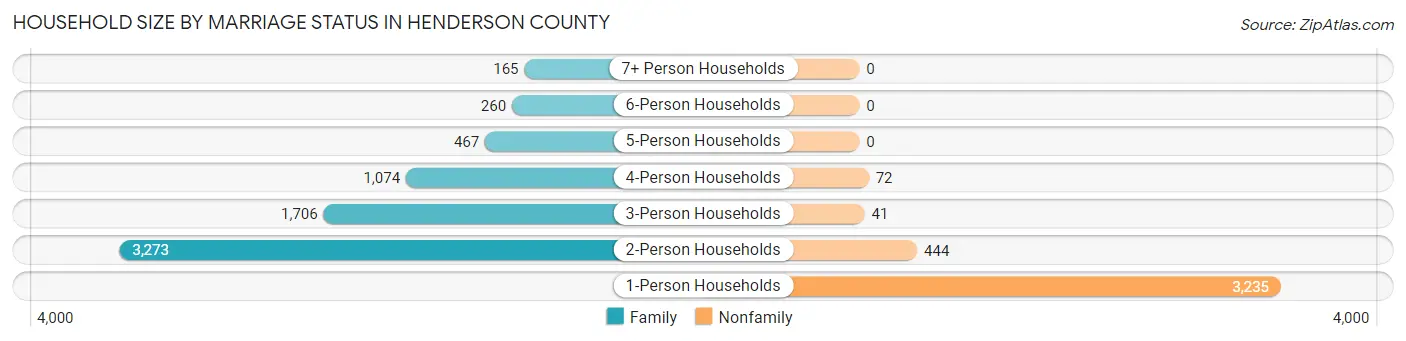
Household Size by Marriage Status in Henderson County
Out of a total of 10,737 households in Henderson County, 6,945 (64.7%) are family households, while 3,792 (35.3%) are nonfamily households. The most numerous type of family households are 2-person households, comprising 3,273, and the most common type of nonfamily households are 1-person households, comprising 3,235.
| Household Size | Family Households | Nonfamily Households |
| 1-Person Households | - | 3,235 (30.1%) |
| 2-Person Households | 3,273 (30.5%) | 444 (4.1%) |
| 3-Person Households | 1,706 (15.9%) | 41 (0.4%) |
| 4-Person Households | 1,074 (10.0%) | 72 (0.7%) |
| 5-Person Households | 467 (4.3%) | 0 (0.0%) |
| 6-Person Households | 260 (2.4%) | 0 (0.0%) |
| 7+ Person Households | 165 (1.5%) | 0 (0.0%) |
| Total | 6,945 (64.7%) | 3,792 (35.3%) |
Female Fertility in Henderson County
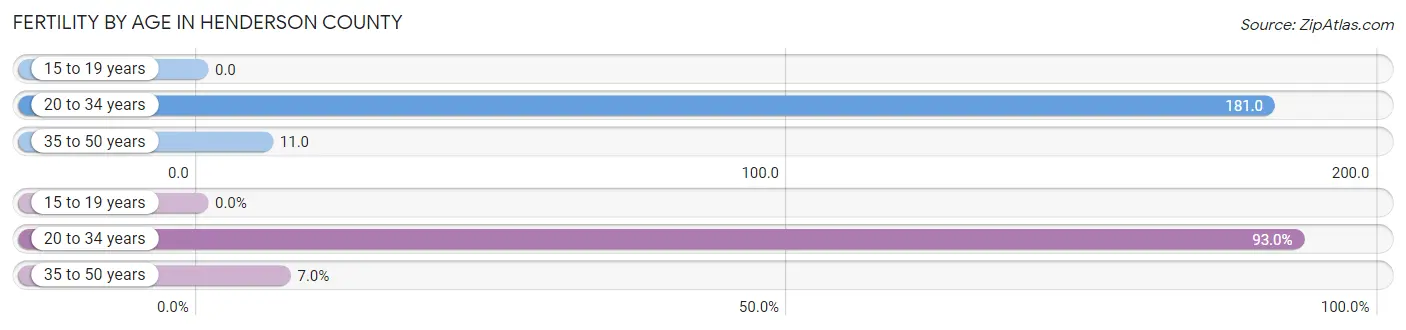
Fertility by Age in Henderson County
Average fertility rate in Henderson County is 74.0 births per 1,000 women. Women in the age bracket of 20 to 34 years have the highest fertility rate with 181.0 births per 1,000 women. Women in the age bracket of 20 to 34 years acount for 93.0% of all women with births.
| Age Bracket | Women with Births | Births / 1,000 Women |
| 15 to 19 years | 0 (0.0%) | 0.0 |
| 20 to 34 years | 425 (93.0%) | 181.0 |
| 35 to 50 years | 32 (7.0%) | 11.0 |
| Total | 457 (100.0%) | 74.0 |
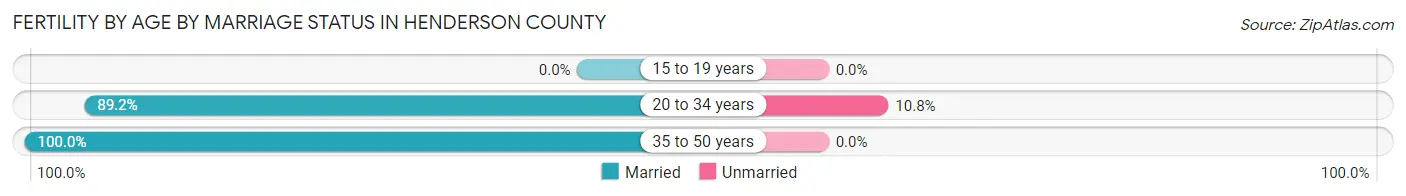
Fertility by Age by Marriage Status in Henderson County
89.9% of women with births (457) in Henderson County are married. The highest percentage of unmarried women with births falls into 20 to 34 years age bracket with 10.8% of them unmarried at the time of birth, while the lowest percentage of unmarried women with births belong to 35 to 50 years age bracket with 0.0% of them unmarried.
| Age Bracket | Married | Unmarried |
| 15 to 19 years | 0 (0.0%) | 0 (0.0%) |
| 20 to 34 years | 379 (89.2%) | 46 (10.8%) |
| 35 to 50 years | 32 (100.0%) | 0 (0.0%) |
| Total | 411 (89.9%) | 46 (10.1%) |
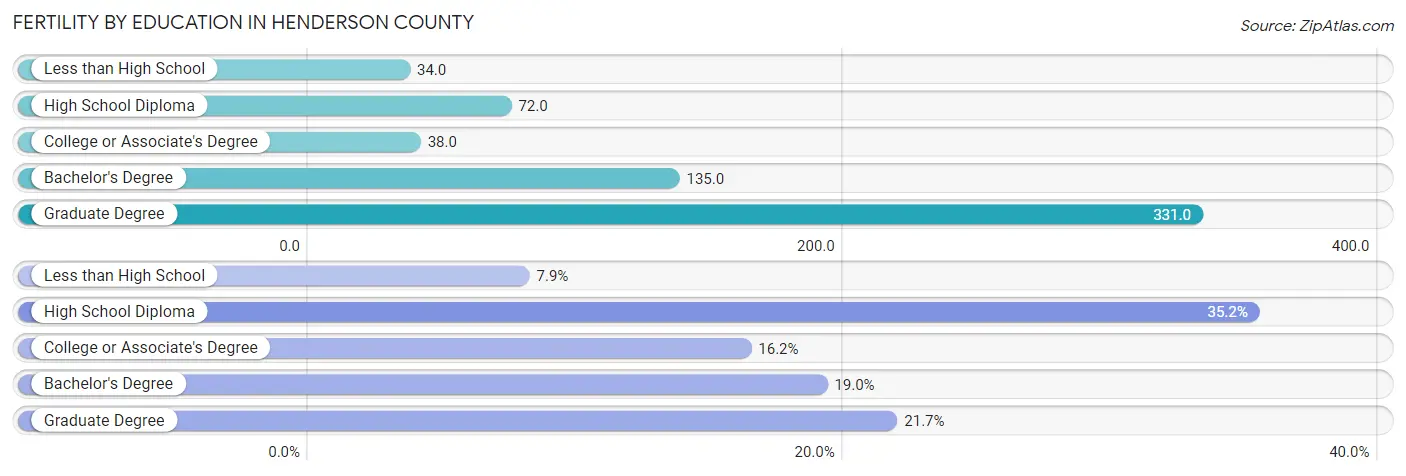
Fertility by Education in Henderson County
Average fertility rate in Henderson County is 74.0 births per 1,000 women. Women with the education attainment of graduate degree have the highest fertility rate of 331.0 births per 1,000 women, while women with the education attainment of less than high school have the lowest fertility at 34.0 births per 1,000 women. Women with the education attainment of high school diploma represent 35.2% of all women with births.
| Educational Attainment | Women with Births | Births / 1,000 Women |
| Less than High School | 36 (7.9%) | 34.0 |
| High School Diploma | 161 (35.2%) | 72.0 |
| College or Associate's Degree | 74 (16.2%) | 38.0 |
| Bachelor's Degree | 87 (19.0%) | 135.0 |
| Graduate Degree | 99 (21.7%) | 331.0 |
| Total | 457 (100.0%) | 74.0 |
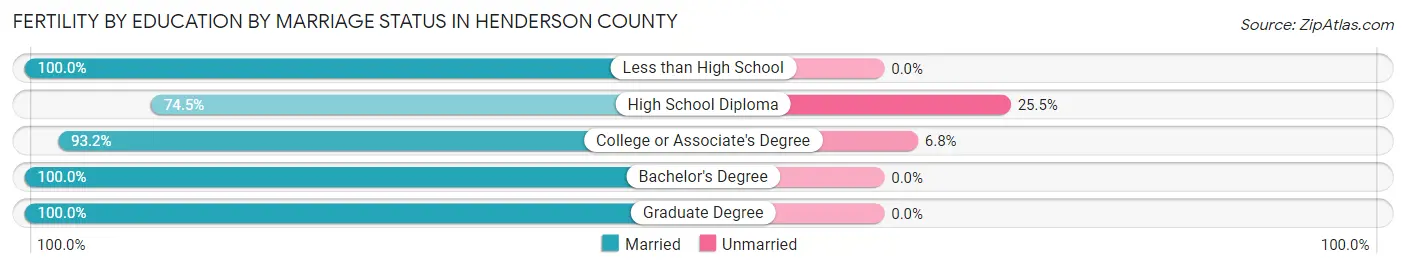
Fertility by Education by Marriage Status in Henderson County
10.1% of women with births in Henderson County are unmarried. Women with the educational attainment of less than high school are most likely to be married with 100.0% of them married at childbirth, while women with the educational attainment of high school diploma are least likely to be married with 25.5% of them unmarried at childbirth.
| Educational Attainment | Married | Unmarried |
| Less than High School | 36 (100.0%) | 0 (0.0%) |
| High School Diploma | 120 (74.5%) | 41 (25.5%) |
| College or Associate's Degree | 69 (93.2%) | 5 (6.8%) |
| Bachelor's Degree | 87 (100.0%) | 0 (0.0%) |
| Graduate Degree | 99 (100.0%) | 0 (0.0%) |
| Total | 411 (89.9%) | 46 (10.1%) |
Income in Henderson County
Income Overview in Henderson County
Per Capita Income in Henderson County is $25,873, while median incomes of families and households are $67,725 and $51,576 respectively.
| Characteristic | Number | Measure |
| Per Capita Income | 27,845 | $25,873 |
| Median Family Income | 6,945 | $67,725 |
| Mean Family Income | 6,945 | $76,829 |
| Median Household Income | 10,737 | $51,576 |
| Mean Household Income | 10,737 | $64,570 |
| Income Deficit | 6,945 | $10,973 |
| Wage / Income Gap (%) | 27,845 | 29.66% |
| Wage / Income Gap ($) | 27,845 | 70.34¢ per $1 |
| Gini / Inequality Index | 27,845 | 0.44 |
Earnings by Sex in Henderson County
Average Earnings in Henderson County are $36,359, $43,451 for men and $30,563 for women, a difference of 29.7%.
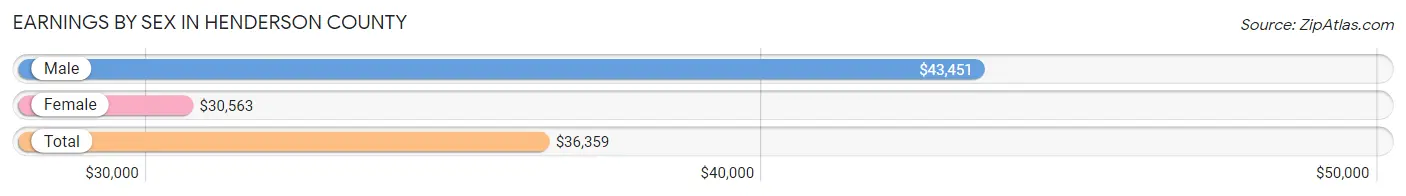
| Sex | Number | Average Earnings |
| Male | 6,309 (50.2%) | $43,451 |
| Female | 6,245 (49.7%) | $30,563 |
| Total | 12,554 (100.0%) | $36,359 |
Earnings by Sex by Income Bracket in Henderson County
The most common earnings brackets in Henderson County are $75,000 to $99,999 for men (617 | 9.8%) and $35,000 to $39,999 for women (574 | 9.2%).

| Income | Male | Female |
| $2,499 or less | 98 (1.5%) | 348 (5.6%) |
| $2,500 to $4,999 | 162 (2.6%) | 287 (4.6%) |
| $5,000 to $7,499 | 111 (1.8%) | 315 (5.0%) |
| $7,500 to $9,999 | 152 (2.4%) | 178 (2.9%) |
| $10,000 to $12,499 | 128 (2.0%) | 158 (2.5%) |
| $12,500 to $14,999 | 286 (4.5%) | 304 (4.9%) |
| $15,000 to $17,499 | 82 (1.3%) | 318 (5.1%) |
| $17,500 to $19,999 | 176 (2.8%) | 292 (4.7%) |
| $20,000 to $22,499 | 148 (2.4%) | 132 (2.1%) |
| $22,500 to $24,999 | 147 (2.3%) | 330 (5.3%) |
| $25,000 to $29,999 | 406 (6.4%) | 395 (6.3%) |
| $30,000 to $34,999 | 522 (8.3%) | 552 (8.8%) |
| $35,000 to $39,999 | 251 (4.0%) | 574 (9.2%) |
| $40,000 to $44,999 | 610 (9.7%) | 522 (8.4%) |
| $45,000 to $49,999 | 361 (5.7%) | 397 (6.4%) |
| $50,000 to $54,999 | 554 (8.8%) | 117 (1.9%) |
| $55,000 to $64,999 | 590 (9.3%) | 509 (8.2%) |
| $65,000 to $74,999 | 416 (6.6%) | 161 (2.6%) |
| $75,000 to $99,999 | 617 (9.8%) | 179 (2.9%) |
| $100,000+ | 492 (7.8%) | 177 (2.8%) |
| Total | 6,309 (100.0%) | 6,245 (100.0%) |
Earnings by Sex by Educational Attainment in Henderson County
Average earnings in Henderson County are $47,934 for men and $34,813 for women, a difference of 27.4%. Men with an educational attainment of bachelor's degree enjoy the highest average annual earnings of $57,772, while those with less than high school education earn the least with $29,583. Women with an educational attainment of bachelor's degree earn the most with the average annual earnings of $48,462, while those with high school diploma education have the smallest earnings of $30,371.
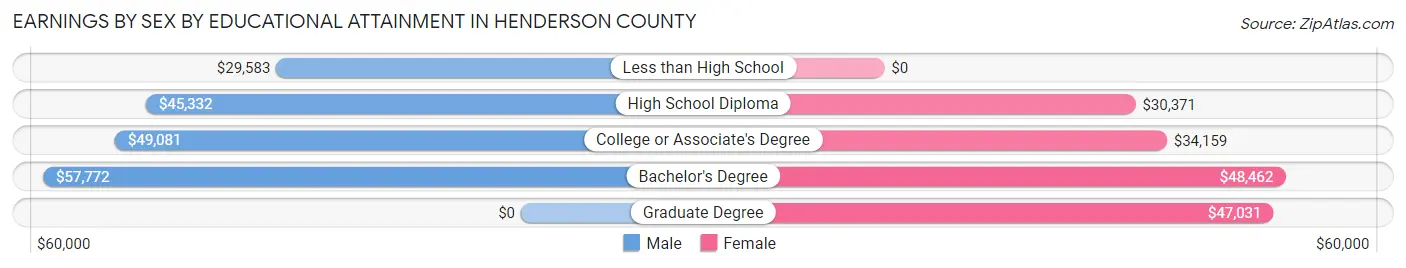
| Educational Attainment | Male Income | Female Income |
| Less than High School | $29,583 | $0 |
| High School Diploma | $45,332 | $30,371 |
| College or Associate's Degree | $49,081 | $34,159 |
| Bachelor's Degree | $57,772 | $48,462 |
| Graduate Degree | - | - |
| Total | $47,934 | $34,813 |
Family Income in Henderson County
Family Income Brackets in Henderson County
According to the Henderson County family income data, there are 1,452 families falling into the $50,000 to $74,999 income range, which is the most common income bracket and makes up 20.9% of all families. Conversely, the $10,000 to $14,999 income bracket is the least frequent group with only 139 families (2.0%) belonging to this category.
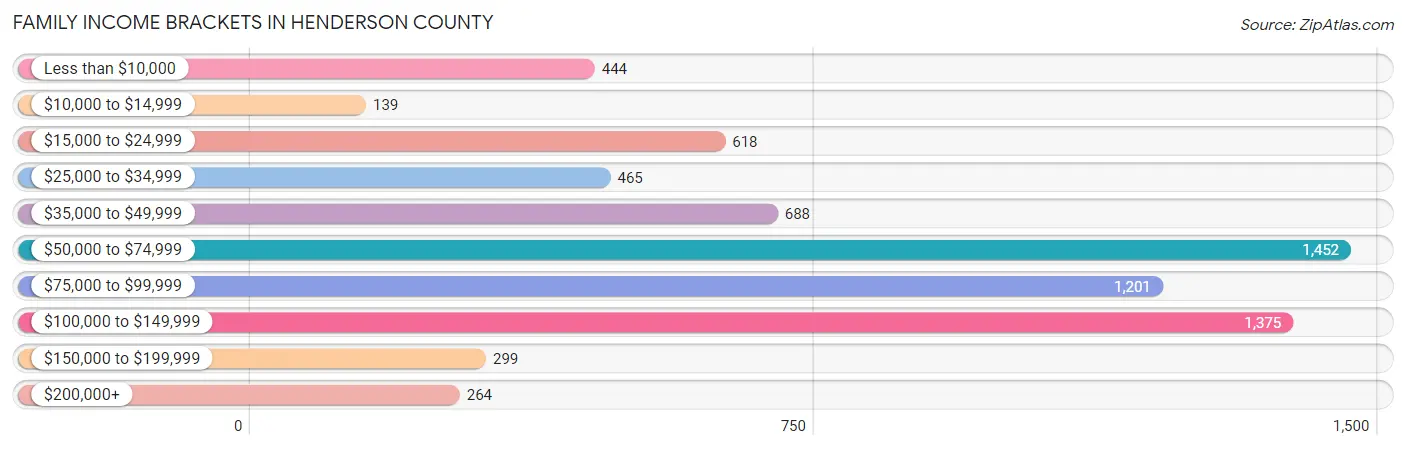
| Income Bracket | # Families | % Families |
| Less than $10,000 | 444 | 6.4% |
| $10,000 to $14,999 | 139 | 2.0% |
| $15,000 to $24,999 | 618 | 8.9% |
| $25,000 to $34,999 | 465 | 6.7% |
| $35,000 to $49,999 | 688 | 9.9% |
| $50,000 to $74,999 | 1,452 | 20.9% |
| $75,000 to $99,999 | 1,201 | 17.3% |
| $100,000 to $149,999 | 1,375 | 19.8% |
| $150,000 to $199,999 | 299 | 4.3% |
| $200,000+ | 264 | 3.8% |
Family Income by Famaliy Size in Henderson County
7+ person families (158 | 2.3%) account for the highest median family income in Henderson County with $110,694 per family, while 2-person families (3,330 | 47.9%) have the highest median income of $29,452 per family member.
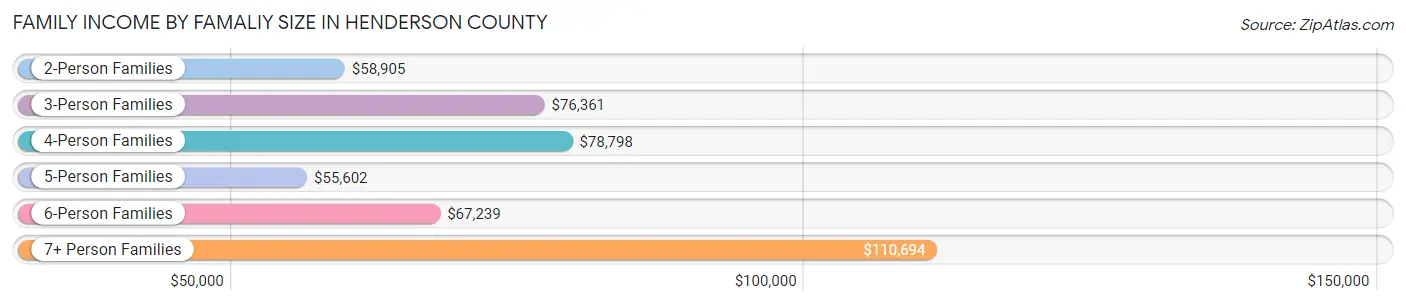
| Income Bracket | # Families | Median Income |
| 2-Person Families | 3,330 (47.9%) | $58,905 |
| 3-Person Families | 1,762 (25.4%) | $76,361 |
| 4-Person Families | 1,005 (14.5%) | $78,798 |
| 5-Person Families | 447 (6.4%) | $55,602 |
| 6-Person Families | 243 (3.5%) | $67,239 |
| 7+ Person Families | 158 (2.3%) | $110,694 |
| Total | 6,945 (100.0%) | $67,725 |
Family Income by Number of Earners in Henderson County
The median family income in Henderson County is $67,725, with families comprising 3+ earners (647) having the highest median family income of $100,724, while families with no earners (1,573) have the lowest median family income of $28,710, accounting for 9.3% and 22.7% of families, respectively.
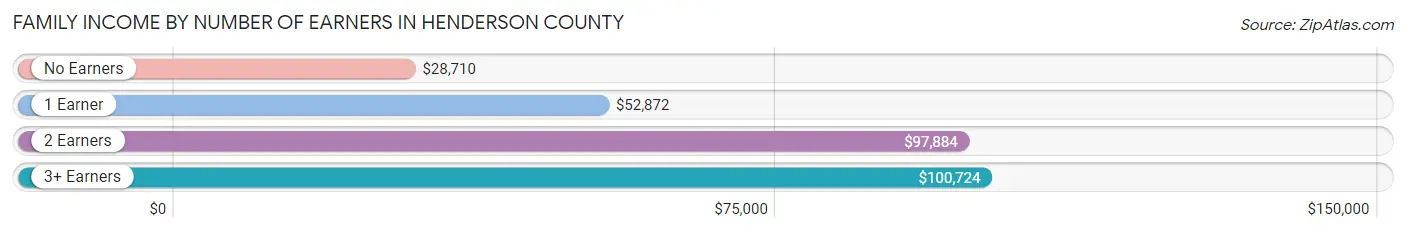
| Number of Earners | # Families | Median Income |
| No Earners | 1,573 (22.7%) | $28,710 |
| 1 Earner | 2,140 (30.8%) | $52,872 |
| 2 Earners | 2,585 (37.2%) | $97,884 |
| 3+ Earners | 647 (9.3%) | $100,724 |
| Total | 6,945 (100.0%) | $67,725 |
Household Income in Henderson County
Household Income Brackets in Henderson County
With 1,900 households falling in the category, the $50,000 to $74,999 income range is the most frequent in Henderson County, accounting for 17.7% of all households. In contrast, only 301 households (2.8%) fall into the $150,000 to $199,999 income bracket, making it the least populous group.
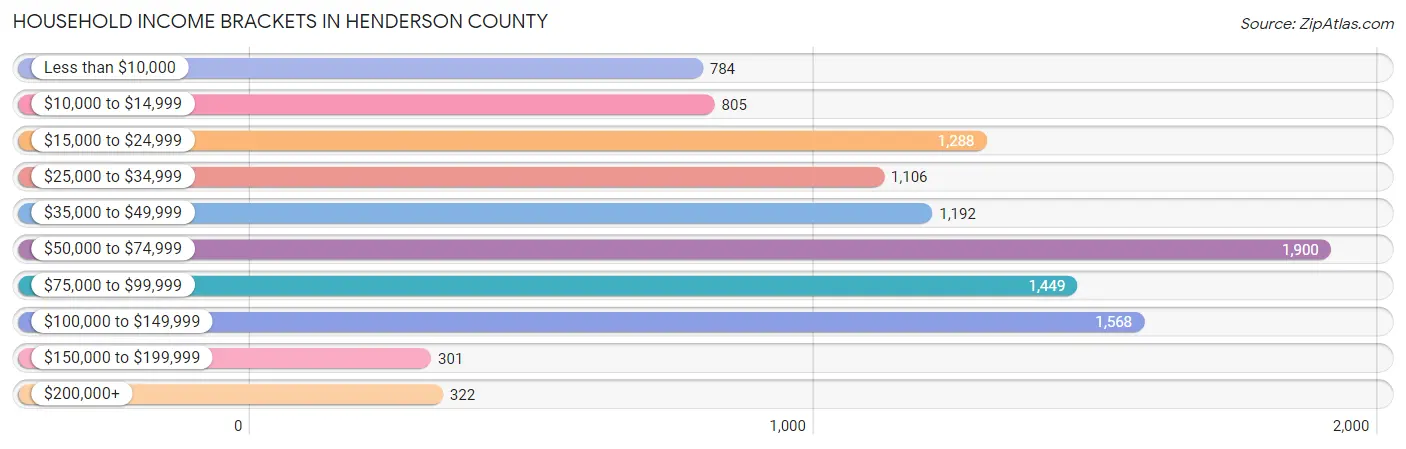
| Income Bracket | # Households | % Households |
| Less than $10,000 | 784 | 7.3% |
| $10,000 to $14,999 | 805 | 7.5% |
| $15,000 to $24,999 | 1,288 | 12.0% |
| $25,000 to $34,999 | 1,106 | 10.3% |
| $35,000 to $49,999 | 1,192 | 11.1% |
| $50,000 to $74,999 | 1,900 | 17.7% |
| $75,000 to $99,999 | 1,449 | 13.5% |
| $100,000 to $149,999 | 1,568 | 14.6% |
| $150,000 to $199,999 | 301 | 2.8% |
| $200,000+ | 322 | 3.0% |
Household Income by Householder Age in Henderson County
The median household income in Henderson County is $51,576, with the highest median household income of $67,101 found in the 25 to 44 years age bracket for the primary householder. A total of 2,931 households (27.3%) fall into this category. Meanwhile, the 65+ years age bracket for the primary householder has the lowest median household income of $33,763, with 3,313 households (30.9%) in this group.
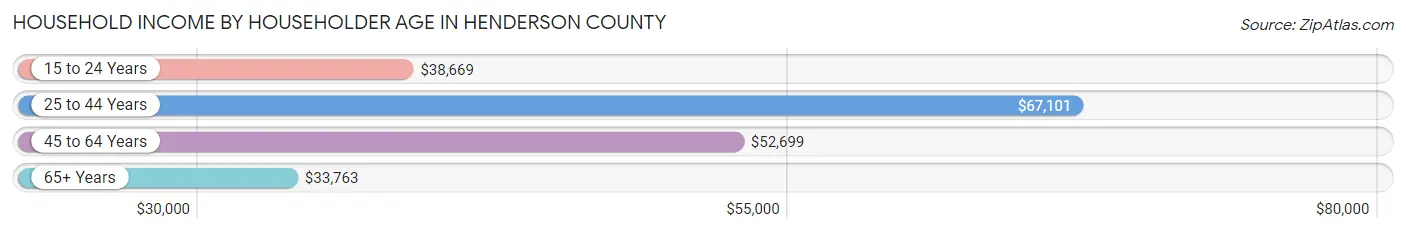
| Income Bracket | # Households | Median Income |
| 15 to 24 Years | 289 (2.7%) | $38,669 |
| 25 to 44 Years | 2,931 (27.3%) | $67,101 |
| 45 to 64 Years | 4,204 (39.2%) | $52,699 |
| 65+ Years | 3,313 (30.9%) | $33,763 |
| Total | 10,737 (100.0%) | $51,576 |
Poverty in Henderson County
Income Below Poverty by Sex and Age in Henderson County
With 14.9% poverty level for males and 21.0% for females among the residents of Henderson County, 12 to 14 year old males and 15 year old females are the most vulnerable to poverty, with 194 males (31.3%) and 26 females (45.6%) in their respective age groups living below the poverty level.
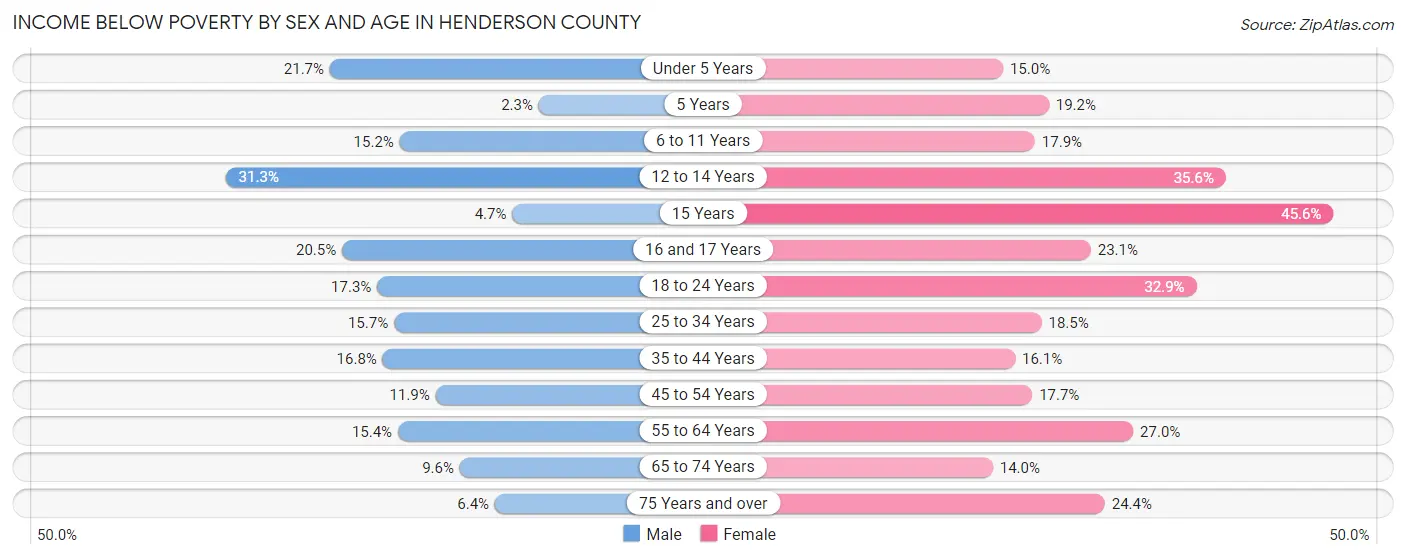
| Age Bracket | Male | Female |
| Under 5 Years | 174 (21.7%) | 104 (15.0%) |
| 5 Years | 6 (2.3%) | 29 (19.2%) |
| 6 to 11 Years | 149 (15.2%) | 190 (17.9%) |
| 12 to 14 Years | 194 (31.3%) | 145 (35.6%) |
| 15 Years | 12 (4.7%) | 26 (45.6%) |
| 16 and 17 Years | 83 (20.5%) | 125 (23.1%) |
| 18 to 24 Years | 184 (17.3%) | 364 (32.9%) |
| 25 to 34 Years | 216 (15.7%) | 295 (18.5%) |
| 35 to 44 Years | 290 (16.8%) | 284 (16.1%) |
| 45 to 54 Years | 213 (11.9%) | 311 (17.7%) |
| 55 to 64 Years | 299 (15.3%) | 534 (27.0%) |
| 65 to 74 Years | 134 (9.6%) | 218 (14.0%) |
| 75 Years and over | 52 (6.4%) | 292 (24.4%) |
| Total | 2,006 (14.9%) | 2,917 (21.0%) |
Income Above Poverty by Sex and Age in Henderson County
According to the poverty statistics in Henderson County, males aged 5 years and females aged 65 to 74 years are the age groups that are most secure financially, with 97.7% of males and 86.0% of females in these age groups living above the poverty line.
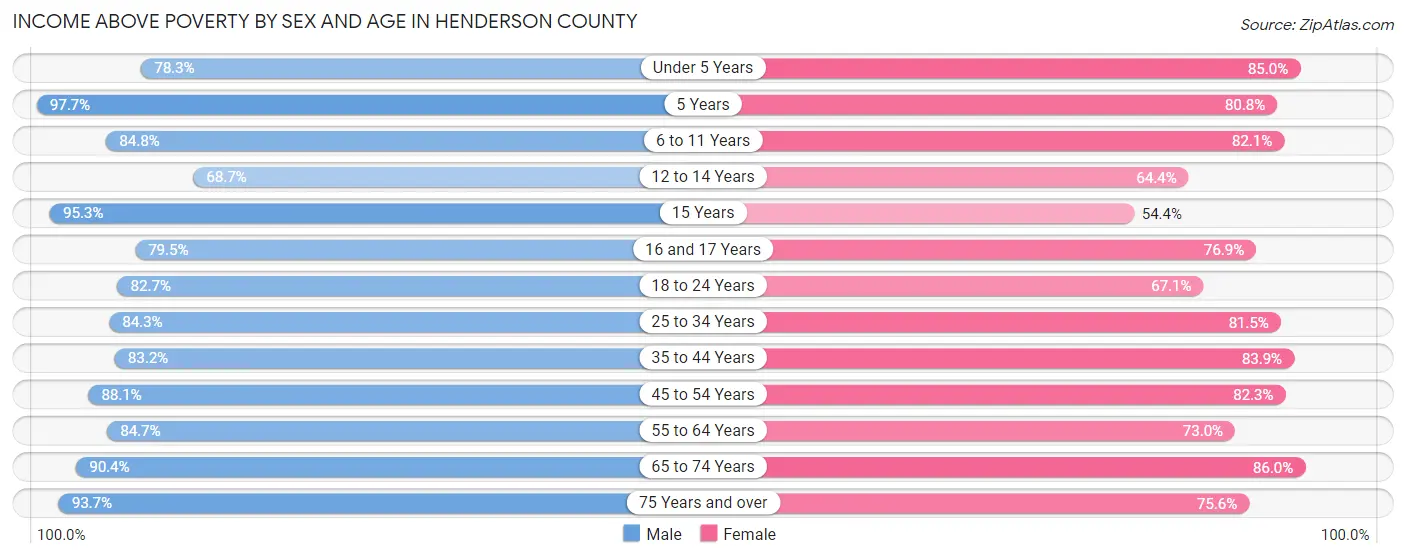
| Age Bracket | Male | Female |
| Under 5 Years | 629 (78.3%) | 591 (85.0%) |
| 5 Years | 257 (97.7%) | 122 (80.8%) |
| 6 to 11 Years | 832 (84.8%) | 870 (82.1%) |
| 12 to 14 Years | 425 (68.7%) | 262 (64.4%) |
| 15 Years | 241 (95.3%) | 31 (54.4%) |
| 16 and 17 Years | 321 (79.5%) | 416 (76.9%) |
| 18 to 24 Years | 881 (82.7%) | 742 (67.1%) |
| 25 to 34 Years | 1,158 (84.3%) | 1,296 (81.5%) |
| 35 to 44 Years | 1,439 (83.2%) | 1,482 (83.9%) |
| 45 to 54 Years | 1,583 (88.1%) | 1,449 (82.3%) |
| 55 to 64 Years | 1,649 (84.7%) | 1,441 (73.0%) |
| 65 to 74 Years | 1,261 (90.4%) | 1,338 (86.0%) |
| 75 Years and over | 767 (93.6%) | 904 (75.6%) |
| Total | 11,443 (85.1%) | 10,944 (79.0%) |
Income Below Poverty Among Married-Couple Families in Henderson County
The poverty statistics for married-couple families in Henderson County show that 6.6% or 348 of the total 5,282 families live below the poverty line. Families with no children have the highest poverty rate of 7.6%, comprising of 230 families. On the other hand, families with 5 or more children have the lowest poverty rate of 0.0%, which includes 0 families.
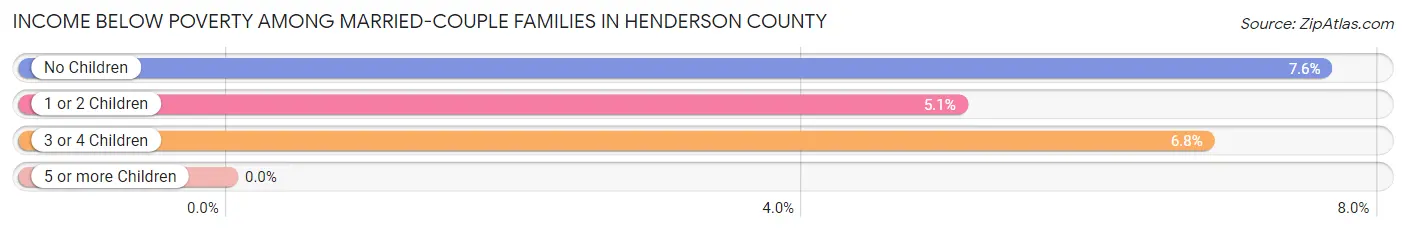
| Children | Above Poverty | Below Poverty |
| No Children | 2,788 (92.4%) | 230 (7.6%) |
| 1 or 2 Children | 1,774 (94.9%) | 95 (5.1%) |
| 3 or 4 Children | 315 (93.2%) | 23 (6.8%) |
| 5 or more Children | 57 (100.0%) | 0 (0.0%) |
| Total | 4,934 (93.4%) | 348 (6.6%) |
Income Below Poverty Among Single-Parent Households in Henderson County
According to the poverty data in Henderson County, 24.0% or 147 single-father households and 46.2% or 485 single-mother households are living below the poverty line. Among single-father households, those with 1 or 2 children have the highest poverty rate, with 74 households (32.7%) experiencing poverty. Likewise, among single-mother households, those with 5 or more children have the highest poverty rate, with 12 households (100.0%) falling below the poverty line.
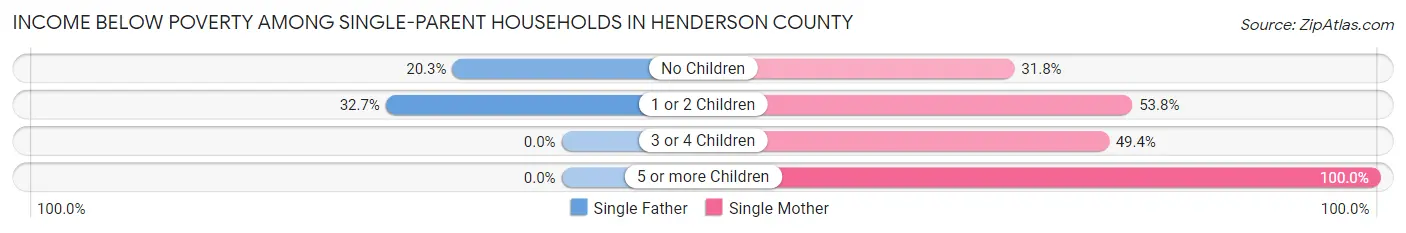
| Children | Single Father | Single Mother |
| No Children | 73 (20.3%) | 104 (31.8%) |
| 1 or 2 Children | 74 (32.7%) | 215 (53.7%) |
| 3 or 4 Children | 0 (0.0%) | 154 (49.4%) |
| 5 or more Children | 0 (0.0%) | 12 (100.0%) |
| Total | 147 (24.0%) | 485 (46.2%) |
Income Below Poverty Among Married-Couple vs Single-Parent Households in Henderson County
The poverty data for Henderson County shows that 348 of the married-couple family households (6.6%) and 632 of the single-parent households (38.0%) are living below the poverty level. Within the married-couple family households, those with no children have the highest poverty rate, with 230 households (7.6%) falling below the poverty line. Among the single-parent households, those with 5 or more children have the highest poverty rate, with 12 household (100.0%) living below poverty.
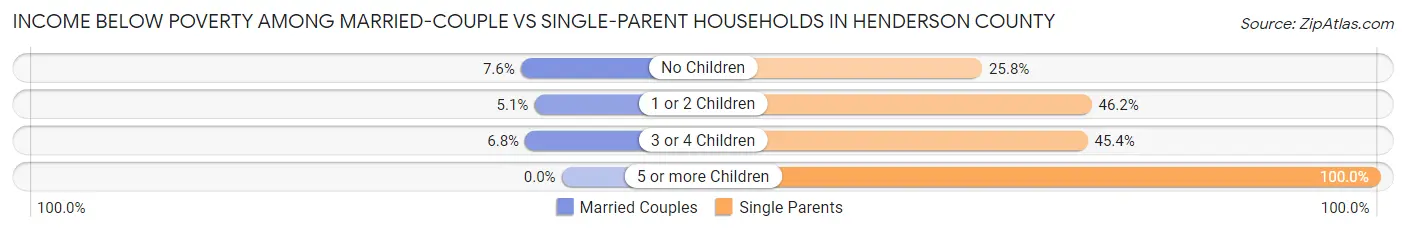
| Children | Married-Couple Families | Single-Parent Households |
| No Children | 230 (7.6%) | 177 (25.8%) |
| 1 or 2 Children | 95 (5.1%) | 289 (46.2%) |
| 3 or 4 Children | 23 (6.8%) | 154 (45.4%) |
| 5 or more Children | 0 (0.0%) | 12 (100.0%) |
| Total | 348 (6.6%) | 632 (38.0%) |
Employment Characteristics in Henderson County
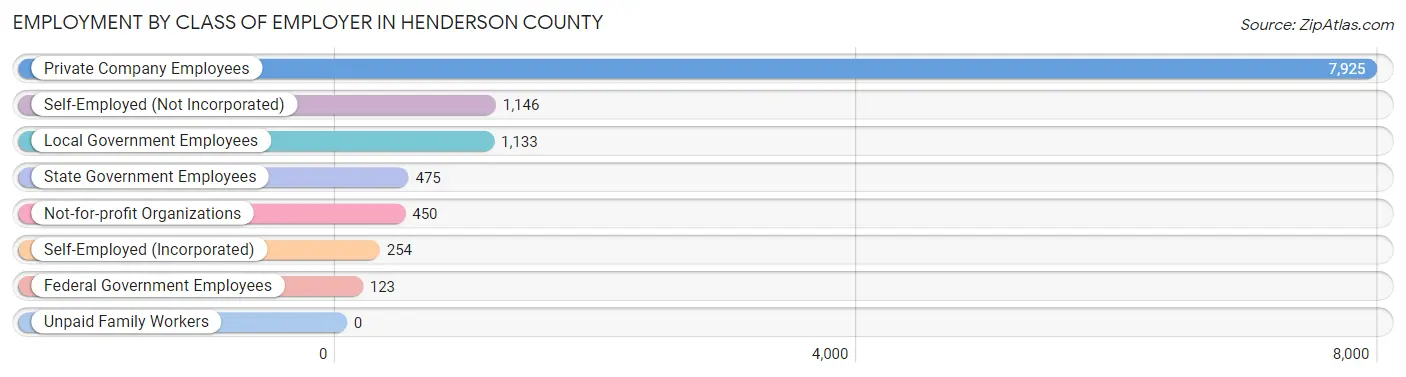
Employment by Class of Employer in Henderson County
Among the 11,506 employed individuals in Henderson County, private company employees (7,925 | 68.9%), self-employed (not incorporated) (1,146 | 10.0%), and local government employees (1,133 | 9.9%) make up the most common classes of employment.
| Employer Class | # Employees | % Employees |
| Private Company Employees | 7,925 | 68.9% |
| Self-Employed (Incorporated) | 254 | 2.2% |
| Self-Employed (Not Incorporated) | 1,146 | 10.0% |
| Not-for-profit Organizations | 450 | 3.9% |
| Local Government Employees | 1,133 | 9.9% |
| State Government Employees | 475 | 4.1% |
| Federal Government Employees | 123 | 1.1% |
| Unpaid Family Workers | 0 | 0.0% |
| Total | 11,506 | 100.0% |
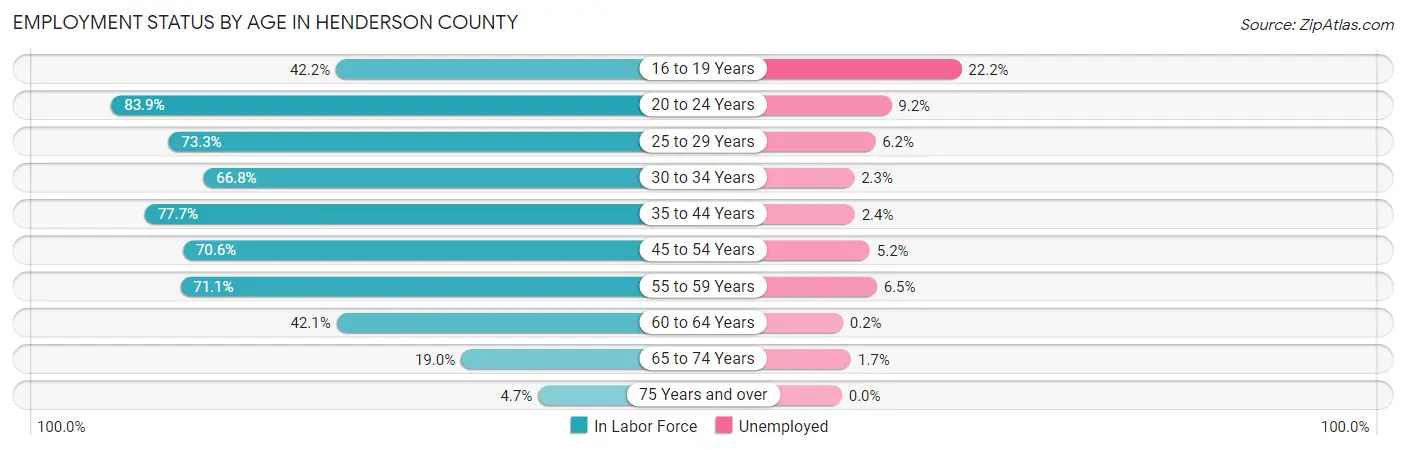
Employment Status by Age in Henderson County
According to the labor force statistics for Henderson County, out of the total population over 16 years of age (22,415), 54.7% or 12,261 individuals are in the labor force, with 5.4% or 662 of them unemployed. The age group with the highest labor force participation rate is 20 to 24 years, with 83.9% or 1,285 individuals in the labor force. Within the labor force, the 16 to 19 years age range has the highest percentage of unemployed individuals, with 22.2% or 152 of them being unemployed.
| Age Bracket | In Labor Force | Unemployed |
| 16 to 19 Years | 685 (42.2%) | 152 (22.2%) |
| 20 to 24 Years | 1,285 (83.9%) | 118 (9.2%) |
| 25 to 29 Years | 1,102 (73.3%) | 68 (6.2%) |
| 30 to 34 Years | 1,013 (66.8%) | 23 (2.3%) |
| 35 to 44 Years | 2,759 (77.7%) | 66 (2.4%) |
| 45 to 54 Years | 2,542 (70.6%) | 132 (5.2%) |
| 55 to 59 Years | 1,322 (71.1%) | 86 (6.5%) |
| 60 to 64 Years | 877 (42.1%) | 2 (0.2%) |
| 65 to 74 Years | 572 (19.0%) | 10 (1.7%) |
| 75 Years and over | 100 (4.7%) | 0 (0.0%) |
| Total | 12,261 (54.7%) | 662 (5.4%) |
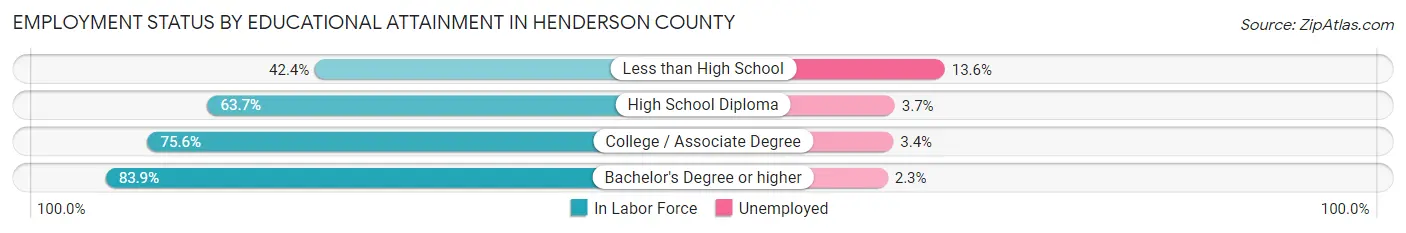
Employment Status by Educational Attainment in Henderson County
According to labor force statistics for Henderson County, 68.1% of individuals (9,613) out of the total population between 25 and 64 years of age (14,116) are in the labor force, with 3.9% or 375 of them being unemployed. The group with the highest labor force participation rate are those with the educational attainment of bachelor's degree or higher, with 83.9% or 1,808 individuals in the labor force. Within the labor force, individuals with less than high school education have the highest percentage of unemployment, with 13.6% or 76 of them being unemployed.
| Educational Attainment | In Labor Force | Unemployed |
| Less than High School | 557 (42.4%) | 179 (13.6%) |
| High School Diploma | 4,299 (63.7%) | 250 (3.7%) |
| College / Associate Degree | 2,948 (75.6%) | 133 (3.4%) |
| Bachelor's Degree or higher | 1,808 (83.9%) | 50 (2.3%) |
| Total | 9,613 (68.1%) | 551 (3.9%) |
Employment Occupations by Sex in Henderson County
Management, Business, Science and Arts Occupations
The most common Management, Business, Science and Arts occupations in Henderson County are Community & Social Service (1,054 | 9.1%), Management (928 | 8.0%), Education Instruction & Library (895 | 7.7%), Health Diagnosing & Treating (760 | 6.6%), and Health Technologists (457 | 3.9%).
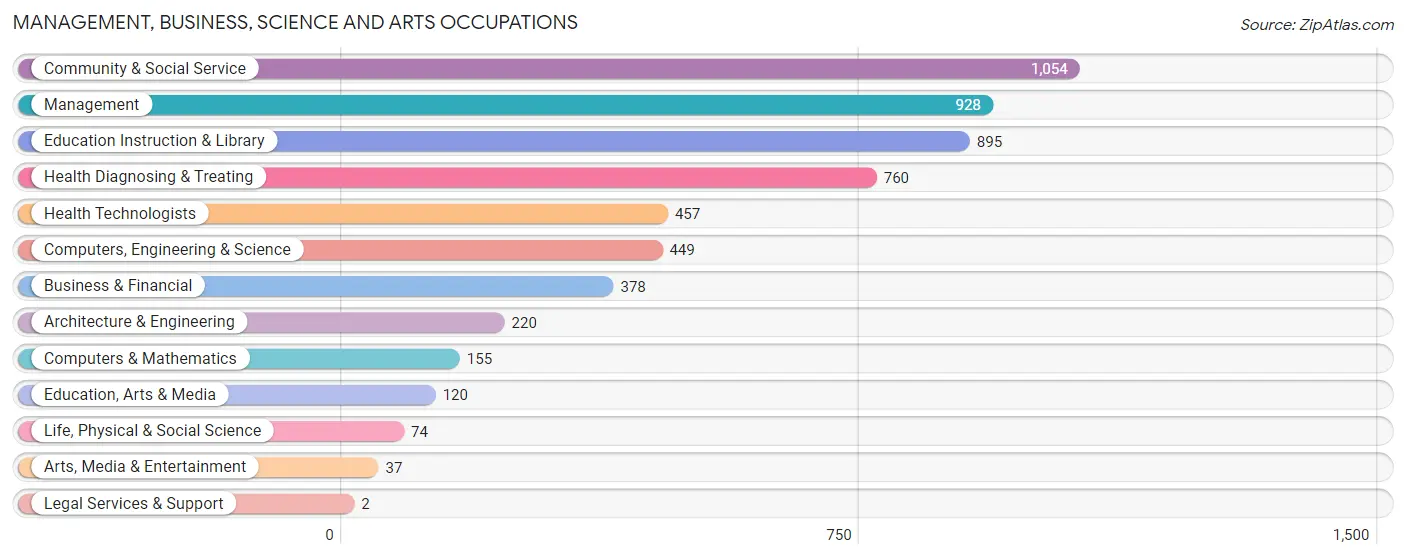
Management, Business, Science and Arts Occupations by Sex
Within the Management, Business, Science and Arts occupations in Henderson County, the most male-oriented occupations are Legal Services & Support (100.0%), Computers & Mathematics (66.4%), and Management (59.8%), while the most female-oriented occupations are Health Diagnosing & Treating (84.5%), Life, Physical & Social Science (83.8%), and Education, Arts & Media (80.0%).
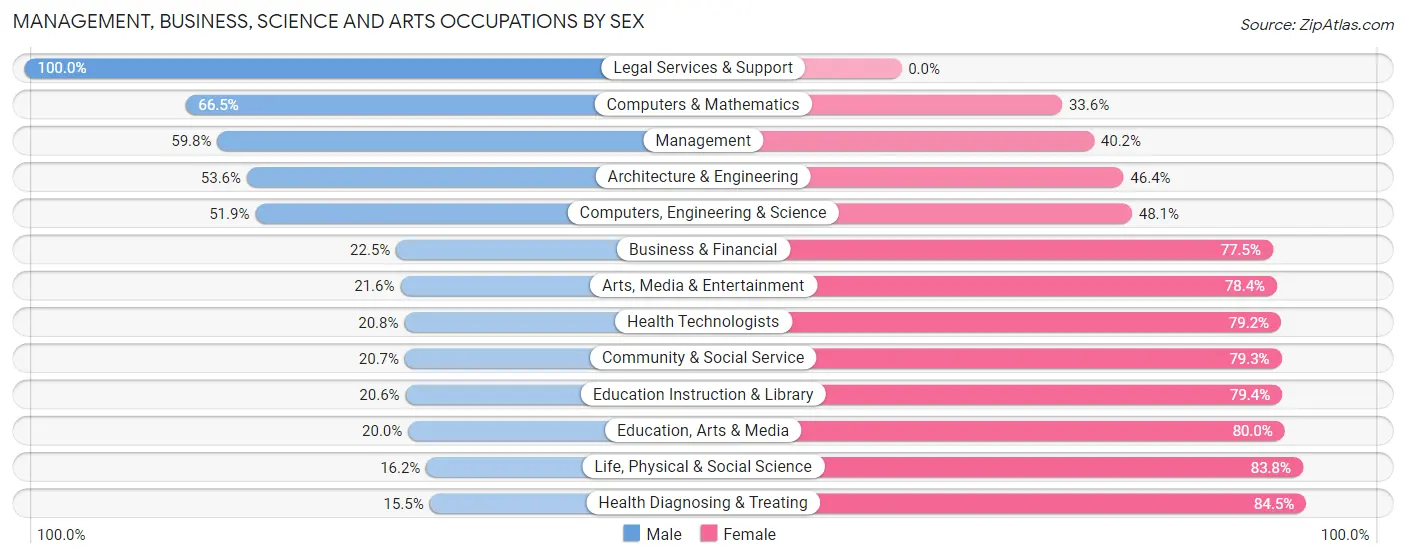
| Occupation | Male | Female |
| Management | 555 (59.8%) | 373 (40.2%) |
| Business & Financial | 85 (22.5%) | 293 (77.5%) |
| Computers, Engineering & Science | 233 (51.9%) | 216 (48.1%) |
| Computers & Mathematics | 103 (66.4%) | 52 (33.6%) |
| Architecture & Engineering | 118 (53.6%) | 102 (46.4%) |
| Life, Physical & Social Science | 12 (16.2%) | 62 (83.8%) |
| Community & Social Service | 218 (20.7%) | 836 (79.3%) |
| Education, Arts & Media | 24 (20.0%) | 96 (80.0%) |
| Legal Services & Support | 2 (100.0%) | 0 (0.0%) |
| Education Instruction & Library | 184 (20.6%) | 711 (79.4%) |
| Arts, Media & Entertainment | 8 (21.6%) | 29 (78.4%) |
| Health Diagnosing & Treating | 118 (15.5%) | 642 (84.5%) |
| Health Technologists | 95 (20.8%) | 362 (79.2%) |
| Total (Category) | 1,209 (33.9%) | 2,360 (66.1%) |
| Total (Overall) | 5,919 (51.0%) | 5,680 (49.0%) |
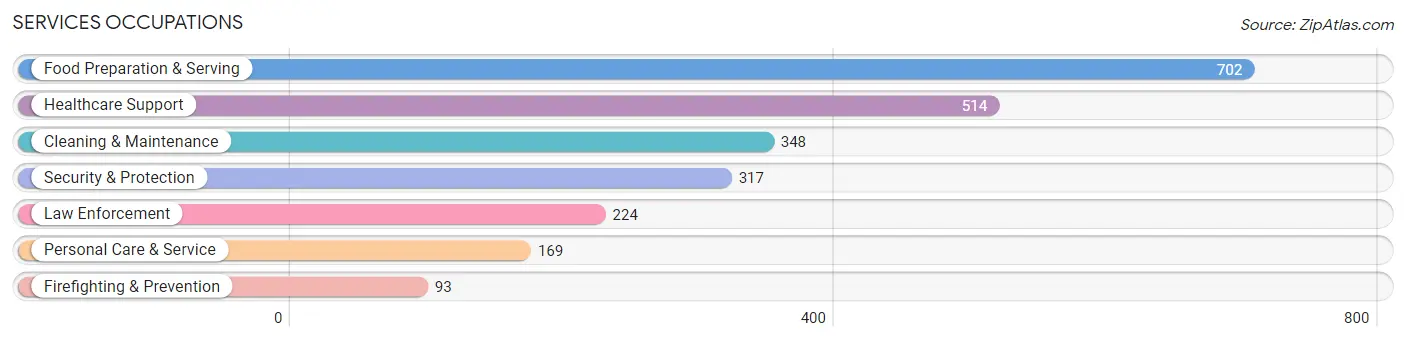
Services Occupations
The most common Services occupations in Henderson County are Food Preparation & Serving (702 | 6.0%), Healthcare Support (514 | 4.4%), Cleaning & Maintenance (348 | 3.0%), Security & Protection (317 | 2.7%), and Law Enforcement (224 | 1.9%).
Services Occupations by Sex
Within the Services occupations in Henderson County, the most male-oriented occupations are Law Enforcement (95.1%), Security & Protection (89.6%), and Firefighting & Prevention (76.3%), while the most female-oriented occupations are Healthcare Support (94.4%), Personal Care & Service (74.0%), and Food Preparation & Serving (69.5%).
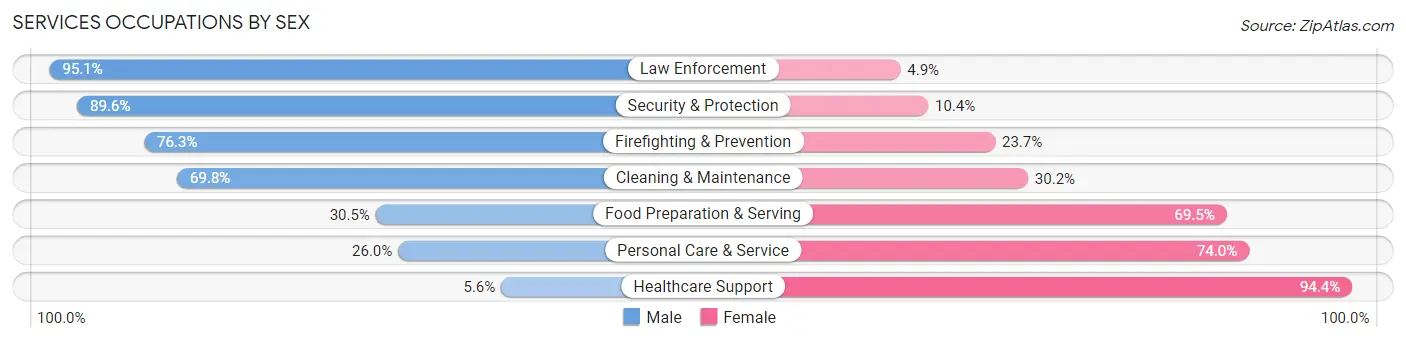
| Occupation | Male | Female |
| Healthcare Support | 29 (5.6%) | 485 (94.4%) |
| Security & Protection | 284 (89.6%) | 33 (10.4%) |
| Firefighting & Prevention | 71 (76.3%) | 22 (23.7%) |
| Law Enforcement | 213 (95.1%) | 11 (4.9%) |
| Food Preparation & Serving | 214 (30.5%) | 488 (69.5%) |
| Cleaning & Maintenance | 243 (69.8%) | 105 (30.2%) |
| Personal Care & Service | 44 (26.0%) | 125 (74.0%) |
| Total (Category) | 814 (39.7%) | 1,236 (60.3%) |
| Total (Overall) | 5,919 (51.0%) | 5,680 (49.0%) |
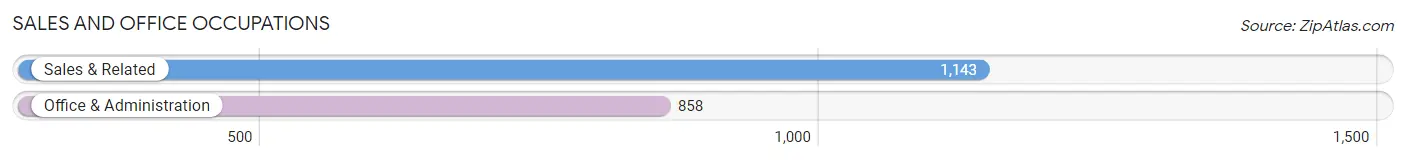
Sales and Office Occupations
The most common Sales and Office occupations in Henderson County are Sales & Related (1,143 | 9.9%), and Office & Administration (858 | 7.4%).
Sales and Office Occupations by Sex
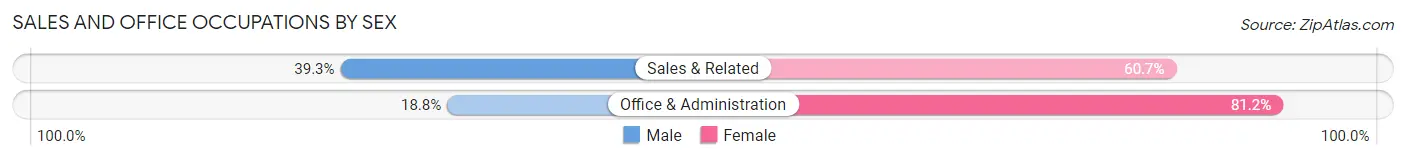
| Occupation | Male | Female |
| Sales & Related | 449 (39.3%) | 694 (60.7%) |
| Office & Administration | 161 (18.8%) | 697 (81.2%) |
| Total (Category) | 610 (30.5%) | 1,391 (69.5%) |
| Total (Overall) | 5,919 (51.0%) | 5,680 (49.0%) |
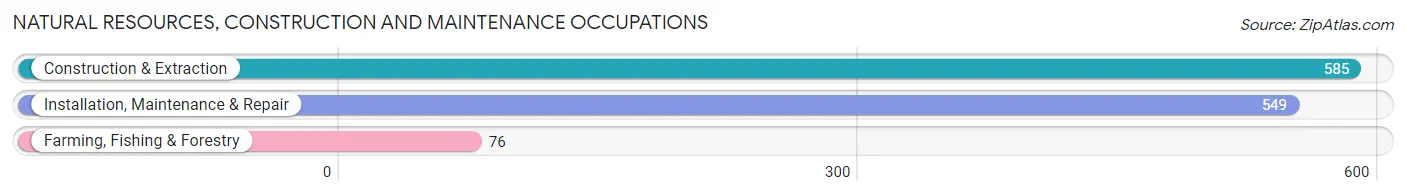
Natural Resources, Construction and Maintenance Occupations
The most common Natural Resources, Construction and Maintenance occupations in Henderson County are Construction & Extraction (585 | 5.0%), Installation, Maintenance & Repair (549 | 4.7%), and Farming, Fishing & Forestry (76 | 0.7%).
Natural Resources, Construction and Maintenance Occupations by Sex
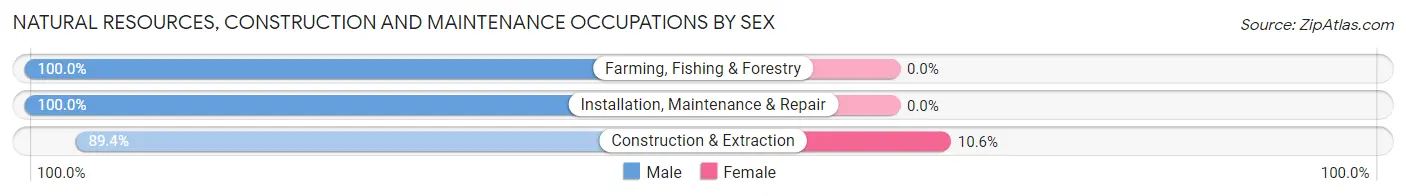
| Occupation | Male | Female |
| Farming, Fishing & Forestry | 76 (100.0%) | 0 (0.0%) |
| Construction & Extraction | 523 (89.4%) | 62 (10.6%) |
| Installation, Maintenance & Repair | 549 (100.0%) | 0 (0.0%) |
| Total (Category) | 1,148 (94.9%) | 62 (5.1%) |
| Total (Overall) | 5,919 (51.0%) | 5,680 (49.0%) |
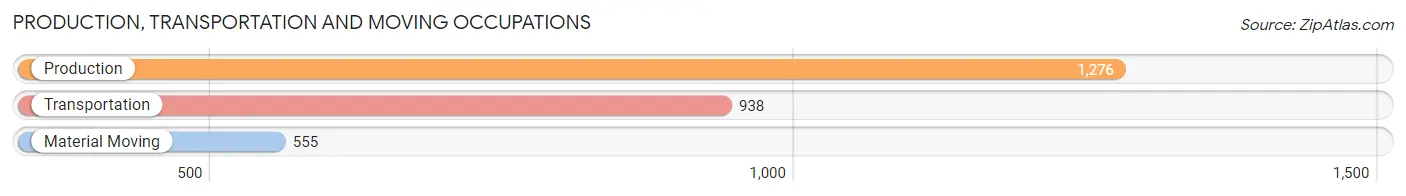
Production, Transportation and Moving Occupations
The most common Production, Transportation and Moving occupations in Henderson County are Production (1,276 | 11.0%), Transportation (938 | 8.1%), and Material Moving (555 | 4.8%).
Production, Transportation and Moving Occupations by Sex
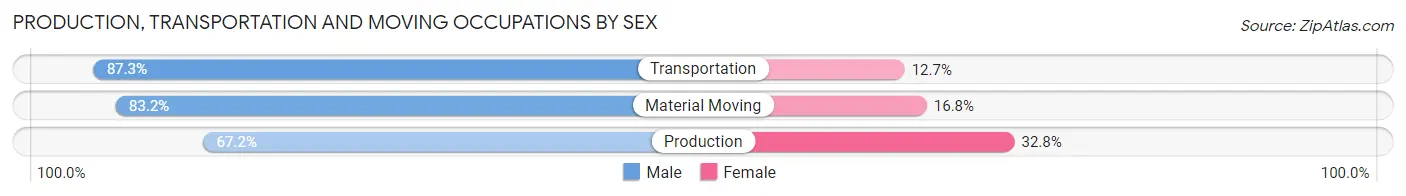
| Occupation | Male | Female |
| Production | 857 (67.2%) | 419 (32.8%) |
| Transportation | 819 (87.3%) | 119 (12.7%) |
| Material Moving | 462 (83.2%) | 93 (16.8%) |
| Total (Category) | 2,138 (77.2%) | 631 (22.8%) |
| Total (Overall) | 5,919 (51.0%) | 5,680 (49.0%) |
Employment Industries by Sex in Henderson County
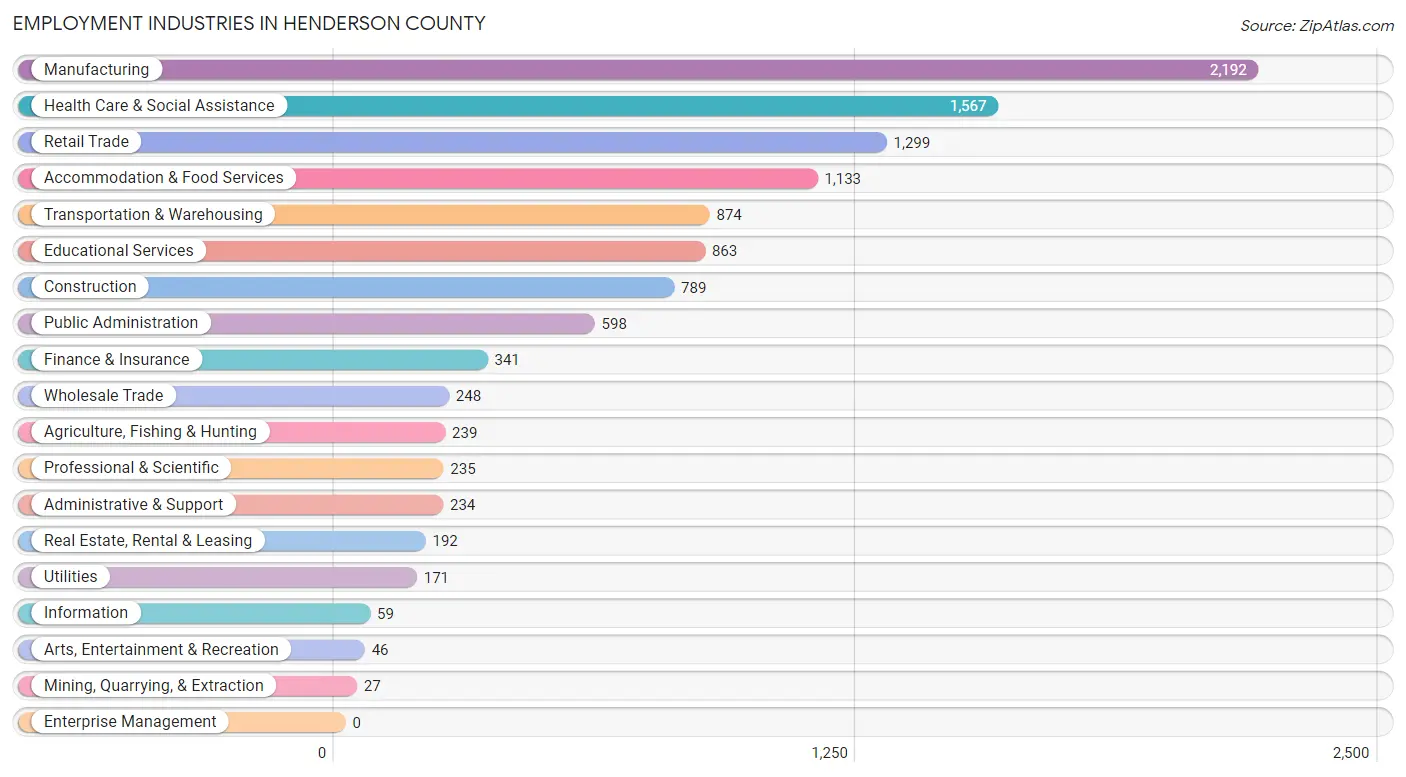
Employment Industries in Henderson County
The major employment industries in Henderson County include Manufacturing (2,192 | 18.9%), Health Care & Social Assistance (1,567 | 13.5%), Retail Trade (1,299 | 11.2%), Accommodation & Food Services (1,133 | 9.8%), and Transportation & Warehousing (874 | 7.5%).
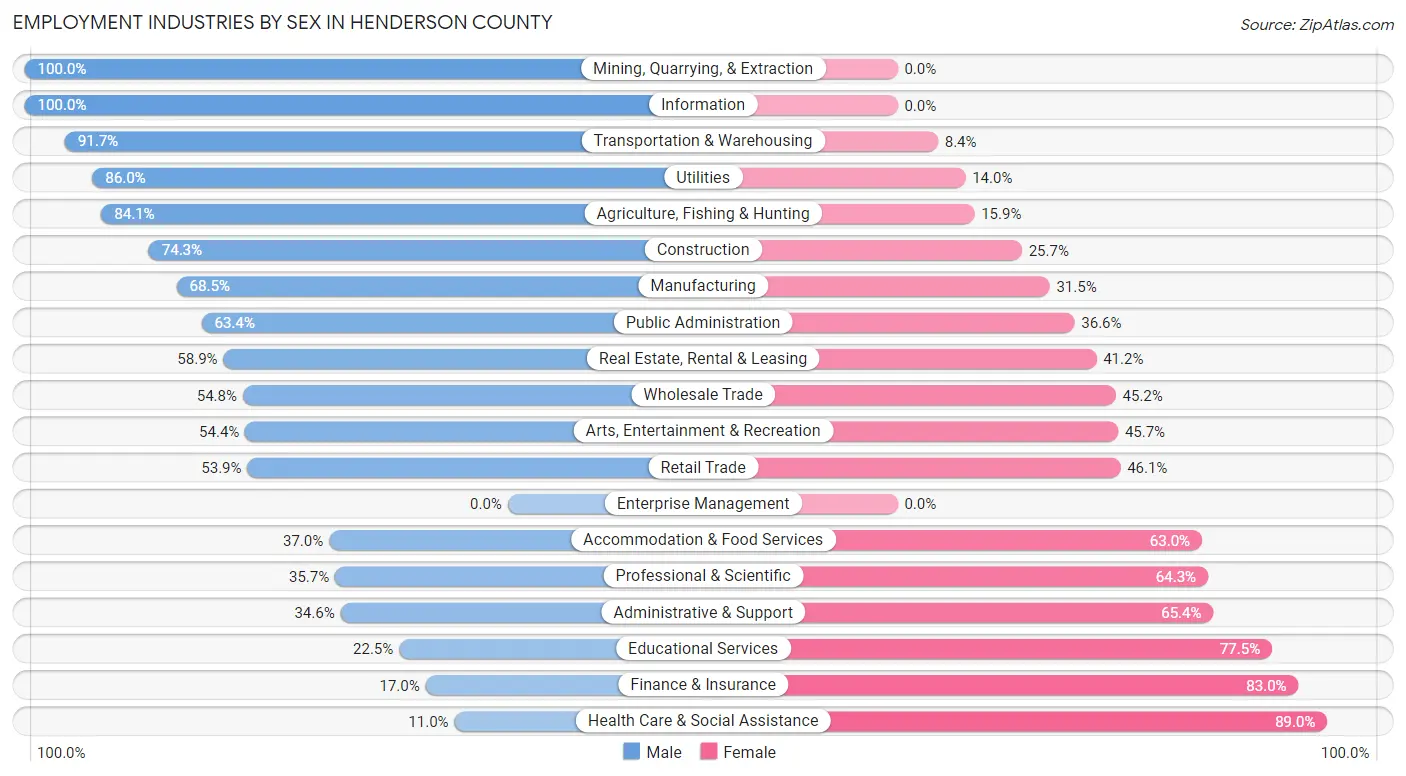
Employment Industries by Sex in Henderson County
The Henderson County industries that see more men than women are Mining, Quarrying, & Extraction (100.0%), Information (100.0%), and Transportation & Warehousing (91.6%), whereas the industries that tend to have a higher number of women are Health Care & Social Assistance (89.0%), Finance & Insurance (83.0%), and Educational Services (77.5%).
| Industry | Male | Female |
| Agriculture, Fishing & Hunting | 201 (84.1%) | 38 (15.9%) |
| Mining, Quarrying, & Extraction | 27 (100.0%) | 0 (0.0%) |
| Construction | 586 (74.3%) | 203 (25.7%) |
| Manufacturing | 1,502 (68.5%) | 690 (31.5%) |
| Wholesale Trade | 136 (54.8%) | 112 (45.2%) |
| Retail Trade | 700 (53.9%) | 599 (46.1%) |
| Transportation & Warehousing | 801 (91.6%) | 73 (8.4%) |
| Utilities | 147 (86.0%) | 24 (14.0%) |
| Information | 59 (100.0%) | 0 (0.0%) |
| Finance & Insurance | 58 (17.0%) | 283 (83.0%) |
| Real Estate, Rental & Leasing | 113 (58.9%) | 79 (41.1%) |
| Professional & Scientific | 84 (35.7%) | 151 (64.3%) |
| Enterprise Management | 0 (0.0%) | 0 (0.0%) |
| Administrative & Support | 81 (34.6%) | 153 (65.4%) |
| Educational Services | 194 (22.5%) | 669 (77.5%) |
| Health Care & Social Assistance | 173 (11.0%) | 1,394 (89.0%) |
| Arts, Entertainment & Recreation | 25 (54.3%) | 21 (45.7%) |
| Accommodation & Food Services | 419 (37.0%) | 714 (63.0%) |
| Public Administration | 379 (63.4%) | 219 (36.6%) |
| Total | 5,919 (51.0%) | 5,680 (49.0%) |
Education in Henderson County
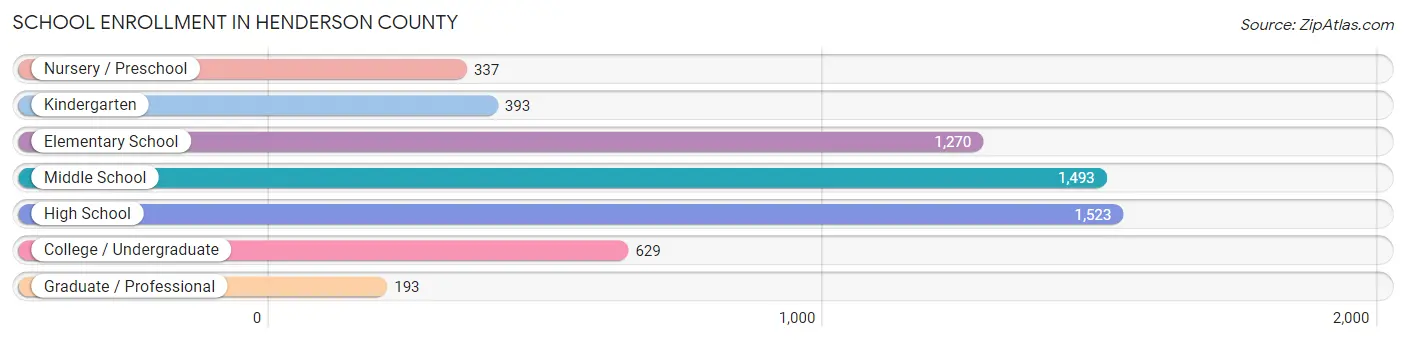
School Enrollment in Henderson County
The most common levels of schooling among the 5,838 students in Henderson County are high school (1,523 | 26.1%), middle school (1,493 | 25.6%), and elementary school (1,270 | 21.7%).
| School Level | # Students | % Students |
| Nursery / Preschool | 337 | 5.8% |
| Kindergarten | 393 | 6.7% |
| Elementary School | 1,270 | 21.7% |
| Middle School | 1,493 | 25.6% |
| High School | 1,523 | 26.1% |
| College / Undergraduate | 629 | 10.8% |
| Graduate / Professional | 193 | 3.3% |
| Total | 5,838 | 100.0% |
School Enrollment by Age by Funding Source in Henderson County
Out of a total of 5,838 students who are enrolled in schools in Henderson County, 730 (12.5%) attend a private institution, while the remaining 5,108 (87.5%) are enrolled in public schools. The age group of 25 to 34 year olds has the highest likelihood of being enrolled in private schools, with 123 (68.3% in the age bracket) enrolled. Conversely, the age group of 15 to 17 year olds has the lowest likelihood of being enrolled in a private school, with 1,197 (96.2% in the age bracket) attending a public institution.
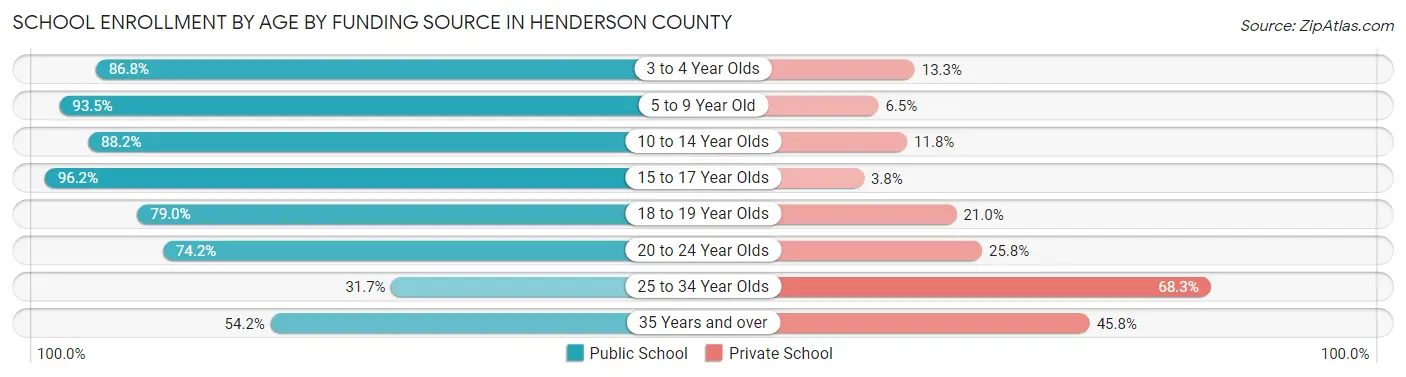
| Age Bracket | Public School | Private School |
| 3 to 4 Year Olds | 144 (86.8%) | 22 (13.3%) |
| 5 to 9 Year Old | 1,670 (93.5%) | 116 (6.5%) |
| 10 to 14 Year Olds | 1,431 (88.2%) | 192 (11.8%) |
| 15 to 17 Year Olds | 1,197 (96.2%) | 47 (3.8%) |
| 18 to 19 Year Olds | 267 (79.0%) | 71 (21.0%) |
| 20 to 24 Year Olds | 265 (74.2%) | 92 (25.8%) |
| 25 to 34 Year Olds | 57 (31.7%) | 123 (68.3%) |
| 35 Years and over | 78 (54.2%) | 66 (45.8%) |
| Total | 5,108 (87.5%) | 730 (12.5%) |
Educational Attainment by Field of Study in Henderson County
Education (930 | 33.1%), business (504 | 17.9%), science & technology (413 | 14.7%), bio, nature & agricultural (342 | 12.1%), and arts & humanities (176 | 6.2%) are the most common fields of study among 2,814 individuals in Henderson County who have obtained a bachelor's degree or higher.
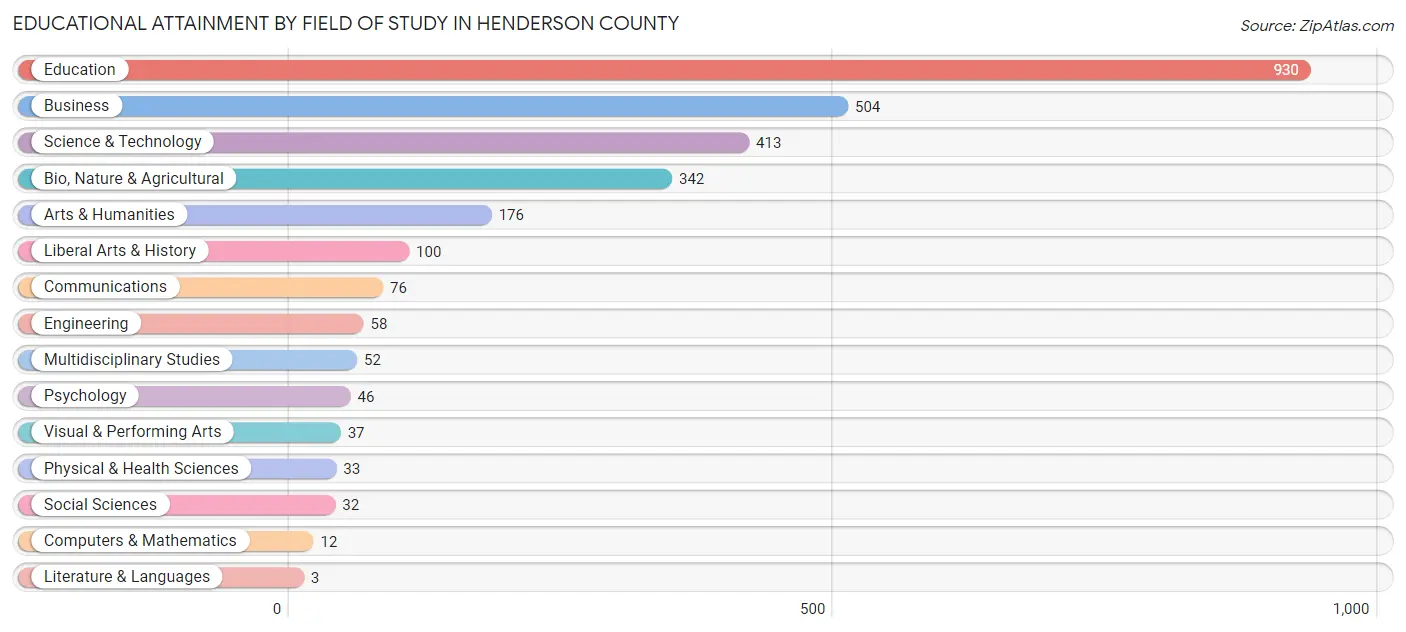
| Field of Study | # Graduates | % Graduates |
| Computers & Mathematics | 12 | 0.4% |
| Bio, Nature & Agricultural | 342 | 12.1% |
| Physical & Health Sciences | 33 | 1.2% |
| Psychology | 46 | 1.6% |
| Social Sciences | 32 | 1.1% |
| Engineering | 58 | 2.1% |
| Multidisciplinary Studies | 52 | 1.8% |
| Science & Technology | 413 | 14.7% |
| Business | 504 | 17.9% |
| Education | 930 | 33.1% |
| Literature & Languages | 3 | 0.1% |
| Liberal Arts & History | 100 | 3.5% |
| Visual & Performing Arts | 37 | 1.3% |
| Communications | 76 | 2.7% |
| Arts & Humanities | 176 | 6.2% |
| Total | 2,814 | 100.0% |
Transportation & Commute in Henderson County
Vehicle Availability by Sex in Henderson County
The most prevalent vehicle ownership categories in Henderson County are males with 2 vehicles (2,507, accounting for 42.8%) and females with 2 vehicles (1,766, making up 44.4%).
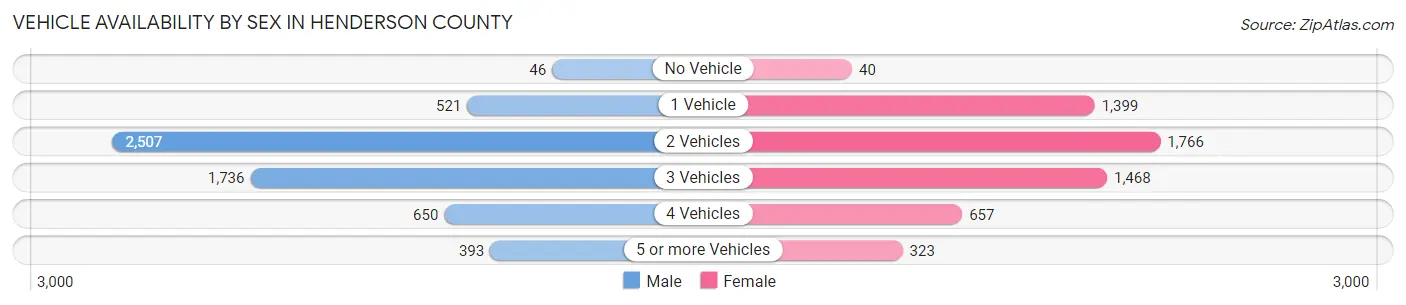
| Vehicles Available | Male | Female |
| No Vehicle | 46 (0.8%) | 40 (0.7%) |
| 1 Vehicle | 521 (8.9%) | 1,399 (24.7%) |
| 2 Vehicles | 2,507 (42.8%) | 1,766 (31.2%) |
| 3 Vehicles | 1,736 (29.7%) | 1,468 (26.0%) |
| 4 Vehicles | 650 (11.1%) | 657 (11.6%) |
| 5 or more Vehicles | 393 (6.7%) | 323 (5.7%) |
| Total | 5,853 (100.0%) | 5,653 (100.0%) |
Commute Time in Henderson County
The most frequently occuring commute durations in Henderson County are 10 to 14 minutes (1,744 commuters, 16.7%), 15 to 19 minutes (1,377 commuters, 13.2%), and 30 to 34 minutes (1,376 commuters, 13.2%).
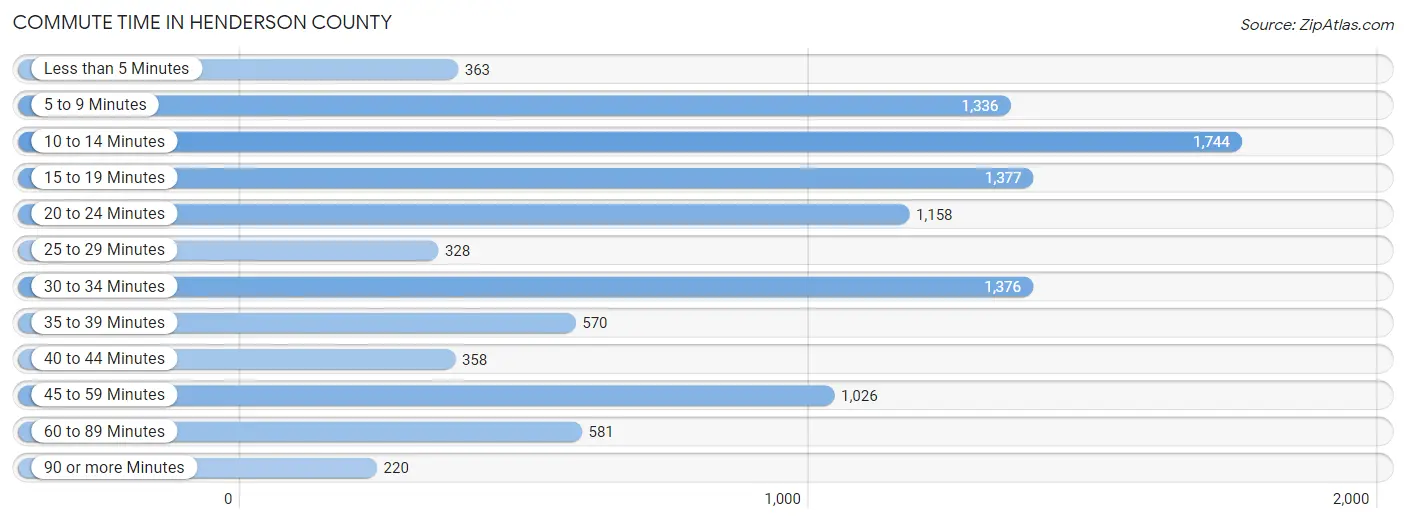
| Commute Time | # Commuters | % Commuters |
| Less than 5 Minutes | 363 | 3.5% |
| 5 to 9 Minutes | 1,336 | 12.8% |
| 10 to 14 Minutes | 1,744 | 16.7% |
| 15 to 19 Minutes | 1,377 | 13.2% |
| 20 to 24 Minutes | 1,158 | 11.1% |
| 25 to 29 Minutes | 328 | 3.1% |
| 30 to 34 Minutes | 1,376 | 13.2% |
| 35 to 39 Minutes | 570 | 5.5% |
| 40 to 44 Minutes | 358 | 3.4% |
| 45 to 59 Minutes | 1,026 | 9.8% |
| 60 to 89 Minutes | 581 | 5.6% |
| 90 or more Minutes | 220 | 2.1% |
Commute Time by Sex in Henderson County
The most common commute times in Henderson County are 10 to 14 minutes (965 commuters, 18.4%) for males and 5 to 9 minutes (960 commuters, 18.5%) for females.
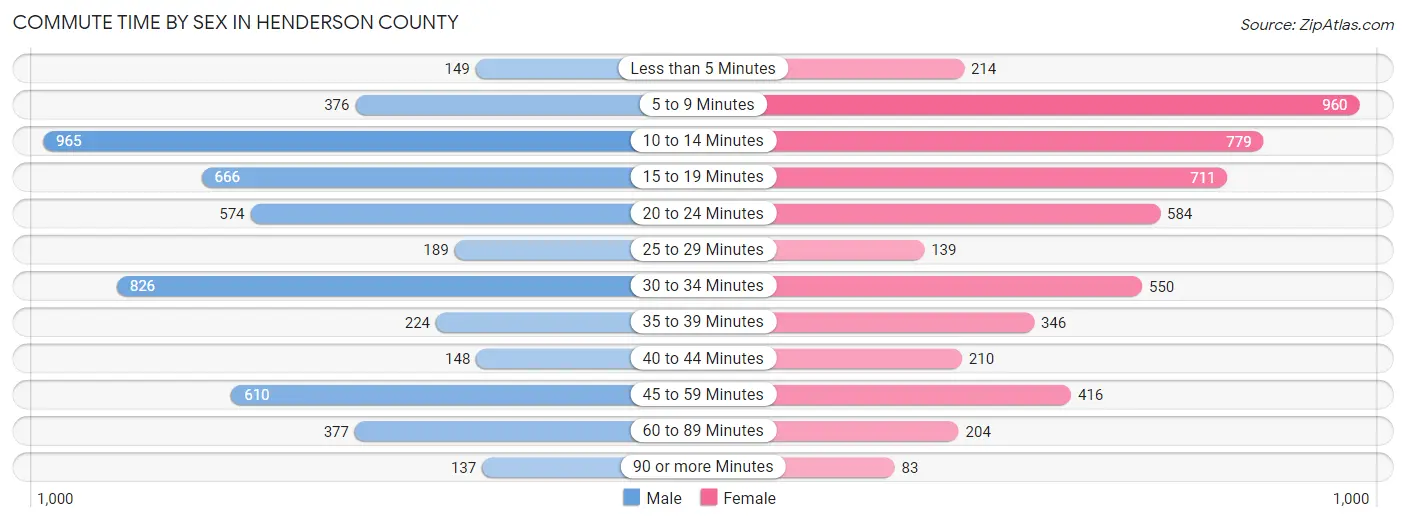
| Commute Time | Male | Female |
| Less than 5 Minutes | 149 (2.8%) | 214 (4.1%) |
| 5 to 9 Minutes | 376 (7.2%) | 960 (18.5%) |
| 10 to 14 Minutes | 965 (18.4%) | 779 (15.0%) |
| 15 to 19 Minutes | 666 (12.7%) | 711 (13.7%) |
| 20 to 24 Minutes | 574 (11.0%) | 584 (11.2%) |
| 25 to 29 Minutes | 189 (3.6%) | 139 (2.7%) |
| 30 to 34 Minutes | 826 (15.8%) | 550 (10.6%) |
| 35 to 39 Minutes | 224 (4.3%) | 346 (6.7%) |
| 40 to 44 Minutes | 148 (2.8%) | 210 (4.0%) |
| 45 to 59 Minutes | 610 (11.6%) | 416 (8.0%) |
| 60 to 89 Minutes | 377 (7.2%) | 204 (3.9%) |
| 90 or more Minutes | 137 (2.6%) | 83 (1.6%) |
Time of Departure to Work by Sex in Henderson County
The most frequent times of departure to work in Henderson County are 6:30 AM to 6:59 AM (801, 15.3%) for males and 7:00 AM to 7:29 AM (1,215, 23.4%) for females.
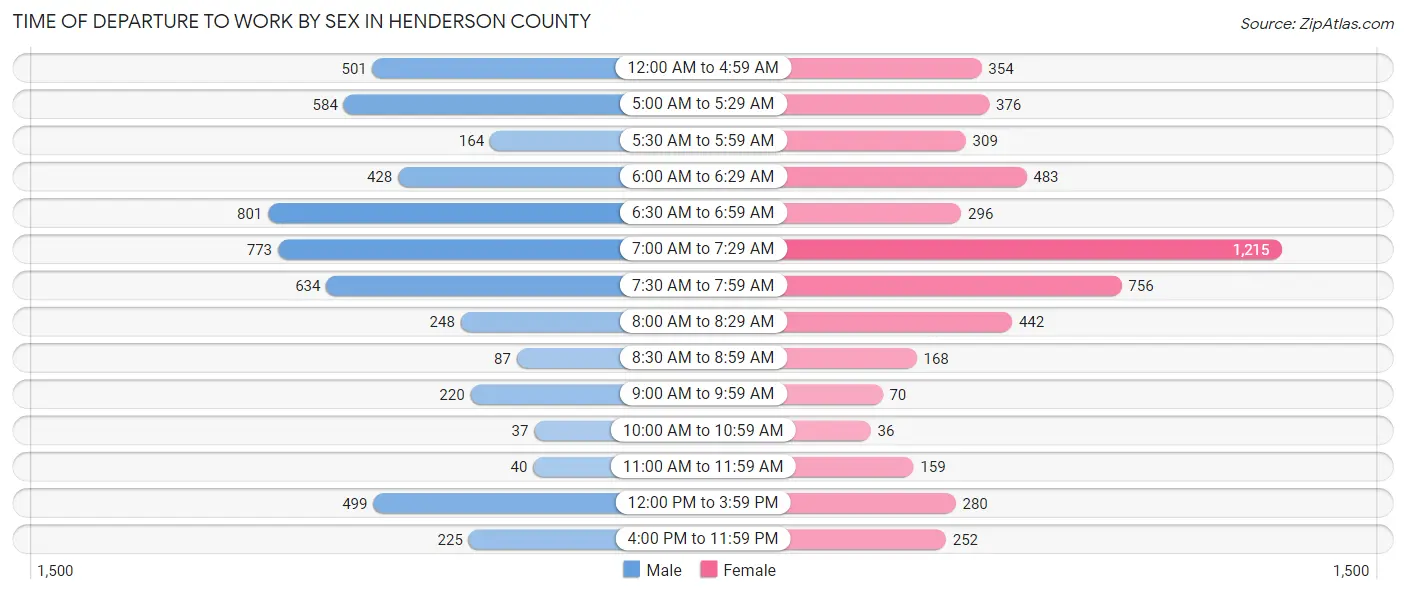
| Time of Departure | Male | Female |
| 12:00 AM to 4:59 AM | 501 (9.6%) | 354 (6.8%) |
| 5:00 AM to 5:29 AM | 584 (11.1%) | 376 (7.2%) |
| 5:30 AM to 5:59 AM | 164 (3.1%) | 309 (5.9%) |
| 6:00 AM to 6:29 AM | 428 (8.2%) | 483 (9.3%) |
| 6:30 AM to 6:59 AM | 801 (15.3%) | 296 (5.7%) |
| 7:00 AM to 7:29 AM | 773 (14.7%) | 1,215 (23.4%) |
| 7:30 AM to 7:59 AM | 634 (12.1%) | 756 (14.5%) |
| 8:00 AM to 8:29 AM | 248 (4.7%) | 442 (8.5%) |
| 8:30 AM to 8:59 AM | 87 (1.7%) | 168 (3.2%) |
| 9:00 AM to 9:59 AM | 220 (4.2%) | 70 (1.3%) |
| 10:00 AM to 10:59 AM | 37 (0.7%) | 36 (0.7%) |
| 11:00 AM to 11:59 AM | 40 (0.8%) | 159 (3.1%) |
| 12:00 PM to 3:59 PM | 499 (9.5%) | 280 (5.4%) |
| 4:00 PM to 11:59 PM | 225 (4.3%) | 252 (4.9%) |
| Total | 5,241 (100.0%) | 5,196 (100.0%) |
Housing Occupancy in Henderson County
Occupancy by Ownership in Henderson County
Of the total 10,737 dwellings in Henderson County, owner-occupied units account for 7,652 (71.3%), while renter-occupied units make up 3,085 (28.7%).
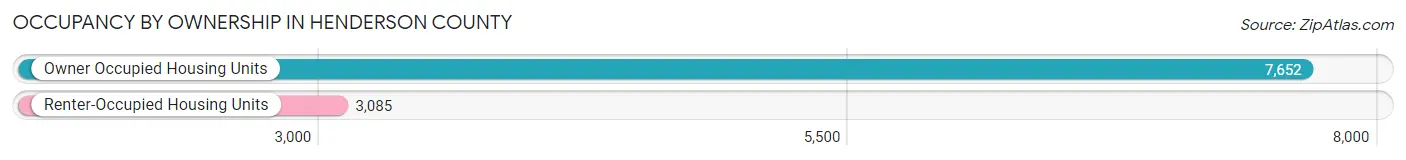
| Occupancy | # Housing Units | % Housing Units |
| Owner Occupied Housing Units | 7,652 | 71.3% |
| Renter-Occupied Housing Units | 3,085 | 28.7% |
| Total Occupied Housing Units | 10,737 | 100.0% |
Occupancy by Household Size in Henderson County
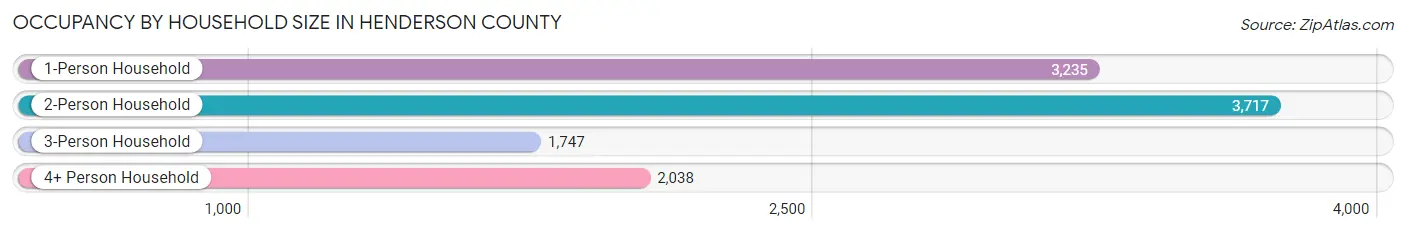
| Household Size | # Housing Units | % Housing Units |
| 1-Person Household | 3,235 | 30.1% |
| 2-Person Household | 3,717 | 34.6% |
| 3-Person Household | 1,747 | 16.3% |
| 4+ Person Household | 2,038 | 19.0% |
| Total Housing Units | 10,737 | 100.0% |
Occupancy by Ownership by Household Size in Henderson County
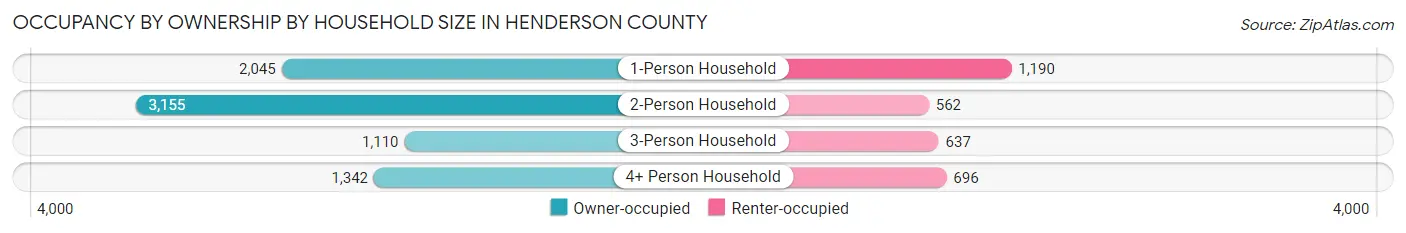
| Household Size | Owner-occupied | Renter-occupied |
| 1-Person Household | 2,045 (63.2%) | 1,190 (36.8%) |
| 2-Person Household | 3,155 (84.9%) | 562 (15.1%) |
| 3-Person Household | 1,110 (63.5%) | 637 (36.5%) |
| 4+ Person Household | 1,342 (65.8%) | 696 (34.2%) |
| Total Housing Units | 7,652 (71.3%) | 3,085 (28.7%) |
Occupancy by Educational Attainment in Henderson County
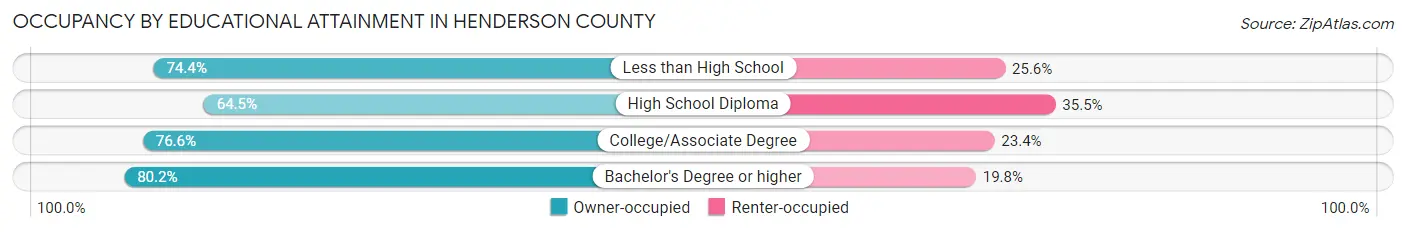
| Household Size | Owner-occupied | Renter-occupied |
| Less than High School | 929 (74.4%) | 319 (25.6%) |
| High School Diploma | 3,180 (64.5%) | 1,753 (35.5%) |
| College/Associate Degree | 2,349 (76.6%) | 719 (23.4%) |
| Bachelor's Degree or higher | 1,194 (80.2%) | 294 (19.8%) |
Occupancy by Age of Householder in Henderson County
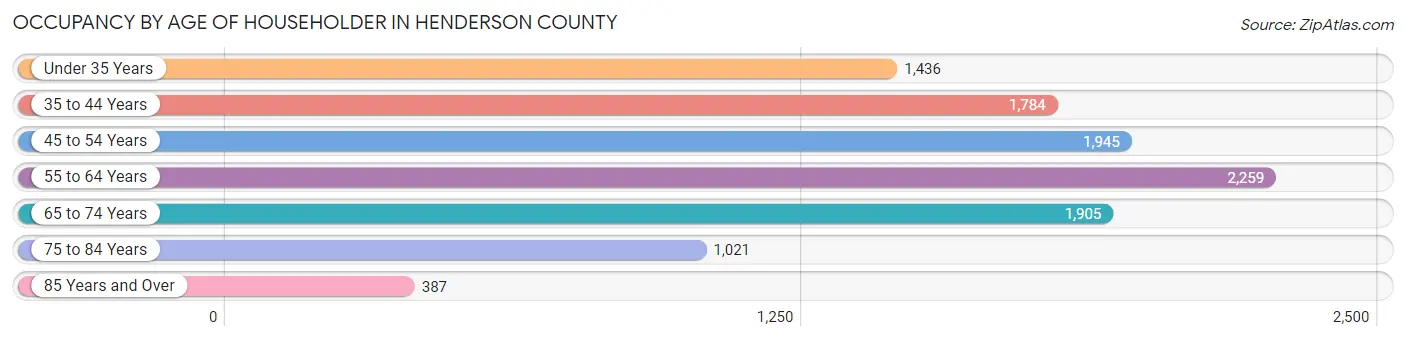
| Age Bracket | # Households | % Households |
| Under 35 Years | 1,436 | 13.4% |
| 35 to 44 Years | 1,784 | 16.6% |
| 45 to 54 Years | 1,945 | 18.1% |
| 55 to 64 Years | 2,259 | 21.0% |
| 65 to 74 Years | 1,905 | 17.7% |
| 75 to 84 Years | 1,021 | 9.5% |
| 85 Years and Over | 387 | 3.6% |
| Total | 10,737 | 100.0% |
Housing Finances in Henderson County
Median Income by Occupancy in Henderson County
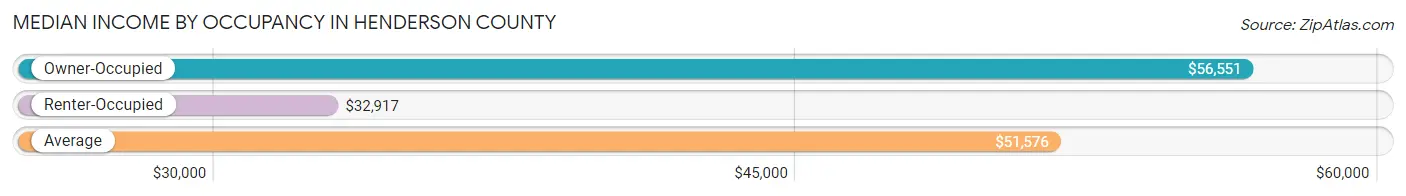
| Occupancy Type | # Households | Median Income |
| Owner-Occupied | 7,652 (71.3%) | $56,551 |
| Renter-Occupied | 3,085 (28.7%) | $32,917 |
| Average | 10,737 (100.0%) | $51,576 |
Occupancy by Householder Income Bracket in Henderson County
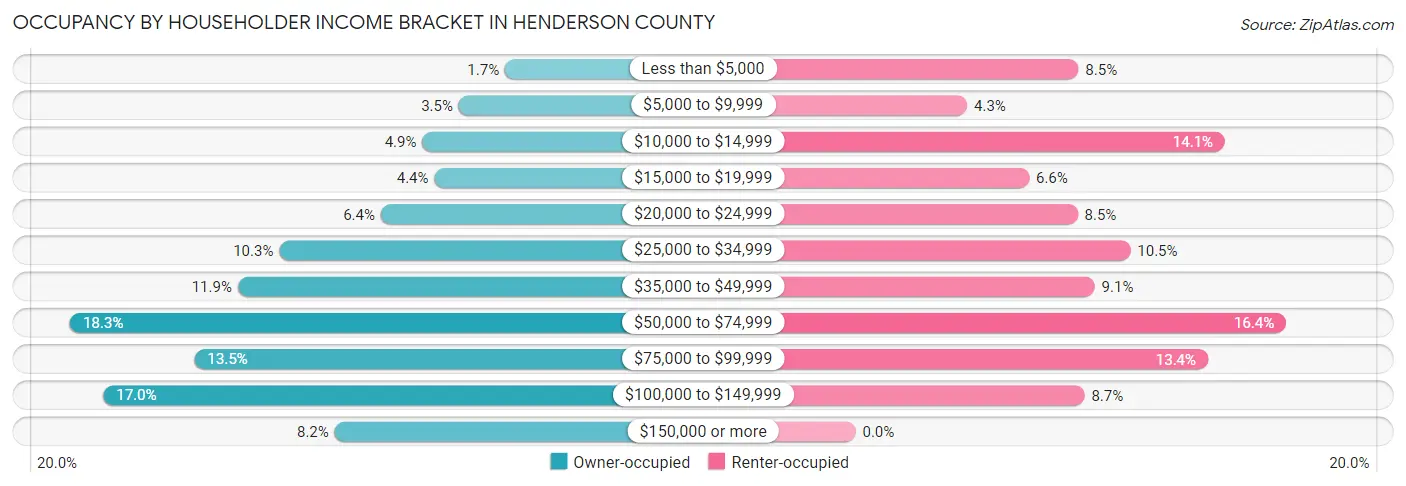
| Income Bracket | Owner-occupied | Renter-occupied |
| Less than $5,000 | 130 (1.7%) | 262 (8.5%) |
| $5,000 to $9,999 | 265 (3.5%) | 131 (4.3%) |
| $10,000 to $14,999 | 371 (4.9%) | 434 (14.1%) |
| $15,000 to $19,999 | 336 (4.4%) | 204 (6.6%) |
| $20,000 to $24,999 | 492 (6.4%) | 261 (8.5%) |
| $25,000 to $34,999 | 788 (10.3%) | 323 (10.5%) |
| $35,000 to $49,999 | 909 (11.9%) | 281 (9.1%) |
| $50,000 to $74,999 | 1,398 (18.3%) | 506 (16.4%) |
| $75,000 to $99,999 | 1,035 (13.5%) | 414 (13.4%) |
| $100,000 to $149,999 | 1,301 (17.0%) | 269 (8.7%) |
| $150,000 or more | 627 (8.2%) | 0 (0.0%) |
| Total | 7,652 (100.0%) | 3,085 (100.0%) |
Monthly Housing Cost Tiers in Henderson County
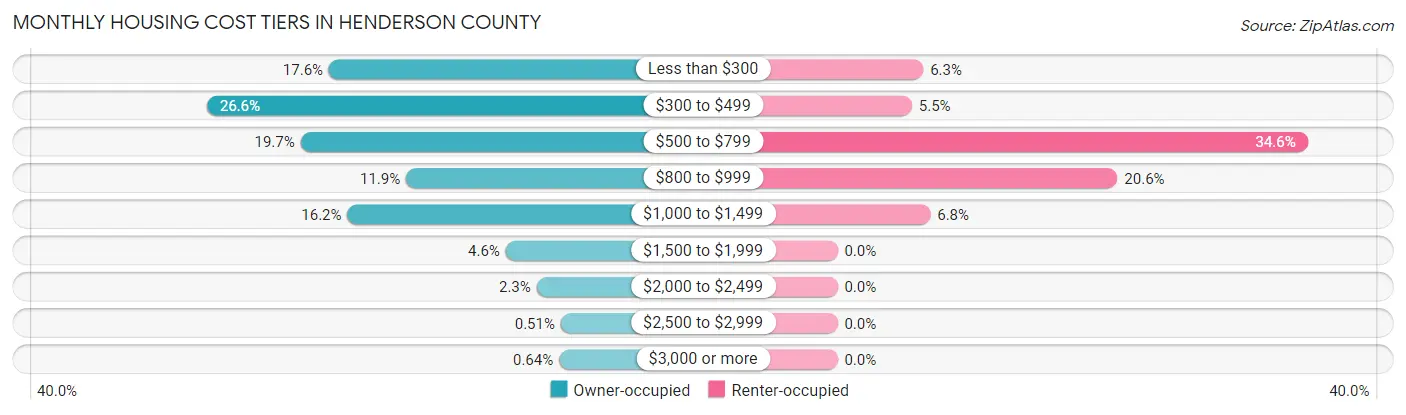
| Monthly Cost | Owner-occupied | Renter-occupied |
| Less than $300 | 1,346 (17.6%) | 195 (6.3%) |
| $300 to $499 | 2,034 (26.6%) | 169 (5.5%) |
| $500 to $799 | 1,506 (19.7%) | 1,068 (34.6%) |
| $800 to $999 | 911 (11.9%) | 636 (20.6%) |
| $1,000 to $1,499 | 1,242 (16.2%) | 211 (6.8%) |
| $1,500 to $1,999 | 350 (4.6%) | 0 (0.0%) |
| $2,000 to $2,499 | 175 (2.3%) | 0 (0.0%) |
| $2,500 to $2,999 | 39 (0.5%) | 0 (0.0%) |
| $3,000 or more | 49 (0.6%) | 0 (0.0%) |
| Total | 7,652 (100.0%) | 3,085 (100.0%) |
Physical Housing Characteristics in Henderson County
Housing Structures in Henderson County
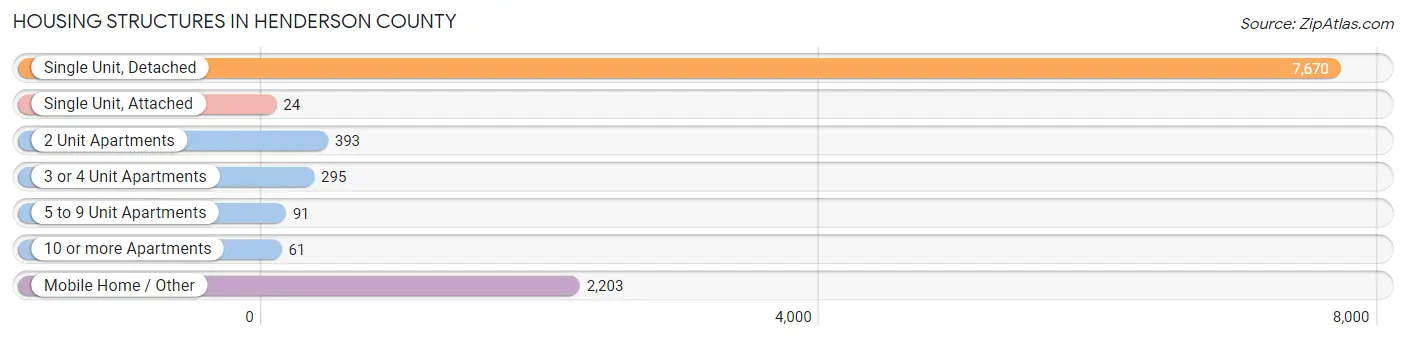
| Structure Type | # Housing Units | % Housing Units |
| Single Unit, Detached | 7,670 | 71.4% |
| Single Unit, Attached | 24 | 0.2% |
| 2 Unit Apartments | 393 | 3.7% |
| 3 or 4 Unit Apartments | 295 | 2.8% |
| 5 to 9 Unit Apartments | 91 | 0.9% |
| 10 or more Apartments | 61 | 0.6% |
| Mobile Home / Other | 2,203 | 20.5% |
| Total | 10,737 | 100.0% |
Housing Structures by Occupancy in Henderson County
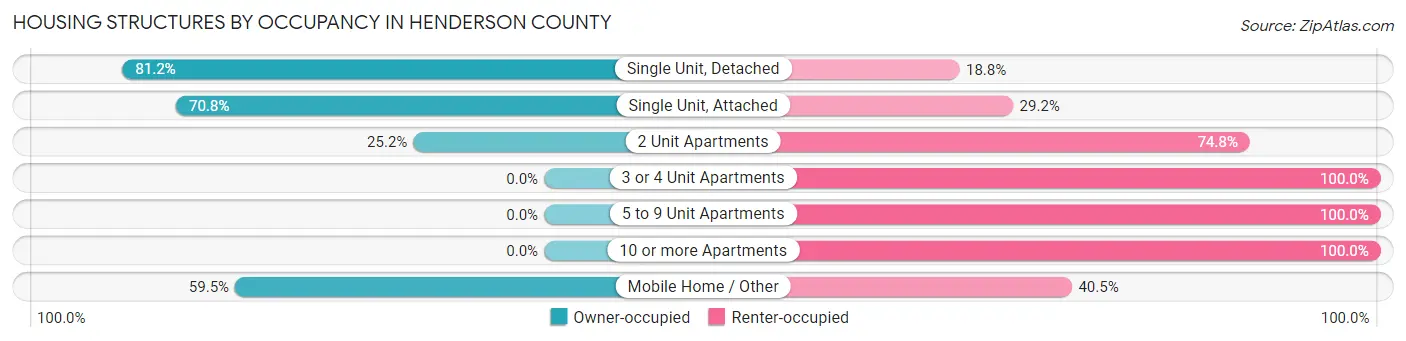
| Structure Type | Owner-occupied | Renter-occupied |
| Single Unit, Detached | 6,225 (81.2%) | 1,445 (18.8%) |
| Single Unit, Attached | 17 (70.8%) | 7 (29.2%) |
| 2 Unit Apartments | 99 (25.2%) | 294 (74.8%) |
| 3 or 4 Unit Apartments | 0 (0.0%) | 295 (100.0%) |
| 5 to 9 Unit Apartments | 0 (0.0%) | 91 (100.0%) |
| 10 or more Apartments | 0 (0.0%) | 61 (100.0%) |
| Mobile Home / Other | 1,311 (59.5%) | 892 (40.5%) |
| Total | 7,652 (71.3%) | 3,085 (28.7%) |
Housing Structures by Number of Rooms in Henderson County
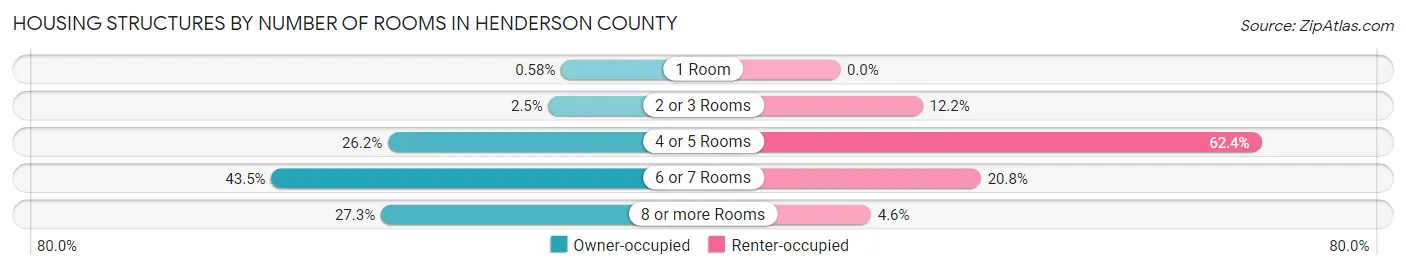
| Number of Rooms | Owner-occupied | Renter-occupied |
| 1 Room | 44 (0.6%) | 0 (0.0%) |
| 2 or 3 Rooms | 188 (2.5%) | 377 (12.2%) |
| 4 or 5 Rooms | 2,007 (26.2%) | 1,924 (62.4%) |
| 6 or 7 Rooms | 3,327 (43.5%) | 643 (20.8%) |
| 8 or more Rooms | 2,086 (27.3%) | 141 (4.6%) |
| Total | 7,652 (100.0%) | 3,085 (100.0%) |
Housing Structure by Heating Type in Henderson County
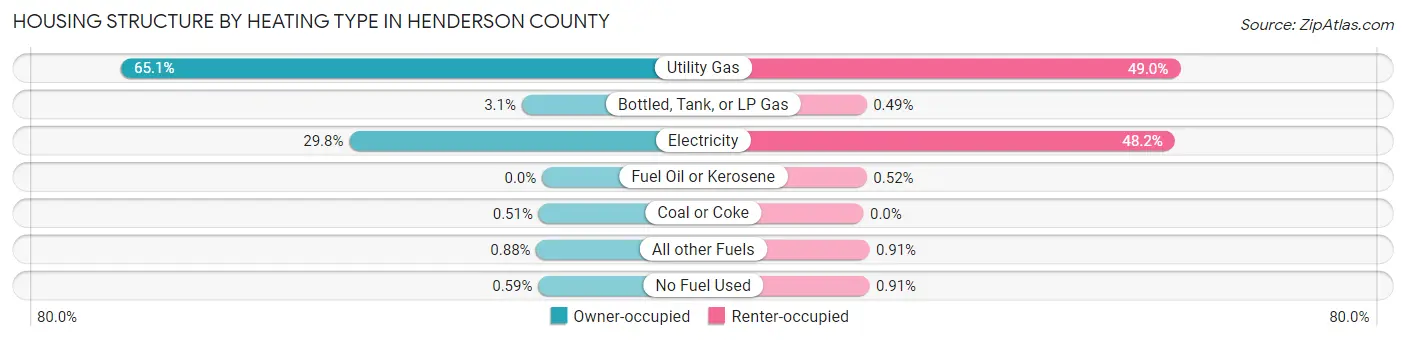
| Heating Type | Owner-occupied | Renter-occupied |
| Utility Gas | 4,980 (65.1%) | 1,512 (49.0%) |
| Bottled, Tank, or LP Gas | 240 (3.1%) | 15 (0.5%) |
| Electricity | 2,281 (29.8%) | 1,486 (48.2%) |
| Fuel Oil or Kerosene | 0 (0.0%) | 16 (0.5%) |
| Coal or Coke | 39 (0.5%) | 0 (0.0%) |
| All other Fuels | 67 (0.9%) | 28 (0.9%) |
| No Fuel Used | 45 (0.6%) | 28 (0.9%) |
| Total | 7,652 (100.0%) | 3,085 (100.0%) |
Household Vehicle Usage in Henderson County
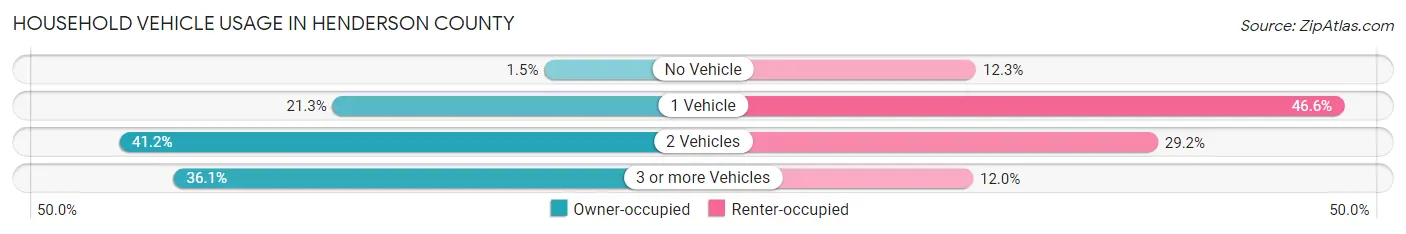
| Vehicles per Household | Owner-occupied | Renter-occupied |
| No Vehicle | 114 (1.5%) | 378 (12.2%) |
| 1 Vehicle | 1,626 (21.2%) | 1,437 (46.6%) |
| 2 Vehicles | 3,151 (41.2%) | 901 (29.2%) |
| 3 or more Vehicles | 2,761 (36.1%) | 369 (12.0%) |
| Total | 7,652 (100.0%) | 3,085 (100.0%) |
Real Estate & Mortgages in Henderson County
Real Estate and Mortgage Overview in Henderson County
| Characteristic | Without Mortgage | With Mortgage |
| Housing Units | 4,426 | 3,226 |
| Median Property Value | $131,700 | $151,500 |
| Median Household Income | $45,888 | $436 |
| Monthly Housing Costs | $380 | $33 |
| Real Estate Taxes | $660 | $170 |
Property Value by Mortgage Status in Henderson County
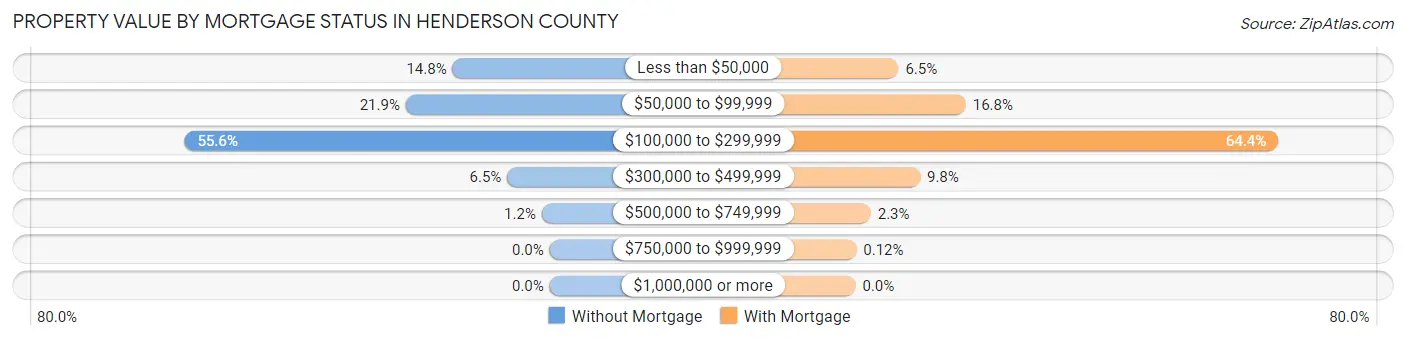
| Property Value | Without Mortgage | With Mortgage |
| Less than $50,000 | 655 (14.8%) | 211 (6.5%) |
| $50,000 to $99,999 | 970 (21.9%) | 542 (16.8%) |
| $100,000 to $299,999 | 2,462 (55.6%) | 2,077 (64.4%) |
| $300,000 to $499,999 | 286 (6.5%) | 317 (9.8%) |
| $500,000 to $749,999 | 53 (1.2%) | 75 (2.3%) |
| $750,000 to $999,999 | 0 (0.0%) | 4 (0.1%) |
| $1,000,000 or more | 0 (0.0%) | 0 (0.0%) |
| Total | 4,426 (100.0%) | 3,226 (100.0%) |
Household Income by Mortgage Status in Henderson County
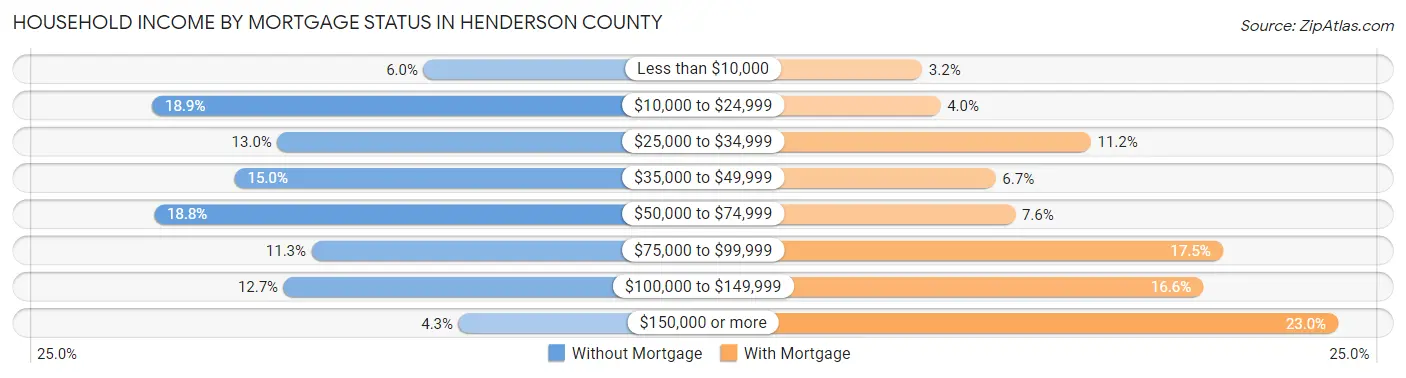
| Household Income | Without Mortgage | With Mortgage |
| Less than $10,000 | 265 (6.0%) | 102 (3.2%) |
| $10,000 to $24,999 | 838 (18.9%) | 130 (4.0%) |
| $25,000 to $34,999 | 573 (13.0%) | 361 (11.2%) |
| $35,000 to $49,999 | 664 (15.0%) | 215 (6.7%) |
| $50,000 to $74,999 | 834 (18.8%) | 245 (7.6%) |
| $75,000 to $99,999 | 501 (11.3%) | 564 (17.5%) |
| $100,000 to $149,999 | 560 (12.7%) | 534 (16.6%) |
| $150,000 or more | 191 (4.3%) | 741 (23.0%) |
| Total | 4,426 (100.0%) | 3,226 (100.0%) |
Property Value to Household Income Ratio in Henderson County
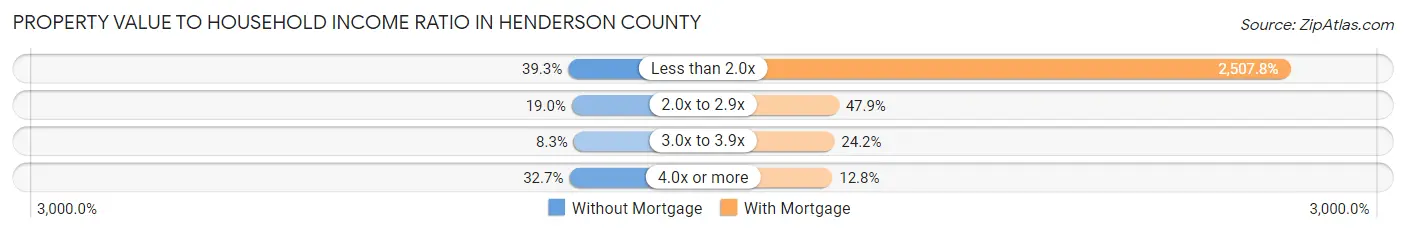
| Value-to-Income Ratio | Without Mortgage | With Mortgage |
| Less than 2.0x | 1,738 (39.3%) | 80,902 (2,507.8%) |
| 2.0x to 2.9x | 839 (19.0%) | 1,544 (47.9%) |
| 3.0x to 3.9x | 365 (8.3%) | 779 (24.1%) |
| 4.0x or more | 1,449 (32.7%) | 414 (12.8%) |
| Total | 4,426 (100.0%) | 3,226 (100.0%) |
Real Estate Taxes by Mortgage Status in Henderson County
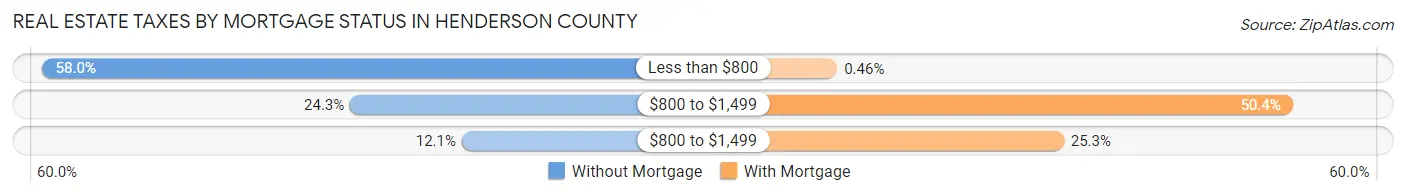
| Property Taxes | Without Mortgage | With Mortgage |
| Less than $800 | 2,568 (58.0%) | 15 (0.5%) |
| $800 to $1,499 | 1,077 (24.3%) | 1,625 (50.4%) |
| $800 to $1,499 | 535 (12.1%) | 816 (25.3%) |
| Total | 4,426 (100.0%) | 3,226 (100.0%) |
Health & Disability in Henderson County
Health Insurance Coverage by Age in Henderson County
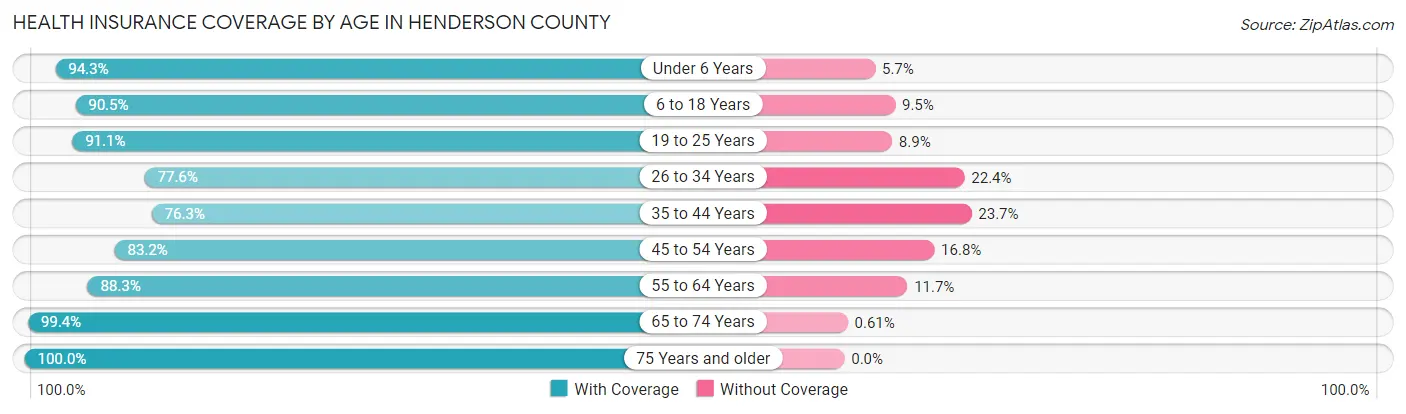
| Age Bracket | With Coverage | Without Coverage |
| Under 6 Years | 1,910 (94.3%) | 116 (5.7%) |
| 6 to 18 Years | 4,336 (90.5%) | 453 (9.5%) |
| 19 to 25 Years | 1,735 (91.1%) | 169 (8.9%) |
| 26 to 34 Years | 2,167 (77.6%) | 625 (22.4%) |
| 35 to 44 Years | 2,667 (76.3%) | 828 (23.7%) |
| 45 to 54 Years | 2,960 (83.2%) | 596 (16.8%) |
| 55 to 64 Years | 3,463 (88.3%) | 460 (11.7%) |
| 65 to 74 Years | 2,933 (99.4%) | 18 (0.6%) |
| 75 Years and older | 2,015 (100.0%) | 0 (0.0%) |
| Total | 24,186 (88.1%) | 3,265 (11.9%) |
Health Insurance Coverage by Citizenship Status in Henderson County
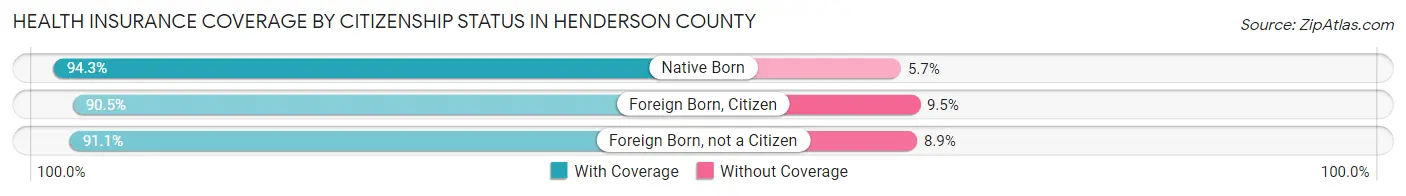
| Citizenship Status | With Coverage | Without Coverage |
| Native Born | 1,910 (94.3%) | 116 (5.7%) |
| Foreign Born, Citizen | 4,336 (90.5%) | 453 (9.5%) |
| Foreign Born, not a Citizen | 1,735 (91.1%) | 169 (8.9%) |
Health Insurance Coverage by Household Income in Henderson County
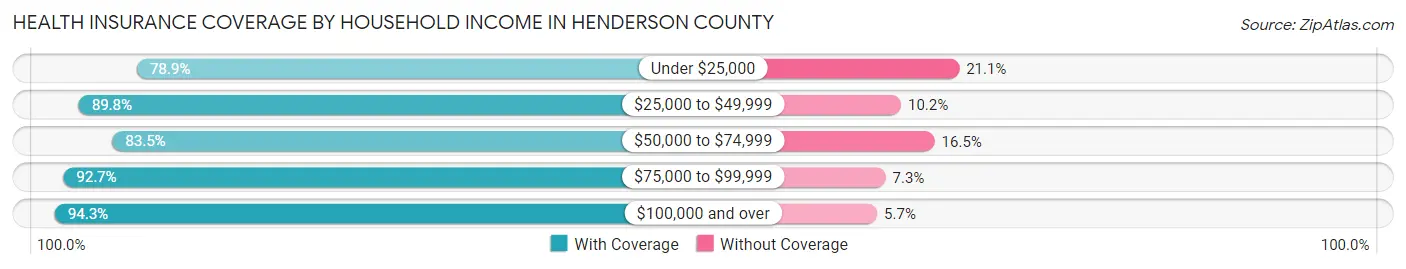
| Household Income | With Coverage | Without Coverage |
| Under $25,000 | 4,326 (78.9%) | 1,154 (21.1%) |
| $25,000 to $49,999 | 4,332 (89.8%) | 490 (10.2%) |
| $50,000 to $74,999 | 4,446 (83.5%) | 876 (16.5%) |
| $75,000 to $99,999 | 4,194 (92.7%) | 329 (7.3%) |
| $100,000 and over | 6,882 (94.3%) | 415 (5.7%) |
Public vs Private Health Insurance Coverage by Age in Henderson County
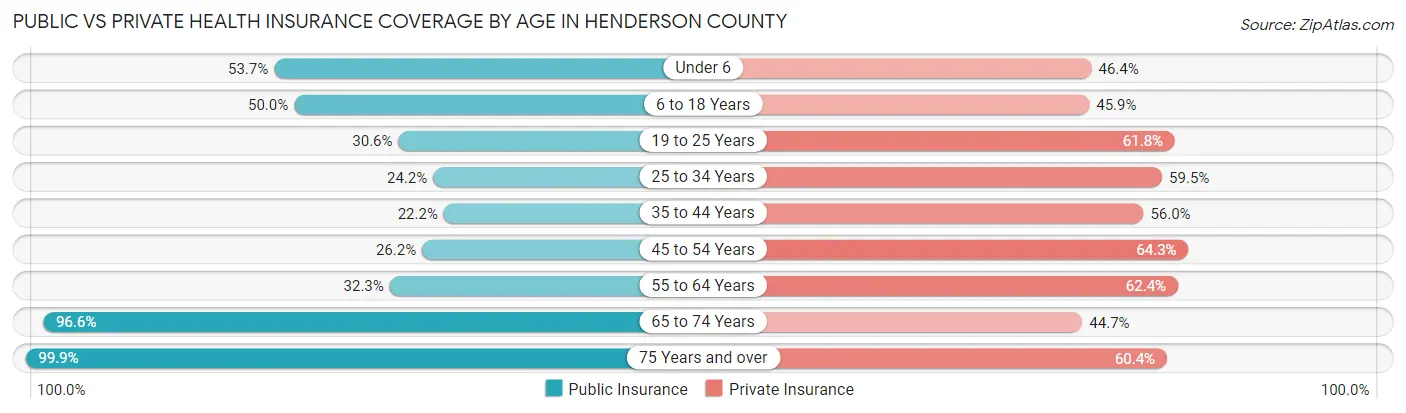
| Age Bracket | Public Insurance | Private Insurance |
| Under 6 | 1,088 (53.7%) | 939 (46.4%) |
| 6 to 18 Years | 2,394 (50.0%) | 2,200 (45.9%) |
| 19 to 25 Years | 583 (30.6%) | 1,177 (61.8%) |
| 25 to 34 Years | 675 (24.2%) | 1,660 (59.5%) |
| 35 to 44 Years | 776 (22.2%) | 1,957 (56.0%) |
| 45 to 54 Years | 933 (26.2%) | 2,288 (64.3%) |
| 55 to 64 Years | 1,265 (32.3%) | 2,447 (62.4%) |
| 65 to 74 Years | 2,850 (96.6%) | 1,318 (44.7%) |
| 75 Years and over | 2,012 (99.9%) | 1,216 (60.4%) |
| Total | 12,576 (45.8%) | 15,202 (55.4%) |
Disability Status by Sex by Age in Henderson County
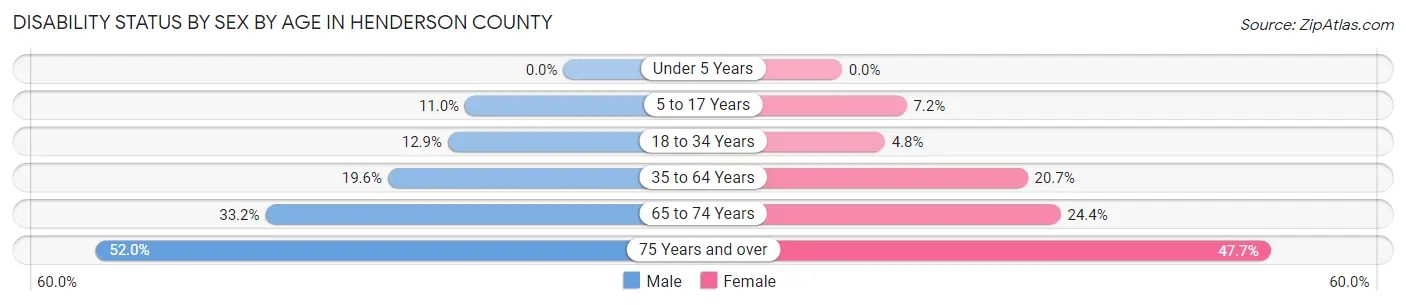
| Age Bracket | Male | Female |
| Under 5 Years | 0 (0.0%) | 0 (0.0%) |
| 5 to 17 Years | 277 (11.0%) | 161 (7.2%) |
| 18 to 34 Years | 314 (12.9%) | 129 (4.8%) |
| 35 to 64 Years | 1,070 (19.6%) | 1,138 (20.7%) |
| 65 to 74 Years | 463 (33.2%) | 379 (24.4%) |
| 75 Years and over | 426 (52.0%) | 571 (47.7%) |
Disability Class by Sex by Age in Henderson County
Disability Class: Hearing Difficulty
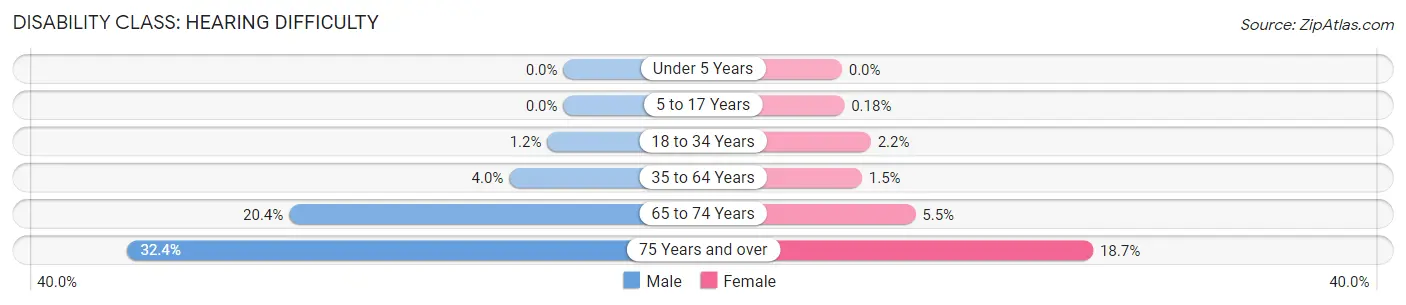
| Age Bracket | Male | Female |
| Under 5 Years | 0 (0.0%) | 0 (0.0%) |
| 5 to 17 Years | 0 (0.0%) | 4 (0.2%) |
| 18 to 34 Years | 29 (1.2%) | 58 (2.1%) |
| 35 to 64 Years | 220 (4.0%) | 82 (1.5%) |
| 65 to 74 Years | 284 (20.4%) | 85 (5.5%) |
| 75 Years and over | 265 (32.4%) | 223 (18.6%) |
Disability Class: Vision Difficulty
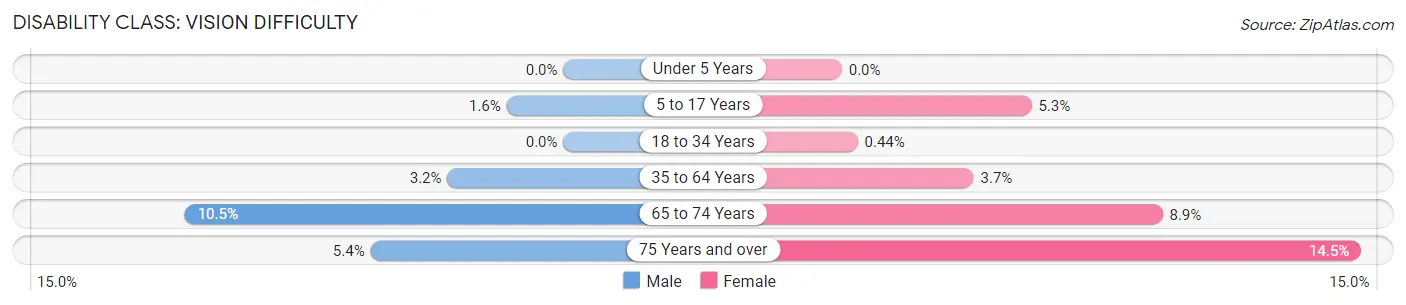
| Age Bracket | Male | Female |
| Under 5 Years | 0 (0.0%) | 0 (0.0%) |
| 5 to 17 Years | 40 (1.6%) | 118 (5.3%) |
| 18 to 34 Years | 0 (0.0%) | 12 (0.4%) |
| 35 to 64 Years | 177 (3.2%) | 202 (3.7%) |
| 65 to 74 Years | 147 (10.5%) | 139 (8.9%) |
| 75 Years and over | 44 (5.4%) | 173 (14.5%) |
Disability Class: Cognitive Difficulty

| Age Bracket | Male | Female |
| 5 to 17 Years | 268 (10.6%) | 52 (2.3%) |
| 18 to 34 Years | 258 (10.6%) | 59 (2.2%) |
| 35 to 64 Years | 457 (8.4%) | 437 (7.9%) |
| 65 to 74 Years | 73 (5.2%) | 125 (8.0%) |
| 75 Years and over | 66 (8.1%) | 126 (10.5%) |
Disability Class: Ambulatory Difficulty
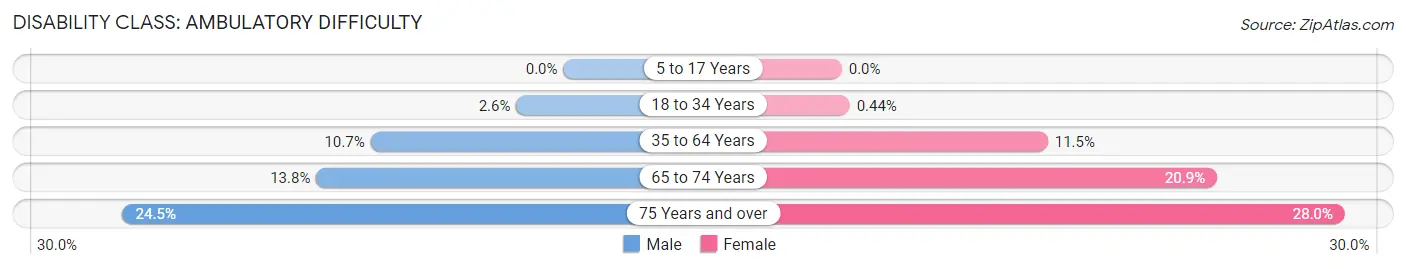
| Age Bracket | Male | Female |
| 5 to 17 Years | 0 (0.0%) | 0 (0.0%) |
| 18 to 34 Years | 64 (2.6%) | 12 (0.4%) |
| 35 to 64 Years | 588 (10.7%) | 631 (11.5%) |
| 65 to 74 Years | 192 (13.8%) | 325 (20.9%) |
| 75 Years and over | 201 (24.5%) | 335 (28.0%) |
Disability Class: Self-Care Difficulty
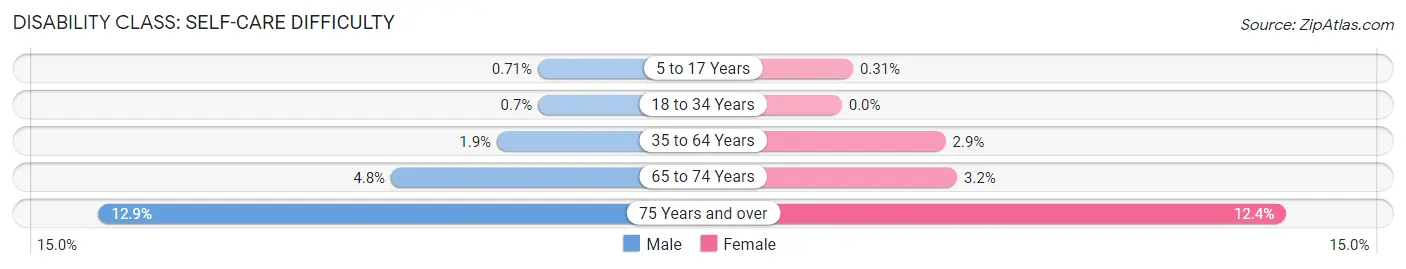
| Age Bracket | Male | Female |
| 5 to 17 Years | 18 (0.7%) | 7 (0.3%) |
| 18 to 34 Years | 17 (0.7%) | 0 (0.0%) |
| 35 to 64 Years | 101 (1.8%) | 159 (2.9%) |
| 65 to 74 Years | 67 (4.8%) | 50 (3.2%) |
| 75 Years and over | 106 (12.9%) | 148 (12.4%) |
Technology Access in Henderson County
Computing Device Access in Henderson County
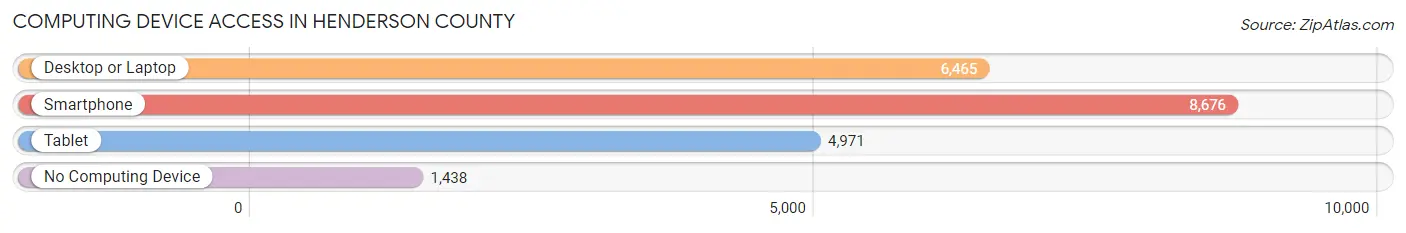
| Device Type | # Households | % Households |
| Desktop or Laptop | 6,465 | 60.2% |
| Smartphone | 8,676 | 80.8% |
| Tablet | 4,971 | 46.3% |
| No Computing Device | 1,438 | 13.4% |
| Total | 10,737 | 100.0% |
Internet Access in Henderson County
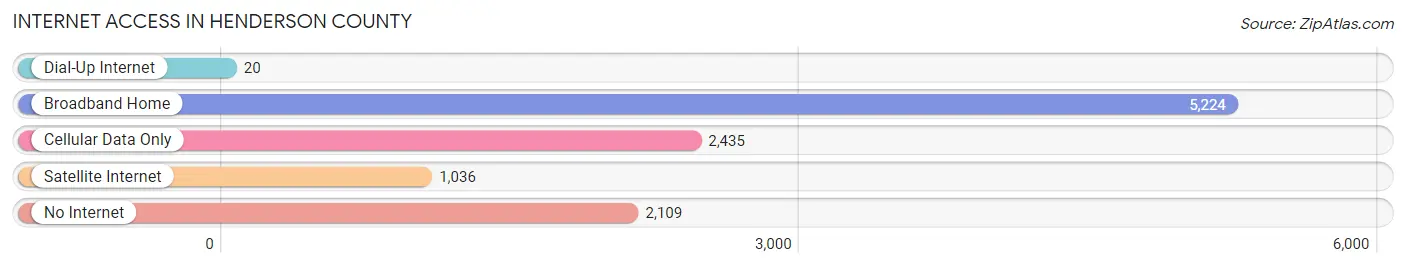
| Internet Type | # Households | % Households |
| Dial-Up Internet | 20 | 0.2% |
| Broadband Home | 5,224 | 48.6% |
| Cellular Data Only | 2,435 | 22.7% |
| Satellite Internet | 1,036 | 9.7% |
| No Internet | 2,109 | 19.6% |
| Total | 10,737 | 100.0% |
Henderson County Summary
Henderson County is located in the western part of Tennessee, in the United States. It is bordered by Carroll County to the north, Decatur County to the east, Hardin County to the south, and Madison County to the west. The county seat is Lexington, and the largest city is Henderson. The county was established in 1821 and named for James Henderson, a soldier in the War of 1812.
Geography
Henderson County covers an area of 545 square miles, making it the second-largest county in Tennessee. The terrain is mostly rolling hills, with the highest point being the summit of Big Hill at 890 feet above sea level. The county is drained by the Forked Deer River, which flows through the center of the county. The county is also home to several lakes, including Beech Lake, Chickasaw Lake, and Natchez Trace Lake.
Climate
Henderson County has a humid subtropical climate, with hot, humid summers and mild winters. The average annual temperature is around 63°F, with the average high in July being around 90°F and the average low in January being around 34°F. The average annual precipitation is around 45 inches, with the wettest month being May and the driest month being October.
Demographics
As of the 2010 census, Henderson County had a population of 27,769. The racial makeup of the county was 87.3% White, 9.2% African American, 0.4% Native American, 0.5% Asian, 0.1% Pacific Islander, 1.2% from other races, and 1.3% from two or more races. Hispanic or Latino of any race were 2.7% of the population.
The median household income was $37,945 and the median family income was $45,945. The per capita income was $19,945. About 14.2% of the population was below the poverty line.
Economy
Henderson County's economy is largely based on agriculture, with the main crops being corn, soybeans, and cotton. The county is also home to several manufacturing companies, including a paper mill, a furniture factory, and a plastics plant. Tourism is also an important part of the economy, with the Natchez Trace Parkway running through the county.
History
Henderson County was established in 1821 and named for James Henderson, a soldier in the War of 1812. The county was originally part of Carroll County, but was split off in 1821. The county seat was originally located in Lexington, but was moved to Henderson in 1822.
The county was largely agricultural in the 19th century, with cotton being the main crop. The county was also home to several iron furnaces, which produced iron for use in the Civil War. After the war, the county's economy shifted to timber and lumber production.
In the 20th century, the county's economy shifted to manufacturing, with several factories being built in the county. The county also became a popular tourist destination, with the Natchez Trace Parkway running through the county.
Today, Henderson County is a largely rural county, with agriculture and manufacturing being the main sources of income. The county is also home to several tourist attractions, including the Natchez Trace Parkway and several historic sites.
Common Questions
What is the Total Population of Henderson County?
Total Population of Henderson County is 27,845.
What is the Total Male Population of Henderson County?
Total Male Population of Henderson County is 13,729.
What is the Total Female Population of Henderson County?
Total Female Population of Henderson County is 14,116.
What is the Ratio of Males per 100 Females in Henderson County?
There are 97.26 Males per 100 Females in Henderson County.
What is the Ratio of Females per 100 Males in Henderson County?
There are 102.82 Females per 100 Males in Henderson County.
What is the Median Population Age in Henderson County?
Median Population Age in Henderson County is 40.7 Years.
What is the Average Family Size in Henderson County
Average Family Size in Henderson County is 3.2 People.
What is the Average Household Size in Henderson County
Average Household Size in Henderson County is 2.6 People.
What is Per Capita Income in Henderson County?
Per Capita income in Henderson County is $25,873.
What is the Median Family Income in Henderson County?
Median Family Income in Henderson County is $67,725.
What is the Median Household income in Henderson County?
Median Household Income in Henderson County is $51,576.
What is Income or Wage Gap in Henderson County?
Income or Wage Gap in Henderson County is 29.7%.
Women in Henderson County earn 70.3 cents for every dollar earned by a man.
What is Family Income Deficit in Henderson County?
Family Income Deficit in Henderson County is $10,973.
Families that are below poverty line in Henderson County earn $10,973 less on average than the poverty threshold level.
What is Inequality or Gini Index in Henderson County?
Inequality or Gini Index in Henderson County is 0.44.
How Large is the Labor Force in Henderson County?
There are 12,261 People in the Labor Forcein in Henderson County.
What is the Percentage of People in the Labor Force in Henderson County?
54.7% of People are in the Labor Force in Henderson County.
What is the Unemployment Rate in Henderson County?
Unemployment Rate in Henderson County is 5.4%.