Haywood County, TN
Haywood County Map
Haywood County Overview
17,806
TOTAL POPULATION
8,445
MALE POPULATION
9,361
FEMALE POPULATION
90.21
MALES / 100 FEMALES
110.85
FEMALES / 100 MALES
43.1
MEDIAN AGE
3.1
AVG FAMILY SIZE
2.4
AVG HOUSEHOLD SIZE
$26,031
PER CAPITA INCOME
$59,469
AVG FAMILY INCOME
$44,890
AVG HOUSEHOLD INCOME
30.8%
WAGE / INCOME GAP [ % ]
69.2¢/ $1
WAGE / INCOME GAP [ $ ]
$9,333
FAMILY INCOME DEFICIT
0.47
INEQUALITY / GINI INDEX
7,947
LABOR FORCE [ PEOPLE ]
55.2%
PERCENT IN LABOR FORCE
8.5%
UNEMPLOYMENT RATE
Haywood County Area Codes
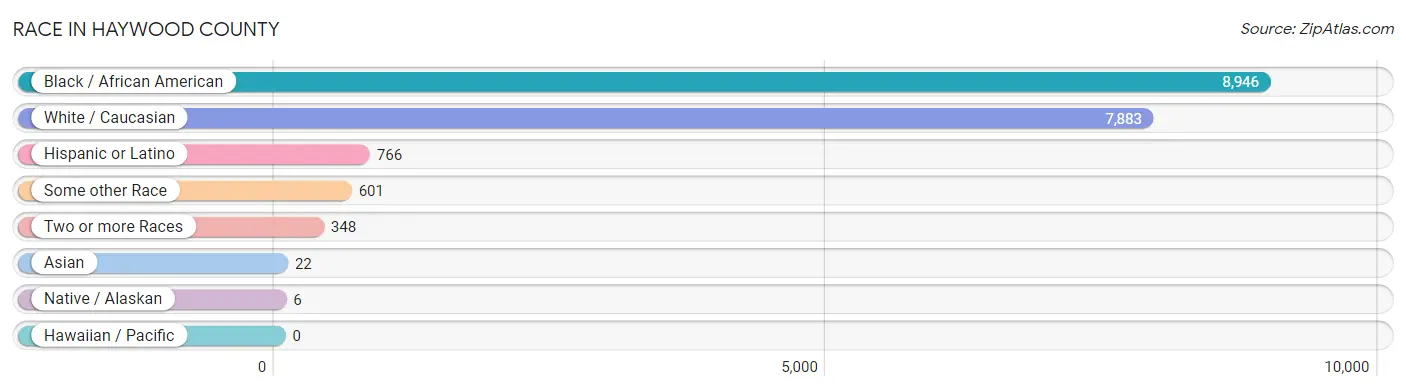
Race in Haywood County
The most populous races in Haywood County are Black / African American (8,946 | 50.2%), White / Caucasian (7,883 | 44.3%), and Hispanic or Latino (766 | 4.3%).
| Race | # Population | % Population |
| Asian | 22 | 0.1% |
| Black / African American | 8,946 | 50.2% |
| Hawaiian / Pacific | 0 | 0.0% |
| Hispanic or Latino | 766 | 4.3% |
| Native / Alaskan | 6 | 0.0% |
| White / Caucasian | 7,883 | 44.3% |
| Two or more Races | 348 | 1.9% |
| Some other Race | 601 | 3.4% |
| Total | 17,806 | 100.0% |
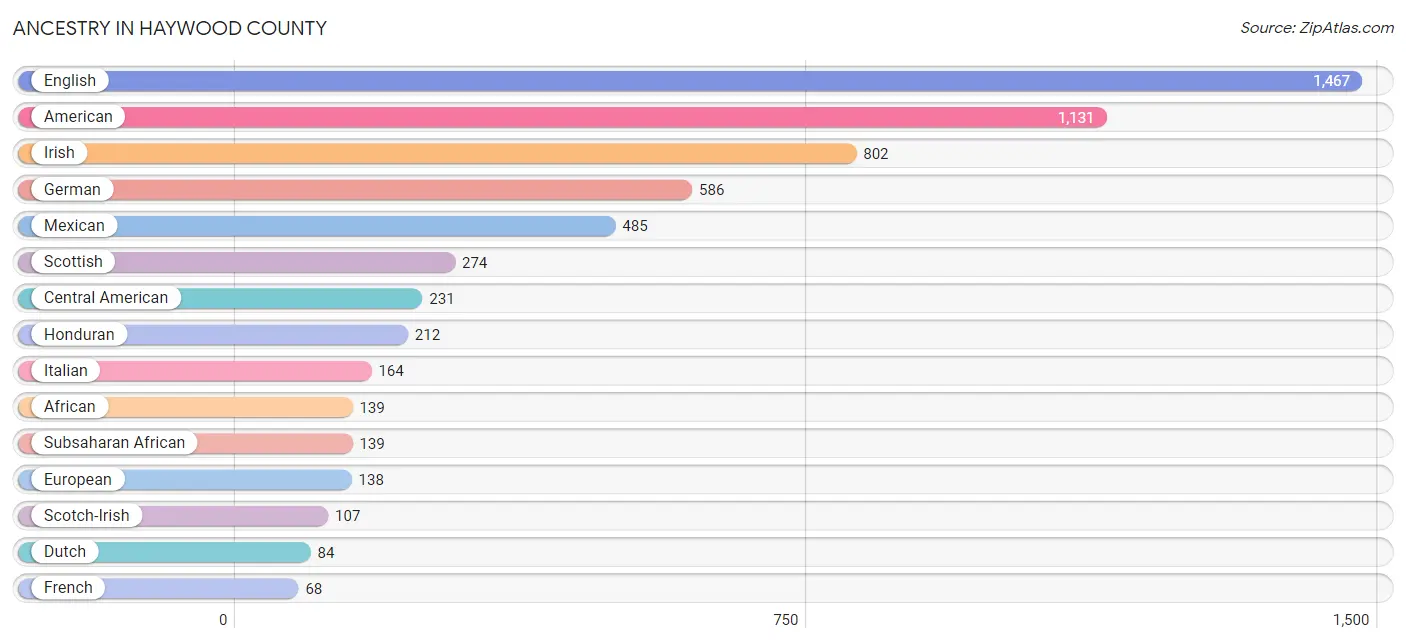
Ancestry in Haywood County
The most populous ancestries reported in Haywood County are English (1,467 | 8.2%), American (1,131 | 6.4%), Irish (802 | 4.5%), German (586 | 3.3%), and Mexican (485 | 2.7%), together accounting for 25.1% of all Haywood County residents.
| Ancestry | # Population | % Population |
| African | 139 | 0.8% |
| American | 1,131 | 6.4% |
| Arab | 62 | 0.4% |
| Blackfeet | 12 | 0.1% |
| British | 48 | 0.3% |
| Burmese | 22 | 0.1% |
| Cajun | 8 | 0.0% |
| Canadian | 10 | 0.1% |
| Central American | 231 | 1.3% |
| Cherokee | 53 | 0.3% |
| Costa Rican | 19 | 0.1% |
| Czech | 8 | 0.0% |
| Danish | 6 | 0.0% |
| Dominican | 22 | 0.1% |
| Dutch | 84 | 0.5% |
| English | 1,467 | 8.2% |
| European | 138 | 0.8% |
| French | 68 | 0.4% |
| French Canadian | 12 | 0.1% |
| German | 586 | 3.3% |
| Greek | 36 | 0.2% |
| Honduran | 212 | 1.2% |
| Iranian | 10 | 0.1% |
| Irish | 802 | 4.5% |
| Iroquois | 16 | 0.1% |
| Italian | 164 | 0.9% |
| Mexican | 485 | 2.7% |
| Norwegian | 12 | 0.1% |
| Polish | 40 | 0.2% |
| Puerto Rican | 28 | 0.2% |
| Scandinavian | 16 | 0.1% |
| Scotch-Irish | 107 | 0.6% |
| Scottish | 274 | 1.5% |
| Subsaharan African | 139 | 0.8% |
| Swedish | 44 | 0.3% |
| Welsh | 61 | 0.3% | View All 36 Rows |
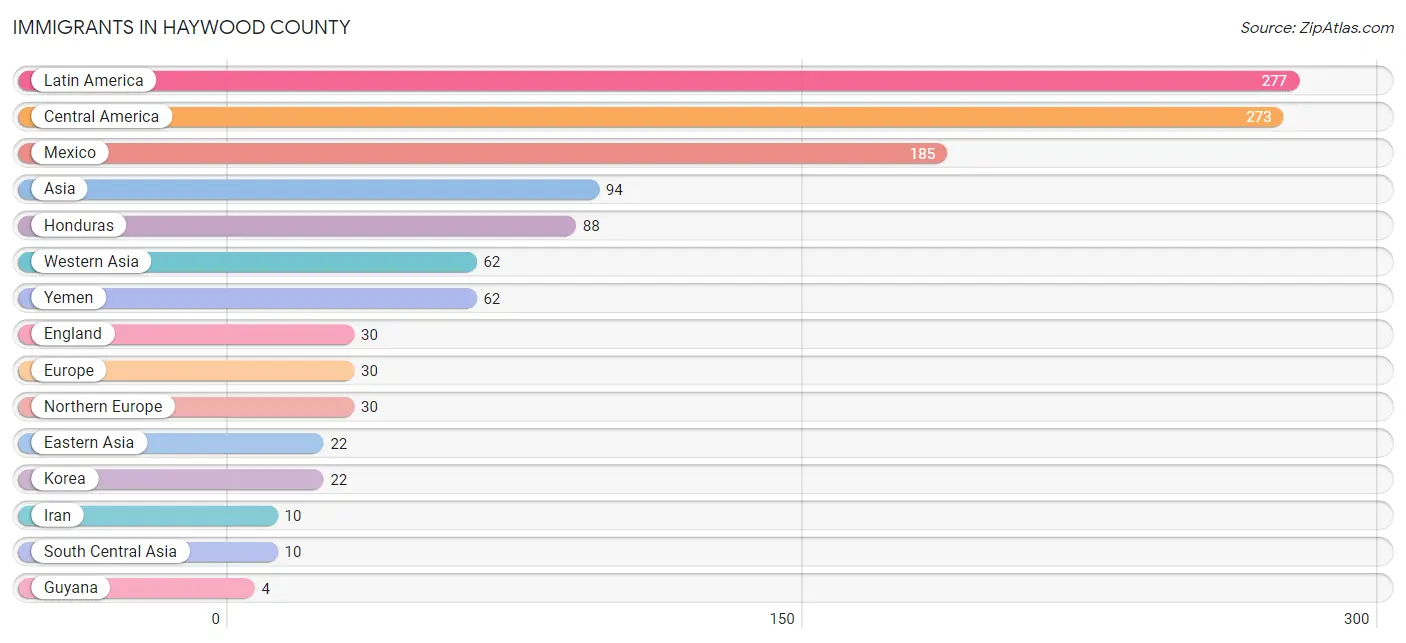
Immigrants in Haywood County
The most numerous immigrant groups reported in Haywood County came from Latin America (277 | 1.6%), Central America (273 | 1.5%), Mexico (185 | 1.0%), Asia (94 | 0.5%), and Honduras (88 | 0.5%), together accounting for 5.1% of all Haywood County residents.
| Immigration Origin | # Population | % Population |
| Asia | 94 | 0.5% |
| Central America | 273 | 1.5% |
| Eastern Asia | 22 | 0.1% |
| England | 30 | 0.2% |
| Europe | 30 | 0.2% |
| Guyana | 4 | 0.0% |
| Honduras | 88 | 0.5% |
| Iran | 10 | 0.1% |
| Korea | 22 | 0.1% |
| Latin America | 277 | 1.6% |
| Mexico | 185 | 1.0% |
| Northern Europe | 30 | 0.2% |
| South America | 4 | 0.0% |
| South Central Asia | 10 | 0.1% |
| Western Asia | 62 | 0.4% |
| Yemen | 62 | 0.4% | View All 16 Rows |
Sex and Age in Haywood County
Sex and Age in Haywood County
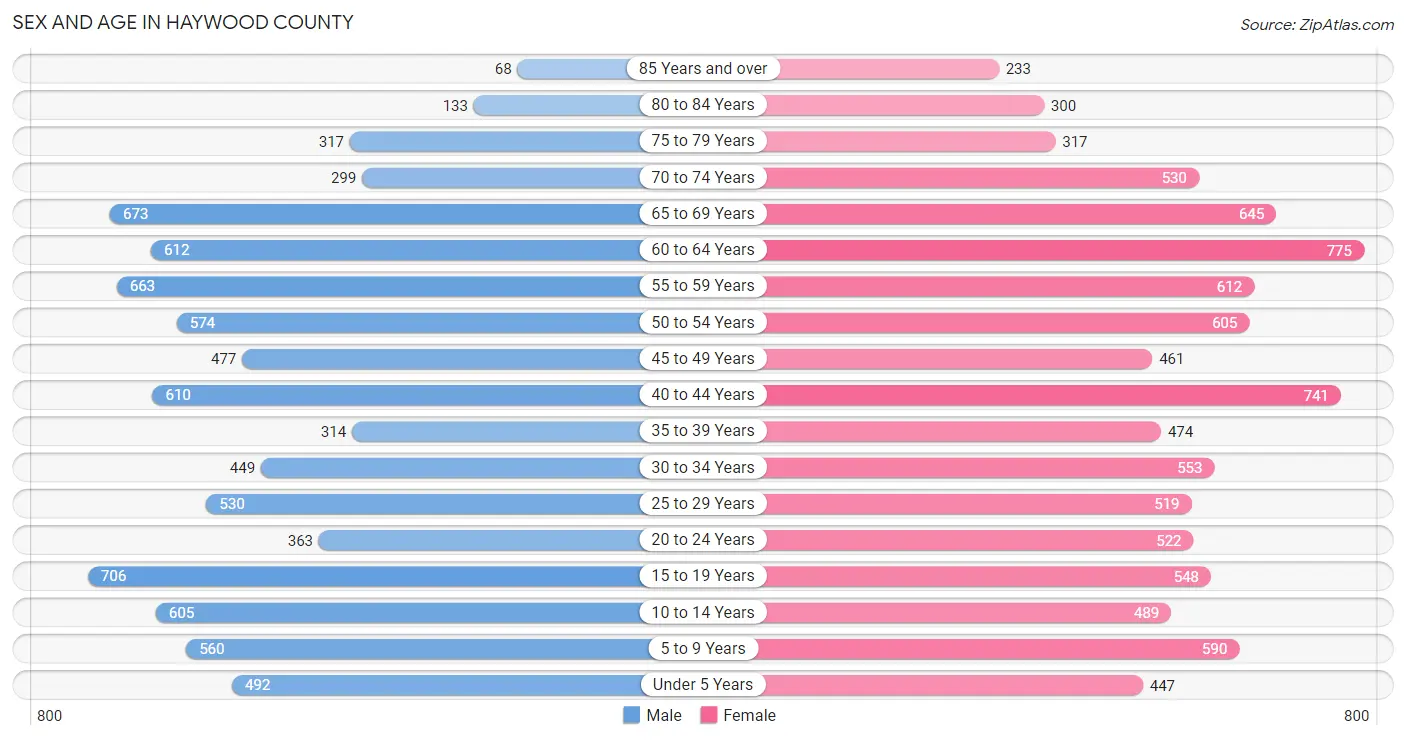
The most populous age groups in Haywood County are 15 to 19 Years (706 | 8.4%) for men and 60 to 64 Years (775 | 8.3%) for women.
| Age Bracket | Male | Female |
| Under 5 Years | 492 (5.8%) | 447 (4.8%) |
| 5 to 9 Years | 560 (6.6%) | 590 (6.3%) |
| 10 to 14 Years | 605 (7.2%) | 489 (5.2%) |
| 15 to 19 Years | 706 (8.4%) | 548 (5.9%) |
| 20 to 24 Years | 363 (4.3%) | 522 (5.6%) |
| 25 to 29 Years | 530 (6.3%) | 519 (5.5%) |
| 30 to 34 Years | 449 (5.3%) | 553 (5.9%) |
| 35 to 39 Years | 314 (3.7%) | 474 (5.1%) |
| 40 to 44 Years | 610 (7.2%) | 741 (7.9%) |
| 45 to 49 Years | 477 (5.7%) | 461 (4.9%) |
| 50 to 54 Years | 574 (6.8%) | 605 (6.5%) |
| 55 to 59 Years | 663 (7.9%) | 612 (6.5%) |
| 60 to 64 Years | 612 (7.2%) | 775 (8.3%) |
| 65 to 69 Years | 673 (8.0%) | 645 (6.9%) |
| 70 to 74 Years | 299 (3.5%) | 530 (5.7%) |
| 75 to 79 Years | 317 (3.7%) | 317 (3.4%) |
| 80 to 84 Years | 133 (1.6%) | 300 (3.2%) |
| 85 Years and over | 68 (0.8%) | 233 (2.5%) |
| Total | 8,445 (100.0%) | 9,361 (100.0%) |
Families and Households in Haywood County
Median Family Size in Haywood County
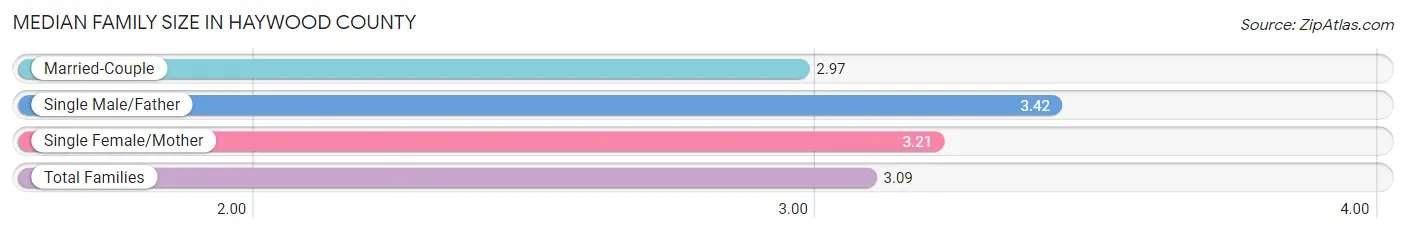
The median family size in Haywood County is 3.09 persons per family, with single male/father families (429 | 9.5%) accounting for the largest median family size of 3.42 persons per family. On the other hand, married-couple families (2,683 | 59.1%) represent the smallest median family size with 2.97 persons per family.
| Family Type | # Families | Family Size |
| Married-Couple | 2,683 (59.1%) | 2.97 |
| Single Male/Father | 429 (9.5%) | 3.42 |
| Single Female/Mother | 1,427 (31.4%) | 3.21 |
| Total Families | 4,539 (100.0%) | 3.09 |
Median Household Size in Haywood County
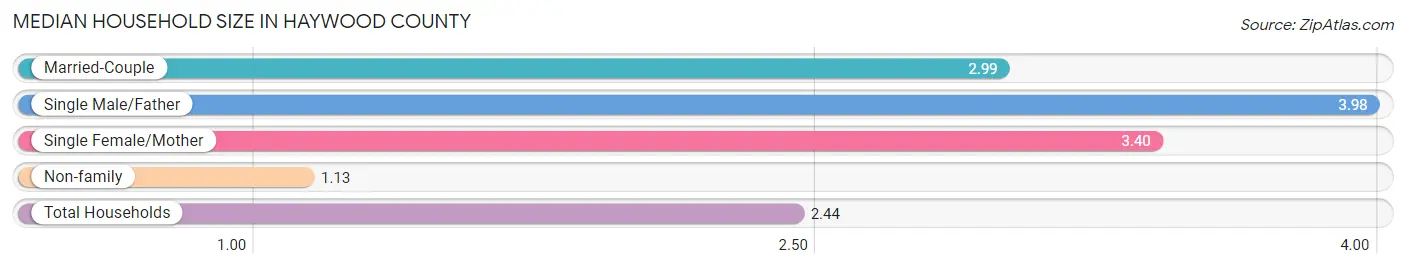
The median household size in Haywood County is 2.44 persons per household, with single male/father households (429 | 6.0%) accounting for the largest median household size of 3.98 persons per household. non-family households (2,661 | 37.0%) represent the smallest median household size with 1.13 persons per household.
| Household Type | # Households | Household Size |
| Married-Couple | 2,683 (37.3%) | 2.99 |
| Single Male/Father | 429 (6.0%) | 3.98 |
| Single Female/Mother | 1,427 (19.8%) | 3.40 |
| Non-family | 2,661 (37.0%) | 1.13 |
| Total Households | 7,200 (100.0%) | 2.44 |
Household Size by Marriage Status in Haywood County
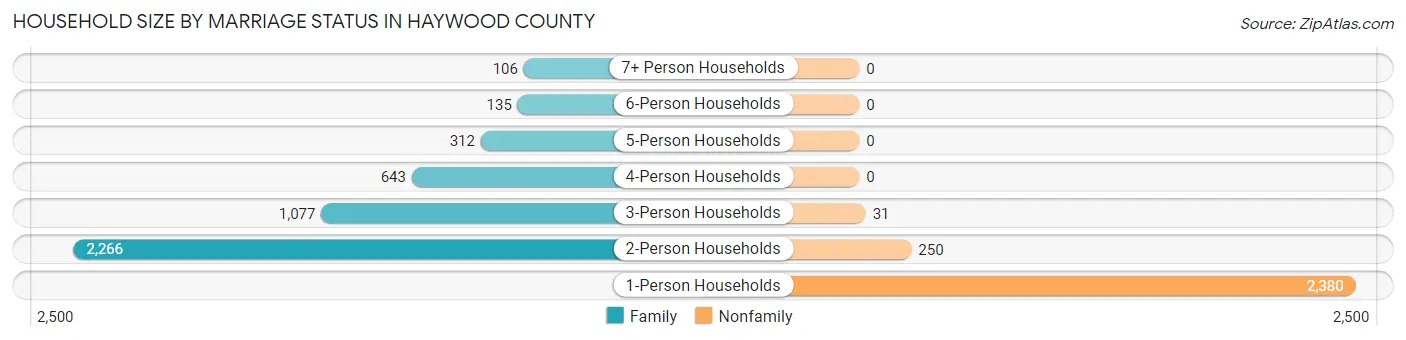
Out of a total of 7,200 households in Haywood County, 4,539 (63.0%) are family households, while 2,661 (37.0%) are nonfamily households. The most numerous type of family households are 2-person households, comprising 2,266, and the most common type of nonfamily households are 1-person households, comprising 2,380.
| Household Size | Family Households | Nonfamily Households |
| 1-Person Households | - | 2,380 (33.1%) |
| 2-Person Households | 2,266 (31.5%) | 250 (3.5%) |
| 3-Person Households | 1,077 (15.0%) | 31 (0.4%) |
| 4-Person Households | 643 (8.9%) | 0 (0.0%) |
| 5-Person Households | 312 (4.3%) | 0 (0.0%) |
| 6-Person Households | 135 (1.9%) | 0 (0.0%) |
| 7+ Person Households | 106 (1.5%) | 0 (0.0%) |
| Total | 4,539 (63.0%) | 2,661 (37.0%) |
Female Fertility in Haywood County
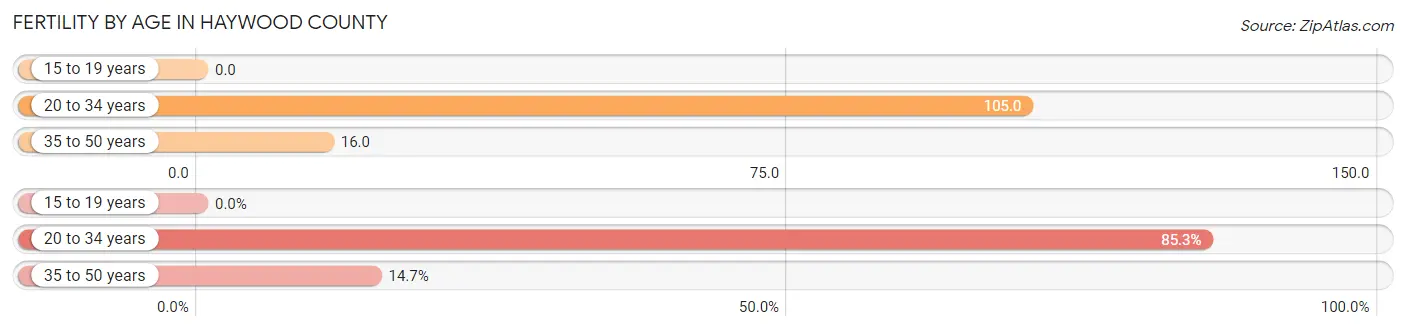
Fertility by Age in Haywood County
Average fertility rate in Haywood County is 50.0 births per 1,000 women. Women in the age bracket of 20 to 34 years have the highest fertility rate with 105.0 births per 1,000 women. Women in the age bracket of 20 to 34 years acount for 85.3% of all women with births.
| Age Bracket | Women with Births | Births / 1,000 Women |
| 15 to 19 years | 0 (0.0%) | 0.0 |
| 20 to 34 years | 168 (85.3%) | 105.0 |
| 35 to 50 years | 29 (14.7%) | 16.0 |
| Total | 197 (100.0%) | 50.0 |
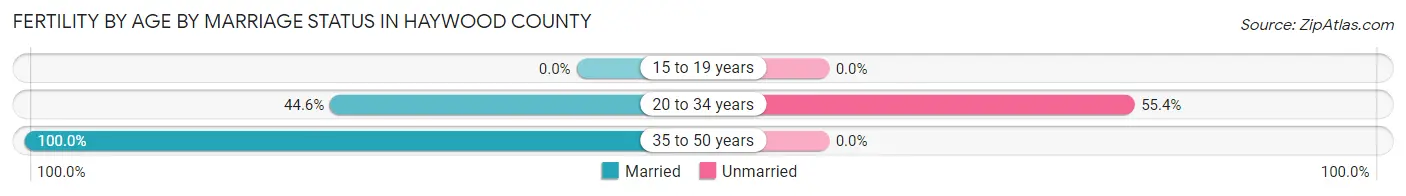
Fertility by Age by Marriage Status in Haywood County
52.8% of women with births (197) in Haywood County are married. The highest percentage of unmarried women with births falls into 20 to 34 years age bracket with 55.4% of them unmarried at the time of birth, while the lowest percentage of unmarried women with births belong to 35 to 50 years age bracket with 0.0% of them unmarried.
| Age Bracket | Married | Unmarried |
| 15 to 19 years | 0 (0.0%) | 0 (0.0%) |
| 20 to 34 years | 75 (44.6%) | 93 (55.4%) |
| 35 to 50 years | 29 (100.0%) | 0 (0.0%) |
| Total | 104 (52.8%) | 93 (47.2%) |
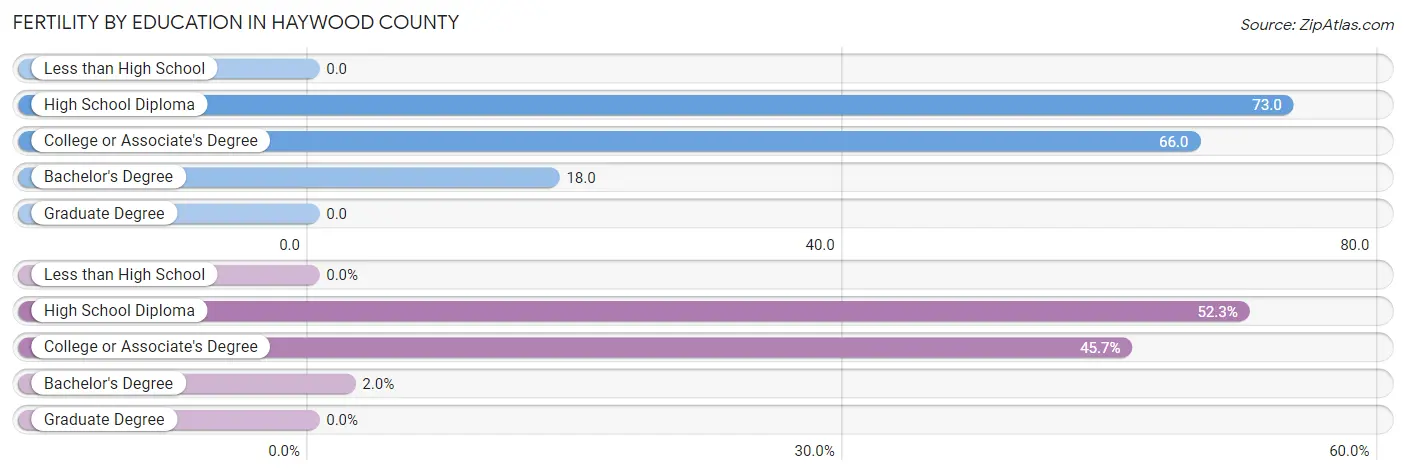
Fertility by Education in Haywood County
| Educational Attainment | Women with Births | Births / 1,000 Women |
| Less than High School | 0 (0.0%) | 0.0 |
| High School Diploma | 103 (52.3%) | 73.0 |
| College or Associate's Degree | 90 (45.7%) | 66.0 |
| Bachelor's Degree | 4 (2.0%) | 18.0 |
| Graduate Degree | 0 (0.0%) | 0.0 |
| Total | 197 (100.0%) | 50.0 |
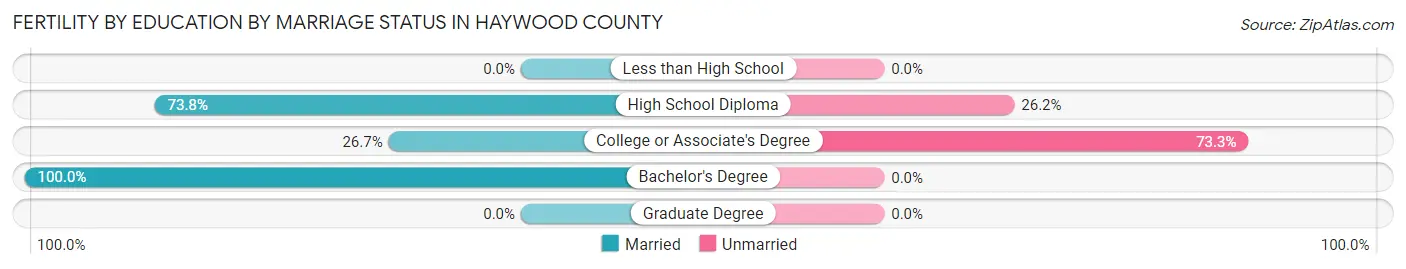
Fertility by Education by Marriage Status in Haywood County
47.2% of women with births in Haywood County are unmarried. Women with the educational attainment of bachelor's degree are most likely to be married with 100.0% of them married at childbirth, while women with the educational attainment of college or associate's degree are least likely to be married with 73.3% of them unmarried at childbirth.
| Educational Attainment | Married | Unmarried |
| Less than High School | 0 (0.0%) | 0 (0.0%) |
| High School Diploma | 76 (73.8%) | 27 (26.2%) |
| College or Associate's Degree | 24 (26.7%) | 66 (73.3%) |
| Bachelor's Degree | 4 (100.0%) | 0 (0.0%) |
| Graduate Degree | 0 (0.0%) | 0 (0.0%) |
| Total | 104 (52.8%) | 93 (47.2%) |
Income in Haywood County
Income Overview in Haywood County
Per Capita Income in Haywood County is $26,031, while median incomes of families and households are $59,469 and $44,890 respectively.
| Characteristic | Number | Measure |
| Per Capita Income | 17,806 | $26,031 |
| Median Family Income | 4,539 | $59,469 |
| Mean Family Income | 4,539 | $76,080 |
| Median Household Income | 7,200 | $44,890 |
| Mean Household Income | 7,200 | $61,642 |
| Income Deficit | 4,539 | $9,333 |
| Wage / Income Gap (%) | 17,806 | 30.79% |
| Wage / Income Gap ($) | 17,806 | 69.21¢ per $1 |
| Gini / Inequality Index | 17,806 | 0.47 |
Earnings by Sex in Haywood County
Average Earnings in Haywood County are $31,760, $38,248 for men and $26,470 for women, a difference of 30.8%.
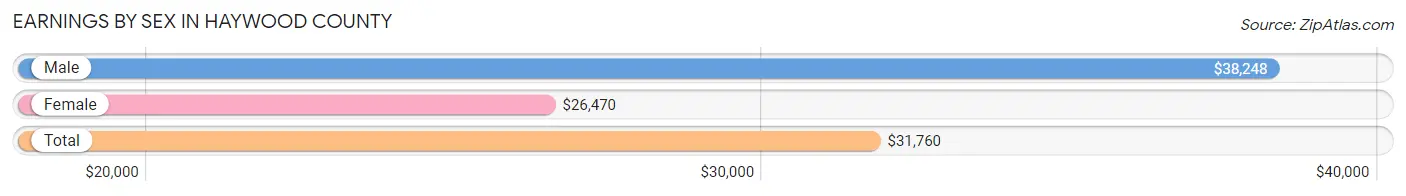
| Sex | Number | Average Earnings |
| Male | 4,272 (50.6%) | $38,248 |
| Female | 4,178 (49.4%) | $26,470 |
| Total | 8,450 (100.0%) | $31,760 |
Earnings by Sex by Income Bracket in Haywood County
The most common earnings brackets in Haywood County are $55,000 to $64,999 for men (412 | 9.6%) and $2,499 or less for women (464 | 11.1%).
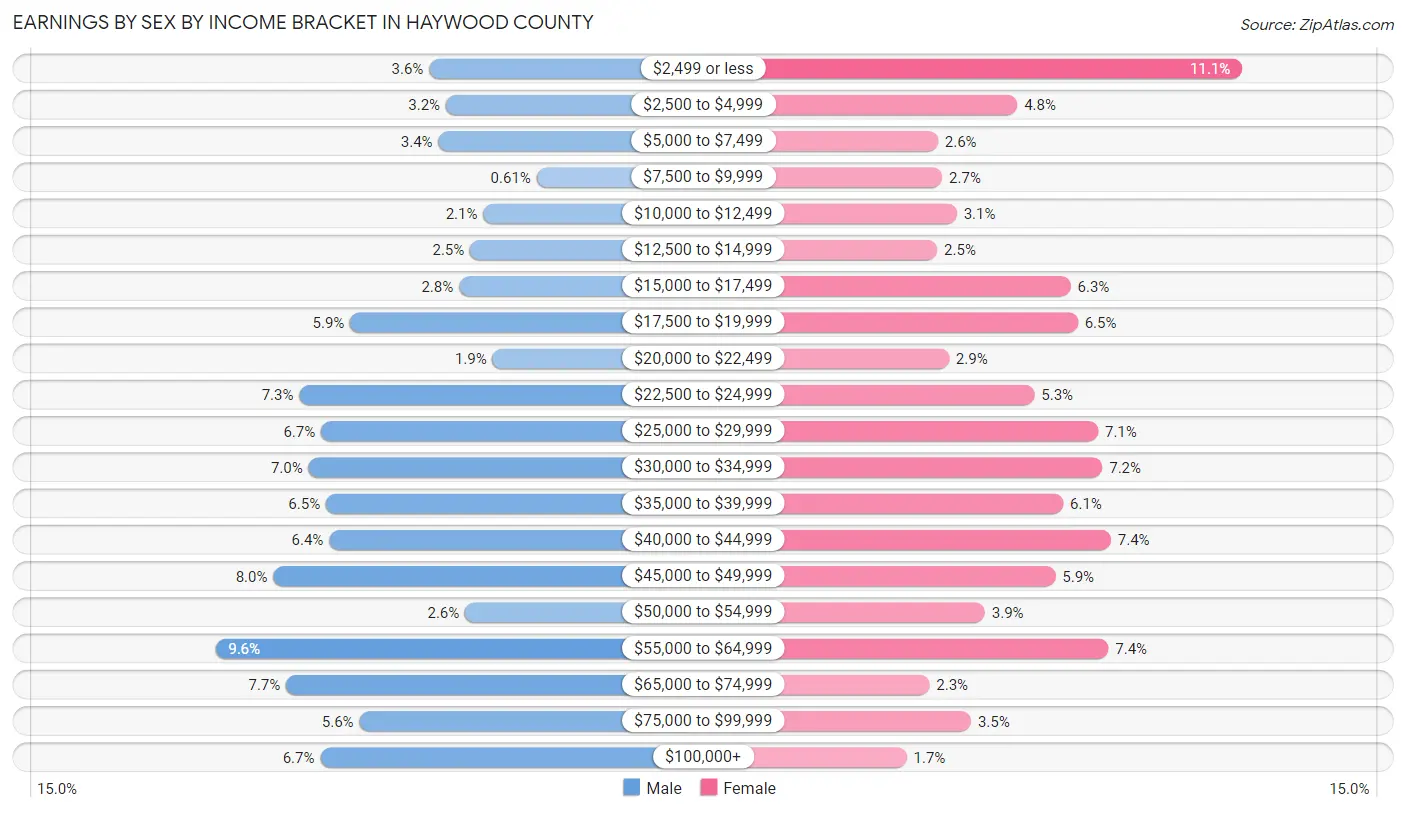
| Income | Male | Female |
| $2,499 or less | 155 (3.6%) | 464 (11.1%) |
| $2,500 to $4,999 | 135 (3.2%) | 200 (4.8%) |
| $5,000 to $7,499 | 144 (3.4%) | 107 (2.6%) |
| $7,500 to $9,999 | 26 (0.6%) | 112 (2.7%) |
| $10,000 to $12,499 | 90 (2.1%) | 129 (3.1%) |
| $12,500 to $14,999 | 106 (2.5%) | 106 (2.5%) |
| $15,000 to $17,499 | 119 (2.8%) | 263 (6.3%) |
| $17,500 to $19,999 | 250 (5.9%) | 271 (6.5%) |
| $20,000 to $22,499 | 79 (1.8%) | 120 (2.9%) |
| $22,500 to $24,999 | 311 (7.3%) | 220 (5.3%) |
| $25,000 to $29,999 | 285 (6.7%) | 295 (7.1%) |
| $30,000 to $34,999 | 300 (7.0%) | 300 (7.2%) |
| $35,000 to $39,999 | 279 (6.5%) | 254 (6.1%) |
| $40,000 to $44,999 | 275 (6.4%) | 310 (7.4%) |
| $45,000 to $49,999 | 342 (8.0%) | 245 (5.9%) |
| $50,000 to $54,999 | 112 (2.6%) | 162 (3.9%) |
| $55,000 to $64,999 | 412 (9.6%) | 307 (7.3%) |
| $65,000 to $74,999 | 327 (7.6%) | 97 (2.3%) |
| $75,000 to $99,999 | 239 (5.6%) | 146 (3.5%) |
| $100,000+ | 286 (6.7%) | 70 (1.7%) |
| Total | 4,272 (100.0%) | 4,178 (100.0%) |
Earnings by Sex by Educational Attainment in Haywood County
Average earnings in Haywood County are $40,796 for men and $30,123 for women, a difference of 26.2%. Men with an educational attainment of graduate degree enjoy the highest average annual earnings of $62,738, while those with less than high school education earn the least with $26,761. Women with an educational attainment of graduate degree earn the most with the average annual earnings of $59,028, while those with less than high school education have the smallest earnings of $18,621.
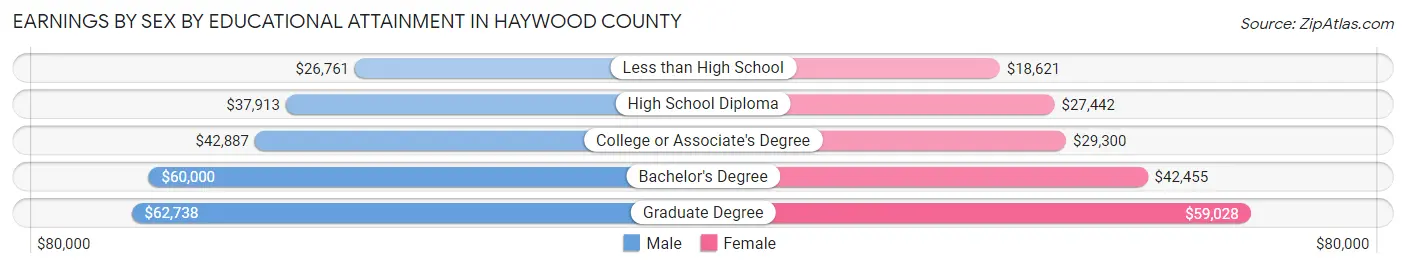
| Educational Attainment | Male Income | Female Income |
| Less than High School | $26,761 | $18,621 |
| High School Diploma | $37,913 | $27,442 |
| College or Associate's Degree | $42,887 | $29,300 |
| Bachelor's Degree | $60,000 | $42,455 |
| Graduate Degree | $62,738 | $59,028 |
| Total | $40,796 | $30,123 |
Family Income in Haywood County
Family Income Brackets in Haywood County
According to the Haywood County family income data, there are 808 families falling into the $50,000 to $74,999 income range, which is the most common income bracket and makes up 17.8% of all families. Conversely, the less than $10,000 income bracket is the least frequent group with only 150 families (3.3%) belonging to this category.
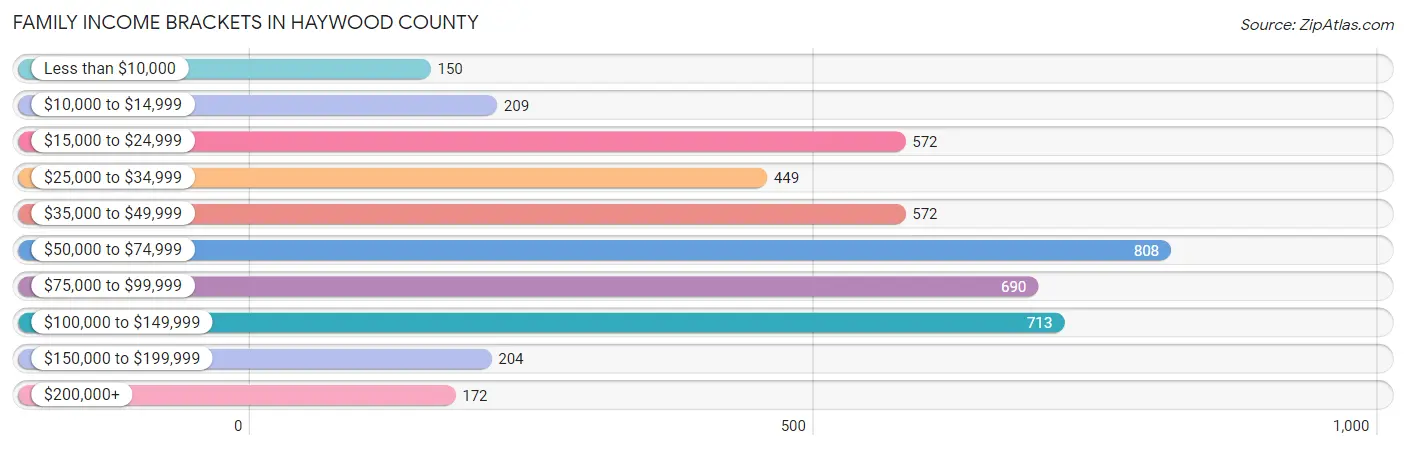
| Income Bracket | # Families | % Families |
| Less than $10,000 | 150 | 3.3% |
| $10,000 to $14,999 | 209 | 4.6% |
| $15,000 to $24,999 | 572 | 12.6% |
| $25,000 to $34,999 | 449 | 9.9% |
| $35,000 to $49,999 | 572 | 12.6% |
| $50,000 to $74,999 | 808 | 17.8% |
| $75,000 to $99,999 | 690 | 15.2% |
| $100,000 to $149,999 | 713 | 15.7% |
| $150,000 to $199,999 | 204 | 4.5% |
| $200,000+ | 172 | 3.8% |
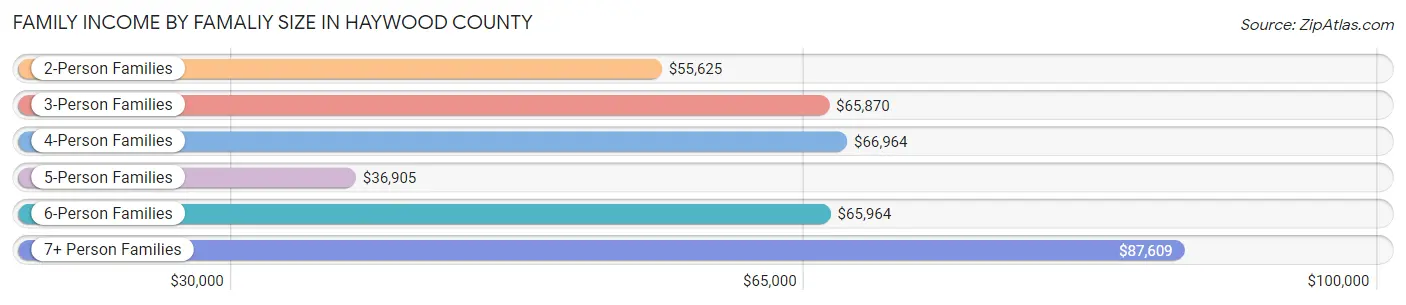
Family Income by Famaliy Size in Haywood County
7+ person families (84 | 1.8%) account for the highest median family income in Haywood County with $87,609 per family, while 2-person families (2,451 | 54.0%) have the highest median income of $27,812 per family member.
| Income Bracket | # Families | Median Income |
| 2-Person Families | 2,451 (54.0%) | $55,625 |
| 3-Person Families | 988 (21.8%) | $65,870 |
| 4-Person Families | 665 (14.6%) | $66,964 |
| 5-Person Families | 218 (4.8%) | $36,905 |
| 6-Person Families | 133 (2.9%) | $65,964 |
| 7+ Person Families | 84 (1.8%) | $87,609 |
| Total | 4,539 (100.0%) | $59,469 |
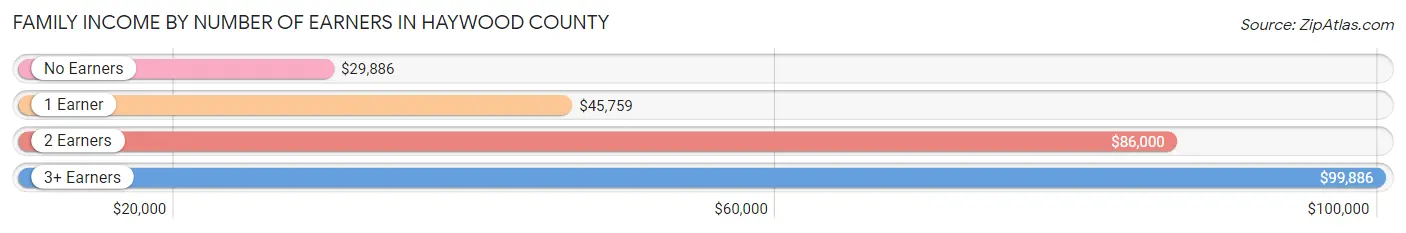
Family Income by Number of Earners in Haywood County
The median family income in Haywood County is $59,469, with families comprising 3+ earners (348) having the highest median family income of $99,886, while families with no earners (982) have the lowest median family income of $29,886, accounting for 7.7% and 21.6% of families, respectively.
| Number of Earners | # Families | Median Income |
| No Earners | 982 (21.6%) | $29,886 |
| 1 Earner | 1,687 (37.2%) | $45,759 |
| 2 Earners | 1,522 (33.5%) | $86,000 |
| 3+ Earners | 348 (7.7%) | $99,886 |
| Total | 4,539 (100.0%) | $59,469 |
Household Income in Haywood County
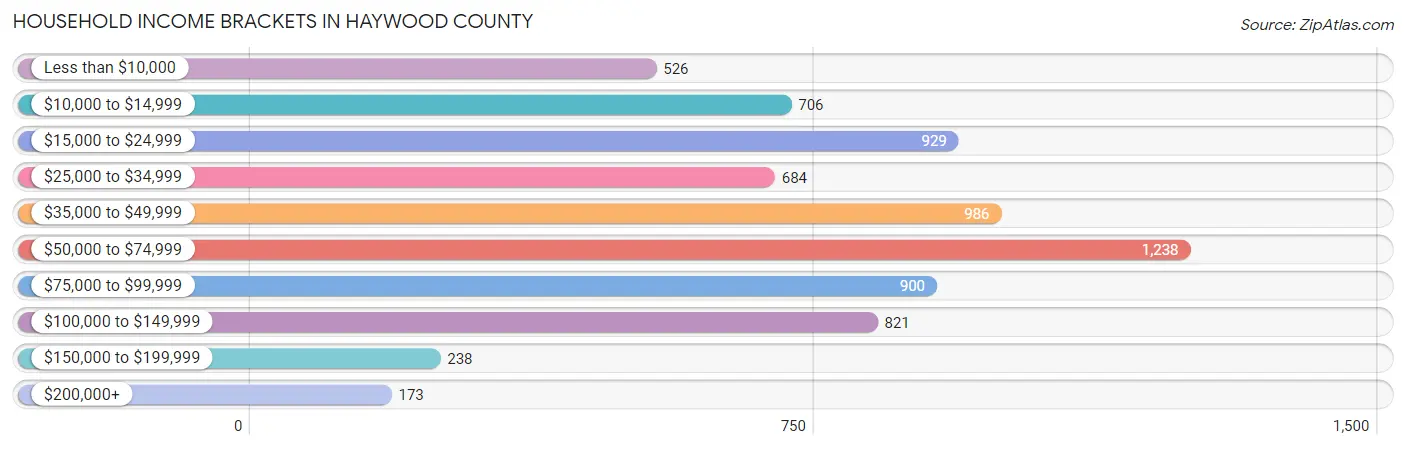
Household Income Brackets in Haywood County
With 1,238 households falling in the category, the $50,000 to $74,999 income range is the most frequent in Haywood County, accounting for 17.2% of all households. In contrast, only 173 households (2.4%) fall into the $200,000+ income bracket, making it the least populous group.
| Income Bracket | # Households | % Households |
| Less than $10,000 | 526 | 7.3% |
| $10,000 to $14,999 | 706 | 9.8% |
| $15,000 to $24,999 | 929 | 12.9% |
| $25,000 to $34,999 | 684 | 9.5% |
| $35,000 to $49,999 | 986 | 13.7% |
| $50,000 to $74,999 | 1,238 | 17.2% |
| $75,000 to $99,999 | 900 | 12.5% |
| $100,000 to $149,999 | 821 | 11.4% |
| $150,000 to $199,999 | 238 | 3.3% |
| $200,000+ | 173 | 2.4% |
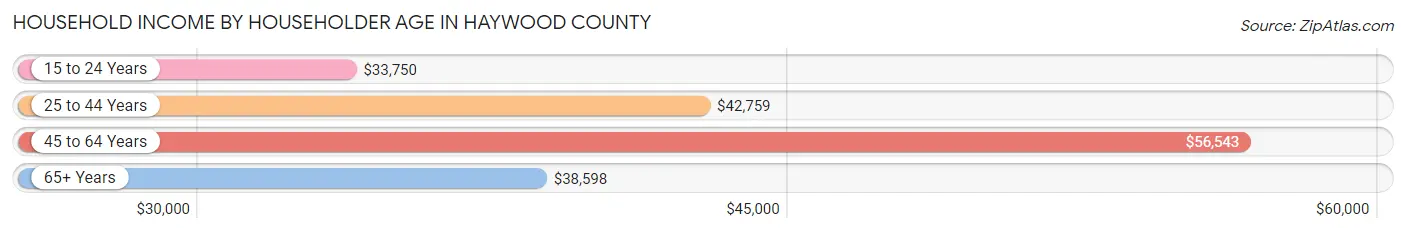
Household Income by Householder Age in Haywood County
The median household income in Haywood County is $44,890, with the highest median household income of $56,543 found in the 45 to 64 years age bracket for the primary householder. A total of 2,758 households (38.3%) fall into this category. Meanwhile, the 15 to 24 years age bracket for the primary householder has the lowest median household income of $33,750, with 280 households (3.9%) in this group.
| Income Bracket | # Households | Median Income |
| 15 to 24 Years | 280 (3.9%) | $33,750 |
| 25 to 44 Years | 1,884 (26.2%) | $42,759 |
| 45 to 64 Years | 2,758 (38.3%) | $56,543 |
| 65+ Years | 2,278 (31.6%) | $38,598 |
| Total | 7,200 (100.0%) | $44,890 |
Poverty in Haywood County
Income Below Poverty by Sex and Age in Haywood County
With 19.1% poverty level for males and 24.4% for females among the residents of Haywood County, under 5 year old males and under 5 year old females are the most vulnerable to poverty, with 252 males (53.5%) and 228 females (51.0%) in their respective age groups living below the poverty level.
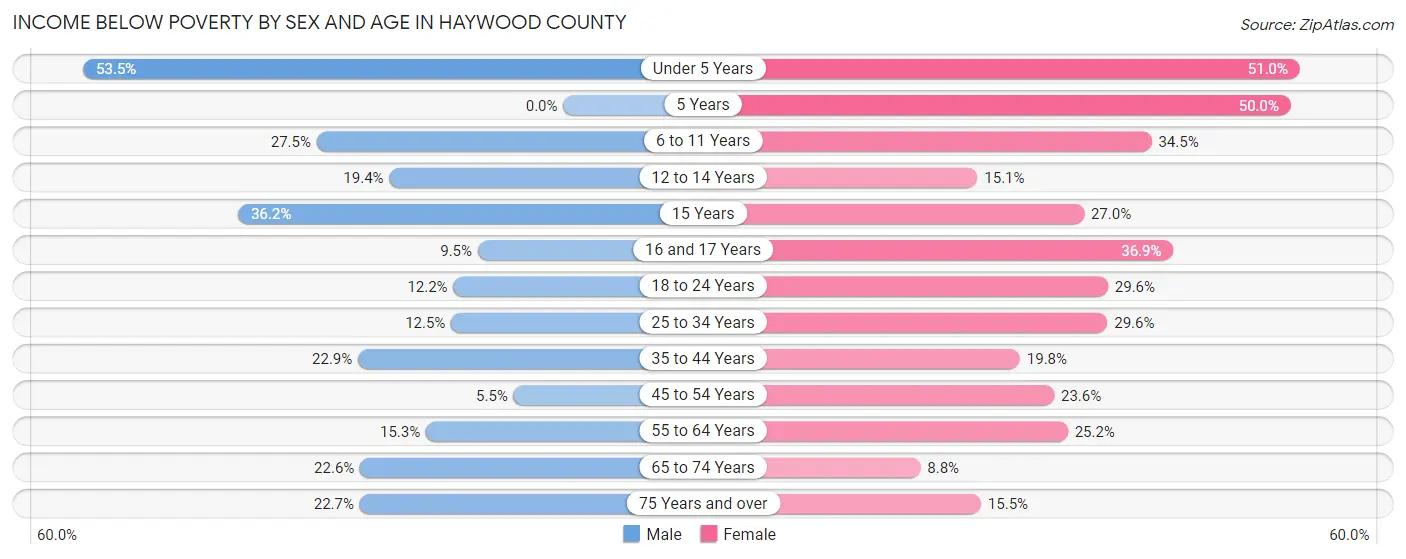
| Age Bracket | Male | Female |
| Under 5 Years | 252 (53.5%) | 228 (51.0%) |
| 5 Years | 0 (0.0%) | 61 (50.0%) |
| 6 to 11 Years | 187 (27.5%) | 209 (34.5%) |
| 12 to 14 Years | 80 (19.4%) | 53 (15.1%) |
| 15 Years | 50 (36.2%) | 24 (27.0%) |
| 16 and 17 Years | 22 (9.5%) | 103 (36.9%) |
| 18 to 24 Years | 84 (12.2%) | 208 (29.6%) |
| 25 to 34 Years | 115 (12.5%) | 317 (29.6%) |
| 35 to 44 Years | 206 (22.9%) | 240 (19.8%) |
| 45 to 54 Years | 58 (5.5%) | 252 (23.6%) |
| 55 to 64 Years | 195 (15.3%) | 349 (25.2%) |
| 65 to 74 Years | 220 (22.6%) | 101 (8.7%) |
| 75 Years and over | 112 (22.7%) | 123 (15.5%) |
| Total | 1,581 (19.1%) | 2,268 (24.4%) |
Income Above Poverty by Sex and Age in Haywood County
According to the poverty statistics in Haywood County, males aged 5 years and females aged 65 to 74 years are the age groups that are most secure financially, with 100.0% of males and 91.2% of females in these age groups living above the poverty line.
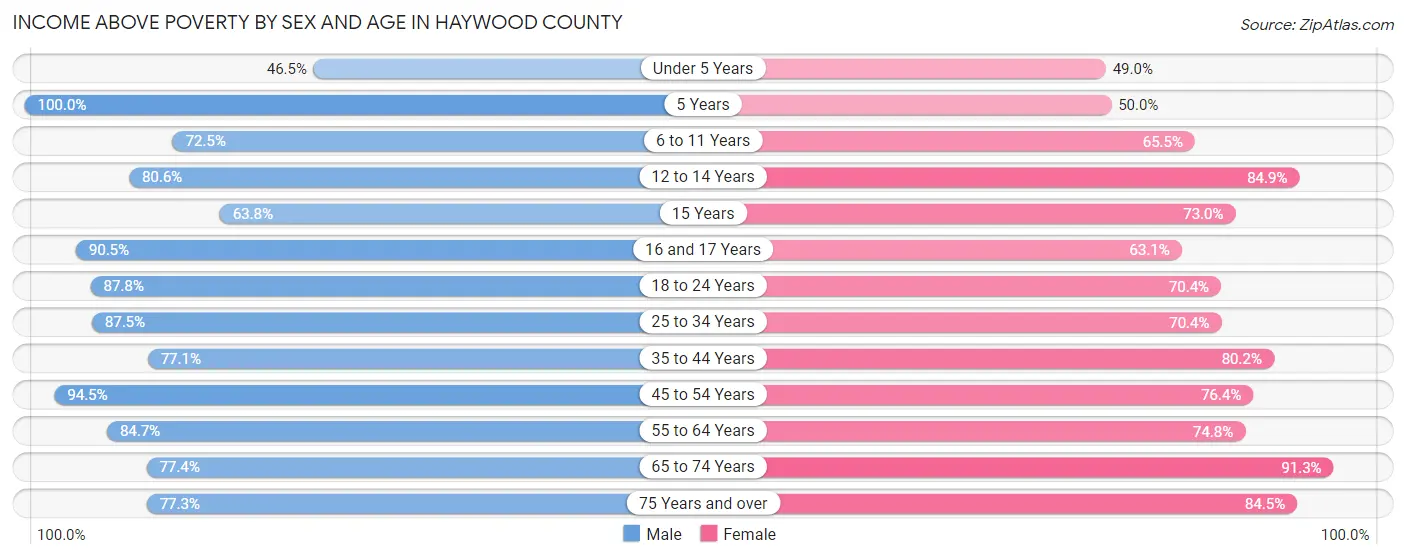
| Age Bracket | Male | Female |
| Under 5 Years | 219 (46.5%) | 219 (49.0%) |
| 5 Years | 47 (100.0%) | 61 (50.0%) |
| 6 to 11 Years | 494 (72.5%) | 397 (65.5%) |
| 12 to 14 Years | 333 (80.6%) | 298 (84.9%) |
| 15 Years | 88 (63.8%) | 65 (73.0%) |
| 16 and 17 Years | 209 (90.5%) | 176 (63.1%) |
| 18 to 24 Years | 602 (87.8%) | 494 (70.4%) |
| 25 to 34 Years | 806 (87.5%) | 755 (70.4%) |
| 35 to 44 Years | 695 (77.1%) | 970 (80.2%) |
| 45 to 54 Years | 990 (94.5%) | 814 (76.4%) |
| 55 to 64 Years | 1,080 (84.7%) | 1,038 (74.8%) |
| 65 to 74 Years | 752 (77.4%) | 1,053 (91.2%) |
| 75 Years and over | 382 (77.3%) | 671 (84.5%) |
| Total | 6,697 (80.9%) | 7,011 (75.6%) |
Income Below Poverty Among Married-Couple Families in Haywood County
The poverty statistics for married-couple families in Haywood County show that 9.6% or 258 of the total 2,683 families live below the poverty line. Families with 3 or 4 children have the highest poverty rate of 36.9%, comprising of 66 families. On the other hand, families with 5 or more children have the lowest poverty rate of 0.0%, which includes 0 families.
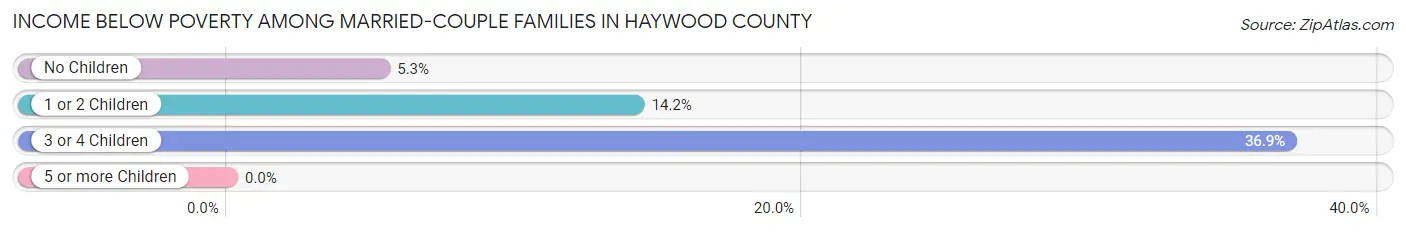
| Children | Above Poverty | Below Poverty |
| No Children | 1,714 (94.7%) | 96 (5.3%) |
| 1 or 2 Children | 582 (85.8%) | 96 (14.2%) |
| 3 or 4 Children | 113 (63.1%) | 66 (36.9%) |
| 5 or more Children | 16 (100.0%) | 0 (0.0%) |
| Total | 2,425 (90.4%) | 258 (9.6%) |
Income Below Poverty Among Single-Parent Households in Haywood County
According to the poverty data in Haywood County, 23.1% or 99 single-father households and 28.8% or 411 single-mother households are living below the poverty line. Among single-father households, those with 5 or more children have the highest poverty rate, with 22 households (100.0%) experiencing poverty. Likewise, among single-mother households, those with 1 or 2 children have the highest poverty rate, with 307 households (39.5%) falling below the poverty line.
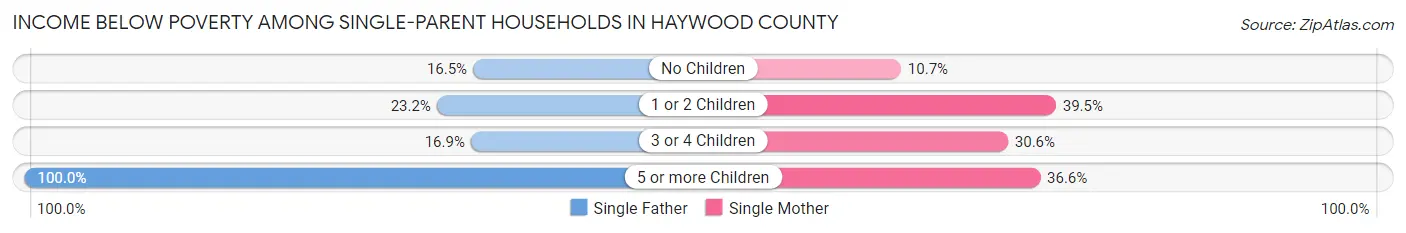
| Children | Single Father | Single Mother |
| No Children | 32 (16.5%) | 52 (10.7%) |
| 1 or 2 Children | 33 (23.2%) | 307 (39.5%) |
| 3 or 4 Children | 12 (16.9%) | 37 (30.6%) |
| 5 or more Children | 22 (100.0%) | 15 (36.6%) |
| Total | 99 (23.1%) | 411 (28.8%) |
Income Below Poverty Among Married-Couple vs Single-Parent Households in Haywood County
The poverty data for Haywood County shows that 258 of the married-couple family households (9.6%) and 510 of the single-parent households (27.5%) are living below the poverty level. Within the married-couple family households, those with 3 or 4 children have the highest poverty rate, with 66 households (36.9%) falling below the poverty line. Among the single-parent households, those with 5 or more children have the highest poverty rate, with 37 household (58.7%) living below poverty.
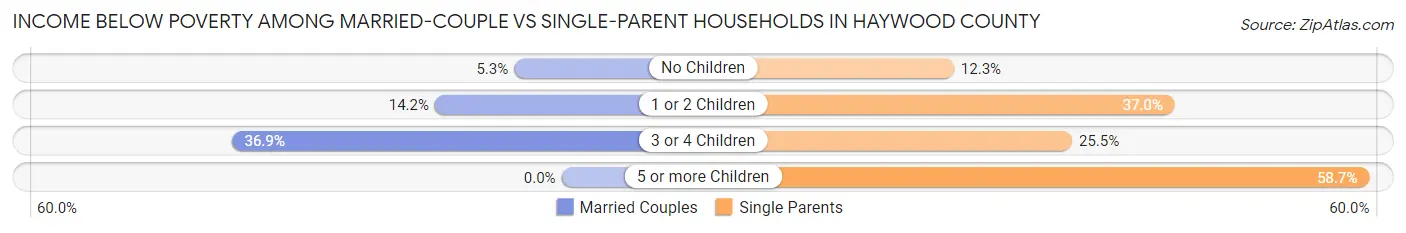
| Children | Married-Couple Families | Single-Parent Households |
| No Children | 96 (5.3%) | 84 (12.3%) |
| 1 or 2 Children | 96 (14.2%) | 340 (37.0%) |
| 3 or 4 Children | 66 (36.9%) | 49 (25.5%) |
| 5 or more Children | 0 (0.0%) | 37 (58.7%) |
| Total | 258 (9.6%) | 510 (27.5%) |
Employment Characteristics in Haywood County
Employment by Class of Employer in Haywood County
Among the 7,153 employed individuals in Haywood County, private company employees (4,962 | 69.4%), local government employees (697 | 9.7%), and self-employed (not incorporated) (467 | 6.5%) make up the most common classes of employment.
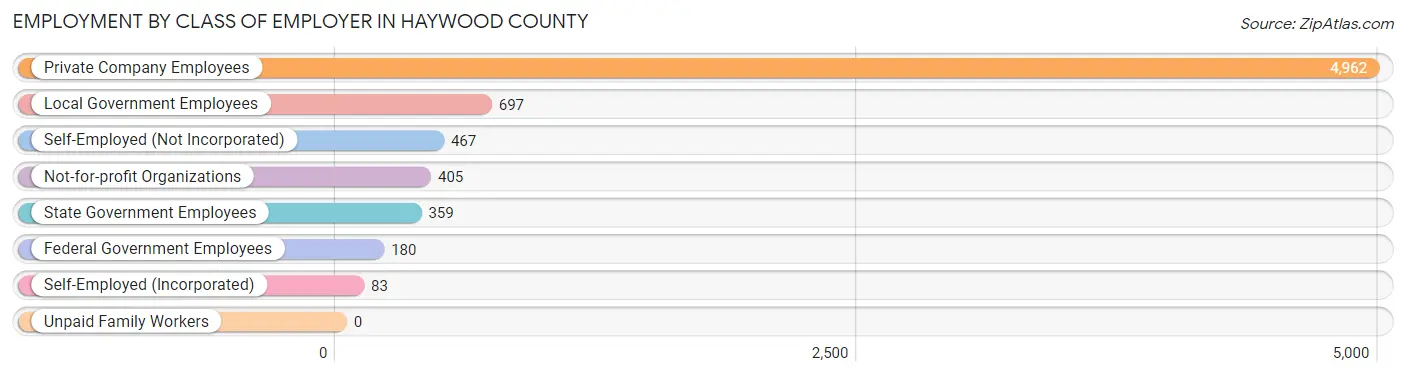
| Employer Class | # Employees | % Employees |
| Private Company Employees | 4,962 | 69.4% |
| Self-Employed (Incorporated) | 83 | 1.2% |
| Self-Employed (Not Incorporated) | 467 | 6.5% |
| Not-for-profit Organizations | 405 | 5.7% |
| Local Government Employees | 697 | 9.7% |
| State Government Employees | 359 | 5.0% |
| Federal Government Employees | 180 | 2.5% |
| Unpaid Family Workers | 0 | 0.0% |
| Total | 7,153 | 100.0% |
Employment Status by Age in Haywood County
According to the labor force statistics for Haywood County, out of the total population over 16 years of age (14,396), 55.2% or 7,947 individuals are in the labor force, with 8.5% or 675 of them unemployed. The age group with the highest labor force participation rate is 25 to 29 years, with 83.0% or 871 individuals in the labor force. Within the labor force, the 16 to 19 years age range has the highest percentage of unemployed individuals, with 26.8% or 150 of them being unemployed.
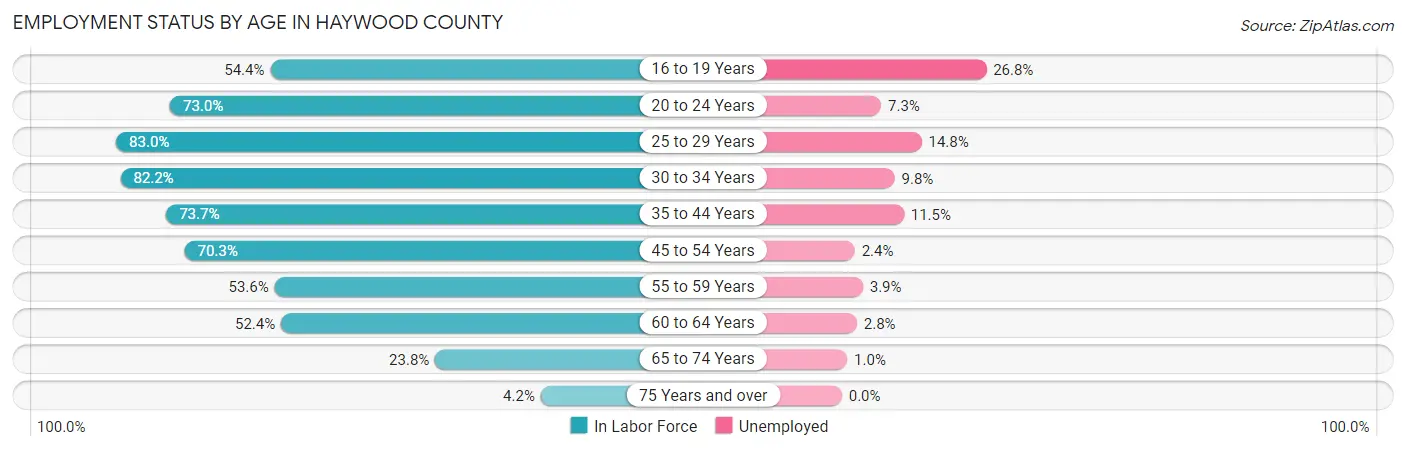
| Age Bracket | In Labor Force | Unemployed |
| 16 to 19 Years | 559 (54.4%) | 150 (26.8%) |
| 20 to 24 Years | 646 (73.0%) | 47 (7.3%) |
| 25 to 29 Years | 871 (83.0%) | 129 (14.8%) |
| 30 to 34 Years | 824 (82.2%) | 81 (9.8%) |
| 35 to 44 Years | 1,576 (73.7%) | 181 (11.5%) |
| 45 to 54 Years | 1,488 (70.3%) | 36 (2.4%) |
| 55 to 59 Years | 683 (53.6%) | 27 (3.9%) |
| 60 to 64 Years | 727 (52.4%) | 20 (2.8%) |
| 65 to 74 Years | 511 (23.8%) | 5 (1.0%) |
| 75 Years and over | 57 (4.2%) | 0 (0.0%) |
| Total | 7,947 (55.2%) | 675 (8.5%) |
Employment Status by Educational Attainment in Haywood County
According to labor force statistics for Haywood County, 68.8% of individuals (6,171) out of the total population between 25 and 64 years of age (8,969) are in the labor force, with 7.7% or 475 of them being unemployed. The group with the highest labor force participation rate are those with the educational attainment of bachelor's degree or higher, with 90.1% or 942 individuals in the labor force. Within the labor force, individuals with less than high school education have the highest percentage of unemployment, with 11.1% or 63 of them being unemployed.
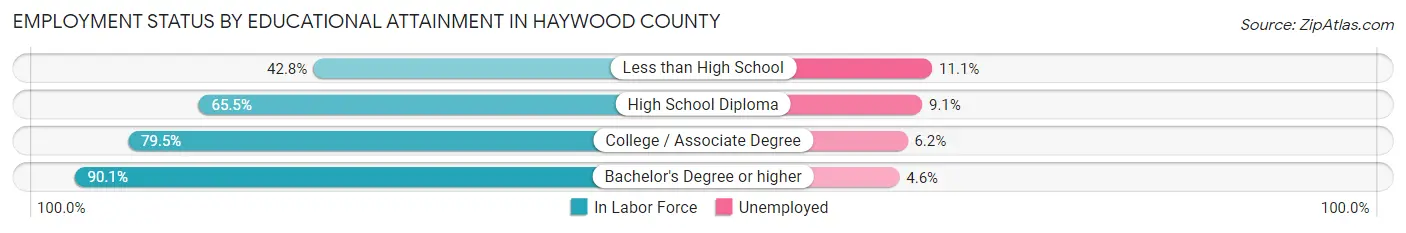
| Educational Attainment | In Labor Force | Unemployed |
| Less than High School | 566 (42.8%) | 147 (11.1%) |
| High School Diploma | 2,739 (65.5%) | 380 (9.1%) |
| College / Associate Degree | 1,925 (79.5%) | 150 (6.2%) |
| Bachelor's Degree or higher | 942 (90.1%) | 48 (4.6%) |
| Total | 6,171 (68.8%) | 691 (7.7%) |
Employment Occupations by Sex in Haywood County
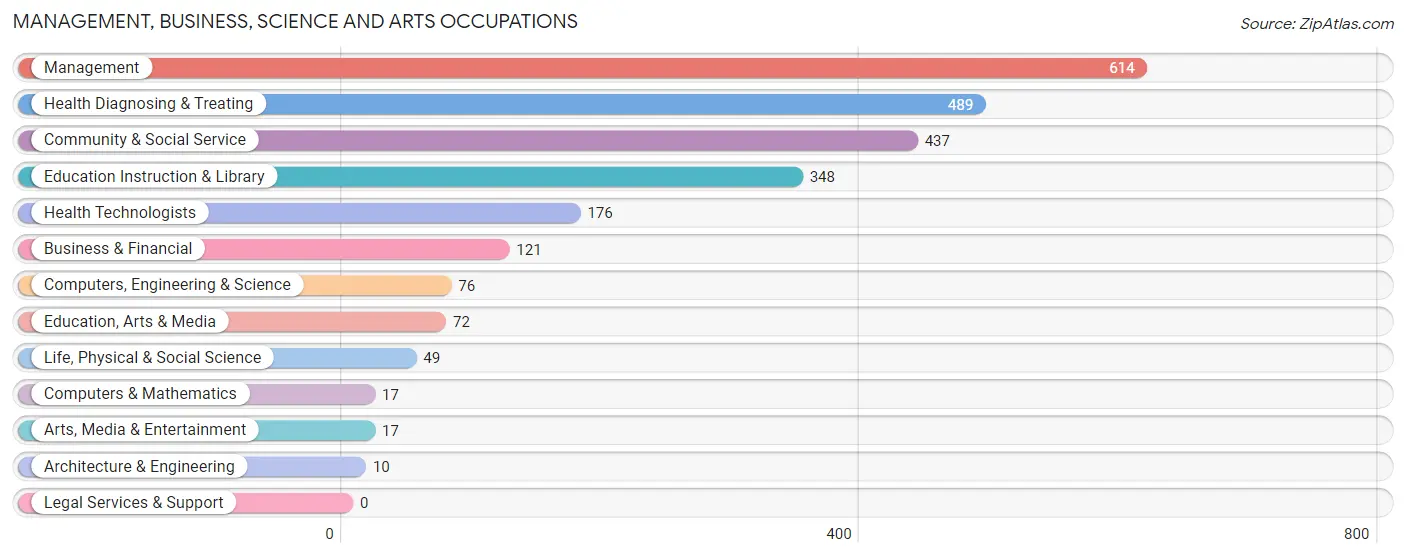
Management, Business, Science and Arts Occupations
The most common Management, Business, Science and Arts occupations in Haywood County are Management (614 | 8.5%), Health Diagnosing & Treating (489 | 6.7%), Community & Social Service (437 | 6.0%), Education Instruction & Library (348 | 4.8%), and Health Technologists (176 | 2.4%).
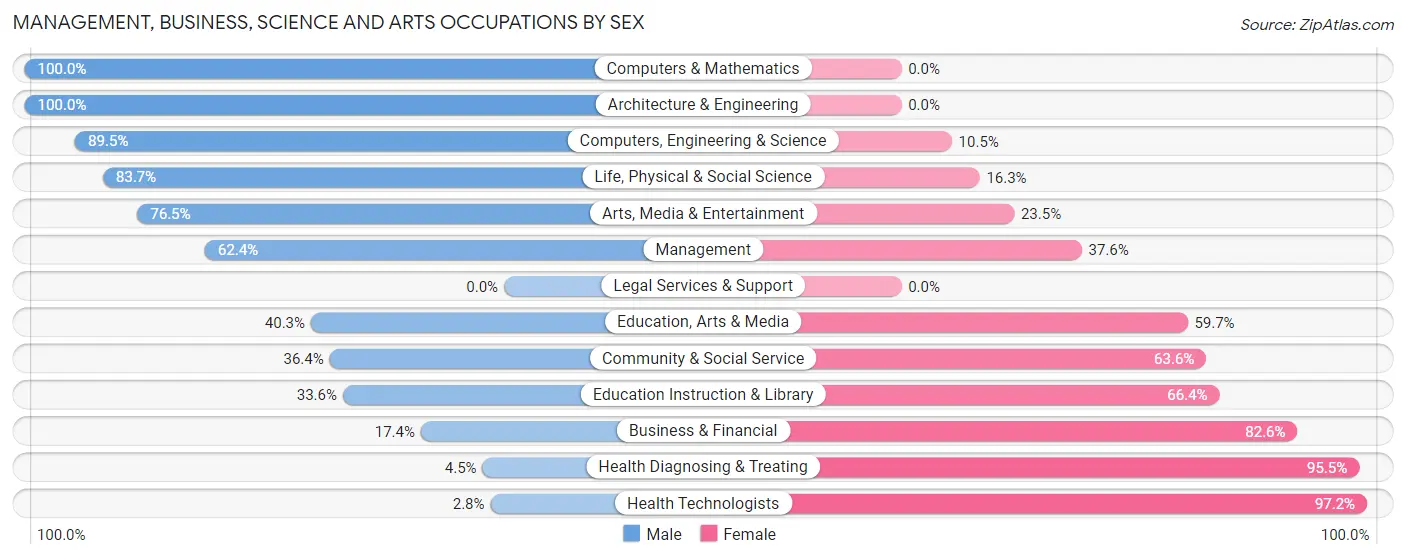
Management, Business, Science and Arts Occupations by Sex
Within the Management, Business, Science and Arts occupations in Haywood County, the most male-oriented occupations are Computers & Mathematics (100.0%), Architecture & Engineering (100.0%), and Computers, Engineering & Science (89.5%), while the most female-oriented occupations are Health Technologists (97.2%), Health Diagnosing & Treating (95.5%), and Business & Financial (82.6%).
| Occupation | Male | Female |
| Management | 383 (62.4%) | 231 (37.6%) |
| Business & Financial | 21 (17.4%) | 100 (82.6%) |
| Computers, Engineering & Science | 68 (89.5%) | 8 (10.5%) |
| Computers & Mathematics | 17 (100.0%) | 0 (0.0%) |
| Architecture & Engineering | 10 (100.0%) | 0 (0.0%) |
| Life, Physical & Social Science | 41 (83.7%) | 8 (16.3%) |
| Community & Social Service | 159 (36.4%) | 278 (63.6%) |
| Education, Arts & Media | 29 (40.3%) | 43 (59.7%) |
| Legal Services & Support | 0 (0.0%) | 0 (0.0%) |
| Education Instruction & Library | 117 (33.6%) | 231 (66.4%) |
| Arts, Media & Entertainment | 13 (76.5%) | 4 (23.5%) |
| Health Diagnosing & Treating | 22 (4.5%) | 467 (95.5%) |
| Health Technologists | 5 (2.8%) | 171 (97.2%) |
| Total (Category) | 653 (37.6%) | 1,084 (62.4%) |
| Total (Overall) | 3,677 (50.6%) | 3,591 (49.4%) |
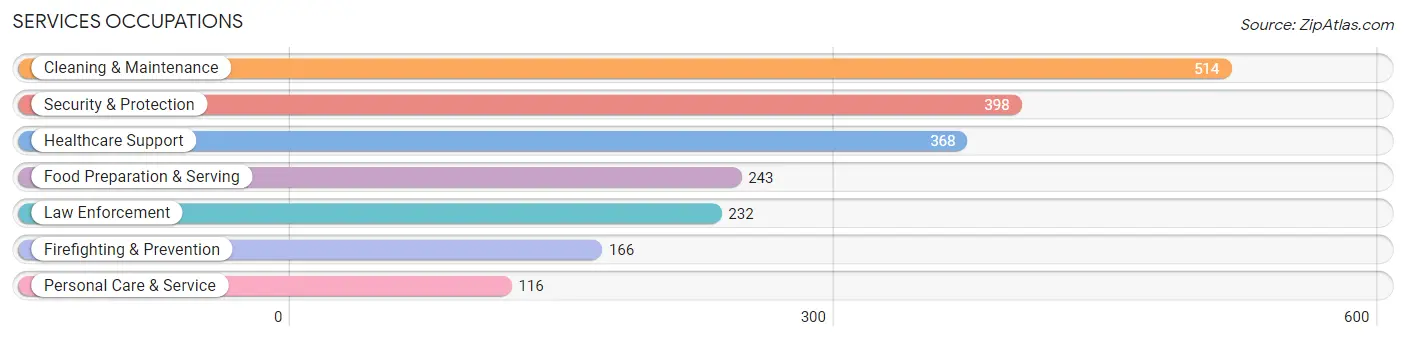
Services Occupations
The most common Services occupations in Haywood County are Cleaning & Maintenance (514 | 7.1%), Security & Protection (398 | 5.5%), Healthcare Support (368 | 5.1%), Food Preparation & Serving (243 | 3.3%), and Law Enforcement (232 | 3.2%).
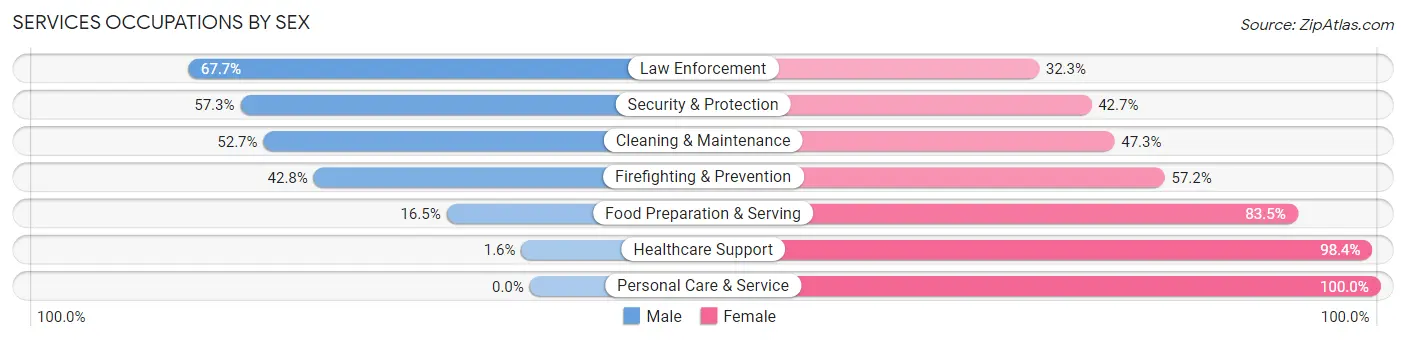
Services Occupations by Sex
Within the Services occupations in Haywood County, the most male-oriented occupations are Law Enforcement (67.7%), Security & Protection (57.3%), and Cleaning & Maintenance (52.7%), while the most female-oriented occupations are Personal Care & Service (100.0%), Healthcare Support (98.4%), and Food Preparation & Serving (83.5%).
| Occupation | Male | Female |
| Healthcare Support | 6 (1.6%) | 362 (98.4%) |
| Security & Protection | 228 (57.3%) | 170 (42.7%) |
| Firefighting & Prevention | 71 (42.8%) | 95 (57.2%) |
| Law Enforcement | 157 (67.7%) | 75 (32.3%) |
| Food Preparation & Serving | 40 (16.5%) | 203 (83.5%) |
| Cleaning & Maintenance | 271 (52.7%) | 243 (47.3%) |
| Personal Care & Service | 0 (0.0%) | 116 (100.0%) |
| Total (Category) | 545 (33.3%) | 1,094 (66.7%) |
| Total (Overall) | 3,677 (50.6%) | 3,591 (49.4%) |
Sales and Office Occupations
The most common Sales and Office occupations in Haywood County are Sales & Related (587 | 8.1%), and Office & Administration (523 | 7.2%).
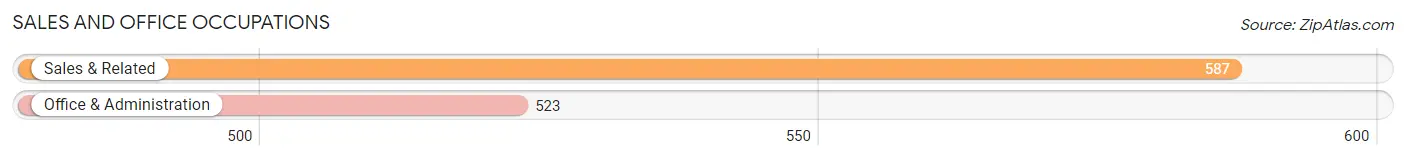
Sales and Office Occupations by Sex
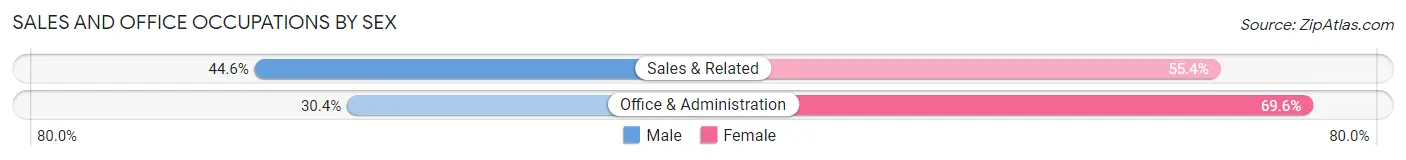
| Occupation | Male | Female |
| Sales & Related | 262 (44.6%) | 325 (55.4%) |
| Office & Administration | 159 (30.4%) | 364 (69.6%) |
| Total (Category) | 421 (37.9%) | 689 (62.1%) |
| Total (Overall) | 3,677 (50.6%) | 3,591 (49.4%) |
Natural Resources, Construction and Maintenance Occupations
The most common Natural Resources, Construction and Maintenance occupations in Haywood County are Construction & Extraction (291 | 4.0%), Installation, Maintenance & Repair (240 | 3.3%), and Farming, Fishing & Forestry (106 | 1.5%).
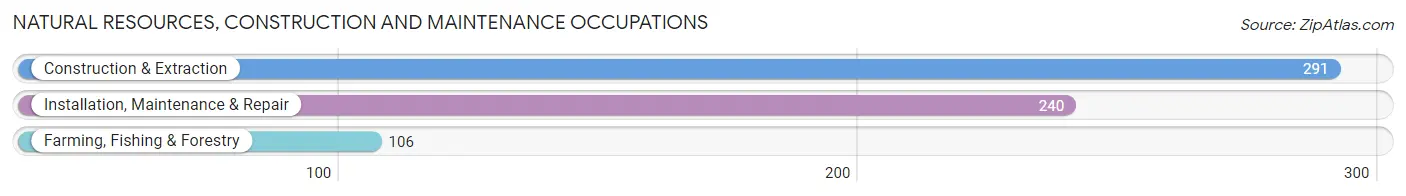
Natural Resources, Construction and Maintenance Occupations by Sex
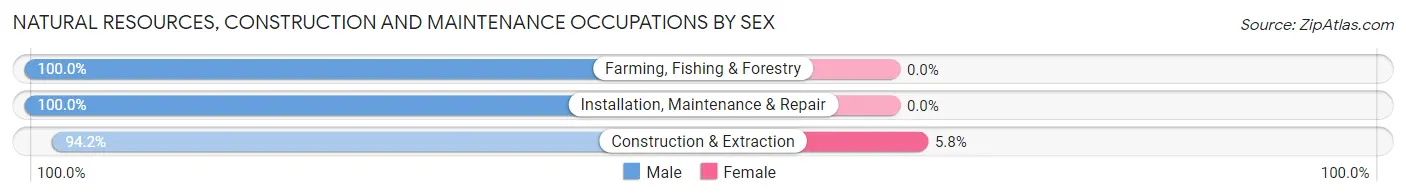
| Occupation | Male | Female |
| Farming, Fishing & Forestry | 106 (100.0%) | 0 (0.0%) |
| Construction & Extraction | 274 (94.2%) | 17 (5.8%) |
| Installation, Maintenance & Repair | 240 (100.0%) | 0 (0.0%) |
| Total (Category) | 620 (97.3%) | 17 (2.7%) |
| Total (Overall) | 3,677 (50.6%) | 3,591 (49.4%) |
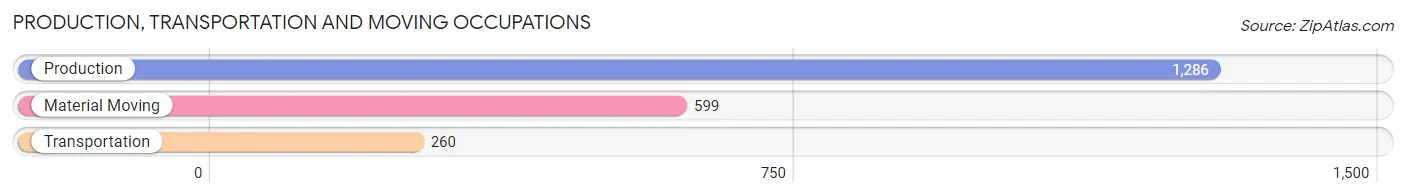
Production, Transportation and Moving Occupations
The most common Production, Transportation and Moving occupations in Haywood County are Production (1,286 | 17.7%), Material Moving (599 | 8.2%), and Transportation (260 | 3.6%).
Production, Transportation and Moving Occupations by Sex

| Occupation | Male | Female |
| Production | 764 (59.4%) | 522 (40.6%) |
| Transportation | 215 (82.7%) | 45 (17.3%) |
| Material Moving | 459 (76.6%) | 140 (23.4%) |
| Total (Category) | 1,438 (67.0%) | 707 (33.0%) |
| Total (Overall) | 3,677 (50.6%) | 3,591 (49.4%) |
Employment Industries by Sex in Haywood County
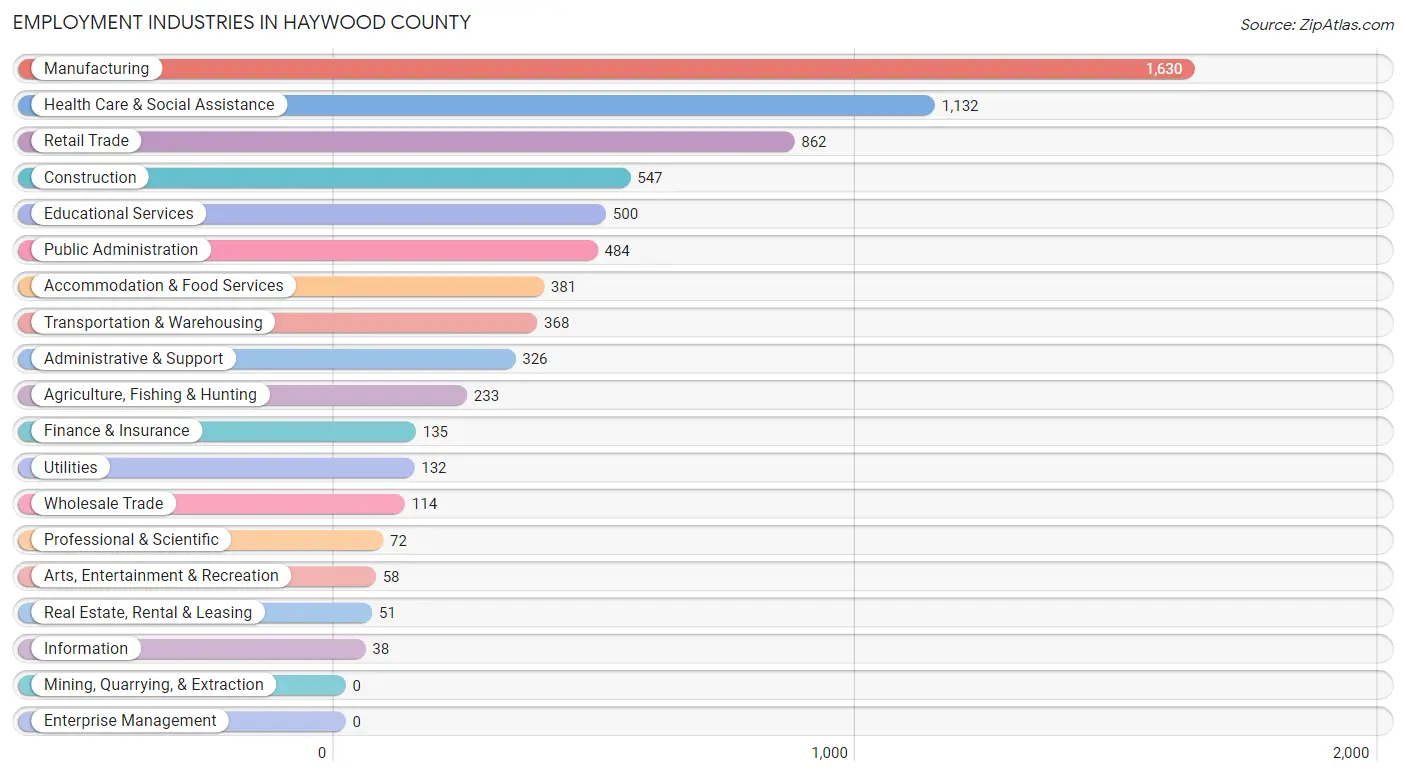
Employment Industries in Haywood County
The major employment industries in Haywood County include Manufacturing (1,630 | 22.4%), Health Care & Social Assistance (1,132 | 15.6%), Retail Trade (862 | 11.9%), Construction (547 | 7.5%), and Educational Services (500 | 6.9%).
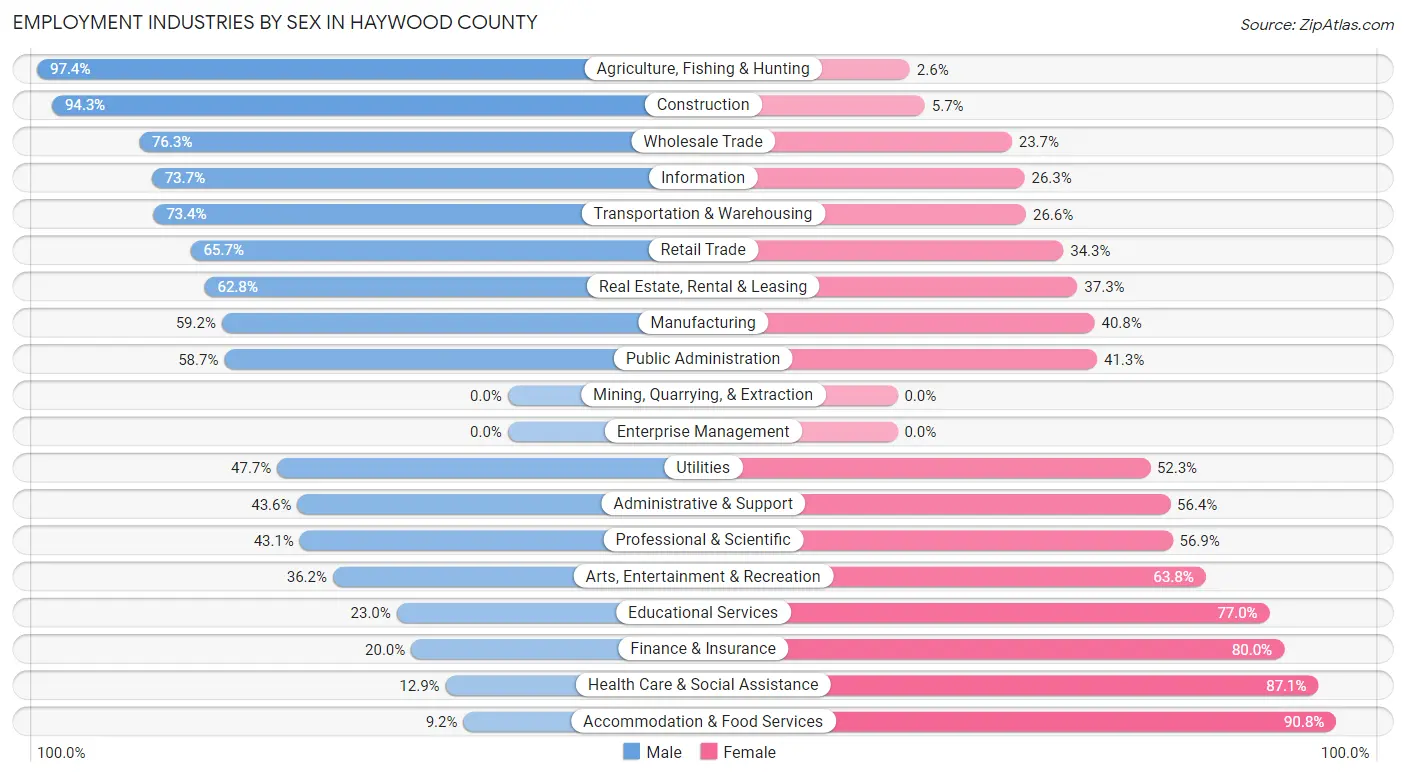
Employment Industries by Sex in Haywood County
The Haywood County industries that see more men than women are Agriculture, Fishing & Hunting (97.4%), Construction (94.3%), and Wholesale Trade (76.3%), whereas the industries that tend to have a higher number of women are Accommodation & Food Services (90.8%), Health Care & Social Assistance (87.1%), and Finance & Insurance (80.0%).
| Industry | Male | Female |
| Agriculture, Fishing & Hunting | 227 (97.4%) | 6 (2.6%) |
| Mining, Quarrying, & Extraction | 0 (0.0%) | 0 (0.0%) |
| Construction | 516 (94.3%) | 31 (5.7%) |
| Manufacturing | 965 (59.2%) | 665 (40.8%) |
| Wholesale Trade | 87 (76.3%) | 27 (23.7%) |
| Retail Trade | 566 (65.7%) | 296 (34.3%) |
| Transportation & Warehousing | 270 (73.4%) | 98 (26.6%) |
| Utilities | 63 (47.7%) | 69 (52.3%) |
| Information | 28 (73.7%) | 10 (26.3%) |
| Finance & Insurance | 27 (20.0%) | 108 (80.0%) |
| Real Estate, Rental & Leasing | 32 (62.7%) | 19 (37.2%) |
| Professional & Scientific | 31 (43.1%) | 41 (56.9%) |
| Enterprise Management | 0 (0.0%) | 0 (0.0%) |
| Administrative & Support | 142 (43.6%) | 184 (56.4%) |
| Educational Services | 115 (23.0%) | 385 (77.0%) |
| Health Care & Social Assistance | 146 (12.9%) | 986 (87.1%) |
| Arts, Entertainment & Recreation | 21 (36.2%) | 37 (63.8%) |
| Accommodation & Food Services | 35 (9.2%) | 346 (90.8%) |
| Public Administration | 284 (58.7%) | 200 (41.3%) |
| Total | 3,677 (50.6%) | 3,591 (49.4%) |
Education in Haywood County
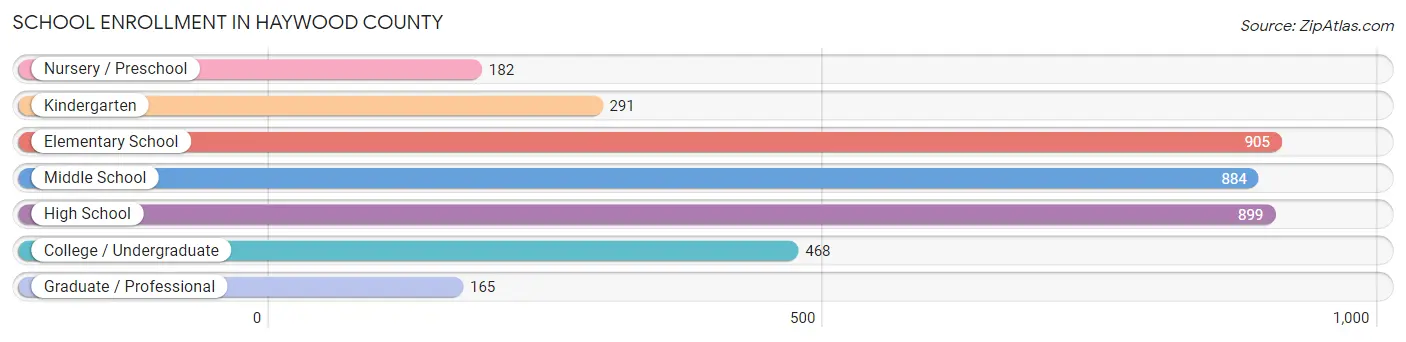
School Enrollment in Haywood County
The most common levels of schooling among the 3,794 students in Haywood County are elementary school (905 | 23.8%), high school (899 | 23.7%), and middle school (884 | 23.3%).
| School Level | # Students | % Students |
| Nursery / Preschool | 182 | 4.8% |
| Kindergarten | 291 | 7.7% |
| Elementary School | 905 | 23.8% |
| Middle School | 884 | 23.3% |
| High School | 899 | 23.7% |
| College / Undergraduate | 468 | 12.3% |
| Graduate / Professional | 165 | 4.3% |
| Total | 3,794 | 100.0% |
School Enrollment by Age by Funding Source in Haywood County
Out of a total of 3,794 students who are enrolled in schools in Haywood County, 281 (7.4%) attend a private institution, while the remaining 3,513 (92.6%) are enrolled in public schools. The age group of 20 to 24 year olds has the highest likelihood of being enrolled in private schools, with 21 (21.6% in the age bracket) enrolled. Conversely, the age group of 25 to 34 year olds has the lowest likelihood of being enrolled in a private school, with 179 (100.0% in the age bracket) attending a public institution.
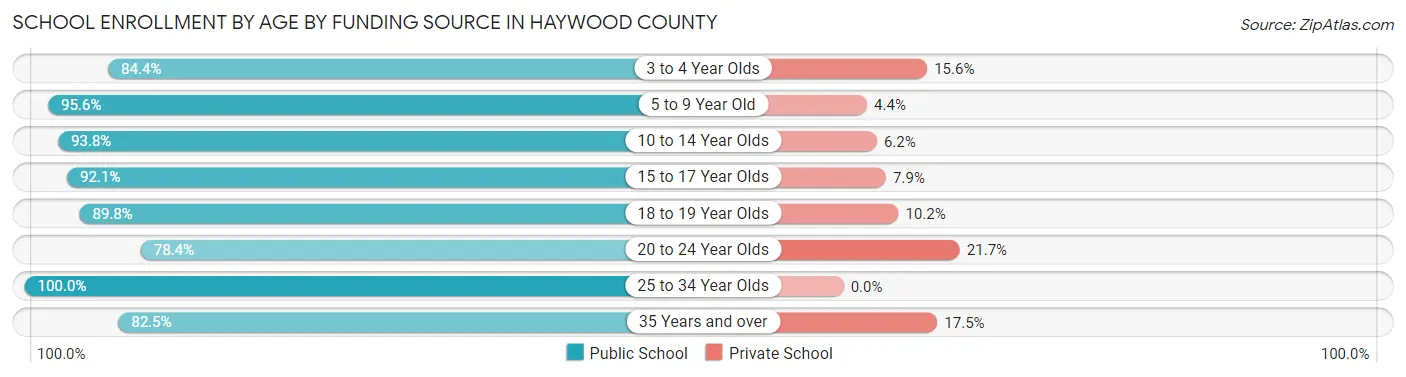
| Age Bracket | Public School | Private School |
| 3 to 4 Year Olds | 103 (84.4%) | 19 (15.6%) |
| 5 to 9 Year Old | 1,092 (95.6%) | 50 (4.4%) |
| 10 to 14 Year Olds | 1,026 (93.8%) | 68 (6.2%) |
| 15 to 17 Year Olds | 629 (92.1%) | 54 (7.9%) |
| 18 to 19 Year Olds | 202 (89.8%) | 23 (10.2%) |
| 20 to 24 Year Olds | 76 (78.3%) | 21 (21.6%) |
| 25 to 34 Year Olds | 179 (100.0%) | 0 (0.0%) |
| 35 Years and over | 208 (82.5%) | 44 (17.5%) |
| Total | 3,513 (92.6%) | 281 (7.4%) |
Educational Attainment by Field of Study in Haywood County
Education (406 | 25.9%), business (277 | 17.7%), science & technology (143 | 9.1%), engineering (116 | 7.4%), and bio, nature & agricultural (111 | 7.1%) are the most common fields of study among 1,565 individuals in Haywood County who have obtained a bachelor's degree or higher.
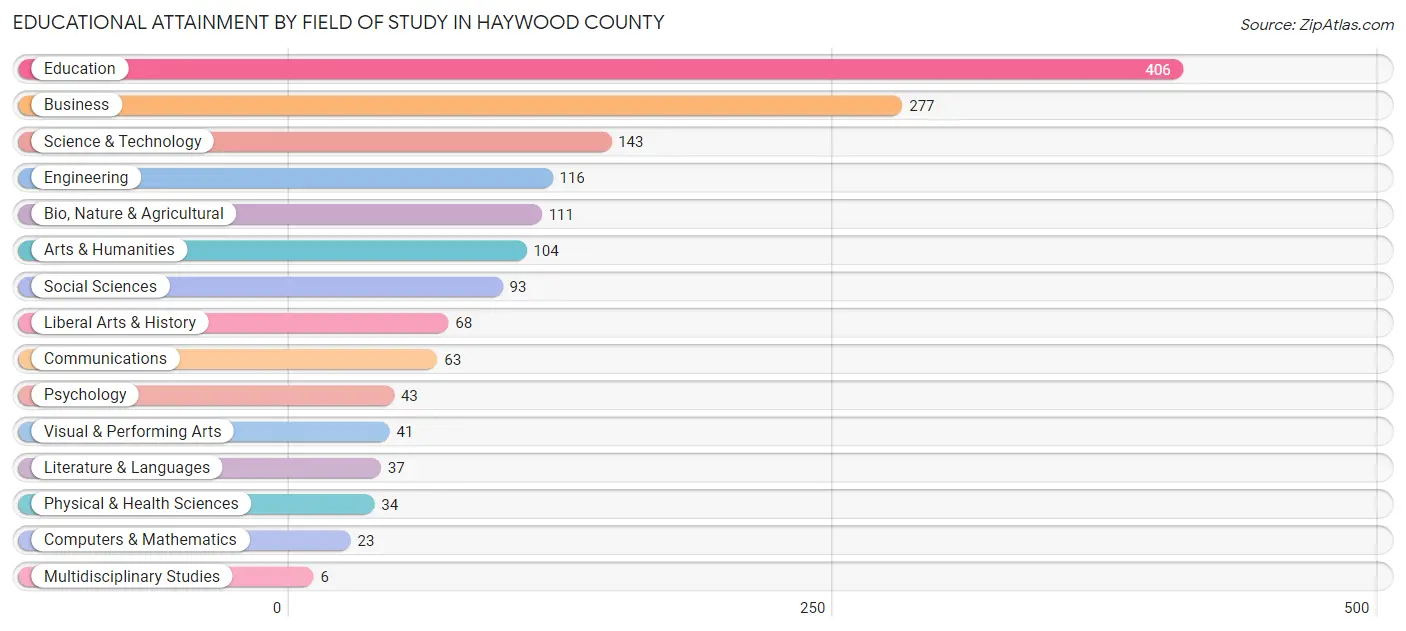
| Field of Study | # Graduates | % Graduates |
| Computers & Mathematics | 23 | 1.5% |
| Bio, Nature & Agricultural | 111 | 7.1% |
| Physical & Health Sciences | 34 | 2.2% |
| Psychology | 43 | 2.8% |
| Social Sciences | 93 | 5.9% |
| Engineering | 116 | 7.4% |
| Multidisciplinary Studies | 6 | 0.4% |
| Science & Technology | 143 | 9.1% |
| Business | 277 | 17.7% |
| Education | 406 | 25.9% |
| Literature & Languages | 37 | 2.4% |
| Liberal Arts & History | 68 | 4.3% |
| Visual & Performing Arts | 41 | 2.6% |
| Communications | 63 | 4.0% |
| Arts & Humanities | 104 | 6.7% |
| Total | 1,565 | 100.0% |
Transportation & Commute in Haywood County
Vehicle Availability by Sex in Haywood County
The most prevalent vehicle ownership categories in Haywood County are males with 2 vehicles (1,604, accounting for 43.9%) and females with 2 vehicles (1,171, making up 45.9%).
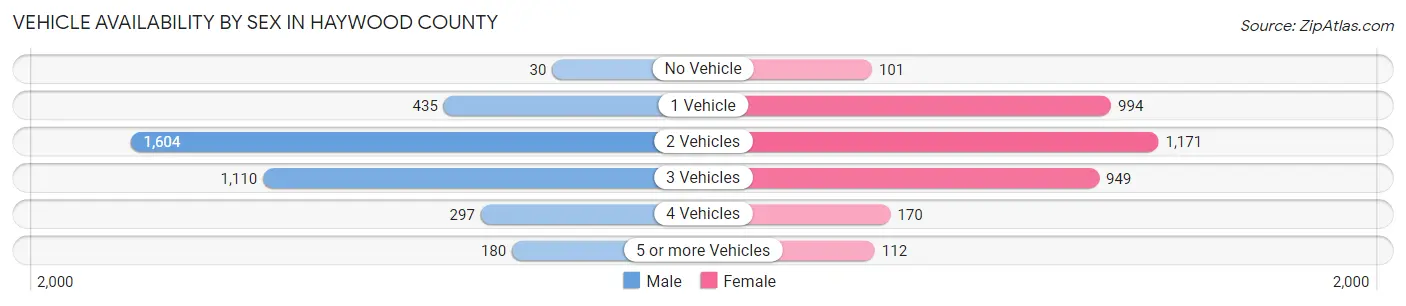
| Vehicles Available | Male | Female |
| No Vehicle | 30 (0.8%) | 101 (2.9%) |
| 1 Vehicle | 435 (11.9%) | 994 (28.4%) |
| 2 Vehicles | 1,604 (43.9%) | 1,171 (33.5%) |
| 3 Vehicles | 1,110 (30.4%) | 949 (27.1%) |
| 4 Vehicles | 297 (8.1%) | 170 (4.9%) |
| 5 or more Vehicles | 180 (4.9%) | 112 (3.2%) |
| Total | 3,656 (100.0%) | 3,497 (100.0%) |
Commute Time in Haywood County
The most frequently occuring commute durations in Haywood County are 5 to 9 minutes (1,223 commuters, 17.7%), 30 to 34 minutes (1,194 commuters, 17.3%), and 15 to 19 minutes (876 commuters, 12.7%).
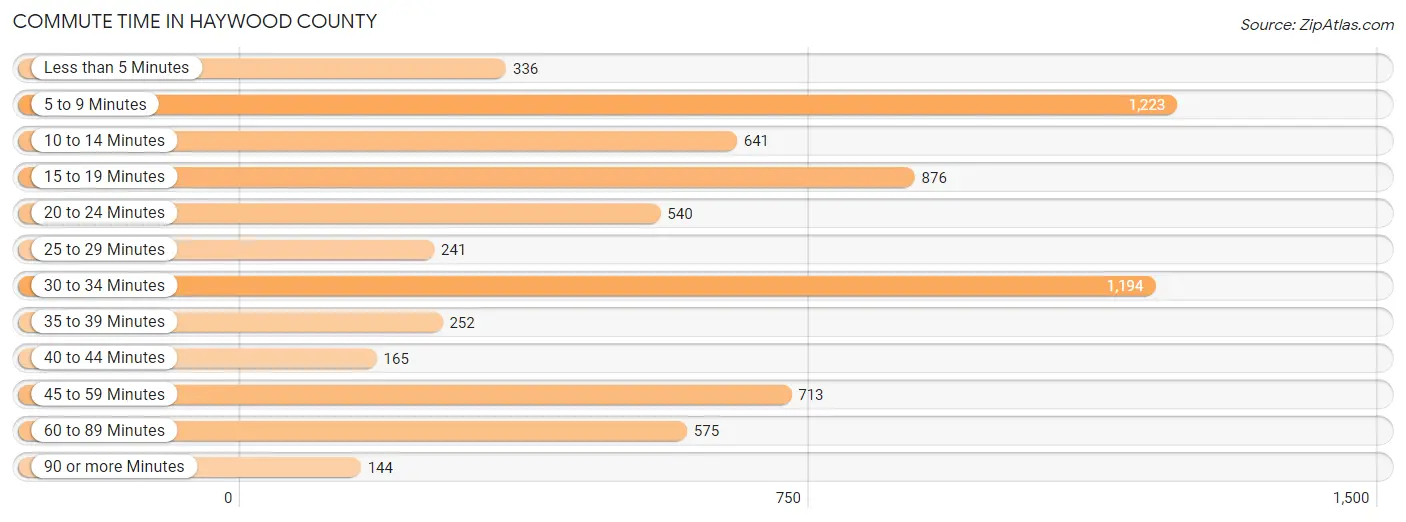
| Commute Time | # Commuters | % Commuters |
| Less than 5 Minutes | 336 | 4.9% |
| 5 to 9 Minutes | 1,223 | 17.7% |
| 10 to 14 Minutes | 641 | 9.3% |
| 15 to 19 Minutes | 876 | 12.7% |
| 20 to 24 Minutes | 540 | 7.8% |
| 25 to 29 Minutes | 241 | 3.5% |
| 30 to 34 Minutes | 1,194 | 17.3% |
| 35 to 39 Minutes | 252 | 3.6% |
| 40 to 44 Minutes | 165 | 2.4% |
| 45 to 59 Minutes | 713 | 10.3% |
| 60 to 89 Minutes | 575 | 8.3% |
| 90 or more Minutes | 144 | 2.1% |
Commute Time by Sex in Haywood County
The most common commute times in Haywood County are 5 to 9 minutes (749 commuters, 21.1%) for males and 30 to 34 minutes (523 commuters, 15.6%) for females.
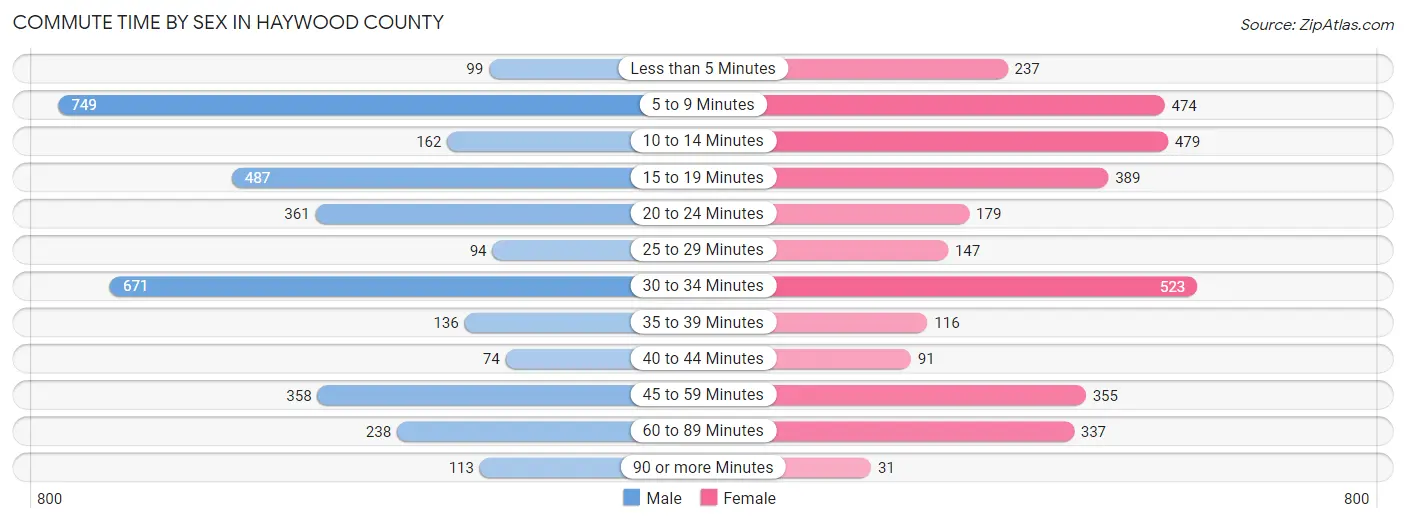
| Commute Time | Male | Female |
| Less than 5 Minutes | 99 (2.8%) | 237 (7.1%) |
| 5 to 9 Minutes | 749 (21.1%) | 474 (14.1%) |
| 10 to 14 Minutes | 162 (4.6%) | 479 (14.3%) |
| 15 to 19 Minutes | 487 (13.8%) | 389 (11.6%) |
| 20 to 24 Minutes | 361 (10.2%) | 179 (5.3%) |
| 25 to 29 Minutes | 94 (2.6%) | 147 (4.4%) |
| 30 to 34 Minutes | 671 (18.9%) | 523 (15.6%) |
| 35 to 39 Minutes | 136 (3.8%) | 116 (3.5%) |
| 40 to 44 Minutes | 74 (2.1%) | 91 (2.7%) |
| 45 to 59 Minutes | 358 (10.1%) | 355 (10.6%) |
| 60 to 89 Minutes | 238 (6.7%) | 337 (10.0%) |
| 90 or more Minutes | 113 (3.2%) | 31 (0.9%) |
Time of Departure to Work by Sex in Haywood County
The most frequent times of departure to work in Haywood County are 6:30 AM to 6:59 AM (527, 14.9%) for males and 7:00 AM to 7:29 AM (539, 16.1%) for females.
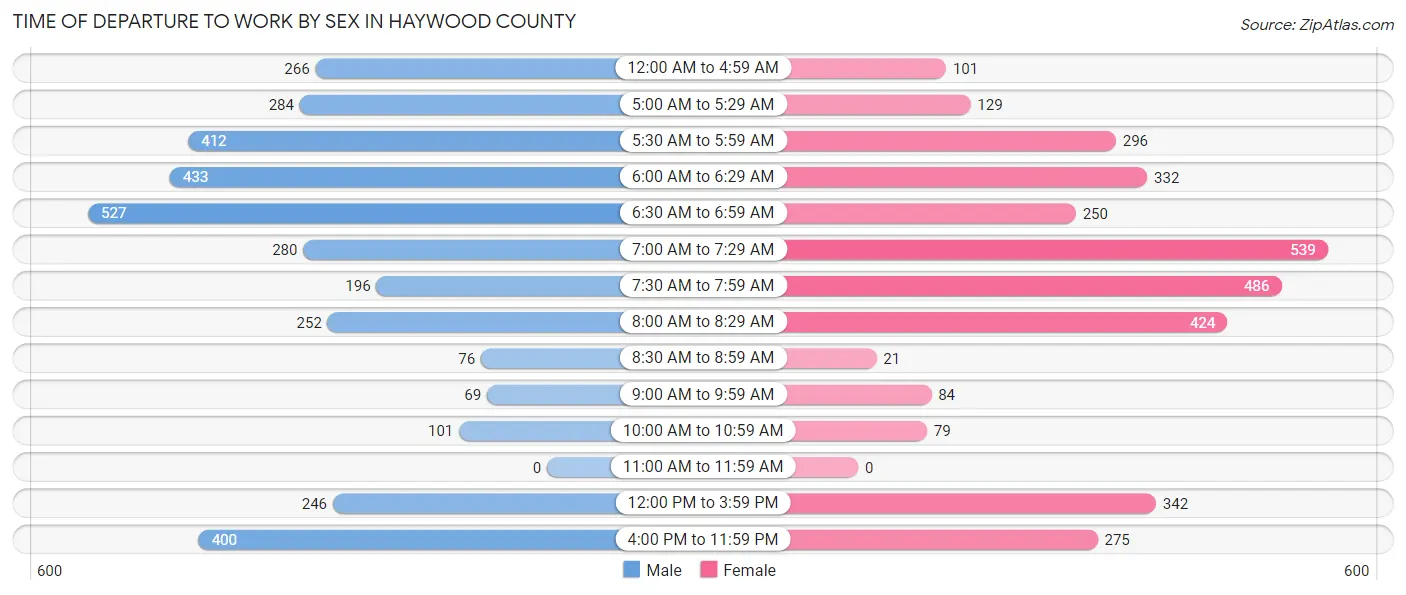
| Time of Departure | Male | Female |
| 12:00 AM to 4:59 AM | 266 (7.5%) | 101 (3.0%) |
| 5:00 AM to 5:29 AM | 284 (8.0%) | 129 (3.8%) |
| 5:30 AM to 5:59 AM | 412 (11.6%) | 296 (8.8%) |
| 6:00 AM to 6:29 AM | 433 (12.2%) | 332 (9.9%) |
| 6:30 AM to 6:59 AM | 527 (14.9%) | 250 (7.4%) |
| 7:00 AM to 7:29 AM | 280 (7.9%) | 539 (16.1%) |
| 7:30 AM to 7:59 AM | 196 (5.5%) | 486 (14.5%) |
| 8:00 AM to 8:29 AM | 252 (7.1%) | 424 (12.6%) |
| 8:30 AM to 8:59 AM | 76 (2.1%) | 21 (0.6%) |
| 9:00 AM to 9:59 AM | 69 (1.9%) | 84 (2.5%) |
| 10:00 AM to 10:59 AM | 101 (2.9%) | 79 (2.4%) |
| 11:00 AM to 11:59 AM | 0 (0.0%) | 0 (0.0%) |
| 12:00 PM to 3:59 PM | 246 (7.0%) | 342 (10.2%) |
| 4:00 PM to 11:59 PM | 400 (11.3%) | 275 (8.2%) |
| Total | 3,542 (100.0%) | 3,358 (100.0%) |
Housing Occupancy in Haywood County
Occupancy by Ownership in Haywood County
Of the total 7,200 dwellings in Haywood County, owner-occupied units account for 4,182 (58.1%), while renter-occupied units make up 3,018 (41.9%).
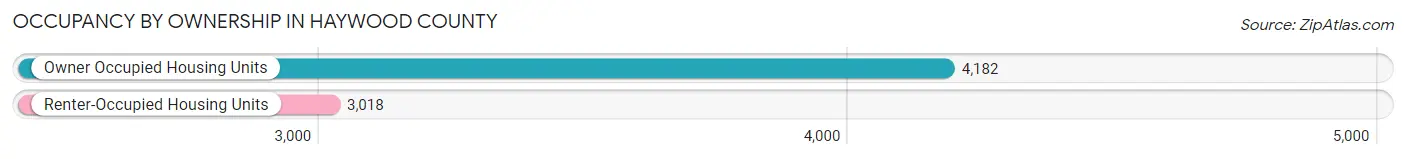
| Occupancy | # Housing Units | % Housing Units |
| Owner Occupied Housing Units | 4,182 | 58.1% |
| Renter-Occupied Housing Units | 3,018 | 41.9% |
| Total Occupied Housing Units | 7,200 | 100.0% |
Occupancy by Household Size in Haywood County
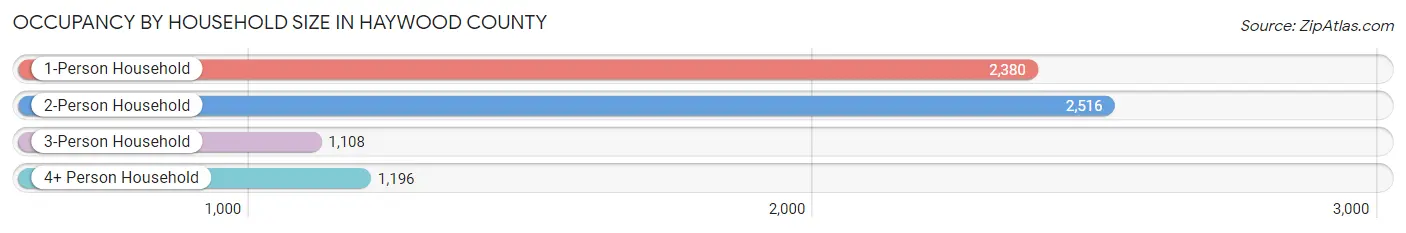
| Household Size | # Housing Units | % Housing Units |
| 1-Person Household | 2,380 | 33.1% |
| 2-Person Household | 2,516 | 34.9% |
| 3-Person Household | 1,108 | 15.4% |
| 4+ Person Household | 1,196 | 16.6% |
| Total Housing Units | 7,200 | 100.0% |
Occupancy by Ownership by Household Size in Haywood County
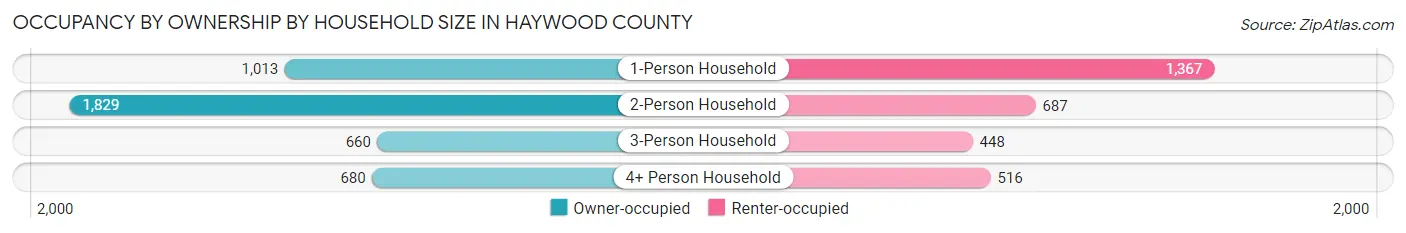
| Household Size | Owner-occupied | Renter-occupied |
| 1-Person Household | 1,013 (42.6%) | 1,367 (57.4%) |
| 2-Person Household | 1,829 (72.7%) | 687 (27.3%) |
| 3-Person Household | 660 (59.6%) | 448 (40.4%) |
| 4+ Person Household | 680 (56.9%) | 516 (43.1%) |
| Total Housing Units | 4,182 (58.1%) | 3,018 (41.9%) |
Occupancy by Educational Attainment in Haywood County
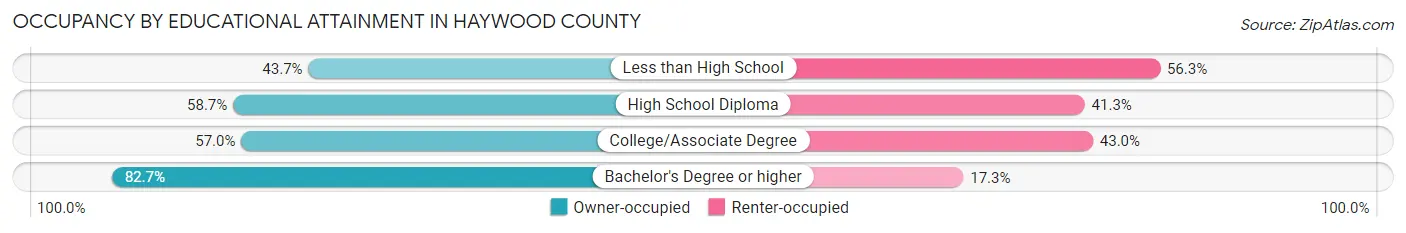
| Household Size | Owner-occupied | Renter-occupied |
| Less than High School | 568 (43.7%) | 731 (56.3%) |
| High School Diploma | 1,876 (58.7%) | 1,322 (41.3%) |
| College/Associate Degree | 1,106 (57.0%) | 833 (43.0%) |
| Bachelor's Degree or higher | 632 (82.7%) | 132 (17.3%) |
Occupancy by Age of Householder in Haywood County
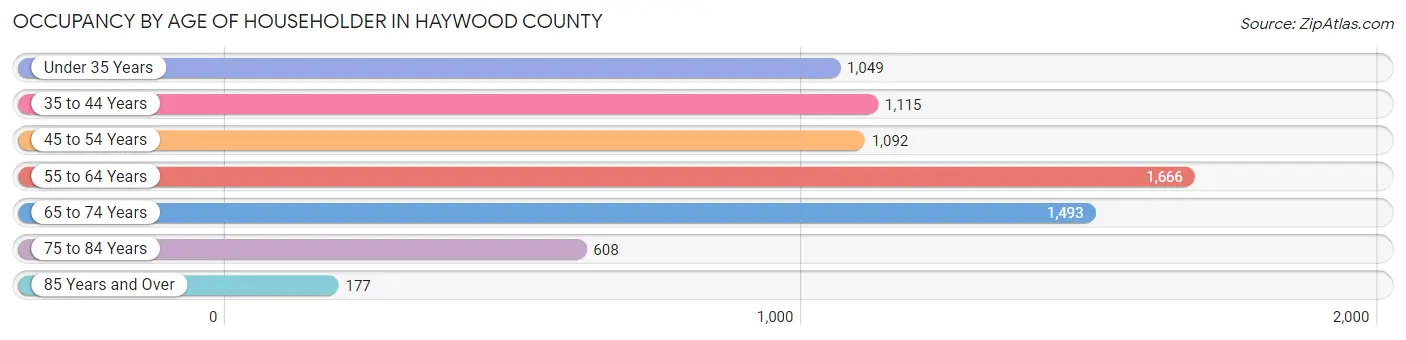
| Age Bracket | # Households | % Households |
| Under 35 Years | 1,049 | 14.6% |
| 35 to 44 Years | 1,115 | 15.5% |
| 45 to 54 Years | 1,092 | 15.2% |
| 55 to 64 Years | 1,666 | 23.1% |
| 65 to 74 Years | 1,493 | 20.7% |
| 75 to 84 Years | 608 | 8.4% |
| 85 Years and Over | 177 | 2.5% |
| Total | 7,200 | 100.0% |
Housing Finances in Haywood County
Median Income by Occupancy in Haywood County
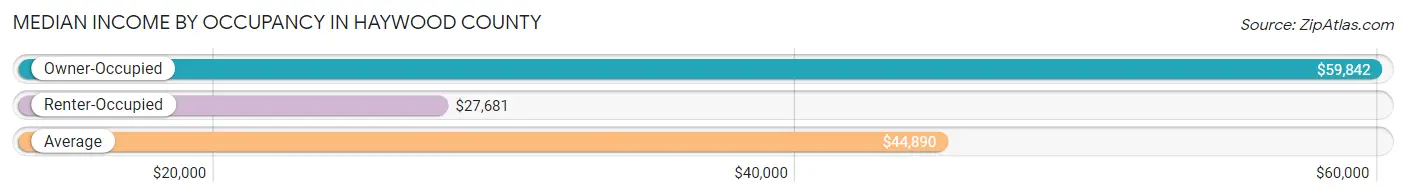
| Occupancy Type | # Households | Median Income |
| Owner-Occupied | 4,182 (58.1%) | $59,842 |
| Renter-Occupied | 3,018 (41.9%) | $27,681 |
| Average | 7,200 (100.0%) | $44,890 |
Occupancy by Householder Income Bracket in Haywood County
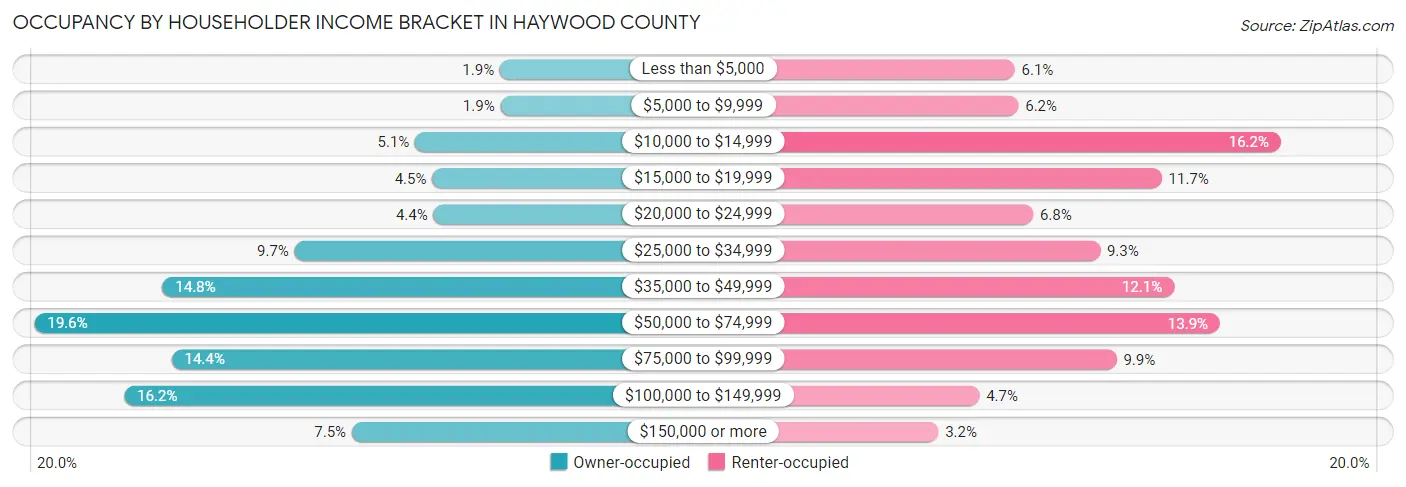
| Income Bracket | Owner-occupied | Renter-occupied |
| Less than $5,000 | 79 (1.9%) | 183 (6.1%) |
| $5,000 to $9,999 | 78 (1.9%) | 187 (6.2%) |
| $10,000 to $14,999 | 214 (5.1%) | 489 (16.2%) |
| $15,000 to $19,999 | 187 (4.5%) | 352 (11.7%) |
| $20,000 to $24,999 | 185 (4.4%) | 204 (6.8%) |
| $25,000 to $34,999 | 406 (9.7%) | 281 (9.3%) |
| $35,000 to $49,999 | 617 (14.7%) | 366 (12.1%) |
| $50,000 to $74,999 | 821 (19.6%) | 419 (13.9%) |
| $75,000 to $99,999 | 602 (14.4%) | 300 (9.9%) |
| $100,000 to $149,999 | 678 (16.2%) | 142 (4.7%) |
| $150,000 or more | 315 (7.5%) | 95 (3.2%) |
| Total | 4,182 (100.0%) | 3,018 (100.0%) |
Monthly Housing Cost Tiers in Haywood County
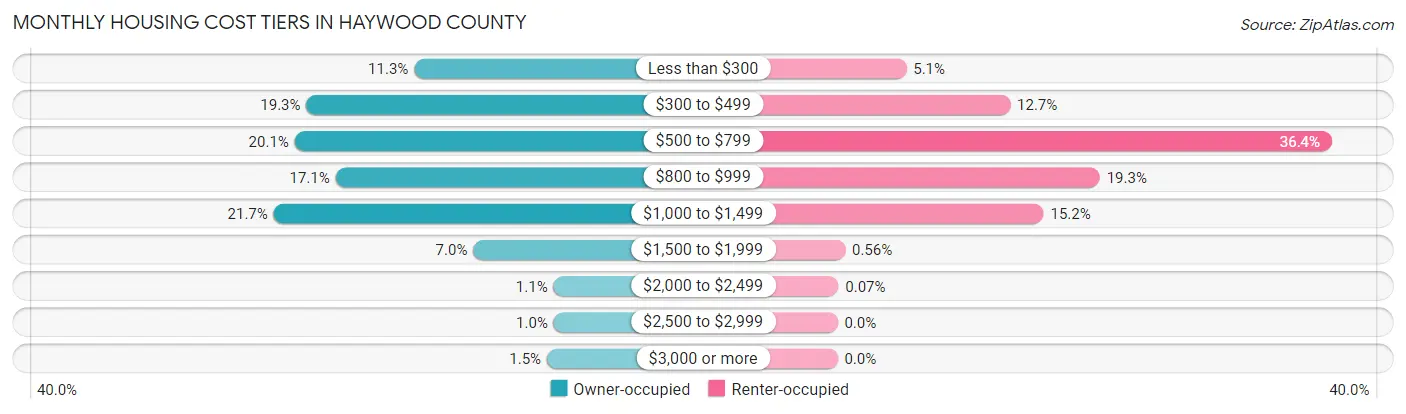
| Monthly Cost | Owner-occupied | Renter-occupied |
| Less than $300 | 473 (11.3%) | 153 (5.1%) |
| $300 to $499 | 805 (19.3%) | 384 (12.7%) |
| $500 to $799 | 841 (20.1%) | 1,099 (36.4%) |
| $800 to $999 | 715 (17.1%) | 583 (19.3%) |
| $1,000 to $1,499 | 906 (21.7%) | 458 (15.2%) |
| $1,500 to $1,999 | 291 (7.0%) | 17 (0.6%) |
| $2,000 to $2,499 | 44 (1.1%) | 2 (0.1%) |
| $2,500 to $2,999 | 43 (1.0%) | 0 (0.0%) |
| $3,000 or more | 64 (1.5%) | 0 (0.0%) |
| Total | 4,182 (100.0%) | 3,018 (100.0%) |
Physical Housing Characteristics in Haywood County
Housing Structures in Haywood County
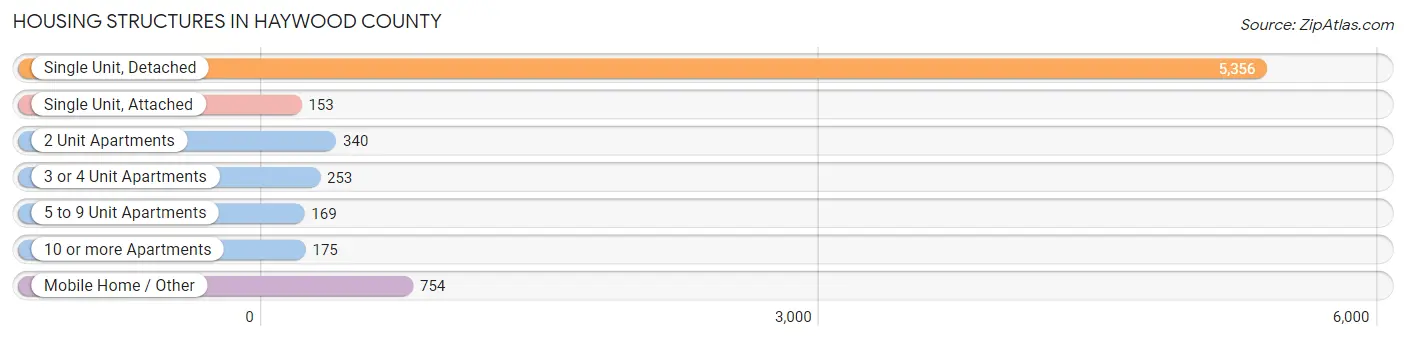
| Structure Type | # Housing Units | % Housing Units |
| Single Unit, Detached | 5,356 | 74.4% |
| Single Unit, Attached | 153 | 2.1% |
| 2 Unit Apartments | 340 | 4.7% |
| 3 or 4 Unit Apartments | 253 | 3.5% |
| 5 to 9 Unit Apartments | 169 | 2.4% |
| 10 or more Apartments | 175 | 2.4% |
| Mobile Home / Other | 754 | 10.5% |
| Total | 7,200 | 100.0% |
Housing Structures by Occupancy in Haywood County
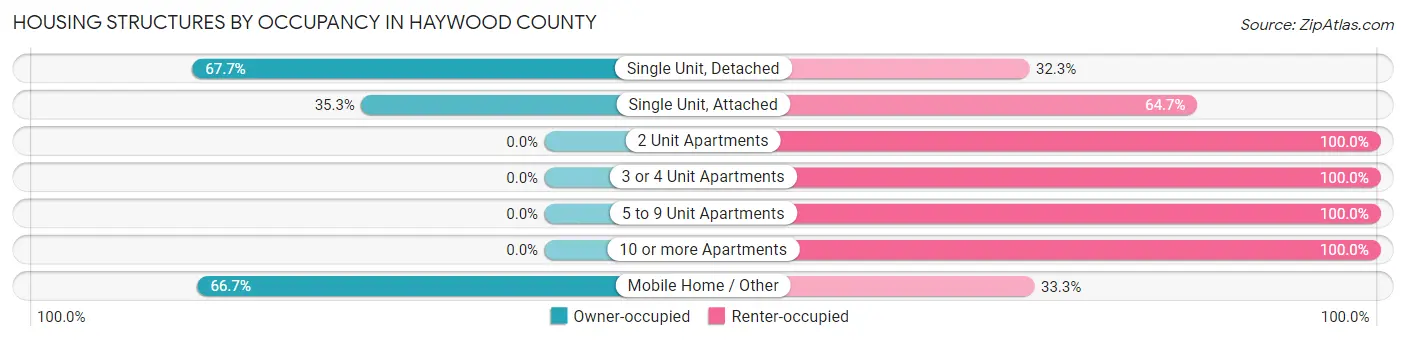
| Structure Type | Owner-occupied | Renter-occupied |
| Single Unit, Detached | 3,625 (67.7%) | 1,731 (32.3%) |
| Single Unit, Attached | 54 (35.3%) | 99 (64.7%) |
| 2 Unit Apartments | 0 (0.0%) | 340 (100.0%) |
| 3 or 4 Unit Apartments | 0 (0.0%) | 253 (100.0%) |
| 5 to 9 Unit Apartments | 0 (0.0%) | 169 (100.0%) |
| 10 or more Apartments | 0 (0.0%) | 175 (100.0%) |
| Mobile Home / Other | 503 (66.7%) | 251 (33.3%) |
| Total | 4,182 (58.1%) | 3,018 (41.9%) |
Housing Structures by Number of Rooms in Haywood County
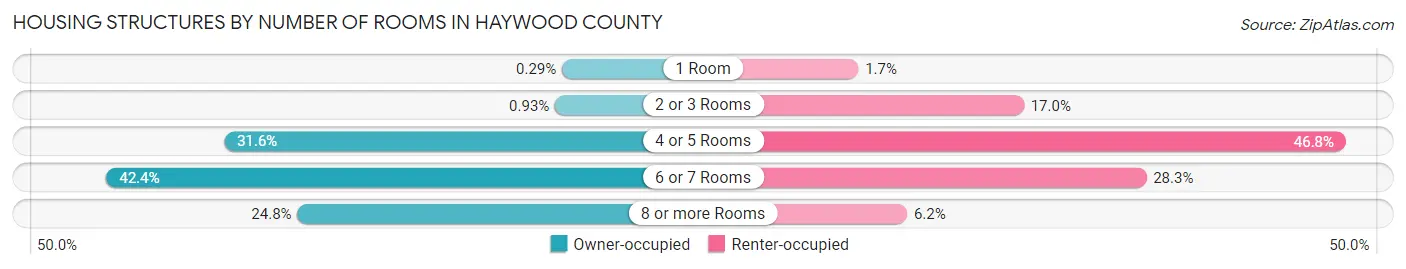
| Number of Rooms | Owner-occupied | Renter-occupied |
| 1 Room | 12 (0.3%) | 51 (1.7%) |
| 2 or 3 Rooms | 39 (0.9%) | 513 (17.0%) |
| 4 or 5 Rooms | 1,320 (31.6%) | 1,412 (46.8%) |
| 6 or 7 Rooms | 1,775 (42.4%) | 855 (28.3%) |
| 8 or more Rooms | 1,036 (24.8%) | 187 (6.2%) |
| Total | 4,182 (100.0%) | 3,018 (100.0%) |
Housing Structure by Heating Type in Haywood County
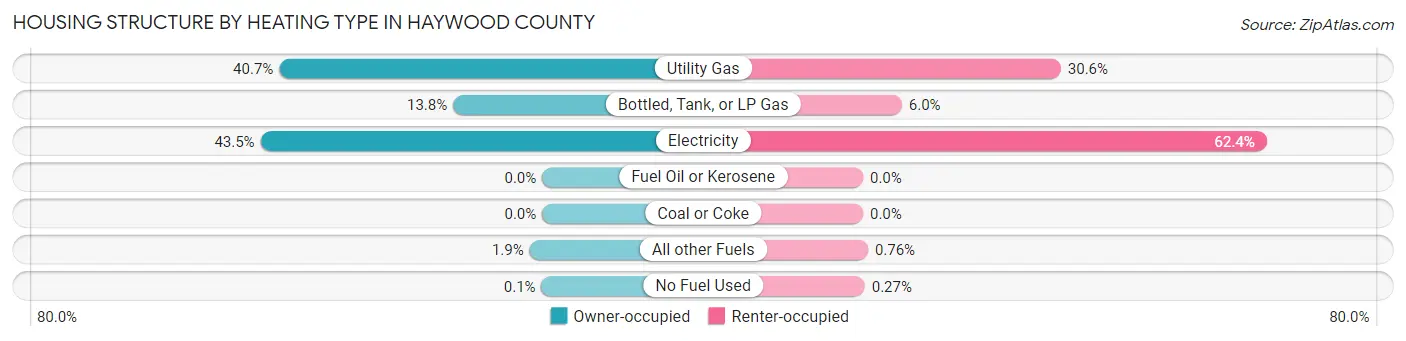
| Heating Type | Owner-occupied | Renter-occupied |
| Utility Gas | 1,700 (40.6%) | 923 (30.6%) |
| Bottled, Tank, or LP Gas | 576 (13.8%) | 181 (6.0%) |
| Electricity | 1,821 (43.5%) | 1,883 (62.4%) |
| Fuel Oil or Kerosene | 0 (0.0%) | 0 (0.0%) |
| Coal or Coke | 0 (0.0%) | 0 (0.0%) |
| All other Fuels | 81 (1.9%) | 23 (0.8%) |
| No Fuel Used | 4 (0.1%) | 8 (0.3%) |
| Total | 4,182 (100.0%) | 3,018 (100.0%) |
Household Vehicle Usage in Haywood County
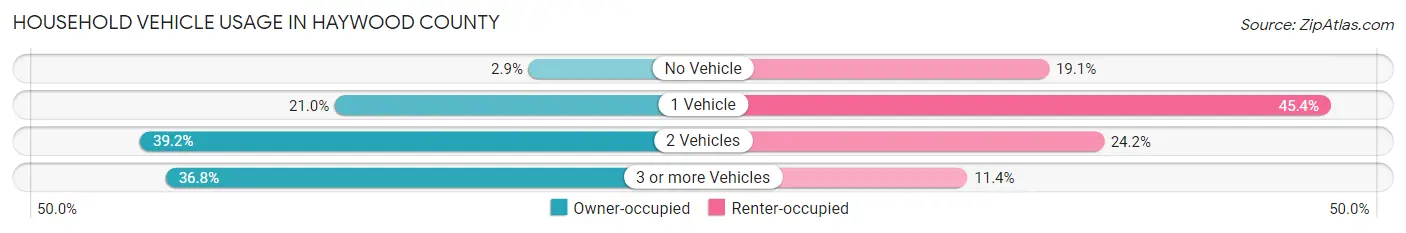
| Vehicles per Household | Owner-occupied | Renter-occupied |
| No Vehicle | 123 (2.9%) | 575 (19.1%) |
| 1 Vehicle | 879 (21.0%) | 1,369 (45.4%) |
| 2 Vehicles | 1,640 (39.2%) | 729 (24.2%) |
| 3 or more Vehicles | 1,540 (36.8%) | 345 (11.4%) |
| Total | 4,182 (100.0%) | 3,018 (100.0%) |
Real Estate & Mortgages in Haywood County
Real Estate and Mortgage Overview in Haywood County
| Characteristic | Without Mortgage | With Mortgage |
| Housing Units | 2,053 | 2,129 |
| Median Property Value | $103,500 | $141,000 |
| Median Household Income | $54,735 | $203 |
| Monthly Housing Costs | $446 | $64 |
| Real Estate Taxes | $748 | $89 |
Property Value by Mortgage Status in Haywood County
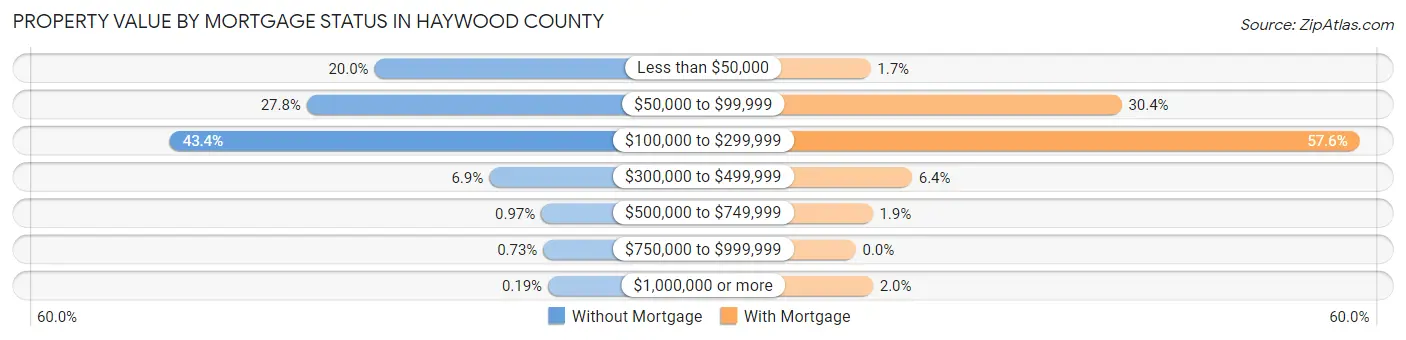
| Property Value | Without Mortgage | With Mortgage |
| Less than $50,000 | 411 (20.0%) | 36 (1.7%) |
| $50,000 to $99,999 | 570 (27.8%) | 647 (30.4%) |
| $100,000 to $299,999 | 891 (43.4%) | 1,226 (57.6%) |
| $300,000 to $499,999 | 142 (6.9%) | 137 (6.4%) |
| $500,000 to $749,999 | 20 (1.0%) | 41 (1.9%) |
| $750,000 to $999,999 | 15 (0.7%) | 0 (0.0%) |
| $1,000,000 or more | 4 (0.2%) | 42 (2.0%) |
| Total | 2,053 (100.0%) | 2,129 (100.0%) |
Household Income by Mortgage Status in Haywood County
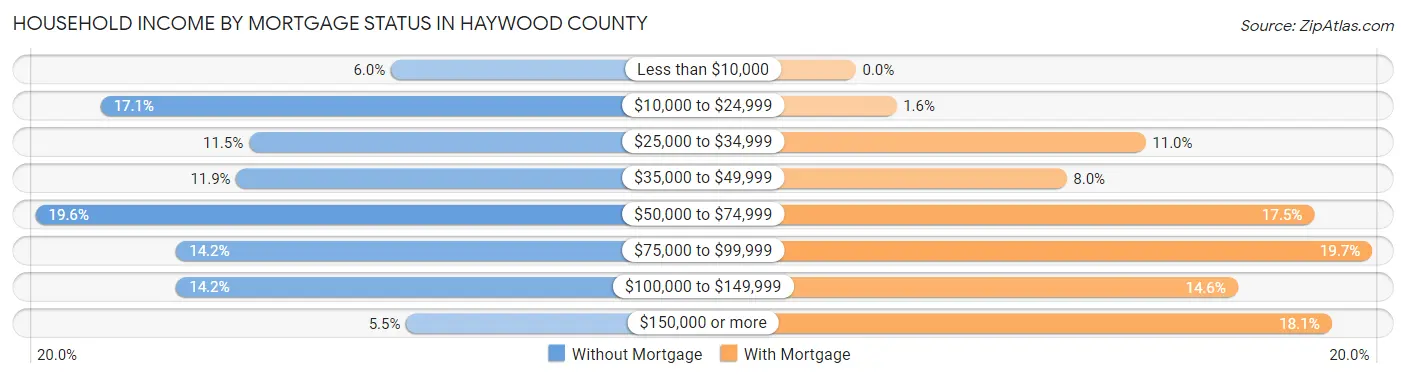
| Household Income | Without Mortgage | With Mortgage |
| Less than $10,000 | 124 (6.0%) | 0 (0.0%) |
| $10,000 to $24,999 | 351 (17.1%) | 33 (1.5%) |
| $25,000 to $34,999 | 235 (11.5%) | 235 (11.0%) |
| $35,000 to $49,999 | 245 (11.9%) | 171 (8.0%) |
| $50,000 to $74,999 | 402 (19.6%) | 372 (17.5%) |
| $75,000 to $99,999 | 292 (14.2%) | 419 (19.7%) |
| $100,000 to $149,999 | 292 (14.2%) | 310 (14.6%) |
| $150,000 or more | 112 (5.5%) | 386 (18.1%) |
| Total | 2,053 (100.0%) | 2,129 (100.0%) |
Property Value to Household Income Ratio in Haywood County
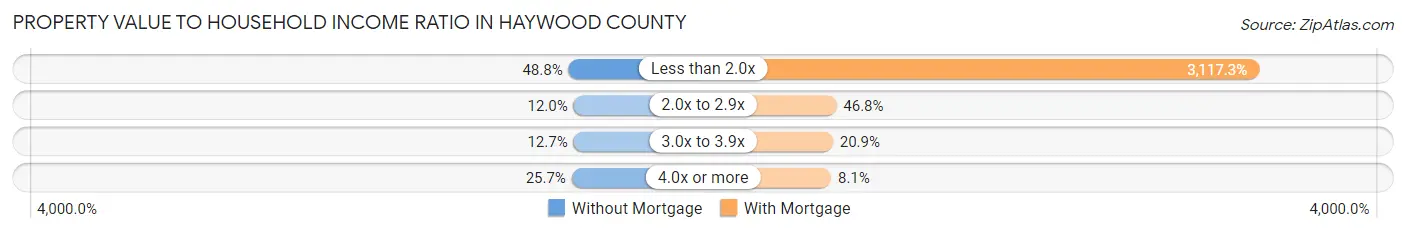
| Value-to-Income Ratio | Without Mortgage | With Mortgage |
| Less than 2.0x | 1,002 (48.8%) | 66,367 (3,117.3%) |
| 2.0x to 2.9x | 246 (12.0%) | 997 (46.8%) |
| 3.0x to 3.9x | 260 (12.7%) | 445 (20.9%) |
| 4.0x or more | 528 (25.7%) | 173 (8.1%) |
| Total | 2,053 (100.0%) | 2,129 (100.0%) |
Real Estate Taxes by Mortgage Status in Haywood County
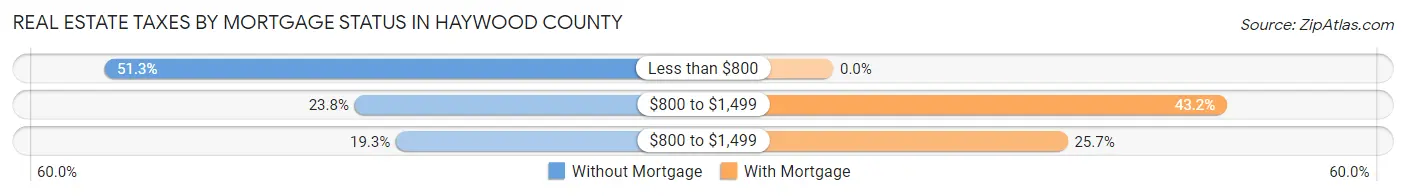
| Property Taxes | Without Mortgage | With Mortgage |
| Less than $800 | 1,053 (51.3%) | 0 (0.0%) |
| $800 to $1,499 | 489 (23.8%) | 919 (43.2%) |
| $800 to $1,499 | 396 (19.3%) | 547 (25.7%) |
| Total | 2,053 (100.0%) | 2,129 (100.0%) |
Health & Disability in Haywood County
Health Insurance Coverage by Age in Haywood County
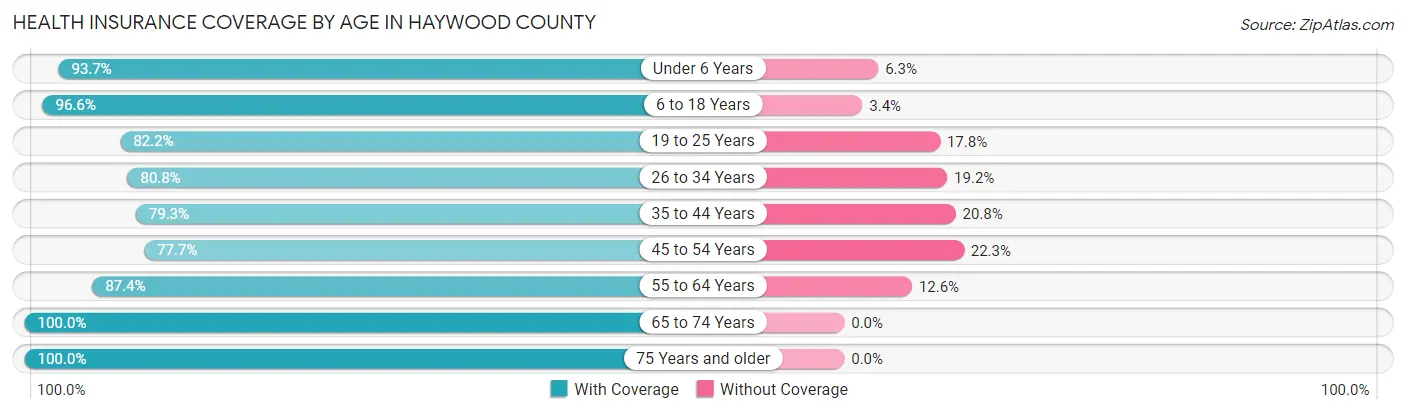
| Age Bracket | With Coverage | Without Coverage |
| Under 6 Years | 1,038 (93.7%) | 70 (6.3%) |
| 6 to 18 Years | 2,901 (96.6%) | 101 (3.4%) |
| 19 to 25 Years | 1,105 (82.2%) | 240 (17.8%) |
| 26 to 34 Years | 1,492 (80.8%) | 354 (19.2%) |
| 35 to 44 Years | 1,673 (79.2%) | 438 (20.7%) |
| 45 to 54 Years | 1,643 (77.7%) | 471 (22.3%) |
| 55 to 64 Years | 2,326 (87.4%) | 336 (12.6%) |
| 65 to 74 Years | 2,126 (100.0%) | 0 (0.0%) |
| 75 Years and older | 1,288 (100.0%) | 0 (0.0%) |
| Total | 15,592 (88.6%) | 2,010 (11.4%) |
Health Insurance Coverage by Citizenship Status in Haywood County
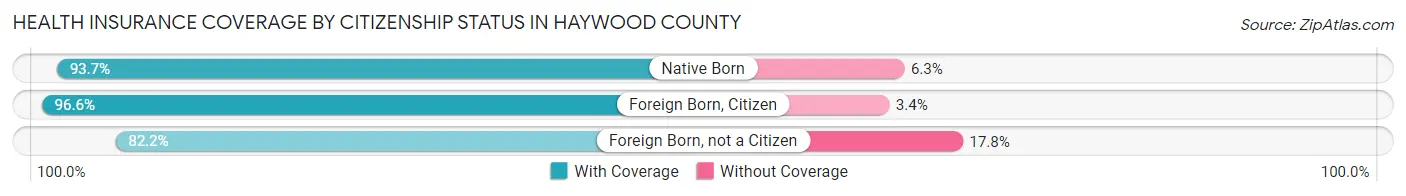
| Citizenship Status | With Coverage | Without Coverage |
| Native Born | 1,038 (93.7%) | 70 (6.3%) |
| Foreign Born, Citizen | 2,901 (96.6%) | 101 (3.4%) |
| Foreign Born, not a Citizen | 1,105 (82.2%) | 240 (17.8%) |
Health Insurance Coverage by Household Income in Haywood County
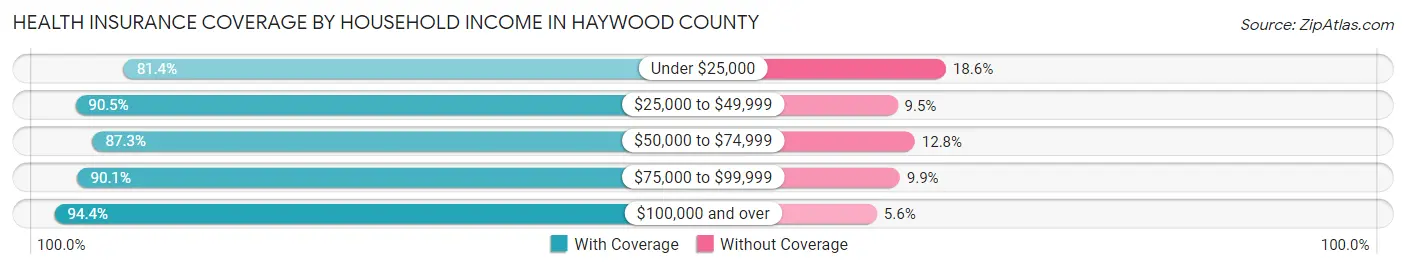
| Household Income | With Coverage | Without Coverage |
| Under $25,000 | 3,255 (81.4%) | 743 (18.6%) |
| $25,000 to $49,999 | 3,279 (90.5%) | 345 (9.5%) |
| $50,000 to $74,999 | 2,916 (87.3%) | 426 (12.8%) |
| $75,000 to $99,999 | 2,547 (90.1%) | 281 (9.9%) |
| $100,000 and over | 3,595 (94.4%) | 215 (5.6%) |
Public vs Private Health Insurance Coverage by Age in Haywood County
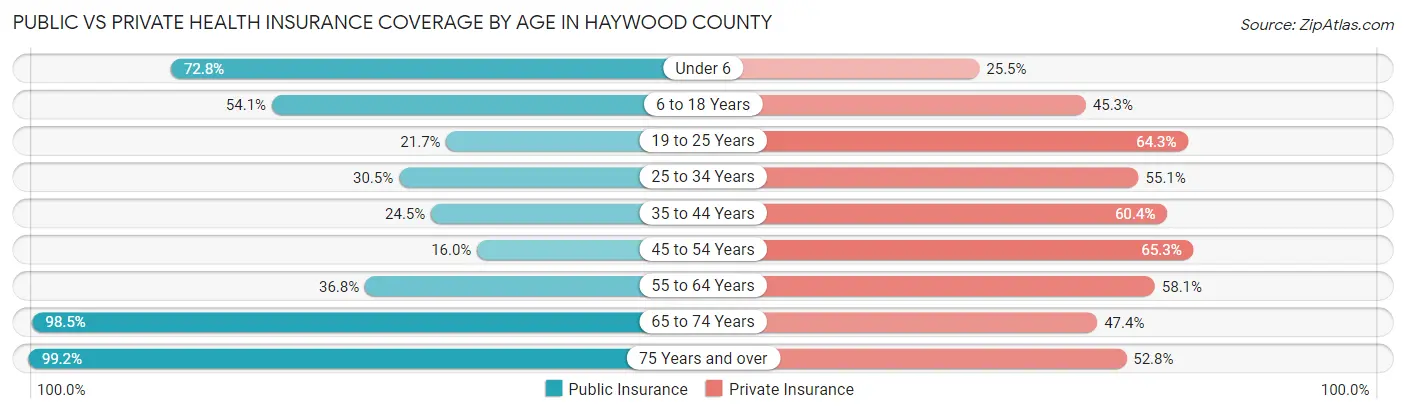
| Age Bracket | Public Insurance | Private Insurance |
| Under 6 | 807 (72.8%) | 283 (25.5%) |
| 6 to 18 Years | 1,624 (54.1%) | 1,360 (45.3%) |
| 19 to 25 Years | 292 (21.7%) | 865 (64.3%) |
| 25 to 34 Years | 563 (30.5%) | 1,017 (55.1%) |
| 35 to 44 Years | 518 (24.5%) | 1,275 (60.4%) |
| 45 to 54 Years | 338 (16.0%) | 1,380 (65.3%) |
| 55 to 64 Years | 980 (36.8%) | 1,547 (58.1%) |
| 65 to 74 Years | 2,095 (98.5%) | 1,008 (47.4%) |
| 75 Years and over | 1,278 (99.2%) | 680 (52.8%) |
| Total | 8,495 (48.3%) | 9,415 (53.5%) |
Disability Status by Sex by Age in Haywood County
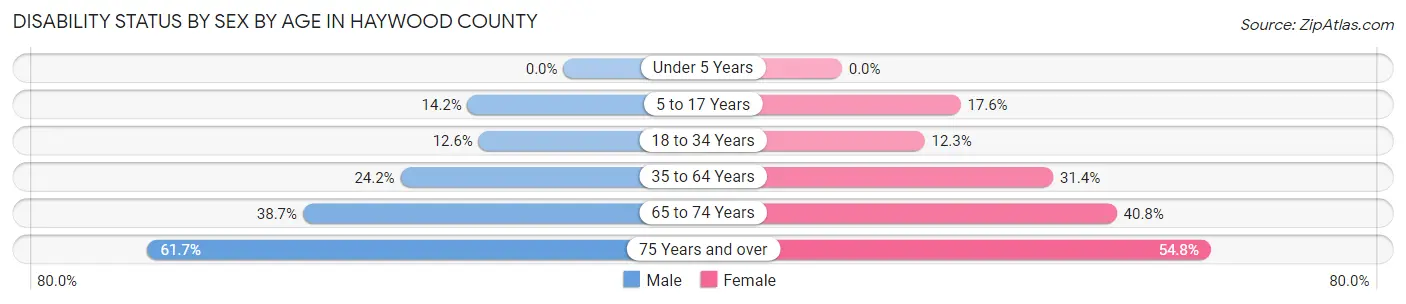
| Age Bracket | Male | Female |
| Under 5 Years | 0 (0.0%) | 0 (0.0%) |
| 5 to 17 Years | 218 (14.2%) | 255 (17.6%) |
| 18 to 34 Years | 202 (12.6%) | 218 (12.3%) |
| 35 to 64 Years | 780 (24.2%) | 1,149 (31.4%) |
| 65 to 74 Years | 376 (38.7%) | 471 (40.8%) |
| 75 Years and over | 305 (61.7%) | 435 (54.8%) |
Disability Class by Sex by Age in Haywood County
Disability Class: Hearing Difficulty
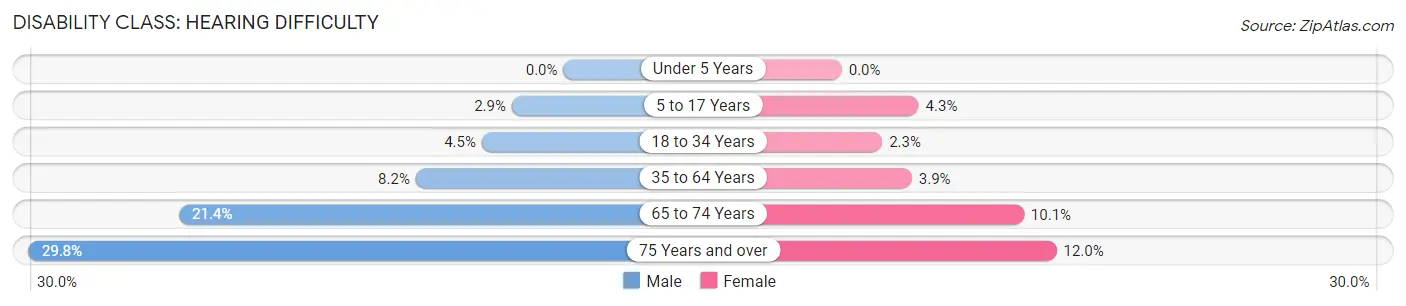
| Age Bracket | Male | Female |
| Under 5 Years | 0 (0.0%) | 0 (0.0%) |
| 5 to 17 Years | 44 (2.9%) | 62 (4.3%) |
| 18 to 34 Years | 73 (4.5%) | 40 (2.2%) |
| 35 to 64 Years | 265 (8.2%) | 143 (3.9%) |
| 65 to 74 Years | 208 (21.4%) | 117 (10.1%) |
| 75 Years and over | 147 (29.8%) | 95 (12.0%) |
Disability Class: Vision Difficulty
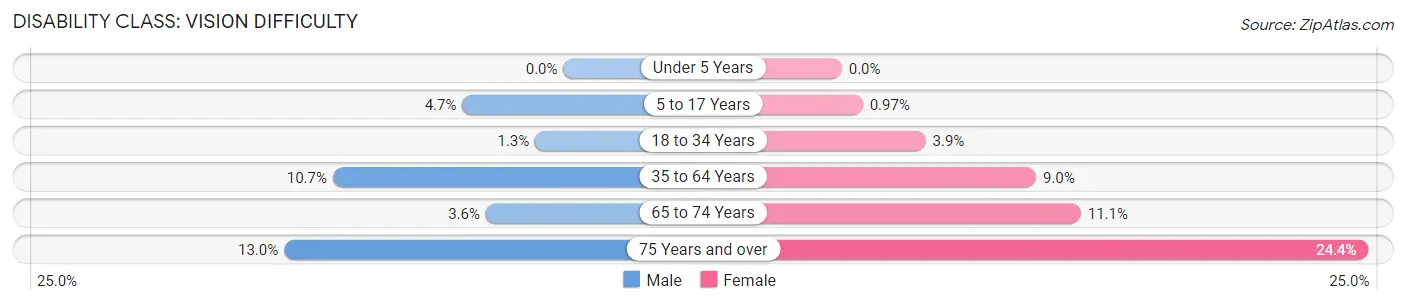
| Age Bracket | Male | Female |
| Under 5 Years | 0 (0.0%) | 0 (0.0%) |
| 5 to 17 Years | 72 (4.7%) | 14 (1.0%) |
| 18 to 34 Years | 21 (1.3%) | 69 (3.9%) |
| 35 to 64 Years | 345 (10.7%) | 330 (9.0%) |
| 65 to 74 Years | 35 (3.6%) | 128 (11.1%) |
| 75 Years and over | 64 (13.0%) | 194 (24.4%) |
Disability Class: Cognitive Difficulty
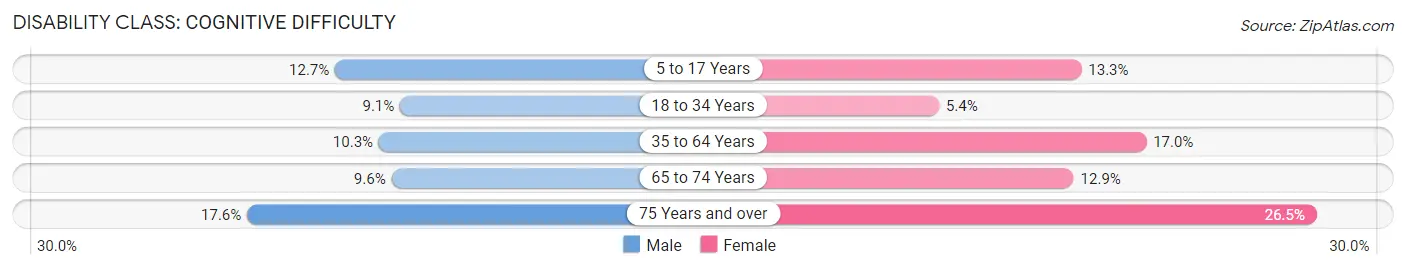
| Age Bracket | Male | Female |
| 5 to 17 Years | 195 (12.7%) | 193 (13.3%) |
| 18 to 34 Years | 146 (9.1%) | 96 (5.4%) |
| 35 to 64 Years | 331 (10.3%) | 621 (17.0%) |
| 65 to 74 Years | 93 (9.6%) | 149 (12.9%) |
| 75 Years and over | 87 (17.6%) | 210 (26.5%) |
Disability Class: Ambulatory Difficulty
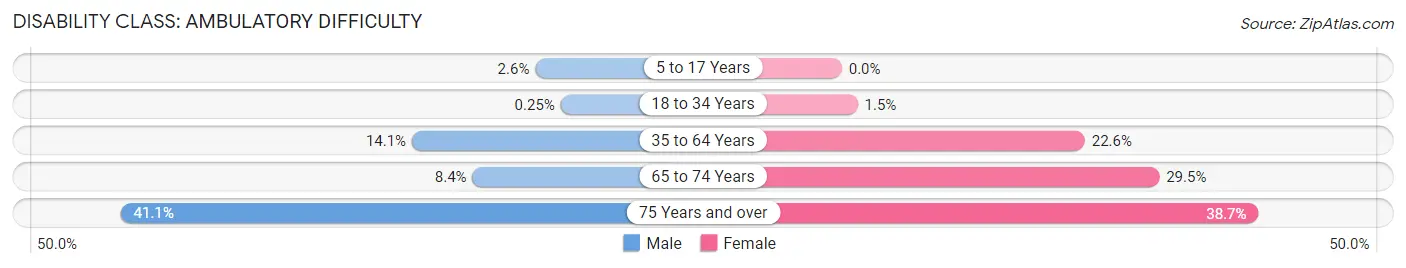
| Age Bracket | Male | Female |
| 5 to 17 Years | 40 (2.6%) | 0 (0.0%) |
| 18 to 34 Years | 4 (0.3%) | 26 (1.5%) |
| 35 to 64 Years | 453 (14.1%) | 826 (22.6%) |
| 65 to 74 Years | 82 (8.4%) | 340 (29.5%) |
| 75 Years and over | 203 (41.1%) | 307 (38.7%) |
Disability Class: Self-Care Difficulty
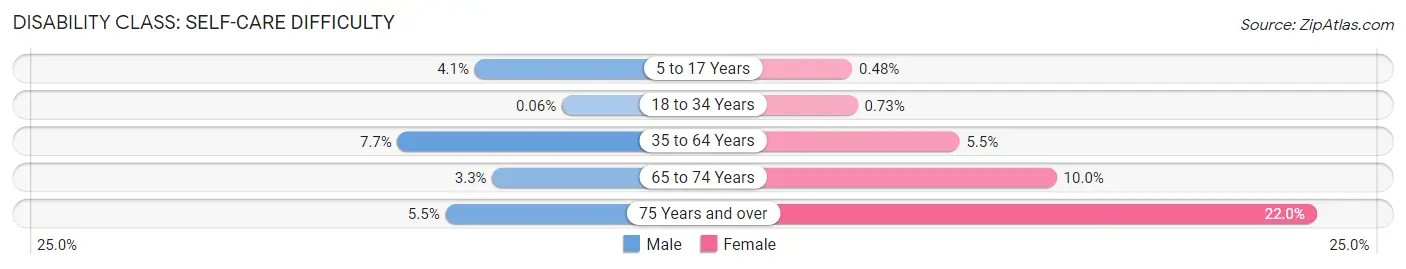
| Age Bracket | Male | Female |
| 5 to 17 Years | 63 (4.1%) | 7 (0.5%) |
| 18 to 34 Years | 1 (0.1%) | 13 (0.7%) |
| 35 to 64 Years | 248 (7.7%) | 200 (5.5%) |
| 65 to 74 Years | 32 (3.3%) | 115 (10.0%) |
| 75 Years and over | 27 (5.5%) | 175 (22.0%) |
Technology Access in Haywood County
Computing Device Access in Haywood County

| Device Type | # Households | % Households |
| Desktop or Laptop | 3,935 | 54.6% |
| Smartphone | 5,755 | 79.9% |
| Tablet | 3,333 | 46.3% |
| No Computing Device | 937 | 13.0% |
| Total | 7,200 | 100.0% |
Internet Access in Haywood County
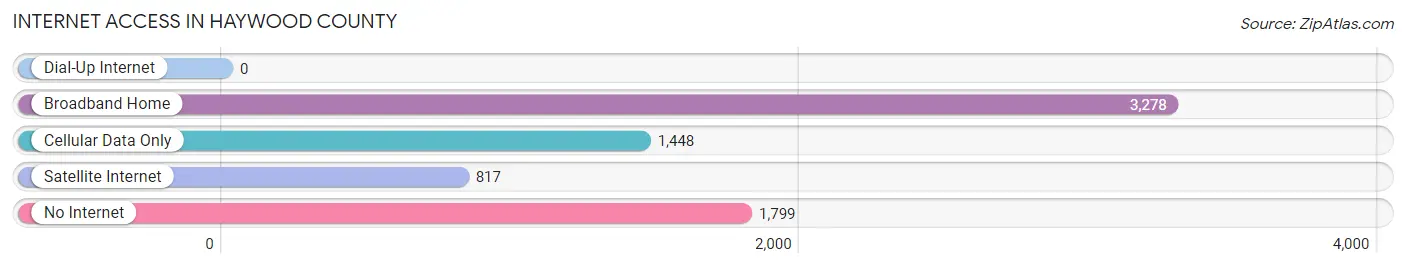
| Internet Type | # Households | % Households |
| Dial-Up Internet | 0 | 0.0% |
| Broadband Home | 3,278 | 45.5% |
| Cellular Data Only | 1,448 | 20.1% |
| Satellite Internet | 817 | 11.4% |
| No Internet | 1,799 | 25.0% |
| Total | 7,200 | 100.0% |
Haywood County Summary
Haywood County is located in the western part of Tennessee, in the United States. It is bordered by Madison County to the north, Hardeman County to the east, Fayette County to the south, and Lauderdale County to the west. The county seat is Brownsville. The county was established in 1823 and named for John Haywood, who was the state treasurer of Tennessee from 1826 to 1841.
Geography
Haywood County covers an area of 545 square miles and is located in the Central Basin of West Tennessee. The terrain is mostly flat, with some rolling hills in the northern part of the county. The county is drained by the Hatchie River, which flows through the center of the county. The county is also home to several small lakes, including Reelfoot Lake, which is located in the northern part of the county.
The climate of Haywood County is humid subtropical, with hot summers and mild winters. The average annual temperature is around 64°F, and the average annual precipitation is around 45 inches.
Demographics
As of the 2010 census, Haywood County had a population of 18,787. The racial makeup of the county was 79.2% White, 18.2% African American, 0.4% Native American, 0.3% Asian, 0.1% Pacific Islander, 0.7% from other races, and 1.1% from two or more races. Hispanic or Latino of any race were 1.9% of the population.
The median income for a household in the county was $33,945, and the median income for a family was $41,945. The per capita income for the county was $17,845. About 19.2% of the population was below the poverty line.
Economy
The economy of Haywood County is largely based on agriculture. The county is home to several large farms, which produce a variety of crops, including cotton, soybeans, corn, and wheat. The county is also home to several large poultry farms, which produce eggs and poultry products.
In addition to agriculture, Haywood County is home to several manufacturing companies, including a furniture factory, a plastics factory, and a paper mill. The county is also home to several retail stores, restaurants, and other businesses.
The county is served by the Brownsville-Haywood County Airport, which provides air service to the area. The county is also served by several major highways, including Interstate 40, which runs through the county.
Conclusion
Haywood County is a rural county located in the western part of Tennessee. The county is home to a diverse population and a strong agricultural economy. The county is served by several major highways and the Brownsville-Haywood County Airport, which provides air service to the area. The county is also home to several manufacturing companies, retail stores, restaurants, and other businesses.
Common Questions
What is the Total Population of Haywood County?
Total Population of Haywood County is 17,806.
What is the Total Male Population of Haywood County?
Total Male Population of Haywood County is 8,445.
What is the Total Female Population of Haywood County?
Total Female Population of Haywood County is 9,361.
What is the Ratio of Males per 100 Females in Haywood County?
There are 90.21 Males per 100 Females in Haywood County.
What is the Ratio of Females per 100 Males in Haywood County?
There are 110.85 Females per 100 Males in Haywood County.
What is the Median Population Age in Haywood County?
Median Population Age in Haywood County is 43.1 Years.
What is the Average Family Size in Haywood County
Average Family Size in Haywood County is 3.1 People.
What is the Average Household Size in Haywood County
Average Household Size in Haywood County is 2.4 People.
What is Per Capita Income in Haywood County?
Per Capita income in Haywood County is $26,031.
What is the Median Family Income in Haywood County?
Median Family Income in Haywood County is $59,469.
What is the Median Household income in Haywood County?
Median Household Income in Haywood County is $44,890.
What is Income or Wage Gap in Haywood County?
Income or Wage Gap in Haywood County is 30.8%.
Women in Haywood County earn 69.2 cents for every dollar earned by a man.
What is Family Income Deficit in Haywood County?
Family Income Deficit in Haywood County is $9,333.
Families that are below poverty line in Haywood County earn $9,333 less on average than the poverty threshold level.
What is Inequality or Gini Index in Haywood County?
Inequality or Gini Index in Haywood County is 0.47.
How Large is the Labor Force in Haywood County?
There are 7,947 People in the Labor Forcein in Haywood County.
What is the Percentage of People in the Labor Force in Haywood County?
55.2% of People are in the Labor Force in Haywood County.
What is the Unemployment Rate in Haywood County?
Unemployment Rate in Haywood County is 8.5%.