Hawkins County, TN
Hawkins County Map

Hawkins County Overview
57,107
TOTAL POPULATION
28,159
MALE POPULATION
28,948
FEMALE POPULATION
97.27
MALES / 100 FEMALES
102.80
FEMALES / 100 MALES
45.5
MEDIAN AGE
3.0
AVG FAMILY SIZE
2.5
AVG HOUSEHOLD SIZE
$28,648
PER CAPITA INCOME
$64,529
AVG FAMILY INCOME
$53,647
AVG HOUSEHOLD INCOME
33.0%
WAGE / INCOME GAP [ % ]
67.0¢/ $1
WAGE / INCOME GAP [ $ ]
$10,923
FAMILY INCOME DEFICIT
0.46
INEQUALITY / GINI INDEX
24,022
LABOR FORCE [ PEOPLE ]
50.5%
PERCENT IN LABOR FORCE
8.6%
UNEMPLOYMENT RATE
Hawkins County Area Codes
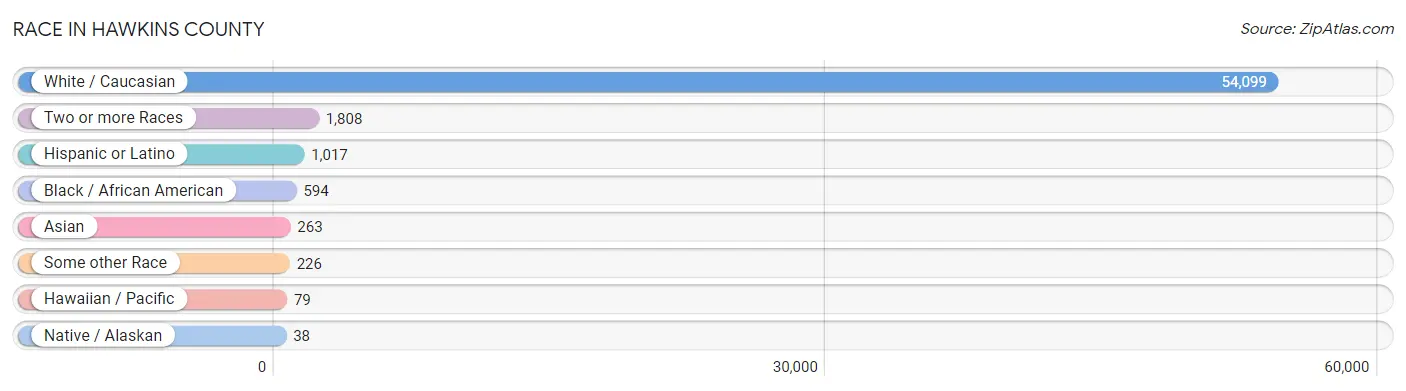
Race in Hawkins County
The most populous races in Hawkins County are White / Caucasian (54,099 | 94.7%), Two or more Races (1,808 | 3.2%), and Hispanic or Latino (1,017 | 1.8%).
| Race | # Population | % Population |
| Asian | 263 | 0.5% |
| Black / African American | 594 | 1.0% |
| Hawaiian / Pacific | 79 | 0.1% |
| Hispanic or Latino | 1,017 | 1.8% |
| Native / Alaskan | 38 | 0.1% |
| White / Caucasian | 54,099 | 94.7% |
| Two or more Races | 1,808 | 3.2% |
| Some other Race | 226 | 0.4% |
| Total | 57,107 | 100.0% |
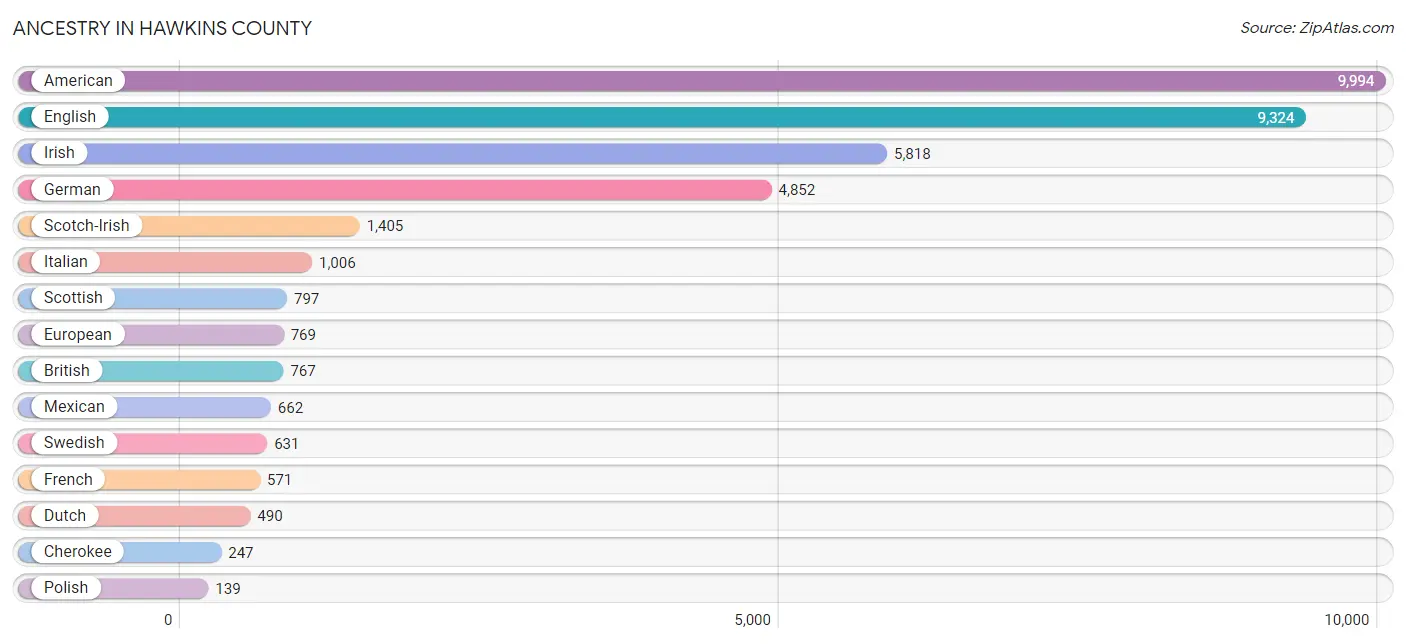
Ancestry in Hawkins County
The most populous ancestries reported in Hawkins County are American (9,994 | 17.5%), English (9,324 | 16.3%), Irish (5,818 | 10.2%), German (4,852 | 8.5%), and Scotch-Irish (1,405 | 2.5%), together accounting for 55.0% of all Hawkins County residents.
| Ancestry | # Population | % Population |
| African | 19 | 0.0% |
| American | 9,994 | 17.5% |
| Apache | 16 | 0.0% |
| Arab | 7 | 0.0% |
| Armenian | 3 | 0.0% |
| Austrian | 67 | 0.1% |
| Belgian | 10 | 0.0% |
| Bhutanese | 27 | 0.1% |
| British | 767 | 1.3% |
| Burmese | 122 | 0.2% |
| Canadian | 48 | 0.1% |
| Central American | 46 | 0.1% |
| Cherokee | 247 | 0.4% |
| Choctaw | 8 | 0.0% |
| Cuban | 39 | 0.1% |
| Czech | 35 | 0.1% |
| Danish | 18 | 0.0% |
| Dutch | 490 | 0.9% |
| Eastern European | 100 | 0.2% |
| English | 9,324 | 16.3% |
| Estonian | 5 | 0.0% |
| European | 769 | 1.3% |
| Finnish | 2 | 0.0% |
| French | 571 | 1.0% |
| French Canadian | 24 | 0.0% |
| German | 4,852 | 8.5% |
| Greek | 63 | 0.1% |
| Guatemalan | 28 | 0.1% |
| Guyanese | 9 | 0.0% |
| Honduran | 2 | 0.0% |
| Hungarian | 48 | 0.1% |
| Indian (Asian) | 98 | 0.2% |
| Irish | 5,818 | 10.2% |
| Iroquois | 4 | 0.0% |
| Italian | 1,006 | 1.8% |
| Kiowa | 11 | 0.0% |
| Korean | 8 | 0.0% |
| Lebanese | 7 | 0.0% |
| Luxembourger | 8 | 0.0% |
| Mexican | 662 | 1.2% |
| Navajo | 4 | 0.0% |
| Northern European | 16 | 0.0% |
| Norwegian | 111 | 0.2% |
| Pakistani | 38 | 0.1% |
| Pennsylvania German | 17 | 0.0% |
| Polish | 139 | 0.2% |
| Portuguese | 5 | 0.0% |
| Puerto Rican | 105 | 0.2% |
| Romanian | 82 | 0.1% |
| Russian | 70 | 0.1% |
| Salvadoran | 16 | 0.0% |
| Scandinavian | 47 | 0.1% |
| Scotch-Irish | 1,405 | 2.5% |
| Scottish | 797 | 1.4% |
| Sioux | 12 | 0.0% |
| Spaniard | 11 | 0.0% |
| Spanish | 53 | 0.1% |
| Subsaharan African | 36 | 0.1% |
| Swedish | 631 | 1.1% |
| Swiss | 2 | 0.0% |
| Thai | 49 | 0.1% |
| Vietnamese | 37 | 0.1% |
| Welsh | 68 | 0.1% |
| West Indian | 5 | 0.0% |
| Yugoslavian | 19 | 0.0% | View All 65 Rows |
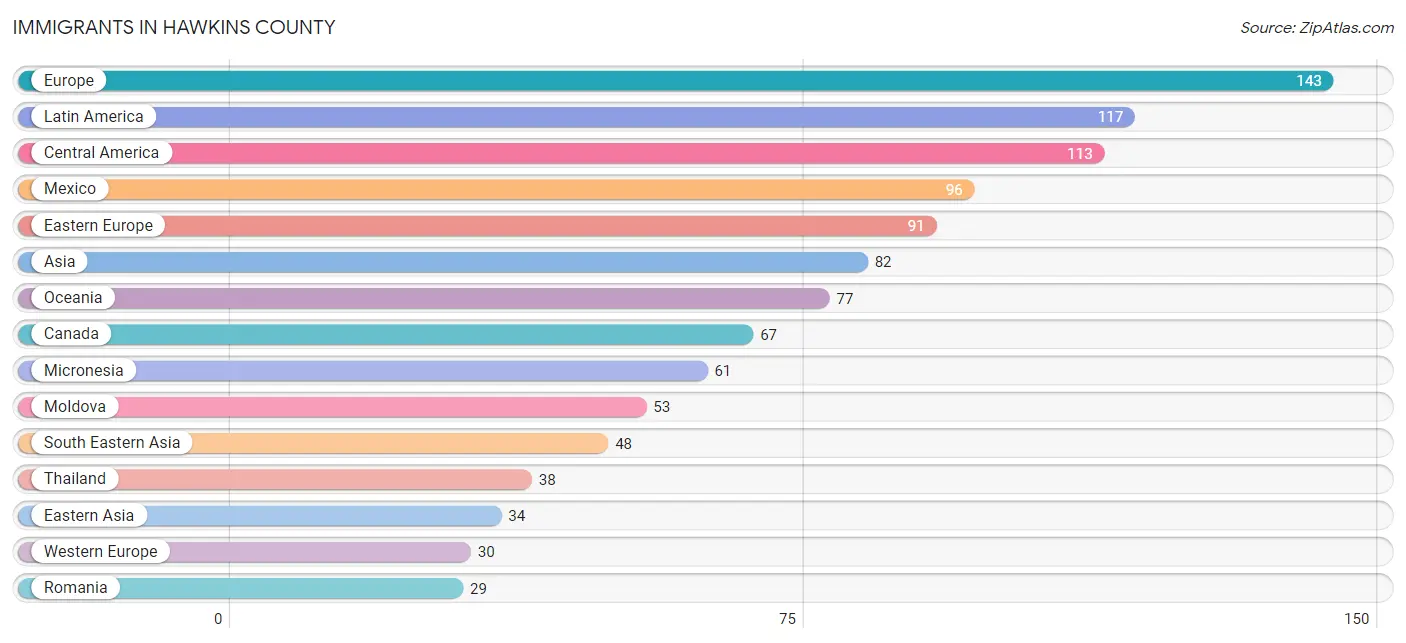
Immigrants in Hawkins County
The most numerous immigrant groups reported in Hawkins County came from Europe (143 | 0.3%), Latin America (117 | 0.2%), Central America (113 | 0.2%), Mexico (96 | 0.2%), and Eastern Europe (91 | 0.2%), together accounting for 1.0% of all Hawkins County residents.
| Immigration Origin | # Population | % Population |
| Africa | 10 | 0.0% |
| Asia | 82 | 0.1% |
| Austria | 20 | 0.0% |
| Canada | 67 | 0.1% |
| Central America | 113 | 0.2% |
| Eastern Asia | 34 | 0.1% |
| Eastern Europe | 91 | 0.2% |
| El Salvador | 17 | 0.0% |
| England | 13 | 0.0% |
| Europe | 143 | 0.3% |
| Germany | 10 | 0.0% |
| Guyana | 4 | 0.0% |
| Japan | 18 | 0.0% |
| Korea | 16 | 0.0% |
| Latin America | 117 | 0.2% |
| Mexico | 96 | 0.2% |
| Micronesia | 61 | 0.1% |
| Moldova | 53 | 0.1% |
| Northern Africa | 10 | 0.0% |
| Northern Europe | 22 | 0.0% |
| Oceania | 77 | 0.1% |
| Philippines | 10 | 0.0% |
| Poland | 9 | 0.0% |
| Romania | 29 | 0.1% |
| South America | 4 | 0.0% |
| South Eastern Asia | 48 | 0.1% |
| Thailand | 38 | 0.1% |
| Western Europe | 30 | 0.1% | View All 28 Rows |
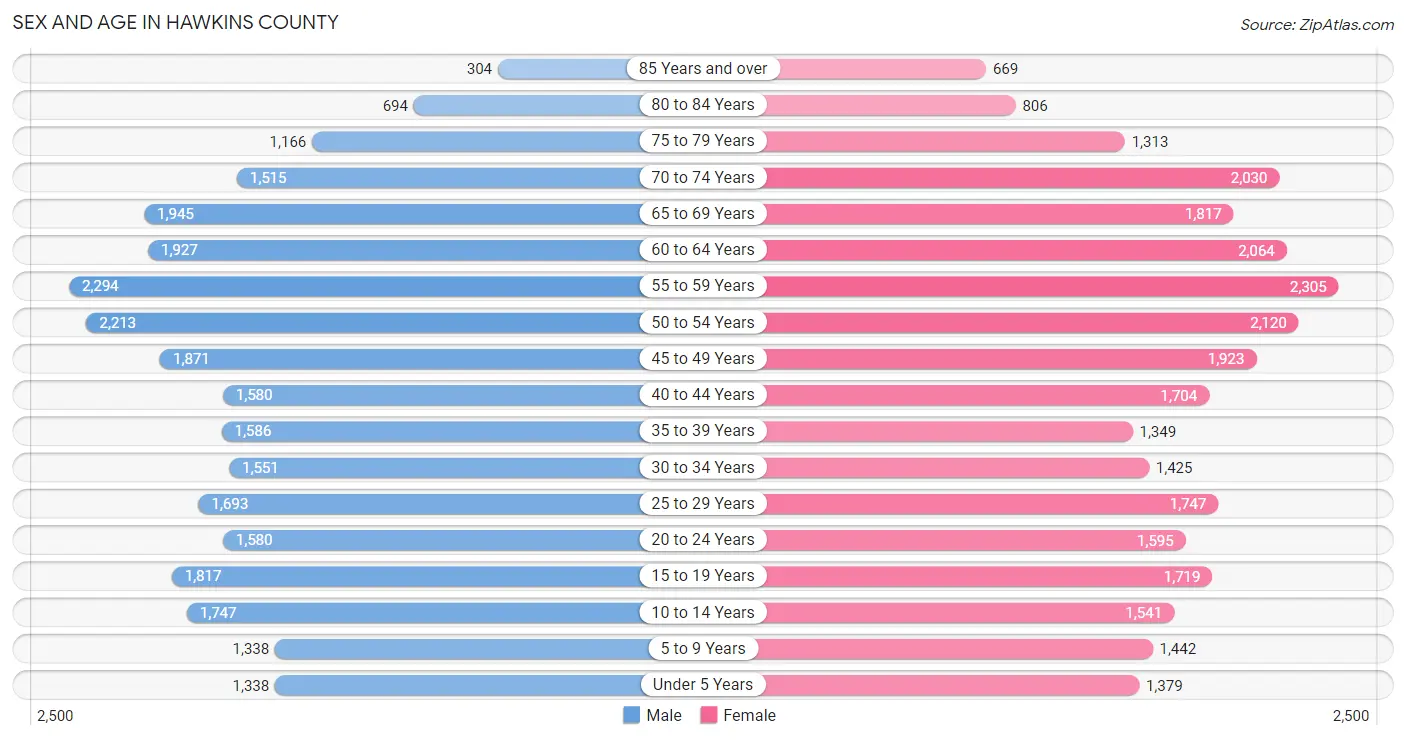
Sex and Age in Hawkins County
Sex and Age in Hawkins County
The most populous age groups in Hawkins County are 55 to 59 Years (2,294 | 8.2%) for men and 55 to 59 Years (2,305 | 8.0%) for women.
| Age Bracket | Male | Female |
| Under 5 Years | 1,338 (4.8%) | 1,379 (4.8%) |
| 5 to 9 Years | 1,338 (4.8%) | 1,442 (5.0%) |
| 10 to 14 Years | 1,747 (6.2%) | 1,541 (5.3%) |
| 15 to 19 Years | 1,817 (6.5%) | 1,719 (5.9%) |
| 20 to 24 Years | 1,580 (5.6%) | 1,595 (5.5%) |
| 25 to 29 Years | 1,693 (6.0%) | 1,747 (6.0%) |
| 30 to 34 Years | 1,551 (5.5%) | 1,425 (4.9%) |
| 35 to 39 Years | 1,586 (5.6%) | 1,349 (4.7%) |
| 40 to 44 Years | 1,580 (5.6%) | 1,704 (5.9%) |
| 45 to 49 Years | 1,871 (6.6%) | 1,923 (6.6%) |
| 50 to 54 Years | 2,213 (7.9%) | 2,120 (7.3%) |
| 55 to 59 Years | 2,294 (8.2%) | 2,305 (8.0%) |
| 60 to 64 Years | 1,927 (6.8%) | 2,064 (7.1%) |
| 65 to 69 Years | 1,945 (6.9%) | 1,817 (6.3%) |
| 70 to 74 Years | 1,515 (5.4%) | 2,030 (7.0%) |
| 75 to 79 Years | 1,166 (4.1%) | 1,313 (4.5%) |
| 80 to 84 Years | 694 (2.5%) | 806 (2.8%) |
| 85 Years and over | 304 (1.1%) | 669 (2.3%) |
| Total | 28,159 (100.0%) | 28,948 (100.0%) |
Families and Households in Hawkins County
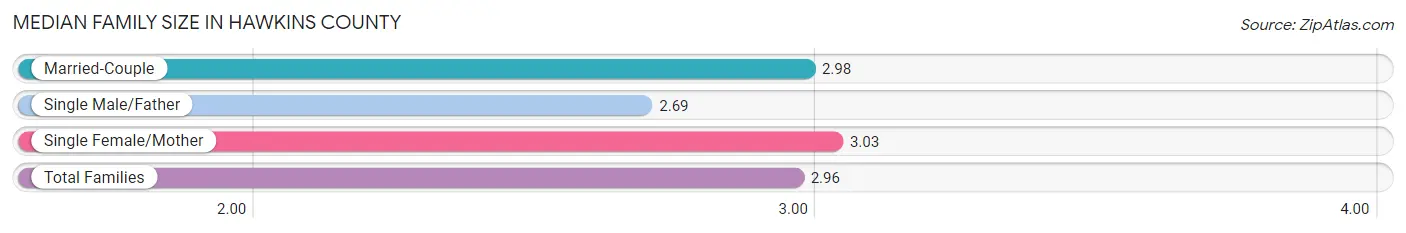
Median Family Size in Hawkins County
The median family size in Hawkins County is 2.96 persons per family, with single female/mother families (2,757 | 17.3%) accounting for the largest median family size of 3.03 persons per family. On the other hand, single male/father families (1,480 | 9.3%) represent the smallest median family size with 2.69 persons per family.
| Family Type | # Families | Family Size |
| Married-Couple | 11,683 (73.4%) | 2.98 |
| Single Male/Father | 1,480 (9.3%) | 2.69 |
| Single Female/Mother | 2,757 (17.3%) | 3.03 |
| Total Families | 15,920 (100.0%) | 2.96 |
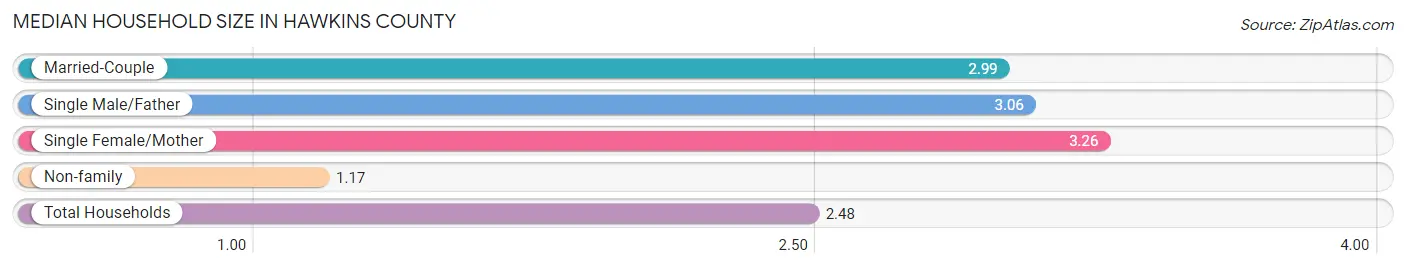
Median Household Size in Hawkins County
The median household size in Hawkins County is 2.48 persons per household, with single female/mother households (2,757 | 12.1%) accounting for the largest median household size of 3.26 persons per household. non-family households (6,865 | 30.1%) represent the smallest median household size with 1.17 persons per household.
| Household Type | # Households | Household Size |
| Married-Couple | 11,683 (51.3%) | 2.99 |
| Single Male/Father | 1,480 (6.5%) | 3.06 |
| Single Female/Mother | 2,757 (12.1%) | 3.26 |
| Non-family | 6,865 (30.1%) | 1.17 |
| Total Households | 22,785 (100.0%) | 2.48 |
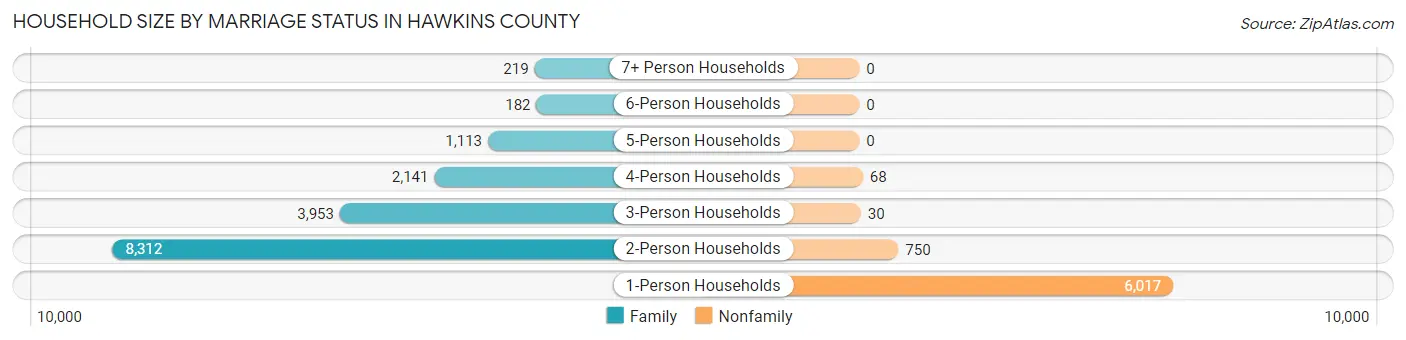
Household Size by Marriage Status in Hawkins County
Out of a total of 22,785 households in Hawkins County, 15,920 (69.9%) are family households, while 6,865 (30.1%) are nonfamily households. The most numerous type of family households are 2-person households, comprising 8,312, and the most common type of nonfamily households are 1-person households, comprising 6,017.
| Household Size | Family Households | Nonfamily Households |
| 1-Person Households | - | 6,017 (26.4%) |
| 2-Person Households | 8,312 (36.5%) | 750 (3.3%) |
| 3-Person Households | 3,953 (17.3%) | 30 (0.1%) |
| 4-Person Households | 2,141 (9.4%) | 68 (0.3%) |
| 5-Person Households | 1,113 (4.9%) | 0 (0.0%) |
| 6-Person Households | 182 (0.8%) | 0 (0.0%) |
| 7+ Person Households | 219 (1.0%) | 0 (0.0%) |
| Total | 15,920 (69.9%) | 6,865 (30.1%) |
Female Fertility in Hawkins County
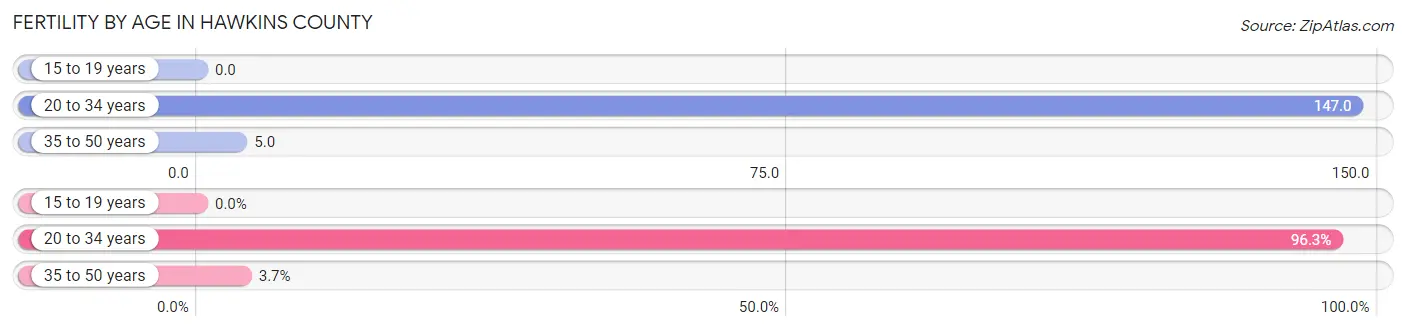
Fertility by Age in Hawkins County
Average fertility rate in Hawkins County is 61.0 births per 1,000 women. Women in the age bracket of 20 to 34 years have the highest fertility rate with 147.0 births per 1,000 women. Women in the age bracket of 20 to 34 years acount for 96.3% of all women with births.
| Age Bracket | Women with Births | Births / 1,000 Women |
| 15 to 19 years | 0 (0.0%) | 0.0 |
| 20 to 34 years | 700 (96.3%) | 147.0 |
| 35 to 50 years | 27 (3.7%) | 5.0 |
| Total | 727 (100.0%) | 61.0 |
Fertility by Age by Marriage Status in Hawkins County
70.8% of women with births (727) in Hawkins County are married. The highest percentage of unmarried women with births falls into 20 to 34 years age bracket with 30.3% of them unmarried at the time of birth, while the lowest percentage of unmarried women with births belong to 35 to 50 years age bracket with 0.0% of them unmarried.
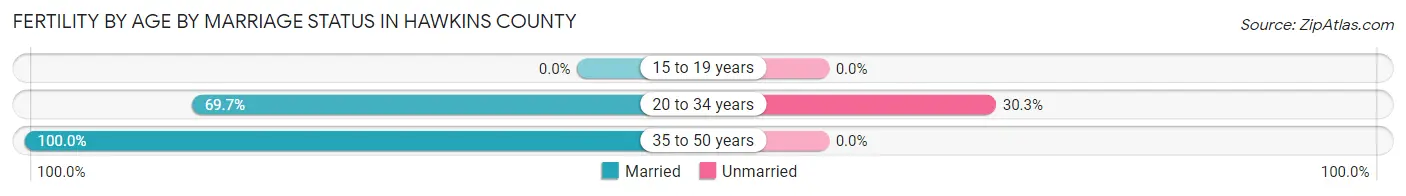
| Age Bracket | Married | Unmarried |
| 15 to 19 years | 0 (0.0%) | 0 (0.0%) |
| 20 to 34 years | 488 (69.7%) | 212 (30.3%) |
| 35 to 50 years | 27 (100.0%) | 0 (0.0%) |
| Total | 515 (70.8%) | 212 (29.2%) |
Fertility by Education in Hawkins County
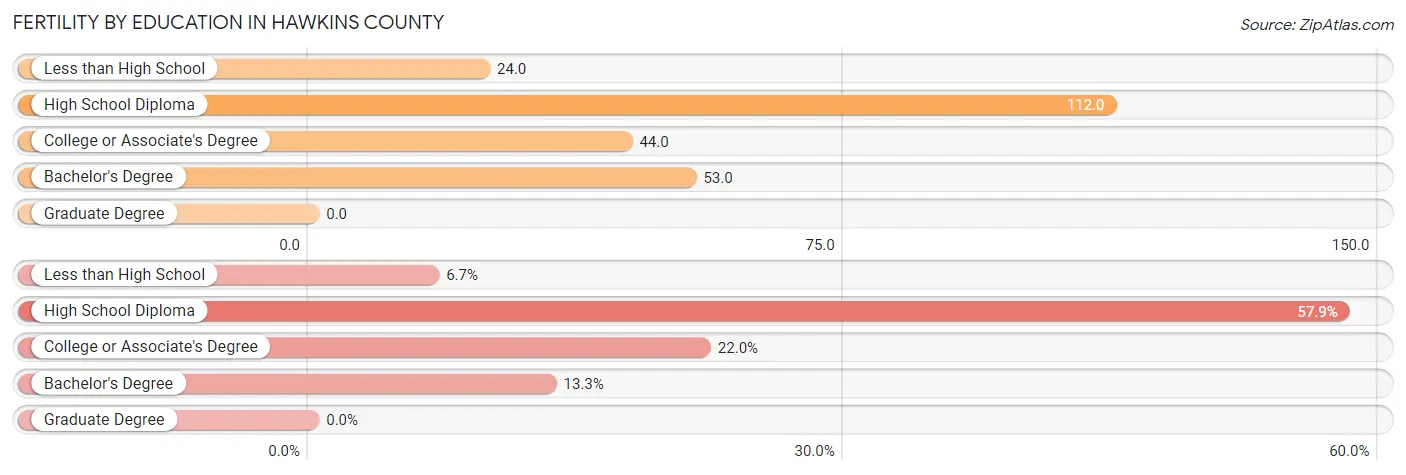
| Educational Attainment | Women with Births | Births / 1,000 Women |
| Less than High School | 49 (6.7%) | 24.0 |
| High School Diploma | 421 (57.9%) | 112.0 |
| College or Associate's Degree | 160 (22.0%) | 44.0 |
| Bachelor's Degree | 97 (13.3%) | 53.0 |
| Graduate Degree | 0 (0.0%) | 0.0 |
| Total | 727 (100.0%) | 61.0 |
Fertility by Education by Marriage Status in Hawkins County
29.2% of women with births in Hawkins County are unmarried. Women with the educational attainment of college or associate's degree are most likely to be married with 88.7% of them married at childbirth, while women with the educational attainment of bachelor's degree are least likely to be married with 43.3% of them unmarried at childbirth.

| Educational Attainment | Married | Unmarried |
| Less than High School | 32 (65.3%) | 17 (34.7%) |
| High School Diploma | 286 (67.9%) | 135 (32.1%) |
| College or Associate's Degree | 142 (88.7%) | 18 (11.3%) |
| Bachelor's Degree | 55 (56.7%) | 42 (43.3%) |
| Graduate Degree | 0 (0.0%) | 0 (0.0%) |
| Total | 515 (70.8%) | 212 (29.2%) |
Income in Hawkins County
Income Overview in Hawkins County
Per Capita Income in Hawkins County is $28,648, while median incomes of families and households are $64,529 and $53,647 respectively.
| Characteristic | Number | Measure |
| Per Capita Income | 57,107 | $28,648 |
| Median Family Income | 15,920 | $64,529 |
| Mean Family Income | 15,920 | $79,258 |
| Median Household Income | 22,785 | $53,647 |
| Mean Household Income | 22,785 | $69,193 |
| Income Deficit | 15,920 | $10,923 |
| Wage / Income Gap (%) | 57,107 | 32.99% |
| Wage / Income Gap ($) | 57,107 | 67.01¢ per $1 |
| Gini / Inequality Index | 57,107 | 0.46 |
Earnings by Sex in Hawkins County
Average Earnings in Hawkins County are $33,897, $41,538 for men and $27,834 for women, a difference of 33.0%.
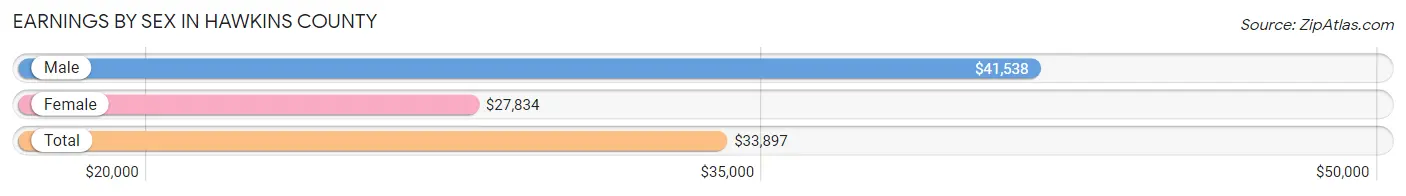
| Sex | Number | Average Earnings |
| Male | 13,442 (53.2%) | $41,538 |
| Female | 11,844 (46.8%) | $27,834 |
| Total | 25,286 (100.0%) | $33,897 |
Earnings by Sex by Income Bracket in Hawkins County
The most common earnings brackets in Hawkins County are $75,000 to $99,999 for men (1,345 | 10.0%) and $25,000 to $29,999 for women (1,038 | 8.8%).

| Income | Male | Female |
| $2,499 or less | 793 (5.9%) | 739 (6.2%) |
| $2,500 to $4,999 | 375 (2.8%) | 518 (4.4%) |
| $5,000 to $7,499 | 358 (2.7%) | 703 (5.9%) |
| $7,500 to $9,999 | 467 (3.5%) | 466 (3.9%) |
| $10,000 to $12,499 | 199 (1.5%) | 423 (3.6%) |
| $12,500 to $14,999 | 411 (3.1%) | 763 (6.4%) |
| $15,000 to $17,499 | 392 (2.9%) | 456 (3.8%) |
| $17,500 to $19,999 | 215 (1.6%) | 298 (2.5%) |
| $20,000 to $22,499 | 213 (1.6%) | 417 (3.5%) |
| $22,500 to $24,999 | 564 (4.2%) | 575 (4.9%) |
| $25,000 to $29,999 | 877 (6.5%) | 1,038 (8.8%) |
| $30,000 to $34,999 | 859 (6.4%) | 948 (8.0%) |
| $35,000 to $39,999 | 651 (4.8%) | 1,001 (8.5%) |
| $40,000 to $44,999 | 971 (7.2%) | 640 (5.4%) |
| $45,000 to $49,999 | 898 (6.7%) | 569 (4.8%) |
| $50,000 to $54,999 | 606 (4.5%) | 346 (2.9%) |
| $55,000 to $64,999 | 987 (7.3%) | 627 (5.3%) |
| $65,000 to $74,999 | 1,092 (8.1%) | 652 (5.5%) |
| $75,000 to $99,999 | 1,345 (10.0%) | 314 (2.6%) |
| $100,000+ | 1,169 (8.7%) | 351 (3.0%) |
| Total | 13,442 (100.0%) | 11,844 (100.0%) |
Earnings by Sex by Educational Attainment in Hawkins County
Average earnings in Hawkins County are $46,103 for men and $31,434 for women, a difference of 31.8%. Men with an educational attainment of graduate degree enjoy the highest average annual earnings of $81,128, while those with less than high school education earn the least with $19,912. Women with an educational attainment of graduate degree earn the most with the average annual earnings of $59,422, while those with less than high school education have the smallest earnings of $16,380.
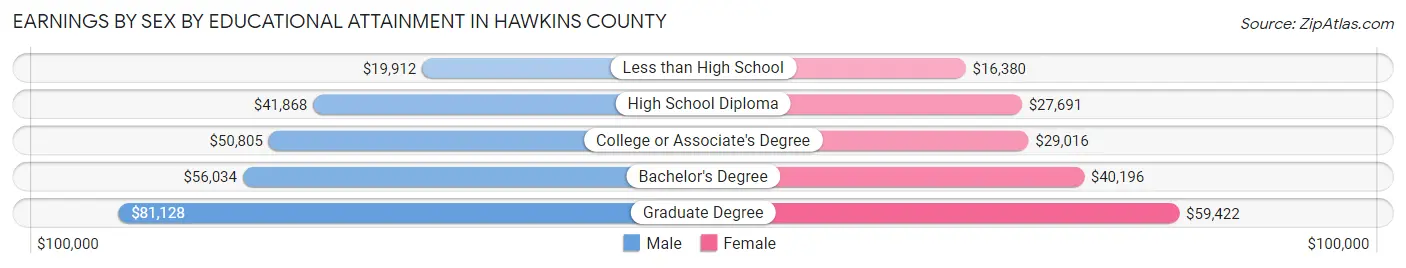
| Educational Attainment | Male Income | Female Income |
| Less than High School | $19,912 | $16,380 |
| High School Diploma | $41,868 | $27,691 |
| College or Associate's Degree | $50,805 | $29,016 |
| Bachelor's Degree | $56,034 | $40,196 |
| Graduate Degree | $81,128 | $59,422 |
| Total | $46,103 | $31,434 |
Family Income in Hawkins County
Family Income Brackets in Hawkins County
According to the Hawkins County family income data, there are 3,582 families falling into the $50,000 to $74,999 income range, which is the most common income bracket and makes up 22.5% of all families. Conversely, the $10,000 to $14,999 income bracket is the least frequent group with only 287 families (1.8%) belonging to this category.
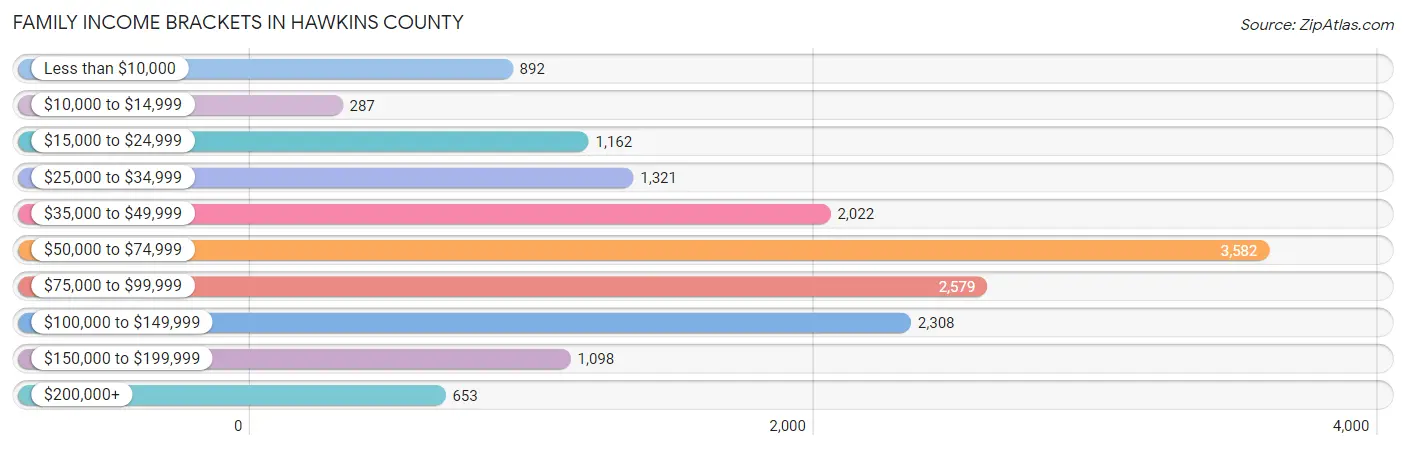
| Income Bracket | # Families | % Families |
| Less than $10,000 | 892 | 5.6% |
| $10,000 to $14,999 | 287 | 1.8% |
| $15,000 to $24,999 | 1,162 | 7.3% |
| $25,000 to $34,999 | 1,321 | 8.3% |
| $35,000 to $49,999 | 2,022 | 12.7% |
| $50,000 to $74,999 | 3,582 | 22.5% |
| $75,000 to $99,999 | 2,579 | 16.2% |
| $100,000 to $149,999 | 2,308 | 14.5% |
| $150,000 to $199,999 | 1,098 | 6.9% |
| $200,000+ | 653 | 4.1% |
Family Income by Famaliy Size in Hawkins County
4-person families (2,017 | 12.7%) account for the highest median family income in Hawkins County with $82,463 per family, while 2-person families (9,035 | 56.8%) have the highest median income of $30,698 per family member.
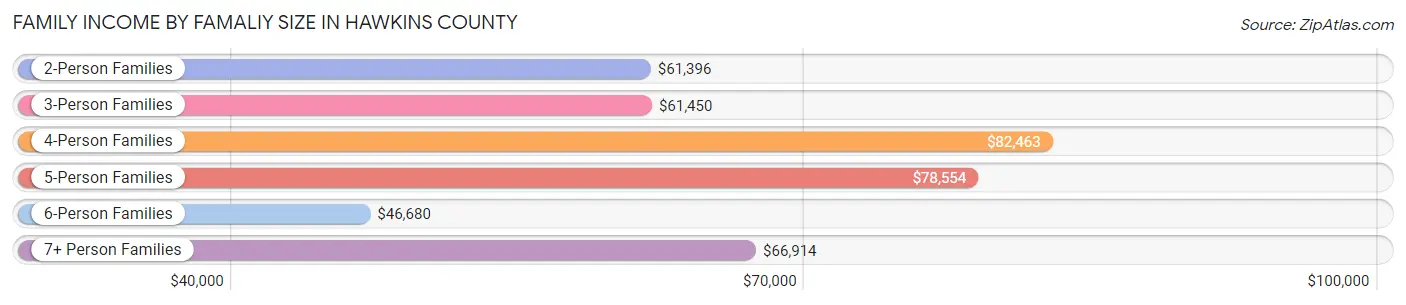
| Income Bracket | # Families | Median Income |
| 2-Person Families | 9,035 (56.8%) | $61,396 |
| 3-Person Families | 3,469 (21.8%) | $61,450 |
| 4-Person Families | 2,017 (12.7%) | $82,463 |
| 5-Person Families | 1,057 (6.6%) | $78,554 |
| 6-Person Families | 173 (1.1%) | $46,680 |
| 7+ Person Families | 169 (1.1%) | $66,914 |
| Total | 15,920 (100.0%) | $64,529 |
Family Income by Number of Earners in Hawkins County
The median family income in Hawkins County is $64,529, with families comprising 3+ earners (1,237) having the highest median family income of $125,661, while families with no earners (4,116) have the lowest median family income of $37,329, accounting for 7.8% and 25.9% of families, respectively.
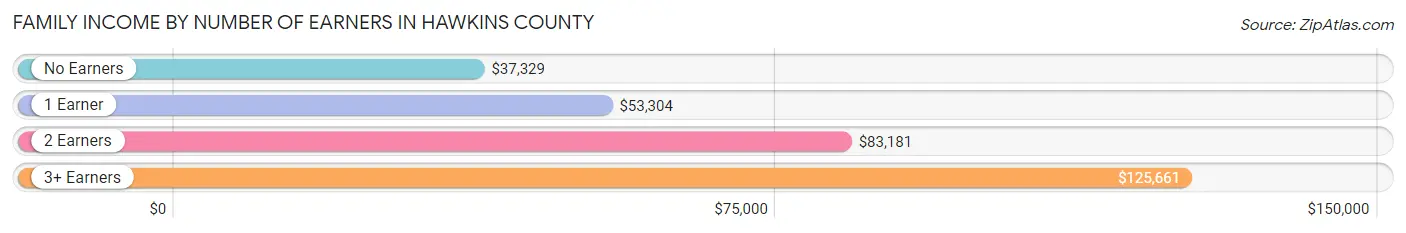
| Number of Earners | # Families | Median Income |
| No Earners | 4,116 (25.9%) | $37,329 |
| 1 Earner | 5,422 (34.1%) | $53,304 |
| 2 Earners | 5,145 (32.3%) | $83,181 |
| 3+ Earners | 1,237 (7.8%) | $125,661 |
| Total | 15,920 (100.0%) | $64,529 |
Household Income in Hawkins County
Household Income Brackets in Hawkins County
With 4,694 households falling in the category, the $50,000 to $74,999 income range is the most frequent in Hawkins County, accounting for 20.6% of all households. In contrast, only 752 households (3.3%) fall into the $200,000+ income bracket, making it the least populous group.
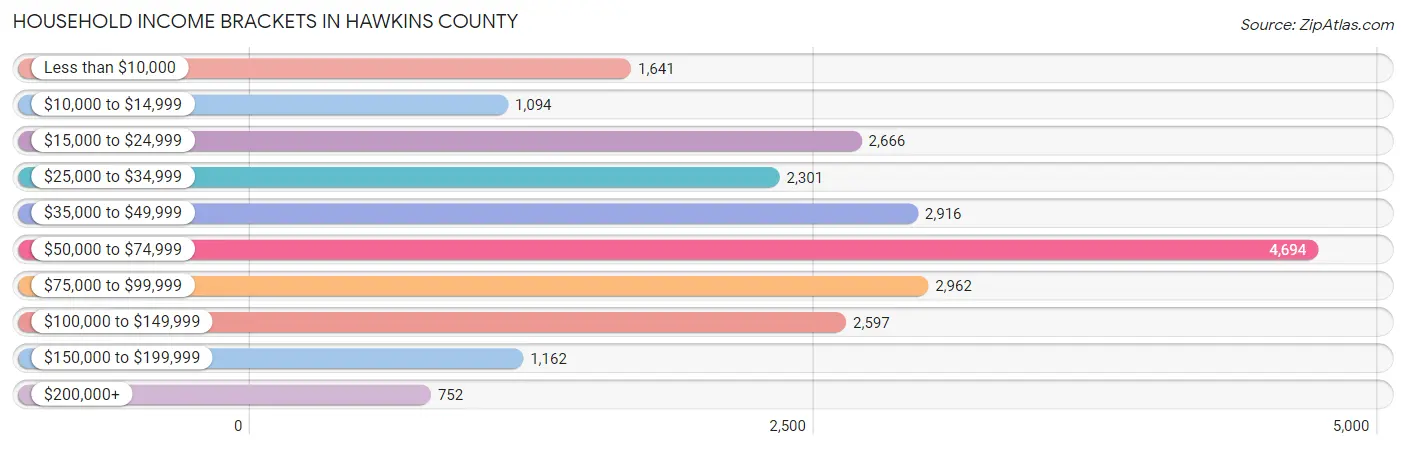
| Income Bracket | # Households | % Households |
| Less than $10,000 | 1,641 | 7.2% |
| $10,000 to $14,999 | 1,094 | 4.8% |
| $15,000 to $24,999 | 2,666 | 11.7% |
| $25,000 to $34,999 | 2,301 | 10.1% |
| $35,000 to $49,999 | 2,916 | 12.8% |
| $50,000 to $74,999 | 4,694 | 20.6% |
| $75,000 to $99,999 | 2,962 | 13.0% |
| $100,000 to $149,999 | 2,597 | 11.4% |
| $150,000 to $199,999 | 1,162 | 5.1% |
| $200,000+ | 752 | 3.3% |
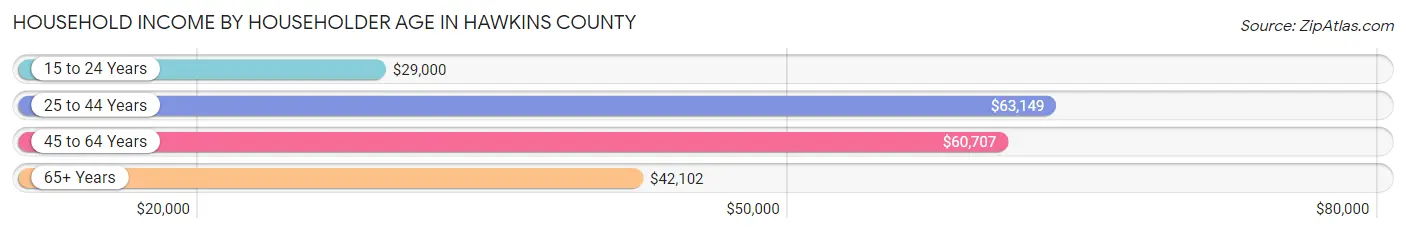
Household Income by Householder Age in Hawkins County
The median household income in Hawkins County is $53,647, with the highest median household income of $63,149 found in the 25 to 44 years age bracket for the primary householder. A total of 5,466 households (24.0%) fall into this category. Meanwhile, the 15 to 24 years age bracket for the primary householder has the lowest median household income of $29,000, with 638 households (2.8%) in this group.
| Income Bracket | # Households | Median Income |
| 15 to 24 Years | 638 (2.8%) | $29,000 |
| 25 to 44 Years | 5,466 (24.0%) | $63,149 |
| 45 to 64 Years | 8,965 (39.4%) | $60,707 |
| 65+ Years | 7,716 (33.9%) | $42,102 |
| Total | 22,785 (100.0%) | $53,647 |
Poverty in Hawkins County
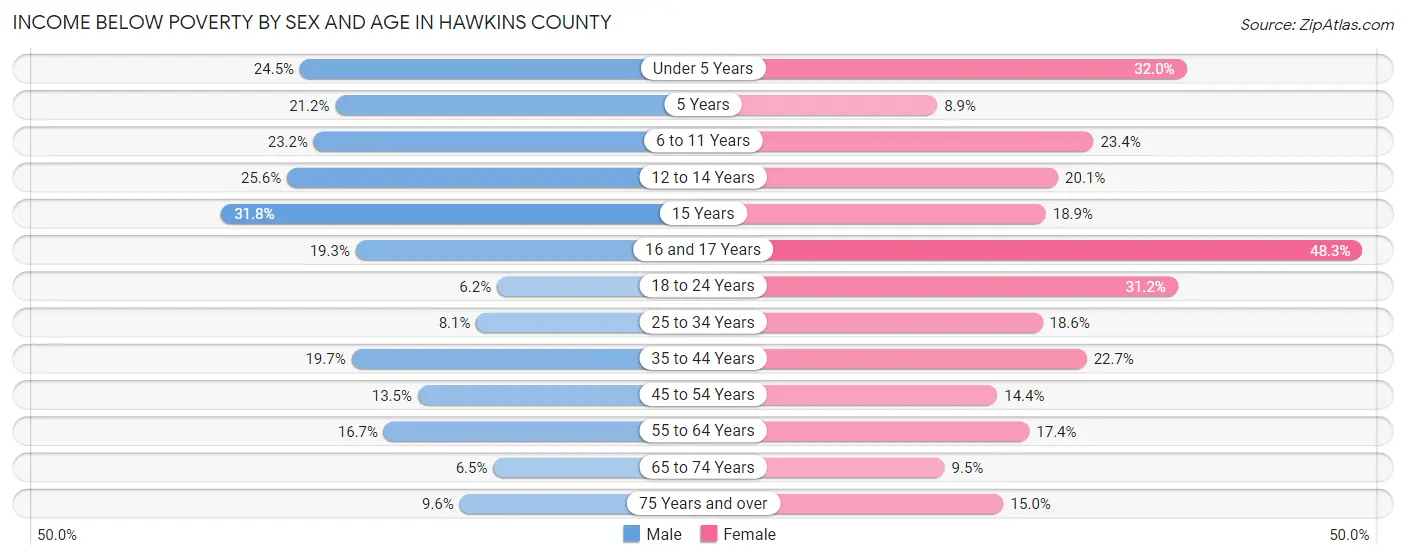
Income Below Poverty by Sex and Age in Hawkins County
With 14.4% poverty level for males and 19.3% for females among the residents of Hawkins County, 15 year old males and 16 and 17 year old females are the most vulnerable to poverty, with 127 males (31.8%) and 341 females (48.3%) in their respective age groups living below the poverty level.
| Age Bracket | Male | Female |
| Under 5 Years | 312 (24.4%) | 441 (32.0%) |
| 5 Years | 76 (21.2%) | 31 (8.9%) |
| 6 to 11 Years | 305 (23.2%) | 370 (23.4%) |
| 12 to 14 Years | 351 (25.6%) | 196 (20.1%) |
| 15 Years | 127 (31.8%) | 67 (18.9%) |
| 16 and 17 Years | 148 (19.3%) | 341 (48.3%) |
| 18 to 24 Years | 135 (6.2%) | 700 (31.2%) |
| 25 to 34 Years | 258 (8.1%) | 588 (18.6%) |
| 35 to 44 Years | 607 (19.7%) | 687 (22.7%) |
| 45 to 54 Years | 545 (13.5%) | 583 (14.4%) |
| 55 to 64 Years | 699 (16.7%) | 758 (17.4%) |
| 65 to 74 Years | 222 (6.5%) | 365 (9.5%) |
| 75 Years and over | 204 (9.6%) | 395 (15.0%) |
| Total | 3,989 (14.4%) | 5,522 (19.3%) |
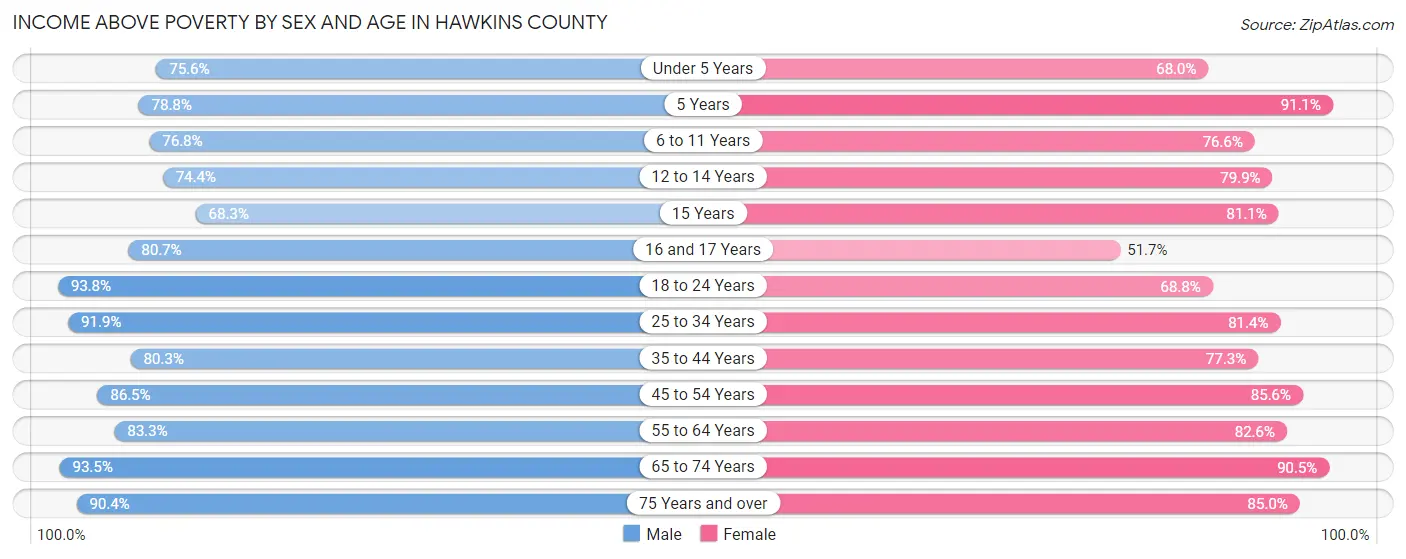
Income Above Poverty by Sex and Age in Hawkins County
According to the poverty statistics in Hawkins County, males aged 18 to 24 years and females aged 5 years are the age groups that are most secure financially, with 93.8% of males and 91.1% of females in these age groups living above the poverty line.
| Age Bracket | Male | Female |
| Under 5 Years | 964 (75.5%) | 938 (68.0%) |
| 5 Years | 283 (78.8%) | 319 (91.1%) |
| 6 to 11 Years | 1,012 (76.8%) | 1,214 (76.6%) |
| 12 to 14 Years | 1,018 (74.4%) | 780 (79.9%) |
| 15 Years | 273 (68.2%) | 287 (81.1%) |
| 16 and 17 Years | 620 (80.7%) | 365 (51.7%) |
| 18 to 24 Years | 2,056 (93.8%) | 1,546 (68.8%) |
| 25 to 34 Years | 2,934 (91.9%) | 2,569 (81.4%) |
| 35 to 44 Years | 2,480 (80.3%) | 2,336 (77.3%) |
| 45 to 54 Years | 3,488 (86.5%) | 3,456 (85.6%) |
| 55 to 64 Years | 3,497 (83.3%) | 3,595 (82.6%) |
| 65 to 74 Years | 3,192 (93.5%) | 3,462 (90.5%) |
| 75 Years and over | 1,915 (90.4%) | 2,235 (85.0%) |
| Total | 23,732 (85.6%) | 23,102 (80.7%) |
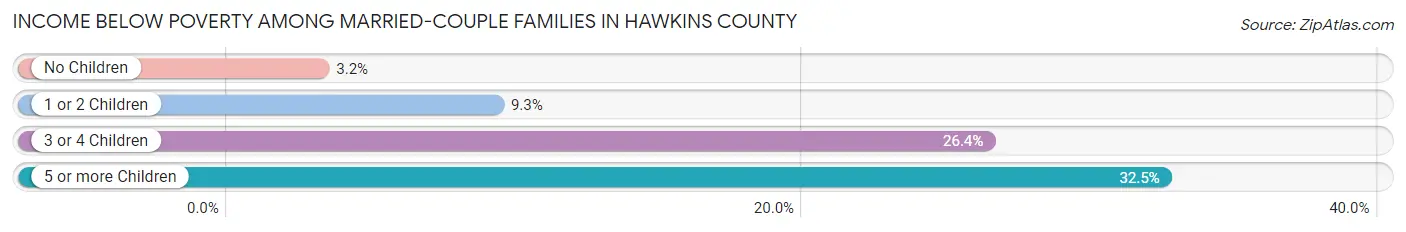
Income Below Poverty Among Married-Couple Families in Hawkins County
The poverty statistics for married-couple families in Hawkins County show that 6.0% or 700 of the total 11,683 families live below the poverty line. Families with 5 or more children have the highest poverty rate of 32.5%, comprising of 26 families. On the other hand, families with no children have the lowest poverty rate of 3.2%, which includes 249 families.
| Children | Above Poverty | Below Poverty |
| No Children | 7,577 (96.8%) | 249 (3.2%) |
| 1 or 2 Children | 3,028 (90.7%) | 309 (9.3%) |
| 3 or 4 Children | 324 (73.6%) | 116 (26.4%) |
| 5 or more Children | 54 (67.5%) | 26 (32.5%) |
| Total | 10,983 (94.0%) | 700 (6.0%) |
Income Below Poverty Among Single-Parent Households in Hawkins County
According to the poverty data in Hawkins County, 19.7% or 292 single-father households and 37.4% or 1,031 single-mother households are living below the poverty line. Among single-father households, those with 1 or 2 children have the highest poverty rate, with 252 households (33.0%) experiencing poverty. Likewise, among single-mother households, those with 5 or more children have the highest poverty rate, with 21 households (100.0%) falling below the poverty line.
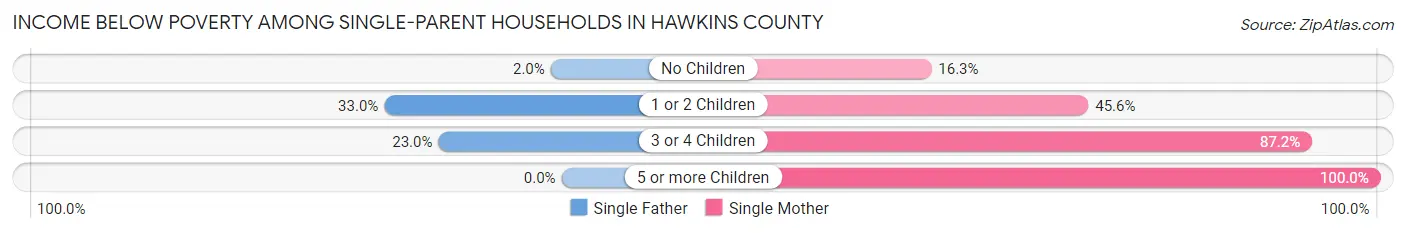
| Children | Single Father | Single Mother |
| No Children | 12 (2.0%) | 154 (16.3%) |
| 1 or 2 Children | 252 (33.0%) | 774 (45.6%) |
| 3 or 4 Children | 28 (23.0%) | 82 (87.2%) |
| 5 or more Children | 0 (0.0%) | 21 (100.0%) |
| Total | 292 (19.7%) | 1,031 (37.4%) |
Income Below Poverty Among Married-Couple vs Single-Parent Households in Hawkins County
The poverty data for Hawkins County shows that 700 of the married-couple family households (6.0%) and 1,323 of the single-parent households (31.2%) are living below the poverty level. Within the married-couple family households, those with 5 or more children have the highest poverty rate, with 26 households (32.5%) falling below the poverty line. Among the single-parent households, those with 5 or more children have the highest poverty rate, with 21 household (100.0%) living below poverty.
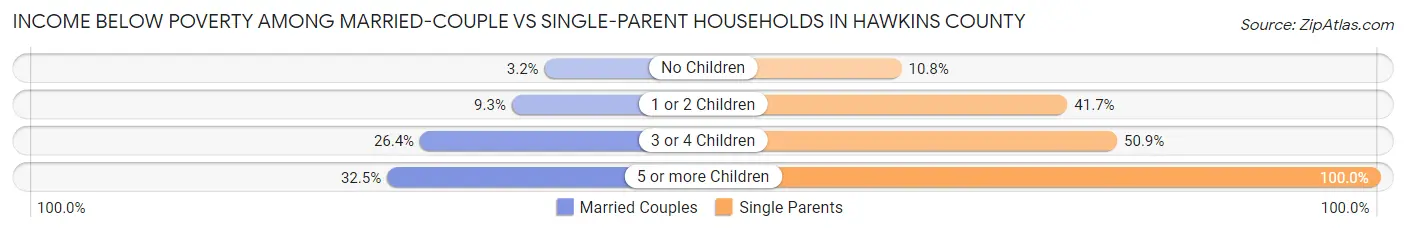
| Children | Married-Couple Families | Single-Parent Households |
| No Children | 249 (3.2%) | 166 (10.8%) |
| 1 or 2 Children | 309 (9.3%) | 1,026 (41.7%) |
| 3 or 4 Children | 116 (26.4%) | 110 (50.9%) |
| 5 or more Children | 26 (32.5%) | 21 (100.0%) |
| Total | 700 (6.0%) | 1,323 (31.2%) |
Employment Characteristics in Hawkins County
Employment by Class of Employer in Hawkins County
Among the 21,481 employed individuals in Hawkins County, private company employees (15,075 | 70.2%), local government employees (1,923 | 8.9%), and not-for-profit organizations (1,482 | 6.9%) make up the most common classes of employment.

| Employer Class | # Employees | % Employees |
| Private Company Employees | 15,075 | 70.2% |
| Self-Employed (Incorporated) | 463 | 2.2% |
| Self-Employed (Not Incorporated) | 1,296 | 6.0% |
| Not-for-profit Organizations | 1,482 | 6.9% |
| Local Government Employees | 1,923 | 8.9% |
| State Government Employees | 753 | 3.5% |
| Federal Government Employees | 465 | 2.2% |
| Unpaid Family Workers | 24 | 0.1% |
| Total | 21,481 | 100.0% |
Employment Status by Age in Hawkins County
According to the labor force statistics for Hawkins County, out of the total population over 16 years of age (47,568), 50.5% or 24,022 individuals are in the labor force, with 8.6% or 2,066 of them unemployed. The age group with the highest labor force participation rate is 30 to 34 years, with 80.0% or 2,381 individuals in the labor force. Within the labor force, the 20 to 24 years age range has the highest percentage of unemployed individuals, with 15.6% or 377 of them being unemployed.
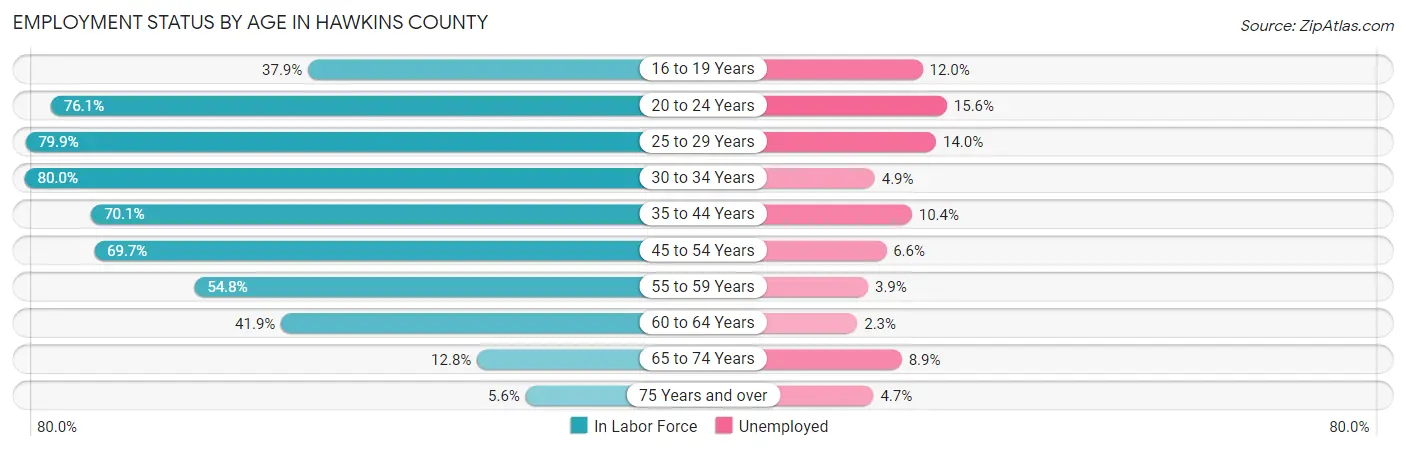
| Age Bracket | In Labor Force | Unemployed |
| 16 to 19 Years | 1,054 (37.9%) | 126 (12.0%) |
| 20 to 24 Years | 2,416 (76.1%) | 377 (15.6%) |
| 25 to 29 Years | 2,749 (79.9%) | 385 (14.0%) |
| 30 to 34 Years | 2,381 (80.0%) | 117 (4.9%) |
| 35 to 44 Years | 4,360 (70.1%) | 453 (10.4%) |
| 45 to 54 Years | 5,665 (69.7%) | 374 (6.6%) |
| 55 to 59 Years | 2,520 (54.8%) | 98 (3.9%) |
| 60 to 64 Years | 1,672 (41.9%) | 38 (2.3%) |
| 65 to 74 Years | 935 (12.8%) | 83 (8.9%) |
| 75 Years and over | 277 (5.6%) | 13 (4.7%) |
| Total | 24,022 (50.5%) | 2,066 (8.6%) |
Employment Status by Educational Attainment in Hawkins County
According to labor force statistics for Hawkins County, 65.9% of individuals (19,343) out of the total population between 25 and 64 years of age (29,352) are in the labor force, with 7.6% or 1,470 of them being unemployed. The group with the highest labor force participation rate are those with the educational attainment of bachelor's degree or higher, with 85.2% or 4,382 individuals in the labor force. Within the labor force, individuals with less than high school education have the highest percentage of unemployment, with 13.5% or 171 of them being unemployed.
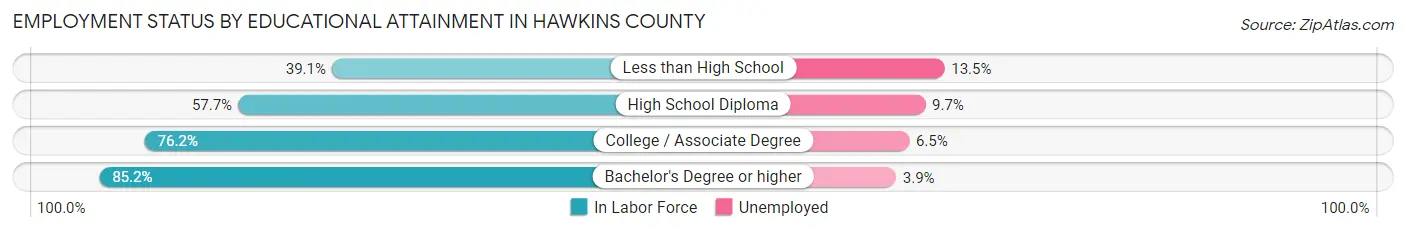
| Educational Attainment | In Labor Force | Unemployed |
| Less than High School | 1,270 (39.1%) | 438 (13.5%) |
| High School Diploma | 7,142 (57.7%) | 1,201 (9.7%) |
| College / Associate Degree | 6,541 (76.2%) | 558 (6.5%) |
| Bachelor's Degree or higher | 4,382 (85.2%) | 201 (3.9%) |
| Total | 19,343 (65.9%) | 2,231 (7.6%) |
Employment Occupations by Sex in Hawkins County
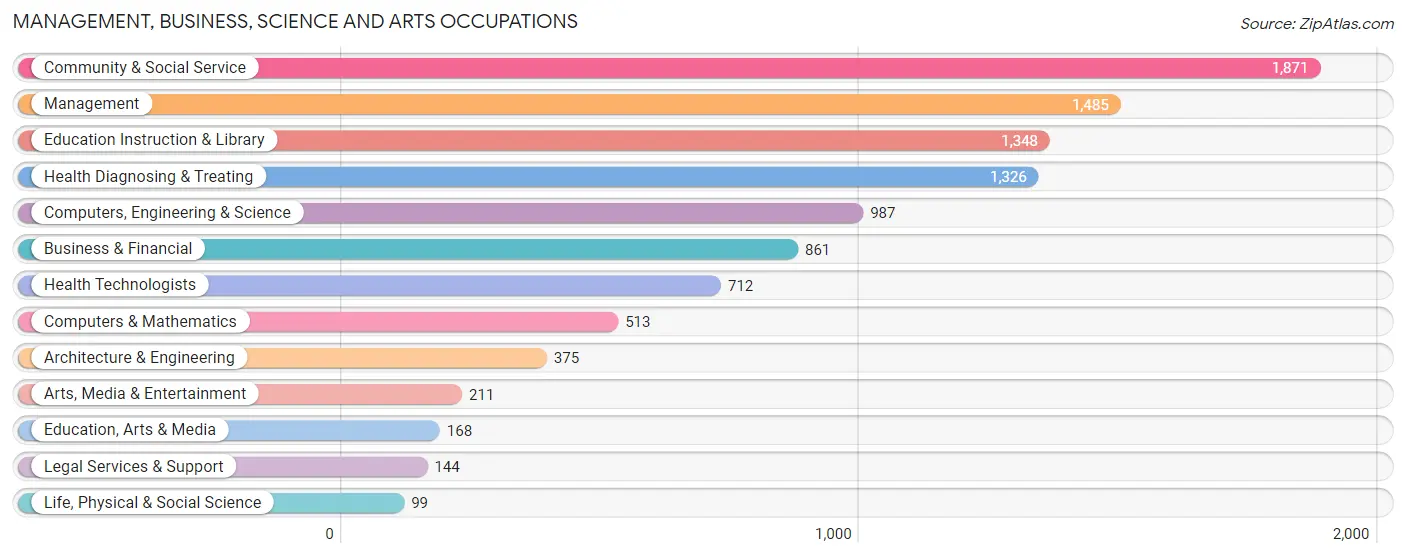
Management, Business, Science and Arts Occupations
The most common Management, Business, Science and Arts occupations in Hawkins County are Community & Social Service (1,871 | 8.5%), Management (1,485 | 6.8%), Education Instruction & Library (1,348 | 6.1%), Health Diagnosing & Treating (1,326 | 6.0%), and Computers, Engineering & Science (987 | 4.5%).
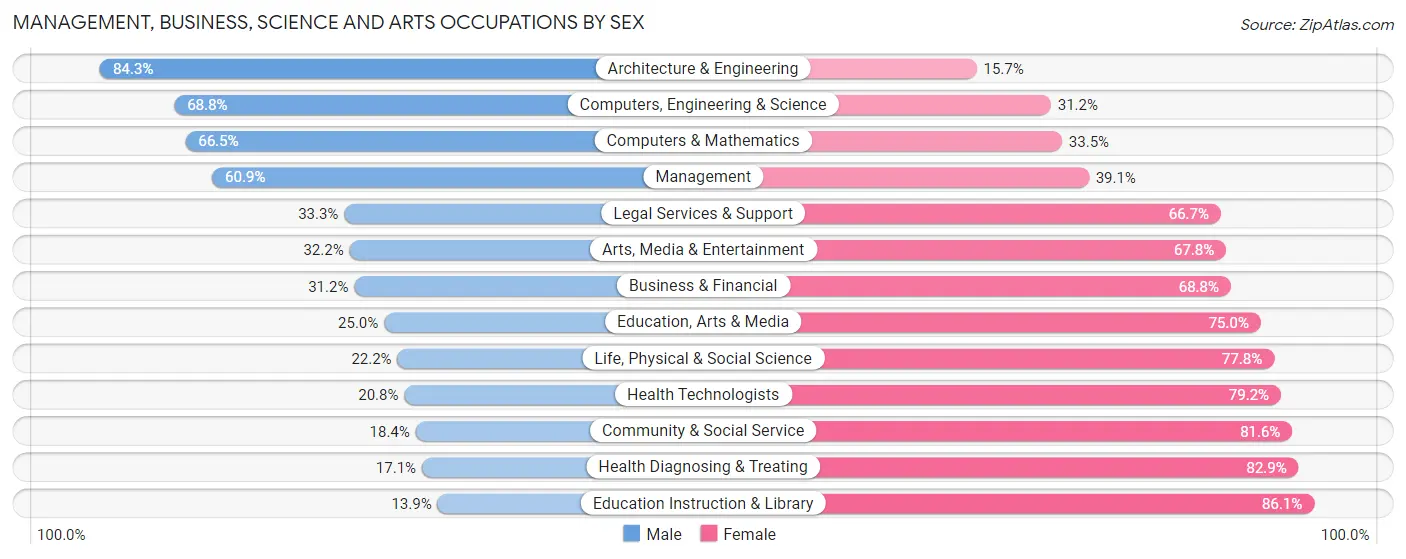
Management, Business, Science and Arts Occupations by Sex
Within the Management, Business, Science and Arts occupations in Hawkins County, the most male-oriented occupations are Architecture & Engineering (84.3%), Computers, Engineering & Science (68.8%), and Computers & Mathematics (66.5%), while the most female-oriented occupations are Education Instruction & Library (86.1%), Health Diagnosing & Treating (82.9%), and Community & Social Service (81.6%).
| Occupation | Male | Female |
| Management | 904 (60.9%) | 581 (39.1%) |
| Business & Financial | 269 (31.2%) | 592 (68.8%) |
| Computers, Engineering & Science | 679 (68.8%) | 308 (31.2%) |
| Computers & Mathematics | 341 (66.5%) | 172 (33.5%) |
| Architecture & Engineering | 316 (84.3%) | 59 (15.7%) |
| Life, Physical & Social Science | 22 (22.2%) | 77 (77.8%) |
| Community & Social Service | 345 (18.4%) | 1,526 (81.6%) |
| Education, Arts & Media | 42 (25.0%) | 126 (75.0%) |
| Legal Services & Support | 48 (33.3%) | 96 (66.7%) |
| Education Instruction & Library | 187 (13.9%) | 1,161 (86.1%) |
| Arts, Media & Entertainment | 68 (32.2%) | 143 (67.8%) |
| Health Diagnosing & Treating | 227 (17.1%) | 1,099 (82.9%) |
| Health Technologists | 148 (20.8%) | 564 (79.2%) |
| Total (Category) | 2,424 (37.1%) | 4,106 (62.9%) |
| Total (Overall) | 11,739 (53.5%) | 10,190 (46.5%) |
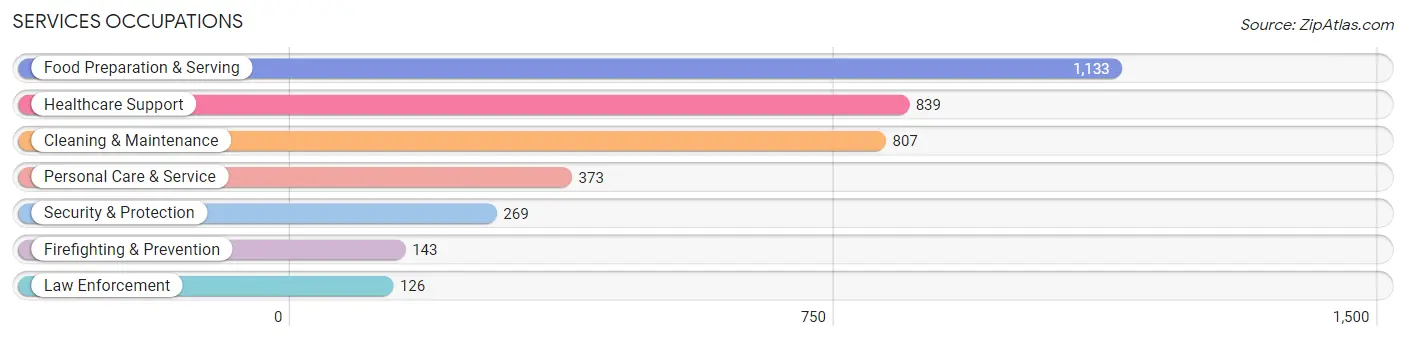
Services Occupations
The most common Services occupations in Hawkins County are Food Preparation & Serving (1,133 | 5.2%), Healthcare Support (839 | 3.8%), Cleaning & Maintenance (807 | 3.7%), Personal Care & Service (373 | 1.7%), and Security & Protection (269 | 1.2%).
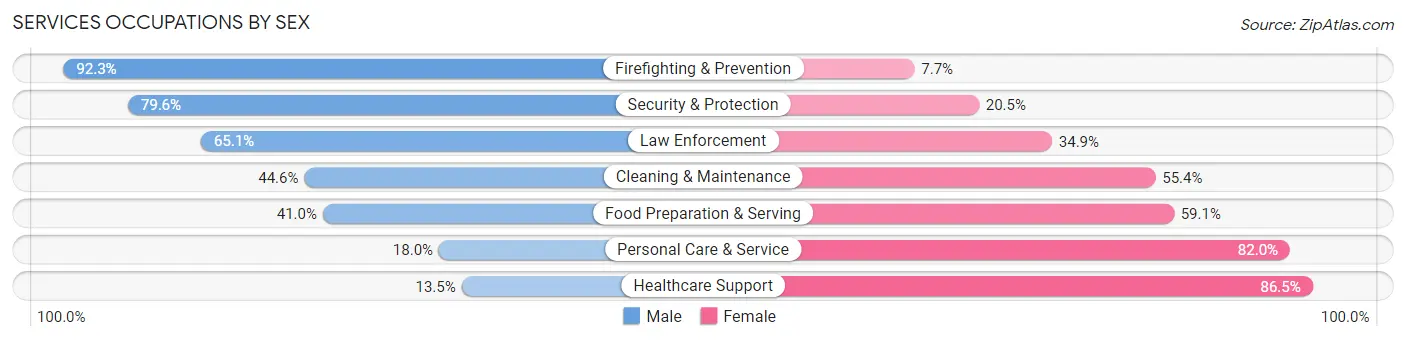
Services Occupations by Sex
Within the Services occupations in Hawkins County, the most male-oriented occupations are Firefighting & Prevention (92.3%), Security & Protection (79.5%), and Law Enforcement (65.1%), while the most female-oriented occupations are Healthcare Support (86.5%), Personal Care & Service (82.0%), and Food Preparation & Serving (59.1%).
| Occupation | Male | Female |
| Healthcare Support | 113 (13.5%) | 726 (86.5%) |
| Security & Protection | 214 (79.5%) | 55 (20.4%) |
| Firefighting & Prevention | 132 (92.3%) | 11 (7.7%) |
| Law Enforcement | 82 (65.1%) | 44 (34.9%) |
| Food Preparation & Serving | 464 (40.9%) | 669 (59.1%) |
| Cleaning & Maintenance | 360 (44.6%) | 447 (55.4%) |
| Personal Care & Service | 67 (18.0%) | 306 (82.0%) |
| Total (Category) | 1,218 (35.6%) | 2,203 (64.4%) |
| Total (Overall) | 11,739 (53.5%) | 10,190 (46.5%) |
Sales and Office Occupations
The most common Sales and Office occupations in Hawkins County are Sales & Related (2,009 | 9.2%), and Office & Administration (1,953 | 8.9%).

Sales and Office Occupations by Sex
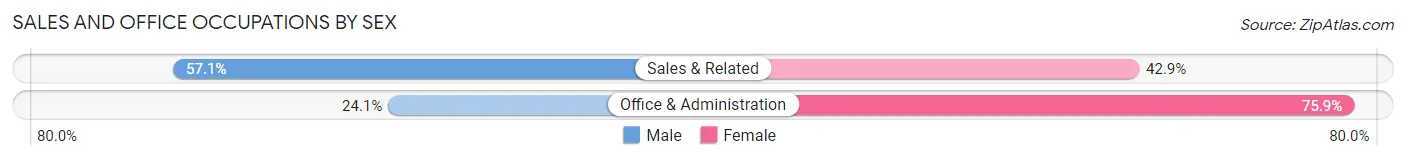
| Occupation | Male | Female |
| Sales & Related | 1,148 (57.1%) | 861 (42.9%) |
| Office & Administration | 470 (24.1%) | 1,483 (75.9%) |
| Total (Category) | 1,618 (40.8%) | 2,344 (59.2%) |
| Total (Overall) | 11,739 (53.5%) | 10,190 (46.5%) |
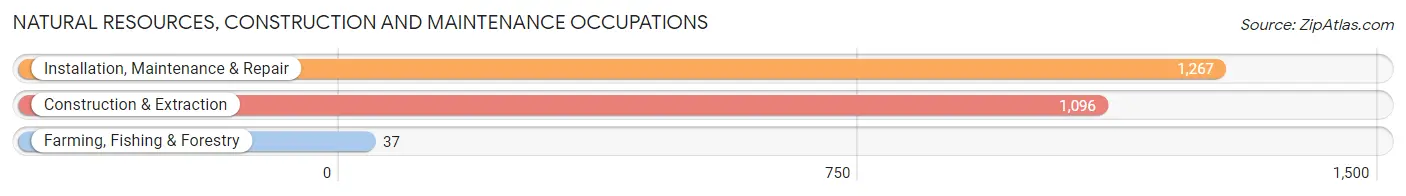
Natural Resources, Construction and Maintenance Occupations
The most common Natural Resources, Construction and Maintenance occupations in Hawkins County are Installation, Maintenance & Repair (1,267 | 5.8%), Construction & Extraction (1,096 | 5.0%), and Farming, Fishing & Forestry (37 | 0.2%).
Natural Resources, Construction and Maintenance Occupations by Sex
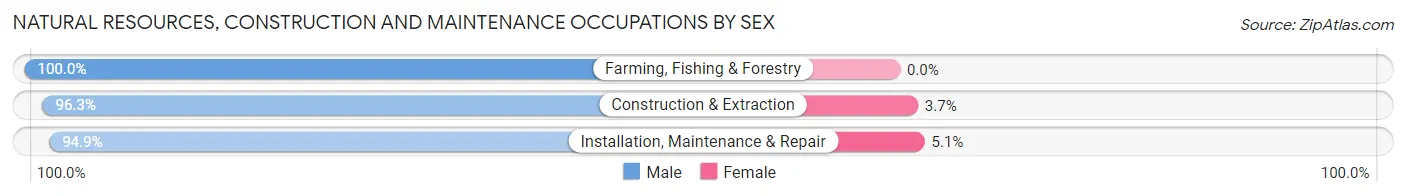
| Occupation | Male | Female |
| Farming, Fishing & Forestry | 37 (100.0%) | 0 (0.0%) |
| Construction & Extraction | 1,055 (96.3%) | 41 (3.7%) |
| Installation, Maintenance & Repair | 1,202 (94.9%) | 65 (5.1%) |
| Total (Category) | 2,294 (95.6%) | 106 (4.4%) |
| Total (Overall) | 11,739 (53.5%) | 10,190 (46.5%) |
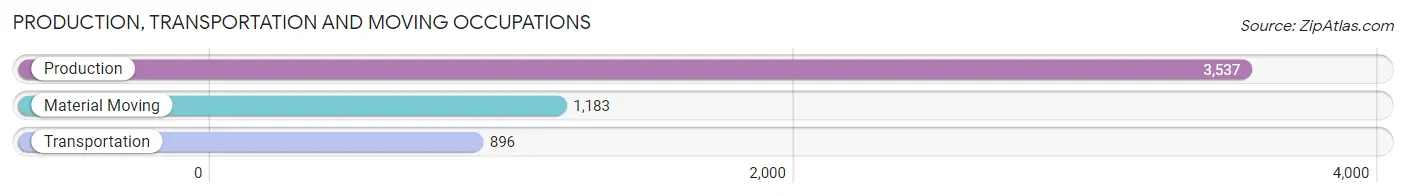
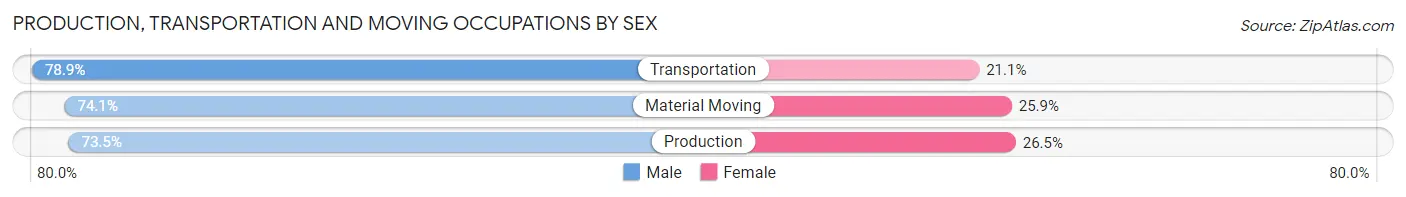
Production, Transportation and Moving Occupations
The most common Production, Transportation and Moving occupations in Hawkins County are Production (3,537 | 16.1%), Material Moving (1,183 | 5.4%), and Transportation (896 | 4.1%).
Production, Transportation and Moving Occupations by Sex
| Occupation | Male | Female |
| Production | 2,601 (73.5%) | 936 (26.5%) |
| Transportation | 707 (78.9%) | 189 (21.1%) |
| Material Moving | 877 (74.1%) | 306 (25.9%) |
| Total (Category) | 4,185 (74.5%) | 1,431 (25.5%) |
| Total (Overall) | 11,739 (53.5%) | 10,190 (46.5%) |
Employment Industries by Sex in Hawkins County
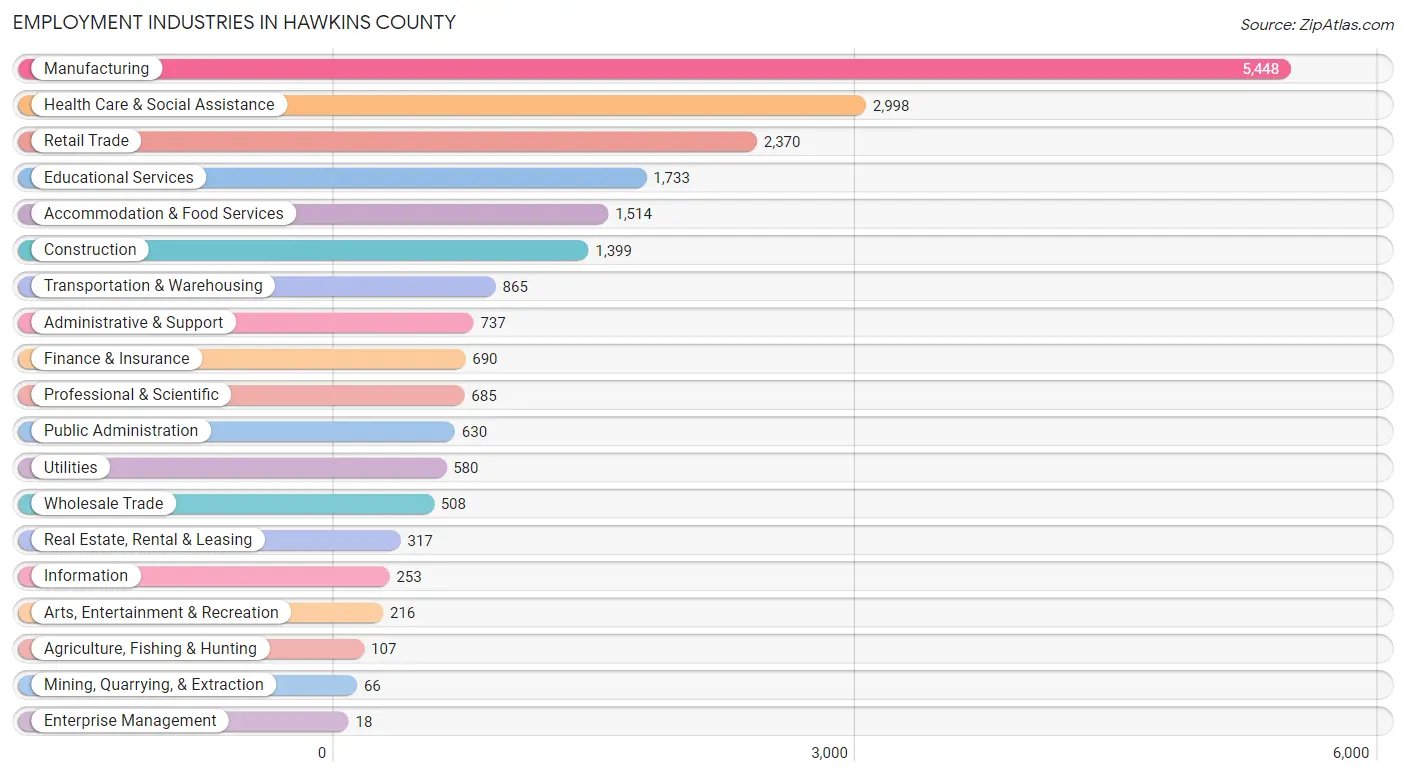
Employment Industries in Hawkins County
The major employment industries in Hawkins County include Manufacturing (5,448 | 24.8%), Health Care & Social Assistance (2,998 | 13.7%), Retail Trade (2,370 | 10.8%), Educational Services (1,733 | 7.9%), and Accommodation & Food Services (1,514 | 6.9%).
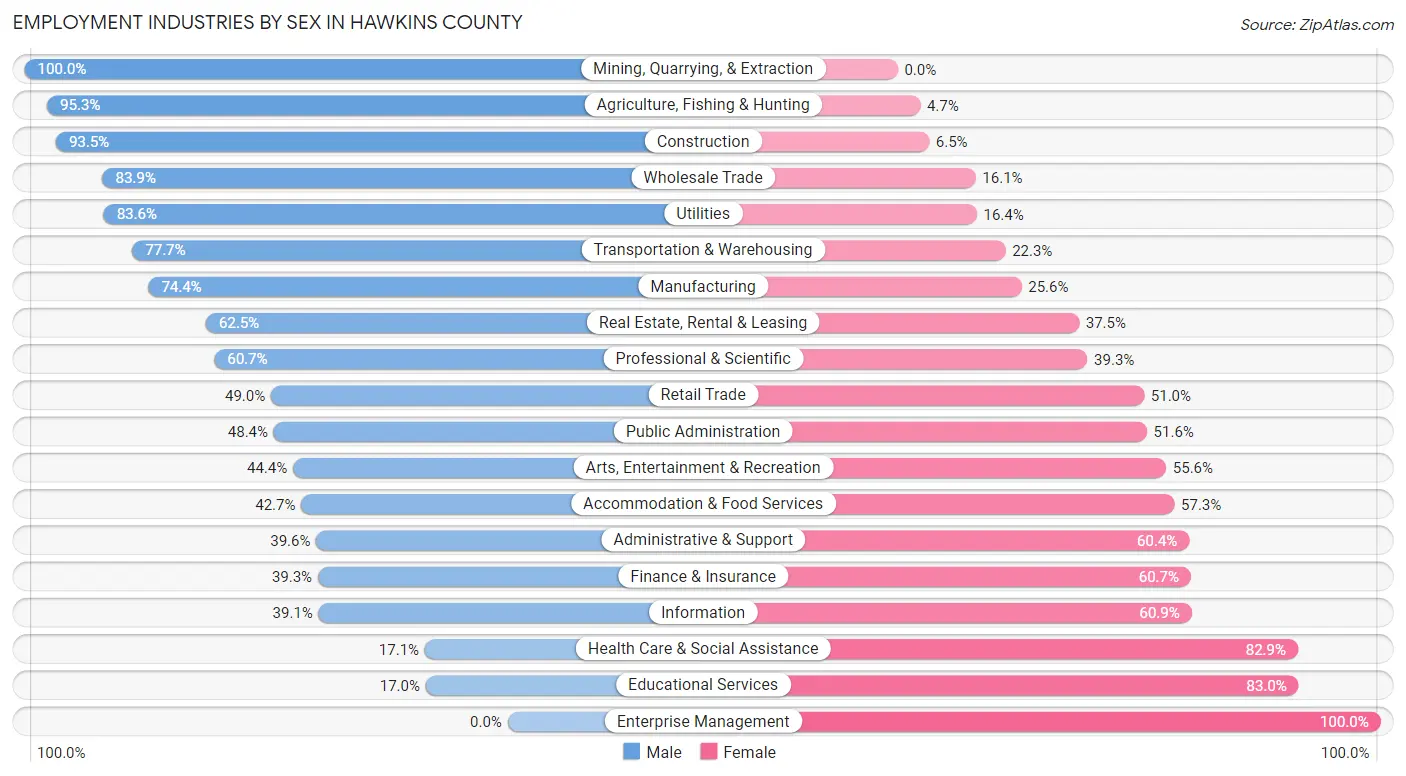
Employment Industries by Sex in Hawkins County
The Hawkins County industries that see more men than women are Mining, Quarrying, & Extraction (100.0%), Agriculture, Fishing & Hunting (95.3%), and Construction (93.5%), whereas the industries that tend to have a higher number of women are Enterprise Management (100.0%), Educational Services (83.0%), and Health Care & Social Assistance (82.9%).
| Industry | Male | Female |
| Agriculture, Fishing & Hunting | 102 (95.3%) | 5 (4.7%) |
| Mining, Quarrying, & Extraction | 66 (100.0%) | 0 (0.0%) |
| Construction | 1,308 (93.5%) | 91 (6.5%) |
| Manufacturing | 4,051 (74.4%) | 1,397 (25.6%) |
| Wholesale Trade | 426 (83.9%) | 82 (16.1%) |
| Retail Trade | 1,161 (49.0%) | 1,209 (51.0%) |
| Transportation & Warehousing | 672 (77.7%) | 193 (22.3%) |
| Utilities | 485 (83.6%) | 95 (16.4%) |
| Information | 99 (39.1%) | 154 (60.9%) |
| Finance & Insurance | 271 (39.3%) | 419 (60.7%) |
| Real Estate, Rental & Leasing | 198 (62.5%) | 119 (37.5%) |
| Professional & Scientific | 416 (60.7%) | 269 (39.3%) |
| Enterprise Management | 0 (0.0%) | 18 (100.0%) |
| Administrative & Support | 292 (39.6%) | 445 (60.4%) |
| Educational Services | 294 (17.0%) | 1,439 (83.0%) |
| Health Care & Social Assistance | 514 (17.1%) | 2,484 (82.9%) |
| Arts, Entertainment & Recreation | 96 (44.4%) | 120 (55.6%) |
| Accommodation & Food Services | 647 (42.7%) | 867 (57.3%) |
| Public Administration | 305 (48.4%) | 325 (51.6%) |
| Total | 11,739 (53.5%) | 10,190 (46.5%) |
Education in Hawkins County
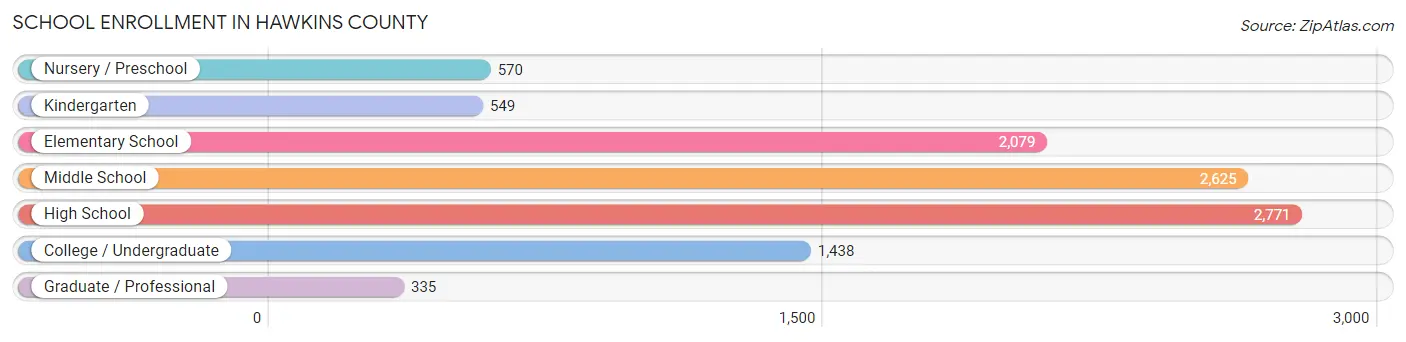
School Enrollment in Hawkins County
The most common levels of schooling among the 10,367 students in Hawkins County are high school (2,771 | 26.7%), middle school (2,625 | 25.3%), and elementary school (2,079 | 20.1%).
| School Level | # Students | % Students |
| Nursery / Preschool | 570 | 5.5% |
| Kindergarten | 549 | 5.3% |
| Elementary School | 2,079 | 20.1% |
| Middle School | 2,625 | 25.3% |
| High School | 2,771 | 26.7% |
| College / Undergraduate | 1,438 | 13.9% |
| Graduate / Professional | 335 | 3.2% |
| Total | 10,367 | 100.0% |
School Enrollment by Age by Funding Source in Hawkins County
Out of a total of 10,367 students who are enrolled in schools in Hawkins County, 1,379 (13.3%) attend a private institution, while the remaining 8,988 (86.7%) are enrolled in public schools. The age group of 3 to 4 year olds has the highest likelihood of being enrolled in private schools, with 97 (30.9% in the age bracket) enrolled. Conversely, the age group of 18 to 19 year olds has the lowest likelihood of being enrolled in a private school, with 749 (93.9% in the age bracket) attending a public institution.
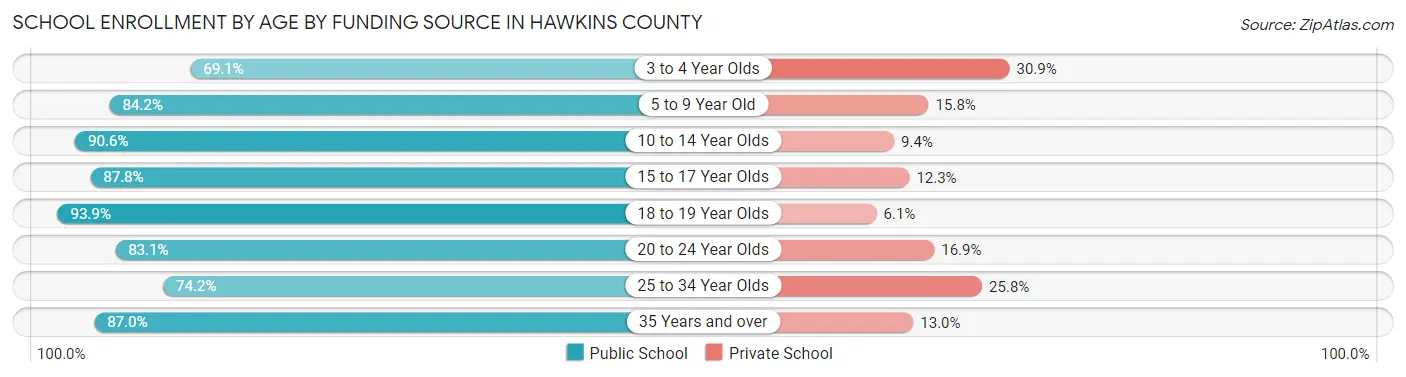
| Age Bracket | Public School | Private School |
| 3 to 4 Year Olds | 217 (69.1%) | 97 (30.9%) |
| 5 to 9 Year Old | 2,169 (84.2%) | 408 (15.8%) |
| 10 to 14 Year Olds | 2,882 (90.6%) | 299 (9.4%) |
| 15 to 17 Year Olds | 1,877 (87.7%) | 262 (12.2%) |
| 18 to 19 Year Olds | 749 (93.9%) | 49 (6.1%) |
| 20 to 24 Year Olds | 463 (83.1%) | 94 (16.9%) |
| 25 to 34 Year Olds | 400 (74.2%) | 139 (25.8%) |
| 35 Years and over | 228 (87.0%) | 34 (13.0%) |
| Total | 8,988 (86.7%) | 1,379 (13.3%) |
Educational Attainment by Field of Study in Hawkins County
Business (1,725 | 23.3%), education (1,571 | 21.2%), science & technology (869 | 11.7%), arts & humanities (536 | 7.2%), and bio, nature & agricultural (425 | 5.7%) are the most common fields of study among 7,415 individuals in Hawkins County who have obtained a bachelor's degree or higher.
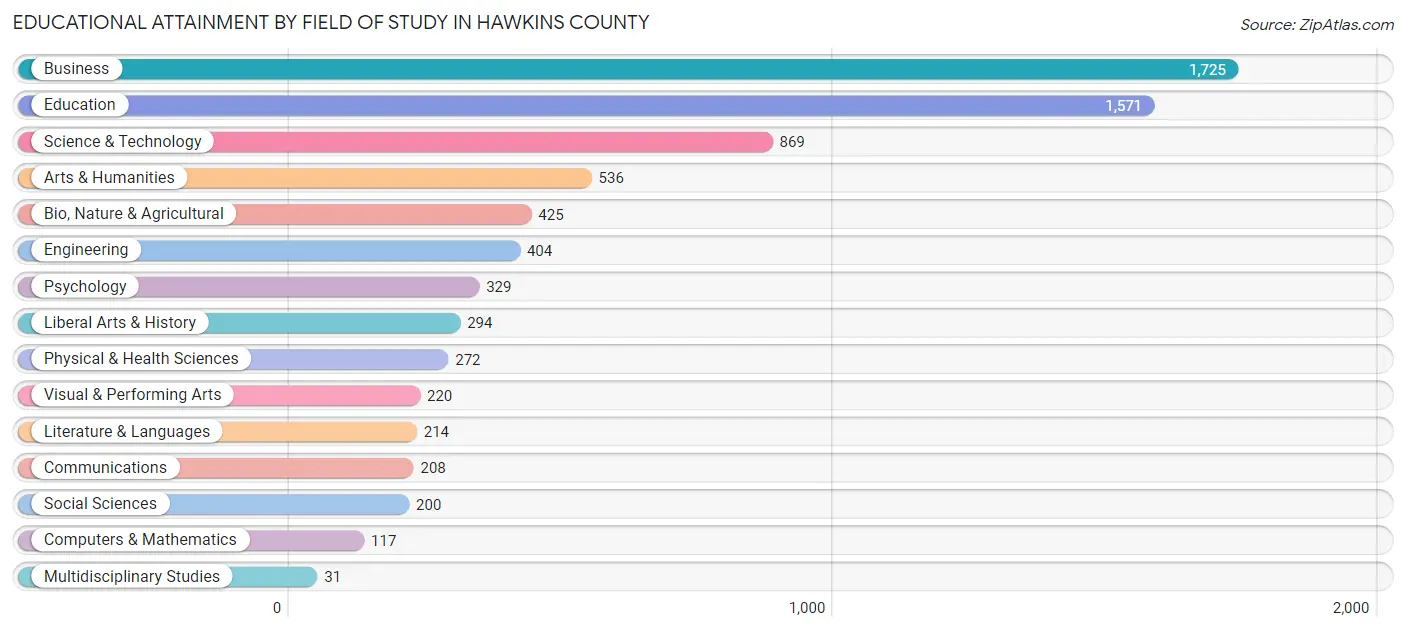
| Field of Study | # Graduates | % Graduates |
| Computers & Mathematics | 117 | 1.6% |
| Bio, Nature & Agricultural | 425 | 5.7% |
| Physical & Health Sciences | 272 | 3.7% |
| Psychology | 329 | 4.4% |
| Social Sciences | 200 | 2.7% |
| Engineering | 404 | 5.4% |
| Multidisciplinary Studies | 31 | 0.4% |
| Science & Technology | 869 | 11.7% |
| Business | 1,725 | 23.3% |
| Education | 1,571 | 21.2% |
| Literature & Languages | 214 | 2.9% |
| Liberal Arts & History | 294 | 4.0% |
| Visual & Performing Arts | 220 | 3.0% |
| Communications | 208 | 2.8% |
| Arts & Humanities | 536 | 7.2% |
| Total | 7,415 | 100.0% |
Transportation & Commute in Hawkins County
Vehicle Availability by Sex in Hawkins County
The most prevalent vehicle ownership categories in Hawkins County are males with 2 vehicles (4,334, accounting for 37.8%) and females with 2 vehicles (3,738, making up 43.2%).
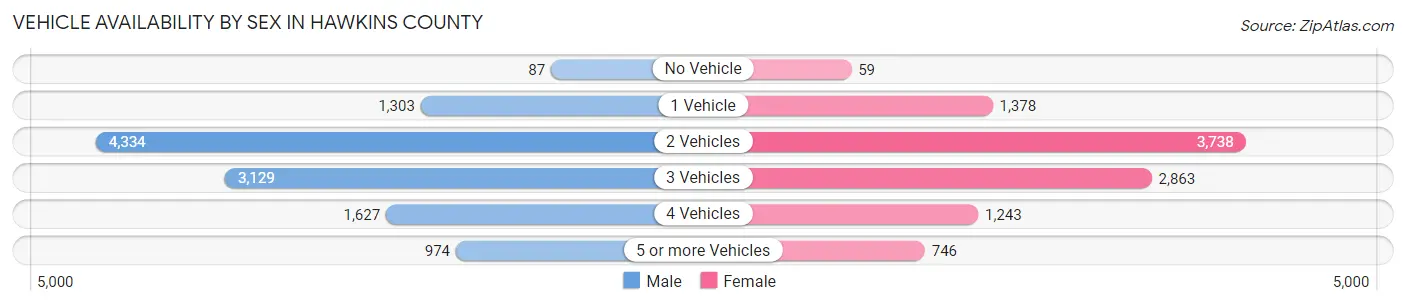
| Vehicles Available | Male | Female |
| No Vehicle | 87 (0.8%) | 59 (0.6%) |
| 1 Vehicle | 1,303 (11.4%) | 1,378 (13.7%) |
| 2 Vehicles | 4,334 (37.8%) | 3,738 (37.3%) |
| 3 Vehicles | 3,129 (27.3%) | 2,863 (28.5%) |
| 4 Vehicles | 1,627 (14.2%) | 1,243 (12.4%) |
| 5 or more Vehicles | 974 (8.5%) | 746 (7.4%) |
| Total | 11,454 (100.0%) | 10,027 (100.0%) |
Commute Time in Hawkins County
The most frequently occuring commute durations in Hawkins County are 20 to 24 minutes (3,084 commuters, 15.7%), 10 to 14 minutes (2,794 commuters, 14.2%), and 15 to 19 minutes (2,639 commuters, 13.4%).
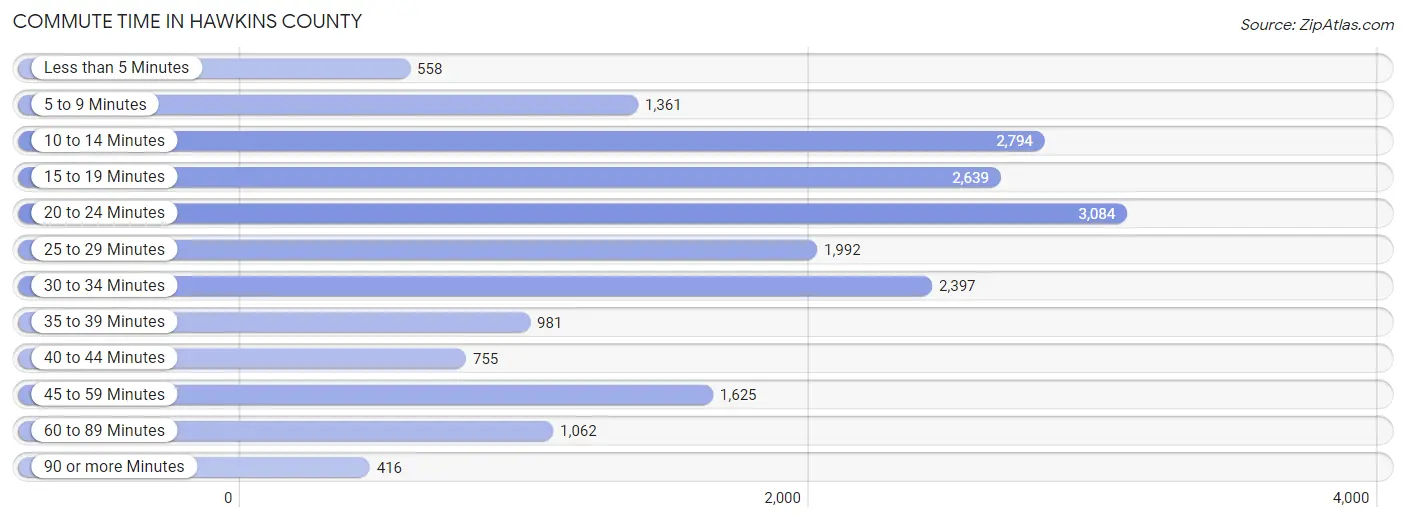
| Commute Time | # Commuters | % Commuters |
| Less than 5 Minutes | 558 | 2.8% |
| 5 to 9 Minutes | 1,361 | 6.9% |
| 10 to 14 Minutes | 2,794 | 14.2% |
| 15 to 19 Minutes | 2,639 | 13.4% |
| 20 to 24 Minutes | 3,084 | 15.7% |
| 25 to 29 Minutes | 1,992 | 10.1% |
| 30 to 34 Minutes | 2,397 | 12.2% |
| 35 to 39 Minutes | 981 | 5.0% |
| 40 to 44 Minutes | 755 | 3.8% |
| 45 to 59 Minutes | 1,625 | 8.3% |
| 60 to 89 Minutes | 1,062 | 5.4% |
| 90 or more Minutes | 416 | 2.1% |
Commute Time by Sex in Hawkins County
The most common commute times in Hawkins County are 20 to 24 minutes (1,477 commuters, 14.1%) for males and 20 to 24 minutes (1,607 commuters, 17.5%) for females.

| Commute Time | Male | Female |
| Less than 5 Minutes | 268 (2.6%) | 290 (3.2%) |
| 5 to 9 Minutes | 716 (6.8%) | 645 (7.0%) |
| 10 to 14 Minutes | 1,465 (14.0%) | 1,329 (14.5%) |
| 15 to 19 Minutes | 1,357 (13.0%) | 1,282 (14.0%) |
| 20 to 24 Minutes | 1,477 (14.1%) | 1,607 (17.5%) |
| 25 to 29 Minutes | 1,166 (11.1%) | 826 (9.0%) |
| 30 to 34 Minutes | 1,404 (13.4%) | 993 (10.8%) |
| 35 to 39 Minutes | 379 (3.6%) | 602 (6.6%) |
| 40 to 44 Minutes | 207 (2.0%) | 548 (6.0%) |
| 45 to 59 Minutes | 1,127 (10.7%) | 498 (5.4%) |
| 60 to 89 Minutes | 636 (6.1%) | 426 (4.6%) |
| 90 or more Minutes | 278 (2.6%) | 138 (1.5%) |
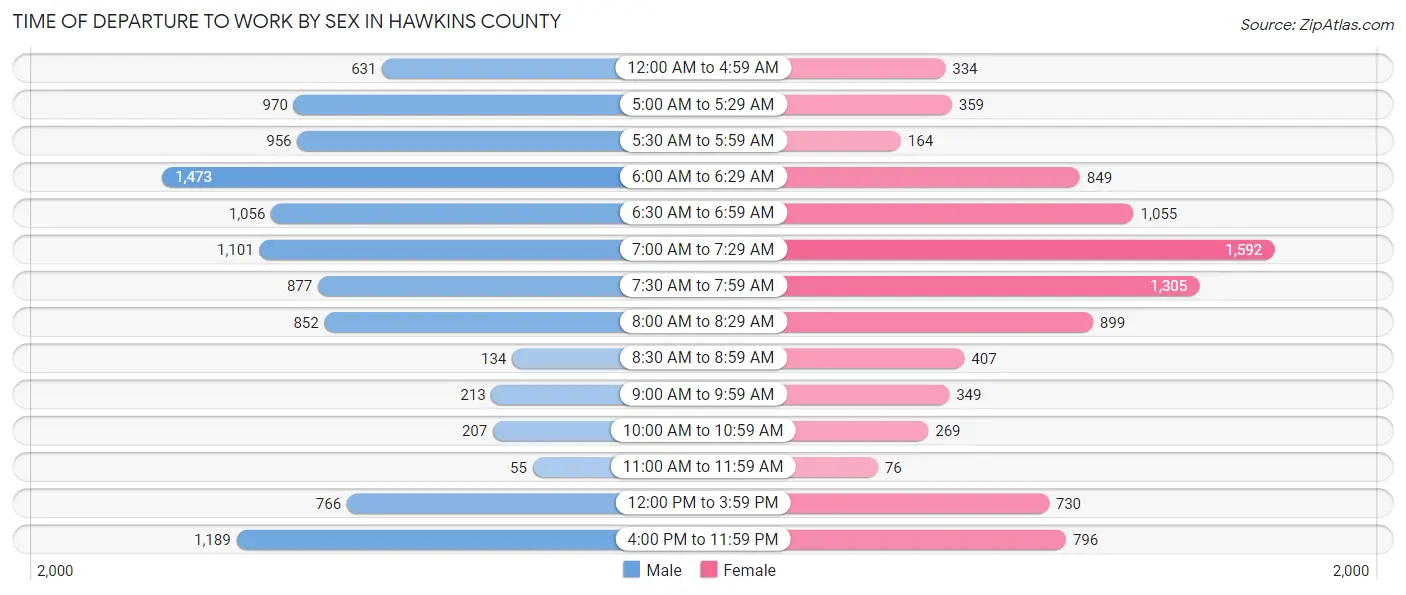
Time of Departure to Work by Sex in Hawkins County
The most frequent times of departure to work in Hawkins County are 6:00 AM to 6:29 AM (1,473, 14.1%) for males and 7:00 AM to 7:29 AM (1,592, 17.3%) for females.
| Time of Departure | Male | Female |
| 12:00 AM to 4:59 AM | 631 (6.0%) | 334 (3.6%) |
| 5:00 AM to 5:29 AM | 970 (9.3%) | 359 (3.9%) |
| 5:30 AM to 5:59 AM | 956 (9.1%) | 164 (1.8%) |
| 6:00 AM to 6:29 AM | 1,473 (14.1%) | 849 (9.2%) |
| 6:30 AM to 6:59 AM | 1,056 (10.1%) | 1,055 (11.5%) |
| 7:00 AM to 7:29 AM | 1,101 (10.5%) | 1,592 (17.3%) |
| 7:30 AM to 7:59 AM | 877 (8.4%) | 1,305 (14.2%) |
| 8:00 AM to 8:29 AM | 852 (8.1%) | 899 (9.8%) |
| 8:30 AM to 8:59 AM | 134 (1.3%) | 407 (4.4%) |
| 9:00 AM to 9:59 AM | 213 (2.0%) | 349 (3.8%) |
| 10:00 AM to 10:59 AM | 207 (2.0%) | 269 (2.9%) |
| 11:00 AM to 11:59 AM | 55 (0.5%) | 76 (0.8%) |
| 12:00 PM to 3:59 PM | 766 (7.3%) | 730 (8.0%) |
| 4:00 PM to 11:59 PM | 1,189 (11.4%) | 796 (8.7%) |
| Total | 10,480 (100.0%) | 9,184 (100.0%) |
Housing Occupancy in Hawkins County
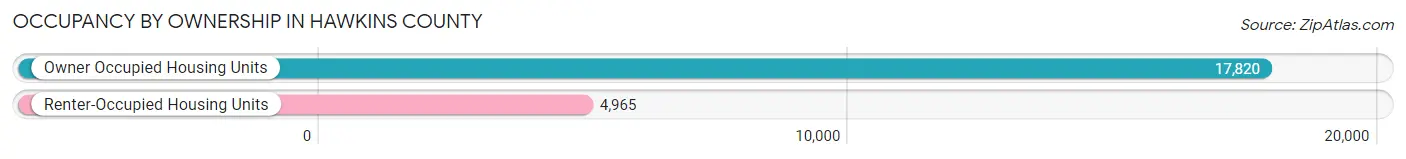
Occupancy by Ownership in Hawkins County
Of the total 22,785 dwellings in Hawkins County, owner-occupied units account for 17,820 (78.2%), while renter-occupied units make up 4,965 (21.8%).
| Occupancy | # Housing Units | % Housing Units |
| Owner Occupied Housing Units | 17,820 | 78.2% |
| Renter-Occupied Housing Units | 4,965 | 21.8% |
| Total Occupied Housing Units | 22,785 | 100.0% |
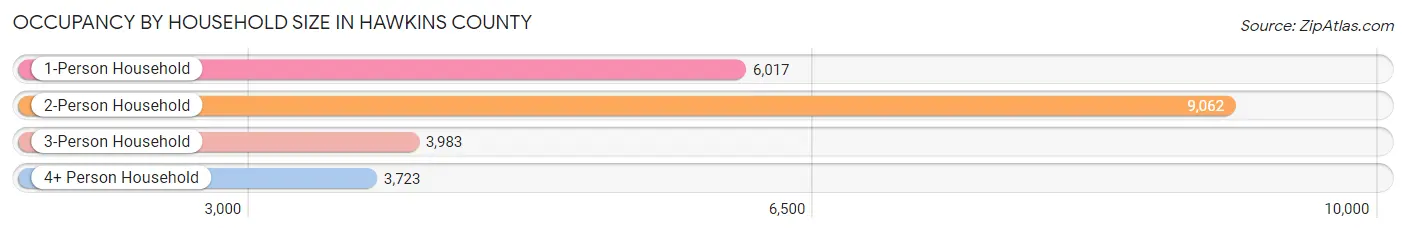
Occupancy by Household Size in Hawkins County
| Household Size | # Housing Units | % Housing Units |
| 1-Person Household | 6,017 | 26.4% |
| 2-Person Household | 9,062 | 39.8% |
| 3-Person Household | 3,983 | 17.5% |
| 4+ Person Household | 3,723 | 16.3% |
| Total Housing Units | 22,785 | 100.0% |
Occupancy by Ownership by Household Size in Hawkins County
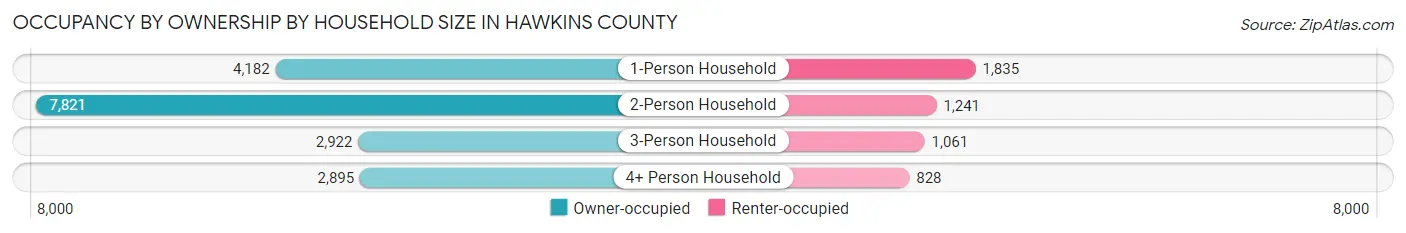
| Household Size | Owner-occupied | Renter-occupied |
| 1-Person Household | 4,182 (69.5%) | 1,835 (30.5%) |
| 2-Person Household | 7,821 (86.3%) | 1,241 (13.7%) |
| 3-Person Household | 2,922 (73.4%) | 1,061 (26.6%) |
| 4+ Person Household | 2,895 (77.8%) | 828 (22.2%) |
| Total Housing Units | 17,820 (78.2%) | 4,965 (21.8%) |
Occupancy by Educational Attainment in Hawkins County
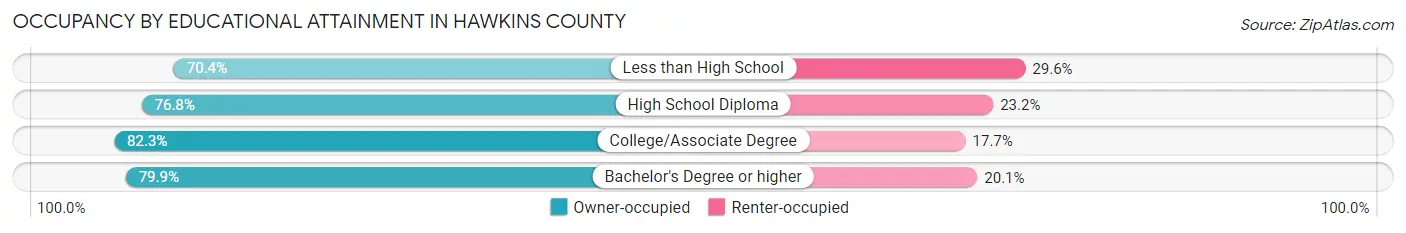
| Household Size | Owner-occupied | Renter-occupied |
| Less than High School | 1,976 (70.4%) | 831 (29.6%) |
| High School Diploma | 7,008 (76.8%) | 2,118 (23.2%) |
| College/Associate Degree | 5,667 (82.3%) | 1,221 (17.7%) |
| Bachelor's Degree or higher | 3,169 (79.9%) | 795 (20.1%) |
Occupancy by Age of Householder in Hawkins County
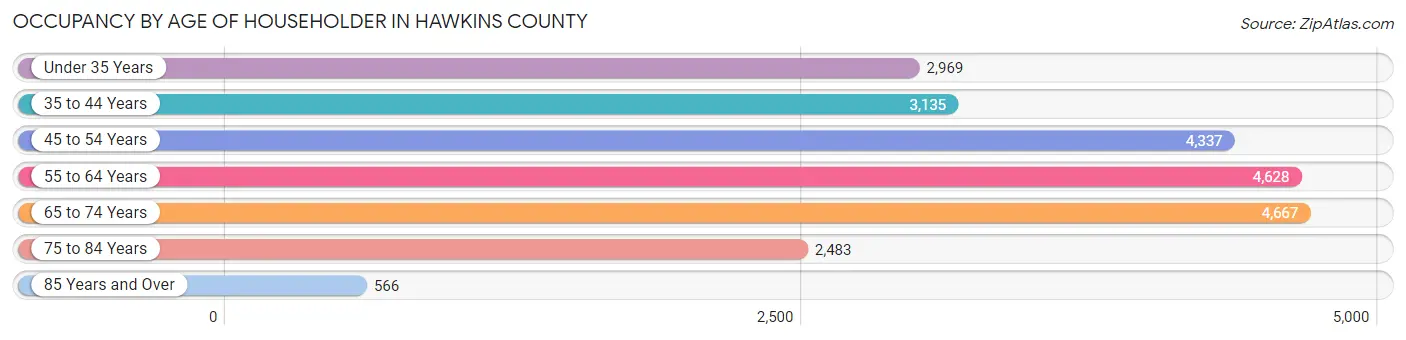
| Age Bracket | # Households | % Households |
| Under 35 Years | 2,969 | 13.0% |
| 35 to 44 Years | 3,135 | 13.8% |
| 45 to 54 Years | 4,337 | 19.0% |
| 55 to 64 Years | 4,628 | 20.3% |
| 65 to 74 Years | 4,667 | 20.5% |
| 75 to 84 Years | 2,483 | 10.9% |
| 85 Years and Over | 566 | 2.5% |
| Total | 22,785 | 100.0% |
Housing Finances in Hawkins County
Median Income by Occupancy in Hawkins County
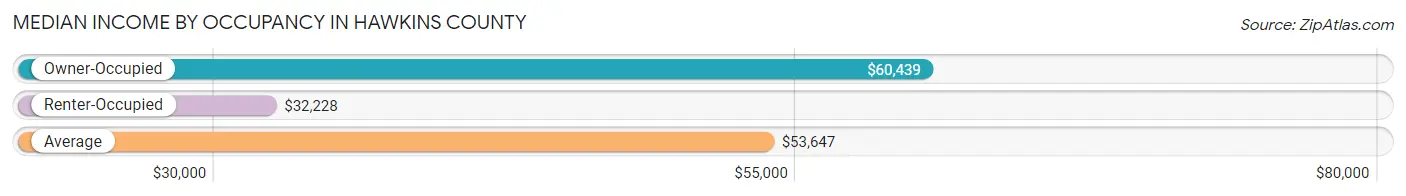
| Occupancy Type | # Households | Median Income |
| Owner-Occupied | 17,820 (78.2%) | $60,439 |
| Renter-Occupied | 4,965 (21.8%) | $32,228 |
| Average | 22,785 (100.0%) | $53,647 |
Occupancy by Householder Income Bracket in Hawkins County
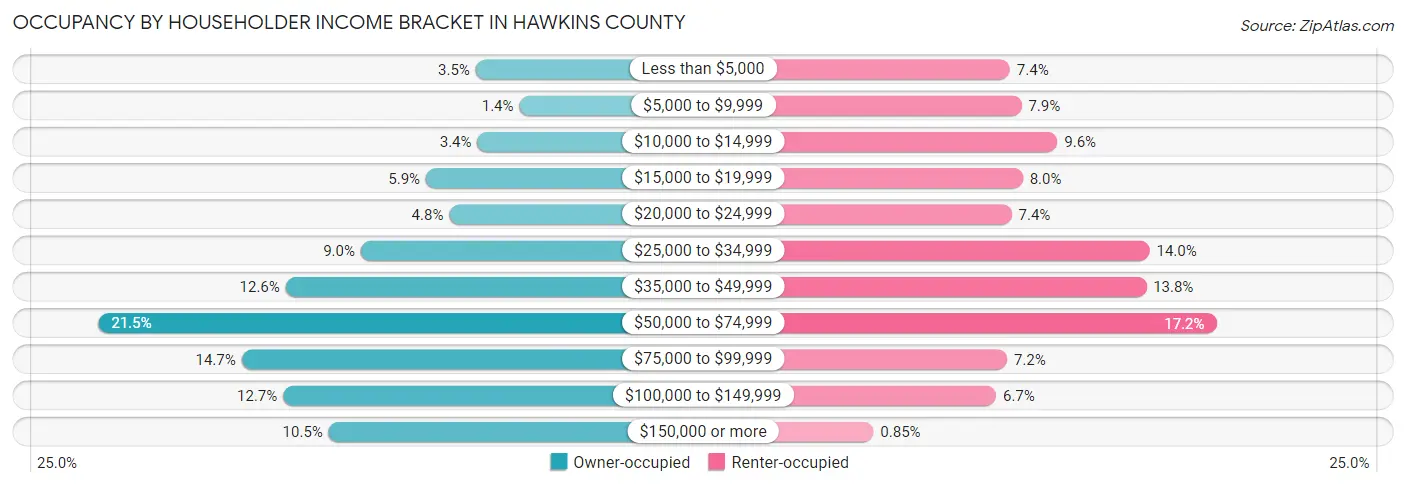
| Income Bracket | Owner-occupied | Renter-occupied |
| Less than $5,000 | 627 (3.5%) | 365 (7.3%) |
| $5,000 to $9,999 | 257 (1.4%) | 392 (7.9%) |
| $10,000 to $14,999 | 613 (3.4%) | 477 (9.6%) |
| $15,000 to $19,999 | 1,049 (5.9%) | 395 (8.0%) |
| $20,000 to $24,999 | 852 (4.8%) | 369 (7.4%) |
| $25,000 to $34,999 | 1,602 (9.0%) | 695 (14.0%) |
| $35,000 to $49,999 | 2,240 (12.6%) | 687 (13.8%) |
| $50,000 to $74,999 | 3,830 (21.5%) | 853 (17.2%) |
| $75,000 to $99,999 | 2,614 (14.7%) | 358 (7.2%) |
| $100,000 to $149,999 | 2,261 (12.7%) | 332 (6.7%) |
| $150,000 or more | 1,875 (10.5%) | 42 (0.9%) |
| Total | 17,820 (100.0%) | 4,965 (100.0%) |
Monthly Housing Cost Tiers in Hawkins County
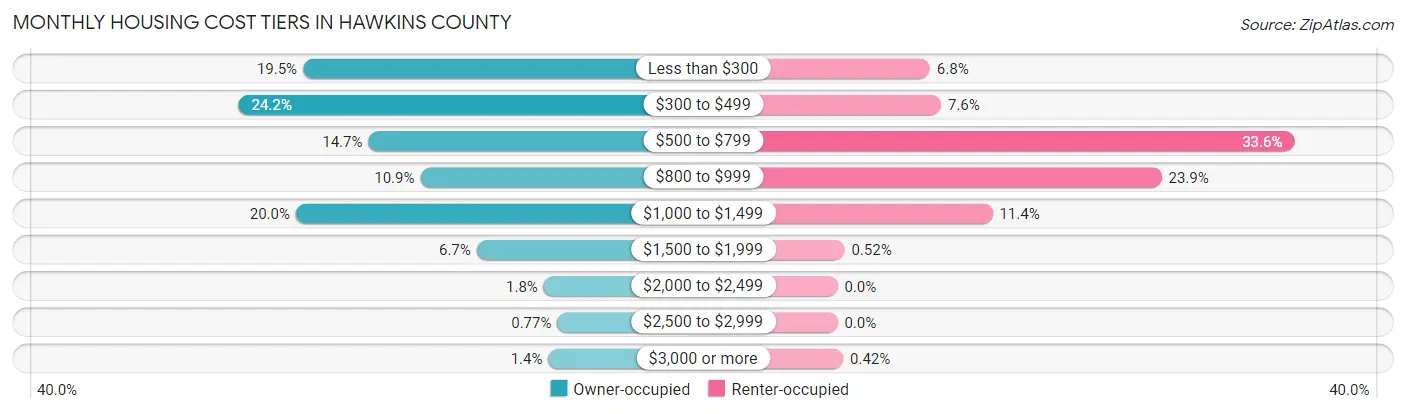
| Monthly Cost | Owner-occupied | Renter-occupied |
| Less than $300 | 3,475 (19.5%) | 338 (6.8%) |
| $300 to $499 | 4,320 (24.2%) | 379 (7.6%) |
| $500 to $799 | 2,617 (14.7%) | 1,670 (33.6%) |
| $800 to $999 | 1,935 (10.9%) | 1,185 (23.9%) |
| $1,000 to $1,499 | 3,569 (20.0%) | 567 (11.4%) |
| $1,500 to $1,999 | 1,196 (6.7%) | 26 (0.5%) |
| $2,000 to $2,499 | 316 (1.8%) | 0 (0.0%) |
| $2,500 to $2,999 | 137 (0.8%) | 0 (0.0%) |
| $3,000 or more | 255 (1.4%) | 21 (0.4%) |
| Total | 17,820 (100.0%) | 4,965 (100.0%) |
Physical Housing Characteristics in Hawkins County
Housing Structures in Hawkins County
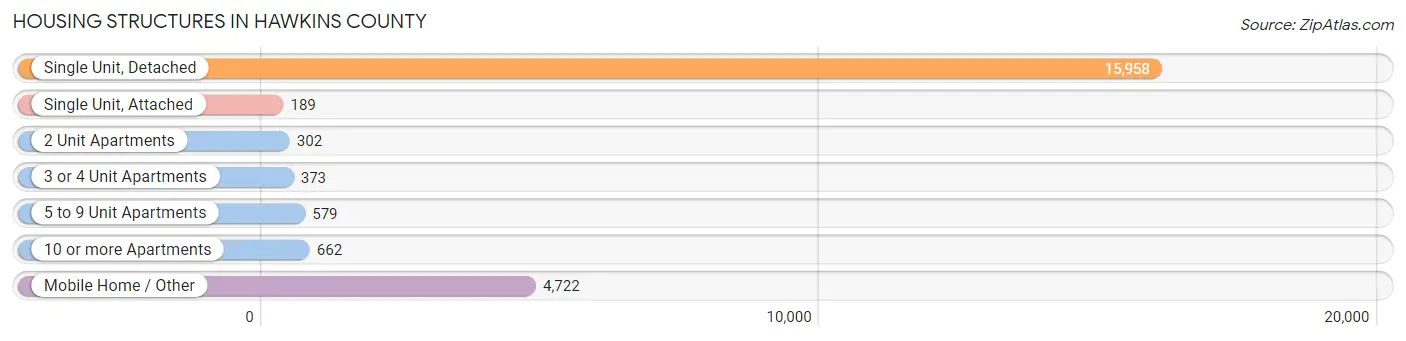
| Structure Type | # Housing Units | % Housing Units |
| Single Unit, Detached | 15,958 | 70.0% |
| Single Unit, Attached | 189 | 0.8% |
| 2 Unit Apartments | 302 | 1.3% |
| 3 or 4 Unit Apartments | 373 | 1.6% |
| 5 to 9 Unit Apartments | 579 | 2.5% |
| 10 or more Apartments | 662 | 2.9% |
| Mobile Home / Other | 4,722 | 20.7% |
| Total | 22,785 | 100.0% |
Housing Structures by Occupancy in Hawkins County
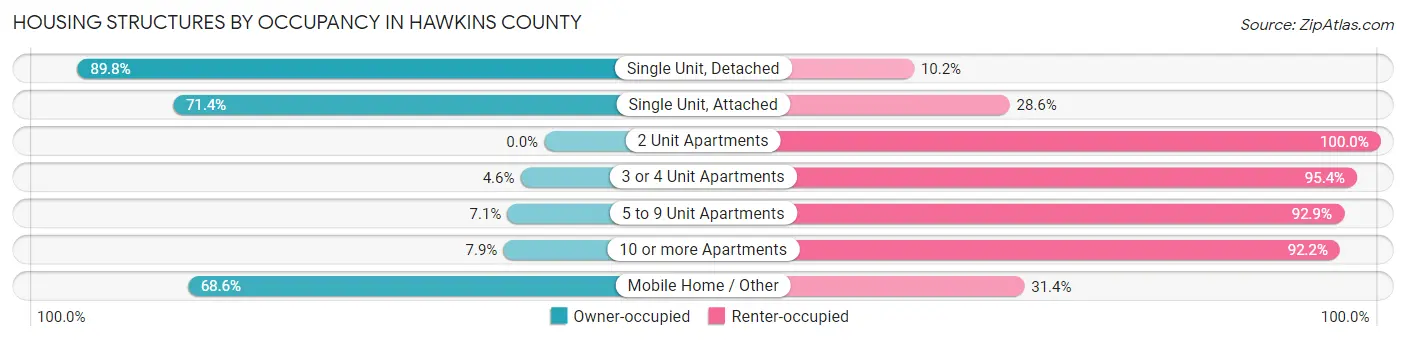
| Structure Type | Owner-occupied | Renter-occupied |
| Single Unit, Detached | 14,336 (89.8%) | 1,622 (10.2%) |
| Single Unit, Attached | 135 (71.4%) | 54 (28.6%) |
| 2 Unit Apartments | 0 (0.0%) | 302 (100.0%) |
| 3 or 4 Unit Apartments | 17 (4.6%) | 356 (95.4%) |
| 5 to 9 Unit Apartments | 41 (7.1%) | 538 (92.9%) |
| 10 or more Apartments | 52 (7.9%) | 610 (92.1%) |
| Mobile Home / Other | 3,239 (68.6%) | 1,483 (31.4%) |
| Total | 17,820 (78.2%) | 4,965 (21.8%) |
Housing Structures by Number of Rooms in Hawkins County
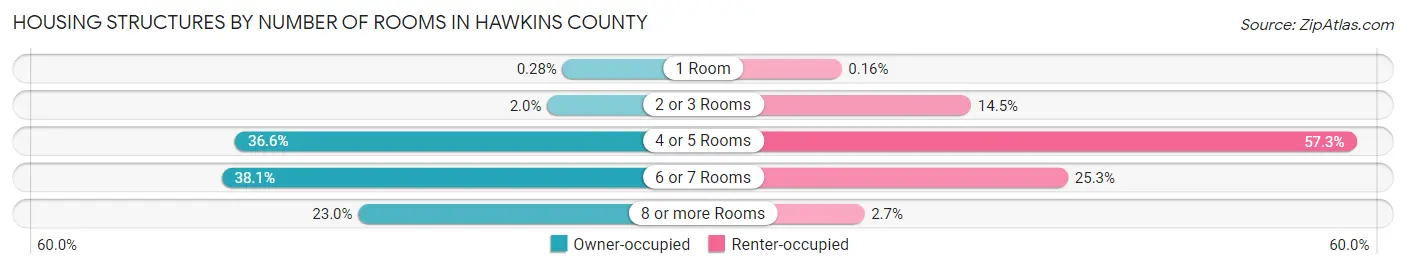
| Number of Rooms | Owner-occupied | Renter-occupied |
| 1 Room | 50 (0.3%) | 8 (0.2%) |
| 2 or 3 Rooms | 354 (2.0%) | 722 (14.5%) |
| 4 or 5 Rooms | 6,529 (36.6%) | 2,845 (57.3%) |
| 6 or 7 Rooms | 6,796 (38.1%) | 1,256 (25.3%) |
| 8 or more Rooms | 4,091 (23.0%) | 134 (2.7%) |
| Total | 17,820 (100.0%) | 4,965 (100.0%) |
Housing Structure by Heating Type in Hawkins County
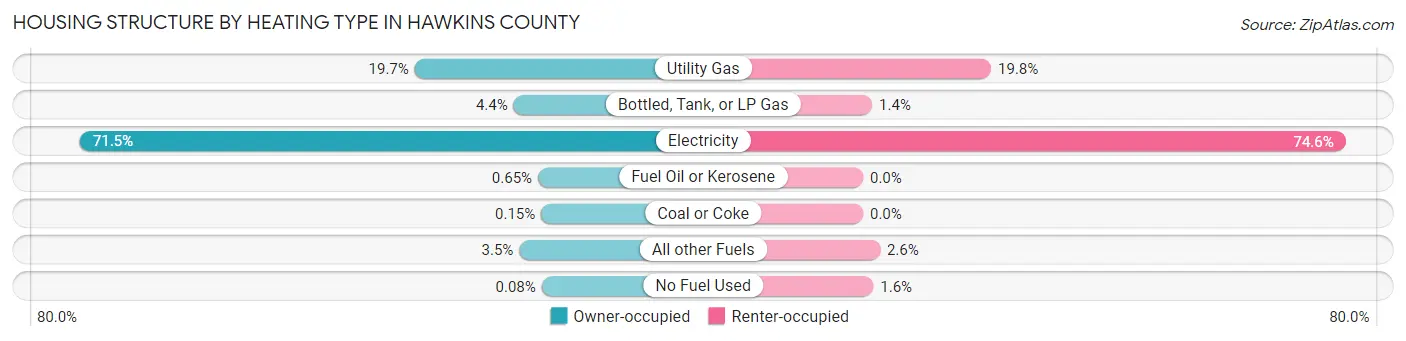
| Heating Type | Owner-occupied | Renter-occupied |
| Utility Gas | 3,512 (19.7%) | 983 (19.8%) |
| Bottled, Tank, or LP Gas | 786 (4.4%) | 70 (1.4%) |
| Electricity | 12,733 (71.5%) | 3,703 (74.6%) |
| Fuel Oil or Kerosene | 116 (0.6%) | 0 (0.0%) |
| Coal or Coke | 27 (0.2%) | 0 (0.0%) |
| All other Fuels | 631 (3.5%) | 130 (2.6%) |
| No Fuel Used | 15 (0.1%) | 79 (1.6%) |
| Total | 17,820 (100.0%) | 4,965 (100.0%) |
Household Vehicle Usage in Hawkins County
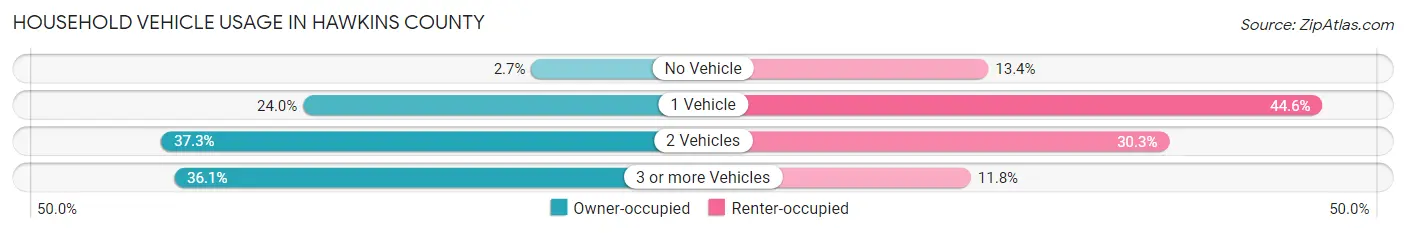
| Vehicles per Household | Owner-occupied | Renter-occupied |
| No Vehicle | 481 (2.7%) | 665 (13.4%) |
| 1 Vehicle | 4,276 (24.0%) | 2,213 (44.6%) |
| 2 Vehicles | 6,638 (37.2%) | 1,503 (30.3%) |
| 3 or more Vehicles | 6,425 (36.0%) | 584 (11.8%) |
| Total | 17,820 (100.0%) | 4,965 (100.0%) |
Real Estate & Mortgages in Hawkins County
Real Estate and Mortgage Overview in Hawkins County
| Characteristic | Without Mortgage | With Mortgage |
| Housing Units | 9,094 | 8,726 |
| Median Property Value | $133,400 | $171,100 |
| Median Household Income | $44,534 | $1,388 |
| Monthly Housing Costs | $348 | $251 |
| Real Estate Taxes | $822 | $216 |
Property Value by Mortgage Status in Hawkins County
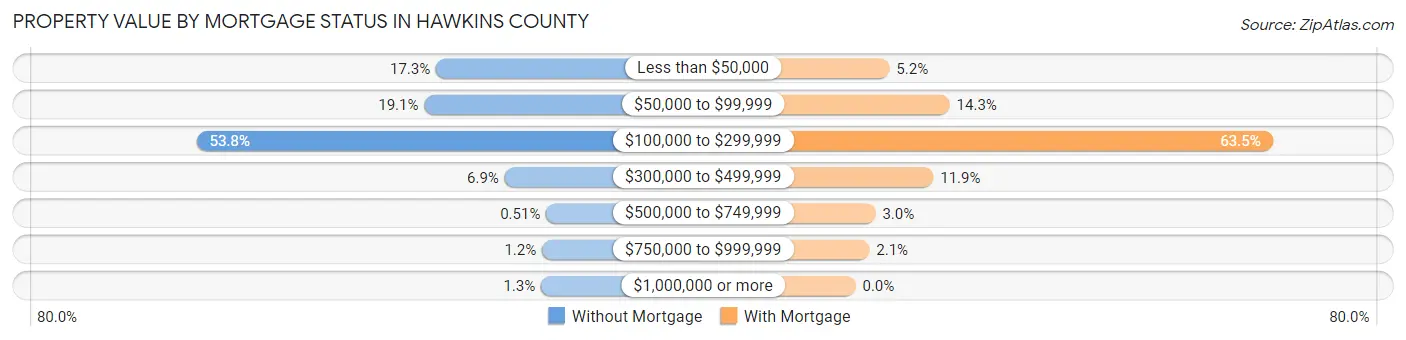
| Property Value | Without Mortgage | With Mortgage |
| Less than $50,000 | 1,573 (17.3%) | 450 (5.2%) |
| $50,000 to $99,999 | 1,737 (19.1%) | 1,251 (14.3%) |
| $100,000 to $299,999 | 4,892 (53.8%) | 5,544 (63.5%) |
| $300,000 to $499,999 | 623 (6.9%) | 1,034 (11.8%) |
| $500,000 to $749,999 | 46 (0.5%) | 264 (3.0%) |
| $750,000 to $999,999 | 105 (1.1%) | 183 (2.1%) |
| $1,000,000 or more | 118 (1.3%) | 0 (0.0%) |
| Total | 9,094 (100.0%) | 8,726 (100.0%) |
Household Income by Mortgage Status in Hawkins County
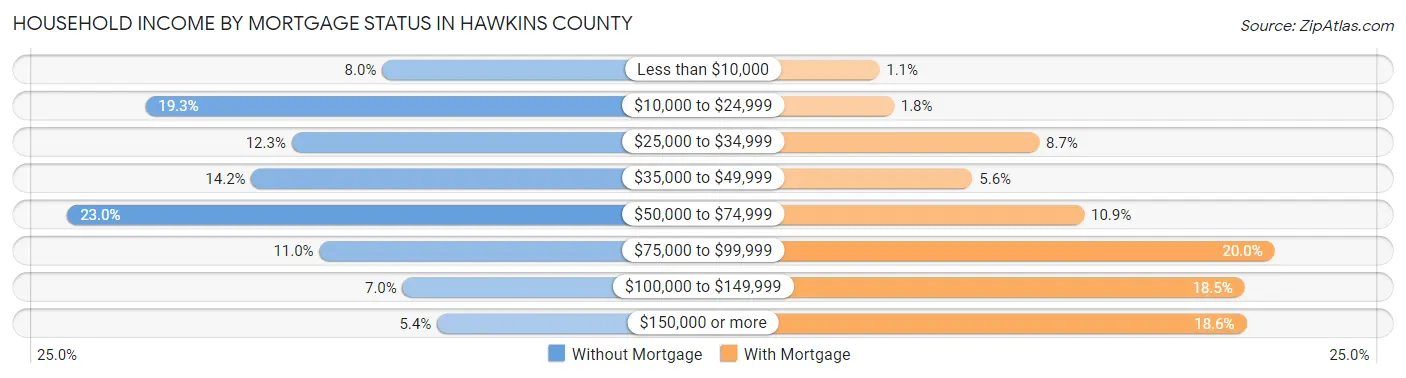
| Household Income | Without Mortgage | With Mortgage |
| Less than $10,000 | 725 (8.0%) | 99 (1.1%) |
| $10,000 to $24,999 | 1,751 (19.3%) | 159 (1.8%) |
| $25,000 to $34,999 | 1,117 (12.3%) | 763 (8.7%) |
| $35,000 to $49,999 | 1,291 (14.2%) | 485 (5.6%) |
| $50,000 to $74,999 | 2,089 (23.0%) | 949 (10.9%) |
| $75,000 to $99,999 | 997 (11.0%) | 1,741 (20.0%) |
| $100,000 to $149,999 | 637 (7.0%) | 1,617 (18.5%) |
| $150,000 or more | 487 (5.4%) | 1,624 (18.6%) |
| Total | 9,094 (100.0%) | 8,726 (100.0%) |
Property Value to Household Income Ratio in Hawkins County
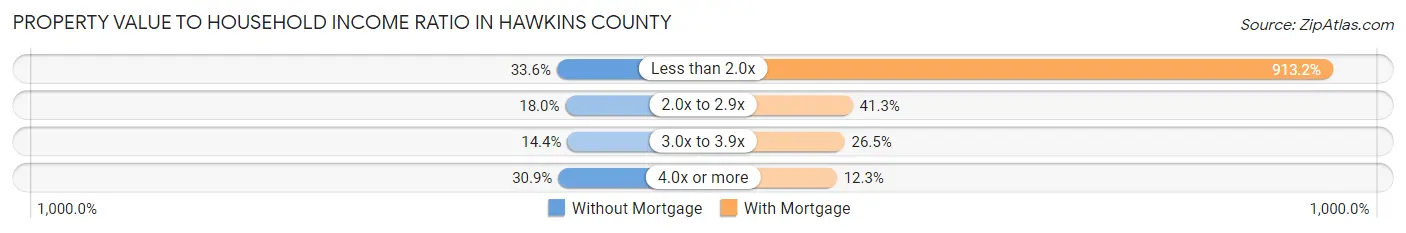
| Value-to-Income Ratio | Without Mortgage | With Mortgage |
| Less than 2.0x | 3,052 (33.6%) | 79,684 (913.2%) |
| 2.0x to 2.9x | 1,634 (18.0%) | 3,604 (41.3%) |
| 3.0x to 3.9x | 1,307 (14.4%) | 2,316 (26.5%) |
| 4.0x or more | 2,814 (30.9%) | 1,074 (12.3%) |
| Total | 9,094 (100.0%) | 8,726 (100.0%) |
Real Estate Taxes by Mortgage Status in Hawkins County
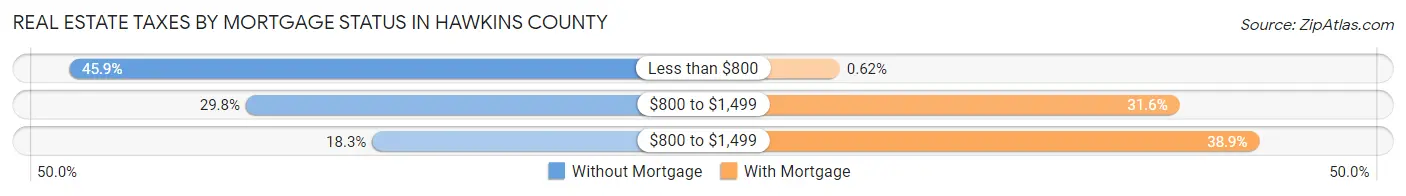
| Property Taxes | Without Mortgage | With Mortgage |
| Less than $800 | 4,178 (45.9%) | 54 (0.6%) |
| $800 to $1,499 | 2,710 (29.8%) | 2,761 (31.6%) |
| $800 to $1,499 | 1,661 (18.3%) | 3,396 (38.9%) |
| Total | 9,094 (100.0%) | 8,726 (100.0%) |
Health & Disability in Hawkins County
Health Insurance Coverage by Age in Hawkins County
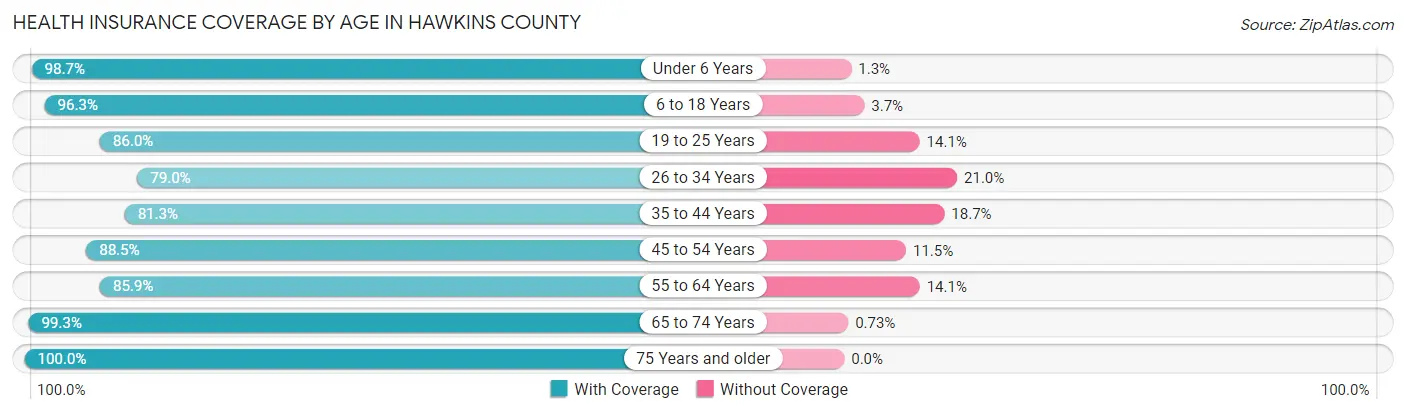
| Age Bracket | With Coverage | Without Coverage |
| Under 6 Years | 3,381 (98.7%) | 45 (1.3%) |
| 6 to 18 Years | 7,858 (96.3%) | 305 (3.7%) |
| 19 to 25 Years | 3,988 (86.0%) | 652 (14.1%) |
| 26 to 34 Years | 4,372 (79.0%) | 1,165 (21.0%) |
| 35 to 44 Years | 4,969 (81.3%) | 1,141 (18.7%) |
| 45 to 54 Years | 7,143 (88.5%) | 929 (11.5%) |
| 55 to 64 Years | 7,346 (85.9%) | 1,203 (14.1%) |
| 65 to 74 Years | 7,188 (99.3%) | 53 (0.7%) |
| 75 Years and older | 4,749 (100.0%) | 0 (0.0%) |
| Total | 50,994 (90.3%) | 5,493 (9.7%) |
Health Insurance Coverage by Citizenship Status in Hawkins County
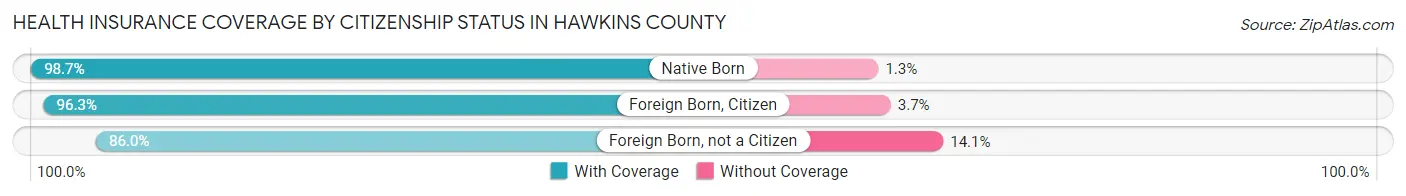
| Citizenship Status | With Coverage | Without Coverage |
| Native Born | 3,381 (98.7%) | 45 (1.3%) |
| Foreign Born, Citizen | 7,858 (96.3%) | 305 (3.7%) |
| Foreign Born, not a Citizen | 3,988 (86.0%) | 652 (14.1%) |
Health Insurance Coverage by Household Income in Hawkins County
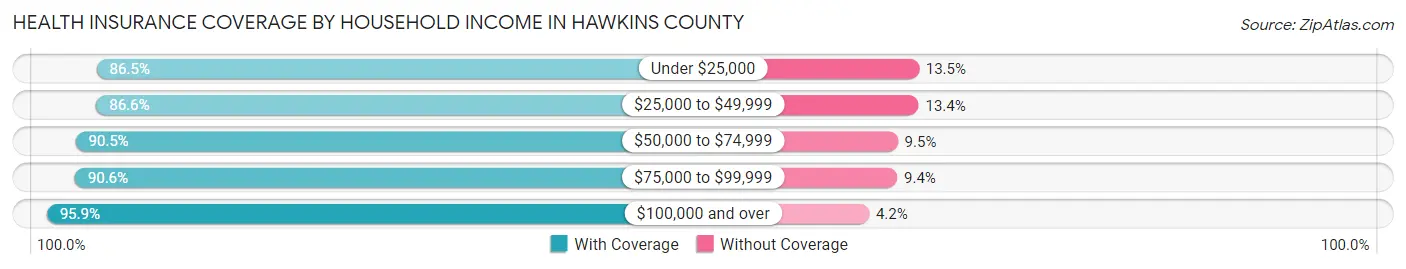
| Household Income | With Coverage | Without Coverage |
| Under $25,000 | 8,237 (86.5%) | 1,284 (13.5%) |
| $25,000 to $49,999 | 10,539 (86.6%) | 1,637 (13.4%) |
| $50,000 to $74,999 | 11,438 (90.5%) | 1,205 (9.5%) |
| $75,000 to $99,999 | 7,698 (90.6%) | 801 (9.4%) |
| $100,000 and over | 13,077 (95.9%) | 566 (4.2%) |
Public vs Private Health Insurance Coverage by Age in Hawkins County
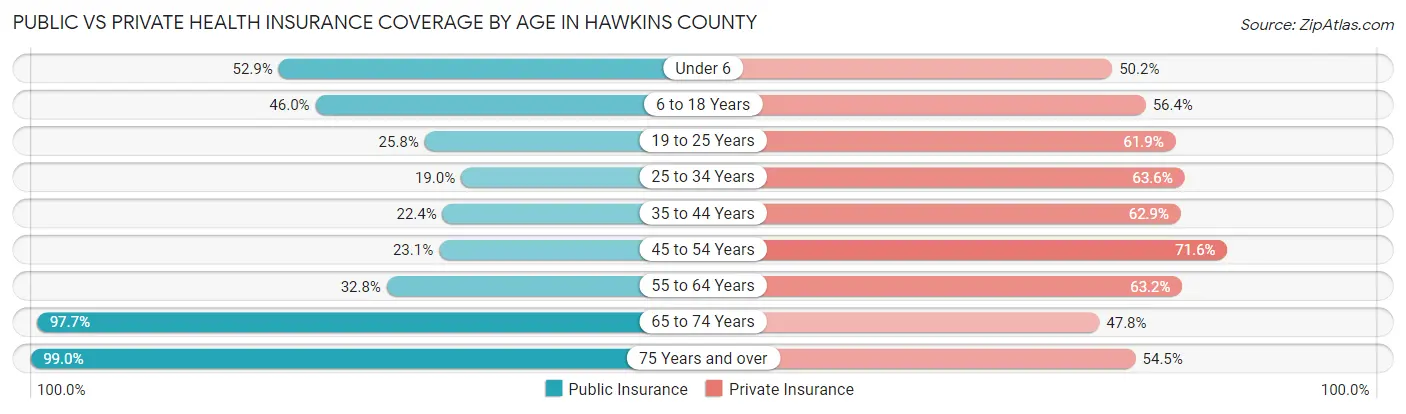
| Age Bracket | Public Insurance | Private Insurance |
| Under 6 | 1,811 (52.9%) | 1,720 (50.2%) |
| 6 to 18 Years | 3,757 (46.0%) | 4,605 (56.4%) |
| 19 to 25 Years | 1,195 (25.8%) | 2,874 (61.9%) |
| 25 to 34 Years | 1,052 (19.0%) | 3,522 (63.6%) |
| 35 to 44 Years | 1,370 (22.4%) | 3,844 (62.9%) |
| 45 to 54 Years | 1,863 (23.1%) | 5,777 (71.6%) |
| 55 to 64 Years | 2,803 (32.8%) | 5,402 (63.2%) |
| 65 to 74 Years | 7,077 (97.7%) | 3,462 (47.8%) |
| 75 Years and over | 4,699 (99.0%) | 2,590 (54.5%) |
| Total | 25,627 (45.4%) | 33,796 (59.8%) |
Disability Status by Sex by Age in Hawkins County
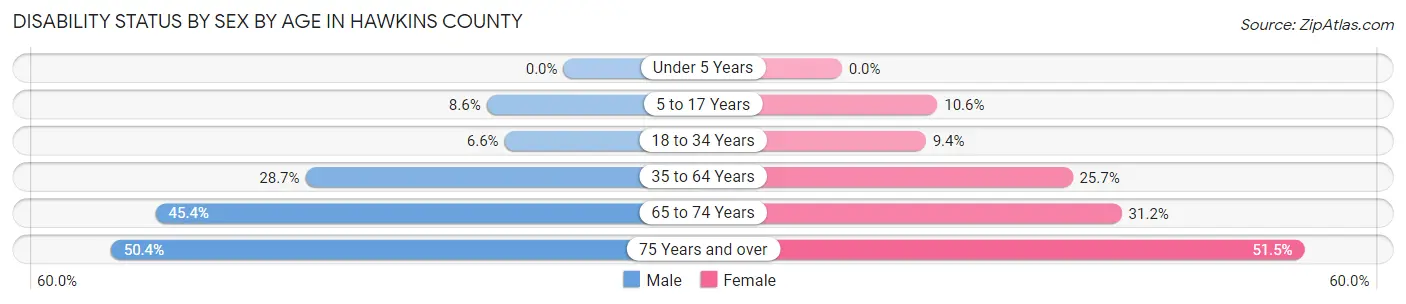
| Age Bracket | Male | Female |
| Under 5 Years | 0 (0.0%) | 0 (0.0%) |
| 5 to 17 Years | 364 (8.6%) | 430 (10.6%) |
| 18 to 34 Years | 351 (6.6%) | 505 (9.3%) |
| 35 to 64 Years | 3,251 (28.7%) | 2,932 (25.7%) |
| 65 to 74 Years | 1,550 (45.4%) | 1,193 (31.2%) |
| 75 Years and over | 1,068 (50.4%) | 1,355 (51.5%) |
Disability Class by Sex by Age in Hawkins County
Disability Class: Hearing Difficulty
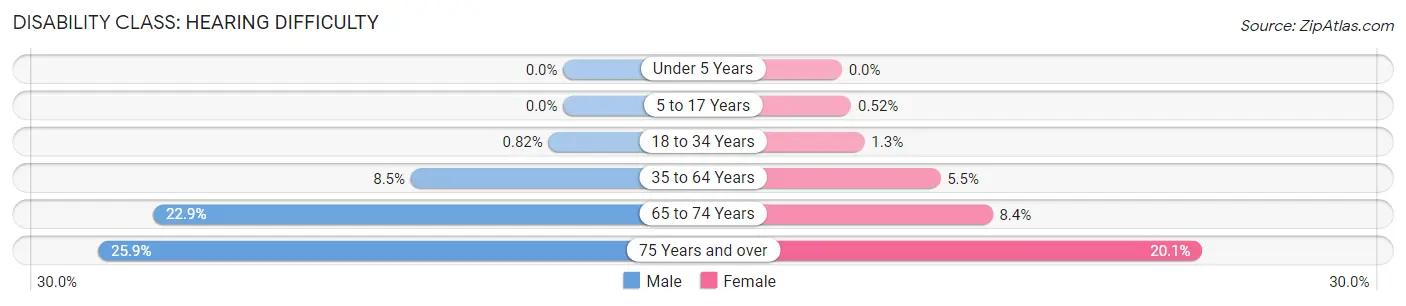
| Age Bracket | Male | Female |
| Under 5 Years | 0 (0.0%) | 0 (0.0%) |
| 5 to 17 Years | 0 (0.0%) | 21 (0.5%) |
| 18 to 34 Years | 44 (0.8%) | 68 (1.3%) |
| 35 to 64 Years | 961 (8.5%) | 625 (5.5%) |
| 65 to 74 Years | 780 (22.9%) | 321 (8.4%) |
| 75 Years and over | 549 (25.9%) | 528 (20.1%) |
Disability Class: Vision Difficulty
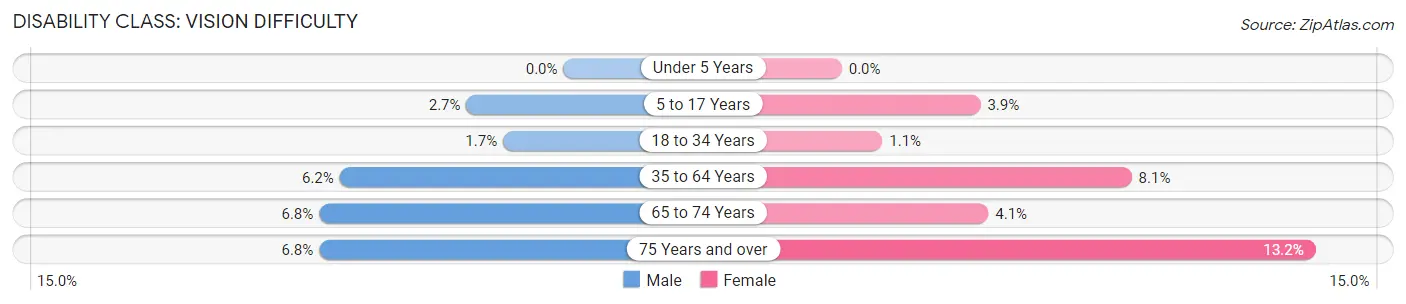
| Age Bracket | Male | Female |
| Under 5 Years | 0 (0.0%) | 0 (0.0%) |
| 5 to 17 Years | 115 (2.7%) | 156 (3.9%) |
| 18 to 34 Years | 90 (1.7%) | 61 (1.1%) |
| 35 to 64 Years | 705 (6.2%) | 921 (8.1%) |
| 65 to 74 Years | 232 (6.8%) | 156 (4.1%) |
| 75 Years and over | 144 (6.8%) | 347 (13.2%) |
Disability Class: Cognitive Difficulty
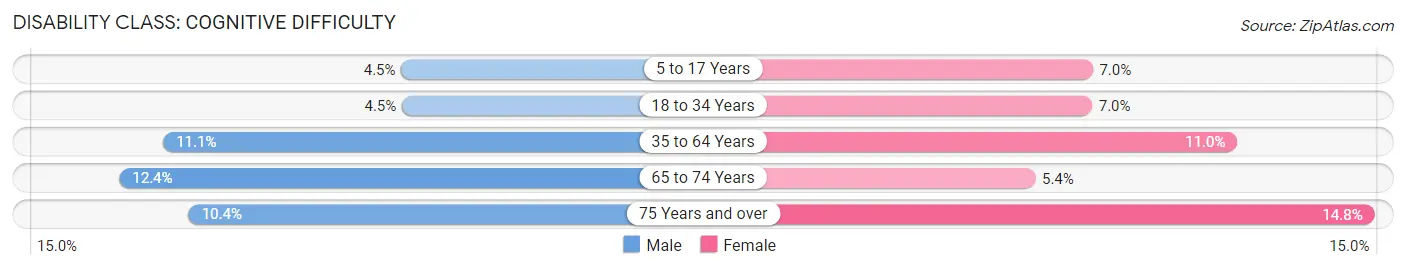
| Age Bracket | Male | Female |
| 5 to 17 Years | 192 (4.5%) | 282 (7.0%) |
| 18 to 34 Years | 240 (4.5%) | 376 (7.0%) |
| 35 to 64 Years | 1,261 (11.1%) | 1,257 (11.0%) |
| 65 to 74 Years | 422 (12.4%) | 206 (5.4%) |
| 75 Years and over | 221 (10.4%) | 390 (14.8%) |
Disability Class: Ambulatory Difficulty
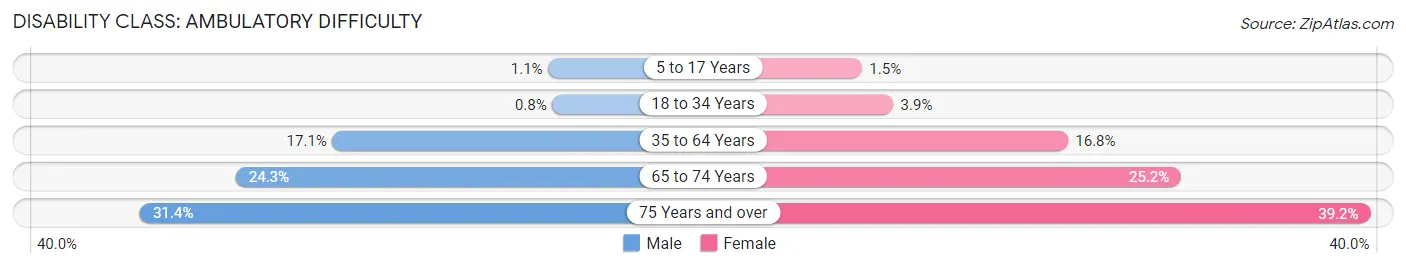
| Age Bracket | Male | Female |
| 5 to 17 Years | 47 (1.1%) | 62 (1.5%) |
| 18 to 34 Years | 43 (0.8%) | 208 (3.8%) |
| 35 to 64 Years | 1,938 (17.1%) | 1,920 (16.8%) |
| 65 to 74 Years | 830 (24.3%) | 964 (25.2%) |
| 75 Years and over | 666 (31.4%) | 1,032 (39.2%) |
Disability Class: Self-Care Difficulty
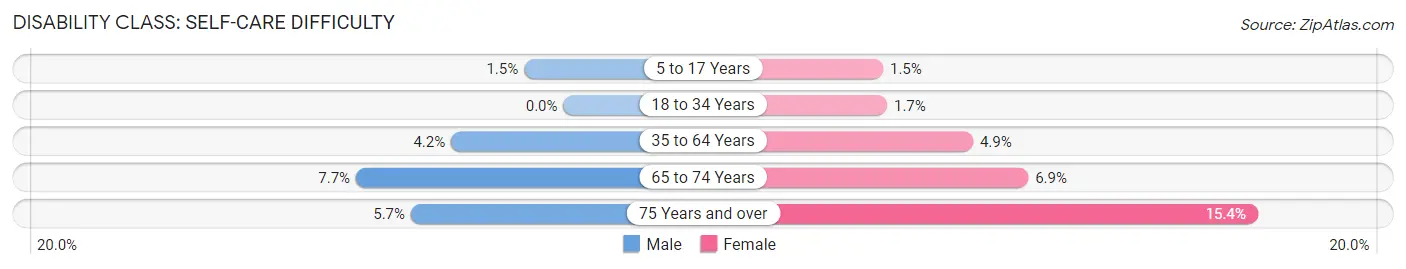
| Age Bracket | Male | Female |
| 5 to 17 Years | 62 (1.5%) | 62 (1.5%) |
| 18 to 34 Years | 0 (0.0%) | 91 (1.7%) |
| 35 to 64 Years | 472 (4.2%) | 556 (4.9%) |
| 65 to 74 Years | 263 (7.7%) | 265 (6.9%) |
| 75 Years and over | 120 (5.7%) | 406 (15.4%) |
Technology Access in Hawkins County
Computing Device Access in Hawkins County
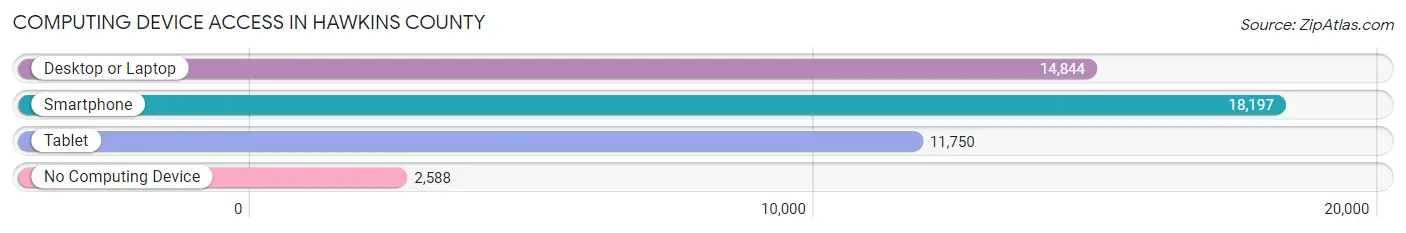
| Device Type | # Households | % Households |
| Desktop or Laptop | 14,844 | 65.1% |
| Smartphone | 18,197 | 79.9% |
| Tablet | 11,750 | 51.6% |
| No Computing Device | 2,588 | 11.4% |
| Total | 22,785 | 100.0% |
Internet Access in Hawkins County
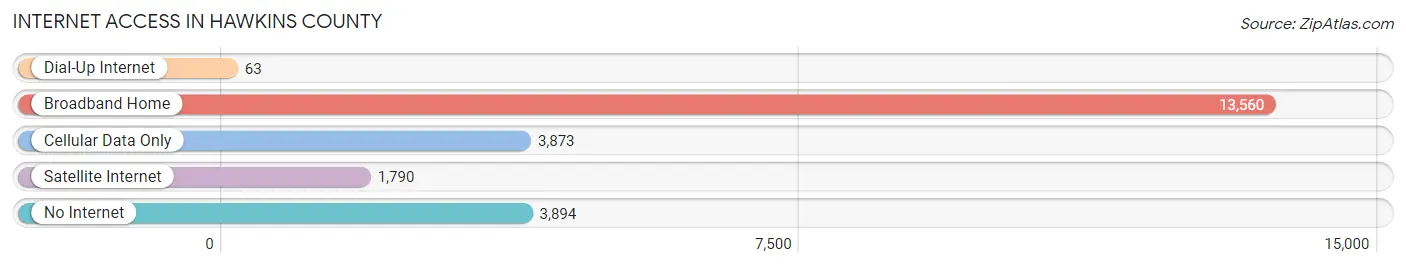
| Internet Type | # Households | % Households |
| Dial-Up Internet | 63 | 0.3% |
| Broadband Home | 13,560 | 59.5% |
| Cellular Data Only | 3,873 | 17.0% |
| Satellite Internet | 1,790 | 7.9% |
| No Internet | 3,894 | 17.1% |
| Total | 22,785 | 100.0% |
Hawkins County Summary
Hawkins County is located in the northeastern corner of Tennessee, and is part of the Tri-Cities region. It is bordered by Sullivan County to the north, Greene County to the east, Hancock County to the south, and Hamblen County to the west. The county seat is Rogersville, and the largest city is Church Hill. The county was established in 1787 and named for Benjamin Hawkins, a Revolutionary War hero and statesman.
Geography
Hawkins County covers an area of 517 square miles, with a population of 56,833 as of the 2010 census. The terrain is mostly hilly, with the highest point being Clinch Mountain at 2,890 feet. The county is drained by the Holston River, which forms the northern border. Other major waterways include the Nolichucky River, which forms the western border, and the Clinch River, which forms the eastern border.
The county is home to several state parks, including Warriors' Path State Park, which offers camping, fishing, and hiking. Other attractions include the historic Rogersville Town Hall, the Hawkins County Museum, and the Hawkins County Courthouse.
Economy
The economy of Hawkins County is largely based on agriculture, with the main crops being corn, soybeans, and tobacco. The county is also home to several manufacturing companies, including Eastman Chemical Company, which produces chemicals and plastics, and Holston Army Ammunition Plant, which produces ammunition for the U.S. military.
The county is also home to several educational institutions, including the University of Tennessee at Knoxville, East Tennessee State University, and Walters State Community College.
Demographics
As of the 2010 census, the population of Hawkins County was 56,833, with a racial makeup of 92.3% White, 4.2% African American, 0.7% Native American, 0.4% Asian, 0.1% Pacific Islander, 1.2% from other races, and 1.1% from two or more races. Hispanic or Latino of any race were 2.3% of the population.
The median household income was $37,845, and the median family income was $45,945. The per capita income was $19,945. About 15.2% of the population was below the poverty line.
The largest employers in the county are Eastman Chemical Company, Holston Army Ammunition Plant, and Hawkins County Schools. The county is served by the Hawkins County School System, which consists of 15 elementary schools, four middle schools, and three high schools.
Common Questions
What is the Total Population of Hawkins County?
Total Population of Hawkins County is 57,107.
What is the Total Male Population of Hawkins County?
Total Male Population of Hawkins County is 28,159.
What is the Total Female Population of Hawkins County?
Total Female Population of Hawkins County is 28,948.
What is the Ratio of Males per 100 Females in Hawkins County?
There are 97.27 Males per 100 Females in Hawkins County.
What is the Ratio of Females per 100 Males in Hawkins County?
There are 102.80 Females per 100 Males in Hawkins County.
What is the Median Population Age in Hawkins County?
Median Population Age in Hawkins County is 45.5 Years.
What is the Average Family Size in Hawkins County
Average Family Size in Hawkins County is 3.0 People.
What is the Average Household Size in Hawkins County
Average Household Size in Hawkins County is 2.5 People.
What is Per Capita Income in Hawkins County?
Per Capita income in Hawkins County is $28,648.
What is the Median Family Income in Hawkins County?
Median Family Income in Hawkins County is $64,529.
What is the Median Household income in Hawkins County?
Median Household Income in Hawkins County is $53,647.
What is Income or Wage Gap in Hawkins County?
Income or Wage Gap in Hawkins County is 33.0%.
Women in Hawkins County earn 67.0 cents for every dollar earned by a man.
What is Family Income Deficit in Hawkins County?
Family Income Deficit in Hawkins County is $10,923.
Families that are below poverty line in Hawkins County earn $10,923 less on average than the poverty threshold level.
What is Inequality or Gini Index in Hawkins County?
Inequality or Gini Index in Hawkins County is 0.46.
How Large is the Labor Force in Hawkins County?
There are 24,022 People in the Labor Forcein in Hawkins County.
What is the Percentage of People in the Labor Force in Hawkins County?
50.5% of People are in the Labor Force in Hawkins County.
What is the Unemployment Rate in Hawkins County?
Unemployment Rate in Hawkins County is 8.6%.