Hardin County, TN
Hardin County Map
Hardin County Overview
26,824
TOTAL POPULATION
12,878
MALE POPULATION
13,946
FEMALE POPULATION
92.34
MALES / 100 FEMALES
108.29
FEMALES / 100 MALES
45.5
MEDIAN AGE
2.9
AVG FAMILY SIZE
2.4
AVG HOUSEHOLD SIZE
$26,068
PER CAPITA INCOME
$52,664
AVG FAMILY INCOME
$46,902
AVG HOUSEHOLD INCOME
32.8%
WAGE / INCOME GAP [ % ]
67.2¢/ $1
WAGE / INCOME GAP [ $ ]
$8,381
FAMILY INCOME DEFICIT
0.45
INEQUALITY / GINI INDEX
11,007
LABOR FORCE [ PEOPLE ]
49.8%
PERCENT IN LABOR FORCE
3.3%
UNEMPLOYMENT RATE
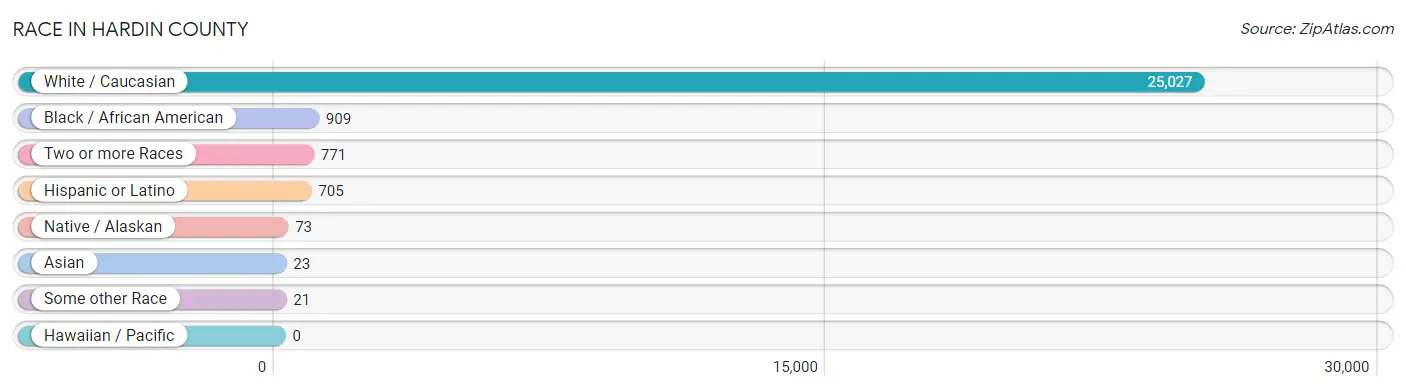
Race in Hardin County
The most populous races in Hardin County are White / Caucasian (25,027 | 93.3%), Black / African American (909 | 3.4%), and Two or more Races (771 | 2.9%).
| Race | # Population | % Population |
| Asian | 23 | 0.1% |
| Black / African American | 909 | 3.4% |
| Hawaiian / Pacific | 0 | 0.0% |
| Hispanic or Latino | 705 | 2.6% |
| Native / Alaskan | 73 | 0.3% |
| White / Caucasian | 25,027 | 93.3% |
| Two or more Races | 771 | 2.9% |
| Some other Race | 21 | 0.1% |
| Total | 26,824 | 100.0% |
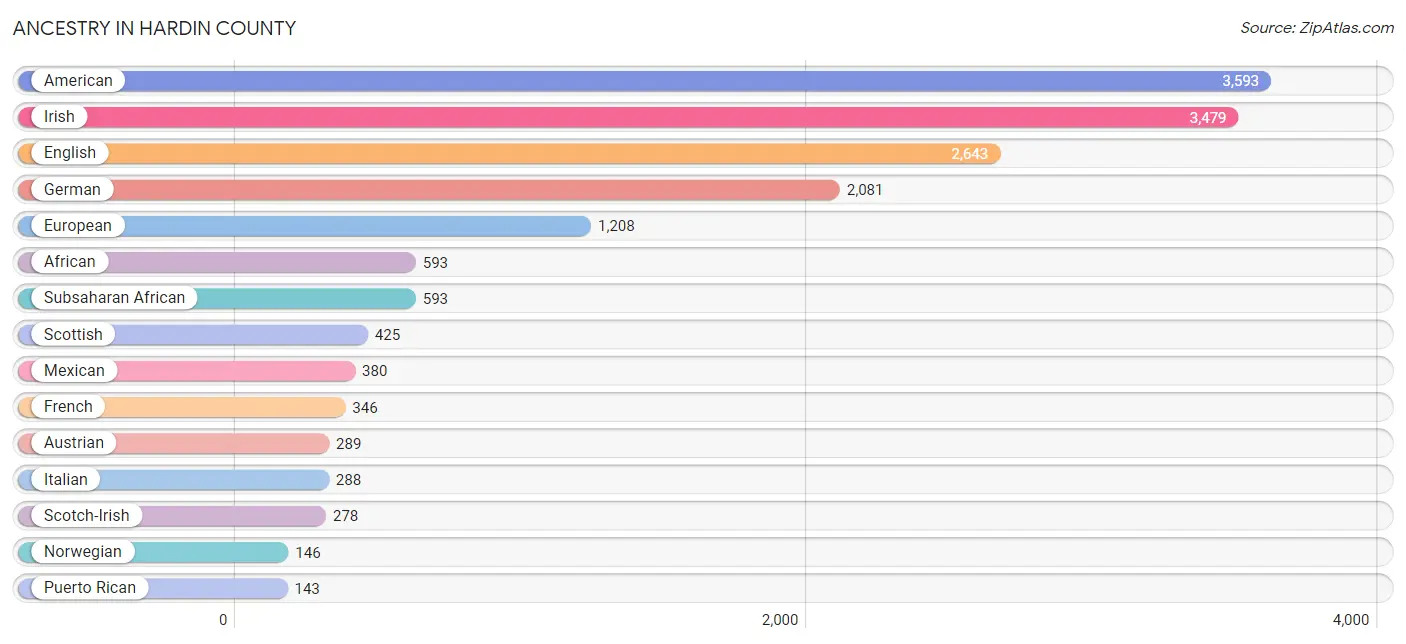
Ancestry in Hardin County
The most populous ancestries reported in Hardin County are American (3,593 | 13.4%), Irish (3,479 | 13.0%), English (2,643 | 9.9%), German (2,081 | 7.8%), and European (1,208 | 4.5%), together accounting for 48.5% of all Hardin County residents.
| Ancestry | # Population | % Population |
| African | 593 | 2.2% |
| American | 3,593 | 13.4% |
| Apache | 2 | 0.0% |
| Arab | 46 | 0.2% |
| Austrian | 289 | 1.1% |
| British | 55 | 0.2% |
| Celtic | 4 | 0.0% |
| Central American | 6 | 0.0% |
| Central American Indian | 15 | 0.1% |
| Cherokee | 129 | 0.5% |
| Chickasaw | 15 | 0.1% |
| Choctaw | 36 | 0.1% |
| Creek | 8 | 0.0% |
| Czech | 6 | 0.0% |
| Czechoslovakian | 3 | 0.0% |
| Dutch | 98 | 0.4% |
| Eastern European | 19 | 0.1% |
| English | 2,643 | 9.9% |
| European | 1,208 | 4.5% |
| Finnish | 2 | 0.0% |
| French | 346 | 1.3% |
| French Canadian | 6 | 0.0% |
| German | 2,081 | 7.8% |
| Greek | 68 | 0.3% |
| Honduran | 6 | 0.0% |
| Hungarian | 11 | 0.0% |
| Indian (Asian) | 13 | 0.1% |
| Irish | 3,479 | 13.0% |
| Italian | 288 | 1.1% |
| Jamaican | 10 | 0.0% |
| Korean | 62 | 0.2% |
| Laotian | 9 | 0.0% |
| Lebanese | 46 | 0.2% |
| Lithuanian | 20 | 0.1% |
| Mexican | 380 | 1.4% |
| Northern European | 35 | 0.1% |
| Norwegian | 146 | 0.5% |
| Peruvian | 132 | 0.5% |
| Polish | 74 | 0.3% |
| Potawatomi | 12 | 0.0% |
| Puerto Rican | 143 | 0.5% |
| Romanian | 26 | 0.1% |
| Russian | 2 | 0.0% |
| Scandinavian | 9 | 0.0% |
| Scotch-Irish | 278 | 1.0% |
| Scottish | 425 | 1.6% |
| South American | 132 | 0.5% |
| Spaniard | 24 | 0.1% |
| Subsaharan African | 593 | 2.2% |
| Swedish | 18 | 0.1% |
| Welsh | 67 | 0.3% | View All 51 Rows |
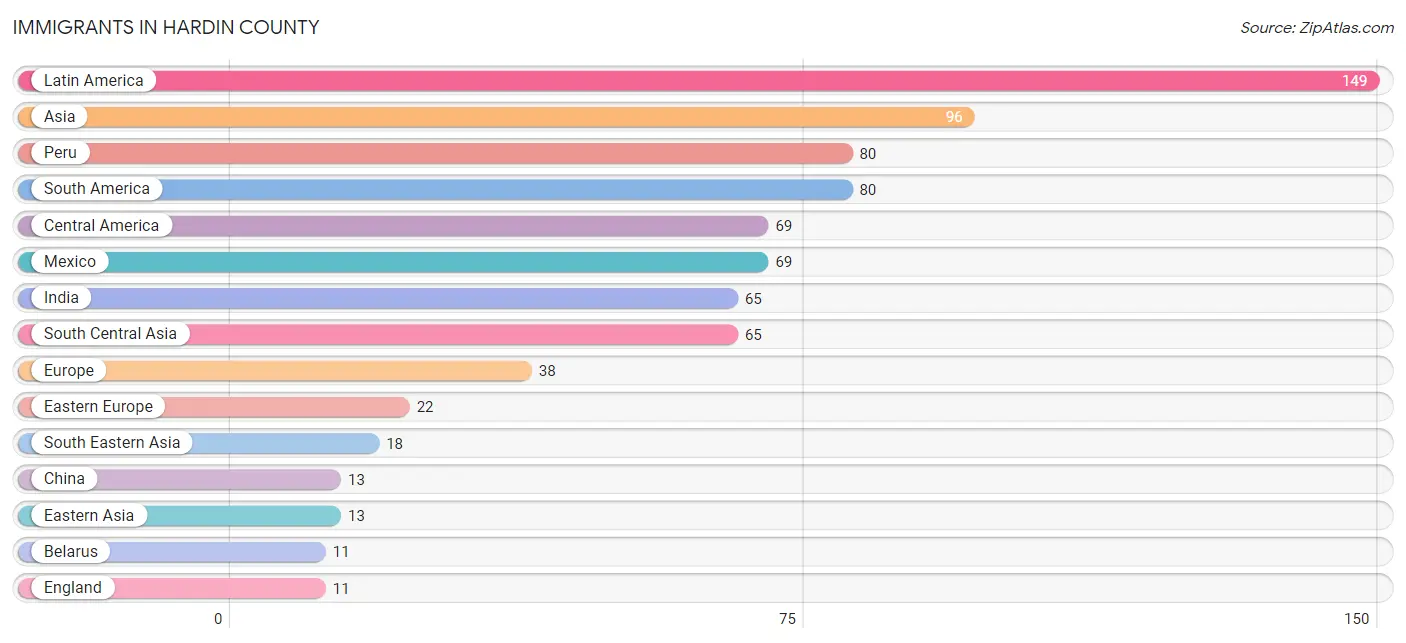
Immigrants in Hardin County
The most numerous immigrant groups reported in Hardin County came from Latin America (149 | 0.6%), Asia (96 | 0.4%), Peru (80 | 0.3%), South America (80 | 0.3%), and Central America (69 | 0.3%), together accounting for 1.8% of all Hardin County residents.
| Immigration Origin | # Population | % Population |
| Asia | 96 | 0.4% |
| Belarus | 11 | 0.0% |
| Central America | 69 | 0.3% |
| China | 13 | 0.1% |
| Eastern Asia | 13 | 0.1% |
| Eastern Europe | 22 | 0.1% |
| England | 11 | 0.0% |
| Europe | 38 | 0.1% |
| Germany | 5 | 0.0% |
| India | 65 | 0.2% |
| Indonesia | 9 | 0.0% |
| Latin America | 149 | 0.6% |
| Mexico | 69 | 0.3% |
| Northern Europe | 11 | 0.0% |
| Peru | 80 | 0.3% |
| Philippines | 9 | 0.0% |
| Romania | 11 | 0.0% |
| South America | 80 | 0.3% |
| South Central Asia | 65 | 0.2% |
| South Eastern Asia | 18 | 0.1% |
| Western Europe | 5 | 0.0% | View All 21 Rows |
Sex and Age in Hardin County
Sex and Age in Hardin County
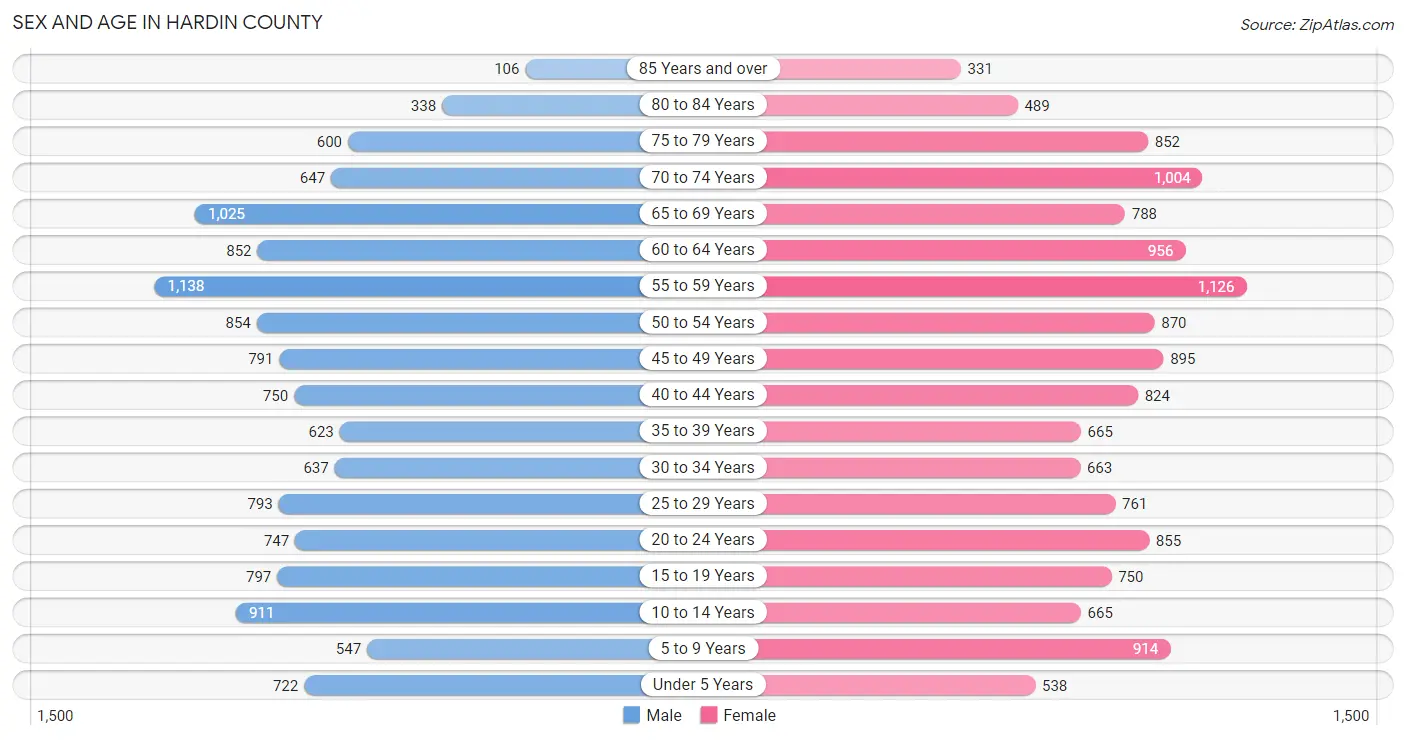
The most populous age groups in Hardin County are 55 to 59 Years (1,138 | 8.8%) for men and 55 to 59 Years (1,126 | 8.1%) for women.
| Age Bracket | Male | Female |
| Under 5 Years | 722 (5.6%) | 538 (3.9%) |
| 5 to 9 Years | 547 (4.3%) | 914 (6.6%) |
| 10 to 14 Years | 911 (7.1%) | 665 (4.8%) |
| 15 to 19 Years | 797 (6.2%) | 750 (5.4%) |
| 20 to 24 Years | 747 (5.8%) | 855 (6.1%) |
| 25 to 29 Years | 793 (6.2%) | 761 (5.5%) |
| 30 to 34 Years | 637 (5.0%) | 663 (4.8%) |
| 35 to 39 Years | 623 (4.8%) | 665 (4.8%) |
| 40 to 44 Years | 750 (5.8%) | 824 (5.9%) |
| 45 to 49 Years | 791 (6.1%) | 895 (6.4%) |
| 50 to 54 Years | 854 (6.6%) | 870 (6.2%) |
| 55 to 59 Years | 1,138 (8.8%) | 1,126 (8.1%) |
| 60 to 64 Years | 852 (6.6%) | 956 (6.9%) |
| 65 to 69 Years | 1,025 (8.0%) | 788 (5.7%) |
| 70 to 74 Years | 647 (5.0%) | 1,004 (7.2%) |
| 75 to 79 Years | 600 (4.7%) | 852 (6.1%) |
| 80 to 84 Years | 338 (2.6%) | 489 (3.5%) |
| 85 Years and over | 106 (0.8%) | 331 (2.4%) |
| Total | 12,878 (100.0%) | 13,946 (100.0%) |
Families and Households in Hardin County
Median Family Size in Hardin County
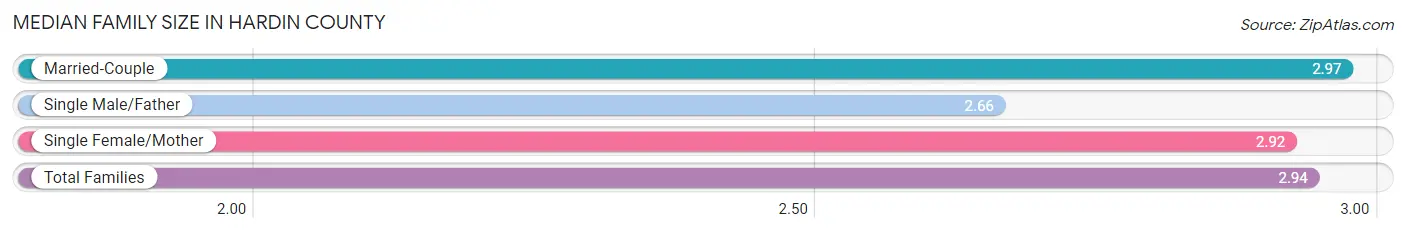
The median family size in Hardin County is 2.94 persons per family, with married-couple families (5,536 | 76.9%) accounting for the largest median family size of 2.97 persons per family. On the other hand, single male/father families (523 | 7.3%) represent the smallest median family size with 2.66 persons per family.
| Family Type | # Families | Family Size |
| Married-Couple | 5,536 (76.9%) | 2.97 |
| Single Male/Father | 523 (7.3%) | 2.66 |
| Single Female/Mother | 1,137 (15.8%) | 2.92 |
| Total Families | 7,196 (100.0%) | 2.94 |
Median Household Size in Hardin County
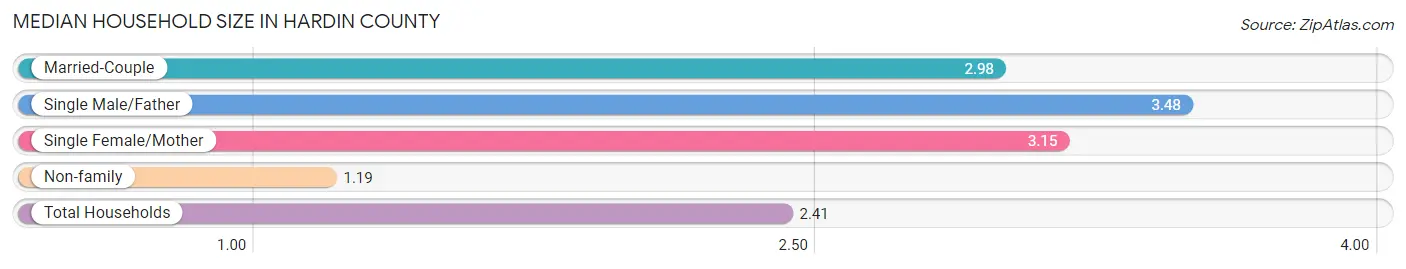
The median household size in Hardin County is 2.41 persons per household, with single male/father households (523 | 4.8%) accounting for the largest median household size of 3.48 persons per household. non-family households (3,707 | 34.0%) represent the smallest median household size with 1.19 persons per household.
| Household Type | # Households | Household Size |
| Married-Couple | 5,536 (50.8%) | 2.98 |
| Single Male/Father | 523 (4.8%) | 3.48 |
| Single Female/Mother | 1,137 (10.4%) | 3.15 |
| Non-family | 3,707 (34.0%) | 1.19 |
| Total Households | 10,903 (100.0%) | 2.41 |
Household Size by Marriage Status in Hardin County
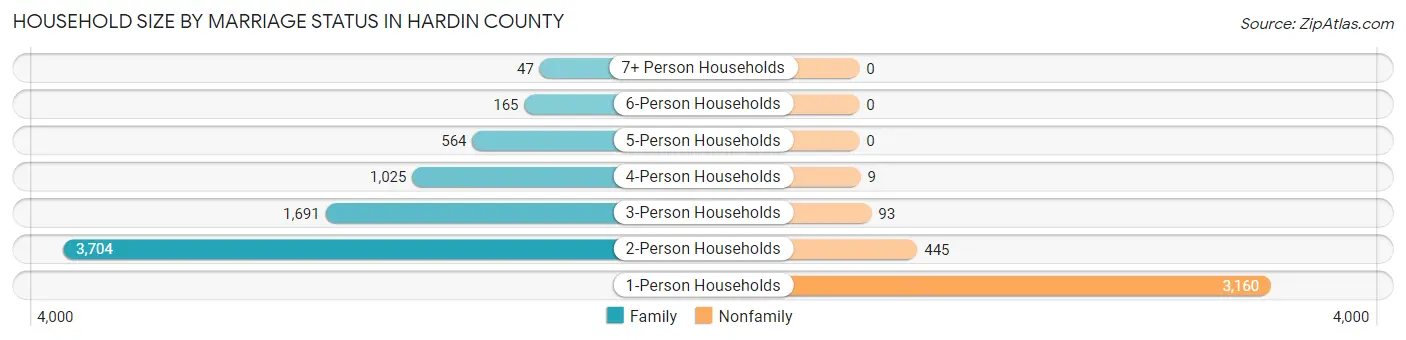
Out of a total of 10,903 households in Hardin County, 7,196 (66.0%) are family households, while 3,707 (34.0%) are nonfamily households. The most numerous type of family households are 2-person households, comprising 3,704, and the most common type of nonfamily households are 1-person households, comprising 3,160.
| Household Size | Family Households | Nonfamily Households |
| 1-Person Households | - | 3,160 (29.0%) |
| 2-Person Households | 3,704 (34.0%) | 445 (4.1%) |
| 3-Person Households | 1,691 (15.5%) | 93 (0.9%) |
| 4-Person Households | 1,025 (9.4%) | 9 (0.1%) |
| 5-Person Households | 564 (5.2%) | 0 (0.0%) |
| 6-Person Households | 165 (1.5%) | 0 (0.0%) |
| 7+ Person Households | 47 (0.4%) | 0 (0.0%) |
| Total | 7,196 (66.0%) | 3,707 (34.0%) |
Female Fertility in Hardin County
Fertility by Age in Hardin County
Average fertility rate in Hardin County is 73.0 births per 1,000 women. Women in the age bracket of 20 to 34 years have the highest fertility rate with 168.0 births per 1,000 women. Women in the age bracket of 20 to 34 years acount for 94.3% of all women with births.
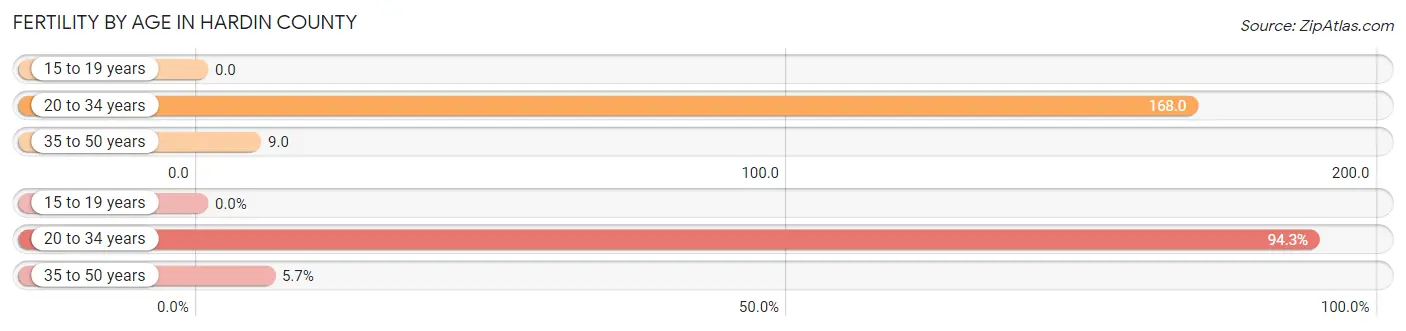
| Age Bracket | Women with Births | Births / 1,000 Women |
| 15 to 19 years | 0 (0.0%) | 0.0 |
| 20 to 34 years | 382 (94.3%) | 168.0 |
| 35 to 50 years | 23 (5.7%) | 9.0 |
| Total | 405 (100.0%) | 73.0 |
Fertility by Age by Marriage Status in Hardin County
42.0% of women with births (405) in Hardin County are married. The highest percentage of unmarried women with births falls into 20 to 34 years age bracket with 61.5% of them unmarried at the time of birth, while the lowest percentage of unmarried women with births belong to 35 to 50 years age bracket with 0.0% of them unmarried.
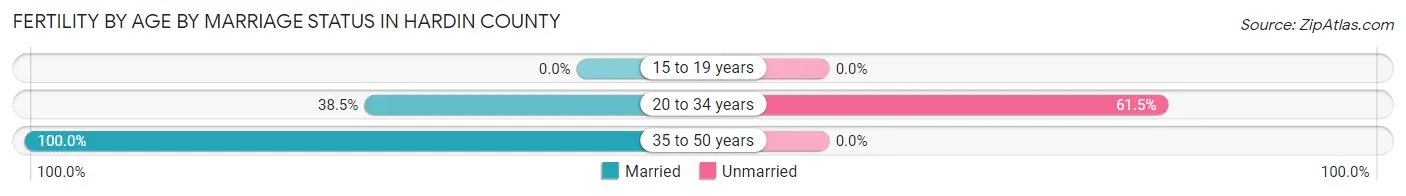
| Age Bracket | Married | Unmarried |
| 15 to 19 years | 0 (0.0%) | 0 (0.0%) |
| 20 to 34 years | 147 (38.5%) | 235 (61.5%) |
| 35 to 50 years | 23 (100.0%) | 0 (0.0%) |
| Total | 170 (42.0%) | 235 (58.0%) |
Fertility by Education in Hardin County
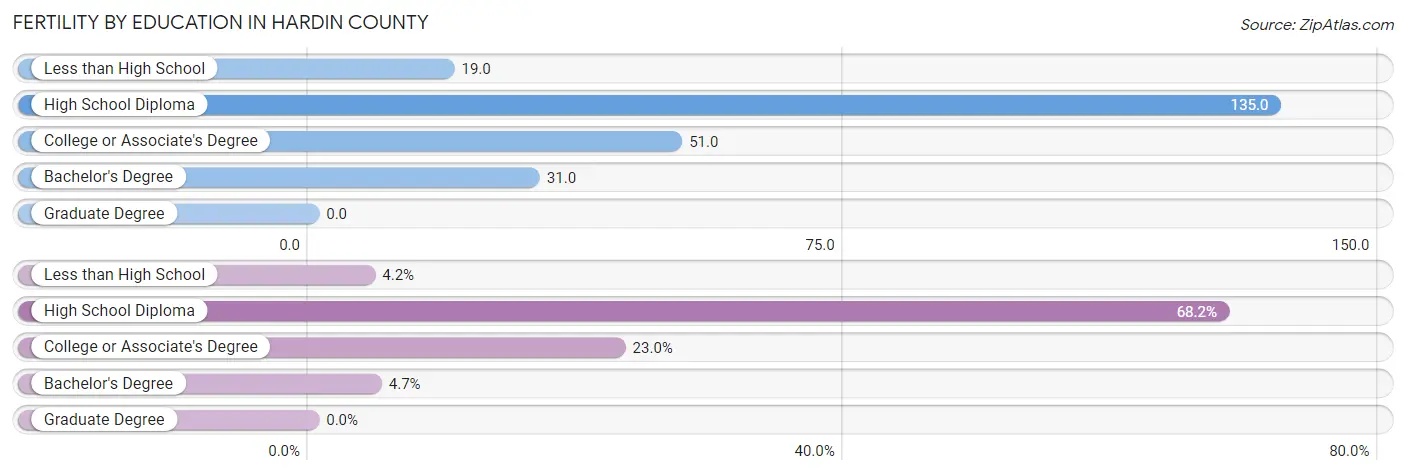
| Educational Attainment | Women with Births | Births / 1,000 Women |
| Less than High School | 17 (4.2%) | 19.0 |
| High School Diploma | 276 (68.1%) | 135.0 |
| College or Associate's Degree | 93 (23.0%) | 51.0 |
| Bachelor's Degree | 19 (4.7%) | 31.0 |
| Graduate Degree | 0 (0.0%) | 0.0 |
| Total | 405 (100.0%) | 73.0 |
Fertility by Education by Marriage Status in Hardin County
58.0% of women with births in Hardin County are unmarried. Women with the educational attainment of less than high school are most likely to be married with 100.0% of them married at childbirth, while women with the educational attainment of high school diploma are least likely to be married with 72.5% of them unmarried at childbirth.
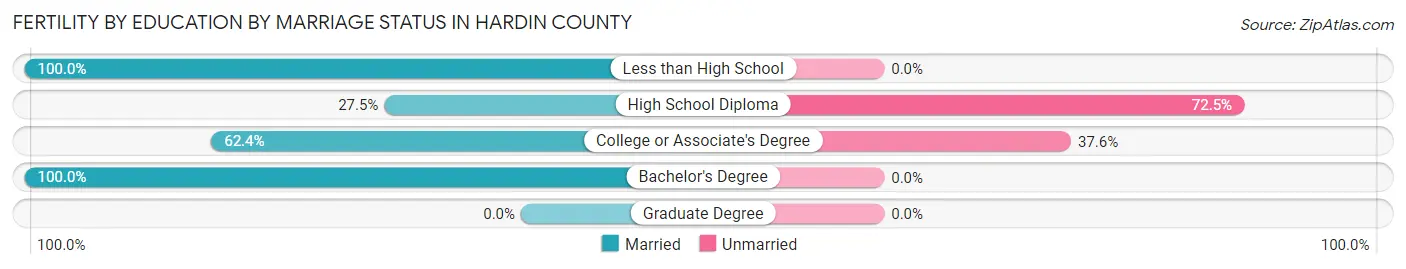
| Educational Attainment | Married | Unmarried |
| Less than High School | 17 (100.0%) | 0 (0.0%) |
| High School Diploma | 76 (27.5%) | 200 (72.5%) |
| College or Associate's Degree | 58 (62.4%) | 35 (37.6%) |
| Bachelor's Degree | 19 (100.0%) | 0 (0.0%) |
| Graduate Degree | 0 (0.0%) | 0 (0.0%) |
| Total | 170 (42.0%) | 235 (58.0%) |
Income in Hardin County
Income Overview in Hardin County
Per Capita Income in Hardin County is $26,068, while median incomes of families and households are $52,664 and $46,902 respectively.
| Characteristic | Number | Measure |
| Per Capita Income | 26,824 | $26,068 |
| Median Family Income | 7,196 | $52,664 |
| Mean Family Income | 7,196 | $69,321 |
| Median Household Income | 10,903 | $46,902 |
| Mean Household Income | 10,903 | $61,894 |
| Income Deficit | 7,196 | $8,381 |
| Wage / Income Gap (%) | 26,824 | 32.81% |
| Wage / Income Gap ($) | 26,824 | 67.19¢ per $1 |
| Gini / Inequality Index | 26,824 | 0.45 |
Earnings by Sex in Hardin County
Average Earnings in Hardin County are $32,098, $39,483 for men and $26,528 for women, a difference of 32.8%.
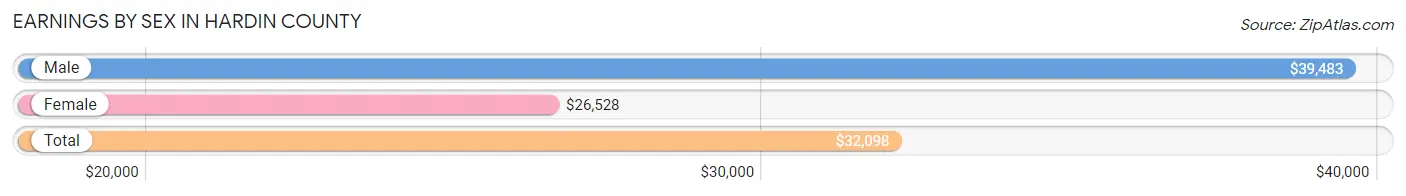
| Sex | Number | Average Earnings |
| Male | 6,260 (54.1%) | $39,483 |
| Female | 5,317 (45.9%) | $26,528 |
| Total | 11,577 (100.0%) | $32,098 |
Earnings by Sex by Income Bracket in Hardin County
The most common earnings brackets in Hardin County are $75,000 to $99,999 for men (668 | 10.7%) and $25,000 to $29,999 for women (560 | 10.5%).
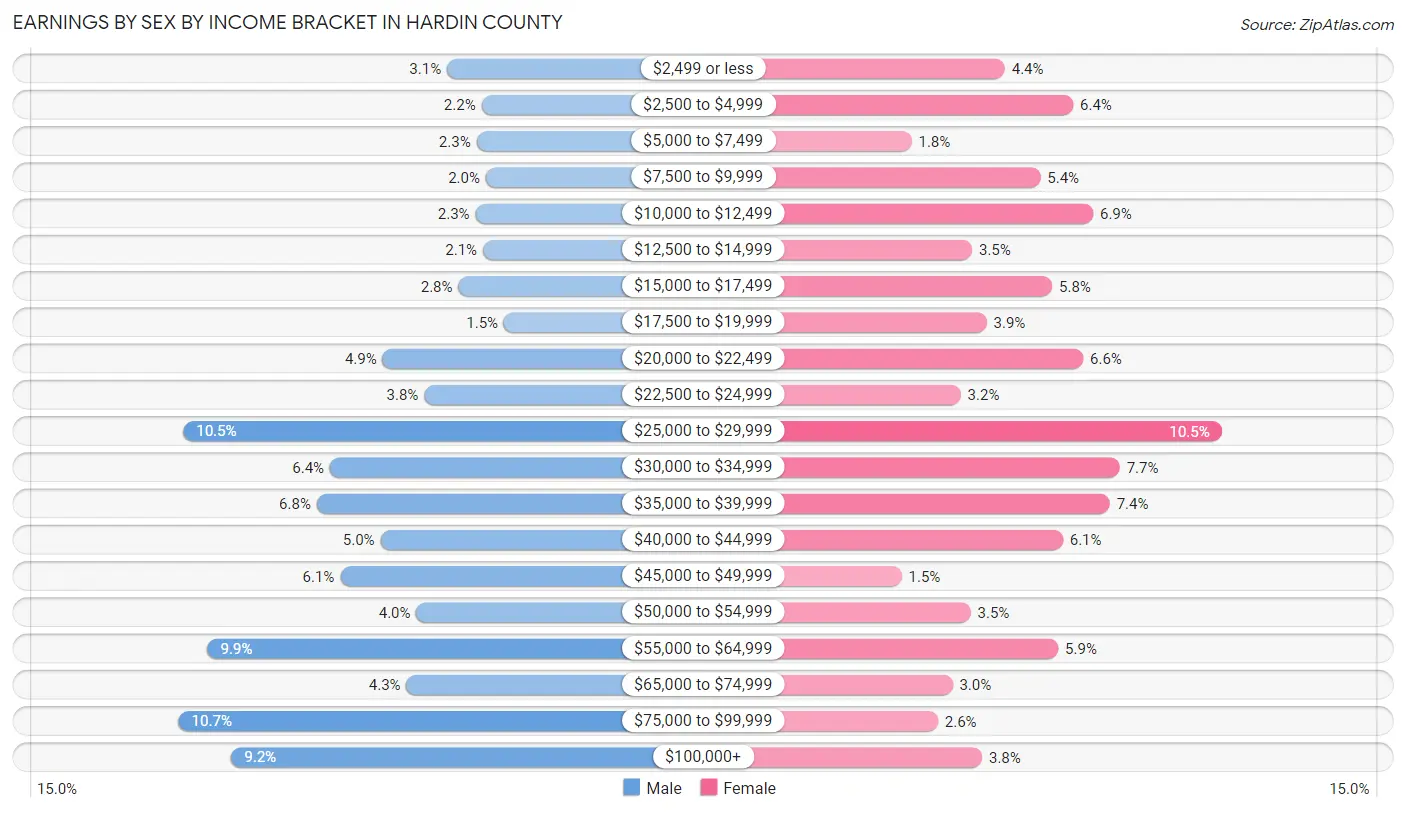
| Income | Male | Female |
| $2,499 or less | 196 (3.1%) | 236 (4.4%) |
| $2,500 to $4,999 | 135 (2.2%) | 338 (6.4%) |
| $5,000 to $7,499 | 144 (2.3%) | 97 (1.8%) |
| $7,500 to $9,999 | 128 (2.0%) | 289 (5.4%) |
| $10,000 to $12,499 | 146 (2.3%) | 368 (6.9%) |
| $12,500 to $14,999 | 133 (2.1%) | 187 (3.5%) |
| $15,000 to $17,499 | 176 (2.8%) | 307 (5.8%) |
| $17,500 to $19,999 | 96 (1.5%) | 209 (3.9%) |
| $20,000 to $22,499 | 309 (4.9%) | 353 (6.6%) |
| $22,500 to $24,999 | 236 (3.8%) | 170 (3.2%) |
| $25,000 to $29,999 | 660 (10.5%) | 560 (10.5%) |
| $30,000 to $34,999 | 402 (6.4%) | 408 (7.7%) |
| $35,000 to $39,999 | 425 (6.8%) | 393 (7.4%) |
| $40,000 to $44,999 | 313 (5.0%) | 323 (6.1%) |
| $45,000 to $49,999 | 384 (6.1%) | 82 (1.5%) |
| $50,000 to $54,999 | 250 (4.0%) | 185 (3.5%) |
| $55,000 to $64,999 | 617 (9.9%) | 316 (5.9%) |
| $65,000 to $74,999 | 267 (4.3%) | 158 (3.0%) |
| $75,000 to $99,999 | 668 (10.7%) | 136 (2.6%) |
| $100,000+ | 575 (9.2%) | 202 (3.8%) |
| Total | 6,260 (100.0%) | 5,317 (100.0%) |
Earnings by Sex by Educational Attainment in Hardin County
Average earnings in Hardin County are $44,452 for men and $29,041 for women, a difference of 34.7%. Men with an educational attainment of graduate degree enjoy the highest average annual earnings of $57,946, while those with less than high school education earn the least with $31,483. Women with an educational attainment of graduate degree earn the most with the average annual earnings of $51,579, while those with high school diploma education have the smallest earnings of $22,446.
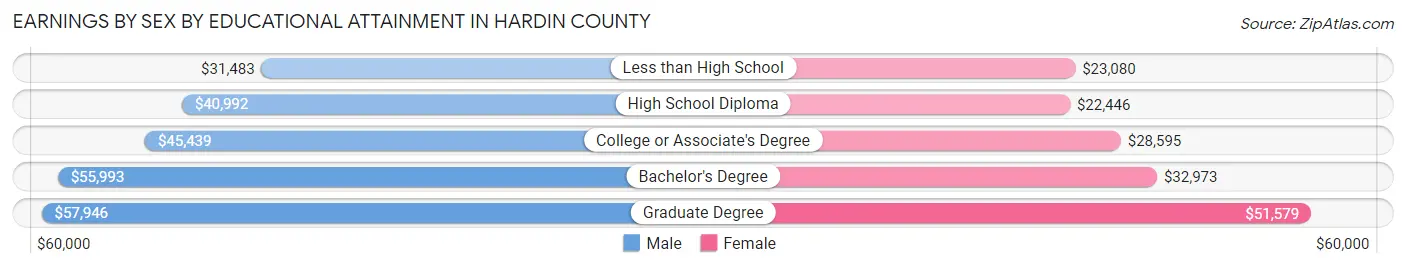
| Educational Attainment | Male Income | Female Income |
| Less than High School | $31,483 | $23,080 |
| High School Diploma | $40,992 | $22,446 |
| College or Associate's Degree | $45,439 | $28,595 |
| Bachelor's Degree | $55,993 | $32,973 |
| Graduate Degree | $57,946 | $51,579 |
| Total | $44,452 | $29,041 |
Family Income in Hardin County
Family Income Brackets in Hardin County
According to the Hardin County family income data, there are 1,432 families falling into the $35,000 to $49,999 income range, which is the most common income bracket and makes up 19.9% of all families. Conversely, the $200,000+ income bracket is the least frequent group with only 201 families (2.8%) belonging to this category.
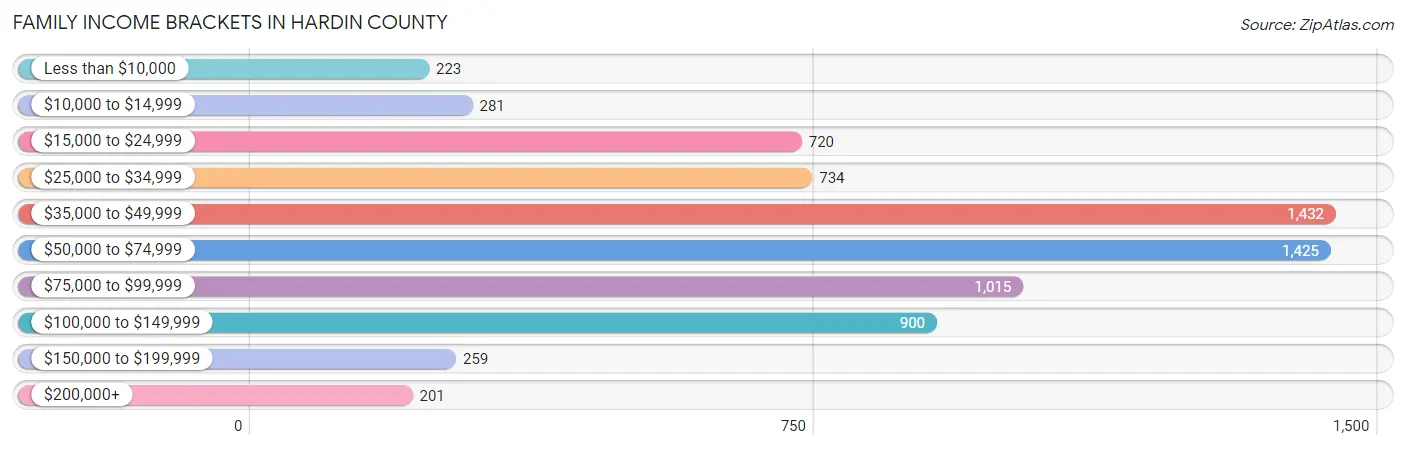
| Income Bracket | # Families | % Families |
| Less than $10,000 | 223 | 3.1% |
| $10,000 to $14,999 | 281 | 3.9% |
| $15,000 to $24,999 | 720 | 10.0% |
| $25,000 to $34,999 | 734 | 10.2% |
| $35,000 to $49,999 | 1,432 | 19.9% |
| $50,000 to $74,999 | 1,425 | 19.8% |
| $75,000 to $99,999 | 1,015 | 14.1% |
| $100,000 to $149,999 | 900 | 12.5% |
| $150,000 to $199,999 | 259 | 3.6% |
| $200,000+ | 201 | 2.8% |
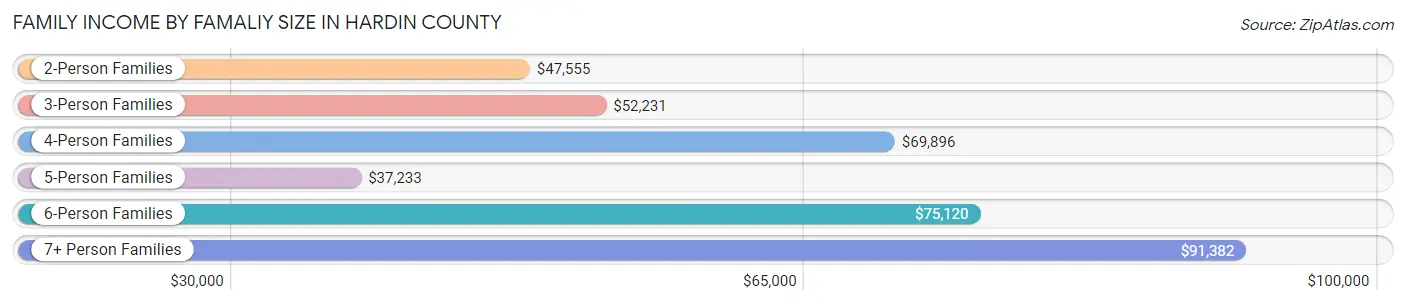
Family Income by Famaliy Size in Hardin County
7+ person families (35 | 0.5%) account for the highest median family income in Hardin County with $91,382 per family, while 2-person families (4,136 | 57.5%) have the highest median income of $23,778 per family member.
| Income Bracket | # Families | Median Income |
| 2-Person Families | 4,136 (57.5%) | $47,555 |
| 3-Person Families | 1,397 (19.4%) | $52,231 |
| 4-Person Families | 951 (13.2%) | $69,896 |
| 5-Person Families | 512 (7.1%) | $37,233 |
| 6-Person Families | 165 (2.3%) | $75,120 |
| 7+ Person Families | 35 (0.5%) | $91,382 |
| Total | 7,196 (100.0%) | $52,664 |
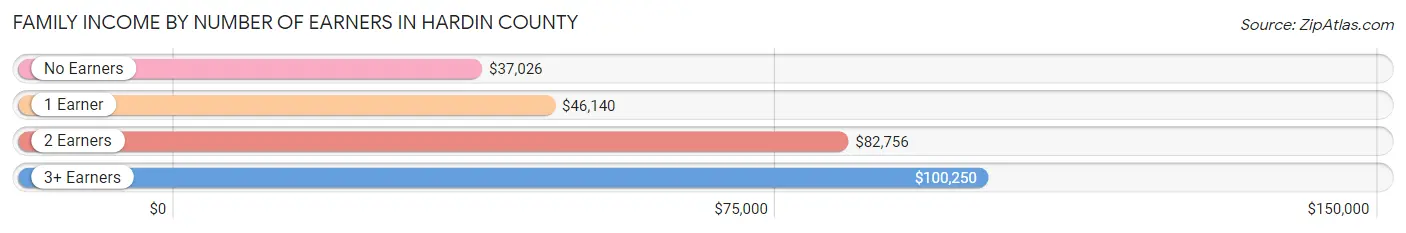
Family Income by Number of Earners in Hardin County
The median family income in Hardin County is $52,664, with families comprising 3+ earners (394) having the highest median family income of $100,250, while families with no earners (1,813) have the lowest median family income of $37,026, accounting for 5.5% and 25.2% of families, respectively.
| Number of Earners | # Families | Median Income |
| No Earners | 1,813 (25.2%) | $37,026 |
| 1 Earner | 2,827 (39.3%) | $46,140 |
| 2 Earners | 2,162 (30.0%) | $82,756 |
| 3+ Earners | 394 (5.5%) | $100,250 |
| Total | 7,196 (100.0%) | $52,664 |
Household Income in Hardin County
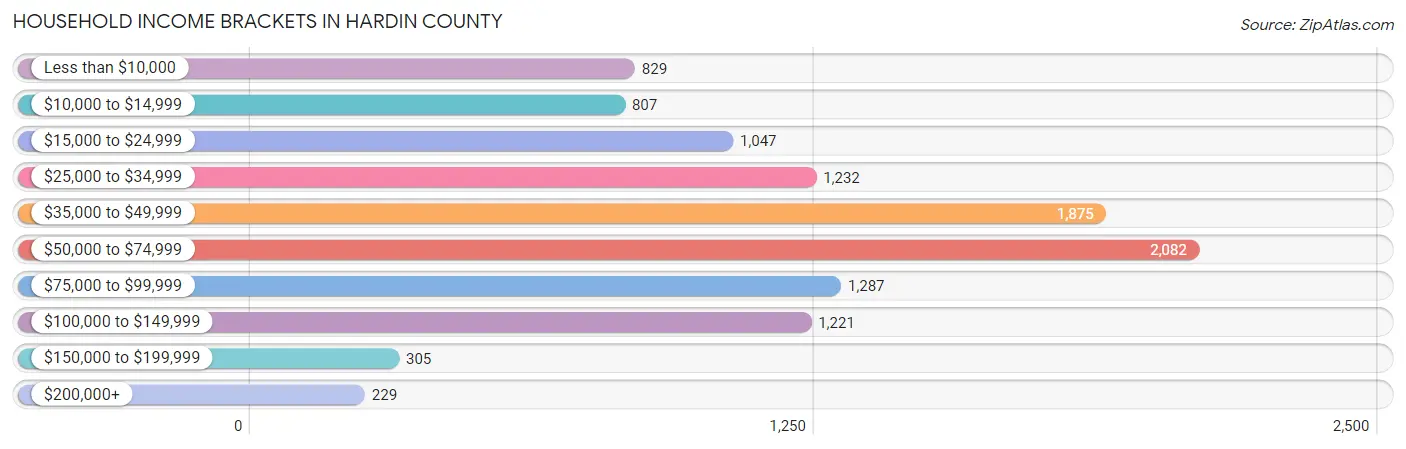
Household Income Brackets in Hardin County
With 2,082 households falling in the category, the $50,000 to $74,999 income range is the most frequent in Hardin County, accounting for 19.1% of all households. In contrast, only 229 households (2.1%) fall into the $200,000+ income bracket, making it the least populous group.
| Income Bracket | # Households | % Households |
| Less than $10,000 | 829 | 7.6% |
| $10,000 to $14,999 | 807 | 7.4% |
| $15,000 to $24,999 | 1,047 | 9.6% |
| $25,000 to $34,999 | 1,232 | 11.3% |
| $35,000 to $49,999 | 1,875 | 17.2% |
| $50,000 to $74,999 | 2,082 | 19.1% |
| $75,000 to $99,999 | 1,287 | 11.8% |
| $100,000 to $149,999 | 1,221 | 11.2% |
| $150,000 to $199,999 | 305 | 2.8% |
| $200,000+ | 229 | 2.1% |
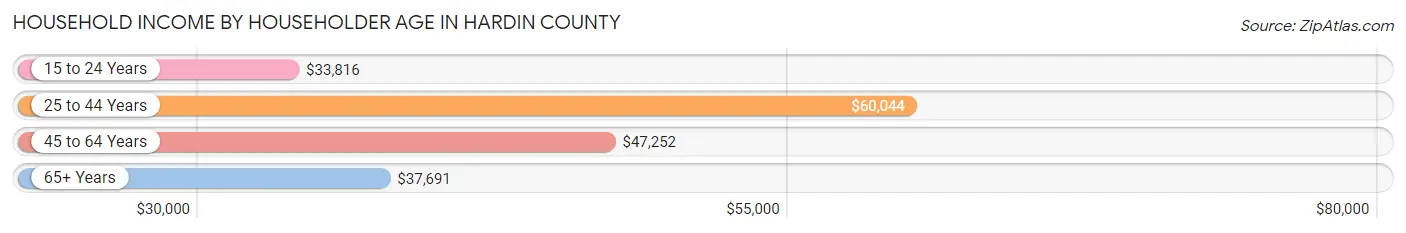
Household Income by Householder Age in Hardin County
The median household income in Hardin County is $46,902, with the highest median household income of $60,044 found in the 25 to 44 years age bracket for the primary householder. A total of 2,922 households (26.8%) fall into this category. Meanwhile, the 15 to 24 years age bracket for the primary householder has the lowest median household income of $33,816, with 388 households (3.6%) in this group.
| Income Bracket | # Households | Median Income |
| 15 to 24 Years | 388 (3.6%) | $33,816 |
| 25 to 44 Years | 2,922 (26.8%) | $60,044 |
| 45 to 64 Years | 4,024 (36.9%) | $47,252 |
| 65+ Years | 3,569 (32.7%) | $37,691 |
| Total | 10,903 (100.0%) | $46,902 |
Poverty in Hardin County
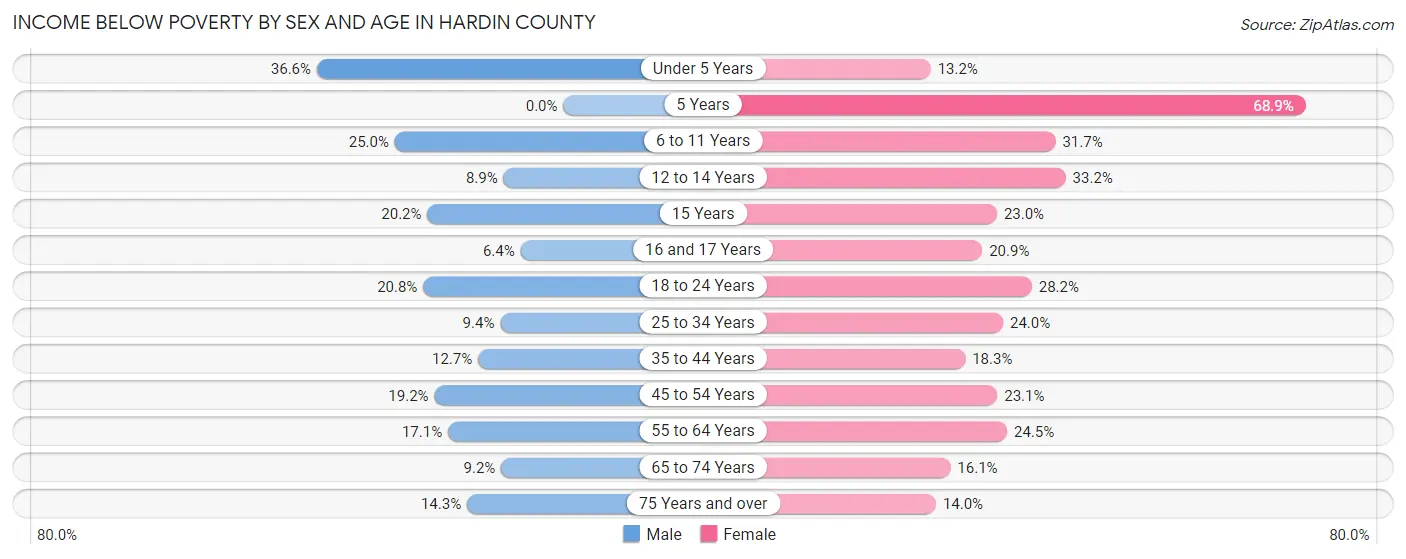
Income Below Poverty by Sex and Age in Hardin County
With 15.9% poverty level for males and 22.6% for females among the residents of Hardin County, under 5 year old males and 5 year old females are the most vulnerable to poverty, with 250 males (36.6%) and 157 females (68.9%) in their respective age groups living below the poverty level.
| Age Bracket | Male | Female |
| Under 5 Years | 250 (36.6%) | 71 (13.2%) |
| 5 Years | 0 (0.0%) | 157 (68.9%) |
| 6 to 11 Years | 184 (25.0%) | 310 (31.7%) |
| 12 to 14 Years | 53 (8.9%) | 120 (33.2%) |
| 15 Years | 42 (20.2%) | 50 (23.0%) |
| 16 and 17 Years | 22 (6.4%) | 64 (20.8%) |
| 18 to 24 Years | 206 (20.8%) | 305 (28.2%) |
| 25 to 34 Years | 134 (9.4%) | 341 (23.9%) |
| 35 to 44 Years | 174 (12.7%) | 273 (18.3%) |
| 45 to 54 Years | 315 (19.2%) | 398 (23.1%) |
| 55 to 64 Years | 335 (17.1%) | 511 (24.5%) |
| 65 to 74 Years | 147 (9.2%) | 287 (16.1%) |
| 75 Years and over | 146 (14.3%) | 200 (14.0%) |
| Total | 2,008 (15.9%) | 3,087 (22.6%) |
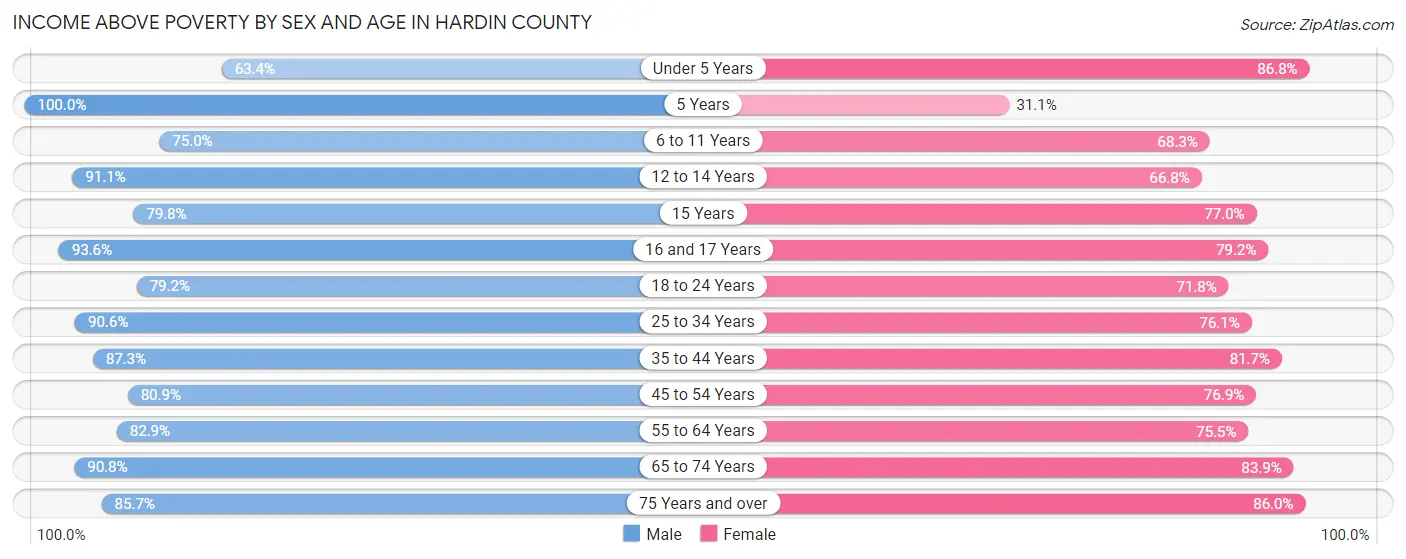
Income Above Poverty by Sex and Age in Hardin County
According to the poverty statistics in Hardin County, males aged 5 years and females aged under 5 years are the age groups that are most secure financially, with 100.0% of males and 86.8% of females in these age groups living above the poverty line.
| Age Bracket | Male | Female |
| Under 5 Years | 433 (63.4%) | 467 (86.8%) |
| 5 Years | 77 (100.0%) | 71 (31.1%) |
| 6 to 11 Years | 551 (75.0%) | 667 (68.3%) |
| 12 to 14 Years | 544 (91.1%) | 241 (66.8%) |
| 15 Years | 166 (79.8%) | 167 (77.0%) |
| 16 and 17 Years | 324 (93.6%) | 243 (79.1%) |
| 18 to 24 Years | 784 (79.2%) | 776 (71.8%) |
| 25 to 34 Years | 1,296 (90.6%) | 1,083 (76.0%) |
| 35 to 44 Years | 1,199 (87.3%) | 1,216 (81.7%) |
| 45 to 54 Years | 1,330 (80.8%) | 1,326 (76.9%) |
| 55 to 64 Years | 1,621 (82.9%) | 1,571 (75.5%) |
| 65 to 74 Years | 1,445 (90.8%) | 1,492 (83.9%) |
| 75 Years and over | 874 (85.7%) | 1,231 (86.0%) |
| Total | 10,644 (84.1%) | 10,551 (77.4%) |
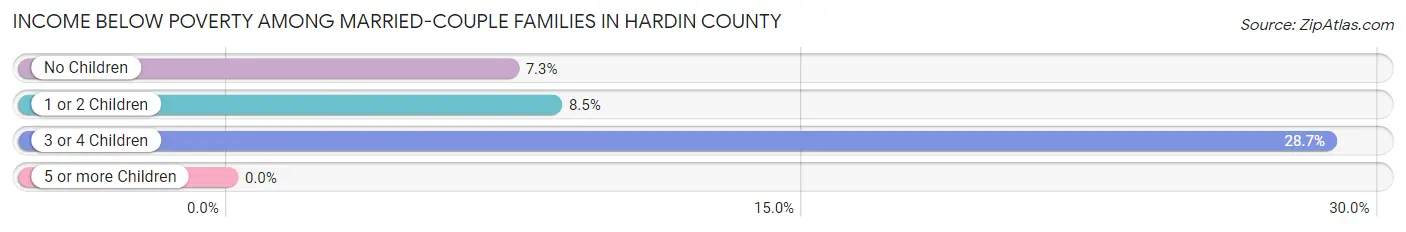
Income Below Poverty Among Married-Couple Families in Hardin County
The poverty statistics for married-couple families in Hardin County show that 9.5% or 525 of the total 5,536 families live below the poverty line. Families with 3 or 4 children have the highest poverty rate of 28.7%, comprising of 144 families. On the other hand, families with 5 or more children have the lowest poverty rate of 0.0%, which includes 0 families.
| Children | Above Poverty | Below Poverty |
| No Children | 3,478 (92.7%) | 275 (7.3%) |
| 1 or 2 Children | 1,147 (91.5%) | 106 (8.5%) |
| 3 or 4 Children | 358 (71.3%) | 144 (28.7%) |
| 5 or more Children | 28 (100.0%) | 0 (0.0%) |
| Total | 5,011 (90.5%) | 525 (9.5%) |
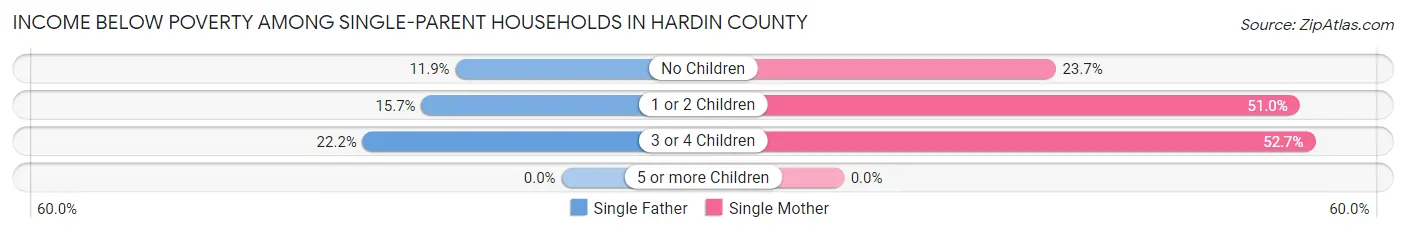
Income Below Poverty Among Single-Parent Households in Hardin County
According to the poverty data in Hardin County, 14.3% or 75 single-father households and 42.0% or 478 single-mother households are living below the poverty line. Among single-father households, those with 3 or 4 children have the highest poverty rate, with 4 households (22.2%) experiencing poverty. Likewise, among single-mother households, those with 3 or 4 children have the highest poverty rate, with 39 households (52.7%) falling below the poverty line.
| Children | Single Father | Single Mother |
| No Children | 25 (11.8%) | 89 (23.7%) |
| 1 or 2 Children | 46 (15.7%) | 350 (50.9%) |
| 3 or 4 Children | 4 (22.2%) | 39 (52.7%) |
| 5 or more Children | 0 (0.0%) | 0 (0.0%) |
| Total | 75 (14.3%) | 478 (42.0%) |
Income Below Poverty Among Married-Couple vs Single-Parent Households in Hardin County
The poverty data for Hardin County shows that 525 of the married-couple family households (9.5%) and 553 of the single-parent households (33.3%) are living below the poverty level. Within the married-couple family households, those with 3 or 4 children have the highest poverty rate, with 144 households (28.7%) falling below the poverty line. Among the single-parent households, those with 3 or 4 children have the highest poverty rate, with 43 household (46.7%) living below poverty.
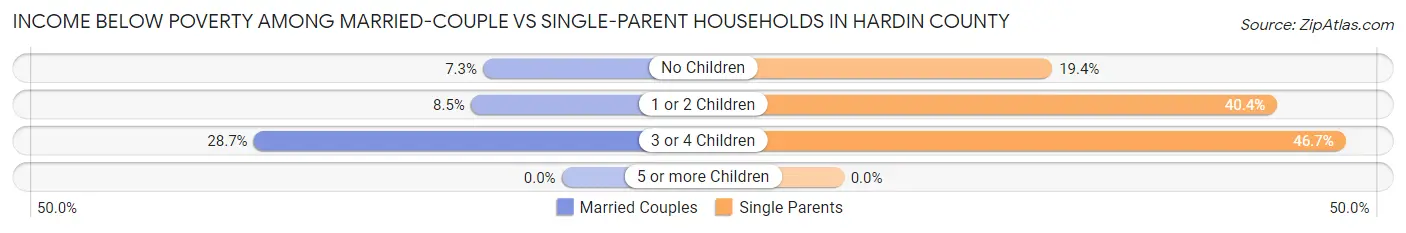
| Children | Married-Couple Families | Single-Parent Households |
| No Children | 275 (7.3%) | 114 (19.4%) |
| 1 or 2 Children | 106 (8.5%) | 396 (40.4%) |
| 3 or 4 Children | 144 (28.7%) | 43 (46.7%) |
| 5 or more Children | 0 (0.0%) | 0 (0.0%) |
| Total | 525 (9.5%) | 553 (33.3%) |
Employment Characteristics in Hardin County
Employment by Class of Employer in Hardin County
Among the 10,426 employed individuals in Hardin County, private company employees (7,123 | 68.3%), local government employees (1,021 | 9.8%), and self-employed (not incorporated) (649 | 6.2%) make up the most common classes of employment.
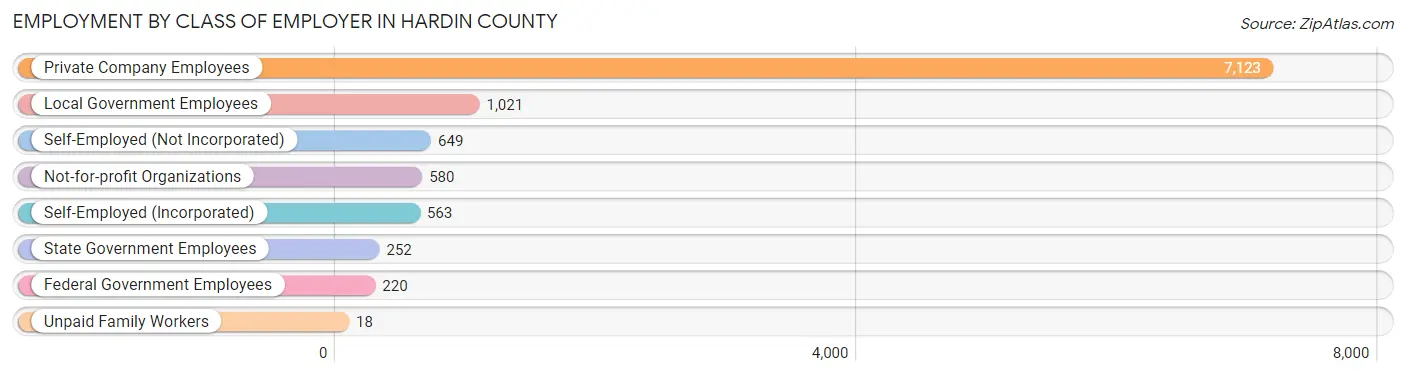
| Employer Class | # Employees | % Employees |
| Private Company Employees | 7,123 | 68.3% |
| Self-Employed (Incorporated) | 563 | 5.4% |
| Self-Employed (Not Incorporated) | 649 | 6.2% |
| Not-for-profit Organizations | 580 | 5.6% |
| Local Government Employees | 1,021 | 9.8% |
| State Government Employees | 252 | 2.4% |
| Federal Government Employees | 220 | 2.1% |
| Unpaid Family Workers | 18 | 0.2% |
| Total | 10,426 | 100.0% |
Employment Status by Age in Hardin County
According to the labor force statistics for Hardin County, out of the total population over 16 years of age (22,102), 49.8% or 11,007 individuals are in the labor force, with 3.3% or 363 of them unemployed. The age group with the highest labor force participation rate is 25 to 29 years, with 79.4% or 1,234 individuals in the labor force. Within the labor force, the 16 to 19 years age range has the highest percentage of unemployed individuals, with 14.6% or 53 of them being unemployed.
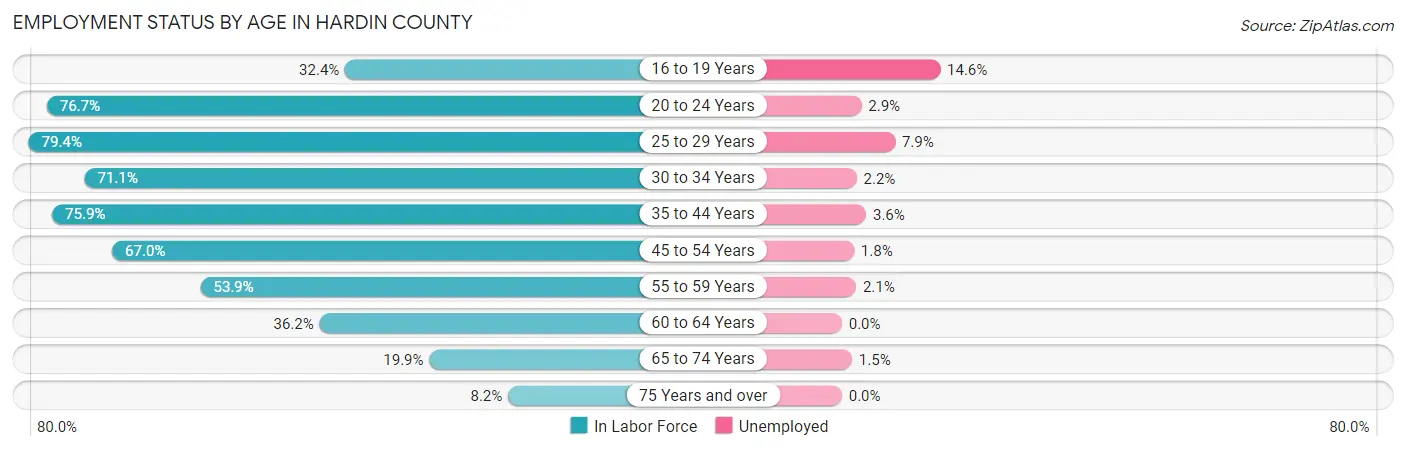
| Age Bracket | In Labor Force | Unemployed |
| 16 to 19 Years | 364 (32.4%) | 53 (14.6%) |
| 20 to 24 Years | 1,229 (76.7%) | 36 (2.9%) |
| 25 to 29 Years | 1,234 (79.4%) | 97 (7.9%) |
| 30 to 34 Years | 924 (71.1%) | 20 (2.2%) |
| 35 to 44 Years | 2,172 (75.9%) | 78 (3.6%) |
| 45 to 54 Years | 2,285 (67.0%) | 41 (1.8%) |
| 55 to 59 Years | 1,220 (53.9%) | 26 (2.1%) |
| 60 to 64 Years | 654 (36.2%) | 0 (0.0%) |
| 65 to 74 Years | 689 (19.9%) | 10 (1.5%) |
| 75 Years and over | 223 (8.2%) | 0 (0.0%) |
| Total | 11,007 (49.8%) | 363 (3.3%) |
Employment Status by Educational Attainment in Hardin County
According to labor force statistics for Hardin County, 64.4% of individuals (8,500) out of the total population between 25 and 64 years of age (13,198) are in the labor force, with 3.1% or 264 of them being unemployed. The group with the highest labor force participation rate are those with the educational attainment of bachelor's degree or higher, with 83.3% or 1,932 individuals in the labor force. Within the labor force, individuals with less than high school education have the highest percentage of unemployment, with 4.5% or 32 of them being unemployed.
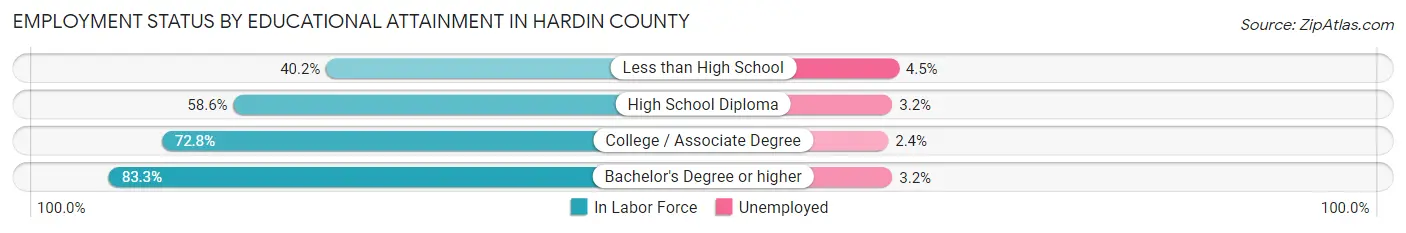
| Educational Attainment | In Labor Force | Unemployed |
| Less than High School | 715 (40.2%) | 80 (4.5%) |
| High School Diploma | 3,208 (58.6%) | 175 (3.2%) |
| College / Associate Degree | 2,640 (72.8%) | 87 (2.4%) |
| Bachelor's Degree or higher | 1,932 (83.3%) | 74 (3.2%) |
| Total | 8,500 (64.4%) | 409 (3.1%) |
Employment Occupations by Sex in Hardin County
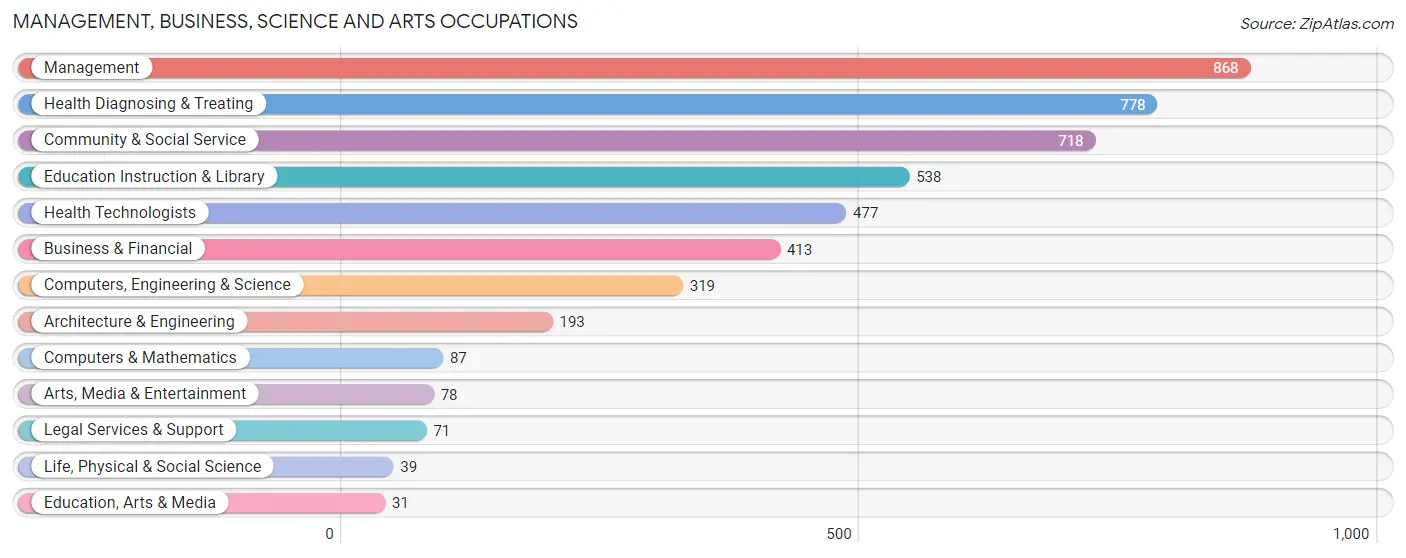
Management, Business, Science and Arts Occupations
The most common Management, Business, Science and Arts occupations in Hardin County are Management (868 | 8.2%), Health Diagnosing & Treating (778 | 7.3%), Community & Social Service (718 | 6.8%), Education Instruction & Library (538 | 5.1%), and Health Technologists (477 | 4.5%).
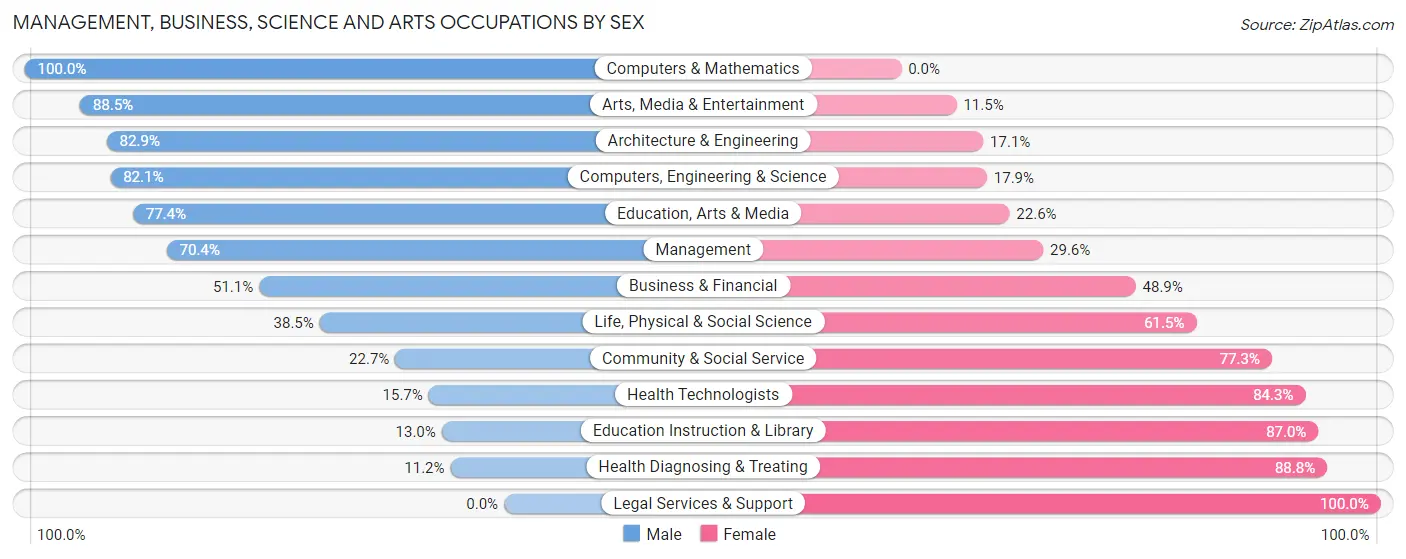
Management, Business, Science and Arts Occupations by Sex
Within the Management, Business, Science and Arts occupations in Hardin County, the most male-oriented occupations are Computers & Mathematics (100.0%), Arts, Media & Entertainment (88.5%), and Architecture & Engineering (82.9%), while the most female-oriented occupations are Legal Services & Support (100.0%), Health Diagnosing & Treating (88.8%), and Education Instruction & Library (87.0%).
| Occupation | Male | Female |
| Management | 611 (70.4%) | 257 (29.6%) |
| Business & Financial | 211 (51.1%) | 202 (48.9%) |
| Computers, Engineering & Science | 262 (82.1%) | 57 (17.9%) |
| Computers & Mathematics | 87 (100.0%) | 0 (0.0%) |
| Architecture & Engineering | 160 (82.9%) | 33 (17.1%) |
| Life, Physical & Social Science | 15 (38.5%) | 24 (61.5%) |
| Community & Social Service | 163 (22.7%) | 555 (77.3%) |
| Education, Arts & Media | 24 (77.4%) | 7 (22.6%) |
| Legal Services & Support | 0 (0.0%) | 71 (100.0%) |
| Education Instruction & Library | 70 (13.0%) | 468 (87.0%) |
| Arts, Media & Entertainment | 69 (88.5%) | 9 (11.5%) |
| Health Diagnosing & Treating | 87 (11.2%) | 691 (88.8%) |
| Health Technologists | 75 (15.7%) | 402 (84.3%) |
| Total (Category) | 1,334 (43.1%) | 1,762 (56.9%) |
| Total (Overall) | 5,675 (53.5%) | 4,934 (46.5%) |
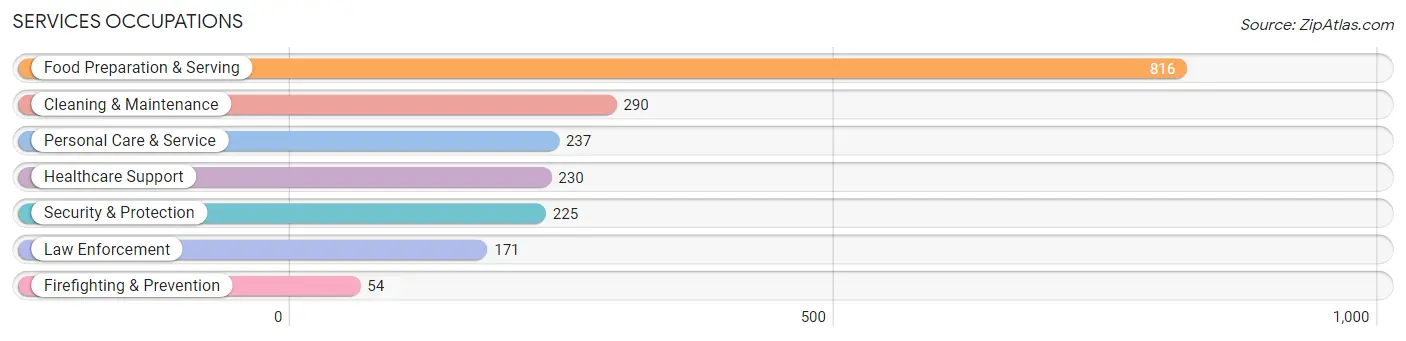
Services Occupations
The most common Services occupations in Hardin County are Food Preparation & Serving (816 | 7.7%), Cleaning & Maintenance (290 | 2.7%), Personal Care & Service (237 | 2.2%), Healthcare Support (230 | 2.2%), and Security & Protection (225 | 2.1%).
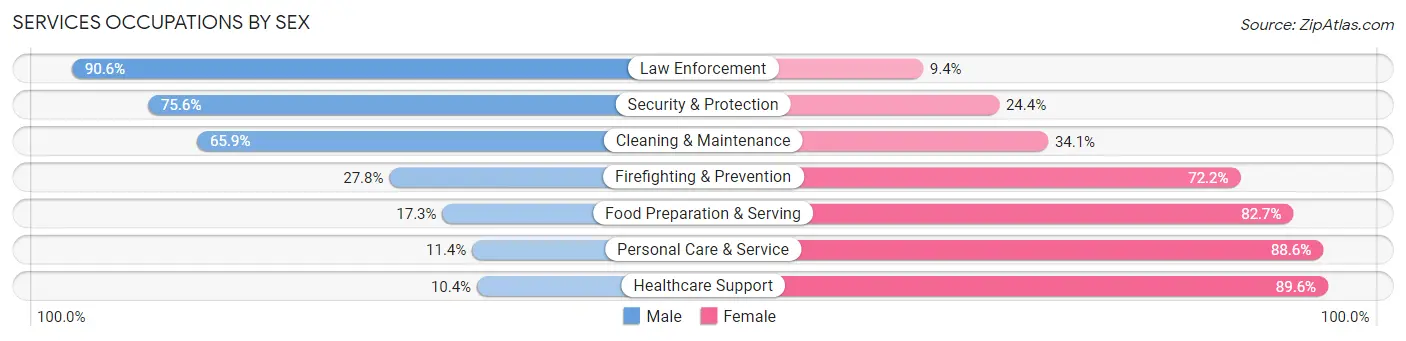
Services Occupations by Sex
Within the Services occupations in Hardin County, the most male-oriented occupations are Law Enforcement (90.6%), Security & Protection (75.6%), and Cleaning & Maintenance (65.9%), while the most female-oriented occupations are Healthcare Support (89.6%), Personal Care & Service (88.6%), and Food Preparation & Serving (82.7%).
| Occupation | Male | Female |
| Healthcare Support | 24 (10.4%) | 206 (89.6%) |
| Security & Protection | 170 (75.6%) | 55 (24.4%) |
| Firefighting & Prevention | 15 (27.8%) | 39 (72.2%) |
| Law Enforcement | 155 (90.6%) | 16 (9.4%) |
| Food Preparation & Serving | 141 (17.3%) | 675 (82.7%) |
| Cleaning & Maintenance | 191 (65.9%) | 99 (34.1%) |
| Personal Care & Service | 27 (11.4%) | 210 (88.6%) |
| Total (Category) | 553 (30.8%) | 1,245 (69.2%) |
| Total (Overall) | 5,675 (53.5%) | 4,934 (46.5%) |
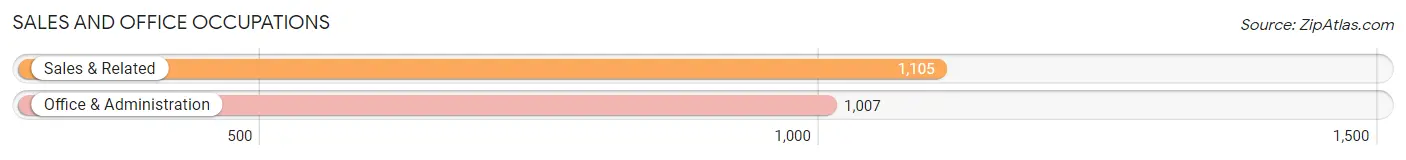
Sales and Office Occupations
The most common Sales and Office occupations in Hardin County are Sales & Related (1,105 | 10.4%), and Office & Administration (1,007 | 9.5%).
Sales and Office Occupations by Sex
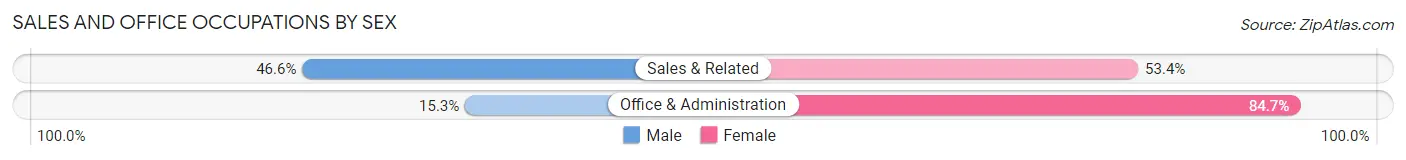
| Occupation | Male | Female |
| Sales & Related | 515 (46.6%) | 590 (53.4%) |
| Office & Administration | 154 (15.3%) | 853 (84.7%) |
| Total (Category) | 669 (31.7%) | 1,443 (68.3%) |
| Total (Overall) | 5,675 (53.5%) | 4,934 (46.5%) |
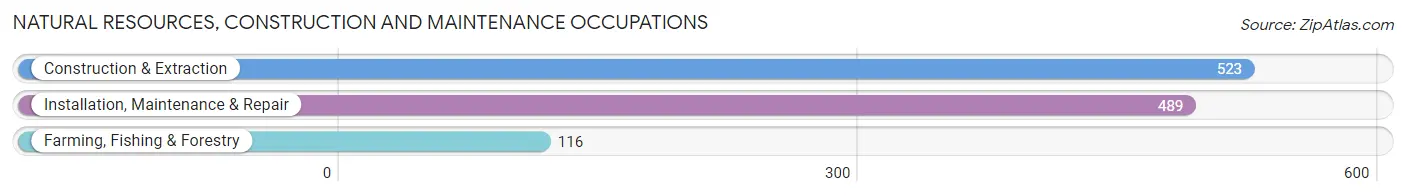
Natural Resources, Construction and Maintenance Occupations
The most common Natural Resources, Construction and Maintenance occupations in Hardin County are Construction & Extraction (523 | 4.9%), Installation, Maintenance & Repair (489 | 4.6%), and Farming, Fishing & Forestry (116 | 1.1%).
Natural Resources, Construction and Maintenance Occupations by Sex
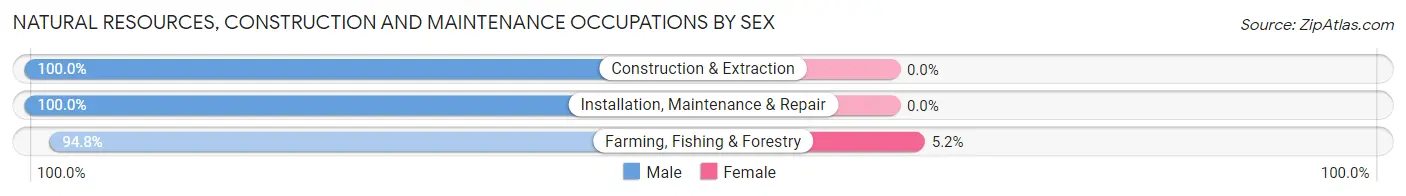
| Occupation | Male | Female |
| Farming, Fishing & Forestry | 110 (94.8%) | 6 (5.2%) |
| Construction & Extraction | 523 (100.0%) | 0 (0.0%) |
| Installation, Maintenance & Repair | 489 (100.0%) | 0 (0.0%) |
| Total (Category) | 1,122 (99.5%) | 6 (0.5%) |
| Total (Overall) | 5,675 (53.5%) | 4,934 (46.5%) |
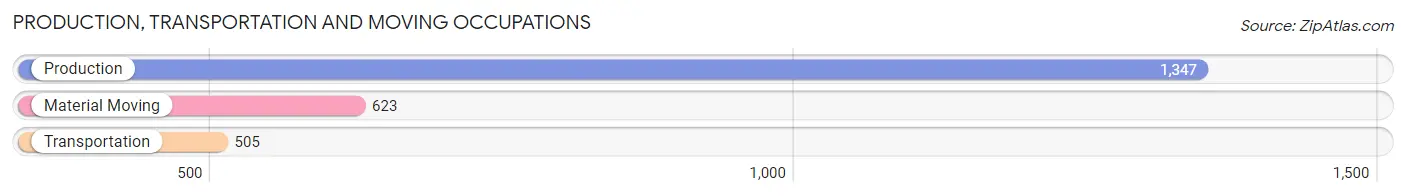
Production, Transportation and Moving Occupations
The most common Production, Transportation and Moving occupations in Hardin County are Production (1,347 | 12.7%), Material Moving (623 | 5.9%), and Transportation (505 | 4.8%).
Production, Transportation and Moving Occupations by Sex
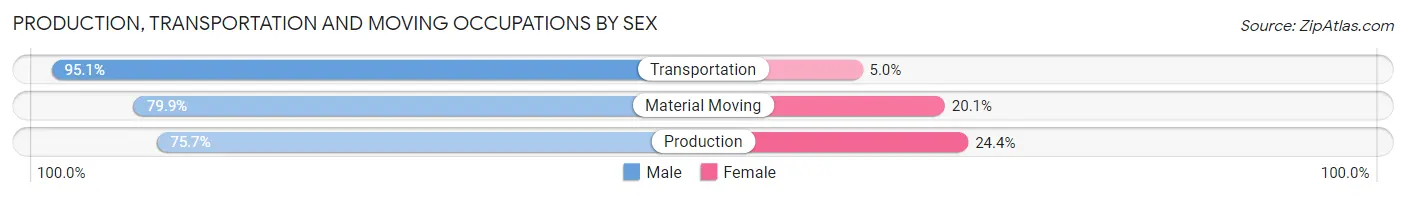
| Occupation | Male | Female |
| Production | 1,019 (75.6%) | 328 (24.3%) |
| Transportation | 480 (95.1%) | 25 (5.0%) |
| Material Moving | 498 (79.9%) | 125 (20.1%) |
| Total (Category) | 1,997 (80.7%) | 478 (19.3%) |
| Total (Overall) | 5,675 (53.5%) | 4,934 (46.5%) |
Employment Industries by Sex in Hardin County
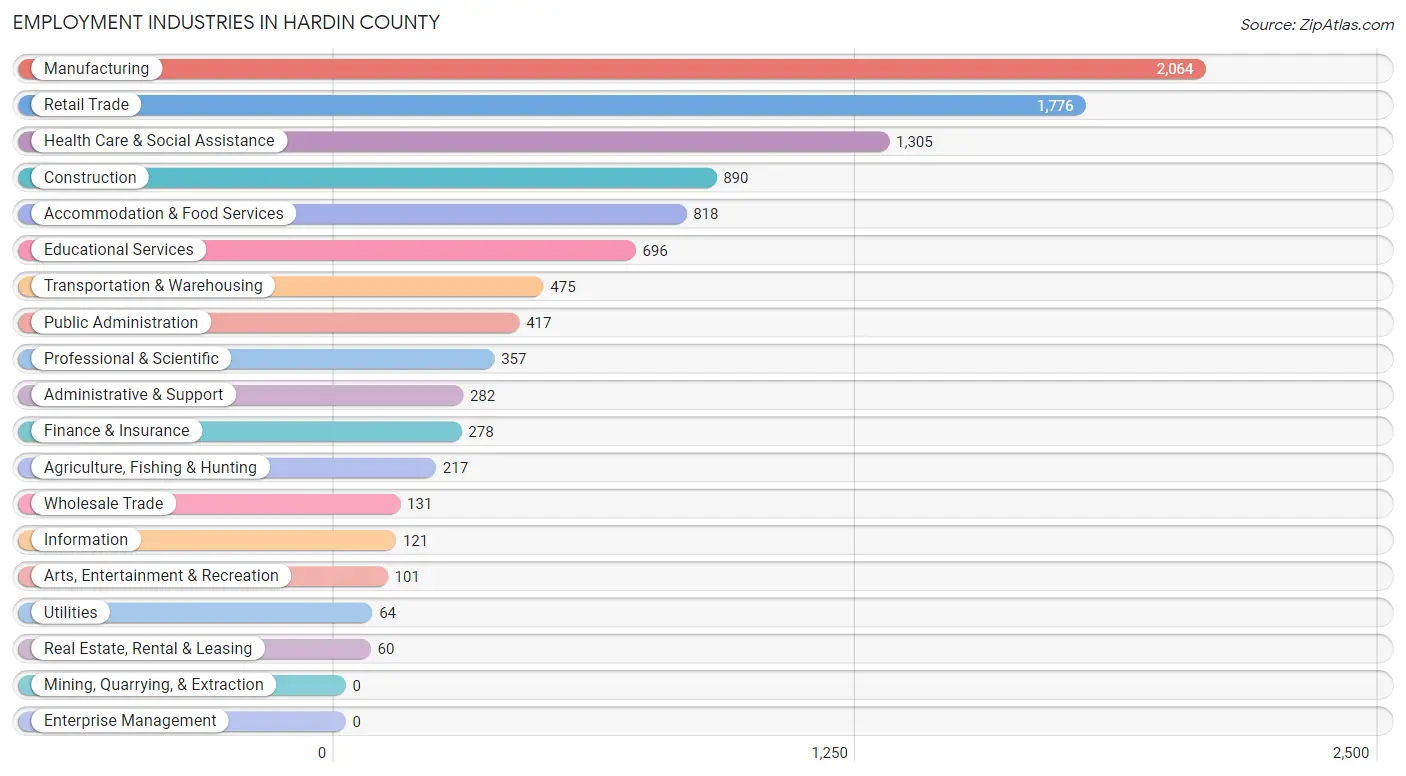
Employment Industries in Hardin County
The major employment industries in Hardin County include Manufacturing (2,064 | 19.5%), Retail Trade (1,776 | 16.7%), Health Care & Social Assistance (1,305 | 12.3%), Construction (890 | 8.4%), and Accommodation & Food Services (818 | 7.7%).
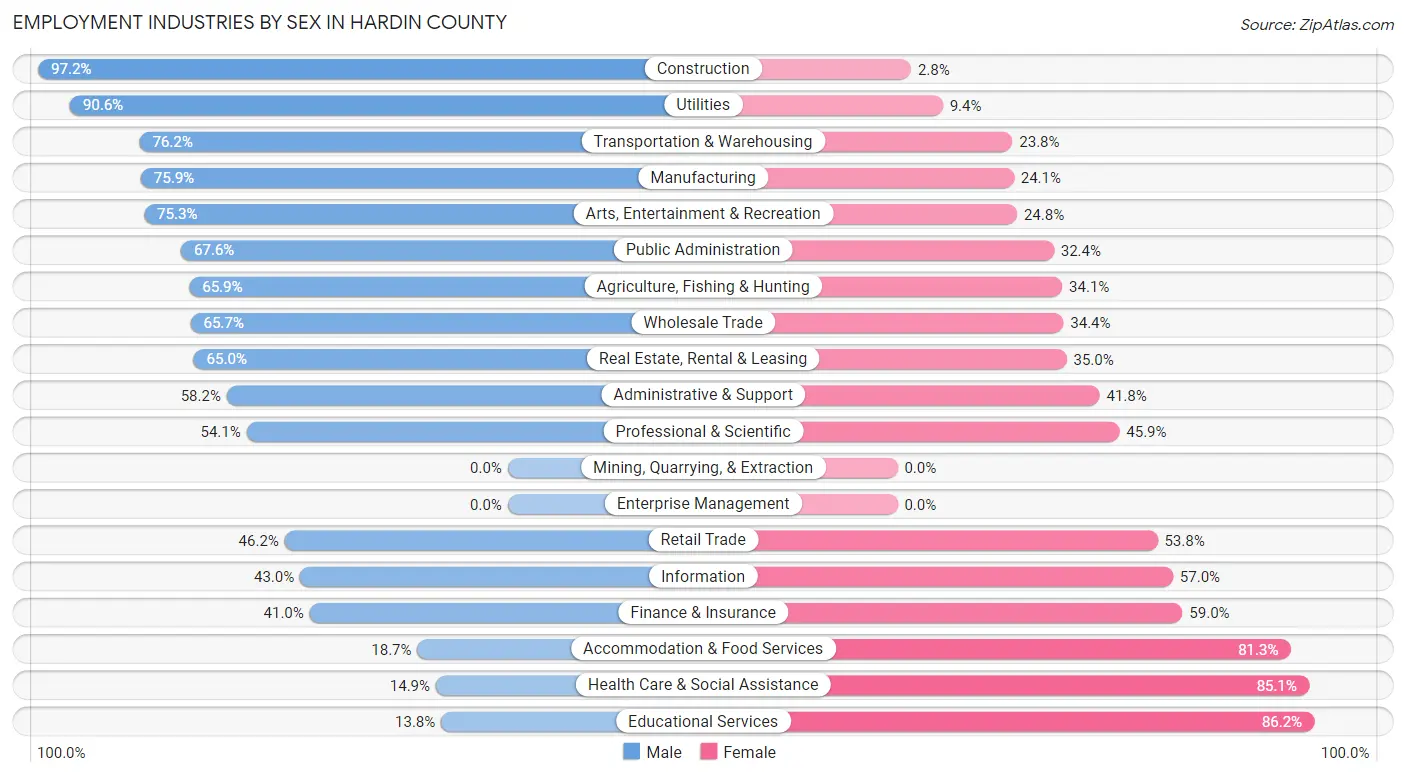
Employment Industries by Sex in Hardin County
The Hardin County industries that see more men than women are Construction (97.2%), Utilities (90.6%), and Transportation & Warehousing (76.2%), whereas the industries that tend to have a higher number of women are Educational Services (86.2%), Health Care & Social Assistance (85.1%), and Accommodation & Food Services (81.3%).
| Industry | Male | Female |
| Agriculture, Fishing & Hunting | 143 (65.9%) | 74 (34.1%) |
| Mining, Quarrying, & Extraction | 0 (0.0%) | 0 (0.0%) |
| Construction | 865 (97.2%) | 25 (2.8%) |
| Manufacturing | 1,567 (75.9%) | 497 (24.1%) |
| Wholesale Trade | 86 (65.6%) | 45 (34.4%) |
| Retail Trade | 820 (46.2%) | 956 (53.8%) |
| Transportation & Warehousing | 362 (76.2%) | 113 (23.8%) |
| Utilities | 58 (90.6%) | 6 (9.4%) |
| Information | 52 (43.0%) | 69 (57.0%) |
| Finance & Insurance | 114 (41.0%) | 164 (59.0%) |
| Real Estate, Rental & Leasing | 39 (65.0%) | 21 (35.0%) |
| Professional & Scientific | 193 (54.1%) | 164 (45.9%) |
| Enterprise Management | 0 (0.0%) | 0 (0.0%) |
| Administrative & Support | 164 (58.2%) | 118 (41.8%) |
| Educational Services | 96 (13.8%) | 600 (86.2%) |
| Health Care & Social Assistance | 194 (14.9%) | 1,111 (85.1%) |
| Arts, Entertainment & Recreation | 76 (75.2%) | 25 (24.7%) |
| Accommodation & Food Services | 153 (18.7%) | 665 (81.3%) |
| Public Administration | 282 (67.6%) | 135 (32.4%) |
| Total | 5,675 (53.5%) | 4,934 (46.5%) |
Education in Hardin County
School Enrollment in Hardin County
The most common levels of schooling among the 5,294 students in Hardin County are high school (1,392 | 26.3%), middle school (1,381 | 26.1%), and elementary school (1,003 | 19.0%).
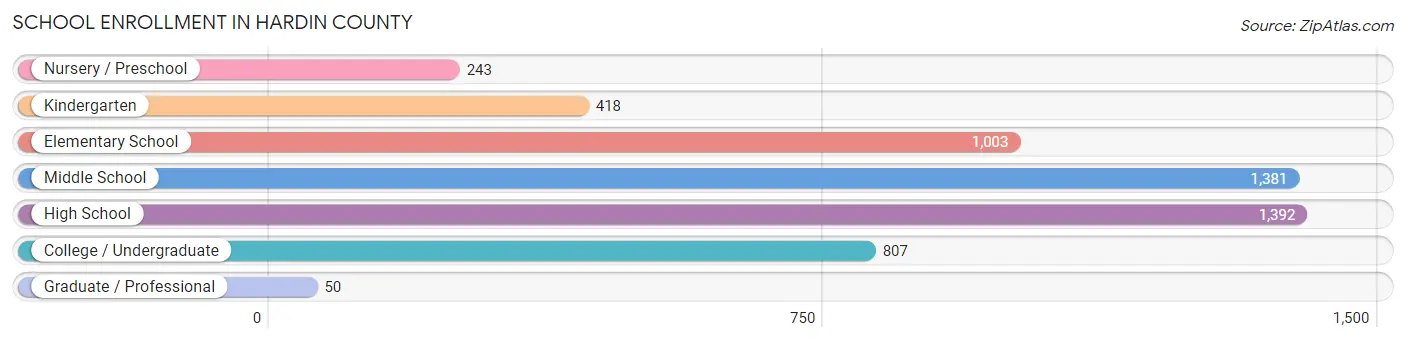
| School Level | # Students | % Students |
| Nursery / Preschool | 243 | 4.6% |
| Kindergarten | 418 | 7.9% |
| Elementary School | 1,003 | 19.0% |
| Middle School | 1,381 | 26.1% |
| High School | 1,392 | 26.3% |
| College / Undergraduate | 807 | 15.2% |
| Graduate / Professional | 50 | 0.9% |
| Total | 5,294 | 100.0% |
School Enrollment by Age by Funding Source in Hardin County
Out of a total of 5,294 students who are enrolled in schools in Hardin County, 889 (16.8%) attend a private institution, while the remaining 4,405 (83.2%) are enrolled in public schools. The age group of 3 to 4 year olds has the highest likelihood of being enrolled in private schools, with 42 (36.8% in the age bracket) enrolled. Conversely, the age group of 15 to 17 year olds has the lowest likelihood of being enrolled in a private school, with 1,005 (93.2% in the age bracket) attending a public institution.
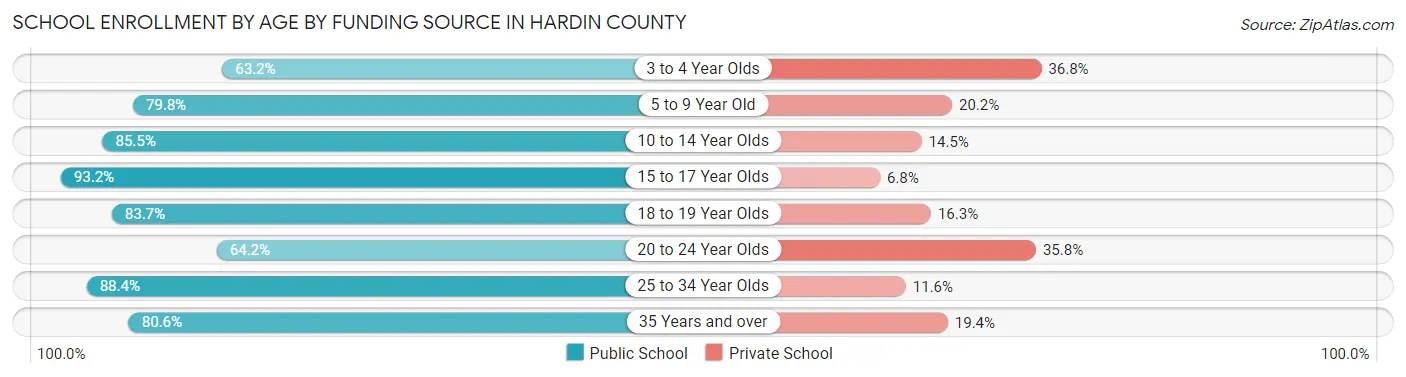
| Age Bracket | Public School | Private School |
| 3 to 4 Year Olds | 72 (63.2%) | 42 (36.8%) |
| 5 to 9 Year Old | 1,166 (79.8%) | 295 (20.2%) |
| 10 to 14 Year Olds | 1,347 (85.5%) | 229 (14.5%) |
| 15 to 17 Year Olds | 1,005 (93.2%) | 73 (6.8%) |
| 18 to 19 Year Olds | 242 (83.7%) | 47 (16.3%) |
| 20 to 24 Year Olds | 267 (64.2%) | 149 (35.8%) |
| 25 to 34 Year Olds | 168 (88.4%) | 22 (11.6%) |
| 35 Years and over | 137 (80.6%) | 33 (19.4%) |
| Total | 4,405 (83.2%) | 889 (16.8%) |
Educational Attainment by Field of Study in Hardin County
Education (890 | 28.3%), business (727 | 23.2%), science & technology (419 | 13.3%), arts & humanities (157 | 5.0%), and social sciences (151 | 4.8%) are the most common fields of study among 3,140 individuals in Hardin County who have obtained a bachelor's degree or higher.
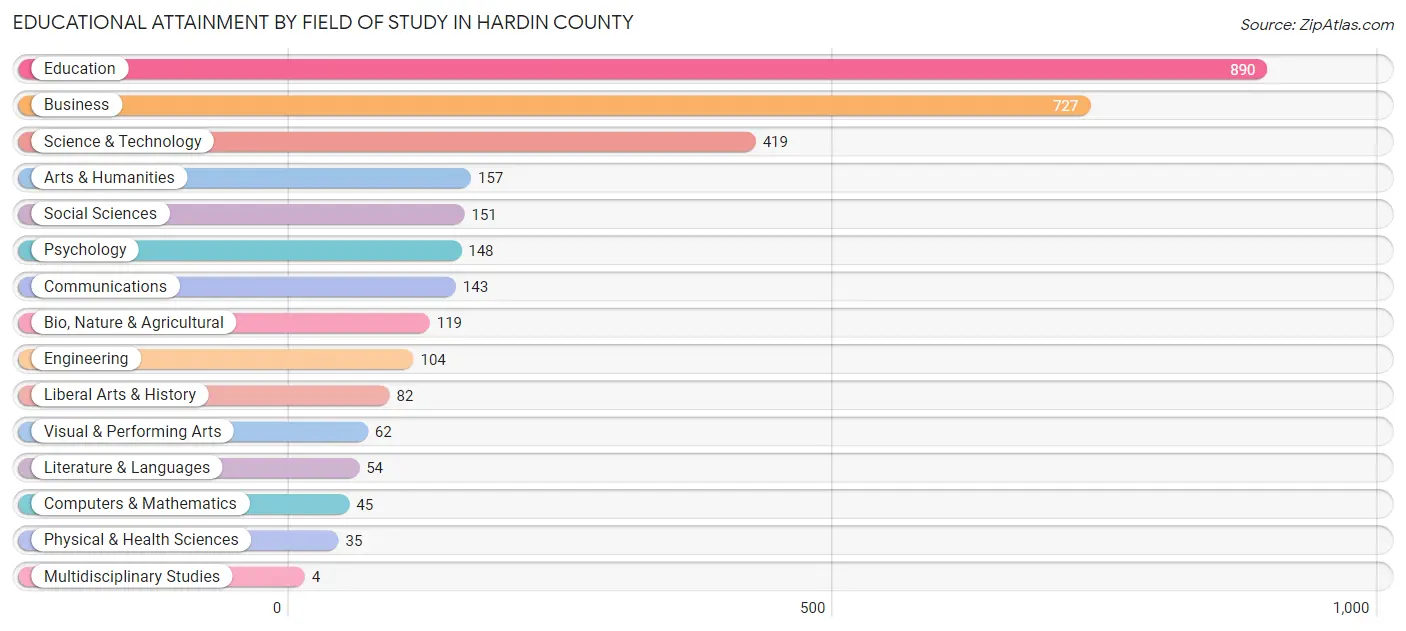
| Field of Study | # Graduates | % Graduates |
| Computers & Mathematics | 45 | 1.4% |
| Bio, Nature & Agricultural | 119 | 3.8% |
| Physical & Health Sciences | 35 | 1.1% |
| Psychology | 148 | 4.7% |
| Social Sciences | 151 | 4.8% |
| Engineering | 104 | 3.3% |
| Multidisciplinary Studies | 4 | 0.1% |
| Science & Technology | 419 | 13.3% |
| Business | 727 | 23.2% |
| Education | 890 | 28.3% |
| Literature & Languages | 54 | 1.7% |
| Liberal Arts & History | 82 | 2.6% |
| Visual & Performing Arts | 62 | 2.0% |
| Communications | 143 | 4.5% |
| Arts & Humanities | 157 | 5.0% |
| Total | 3,140 | 100.0% |
Transportation & Commute in Hardin County
Vehicle Availability by Sex in Hardin County
The most prevalent vehicle ownership categories in Hardin County are males with 2 vehicles (2,397, accounting for 43.1%) and females with 2 vehicles (1,965, making up 49.3%).
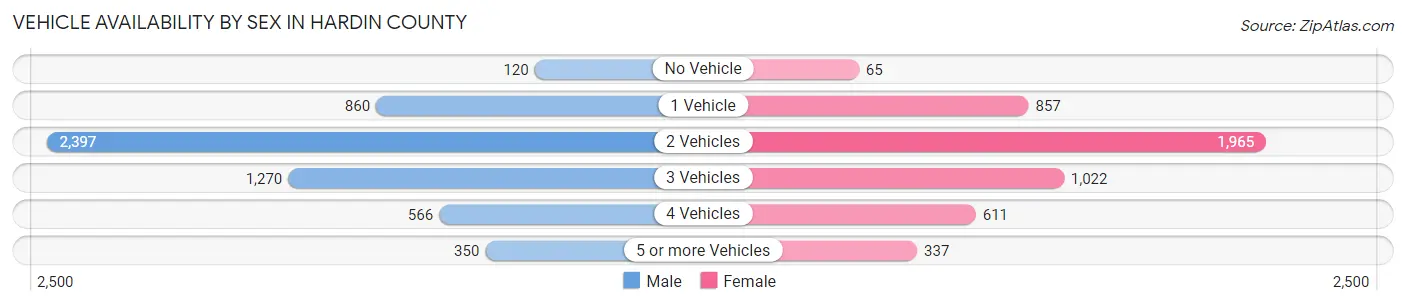
| Vehicles Available | Male | Female |
| No Vehicle | 120 (2.2%) | 65 (1.3%) |
| 1 Vehicle | 860 (15.5%) | 857 (17.6%) |
| 2 Vehicles | 2,397 (43.1%) | 1,965 (40.5%) |
| 3 Vehicles | 1,270 (22.8%) | 1,022 (21.0%) |
| 4 Vehicles | 566 (10.2%) | 611 (12.6%) |
| 5 or more Vehicles | 350 (6.3%) | 337 (6.9%) |
| Total | 5,563 (100.0%) | 4,857 (100.0%) |
Commute Time in Hardin County
The most frequently occuring commute durations in Hardin County are 15 to 19 minutes (1,839 commuters, 18.8%), 10 to 14 minutes (1,580 commuters, 16.1%), and 5 to 9 minutes (1,348 commuters, 13.8%).
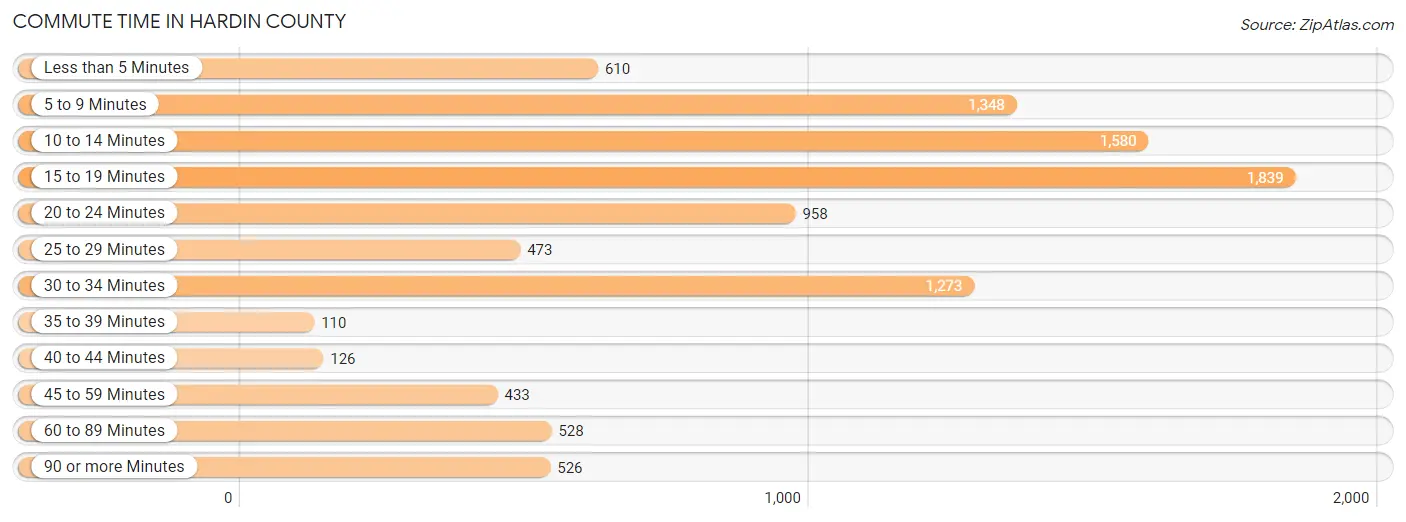
| Commute Time | # Commuters | % Commuters |
| Less than 5 Minutes | 610 | 6.2% |
| 5 to 9 Minutes | 1,348 | 13.8% |
| 10 to 14 Minutes | 1,580 | 16.1% |
| 15 to 19 Minutes | 1,839 | 18.8% |
| 20 to 24 Minutes | 958 | 9.8% |
| 25 to 29 Minutes | 473 | 4.8% |
| 30 to 34 Minutes | 1,273 | 13.0% |
| 35 to 39 Minutes | 110 | 1.1% |
| 40 to 44 Minutes | 126 | 1.3% |
| 45 to 59 Minutes | 433 | 4.4% |
| 60 to 89 Minutes | 528 | 5.4% |
| 90 or more Minutes | 526 | 5.4% |
Commute Time by Sex in Hardin County
The most common commute times in Hardin County are 30 to 34 minutes (839 commuters, 16.3%) for males and 15 to 19 minutes (1,184 commuters, 25.4%) for females.
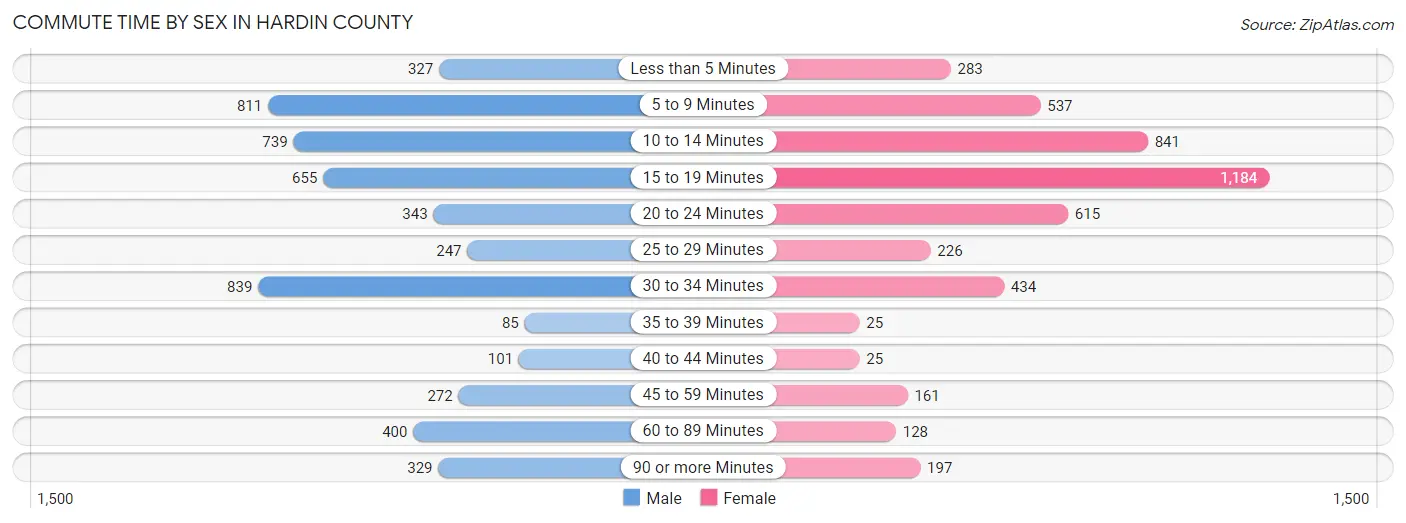
| Commute Time | Male | Female |
| Less than 5 Minutes | 327 (6.4%) | 283 (6.1%) |
| 5 to 9 Minutes | 811 (15.8%) | 537 (11.5%) |
| 10 to 14 Minutes | 739 (14.4%) | 841 (18.1%) |
| 15 to 19 Minutes | 655 (12.7%) | 1,184 (25.4%) |
| 20 to 24 Minutes | 343 (6.7%) | 615 (13.2%) |
| 25 to 29 Minutes | 247 (4.8%) | 226 (4.9%) |
| 30 to 34 Minutes | 839 (16.3%) | 434 (9.3%) |
| 35 to 39 Minutes | 85 (1.7%) | 25 (0.5%) |
| 40 to 44 Minutes | 101 (2.0%) | 25 (0.5%) |
| 45 to 59 Minutes | 272 (5.3%) | 161 (3.5%) |
| 60 to 89 Minutes | 400 (7.8%) | 128 (2.8%) |
| 90 or more Minutes | 329 (6.4%) | 197 (4.2%) |
Time of Departure to Work by Sex in Hardin County
The most frequent times of departure to work in Hardin County are 5:30 AM to 5:59 AM (598, 11.6%) for males and 7:00 AM to 7:29 AM (928, 19.9%) for females.
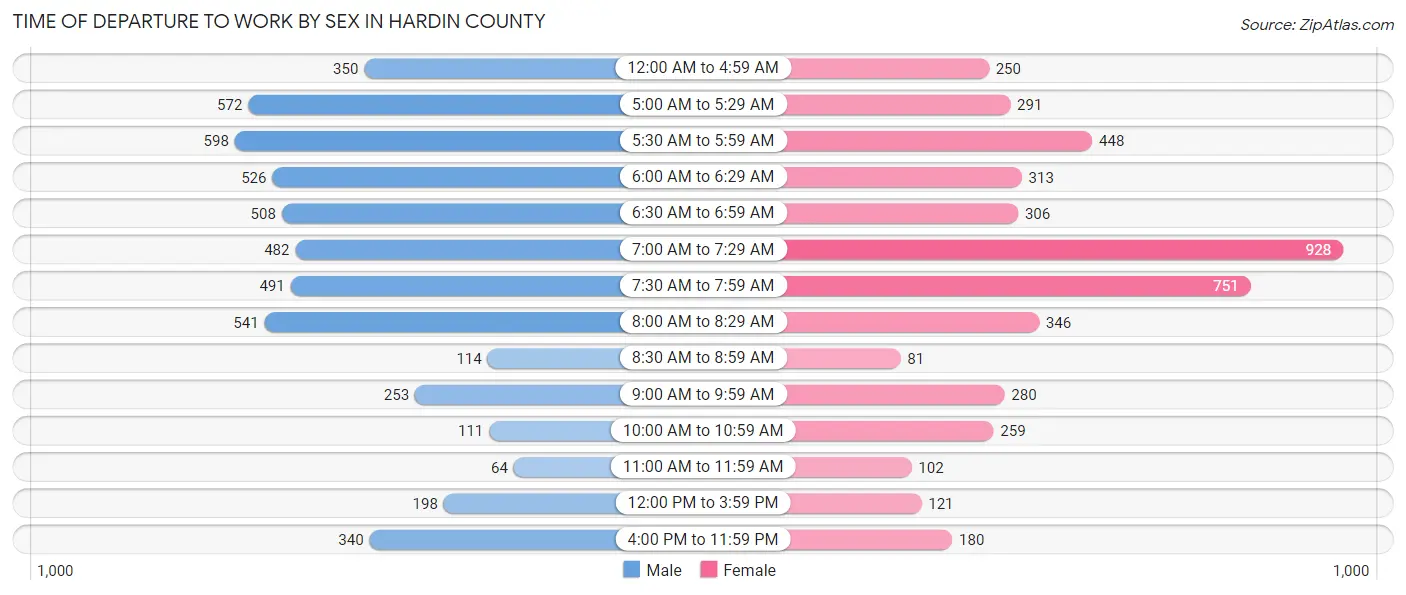
| Time of Departure | Male | Female |
| 12:00 AM to 4:59 AM | 350 (6.8%) | 250 (5.4%) |
| 5:00 AM to 5:29 AM | 572 (11.1%) | 291 (6.2%) |
| 5:30 AM to 5:59 AM | 598 (11.6%) | 448 (9.6%) |
| 6:00 AM to 6:29 AM | 526 (10.2%) | 313 (6.7%) |
| 6:30 AM to 6:59 AM | 508 (9.9%) | 306 (6.6%) |
| 7:00 AM to 7:29 AM | 482 (9.4%) | 928 (19.9%) |
| 7:30 AM to 7:59 AM | 491 (9.5%) | 751 (16.1%) |
| 8:00 AM to 8:29 AM | 541 (10.5%) | 346 (7.4%) |
| 8:30 AM to 8:59 AM | 114 (2.2%) | 81 (1.7%) |
| 9:00 AM to 9:59 AM | 253 (4.9%) | 280 (6.0%) |
| 10:00 AM to 10:59 AM | 111 (2.2%) | 259 (5.6%) |
| 11:00 AM to 11:59 AM | 64 (1.2%) | 102 (2.2%) |
| 12:00 PM to 3:59 PM | 198 (3.8%) | 121 (2.6%) |
| 4:00 PM to 11:59 PM | 340 (6.6%) | 180 (3.9%) |
| Total | 5,148 (100.0%) | 4,656 (100.0%) |
Housing Occupancy in Hardin County
Occupancy by Ownership in Hardin County
Of the total 10,903 dwellings in Hardin County, owner-occupied units account for 8,243 (75.6%), while renter-occupied units make up 2,660 (24.4%).
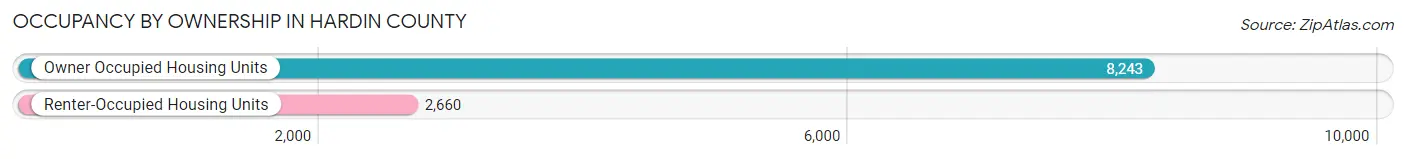
| Occupancy | # Housing Units | % Housing Units |
| Owner Occupied Housing Units | 8,243 | 75.6% |
| Renter-Occupied Housing Units | 2,660 | 24.4% |
| Total Occupied Housing Units | 10,903 | 100.0% |
Occupancy by Household Size in Hardin County
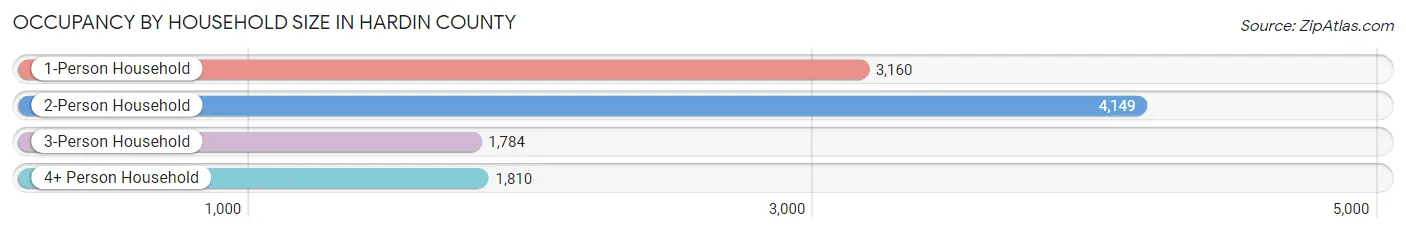
| Household Size | # Housing Units | % Housing Units |
| 1-Person Household | 3,160 | 29.0% |
| 2-Person Household | 4,149 | 38.1% |
| 3-Person Household | 1,784 | 16.4% |
| 4+ Person Household | 1,810 | 16.6% |
| Total Housing Units | 10,903 | 100.0% |
Occupancy by Ownership by Household Size in Hardin County
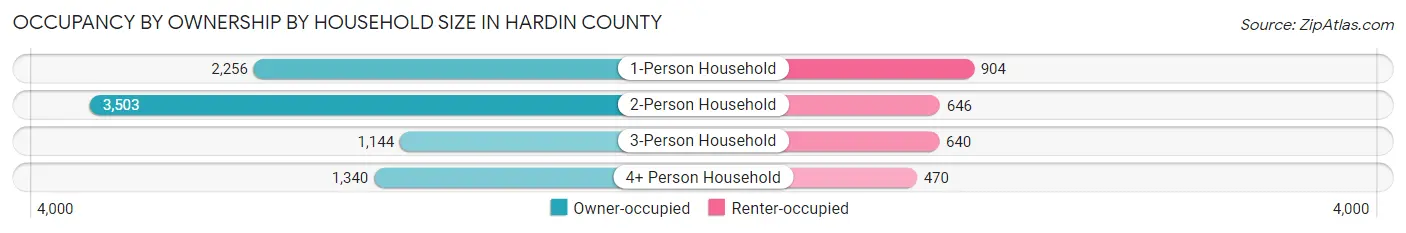
| Household Size | Owner-occupied | Renter-occupied |
| 1-Person Household | 2,256 (71.4%) | 904 (28.6%) |
| 2-Person Household | 3,503 (84.4%) | 646 (15.6%) |
| 3-Person Household | 1,144 (64.1%) | 640 (35.9%) |
| 4+ Person Household | 1,340 (74.0%) | 470 (26.0%) |
| Total Housing Units | 8,243 (75.6%) | 2,660 (24.4%) |
Occupancy by Educational Attainment in Hardin County
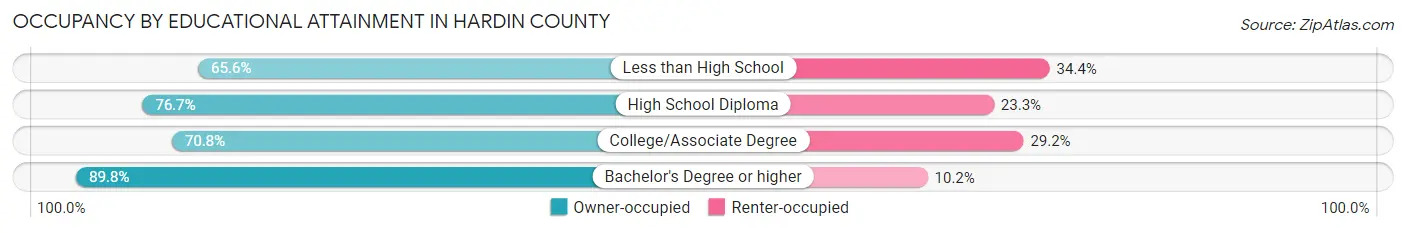
| Household Size | Owner-occupied | Renter-occupied |
| Less than High School | 946 (65.6%) | 496 (34.4%) |
| High School Diploma | 3,492 (76.7%) | 1,063 (23.3%) |
| College/Associate Degree | 2,238 (70.8%) | 923 (29.2%) |
| Bachelor's Degree or higher | 1,567 (89.8%) | 178 (10.2%) |
Occupancy by Age of Householder in Hardin County
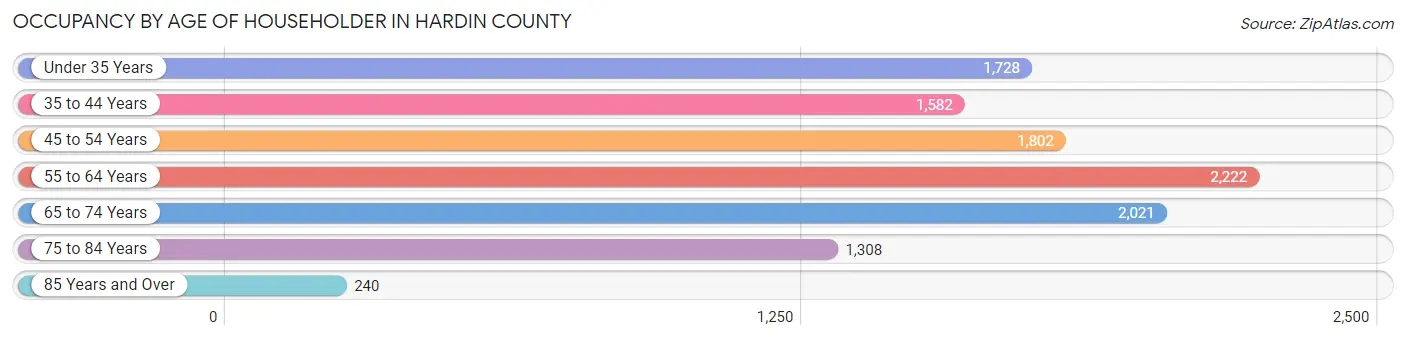
| Age Bracket | # Households | % Households |
| Under 35 Years | 1,728 | 15.9% |
| 35 to 44 Years | 1,582 | 14.5% |
| 45 to 54 Years | 1,802 | 16.5% |
| 55 to 64 Years | 2,222 | 20.4% |
| 65 to 74 Years | 2,021 | 18.5% |
| 75 to 84 Years | 1,308 | 12.0% |
| 85 Years and Over | 240 | 2.2% |
| Total | 10,903 | 100.0% |
Housing Finances in Hardin County
Median Income by Occupancy in Hardin County
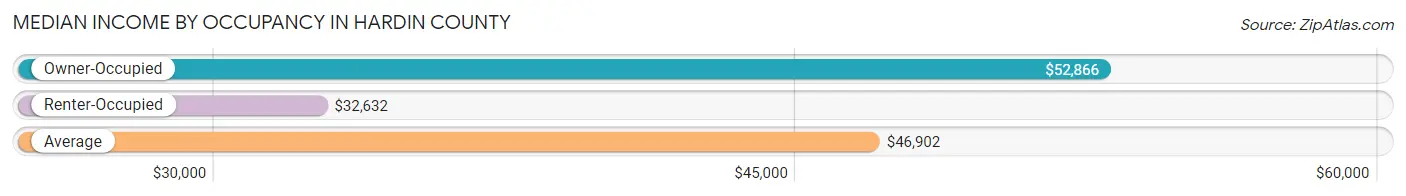
| Occupancy Type | # Households | Median Income |
| Owner-Occupied | 8,243 (75.6%) | $52,866 |
| Renter-Occupied | 2,660 (24.4%) | $32,632 |
| Average | 10,903 (100.0%) | $46,902 |
Occupancy by Householder Income Bracket in Hardin County
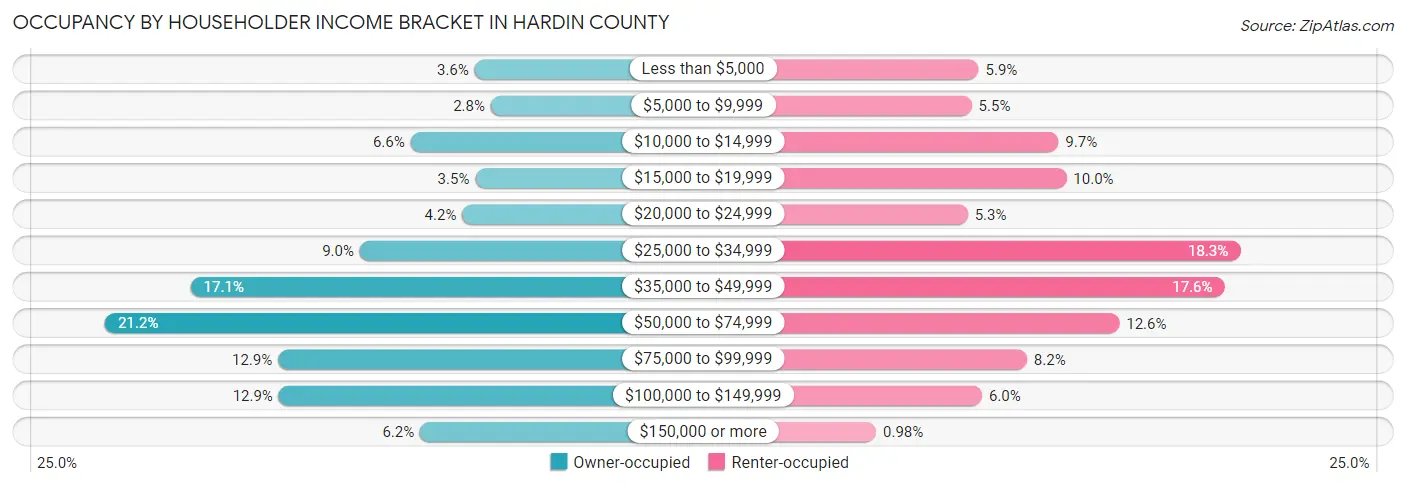
| Income Bracket | Owner-occupied | Renter-occupied |
| Less than $5,000 | 294 (3.6%) | 156 (5.9%) |
| $5,000 to $9,999 | 231 (2.8%) | 147 (5.5%) |
| $10,000 to $14,999 | 546 (6.6%) | 257 (9.7%) |
| $15,000 to $19,999 | 292 (3.5%) | 267 (10.0%) |
| $20,000 to $24,999 | 343 (4.2%) | 142 (5.3%) |
| $25,000 to $34,999 | 745 (9.0%) | 487 (18.3%) |
| $35,000 to $49,999 | 1,409 (17.1%) | 467 (17.6%) |
| $50,000 to $74,999 | 1,745 (21.2%) | 334 (12.6%) |
| $75,000 to $99,999 | 1,066 (12.9%) | 217 (8.2%) |
| $100,000 to $149,999 | 1,063 (12.9%) | 160 (6.0%) |
| $150,000 or more | 509 (6.2%) | 26 (1.0%) |
| Total | 8,243 (100.0%) | 2,660 (100.0%) |
Monthly Housing Cost Tiers in Hardin County
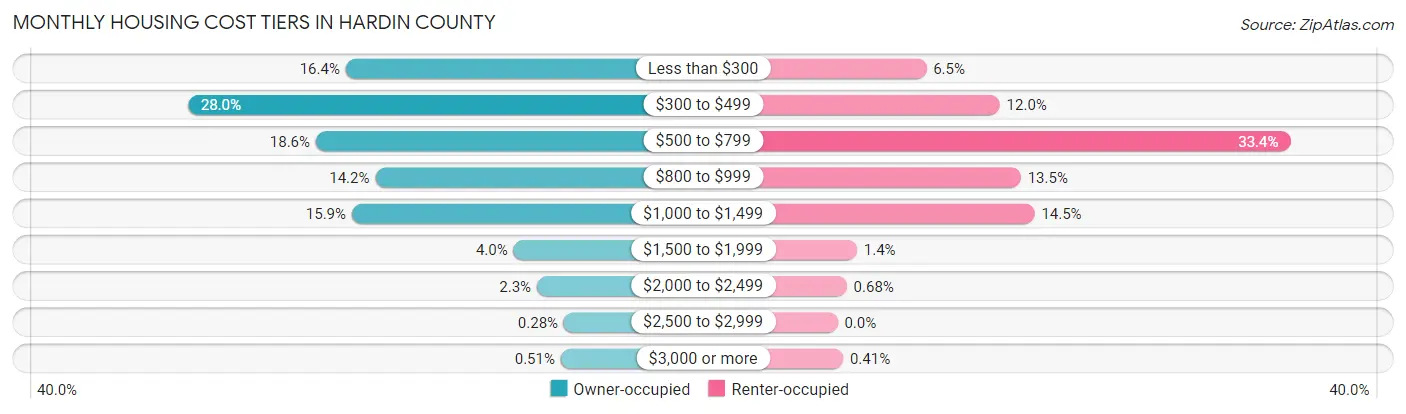
| Monthly Cost | Owner-occupied | Renter-occupied |
| Less than $300 | 1,348 (16.4%) | 174 (6.5%) |
| $300 to $499 | 2,306 (28.0%) | 318 (11.9%) |
| $500 to $799 | 1,529 (18.5%) | 887 (33.4%) |
| $800 to $999 | 1,168 (14.2%) | 359 (13.5%) |
| $1,000 to $1,499 | 1,311 (15.9%) | 386 (14.5%) |
| $1,500 to $1,999 | 329 (4.0%) | 38 (1.4%) |
| $2,000 to $2,499 | 187 (2.3%) | 18 (0.7%) |
| $2,500 to $2,999 | 23 (0.3%) | 0 (0.0%) |
| $3,000 or more | 42 (0.5%) | 11 (0.4%) |
| Total | 8,243 (100.0%) | 2,660 (100.0%) |
Physical Housing Characteristics in Hardin County
Housing Structures in Hardin County
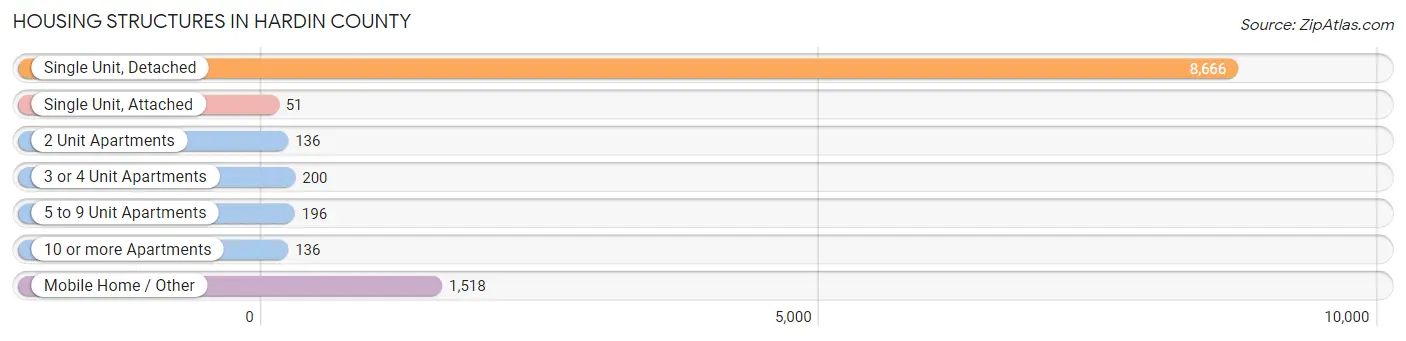
| Structure Type | # Housing Units | % Housing Units |
| Single Unit, Detached | 8,666 | 79.5% |
| Single Unit, Attached | 51 | 0.5% |
| 2 Unit Apartments | 136 | 1.3% |
| 3 or 4 Unit Apartments | 200 | 1.8% |
| 5 to 9 Unit Apartments | 196 | 1.8% |
| 10 or more Apartments | 136 | 1.3% |
| Mobile Home / Other | 1,518 | 13.9% |
| Total | 10,903 | 100.0% |
Housing Structures by Occupancy in Hardin County
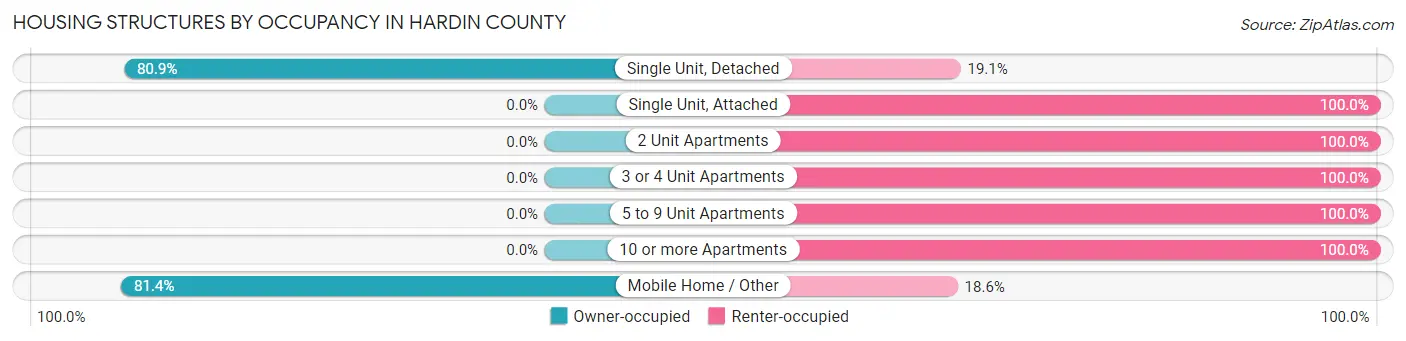
| Structure Type | Owner-occupied | Renter-occupied |
| Single Unit, Detached | 7,007 (80.9%) | 1,659 (19.1%) |
| Single Unit, Attached | 0 (0.0%) | 51 (100.0%) |
| 2 Unit Apartments | 0 (0.0%) | 136 (100.0%) |
| 3 or 4 Unit Apartments | 0 (0.0%) | 200 (100.0%) |
| 5 to 9 Unit Apartments | 0 (0.0%) | 196 (100.0%) |
| 10 or more Apartments | 0 (0.0%) | 136 (100.0%) |
| Mobile Home / Other | 1,236 (81.4%) | 282 (18.6%) |
| Total | 8,243 (75.6%) | 2,660 (24.4%) |
Housing Structures by Number of Rooms in Hardin County
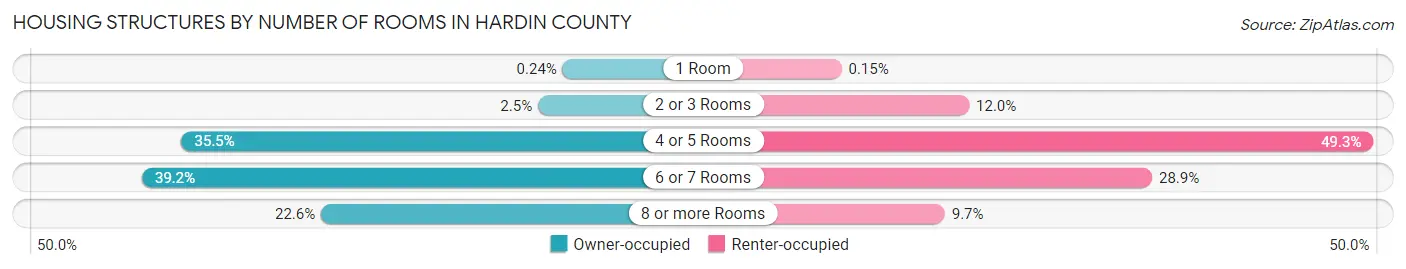
| Number of Rooms | Owner-occupied | Renter-occupied |
| 1 Room | 20 (0.2%) | 4 (0.2%) |
| 2 or 3 Rooms | 208 (2.5%) | 318 (11.9%) |
| 4 or 5 Rooms | 2,926 (35.5%) | 1,312 (49.3%) |
| 6 or 7 Rooms | 3,228 (39.2%) | 768 (28.9%) |
| 8 or more Rooms | 1,861 (22.6%) | 258 (9.7%) |
| Total | 8,243 (100.0%) | 2,660 (100.0%) |
Housing Structure by Heating Type in Hardin County
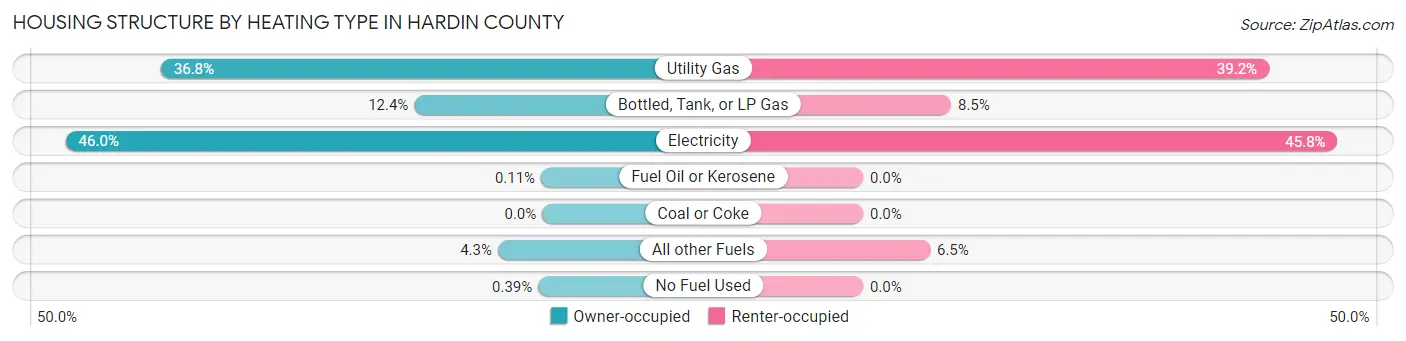
| Heating Type | Owner-occupied | Renter-occupied |
| Utility Gas | 3,036 (36.8%) | 1,043 (39.2%) |
| Bottled, Tank, or LP Gas | 1,019 (12.4%) | 226 (8.5%) |
| Electricity | 3,794 (46.0%) | 1,219 (45.8%) |
| Fuel Oil or Kerosene | 9 (0.1%) | 0 (0.0%) |
| Coal or Coke | 0 (0.0%) | 0 (0.0%) |
| All other Fuels | 353 (4.3%) | 172 (6.5%) |
| No Fuel Used | 32 (0.4%) | 0 (0.0%) |
| Total | 8,243 (100.0%) | 2,660 (100.0%) |
Household Vehicle Usage in Hardin County
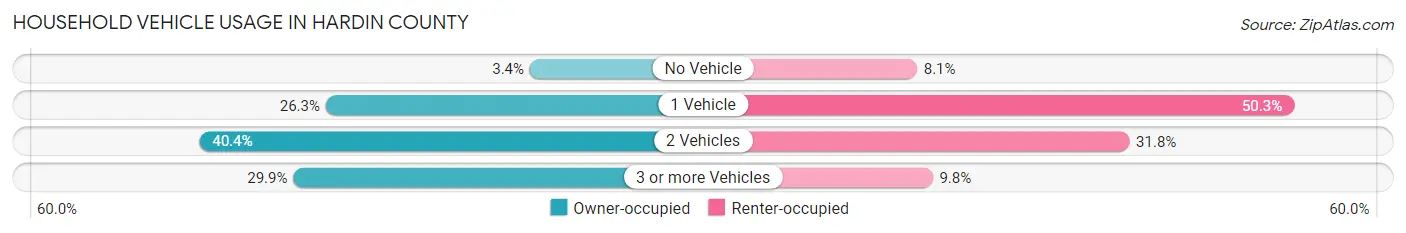
| Vehicles per Household | Owner-occupied | Renter-occupied |
| No Vehicle | 280 (3.4%) | 214 (8.1%) |
| 1 Vehicle | 2,165 (26.3%) | 1,338 (50.3%) |
| 2 Vehicles | 3,333 (40.4%) | 847 (31.8%) |
| 3 or more Vehicles | 2,465 (29.9%) | 261 (9.8%) |
| Total | 8,243 (100.0%) | 2,660 (100.0%) |
Real Estate & Mortgages in Hardin County
Real Estate and Mortgage Overview in Hardin County
| Characteristic | Without Mortgage | With Mortgage |
| Housing Units | 4,519 | 3,724 |
| Median Property Value | $129,500 | $152,600 |
| Median Household Income | $44,135 | $226 |
| Monthly Housing Costs | $366 | $42 |
| Real Estate Taxes | $652 | $154 |
Property Value by Mortgage Status in Hardin County
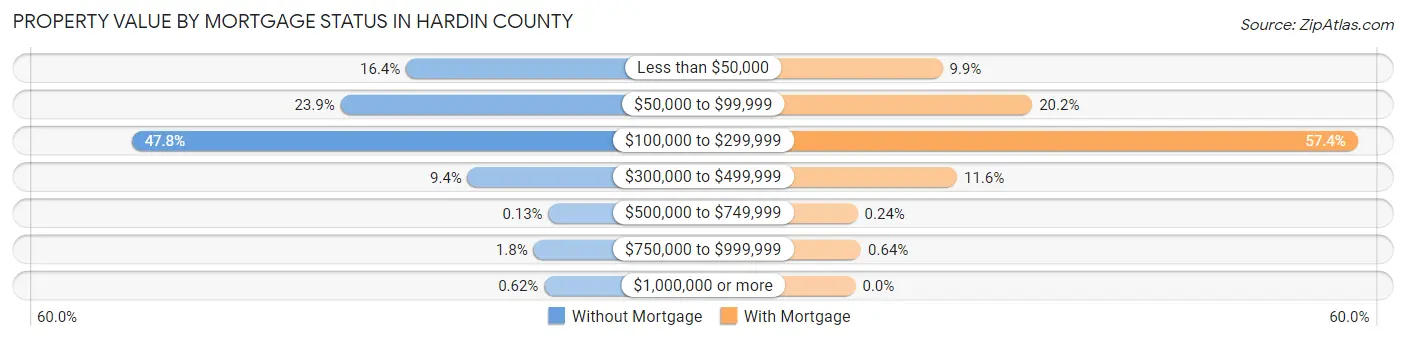
| Property Value | Without Mortgage | With Mortgage |
| Less than $50,000 | 741 (16.4%) | 370 (9.9%) |
| $50,000 to $99,999 | 1,080 (23.9%) | 752 (20.2%) |
| $100,000 to $299,999 | 2,158 (47.7%) | 2,137 (57.4%) |
| $300,000 to $499,999 | 423 (9.4%) | 432 (11.6%) |
| $500,000 to $749,999 | 6 (0.1%) | 9 (0.2%) |
| $750,000 to $999,999 | 83 (1.8%) | 24 (0.6%) |
| $1,000,000 or more | 28 (0.6%) | 0 (0.0%) |
| Total | 4,519 (100.0%) | 3,724 (100.0%) |
Household Income by Mortgage Status in Hardin County

| Household Income | Without Mortgage | With Mortgage |
| Less than $10,000 | 373 (8.3%) | 44 (1.2%) |
| $10,000 to $24,999 | 818 (18.1%) | 152 (4.1%) |
| $25,000 to $34,999 | 602 (13.3%) | 363 (9.8%) |
| $35,000 to $49,999 | 680 (15.0%) | 143 (3.8%) |
| $50,000 to $74,999 | 877 (19.4%) | 729 (19.6%) |
| $75,000 to $99,999 | 400 (8.8%) | 868 (23.3%) |
| $100,000 to $149,999 | 486 (10.7%) | 666 (17.9%) |
| $150,000 or more | 283 (6.3%) | 577 (15.5%) |
| Total | 4,519 (100.0%) | 3,724 (100.0%) |
Property Value to Household Income Ratio in Hardin County
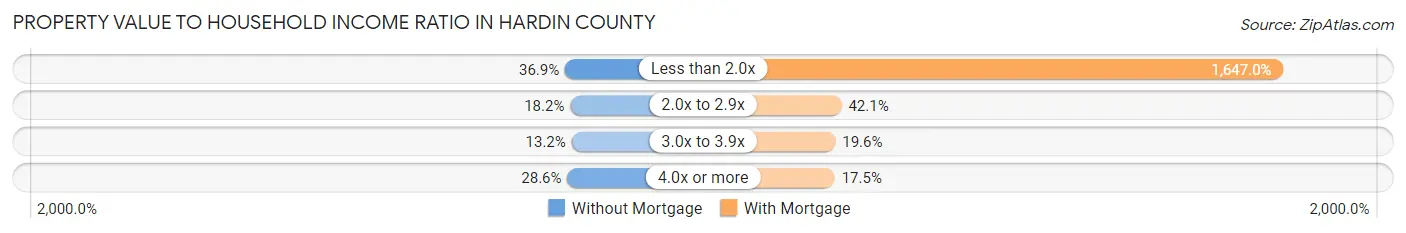
| Value-to-Income Ratio | Without Mortgage | With Mortgage |
| Less than 2.0x | 1,668 (36.9%) | 61,333 (1,647.0%) |
| 2.0x to 2.9x | 824 (18.2%) | 1,566 (42.0%) |
| 3.0x to 3.9x | 595 (13.2%) | 730 (19.6%) |
| 4.0x or more | 1,291 (28.6%) | 652 (17.5%) |
| Total | 4,519 (100.0%) | 3,724 (100.0%) |
Real Estate Taxes by Mortgage Status in Hardin County
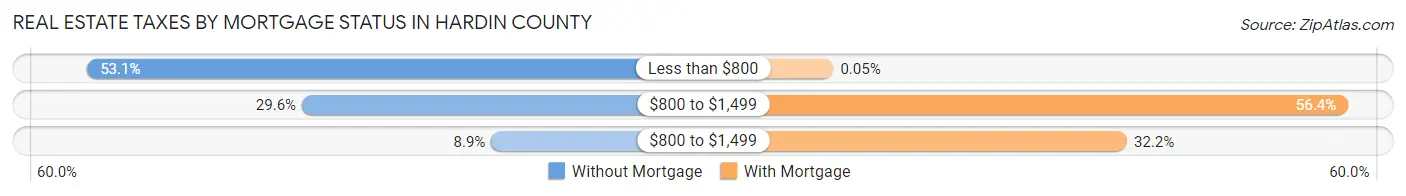
| Property Taxes | Without Mortgage | With Mortgage |
| Less than $800 | 2,401 (53.1%) | 2 (0.1%) |
| $800 to $1,499 | 1,338 (29.6%) | 2,102 (56.4%) |
| $800 to $1,499 | 401 (8.9%) | 1,200 (32.2%) |
| Total | 4,519 (100.0%) | 3,724 (100.0%) |
Health & Disability in Hardin County
Health Insurance Coverage by Age in Hardin County
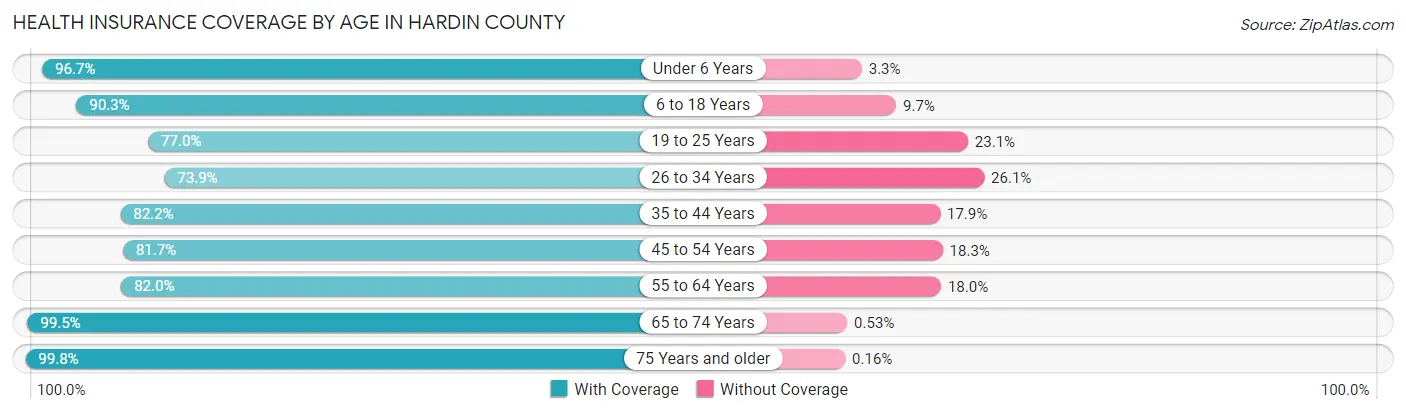
| Age Bracket | With Coverage | Without Coverage |
| Under 6 Years | 1,514 (96.7%) | 51 (3.3%) |
| 6 to 18 Years | 3,637 (90.3%) | 389 (9.7%) |
| 19 to 25 Years | 1,676 (76.9%) | 502 (23.1%) |
| 26 to 34 Years | 1,851 (73.9%) | 653 (26.1%) |
| 35 to 44 Years | 2,351 (82.2%) | 511 (17.8%) |
| 45 to 54 Years | 2,751 (81.7%) | 618 (18.3%) |
| 55 to 64 Years | 3,310 (82.0%) | 728 (18.0%) |
| 65 to 74 Years | 3,353 (99.5%) | 18 (0.5%) |
| 75 Years and older | 2,447 (99.8%) | 4 (0.2%) |
| Total | 22,890 (86.8%) | 3,474 (13.2%) |
Health Insurance Coverage by Citizenship Status in Hardin County
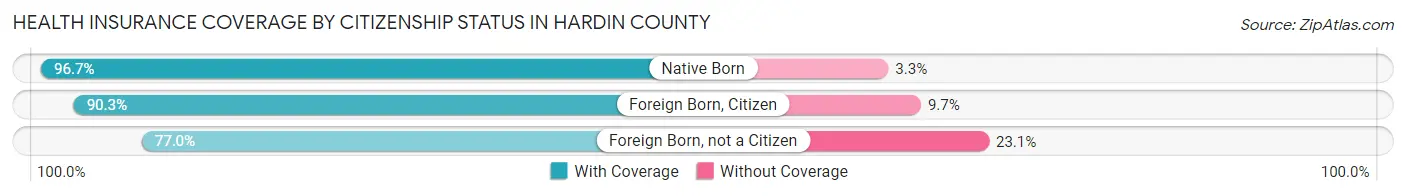
| Citizenship Status | With Coverage | Without Coverage |
| Native Born | 1,514 (96.7%) | 51 (3.3%) |
| Foreign Born, Citizen | 3,637 (90.3%) | 389 (9.7%) |
| Foreign Born, not a Citizen | 1,676 (76.9%) | 502 (23.1%) |
Health Insurance Coverage by Household Income in Hardin County
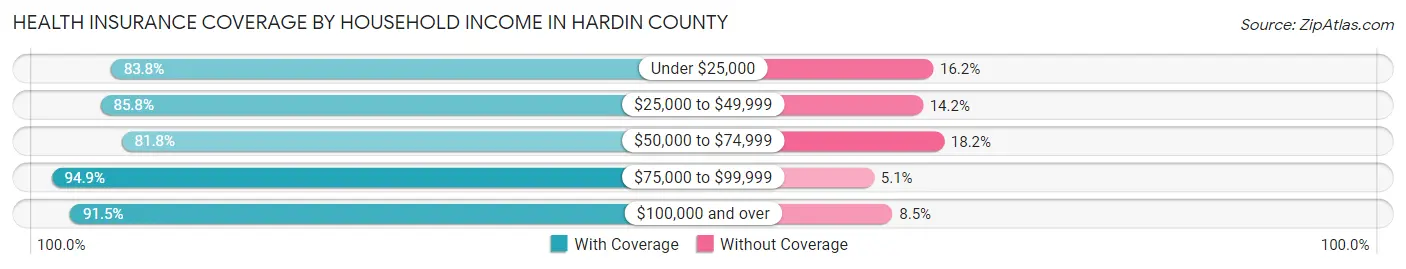
| Household Income | With Coverage | Without Coverage |
| Under $25,000 | 3,959 (83.8%) | 763 (16.2%) |
| $25,000 to $49,999 | 6,119 (85.8%) | 1,015 (14.2%) |
| $50,000 to $74,999 | 4,599 (81.8%) | 1,022 (18.2%) |
| $75,000 to $99,999 | 3,573 (94.9%) | 191 (5.1%) |
| $100,000 and over | 4,624 (91.5%) | 432 (8.5%) |
Public vs Private Health Insurance Coverage by Age in Hardin County
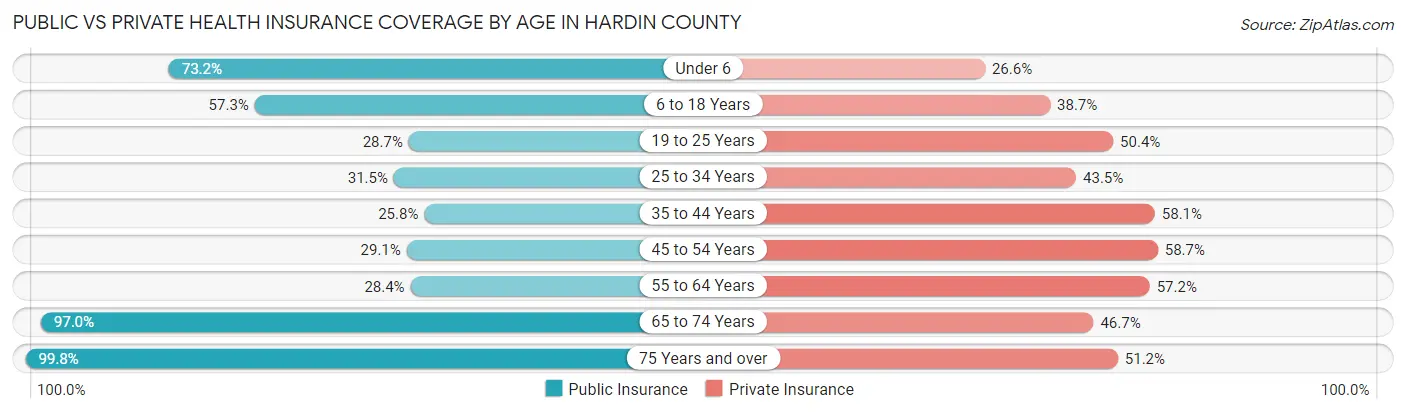
| Age Bracket | Public Insurance | Private Insurance |
| Under 6 | 1,146 (73.2%) | 416 (26.6%) |
| 6 to 18 Years | 2,307 (57.3%) | 1,557 (38.7%) |
| 19 to 25 Years | 625 (28.7%) | 1,097 (50.4%) |
| 25 to 34 Years | 788 (31.5%) | 1,089 (43.5%) |
| 35 to 44 Years | 739 (25.8%) | 1,663 (58.1%) |
| 45 to 54 Years | 980 (29.1%) | 1,976 (58.7%) |
| 55 to 64 Years | 1,146 (28.4%) | 2,308 (57.2%) |
| 65 to 74 Years | 3,269 (97.0%) | 1,575 (46.7%) |
| 75 Years and over | 2,447 (99.8%) | 1,256 (51.2%) |
| Total | 13,447 (51.0%) | 12,937 (49.1%) |
Disability Status by Sex by Age in Hardin County
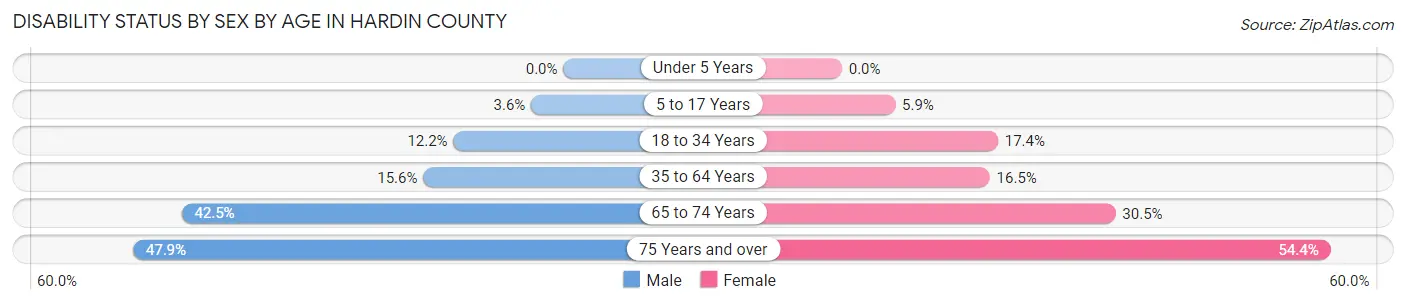
| Age Bracket | Male | Female |
| Under 5 Years | 0 (0.0%) | 0 (0.0%) |
| 5 to 17 Years | 72 (3.6%) | 125 (5.9%) |
| 18 to 34 Years | 293 (12.2%) | 435 (17.4%) |
| 35 to 64 Years | 776 (15.6%) | 872 (16.5%) |
| 65 to 74 Years | 677 (42.5%) | 542 (30.5%) |
| 75 Years and over | 489 (47.9%) | 779 (54.4%) |
Disability Class by Sex by Age in Hardin County
Disability Class: Hearing Difficulty
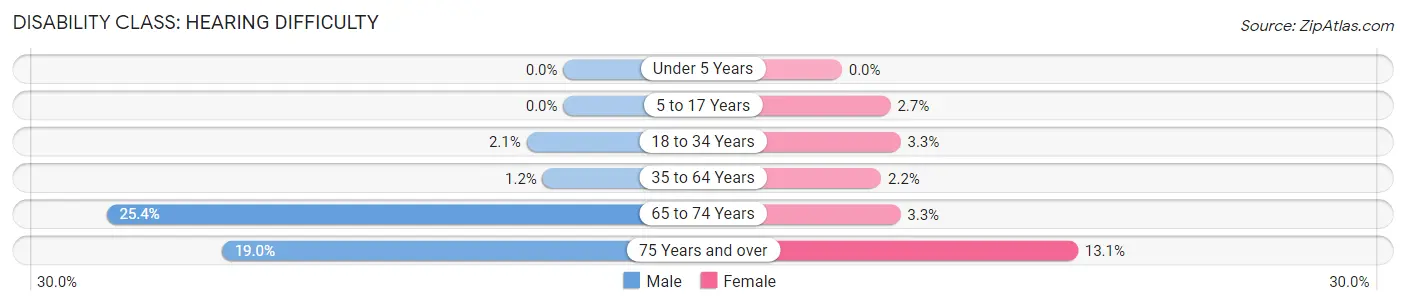
| Age Bracket | Male | Female |
| Under 5 Years | 0 (0.0%) | 0 (0.0%) |
| 5 to 17 Years | 0 (0.0%) | 57 (2.7%) |
| 18 to 34 Years | 49 (2.1%) | 82 (3.3%) |
| 35 to 64 Years | 57 (1.1%) | 116 (2.2%) |
| 65 to 74 Years | 405 (25.4%) | 58 (3.3%) |
| 75 Years and over | 194 (19.0%) | 188 (13.1%) |
Disability Class: Vision Difficulty
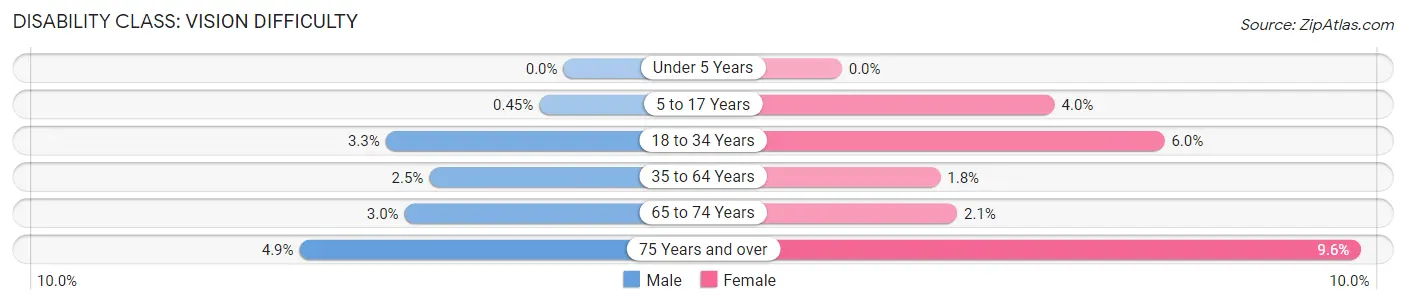
| Age Bracket | Male | Female |
| Under 5 Years | 0 (0.0%) | 0 (0.0%) |
| 5 to 17 Years | 9 (0.4%) | 83 (4.0%) |
| 18 to 34 Years | 79 (3.3%) | 150 (6.0%) |
| 35 to 64 Years | 124 (2.5%) | 97 (1.8%) |
| 65 to 74 Years | 47 (2.9%) | 38 (2.1%) |
| 75 Years and over | 50 (4.9%) | 138 (9.6%) |
Disability Class: Cognitive Difficulty
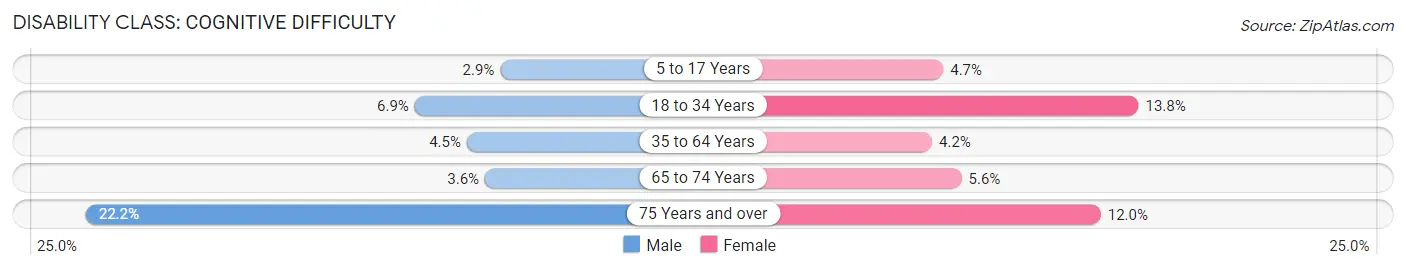
| Age Bracket | Male | Female |
| 5 to 17 Years | 59 (2.9%) | 99 (4.7%) |
| 18 to 34 Years | 165 (6.9%) | 345 (13.8%) |
| 35 to 64 Years | 223 (4.5%) | 222 (4.2%) |
| 65 to 74 Years | 58 (3.6%) | 99 (5.6%) |
| 75 Years and over | 226 (22.2%) | 172 (12.0%) |
Disability Class: Ambulatory Difficulty
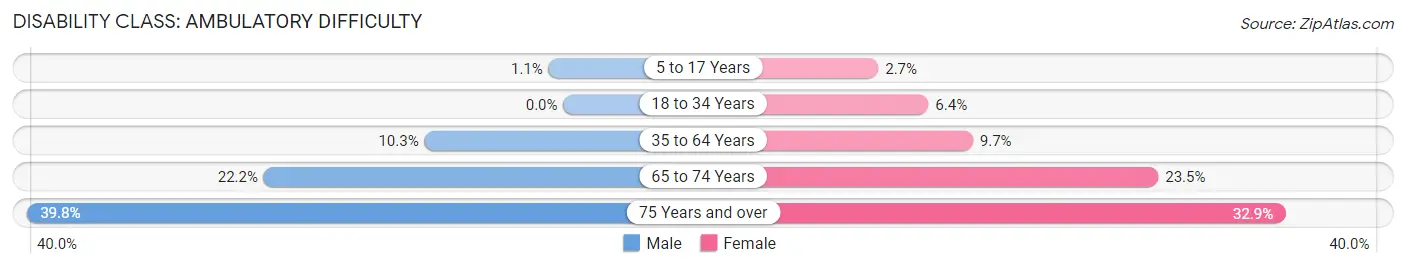
| Age Bracket | Male | Female |
| 5 to 17 Years | 22 (1.1%) | 57 (2.7%) |
| 18 to 34 Years | 0 (0.0%) | 161 (6.4%) |
| 35 to 64 Years | 513 (10.3%) | 515 (9.7%) |
| 65 to 74 Years | 354 (22.2%) | 418 (23.5%) |
| 75 Years and over | 406 (39.8%) | 471 (32.9%) |
Disability Class: Self-Care Difficulty
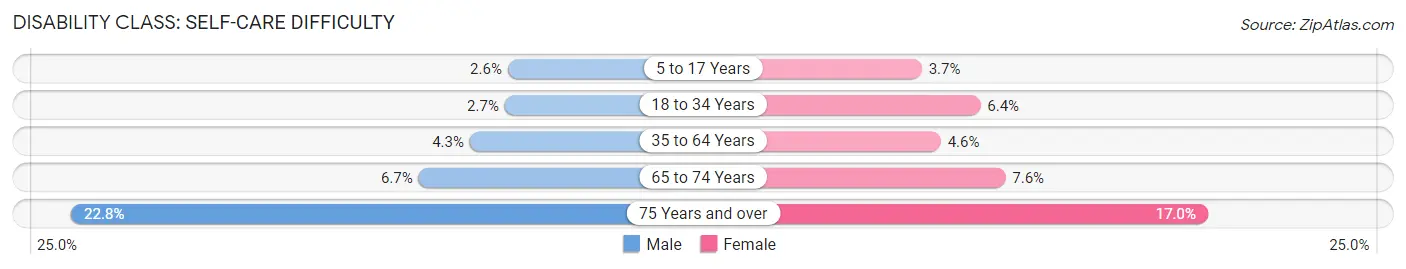
| Age Bracket | Male | Female |
| 5 to 17 Years | 52 (2.6%) | 78 (3.7%) |
| 18 to 34 Years | 65 (2.7%) | 161 (6.4%) |
| 35 to 64 Years | 216 (4.3%) | 243 (4.6%) |
| 65 to 74 Years | 107 (6.7%) | 135 (7.6%) |
| 75 Years and over | 233 (22.8%) | 243 (17.0%) |
Technology Access in Hardin County
Computing Device Access in Hardin County
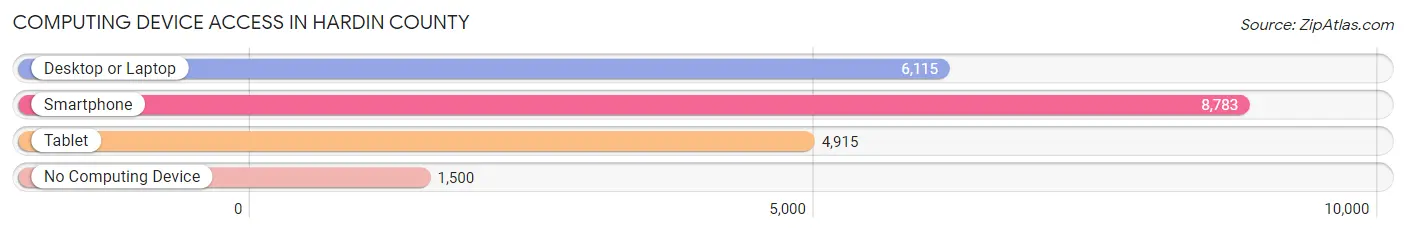
| Device Type | # Households | % Households |
| Desktop or Laptop | 6,115 | 56.1% |
| Smartphone | 8,783 | 80.6% |
| Tablet | 4,915 | 45.1% |
| No Computing Device | 1,500 | 13.8% |
| Total | 10,903 | 100.0% |
Internet Access in Hardin County
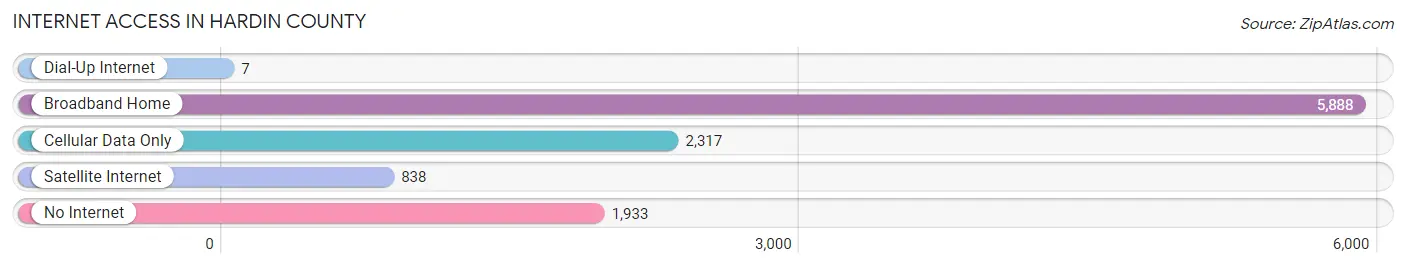
| Internet Type | # Households | % Households |
| Dial-Up Internet | 7 | 0.1% |
| Broadband Home | 5,888 | 54.0% |
| Cellular Data Only | 2,317 | 21.2% |
| Satellite Internet | 838 | 7.7% |
| No Internet | 1,933 | 17.7% |
| Total | 10,903 | 100.0% |
Hardin County Summary
Hardin County is located in the western part of Tennessee, in the United States. It is bordered by the states of Kentucky and Mississippi, and is part of the Jackson Metropolitan Statistical Area. The county seat is Savannah, and the population was estimated to be 27,845 in 2019.
History
Hardin County was established in 1819 from parts of McNairy and Wayne counties. It was named for Colonel Joseph Hardin, a Revolutionary War veteran and early settler of the area. The county was originally part of the Chickasaw Nation, and the first settlers were mostly Scots-Irish immigrants.
The county was largely agricultural in the 19th century, with cotton and tobacco being the main crops. The county also had a thriving timber industry, and the town of Savannah was an important port on the Tennessee River.
In the 20th century, the county's economy shifted to manufacturing, with the opening of several factories. The county also became a popular tourist destination, with the opening of Pickwick Landing State Park in the 1950s.
Geography
Hardin County is located in the western part of Tennessee, and is bordered by the states of Kentucky and Mississippi. It is part of the Jackson Metropolitan Statistical Area. The county covers an area of 545 square miles, and is mostly rural.
The terrain is mostly flat, with some rolling hills in the northern part of the county. The Tennessee River forms the western border of the county, and the Pickwick Lake is located in the northern part.
The climate is humid subtropical, with hot summers and mild winters. The average annual temperature is around 64°F, and the average annual precipitation is around 48 inches.
Economy
The economy of Hardin County is largely based on manufacturing and tourism. The county is home to several factories, including a paper mill, a furniture factory, and a plastics plant.
The county is also a popular tourist destination, with Pickwick Landing State Park being the main attraction. The park offers camping, fishing, boating, and other outdoor activities.
Demographics
As of the 2019 census, the population of Hardin County was estimated to be 27,845. The population is mostly white (90.3%), with small percentages of African American (7.2%), Hispanic (1.2%), and Asian (0.7%) residents.
The median household income is $41,845, and the median home value is $117,400. The poverty rate is 17.3%, and the unemployment rate is 4.2%.
Conclusion
Hardin County is located in the western part of Tennessee, and is part of the Jackson Metropolitan Statistical Area. The county was established in 1819, and was named for Colonel Joseph Hardin. The economy of Hardin County is largely based on manufacturing and tourism, and the county is a popular tourist destination. The population of Hardin County is mostly white, with a median household income of $41,845 and a median home value of $117,400.
Common Questions
What is the Total Population of Hardin County?
Total Population of Hardin County is 26,824.
What is the Total Male Population of Hardin County?
Total Male Population of Hardin County is 12,878.
What is the Total Female Population of Hardin County?
Total Female Population of Hardin County is 13,946.
What is the Ratio of Males per 100 Females in Hardin County?
There are 92.34 Males per 100 Females in Hardin County.
What is the Ratio of Females per 100 Males in Hardin County?
There are 108.29 Females per 100 Males in Hardin County.
What is the Median Population Age in Hardin County?
Median Population Age in Hardin County is 45.5 Years.
What is the Average Family Size in Hardin County
Average Family Size in Hardin County is 2.9 People.
What is the Average Household Size in Hardin County
Average Household Size in Hardin County is 2.4 People.
What is Per Capita Income in Hardin County?
Per Capita income in Hardin County is $26,068.
What is the Median Family Income in Hardin County?
Median Family Income in Hardin County is $52,664.
What is the Median Household income in Hardin County?
Median Household Income in Hardin County is $46,902.
What is Income or Wage Gap in Hardin County?
Income or Wage Gap in Hardin County is 32.8%.
Women in Hardin County earn 67.2 cents for every dollar earned by a man.
What is Family Income Deficit in Hardin County?
Family Income Deficit in Hardin County is $8,381.
Families that are below poverty line in Hardin County earn $8,381 less on average than the poverty threshold level.
What is Inequality or Gini Index in Hardin County?
Inequality or Gini Index in Hardin County is 0.45.
How Large is the Labor Force in Hardin County?
There are 11,007 People in the Labor Forcein in Hardin County.
What is the Percentage of People in the Labor Force in Hardin County?
49.8% of People are in the Labor Force in Hardin County.
What is the Unemployment Rate in Hardin County?
Unemployment Rate in Hardin County is 3.3%.