Hancock County, TN
Hancock County Map
Hancock County Overview
6,726
TOTAL POPULATION
3,312
MALE POPULATION
3,414
FEMALE POPULATION
97.01
MALES / 100 FEMALES
103.08
FEMALES / 100 MALES
44.9
MEDIAN AGE
3.0
AVG FAMILY SIZE
2.3
AVG HOUSEHOLD SIZE
$24,120
PER CAPITA INCOME
$45,753
AVG FAMILY INCOME
$31,809
AVG HOUSEHOLD INCOME
33.7%
WAGE / INCOME GAP [ % ]
66.3¢/ $1
WAGE / INCOME GAP [ $ ]
$10,216
FAMILY INCOME DEFICIT
0.54
INEQUALITY / GINI INDEX
2,427
LABOR FORCE [ PEOPLE ]
44.8%
PERCENT IN LABOR FORCE
10.1%
UNEMPLOYMENT RATE
Hancock County Area Codes
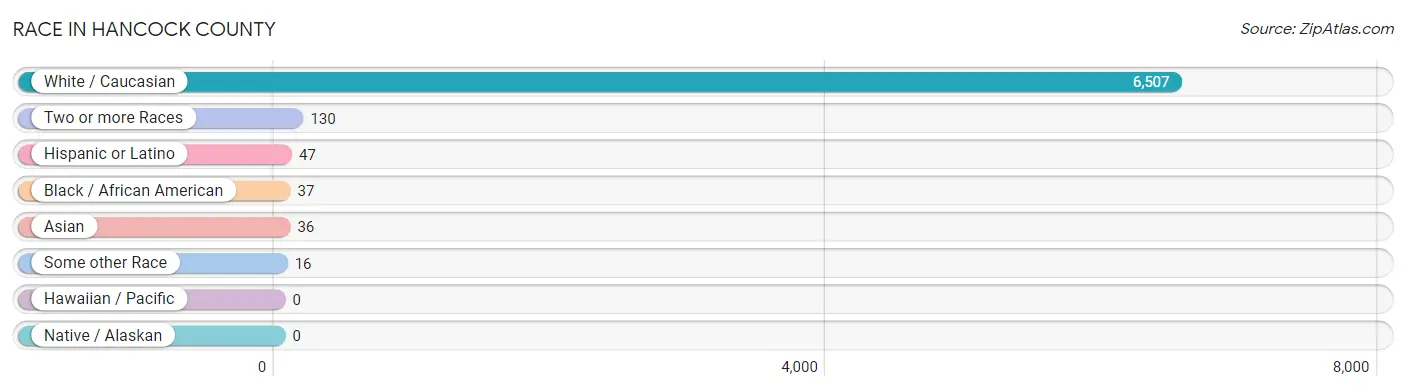
Race in Hancock County
The most populous races in Hancock County are White / Caucasian (6,507 | 96.7%), Two or more Races (130 | 1.9%), and Hispanic or Latino (47 | 0.7%).
| Race | # Population | % Population |
| Asian | 36 | 0.5% |
| Black / African American | 37 | 0.5% |
| Hawaiian / Pacific | 0 | 0.0% |
| Hispanic or Latino | 47 | 0.7% |
| Native / Alaskan | 0 | 0.0% |
| White / Caucasian | 6,507 | 96.7% |
| Two or more Races | 130 | 1.9% |
| Some other Race | 16 | 0.2% |
| Total | 6,726 | 100.0% |
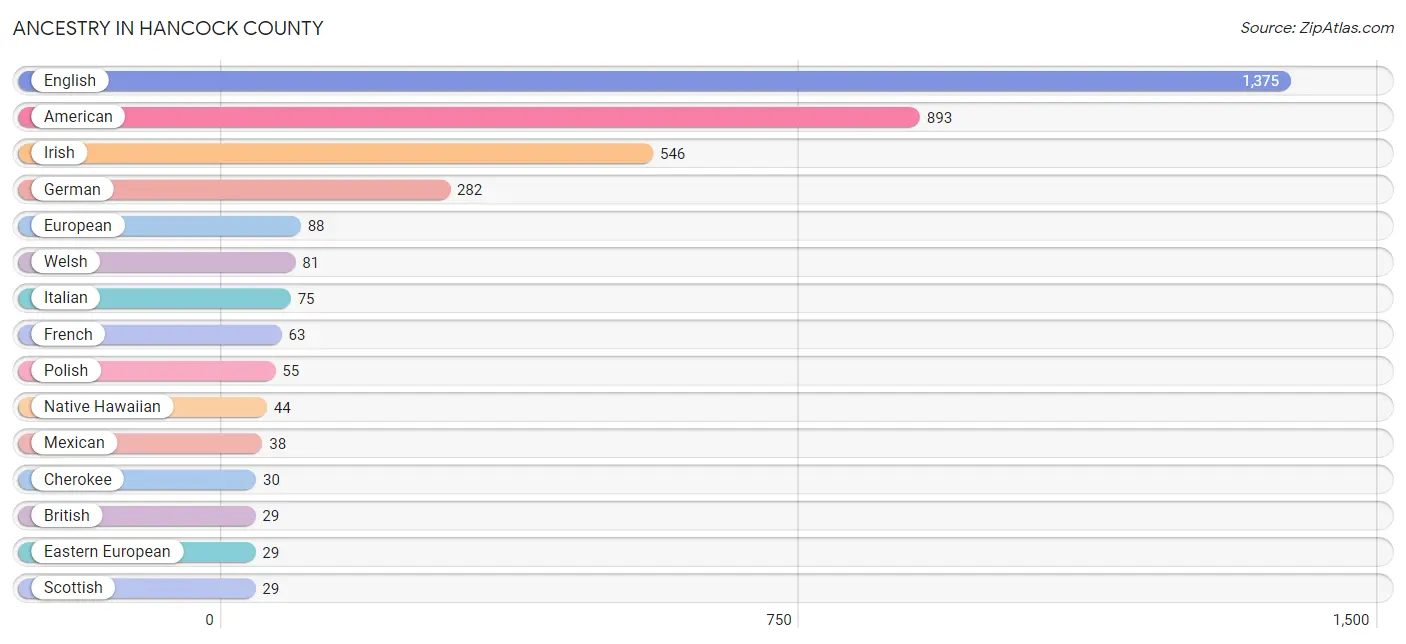
Ancestry in Hancock County
The most populous ancestries reported in Hancock County are English (1,375 | 20.4%), American (893 | 13.3%), Irish (546 | 8.1%), German (282 | 4.2%), and European (88 | 1.3%), together accounting for 47.3% of all Hancock County residents.
| Ancestry | # Population | % Population |
| American | 893 | 13.3% |
| British | 29 | 0.4% |
| Cherokee | 30 | 0.4% |
| Czech | 6 | 0.1% |
| Dutch | 10 | 0.2% |
| Eastern European | 29 | 0.4% |
| English | 1,375 | 20.4% |
| European | 88 | 1.3% |
| French | 63 | 0.9% |
| French Canadian | 21 | 0.3% |
| German | 282 | 4.2% |
| Hungarian | 17 | 0.3% |
| Irish | 546 | 8.1% |
| Italian | 75 | 1.1% |
| Mexican | 38 | 0.6% |
| Native Hawaiian | 44 | 0.6% |
| Navajo | 10 | 0.2% |
| Norwegian | 8 | 0.1% |
| Polish | 55 | 0.8% |
| Scotch-Irish | 21 | 0.3% |
| Scottish | 29 | 0.4% |
| Sri Lankan | 11 | 0.2% |
| Swedish | 27 | 0.4% |
| Thai | 25 | 0.4% |
| Welsh | 81 | 1.2% | View All 25 Rows |
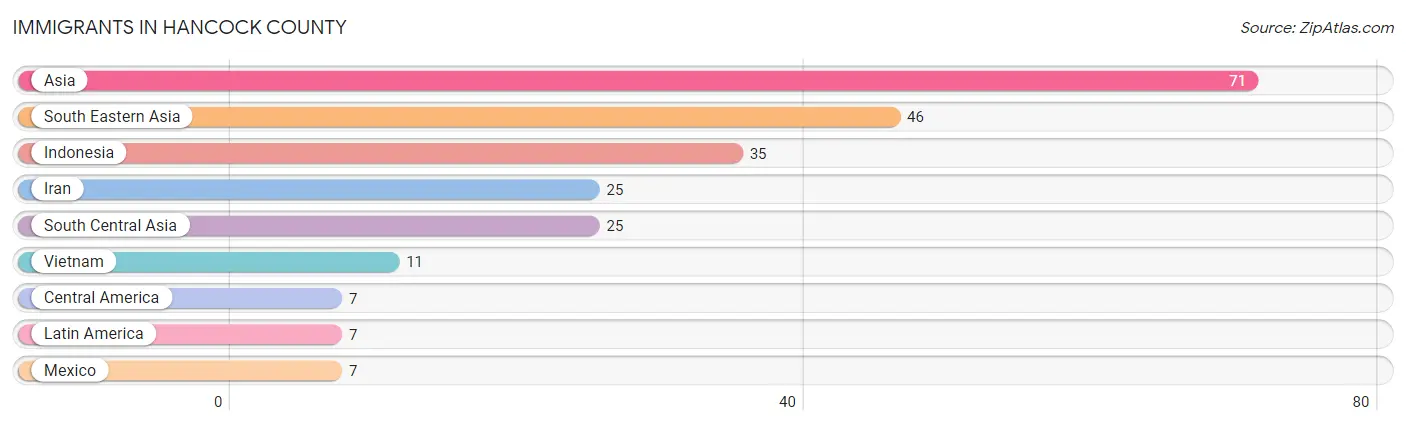
Immigrants in Hancock County
The most numerous immigrant groups reported in Hancock County came from Asia (71 | 1.1%), South Eastern Asia (46 | 0.7%), Indonesia (35 | 0.5%), Iran (25 | 0.4%), and South Central Asia (25 | 0.4%), together accounting for 3.0% of all Hancock County residents.
| Immigration Origin | # Population | % Population |
| Asia | 71 | 1.1% |
| Central America | 7 | 0.1% |
| Indonesia | 35 | 0.5% |
| Iran | 25 | 0.4% |
| Latin America | 7 | 0.1% |
| Mexico | 7 | 0.1% |
| South Central Asia | 25 | 0.4% |
| South Eastern Asia | 46 | 0.7% |
| Vietnam | 11 | 0.2% | View All 9 Rows |
Sex and Age in Hancock County
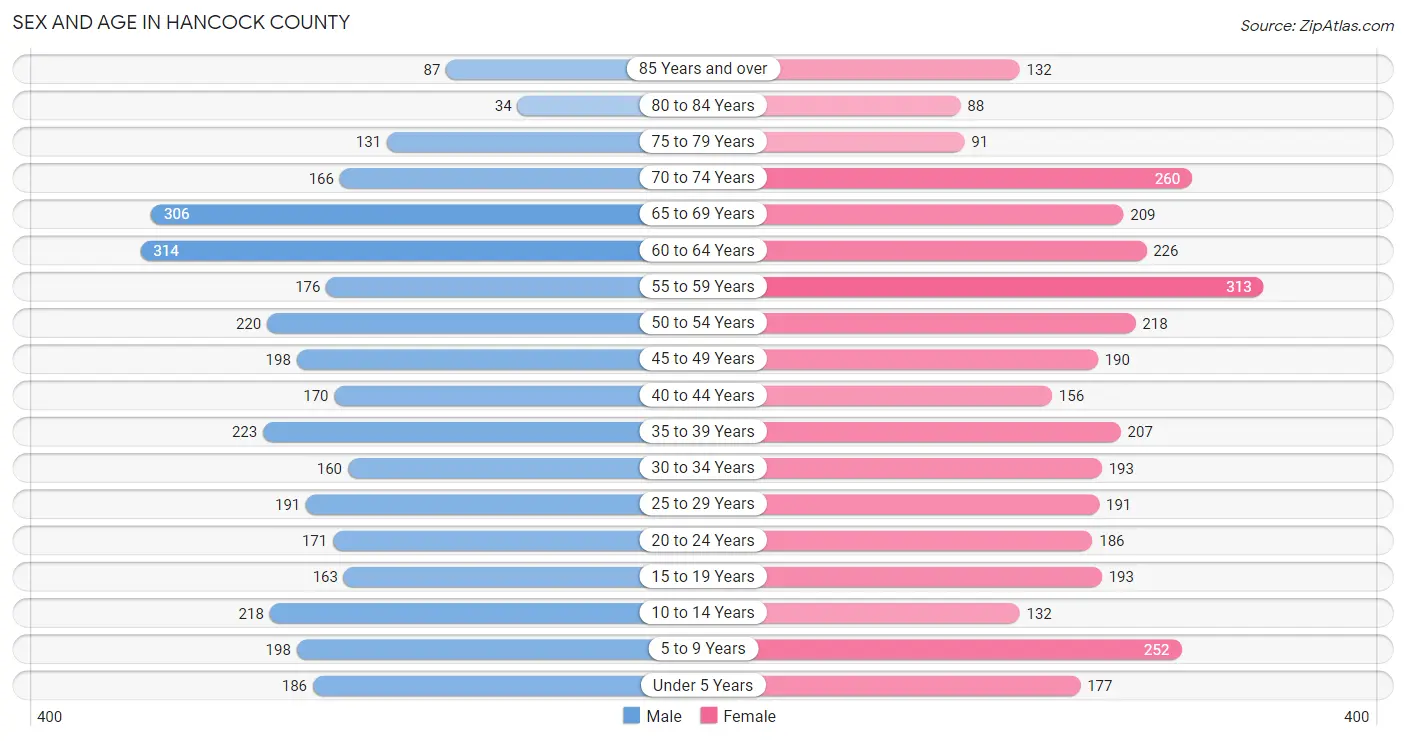
Sex and Age in Hancock County
The most populous age groups in Hancock County are 60 to 64 Years (314 | 9.5%) for men and 55 to 59 Years (313 | 9.2%) for women.
| Age Bracket | Male | Female |
| Under 5 Years | 186 (5.6%) | 177 (5.2%) |
| 5 to 9 Years | 198 (6.0%) | 252 (7.4%) |
| 10 to 14 Years | 218 (6.6%) | 132 (3.9%) |
| 15 to 19 Years | 163 (4.9%) | 193 (5.7%) |
| 20 to 24 Years | 171 (5.2%) | 186 (5.4%) |
| 25 to 29 Years | 191 (5.8%) | 191 (5.6%) |
| 30 to 34 Years | 160 (4.8%) | 193 (5.7%) |
| 35 to 39 Years | 223 (6.7%) | 207 (6.1%) |
| 40 to 44 Years | 170 (5.1%) | 156 (4.6%) |
| 45 to 49 Years | 198 (6.0%) | 190 (5.6%) |
| 50 to 54 Years | 220 (6.6%) | 218 (6.4%) |
| 55 to 59 Years | 176 (5.3%) | 313 (9.2%) |
| 60 to 64 Years | 314 (9.5%) | 226 (6.6%) |
| 65 to 69 Years | 306 (9.2%) | 209 (6.1%) |
| 70 to 74 Years | 166 (5.0%) | 260 (7.6%) |
| 75 to 79 Years | 131 (4.0%) | 91 (2.7%) |
| 80 to 84 Years | 34 (1.0%) | 88 (2.6%) |
| 85 Years and over | 87 (2.6%) | 132 (3.9%) |
| Total | 3,312 (100.0%) | 3,414 (100.0%) |
Families and Households in Hancock County
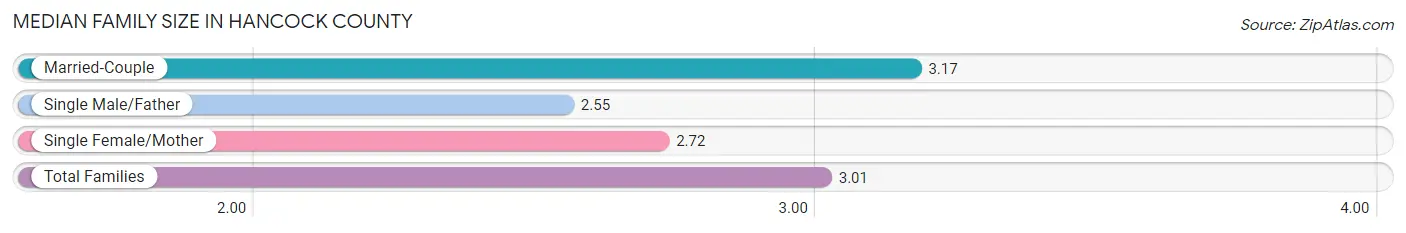
Median Family Size in Hancock County
The median family size in Hancock County is 3.01 persons per family, with married-couple families (1,177 | 69.5%) accounting for the largest median family size of 3.17 persons per family. On the other hand, single male/father families (195 | 11.5%) represent the smallest median family size with 2.55 persons per family.
| Family Type | # Families | Family Size |
| Married-Couple | 1,177 (69.5%) | 3.17 |
| Single Male/Father | 195 (11.5%) | 2.55 |
| Single Female/Mother | 321 (19.0%) | 2.72 |
| Total Families | 1,693 (100.0%) | 3.01 |
Median Household Size in Hancock County
The median household size in Hancock County is 2.32 persons per household, with married-couple households (1,177 | 41.6%) accounting for the largest median household size of 3.19 persons per household. non-family households (1,136 | 40.2%) represent the smallest median household size with 1.15 persons per household.

| Household Type | # Households | Household Size |
| Married-Couple | 1,177 (41.6%) | 3.19 |
| Single Male/Father | 195 (6.9%) | 3.17 |
| Single Female/Mother | 321 (11.4%) | 2.80 |
| Non-family | 1,136 (40.2%) | 1.15 |
| Total Households | 2,829 (100.0%) | 2.32 |
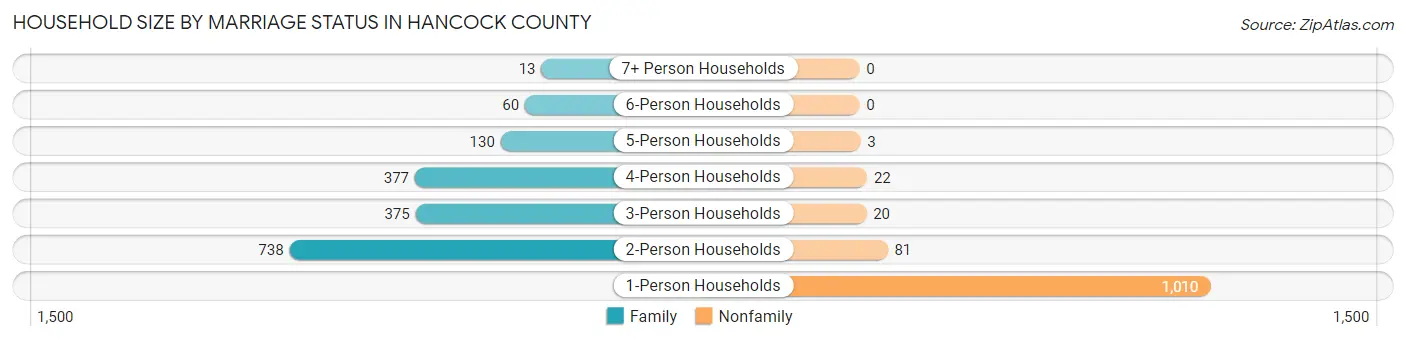
Household Size by Marriage Status in Hancock County
Out of a total of 2,829 households in Hancock County, 1,693 (59.8%) are family households, while 1,136 (40.2%) are nonfamily households. The most numerous type of family households are 2-person households, comprising 738, and the most common type of nonfamily households are 1-person households, comprising 1,010.
| Household Size | Family Households | Nonfamily Households |
| 1-Person Households | - | 1,010 (35.7%) |
| 2-Person Households | 738 (26.1%) | 81 (2.9%) |
| 3-Person Households | 375 (13.3%) | 20 (0.7%) |
| 4-Person Households | 377 (13.3%) | 22 (0.8%) |
| 5-Person Households | 130 (4.6%) | 3 (0.1%) |
| 6-Person Households | 60 (2.1%) | 0 (0.0%) |
| 7+ Person Households | 13 (0.5%) | 0 (0.0%) |
| Total | 1,693 (59.8%) | 1,136 (40.2%) |
Female Fertility in Hancock County
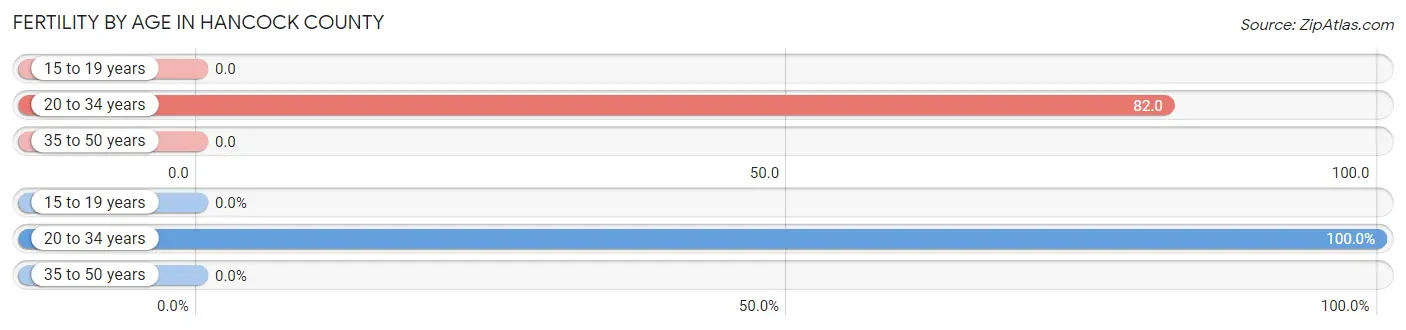
Fertility by Age in Hancock County
Average fertility rate in Hancock County is 35.0 births per 1,000 women. Women in the age bracket of 20 to 34 years have the highest fertility rate with 82.0 births per 1,000 women. Women in the age bracket of 20 to 34 years acount for 100.0% of all women with births.
| Age Bracket | Women with Births | Births / 1,000 Women |
| 15 to 19 years | 0 (0.0%) | 0.0 |
| 20 to 34 years | 47 (100.0%) | 82.0 |
| 35 to 50 years | 0 (0.0%) | 0.0 |
| Total | 47 (100.0%) | 35.0 |
Fertility by Age by Marriage Status in Hancock County
51.1% of women with births (47) in Hancock County are married. The highest percentage of unmarried women with births falls into 20 to 34 years age bracket with 48.9% of them unmarried at the time of birth, while the lowest percentage of unmarried women with births belong to 20 to 34 years age bracket with 48.9% of them unmarried.
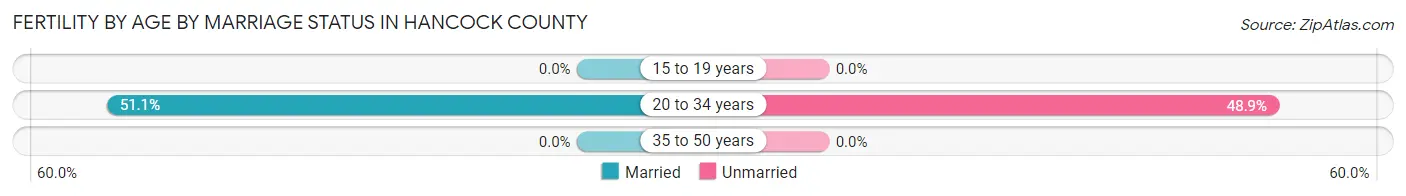
| Age Bracket | Married | Unmarried |
| 15 to 19 years | 0 (0.0%) | 0 (0.0%) |
| 20 to 34 years | 24 (51.1%) | 23 (48.9%) |
| 35 to 50 years | 0 (0.0%) | 0 (0.0%) |
| Total | 24 (51.1%) | 23 (48.9%) |
Fertility by Education in Hancock County
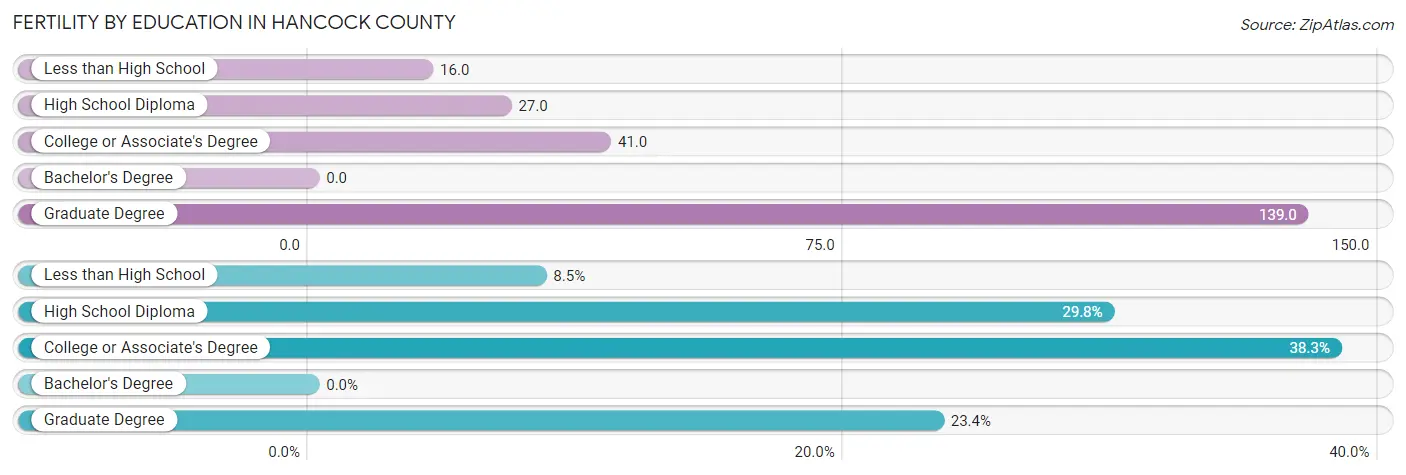
| Educational Attainment | Women with Births | Births / 1,000 Women |
| Less than High School | 4 (8.5%) | 16.0 |
| High School Diploma | 14 (29.8%) | 27.0 |
| College or Associate's Degree | 18 (38.3%) | 41.0 |
| Bachelor's Degree | 0 (0.0%) | 0.0 |
| Graduate Degree | 11 (23.4%) | 139.0 |
| Total | 47 (100.0%) | 35.0 |
Fertility by Education by Marriage Status in Hancock County
48.9% of women with births in Hancock County are unmarried. Women with the educational attainment of college or associate's degree are most likely to be married with 100.0% of them married at childbirth, while women with the educational attainment of less than high school are least likely to be married with 100.0% of them unmarried at childbirth.
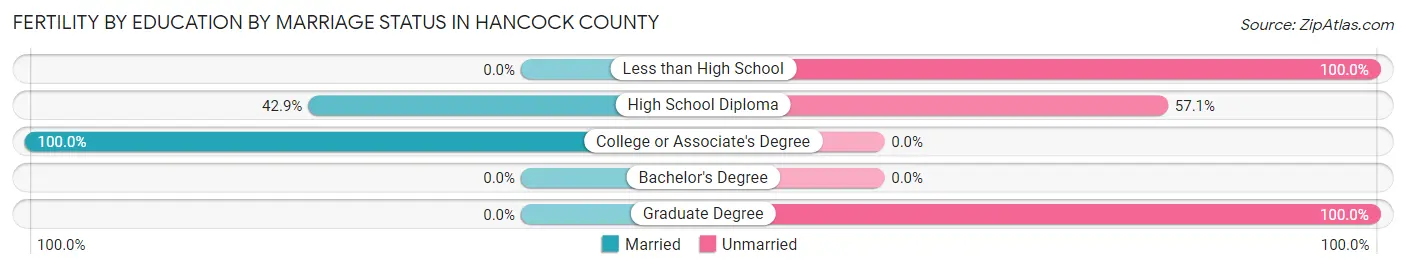
| Educational Attainment | Married | Unmarried |
| Less than High School | 0 (0.0%) | 4 (100.0%) |
| High School Diploma | 6 (42.9%) | 8 (57.1%) |
| College or Associate's Degree | 18 (100.0%) | 0 (0.0%) |
| Bachelor's Degree | 0 (0.0%) | 0 (0.0%) |
| Graduate Degree | 0 (0.0%) | 11 (100.0%) |
| Total | 24 (51.1%) | 23 (48.9%) |
Income in Hancock County
Income Overview in Hancock County
Per Capita Income in Hancock County is $24,120, while median incomes of families and households are $45,753 and $31,809 respectively.
| Characteristic | Number | Measure |
| Per Capita Income | 6,726 | $24,120 |
| Median Family Income | 1,693 | $45,753 |
| Mean Family Income | 1,693 | $71,733 |
| Median Household Income | 2,829 | $31,809 |
| Mean Household Income | 2,829 | $54,601 |
| Income Deficit | 1,693 | $10,216 |
| Wage / Income Gap (%) | 6,726 | 33.75% |
| Wage / Income Gap ($) | 6,726 | 66.25¢ per $1 |
| Gini / Inequality Index | 6,726 | 0.54 |
Earnings by Sex in Hancock County
Average Earnings in Hancock County are $25,625, $33,911 for men and $22,467 for women, a difference of 33.8%.
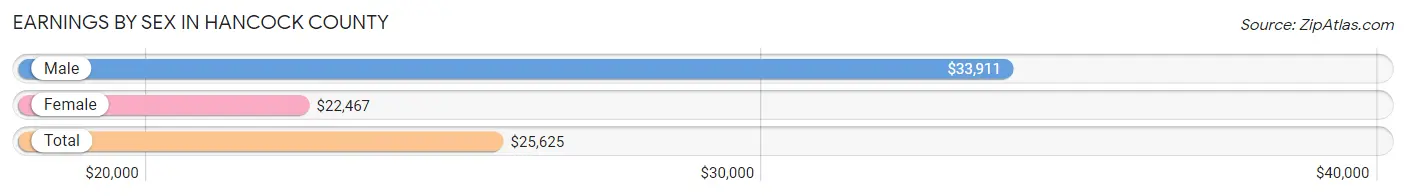
| Sex | Number | Average Earnings |
| Male | 1,267 (50.3%) | $33,911 |
| Female | 1,251 (49.7%) | $22,467 |
| Total | 2,518 (100.0%) | $25,625 |
Earnings by Sex by Income Bracket in Hancock County
The most common earnings brackets in Hancock County are $55,000 to $64,999 for men (146 | 11.5%) and $10,000 to $12,499 for women (153 | 12.2%).
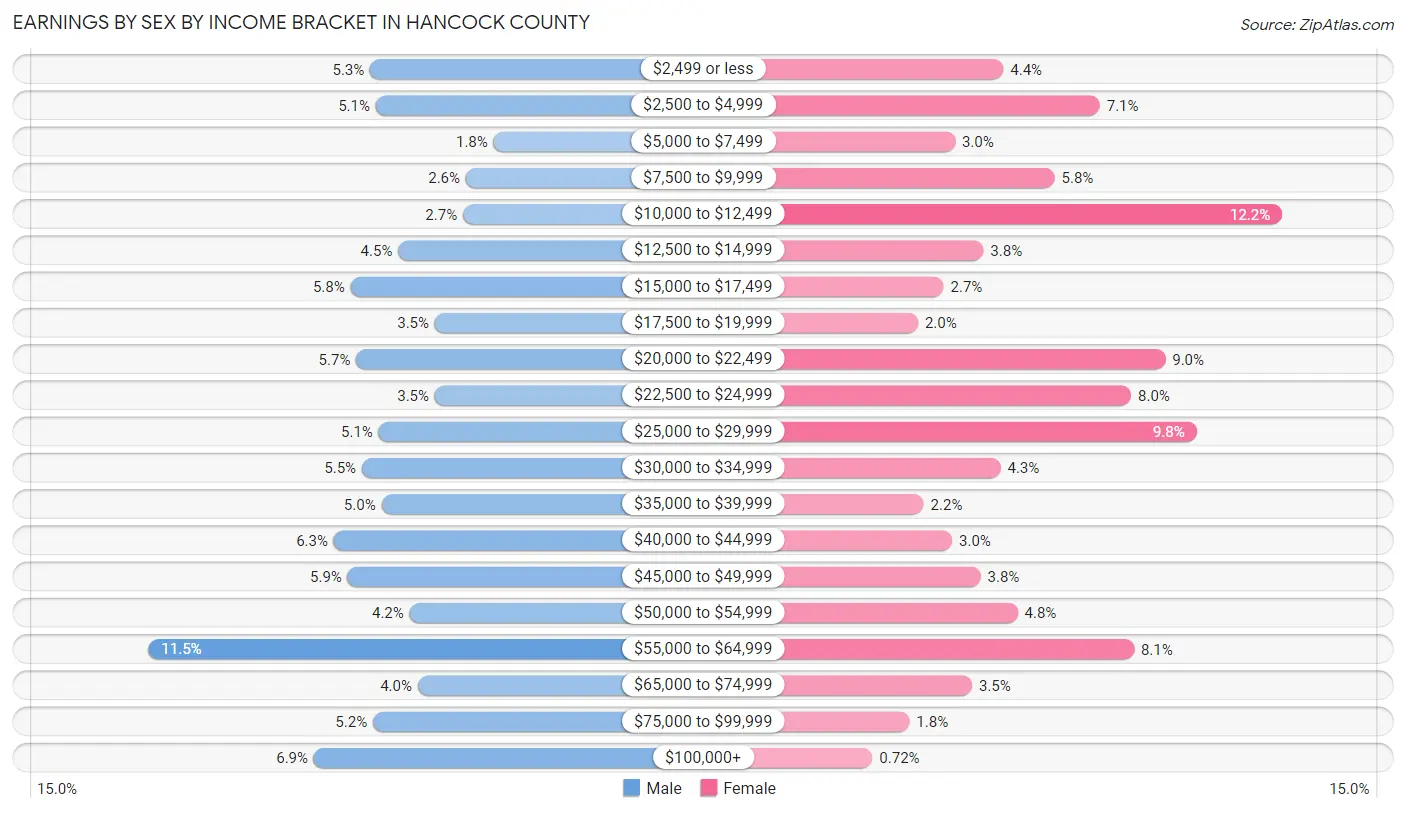
| Income | Male | Female |
| $2,499 or less | 67 (5.3%) | 55 (4.4%) |
| $2,500 to $4,999 | 65 (5.1%) | 89 (7.1%) |
| $5,000 to $7,499 | 23 (1.8%) | 38 (3.0%) |
| $7,500 to $9,999 | 33 (2.6%) | 73 (5.8%) |
| $10,000 to $12,499 | 34 (2.7%) | 153 (12.2%) |
| $12,500 to $14,999 | 57 (4.5%) | 48 (3.8%) |
| $15,000 to $17,499 | 74 (5.8%) | 34 (2.7%) |
| $17,500 to $19,999 | 44 (3.5%) | 25 (2.0%) |
| $20,000 to $22,499 | 72 (5.7%) | 112 (8.9%) |
| $22,500 to $24,999 | 44 (3.5%) | 100 (8.0%) |
| $25,000 to $29,999 | 64 (5.1%) | 123 (9.8%) |
| $30,000 to $34,999 | 70 (5.5%) | 54 (4.3%) |
| $35,000 to $39,999 | 63 (5.0%) | 27 (2.2%) |
| $40,000 to $44,999 | 80 (6.3%) | 37 (3.0%) |
| $45,000 to $49,999 | 75 (5.9%) | 47 (3.8%) |
| $50,000 to $54,999 | 53 (4.2%) | 60 (4.8%) |
| $55,000 to $64,999 | 146 (11.5%) | 101 (8.1%) |
| $65,000 to $74,999 | 50 (4.0%) | 44 (3.5%) |
| $75,000 to $99,999 | 66 (5.2%) | 22 (1.8%) |
| $100,000+ | 87 (6.9%) | 9 (0.7%) |
| Total | 1,267 (100.0%) | 1,251 (100.0%) |
Earnings by Sex by Educational Attainment in Hancock County
Average earnings in Hancock County are $36,389 for men and $22,806 for women, a difference of 37.3%. Men with an educational attainment of bachelor's degree enjoy the highest average annual earnings of $49,688, while those with less than high school education earn the least with $16,205. Women with an educational attainment of graduate degree earn the most with the average annual earnings of $57,045, while those with high school diploma education have the smallest earnings of $18,500.
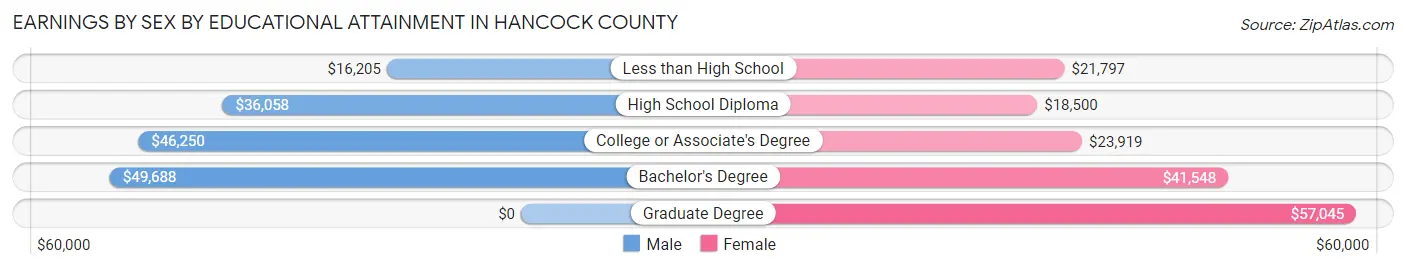
| Educational Attainment | Male Income | Female Income |
| Less than High School | $16,205 | $21,797 |
| High School Diploma | $36,058 | $18,500 |
| College or Associate's Degree | $46,250 | $23,919 |
| Bachelor's Degree | $49,688 | $41,548 |
| Graduate Degree | - | - |
| Total | $36,389 | $22,806 |
Family Income in Hancock County
Family Income Brackets in Hancock County
According to the Hancock County family income data, there are 278 families falling into the $50,000 to $74,999 income range, which is the most common income bracket and makes up 16.4% of all families. Conversely, the $150,000 to $199,999 income bracket is the least frequent group with only 10 families (0.6%) belonging to this category.
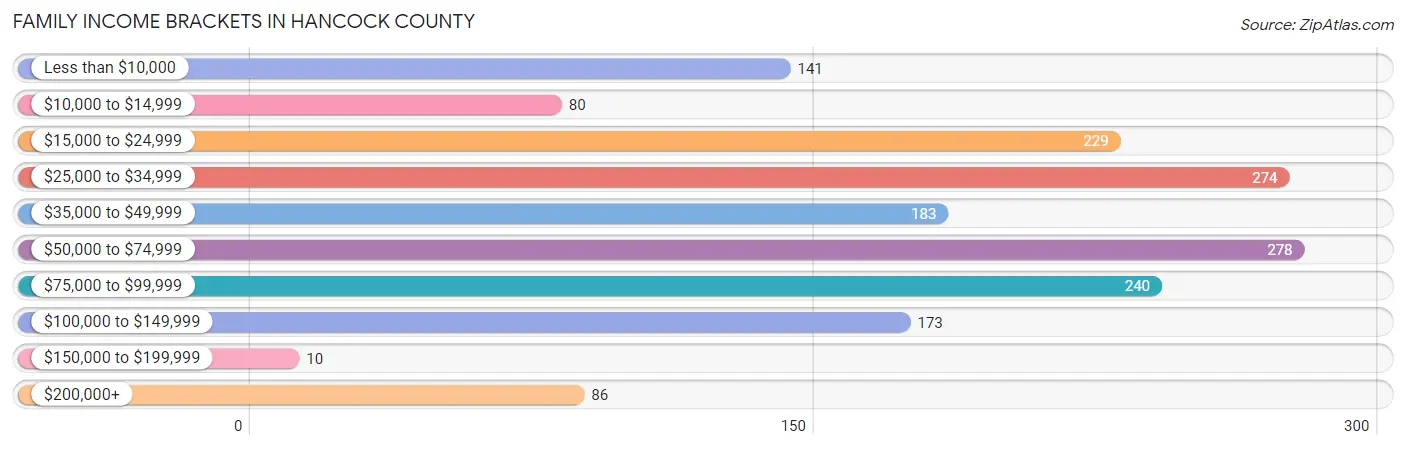
| Income Bracket | # Families | % Families |
| Less than $10,000 | 141 | 8.3% |
| $10,000 to $14,999 | 80 | 4.7% |
| $15,000 to $24,999 | 229 | 13.5% |
| $25,000 to $34,999 | 274 | 16.2% |
| $35,000 to $49,999 | 183 | 10.8% |
| $50,000 to $74,999 | 278 | 16.4% |
| $75,000 to $99,999 | 240 | 14.2% |
| $100,000 to $149,999 | 173 | 10.2% |
| $150,000 to $199,999 | 10 | 0.6% |
| $200,000+ | 86 | 5.1% |
Family Income by Famaliy Size in Hancock County
4-person families (272 | 16.1%) account for the highest median family income in Hancock County with $75,750 per family, while 2-person families (779 | 46.0%) have the highest median income of $20,625 per family member.
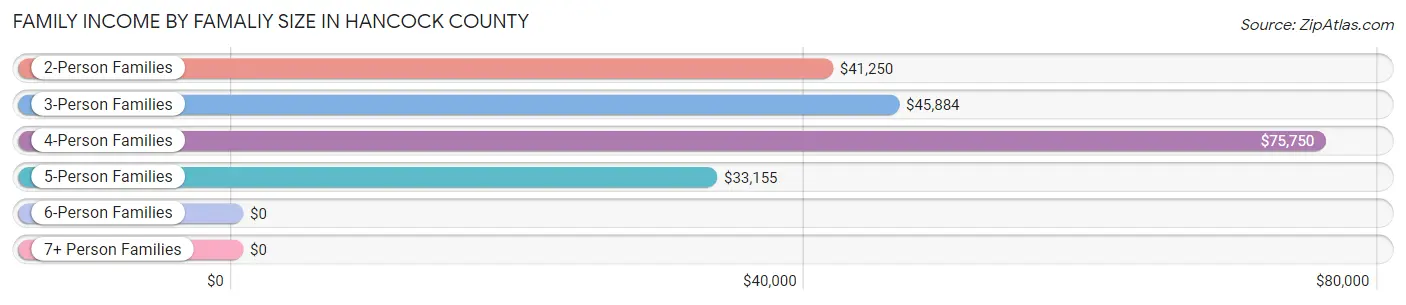
| Income Bracket | # Families | Median Income |
| 2-Person Families | 779 (46.0%) | $41,250 |
| 3-Person Families | 467 (27.6%) | $45,884 |
| 4-Person Families | 272 (16.1%) | $75,750 |
| 5-Person Families | 123 (7.3%) | $33,155 |
| 6-Person Families | 39 (2.3%) | $0 |
| 7+ Person Families | 13 (0.8%) | $0 |
| Total | 1,693 (100.0%) | $45,753 |
Family Income by Number of Earners in Hancock County
The median family income in Hancock County is $45,753, with families comprising 3+ earners (91) having the highest median family income of $92,266, while families with no earners (518) have the lowest median family income of $25,431, accounting for 5.4% and 30.6% of families, respectively.
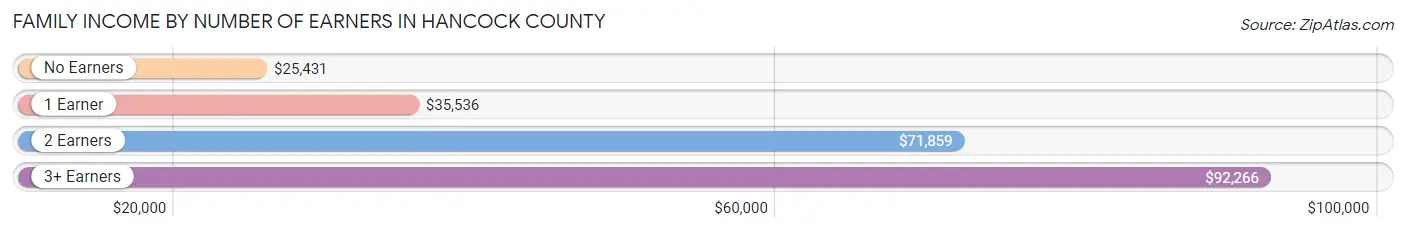
| Number of Earners | # Families | Median Income |
| No Earners | 518 (30.6%) | $25,431 |
| 1 Earner | 542 (32.0%) | $35,536 |
| 2 Earners | 542 (32.0%) | $71,859 |
| 3+ Earners | 91 (5.4%) | $92,266 |
| Total | 1,693 (100.0%) | $45,753 |
Household Income in Hancock County
Household Income Brackets in Hancock County
With 455 households falling in the category, the $15,000 to $24,999 income range is the most frequent in Hancock County, accounting for 16.1% of all households. In contrast, only 28 households (1.0%) fall into the $150,000 to $199,999 income bracket, making it the least populous group.
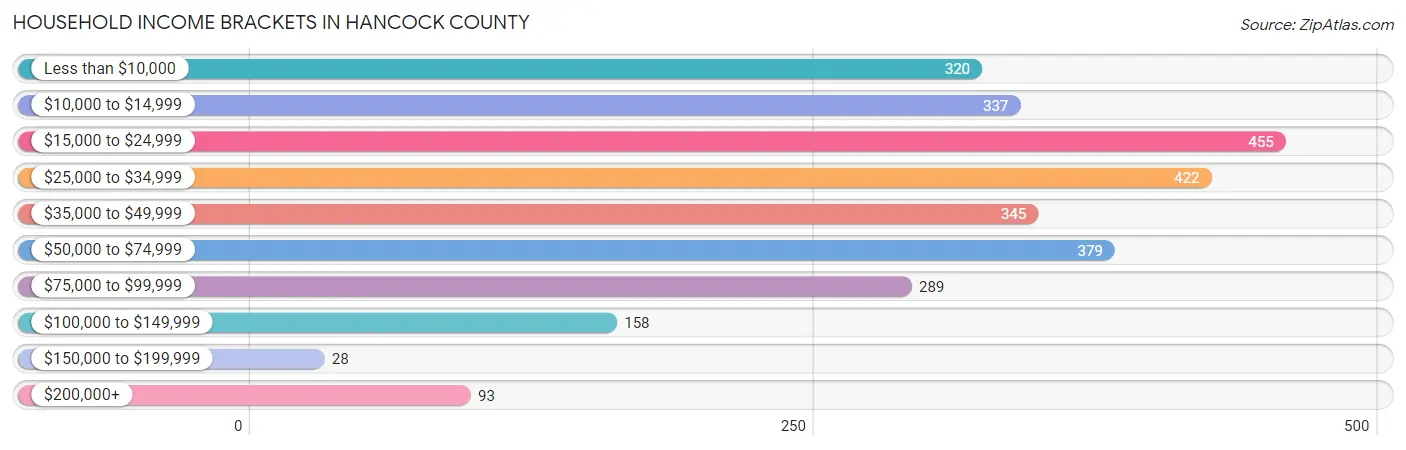
| Income Bracket | # Households | % Households |
| Less than $10,000 | 320 | 11.3% |
| $10,000 to $14,999 | 337 | 11.9% |
| $15,000 to $24,999 | 455 | 16.1% |
| $25,000 to $34,999 | 422 | 14.9% |
| $35,000 to $49,999 | 345 | 12.2% |
| $50,000 to $74,999 | 379 | 13.4% |
| $75,000 to $99,999 | 289 | 10.2% |
| $100,000 to $149,999 | 158 | 5.6% |
| $150,000 to $199,999 | 28 | 1.0% |
| $200,000+ | 93 | 3.3% |
Household Income by Householder Age in Hancock County
The median household income in Hancock County is $31,809, with the highest median household income of $38,301 found in the 25 to 44 years age bracket for the primary householder. A total of 707 households (25.0%) fall into this category. Meanwhile, the 15 to 24 years age bracket for the primary householder has the lowest median household income of $0, with 76 households (2.7%) in this group.
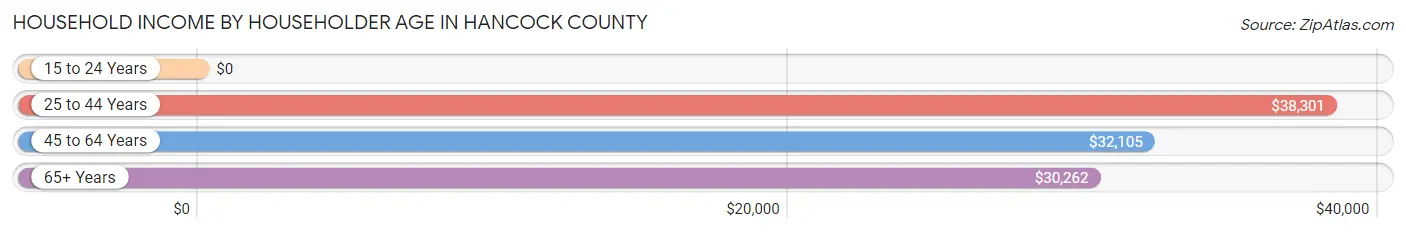
| Income Bracket | # Households | Median Income |
| 15 to 24 Years | 76 (2.7%) | $0 |
| 25 to 44 Years | 707 (25.0%) | $38,301 |
| 45 to 64 Years | 1,004 (35.5%) | $32,105 |
| 65+ Years | 1,042 (36.8%) | $30,262 |
| Total | 2,829 (100.0%) | $31,809 |
Poverty in Hancock County
Income Below Poverty by Sex and Age in Hancock County
With 34.1% poverty level for males and 30.6% for females among the residents of Hancock County, 6 to 11 year old males and under 5 year old females are the most vulnerable to poverty, with 164 males (63.8%) and 93 females (52.5%) in their respective age groups living below the poverty level.
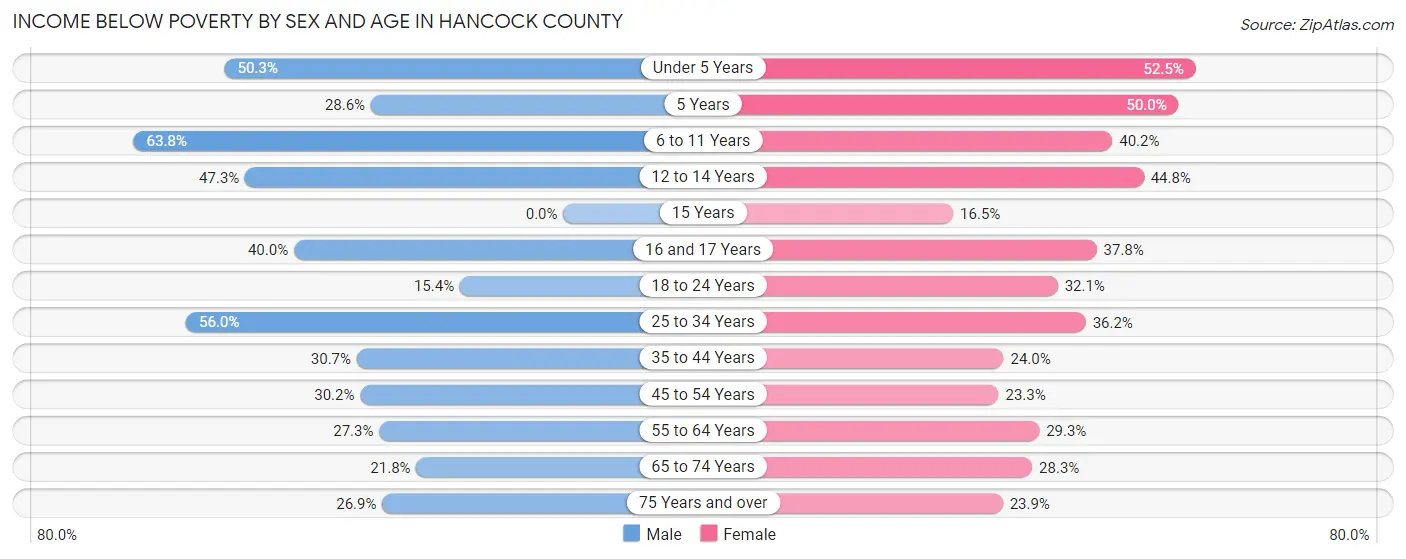
| Age Bracket | Male | Female |
| Under 5 Years | 84 (50.3%) | 93 (52.5%) |
| 5 Years | 8 (28.6%) | 29 (50.0%) |
| 6 to 11 Years | 164 (63.8%) | 94 (40.2%) |
| 12 to 14 Years | 43 (47.2%) | 39 (44.8%) |
| 15 Years | 0 (0.0%) | 22 (16.5%) |
| 16 and 17 Years | 28 (40.0%) | 14 (37.8%) |
| 18 to 24 Years | 37 (15.3%) | 67 (32.1%) |
| 25 to 34 Years | 177 (56.0%) | 134 (36.2%) |
| 35 to 44 Years | 111 (30.7%) | 86 (24.0%) |
| 45 to 54 Years | 123 (30.1%) | 95 (23.3%) |
| 55 to 64 Years | 132 (27.3%) | 158 (29.3%) |
| 65 to 74 Years | 103 (21.8%) | 132 (28.3%) |
| 75 Years and over | 64 (26.9%) | 70 (23.9%) |
| Total | 1,074 (34.1%) | 1,033 (30.6%) |
Income Above Poverty by Sex and Age in Hancock County
According to the poverty statistics in Hancock County, males aged 15 years and females aged 15 years are the age groups that are most secure financially, with 100.0% of males and 83.5% of females in these age groups living above the poverty line.
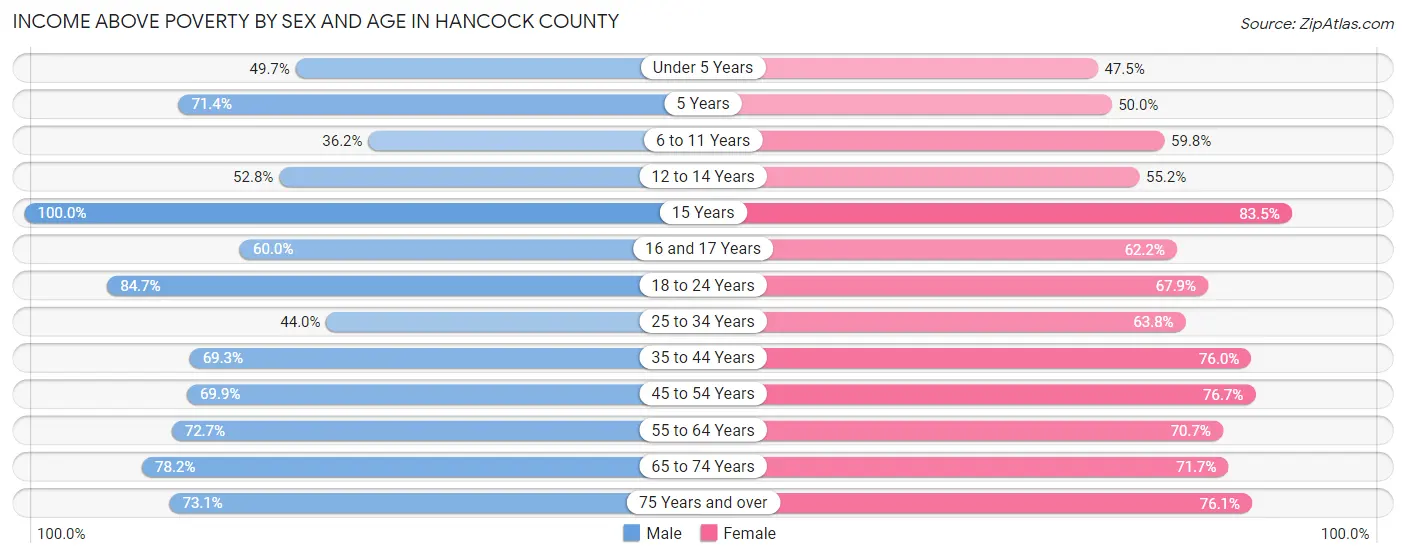
| Age Bracket | Male | Female |
| Under 5 Years | 83 (49.7%) | 84 (47.5%) |
| 5 Years | 20 (71.4%) | 29 (50.0%) |
| 6 to 11 Years | 93 (36.2%) | 140 (59.8%) |
| 12 to 14 Years | 48 (52.7%) | 48 (55.2%) |
| 15 Years | 13 (100.0%) | 111 (83.5%) |
| 16 and 17 Years | 42 (60.0%) | 23 (62.2%) |
| 18 to 24 Years | 204 (84.7%) | 142 (67.9%) |
| 25 to 34 Years | 139 (44.0%) | 236 (63.8%) |
| 35 to 44 Years | 251 (69.3%) | 272 (76.0%) |
| 45 to 54 Years | 285 (69.9%) | 313 (76.7%) |
| 55 to 64 Years | 351 (72.7%) | 381 (70.7%) |
| 65 to 74 Years | 369 (78.2%) | 335 (71.7%) |
| 75 Years and over | 174 (73.1%) | 223 (76.1%) |
| Total | 2,072 (65.9%) | 2,337 (69.4%) |
Income Below Poverty Among Married-Couple Families in Hancock County
The poverty statistics for married-couple families in Hancock County show that 16.2% or 191 of the total 1,177 families live below the poverty line. Families with 5 or more children have the highest poverty rate of 100.0%, comprising of 13 families. On the other hand, families with no children have the lowest poverty rate of 7.6%, which includes 50 families.
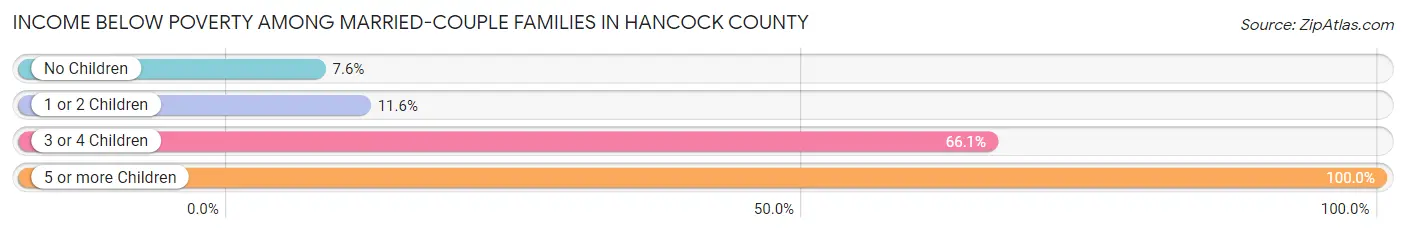
| Children | Above Poverty | Below Poverty |
| No Children | 606 (92.4%) | 50 (7.6%) |
| 1 or 2 Children | 337 (88.4%) | 44 (11.6%) |
| 3 or 4 Children | 43 (33.9%) | 84 (66.1%) |
| 5 or more Children | 0 (0.0%) | 13 (100.0%) |
| Total | 986 (83.8%) | 191 (16.2%) |
Income Below Poverty Among Single-Parent Households in Hancock County
According to the poverty data in Hancock County, 36.4% or 71 single-father households and 51.4% or 165 single-mother households are living below the poverty line. Among single-father households, those with 3 or 4 children have the highest poverty rate, with 14 households (100.0%) experiencing poverty. Likewise, among single-mother households, those with 3 or 4 children have the highest poverty rate, with 14 households (100.0%) falling below the poverty line.
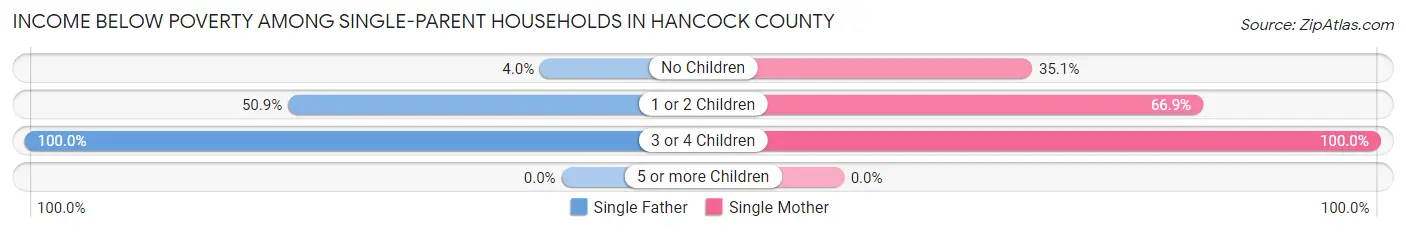
| Children | Single Father | Single Mother |
| No Children | 3 (4.0%) | 60 (35.1%) |
| 1 or 2 Children | 54 (50.9%) | 91 (66.9%) |
| 3 or 4 Children | 14 (100.0%) | 14 (100.0%) |
| 5 or more Children | 0 (0.0%) | 0 (0.0%) |
| Total | 71 (36.4%) | 165 (51.4%) |
Income Below Poverty Among Married-Couple vs Single-Parent Households in Hancock County
The poverty data for Hancock County shows that 191 of the married-couple family households (16.2%) and 236 of the single-parent households (45.7%) are living below the poverty level. Within the married-couple family households, those with 5 or more children have the highest poverty rate, with 13 households (100.0%) falling below the poverty line. Among the single-parent households, those with 3 or 4 children have the highest poverty rate, with 28 household (100.0%) living below poverty.
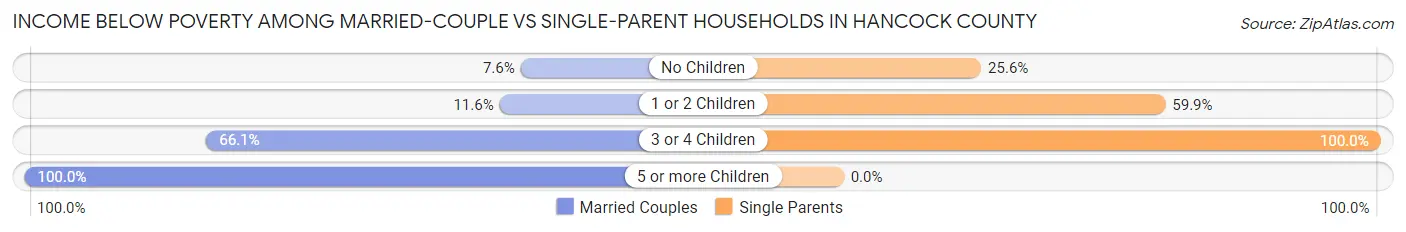
| Children | Married-Couple Families | Single-Parent Households |
| No Children | 50 (7.6%) | 63 (25.6%) |
| 1 or 2 Children | 44 (11.6%) | 145 (59.9%) |
| 3 or 4 Children | 84 (66.1%) | 28 (100.0%) |
| 5 or more Children | 13 (100.0%) | 0 (0.0%) |
| Total | 191 (16.2%) | 236 (45.7%) |
Employment Characteristics in Hancock County
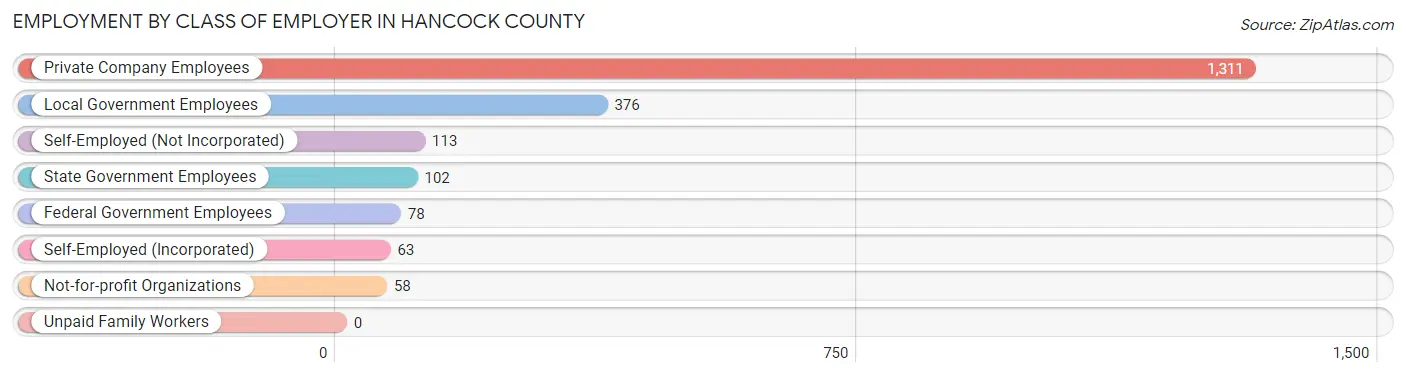
Employment by Class of Employer in Hancock County
Among the 2,101 employed individuals in Hancock County, private company employees (1,311 | 62.4%), local government employees (376 | 17.9%), and self-employed (not incorporated) (113 | 5.4%) make up the most common classes of employment.
| Employer Class | # Employees | % Employees |
| Private Company Employees | 1,311 | 62.4% |
| Self-Employed (Incorporated) | 63 | 3.0% |
| Self-Employed (Not Incorporated) | 113 | 5.4% |
| Not-for-profit Organizations | 58 | 2.8% |
| Local Government Employees | 376 | 17.9% |
| State Government Employees | 102 | 4.9% |
| Federal Government Employees | 78 | 3.7% |
| Unpaid Family Workers | 0 | 0.0% |
| Total | 2,101 | 100.0% |
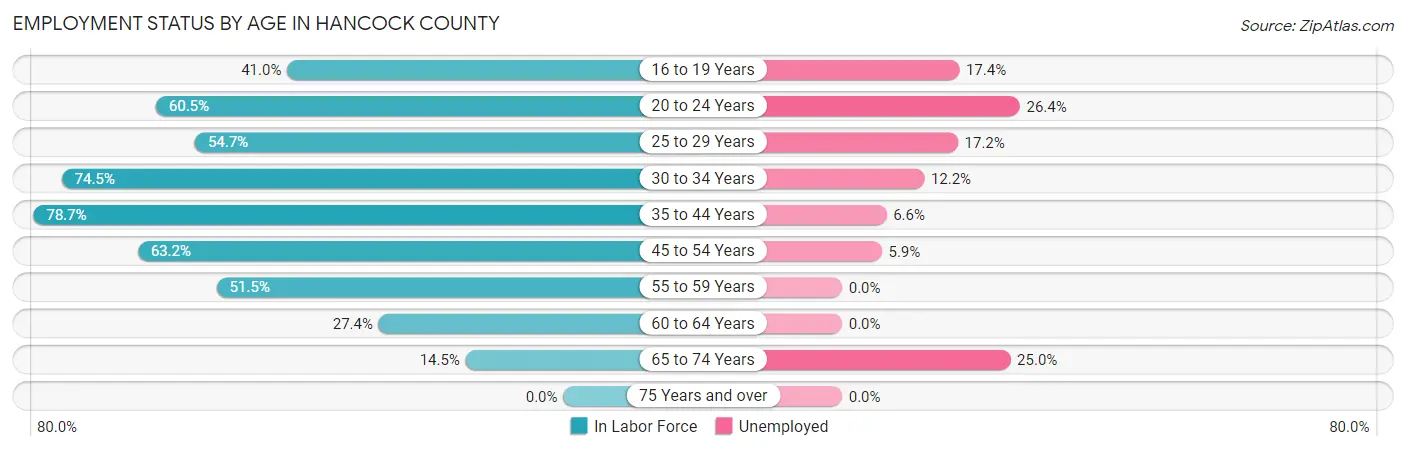
Employment Status by Age in Hancock County
According to the labor force statistics for Hancock County, out of the total population over 16 years of age (5,417), 44.8% or 2,427 individuals are in the labor force, with 10.1% or 245 of them unemployed. The age group with the highest labor force participation rate is 35 to 44 years, with 78.7% or 595 individuals in the labor force. Within the labor force, the 20 to 24 years age range has the highest percentage of unemployed individuals, with 26.4% or 57 of them being unemployed.
| Age Bracket | In Labor Force | Unemployed |
| 16 to 19 Years | 86 (41.0%) | 15 (17.4%) |
| 20 to 24 Years | 216 (60.5%) | 57 (26.4%) |
| 25 to 29 Years | 209 (54.7%) | 36 (17.2%) |
| 30 to 34 Years | 263 (74.5%) | 32 (12.2%) |
| 35 to 44 Years | 595 (78.7%) | 39 (6.6%) |
| 45 to 54 Years | 522 (63.2%) | 31 (5.9%) |
| 55 to 59 Years | 252 (51.5%) | 0 (0.0%) |
| 60 to 64 Years | 148 (27.4%) | 0 (0.0%) |
| 65 to 74 Years | 136 (14.5%) | 34 (25.0%) |
| 75 Years and over | 0 (0.0%) | 0 (0.0%) |
| Total | 2,427 (44.8%) | 245 (10.1%) |
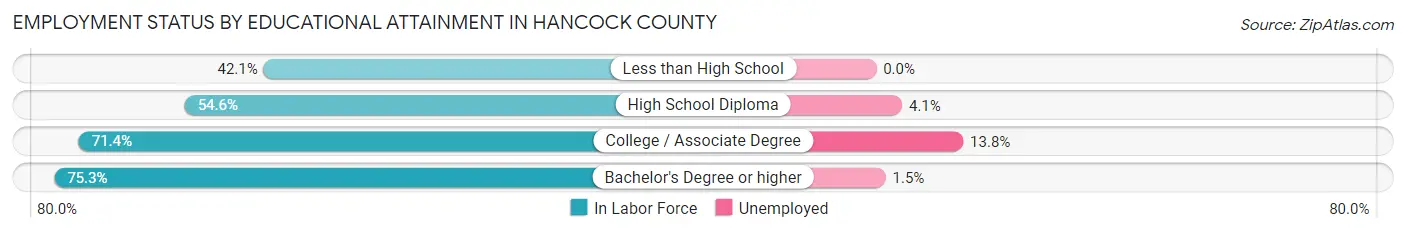
Employment Status by Educational Attainment in Hancock County
According to labor force statistics for Hancock County, 59.4% of individuals (1,988) out of the total population between 25 and 64 years of age (3,346) are in the labor force, with 6.9% or 137 of them being unemployed. The group with the highest labor force participation rate are those with the educational attainment of bachelor's degree or higher, with 75.3% or 195 individuals in the labor force. Within the labor force, individuals with college / associate degree education have the highest percentage of unemployment, with 13.8% or 100 of them being unemployed.
| Educational Attainment | In Labor Force | Unemployed |
| Less than High School | 209 (42.1%) | 0 (0.0%) |
| High School Diploma | 860 (54.6%) | 65 (4.1%) |
| College / Associate Degree | 725 (71.4%) | 140 (13.8%) |
| Bachelor's Degree or higher | 195 (75.3%) | 4 (1.5%) |
| Total | 1,988 (59.4%) | 231 (6.9%) |
Employment Occupations by Sex in Hancock County
Management, Business, Science and Arts Occupations
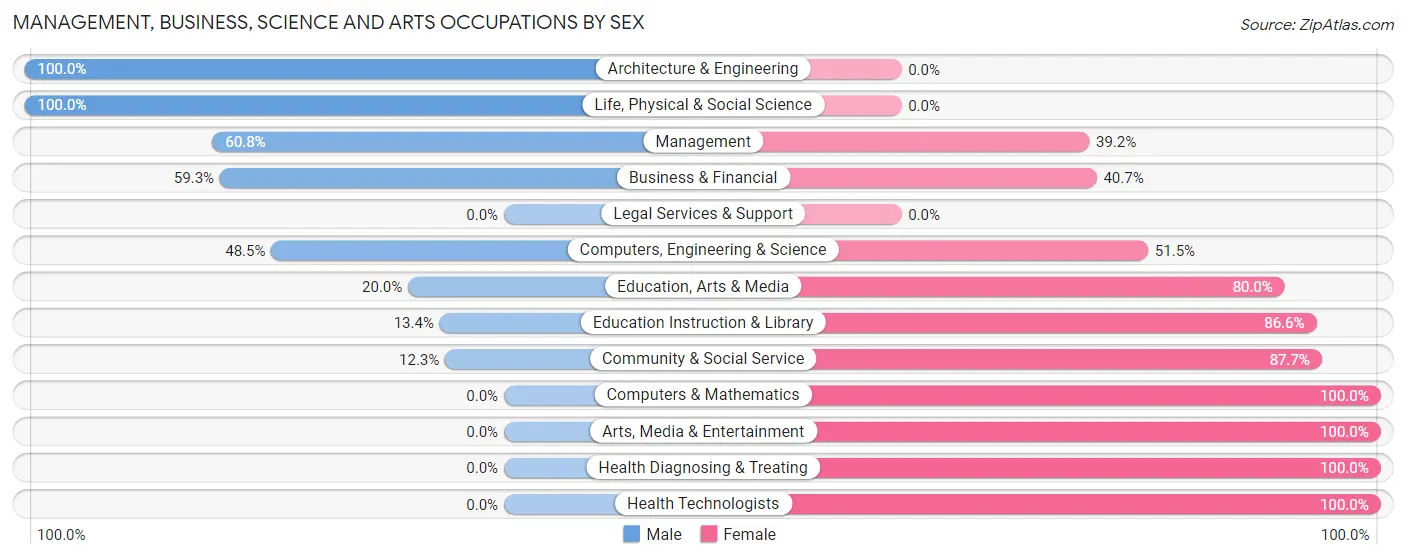
The most common Management, Business, Science and Arts occupations in Hancock County are Community & Social Service (228 | 10.4%), Education Instruction & Library (194 | 8.9%), Management (148 | 6.8%), Health Diagnosing & Treating (148 | 6.8%), and Health Technologists (77 | 3.5%).
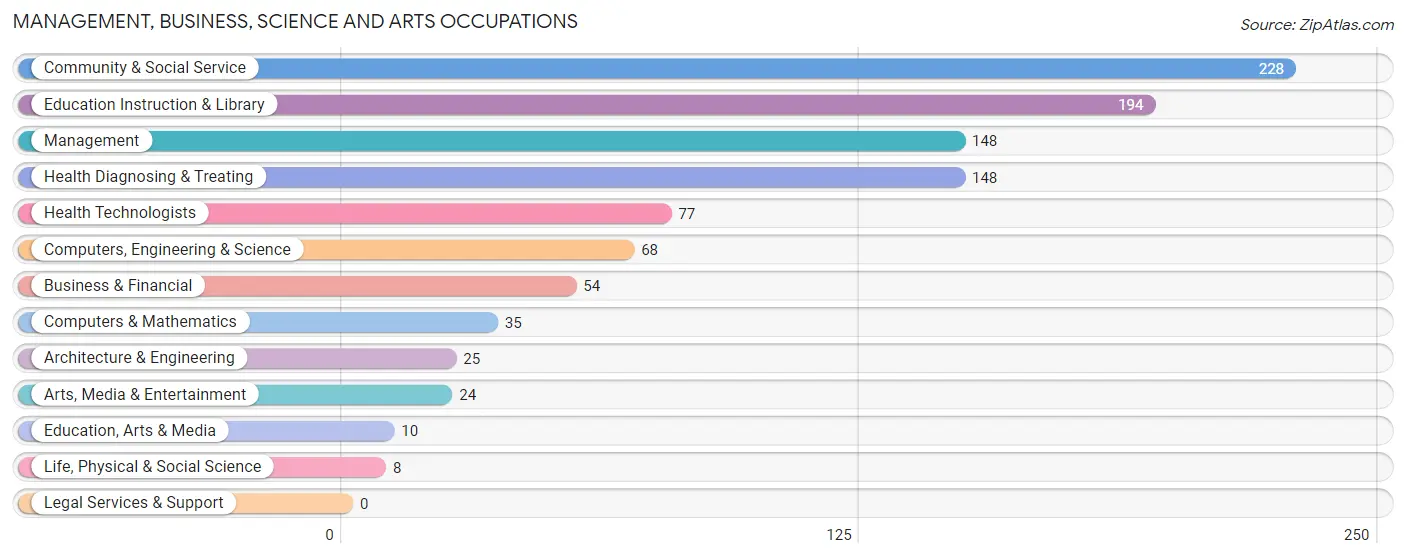
Management, Business, Science and Arts Occupations by Sex
Within the Management, Business, Science and Arts occupations in Hancock County, the most male-oriented occupations are Architecture & Engineering (100.0%), Life, Physical & Social Science (100.0%), and Management (60.8%), while the most female-oriented occupations are Computers & Mathematics (100.0%), Arts, Media & Entertainment (100.0%), and Health Diagnosing & Treating (100.0%).
| Occupation | Male | Female |
| Management | 90 (60.8%) | 58 (39.2%) |
| Business & Financial | 32 (59.3%) | 22 (40.7%) |
| Computers, Engineering & Science | 33 (48.5%) | 35 (51.5%) |
| Computers & Mathematics | 0 (0.0%) | 35 (100.0%) |
| Architecture & Engineering | 25 (100.0%) | 0 (0.0%) |
| Life, Physical & Social Science | 8 (100.0%) | 0 (0.0%) |
| Community & Social Service | 28 (12.3%) | 200 (87.7%) |
| Education, Arts & Media | 2 (20.0%) | 8 (80.0%) |
| Legal Services & Support | 0 (0.0%) | 0 (0.0%) |
| Education Instruction & Library | 26 (13.4%) | 168 (86.6%) |
| Arts, Media & Entertainment | 0 (0.0%) | 24 (100.0%) |
| Health Diagnosing & Treating | 0 (0.0%) | 148 (100.0%) |
| Health Technologists | 0 (0.0%) | 77 (100.0%) |
| Total (Category) | 183 (28.3%) | 463 (71.7%) |
| Total (Overall) | 1,061 (48.6%) | 1,122 (51.4%) |
Services Occupations
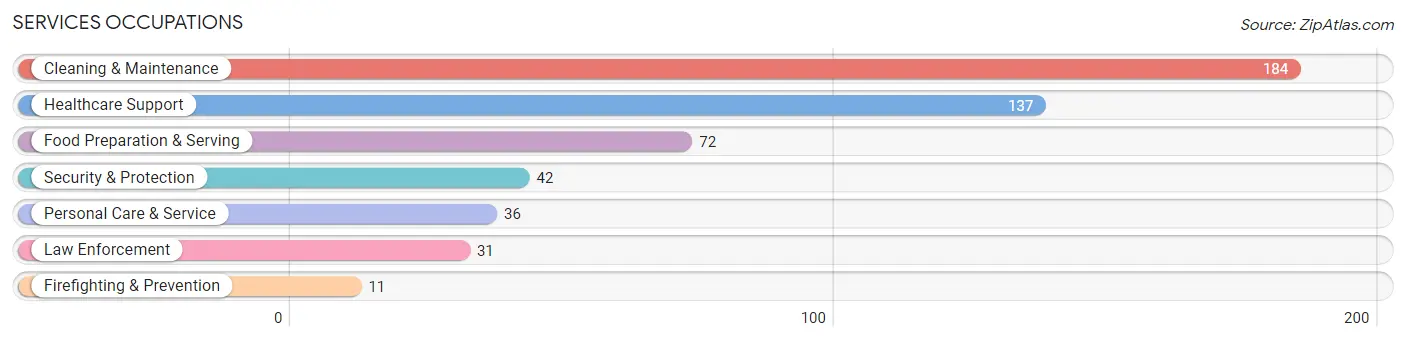
The most common Services occupations in Hancock County are Cleaning & Maintenance (184 | 8.4%), Healthcare Support (137 | 6.3%), Food Preparation & Serving (72 | 3.3%), Security & Protection (42 | 1.9%), and Personal Care & Service (36 | 1.7%).
Services Occupations by Sex
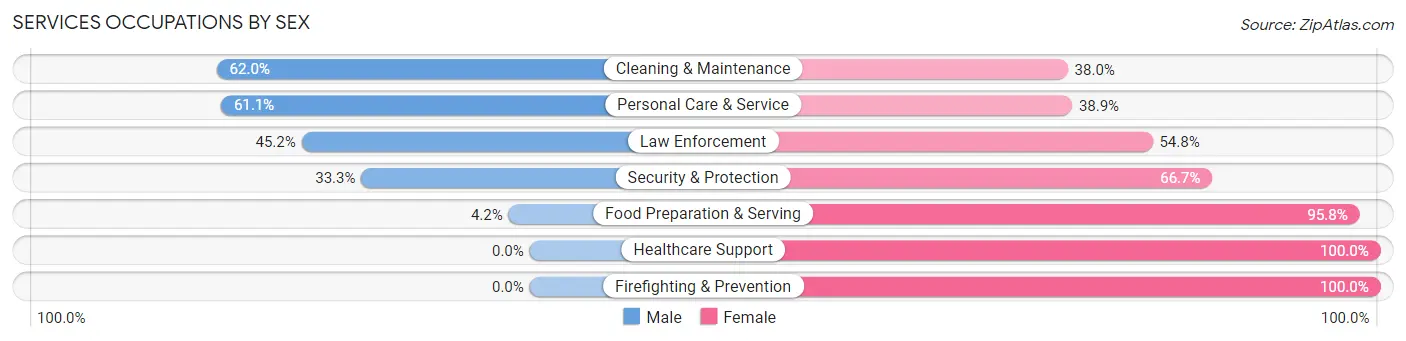
Within the Services occupations in Hancock County, the most male-oriented occupations are Cleaning & Maintenance (62.0%), Personal Care & Service (61.1%), and Law Enforcement (45.2%), while the most female-oriented occupations are Healthcare Support (100.0%), Firefighting & Prevention (100.0%), and Food Preparation & Serving (95.8%).
| Occupation | Male | Female |
| Healthcare Support | 0 (0.0%) | 137 (100.0%) |
| Security & Protection | 14 (33.3%) | 28 (66.7%) |
| Firefighting & Prevention | 0 (0.0%) | 11 (100.0%) |
| Law Enforcement | 14 (45.2%) | 17 (54.8%) |
| Food Preparation & Serving | 3 (4.2%) | 69 (95.8%) |
| Cleaning & Maintenance | 114 (62.0%) | 70 (38.0%) |
| Personal Care & Service | 22 (61.1%) | 14 (38.9%) |
| Total (Category) | 153 (32.5%) | 318 (67.5%) |
| Total (Overall) | 1,061 (48.6%) | 1,122 (51.4%) |
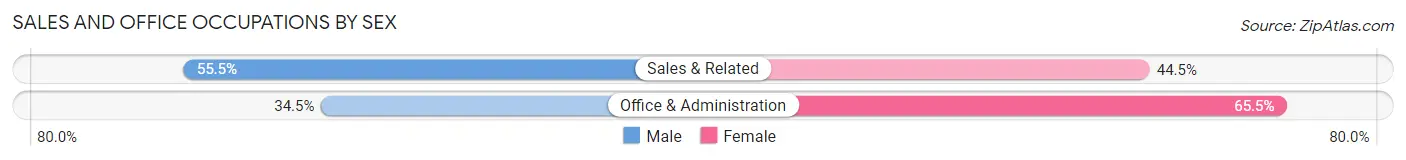
Sales and Office Occupations
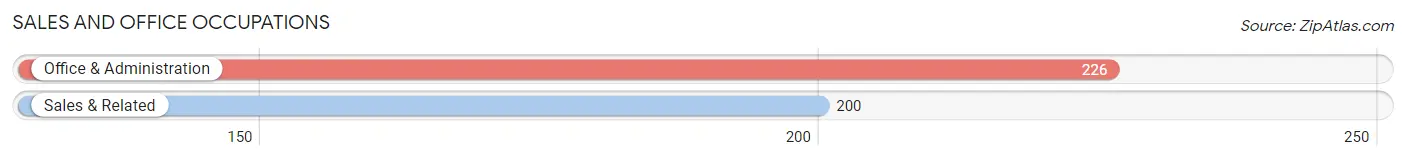
The most common Sales and Office occupations in Hancock County are Office & Administration (226 | 10.3%), and Sales & Related (200 | 9.2%).
Sales and Office Occupations by Sex
| Occupation | Male | Female |
| Sales & Related | 111 (55.5%) | 89 (44.5%) |
| Office & Administration | 78 (34.5%) | 148 (65.5%) |
| Total (Category) | 189 (44.4%) | 237 (55.6%) |
| Total (Overall) | 1,061 (48.6%) | 1,122 (51.4%) |
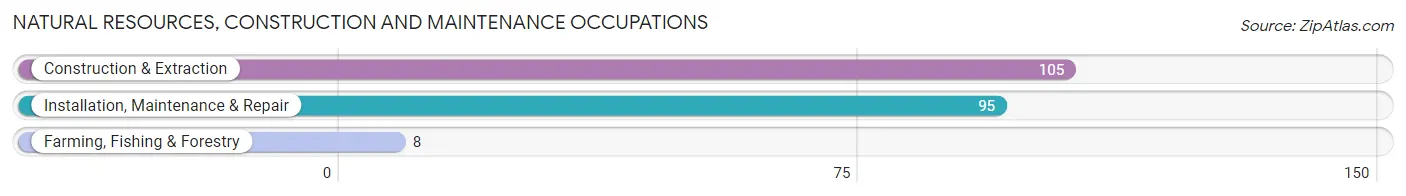
Natural Resources, Construction and Maintenance Occupations
The most common Natural Resources, Construction and Maintenance occupations in Hancock County are Construction & Extraction (105 | 4.8%), Installation, Maintenance & Repair (95 | 4.3%), and Farming, Fishing & Forestry (8 | 0.4%).
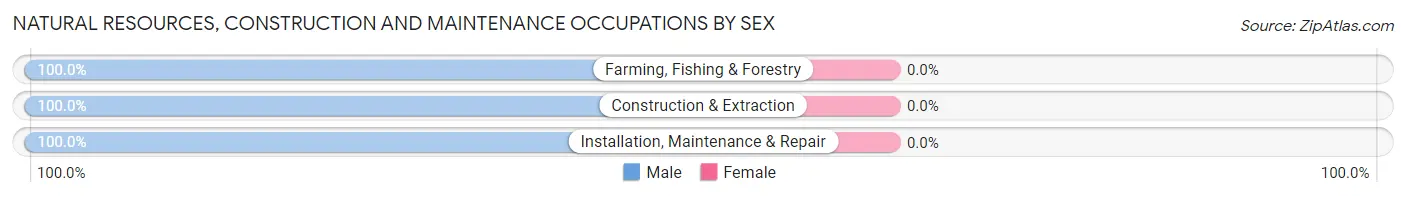
Natural Resources, Construction and Maintenance Occupations by Sex
| Occupation | Male | Female |
| Farming, Fishing & Forestry | 8 (100.0%) | 0 (0.0%) |
| Construction & Extraction | 105 (100.0%) | 0 (0.0%) |
| Installation, Maintenance & Repair | 95 (100.0%) | 0 (0.0%) |
| Total (Category) | 208 (100.0%) | 0 (0.0%) |
| Total (Overall) | 1,061 (48.6%) | 1,122 (51.4%) |
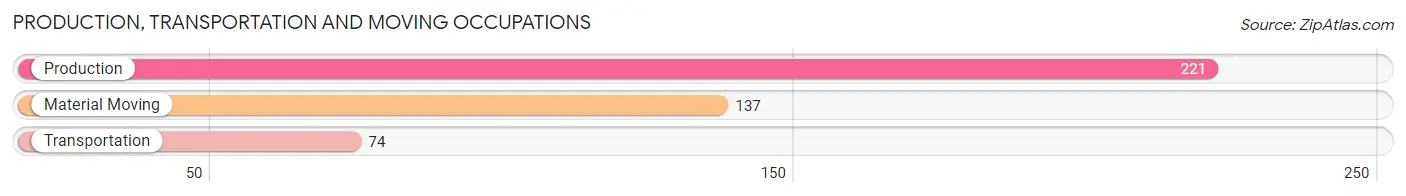
Production, Transportation and Moving Occupations
The most common Production, Transportation and Moving occupations in Hancock County are Production (221 | 10.1%), Material Moving (137 | 6.3%), and Transportation (74 | 3.4%).
Production, Transportation and Moving Occupations by Sex
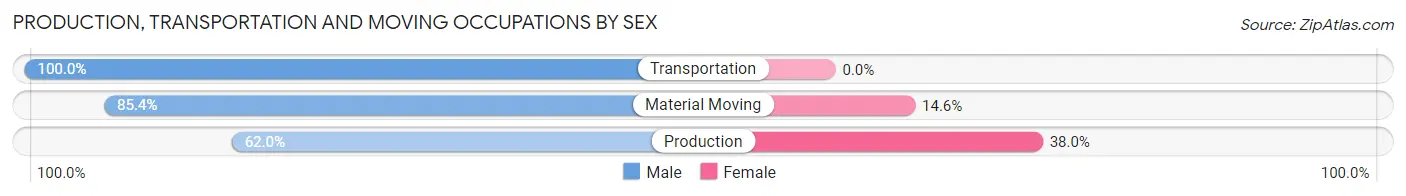
| Occupation | Male | Female |
| Production | 137 (62.0%) | 84 (38.0%) |
| Transportation | 74 (100.0%) | 0 (0.0%) |
| Material Moving | 117 (85.4%) | 20 (14.6%) |
| Total (Category) | 328 (75.9%) | 104 (24.1%) |
| Total (Overall) | 1,061 (48.6%) | 1,122 (51.4%) |
Employment Industries by Sex in Hancock County
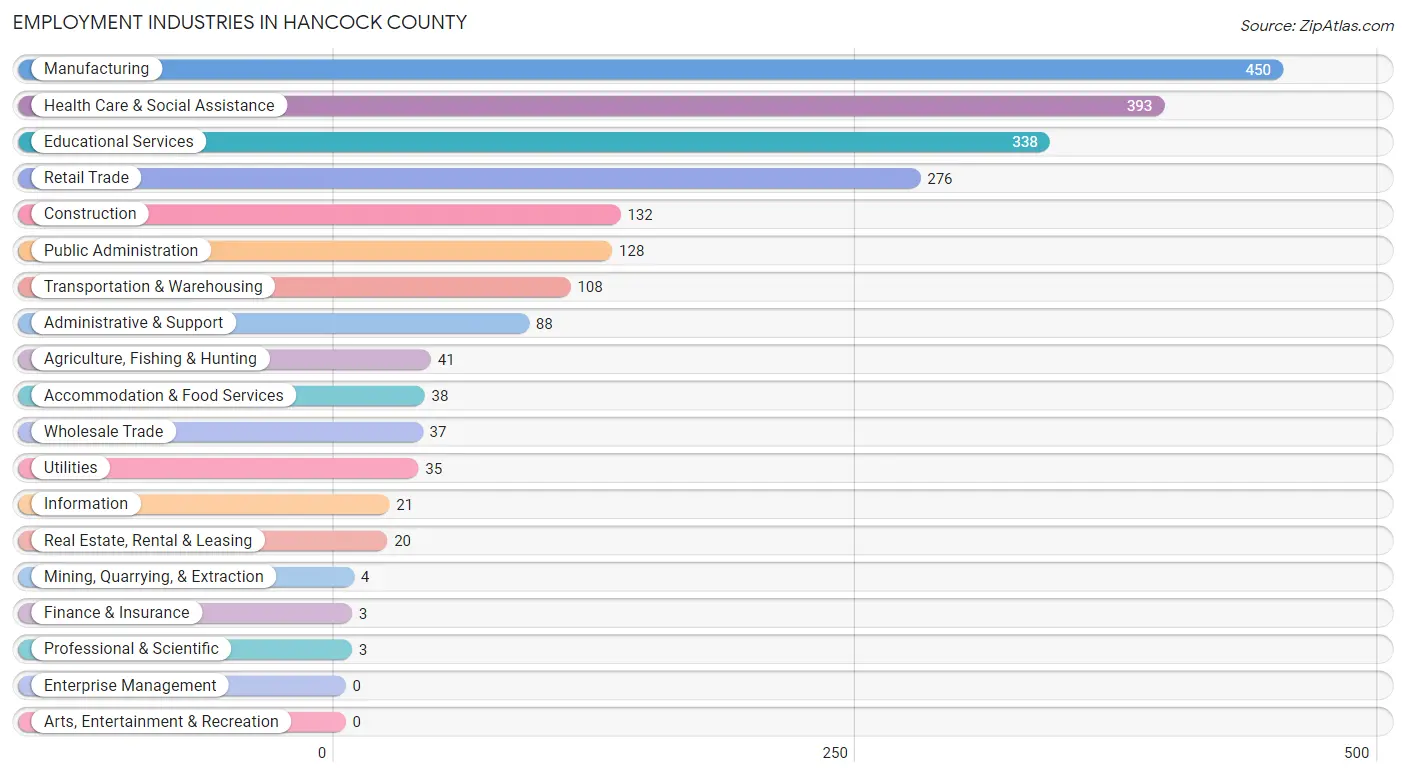
Employment Industries in Hancock County
The major employment industries in Hancock County include Manufacturing (450 | 20.6%), Health Care & Social Assistance (393 | 18.0%), Educational Services (338 | 15.5%), Retail Trade (276 | 12.6%), and Construction (132 | 6.0%).
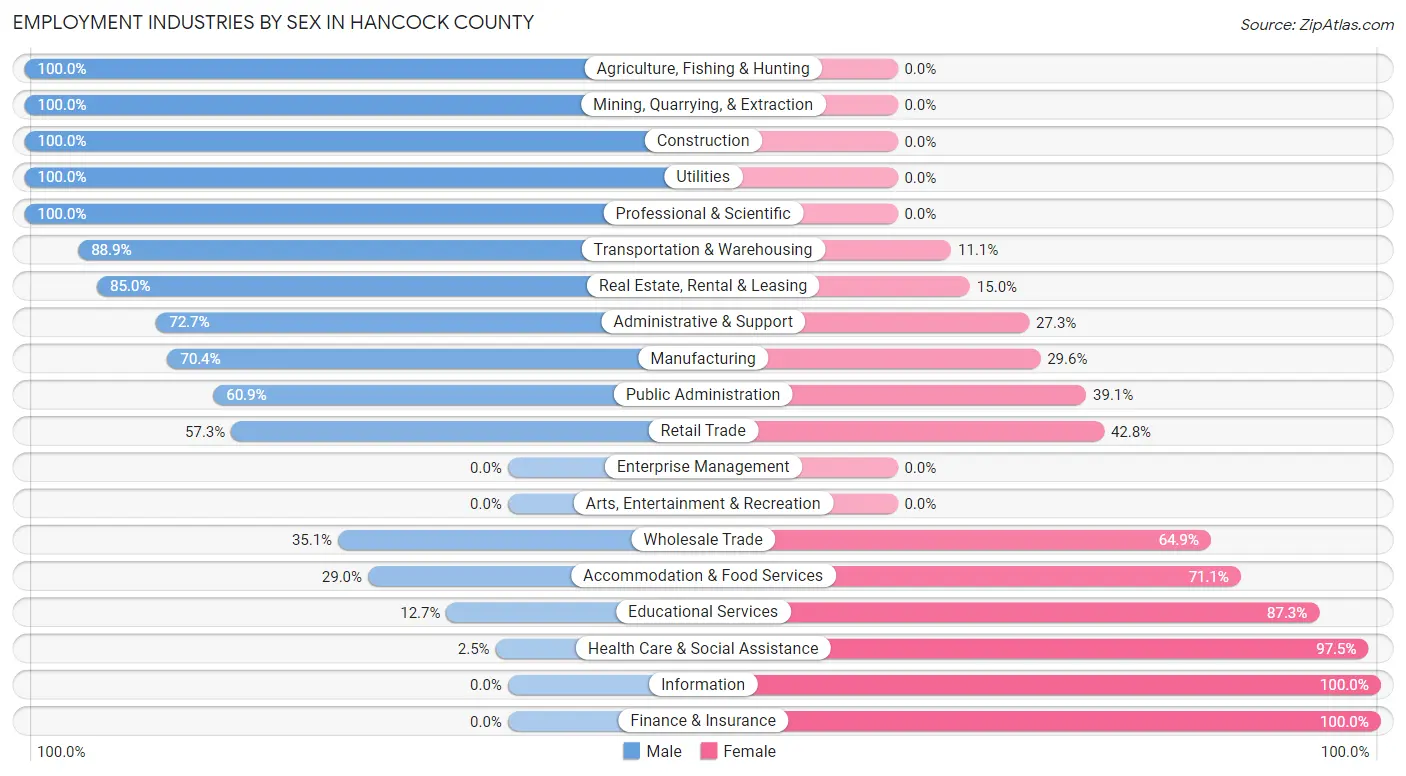
Employment Industries by Sex in Hancock County
The Hancock County industries that see more men than women are Agriculture, Fishing & Hunting (100.0%), Mining, Quarrying, & Extraction (100.0%), and Construction (100.0%), whereas the industries that tend to have a higher number of women are Information (100.0%), Finance & Insurance (100.0%), and Health Care & Social Assistance (97.5%).
| Industry | Male | Female |
| Agriculture, Fishing & Hunting | 41 (100.0%) | 0 (0.0%) |
| Mining, Quarrying, & Extraction | 4 (100.0%) | 0 (0.0%) |
| Construction | 132 (100.0%) | 0 (0.0%) |
| Manufacturing | 317 (70.4%) | 133 (29.6%) |
| Wholesale Trade | 13 (35.1%) | 24 (64.9%) |
| Retail Trade | 158 (57.3%) | 118 (42.7%) |
| Transportation & Warehousing | 96 (88.9%) | 12 (11.1%) |
| Utilities | 35 (100.0%) | 0 (0.0%) |
| Information | 0 (0.0%) | 21 (100.0%) |
| Finance & Insurance | 0 (0.0%) | 3 (100.0%) |
| Real Estate, Rental & Leasing | 17 (85.0%) | 3 (15.0%) |
| Professional & Scientific | 3 (100.0%) | 0 (0.0%) |
| Enterprise Management | 0 (0.0%) | 0 (0.0%) |
| Administrative & Support | 64 (72.7%) | 24 (27.3%) |
| Educational Services | 43 (12.7%) | 295 (87.3%) |
| Health Care & Social Assistance | 10 (2.5%) | 383 (97.5%) |
| Arts, Entertainment & Recreation | 0 (0.0%) | 0 (0.0%) |
| Accommodation & Food Services | 11 (28.9%) | 27 (71.1%) |
| Public Administration | 78 (60.9%) | 50 (39.1%) |
| Total | 1,061 (48.6%) | 1,122 (51.4%) |
Education in Hancock County
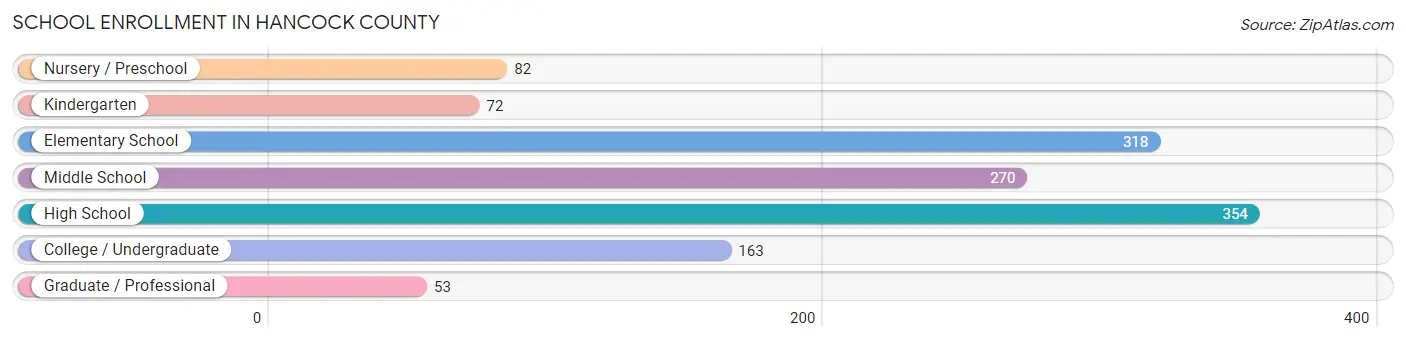
School Enrollment in Hancock County
The most common levels of schooling among the 1,312 students in Hancock County are high school (354 | 27.0%), elementary school (318 | 24.2%), and middle school (270 | 20.6%).
| School Level | # Students | % Students |
| Nursery / Preschool | 82 | 6.2% |
| Kindergarten | 72 | 5.5% |
| Elementary School | 318 | 24.2% |
| Middle School | 270 | 20.6% |
| High School | 354 | 27.0% |
| College / Undergraduate | 163 | 12.4% |
| Graduate / Professional | 53 | 4.0% |
| Total | 1,312 | 100.0% |
School Enrollment by Age by Funding Source in Hancock County
Out of a total of 1,312 students who are enrolled in schools in Hancock County, 143 (10.9%) attend a private institution, while the remaining 1,169 (89.1%) are enrolled in public schools. The age group of 20 to 24 year olds has the highest likelihood of being enrolled in private schools, with 33 (62.3% in the age bracket) enrolled. Conversely, the age group of 25 to 34 year olds has the lowest likelihood of being enrolled in a private school, with 126 (100.0% in the age bracket) attending a public institution.

| Age Bracket | Public School | Private School |
| 3 to 4 Year Olds | 30 (76.9%) | 9 (23.1%) |
| 5 to 9 Year Old | 356 (88.1%) | 48 (11.9%) |
| 10 to 14 Year Olds | 303 (88.6%) | 39 (11.4%) |
| 15 to 17 Year Olds | 251 (99.6%) | 1 (0.4%) |
| 18 to 19 Year Olds | 69 (95.8%) | 3 (4.2%) |
| 20 to 24 Year Olds | 20 (37.7%) | 33 (62.3%) |
| 25 to 34 Year Olds | 126 (100.0%) | 0 (0.0%) |
| 35 Years and over | 14 (58.3%) | 10 (41.7%) |
| Total | 1,169 (89.1%) | 143 (10.9%) |
Educational Attainment by Field of Study in Hancock County
Business (113 | 22.4%), education (107 | 21.2%), science & technology (78 | 15.4%), literature & languages (38 | 7.5%), and engineering (36 | 7.1%) are the most common fields of study among 505 individuals in Hancock County who have obtained a bachelor's degree or higher.
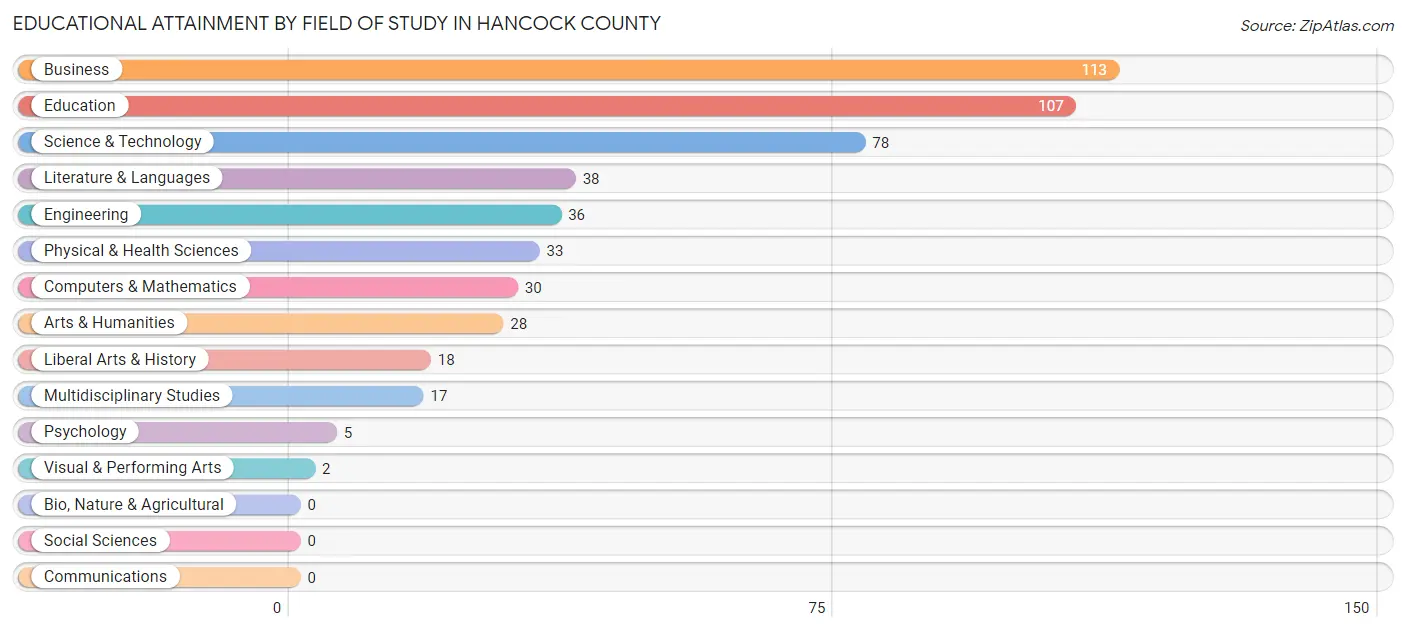
| Field of Study | # Graduates | % Graduates |
| Computers & Mathematics | 30 | 5.9% |
| Bio, Nature & Agricultural | 0 | 0.0% |
| Physical & Health Sciences | 33 | 6.5% |
| Psychology | 5 | 1.0% |
| Social Sciences | 0 | 0.0% |
| Engineering | 36 | 7.1% |
| Multidisciplinary Studies | 17 | 3.4% |
| Science & Technology | 78 | 15.4% |
| Business | 113 | 22.4% |
| Education | 107 | 21.2% |
| Literature & Languages | 38 | 7.5% |
| Liberal Arts & History | 18 | 3.6% |
| Visual & Performing Arts | 2 | 0.4% |
| Communications | 0 | 0.0% |
| Arts & Humanities | 28 | 5.5% |
| Total | 505 | 100.0% |
Transportation & Commute in Hancock County
Vehicle Availability by Sex in Hancock County
The most prevalent vehicle ownership categories in Hancock County are males with 2 vehicles (364, accounting for 35.9%) and females with 2 vehicles (469, making up 33.5%).
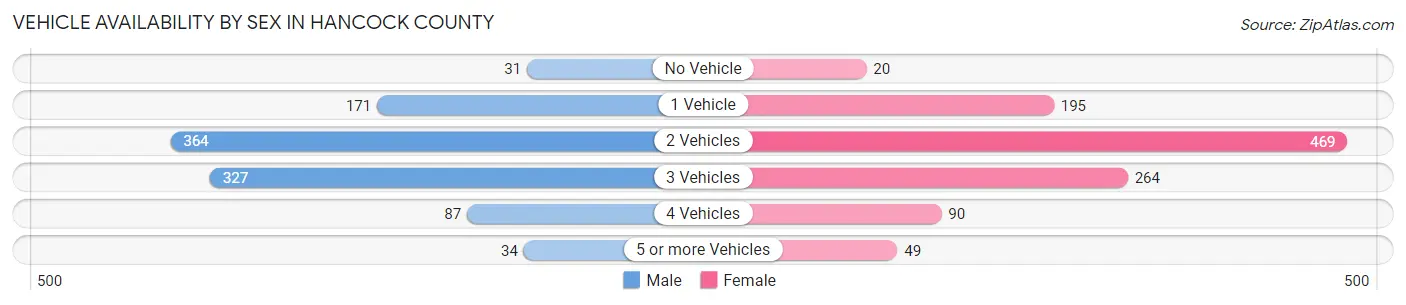
| Vehicles Available | Male | Female |
| No Vehicle | 31 (3.1%) | 20 (1.8%) |
| 1 Vehicle | 171 (16.9%) | 195 (17.9%) |
| 2 Vehicles | 364 (35.9%) | 469 (43.1%) |
| 3 Vehicles | 327 (32.3%) | 264 (24.3%) |
| 4 Vehicles | 87 (8.6%) | 90 (8.3%) |
| 5 or more Vehicles | 34 (3.4%) | 49 (4.5%) |
| Total | 1,014 (100.0%) | 1,087 (100.0%) |
Commute Time in Hancock County
The most frequently occuring commute durations in Hancock County are 60 to 89 minutes (389 commuters, 18.9%), 15 to 19 minutes (307 commuters, 14.9%), and 10 to 14 minutes (277 commuters, 13.5%).
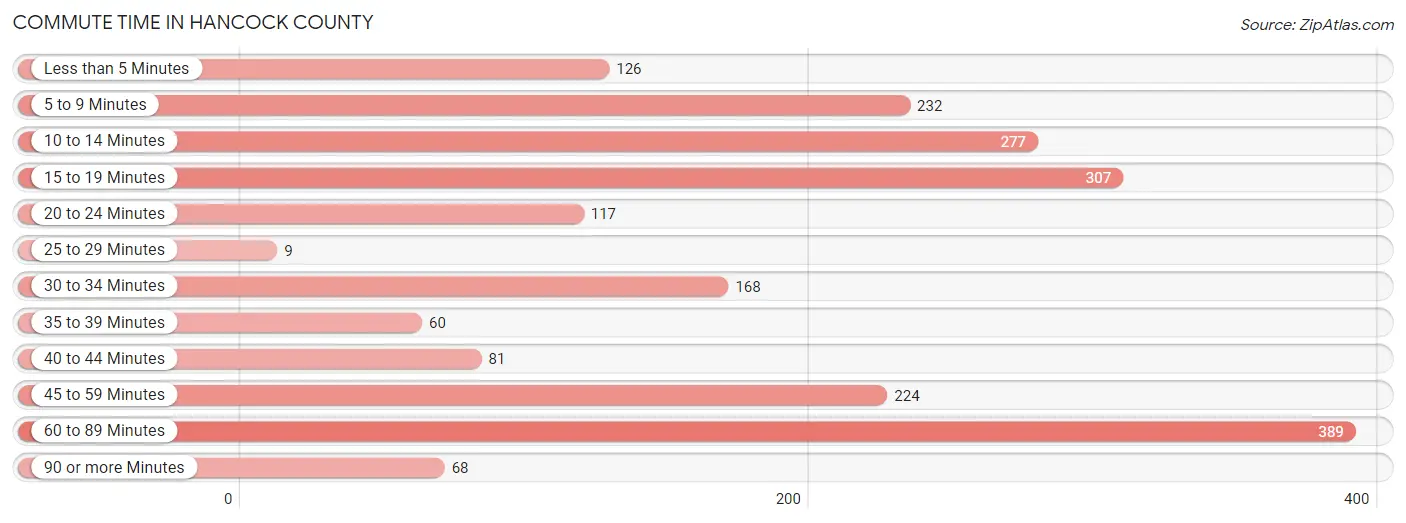
| Commute Time | # Commuters | % Commuters |
| Less than 5 Minutes | 126 | 6.1% |
| 5 to 9 Minutes | 232 | 11.3% |
| 10 to 14 Minutes | 277 | 13.5% |
| 15 to 19 Minutes | 307 | 14.9% |
| 20 to 24 Minutes | 117 | 5.7% |
| 25 to 29 Minutes | 9 | 0.4% |
| 30 to 34 Minutes | 168 | 8.2% |
| 35 to 39 Minutes | 60 | 2.9% |
| 40 to 44 Minutes | 81 | 3.9% |
| 45 to 59 Minutes | 224 | 10.9% |
| 60 to 89 Minutes | 389 | 18.9% |
| 90 or more Minutes | 68 | 3.3% |
Commute Time by Sex in Hancock County
The most common commute times in Hancock County are 60 to 89 minutes (257 commuters, 26.2%) for males and 15 to 19 minutes (240 commuters, 22.3%) for females.
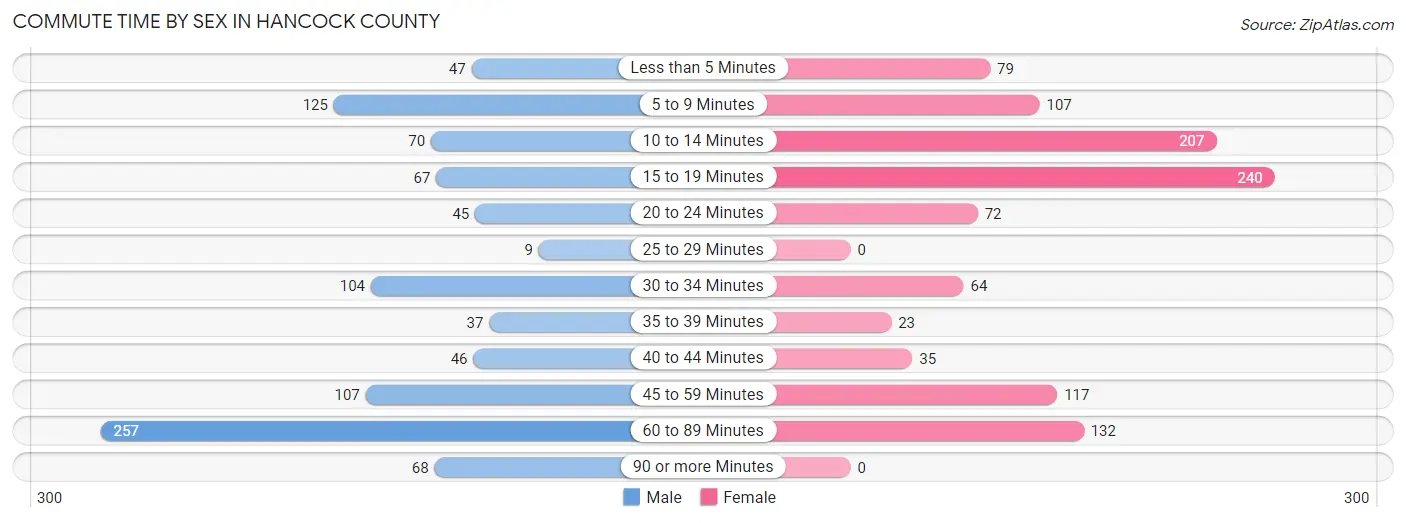
| Commute Time | Male | Female |
| Less than 5 Minutes | 47 (4.8%) | 79 (7.3%) |
| 5 to 9 Minutes | 125 (12.7%) | 107 (9.9%) |
| 10 to 14 Minutes | 70 (7.1%) | 207 (19.2%) |
| 15 to 19 Minutes | 67 (6.8%) | 240 (22.3%) |
| 20 to 24 Minutes | 45 (4.6%) | 72 (6.7%) |
| 25 to 29 Minutes | 9 (0.9%) | 0 (0.0%) |
| 30 to 34 Minutes | 104 (10.6%) | 64 (5.9%) |
| 35 to 39 Minutes | 37 (3.8%) | 23 (2.1%) |
| 40 to 44 Minutes | 46 (4.7%) | 35 (3.3%) |
| 45 to 59 Minutes | 107 (10.9%) | 117 (10.9%) |
| 60 to 89 Minutes | 257 (26.2%) | 132 (12.3%) |
| 90 or more Minutes | 68 (6.9%) | 0 (0.0%) |
Time of Departure to Work by Sex in Hancock County
The most frequent times of departure to work in Hancock County are 6:30 AM to 6:59 AM (120, 12.2%) for males and 7:30 AM to 7:59 AM (203, 18.9%) for females.
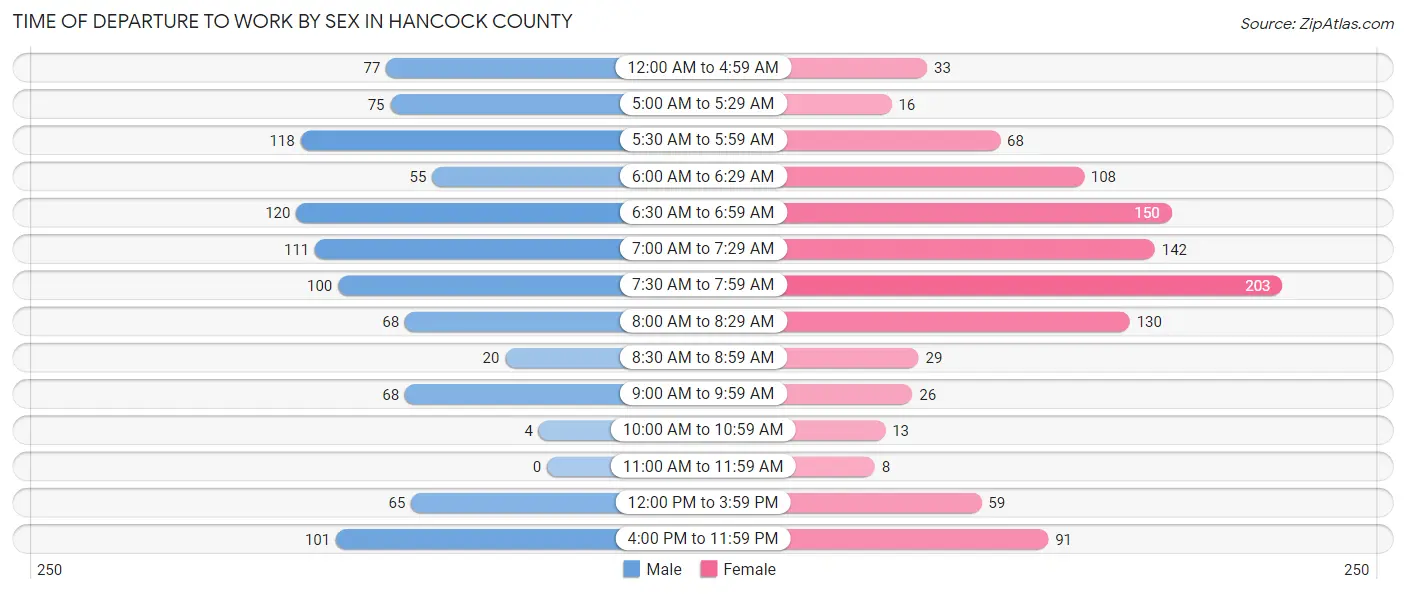
| Time of Departure | Male | Female |
| 12:00 AM to 4:59 AM | 77 (7.8%) | 33 (3.1%) |
| 5:00 AM to 5:29 AM | 75 (7.6%) | 16 (1.5%) |
| 5:30 AM to 5:59 AM | 118 (12.0%) | 68 (6.3%) |
| 6:00 AM to 6:29 AM | 55 (5.6%) | 108 (10.0%) |
| 6:30 AM to 6:59 AM | 120 (12.2%) | 150 (13.9%) |
| 7:00 AM to 7:29 AM | 111 (11.3%) | 142 (13.2%) |
| 7:30 AM to 7:59 AM | 100 (10.2%) | 203 (18.9%) |
| 8:00 AM to 8:29 AM | 68 (6.9%) | 130 (12.1%) |
| 8:30 AM to 8:59 AM | 20 (2.0%) | 29 (2.7%) |
| 9:00 AM to 9:59 AM | 68 (6.9%) | 26 (2.4%) |
| 10:00 AM to 10:59 AM | 4 (0.4%) | 13 (1.2%) |
| 11:00 AM to 11:59 AM | 0 (0.0%) | 8 (0.7%) |
| 12:00 PM to 3:59 PM | 65 (6.6%) | 59 (5.5%) |
| 4:00 PM to 11:59 PM | 101 (10.3%) | 91 (8.5%) |
| Total | 982 (100.0%) | 1,076 (100.0%) |
Housing Occupancy in Hancock County
Occupancy by Ownership in Hancock County
Of the total 2,829 dwellings in Hancock County, owner-occupied units account for 2,203 (77.9%), while renter-occupied units make up 626 (22.1%).

| Occupancy | # Housing Units | % Housing Units |
| Owner Occupied Housing Units | 2,203 | 77.9% |
| Renter-Occupied Housing Units | 626 | 22.1% |
| Total Occupied Housing Units | 2,829 | 100.0% |
Occupancy by Household Size in Hancock County
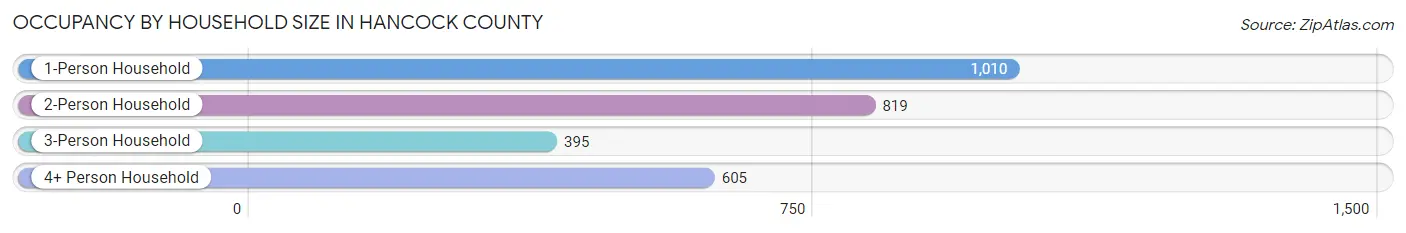
| Household Size | # Housing Units | % Housing Units |
| 1-Person Household | 1,010 | 35.7% |
| 2-Person Household | 819 | 28.9% |
| 3-Person Household | 395 | 14.0% |
| 4+ Person Household | 605 | 21.4% |
| Total Housing Units | 2,829 | 100.0% |
Occupancy by Ownership by Household Size in Hancock County
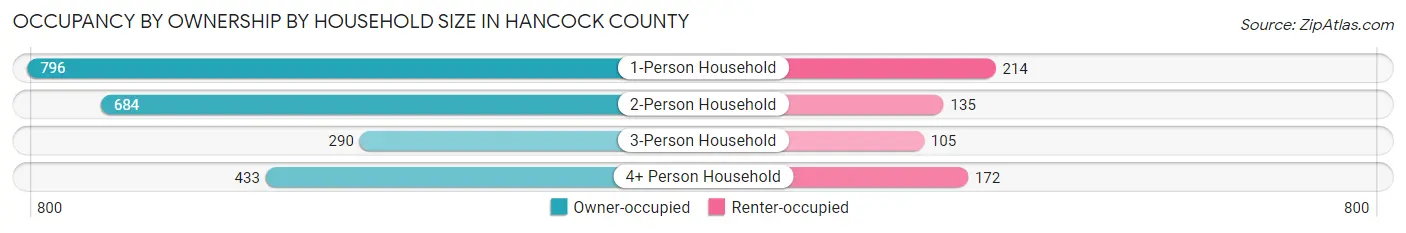
| Household Size | Owner-occupied | Renter-occupied |
| 1-Person Household | 796 (78.8%) | 214 (21.2%) |
| 2-Person Household | 684 (83.5%) | 135 (16.5%) |
| 3-Person Household | 290 (73.4%) | 105 (26.6%) |
| 4+ Person Household | 433 (71.6%) | 172 (28.4%) |
| Total Housing Units | 2,203 (77.9%) | 626 (22.1%) |
Occupancy by Educational Attainment in Hancock County
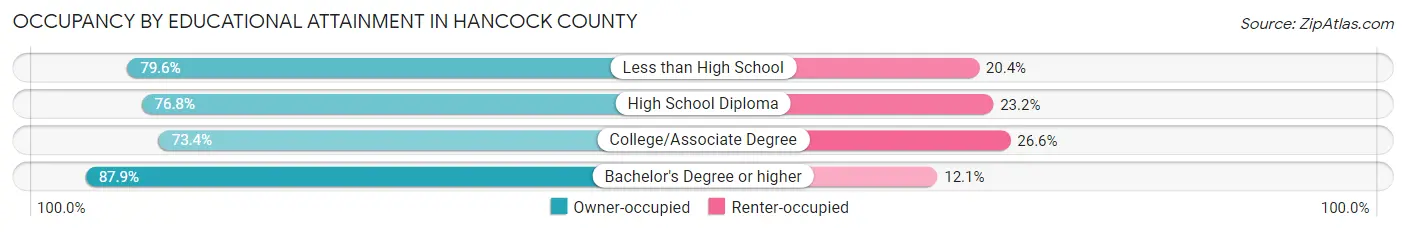
| Household Size | Owner-occupied | Renter-occupied |
| Less than High School | 469 (79.6%) | 120 (20.4%) |
| High School Diploma | 953 (76.8%) | 288 (23.2%) |
| College/Associate Degree | 491 (73.4%) | 178 (26.6%) |
| Bachelor's Degree or higher | 290 (87.9%) | 40 (12.1%) |
Occupancy by Age of Householder in Hancock County
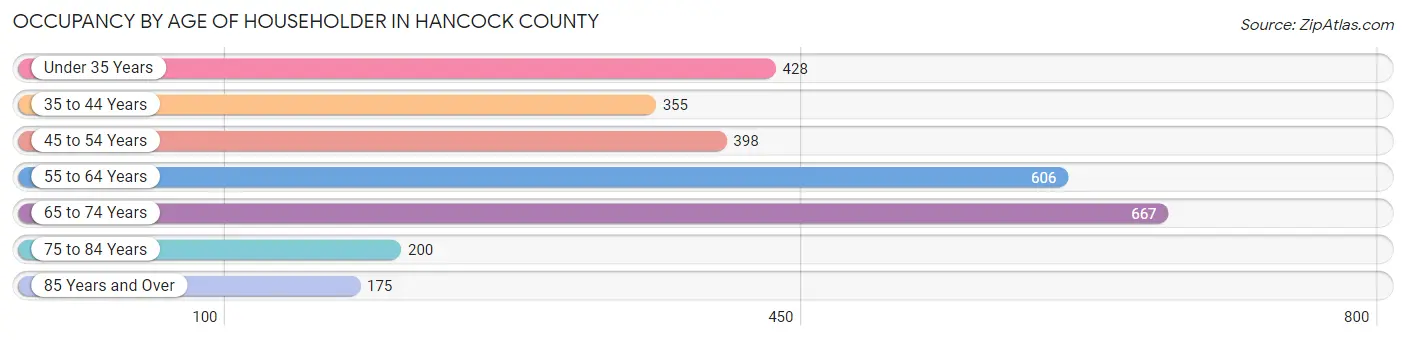
| Age Bracket | # Households | % Households |
| Under 35 Years | 428 | 15.1% |
| 35 to 44 Years | 355 | 12.6% |
| 45 to 54 Years | 398 | 14.1% |
| 55 to 64 Years | 606 | 21.4% |
| 65 to 74 Years | 667 | 23.6% |
| 75 to 84 Years | 200 | 7.1% |
| 85 Years and Over | 175 | 6.2% |
| Total | 2,829 | 100.0% |
Housing Finances in Hancock County
Median Income by Occupancy in Hancock County
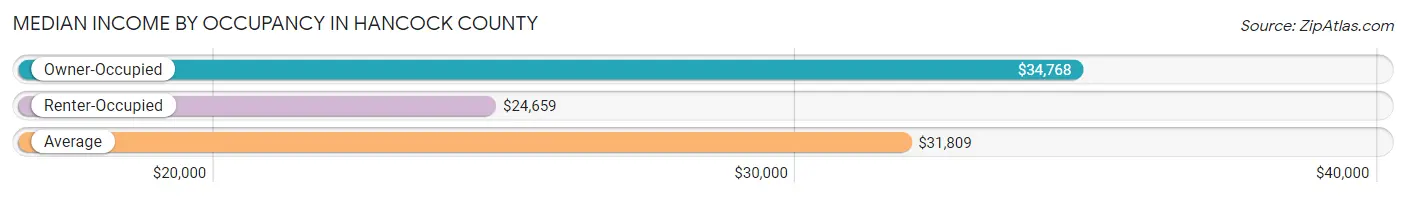
| Occupancy Type | # Households | Median Income |
| Owner-Occupied | 2,203 (77.9%) | $34,768 |
| Renter-Occupied | 626 (22.1%) | $24,659 |
| Average | 2,829 (100.0%) | $31,809 |
Occupancy by Householder Income Bracket in Hancock County
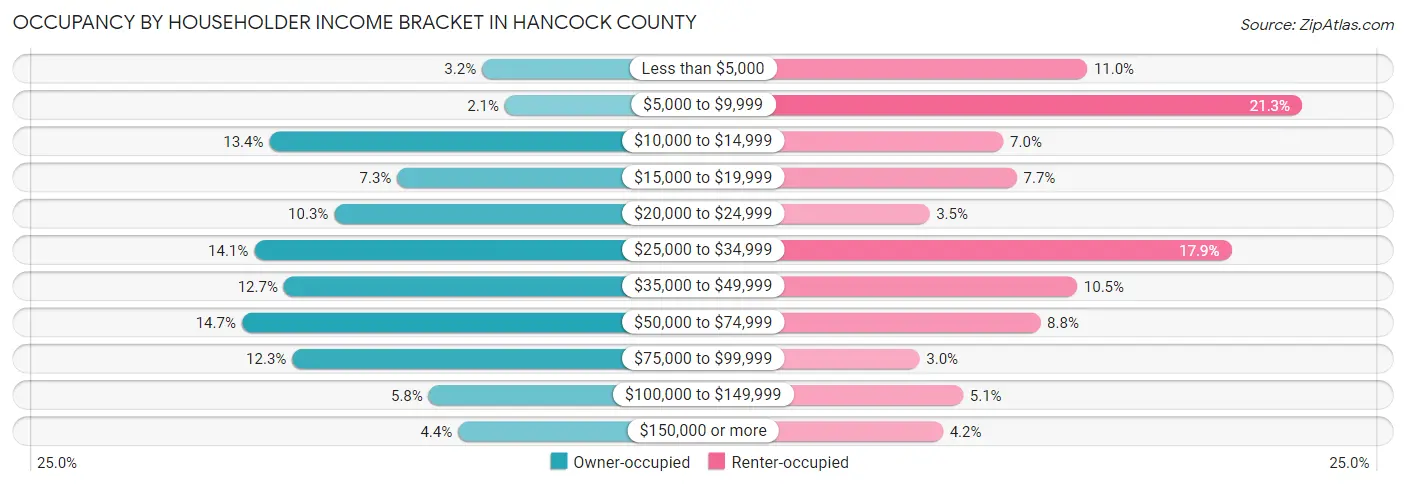
| Income Bracket | Owner-occupied | Renter-occupied |
| Less than $5,000 | 71 (3.2%) | 69 (11.0%) |
| $5,000 to $9,999 | 47 (2.1%) | 133 (21.2%) |
| $10,000 to $14,999 | 294 (13.4%) | 44 (7.0%) |
| $15,000 to $19,999 | 160 (7.3%) | 48 (7.7%) |
| $20,000 to $24,999 | 226 (10.3%) | 22 (3.5%) |
| $25,000 to $34,999 | 310 (14.1%) | 112 (17.9%) |
| $35,000 to $49,999 | 279 (12.7%) | 66 (10.5%) |
| $50,000 to $74,999 | 323 (14.7%) | 55 (8.8%) |
| $75,000 to $99,999 | 270 (12.3%) | 19 (3.0%) |
| $100,000 to $149,999 | 127 (5.8%) | 32 (5.1%) |
| $150,000 or more | 96 (4.4%) | 26 (4.2%) |
| Total | 2,203 (100.0%) | 626 (100.0%) |
Monthly Housing Cost Tiers in Hancock County
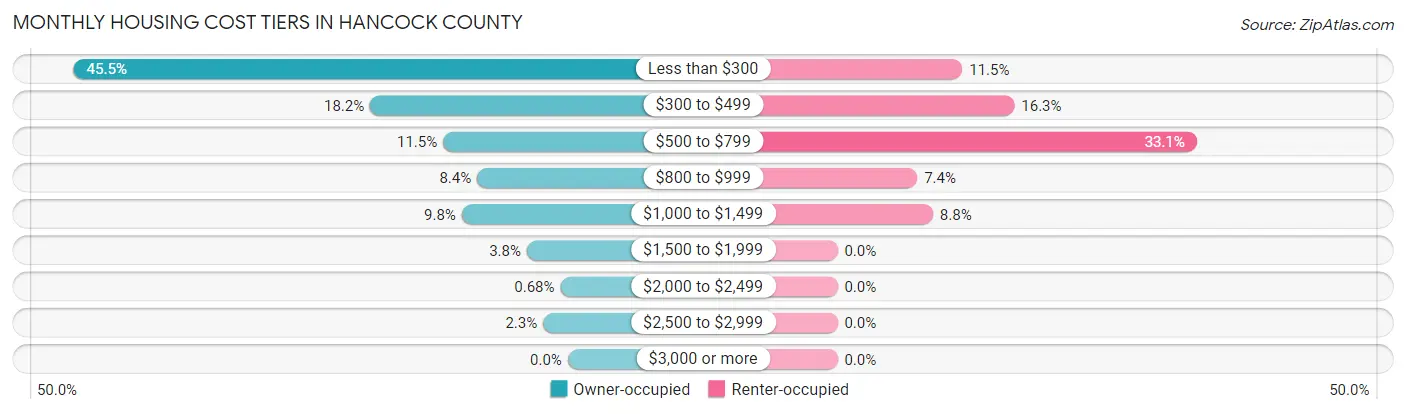
| Monthly Cost | Owner-occupied | Renter-occupied |
| Less than $300 | 1,002 (45.5%) | 72 (11.5%) |
| $300 to $499 | 401 (18.2%) | 102 (16.3%) |
| $500 to $799 | 253 (11.5%) | 207 (33.1%) |
| $800 to $999 | 184 (8.4%) | 46 (7.3%) |
| $1,000 to $1,499 | 215 (9.8%) | 55 (8.8%) |
| $1,500 to $1,999 | 83 (3.8%) | 0 (0.0%) |
| $2,000 to $2,499 | 15 (0.7%) | 0 (0.0%) |
| $2,500 to $2,999 | 50 (2.3%) | 0 (0.0%) |
| $3,000 or more | 0 (0.0%) | 0 (0.0%) |
| Total | 2,203 (100.0%) | 626 (100.0%) |
Physical Housing Characteristics in Hancock County
Housing Structures in Hancock County
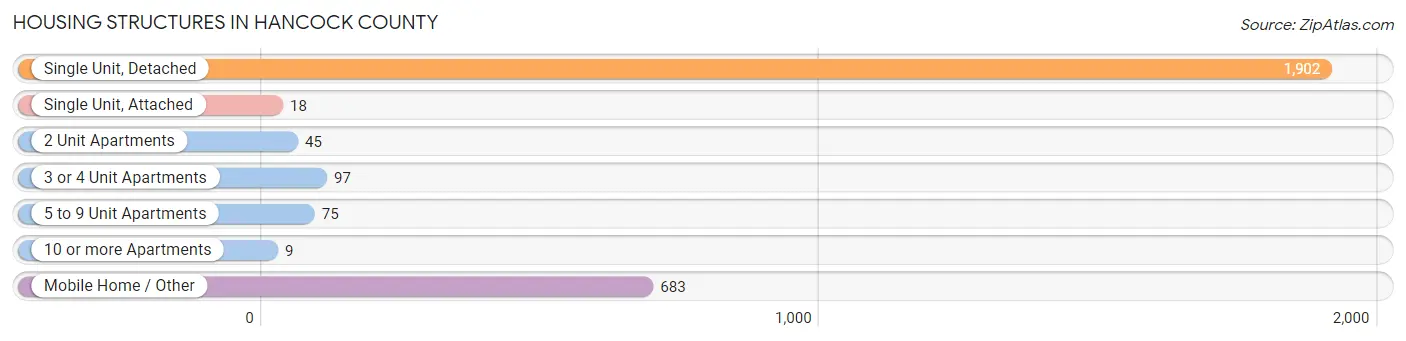
| Structure Type | # Housing Units | % Housing Units |
| Single Unit, Detached | 1,902 | 67.2% |
| Single Unit, Attached | 18 | 0.6% |
| 2 Unit Apartments | 45 | 1.6% |
| 3 or 4 Unit Apartments | 97 | 3.4% |
| 5 to 9 Unit Apartments | 75 | 2.6% |
| 10 or more Apartments | 9 | 0.3% |
| Mobile Home / Other | 683 | 24.1% |
| Total | 2,829 | 100.0% |
Housing Structures by Occupancy in Hancock County
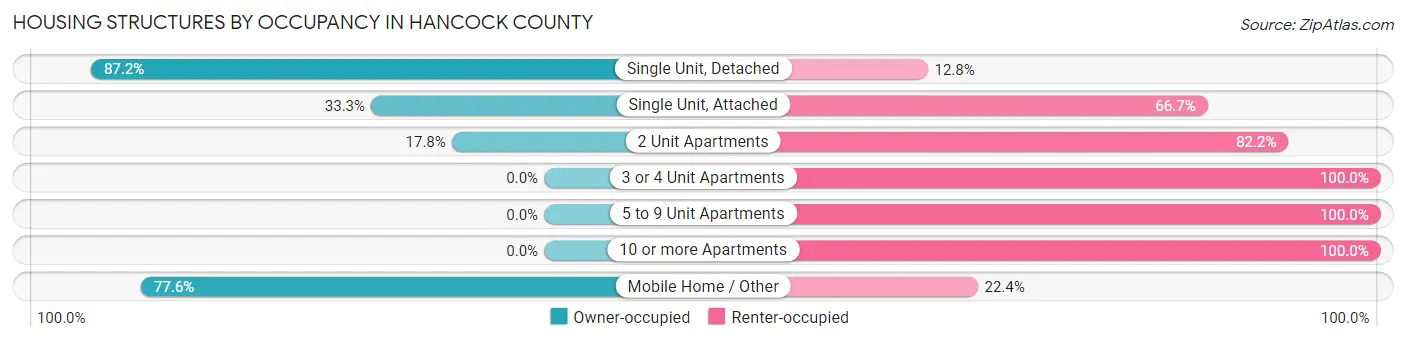
| Structure Type | Owner-occupied | Renter-occupied |
| Single Unit, Detached | 1,659 (87.2%) | 243 (12.8%) |
| Single Unit, Attached | 6 (33.3%) | 12 (66.7%) |
| 2 Unit Apartments | 8 (17.8%) | 37 (82.2%) |
| 3 or 4 Unit Apartments | 0 (0.0%) | 97 (100.0%) |
| 5 to 9 Unit Apartments | 0 (0.0%) | 75 (100.0%) |
| 10 or more Apartments | 0 (0.0%) | 9 (100.0%) |
| Mobile Home / Other | 530 (77.6%) | 153 (22.4%) |
| Total | 2,203 (77.9%) | 626 (22.1%) |
Housing Structures by Number of Rooms in Hancock County
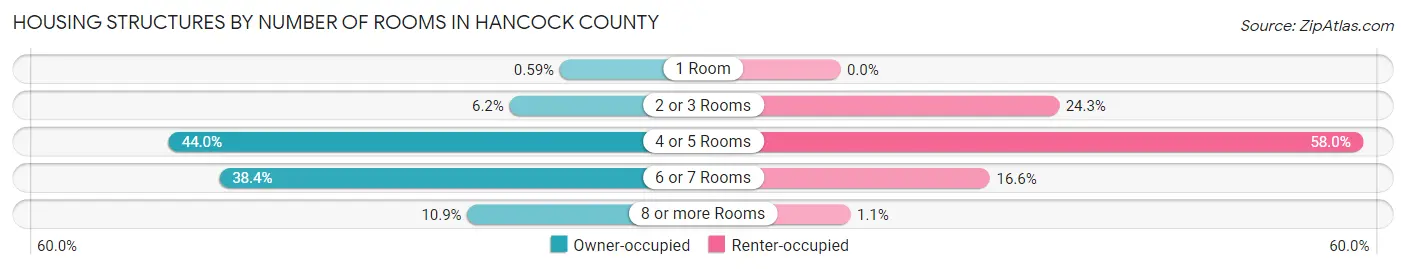
| Number of Rooms | Owner-occupied | Renter-occupied |
| 1 Room | 13 (0.6%) | 0 (0.0%) |
| 2 or 3 Rooms | 136 (6.2%) | 152 (24.3%) |
| 4 or 5 Rooms | 969 (44.0%) | 363 (58.0%) |
| 6 or 7 Rooms | 846 (38.4%) | 104 (16.6%) |
| 8 or more Rooms | 239 (10.8%) | 7 (1.1%) |
| Total | 2,203 (100.0%) | 626 (100.0%) |
Housing Structure by Heating Type in Hancock County
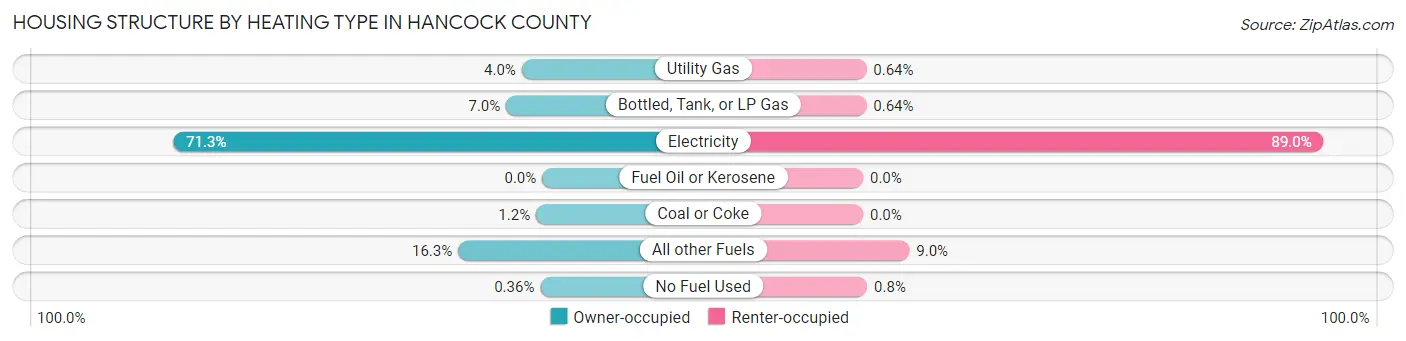
| Heating Type | Owner-occupied | Renter-occupied |
| Utility Gas | 87 (4.0%) | 4 (0.6%) |
| Bottled, Tank, or LP Gas | 153 (7.0%) | 4 (0.6%) |
| Electricity | 1,571 (71.3%) | 557 (89.0%) |
| Fuel Oil or Kerosene | 0 (0.0%) | 0 (0.0%) |
| Coal or Coke | 26 (1.2%) | 0 (0.0%) |
| All other Fuels | 358 (16.3%) | 56 (8.9%) |
| No Fuel Used | 8 (0.4%) | 5 (0.8%) |
| Total | 2,203 (100.0%) | 626 (100.0%) |
Household Vehicle Usage in Hancock County
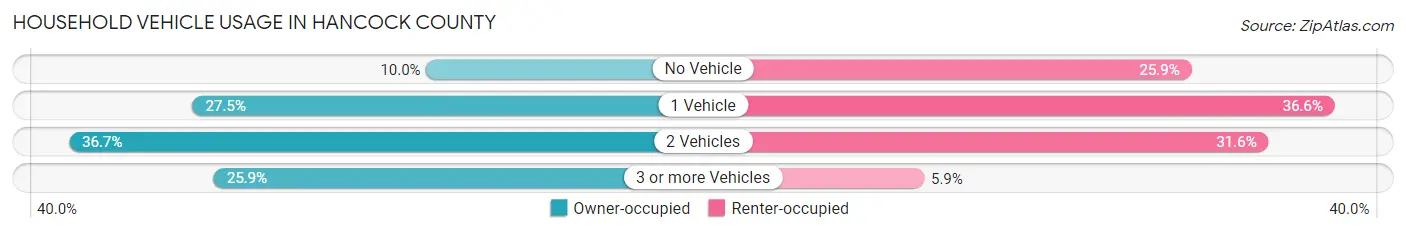
| Vehicles per Household | Owner-occupied | Renter-occupied |
| No Vehicle | 220 (10.0%) | 162 (25.9%) |
| 1 Vehicle | 605 (27.5%) | 229 (36.6%) |
| 2 Vehicles | 808 (36.7%) | 198 (31.6%) |
| 3 or more Vehicles | 570 (25.9%) | 37 (5.9%) |
| Total | 2,203 (100.0%) | 626 (100.0%) |
Real Estate & Mortgages in Hancock County
Real Estate and Mortgage Overview in Hancock County
| Characteristic | Without Mortgage | With Mortgage |
| Housing Units | 1,577 | 626 |
| Median Property Value | $87,400 | $139,000 |
| Median Household Income | $29,732 | $24 |
| Monthly Housing Costs | $273 | $0 |
| Real Estate Taxes | $420 | $20 |
Property Value by Mortgage Status in Hancock County
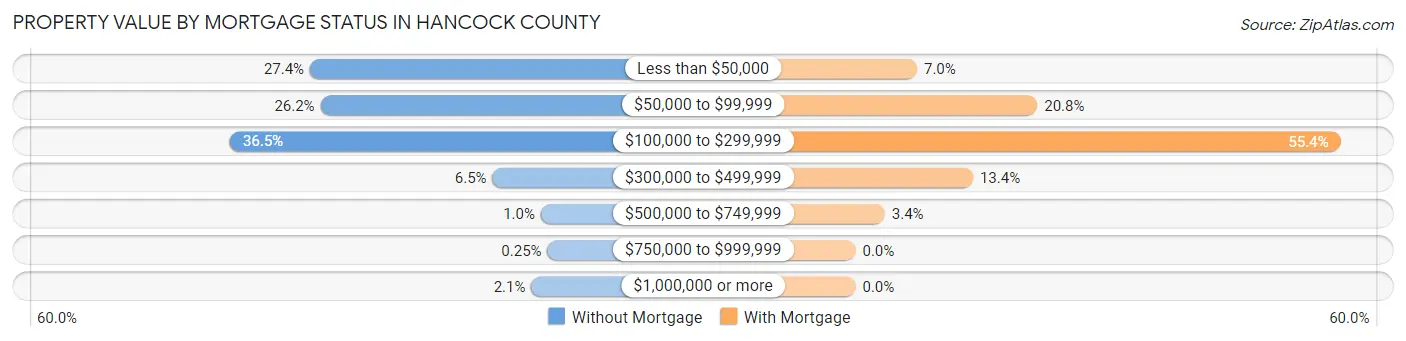
| Property Value | Without Mortgage | With Mortgage |
| Less than $50,000 | 432 (27.4%) | 44 (7.0%) |
| $50,000 to $99,999 | 413 (26.2%) | 130 (20.8%) |
| $100,000 to $299,999 | 576 (36.5%) | 347 (55.4%) |
| $300,000 to $499,999 | 103 (6.5%) | 84 (13.4%) |
| $500,000 to $749,999 | 16 (1.0%) | 21 (3.4%) |
| $750,000 to $999,999 | 4 (0.3%) | 0 (0.0%) |
| $1,000,000 or more | 33 (2.1%) | 0 (0.0%) |
| Total | 1,577 (100.0%) | 626 (100.0%) |
Household Income by Mortgage Status in Hancock County
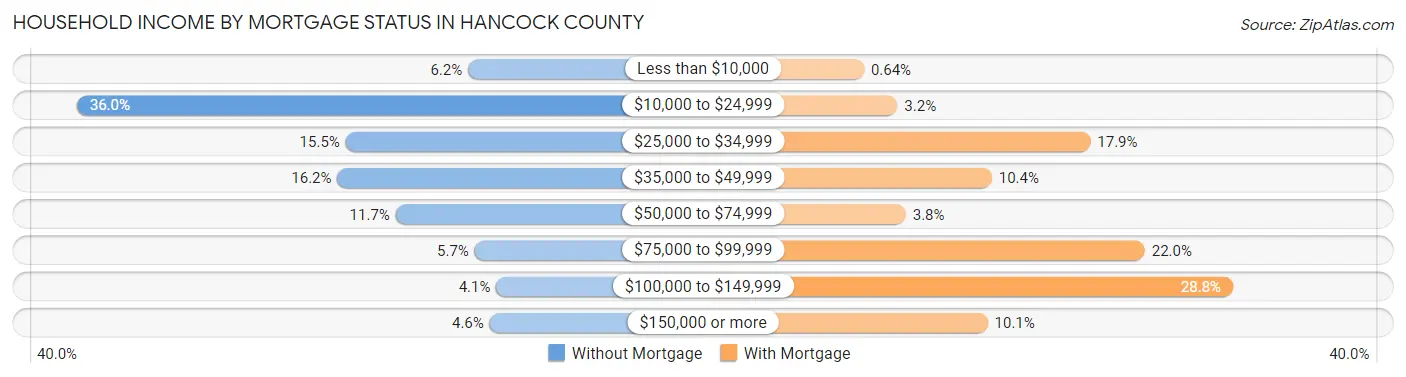
| Household Income | Without Mortgage | With Mortgage |
| Less than $10,000 | 98 (6.2%) | 4 (0.6%) |
| $10,000 to $24,999 | 568 (36.0%) | 20 (3.2%) |
| $25,000 to $34,999 | 245 (15.5%) | 112 (17.9%) |
| $35,000 to $49,999 | 255 (16.2%) | 65 (10.4%) |
| $50,000 to $74,999 | 185 (11.7%) | 24 (3.8%) |
| $75,000 to $99,999 | 90 (5.7%) | 138 (22.0%) |
| $100,000 to $149,999 | 64 (4.1%) | 180 (28.7%) |
| $150,000 or more | 72 (4.6%) | 63 (10.1%) |
| Total | 1,577 (100.0%) | 626 (100.0%) |
Property Value to Household Income Ratio in Hancock County
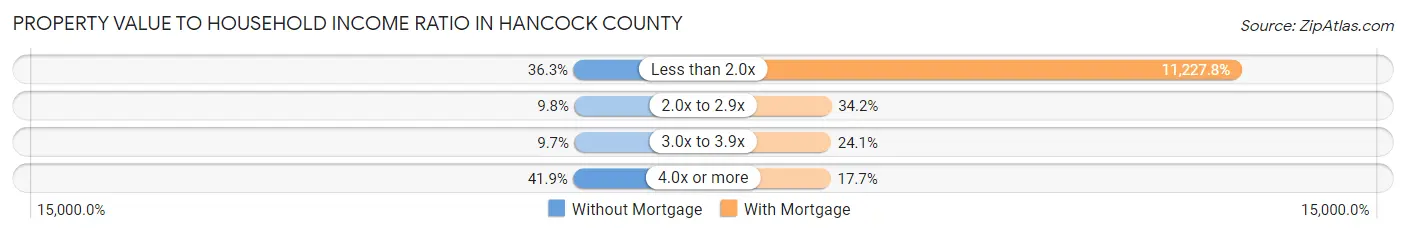
| Value-to-Income Ratio | Without Mortgage | With Mortgage |
| Less than 2.0x | 573 (36.3%) | 70,286 (11,227.8%) |
| 2.0x to 2.9x | 155 (9.8%) | 214 (34.2%) |
| 3.0x to 3.9x | 153 (9.7%) | 151 (24.1%) |
| 4.0x or more | 661 (41.9%) | 111 (17.7%) |
| Total | 1,577 (100.0%) | 626 (100.0%) |
Real Estate Taxes by Mortgage Status in Hancock County

| Property Taxes | Without Mortgage | With Mortgage |
| Less than $800 | 1,046 (66.3%) | 0 (0.0%) |
| $800 to $1,499 | 311 (19.7%) | 282 (45.1%) |
| $800 to $1,499 | 74 (4.7%) | 242 (38.7%) |
| Total | 1,577 (100.0%) | 626 (100.0%) |
Health & Disability in Hancock County
Health Insurance Coverage by Age in Hancock County
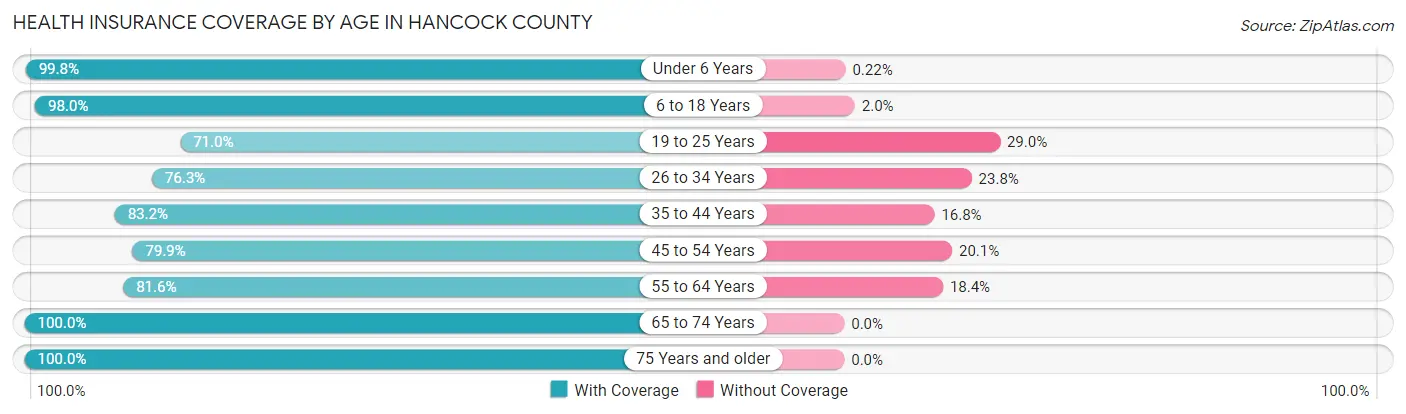
| Age Bracket | With Coverage | Without Coverage |
| Under 6 Years | 448 (99.8%) | 1 (0.2%) |
| 6 to 18 Years | 999 (98.0%) | 20 (2.0%) |
| 19 to 25 Years | 330 (71.0%) | 135 (29.0%) |
| 26 to 34 Years | 472 (76.2%) | 147 (23.7%) |
| 35 to 44 Years | 599 (83.2%) | 121 (16.8%) |
| 45 to 54 Years | 652 (79.9%) | 164 (20.1%) |
| 55 to 64 Years | 834 (81.6%) | 188 (18.4%) |
| 65 to 74 Years | 939 (100.0%) | 0 (0.0%) |
| 75 Years and older | 531 (100.0%) | 0 (0.0%) |
| Total | 5,804 (88.2%) | 776 (11.8%) |
Health Insurance Coverage by Citizenship Status in Hancock County
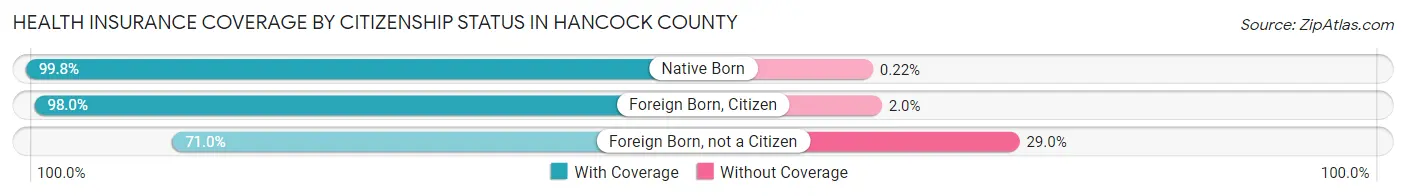
| Citizenship Status | With Coverage | Without Coverage |
| Native Born | 448 (99.8%) | 1 (0.2%) |
| Foreign Born, Citizen | 999 (98.0%) | 20 (2.0%) |
| Foreign Born, not a Citizen | 330 (71.0%) | 135 (29.0%) |
Health Insurance Coverage by Household Income in Hancock County
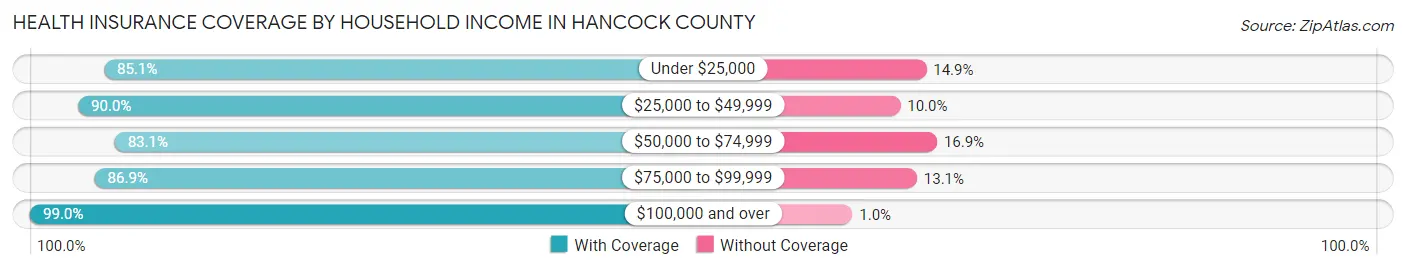
| Household Income | With Coverage | Without Coverage |
| Under $25,000 | 1,675 (85.1%) | 293 (14.9%) |
| $25,000 to $49,999 | 1,597 (90.0%) | 178 (10.0%) |
| $50,000 to $74,999 | 851 (83.1%) | 173 (16.9%) |
| $75,000 to $99,999 | 814 (86.9%) | 123 (13.1%) |
| $100,000 and over | 860 (99.0%) | 9 (1.0%) |
Public vs Private Health Insurance Coverage by Age in Hancock County
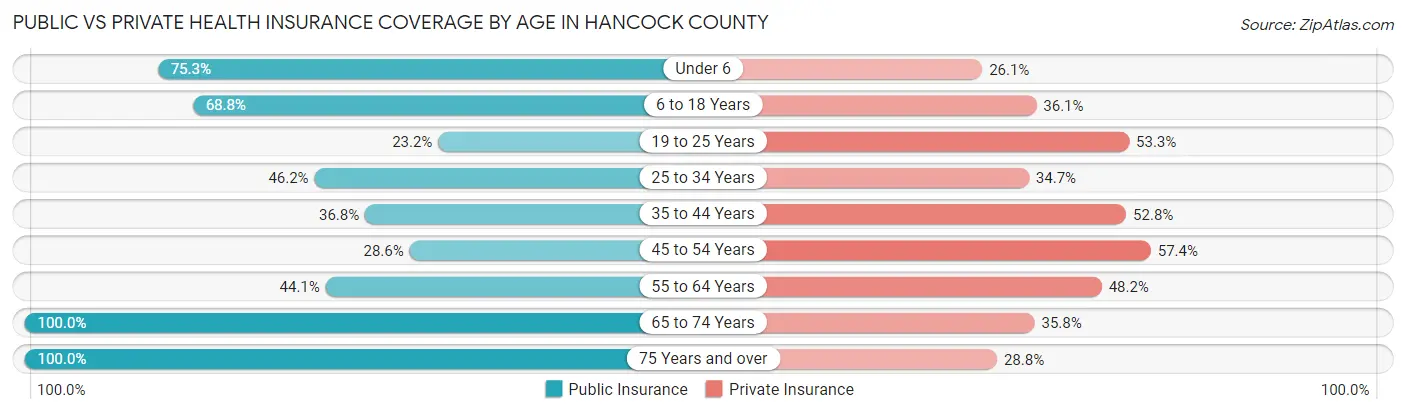
| Age Bracket | Public Insurance | Private Insurance |
| Under 6 | 338 (75.3%) | 117 (26.1%) |
| 6 to 18 Years | 701 (68.8%) | 368 (36.1%) |
| 19 to 25 Years | 108 (23.2%) | 248 (53.3%) |
| 25 to 34 Years | 286 (46.2%) | 215 (34.7%) |
| 35 to 44 Years | 265 (36.8%) | 380 (52.8%) |
| 45 to 54 Years | 233 (28.5%) | 468 (57.4%) |
| 55 to 64 Years | 451 (44.1%) | 493 (48.2%) |
| 65 to 74 Years | 939 (100.0%) | 336 (35.8%) |
| 75 Years and over | 531 (100.0%) | 153 (28.8%) |
| Total | 3,852 (58.5%) | 2,778 (42.2%) |
Disability Status by Sex by Age in Hancock County
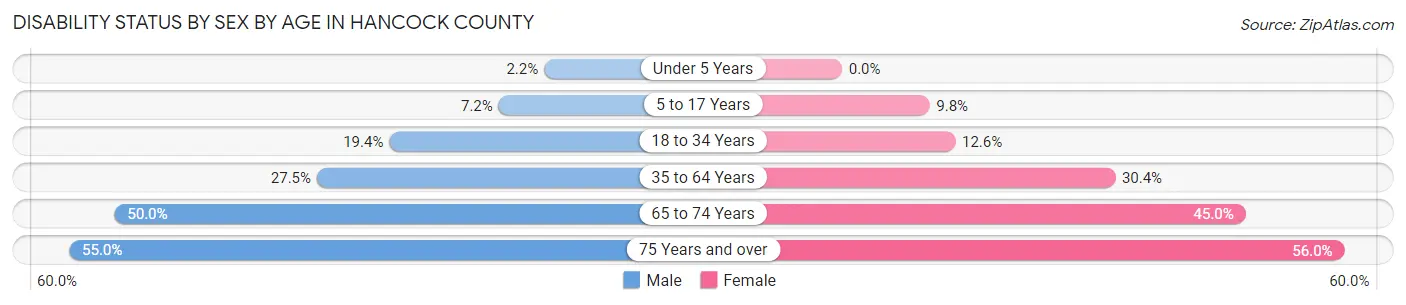
| Age Bracket | Male | Female |
| Under 5 Years | 4 (2.1%) | 0 (0.0%) |
| 5 to 17 Years | 36 (7.2%) | 54 (9.8%) |
| 18 to 34 Years | 108 (19.4%) | 73 (12.6%) |
| 35 to 64 Years | 344 (27.5%) | 397 (30.4%) |
| 65 to 74 Years | 236 (50.0%) | 210 (45.0%) |
| 75 Years and over | 131 (55.0%) | 164 (56.0%) |
Disability Class by Sex by Age in Hancock County
Disability Class: Hearing Difficulty

| Age Bracket | Male | Female |
| Under 5 Years | 0 (0.0%) | 0 (0.0%) |
| 5 to 17 Years | 7 (1.4%) | 1 (0.2%) |
| 18 to 34 Years | 8 (1.4%) | 0 (0.0%) |
| 35 to 64 Years | 108 (8.6%) | 67 (5.1%) |
| 65 to 74 Years | 155 (32.8%) | 45 (9.6%) |
| 75 Years and over | 115 (48.3%) | 74 (25.3%) |
Disability Class: Vision Difficulty
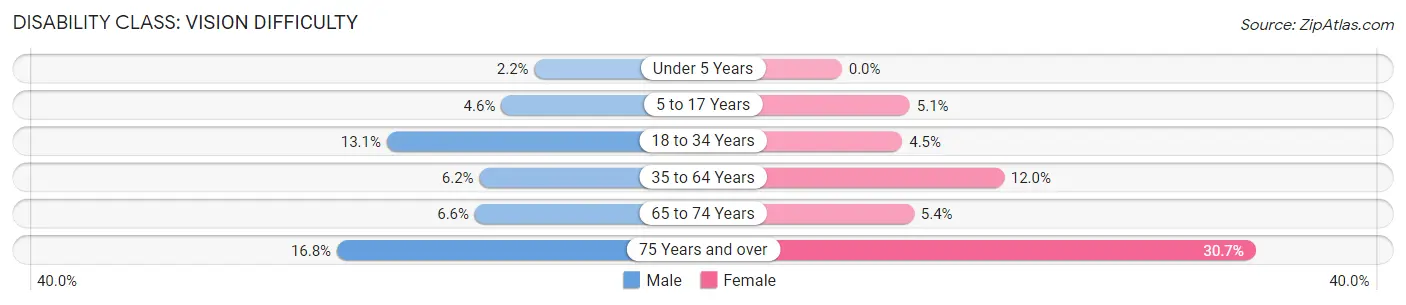
| Age Bracket | Male | Female |
| Under 5 Years | 4 (2.1%) | 0 (0.0%) |
| 5 to 17 Years | 23 (4.6%) | 28 (5.1%) |
| 18 to 34 Years | 73 (13.1%) | 26 (4.5%) |
| 35 to 64 Years | 78 (6.2%) | 157 (12.0%) |
| 65 to 74 Years | 31 (6.6%) | 25 (5.3%) |
| 75 Years and over | 40 (16.8%) | 90 (30.7%) |
Disability Class: Cognitive Difficulty
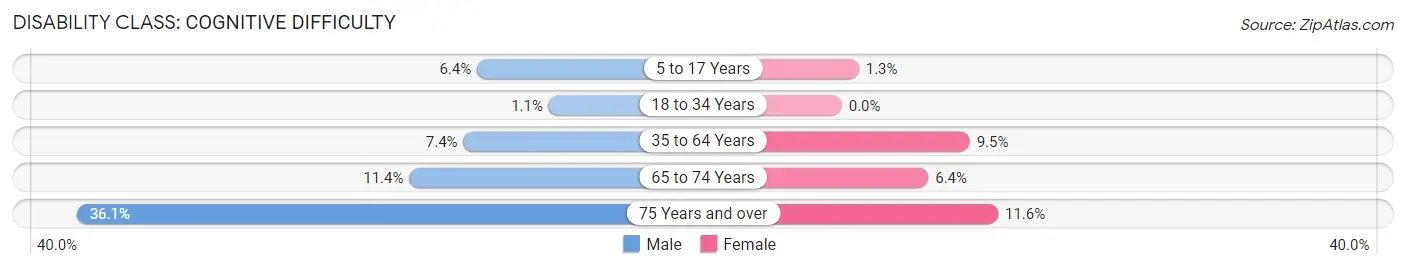
| Age Bracket | Male | Female |
| 5 to 17 Years | 32 (6.4%) | 7 (1.3%) |
| 18 to 34 Years | 6 (1.1%) | 0 (0.0%) |
| 35 to 64 Years | 93 (7.4%) | 124 (9.5%) |
| 65 to 74 Years | 54 (11.4%) | 30 (6.4%) |
| 75 Years and over | 86 (36.1%) | 34 (11.6%) |
Disability Class: Ambulatory Difficulty
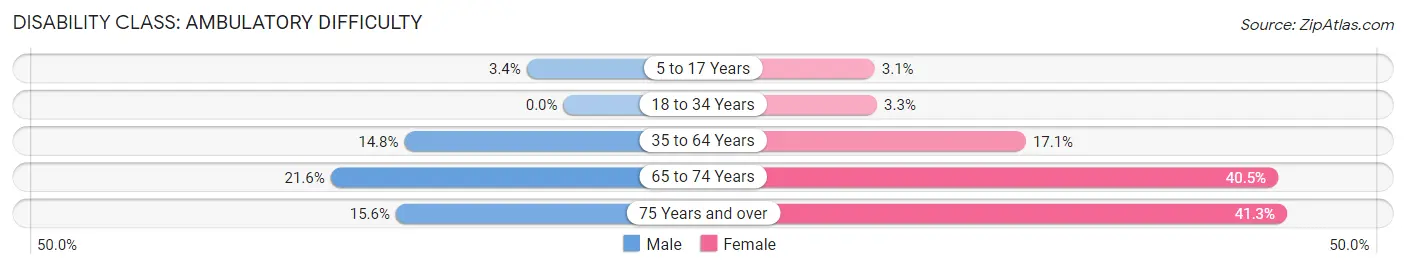
| Age Bracket | Male | Female |
| 5 to 17 Years | 17 (3.4%) | 17 (3.1%) |
| 18 to 34 Years | 0 (0.0%) | 19 (3.3%) |
| 35 to 64 Years | 185 (14.8%) | 223 (17.1%) |
| 65 to 74 Years | 102 (21.6%) | 189 (40.5%) |
| 75 Years and over | 37 (15.5%) | 121 (41.3%) |
Disability Class: Self-Care Difficulty
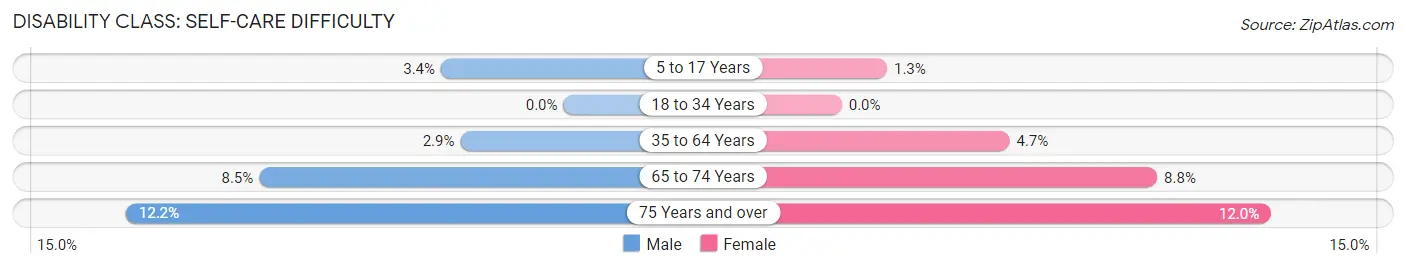
| Age Bracket | Male | Female |
| 5 to 17 Years | 17 (3.4%) | 7 (1.3%) |
| 18 to 34 Years | 0 (0.0%) | 0 (0.0%) |
| 35 to 64 Years | 36 (2.9%) | 61 (4.7%) |
| 65 to 74 Years | 40 (8.5%) | 41 (8.8%) |
| 75 Years and over | 29 (12.2%) | 35 (11.9%) |
Technology Access in Hancock County
Computing Device Access in Hancock County
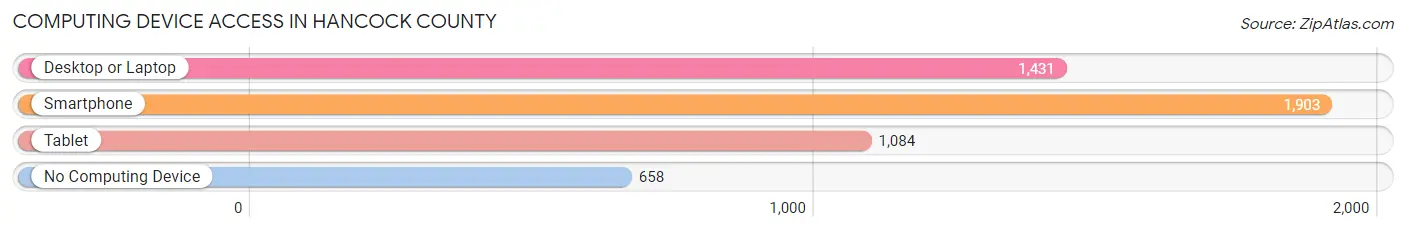
| Device Type | # Households | % Households |
| Desktop or Laptop | 1,431 | 50.6% |
| Smartphone | 1,903 | 67.3% |
| Tablet | 1,084 | 38.3% |
| No Computing Device | 658 | 23.3% |
| Total | 2,829 | 100.0% |
Internet Access in Hancock County
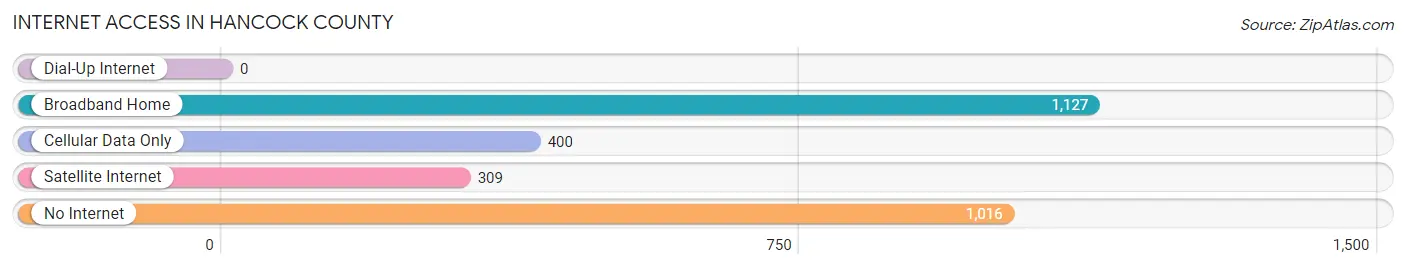
| Internet Type | # Households | % Households |
| Dial-Up Internet | 0 | 0.0% |
| Broadband Home | 1,127 | 39.8% |
| Cellular Data Only | 400 | 14.1% |
| Satellite Internet | 309 | 10.9% |
| No Internet | 1,016 | 35.9% |
| Total | 2,829 | 100.0% |
Hancock County Summary
Hancock County is located in the northeastern corner of Tennessee, and is part of the Appalachian region. It is bordered by Virginia to the north, Kentucky to the east, and North Carolina to the south. The county seat is Sneedville, and the county is named after John Hancock, the first signer of the Declaration of Independence.
Geography
Hancock County is located in the Appalachian Mountains, and is part of the Cumberland Plateau. The county is mostly mountainous, with elevations ranging from 1,000 to 3,000 feet. The highest point in the county is Clinch Mountain, which has an elevation of 3,000 feet. The county is drained by the Clinch River, which flows through the county from north to south. The county is also home to several state parks, including Big Ridge State Park, Frozen Head State Park, and Norris Dam State Park.
Demographics
As of the 2010 census, the population of Hancock County was 6,819. The population is predominantly white, with 95.3% of the population identifying as white. The remaining 4.7% of the population is made up of African Americans, Native Americans, Asians, and other races. The median household income in the county is $30,845, and the median age is 41.3 years.
Economy
Hancock County is largely rural, and the economy is largely based on agriculture. The county is home to several large farms, and the main crops grown in the county are corn, soybeans, and hay. The county is also home to several small businesses, including restaurants, retail stores, and service providers. The county is also home to several manufacturing companies, including a furniture factory and a paper mill.
History
Hancock County was formed in 1844 from parts of Hawkins and Claiborne Counties. The county was named after John Hancock, the first signer of the Declaration of Independence. The county seat was originally located in the town of Sneedville, which was named after the first settler in the area, William Sneed. The county was largely rural until the late 19th century, when the railroad was built through the county. This allowed for the development of several small towns, including Sneedville, Mooresburg, and Bulls Gap.
In the early 20th century, the county was home to several coal mines, which provided employment for many of the county’s residents. The coal industry declined in the mid-20th century, and the county’s economy shifted to agriculture. Today, Hancock County is largely rural, and the economy is based on agriculture and small businesses.
Common Questions
What is the Total Population of Hancock County?
Total Population of Hancock County is 6,726.
What is the Total Male Population of Hancock County?
Total Male Population of Hancock County is 3,312.
What is the Total Female Population of Hancock County?
Total Female Population of Hancock County is 3,414.
What is the Ratio of Males per 100 Females in Hancock County?
There are 97.01 Males per 100 Females in Hancock County.
What is the Ratio of Females per 100 Males in Hancock County?
There are 103.08 Females per 100 Males in Hancock County.
What is the Median Population Age in Hancock County?
Median Population Age in Hancock County is 44.9 Years.
What is the Average Family Size in Hancock County
Average Family Size in Hancock County is 3.0 People.
What is the Average Household Size in Hancock County
Average Household Size in Hancock County is 2.3 People.
What is Per Capita Income in Hancock County?
Per Capita income in Hancock County is $24,120.
What is the Median Family Income in Hancock County?
Median Family Income in Hancock County is $45,753.
What is the Median Household income in Hancock County?
Median Household Income in Hancock County is $31,809.
What is Income or Wage Gap in Hancock County?
Income or Wage Gap in Hancock County is 33.7%.
Women in Hancock County earn 66.3 cents for every dollar earned by a man.
What is Family Income Deficit in Hancock County?
Family Income Deficit in Hancock County is $10,216.
Families that are below poverty line in Hancock County earn $10,216 less on average than the poverty threshold level.
What is Inequality or Gini Index in Hancock County?
Inequality or Gini Index in Hancock County is 0.54.
How Large is the Labor Force in Hancock County?
There are 2,427 People in the Labor Forcein in Hancock County.
What is the Percentage of People in the Labor Force in Hancock County?
44.8% of People are in the Labor Force in Hancock County.
What is the Unemployment Rate in Hancock County?
Unemployment Rate in Hancock County is 10.1%.