Hamilton County, TN
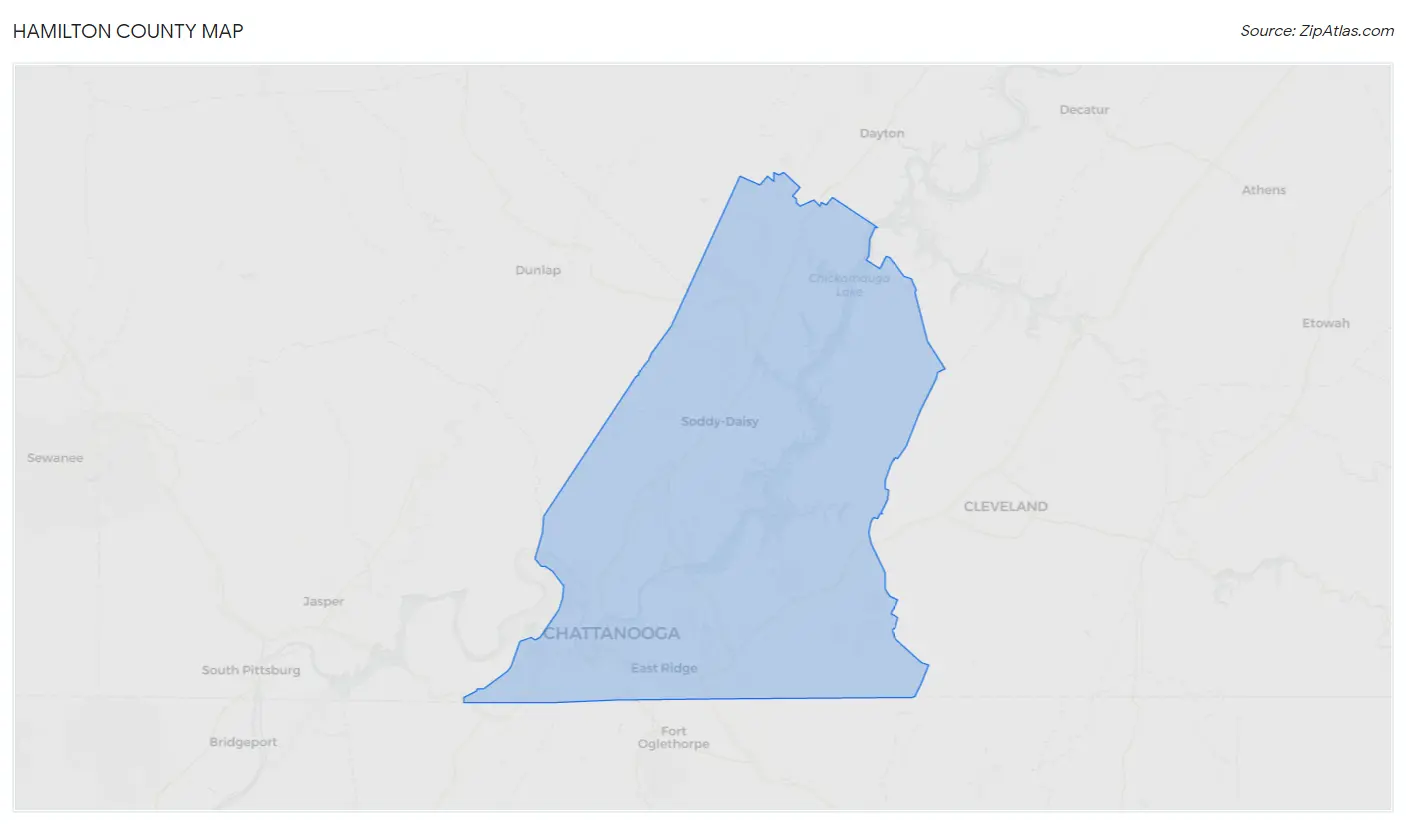
Hamilton County Map
Hamilton County Overview
367,193
TOTAL POPULATION
178,248
MALE POPULATION
188,945
FEMALE POPULATION
94.34
MALES / 100 FEMALES
106.00
FEMALES / 100 MALES
39.7
MEDIAN AGE
3.0
AVG FAMILY SIZE
2.4
AVG HOUSEHOLD SIZE
$41,198
PER CAPITA INCOME
$90,913
AVG FAMILY INCOME
$69,069
AVG HOUSEHOLD INCOME
26.5%
WAGE / INCOME GAP [ % ]
73.5¢/ $1
WAGE / INCOME GAP [ $ ]
$11,891
FAMILY INCOME DEFICIT
0.48
INEQUALITY / GINI INDEX
191,297
LABOR FORCE [ PEOPLE ]
63.8%
PERCENT IN LABOR FORCE
4.4%
UNEMPLOYMENT RATE
Hamilton County Area Codes
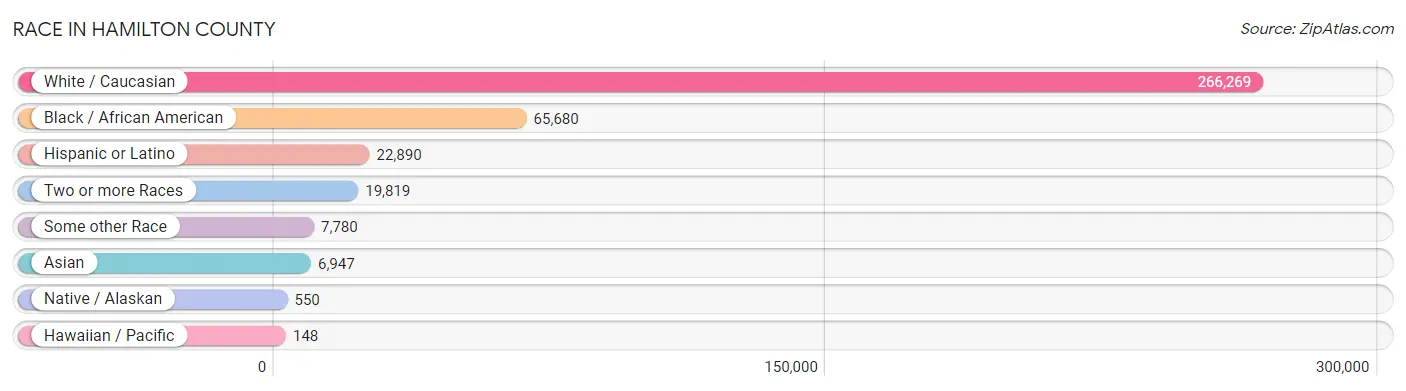
Race in Hamilton County
The most populous races in Hamilton County are White / Caucasian (266,269 | 72.5%), Black / African American (65,680 | 17.9%), and Hispanic or Latino (22,890 | 6.2%).
| Race | # Population | % Population |
| Asian | 6,947 | 1.9% |
| Black / African American | 65,680 | 17.9% |
| Hawaiian / Pacific | 148 | 0.0% |
| Hispanic or Latino | 22,890 | 6.2% |
| Native / Alaskan | 550 | 0.2% |
| White / Caucasian | 266,269 | 72.5% |
| Two or more Races | 19,819 | 5.4% |
| Some other Race | 7,780 | 2.1% |
| Total | 367,193 | 100.0% |
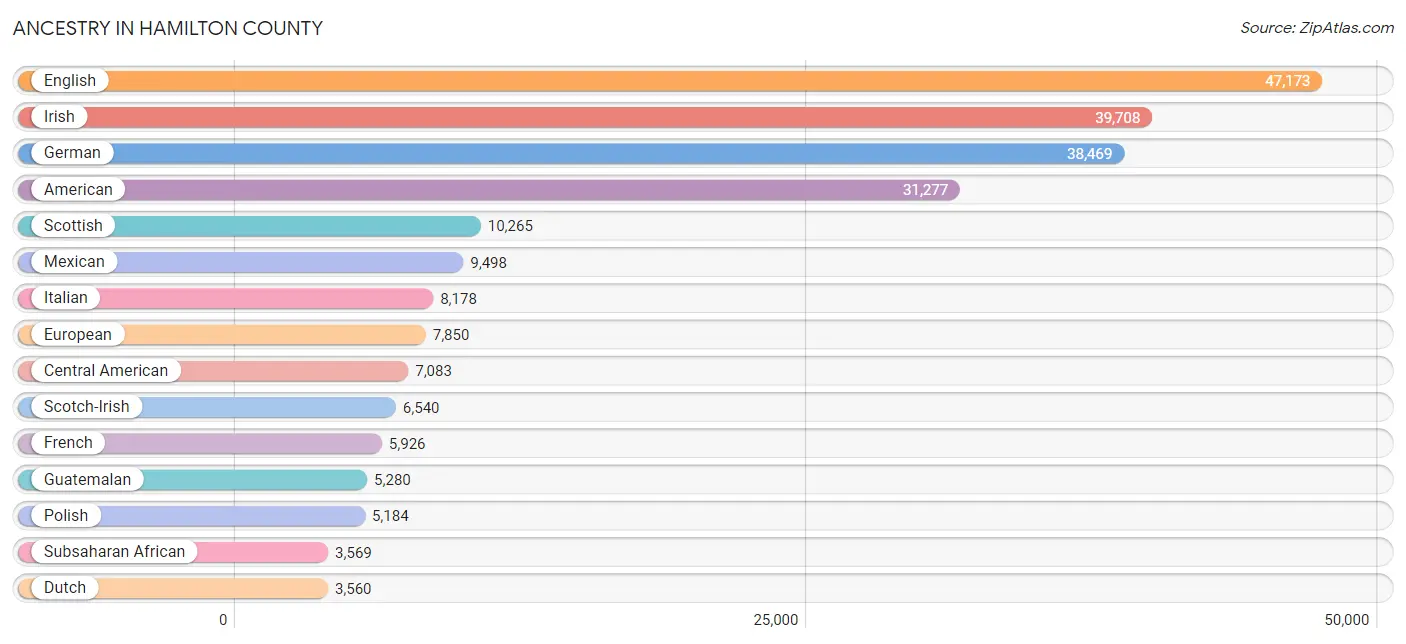
Ancestry in Hamilton County
The most populous ancestries reported in Hamilton County are English (47,173 | 12.9%), Irish (39,708 | 10.8%), German (38,469 | 10.5%), American (31,277 | 8.5%), and Scottish (10,265 | 2.8%), together accounting for 45.5% of all Hamilton County residents.
| Ancestry | # Population | % Population |
| African | 2,258 | 0.6% |
| Alaska Native | 50 | 0.0% |
| Alsatian | 14 | 0.0% |
| American | 31,277 | 8.5% |
| Apache | 16 | 0.0% |
| Arab | 1,015 | 0.3% |
| Argentinean | 191 | 0.1% |
| Armenian | 107 | 0.0% |
| Assyrian / Chaldean / Syriac | 5 | 0.0% |
| Australian | 52 | 0.0% |
| Austrian | 308 | 0.1% |
| Bahamian | 65 | 0.0% |
| Basque | 19 | 0.0% |
| Belgian | 88 | 0.0% |
| Belizean | 9 | 0.0% |
| Bhutanese | 687 | 0.2% |
| Blackfeet | 85 | 0.0% |
| Bolivian | 93 | 0.0% |
| Brazilian | 486 | 0.1% |
| British | 2,753 | 0.7% |
| British West Indian | 7 | 0.0% |
| Bulgarian | 31 | 0.0% |
| Burmese | 1,324 | 0.4% |
| Cajun | 139 | 0.0% |
| Cambodian | 58 | 0.0% |
| Canadian | 504 | 0.1% |
| Celtic | 60 | 0.0% |
| Central American | 7,083 | 1.9% |
| Central American Indian | 8 | 0.0% |
| Cherokee | 1,561 | 0.4% |
| Chickasaw | 176 | 0.1% |
| Chilean | 51 | 0.0% |
| Chippewa | 13 | 0.0% |
| Choctaw | 197 | 0.1% |
| Colombian | 390 | 0.1% |
| Comanche | 8 | 0.0% |
| Costa Rican | 23 | 0.0% |
| Cree | 6 | 0.0% |
| Creek | 381 | 0.1% |
| Croatian | 198 | 0.1% |
| Crow | 16 | 0.0% |
| Cuban | 481 | 0.1% |
| Czech | 643 | 0.2% |
| Czechoslovakian | 112 | 0.0% |
| Danish | 522 | 0.1% |
| Dominican | 413 | 0.1% |
| Dutch | 3,560 | 1.0% |
| Dutch West Indian | 72 | 0.0% |
| Eastern European | 412 | 0.1% |
| Ecuadorian | 220 | 0.1% |
| Egyptian | 153 | 0.0% |
| English | 47,173 | 12.9% |
| Ethiopian | 372 | 0.1% |
| European | 7,850 | 2.1% |
| Filipino | 103 | 0.0% |
| Finnish | 159 | 0.0% |
| French | 5,926 | 1.6% |
| French American Indian | 4 | 0.0% |
| French Canadian | 855 | 0.2% |
| German | 38,469 | 10.5% |
| German Russian | 4 | 0.0% |
| Greek | 802 | 0.2% |
| Guamanian / Chamorro | 93 | 0.0% |
| Guatemalan | 5,280 | 1.4% |
| Guyanese | 21 | 0.0% |
| Haitian | 1,101 | 0.3% |
| Honduran | 807 | 0.2% |
| Hungarian | 1,119 | 0.3% |
| Icelander | 47 | 0.0% |
| Indian (Asian) | 1,196 | 0.3% |
| Iranian | 421 | 0.1% |
| Irish | 39,708 | 10.8% |
| Iroquois | 16 | 0.0% |
| Israeli | 45 | 0.0% |
| Italian | 8,178 | 2.2% |
| Jamaican | 552 | 0.2% |
| Japanese | 178 | 0.1% |
| Jordanian | 8 | 0.0% |
| Kenyan | 131 | 0.0% |
| Korean | 1,959 | 0.5% |
| Laotian | 168 | 0.1% |
| Latvian | 24 | 0.0% |
| Lebanese | 284 | 0.1% |
| Liberian | 40 | 0.0% |
| Lithuanian | 341 | 0.1% |
| Lumbee | 11 | 0.0% |
| Luxembourger | 29 | 0.0% |
| Malaysian | 27 | 0.0% |
| Maltese | 49 | 0.0% |
| Menominee | 2 | 0.0% |
| Mexican | 9,498 | 2.6% |
| Mexican American Indian | 165 | 0.0% |
| Mongolian | 7 | 0.0% |
| Moroccan | 81 | 0.0% |
| Native Hawaiian | 223 | 0.1% |
| Navajo | 51 | 0.0% |
| New Zealander | 22 | 0.0% |
| Nicaraguan | 205 | 0.1% |
| Nigerian | 109 | 0.0% |
| Northern European | 565 | 0.2% |
| Norwegian | 1,888 | 0.5% |
| Okinawan | 9 | 0.0% |
| Osage | 4 | 0.0% |
| Pakistani | 73 | 0.0% |
| Palestinian | 34 | 0.0% |
| Panamanian | 116 | 0.0% |
| Paraguayan | 18 | 0.0% |
| Pennsylvania German | 52 | 0.0% |
| Peruvian | 729 | 0.2% |
| Polish | 5,184 | 1.4% |
| Portuguese | 382 | 0.1% |
| Potawatomi | 64 | 0.0% |
| Puerto Rican | 1,890 | 0.5% |
| Romanian | 263 | 0.1% |
| Russian | 980 | 0.3% |
| Salvadoran | 652 | 0.2% |
| Samoan | 120 | 0.0% |
| Scandinavian | 1,090 | 0.3% |
| Scotch-Irish | 6,540 | 1.8% |
| Scottish | 10,265 | 2.8% |
| Serbian | 121 | 0.0% |
| Sierra Leonean | 12 | 0.0% |
| Sioux | 32 | 0.0% |
| Slavic | 26 | 0.0% |
| Slovak | 398 | 0.1% |
| Slovene | 76 | 0.0% |
| Somali | 5 | 0.0% |
| South African | 86 | 0.0% |
| South American | 2,139 | 0.6% |
| South American Indian | 138 | 0.0% |
| Spaniard | 202 | 0.1% |
| Spanish | 514 | 0.1% |
| Sri Lankan | 1,117 | 0.3% |
| Subsaharan African | 3,569 | 1.0% |
| Sudanese | 308 | 0.1% |
| Swedish | 1,544 | 0.4% |
| Swiss | 860 | 0.2% |
| Syrian | 182 | 0.1% |
| Thai | 1,997 | 0.5% |
| Trinidadian and Tobagonian | 42 | 0.0% |
| Turkish | 20 | 0.0% |
| Ugandan | 8 | 0.0% |
| Ukrainian | 947 | 0.3% |
| Uruguayan | 30 | 0.0% |
| Ute | 30 | 0.0% |
| Venezuelan | 417 | 0.1% |
| Welsh | 3,159 | 0.9% |
| West Indian | 26 | 0.0% |
| Yugoslavian | 633 | 0.2% | View All 149 Rows |
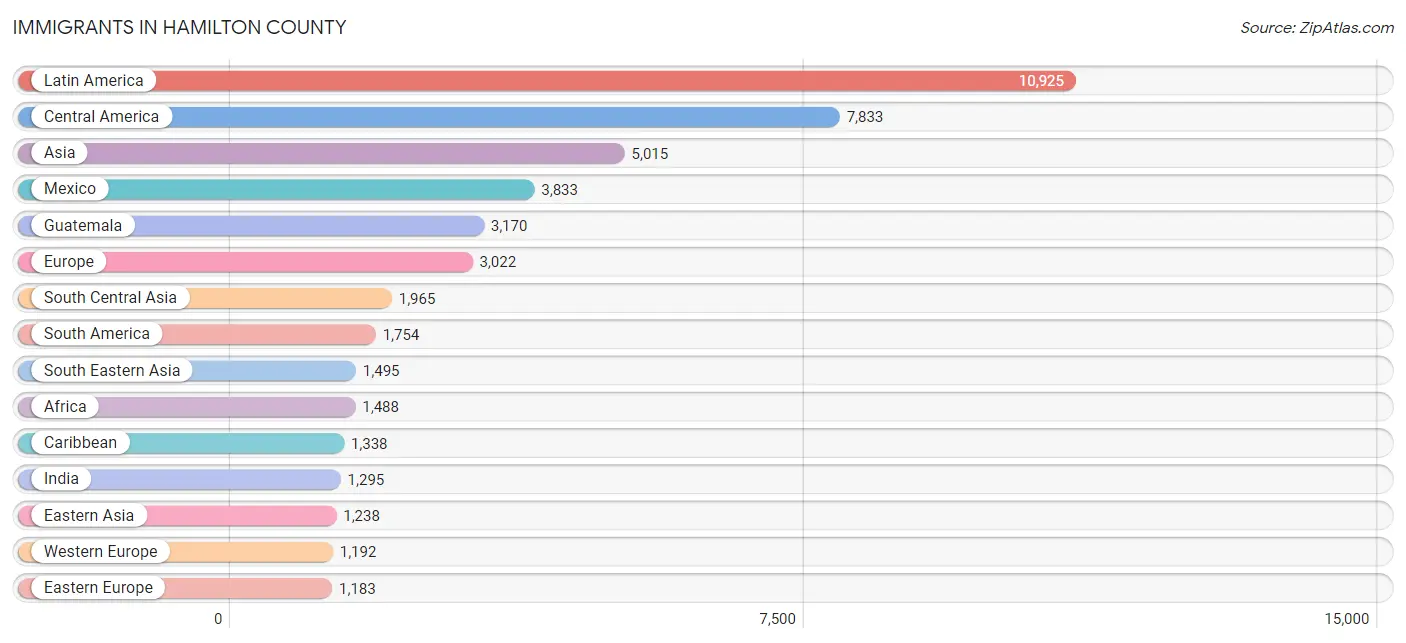
Immigrants in Hamilton County
The most numerous immigrant groups reported in Hamilton County came from Latin America (10,925 | 3.0%), Central America (7,833 | 2.1%), Asia (5,015 | 1.4%), Mexico (3,833 | 1.0%), and Guatemala (3,170 | 0.9%), together accounting for 8.4% of all Hamilton County residents.
| Immigration Origin | # Population | % Population |
| Africa | 1,488 | 0.4% |
| Argentina | 68 | 0.0% |
| Asia | 5,015 | 1.4% |
| Australia | 19 | 0.0% |
| Austria | 68 | 0.0% |
| Bahamas | 25 | 0.0% |
| Barbados | 16 | 0.0% |
| Bosnia and Herzegovina | 240 | 0.1% |
| Brazil | 360 | 0.1% |
| Bulgaria | 31 | 0.0% |
| Cambodia | 98 | 0.0% |
| Canada | 555 | 0.2% |
| Caribbean | 1,338 | 0.4% |
| Central America | 7,833 | 2.1% |
| Chile | 93 | 0.0% |
| China | 438 | 0.1% |
| Colombia | 159 | 0.0% |
| Costa Rica | 23 | 0.0% |
| Croatia | 42 | 0.0% |
| Cuba | 159 | 0.0% |
| Czechoslovakia | 30 | 0.0% |
| Denmark | 44 | 0.0% |
| Dominica | 10 | 0.0% |
| Dominican Republic | 166 | 0.1% |
| Eastern Africa | 290 | 0.1% |
| Eastern Asia | 1,238 | 0.3% |
| Eastern Europe | 1,183 | 0.3% |
| Ecuador | 222 | 0.1% |
| Egypt | 117 | 0.0% |
| El Salvador | 307 | 0.1% |
| England | 238 | 0.1% |
| Ethiopia | 91 | 0.0% |
| Europe | 3,022 | 0.8% |
| France | 190 | 0.1% |
| Germany | 887 | 0.2% |
| Greece | 10 | 0.0% |
| Guatemala | 3,170 | 0.9% |
| Guyana | 40 | 0.0% |
| Haiti | 705 | 0.2% |
| Honduras | 461 | 0.1% |
| India | 1,295 | 0.4% |
| Indonesia | 53 | 0.0% |
| Iran | 176 | 0.1% |
| Iraq | 104 | 0.0% |
| Ireland | 3 | 0.0% |
| Israel | 23 | 0.0% |
| Italy | 57 | 0.0% |
| Jamaica | 191 | 0.1% |
| Japan | 147 | 0.0% |
| Jordan | 25 | 0.0% |
| Kazakhstan | 20 | 0.0% |
| Kenya | 124 | 0.0% |
| Korea | 653 | 0.2% |
| Kuwait | 9 | 0.0% |
| Laos | 12 | 0.0% |
| Latin America | 10,925 | 3.0% |
| Latvia | 18 | 0.0% |
| Liberia | 11 | 0.0% |
| Lithuania | 15 | 0.0% |
| Malaysia | 43 | 0.0% |
| Mexico | 3,833 | 1.0% |
| Micronesia | 3 | 0.0% |
| Middle Africa | 14 | 0.0% |
| Moldova | 26 | 0.0% |
| Morocco | 69 | 0.0% |
| Nepal | 66 | 0.0% |
| Netherlands | 14 | 0.0% |
| Nicaragua | 39 | 0.0% |
| Nigeria | 8 | 0.0% |
| Northern Africa | 436 | 0.1% |
| Northern Europe | 451 | 0.1% |
| Oceania | 35 | 0.0% |
| Pakistan | 408 | 0.1% |
| Peru | 418 | 0.1% |
| Philippines | 618 | 0.2% |
| Poland | 73 | 0.0% |
| Portugal | 63 | 0.0% |
| Romania | 150 | 0.0% |
| Russia | 108 | 0.0% |
| Saudi Arabia | 16 | 0.0% |
| South Africa | 133 | 0.0% |
| South America | 1,754 | 0.5% |
| South Central Asia | 1,965 | 0.5% |
| South Eastern Asia | 1,495 | 0.4% |
| Southern Europe | 196 | 0.1% |
| Spain | 37 | 0.0% |
| Sudan | 250 | 0.1% |
| Sweden | 10 | 0.0% |
| Switzerland | 33 | 0.0% |
| Syria | 112 | 0.0% |
| Taiwan | 107 | 0.0% |
| Thailand | 41 | 0.0% |
| Turkey | 11 | 0.0% |
| Uganda | 8 | 0.0% |
| Ukraine | 292 | 0.1% |
| Uruguay | 3 | 0.0% |
| Venezuela | 373 | 0.1% |
| Vietnam | 605 | 0.2% |
| Western Africa | 169 | 0.1% |
| Western Asia | 300 | 0.1% |
| Western Europe | 1,192 | 0.3% |
| Zimbabwe | 12 | 0.0% | View All 102 Rows |
Sex and Age in Hamilton County
Sex and Age in Hamilton County
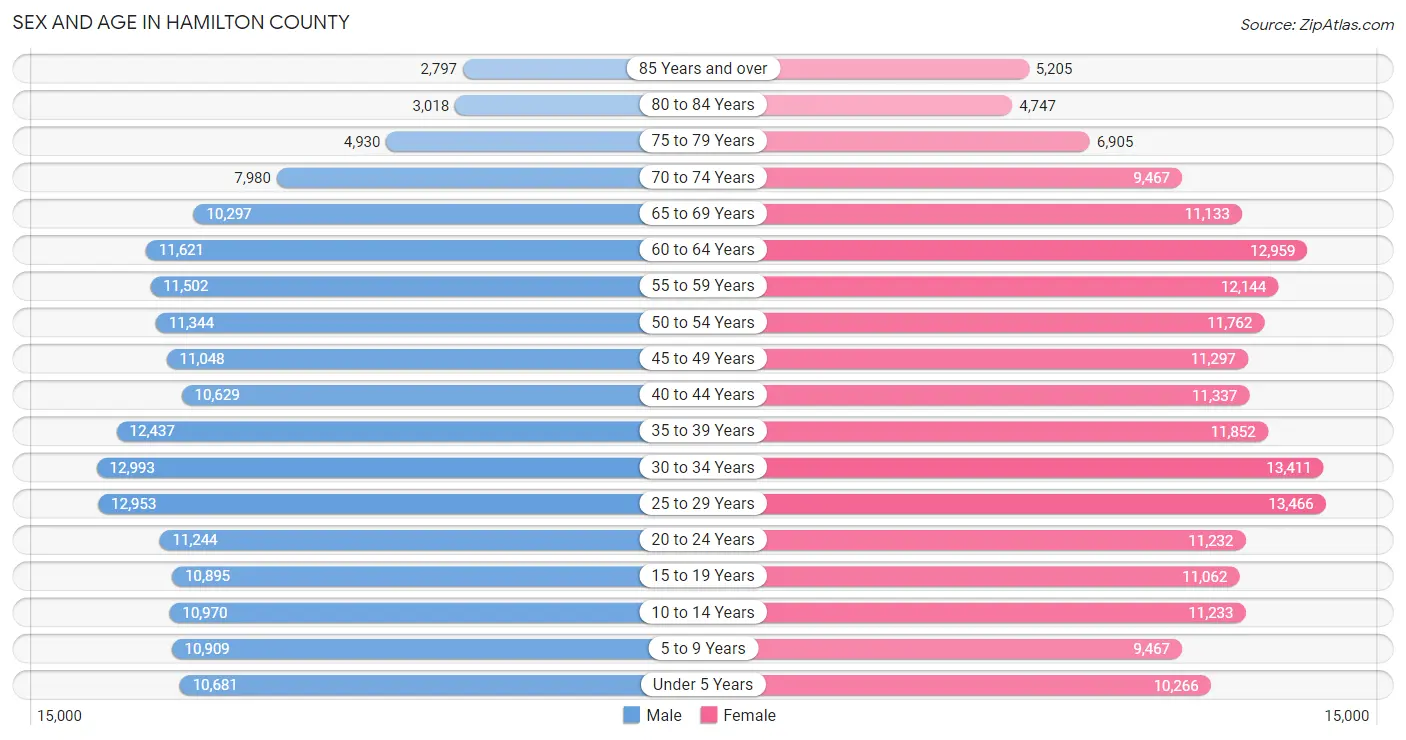
The most populous age groups in Hamilton County are 30 to 34 Years (12,993 | 7.3%) for men and 25 to 29 Years (13,466 | 7.1%) for women.
| Age Bracket | Male | Female |
| Under 5 Years | 10,681 (6.0%) | 10,266 (5.4%) |
| 5 to 9 Years | 10,909 (6.1%) | 9,467 (5.0%) |
| 10 to 14 Years | 10,970 (6.1%) | 11,233 (5.9%) |
| 15 to 19 Years | 10,895 (6.1%) | 11,062 (5.9%) |
| 20 to 24 Years | 11,244 (6.3%) | 11,232 (5.9%) |
| 25 to 29 Years | 12,953 (7.3%) | 13,466 (7.1%) |
| 30 to 34 Years | 12,993 (7.3%) | 13,411 (7.1%) |
| 35 to 39 Years | 12,437 (7.0%) | 11,852 (6.3%) |
| 40 to 44 Years | 10,629 (6.0%) | 11,337 (6.0%) |
| 45 to 49 Years | 11,048 (6.2%) | 11,297 (6.0%) |
| 50 to 54 Years | 11,344 (6.4%) | 11,762 (6.2%) |
| 55 to 59 Years | 11,502 (6.5%) | 12,144 (6.4%) |
| 60 to 64 Years | 11,621 (6.5%) | 12,959 (6.9%) |
| 65 to 69 Years | 10,297 (5.8%) | 11,133 (5.9%) |
| 70 to 74 Years | 7,980 (4.5%) | 9,467 (5.0%) |
| 75 to 79 Years | 4,930 (2.8%) | 6,905 (3.6%) |
| 80 to 84 Years | 3,018 (1.7%) | 4,747 (2.5%) |
| 85 Years and over | 2,797 (1.6%) | 5,205 (2.8%) |
| Total | 178,248 (100.0%) | 188,945 (100.0%) |
Families and Households in Hamilton County
Median Family Size in Hamilton County
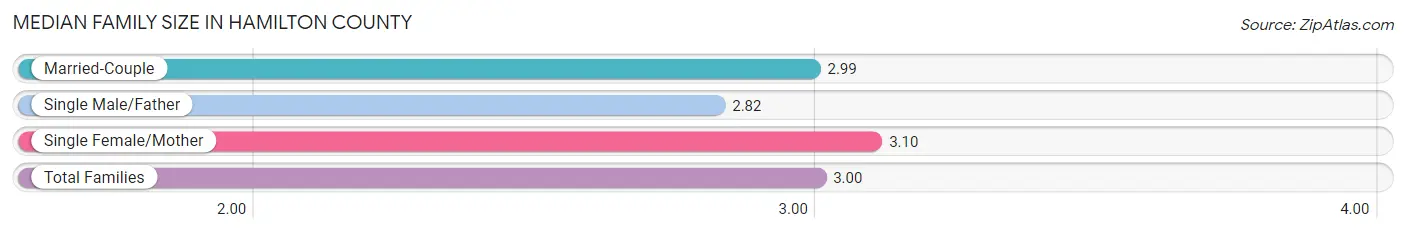
The median family size in Hamilton County is 3.00 persons per family, with single female/mother families (17,871 | 19.1%) accounting for the largest median family size of 3.1 persons per family. On the other hand, single male/father families (6,785 | 7.3%) represent the smallest median family size with 2.82 persons per family.
| Family Type | # Families | Family Size |
| Married-Couple | 68,801 (73.6%) | 2.99 |
| Single Male/Father | 6,785 (7.3%) | 2.82 |
| Single Female/Mother | 17,871 (19.1%) | 3.10 |
| Total Families | 93,457 (100.0%) | 3.00 |
Median Household Size in Hamilton County
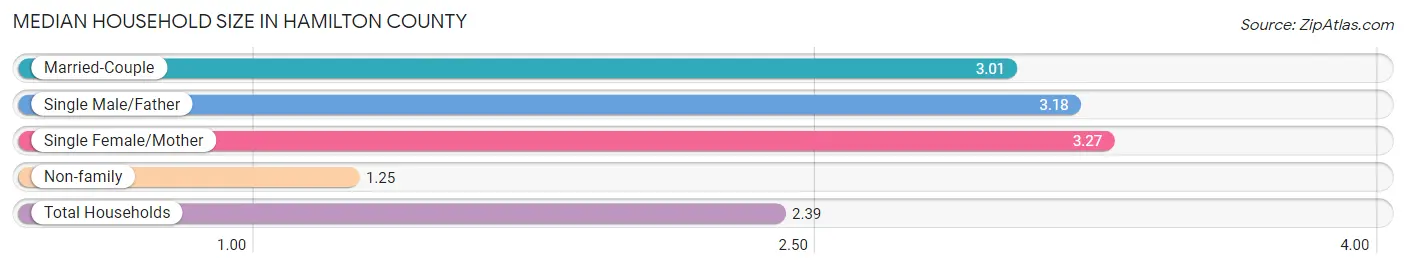
The median household size in Hamilton County is 2.39 persons per household, with single female/mother households (17,871 | 12.0%) accounting for the largest median household size of 3.27 persons per household. non-family households (55,431 | 37.2%) represent the smallest median household size with 1.25 persons per household.
| Household Type | # Households | Household Size |
| Married-Couple | 68,801 (46.2%) | 3.01 |
| Single Male/Father | 6,785 (4.6%) | 3.18 |
| Single Female/Mother | 17,871 (12.0%) | 3.27 |
| Non-family | 55,431 (37.2%) | 1.25 |
| Total Households | 148,888 (100.0%) | 2.39 |
Household Size by Marriage Status in Hamilton County
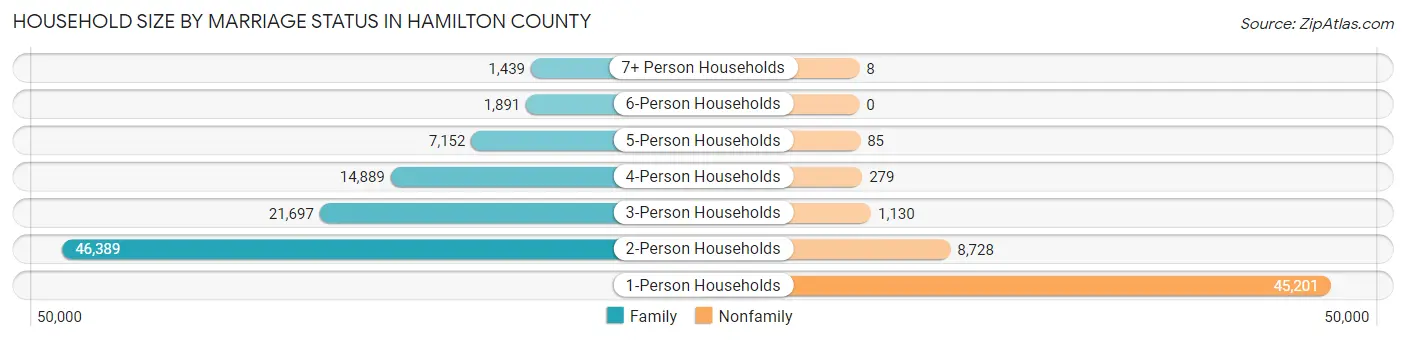
Out of a total of 148,888 households in Hamilton County, 93,457 (62.8%) are family households, while 55,431 (37.2%) are nonfamily households. The most numerous type of family households are 2-person households, comprising 46,389, and the most common type of nonfamily households are 1-person households, comprising 45,201.
| Household Size | Family Households | Nonfamily Households |
| 1-Person Households | - | 45,201 (30.4%) |
| 2-Person Households | 46,389 (31.2%) | 8,728 (5.9%) |
| 3-Person Households | 21,697 (14.6%) | 1,130 (0.8%) |
| 4-Person Households | 14,889 (10.0%) | 279 (0.2%) |
| 5-Person Households | 7,152 (4.8%) | 85 (0.1%) |
| 6-Person Households | 1,891 (1.3%) | 0 (0.0%) |
| 7+ Person Households | 1,439 (1.0%) | 8 (0.0%) |
| Total | 93,457 (62.8%) | 55,431 (37.2%) |
Female Fertility in Hamilton County
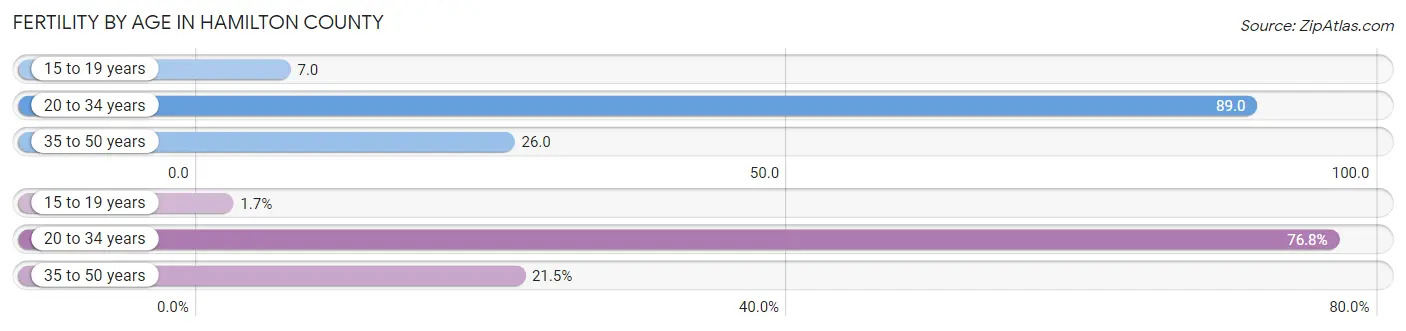
Fertility by Age in Hamilton County
Average fertility rate in Hamilton County is 51.0 births per 1,000 women. Women in the age bracket of 20 to 34 years have the highest fertility rate with 89.0 births per 1,000 women. Women in the age bracket of 20 to 34 years acount for 76.8% of all women with births.
| Age Bracket | Women with Births | Births / 1,000 Women |
| 15 to 19 years | 76 (1.7%) | 7.0 |
| 20 to 34 years | 3,402 (76.8%) | 89.0 |
| 35 to 50 years | 953 (21.5%) | 26.0 |
| Total | 4,431 (100.0%) | 51.0 |
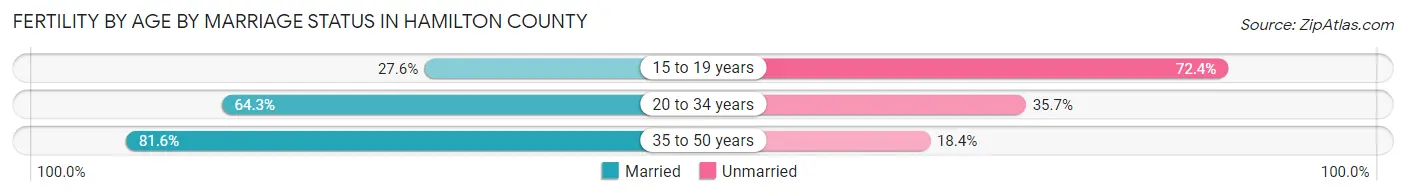
Fertility by Age by Marriage Status in Hamilton County
67.4% of women with births (4,431) in Hamilton County are married. The highest percentage of unmarried women with births falls into 15 to 19 years age bracket with 72.4% of them unmarried at the time of birth, while the lowest percentage of unmarried women with births belong to 35 to 50 years age bracket with 18.4% of them unmarried.
| Age Bracket | Married | Unmarried |
| 15 to 19 years | 21 (27.6%) | 55 (72.4%) |
| 20 to 34 years | 2,187 (64.3%) | 1,215 (35.7%) |
| 35 to 50 years | 778 (81.6%) | 175 (18.4%) |
| Total | 2,986 (67.4%) | 1,445 (32.6%) |
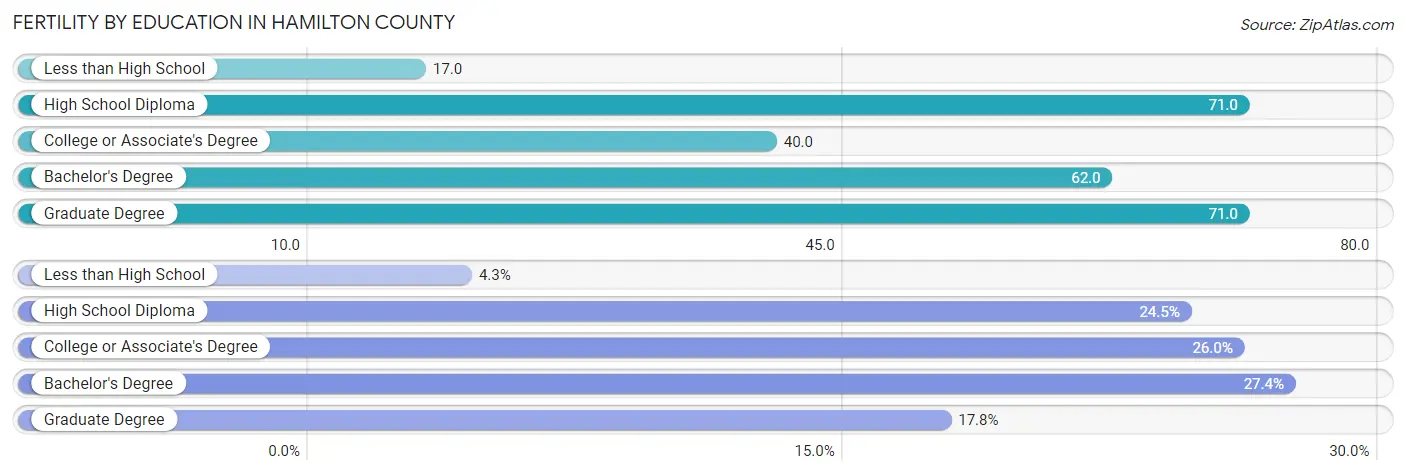
Fertility by Education in Hamilton County
Average fertility rate in Hamilton County is 51.0 births per 1,000 women. Women with the education attainment of high school diploma have the highest fertility rate of 71.0 births per 1,000 women, while women with the education attainment of less than high school have the lowest fertility at 17.0 births per 1,000 women. Women with the education attainment of bachelor's degree represent 27.4% of all women with births.
| Educational Attainment | Women with Births | Births / 1,000 Women |
| Less than High School | 190 (4.3%) | 17.0 |
| High School Diploma | 1,086 (24.5%) | 71.0 |
| College or Associate's Degree | 1,152 (26.0%) | 40.0 |
| Bachelor's Degree | 1,216 (27.4%) | 62.0 |
| Graduate Degree | 787 (17.8%) | 71.0 |
| Total | 4,431 (100.0%) | 51.0 |
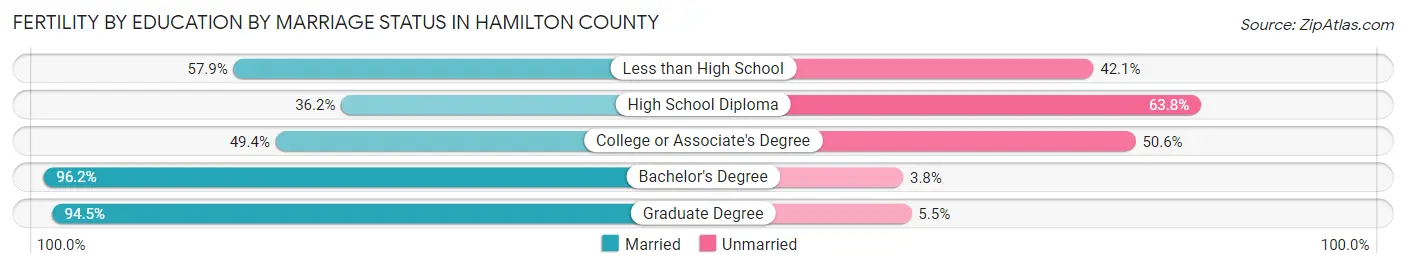
Fertility by Education by Marriage Status in Hamilton County
32.6% of women with births in Hamilton County are unmarried. Women with the educational attainment of bachelor's degree are most likely to be married with 96.2% of them married at childbirth, while women with the educational attainment of high school diploma are least likely to be married with 63.8% of them unmarried at childbirth.
| Educational Attainment | Married | Unmarried |
| Less than High School | 110 (57.9%) | 80 (42.1%) |
| High School Diploma | 393 (36.2%) | 693 (63.8%) |
| College or Associate's Degree | 569 (49.4%) | 583 (50.6%) |
| Bachelor's Degree | 1,170 (96.2%) | 46 (3.8%) |
| Graduate Degree | 744 (94.5%) | 43 (5.5%) |
| Total | 2,986 (67.4%) | 1,445 (32.6%) |
Income in Hamilton County
Income Overview in Hamilton County
Per Capita Income in Hamilton County is $41,198, while median incomes of families and households are $90,913 and $69,069 respectively.
| Characteristic | Number | Measure |
| Per Capita Income | 367,193 | $41,198 |
| Median Family Income | 93,457 | $90,913 |
| Mean Family Income | 93,457 | $121,586 |
| Median Household Income | 148,888 | $69,069 |
| Mean Household Income | 148,888 | $98,703 |
| Income Deficit | 93,457 | $11,891 |
| Wage / Income Gap (%) | 367,193 | 26.46% |
| Wage / Income Gap ($) | 367,193 | 73.54¢ per $1 |
| Gini / Inequality Index | 367,193 | 0.48 |
Earnings by Sex in Hamilton County
Average Earnings in Hamilton County are $40,296, $46,588 for men and $34,259 for women, a difference of 26.5%.
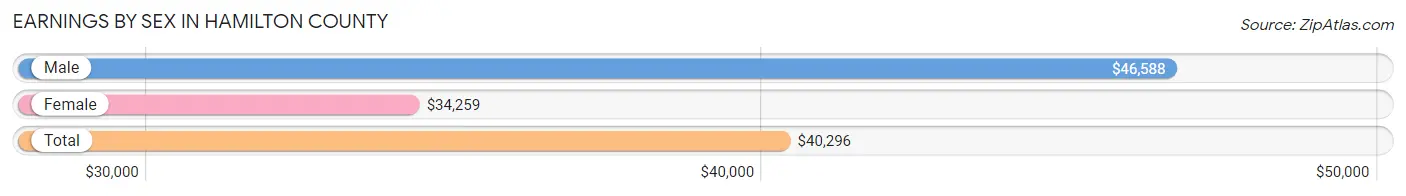
| Sex | Number | Average Earnings |
| Male | 104,774 (52.0%) | $46,588 |
| Female | 96,745 (48.0%) | $34,259 |
| Total | 201,519 (100.0%) | $40,296 |
Earnings by Sex by Income Bracket in Hamilton County
The most common earnings brackets in Hamilton County are $100,000+ for men (19,671 | 18.8%) and $55,000 to $64,999 for women (7,835 | 8.1%).
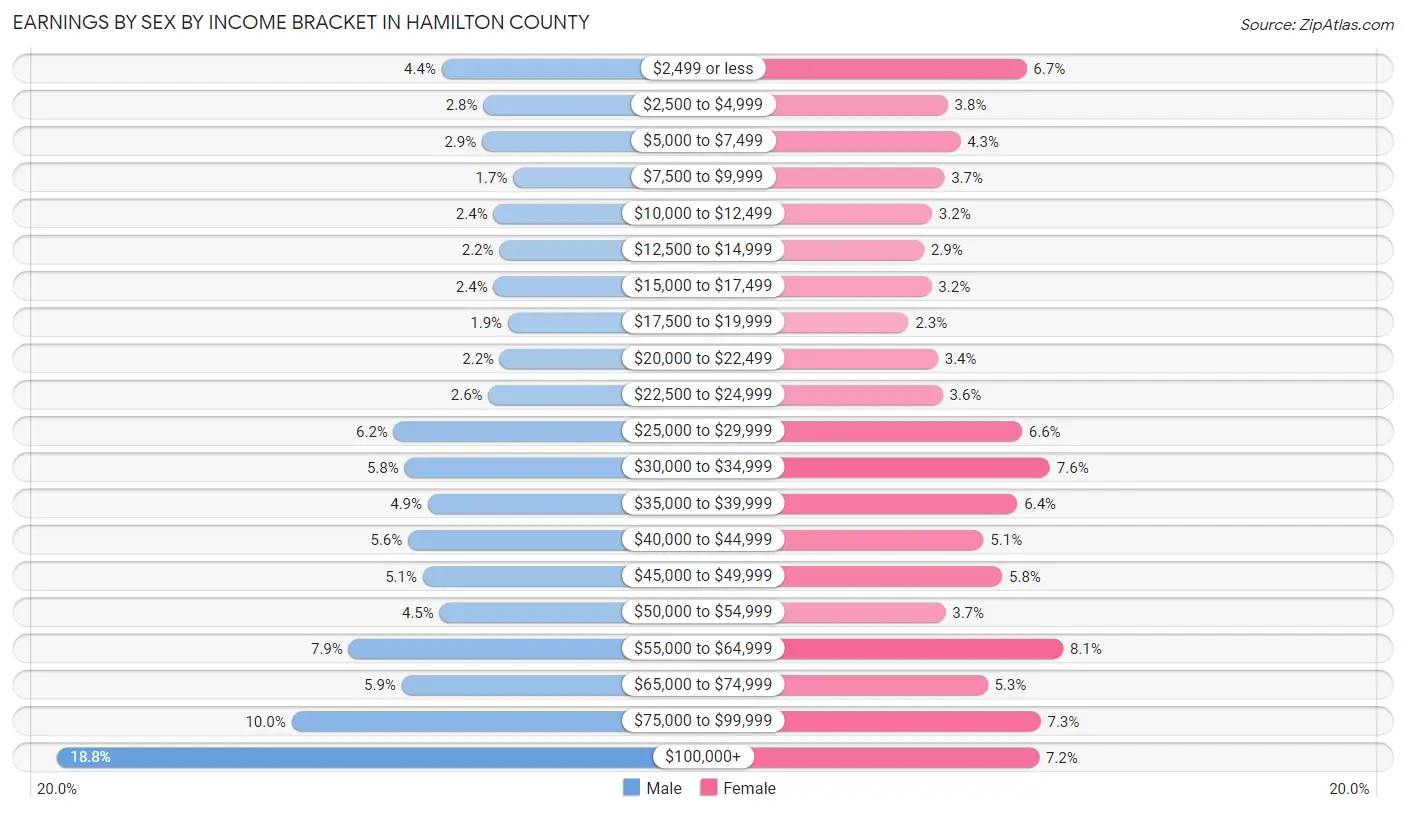
| Income | Male | Female |
| $2,499 or less | 4,577 (4.4%) | 6,511 (6.7%) |
| $2,500 to $4,999 | 2,946 (2.8%) | 3,657 (3.8%) |
| $5,000 to $7,499 | 2,997 (2.9%) | 4,110 (4.3%) |
| $7,500 to $9,999 | 1,772 (1.7%) | 3,531 (3.6%) |
| $10,000 to $12,499 | 2,548 (2.4%) | 3,090 (3.2%) |
| $12,500 to $14,999 | 2,314 (2.2%) | 2,797 (2.9%) |
| $15,000 to $17,499 | 2,551 (2.4%) | 3,067 (3.2%) |
| $17,500 to $19,999 | 1,984 (1.9%) | 2,234 (2.3%) |
| $20,000 to $22,499 | 2,294 (2.2%) | 3,303 (3.4%) |
| $22,500 to $24,999 | 2,741 (2.6%) | 3,469 (3.6%) |
| $25,000 to $29,999 | 6,464 (6.2%) | 6,351 (6.6%) |
| $30,000 to $34,999 | 6,039 (5.8%) | 7,360 (7.6%) |
| $35,000 to $39,999 | 5,125 (4.9%) | 6,183 (6.4%) |
| $40,000 to $44,999 | 5,898 (5.6%) | 4,949 (5.1%) |
| $45,000 to $49,999 | 5,320 (5.1%) | 5,635 (5.8%) |
| $50,000 to $54,999 | 4,667 (4.4%) | 3,569 (3.7%) |
| $55,000 to $64,999 | 8,236 (7.9%) | 7,835 (8.1%) |
| $65,000 to $74,999 | 6,154 (5.9%) | 5,098 (5.3%) |
| $75,000 to $99,999 | 10,476 (10.0%) | 7,027 (7.3%) |
| $100,000+ | 19,671 (18.8%) | 6,969 (7.2%) |
| Total | 104,774 (100.0%) | 96,745 (100.0%) |
Earnings by Sex by Educational Attainment in Hamilton County
Average earnings in Hamilton County are $53,361 for men and $39,278 for women, a difference of 26.4%. Men with an educational attainment of graduate degree enjoy the highest average annual earnings of $101,217, while those with less than high school education earn the least with $28,704. Women with an educational attainment of graduate degree earn the most with the average annual earnings of $60,715, while those with less than high school education have the smallest earnings of $22,907.
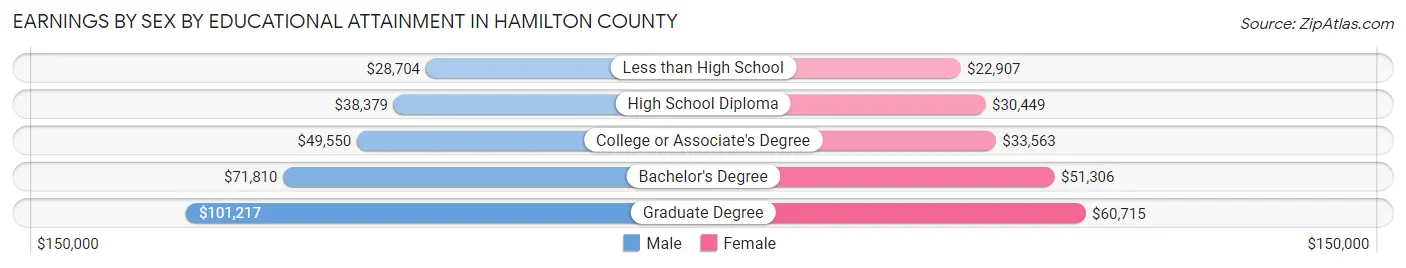
| Educational Attainment | Male Income | Female Income |
| Less than High School | $28,704 | $22,907 |
| High School Diploma | $38,379 | $30,449 |
| College or Associate's Degree | $49,550 | $33,563 |
| Bachelor's Degree | $71,810 | $51,306 |
| Graduate Degree | $101,217 | $60,715 |
| Total | $53,361 | $39,278 |
Family Income in Hamilton County
Family Income Brackets in Hamilton County
According to the Hamilton County family income data, there are 20,000 families falling into the $100,000 to $149,999 income range, which is the most common income bracket and makes up 21.4% of all families. Conversely, the $10,000 to $14,999 income bracket is the least frequent group with only 1,776 families (1.9%) belonging to this category.
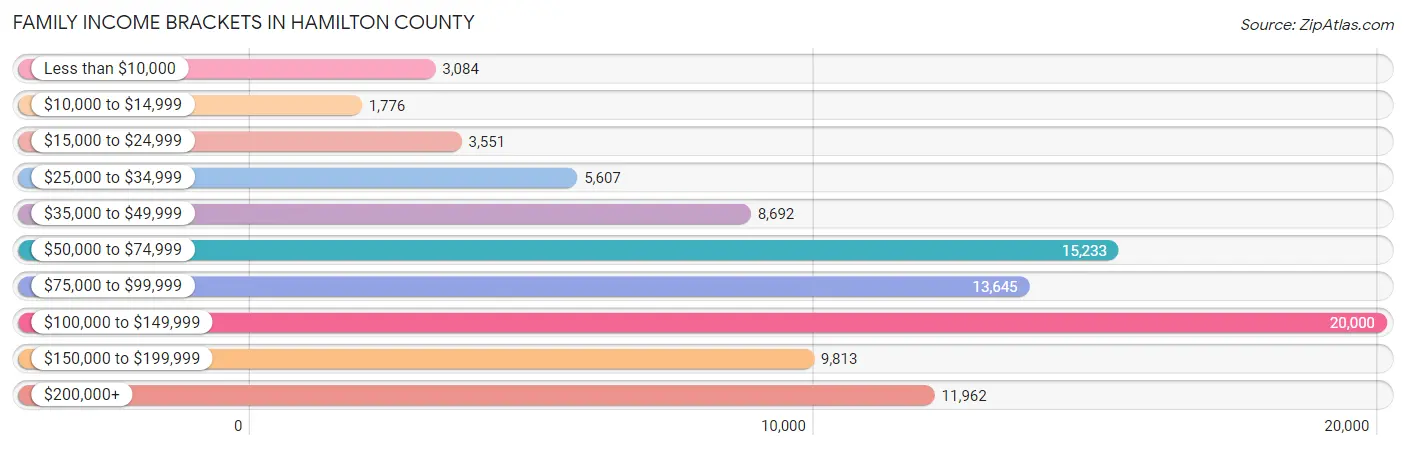
| Income Bracket | # Families | % Families |
| Less than $10,000 | 3,084 | 3.3% |
| $10,000 to $14,999 | 1,776 | 1.9% |
| $15,000 to $24,999 | 3,551 | 3.8% |
| $25,000 to $34,999 | 5,607 | 6.0% |
| $35,000 to $49,999 | 8,692 | 9.3% |
| $50,000 to $74,999 | 15,233 | 16.3% |
| $75,000 to $99,999 | 13,645 | 14.6% |
| $100,000 to $149,999 | 20,000 | 21.4% |
| $150,000 to $199,999 | 9,813 | 10.5% |
| $200,000+ | 11,962 | 12.8% |
Family Income by Famaliy Size in Hamilton County
4-person families (14,390 | 15.4%) account for the highest median family income in Hamilton County with $113,305 per family, while 2-person families (48,372 | 51.8%) have the highest median income of $40,266 per family member.
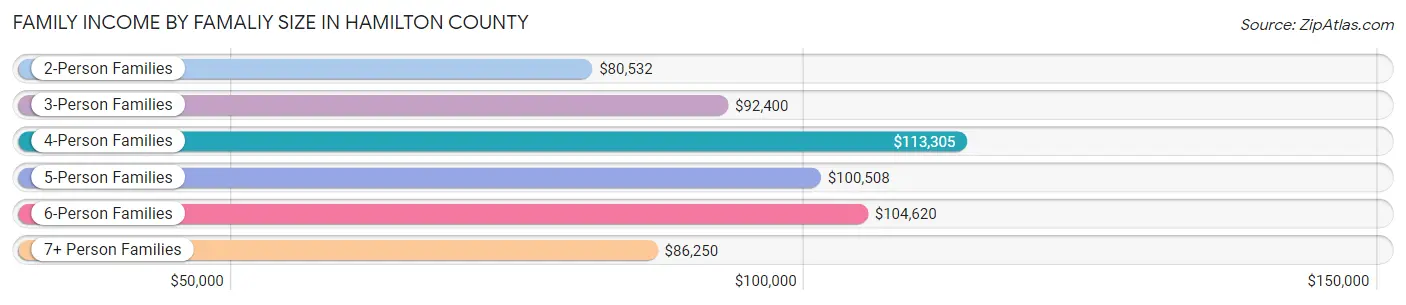
| Income Bracket | # Families | Median Income |
| 2-Person Families | 48,372 (51.8%) | $80,532 |
| 3-Person Families | 21,590 (23.1%) | $92,400 |
| 4-Person Families | 14,390 (15.4%) | $113,305 |
| 5-Person Families | 6,214 (6.7%) | $100,508 |
| 6-Person Families | 1,700 (1.8%) | $104,620 |
| 7+ Person Families | 1,191 (1.3%) | $86,250 |
| Total | 93,457 (100.0%) | $90,913 |
Family Income by Number of Earners in Hamilton County
The median family income in Hamilton County is $90,913, with families comprising 3+ earners (9,350) having the highest median family income of $140,880, while families with no earners (14,124) have the lowest median family income of $47,312, accounting for 10.0% and 15.1% of families, respectively.
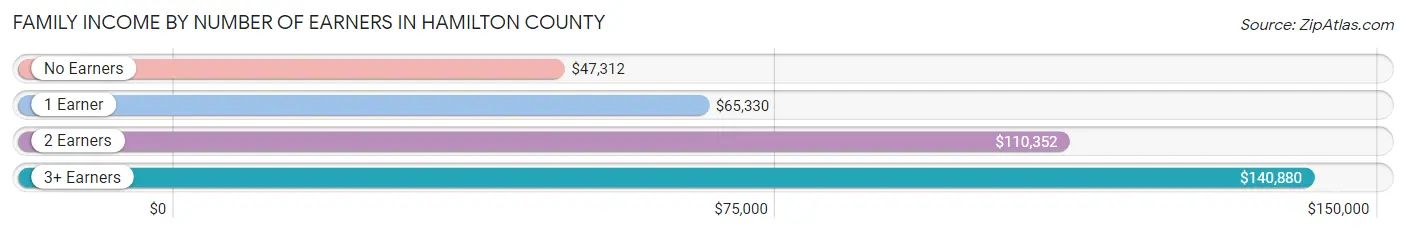
| Number of Earners | # Families | Median Income |
| No Earners | 14,124 (15.1%) | $47,312 |
| 1 Earner | 29,983 (32.1%) | $65,330 |
| 2 Earners | 40,000 (42.8%) | $110,352 |
| 3+ Earners | 9,350 (10.0%) | $140,880 |
| Total | 93,457 (100.0%) | $90,913 |
Household Income in Hamilton County
Household Income Brackets in Hamilton County
With 25,162 households falling in the category, the $100,000 to $149,999 income range is the most frequent in Hamilton County, accounting for 16.9% of all households. In contrast, only 6,104 households (4.1%) fall into the $10,000 to $14,999 income bracket, making it the least populous group.
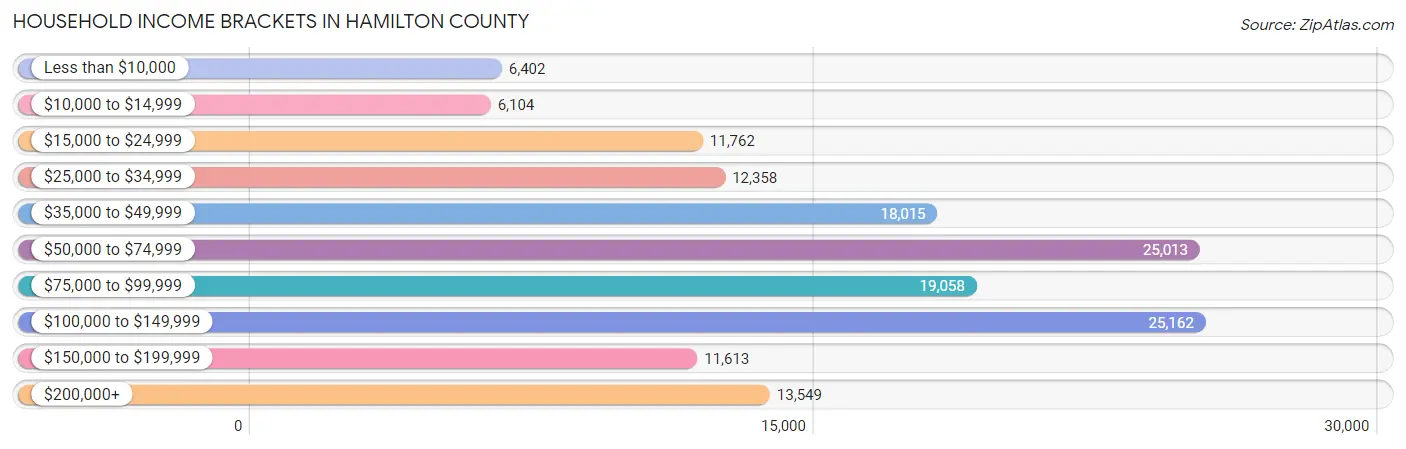
| Income Bracket | # Households | % Households |
| Less than $10,000 | 6,402 | 4.3% |
| $10,000 to $14,999 | 6,104 | 4.1% |
| $15,000 to $24,999 | 11,762 | 7.9% |
| $25,000 to $34,999 | 12,358 | 8.3% |
| $35,000 to $49,999 | 18,015 | 12.1% |
| $50,000 to $74,999 | 25,013 | 16.8% |
| $75,000 to $99,999 | 19,058 | 12.8% |
| $100,000 to $149,999 | 25,162 | 16.9% |
| $150,000 to $199,999 | 11,613 | 7.8% |
| $200,000+ | 13,549 | 9.1% |
Household Income by Householder Age in Hamilton County
The median household income in Hamilton County is $69,069, with the highest median household income of $85,251 found in the 45 to 64 years age bracket for the primary householder. A total of 51,354 households (34.5%) fall into this category. Meanwhile, the 15 to 24 years age bracket for the primary householder has the lowest median household income of $40,018, with 5,787 households (3.9%) in this group.
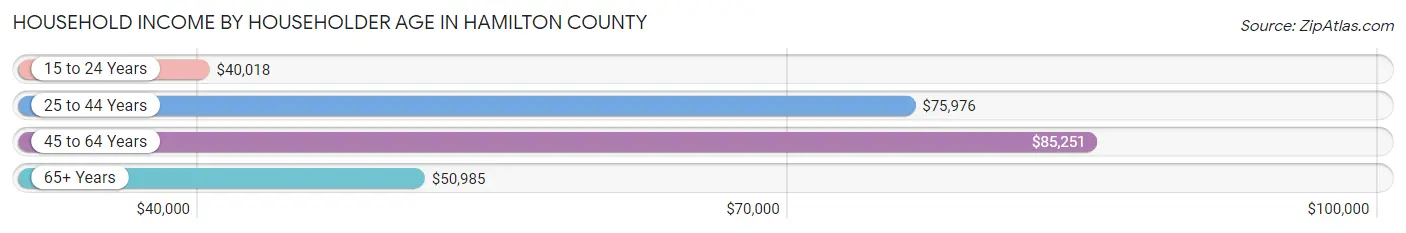
| Income Bracket | # Households | Median Income |
| 15 to 24 Years | 5,787 (3.9%) | $40,018 |
| 25 to 44 Years | 49,857 (33.5%) | $75,976 |
| 45 to 64 Years | 51,354 (34.5%) | $85,251 |
| 65+ Years | 41,890 (28.1%) | $50,985 |
| Total | 148,888 (100.0%) | $69,069 |
Poverty in Hamilton County
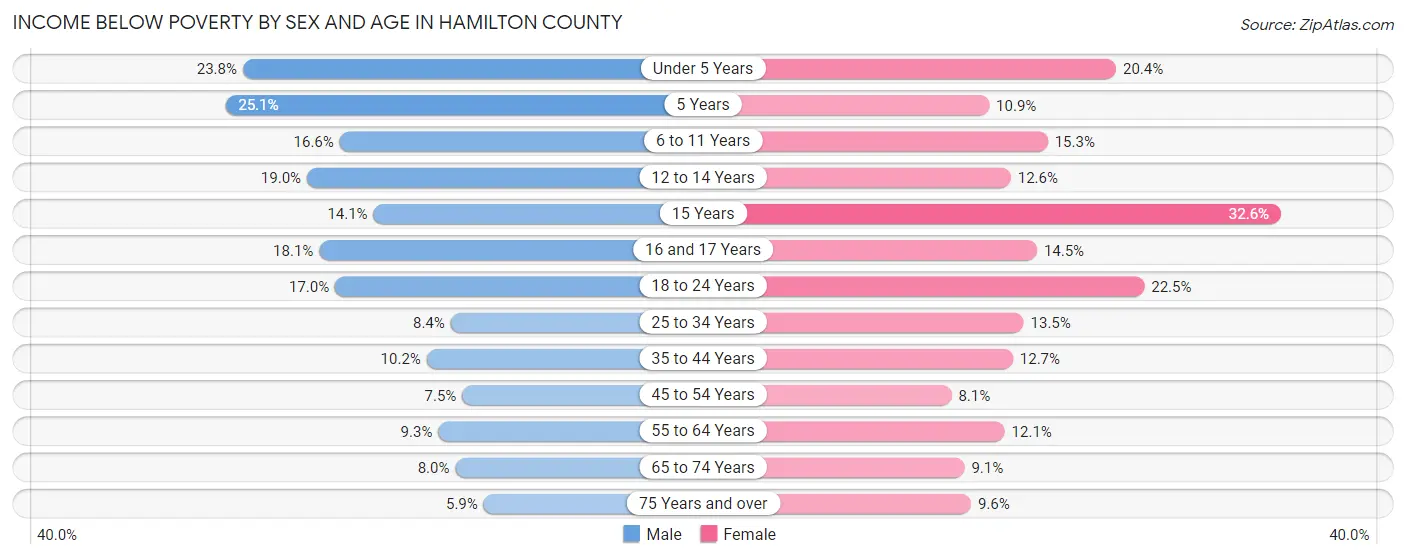
Income Below Poverty by Sex and Age in Hamilton County
With 11.5% poverty level for males and 13.0% for females among the residents of Hamilton County, 5 year old males and 15 year old females are the most vulnerable to poverty, with 448 males (25.1%) and 547 females (32.6%) in their respective age groups living below the poverty level.
| Age Bracket | Male | Female |
| Under 5 Years | 2,489 (23.8%) | 2,060 (20.4%) |
| 5 Years | 448 (25.1%) | 188 (10.9%) |
| 6 to 11 Years | 2,287 (16.6%) | 1,800 (15.3%) |
| 12 to 14 Years | 1,160 (19.0%) | 831 (12.6%) |
| 15 Years | 298 (14.1%) | 547 (32.6%) |
| 16 and 17 Years | 781 (18.1%) | 659 (14.5%) |
| 18 to 24 Years | 2,244 (17.0%) | 2,937 (22.5%) |
| 25 to 34 Years | 2,127 (8.4%) | 3,616 (13.5%) |
| 35 to 44 Years | 2,315 (10.2%) | 2,932 (12.7%) |
| 45 to 54 Years | 1,666 (7.5%) | 1,869 (8.1%) |
| 55 to 64 Years | 2,135 (9.3%) | 3,021 (12.1%) |
| 65 to 74 Years | 1,452 (8.0%) | 1,857 (9.1%) |
| 75 Years and over | 611 (5.9%) | 1,527 (9.6%) |
| Total | 20,013 (11.5%) | 23,844 (13.0%) |
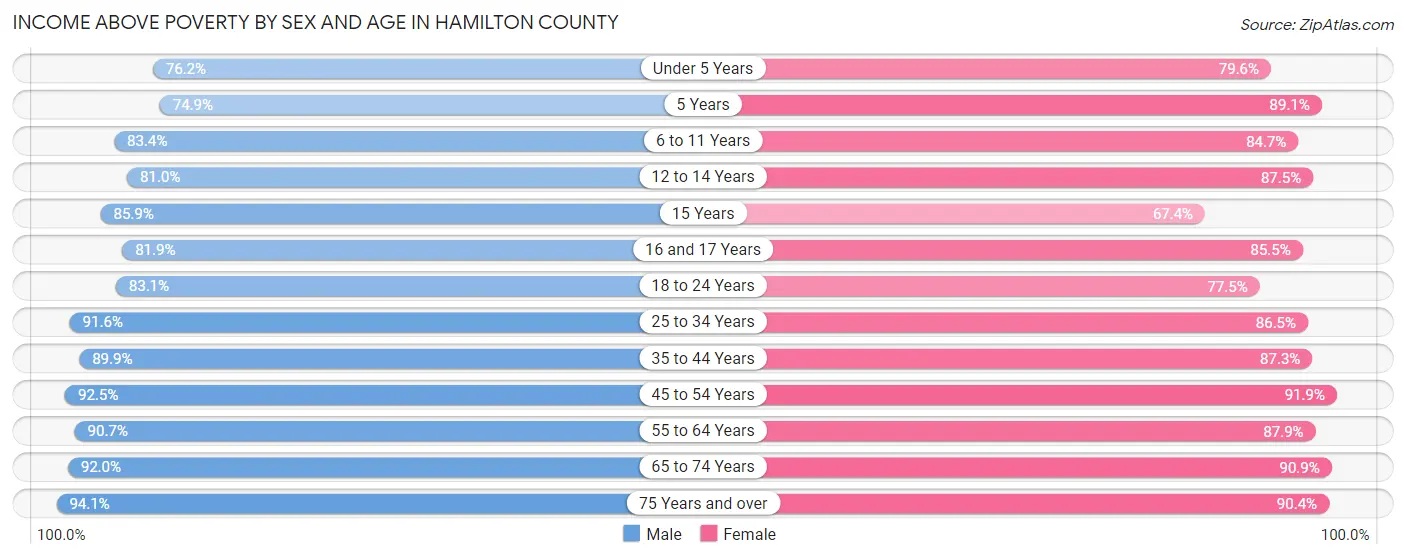
Income Above Poverty by Sex and Age in Hamilton County
According to the poverty statistics in Hamilton County, males aged 75 years and over and females aged 45 to 54 years are the age groups that are most secure financially, with 94.1% of males and 91.9% of females in these age groups living above the poverty line.
| Age Bracket | Male | Female |
| Under 5 Years | 7,967 (76.2%) | 8,060 (79.6%) |
| 5 Years | 1,337 (74.9%) | 1,531 (89.1%) |
| 6 to 11 Years | 11,481 (83.4%) | 9,972 (84.7%) |
| 12 to 14 Years | 4,932 (81.0%) | 5,793 (87.5%) |
| 15 Years | 1,816 (85.9%) | 1,131 (67.4%) |
| 16 and 17 Years | 3,527 (81.9%) | 3,888 (85.5%) |
| 18 to 24 Years | 10,998 (83.1%) | 10,137 (77.5%) |
| 25 to 34 Years | 23,292 (91.6%) | 23,160 (86.5%) |
| 35 to 44 Years | 20,493 (89.8%) | 20,163 (87.3%) |
| 45 to 54 Years | 20,514 (92.5%) | 21,086 (91.9%) |
| 55 to 64 Years | 20,845 (90.7%) | 21,962 (87.9%) |
| 65 to 74 Years | 16,652 (92.0%) | 18,533 (90.9%) |
| 75 Years and over | 9,709 (94.1%) | 14,397 (90.4%) |
| Total | 153,563 (88.5%) | 159,813 (87.0%) |
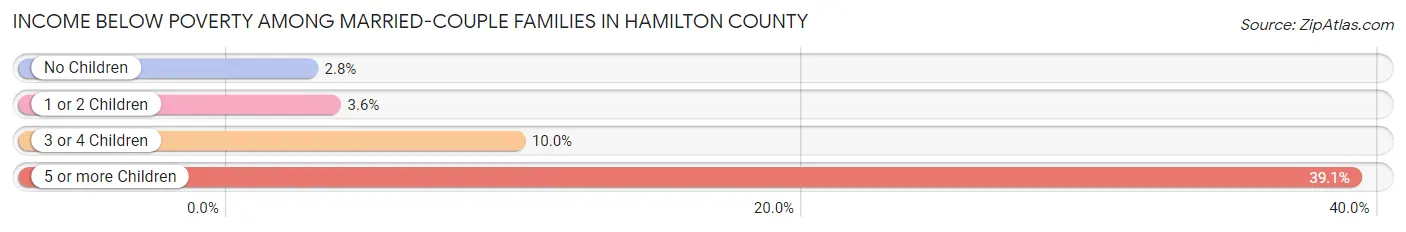
Income Below Poverty Among Married-Couple Families in Hamilton County
The poverty statistics for married-couple families in Hamilton County show that 3.7% or 2,563 of the total 68,801 families live below the poverty line. Families with 5 or more children have the highest poverty rate of 39.1%, comprising of 178 families. On the other hand, families with no children have the lowest poverty rate of 2.8%, which includes 1,192 families.
| Children | Above Poverty | Below Poverty |
| No Children | 41,827 (97.2%) | 1,192 (2.8%) |
| 1 or 2 Children | 20,070 (96.4%) | 742 (3.6%) |
| 3 or 4 Children | 4,064 (90.0%) | 451 (10.0%) |
| 5 or more Children | 277 (60.9%) | 178 (39.1%) |
| Total | 66,238 (96.3%) | 2,563 (3.7%) |
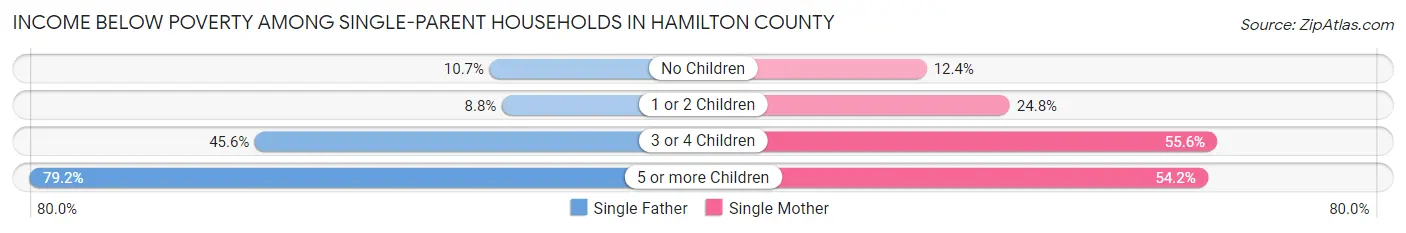
Income Below Poverty Among Single-Parent Households in Hamilton County
According to the poverty data in Hamilton County, 12.6% or 856 single-father households and 22.6% or 4,033 single-mother households are living below the poverty line. Among single-father households, those with 5 or more children have the highest poverty rate, with 38 households (79.2%) experiencing poverty. Likewise, among single-mother households, those with 3 or 4 children have the highest poverty rate, with 818 households (55.6%) falling below the poverty line.
| Children | Single Father | Single Mother |
| No Children | 362 (10.7%) | 919 (12.4%) |
| 1 or 2 Children | 257 (8.8%) | 2,161 (24.8%) |
| 3 or 4 Children | 199 (45.6%) | 818 (55.6%) |
| 5 or more Children | 38 (79.2%) | 135 (54.2%) |
| Total | 856 (12.6%) | 4,033 (22.6%) |
Income Below Poverty Among Married-Couple vs Single-Parent Households in Hamilton County
The poverty data for Hamilton County shows that 2,563 of the married-couple family households (3.7%) and 4,889 of the single-parent households (19.8%) are living below the poverty level. Within the married-couple family households, those with 5 or more children have the highest poverty rate, with 178 households (39.1%) falling below the poverty line. Among the single-parent households, those with 5 or more children have the highest poverty rate, with 173 household (58.3%) living below poverty.
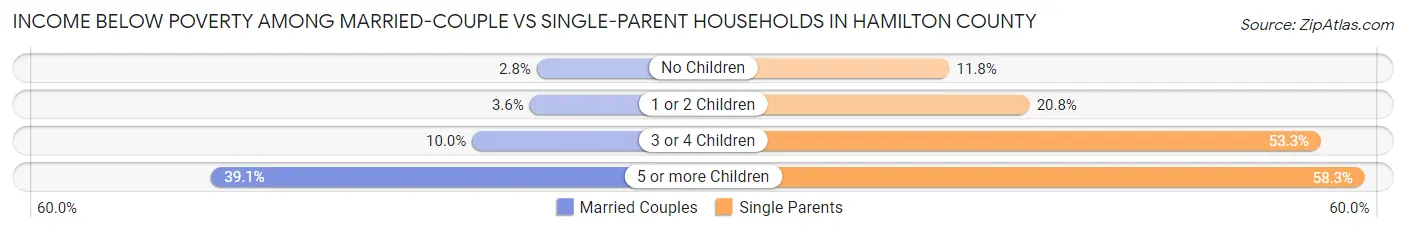
| Children | Married-Couple Families | Single-Parent Households |
| No Children | 1,192 (2.8%) | 1,281 (11.8%) |
| 1 or 2 Children | 742 (3.6%) | 2,418 (20.8%) |
| 3 or 4 Children | 451 (10.0%) | 1,017 (53.3%) |
| 5 or more Children | 178 (39.1%) | 173 (58.3%) |
| Total | 2,563 (3.7%) | 4,889 (19.8%) |
Employment Characteristics in Hamilton County
Employment by Class of Employer in Hamilton County
Among the 179,167 employed individuals in Hamilton County, private company employees (123,261 | 68.8%), not-for-profit organizations (17,747 | 9.9%), and self-employed (not incorporated) (11,447 | 6.4%) make up the most common classes of employment.
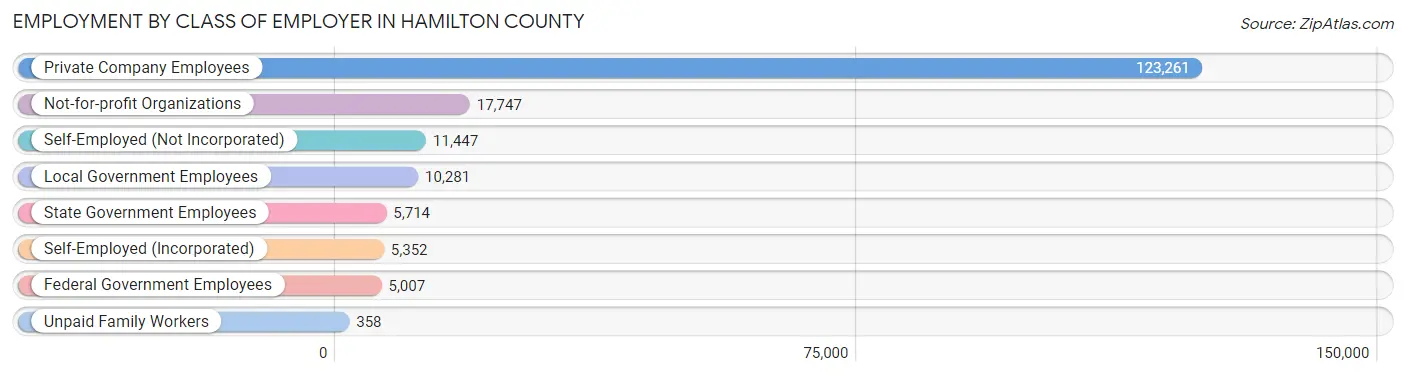
| Employer Class | # Employees | % Employees |
| Private Company Employees | 123,261 | 68.8% |
| Self-Employed (Incorporated) | 5,352 | 3.0% |
| Self-Employed (Not Incorporated) | 11,447 | 6.4% |
| Not-for-profit Organizations | 17,747 | 9.9% |
| Local Government Employees | 10,281 | 5.7% |
| State Government Employees | 5,714 | 3.2% |
| Federal Government Employees | 5,007 | 2.8% |
| Unpaid Family Workers | 358 | 0.2% |
| Total | 179,167 | 100.0% |
Employment Status by Age in Hamilton County
According to the labor force statistics for Hamilton County, out of the total population over 16 years of age (299,839), 63.8% or 191,297 individuals are in the labor force, with 4.4% or 8,417 of them unemployed. The age group with the highest labor force participation rate is 30 to 34 years, with 87.1% or 22,998 individuals in the labor force. Within the labor force, the 16 to 19 years age range has the highest percentage of unemployed individuals, with 13.2% or 1,036 of them being unemployed.
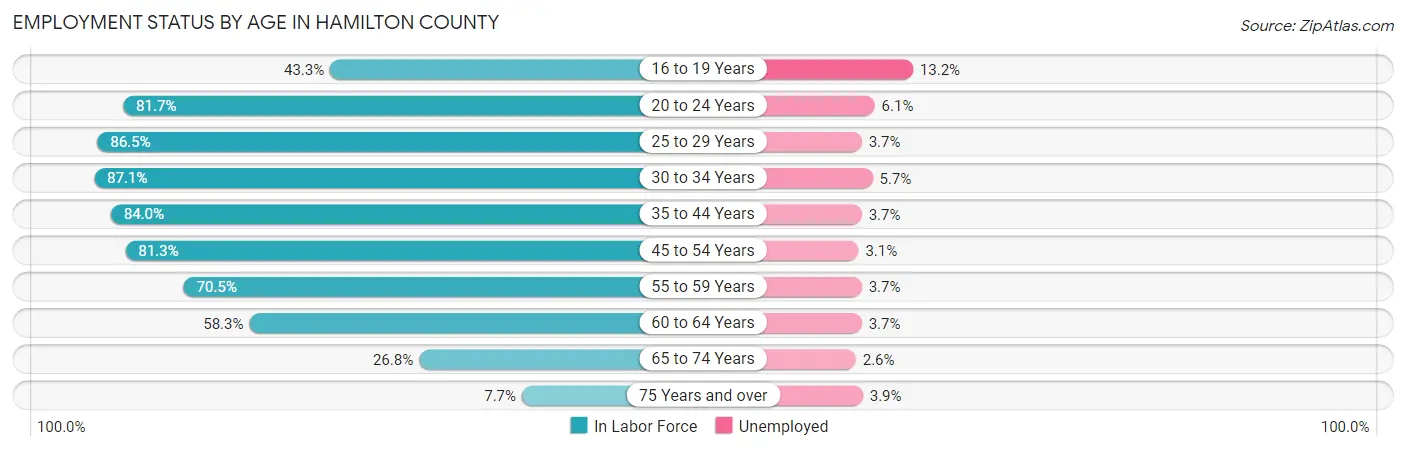
| Age Bracket | In Labor Force | Unemployed |
| 16 to 19 Years | 7,850 (43.3%) | 1,036 (13.2%) |
| 20 to 24 Years | 18,363 (81.7%) | 1,120 (6.1%) |
| 25 to 29 Years | 22,852 (86.5%) | 846 (3.7%) |
| 30 to 34 Years | 22,998 (87.1%) | 1,311 (5.7%) |
| 35 to 44 Years | 38,854 (84.0%) | 1,438 (3.7%) |
| 45 to 54 Years | 36,952 (81.3%) | 1,146 (3.1%) |
| 55 to 59 Years | 16,670 (70.5%) | 617 (3.7%) |
| 60 to 64 Years | 14,330 (58.3%) | 530 (3.7%) |
| 65 to 74 Years | 10,419 (26.8%) | 271 (2.6%) |
| 75 Years and over | 2,125 (7.7%) | 83 (3.9%) |
| Total | 191,297 (63.8%) | 8,417 (4.4%) |
Employment Status by Educational Attainment in Hamilton County
According to labor force statistics for Hamilton County, 79.2% of individuals (152,662) out of the total population between 25 and 64 years of age (192,755) are in the labor force, with 3.9% or 5,954 of them being unemployed. The group with the highest labor force participation rate are those with the educational attainment of bachelor's degree or higher, with 87.3% or 63,155 individuals in the labor force. Within the labor force, individuals with less than high school education have the highest percentage of unemployment, with 9.2% or 834 of them being unemployed.
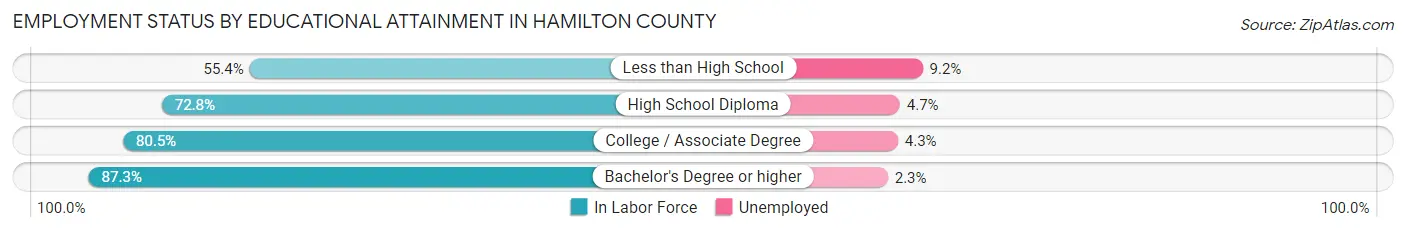
| Educational Attainment | In Labor Force | Unemployed |
| Less than High School | 9,069 (55.4%) | 1,506 (9.2%) |
| High School Diploma | 31,033 (72.8%) | 2,004 (4.7%) |
| College / Associate Degree | 49,438 (80.5%) | 2,641 (4.3%) |
| Bachelor's Degree or higher | 63,155 (87.3%) | 1,664 (2.3%) |
| Total | 152,662 (79.2%) | 7,517 (3.9%) |
Employment Occupations by Sex in Hamilton County
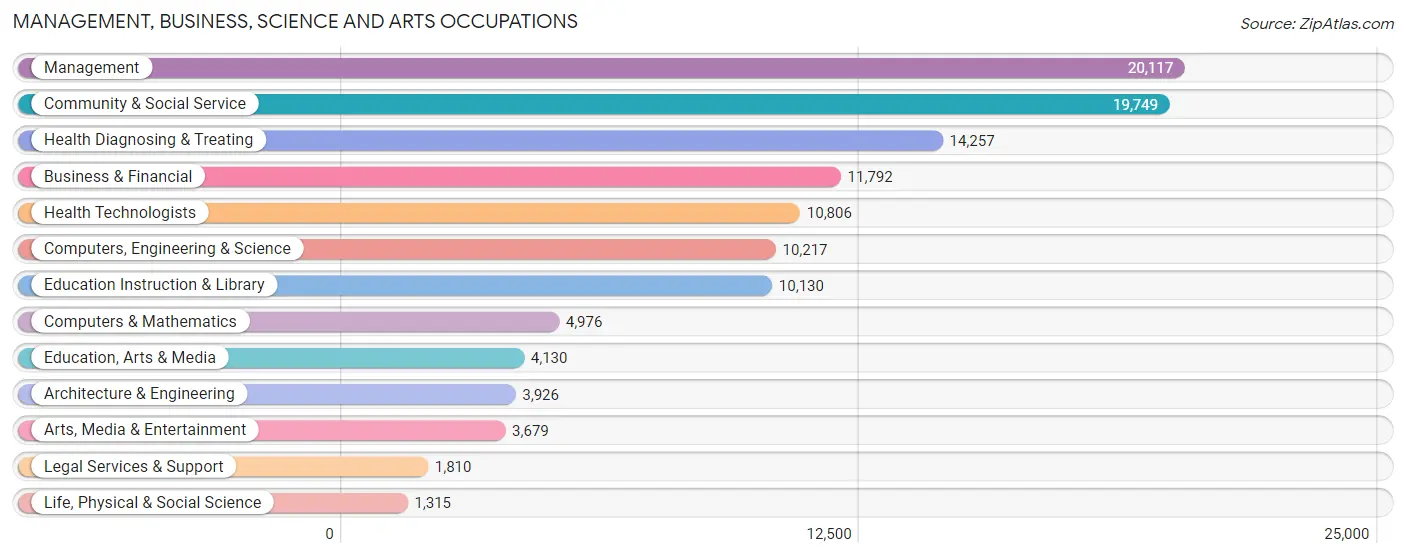
Management, Business, Science and Arts Occupations
The most common Management, Business, Science and Arts occupations in Hamilton County are Management (20,117 | 11.0%), Community & Social Service (19,749 | 10.8%), Health Diagnosing & Treating (14,257 | 7.8%), Business & Financial (11,792 | 6.5%), and Health Technologists (10,806 | 5.9%).
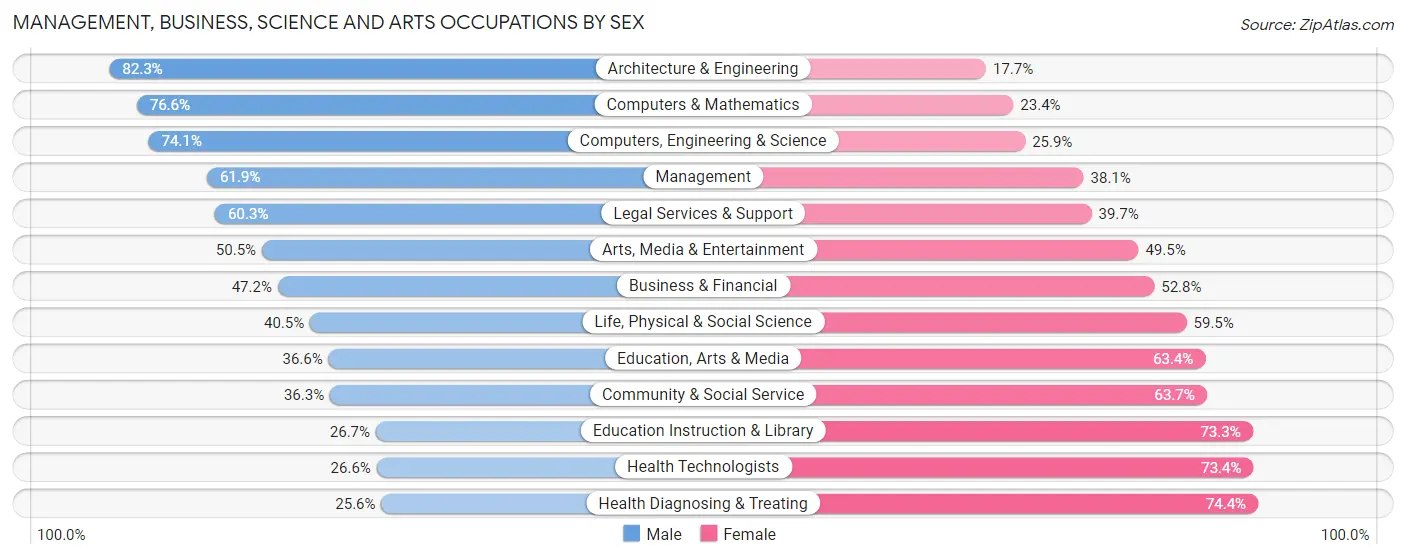
Management, Business, Science and Arts Occupations by Sex
Within the Management, Business, Science and Arts occupations in Hamilton County, the most male-oriented occupations are Architecture & Engineering (82.3%), Computers & Mathematics (76.6%), and Computers, Engineering & Science (74.1%), while the most female-oriented occupations are Health Diagnosing & Treating (74.4%), Health Technologists (73.4%), and Education Instruction & Library (73.3%).
| Occupation | Male | Female |
| Management | 12,461 (61.9%) | 7,656 (38.1%) |
| Business & Financial | 5,565 (47.2%) | 6,227 (52.8%) |
| Computers, Engineering & Science | 7,574 (74.1%) | 2,643 (25.9%) |
| Computers & Mathematics | 3,811 (76.6%) | 1,165 (23.4%) |
| Architecture & Engineering | 3,231 (82.3%) | 695 (17.7%) |
| Life, Physical & Social Science | 532 (40.5%) | 783 (59.5%) |
| Community & Social Service | 7,167 (36.3%) | 12,582 (63.7%) |
| Education, Arts & Media | 1,511 (36.6%) | 2,619 (63.4%) |
| Legal Services & Support | 1,091 (60.3%) | 719 (39.7%) |
| Education Instruction & Library | 2,707 (26.7%) | 7,423 (73.3%) |
| Arts, Media & Entertainment | 1,858 (50.5%) | 1,821 (49.5%) |
| Health Diagnosing & Treating | 3,647 (25.6%) | 10,610 (74.4%) |
| Health Technologists | 2,870 (26.6%) | 7,936 (73.4%) |
| Total (Category) | 36,414 (47.8%) | 39,718 (52.2%) |
| Total (Overall) | 96,035 (52.5%) | 86,820 (47.5%) |
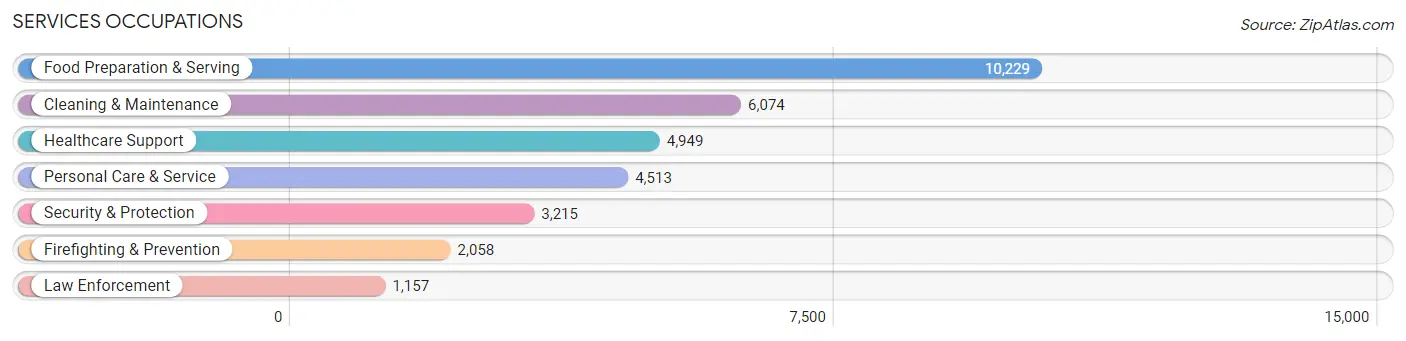
Services Occupations
The most common Services occupations in Hamilton County are Food Preparation & Serving (10,229 | 5.6%), Cleaning & Maintenance (6,074 | 3.3%), Healthcare Support (4,949 | 2.7%), Personal Care & Service (4,513 | 2.5%), and Security & Protection (3,215 | 1.8%).
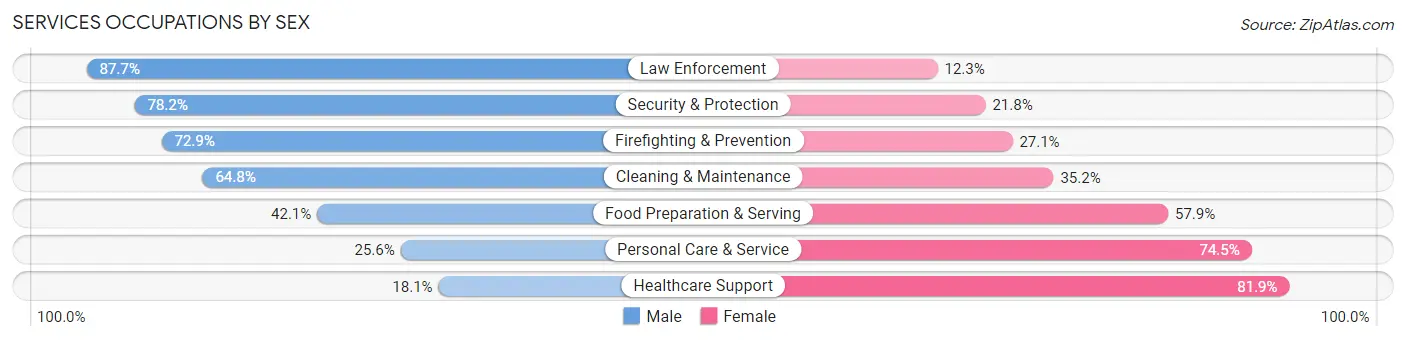
Services Occupations by Sex
Within the Services occupations in Hamilton County, the most male-oriented occupations are Law Enforcement (87.7%), Security & Protection (78.2%), and Firefighting & Prevention (72.9%), while the most female-oriented occupations are Healthcare Support (81.9%), Personal Care & Service (74.5%), and Food Preparation & Serving (57.9%).
| Occupation | Male | Female |
| Healthcare Support | 894 (18.1%) | 4,055 (81.9%) |
| Security & Protection | 2,515 (78.2%) | 700 (21.8%) |
| Firefighting & Prevention | 1,500 (72.9%) | 558 (27.1%) |
| Law Enforcement | 1,015 (87.7%) | 142 (12.3%) |
| Food Preparation & Serving | 4,304 (42.1%) | 5,925 (57.9%) |
| Cleaning & Maintenance | 3,934 (64.8%) | 2,140 (35.2%) |
| Personal Care & Service | 1,153 (25.6%) | 3,360 (74.5%) |
| Total (Category) | 12,800 (44.2%) | 16,180 (55.8%) |
| Total (Overall) | 96,035 (52.5%) | 86,820 (47.5%) |
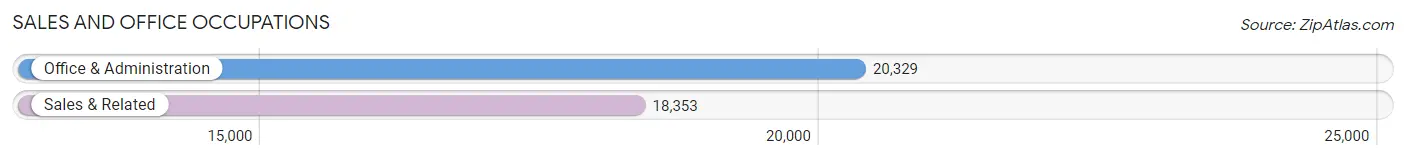
Sales and Office Occupations
The most common Sales and Office occupations in Hamilton County are Office & Administration (20,329 | 11.1%), and Sales & Related (18,353 | 10.0%).
Sales and Office Occupations by Sex
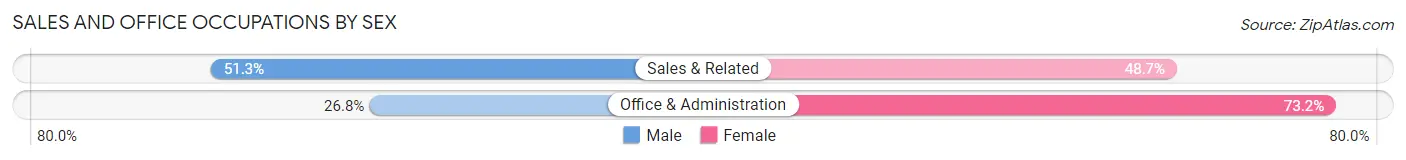
| Occupation | Male | Female |
| Sales & Related | 9,423 (51.3%) | 8,930 (48.7%) |
| Office & Administration | 5,457 (26.8%) | 14,872 (73.2%) |
| Total (Category) | 14,880 (38.5%) | 23,802 (61.5%) |
| Total (Overall) | 96,035 (52.5%) | 86,820 (47.5%) |
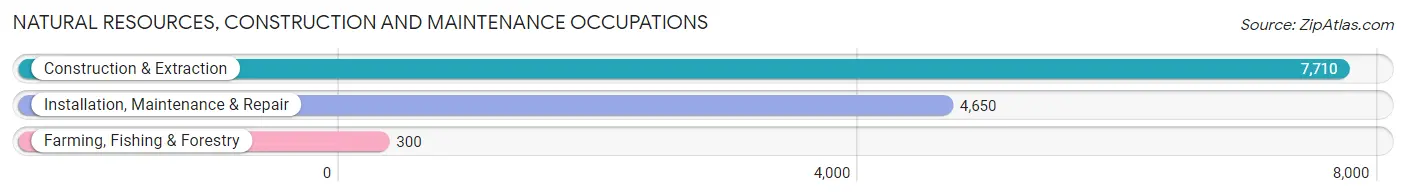
Natural Resources, Construction and Maintenance Occupations
The most common Natural Resources, Construction and Maintenance occupations in Hamilton County are Construction & Extraction (7,710 | 4.2%), Installation, Maintenance & Repair (4,650 | 2.5%), and Farming, Fishing & Forestry (300 | 0.2%).
Natural Resources, Construction and Maintenance Occupations by Sex
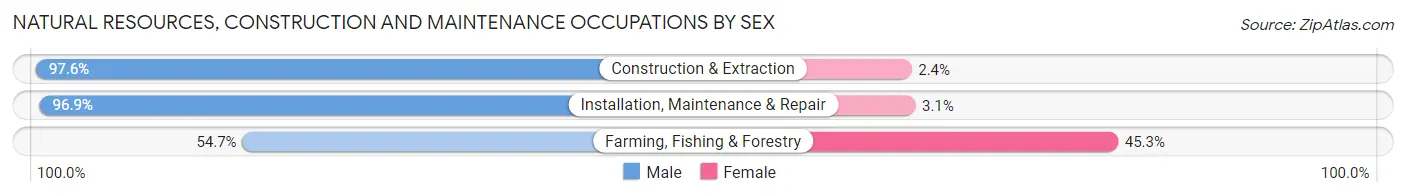
| Occupation | Male | Female |
| Farming, Fishing & Forestry | 164 (54.7%) | 136 (45.3%) |
| Construction & Extraction | 7,528 (97.6%) | 182 (2.4%) |
| Installation, Maintenance & Repair | 4,504 (96.9%) | 146 (3.1%) |
| Total (Category) | 12,196 (96.3%) | 464 (3.7%) |
| Total (Overall) | 96,035 (52.5%) | 86,820 (47.5%) |
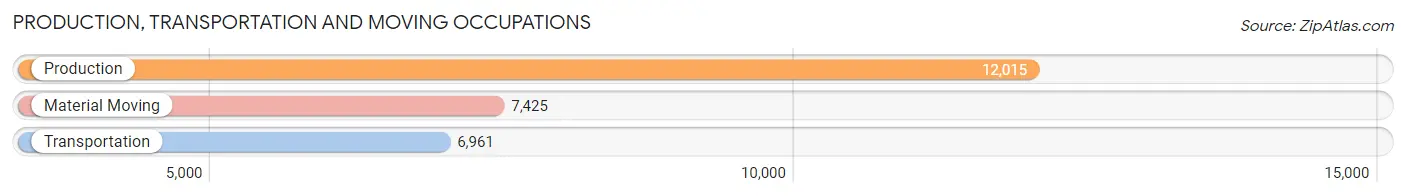
Production, Transportation and Moving Occupations
The most common Production, Transportation and Moving occupations in Hamilton County are Production (12,015 | 6.6%), Material Moving (7,425 | 4.1%), and Transportation (6,961 | 3.8%).
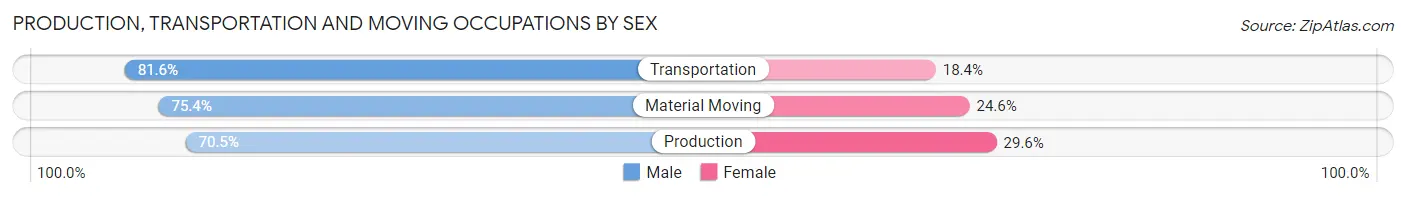
Production, Transportation and Moving Occupations by Sex
| Occupation | Male | Female |
| Production | 8,465 (70.5%) | 3,550 (29.5%) |
| Transportation | 5,681 (81.6%) | 1,280 (18.4%) |
| Material Moving | 5,599 (75.4%) | 1,826 (24.6%) |
| Total (Category) | 19,745 (74.8%) | 6,656 (25.2%) |
| Total (Overall) | 96,035 (52.5%) | 86,820 (47.5%) |
Employment Industries by Sex in Hamilton County
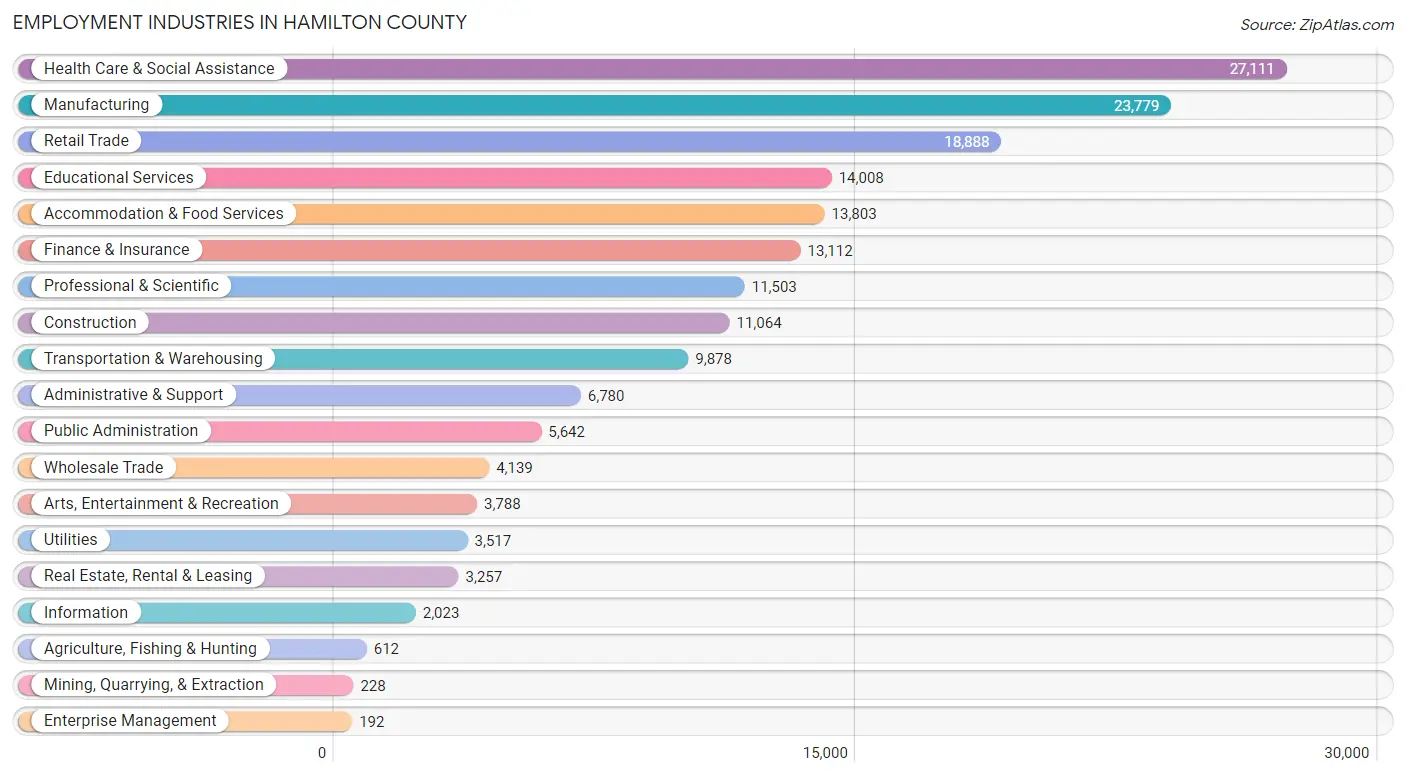
Employment Industries in Hamilton County
The major employment industries in Hamilton County include Health Care & Social Assistance (27,111 | 14.8%), Manufacturing (23,779 | 13.0%), Retail Trade (18,888 | 10.3%), Educational Services (14,008 | 7.7%), and Accommodation & Food Services (13,803 | 7.5%).
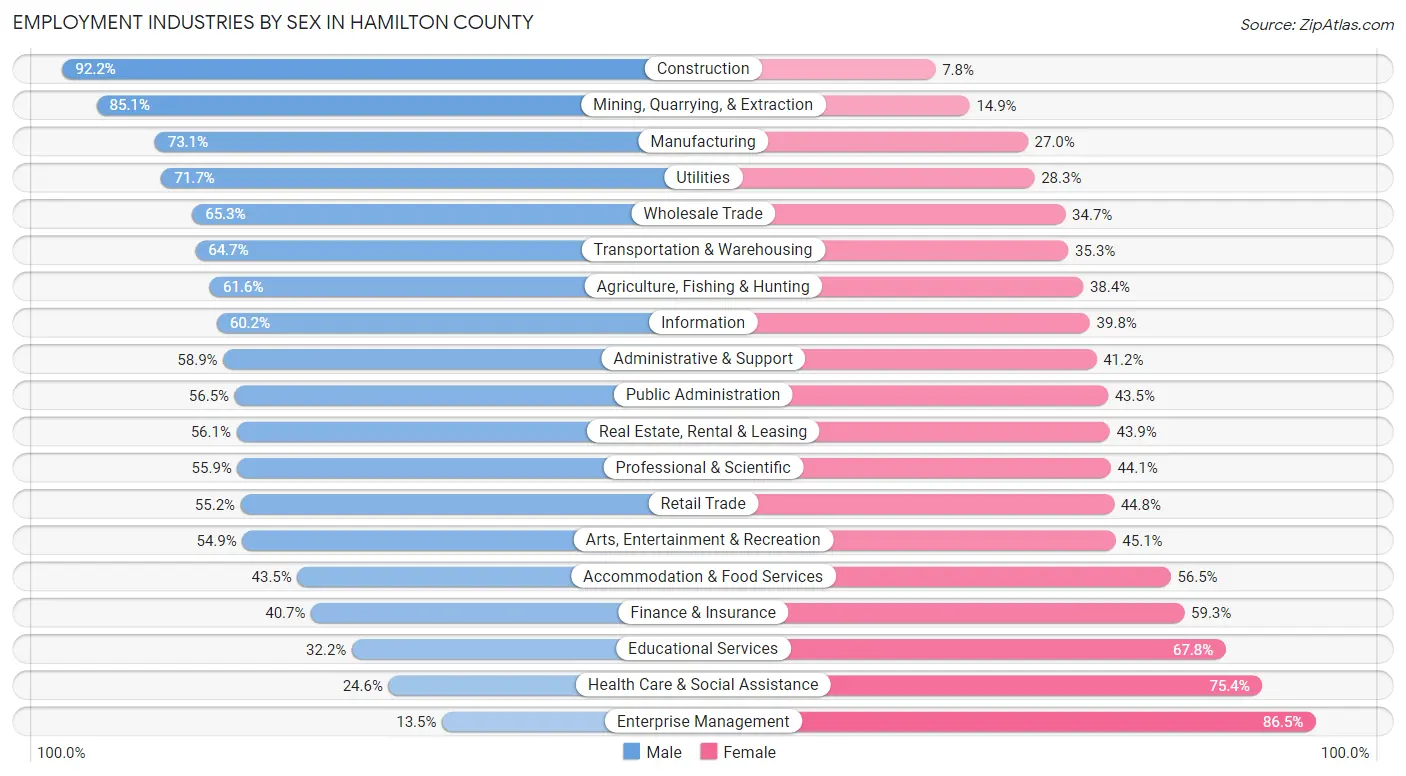
Employment Industries by Sex in Hamilton County
The Hamilton County industries that see more men than women are Construction (92.2%), Mining, Quarrying, & Extraction (85.1%), and Manufacturing (73.1%), whereas the industries that tend to have a higher number of women are Enterprise Management (86.5%), Health Care & Social Assistance (75.4%), and Educational Services (67.8%).
| Industry | Male | Female |
| Agriculture, Fishing & Hunting | 377 (61.6%) | 235 (38.4%) |
| Mining, Quarrying, & Extraction | 194 (85.1%) | 34 (14.9%) |
| Construction | 10,198 (92.2%) | 866 (7.8%) |
| Manufacturing | 17,371 (73.1%) | 6,408 (27.0%) |
| Wholesale Trade | 2,702 (65.3%) | 1,437 (34.7%) |
| Retail Trade | 10,431 (55.2%) | 8,457 (44.8%) |
| Transportation & Warehousing | 6,387 (64.7%) | 3,491 (35.3%) |
| Utilities | 2,521 (71.7%) | 996 (28.3%) |
| Information | 1,218 (60.2%) | 805 (39.8%) |
| Finance & Insurance | 5,331 (40.7%) | 7,781 (59.3%) |
| Real Estate, Rental & Leasing | 1,827 (56.1%) | 1,430 (43.9%) |
| Professional & Scientific | 6,430 (55.9%) | 5,073 (44.1%) |
| Enterprise Management | 26 (13.5%) | 166 (86.5%) |
| Administrative & Support | 3,990 (58.9%) | 2,790 (41.1%) |
| Educational Services | 4,510 (32.2%) | 9,498 (67.8%) |
| Health Care & Social Assistance | 6,677 (24.6%) | 20,434 (75.4%) |
| Arts, Entertainment & Recreation | 2,079 (54.9%) | 1,709 (45.1%) |
| Accommodation & Food Services | 6,003 (43.5%) | 7,800 (56.5%) |
| Public Administration | 3,186 (56.5%) | 2,456 (43.5%) |
| Total | 96,035 (52.5%) | 86,820 (47.5%) |
Education in Hamilton County
School Enrollment in Hamilton County
The most common levels of schooling among the 82,388 students in Hamilton County are college / undergraduate (19,450 | 23.6%), middle school (17,739 | 21.5%), and elementary school (16,753 | 20.3%).
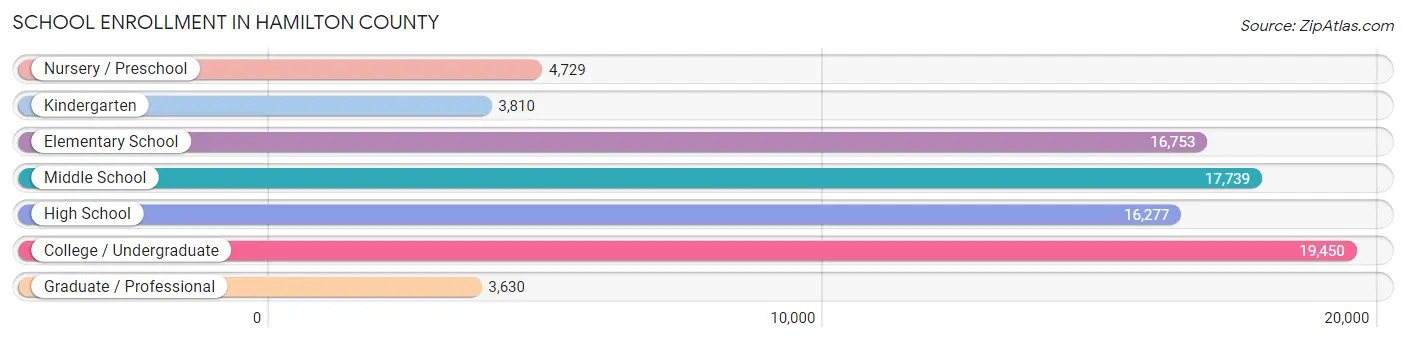
| School Level | # Students | % Students |
| Nursery / Preschool | 4,729 | 5.7% |
| Kindergarten | 3,810 | 4.6% |
| Elementary School | 16,753 | 20.3% |
| Middle School | 17,739 | 21.5% |
| High School | 16,277 | 19.8% |
| College / Undergraduate | 19,450 | 23.6% |
| Graduate / Professional | 3,630 | 4.4% |
| Total | 82,388 | 100.0% |
School Enrollment by Age by Funding Source in Hamilton County
Out of a total of 82,388 students who are enrolled in schools in Hamilton County, 21,009 (25.5%) attend a private institution, while the remaining 61,379 (74.5%) are enrolled in public schools. The age group of 3 to 4 year olds has the highest likelihood of being enrolled in private schools, with 2,095 (59.6% in the age bracket) enrolled. Conversely, the age group of 20 to 24 year olds has the lowest likelihood of being enrolled in a private school, with 7,243 (81.4% in the age bracket) attending a public institution.
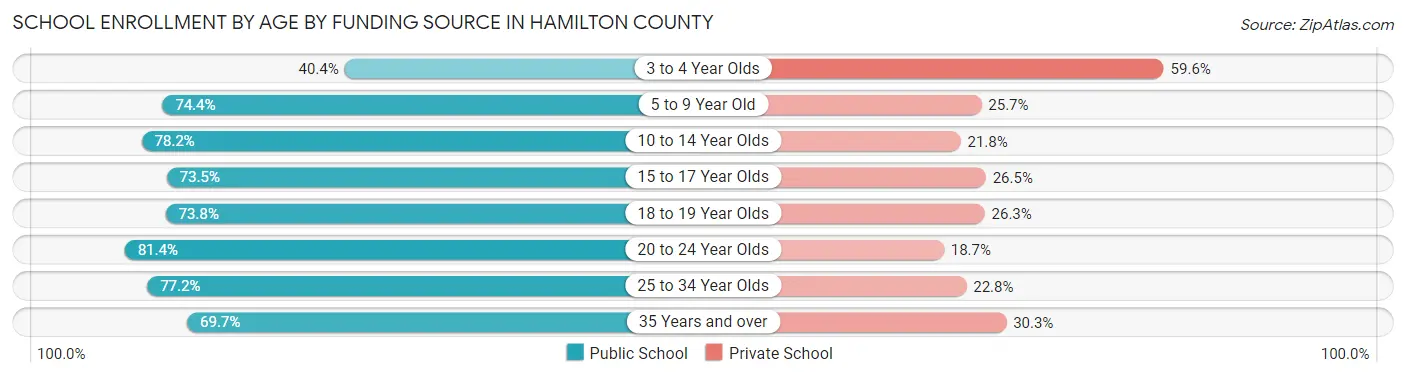
| Age Bracket | Public School | Private School |
| 3 to 4 Year Olds | 1,420 (40.4%) | 2,095 (59.6%) |
| 5 to 9 Year Old | 14,430 (74.4%) | 4,979 (25.7%) |
| 10 to 14 Year Olds | 17,014 (78.2%) | 4,734 (21.8%) |
| 15 to 17 Year Olds | 9,091 (73.5%) | 3,271 (26.5%) |
| 18 to 19 Year Olds | 5,346 (73.8%) | 1,903 (26.3%) |
| 20 to 24 Year Olds | 7,243 (81.4%) | 1,661 (18.6%) |
| 25 to 34 Year Olds | 4,081 (77.2%) | 1,208 (22.8%) |
| 35 Years and over | 2,728 (69.7%) | 1,184 (30.3%) |
| Total | 61,379 (74.5%) | 21,009 (25.5%) |
Educational Attainment by Field of Study in Hamilton County
Business (21,117 | 21.4%), education (11,181 | 11.4%), science & technology (10,411 | 10.6%), engineering (7,992 | 8.1%), and arts & humanities (7,478 | 7.6%) are the most common fields of study among 98,433 individuals in Hamilton County who have obtained a bachelor's degree or higher.
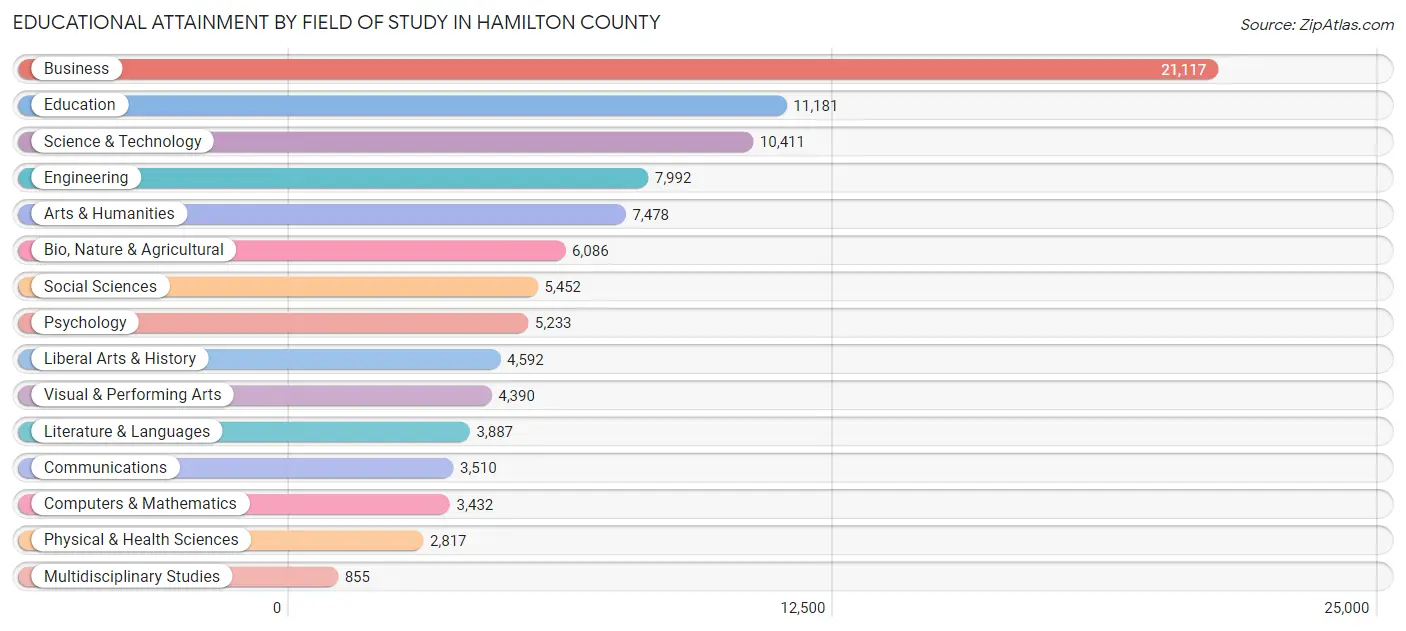
| Field of Study | # Graduates | % Graduates |
| Computers & Mathematics | 3,432 | 3.5% |
| Bio, Nature & Agricultural | 6,086 | 6.2% |
| Physical & Health Sciences | 2,817 | 2.9% |
| Psychology | 5,233 | 5.3% |
| Social Sciences | 5,452 | 5.5% |
| Engineering | 7,992 | 8.1% |
| Multidisciplinary Studies | 855 | 0.9% |
| Science & Technology | 10,411 | 10.6% |
| Business | 21,117 | 21.4% |
| Education | 11,181 | 11.4% |
| Literature & Languages | 3,887 | 4.0% |
| Liberal Arts & History | 4,592 | 4.7% |
| Visual & Performing Arts | 4,390 | 4.5% |
| Communications | 3,510 | 3.6% |
| Arts & Humanities | 7,478 | 7.6% |
| Total | 98,433 | 100.0% |
Transportation & Commute in Hamilton County
Vehicle Availability by Sex in Hamilton County
The most prevalent vehicle ownership categories in Hamilton County are males with 2 vehicles (41,249, accounting for 44.2%) and females with 2 vehicles (34,321, making up 49.8%).
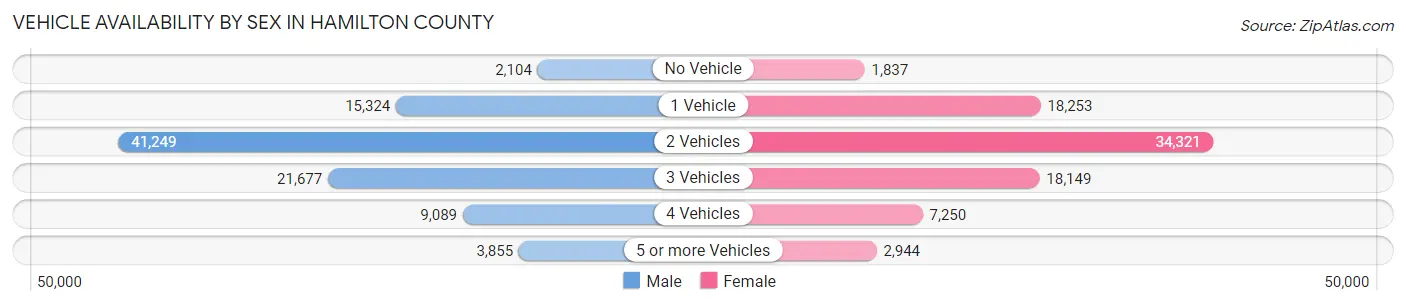
| Vehicles Available | Male | Female |
| No Vehicle | 2,104 (2.3%) | 1,837 (2.2%) |
| 1 Vehicle | 15,324 (16.4%) | 18,253 (22.1%) |
| 2 Vehicles | 41,249 (44.2%) | 34,321 (41.5%) |
| 3 Vehicles | 21,677 (23.2%) | 18,149 (21.9%) |
| 4 Vehicles | 9,089 (9.7%) | 7,250 (8.8%) |
| 5 or more Vehicles | 3,855 (4.1%) | 2,944 (3.6%) |
| Total | 93,298 (100.0%) | 82,754 (100.0%) |
Commute Time in Hamilton County
The most frequently occuring commute durations in Hamilton County are 15 to 19 minutes (33,116 commuters, 20.8%), 20 to 24 minutes (28,906 commuters, 18.2%), and 10 to 14 minutes (23,120 commuters, 14.5%).
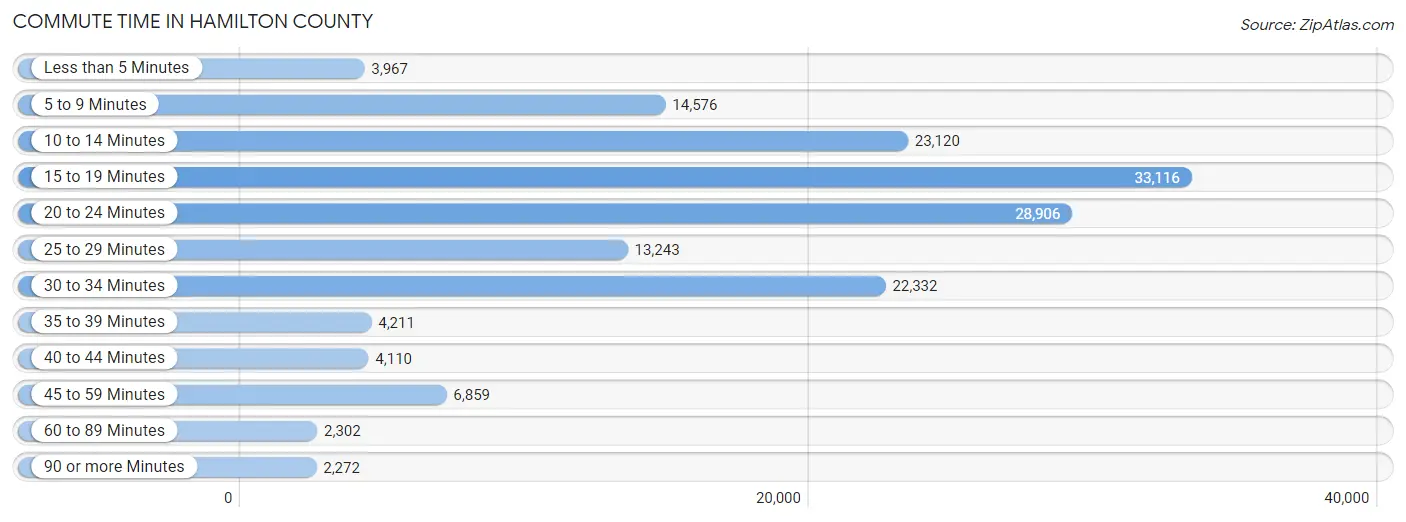
| Commute Time | # Commuters | % Commuters |
| Less than 5 Minutes | 3,967 | 2.5% |
| 5 to 9 Minutes | 14,576 | 9.2% |
| 10 to 14 Minutes | 23,120 | 14.5% |
| 15 to 19 Minutes | 33,116 | 20.8% |
| 20 to 24 Minutes | 28,906 | 18.2% |
| 25 to 29 Minutes | 13,243 | 8.3% |
| 30 to 34 Minutes | 22,332 | 14.0% |
| 35 to 39 Minutes | 4,211 | 2.6% |
| 40 to 44 Minutes | 4,110 | 2.6% |
| 45 to 59 Minutes | 6,859 | 4.3% |
| 60 to 89 Minutes | 2,302 | 1.5% |
| 90 or more Minutes | 2,272 | 1.4% |
Commute Time by Sex in Hamilton County
The most common commute times in Hamilton County are 15 to 19 minutes (17,152 commuters, 19.9%) for males and 15 to 19 minutes (15,964 commuters, 21.9%) for females.
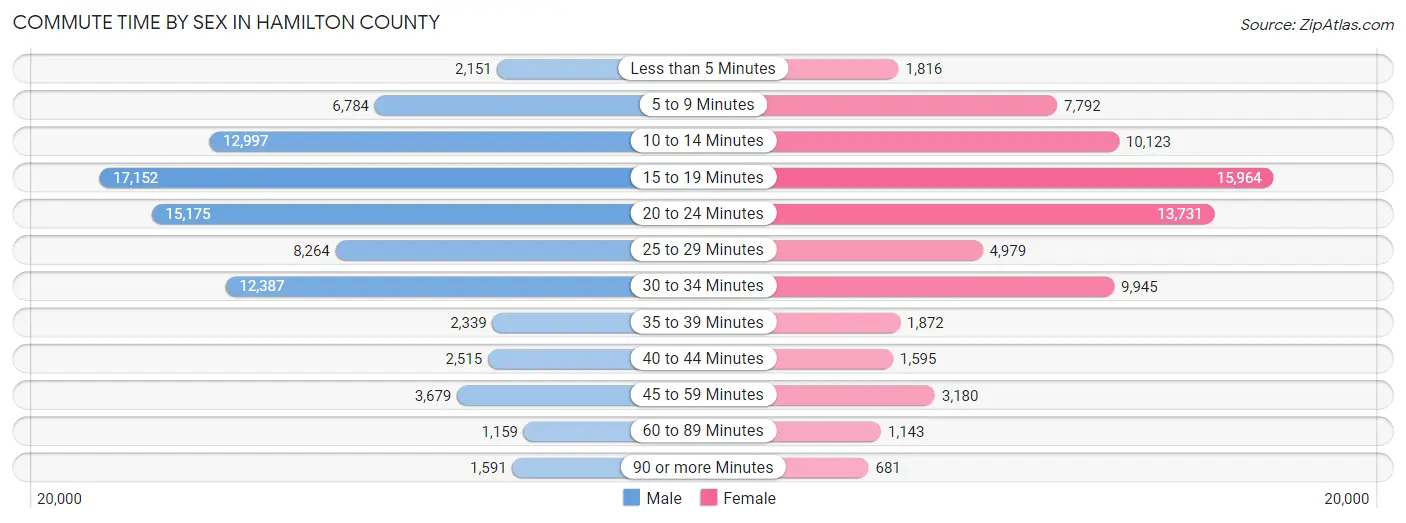
| Commute Time | Male | Female |
| Less than 5 Minutes | 2,151 (2.5%) | 1,816 (2.5%) |
| 5 to 9 Minutes | 6,784 (7.9%) | 7,792 (10.7%) |
| 10 to 14 Minutes | 12,997 (15.1%) | 10,123 (13.9%) |
| 15 to 19 Minutes | 17,152 (19.9%) | 15,964 (21.9%) |
| 20 to 24 Minutes | 15,175 (17.6%) | 13,731 (18.9%) |
| 25 to 29 Minutes | 8,264 (9.6%) | 4,979 (6.8%) |
| 30 to 34 Minutes | 12,387 (14.4%) | 9,945 (13.7%) |
| 35 to 39 Minutes | 2,339 (2.7%) | 1,872 (2.6%) |
| 40 to 44 Minutes | 2,515 (2.9%) | 1,595 (2.2%) |
| 45 to 59 Minutes | 3,679 (4.3%) | 3,180 (4.4%) |
| 60 to 89 Minutes | 1,159 (1.3%) | 1,143 (1.6%) |
| 90 or more Minutes | 1,591 (1.8%) | 681 (0.9%) |
Time of Departure to Work by Sex in Hamilton County
The most frequent times of departure to work in Hamilton County are 7:30 AM to 7:59 AM (12,320, 14.3%) for males and 7:30 AM to 7:59 AM (10,446, 14.3%) for females.
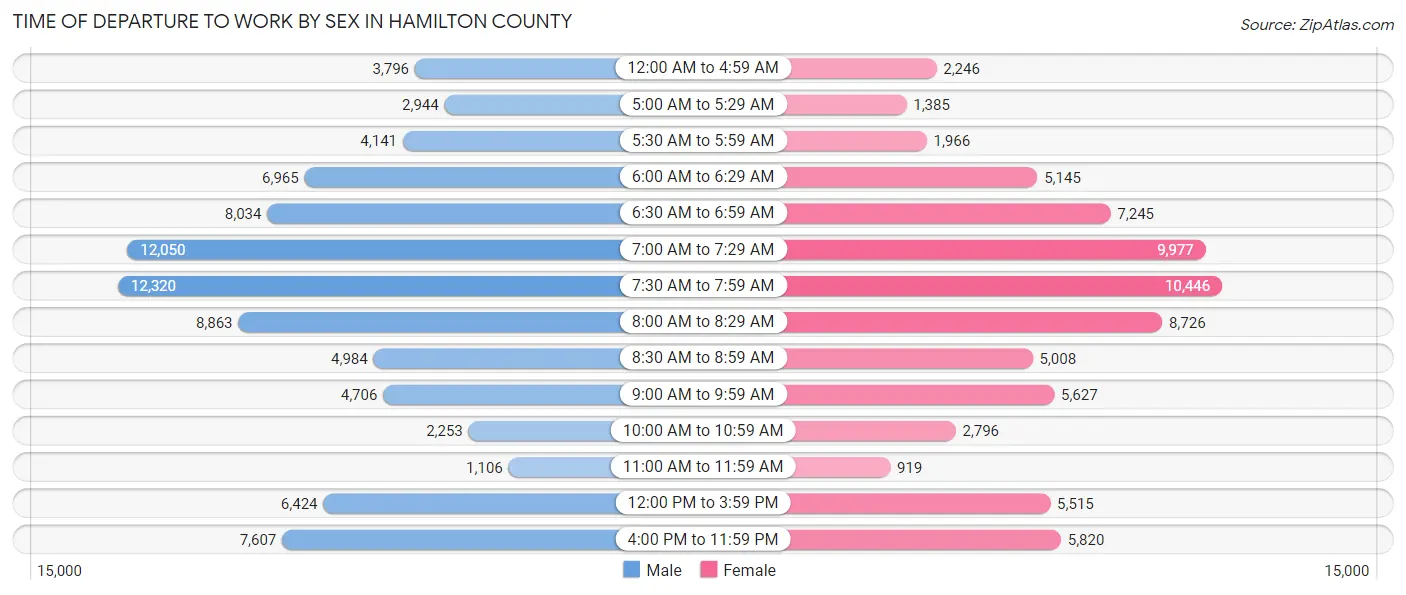
| Time of Departure | Male | Female |
| 12:00 AM to 4:59 AM | 3,796 (4.4%) | 2,246 (3.1%) |
| 5:00 AM to 5:29 AM | 2,944 (3.4%) | 1,385 (1.9%) |
| 5:30 AM to 5:59 AM | 4,141 (4.8%) | 1,966 (2.7%) |
| 6:00 AM to 6:29 AM | 6,965 (8.1%) | 5,145 (7.1%) |
| 6:30 AM to 6:59 AM | 8,034 (9.3%) | 7,245 (10.0%) |
| 7:00 AM to 7:29 AM | 12,050 (14.0%) | 9,977 (13.7%) |
| 7:30 AM to 7:59 AM | 12,320 (14.3%) | 10,446 (14.3%) |
| 8:00 AM to 8:29 AM | 8,863 (10.3%) | 8,726 (12.0%) |
| 8:30 AM to 8:59 AM | 4,984 (5.8%) | 5,008 (6.9%) |
| 9:00 AM to 9:59 AM | 4,706 (5.5%) | 5,627 (7.7%) |
| 10:00 AM to 10:59 AM | 2,253 (2.6%) | 2,796 (3.8%) |
| 11:00 AM to 11:59 AM | 1,106 (1.3%) | 919 (1.3%) |
| 12:00 PM to 3:59 PM | 6,424 (7.4%) | 5,515 (7.6%) |
| 4:00 PM to 11:59 PM | 7,607 (8.8%) | 5,820 (8.0%) |
| Total | 86,193 (100.0%) | 72,821 (100.0%) |
Housing Occupancy in Hamilton County
Occupancy by Ownership in Hamilton County
Of the total 148,888 dwellings in Hamilton County, owner-occupied units account for 96,162 (64.6%), while renter-occupied units make up 52,726 (35.4%).
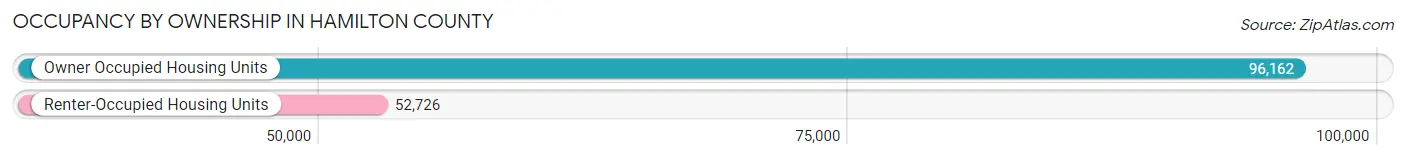
| Occupancy | # Housing Units | % Housing Units |
| Owner Occupied Housing Units | 96,162 | 64.6% |
| Renter-Occupied Housing Units | 52,726 | 35.4% |
| Total Occupied Housing Units | 148,888 | 100.0% |
Occupancy by Household Size in Hamilton County
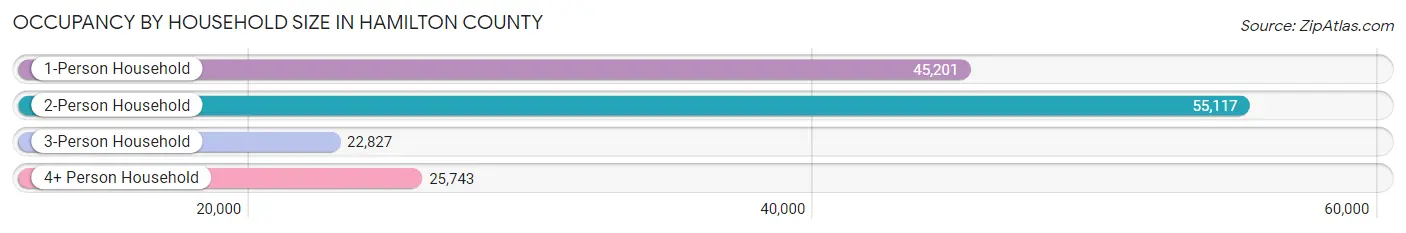
| Household Size | # Housing Units | % Housing Units |
| 1-Person Household | 45,201 | 30.4% |
| 2-Person Household | 55,117 | 37.0% |
| 3-Person Household | 22,827 | 15.3% |
| 4+ Person Household | 25,743 | 17.3% |
| Total Housing Units | 148,888 | 100.0% |
Occupancy by Ownership by Household Size in Hamilton County
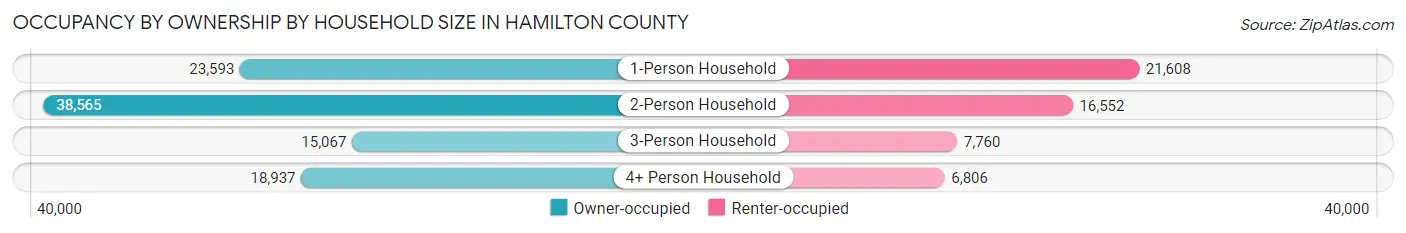
| Household Size | Owner-occupied | Renter-occupied |
| 1-Person Household | 23,593 (52.2%) | 21,608 (47.8%) |
| 2-Person Household | 38,565 (70.0%) | 16,552 (30.0%) |
| 3-Person Household | 15,067 (66.0%) | 7,760 (34.0%) |
| 4+ Person Household | 18,937 (73.6%) | 6,806 (26.4%) |
| Total Housing Units | 96,162 (64.6%) | 52,726 (35.4%) |
Occupancy by Educational Attainment in Hamilton County
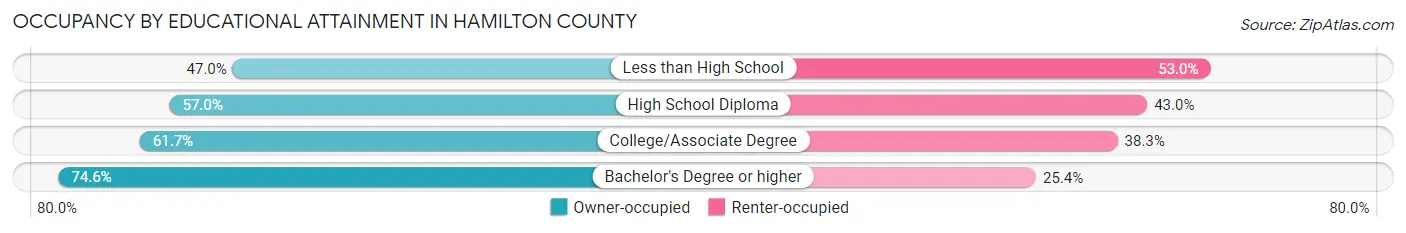
| Household Size | Owner-occupied | Renter-occupied |
| Less than High School | 5,209 (47.0%) | 5,871 (53.0%) |
| High School Diploma | 17,231 (57.0%) | 12,993 (43.0%) |
| College/Associate Degree | 31,353 (61.7%) | 19,456 (38.3%) |
| Bachelor's Degree or higher | 42,369 (74.6%) | 14,406 (25.4%) |
Occupancy by Age of Householder in Hamilton County
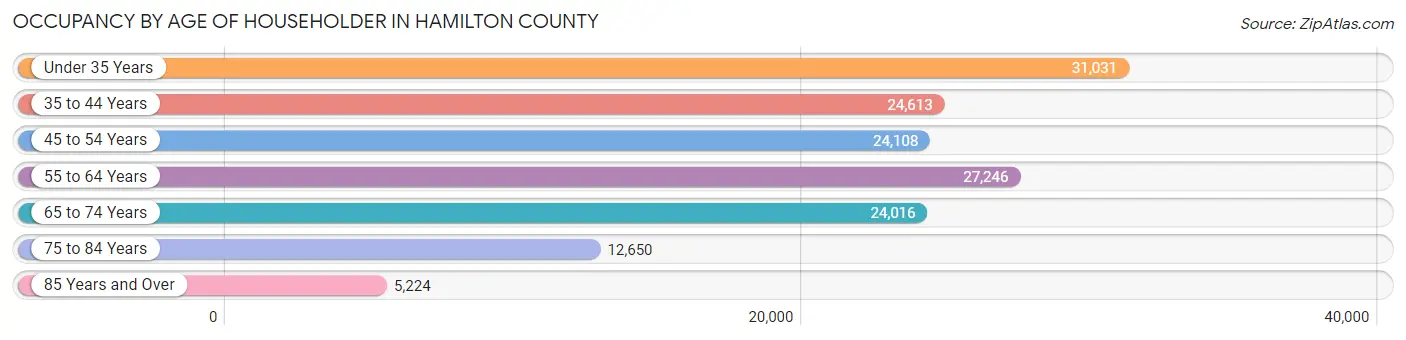
| Age Bracket | # Households | % Households |
| Under 35 Years | 31,031 | 20.8% |
| 35 to 44 Years | 24,613 | 16.5% |
| 45 to 54 Years | 24,108 | 16.2% |
| 55 to 64 Years | 27,246 | 18.3% |
| 65 to 74 Years | 24,016 | 16.1% |
| 75 to 84 Years | 12,650 | 8.5% |
| 85 Years and Over | 5,224 | 3.5% |
| Total | 148,888 | 100.0% |
Housing Finances in Hamilton County
Median Income by Occupancy in Hamilton County
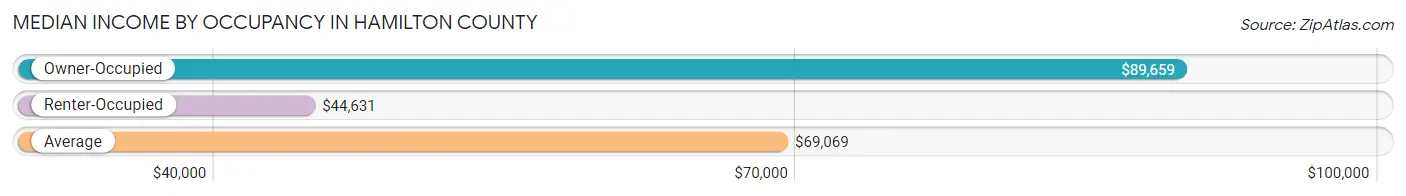
| Occupancy Type | # Households | Median Income |
| Owner-Occupied | 96,162 (64.6%) | $89,659 |
| Renter-Occupied | 52,726 (35.4%) | $44,631 |
| Average | 148,888 (100.0%) | $69,069 |
Occupancy by Householder Income Bracket in Hamilton County
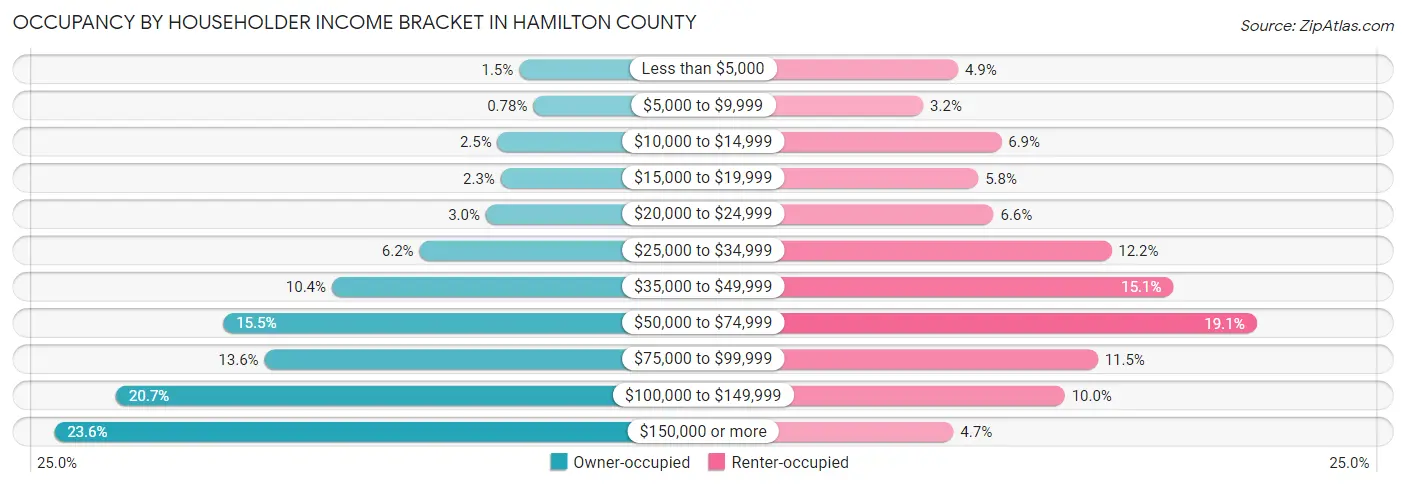
| Income Bracket | Owner-occupied | Renter-occupied |
| Less than $5,000 | 1,397 (1.5%) | 2,573 (4.9%) |
| $5,000 to $9,999 | 749 (0.8%) | 1,698 (3.2%) |
| $10,000 to $14,999 | 2,385 (2.5%) | 3,660 (6.9%) |
| $15,000 to $19,999 | 2,238 (2.3%) | 3,077 (5.8%) |
| $20,000 to $24,999 | 2,923 (3.0%) | 3,465 (6.6%) |
| $25,000 to $34,999 | 5,965 (6.2%) | 6,420 (12.2%) |
| $35,000 to $49,999 | 9,973 (10.4%) | 7,977 (15.1%) |
| $50,000 to $74,999 | 14,940 (15.5%) | 10,068 (19.1%) |
| $75,000 to $99,999 | 13,054 (13.6%) | 6,077 (11.5%) |
| $100,000 to $149,999 | 19,854 (20.6%) | 5,254 (10.0%) |
| $150,000 or more | 22,684 (23.6%) | 2,457 (4.7%) |
| Total | 96,162 (100.0%) | 52,726 (100.0%) |
Monthly Housing Cost Tiers in Hamilton County
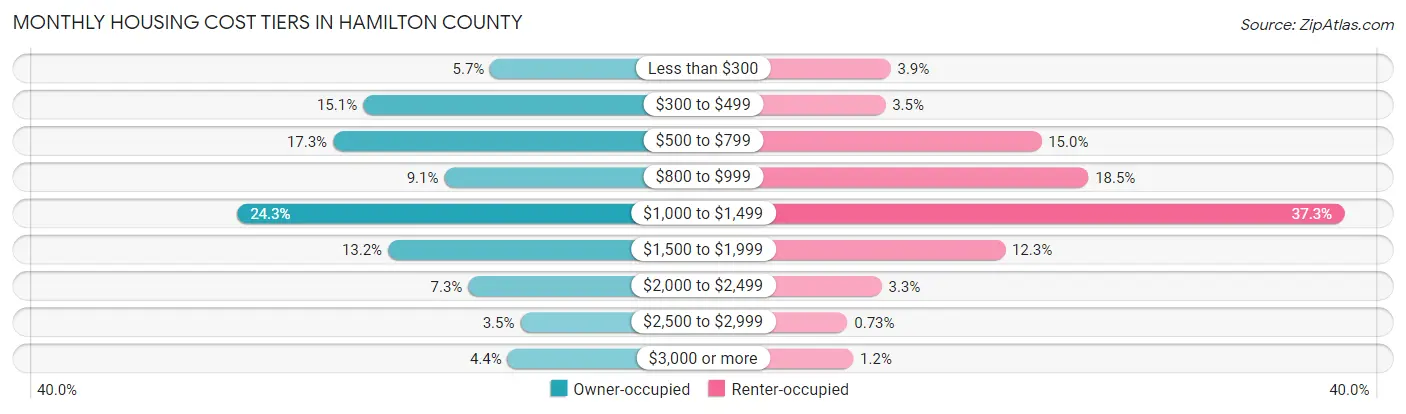
| Monthly Cost | Owner-occupied | Renter-occupied |
| Less than $300 | 5,491 (5.7%) | 2,061 (3.9%) |
| $300 to $499 | 14,499 (15.1%) | 1,858 (3.5%) |
| $500 to $799 | 16,625 (17.3%) | 7,912 (15.0%) |
| $800 to $999 | 8,742 (9.1%) | 9,736 (18.5%) |
| $1,000 to $1,499 | 23,408 (24.3%) | 19,665 (37.3%) |
| $1,500 to $1,999 | 12,735 (13.2%) | 6,505 (12.3%) |
| $2,000 to $2,499 | 7,045 (7.3%) | 1,713 (3.3%) |
| $2,500 to $2,999 | 3,356 (3.5%) | 384 (0.7%) |
| $3,000 or more | 4,261 (4.4%) | 610 (1.2%) |
| Total | 96,162 (100.0%) | 52,726 (100.0%) |
Physical Housing Characteristics in Hamilton County
Housing Structures in Hamilton County
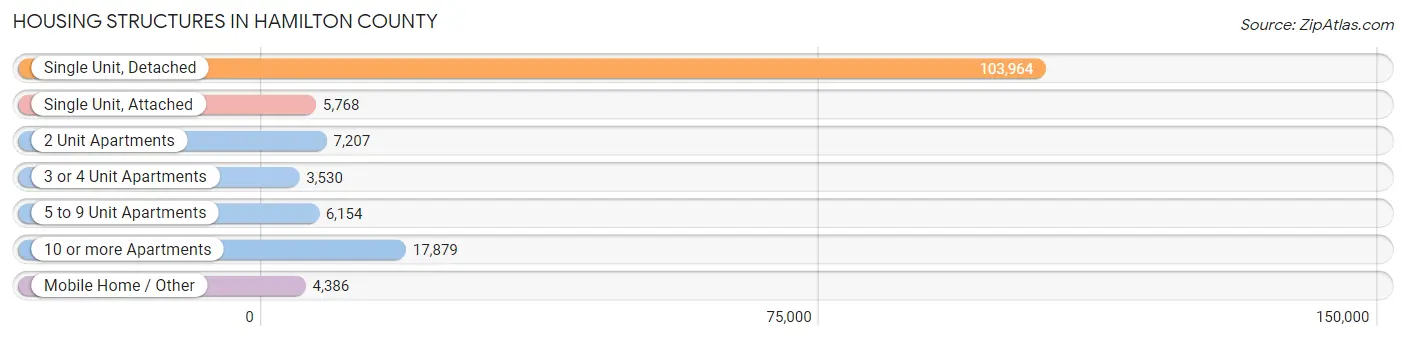
| Structure Type | # Housing Units | % Housing Units |
| Single Unit, Detached | 103,964 | 69.8% |
| Single Unit, Attached | 5,768 | 3.9% |
| 2 Unit Apartments | 7,207 | 4.8% |
| 3 or 4 Unit Apartments | 3,530 | 2.4% |
| 5 to 9 Unit Apartments | 6,154 | 4.1% |
| 10 or more Apartments | 17,879 | 12.0% |
| Mobile Home / Other | 4,386 | 2.9% |
| Total | 148,888 | 100.0% |
Housing Structures by Occupancy in Hamilton County
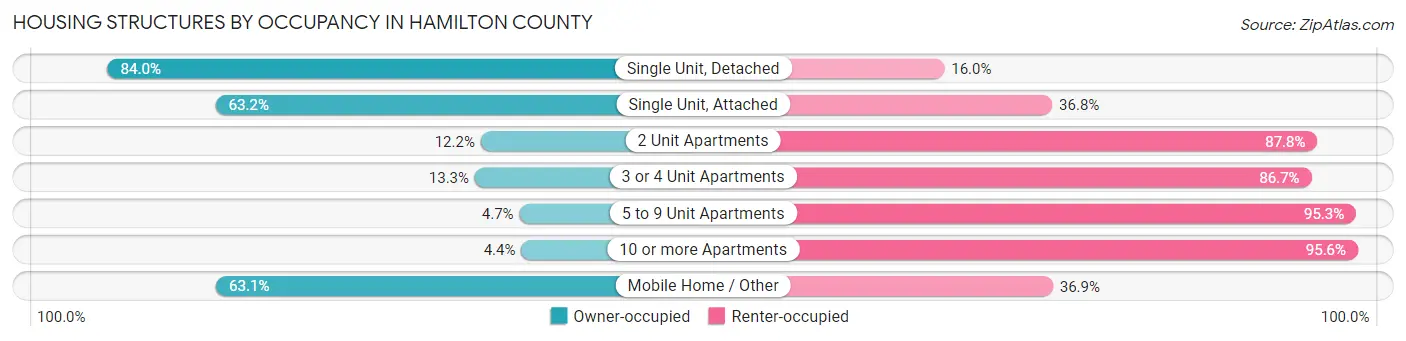
| Structure Type | Owner-occupied | Renter-occupied |
| Single Unit, Detached | 87,327 (84.0%) | 16,637 (16.0%) |
| Single Unit, Attached | 3,647 (63.2%) | 2,121 (36.8%) |
| 2 Unit Apartments | 878 (12.2%) | 6,329 (87.8%) |
| 3 or 4 Unit Apartments | 470 (13.3%) | 3,060 (86.7%) |
| 5 to 9 Unit Apartments | 291 (4.7%) | 5,863 (95.3%) |
| 10 or more Apartments | 781 (4.4%) | 17,098 (95.6%) |
| Mobile Home / Other | 2,768 (63.1%) | 1,618 (36.9%) |
| Total | 96,162 (64.6%) | 52,726 (35.4%) |
Housing Structures by Number of Rooms in Hamilton County
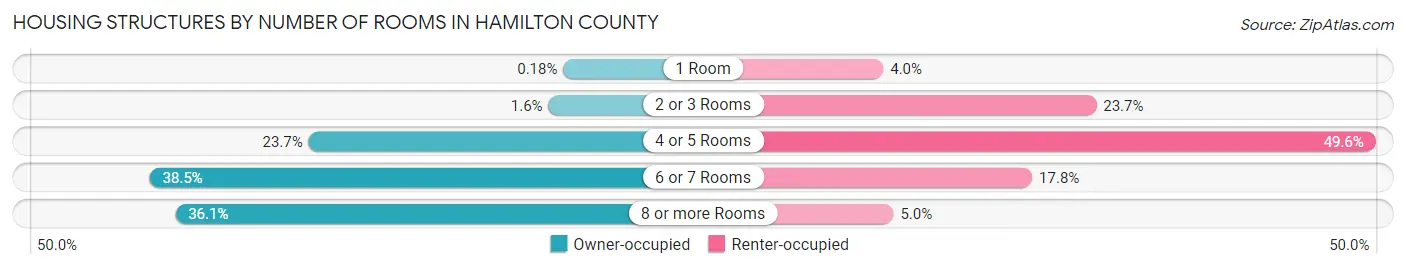
| Number of Rooms | Owner-occupied | Renter-occupied |
| 1 Room | 176 (0.2%) | 2,112 (4.0%) |
| 2 or 3 Rooms | 1,490 (1.5%) | 12,503 (23.7%) |
| 4 or 5 Rooms | 22,830 (23.7%) | 26,126 (49.5%) |
| 6 or 7 Rooms | 36,977 (38.5%) | 9,376 (17.8%) |
| 8 or more Rooms | 34,689 (36.1%) | 2,609 (5.0%) |
| Total | 96,162 (100.0%) | 52,726 (100.0%) |
Housing Structure by Heating Type in Hamilton County
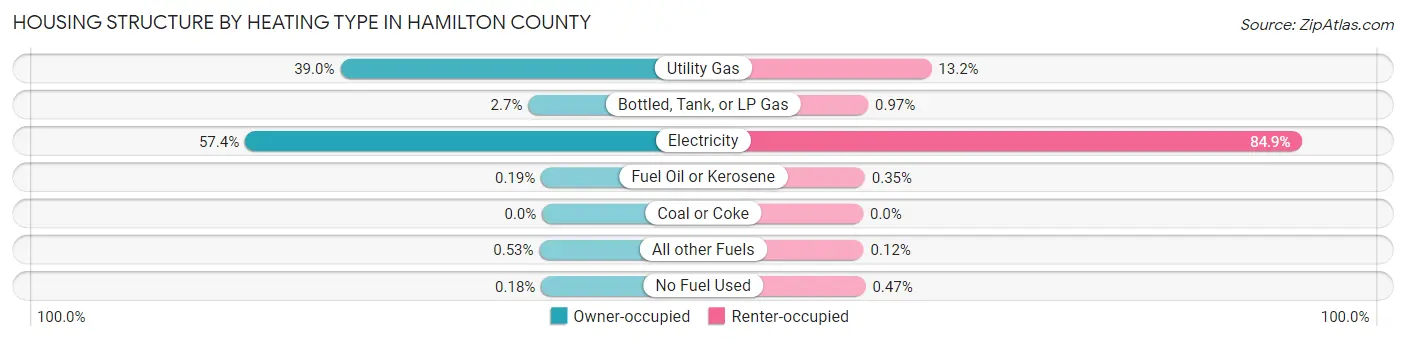
| Heating Type | Owner-occupied | Renter-occupied |
| Utility Gas | 37,516 (39.0%) | 6,964 (13.2%) |
| Bottled, Tank, or LP Gas | 2,580 (2.7%) | 509 (1.0%) |
| Electricity | 55,208 (57.4%) | 44,756 (84.9%) |
| Fuel Oil or Kerosene | 183 (0.2%) | 183 (0.4%) |
| Coal or Coke | 0 (0.0%) | 0 (0.0%) |
| All other Fuels | 506 (0.5%) | 65 (0.1%) |
| No Fuel Used | 169 (0.2%) | 249 (0.5%) |
| Total | 96,162 (100.0%) | 52,726 (100.0%) |
Household Vehicle Usage in Hamilton County
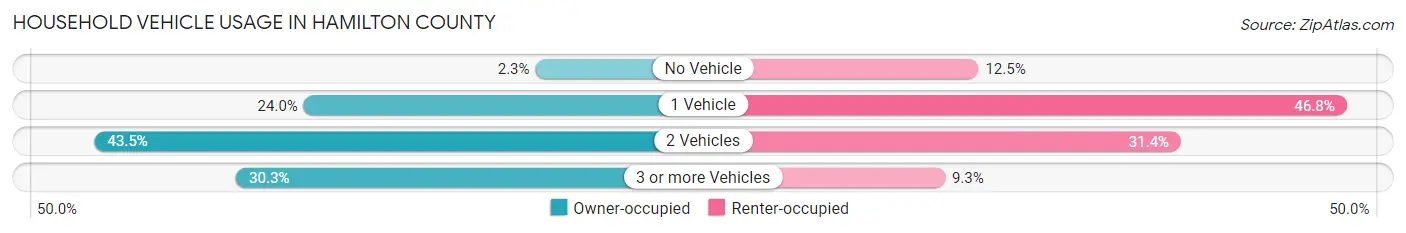
| Vehicles per Household | Owner-occupied | Renter-occupied |
| No Vehicle | 2,231 (2.3%) | 6,577 (12.5%) |
| 1 Vehicle | 23,032 (23.9%) | 24,690 (46.8%) |
| 2 Vehicles | 41,810 (43.5%) | 16,537 (31.4%) |
| 3 or more Vehicles | 29,089 (30.2%) | 4,922 (9.3%) |
| Total | 96,162 (100.0%) | 52,726 (100.0%) |
Real Estate & Mortgages in Hamilton County
Real Estate and Mortgage Overview in Hamilton County
| Characteristic | Without Mortgage | With Mortgage |
| Housing Units | 37,969 | 58,193 |
| Median Property Value | $244,100 | $255,200 |
| Median Household Income | $65,795 | $16,428 |
| Monthly Housing Costs | $494 | $4,136 |
| Real Estate Taxes | $1,854 | $1,201 |
Property Value by Mortgage Status in Hamilton County
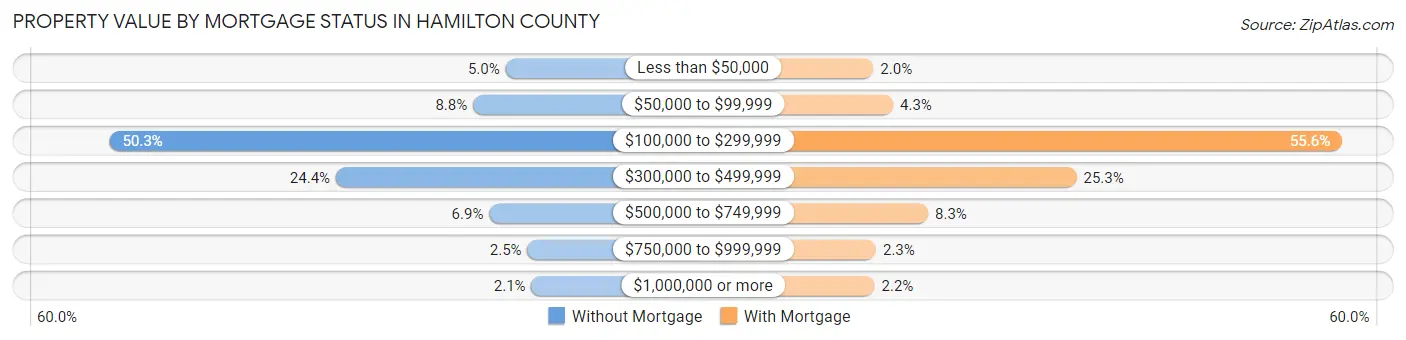
| Property Value | Without Mortgage | With Mortgage |
| Less than $50,000 | 1,908 (5.0%) | 1,190 (2.0%) |
| $50,000 to $99,999 | 3,321 (8.7%) | 2,499 (4.3%) |
| $100,000 to $299,999 | 19,100 (50.3%) | 32,348 (55.6%) |
| $300,000 to $499,999 | 9,271 (24.4%) | 14,698 (25.3%) |
| $500,000 to $749,999 | 2,618 (6.9%) | 4,825 (8.3%) |
| $750,000 to $999,999 | 962 (2.5%) | 1,364 (2.3%) |
| $1,000,000 or more | 789 (2.1%) | 1,269 (2.2%) |
| Total | 37,969 (100.0%) | 58,193 (100.0%) |
Household Income by Mortgage Status in Hamilton County
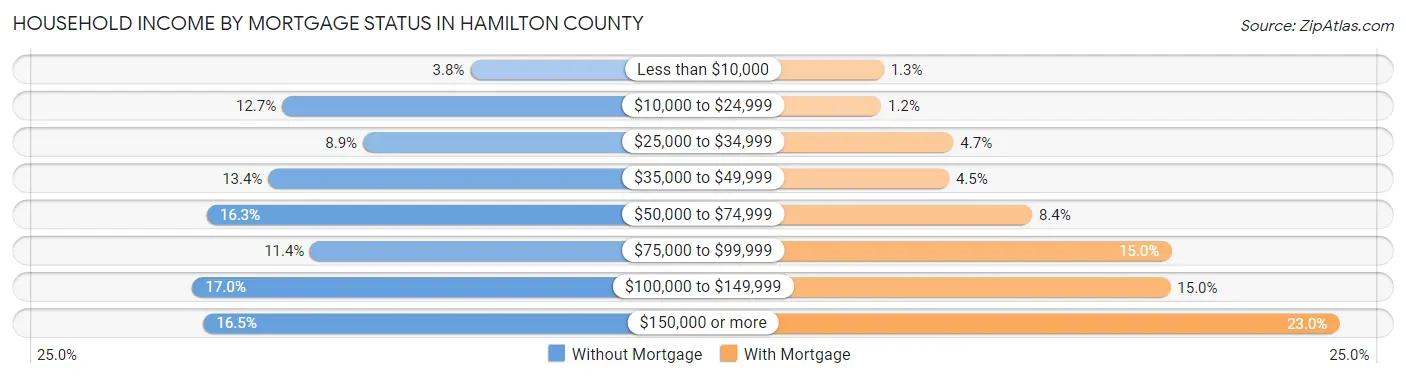
| Household Income | Without Mortgage | With Mortgage |
| Less than $10,000 | 1,435 (3.8%) | 782 (1.3%) |
| $10,000 to $24,999 | 4,837 (12.7%) | 711 (1.2%) |
| $25,000 to $34,999 | 3,376 (8.9%) | 2,709 (4.7%) |
| $35,000 to $49,999 | 5,086 (13.4%) | 2,589 (4.4%) |
| $50,000 to $74,999 | 6,196 (16.3%) | 4,887 (8.4%) |
| $75,000 to $99,999 | 4,328 (11.4%) | 8,744 (15.0%) |
| $100,000 to $149,999 | 6,455 (17.0%) | 8,726 (15.0%) |
| $150,000 or more | 6,256 (16.5%) | 13,399 (23.0%) |
| Total | 37,969 (100.0%) | 58,193 (100.0%) |
Property Value to Household Income Ratio in Hamilton County
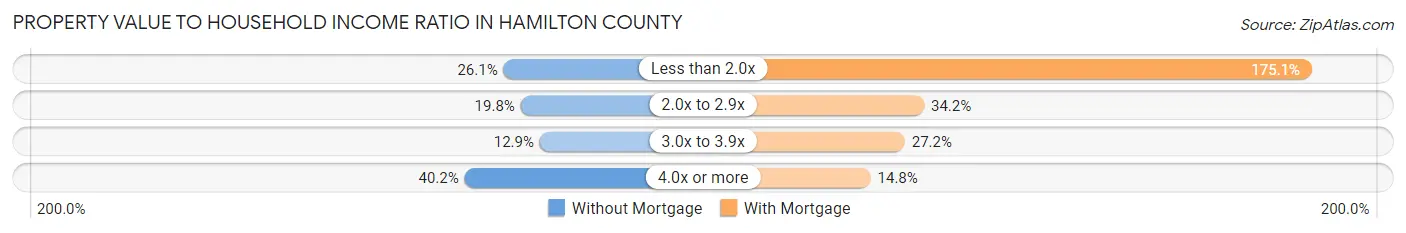
| Value-to-Income Ratio | Without Mortgage | With Mortgage |
| Less than 2.0x | 9,893 (26.1%) | 101,864 (175.0%) |
| 2.0x to 2.9x | 7,525 (19.8%) | 19,897 (34.2%) |
| 3.0x to 3.9x | 4,892 (12.9%) | 15,829 (27.2%) |
| 4.0x or more | 15,258 (40.2%) | 8,602 (14.8%) |
| Total | 37,969 (100.0%) | 58,193 (100.0%) |
Real Estate Taxes by Mortgage Status in Hamilton County
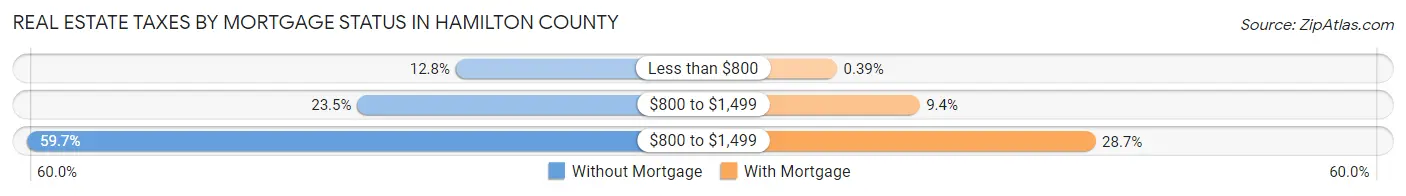
| Property Taxes | Without Mortgage | With Mortgage |
| Less than $800 | 4,841 (12.8%) | 228 (0.4%) |
| $800 to $1,499 | 8,938 (23.5%) | 5,492 (9.4%) |
| $800 to $1,499 | 22,677 (59.7%) | 16,711 (28.7%) |
| Total | 37,969 (100.0%) | 58,193 (100.0%) |
Health & Disability in Hamilton County
Health Insurance Coverage by Age in Hamilton County
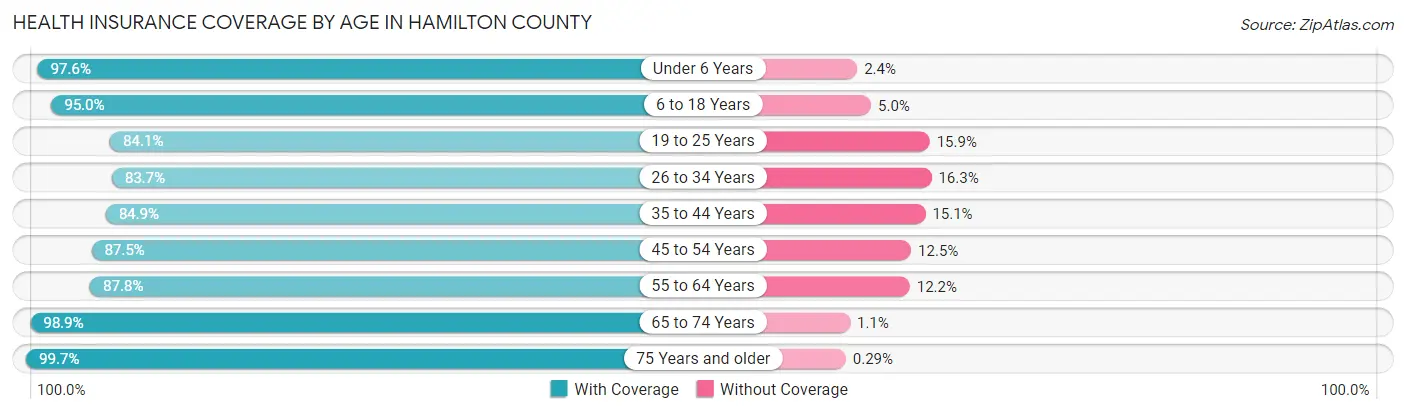
| Age Bracket | With Coverage | Without Coverage |
| Under 6 Years | 23,864 (97.6%) | 589 (2.4%) |
| 6 to 18 Years | 53,763 (95.0%) | 2,826 (5.0%) |
| 19 to 25 Years | 27,482 (84.1%) | 5,206 (15.9%) |
| 26 to 34 Years | 38,563 (83.7%) | 7,489 (16.3%) |
| 35 to 44 Years | 38,943 (84.9%) | 6,945 (15.1%) |
| 45 to 54 Years | 39,509 (87.5%) | 5,628 (12.5%) |
| 55 to 64 Years | 42,105 (87.8%) | 5,860 (12.2%) |
| 65 to 74 Years | 38,081 (98.9%) | 413 (1.1%) |
| 75 Years and older | 26,167 (99.7%) | 77 (0.3%) |
| Total | 328,477 (90.4%) | 35,033 (9.6%) |
Health Insurance Coverage by Citizenship Status in Hamilton County
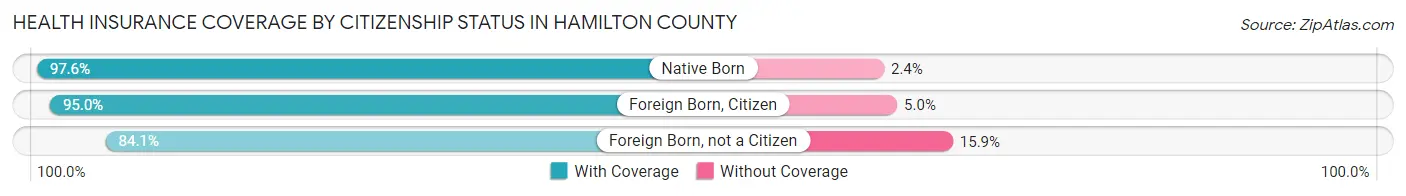
| Citizenship Status | With Coverage | Without Coverage |
| Native Born | 23,864 (97.6%) | 589 (2.4%) |
| Foreign Born, Citizen | 53,763 (95.0%) | 2,826 (5.0%) |
| Foreign Born, not a Citizen | 27,482 (84.1%) | 5,206 (15.9%) |
Health Insurance Coverage by Household Income in Hamilton County
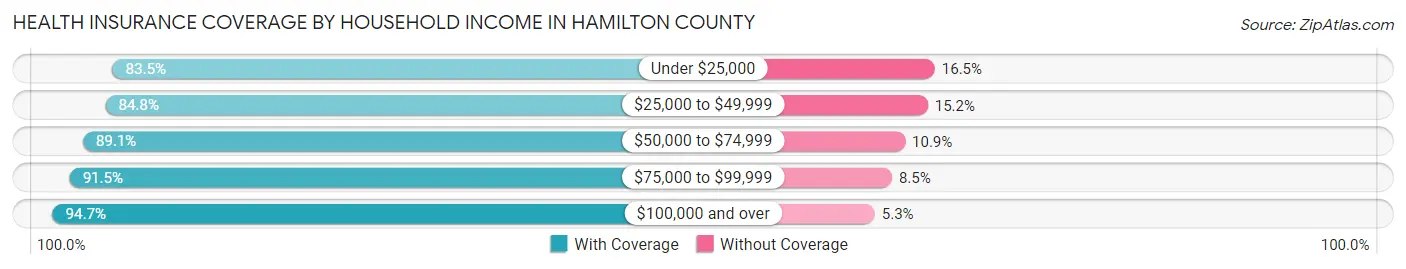
| Household Income | With Coverage | Without Coverage |
| Under $25,000 | 34,806 (83.5%) | 6,876 (16.5%) |
| $25,000 to $49,999 | 49,558 (84.8%) | 8,863 (15.2%) |
| $50,000 to $74,999 | 51,483 (89.1%) | 6,317 (10.9%) |
| $75,000 to $99,999 | 46,381 (91.5%) | 4,285 (8.5%) |
| $100,000 and over | 140,012 (94.7%) | 7,777 (5.3%) |
Public vs Private Health Insurance Coverage by Age in Hamilton County
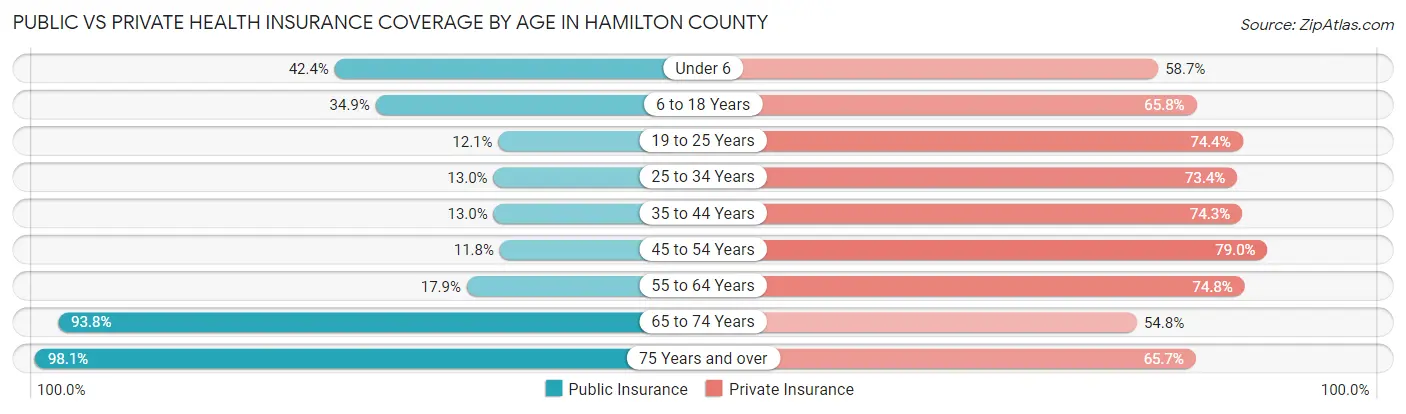
| Age Bracket | Public Insurance | Private Insurance |
| Under 6 | 10,379 (42.4%) | 14,362 (58.7%) |
| 6 to 18 Years | 19,722 (34.8%) | 37,240 (65.8%) |
| 19 to 25 Years | 3,941 (12.1%) | 24,313 (74.4%) |
| 25 to 34 Years | 5,976 (13.0%) | 33,792 (73.4%) |
| 35 to 44 Years | 5,945 (13.0%) | 34,084 (74.3%) |
| 45 to 54 Years | 5,321 (11.8%) | 35,654 (79.0%) |
| 55 to 64 Years | 8,596 (17.9%) | 35,863 (74.8%) |
| 65 to 74 Years | 36,102 (93.8%) | 21,092 (54.8%) |
| 75 Years and over | 25,741 (98.1%) | 17,237 (65.7%) |
| Total | 121,723 (33.5%) | 253,637 (69.8%) |
Disability Status by Sex by Age in Hamilton County
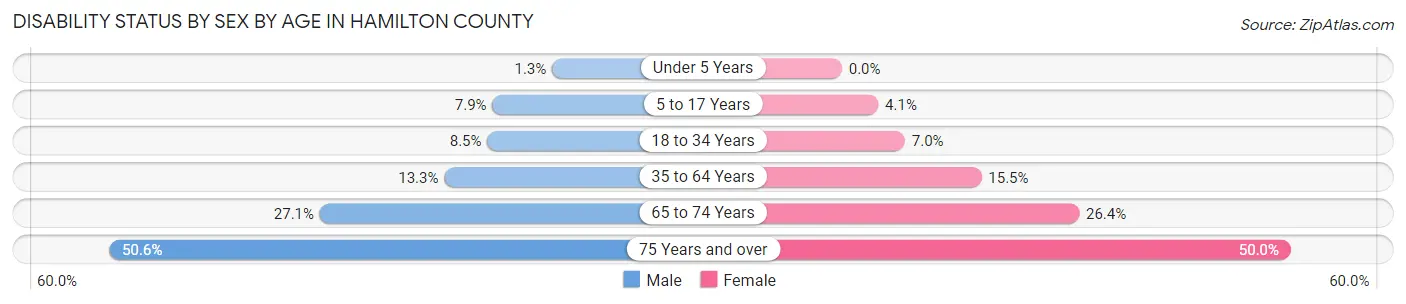
| Age Bracket | Male | Female |
| Under 5 Years | 133 (1.3%) | 0 (0.0%) |
| 5 to 17 Years | 2,235 (7.9%) | 1,089 (4.1%) |
| 18 to 34 Years | 3,459 (8.5%) | 2,999 (7.0%) |
| 35 to 64 Years | 9,012 (13.3%) | 11,035 (15.5%) |
| 65 to 74 Years | 4,910 (27.1%) | 5,387 (26.4%) |
| 75 Years and over | 5,222 (50.6%) | 7,963 (50.0%) |
Disability Class by Sex by Age in Hamilton County
Disability Class: Hearing Difficulty
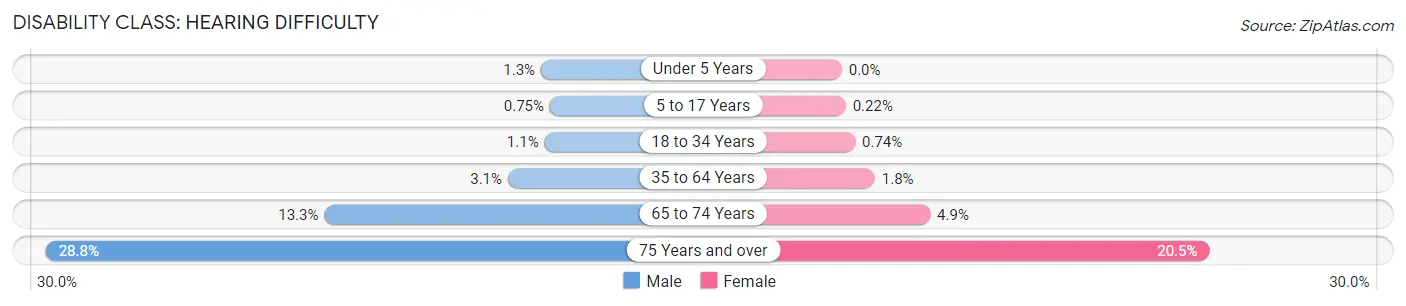
| Age Bracket | Male | Female |
| Under 5 Years | 133 (1.3%) | 0 (0.0%) |
| 5 to 17 Years | 211 (0.7%) | 58 (0.2%) |
| 18 to 34 Years | 428 (1.1%) | 318 (0.7%) |
| 35 to 64 Years | 2,100 (3.1%) | 1,309 (1.8%) |
| 65 to 74 Years | 2,410 (13.3%) | 1,004 (4.9%) |
| 75 Years and over | 2,974 (28.8%) | 3,258 (20.5%) |
Disability Class: Vision Difficulty
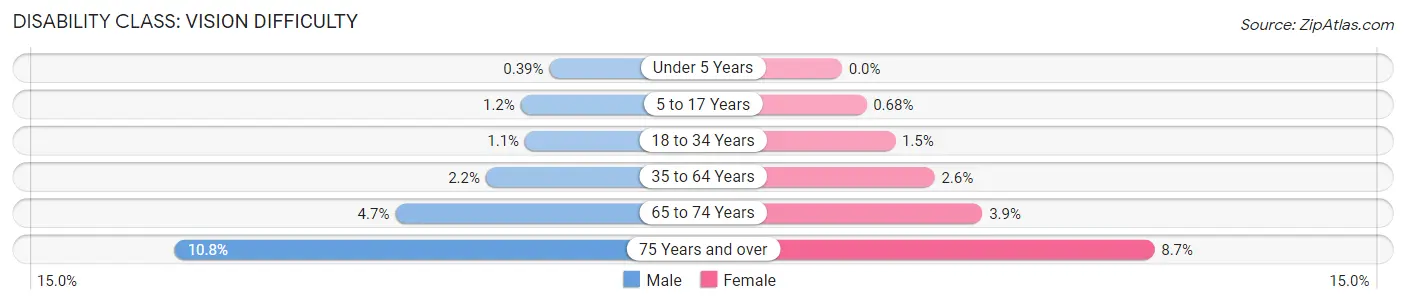
| Age Bracket | Male | Female |
| Under 5 Years | 42 (0.4%) | 0 (0.0%) |
| 5 to 17 Years | 338 (1.2%) | 184 (0.7%) |
| 18 to 34 Years | 437 (1.1%) | 632 (1.5%) |
| 35 to 64 Years | 1,471 (2.2%) | 1,832 (2.6%) |
| 65 to 74 Years | 847 (4.7%) | 798 (3.9%) |
| 75 Years and over | 1,117 (10.8%) | 1,385 (8.7%) |
Disability Class: Cognitive Difficulty
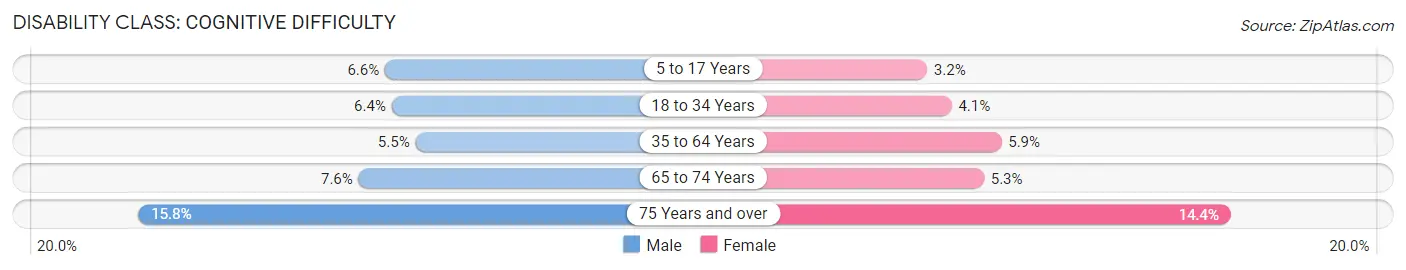
| Age Bracket | Male | Female |
| 5 to 17 Years | 1,872 (6.6%) | 850 (3.2%) |
| 18 to 34 Years | 2,606 (6.4%) | 1,739 (4.1%) |
| 35 to 64 Years | 3,733 (5.5%) | 4,206 (5.9%) |
| 65 to 74 Years | 1,375 (7.6%) | 1,074 (5.3%) |
| 75 Years and over | 1,628 (15.8%) | 2,299 (14.4%) |
Disability Class: Ambulatory Difficulty
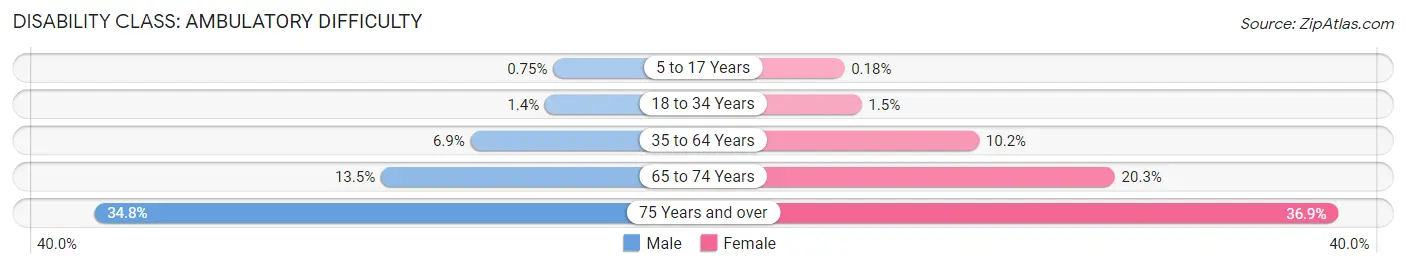
| Age Bracket | Male | Female |
| 5 to 17 Years | 211 (0.7%) | 49 (0.2%) |
| 18 to 34 Years | 556 (1.4%) | 624 (1.5%) |
| 35 to 64 Years | 4,684 (6.9%) | 7,233 (10.2%) |
| 65 to 74 Years | 2,451 (13.5%) | 4,131 (20.3%) |
| 75 Years and over | 3,594 (34.8%) | 5,869 (36.9%) |
Disability Class: Self-Care Difficulty
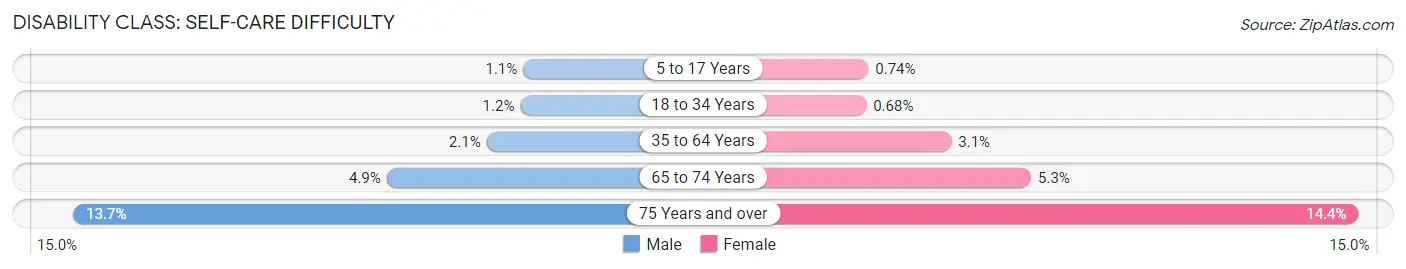
| Age Bracket | Male | Female |
| 5 to 17 Years | 317 (1.1%) | 199 (0.7%) |
| 18 to 34 Years | 489 (1.2%) | 292 (0.7%) |
| 35 to 64 Years | 1,453 (2.1%) | 2,166 (3.0%) |
| 65 to 74 Years | 890 (4.9%) | 1,075 (5.3%) |
| 75 Years and over | 1,409 (13.7%) | 2,290 (14.4%) |
Technology Access in Hamilton County
Computing Device Access in Hamilton County
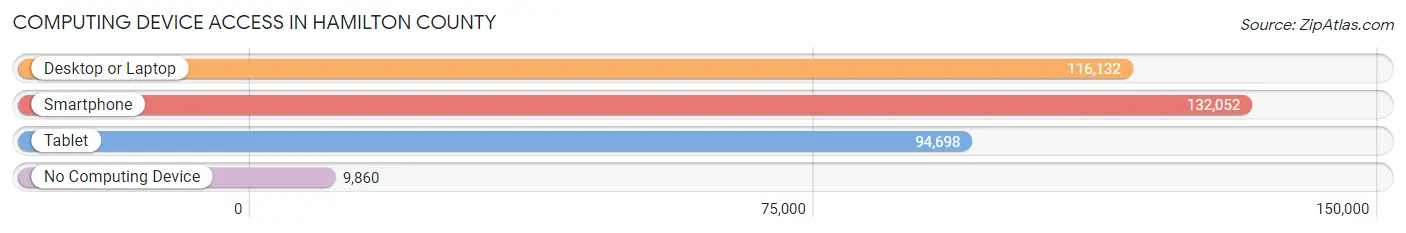
| Device Type | # Households | % Households |
| Desktop or Laptop | 116,132 | 78.0% |
| Smartphone | 132,052 | 88.7% |
| Tablet | 94,698 | 63.6% |
| No Computing Device | 9,860 | 6.6% |
| Total | 148,888 | 100.0% |
Internet Access in Hamilton County
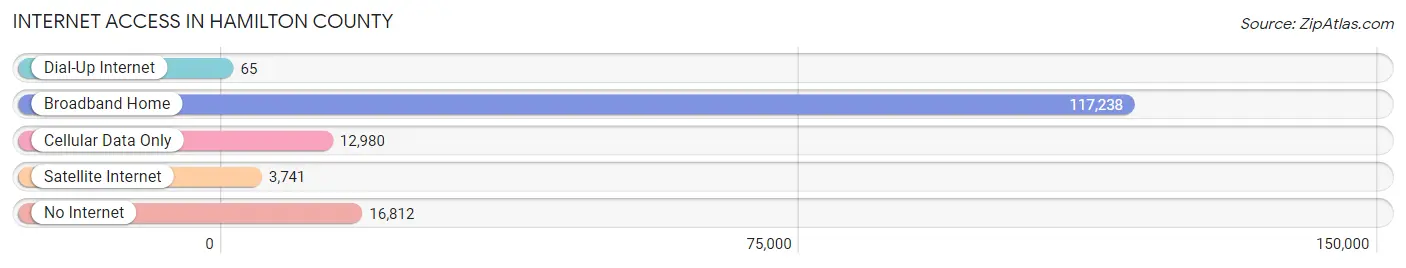
| Internet Type | # Households | % Households |
| Dial-Up Internet | 65 | 0.0% |
| Broadband Home | 117,238 | 78.7% |
| Cellular Data Only | 12,980 | 8.7% |
| Satellite Internet | 3,741 | 2.5% |
| No Internet | 16,812 | 11.3% |
| Total | 148,888 | 100.0% |
Hamilton County Summary
Hamilton County, Tennessee is located in the southeastern part of the state and is part of the Chattanooga metropolitan area. It is bordered by Bradley County to the north, Rhea County to the east, Marion County to the south, and Sequatchie County to the west. The county seat is Chattanooga, which is also the fourth-largest city in the state. Hamilton County is the fourth-most populous county in Tennessee, with a population of 363,000 as of the 2020 census.
History
Hamilton County was established in 1819 and named after Alexander Hamilton, the first Secretary of the Treasury. The county was originally part of the Cherokee Nation, and the area was home to several Native American tribes, including the Chickamauga, the Creek, and the Cherokee. The area was first settled by Europeans in the late 1700s, and the county was officially established in 1819.
The county was initially part of the larger Hamilton County, which included parts of present-day Bradley, Marion, and Sequatchie counties. In 1839, the county was divided into its current boundaries.
During the Civil War, the county was the site of several battles, including the Battle of Chickamauga in 1863. The county was also the site of the Chattanooga Campaign, which was a series of battles fought in the area in 1863.
Geography
Hamilton County is located in the southeastern part of Tennessee and is part of the Chattanooga metropolitan area. It is bordered by Bradley County to the north, Rhea County to the east, Marion County to the south, and Sequatchie County to the west. The county covers an area of 517 square miles and is home to several rivers, including the Tennessee River, the Chickamauga River, and the Hiwassee River.
The county is located in the Cumberland Plateau region of Tennessee and is home to several mountain ranges, including the Cumberland Mountains, the Lookout Mountain Range, and the Walden Ridge. The county is also home to several state parks, including Chickamauga and Chattanooga National Military Park, Harrison Bay State Park, and Prentice Cooper State Forest.
Economy
The economy of Hamilton County is largely based on manufacturing, healthcare, and tourism. The county is home to several major employers, including Volkswagen, Amazon, and Erlanger Health System. The county is also home to several universities, including the University of Tennessee at Chattanooga, Chattanooga State Community College, and Southern Adventist University.
Tourism is also an important part of the county's economy. The county is home to several attractions, including the Tennessee Aquarium, the Chattanooga Choo Choo, and the Lookout Mountain Incline Railway.
Demographics
As of the 2020 census, Hamilton County had a population of 363,000. The population is made up of a diverse mix of races and ethnicities, including White (68.3%), Black or African American (20.2%), Hispanic or Latino (7.2%), Asian (2.3%), and Native American (0.7%).
The median household income in the county is $50,000, and the median home value is $170,000. The county has a poverty rate of 16.3%, and the unemployment rate is 4.2%.
Conclusion
Hamilton County, Tennessee is a diverse and vibrant county located in the southeastern part of the state. The county is home to several major employers, universities, and attractions, and it has a strong economy based on manufacturing, healthcare, and tourism. The county is also home to a diverse population, with a mix of races and ethnicities. Hamilton County is an important part of the Chattanooga metropolitan area and is an important contributor to the state's economy.
Common Questions
What is the Total Population of Hamilton County?
Total Population of Hamilton County is 367,193.
What is the Total Male Population of Hamilton County?
Total Male Population of Hamilton County is 178,248.
What is the Total Female Population of Hamilton County?
Total Female Population of Hamilton County is 188,945.
What is the Ratio of Males per 100 Females in Hamilton County?
There are 94.34 Males per 100 Females in Hamilton County.
What is the Ratio of Females per 100 Males in Hamilton County?
There are 106.00 Females per 100 Males in Hamilton County.
What is the Median Population Age in Hamilton County?
Median Population Age in Hamilton County is 39.7 Years.
What is the Average Family Size in Hamilton County
Average Family Size in Hamilton County is 3.0 People.
What is the Average Household Size in Hamilton County
Average Household Size in Hamilton County is 2.4 People.
What is Per Capita Income in Hamilton County?
Per Capita income in Hamilton County is $41,198.
What is the Median Family Income in Hamilton County?
Median Family Income in Hamilton County is $90,913.
What is the Median Household income in Hamilton County?
Median Household Income in Hamilton County is $69,069.
What is Income or Wage Gap in Hamilton County?
Income or Wage Gap in Hamilton County is 26.5%.
Women in Hamilton County earn 73.5 cents for every dollar earned by a man.
What is Family Income Deficit in Hamilton County?
Family Income Deficit in Hamilton County is $11,891.
Families that are below poverty line in Hamilton County earn $11,891 less on average than the poverty threshold level.
What is Inequality or Gini Index in Hamilton County?
Inequality or Gini Index in Hamilton County is 0.48.
How Large is the Labor Force in Hamilton County?
There are 191,297 People in the Labor Forcein in Hamilton County.
What is the Percentage of People in the Labor Force in Hamilton County?
63.8% of People are in the Labor Force in Hamilton County.
What is the Unemployment Rate in Hamilton County?
Unemployment Rate in Hamilton County is 4.4%.