Greene County, TN
Greene County Map
Greene County Overview
70,399
TOTAL POPULATION
34,731
MALE POPULATION
35,668
FEMALE POPULATION
97.37
MALES / 100 FEMALES
102.70
FEMALES / 100 MALES
44.7
MEDIAN AGE
3.0
AVG FAMILY SIZE
2.5
AVG HOUSEHOLD SIZE
$28,237
PER CAPITA INCOME
$67,267
AVG FAMILY INCOME
$51,975
AVG HOUSEHOLD INCOME
23.3%
WAGE / INCOME GAP [ % ]
76.7¢/ $1
WAGE / INCOME GAP [ $ ]
$10,855
FAMILY INCOME DEFICIT
0.45
INEQUALITY / GINI INDEX
30,947
LABOR FORCE [ PEOPLE ]
52.9%
PERCENT IN LABOR FORCE
5.4%
UNEMPLOYMENT RATE
Greene County Area Codes
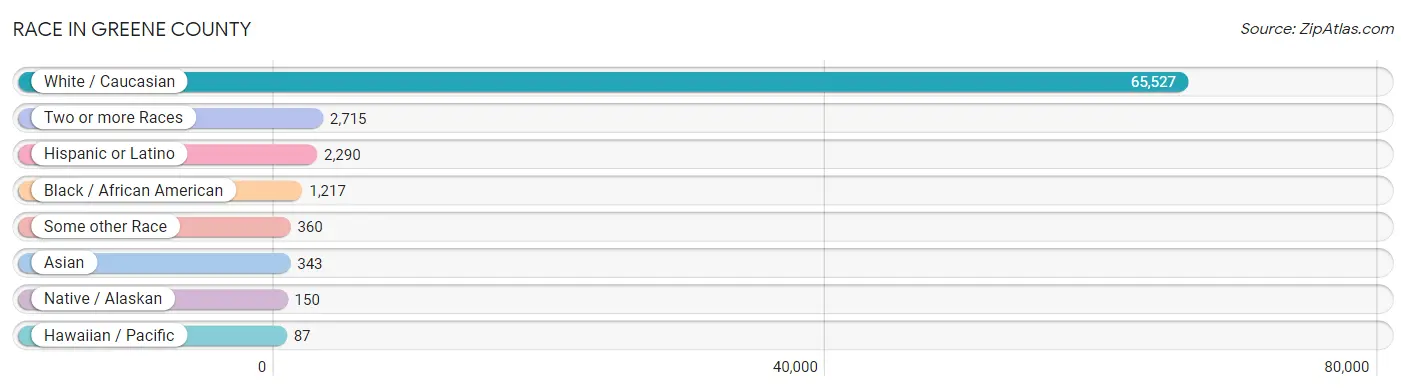
Race in Greene County
The most populous races in Greene County are White / Caucasian (65,527 | 93.1%), Two or more Races (2,715 | 3.9%), and Hispanic or Latino (2,290 | 3.3%).
| Race | # Population | % Population |
| Asian | 343 | 0.5% |
| Black / African American | 1,217 | 1.7% |
| Hawaiian / Pacific | 87 | 0.1% |
| Hispanic or Latino | 2,290 | 3.3% |
| Native / Alaskan | 150 | 0.2% |
| White / Caucasian | 65,527 | 93.1% |
| Two or more Races | 2,715 | 3.9% |
| Some other Race | 360 | 0.5% |
| Total | 70,399 | 100.0% |
Ancestry in Greene County
The most populous ancestries reported in Greene County are American (13,261 | 18.8%), English (9,421 | 13.4%), German (7,855 | 11.2%), Irish (7,138 | 10.1%), and Italian (1,576 | 2.2%), together accounting for 55.8% of all Greene County residents.

| Ancestry | # Population | % Population |
| African | 106 | 0.2% |
| Alaska Native | 6 | 0.0% |
| Alaskan Athabascan | 16 | 0.0% |
| American | 13,261 | 18.8% |
| Apache | 5 | 0.0% |
| Arab | 56 | 0.1% |
| Argentinean | 46 | 0.1% |
| Armenian | 7 | 0.0% |
| Australian | 8 | 0.0% |
| Austrian | 15 | 0.0% |
| Belgian | 51 | 0.1% |
| Bhutanese | 10 | 0.0% |
| Blackfeet | 9 | 0.0% |
| British | 423 | 0.6% |
| Burmese | 257 | 0.4% |
| Canadian | 97 | 0.1% |
| Celtic | 131 | 0.2% |
| Central American | 36 | 0.1% |
| Central American Indian | 35 | 0.1% |
| Cherokee | 300 | 0.4% |
| Chickasaw | 16 | 0.0% |
| Chippewa | 22 | 0.0% |
| Choctaw | 2 | 0.0% |
| Colombian | 38 | 0.1% |
| Cuban | 53 | 0.1% |
| Czech | 43 | 0.1% |
| Czechoslovakian | 18 | 0.0% |
| Danish | 39 | 0.1% |
| Delaware | 10 | 0.0% |
| Dutch | 510 | 0.7% |
| Eastern European | 18 | 0.0% |
| Egyptian | 16 | 0.0% |
| English | 9,421 | 13.4% |
| Estonian | 12 | 0.0% |
| Ethiopian | 33 | 0.1% |
| European | 646 | 0.9% |
| Filipino | 10 | 0.0% |
| Finnish | 6 | 0.0% |
| French | 480 | 0.7% |
| French Canadian | 171 | 0.2% |
| German | 7,855 | 11.2% |
| Greek | 45 | 0.1% |
| Guamanian / Chamorro | 40 | 0.1% |
| Guatemalan | 36 | 0.1% |
| Hungarian | 129 | 0.2% |
| Indian (Asian) | 36 | 0.1% |
| Irish | 7,138 | 10.1% |
| Iroquois | 4 | 0.0% |
| Italian | 1,576 | 2.2% |
| Jamaican | 56 | 0.1% |
| Korean | 50 | 0.1% |
| Laotian | 10 | 0.0% |
| Lebanese | 21 | 0.0% |
| Lithuanian | 26 | 0.0% |
| Malaysian | 2 | 0.0% |
| Mexican | 1,559 | 2.2% |
| Native Hawaiian | 25 | 0.0% |
| Northern European | 28 | 0.0% |
| Norwegian | 292 | 0.4% |
| Ottawa | 14 | 0.0% |
| Paraguayan | 3 | 0.0% |
| Pennsylvania German | 22 | 0.0% |
| Polish | 627 | 0.9% |
| Portuguese | 213 | 0.3% |
| Puerto Rican | 309 | 0.4% |
| Romanian | 11 | 0.0% |
| Russian | 114 | 0.2% |
| Samoan | 11 | 0.0% |
| Scandinavian | 220 | 0.3% |
| Scotch-Irish | 1,384 | 2.0% |
| Scottish | 1,196 | 1.7% |
| Sioux | 9 | 0.0% |
| Slavic | 27 | 0.0% |
| Slovak | 20 | 0.0% |
| South American | 87 | 0.1% |
| Spaniard | 33 | 0.1% |
| Spanish | 30 | 0.0% |
| Spanish American Indian | 94 | 0.1% |
| Sri Lankan | 93 | 0.1% |
| Subsaharan African | 139 | 0.2% |
| Swedish | 184 | 0.3% |
| Swiss | 62 | 0.1% |
| Thai | 29 | 0.0% |
| Ukrainian | 127 | 0.2% |
| Welsh | 527 | 0.7% | View All 85 Rows |
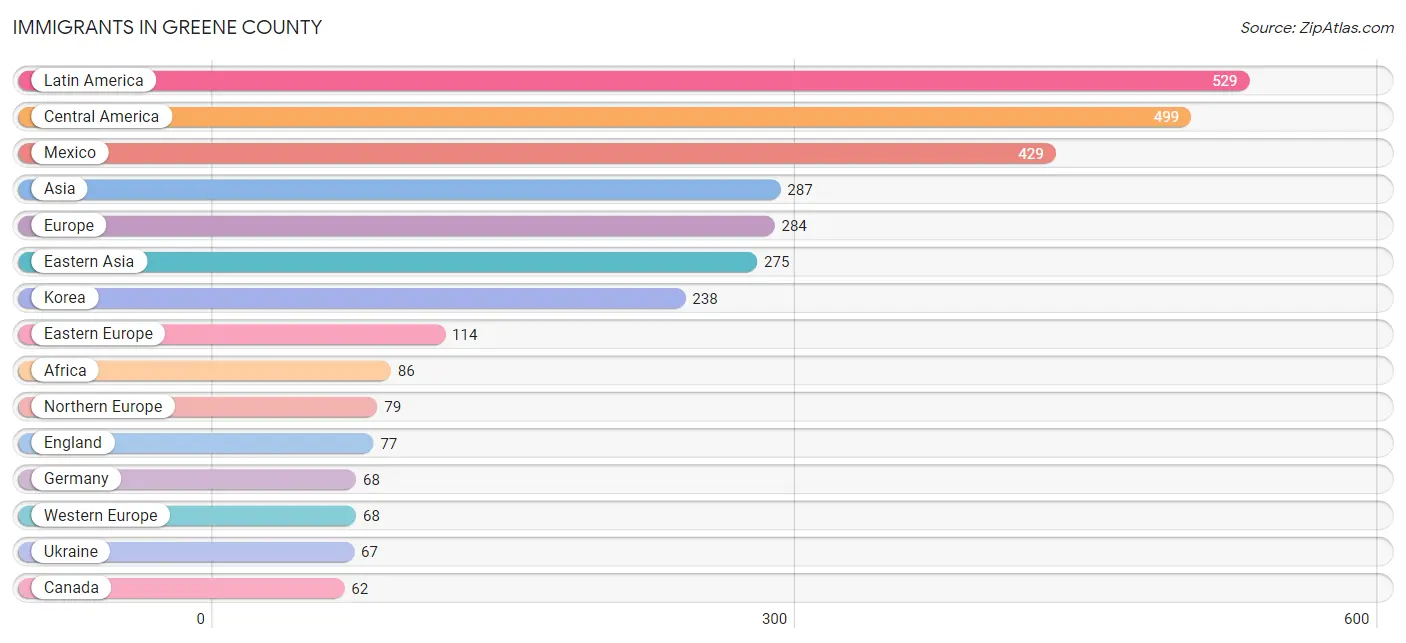
Immigrants in Greene County
The most numerous immigrant groups reported in Greene County came from Latin America (529 | 0.7%), Central America (499 | 0.7%), Mexico (429 | 0.6%), Asia (287 | 0.4%), and Europe (284 | 0.4%), together accounting for 2.9% of all Greene County residents.
| Immigration Origin | # Population | % Population |
| Africa | 86 | 0.1% |
| Asia | 287 | 0.4% |
| Australia | 3 | 0.0% |
| Canada | 62 | 0.1% |
| Caribbean | 9 | 0.0% |
| Central America | 499 | 0.7% |
| China | 35 | 0.1% |
| Colombia | 14 | 0.0% |
| Eastern Africa | 33 | 0.1% |
| Eastern Asia | 275 | 0.4% |
| Eastern Europe | 114 | 0.2% |
| El Salvador | 34 | 0.1% |
| England | 77 | 0.1% |
| Ethiopia | 33 | 0.1% |
| Europe | 284 | 0.4% |
| Germany | 68 | 0.1% |
| Guatemala | 36 | 0.1% |
| Indonesia | 10 | 0.0% |
| Jamaica | 9 | 0.0% |
| Japan | 2 | 0.0% |
| Korea | 238 | 0.3% |
| Laos | 2 | 0.0% |
| Latin America | 529 | 0.7% |
| Mexico | 429 | 0.6% |
| Middle Africa | 37 | 0.1% |
| Northern Africa | 16 | 0.0% |
| Northern Europe | 79 | 0.1% |
| Oceania | 3 | 0.0% |
| Portugal | 5 | 0.0% |
| Russia | 47 | 0.1% |
| South America | 21 | 0.0% |
| South Eastern Asia | 12 | 0.0% |
| Southern Europe | 23 | 0.0% |
| Spain | 18 | 0.0% |
| Taiwan | 10 | 0.0% |
| Ukraine | 67 | 0.1% |
| Western Europe | 68 | 0.1% | View All 37 Rows |
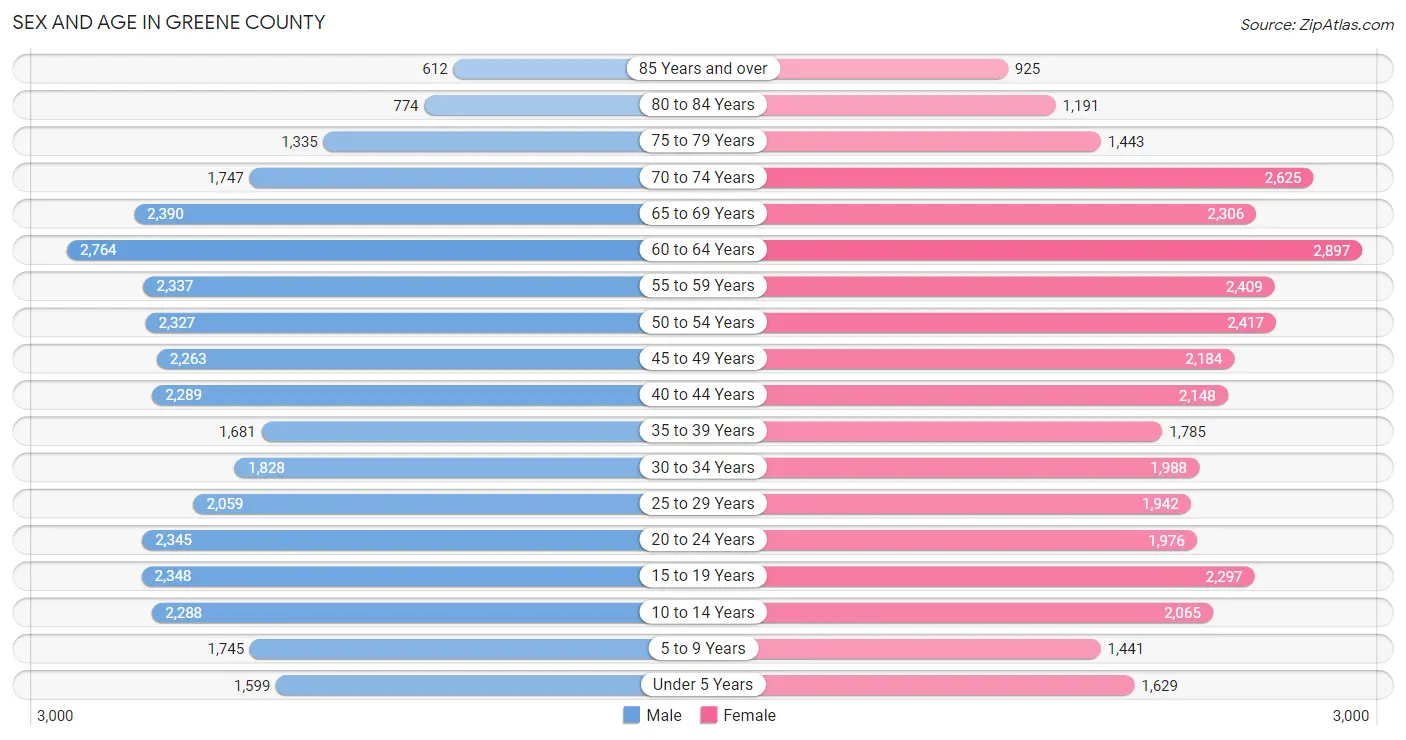
Sex and Age in Greene County
Sex and Age in Greene County
The most populous age groups in Greene County are 60 to 64 Years (2,764 | 8.0%) for men and 60 to 64 Years (2,897 | 8.1%) for women.
| Age Bracket | Male | Female |
| Under 5 Years | 1,599 (4.6%) | 1,629 (4.6%) |
| 5 to 9 Years | 1,745 (5.0%) | 1,441 (4.0%) |
| 10 to 14 Years | 2,288 (6.6%) | 2,065 (5.8%) |
| 15 to 19 Years | 2,348 (6.8%) | 2,297 (6.4%) |
| 20 to 24 Years | 2,345 (6.8%) | 1,976 (5.5%) |
| 25 to 29 Years | 2,059 (5.9%) | 1,942 (5.4%) |
| 30 to 34 Years | 1,828 (5.3%) | 1,988 (5.6%) |
| 35 to 39 Years | 1,681 (4.8%) | 1,785 (5.0%) |
| 40 to 44 Years | 2,289 (6.6%) | 2,148 (6.0%) |
| 45 to 49 Years | 2,263 (6.5%) | 2,184 (6.1%) |
| 50 to 54 Years | 2,327 (6.7%) | 2,417 (6.8%) |
| 55 to 59 Years | 2,337 (6.7%) | 2,409 (6.8%) |
| 60 to 64 Years | 2,764 (8.0%) | 2,897 (8.1%) |
| 65 to 69 Years | 2,390 (6.9%) | 2,306 (6.5%) |
| 70 to 74 Years | 1,747 (5.0%) | 2,625 (7.4%) |
| 75 to 79 Years | 1,335 (3.8%) | 1,443 (4.1%) |
| 80 to 84 Years | 774 (2.2%) | 1,191 (3.3%) |
| 85 Years and over | 612 (1.8%) | 925 (2.6%) |
| Total | 34,731 (100.0%) | 35,668 (100.0%) |
Families and Households in Greene County
Median Family Size in Greene County
The median family size in Greene County is 3.00 persons per family, with single male/father families (1,603 | 8.7%) accounting for the largest median family size of 3.08 persons per family. On the other hand, single female/mother families (2,917 | 15.9%) represent the smallest median family size with 2.96 persons per family.

| Family Type | # Families | Family Size |
| Married-Couple | 13,845 (75.4%) | 3.00 |
| Single Male/Father | 1,603 (8.7%) | 3.08 |
| Single Female/Mother | 2,917 (15.9%) | 2.96 |
| Total Families | 18,365 (100.0%) | 3.00 |
Median Household Size in Greene County
The median household size in Greene County is 2.46 persons per household, with single male/father households (1,603 | 5.8%) accounting for the largest median household size of 3.6 persons per household. non-family households (9,412 | 33.9%) represent the smallest median household size with 1.16 persons per household.
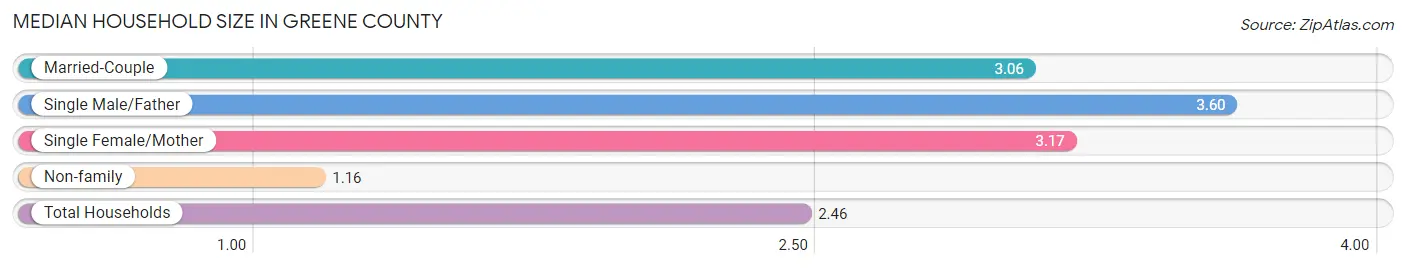
| Household Type | # Households | Household Size |
| Married-Couple | 13,845 (49.8%) | 3.06 |
| Single Male/Father | 1,603 (5.8%) | 3.60 |
| Single Female/Mother | 2,917 (10.5%) | 3.17 |
| Non-family | 9,412 (33.9%) | 1.16 |
| Total Households | 27,777 (100.0%) | 2.46 |
Household Size by Marriage Status in Greene County
Out of a total of 27,777 households in Greene County, 18,365 (66.1%) are family households, while 9,412 (33.9%) are nonfamily households. The most numerous type of family households are 2-person households, comprising 9,114, and the most common type of nonfamily households are 1-person households, comprising 8,212.
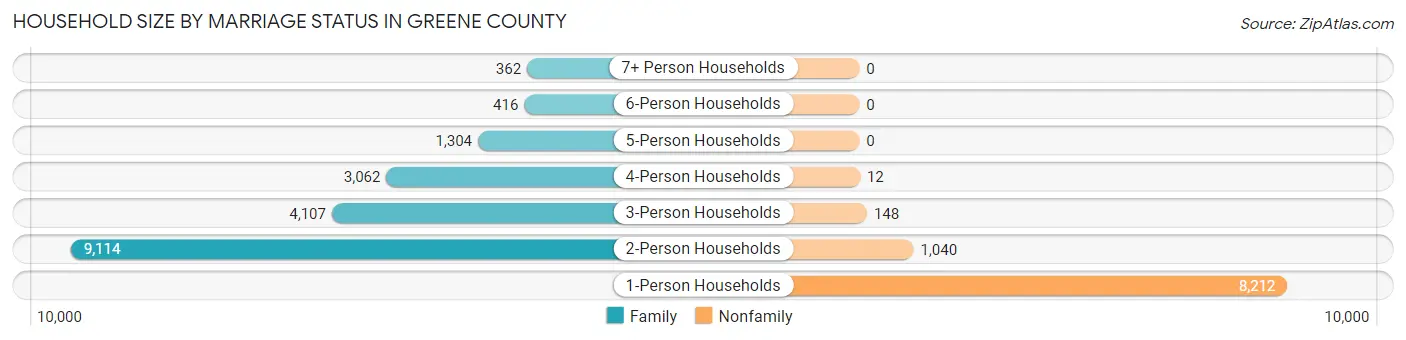
| Household Size | Family Households | Nonfamily Households |
| 1-Person Households | - | 8,212 (29.6%) |
| 2-Person Households | 9,114 (32.8%) | 1,040 (3.7%) |
| 3-Person Households | 4,107 (14.8%) | 148 (0.5%) |
| 4-Person Households | 3,062 (11.0%) | 12 (0.0%) |
| 5-Person Households | 1,304 (4.7%) | 0 (0.0%) |
| 6-Person Households | 416 (1.5%) | 0 (0.0%) |
| 7+ Person Households | 362 (1.3%) | 0 (0.0%) |
| Total | 18,365 (66.1%) | 9,412 (33.9%) |
Female Fertility in Greene County
Fertility by Age in Greene County
Average fertility rate in Greene County is 33.0 births per 1,000 women. Women in the age bracket of 20 to 34 years have the highest fertility rate with 54.0 births per 1,000 women. Women in the age bracket of 20 to 34 years acount for 63.3% of all women with births.
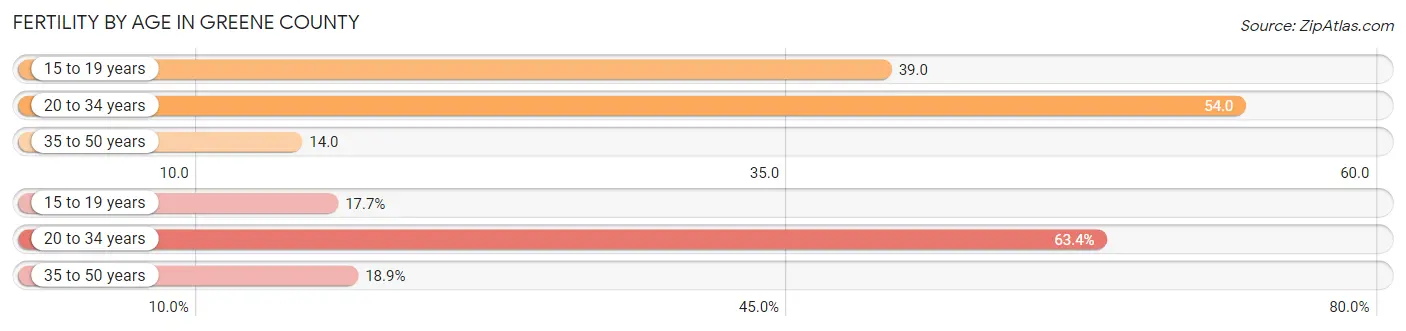
| Age Bracket | Women with Births | Births / 1,000 Women |
| 15 to 19 years | 89 (17.7%) | 39.0 |
| 20 to 34 years | 318 (63.3%) | 54.0 |
| 35 to 50 years | 95 (18.9%) | 14.0 |
| Total | 502 (100.0%) | 33.0 |
Fertility by Age by Marriage Status in Greene County
56.2% of women with births (502) in Greene County are married. The highest percentage of unmarried women with births falls into 15 to 19 years age bracket with 100.0% of them unmarried at the time of birth, while the lowest percentage of unmarried women with births belong to 20 to 34 years age bracket with 31.5% of them unmarried.
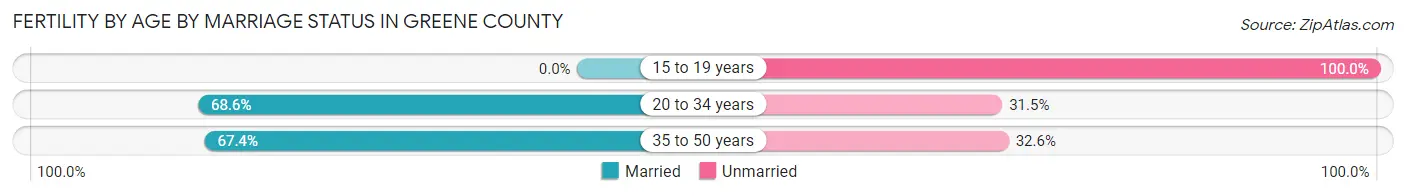
| Age Bracket | Married | Unmarried |
| 15 to 19 years | 0 (0.0%) | 89 (100.0%) |
| 20 to 34 years | 218 (68.5%) | 100 (31.5%) |
| 35 to 50 years | 64 (67.4%) | 31 (32.6%) |
| Total | 282 (56.2%) | 220 (43.8%) |
Fertility by Education in Greene County
Average fertility rate in Greene County is 33.0 births per 1,000 women. Women with the education attainment of graduate degree have the highest fertility rate of 107.0 births per 1,000 women, while women with the education attainment of college or associate's degree have the lowest fertility at 10.0 births per 1,000 women. Women with the education attainment of high school diploma represent 38.8% of all women with births.
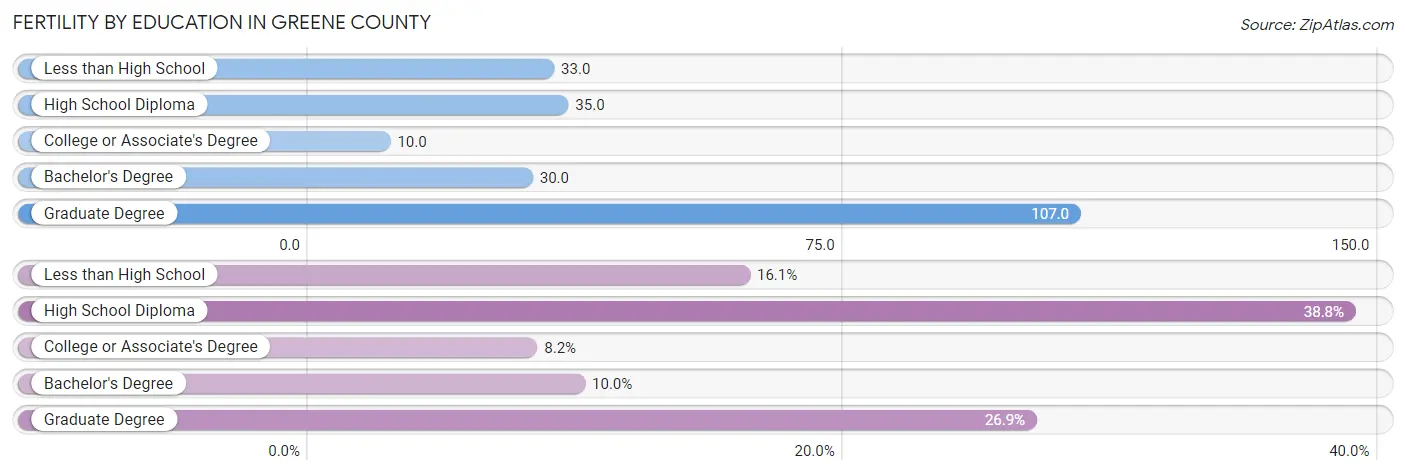
| Educational Attainment | Women with Births | Births / 1,000 Women |
| Less than High School | 81 (16.1%) | 33.0 |
| High School Diploma | 195 (38.8%) | 35.0 |
| College or Associate's Degree | 41 (8.2%) | 10.0 |
| Bachelor's Degree | 50 (10.0%) | 30.0 |
| Graduate Degree | 135 (26.9%) | 107.0 |
| Total | 502 (100.0%) | 33.0 |
Fertility by Education by Marriage Status in Greene County
43.8% of women with births in Greene County are unmarried. Women with the educational attainment of college or associate's degree are most likely to be married with 100.0% of them married at childbirth, while women with the educational attainment of high school diploma are least likely to be married with 70.8% of them unmarried at childbirth.
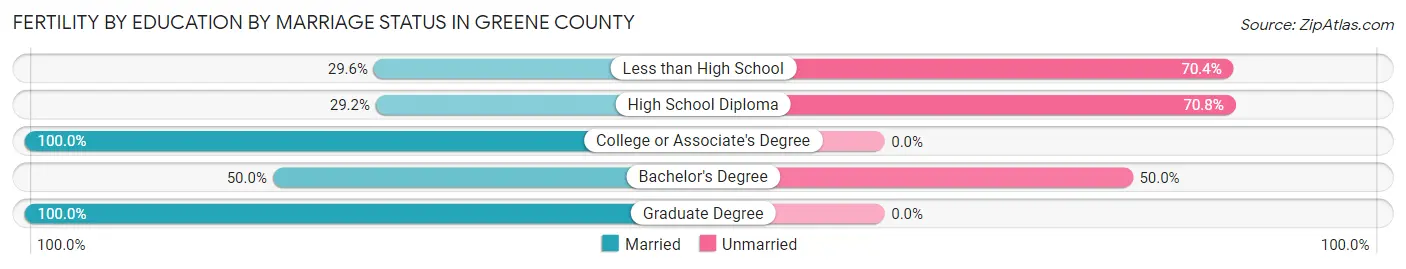
| Educational Attainment | Married | Unmarried |
| Less than High School | 24 (29.6%) | 57 (70.4%) |
| High School Diploma | 57 (29.2%) | 138 (70.8%) |
| College or Associate's Degree | 41 (100.0%) | 0 (0.0%) |
| Bachelor's Degree | 25 (50.0%) | 25 (50.0%) |
| Graduate Degree | 135 (100.0%) | 0 (0.0%) |
| Total | 282 (56.2%) | 220 (43.8%) |
Income in Greene County
Income Overview in Greene County
Per Capita Income in Greene County is $28,237, while median incomes of families and households are $67,267 and $51,975 respectively.
| Characteristic | Number | Measure |
| Per Capita Income | 70,399 | $28,237 |
| Median Family Income | 18,365 | $67,267 |
| Mean Family Income | 18,365 | $82,159 |
| Median Household Income | 27,777 | $51,975 |
| Mean Household Income | 27,777 | $68,249 |
| Income Deficit | 18,365 | $10,855 |
| Wage / Income Gap (%) | 70,399 | 23.26% |
| Wage / Income Gap ($) | 70,399 | 76.74¢ per $1 |
| Gini / Inequality Index | 70,399 | 0.45 |
Earnings by Sex in Greene County
Average Earnings in Greene County are $33,413, $37,612 for men and $28,865 for women, a difference of 23.3%.
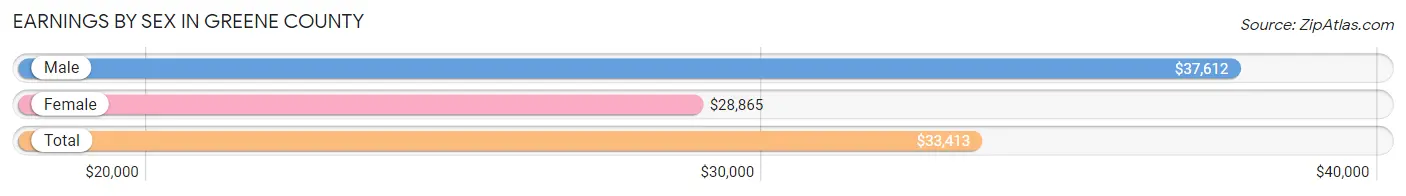
| Sex | Number | Average Earnings |
| Male | 17,709 (53.8%) | $37,612 |
| Female | 15,208 (46.2%) | $28,865 |
| Total | 32,917 (100.0%) | $33,413 |
Earnings by Sex by Income Bracket in Greene County
The most common earnings brackets in Greene County are $55,000 to $64,999 for men (1,522 | 8.6%) and $25,000 to $29,999 for women (1,418 | 9.3%).
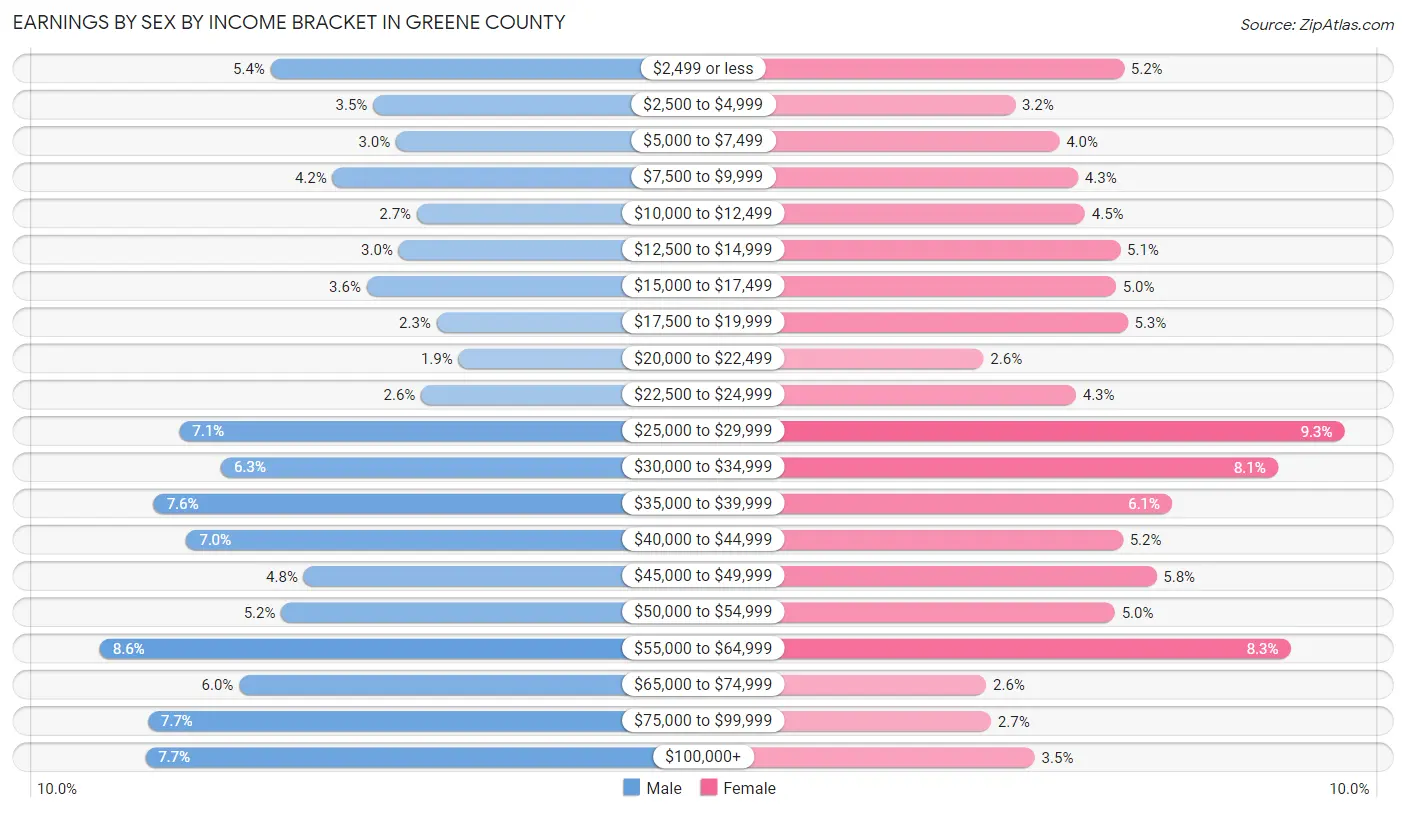
| Income | Male | Female |
| $2,499 or less | 955 (5.4%) | 789 (5.2%) |
| $2,500 to $4,999 | 615 (3.5%) | 479 (3.2%) |
| $5,000 to $7,499 | 539 (3.0%) | 606 (4.0%) |
| $7,500 to $9,999 | 749 (4.2%) | 658 (4.3%) |
| $10,000 to $12,499 | 469 (2.6%) | 678 (4.5%) |
| $12,500 to $14,999 | 529 (3.0%) | 778 (5.1%) |
| $15,000 to $17,499 | 635 (3.6%) | 766 (5.0%) |
| $17,500 to $19,999 | 403 (2.3%) | 800 (5.3%) |
| $20,000 to $22,499 | 332 (1.9%) | 390 (2.6%) |
| $22,500 to $24,999 | 455 (2.6%) | 652 (4.3%) |
| $25,000 to $29,999 | 1,257 (7.1%) | 1,418 (9.3%) |
| $30,000 to $34,999 | 1,119 (6.3%) | 1,228 (8.1%) |
| $35,000 to $39,999 | 1,342 (7.6%) | 926 (6.1%) |
| $40,000 to $44,999 | 1,234 (7.0%) | 787 (5.2%) |
| $45,000 to $49,999 | 845 (4.8%) | 882 (5.8%) |
| $50,000 to $54,999 | 919 (5.2%) | 763 (5.0%) |
| $55,000 to $64,999 | 1,522 (8.6%) | 1,264 (8.3%) |
| $65,000 to $74,999 | 1,059 (6.0%) | 397 (2.6%) |
| $75,000 to $99,999 | 1,361 (7.7%) | 411 (2.7%) |
| $100,000+ | 1,370 (7.7%) | 536 (3.5%) |
| Total | 17,709 (100.0%) | 15,208 (100.0%) |
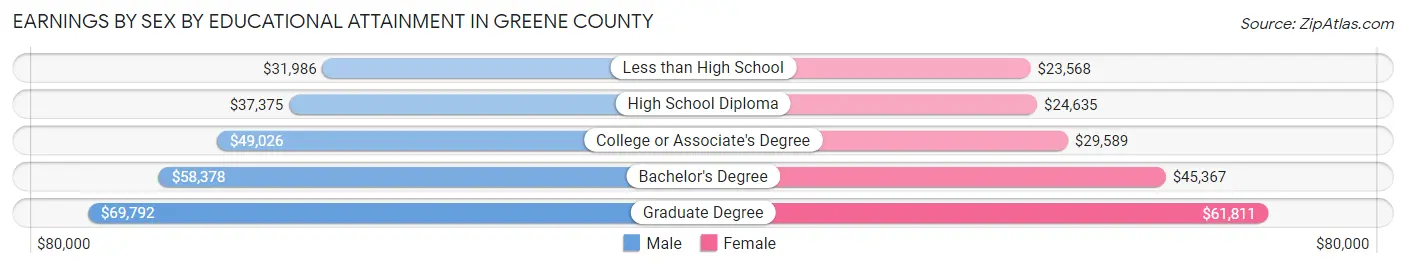
Earnings by Sex by Educational Attainment in Greene County
Average earnings in Greene County are $42,694 for men and $32,025 for women, a difference of 25.0%. Men with an educational attainment of graduate degree enjoy the highest average annual earnings of $69,792, while those with less than high school education earn the least with $31,986. Women with an educational attainment of graduate degree earn the most with the average annual earnings of $61,811, while those with less than high school education have the smallest earnings of $23,568.
| Educational Attainment | Male Income | Female Income |
| Less than High School | $31,986 | $23,568 |
| High School Diploma | $37,375 | $24,635 |
| College or Associate's Degree | $49,026 | $29,589 |
| Bachelor's Degree | $58,378 | $45,367 |
| Graduate Degree | $69,792 | $61,811 |
| Total | $42,694 | $32,025 |
Family Income in Greene County
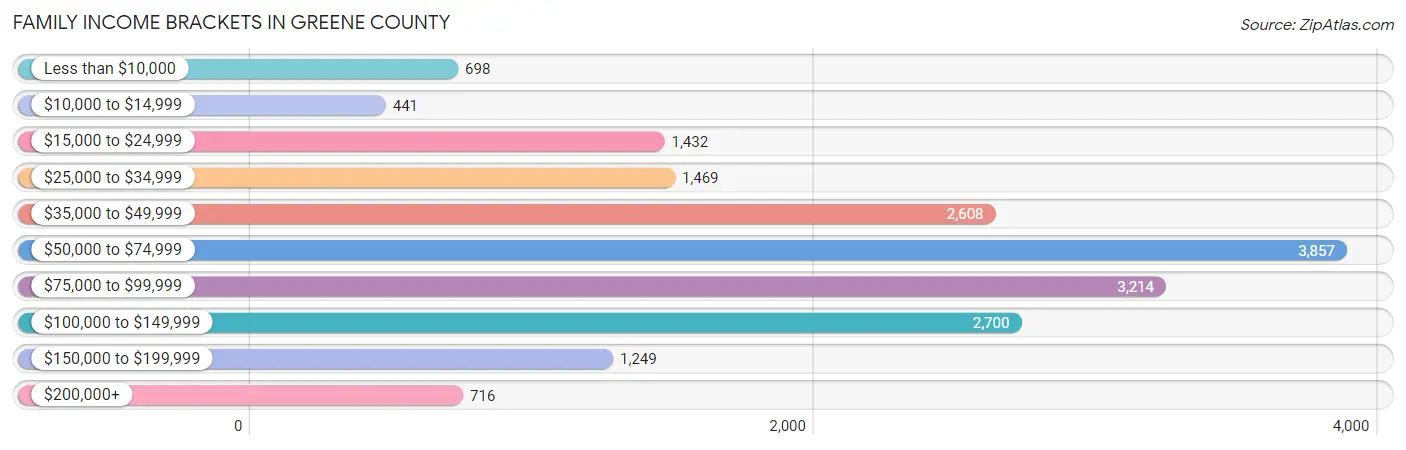
Family Income Brackets in Greene County
According to the Greene County family income data, there are 3,857 families falling into the $50,000 to $74,999 income range, which is the most common income bracket and makes up 21.0% of all families. Conversely, the $10,000 to $14,999 income bracket is the least frequent group with only 441 families (2.4%) belonging to this category.
| Income Bracket | # Families | % Families |
| Less than $10,000 | 698 | 3.8% |
| $10,000 to $14,999 | 441 | 2.4% |
| $15,000 to $24,999 | 1,432 | 7.8% |
| $25,000 to $34,999 | 1,469 | 8.0% |
| $35,000 to $49,999 | 2,608 | 14.2% |
| $50,000 to $74,999 | 3,857 | 21.0% |
| $75,000 to $99,999 | 3,214 | 17.5% |
| $100,000 to $149,999 | 2,700 | 14.7% |
| $150,000 to $199,999 | 1,249 | 6.8% |
| $200,000+ | 716 | 3.9% |
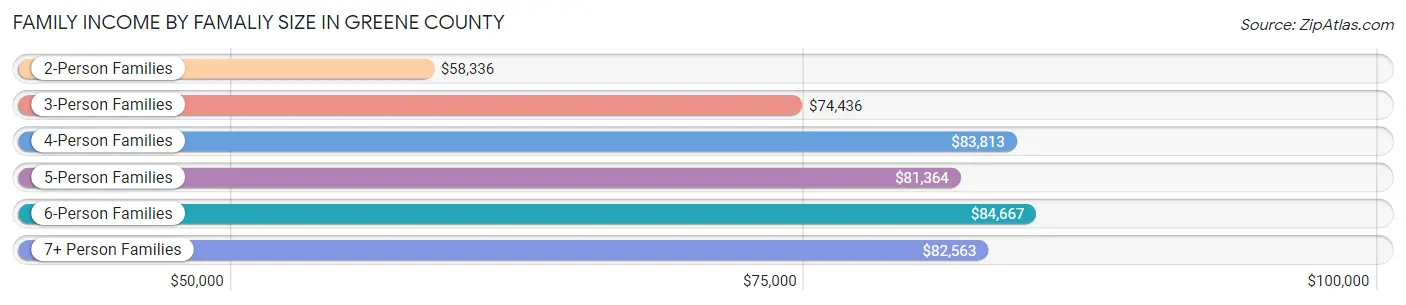
Family Income by Famaliy Size in Greene County
6-person families (382 | 2.1%) account for the highest median family income in Greene County with $84,667 per family, while 2-person families (9,525 | 51.9%) have the highest median income of $29,168 per family member.
| Income Bracket | # Families | Median Income |
| 2-Person Families | 9,525 (51.9%) | $58,336 |
| 3-Person Families | 4,465 (24.3%) | $74,436 |
| 4-Person Families | 2,553 (13.9%) | $83,813 |
| 5-Person Families | 1,188 (6.5%) | $81,364 |
| 6-Person Families | 382 (2.1%) | $84,667 |
| 7+ Person Families | 252 (1.4%) | $82,563 |
| Total | 18,365 (100.0%) | $67,267 |
Family Income by Number of Earners in Greene County
The median family income in Greene County is $67,267, with families comprising 3+ earners (1,591) having the highest median family income of $115,552, while families with no earners (4,208) have the lowest median family income of $36,296, accounting for 8.7% and 22.9% of families, respectively.

| Number of Earners | # Families | Median Income |
| No Earners | 4,208 (22.9%) | $36,296 |
| 1 Earner | 6,470 (35.2%) | $49,979 |
| 2 Earners | 6,096 (33.2%) | $90,448 |
| 3+ Earners | 1,591 (8.7%) | $115,552 |
| Total | 18,365 (100.0%) | $67,267 |
Household Income in Greene County
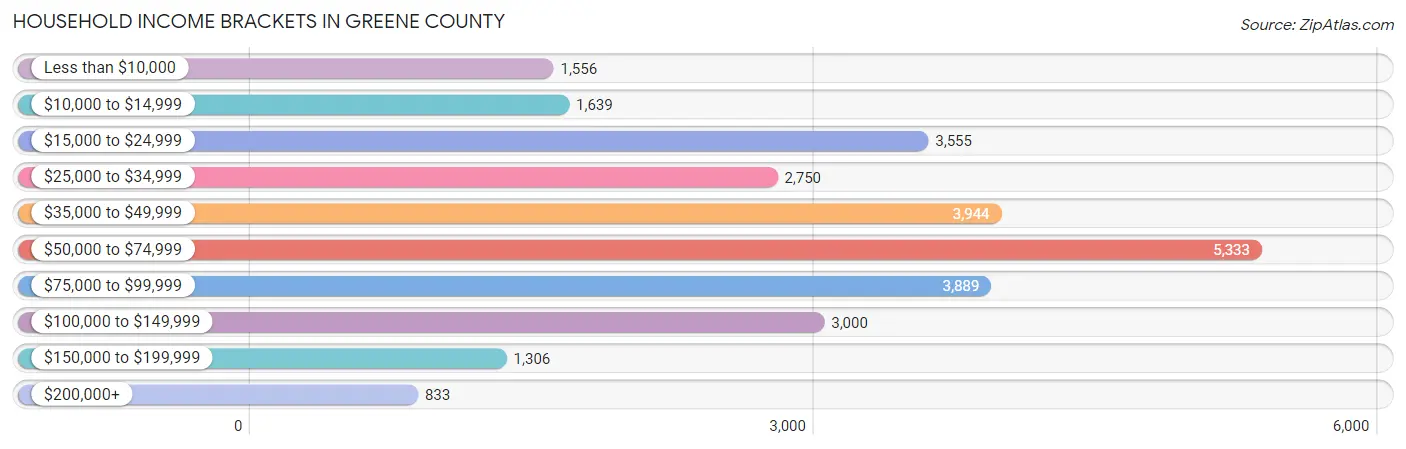
Household Income Brackets in Greene County
With 5,333 households falling in the category, the $50,000 to $74,999 income range is the most frequent in Greene County, accounting for 19.2% of all households. In contrast, only 833 households (3.0%) fall into the $200,000+ income bracket, making it the least populous group.
| Income Bracket | # Households | % Households |
| Less than $10,000 | 1,556 | 5.6% |
| $10,000 to $14,999 | 1,639 | 5.9% |
| $15,000 to $24,999 | 3,555 | 12.8% |
| $25,000 to $34,999 | 2,750 | 9.9% |
| $35,000 to $49,999 | 3,944 | 14.2% |
| $50,000 to $74,999 | 5,333 | 19.2% |
| $75,000 to $99,999 | 3,889 | 14.0% |
| $100,000 to $149,999 | 3,000 | 10.8% |
| $150,000 to $199,999 | 1,306 | 4.7% |
| $200,000+ | 833 | 3.0% |
Household Income by Householder Age in Greene County
The median household income in Greene County is $51,975, with the highest median household income of $64,268 found in the 25 to 44 years age bracket for the primary householder. A total of 6,630 households (23.9%) fall into this category. Meanwhile, the 65+ years age bracket for the primary householder has the lowest median household income of $34,659, with 9,419 households (33.9%) in this group.
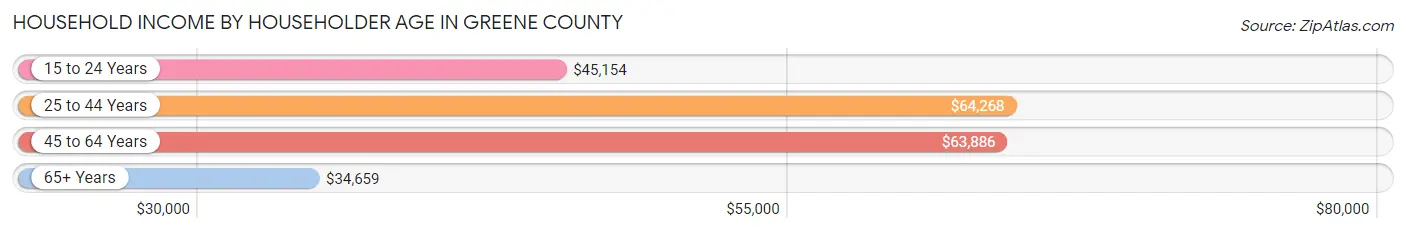
| Income Bracket | # Households | Median Income |
| 15 to 24 Years | 761 (2.7%) | $45,154 |
| 25 to 44 Years | 6,630 (23.9%) | $64,268 |
| 45 to 64 Years | 10,967 (39.5%) | $63,886 |
| 65+ Years | 9,419 (33.9%) | $34,659 |
| Total | 27,777 (100.0%) | $51,975 |
Poverty in Greene County
Income Below Poverty by Sex and Age in Greene County
With 14.1% poverty level for males and 17.1% for females among the residents of Greene County, 5 year old males and 5 year old females are the most vulnerable to poverty, with 124 males (36.6%) and 119 females (41.2%) in their respective age groups living below the poverty level.
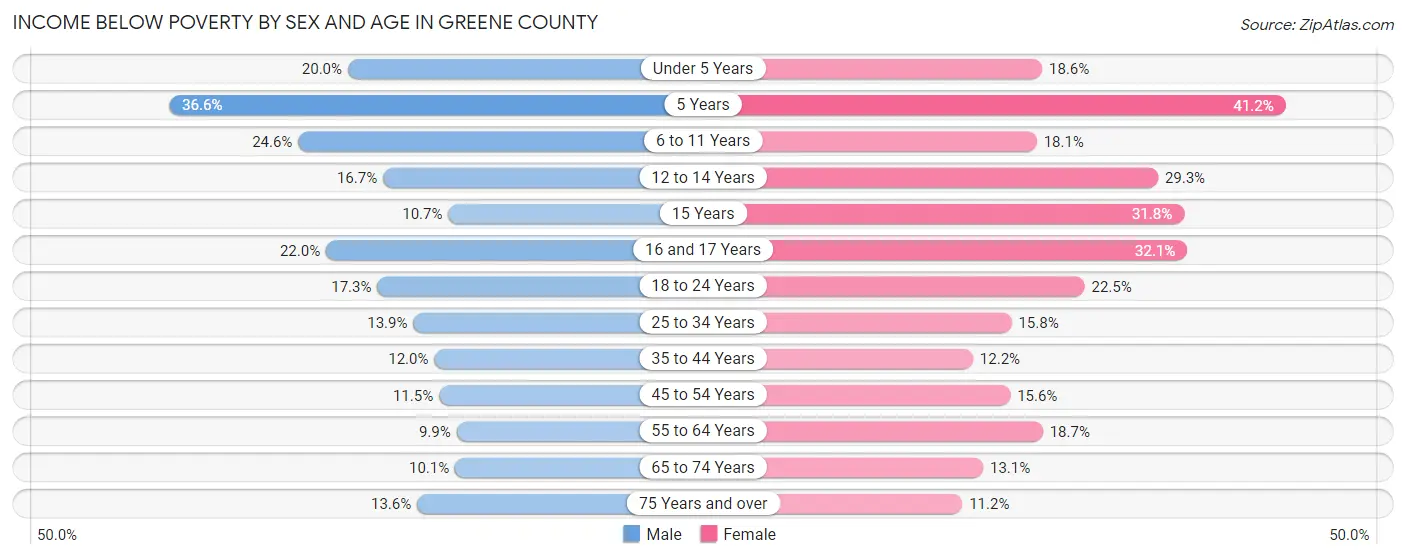
| Age Bracket | Male | Female |
| Under 5 Years | 309 (20.0%) | 301 (18.6%) |
| 5 Years | 124 (36.6%) | 119 (41.2%) |
| 6 to 11 Years | 578 (24.6%) | 327 (18.1%) |
| 12 to 14 Years | 198 (16.7%) | 402 (29.3%) |
| 15 Years | 44 (10.7%) | 222 (31.8%) |
| 16 and 17 Years | 195 (22.0%) | 192 (32.1%) |
| 18 to 24 Years | 495 (17.3%) | 569 (22.5%) |
| 25 to 34 Years | 518 (13.9%) | 609 (15.8%) |
| 35 to 44 Years | 467 (12.0%) | 471 (12.2%) |
| 45 to 54 Years | 524 (11.5%) | 719 (15.6%) |
| 55 to 64 Years | 502 (9.9%) | 988 (18.6%) |
| 65 to 74 Years | 410 (10.1%) | 640 (13.1%) |
| 75 Years and over | 358 (13.6%) | 370 (11.2%) |
| Total | 4,722 (14.1%) | 5,929 (17.1%) |
Income Above Poverty by Sex and Age in Greene County
According to the poverty statistics in Greene County, males aged 55 to 64 years and females aged 75 years and over are the age groups that are most secure financially, with 90.1% of males and 88.8% of females in these age groups living above the poverty line.
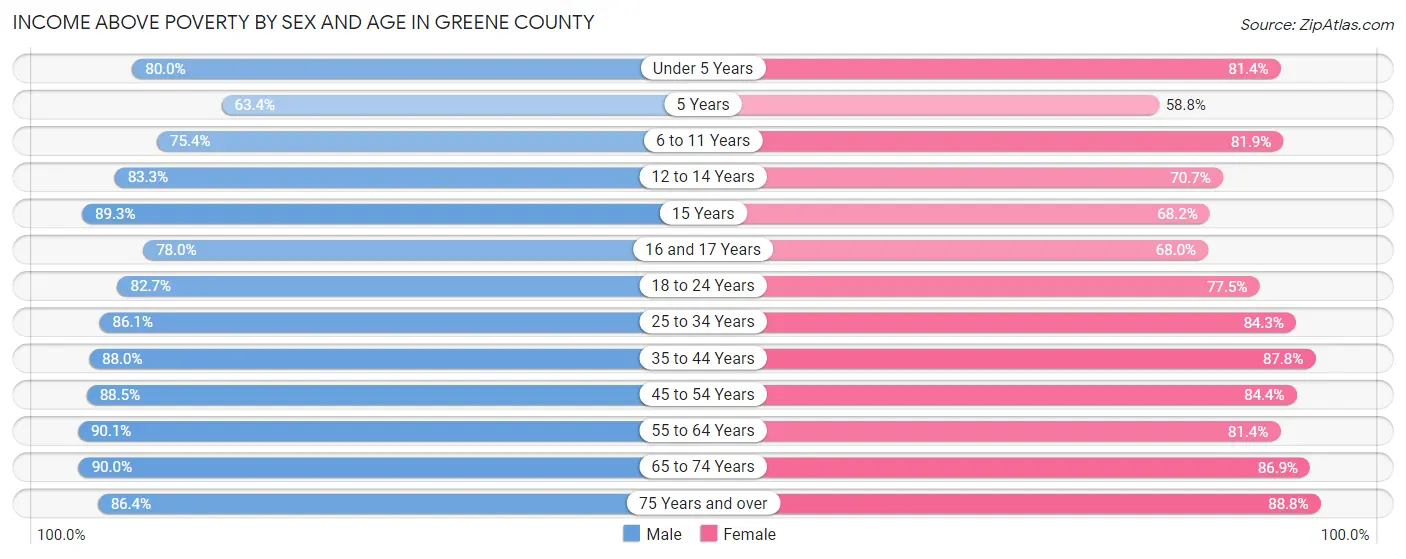
| Age Bracket | Male | Female |
| Under 5 Years | 1,236 (80.0%) | 1,318 (81.4%) |
| 5 Years | 215 (63.4%) | 170 (58.8%) |
| 6 to 11 Years | 1,771 (75.4%) | 1,481 (81.9%) |
| 12 to 14 Years | 985 (83.3%) | 968 (70.7%) |
| 15 Years | 368 (89.3%) | 477 (68.2%) |
| 16 and 17 Years | 690 (78.0%) | 407 (67.9%) |
| 18 to 24 Years | 2,372 (82.7%) | 1,956 (77.5%) |
| 25 to 34 Years | 3,201 (86.1%) | 3,257 (84.3%) |
| 35 to 44 Years | 3,432 (88.0%) | 3,399 (87.8%) |
| 45 to 54 Years | 4,017 (88.5%) | 3,882 (84.4%) |
| 55 to 64 Years | 4,565 (90.1%) | 4,310 (81.4%) |
| 65 to 74 Years | 3,671 (89.9%) | 4,242 (86.9%) |
| 75 Years and over | 2,278 (86.4%) | 2,939 (88.8%) |
| Total | 28,801 (85.9%) | 28,806 (82.9%) |
Income Below Poverty Among Married-Couple Families in Greene County
The poverty statistics for married-couple families in Greene County show that 5.7% or 790 of the total 13,845 families live below the poverty line. Families with 5 or more children have the highest poverty rate of 36.0%, comprising of 18 families. On the other hand, families with 1 or 2 children have the lowest poverty rate of 4.2%, which includes 160 families.
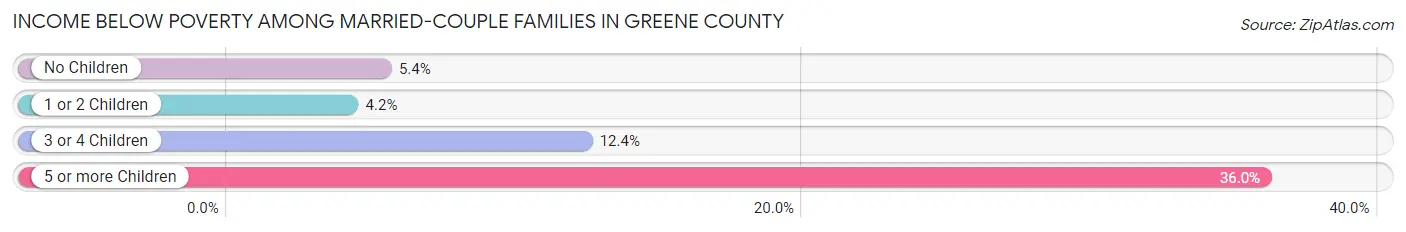
| Children | Above Poverty | Below Poverty |
| No Children | 8,411 (94.6%) | 476 (5.4%) |
| 1 or 2 Children | 3,647 (95.8%) | 160 (4.2%) |
| 3 or 4 Children | 965 (87.6%) | 136 (12.3%) |
| 5 or more Children | 32 (64.0%) | 18 (36.0%) |
| Total | 13,055 (94.3%) | 790 (5.7%) |
Income Below Poverty Among Single-Parent Households in Greene County
According to the poverty data in Greene County, 22.6% or 362 single-father households and 31.4% or 917 single-mother households are living below the poverty line. Among single-father households, those with 3 or 4 children have the highest poverty rate, with 77 households (85.6%) experiencing poverty. Likewise, among single-mother households, those with 5 or more children have the highest poverty rate, with 30 households (100.0%) falling below the poverty line.
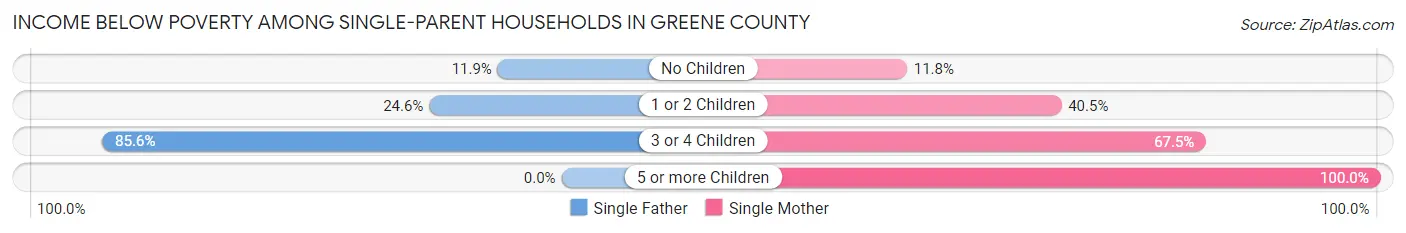
| Children | Single Father | Single Mother |
| No Children | 77 (11.9%) | 146 (11.8%) |
| 1 or 2 Children | 208 (24.6%) | 556 (40.5%) |
| 3 or 4 Children | 77 (85.6%) | 185 (67.5%) |
| 5 or more Children | 0 (0.0%) | 30 (100.0%) |
| Total | 362 (22.6%) | 917 (31.4%) |
Income Below Poverty Among Married-Couple vs Single-Parent Households in Greene County
The poverty data for Greene County shows that 790 of the married-couple family households (5.7%) and 1,279 of the single-parent households (28.3%) are living below the poverty level. Within the married-couple family households, those with 5 or more children have the highest poverty rate, with 18 households (36.0%) falling below the poverty line. Among the single-parent households, those with 3 or 4 children have the highest poverty rate, with 262 household (72.0%) living below poverty.
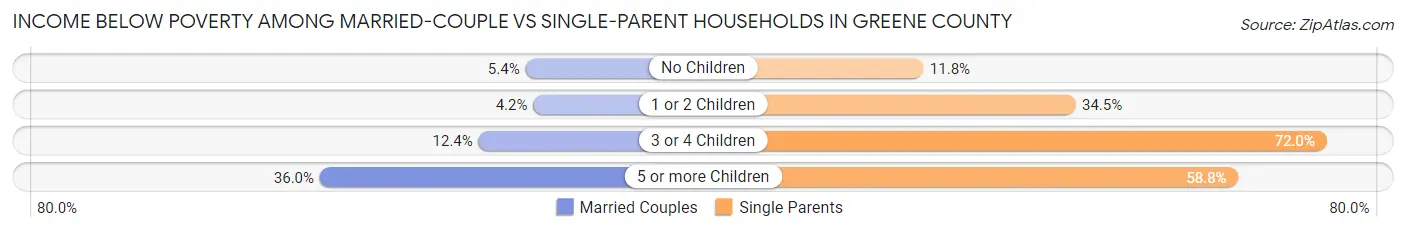
| Children | Married-Couple Families | Single-Parent Households |
| No Children | 476 (5.4%) | 223 (11.8%) |
| 1 or 2 Children | 160 (4.2%) | 764 (34.5%) |
| 3 or 4 Children | 136 (12.3%) | 262 (72.0%) |
| 5 or more Children | 18 (36.0%) | 30 (58.8%) |
| Total | 790 (5.7%) | 1,279 (28.3%) |
Employment Characteristics in Greene County
Employment by Class of Employer in Greene County
Among the 28,512 employed individuals in Greene County, private company employees (20,124 | 70.6%), local government employees (2,330 | 8.2%), and not-for-profit organizations (2,148 | 7.5%) make up the most common classes of employment.

| Employer Class | # Employees | % Employees |
| Private Company Employees | 20,124 | 70.6% |
| Self-Employed (Incorporated) | 764 | 2.7% |
| Self-Employed (Not Incorporated) | 1,562 | 5.5% |
| Not-for-profit Organizations | 2,148 | 7.5% |
| Local Government Employees | 2,330 | 8.2% |
| State Government Employees | 1,038 | 3.6% |
| Federal Government Employees | 496 | 1.7% |
| Unpaid Family Workers | 50 | 0.2% |
| Total | 28,512 | 100.0% |
Employment Status by Age in Greene County
According to the labor force statistics for Greene County, out of the total population over 16 years of age (58,501), 52.9% or 30,947 individuals are in the labor force, with 5.4% or 1,671 of them unemployed. The age group with the highest labor force participation rate is 35 to 44 years, with 79.7% or 6,299 individuals in the labor force. Within the labor force, the 16 to 19 years age range has the highest percentage of unemployed individuals, with 13.5% or 196 of them being unemployed.
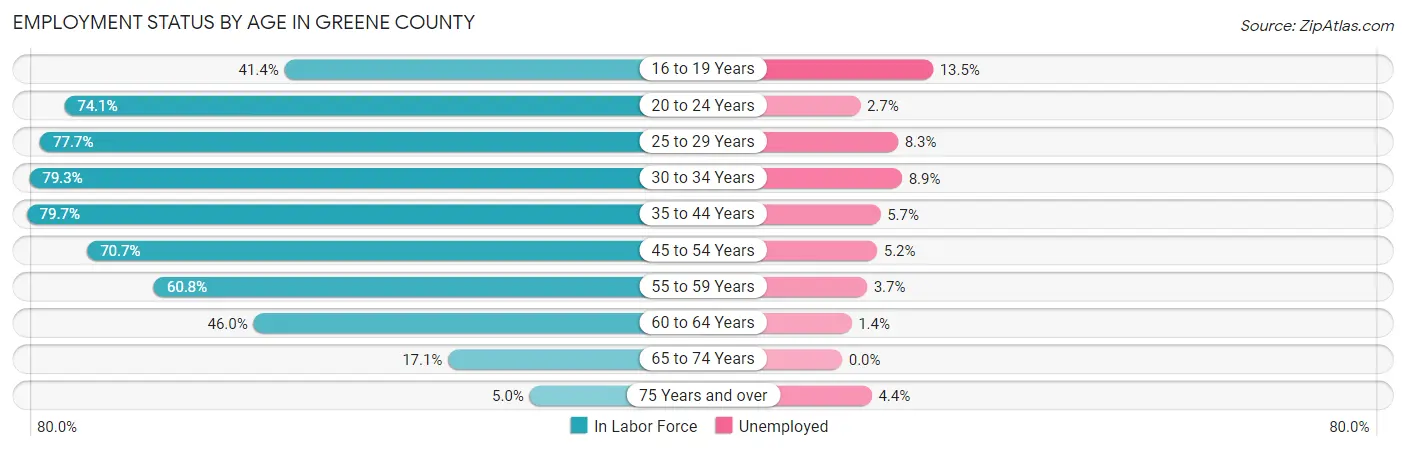
| Age Bracket | In Labor Force | Unemployed |
| 16 to 19 Years | 1,455 (41.4%) | 196 (13.5%) |
| 20 to 24 Years | 3,202 (74.1%) | 86 (2.7%) |
| 25 to 29 Years | 3,109 (77.7%) | 258 (8.3%) |
| 30 to 34 Years | 3,026 (79.3%) | 269 (8.9%) |
| 35 to 44 Years | 6,299 (79.7%) | 359 (5.7%) |
| 45 to 54 Years | 6,498 (70.7%) | 338 (5.2%) |
| 55 to 59 Years | 2,886 (60.8%) | 107 (3.7%) |
| 60 to 64 Years | 2,604 (46.0%) | 36 (1.4%) |
| 65 to 74 Years | 1,551 (17.1%) | 0 (0.0%) |
| 75 Years and over | 314 (5.0%) | 14 (4.4%) |
| Total | 30,947 (52.9%) | 1,671 (5.4%) |
Employment Status by Educational Attainment in Greene County
According to labor force statistics for Greene County, 69.1% of individuals (24,405) out of the total population between 25 and 64 years of age (35,318) are in the labor force, with 5.6% or 1,367 of them being unemployed. The group with the highest labor force participation rate are those with the educational attainment of bachelor's degree or higher, with 80.3% or 5,810 individuals in the labor force. Within the labor force, individuals with high school diploma education have the highest percentage of unemployment, with 8.2% or 814 of them being unemployed.
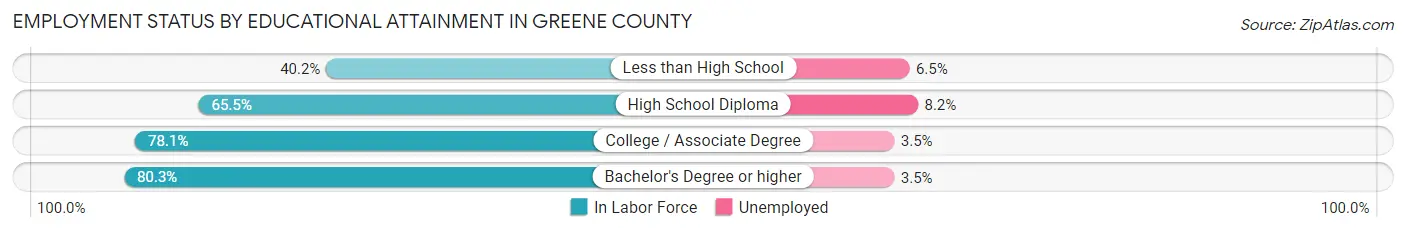
| Educational Attainment | In Labor Force | Unemployed |
| Less than High School | 1,514 (40.2%) | 245 (6.5%) |
| High School Diploma | 9,928 (65.5%) | 1,243 (8.2%) |
| College / Associate Degree | 7,155 (78.1%) | 321 (3.5%) |
| Bachelor's Degree or higher | 5,810 (80.3%) | 253 (3.5%) |
| Total | 24,405 (69.1%) | 1,978 (5.6%) |
Employment Occupations by Sex in Greene County
Management, Business, Science and Arts Occupations
The most common Management, Business, Science and Arts occupations in Greene County are Community & Social Service (2,768 | 9.5%), Management (2,100 | 7.2%), Health Diagnosing & Treating (1,985 | 6.8%), Education Instruction & Library (1,740 | 5.9%), and Health Technologists (1,164 | 4.0%).

Management, Business, Science and Arts Occupations by Sex
Within the Management, Business, Science and Arts occupations in Greene County, the most male-oriented occupations are Architecture & Engineering (93.5%), Computers, Engineering & Science (76.1%), and Computers & Mathematics (70.4%), while the most female-oriented occupations are Health Technologists (90.1%), Education Instruction & Library (85.1%), and Health Diagnosing & Treating (84.0%).
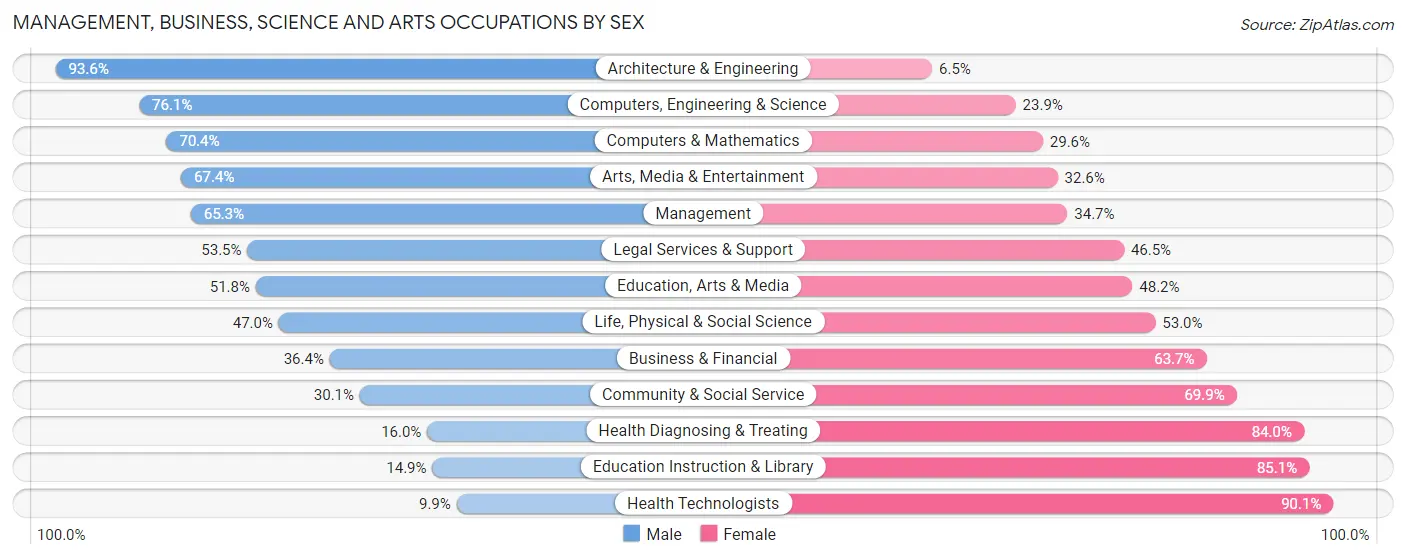
| Occupation | Male | Female |
| Management | 1,372 (65.3%) | 728 (34.7%) |
| Business & Financial | 361 (36.3%) | 632 (63.6%) |
| Computers, Engineering & Science | 545 (76.1%) | 171 (23.9%) |
| Computers & Mathematics | 193 (70.4%) | 81 (29.6%) |
| Architecture & Engineering | 290 (93.5%) | 20 (6.5%) |
| Life, Physical & Social Science | 62 (47.0%) | 70 (53.0%) |
| Community & Social Service | 832 (30.1%) | 1,936 (69.9%) |
| Education, Arts & Media | 322 (51.8%) | 300 (48.2%) |
| Legal Services & Support | 91 (53.5%) | 79 (46.5%) |
| Education Instruction & Library | 260 (14.9%) | 1,480 (85.1%) |
| Arts, Media & Entertainment | 159 (67.4%) | 77 (32.6%) |
| Health Diagnosing & Treating | 318 (16.0%) | 1,667 (84.0%) |
| Health Technologists | 115 (9.9%) | 1,049 (90.1%) |
| Total (Category) | 3,428 (40.0%) | 5,134 (60.0%) |
| Total (Overall) | 15,739 (53.8%) | 13,525 (46.2%) |
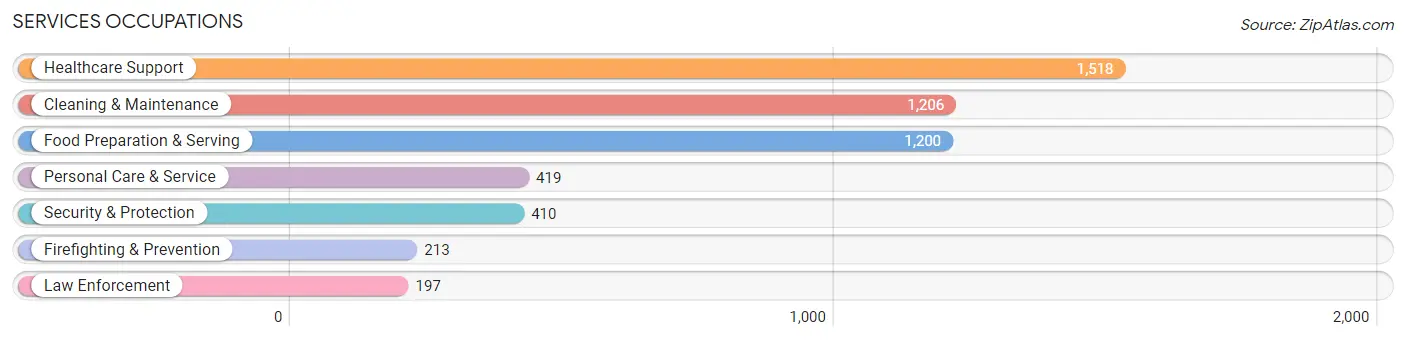
Services Occupations
The most common Services occupations in Greene County are Healthcare Support (1,518 | 5.2%), Cleaning & Maintenance (1,206 | 4.1%), Food Preparation & Serving (1,200 | 4.1%), Personal Care & Service (419 | 1.4%), and Security & Protection (410 | 1.4%).
Services Occupations by Sex
Within the Services occupations in Greene County, the most male-oriented occupations are Firefighting & Prevention (92.0%), Security & Protection (78.0%), and Cleaning & Maintenance (63.9%), while the most female-oriented occupations are Healthcare Support (86.3%), Personal Care & Service (68.7%), and Food Preparation & Serving (62.7%).
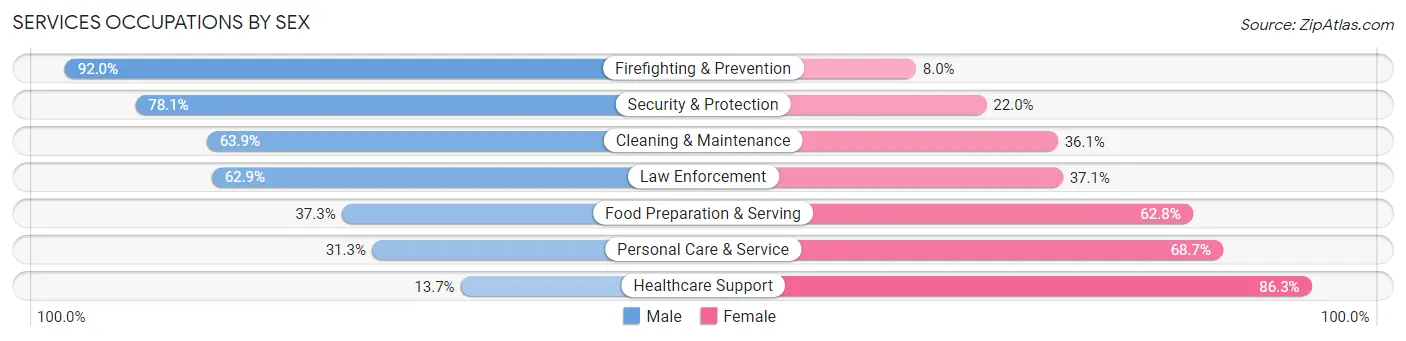
| Occupation | Male | Female |
| Healthcare Support | 208 (13.7%) | 1,310 (86.3%) |
| Security & Protection | 320 (78.0%) | 90 (22.0%) |
| Firefighting & Prevention | 196 (92.0%) | 17 (8.0%) |
| Law Enforcement | 124 (62.9%) | 73 (37.1%) |
| Food Preparation & Serving | 447 (37.2%) | 753 (62.7%) |
| Cleaning & Maintenance | 771 (63.9%) | 435 (36.1%) |
| Personal Care & Service | 131 (31.3%) | 288 (68.7%) |
| Total (Category) | 1,877 (39.5%) | 2,876 (60.5%) |
| Total (Overall) | 15,739 (53.8%) | 13,525 (46.2%) |
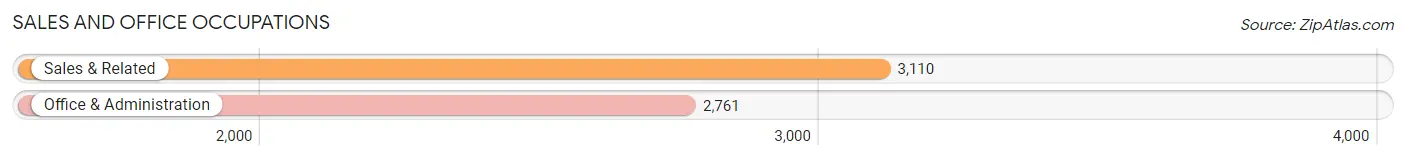
Sales and Office Occupations
The most common Sales and Office occupations in Greene County are Sales & Related (3,110 | 10.6%), and Office & Administration (2,761 | 9.4%).
Sales and Office Occupations by Sex
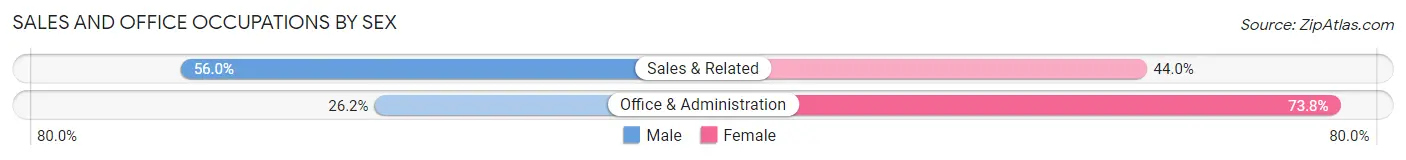
| Occupation | Male | Female |
| Sales & Related | 1,741 (56.0%) | 1,369 (44.0%) |
| Office & Administration | 723 (26.2%) | 2,038 (73.8%) |
| Total (Category) | 2,464 (42.0%) | 3,407 (58.0%) |
| Total (Overall) | 15,739 (53.8%) | 13,525 (46.2%) |
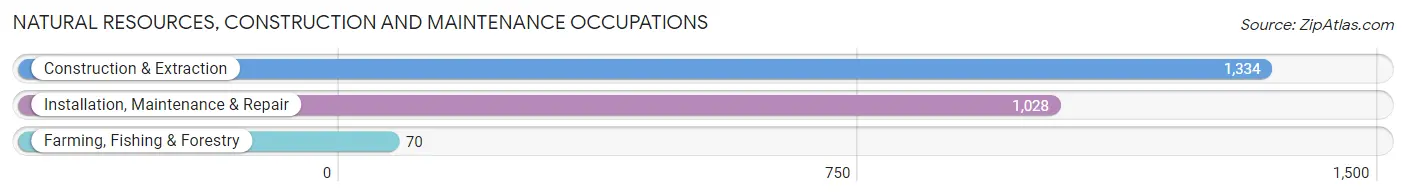
Natural Resources, Construction and Maintenance Occupations
The most common Natural Resources, Construction and Maintenance occupations in Greene County are Construction & Extraction (1,334 | 4.6%), Installation, Maintenance & Repair (1,028 | 3.5%), and Farming, Fishing & Forestry (70 | 0.2%).
Natural Resources, Construction and Maintenance Occupations by Sex
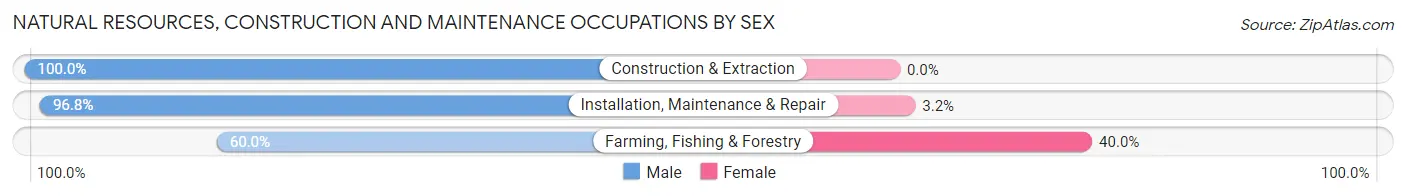
| Occupation | Male | Female |
| Farming, Fishing & Forestry | 42 (60.0%) | 28 (40.0%) |
| Construction & Extraction | 1,334 (100.0%) | 0 (0.0%) |
| Installation, Maintenance & Repair | 995 (96.8%) | 33 (3.2%) |
| Total (Category) | 2,371 (97.5%) | 61 (2.5%) |
| Total (Overall) | 15,739 (53.8%) | 13,525 (46.2%) |
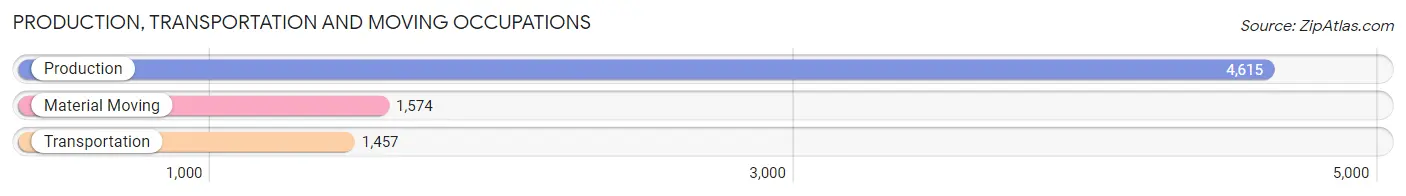
Production, Transportation and Moving Occupations
The most common Production, Transportation and Moving occupations in Greene County are Production (4,615 | 15.8%), Material Moving (1,574 | 5.4%), and Transportation (1,457 | 5.0%).
Production, Transportation and Moving Occupations by Sex

| Occupation | Male | Female |
| Production | 3,158 (68.4%) | 1,457 (31.6%) |
| Transportation | 1,268 (87.0%) | 189 (13.0%) |
| Material Moving | 1,173 (74.5%) | 401 (25.5%) |
| Total (Category) | 5,599 (73.2%) | 2,047 (26.8%) |
| Total (Overall) | 15,739 (53.8%) | 13,525 (46.2%) |
Employment Industries by Sex in Greene County
Employment Industries in Greene County
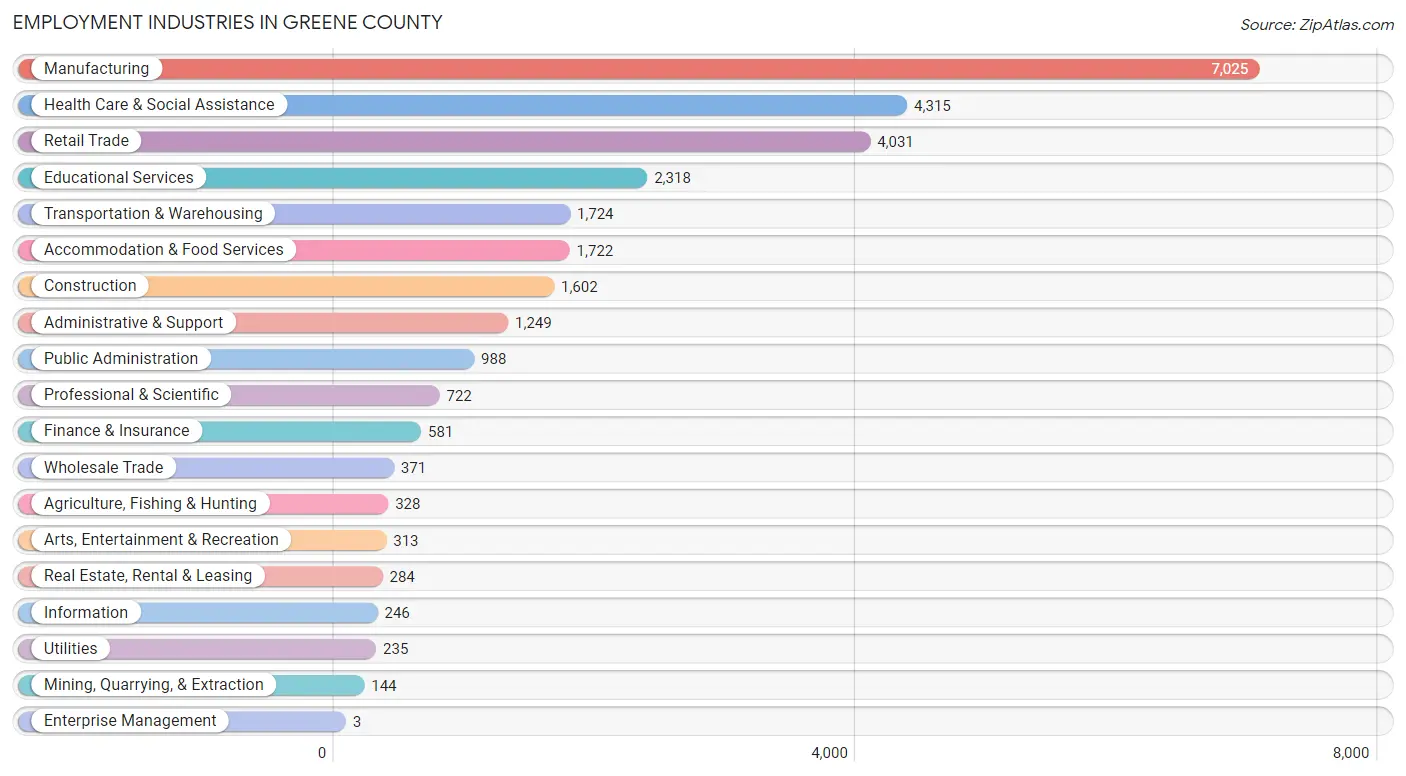
The major employment industries in Greene County include Manufacturing (7,025 | 24.0%), Health Care & Social Assistance (4,315 | 14.7%), Retail Trade (4,031 | 13.8%), Educational Services (2,318 | 7.9%), and Transportation & Warehousing (1,724 | 5.9%).
Employment Industries by Sex in Greene County
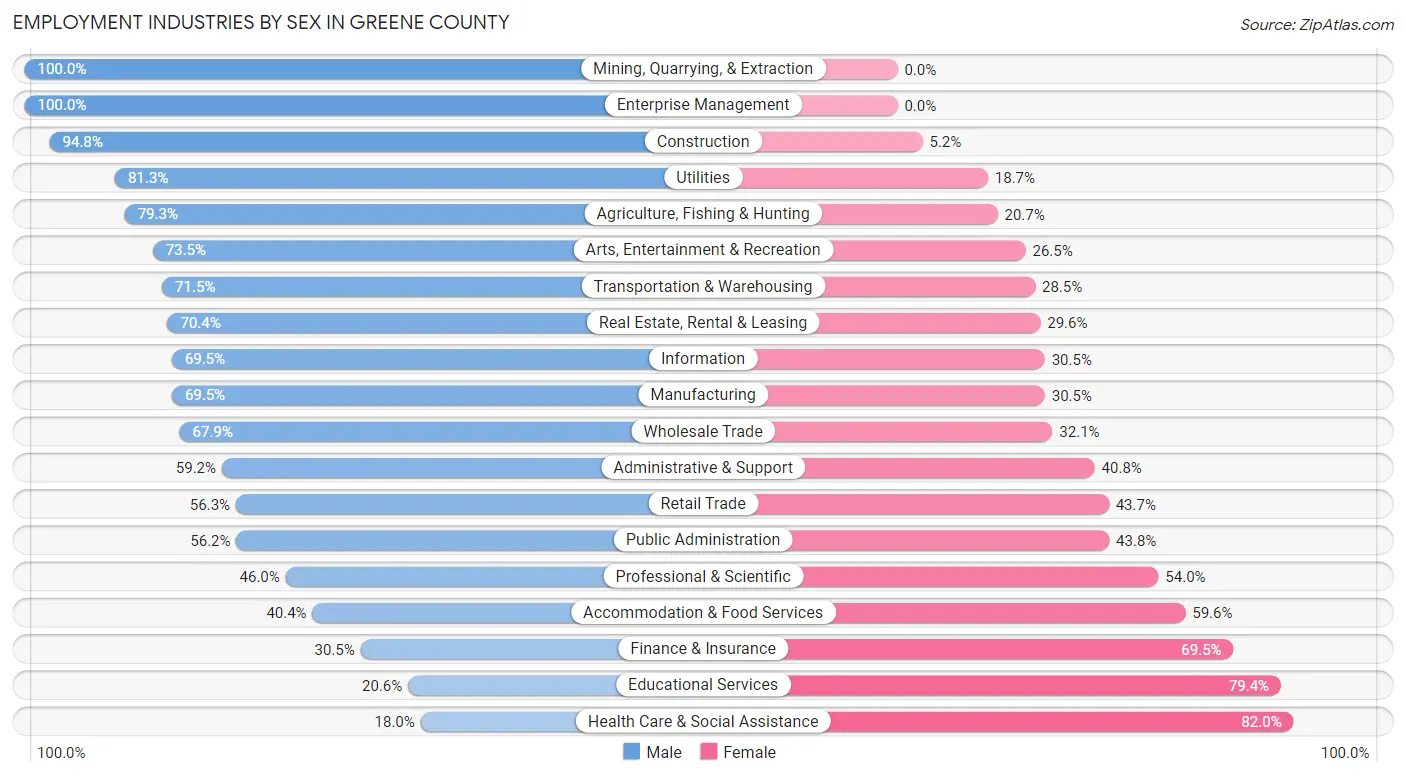
The Greene County industries that see more men than women are Mining, Quarrying, & Extraction (100.0%), Enterprise Management (100.0%), and Construction (94.8%), whereas the industries that tend to have a higher number of women are Health Care & Social Assistance (82.0%), Educational Services (79.4%), and Finance & Insurance (69.5%).
| Industry | Male | Female |
| Agriculture, Fishing & Hunting | 260 (79.3%) | 68 (20.7%) |
| Mining, Quarrying, & Extraction | 144 (100.0%) | 0 (0.0%) |
| Construction | 1,519 (94.8%) | 83 (5.2%) |
| Manufacturing | 4,882 (69.5%) | 2,143 (30.5%) |
| Wholesale Trade | 252 (67.9%) | 119 (32.1%) |
| Retail Trade | 2,268 (56.3%) | 1,763 (43.7%) |
| Transportation & Warehousing | 1,233 (71.5%) | 491 (28.5%) |
| Utilities | 191 (81.3%) | 44 (18.7%) |
| Information | 171 (69.5%) | 75 (30.5%) |
| Finance & Insurance | 177 (30.5%) | 404 (69.5%) |
| Real Estate, Rental & Leasing | 200 (70.4%) | 84 (29.6%) |
| Professional & Scientific | 332 (46.0%) | 390 (54.0%) |
| Enterprise Management | 3 (100.0%) | 0 (0.0%) |
| Administrative & Support | 739 (59.2%) | 510 (40.8%) |
| Educational Services | 478 (20.6%) | 1,840 (79.4%) |
| Health Care & Social Assistance | 778 (18.0%) | 3,537 (82.0%) |
| Arts, Entertainment & Recreation | 230 (73.5%) | 83 (26.5%) |
| Accommodation & Food Services | 696 (40.4%) | 1,026 (59.6%) |
| Public Administration | 555 (56.2%) | 433 (43.8%) |
| Total | 15,739 (53.8%) | 13,525 (46.2%) |
Education in Greene County
School Enrollment in Greene County
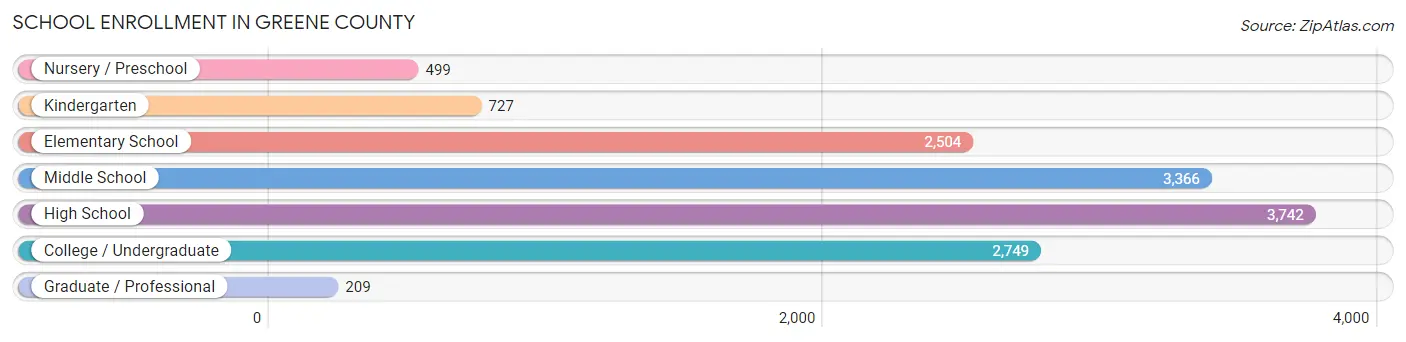
The most common levels of schooling among the 13,796 students in Greene County are high school (3,742 | 27.1%), middle school (3,366 | 24.4%), and college / undergraduate (2,749 | 19.9%).
| School Level | # Students | % Students |
| Nursery / Preschool | 499 | 3.6% |
| Kindergarten | 727 | 5.3% |
| Elementary School | 2,504 | 18.1% |
| Middle School | 3,366 | 24.4% |
| High School | 3,742 | 27.1% |
| College / Undergraduate | 2,749 | 19.9% |
| Graduate / Professional | 209 | 1.5% |
| Total | 13,796 | 100.0% |
School Enrollment by Age by Funding Source in Greene County
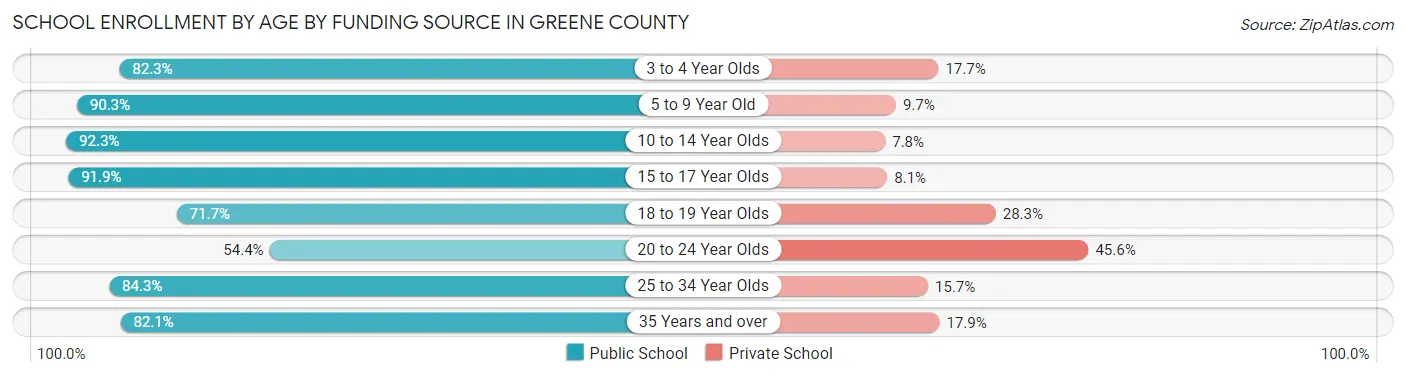
Out of a total of 13,796 students who are enrolled in schools in Greene County, 2,097 (15.2%) attend a private institution, while the remaining 11,699 (84.8%) are enrolled in public schools. The age group of 20 to 24 year olds has the highest likelihood of being enrolled in private schools, with 684 (45.6% in the age bracket) enrolled. Conversely, the age group of 10 to 14 year olds has the lowest likelihood of being enrolled in a private school, with 3,855 (92.2% in the age bracket) attending a public institution.
| Age Bracket | Public School | Private School |
| 3 to 4 Year Olds | 275 (82.3%) | 59 (17.7%) |
| 5 to 9 Year Old | 2,751 (90.3%) | 297 (9.7%) |
| 10 to 14 Year Olds | 3,855 (92.2%) | 324 (7.7%) |
| 15 to 17 Year Olds | 2,327 (91.9%) | 206 (8.1%) |
| 18 to 19 Year Olds | 951 (71.7%) | 376 (28.3%) |
| 20 to 24 Year Olds | 816 (54.4%) | 684 (45.6%) |
| 25 to 34 Year Olds | 407 (84.3%) | 76 (15.7%) |
| 35 Years and over | 322 (82.1%) | 70 (17.9%) |
| Total | 11,699 (84.8%) | 2,097 (15.2%) |
Educational Attainment by Field of Study in Greene County
Education (2,290 | 23.5%), business (1,951 | 20.0%), science & technology (1,035 | 10.6%), arts & humanities (913 | 9.4%), and liberal arts & history (583 | 6.0%) are the most common fields of study among 9,746 individuals in Greene County who have obtained a bachelor's degree or higher.
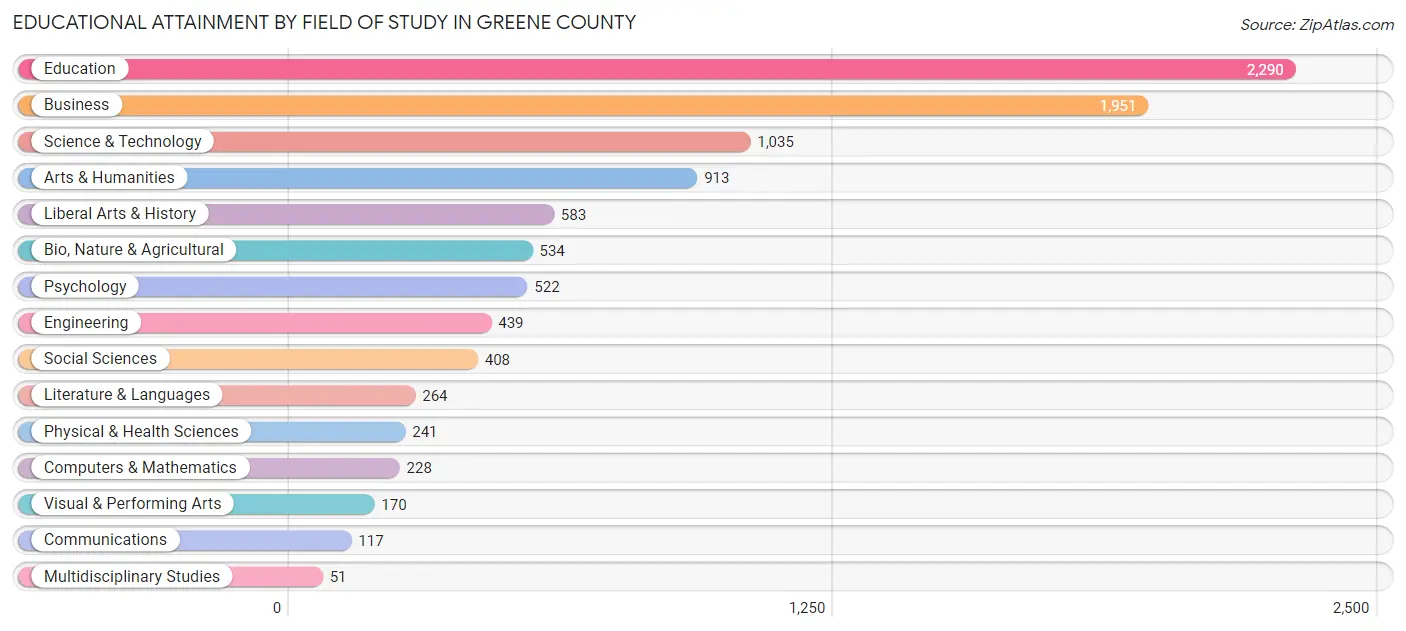
| Field of Study | # Graduates | % Graduates |
| Computers & Mathematics | 228 | 2.3% |
| Bio, Nature & Agricultural | 534 | 5.5% |
| Physical & Health Sciences | 241 | 2.5% |
| Psychology | 522 | 5.4% |
| Social Sciences | 408 | 4.2% |
| Engineering | 439 | 4.5% |
| Multidisciplinary Studies | 51 | 0.5% |
| Science & Technology | 1,035 | 10.6% |
| Business | 1,951 | 20.0% |
| Education | 2,290 | 23.5% |
| Literature & Languages | 264 | 2.7% |
| Liberal Arts & History | 583 | 6.0% |
| Visual & Performing Arts | 170 | 1.7% |
| Communications | 117 | 1.2% |
| Arts & Humanities | 913 | 9.4% |
| Total | 9,746 | 100.0% |
Transportation & Commute in Greene County
Vehicle Availability by Sex in Greene County
The most prevalent vehicle ownership categories in Greene County are males with 2 vehicles (6,035, accounting for 39.8%) and females with 2 vehicles (5,221, making up 46.2%).
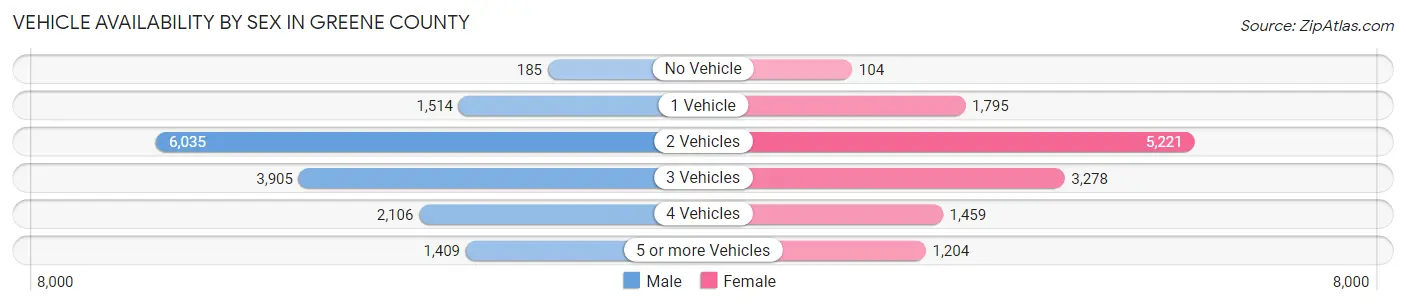
| Vehicles Available | Male | Female |
| No Vehicle | 185 (1.2%) | 104 (0.8%) |
| 1 Vehicle | 1,514 (10.0%) | 1,795 (13.7%) |
| 2 Vehicles | 6,035 (39.8%) | 5,221 (40.0%) |
| 3 Vehicles | 3,905 (25.8%) | 3,278 (25.1%) |
| 4 Vehicles | 2,106 (13.9%) | 1,459 (11.2%) |
| 5 or more Vehicles | 1,409 (9.3%) | 1,204 (9.2%) |
| Total | 15,154 (100.0%) | 13,061 (100.0%) |
Commute Time in Greene County
The most frequently occuring commute durations in Greene County are 15 to 19 minutes (4,903 commuters, 18.2%), 20 to 24 minutes (4,545 commuters, 16.8%), and 30 to 34 minutes (3,464 commuters, 12.8%).
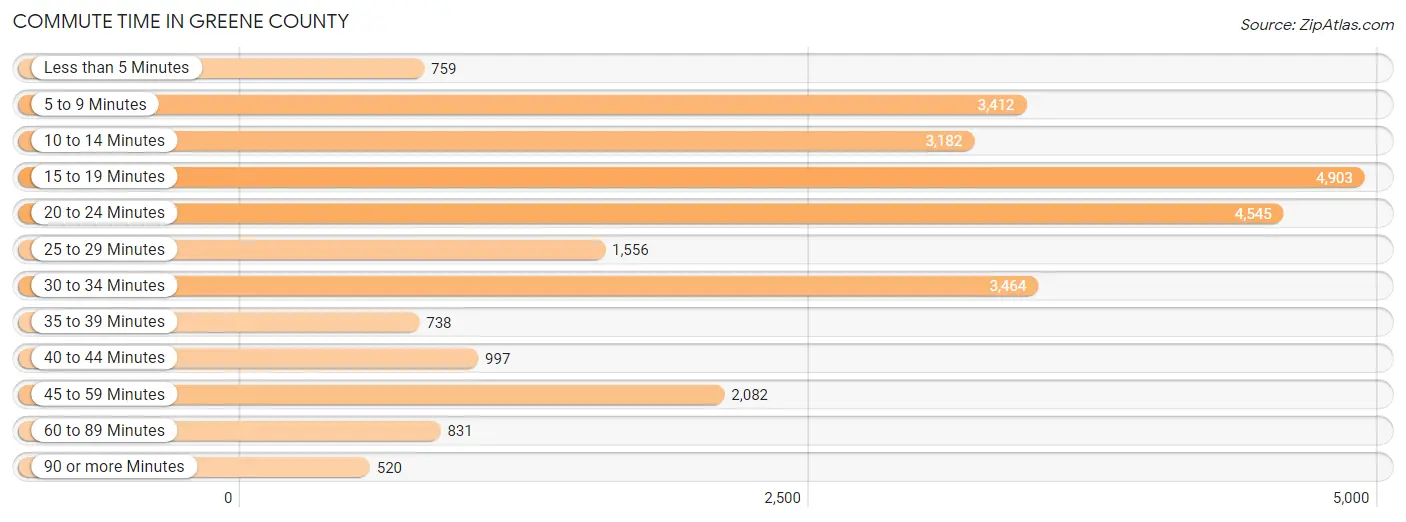
| Commute Time | # Commuters | % Commuters |
| Less than 5 Minutes | 759 | 2.8% |
| 5 to 9 Minutes | 3,412 | 12.6% |
| 10 to 14 Minutes | 3,182 | 11.8% |
| 15 to 19 Minutes | 4,903 | 18.2% |
| 20 to 24 Minutes | 4,545 | 16.8% |
| 25 to 29 Minutes | 1,556 | 5.8% |
| 30 to 34 Minutes | 3,464 | 12.8% |
| 35 to 39 Minutes | 738 | 2.7% |
| 40 to 44 Minutes | 997 | 3.7% |
| 45 to 59 Minutes | 2,082 | 7.7% |
| 60 to 89 Minutes | 831 | 3.1% |
| 90 or more Minutes | 520 | 1.9% |
Commute Time by Sex in Greene County
The most common commute times in Greene County are 15 to 19 minutes (2,517 commuters, 17.1%) for males and 15 to 19 minutes (2,386 commuters, 19.4%) for females.
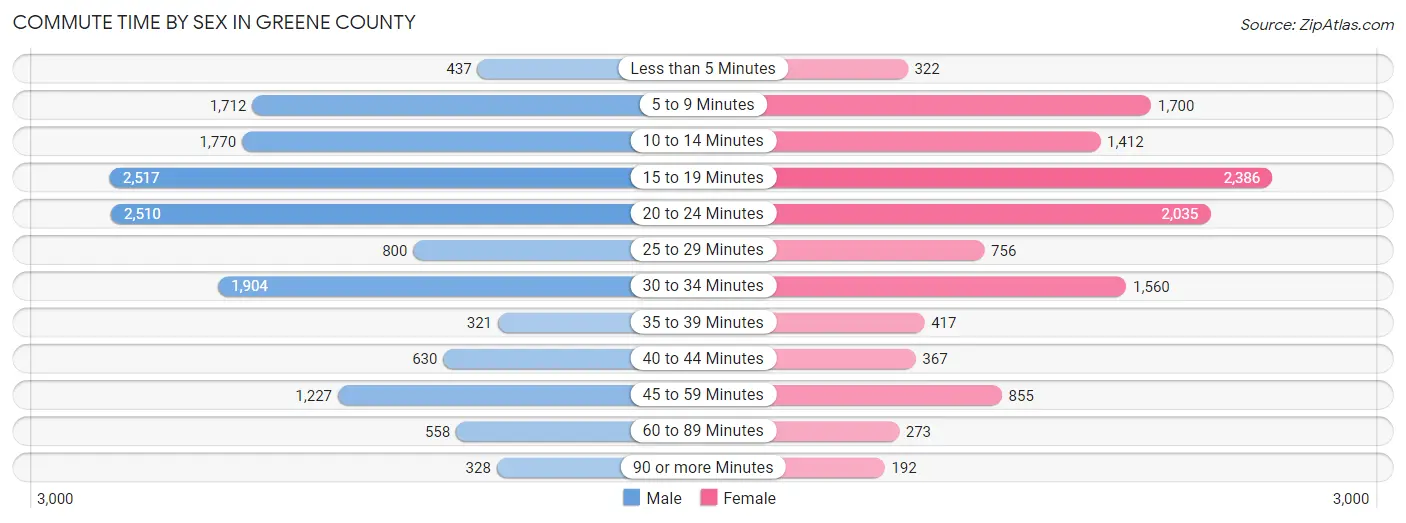
| Commute Time | Male | Female |
| Less than 5 Minutes | 437 (3.0%) | 322 (2.6%) |
| 5 to 9 Minutes | 1,712 (11.6%) | 1,700 (13.9%) |
| 10 to 14 Minutes | 1,770 (12.0%) | 1,412 (11.5%) |
| 15 to 19 Minutes | 2,517 (17.1%) | 2,386 (19.4%) |
| 20 to 24 Minutes | 2,510 (17.1%) | 2,035 (16.6%) |
| 25 to 29 Minutes | 800 (5.4%) | 756 (6.2%) |
| 30 to 34 Minutes | 1,904 (12.9%) | 1,560 (12.7%) |
| 35 to 39 Minutes | 321 (2.2%) | 417 (3.4%) |
| 40 to 44 Minutes | 630 (4.3%) | 367 (3.0%) |
| 45 to 59 Minutes | 1,227 (8.3%) | 855 (7.0%) |
| 60 to 89 Minutes | 558 (3.8%) | 273 (2.2%) |
| 90 or more Minutes | 328 (2.2%) | 192 (1.6%) |
Time of Departure to Work by Sex in Greene County
The most frequent times of departure to work in Greene County are 6:00 AM to 6:29 AM (1,921, 13.1%) for males and 7:30 AM to 7:59 AM (2,407, 19.6%) for females.
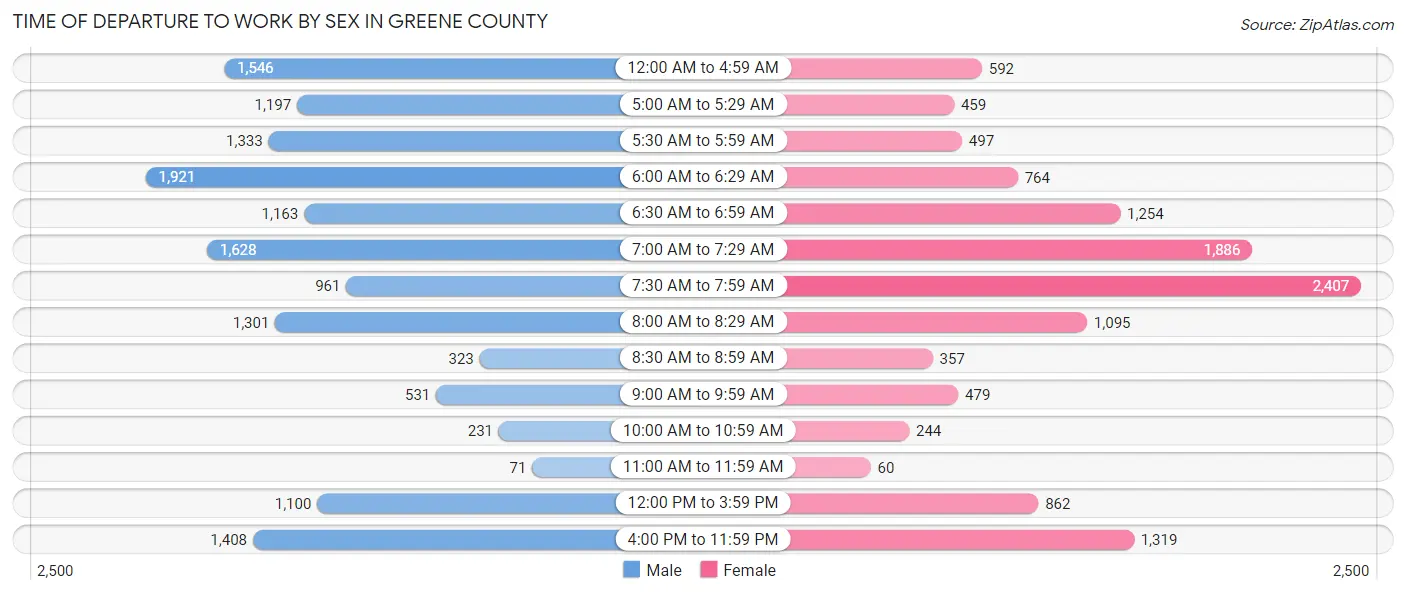
| Time of Departure | Male | Female |
| 12:00 AM to 4:59 AM | 1,546 (10.5%) | 592 (4.8%) |
| 5:00 AM to 5:29 AM | 1,197 (8.1%) | 459 (3.7%) |
| 5:30 AM to 5:59 AM | 1,333 (9.1%) | 497 (4.1%) |
| 6:00 AM to 6:29 AM | 1,921 (13.1%) | 764 (6.2%) |
| 6:30 AM to 6:59 AM | 1,163 (7.9%) | 1,254 (10.2%) |
| 7:00 AM to 7:29 AM | 1,628 (11.1%) | 1,886 (15.4%) |
| 7:30 AM to 7:59 AM | 961 (6.5%) | 2,407 (19.6%) |
| 8:00 AM to 8:29 AM | 1,301 (8.8%) | 1,095 (8.9%) |
| 8:30 AM to 8:59 AM | 323 (2.2%) | 357 (2.9%) |
| 9:00 AM to 9:59 AM | 531 (3.6%) | 479 (3.9%) |
| 10:00 AM to 10:59 AM | 231 (1.6%) | 244 (2.0%) |
| 11:00 AM to 11:59 AM | 71 (0.5%) | 60 (0.5%) |
| 12:00 PM to 3:59 PM | 1,100 (7.5%) | 862 (7.0%) |
| 4:00 PM to 11:59 PM | 1,408 (9.6%) | 1,319 (10.7%) |
| Total | 14,714 (100.0%) | 12,275 (100.0%) |
Housing Occupancy in Greene County
Occupancy by Ownership in Greene County
Of the total 27,777 dwellings in Greene County, owner-occupied units account for 20,948 (75.4%), while renter-occupied units make up 6,829 (24.6%).
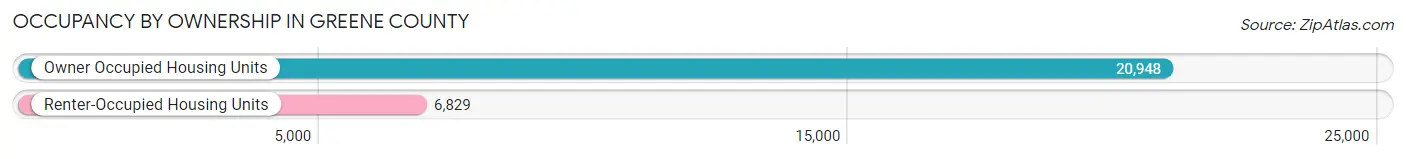
| Occupancy | # Housing Units | % Housing Units |
| Owner Occupied Housing Units | 20,948 | 75.4% |
| Renter-Occupied Housing Units | 6,829 | 24.6% |
| Total Occupied Housing Units | 27,777 | 100.0% |
Occupancy by Household Size in Greene County
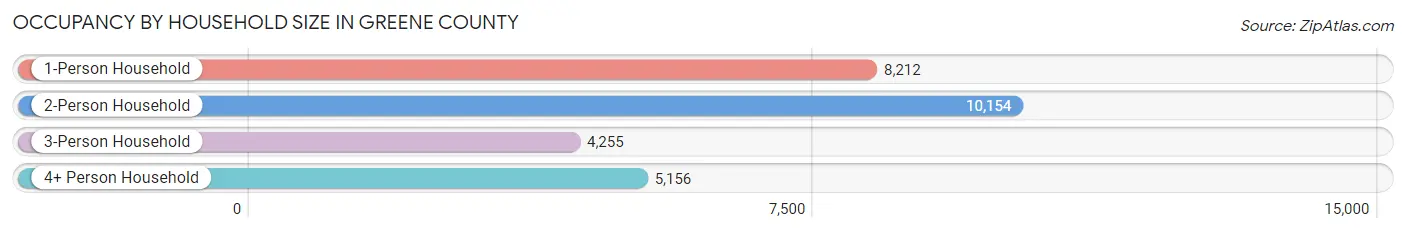
| Household Size | # Housing Units | % Housing Units |
| 1-Person Household | 8,212 | 29.6% |
| 2-Person Household | 10,154 | 36.6% |
| 3-Person Household | 4,255 | 15.3% |
| 4+ Person Household | 5,156 | 18.6% |
| Total Housing Units | 27,777 | 100.0% |
Occupancy by Ownership by Household Size in Greene County

| Household Size | Owner-occupied | Renter-occupied |
| 1-Person Household | 5,644 (68.7%) | 2,568 (31.3%) |
| 2-Person Household | 8,127 (80.0%) | 2,027 (20.0%) |
| 3-Person Household | 3,287 (77.2%) | 968 (22.8%) |
| 4+ Person Household | 3,890 (75.4%) | 1,266 (24.5%) |
| Total Housing Units | 20,948 (75.4%) | 6,829 (24.6%) |
Occupancy by Educational Attainment in Greene County
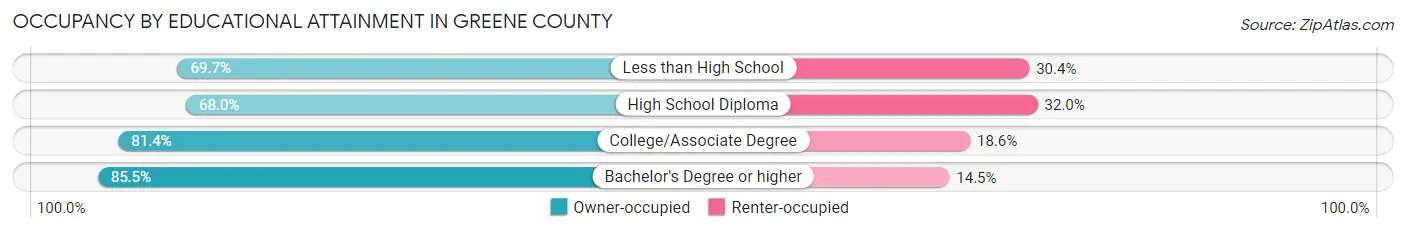
| Household Size | Owner-occupied | Renter-occupied |
| Less than High School | 2,277 (69.7%) | 992 (30.3%) |
| High School Diploma | 7,578 (68.0%) | 3,567 (32.0%) |
| College/Associate Degree | 6,584 (81.4%) | 1,505 (18.6%) |
| Bachelor's Degree or higher | 4,509 (85.5%) | 765 (14.5%) |
Occupancy by Age of Householder in Greene County
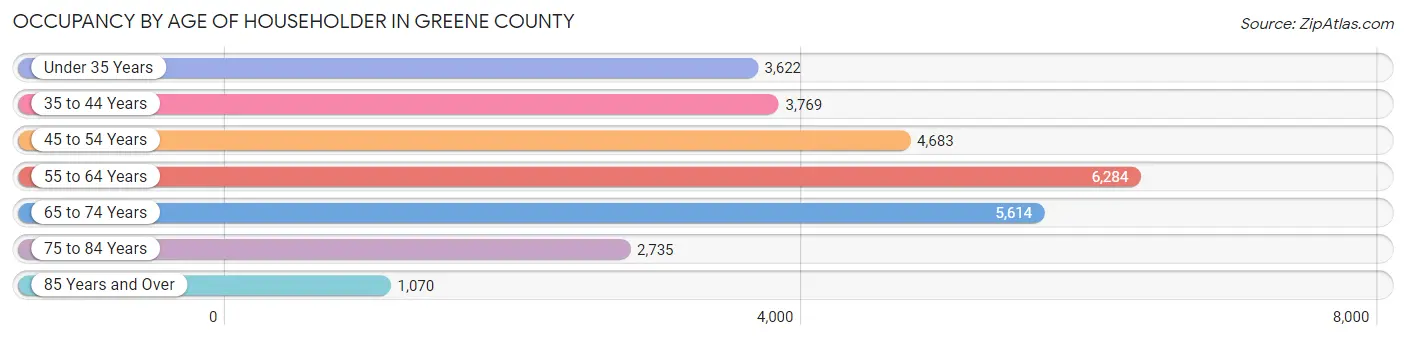
| Age Bracket | # Households | % Households |
| Under 35 Years | 3,622 | 13.0% |
| 35 to 44 Years | 3,769 | 13.6% |
| 45 to 54 Years | 4,683 | 16.9% |
| 55 to 64 Years | 6,284 | 22.6% |
| 65 to 74 Years | 5,614 | 20.2% |
| 75 to 84 Years | 2,735 | 9.9% |
| 85 Years and Over | 1,070 | 3.8% |
| Total | 27,777 | 100.0% |
Housing Finances in Greene County
Median Income by Occupancy in Greene County
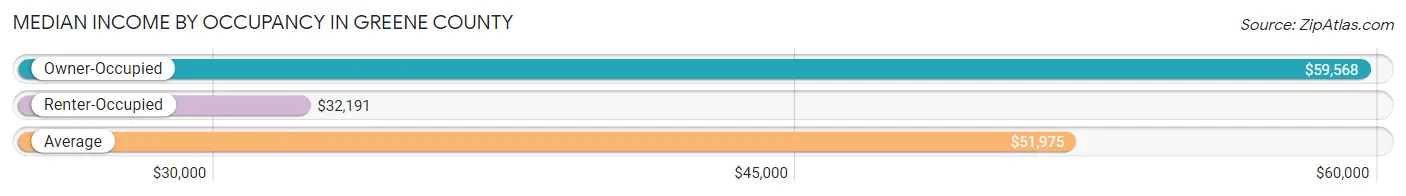
| Occupancy Type | # Households | Median Income |
| Owner-Occupied | 20,948 (75.4%) | $59,568 |
| Renter-Occupied | 6,829 (24.6%) | $32,191 |
| Average | 27,777 (100.0%) | $51,975 |
Occupancy by Householder Income Bracket in Greene County
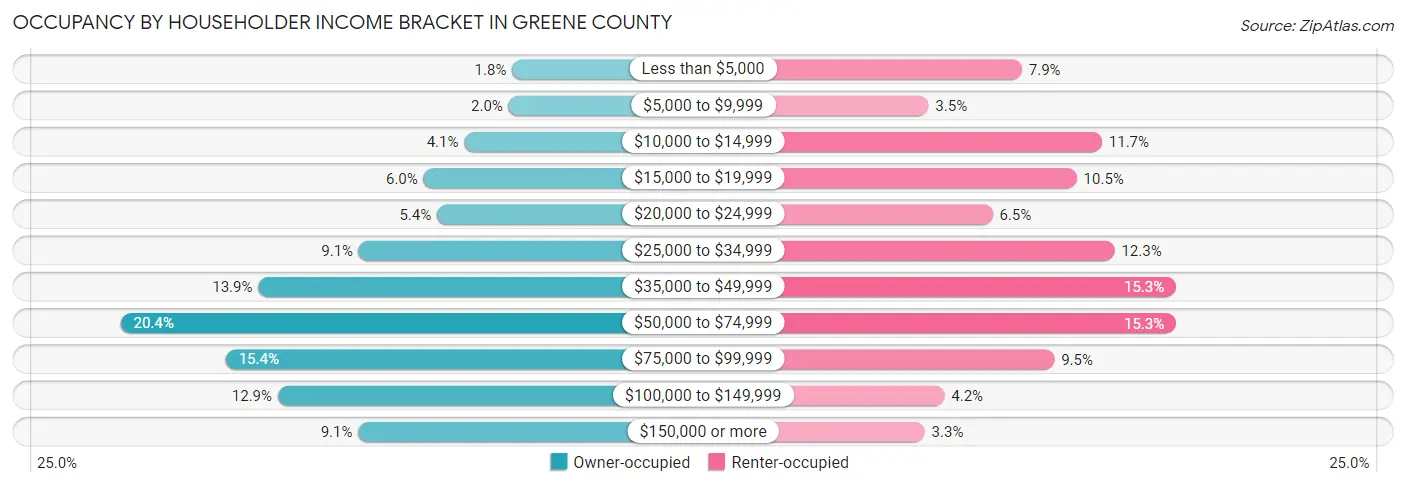
| Income Bracket | Owner-occupied | Renter-occupied |
| Less than $5,000 | 372 (1.8%) | 541 (7.9%) |
| $5,000 to $9,999 | 409 (1.9%) | 237 (3.5%) |
| $10,000 to $14,999 | 850 (4.1%) | 801 (11.7%) |
| $15,000 to $19,999 | 1,257 (6.0%) | 719 (10.5%) |
| $20,000 to $24,999 | 1,123 (5.4%) | 445 (6.5%) |
| $25,000 to $34,999 | 1,902 (9.1%) | 842 (12.3%) |
| $35,000 to $49,999 | 2,906 (13.9%) | 1,042 (15.3%) |
| $50,000 to $74,999 | 4,280 (20.4%) | 1,042 (15.3%) |
| $75,000 to $99,999 | 3,230 (15.4%) | 646 (9.5%) |
| $100,000 to $149,999 | 2,711 (12.9%) | 289 (4.2%) |
| $150,000 or more | 1,908 (9.1%) | 225 (3.3%) |
| Total | 20,948 (100.0%) | 6,829 (100.0%) |
Monthly Housing Cost Tiers in Greene County
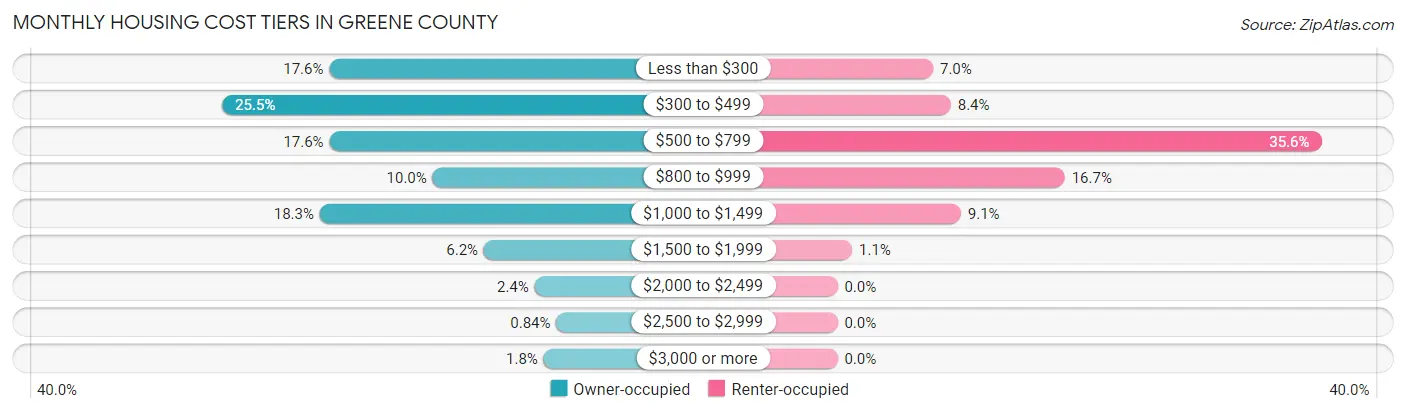
| Monthly Cost | Owner-occupied | Renter-occupied |
| Less than $300 | 3,679 (17.6%) | 481 (7.0%) |
| $300 to $499 | 5,334 (25.5%) | 570 (8.4%) |
| $500 to $799 | 3,676 (17.5%) | 2,434 (35.6%) |
| $800 to $999 | 2,084 (10.0%) | 1,143 (16.7%) |
| $1,000 to $1,499 | 3,826 (18.3%) | 621 (9.1%) |
| $1,500 to $1,999 | 1,292 (6.2%) | 74 (1.1%) |
| $2,000 to $2,499 | 511 (2.4%) | 0 (0.0%) |
| $2,500 to $2,999 | 175 (0.8%) | 0 (0.0%) |
| $3,000 or more | 371 (1.8%) | 0 (0.0%) |
| Total | 20,948 (100.0%) | 6,829 (100.0%) |
Physical Housing Characteristics in Greene County
Housing Structures in Greene County
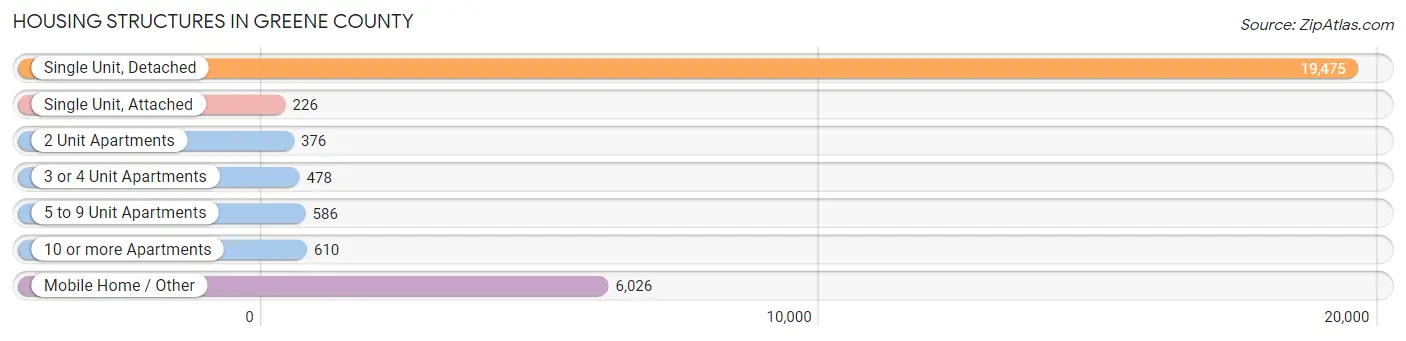
| Structure Type | # Housing Units | % Housing Units |
| Single Unit, Detached | 19,475 | 70.1% |
| Single Unit, Attached | 226 | 0.8% |
| 2 Unit Apartments | 376 | 1.3% |
| 3 or 4 Unit Apartments | 478 | 1.7% |
| 5 to 9 Unit Apartments | 586 | 2.1% |
| 10 or more Apartments | 610 | 2.2% |
| Mobile Home / Other | 6,026 | 21.7% |
| Total | 27,777 | 100.0% |
Housing Structures by Occupancy in Greene County
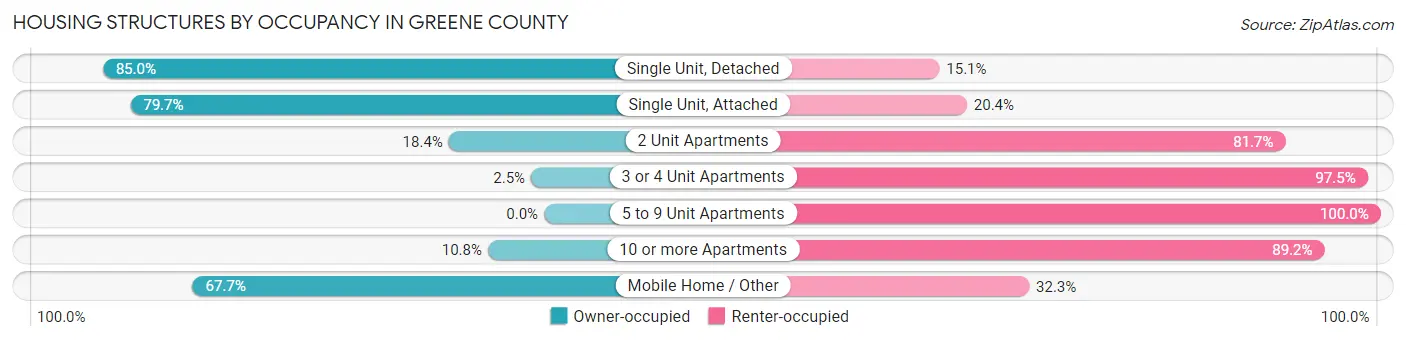
| Structure Type | Owner-occupied | Renter-occupied |
| Single Unit, Detached | 16,544 (85.0%) | 2,931 (15.0%) |
| Single Unit, Attached | 180 (79.6%) | 46 (20.3%) |
| 2 Unit Apartments | 69 (18.3%) | 307 (81.7%) |
| 3 or 4 Unit Apartments | 12 (2.5%) | 466 (97.5%) |
| 5 to 9 Unit Apartments | 0 (0.0%) | 586 (100.0%) |
| 10 or more Apartments | 66 (10.8%) | 544 (89.2%) |
| Mobile Home / Other | 4,077 (67.7%) | 1,949 (32.3%) |
| Total | 20,948 (75.4%) | 6,829 (24.6%) |
Housing Structures by Number of Rooms in Greene County
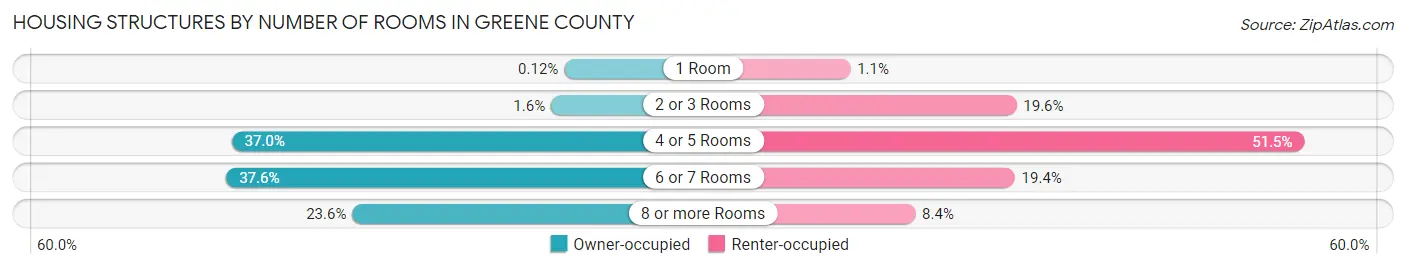
| Number of Rooms | Owner-occupied | Renter-occupied |
| 1 Room | 25 (0.1%) | 78 (1.1%) |
| 2 or 3 Rooms | 332 (1.6%) | 1,337 (19.6%) |
| 4 or 5 Rooms | 7,757 (37.0%) | 3,520 (51.5%) |
| 6 or 7 Rooms | 7,881 (37.6%) | 1,324 (19.4%) |
| 8 or more Rooms | 4,953 (23.6%) | 570 (8.4%) |
| Total | 20,948 (100.0%) | 6,829 (100.0%) |
Housing Structure by Heating Type in Greene County
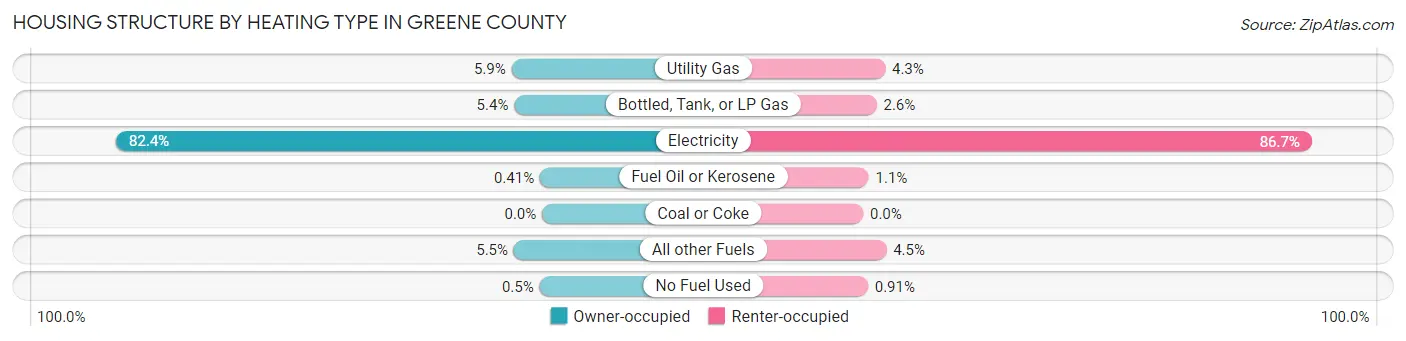
| Heating Type | Owner-occupied | Renter-occupied |
| Utility Gas | 1,239 (5.9%) | 290 (4.3%) |
| Bottled, Tank, or LP Gas | 1,127 (5.4%) | 178 (2.6%) |
| Electricity | 17,251 (82.4%) | 5,920 (86.7%) |
| Fuel Oil or Kerosene | 86 (0.4%) | 73 (1.1%) |
| Coal or Coke | 0 (0.0%) | 0 (0.0%) |
| All other Fuels | 1,141 (5.4%) | 306 (4.5%) |
| No Fuel Used | 104 (0.5%) | 62 (0.9%) |
| Total | 20,948 (100.0%) | 6,829 (100.0%) |
Household Vehicle Usage in Greene County
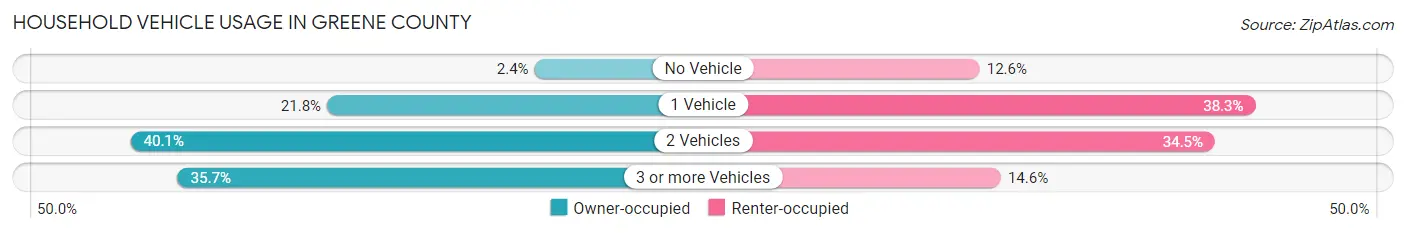
| Vehicles per Household | Owner-occupied | Renter-occupied |
| No Vehicle | 504 (2.4%) | 860 (12.6%) |
| 1 Vehicle | 4,563 (21.8%) | 2,616 (38.3%) |
| 2 Vehicles | 8,400 (40.1%) | 2,358 (34.5%) |
| 3 or more Vehicles | 7,481 (35.7%) | 995 (14.6%) |
| Total | 20,948 (100.0%) | 6,829 (100.0%) |
Real Estate & Mortgages in Greene County
Real Estate and Mortgage Overview in Greene County
| Characteristic | Without Mortgage | With Mortgage |
| Housing Units | 10,564 | 10,384 |
| Median Property Value | $159,900 | $172,000 |
| Median Household Income | $44,245 | $1,282 |
| Monthly Housing Costs | $348 | $371 |
| Real Estate Taxes | $749 | $333 |
Property Value by Mortgage Status in Greene County
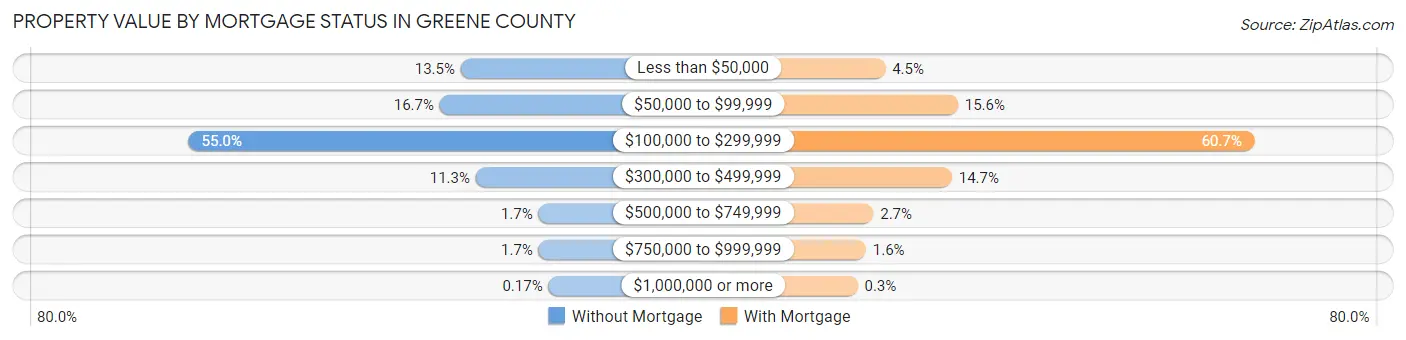
| Property Value | Without Mortgage | With Mortgage |
| Less than $50,000 | 1,429 (13.5%) | 469 (4.5%) |
| $50,000 to $99,999 | 1,767 (16.7%) | 1,618 (15.6%) |
| $100,000 to $299,999 | 5,810 (55.0%) | 6,300 (60.7%) |
| $300,000 to $499,999 | 1,188 (11.3%) | 1,523 (14.7%) |
| $500,000 to $749,999 | 177 (1.7%) | 280 (2.7%) |
| $750,000 to $999,999 | 175 (1.7%) | 163 (1.6%) |
| $1,000,000 or more | 18 (0.2%) | 31 (0.3%) |
| Total | 10,564 (100.0%) | 10,384 (100.0%) |
Household Income by Mortgage Status in Greene County
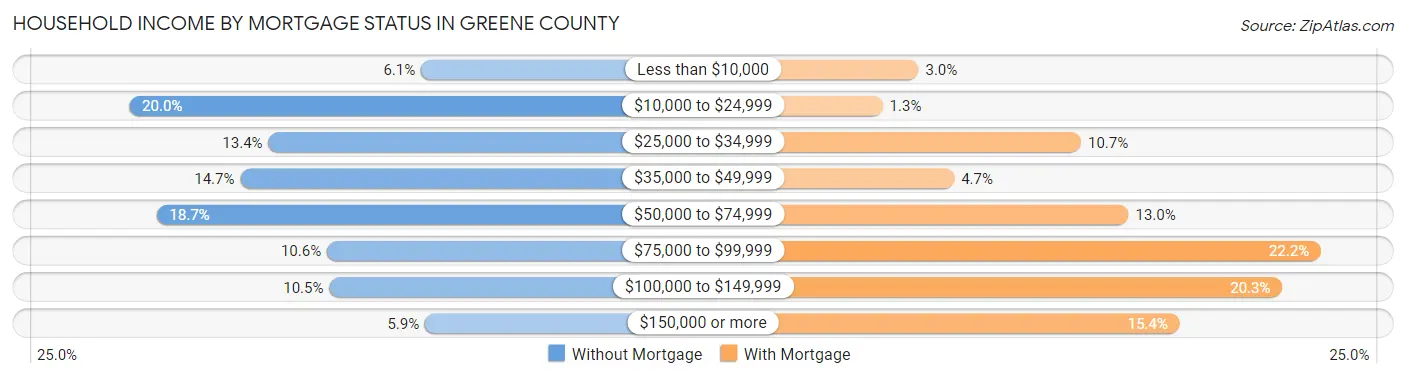
| Household Income | Without Mortgage | With Mortgage |
| Less than $10,000 | 647 (6.1%) | 312 (3.0%) |
| $10,000 to $24,999 | 2,115 (20.0%) | 134 (1.3%) |
| $25,000 to $34,999 | 1,414 (13.4%) | 1,115 (10.7%) |
| $35,000 to $49,999 | 1,556 (14.7%) | 488 (4.7%) |
| $50,000 to $74,999 | 1,978 (18.7%) | 1,350 (13.0%) |
| $75,000 to $99,999 | 1,120 (10.6%) | 2,302 (22.2%) |
| $100,000 to $149,999 | 1,108 (10.5%) | 2,110 (20.3%) |
| $150,000 or more | 626 (5.9%) | 1,603 (15.4%) |
| Total | 10,564 (100.0%) | 10,384 (100.0%) |
Property Value to Household Income Ratio in Greene County
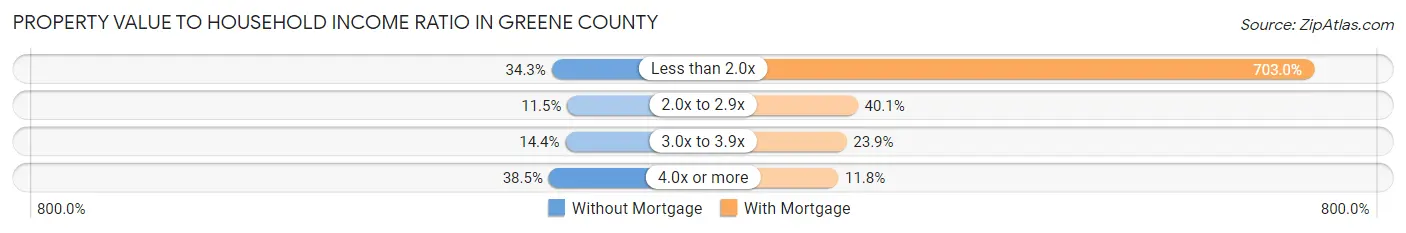
| Value-to-Income Ratio | Without Mortgage | With Mortgage |
| Less than 2.0x | 3,622 (34.3%) | 72,998 (703.0%) |
| 2.0x to 2.9x | 1,212 (11.5%) | 4,165 (40.1%) |
| 3.0x to 3.9x | 1,525 (14.4%) | 2,477 (23.8%) |
| 4.0x or more | 4,067 (38.5%) | 1,220 (11.7%) |
| Total | 10,564 (100.0%) | 10,384 (100.0%) |
Real Estate Taxes by Mortgage Status in Greene County
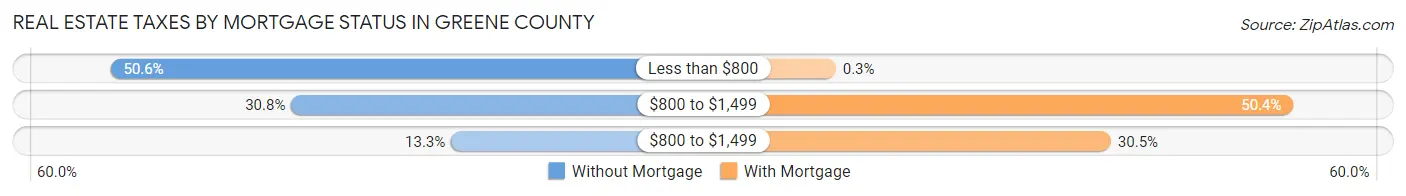
| Property Taxes | Without Mortgage | With Mortgage |
| Less than $800 | 5,344 (50.6%) | 31 (0.3%) |
| $800 to $1,499 | 3,252 (30.8%) | 5,238 (50.4%) |
| $800 to $1,499 | 1,401 (13.3%) | 3,162 (30.4%) |
| Total | 10,564 (100.0%) | 10,384 (100.0%) |
Health & Disability in Greene County
Health Insurance Coverage by Age in Greene County
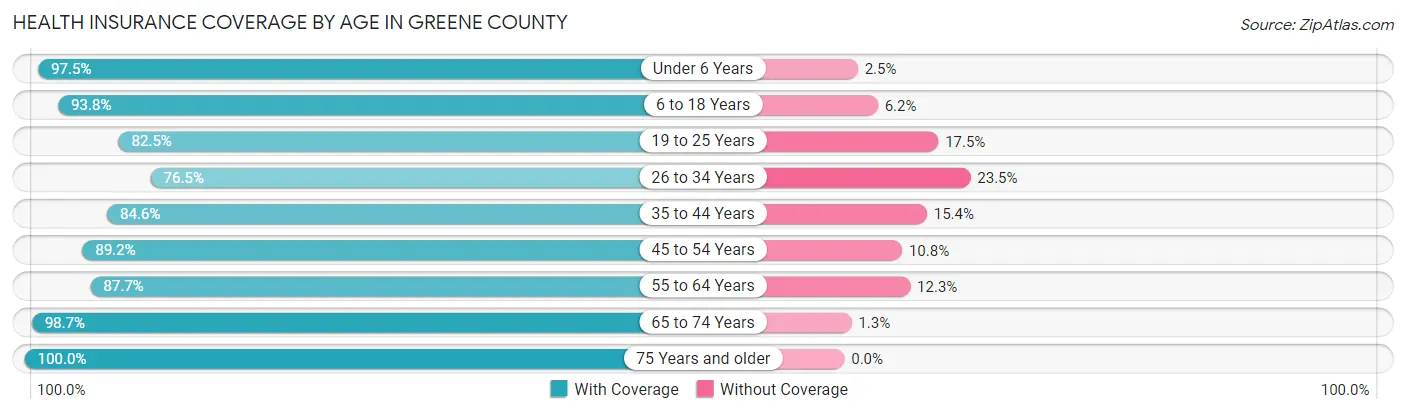
| Age Bracket | With Coverage | Without Coverage |
| Under 6 Years | 3,749 (97.5%) | 96 (2.5%) |
| 6 to 18 Years | 9,774 (93.8%) | 649 (6.2%) |
| 19 to 25 Years | 4,989 (82.5%) | 1,059 (17.5%) |
| 26 to 34 Years | 5,215 (76.5%) | 1,603 (23.5%) |
| 35 to 44 Years | 6,574 (84.6%) | 1,195 (15.4%) |
| 45 to 54 Years | 8,146 (89.2%) | 982 (10.8%) |
| 55 to 64 Years | 9,092 (87.7%) | 1,273 (12.3%) |
| 65 to 74 Years | 8,844 (98.7%) | 119 (1.3%) |
| 75 Years and older | 5,945 (100.0%) | 0 (0.0%) |
| Total | 62,328 (89.9%) | 6,976 (10.1%) |
Health Insurance Coverage by Citizenship Status in Greene County
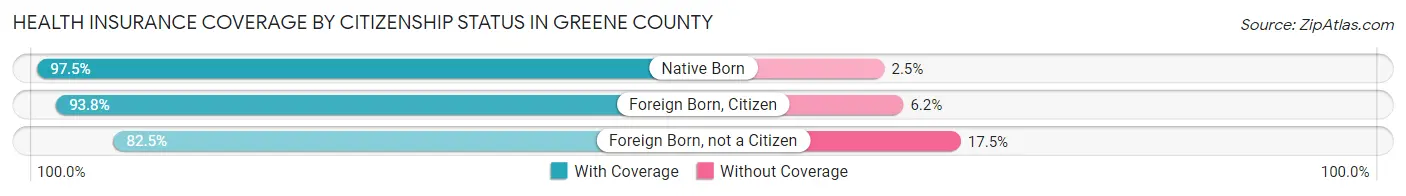
| Citizenship Status | With Coverage | Without Coverage |
| Native Born | 3,749 (97.5%) | 96 (2.5%) |
| Foreign Born, Citizen | 9,774 (93.8%) | 649 (6.2%) |
| Foreign Born, not a Citizen | 4,989 (82.5%) | 1,059 (17.5%) |
Health Insurance Coverage by Household Income in Greene County
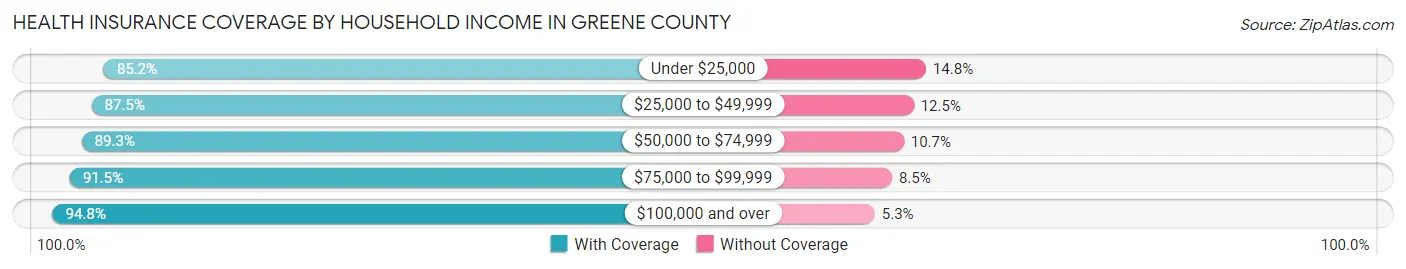
| Household Income | With Coverage | Without Coverage |
| Under $25,000 | 9,764 (85.2%) | 1,702 (14.8%) |
| $25,000 to $49,999 | 12,907 (87.5%) | 1,850 (12.5%) |
| $50,000 to $74,999 | 12,037 (89.3%) | 1,439 (10.7%) |
| $75,000 to $99,999 | 10,823 (91.5%) | 1,002 (8.5%) |
| $100,000 and over | 15,913 (94.8%) | 881 (5.2%) |
Public vs Private Health Insurance Coverage by Age in Greene County
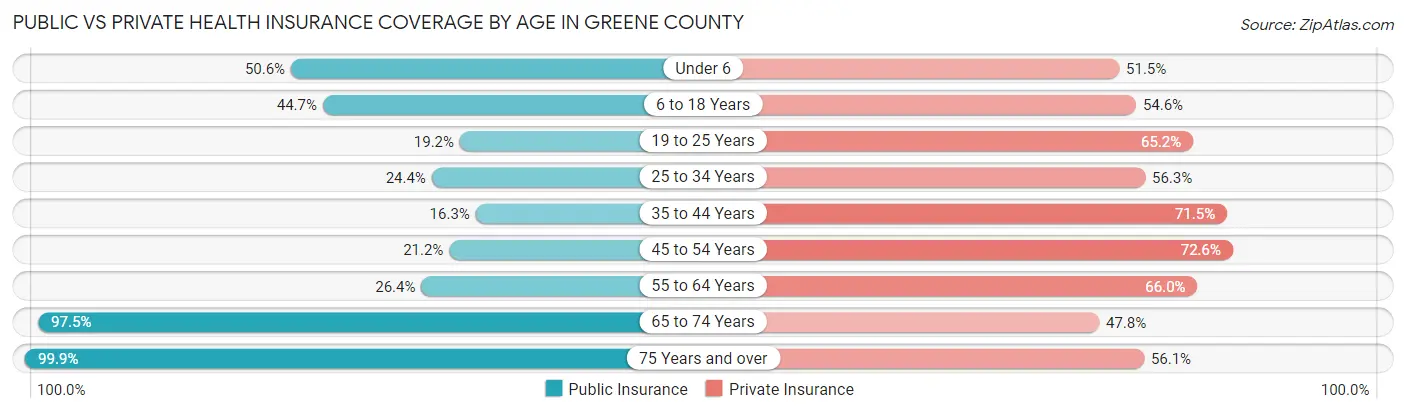
| Age Bracket | Public Insurance | Private Insurance |
| Under 6 | 1,944 (50.6%) | 1,979 (51.5%) |
| 6 to 18 Years | 4,654 (44.7%) | 5,691 (54.6%) |
| 19 to 25 Years | 1,162 (19.2%) | 3,943 (65.2%) |
| 25 to 34 Years | 1,666 (24.4%) | 3,837 (56.3%) |
| 35 to 44 Years | 1,265 (16.3%) | 5,554 (71.5%) |
| 45 to 54 Years | 1,934 (21.2%) | 6,624 (72.6%) |
| 55 to 64 Years | 2,732 (26.4%) | 6,841 (66.0%) |
| 65 to 74 Years | 8,737 (97.5%) | 4,280 (47.7%) |
| 75 Years and over | 5,939 (99.9%) | 3,334 (56.1%) |
| Total | 30,033 (43.3%) | 42,083 (60.7%) |
Disability Status by Sex by Age in Greene County
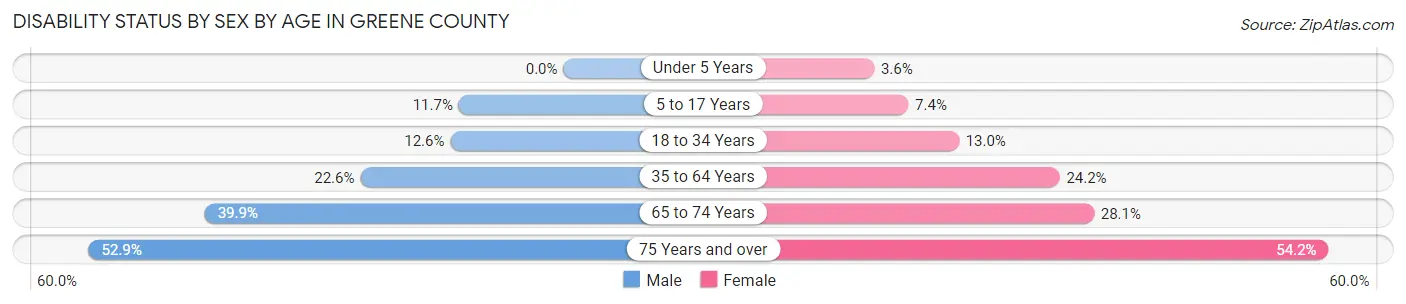
| Age Bracket | Male | Female |
| Under 5 Years | 0 (0.0%) | 58 (3.6%) |
| 5 to 17 Years | 620 (11.7%) | 355 (7.4%) |
| 18 to 34 Years | 891 (12.6%) | 875 (13.0%) |
| 35 to 64 Years | 3,051 (22.6%) | 3,337 (24.2%) |
| 65 to 74 Years | 1,630 (39.9%) | 1,370 (28.1%) |
| 75 Years and over | 1,394 (52.9%) | 1,793 (54.2%) |
Disability Class by Sex by Age in Greene County
Disability Class: Hearing Difficulty
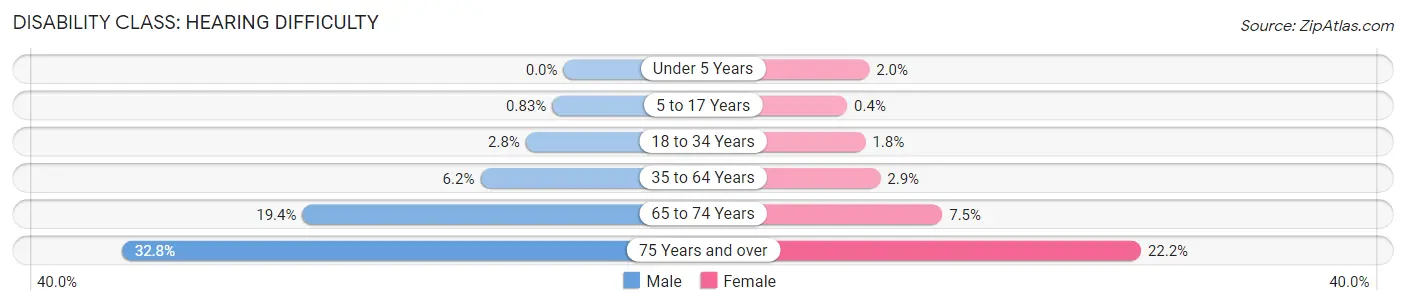
| Age Bracket | Male | Female |
| Under 5 Years | 0 (0.0%) | 33 (2.0%) |
| 5 to 17 Years | 44 (0.8%) | 19 (0.4%) |
| 18 to 34 Years | 198 (2.8%) | 118 (1.8%) |
| 35 to 64 Years | 832 (6.2%) | 394 (2.9%) |
| 65 to 74 Years | 791 (19.4%) | 364 (7.5%) |
| 75 Years and over | 864 (32.8%) | 735 (22.2%) |
Disability Class: Vision Difficulty

| Age Bracket | Male | Female |
| Under 5 Years | 0 (0.0%) | 25 (1.5%) |
| 5 to 17 Years | 199 (3.7%) | 169 (3.5%) |
| 18 to 34 Years | 158 (2.2%) | 313 (4.7%) |
| 35 to 64 Years | 1,218 (9.0%) | 852 (6.2%) |
| 65 to 74 Years | 457 (11.2%) | 296 (6.1%) |
| 75 Years and over | 282 (10.7%) | 505 (15.3%) |
Disability Class: Cognitive Difficulty

| Age Bracket | Male | Female |
| 5 to 17 Years | 506 (9.5%) | 172 (3.6%) |
| 18 to 34 Years | 536 (7.6%) | 511 (7.6%) |
| 35 to 64 Years | 1,147 (8.5%) | 1,643 (11.9%) |
| 65 to 74 Years | 384 (9.4%) | 365 (7.5%) |
| 75 Years and over | 294 (11.2%) | 604 (18.2%) |
Disability Class: Ambulatory Difficulty

| Age Bracket | Male | Female |
| 5 to 17 Years | 104 (1.9%) | 52 (1.1%) |
| 18 to 34 Years | 109 (1.5%) | 220 (3.3%) |
| 35 to 64 Years | 1,598 (11.8%) | 1,955 (14.2%) |
| 65 to 74 Years | 1,123 (27.5%) | 1,025 (21.0%) |
| 75 Years and over | 880 (33.4%) | 1,249 (37.8%) |
Disability Class: Self-Care Difficulty
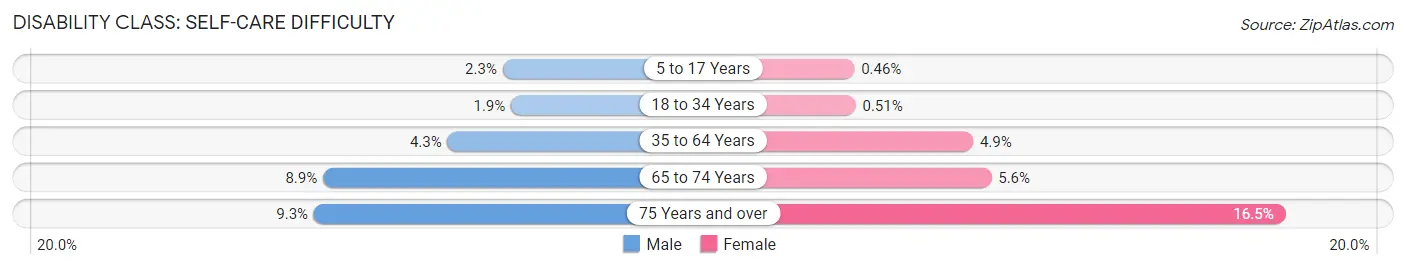
| Age Bracket | Male | Female |
| 5 to 17 Years | 120 (2.2%) | 22 (0.5%) |
| 18 to 34 Years | 137 (1.9%) | 34 (0.5%) |
| 35 to 64 Years | 580 (4.3%) | 670 (4.9%) |
| 65 to 74 Years | 364 (8.9%) | 271 (5.6%) |
| 75 Years and over | 244 (9.3%) | 545 (16.5%) |
Technology Access in Greene County
Computing Device Access in Greene County

| Device Type | # Households | % Households |
| Desktop or Laptop | 17,254 | 62.1% |
| Smartphone | 22,187 | 79.9% |
| Tablet | 13,768 | 49.6% |
| No Computing Device | 3,607 | 13.0% |
| Total | 27,777 | 100.0% |
Internet Access in Greene County
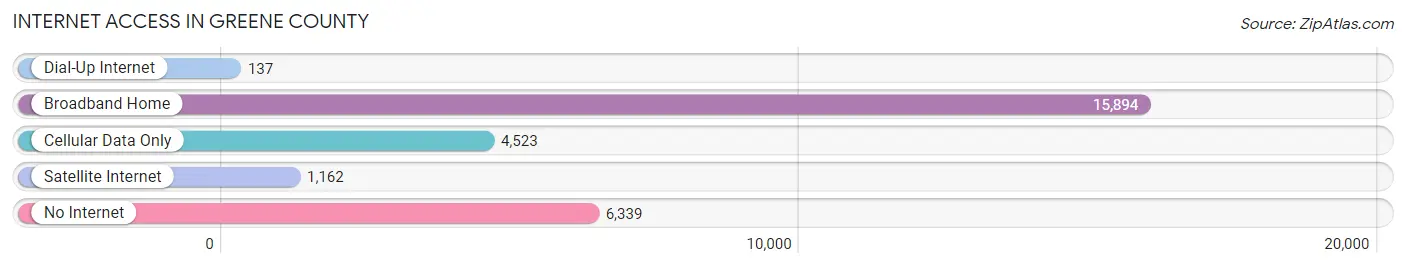
| Internet Type | # Households | % Households |
| Dial-Up Internet | 137 | 0.5% |
| Broadband Home | 15,894 | 57.2% |
| Cellular Data Only | 4,523 | 16.3% |
| Satellite Internet | 1,162 | 4.2% |
| No Internet | 6,339 | 22.8% |
| Total | 27,777 | 100.0% |
Greene County Summary
Greene County is located in the eastern part of Tennessee, in the Appalachian Mountains. It is bordered by Washington County to the north, Unicoi County to the east, Cocke County to the south, and Hamblen County to the west. The county seat is Greeneville, and the county is named after Revolutionary War hero Nathanael Greene.
History
Greene County was formed in 1783 from part of Washington County. It was named after Revolutionary War hero Nathanael Greene. The county was home to several prominent figures in early American history, including Andrew Jackson, Davy Crockett, and Sam Houston.
Greeneville was the site of the first permanent settlement in Greene County, established in 1783. The town was named after Revolutionary War hero Nathanael Greene. It was the site of the first post office in Tennessee, established in 1790.
Greeneville was the site of the first college in Tennessee, Tusculum College, established in 1794. The college was the first to offer a degree in the state.
Greeneville was the site of the first newspaper in Tennessee, the Greeneville Gazette, established in 1797.
Greeneville was the site of the first bank in Tennessee, the Bank of Greene County, established in 1803.
Greeneville was the site of the first railroad in Tennessee, the East Tennessee and Virginia Railroad, established in 1855.
Geography
Greene County is located in the eastern part of Tennessee, in the Appalachian Mountains. It is bordered by Washington County to the north, Unicoi County to the east, Cocke County to the south, and Hamblen County to the west. The county covers an area of 517 square miles, with a population of 68,831 as of the 2010 census.
The county is mostly mountainous, with the highest point being Clinch Mountain at 4,841 feet. The county is drained by the Nolichucky River, which flows through the county from north to south.
Economy
Greene County’s economy is largely based on agriculture and manufacturing. The county’s major crops are corn, soybeans, wheat, and hay. The county is also home to several manufacturing companies, including Eastman Chemical Company, which produces chemicals and plastics, and Nisus Corporation, which produces wood preservatives.
The county is also home to several tourist attractions, including the Andrew Johnson National Historic Site, the Davy Crockett Birthplace State Park, and the Greene County Museum.
Demographics
As of the 2010 census, Greene County had a population of 68,831. The racial makeup of the county was 92.3% White, 4.3% Black or African American, 0.4% Native American, 0.7% Asian, 0.1% Pacific Islander, 1.2% from other races, and 1.1% from two or more races. Hispanic or Latino of any race were 2.7% of the population.
The median income for a household in the county was $37,845, and the median income for a family was $45,945. The per capita income for the county was $20,845. About 14.2% of families and 17.7% of the population were below the poverty line, including 25.2% of those under age 18 and 13.2% of those age 65 or over.
Common Questions
What is the Total Population of Greene County?
Total Population of Greene County is 70,399.
What is the Total Male Population of Greene County?
Total Male Population of Greene County is 34,731.
What is the Total Female Population of Greene County?
Total Female Population of Greene County is 35,668.
What is the Ratio of Males per 100 Females in Greene County?
There are 97.37 Males per 100 Females in Greene County.
What is the Ratio of Females per 100 Males in Greene County?
There are 102.70 Females per 100 Males in Greene County.
What is the Median Population Age in Greene County?
Median Population Age in Greene County is 44.7 Years.
What is the Average Family Size in Greene County
Average Family Size in Greene County is 3.0 People.
What is the Average Household Size in Greene County
Average Household Size in Greene County is 2.5 People.
What is Per Capita Income in Greene County?
Per Capita income in Greene County is $28,237.
What is the Median Family Income in Greene County?
Median Family Income in Greene County is $67,267.
What is the Median Household income in Greene County?
Median Household Income in Greene County is $51,975.
What is Income or Wage Gap in Greene County?
Income or Wage Gap in Greene County is 23.3%.
Women in Greene County earn 76.7 cents for every dollar earned by a man.
What is Family Income Deficit in Greene County?
Family Income Deficit in Greene County is $10,855.
Families that are below poverty line in Greene County earn $10,855 less on average than the poverty threshold level.
What is Inequality or Gini Index in Greene County?
Inequality or Gini Index in Greene County is 0.45.
How Large is the Labor Force in Greene County?
There are 30,947 People in the Labor Forcein in Greene County.
What is the Percentage of People in the Labor Force in Greene County?
52.9% of People are in the Labor Force in Greene County.
What is the Unemployment Rate in Greene County?
Unemployment Rate in Greene County is 5.4%.