Grainger County, TN
Grainger County Map
Grainger County Overview
23,648
TOTAL POPULATION
11,960
MALE POPULATION
11,688
FEMALE POPULATION
102.33
MALES / 100 FEMALES
97.73
FEMALES / 100 MALES
45.6
MEDIAN AGE
3.1
AVG FAMILY SIZE
2.5
AVG HOUSEHOLD SIZE
$26,545
PER CAPITA INCOME
$60,441
AVG FAMILY INCOME
$47,098
AVG HOUSEHOLD INCOME
32.0%
WAGE / INCOME GAP [ % ]
68.0¢/ $1
WAGE / INCOME GAP [ $ ]
$8,998
FAMILY INCOME DEFICIT
0.49
INEQUALITY / GINI INDEX
10,346
LABOR FORCE [ PEOPLE ]
52.4%
PERCENT IN LABOR FORCE
5.8%
UNEMPLOYMENT RATE
Grainger County Area Codes
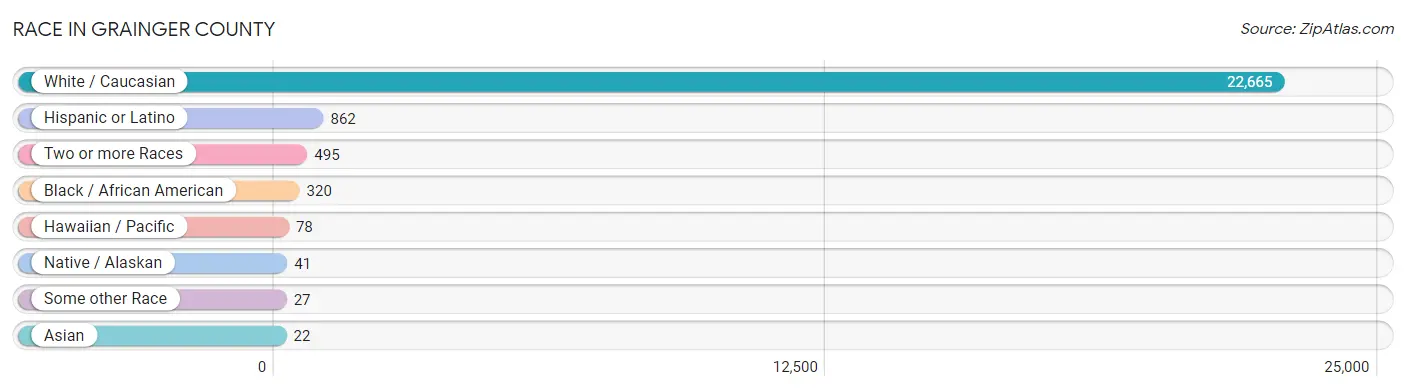
Race in Grainger County
The most populous races in Grainger County are White / Caucasian (22,665 | 95.8%), Hispanic or Latino (862 | 3.6%), and Two or more Races (495 | 2.1%).
| Race | # Population | % Population |
| Asian | 22 | 0.1% |
| Black / African American | 320 | 1.3% |
| Hawaiian / Pacific | 78 | 0.3% |
| Hispanic or Latino | 862 | 3.6% |
| Native / Alaskan | 41 | 0.2% |
| White / Caucasian | 22,665 | 95.8% |
| Two or more Races | 495 | 2.1% |
| Some other Race | 27 | 0.1% |
| Total | 23,648 | 100.0% |
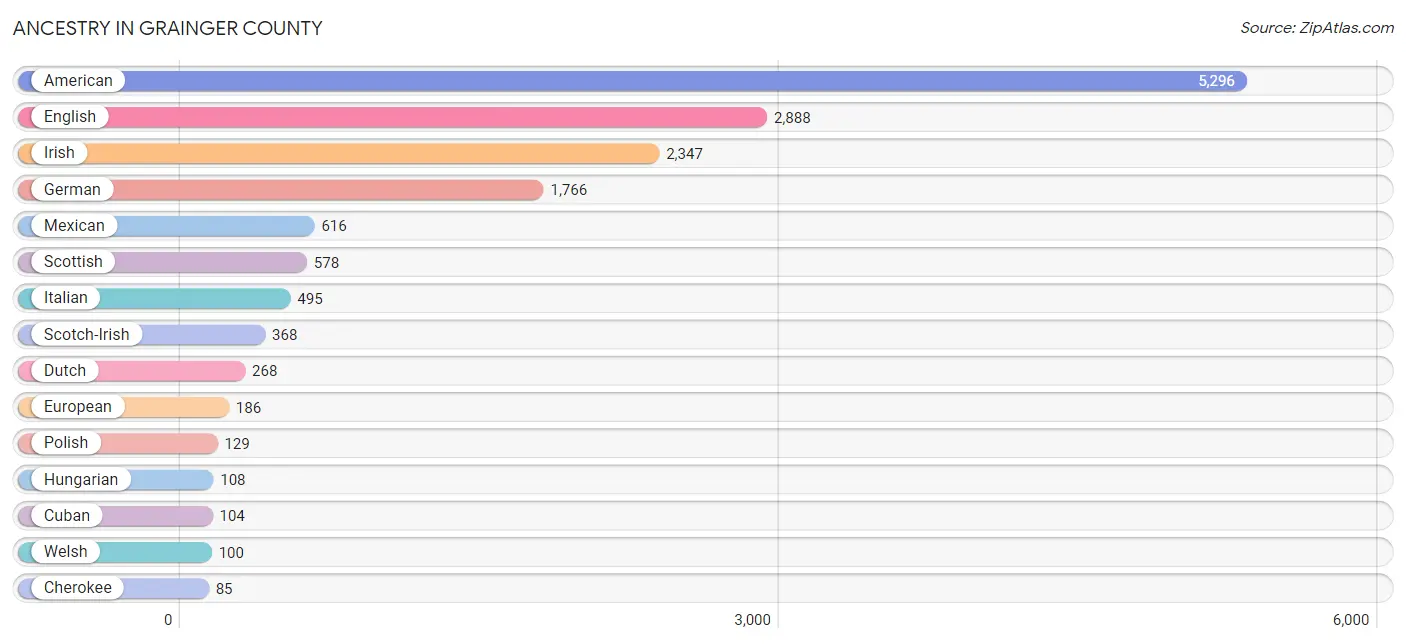
Ancestry in Grainger County
The most populous ancestries reported in Grainger County are American (5,296 | 22.4%), English (2,888 | 12.2%), Irish (2,347 | 9.9%), German (1,766 | 7.5%), and Mexican (616 | 2.6%), together accounting for 54.6% of all Grainger County residents.
| Ancestry | # Population | % Population |
| African | 51 | 0.2% |
| American | 5,296 | 22.4% |
| Austrian | 10 | 0.0% |
| Belgian | 72 | 0.3% |
| British | 51 | 0.2% |
| Burmese | 12 | 0.1% |
| Cajun | 15 | 0.1% |
| Canadian | 9 | 0.0% |
| Central American | 18 | 0.1% |
| Cherokee | 85 | 0.4% |
| Cuban | 104 | 0.4% |
| Czech | 12 | 0.1% |
| Danish | 28 | 0.1% |
| Dutch | 268 | 1.1% |
| Eastern European | 16 | 0.1% |
| English | 2,888 | 12.2% |
| European | 186 | 0.8% |
| French | 71 | 0.3% |
| French Canadian | 54 | 0.2% |
| German | 1,766 | 7.5% |
| Greek | 13 | 0.1% |
| Honduran | 18 | 0.1% |
| Hungarian | 108 | 0.5% |
| Irish | 2,347 | 9.9% |
| Italian | 495 | 2.1% |
| Korean | 29 | 0.1% |
| Malaysian | 2 | 0.0% |
| Mexican | 616 | 2.6% |
| Native Hawaiian | 28 | 0.1% |
| Norwegian | 47 | 0.2% |
| Pennsylvania German | 12 | 0.1% |
| Polish | 129 | 0.5% |
| Portuguese | 7 | 0.0% |
| Russian | 55 | 0.2% |
| Samoan | 58 | 0.3% |
| Scandinavian | 44 | 0.2% |
| Scotch-Irish | 368 | 1.6% |
| Scottish | 578 | 2.4% |
| Seminole | 21 | 0.1% |
| Serbian | 16 | 0.1% |
| Slovak | 10 | 0.0% |
| Sri Lankan | 18 | 0.1% |
| Subsaharan African | 51 | 0.2% |
| Swedish | 60 | 0.3% |
| Swiss | 54 | 0.2% |
| Thai | 8 | 0.0% |
| Welsh | 100 | 0.4% | View All 47 Rows |
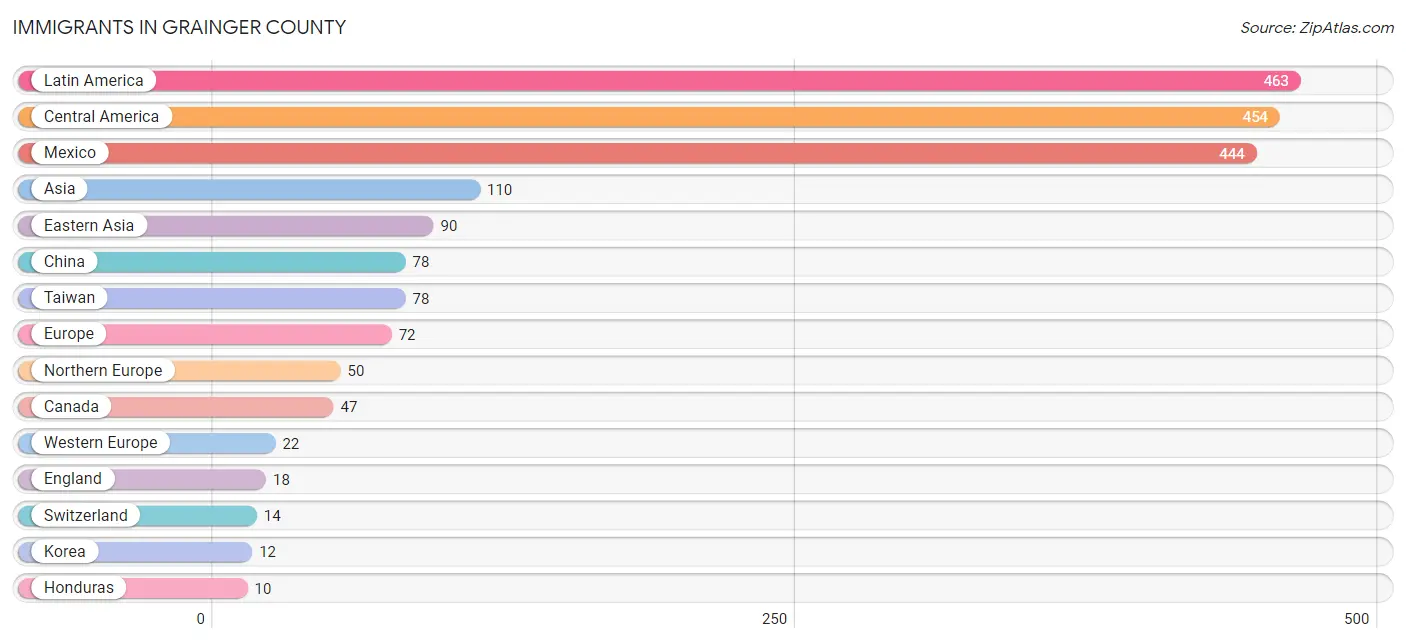
Immigrants in Grainger County
The most numerous immigrant groups reported in Grainger County came from Latin America (463 | 2.0%), Central America (454 | 1.9%), Mexico (444 | 1.9%), Asia (110 | 0.5%), and Eastern Asia (90 | 0.4%), together accounting for 6.6% of all Grainger County residents.
| Immigration Origin | # Population | % Population |
| Asia | 110 | 0.5% |
| Brazil | 9 | 0.0% |
| Canada | 47 | 0.2% |
| Central America | 454 | 1.9% |
| China | 78 | 0.3% |
| Eastern Asia | 90 | 0.4% |
| England | 18 | 0.1% |
| Europe | 72 | 0.3% |
| Germany | 8 | 0.0% |
| Honduras | 10 | 0.0% |
| India | 8 | 0.0% |
| Israel | 9 | 0.0% |
| Korea | 12 | 0.1% |
| Laos | 2 | 0.0% |
| Latin America | 463 | 2.0% |
| Mexico | 444 | 1.9% |
| Northern Europe | 50 | 0.2% |
| Philippines | 1 | 0.0% |
| Scotland | 7 | 0.0% |
| South America | 9 | 0.0% |
| South Central Asia | 8 | 0.0% |
| South Eastern Asia | 3 | 0.0% |
| Switzerland | 14 | 0.1% |
| Taiwan | 78 | 0.3% |
| Western Asia | 9 | 0.0% |
| Western Europe | 22 | 0.1% | View All 26 Rows |
Sex and Age in Grainger County
Sex and Age in Grainger County
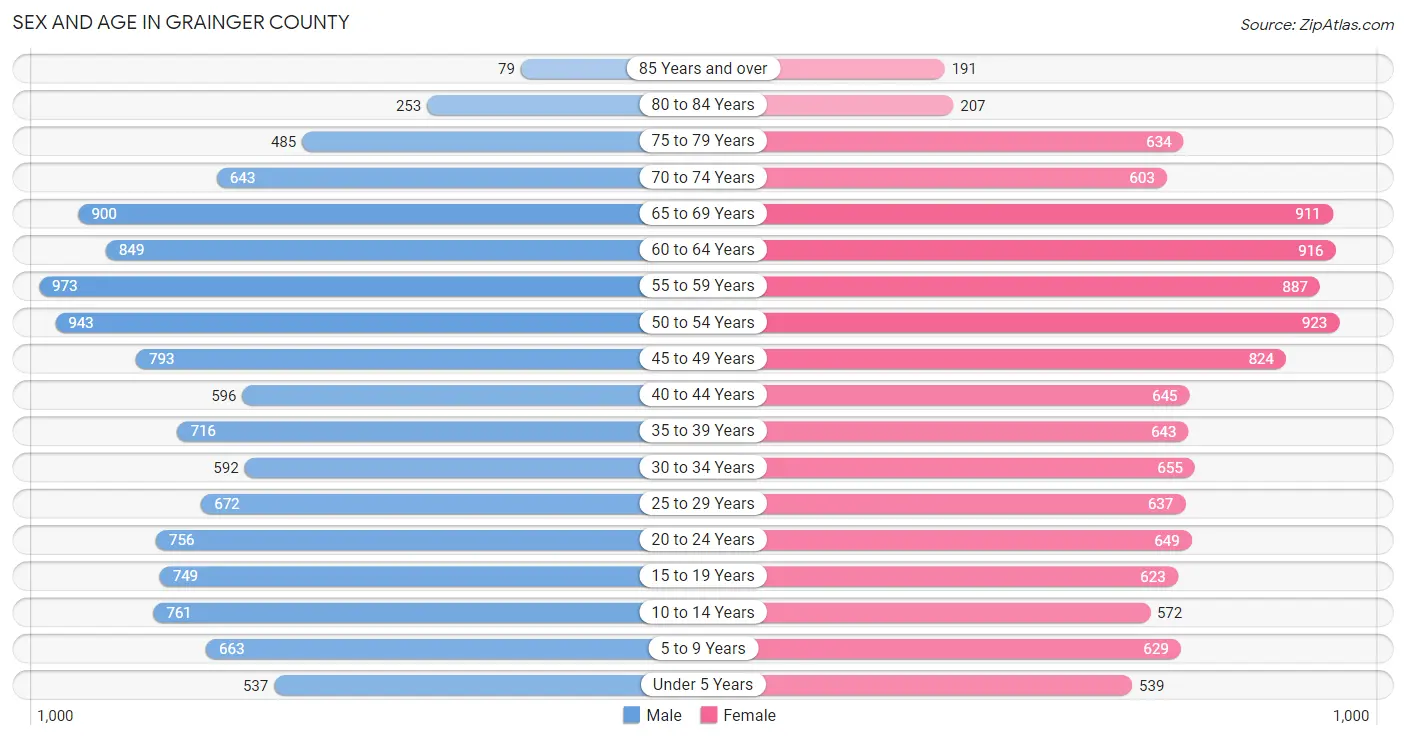
The most populous age groups in Grainger County are 55 to 59 Years (973 | 8.1%) for men and 50 to 54 Years (923 | 7.9%) for women.
| Age Bracket | Male | Female |
| Under 5 Years | 537 (4.5%) | 539 (4.6%) |
| 5 to 9 Years | 663 (5.5%) | 629 (5.4%) |
| 10 to 14 Years | 761 (6.4%) | 572 (4.9%) |
| 15 to 19 Years | 749 (6.3%) | 623 (5.3%) |
| 20 to 24 Years | 756 (6.3%) | 649 (5.6%) |
| 25 to 29 Years | 672 (5.6%) | 637 (5.4%) |
| 30 to 34 Years | 592 (5.0%) | 655 (5.6%) |
| 35 to 39 Years | 716 (6.0%) | 643 (5.5%) |
| 40 to 44 Years | 596 (5.0%) | 645 (5.5%) |
| 45 to 49 Years | 793 (6.6%) | 824 (7.0%) |
| 50 to 54 Years | 943 (7.9%) | 923 (7.9%) |
| 55 to 59 Years | 973 (8.1%) | 887 (7.6%) |
| 60 to 64 Years | 849 (7.1%) | 916 (7.8%) |
| 65 to 69 Years | 900 (7.5%) | 911 (7.8%) |
| 70 to 74 Years | 643 (5.4%) | 603 (5.2%) |
| 75 to 79 Years | 485 (4.1%) | 634 (5.4%) |
| 80 to 84 Years | 253 (2.1%) | 207 (1.8%) |
| 85 Years and over | 79 (0.7%) | 191 (1.6%) |
| Total | 11,960 (100.0%) | 11,688 (100.0%) |
Families and Households in Grainger County
Median Family Size in Grainger County
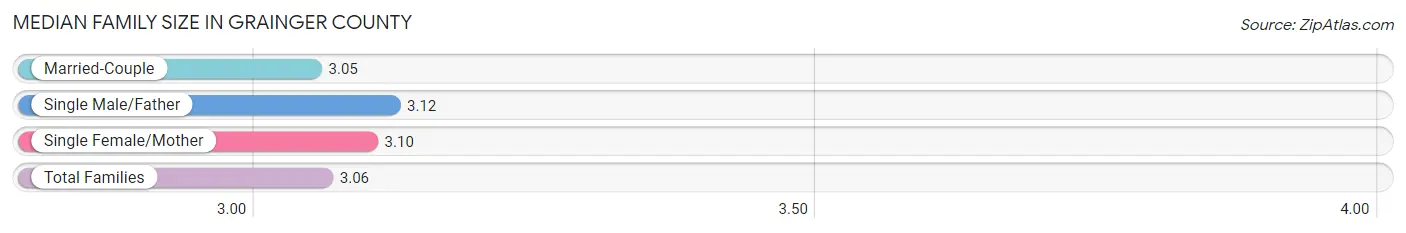
The median family size in Grainger County is 3.06 persons per family, with single male/father families (428 | 6.8%) accounting for the largest median family size of 3.12 persons per family. On the other hand, married-couple families (4,911 | 77.9%) represent the smallest median family size with 3.05 persons per family.
| Family Type | # Families | Family Size |
| Married-Couple | 4,911 (77.9%) | 3.05 |
| Single Male/Father | 428 (6.8%) | 3.12 |
| Single Female/Mother | 962 (15.3%) | 3.10 |
| Total Families | 6,301 (100.0%) | 3.06 |
Median Household Size in Grainger County
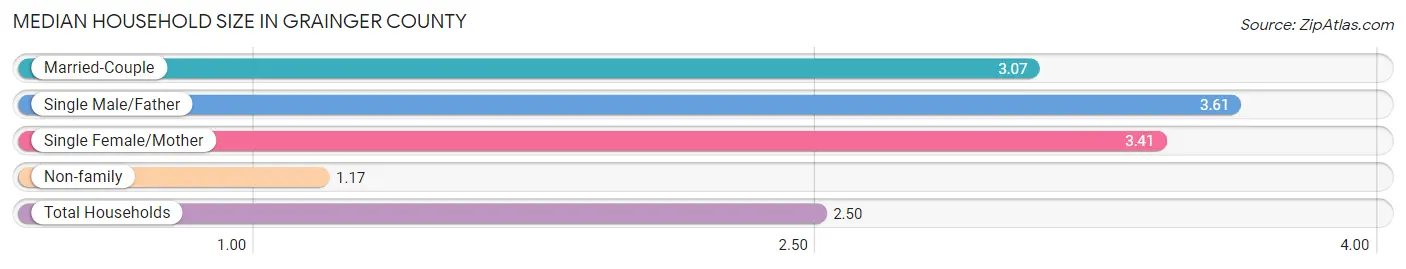
The median household size in Grainger County is 2.50 persons per household, with single male/father households (428 | 4.6%) accounting for the largest median household size of 3.61 persons per household. non-family households (3,083 | 32.9%) represent the smallest median household size with 1.17 persons per household.
| Household Type | # Households | Household Size |
| Married-Couple | 4,911 (52.3%) | 3.07 |
| Single Male/Father | 428 (4.6%) | 3.61 |
| Single Female/Mother | 962 (10.2%) | 3.41 |
| Non-family | 3,083 (32.9%) | 1.17 |
| Total Households | 9,384 (100.0%) | 2.50 |
Household Size by Marriage Status in Grainger County
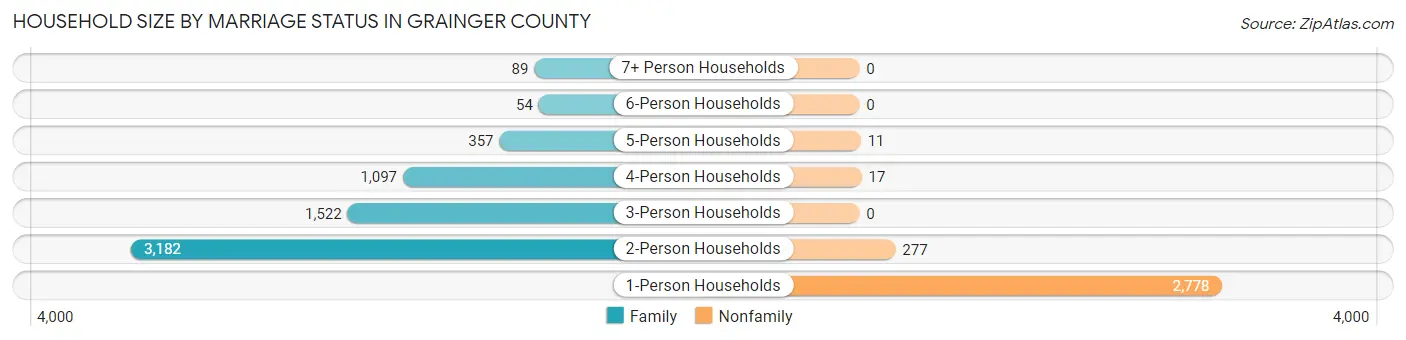
Out of a total of 9,384 households in Grainger County, 6,301 (67.1%) are family households, while 3,083 (32.9%) are nonfamily households. The most numerous type of family households are 2-person households, comprising 3,182, and the most common type of nonfamily households are 1-person households, comprising 2,778.
| Household Size | Family Households | Nonfamily Households |
| 1-Person Households | - | 2,778 (29.6%) |
| 2-Person Households | 3,182 (33.9%) | 277 (2.9%) |
| 3-Person Households | 1,522 (16.2%) | 0 (0.0%) |
| 4-Person Households | 1,097 (11.7%) | 17 (0.2%) |
| 5-Person Households | 357 (3.8%) | 11 (0.1%) |
| 6-Person Households | 54 (0.6%) | 0 (0.0%) |
| 7+ Person Households | 89 (0.9%) | 0 (0.0%) |
| Total | 6,301 (67.1%) | 3,083 (32.9%) |
Female Fertility in Grainger County
Fertility by Age in Grainger County
Average fertility rate in Grainger County is 56.0 births per 1,000 women. Women in the age bracket of 20 to 34 years have the highest fertility rate with 110.0 births per 1,000 women. Women in the age bracket of 20 to 34 years acount for 77.8% of all women with births.
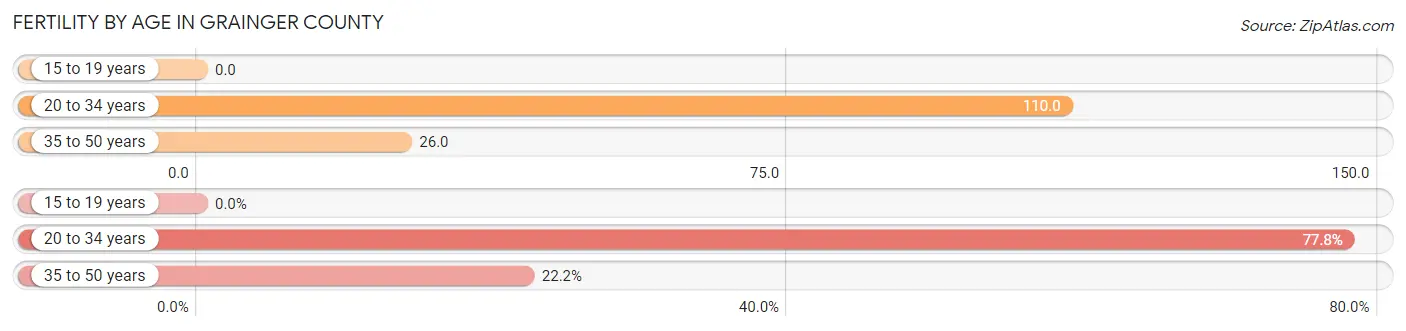
| Age Bracket | Women with Births | Births / 1,000 Women |
| 15 to 19 years | 0 (0.0%) | 0.0 |
| 20 to 34 years | 214 (77.8%) | 110.0 |
| 35 to 50 years | 61 (22.2%) | 26.0 |
| Total | 275 (100.0%) | 56.0 |
Fertility by Age by Marriage Status in Grainger County
59.3% of women with births (275) in Grainger County are married. The highest percentage of unmarried women with births falls into 35 to 50 years age bracket with 52.5% of them unmarried at the time of birth, while the lowest percentage of unmarried women with births belong to 20 to 34 years age bracket with 37.4% of them unmarried.
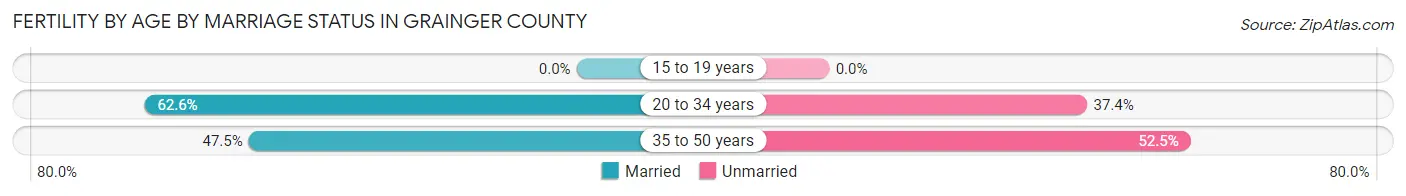
| Age Bracket | Married | Unmarried |
| 15 to 19 years | 0 (0.0%) | 0 (0.0%) |
| 20 to 34 years | 134 (62.6%) | 80 (37.4%) |
| 35 to 50 years | 29 (47.5%) | 32 (52.5%) |
| Total | 163 (59.3%) | 112 (40.7%) |
Fertility by Education in Grainger County
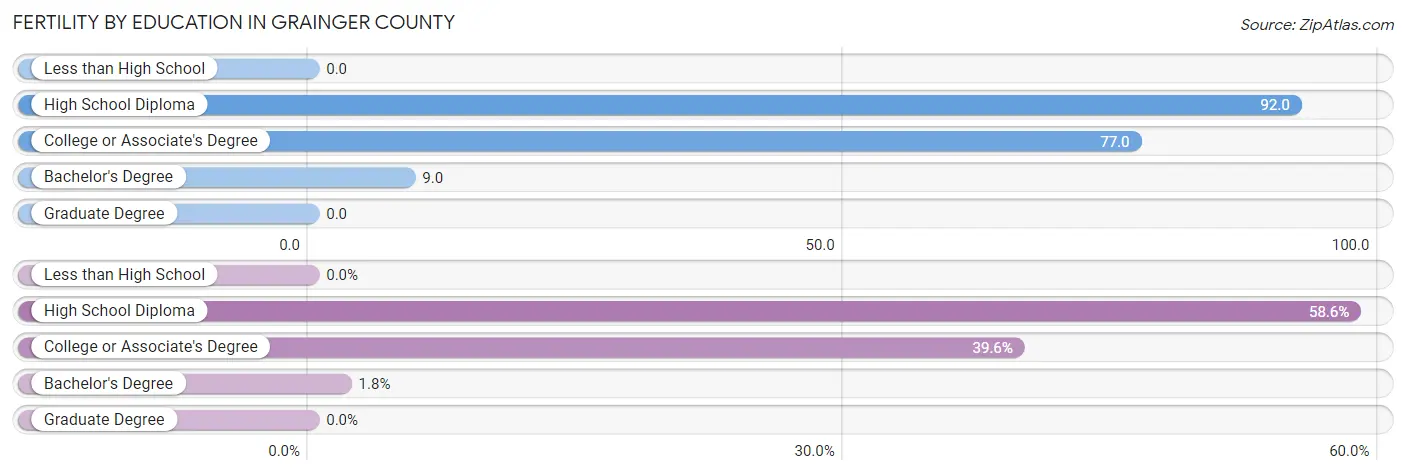
| Educational Attainment | Women with Births | Births / 1,000 Women |
| Less than High School | 0 (0.0%) | 0.0 |
| High School Diploma | 161 (58.6%) | 92.0 |
| College or Associate's Degree | 109 (39.6%) | 77.0 |
| Bachelor's Degree | 5 (1.8%) | 9.0 |
| Graduate Degree | 0 (0.0%) | 0.0 |
| Total | 275 (100.0%) | 56.0 |
Fertility by Education by Marriage Status in Grainger County
40.7% of women with births in Grainger County are unmarried. Women with the educational attainment of bachelor's degree are most likely to be married with 100.0% of them married at childbirth, while women with the educational attainment of high school diploma are least likely to be married with 49.7% of them unmarried at childbirth.
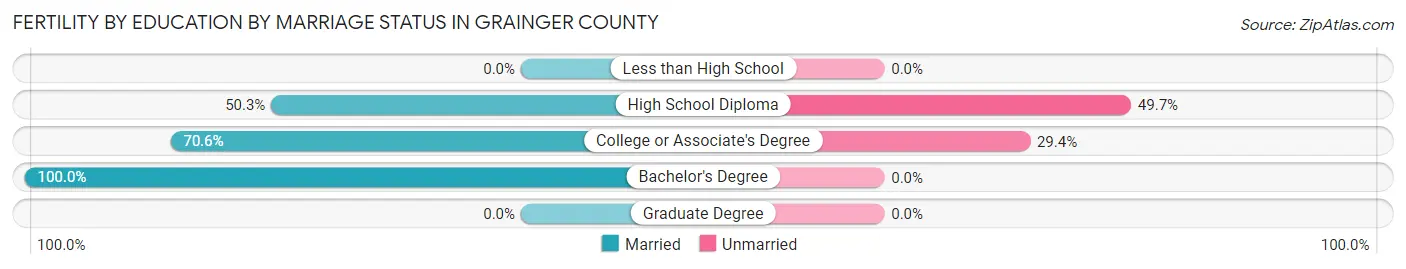
| Educational Attainment | Married | Unmarried |
| Less than High School | 0 (0.0%) | 0 (0.0%) |
| High School Diploma | 81 (50.3%) | 80 (49.7%) |
| College or Associate's Degree | 77 (70.6%) | 32 (29.4%) |
| Bachelor's Degree | 5 (100.0%) | 0 (0.0%) |
| Graduate Degree | 0 (0.0%) | 0 (0.0%) |
| Total | 163 (59.3%) | 112 (40.7%) |
Income in Grainger County
Income Overview in Grainger County
Per Capita Income in Grainger County is $26,545, while median incomes of families and households are $60,441 and $47,098 respectively.
| Characteristic | Number | Measure |
| Per Capita Income | 23,648 | $26,545 |
| Median Family Income | 6,301 | $60,441 |
| Mean Family Income | 6,301 | $79,280 |
| Median Household Income | 9,384 | $47,098 |
| Mean Household Income | 9,384 | $64,393 |
| Income Deficit | 6,301 | $8,998 |
| Wage / Income Gap (%) | 23,648 | 32.02% |
| Wage / Income Gap ($) | 23,648 | 67.98¢ per $1 |
| Gini / Inequality Index | 23,648 | 0.49 |
Earnings by Sex in Grainger County
Average Earnings in Grainger County are $29,867, $35,558 for men and $24,172 for women, a difference of 32.0%.
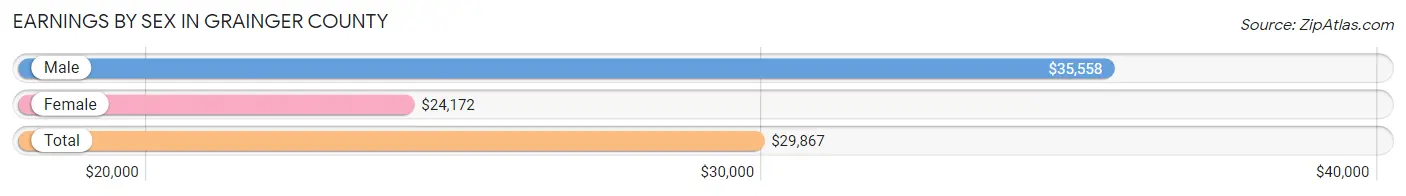
| Sex | Number | Average Earnings |
| Male | 5,499 (52.1%) | $35,558 |
| Female | 5,049 (47.9%) | $24,172 |
| Total | 10,548 (100.0%) | $29,867 |
Earnings by Sex by Income Bracket in Grainger County
The most common earnings brackets in Grainger County are $25,000 to $29,999 for men (587 | 10.7%) and $2,499 or less for women (418 | 8.3%).
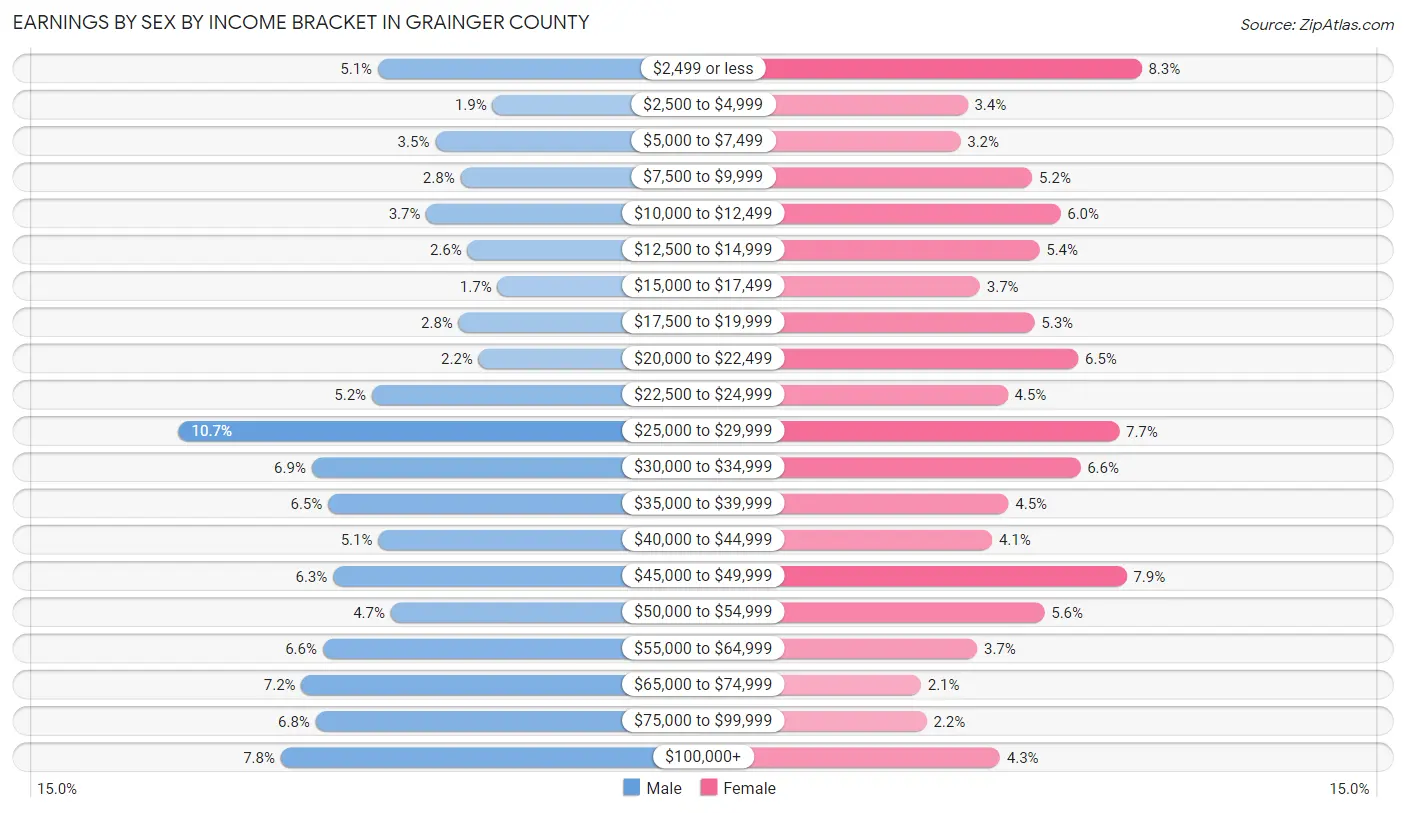
| Income | Male | Female |
| $2,499 or less | 279 (5.1%) | 418 (8.3%) |
| $2,500 to $4,999 | 102 (1.8%) | 171 (3.4%) |
| $5,000 to $7,499 | 190 (3.5%) | 161 (3.2%) |
| $7,500 to $9,999 | 151 (2.8%) | 263 (5.2%) |
| $10,000 to $12,499 | 204 (3.7%) | 303 (6.0%) |
| $12,500 to $14,999 | 140 (2.5%) | 273 (5.4%) |
| $15,000 to $17,499 | 94 (1.7%) | 189 (3.7%) |
| $17,500 to $19,999 | 154 (2.8%) | 266 (5.3%) |
| $20,000 to $22,499 | 123 (2.2%) | 328 (6.5%) |
| $22,500 to $24,999 | 288 (5.2%) | 228 (4.5%) |
| $25,000 to $29,999 | 587 (10.7%) | 386 (7.6%) |
| $30,000 to $34,999 | 381 (6.9%) | 331 (6.6%) |
| $35,000 to $39,999 | 356 (6.5%) | 229 (4.5%) |
| $40,000 to $44,999 | 278 (5.1%) | 206 (4.1%) |
| $45,000 to $49,999 | 348 (6.3%) | 397 (7.9%) |
| $50,000 to $54,999 | 259 (4.7%) | 280 (5.6%) |
| $55,000 to $64,999 | 364 (6.6%) | 185 (3.7%) |
| $65,000 to $74,999 | 397 (7.2%) | 105 (2.1%) |
| $75,000 to $99,999 | 375 (6.8%) | 113 (2.2%) |
| $100,000+ | 429 (7.8%) | 217 (4.3%) |
| Total | 5,499 (100.0%) | 5,049 (100.0%) |
Earnings by Sex by Educational Attainment in Grainger County
Average earnings in Grainger County are $40,085 for men and $27,547 for women, a difference of 31.3%. Men with an educational attainment of graduate degree enjoy the highest average annual earnings of $71,182, while those with college or associate's degree education earn the least with $35,401. Women with an educational attainment of graduate degree earn the most with the average annual earnings of $50,593, while those with high school diploma education have the smallest earnings of $23,974.
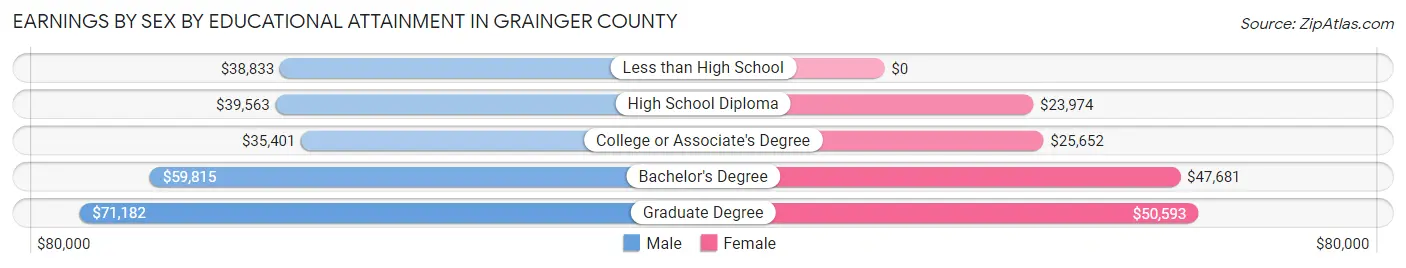
| Educational Attainment | Male Income | Female Income |
| Less than High School | $38,833 | $0 |
| High School Diploma | $39,563 | $23,974 |
| College or Associate's Degree | $35,401 | $25,652 |
| Bachelor's Degree | $59,815 | $47,681 |
| Graduate Degree | $71,182 | $50,593 |
| Total | $40,085 | $27,547 |
Family Income in Grainger County
Family Income Brackets in Grainger County
According to the Grainger County family income data, there are 1,342 families falling into the $50,000 to $74,999 income range, which is the most common income bracket and makes up 21.3% of all families. Conversely, the $200,000+ income bracket is the least frequent group with only 183 families (2.9%) belonging to this category.
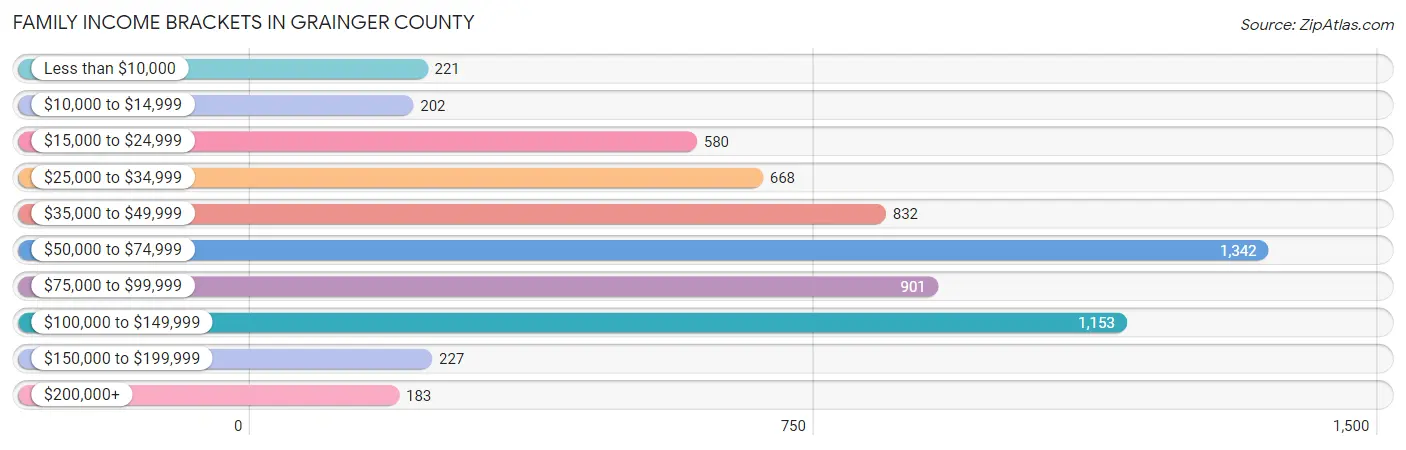
| Income Bracket | # Families | % Families |
| Less than $10,000 | 221 | 3.5% |
| $10,000 to $14,999 | 202 | 3.2% |
| $15,000 to $24,999 | 580 | 9.2% |
| $25,000 to $34,999 | 668 | 10.6% |
| $35,000 to $49,999 | 832 | 13.2% |
| $50,000 to $74,999 | 1,342 | 21.3% |
| $75,000 to $99,999 | 901 | 14.3% |
| $100,000 to $149,999 | 1,153 | 18.3% |
| $150,000 to $199,999 | 227 | 3.6% |
| $200,000+ | 183 | 2.9% |
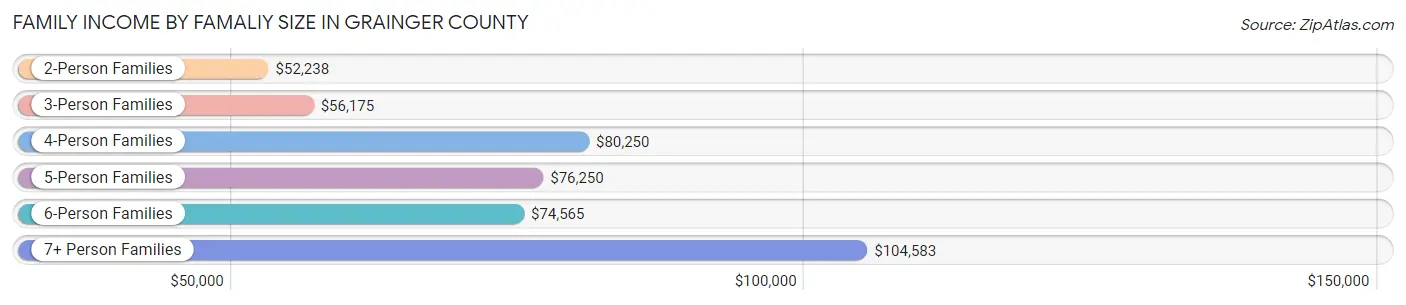
Family Income by Famaliy Size in Grainger County
7+ person families (67 | 1.1%) account for the highest median family income in Grainger County with $104,583 per family, while 2-person families (3,400 | 54.0%) have the highest median income of $26,119 per family member.
| Income Bracket | # Families | Median Income |
| 2-Person Families | 3,400 (54.0%) | $52,238 |
| 3-Person Families | 1,439 (22.8%) | $56,175 |
| 4-Person Families | 1,041 (16.5%) | $80,250 |
| 5-Person Families | 278 (4.4%) | $76,250 |
| 6-Person Families | 76 (1.2%) | $74,565 |
| 7+ Person Families | 67 (1.1%) | $104,583 |
| Total | 6,301 (100.0%) | $60,441 |
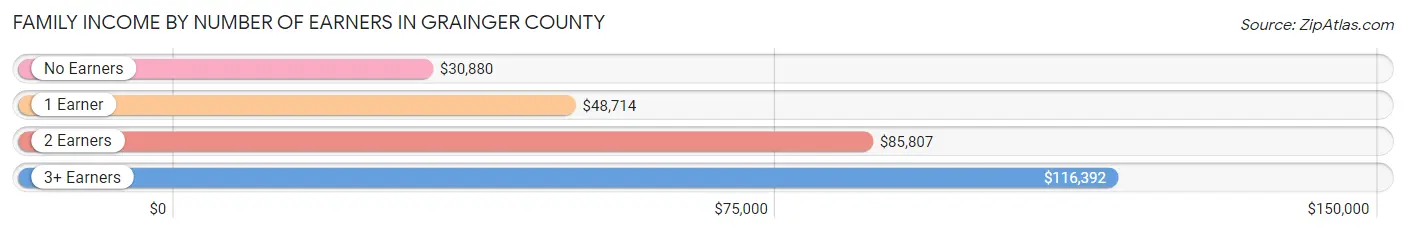
Family Income by Number of Earners in Grainger County
The median family income in Grainger County is $60,441, with families comprising 3+ earners (551) having the highest median family income of $116,392, while families with no earners (1,578) have the lowest median family income of $30,880, accounting for 8.7% and 25.0% of families, respectively.
| Number of Earners | # Families | Median Income |
| No Earners | 1,578 (25.0%) | $30,880 |
| 1 Earner | 1,892 (30.0%) | $48,714 |
| 2 Earners | 2,280 (36.2%) | $85,807 |
| 3+ Earners | 551 (8.7%) | $116,392 |
| Total | 6,301 (100.0%) | $60,441 |
Household Income in Grainger County
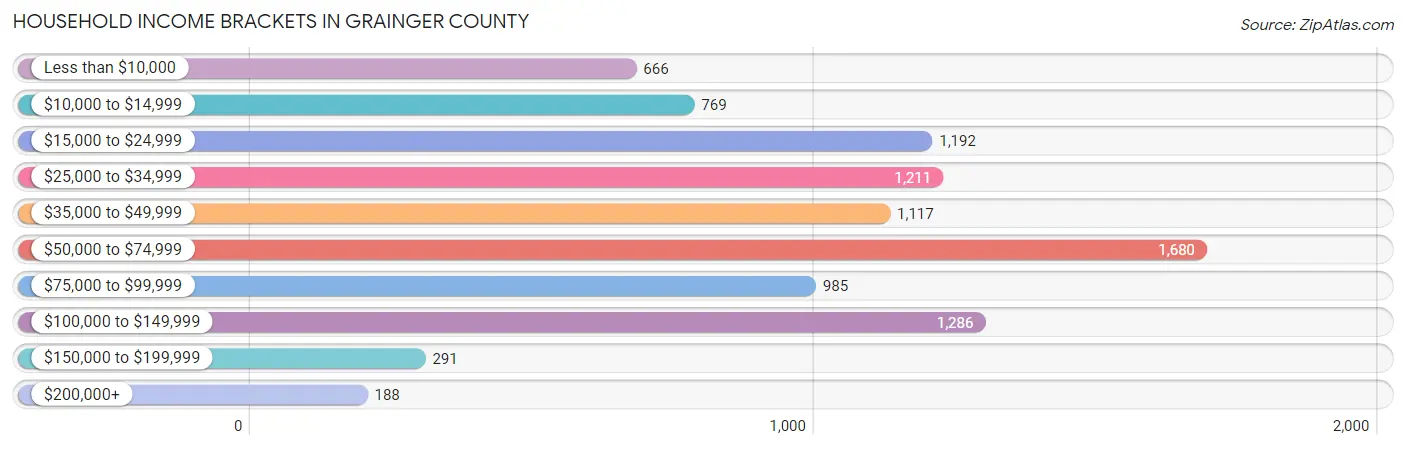
Household Income Brackets in Grainger County
With 1,680 households falling in the category, the $50,000 to $74,999 income range is the most frequent in Grainger County, accounting for 17.9% of all households. In contrast, only 188 households (2.0%) fall into the $200,000+ income bracket, making it the least populous group.
| Income Bracket | # Households | % Households |
| Less than $10,000 | 666 | 7.1% |
| $10,000 to $14,999 | 769 | 8.2% |
| $15,000 to $24,999 | 1,192 | 12.7% |
| $25,000 to $34,999 | 1,211 | 12.9% |
| $35,000 to $49,999 | 1,117 | 11.9% |
| $50,000 to $74,999 | 1,680 | 17.9% |
| $75,000 to $99,999 | 985 | 10.5% |
| $100,000 to $149,999 | 1,286 | 13.7% |
| $150,000 to $199,999 | 291 | 3.1% |
| $200,000+ | 188 | 2.0% |
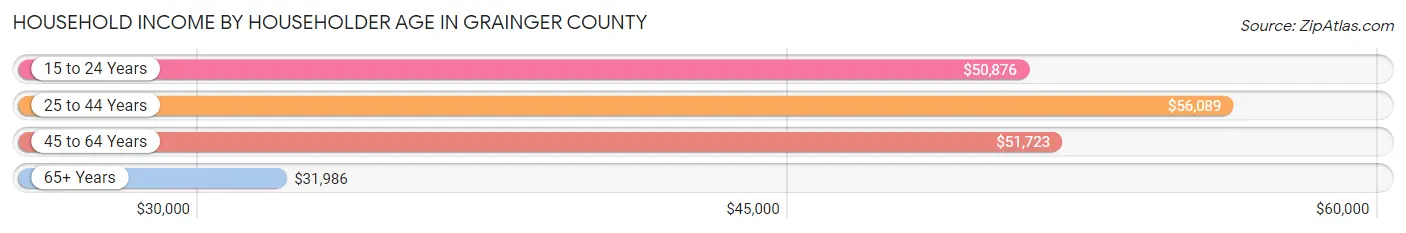
Household Income by Householder Age in Grainger County
The median household income in Grainger County is $47,098, with the highest median household income of $56,089 found in the 25 to 44 years age bracket for the primary householder. A total of 2,360 households (25.2%) fall into this category. Meanwhile, the 65+ years age bracket for the primary householder has the lowest median household income of $31,986, with 3,053 households (32.5%) in this group.
| Income Bracket | # Households | Median Income |
| 15 to 24 Years | 281 (3.0%) | $50,876 |
| 25 to 44 Years | 2,360 (25.2%) | $56,089 |
| 45 to 64 Years | 3,690 (39.3%) | $51,723 |
| 65+ Years | 3,053 (32.5%) | $31,986 |
| Total | 9,384 (100.0%) | $47,098 |
Poverty in Grainger County
Income Below Poverty by Sex and Age in Grainger County
With 15.1% poverty level for males and 20.1% for females among the residents of Grainger County, under 5 year old males and 15 year old females are the most vulnerable to poverty, with 107 males (19.9%) and 38 females (58.5%) in their respective age groups living below the poverty level.
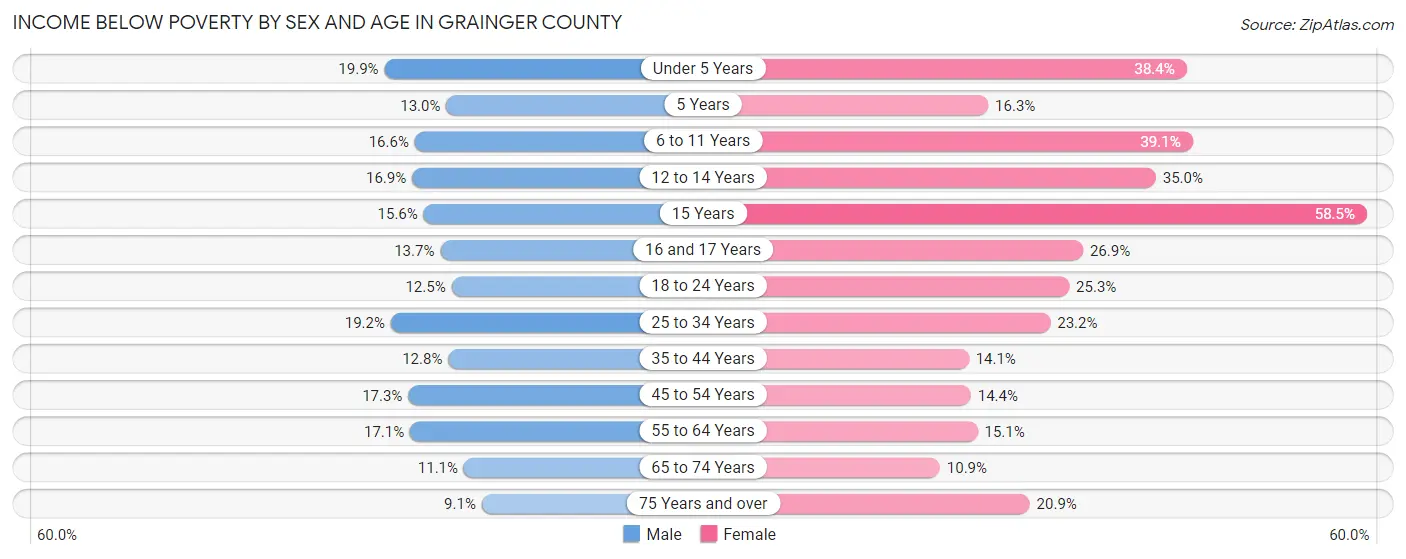
| Age Bracket | Male | Female |
| Under 5 Years | 107 (19.9%) | 205 (38.4%) |
| 5 Years | 9 (13.0%) | 30 (16.3%) |
| 6 to 11 Years | 163 (16.6%) | 230 (39.1%) |
| 12 to 14 Years | 60 (16.9%) | 135 (35.0%) |
| 15 Years | 21 (15.6%) | 38 (58.5%) |
| 16 and 17 Years | 51 (13.7%) | 94 (26.9%) |
| 18 to 24 Years | 124 (12.5%) | 217 (25.3%) |
| 25 to 34 Years | 243 (19.2%) | 300 (23.2%) |
| 35 to 44 Years | 167 (12.8%) | 182 (14.1%) |
| 45 to 54 Years | 300 (17.3%) | 251 (14.4%) |
| 55 to 64 Years | 311 (17.1%) | 271 (15.1%) |
| 65 to 74 Years | 167 (11.1%) | 164 (10.9%) |
| 75 Years and over | 73 (9.1%) | 205 (20.9%) |
| Total | 1,796 (15.1%) | 2,322 (20.1%) |
Income Above Poverty by Sex and Age in Grainger County
According to the poverty statistics in Grainger County, males aged 75 years and over and females aged 65 to 74 years are the age groups that are most secure financially, with 90.9% of males and 89.1% of females in these age groups living above the poverty line.

| Age Bracket | Male | Female |
| Under 5 Years | 430 (80.1%) | 329 (61.6%) |
| 5 Years | 60 (87.0%) | 154 (83.7%) |
| 6 to 11 Years | 822 (83.5%) | 359 (61.0%) |
| 12 to 14 Years | 296 (83.2%) | 251 (65.0%) |
| 15 Years | 114 (84.4%) | 27 (41.5%) |
| 16 and 17 Years | 321 (86.3%) | 256 (73.1%) |
| 18 to 24 Years | 871 (87.5%) | 640 (74.7%) |
| 25 to 34 Years | 1,021 (80.8%) | 992 (76.8%) |
| 35 to 44 Years | 1,136 (87.2%) | 1,106 (85.9%) |
| 45 to 54 Years | 1,436 (82.7%) | 1,496 (85.6%) |
| 55 to 64 Years | 1,511 (82.9%) | 1,521 (84.9%) |
| 65 to 74 Years | 1,340 (88.9%) | 1,338 (89.1%) |
| 75 Years and over | 730 (90.9%) | 775 (79.1%) |
| Total | 10,088 (84.9%) | 9,244 (79.9%) |
Income Below Poverty Among Married-Couple Families in Grainger County
The poverty statistics for married-couple families in Grainger County show that 10.0% or 493 of the total 4,911 families live below the poverty line. Families with 5 or more children have the highest poverty rate of 58.3%, comprising of 21 families. On the other hand, families with no children have the lowest poverty rate of 6.6%, which includes 213 families.
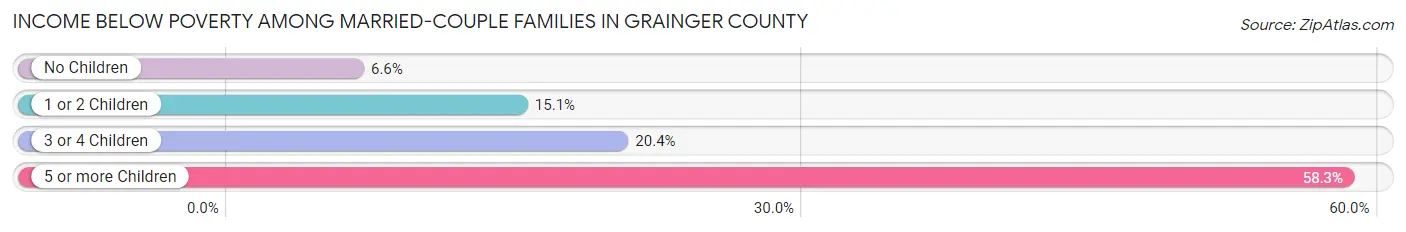
| Children | Above Poverty | Below Poverty |
| No Children | 3,023 (93.4%) | 213 (6.6%) |
| 1 or 2 Children | 1,216 (84.9%) | 217 (15.1%) |
| 3 or 4 Children | 164 (79.6%) | 42 (20.4%) |
| 5 or more Children | 15 (41.7%) | 21 (58.3%) |
| Total | 4,418 (90.0%) | 493 (10.0%) |
Income Below Poverty Among Single-Parent Households in Grainger County
According to the poverty data in Grainger County, 19.9% or 85 single-father households and 31.1% or 299 single-mother households are living below the poverty line. Among single-father households, those with 1 or 2 children have the highest poverty rate, with 58 households (54.7%) experiencing poverty. Likewise, among single-mother households, those with 3 or 4 children have the highest poverty rate, with 18 households (85.7%) falling below the poverty line.
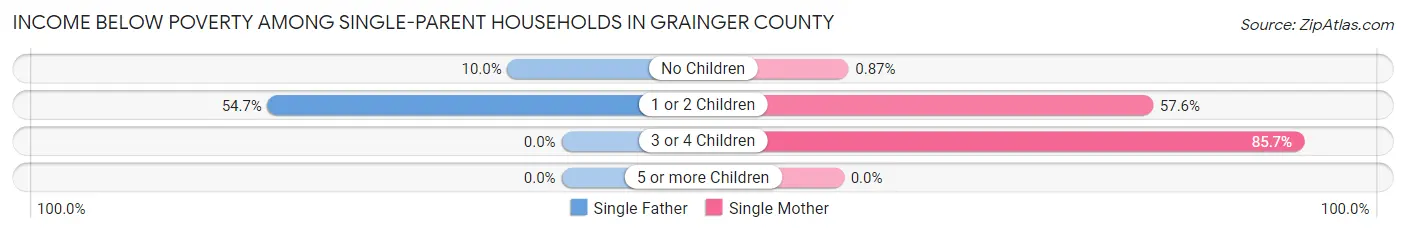
| Children | Single Father | Single Mother |
| No Children | 27 (10.0%) | 4 (0.9%) |
| 1 or 2 Children | 58 (54.7%) | 277 (57.6%) |
| 3 or 4 Children | 0 (0.0%) | 18 (85.7%) |
| 5 or more Children | 0 (0.0%) | 0 (0.0%) |
| Total | 85 (19.9%) | 299 (31.1%) |
Income Below Poverty Among Married-Couple vs Single-Parent Households in Grainger County
The poverty data for Grainger County shows that 493 of the married-couple family households (10.0%) and 384 of the single-parent households (27.6%) are living below the poverty level. Within the married-couple family households, those with 5 or more children have the highest poverty rate, with 21 households (58.3%) falling below the poverty line. Among the single-parent households, those with 1 or 2 children have the highest poverty rate, with 335 household (57.1%) living below poverty.
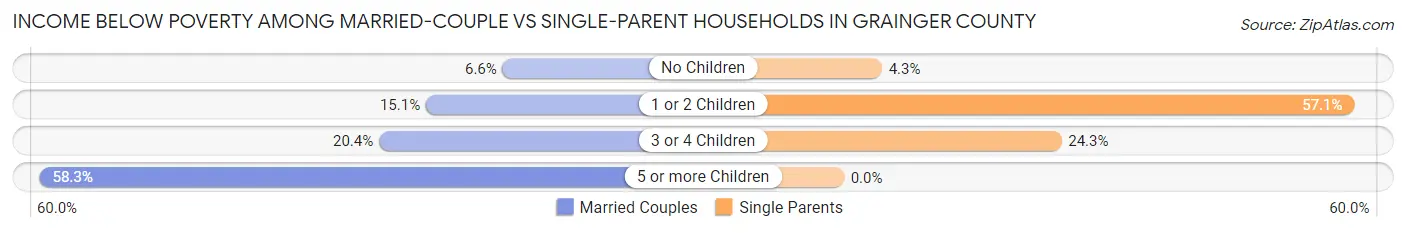
| Children | Married-Couple Families | Single-Parent Households |
| No Children | 213 (6.6%) | 31 (4.3%) |
| 1 or 2 Children | 217 (15.1%) | 335 (57.1%) |
| 3 or 4 Children | 42 (20.4%) | 18 (24.3%) |
| 5 or more Children | 21 (58.3%) | 0 (0.0%) |
| Total | 493 (10.0%) | 384 (27.6%) |
Employment Characteristics in Grainger County
Employment by Class of Employer in Grainger County
Among the 9,411 employed individuals in Grainger County, private company employees (6,496 | 69.0%), self-employed (not incorporated) (971 | 10.3%), and local government employees (681 | 7.2%) make up the most common classes of employment.
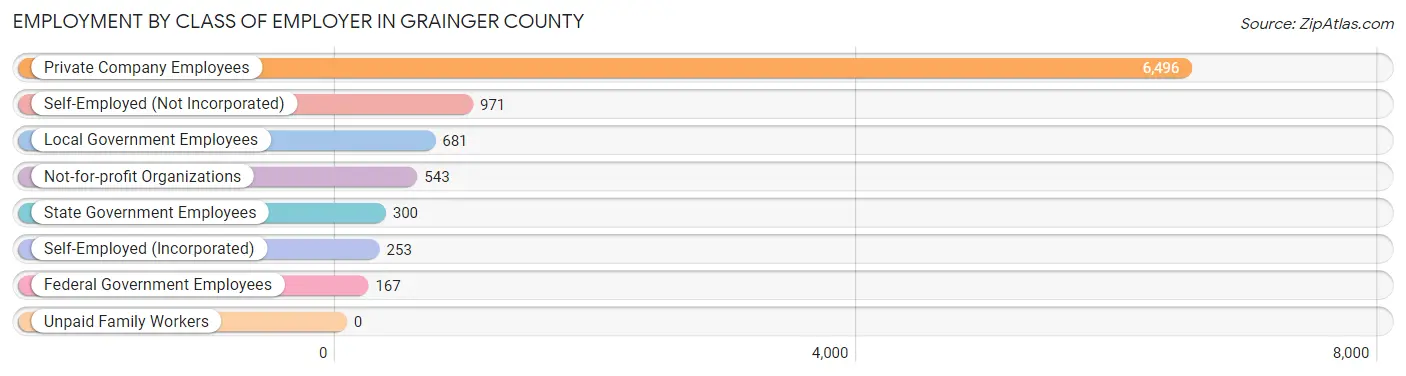
| Employer Class | # Employees | % Employees |
| Private Company Employees | 6,496 | 69.0% |
| Self-Employed (Incorporated) | 253 | 2.7% |
| Self-Employed (Not Incorporated) | 971 | 10.3% |
| Not-for-profit Organizations | 543 | 5.8% |
| Local Government Employees | 681 | 7.2% |
| State Government Employees | 300 | 3.2% |
| Federal Government Employees | 167 | 1.8% |
| Unpaid Family Workers | 0 | 0.0% |
| Total | 9,411 | 100.0% |
Employment Status by Age in Grainger County
According to the labor force statistics for Grainger County, out of the total population over 16 years of age (19,744), 52.4% or 10,346 individuals are in the labor force, with 5.8% or 600 of them unemployed. The age group with the highest labor force participation rate is 25 to 29 years, with 87.5% or 1,145 individuals in the labor force. Within the labor force, the 45 to 54 years age range has the highest percentage of unemployed individuals, with 10.5% or 256 of them being unemployed.
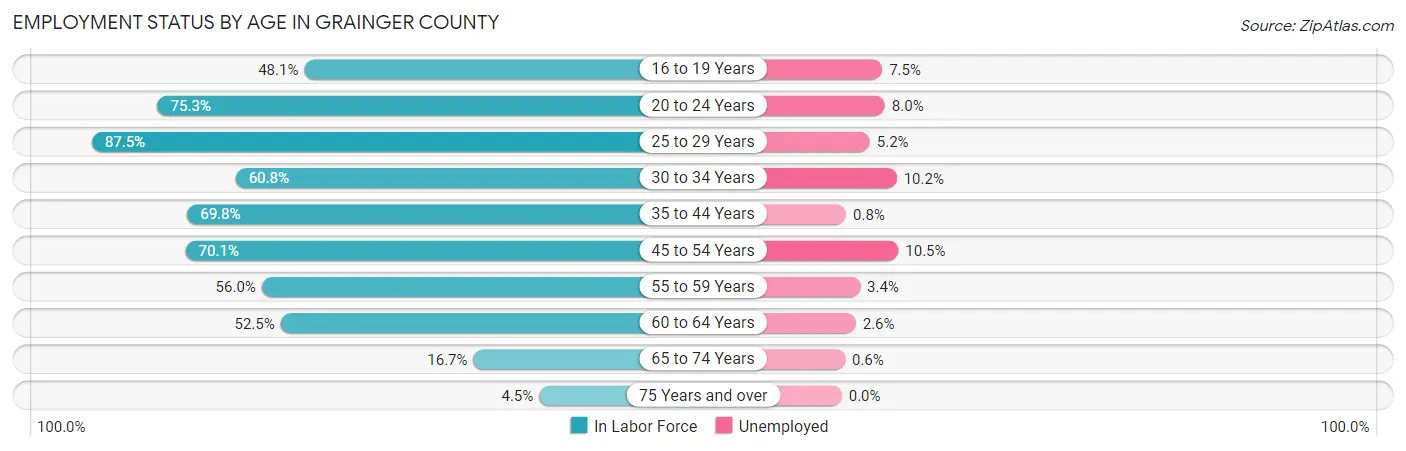
| Age Bracket | In Labor Force | Unemployed |
| 16 to 19 Years | 562 (48.1%) | 42 (7.5%) |
| 20 to 24 Years | 1,058 (75.3%) | 85 (8.0%) |
| 25 to 29 Years | 1,145 (87.5%) | 60 (5.2%) |
| 30 to 34 Years | 758 (60.8%) | 77 (10.2%) |
| 35 to 44 Years | 1,815 (69.8%) | 15 (0.8%) |
| 45 to 54 Years | 2,442 (70.1%) | 256 (10.5%) |
| 55 to 59 Years | 1,042 (56.0%) | 35 (3.4%) |
| 60 to 64 Years | 927 (52.5%) | 24 (2.6%) |
| 65 to 74 Years | 511 (16.7%) | 3 (0.6%) |
| 75 Years and over | 83 (4.5%) | 0 (0.0%) |
| Total | 10,346 (52.4%) | 600 (5.8%) |
Employment Status by Educational Attainment in Grainger County
According to labor force statistics for Grainger County, 66.3% of individuals (8,131) out of the total population between 25 and 64 years of age (12,264) are in the labor force, with 5.7% or 463 of them being unemployed. The group with the highest labor force participation rate are those with the educational attainment of bachelor's degree or higher, with 85.0% or 1,518 individuals in the labor force. Within the labor force, individuals with college / associate degree education have the highest percentage of unemployment, with 8.7% or 215 of them being unemployed.
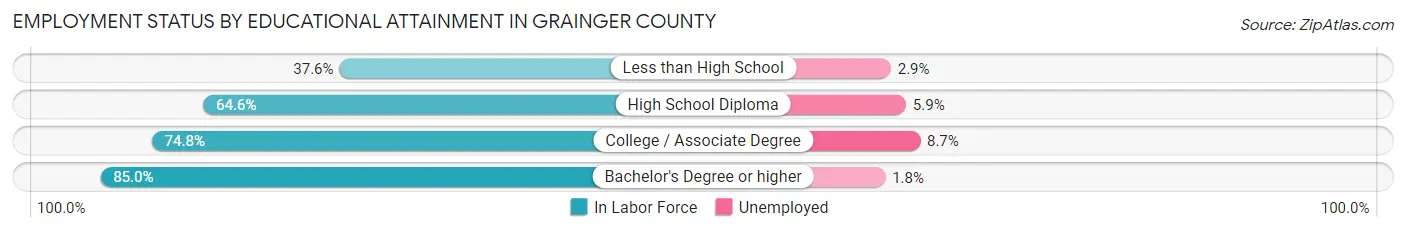
| Educational Attainment | In Labor Force | Unemployed |
| Less than High School | 686 (37.6%) | 53 (2.9%) |
| High School Diploma | 3,459 (64.6%) | 316 (5.9%) |
| College / Associate Degree | 2,468 (74.8%) | 287 (8.7%) |
| Bachelor's Degree or higher | 1,518 (85.0%) | 32 (1.8%) |
| Total | 8,131 (66.3%) | 699 (5.7%) |
Employment Occupations by Sex in Grainger County
Management, Business, Science and Arts Occupations
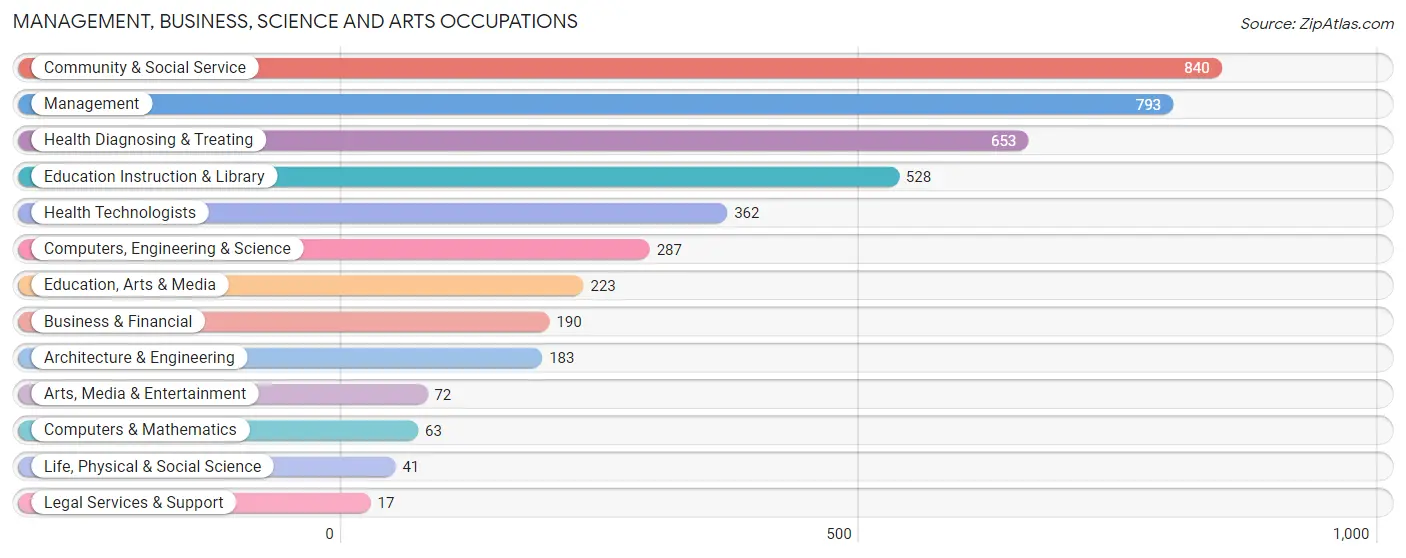
The most common Management, Business, Science and Arts occupations in Grainger County are Community & Social Service (840 | 8.6%), Management (793 | 8.1%), Health Diagnosing & Treating (653 | 6.7%), Education Instruction & Library (528 | 5.4%), and Health Technologists (362 | 3.7%).
Management, Business, Science and Arts Occupations by Sex
Within the Management, Business, Science and Arts occupations in Grainger County, the most male-oriented occupations are Life, Physical & Social Science (100.0%), Legal Services & Support (100.0%), and Computers, Engineering & Science (86.4%), while the most female-oriented occupations are Education, Arts & Media (87.0%), Education Instruction & Library (83.7%), and Health Diagnosing & Treating (82.2%).
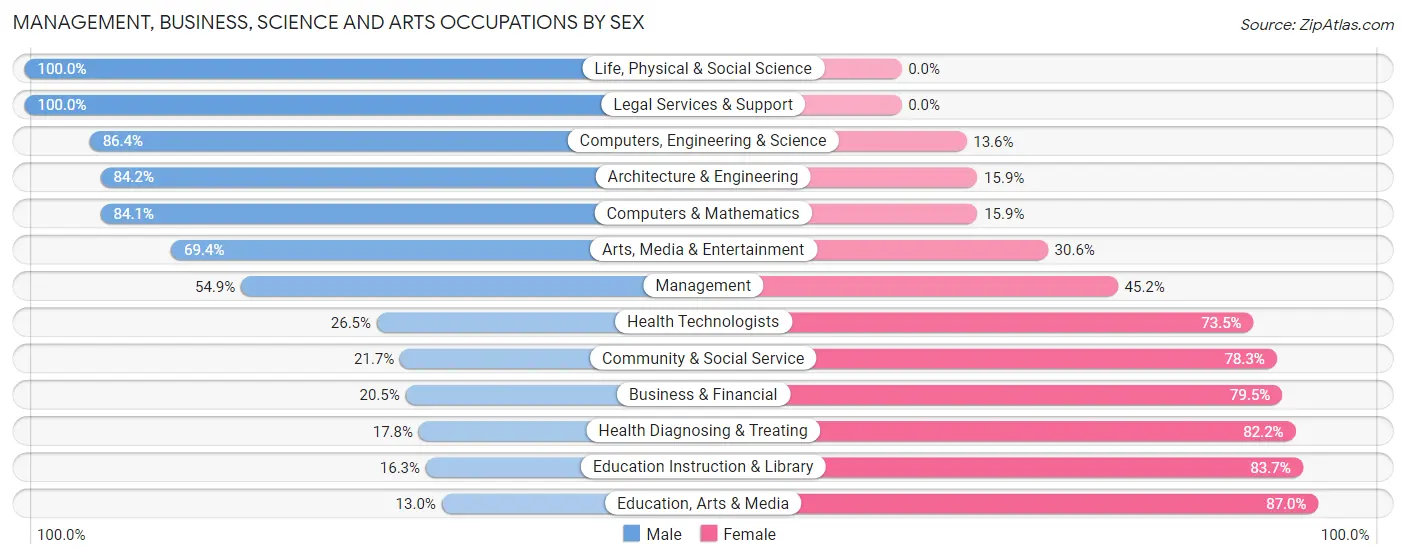
| Occupation | Male | Female |
| Management | 435 (54.8%) | 358 (45.2%) |
| Business & Financial | 39 (20.5%) | 151 (79.5%) |
| Computers, Engineering & Science | 248 (86.4%) | 39 (13.6%) |
| Computers & Mathematics | 53 (84.1%) | 10 (15.9%) |
| Architecture & Engineering | 154 (84.2%) | 29 (15.9%) |
| Life, Physical & Social Science | 41 (100.0%) | 0 (0.0%) |
| Community & Social Service | 182 (21.7%) | 658 (78.3%) |
| Education, Arts & Media | 29 (13.0%) | 194 (87.0%) |
| Legal Services & Support | 17 (100.0%) | 0 (0.0%) |
| Education Instruction & Library | 86 (16.3%) | 442 (83.7%) |
| Arts, Media & Entertainment | 50 (69.4%) | 22 (30.6%) |
| Health Diagnosing & Treating | 116 (17.8%) | 537 (82.2%) |
| Health Technologists | 96 (26.5%) | 266 (73.5%) |
| Total (Category) | 1,020 (36.9%) | 1,743 (63.1%) |
| Total (Overall) | 5,198 (53.3%) | 4,548 (46.7%) |
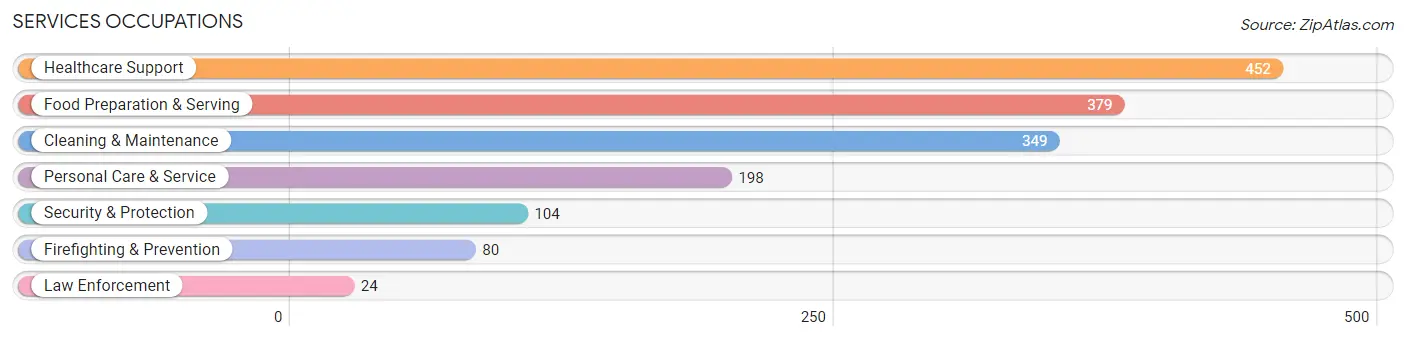
Services Occupations
The most common Services occupations in Grainger County are Healthcare Support (452 | 4.6%), Food Preparation & Serving (379 | 3.9%), Cleaning & Maintenance (349 | 3.6%), Personal Care & Service (198 | 2.0%), and Security & Protection (104 | 1.1%).
Services Occupations by Sex
Within the Services occupations in Grainger County, the most male-oriented occupations are Security & Protection (100.0%), Firefighting & Prevention (100.0%), and Law Enforcement (100.0%), while the most female-oriented occupations are Healthcare Support (100.0%), Personal Care & Service (85.4%), and Food Preparation & Serving (49.3%).
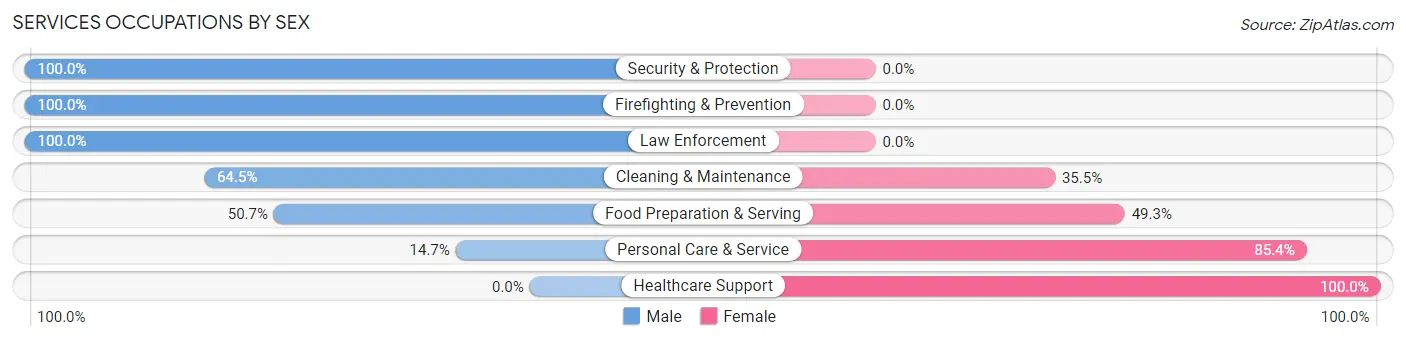
| Occupation | Male | Female |
| Healthcare Support | 0 (0.0%) | 452 (100.0%) |
| Security & Protection | 104 (100.0%) | 0 (0.0%) |
| Firefighting & Prevention | 80 (100.0%) | 0 (0.0%) |
| Law Enforcement | 24 (100.0%) | 0 (0.0%) |
| Food Preparation & Serving | 192 (50.7%) | 187 (49.3%) |
| Cleaning & Maintenance | 225 (64.5%) | 124 (35.5%) |
| Personal Care & Service | 29 (14.6%) | 169 (85.4%) |
| Total (Category) | 550 (37.1%) | 932 (62.9%) |
| Total (Overall) | 5,198 (53.3%) | 4,548 (46.7%) |
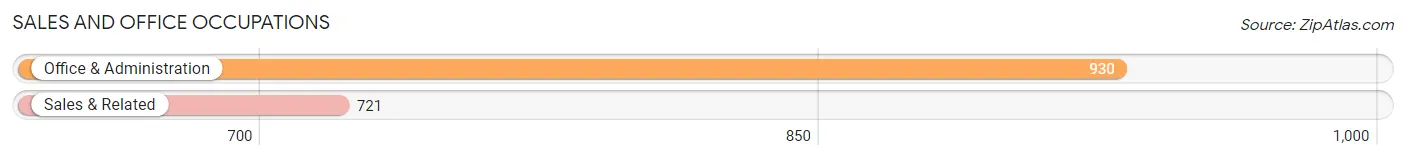
Sales and Office Occupations
The most common Sales and Office occupations in Grainger County are Office & Administration (930 | 9.5%), and Sales & Related (721 | 7.4%).
Sales and Office Occupations by Sex
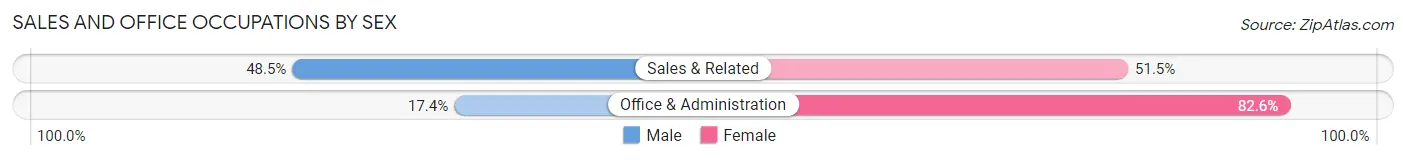
| Occupation | Male | Female |
| Sales & Related | 350 (48.5%) | 371 (51.5%) |
| Office & Administration | 162 (17.4%) | 768 (82.6%) |
| Total (Category) | 512 (31.0%) | 1,139 (69.0%) |
| Total (Overall) | 5,198 (53.3%) | 4,548 (46.7%) |
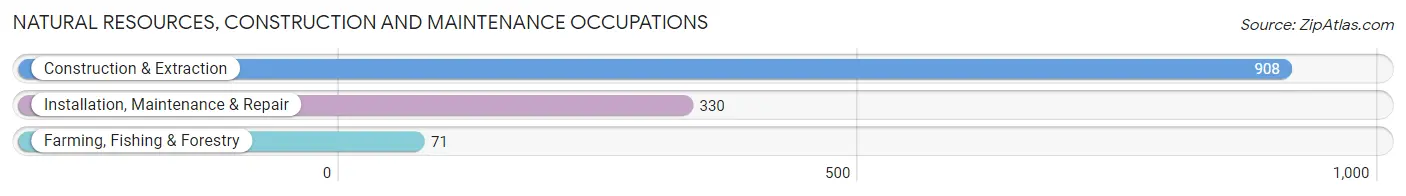
Natural Resources, Construction and Maintenance Occupations
The most common Natural Resources, Construction and Maintenance occupations in Grainger County are Construction & Extraction (908 | 9.3%), Installation, Maintenance & Repair (330 | 3.4%), and Farming, Fishing & Forestry (71 | 0.7%).
Natural Resources, Construction and Maintenance Occupations by Sex
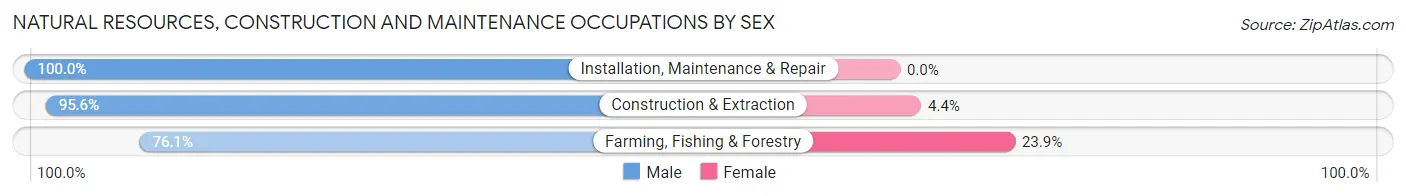
| Occupation | Male | Female |
| Farming, Fishing & Forestry | 54 (76.1%) | 17 (23.9%) |
| Construction & Extraction | 868 (95.6%) | 40 (4.4%) |
| Installation, Maintenance & Repair | 330 (100.0%) | 0 (0.0%) |
| Total (Category) | 1,252 (95.7%) | 57 (4.3%) |
| Total (Overall) | 5,198 (53.3%) | 4,548 (46.7%) |
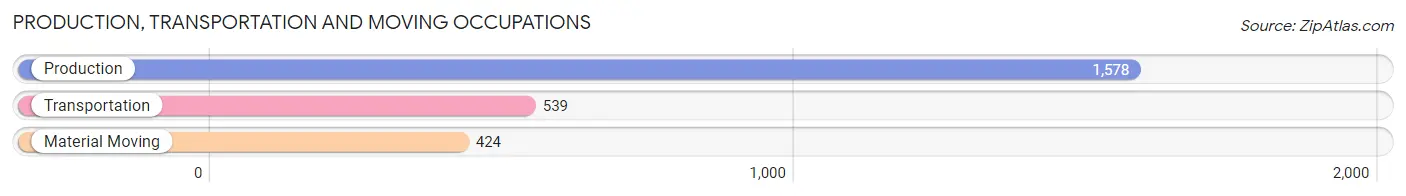
Production, Transportation and Moving Occupations
The most common Production, Transportation and Moving occupations in Grainger County are Production (1,578 | 16.2%), Transportation (539 | 5.5%), and Material Moving (424 | 4.3%).
Production, Transportation and Moving Occupations by Sex
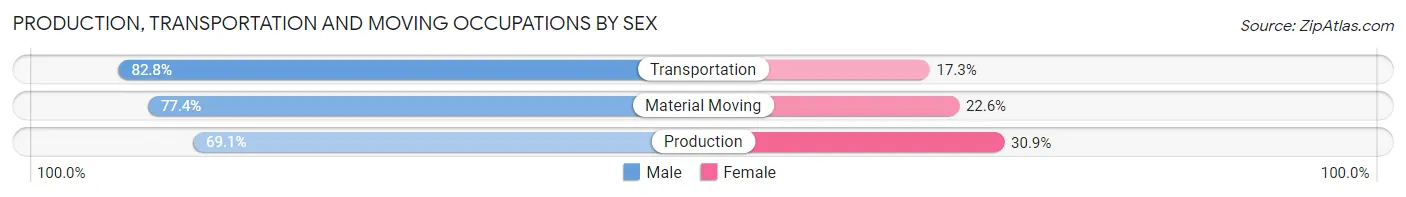
| Occupation | Male | Female |
| Production | 1,090 (69.1%) | 488 (30.9%) |
| Transportation | 446 (82.8%) | 93 (17.2%) |
| Material Moving | 328 (77.4%) | 96 (22.6%) |
| Total (Category) | 1,864 (73.4%) | 677 (26.6%) |
| Total (Overall) | 5,198 (53.3%) | 4,548 (46.7%) |
Employment Industries by Sex in Grainger County
Employment Industries in Grainger County
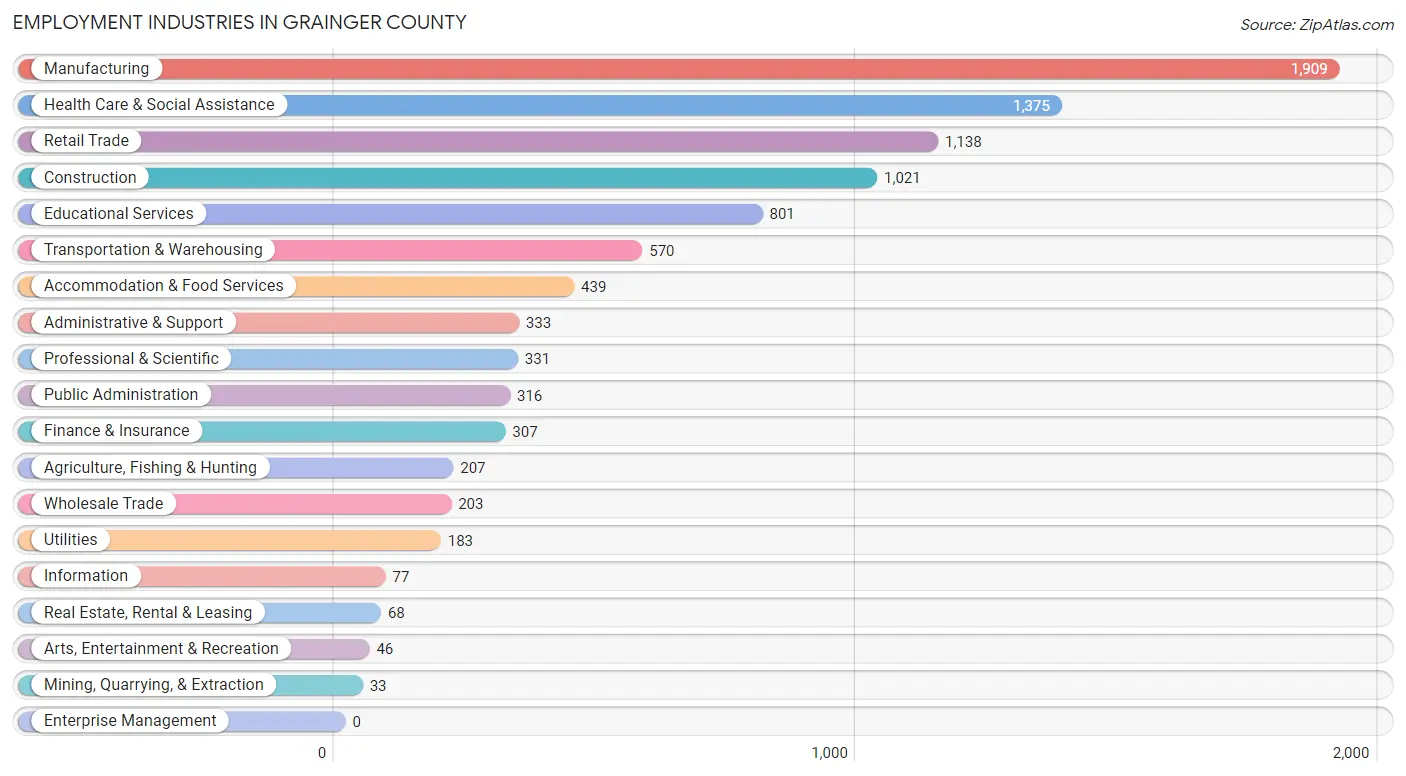
The major employment industries in Grainger County include Manufacturing (1,909 | 19.6%), Health Care & Social Assistance (1,375 | 14.1%), Retail Trade (1,138 | 11.7%), Construction (1,021 | 10.5%), and Educational Services (801 | 8.2%).
Employment Industries by Sex in Grainger County
The Grainger County industries that see more men than women are Mining, Quarrying, & Extraction (100.0%), Wholesale Trade (95.1%), and Construction (89.5%), whereas the industries that tend to have a higher number of women are Real Estate, Rental & Leasing (100.0%), Finance & Insurance (91.9%), and Health Care & Social Assistance (90.0%).
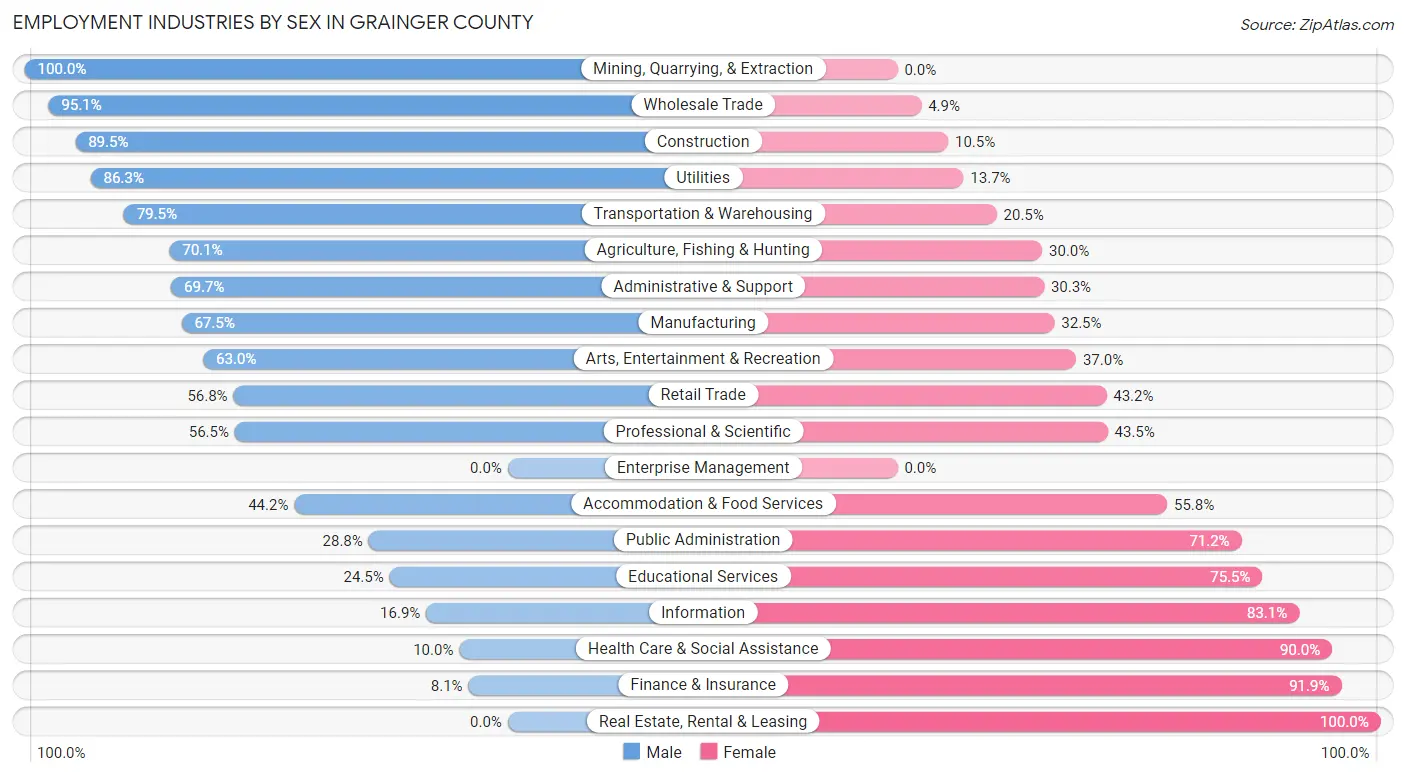
| Industry | Male | Female |
| Agriculture, Fishing & Hunting | 145 (70.1%) | 62 (29.9%) |
| Mining, Quarrying, & Extraction | 33 (100.0%) | 0 (0.0%) |
| Construction | 914 (89.5%) | 107 (10.5%) |
| Manufacturing | 1,289 (67.5%) | 620 (32.5%) |
| Wholesale Trade | 193 (95.1%) | 10 (4.9%) |
| Retail Trade | 646 (56.8%) | 492 (43.2%) |
| Transportation & Warehousing | 453 (79.5%) | 117 (20.5%) |
| Utilities | 158 (86.3%) | 25 (13.7%) |
| Information | 13 (16.9%) | 64 (83.1%) |
| Finance & Insurance | 25 (8.1%) | 282 (91.9%) |
| Real Estate, Rental & Leasing | 0 (0.0%) | 68 (100.0%) |
| Professional & Scientific | 187 (56.5%) | 144 (43.5%) |
| Enterprise Management | 0 (0.0%) | 0 (0.0%) |
| Administrative & Support | 232 (69.7%) | 101 (30.3%) |
| Educational Services | 196 (24.5%) | 605 (75.5%) |
| Health Care & Social Assistance | 138 (10.0%) | 1,237 (90.0%) |
| Arts, Entertainment & Recreation | 29 (63.0%) | 17 (37.0%) |
| Accommodation & Food Services | 194 (44.2%) | 245 (55.8%) |
| Public Administration | 91 (28.8%) | 225 (71.2%) |
| Total | 5,198 (53.3%) | 4,548 (46.7%) |
Education in Grainger County
School Enrollment in Grainger County
The most common levels of schooling among the 4,348 students in Grainger County are high school (1,196 | 27.5%), elementary school (1,068 | 24.6%), and middle school (908 | 20.9%).
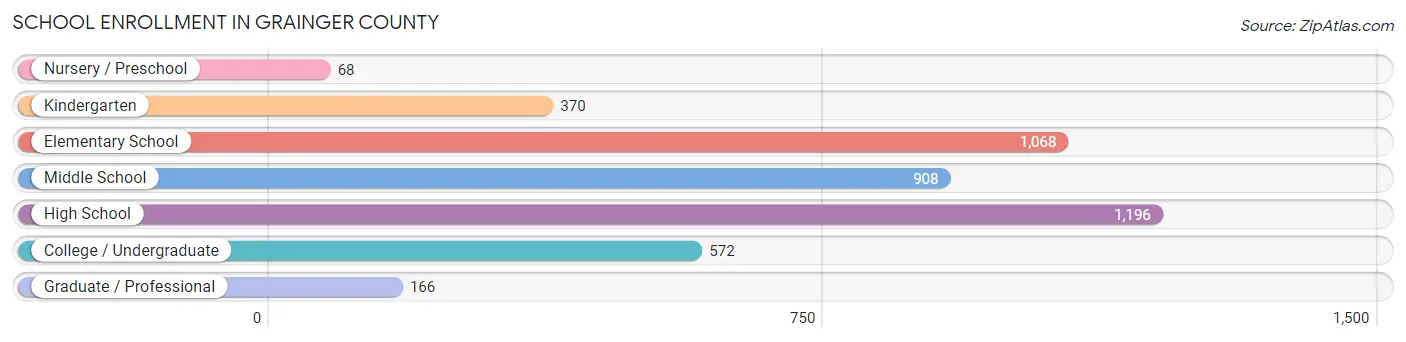
| School Level | # Students | % Students |
| Nursery / Preschool | 68 | 1.6% |
| Kindergarten | 370 | 8.5% |
| Elementary School | 1,068 | 24.6% |
| Middle School | 908 | 20.9% |
| High School | 1,196 | 27.5% |
| College / Undergraduate | 572 | 13.2% |
| Graduate / Professional | 166 | 3.8% |
| Total | 4,348 | 100.0% |
School Enrollment by Age by Funding Source in Grainger County
Out of a total of 4,348 students who are enrolled in schools in Grainger County, 478 (11.0%) attend a private institution, while the remaining 3,870 (89.0%) are enrolled in public schools. The age group of 3 to 4 year olds has the highest likelihood of being enrolled in private schools, with 40 (58.8% in the age bracket) enrolled. Conversely, the age group of 15 to 17 year olds has the lowest likelihood of being enrolled in a private school, with 876 (95.6% in the age bracket) attending a public institution.
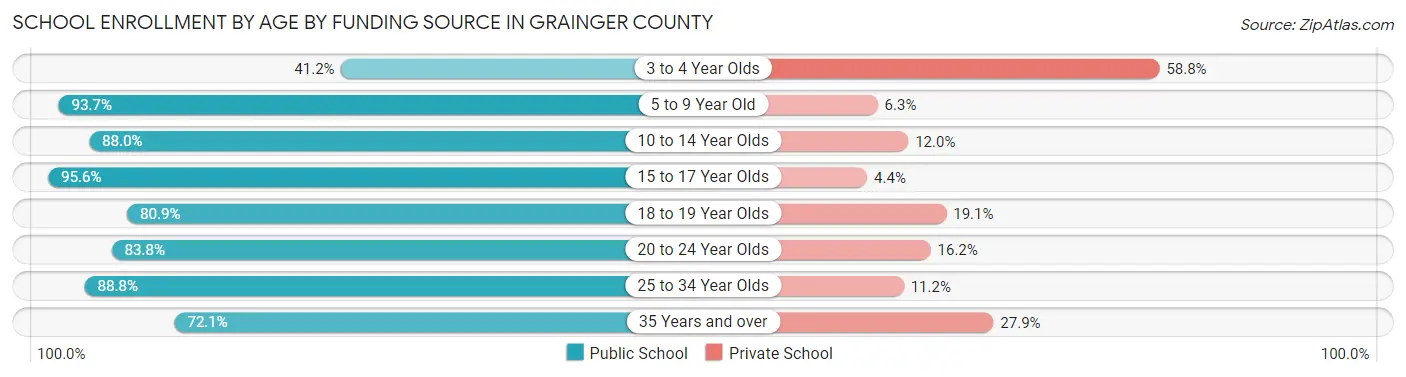
| Age Bracket | Public School | Private School |
| 3 to 4 Year Olds | 28 (41.2%) | 40 (58.8%) |
| 5 to 9 Year Old | 1,139 (93.7%) | 77 (6.3%) |
| 10 to 14 Year Olds | 1,111 (88.0%) | 152 (12.0%) |
| 15 to 17 Year Olds | 876 (95.6%) | 40 (4.4%) |
| 18 to 19 Year Olds | 254 (80.9%) | 60 (19.1%) |
| 20 to 24 Year Olds | 207 (83.8%) | 40 (16.2%) |
| 25 to 34 Year Olds | 119 (88.8%) | 15 (11.2%) |
| 35 Years and over | 137 (72.1%) | 53 (27.9%) |
| Total | 3,870 (89.0%) | 478 (11.0%) |
Educational Attainment by Field of Study in Grainger County
Education (511 | 20.5%), business (405 | 16.3%), liberal arts & history (327 | 13.2%), science & technology (294 | 11.8%), and engineering (222 | 8.9%) are the most common fields of study among 2,487 individuals in Grainger County who have obtained a bachelor's degree or higher.
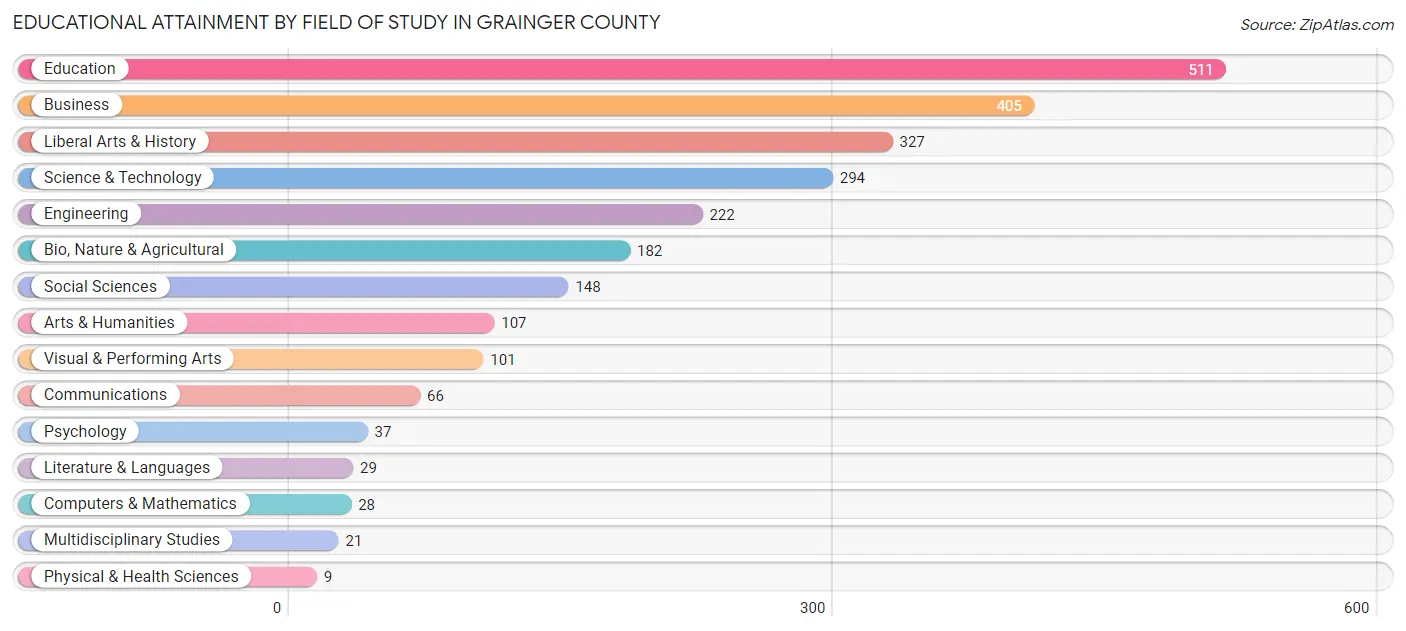
| Field of Study | # Graduates | % Graduates |
| Computers & Mathematics | 28 | 1.1% |
| Bio, Nature & Agricultural | 182 | 7.3% |
| Physical & Health Sciences | 9 | 0.4% |
| Psychology | 37 | 1.5% |
| Social Sciences | 148 | 5.9% |
| Engineering | 222 | 8.9% |
| Multidisciplinary Studies | 21 | 0.8% |
| Science & Technology | 294 | 11.8% |
| Business | 405 | 16.3% |
| Education | 511 | 20.5% |
| Literature & Languages | 29 | 1.2% |
| Liberal Arts & History | 327 | 13.2% |
| Visual & Performing Arts | 101 | 4.1% |
| Communications | 66 | 2.6% |
| Arts & Humanities | 107 | 4.3% |
| Total | 2,487 | 100.0% |
Transportation & Commute in Grainger County
Vehicle Availability by Sex in Grainger County
The most prevalent vehicle ownership categories in Grainger County are males with 2 vehicles (1,768, accounting for 35.2%) and females with 2 vehicles (1,423, making up 40.3%).
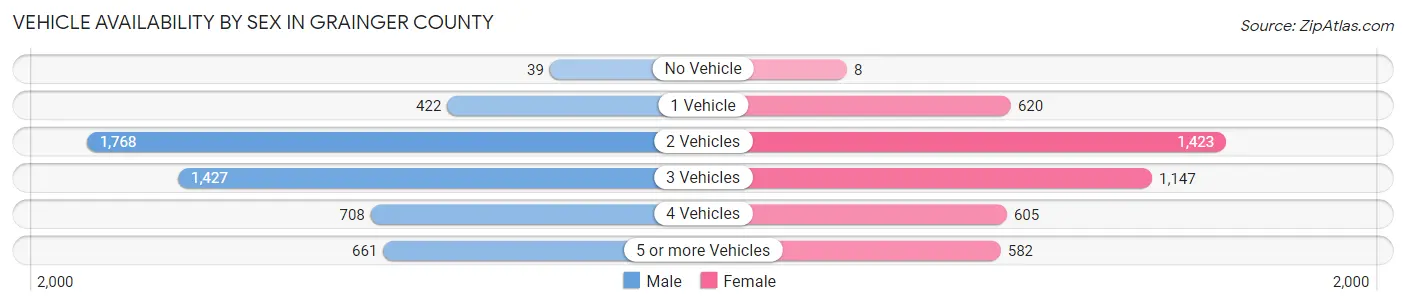
| Vehicles Available | Male | Female |
| No Vehicle | 39 (0.8%) | 8 (0.2%) |
| 1 Vehicle | 422 (8.4%) | 620 (14.1%) |
| 2 Vehicles | 1,768 (35.2%) | 1,423 (32.5%) |
| 3 Vehicles | 1,427 (28.4%) | 1,147 (26.2%) |
| 4 Vehicles | 708 (14.1%) | 605 (13.8%) |
| 5 or more Vehicles | 661 (13.2%) | 582 (13.3%) |
| Total | 5,025 (100.0%) | 4,385 (100.0%) |
Commute Time in Grainger County
The most frequently occuring commute durations in Grainger County are 30 to 34 minutes (1,345 commuters, 15.4%), 45 to 59 minutes (1,224 commuters, 14.0%), and 20 to 24 minutes (1,139 commuters, 13.1%).
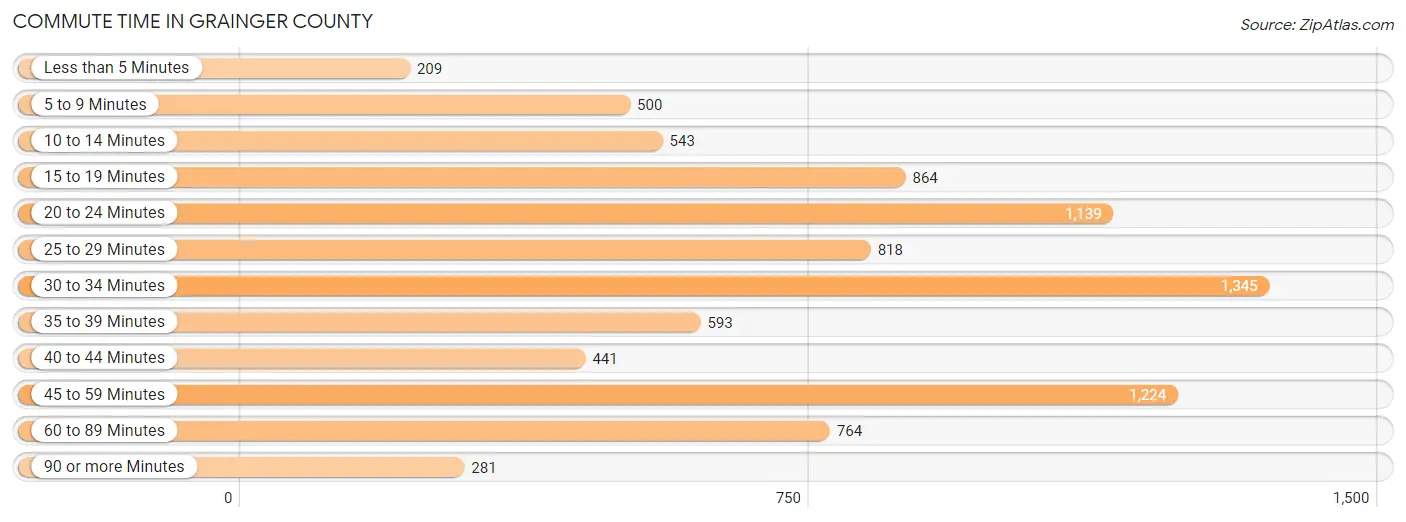
| Commute Time | # Commuters | % Commuters |
| Less than 5 Minutes | 209 | 2.4% |
| 5 to 9 Minutes | 500 | 5.7% |
| 10 to 14 Minutes | 543 | 6.2% |
| 15 to 19 Minutes | 864 | 9.9% |
| 20 to 24 Minutes | 1,139 | 13.1% |
| 25 to 29 Minutes | 818 | 9.4% |
| 30 to 34 Minutes | 1,345 | 15.4% |
| 35 to 39 Minutes | 593 | 6.8% |
| 40 to 44 Minutes | 441 | 5.1% |
| 45 to 59 Minutes | 1,224 | 14.0% |
| 60 to 89 Minutes | 764 | 8.8% |
| 90 or more Minutes | 281 | 3.2% |
Commute Time by Sex in Grainger County
The most common commute times in Grainger County are 45 to 59 minutes (752 commuters, 15.8%) for males and 30 to 34 minutes (704 commuters, 17.8%) for females.
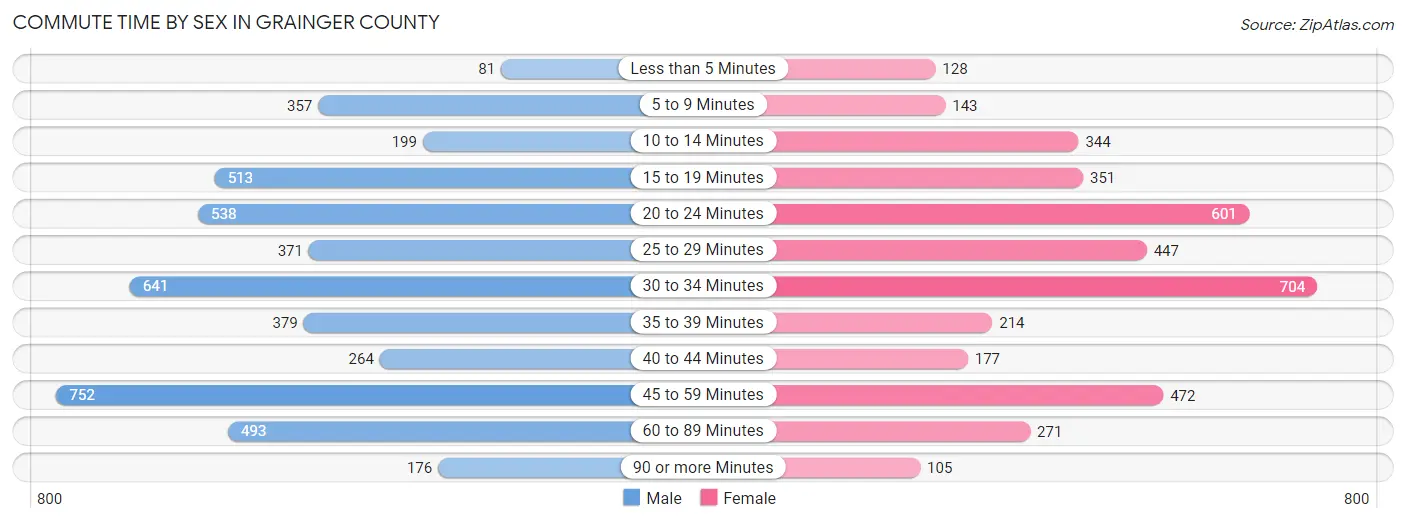
| Commute Time | Male | Female |
| Less than 5 Minutes | 81 (1.7%) | 128 (3.2%) |
| 5 to 9 Minutes | 357 (7.5%) | 143 (3.6%) |
| 10 to 14 Minutes | 199 (4.2%) | 344 (8.7%) |
| 15 to 19 Minutes | 513 (10.8%) | 351 (8.9%) |
| 20 to 24 Minutes | 538 (11.3%) | 601 (15.2%) |
| 25 to 29 Minutes | 371 (7.8%) | 447 (11.3%) |
| 30 to 34 Minutes | 641 (13.5%) | 704 (17.8%) |
| 35 to 39 Minutes | 379 (8.0%) | 214 (5.4%) |
| 40 to 44 Minutes | 264 (5.5%) | 177 (4.5%) |
| 45 to 59 Minutes | 752 (15.8%) | 472 (11.9%) |
| 60 to 89 Minutes | 493 (10.3%) | 271 (6.9%) |
| 90 or more Minutes | 176 (3.7%) | 105 (2.6%) |
Time of Departure to Work by Sex in Grainger County
The most frequent times of departure to work in Grainger County are 6:00 AM to 6:29 AM (935, 19.6%) for males and 7:00 AM to 7:29 AM (787, 19.9%) for females.
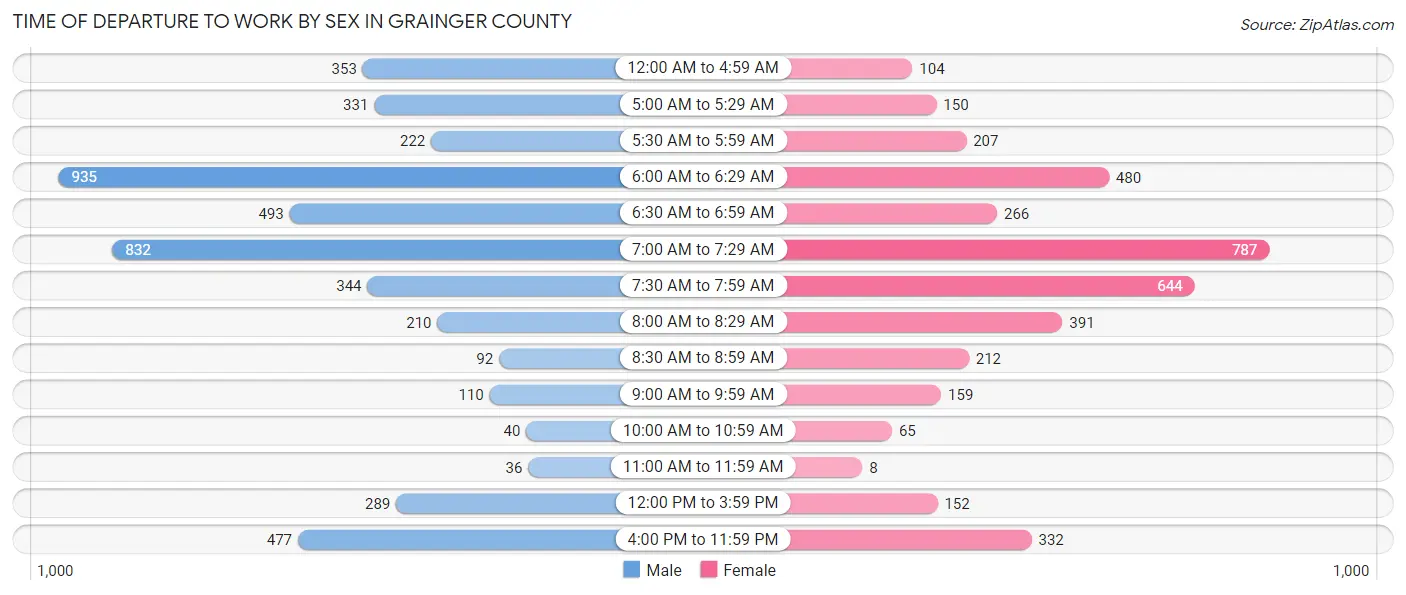
| Time of Departure | Male | Female |
| 12:00 AM to 4:59 AM | 353 (7.4%) | 104 (2.6%) |
| 5:00 AM to 5:29 AM | 331 (7.0%) | 150 (3.8%) |
| 5:30 AM to 5:59 AM | 222 (4.7%) | 207 (5.2%) |
| 6:00 AM to 6:29 AM | 935 (19.6%) | 480 (12.1%) |
| 6:30 AM to 6:59 AM | 493 (10.3%) | 266 (6.7%) |
| 7:00 AM to 7:29 AM | 832 (17.5%) | 787 (19.9%) |
| 7:30 AM to 7:59 AM | 344 (7.2%) | 644 (16.3%) |
| 8:00 AM to 8:29 AM | 210 (4.4%) | 391 (9.9%) |
| 8:30 AM to 8:59 AM | 92 (1.9%) | 212 (5.4%) |
| 9:00 AM to 9:59 AM | 110 (2.3%) | 159 (4.0%) |
| 10:00 AM to 10:59 AM | 40 (0.8%) | 65 (1.6%) |
| 11:00 AM to 11:59 AM | 36 (0.8%) | 8 (0.2%) |
| 12:00 PM to 3:59 PM | 289 (6.1%) | 152 (3.8%) |
| 4:00 PM to 11:59 PM | 477 (10.0%) | 332 (8.4%) |
| Total | 4,764 (100.0%) | 3,957 (100.0%) |
Housing Occupancy in Grainger County
Occupancy by Ownership in Grainger County
Of the total 9,384 dwellings in Grainger County, owner-occupied units account for 7,226 (77.0%), while renter-occupied units make up 2,158 (23.0%).
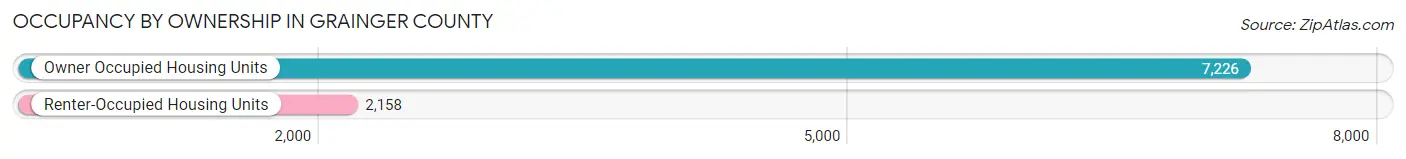
| Occupancy | # Housing Units | % Housing Units |
| Owner Occupied Housing Units | 7,226 | 77.0% |
| Renter-Occupied Housing Units | 2,158 | 23.0% |
| Total Occupied Housing Units | 9,384 | 100.0% |
Occupancy by Household Size in Grainger County
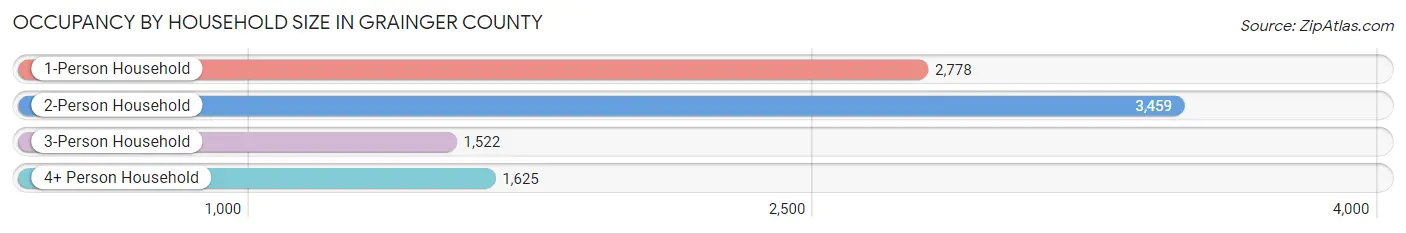
| Household Size | # Housing Units | % Housing Units |
| 1-Person Household | 2,778 | 29.6% |
| 2-Person Household | 3,459 | 36.9% |
| 3-Person Household | 1,522 | 16.2% |
| 4+ Person Household | 1,625 | 17.3% |
| Total Housing Units | 9,384 | 100.0% |
Occupancy by Ownership by Household Size in Grainger County
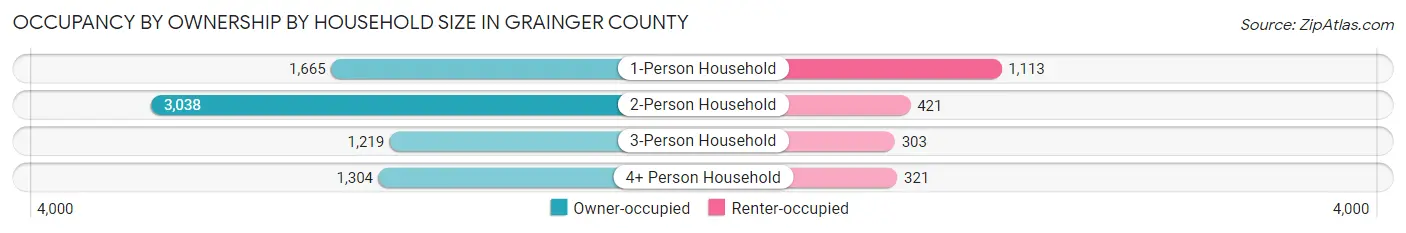
| Household Size | Owner-occupied | Renter-occupied |
| 1-Person Household | 1,665 (59.9%) | 1,113 (40.1%) |
| 2-Person Household | 3,038 (87.8%) | 421 (12.2%) |
| 3-Person Household | 1,219 (80.1%) | 303 (19.9%) |
| 4+ Person Household | 1,304 (80.2%) | 321 (19.8%) |
| Total Housing Units | 7,226 (77.0%) | 2,158 (23.0%) |
Occupancy by Educational Attainment in Grainger County
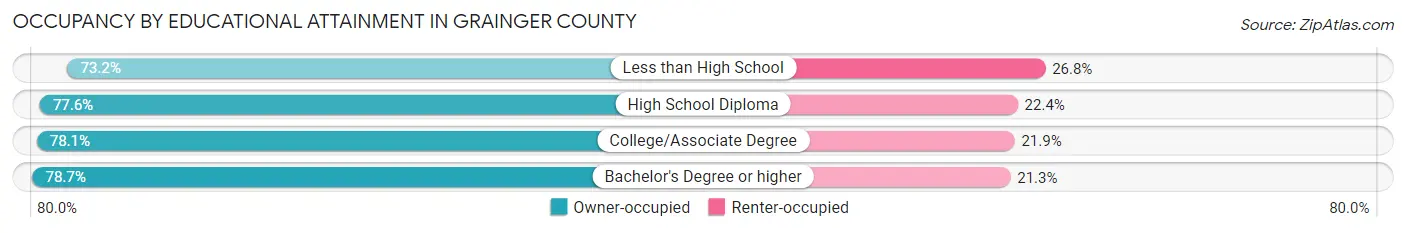
| Household Size | Owner-occupied | Renter-occupied |
| Less than High School | 1,365 (73.2%) | 500 (26.8%) |
| High School Diploma | 2,678 (77.6%) | 775 (22.4%) |
| College/Associate Degree | 2,095 (78.1%) | 589 (21.9%) |
| Bachelor's Degree or higher | 1,088 (78.7%) | 294 (21.3%) |
Occupancy by Age of Householder in Grainger County
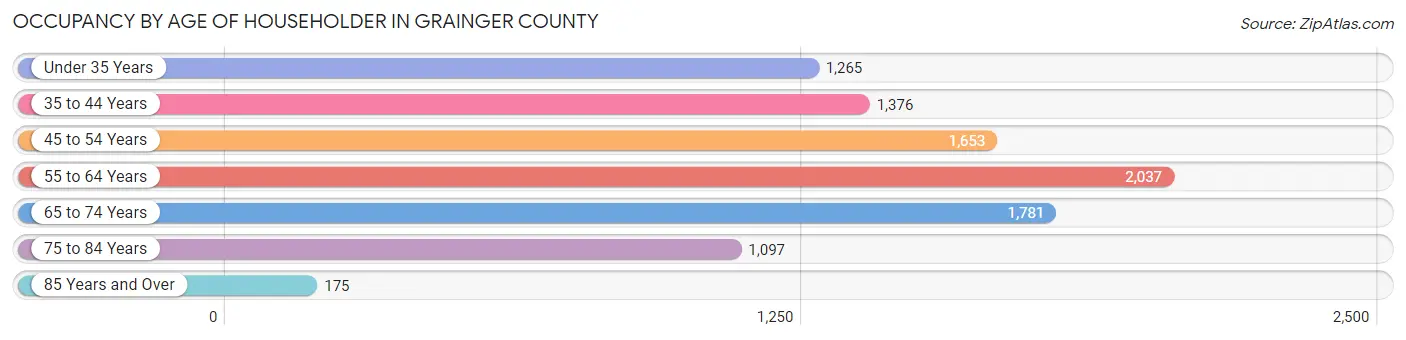
| Age Bracket | # Households | % Households |
| Under 35 Years | 1,265 | 13.5% |
| 35 to 44 Years | 1,376 | 14.7% |
| 45 to 54 Years | 1,653 | 17.6% |
| 55 to 64 Years | 2,037 | 21.7% |
| 65 to 74 Years | 1,781 | 19.0% |
| 75 to 84 Years | 1,097 | 11.7% |
| 85 Years and Over | 175 | 1.9% |
| Total | 9,384 | 100.0% |
Housing Finances in Grainger County
Median Income by Occupancy in Grainger County
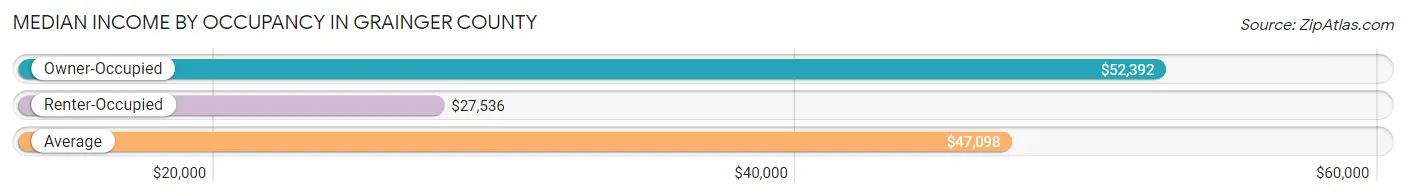
| Occupancy Type | # Households | Median Income |
| Owner-Occupied | 7,226 (77.0%) | $52,392 |
| Renter-Occupied | 2,158 (23.0%) | $27,536 |
| Average | 9,384 (100.0%) | $47,098 |
Occupancy by Householder Income Bracket in Grainger County
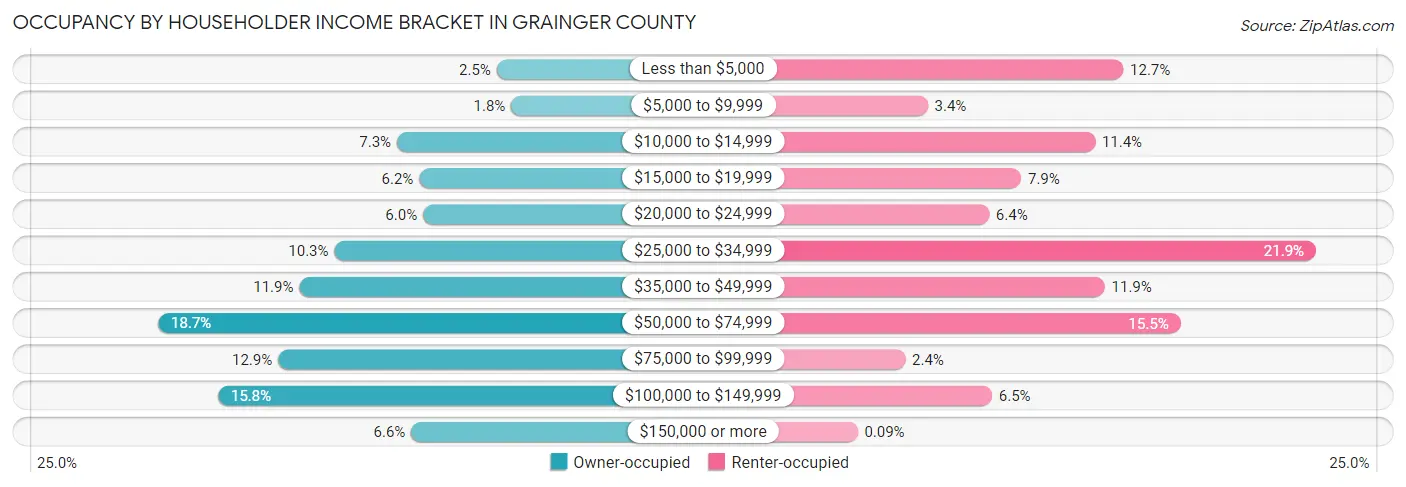
| Income Bracket | Owner-occupied | Renter-occupied |
| Less than $5,000 | 182 (2.5%) | 275 (12.7%) |
| $5,000 to $9,999 | 132 (1.8%) | 74 (3.4%) |
| $10,000 to $14,999 | 525 (7.3%) | 246 (11.4%) |
| $15,000 to $19,999 | 449 (6.2%) | 170 (7.9%) |
| $20,000 to $24,999 | 436 (6.0%) | 137 (6.4%) |
| $25,000 to $34,999 | 741 (10.2%) | 473 (21.9%) |
| $35,000 to $49,999 | 861 (11.9%) | 256 (11.9%) |
| $50,000 to $74,999 | 1,348 (18.6%) | 334 (15.5%) |
| $75,000 to $99,999 | 934 (12.9%) | 51 (2.4%) |
| $100,000 to $149,999 | 1,142 (15.8%) | 140 (6.5%) |
| $150,000 or more | 476 (6.6%) | 2 (0.1%) |
| Total | 7,226 (100.0%) | 2,158 (100.0%) |
Monthly Housing Cost Tiers in Grainger County
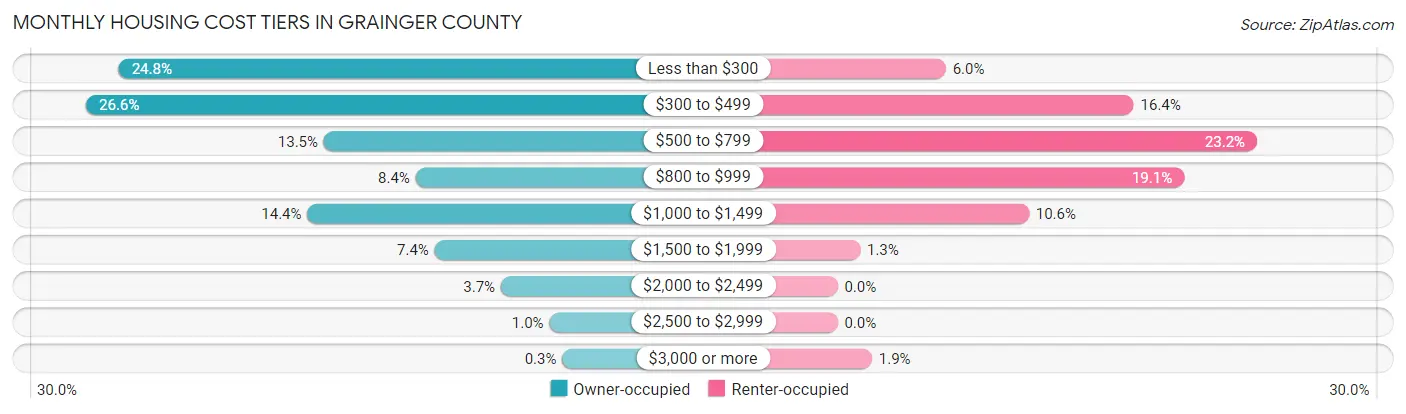
| Monthly Cost | Owner-occupied | Renter-occupied |
| Less than $300 | 1,792 (24.8%) | 129 (6.0%) |
| $300 to $499 | 1,922 (26.6%) | 353 (16.4%) |
| $500 to $799 | 973 (13.5%) | 500 (23.2%) |
| $800 to $999 | 607 (8.4%) | 413 (19.1%) |
| $1,000 to $1,499 | 1,039 (14.4%) | 228 (10.6%) |
| $1,500 to $1,999 | 531 (7.3%) | 27 (1.3%) |
| $2,000 to $2,499 | 267 (3.7%) | 0 (0.0%) |
| $2,500 to $2,999 | 73 (1.0%) | 0 (0.0%) |
| $3,000 or more | 22 (0.3%) | 41 (1.9%) |
| Total | 7,226 (100.0%) | 2,158 (100.0%) |
Physical Housing Characteristics in Grainger County
Housing Structures in Grainger County
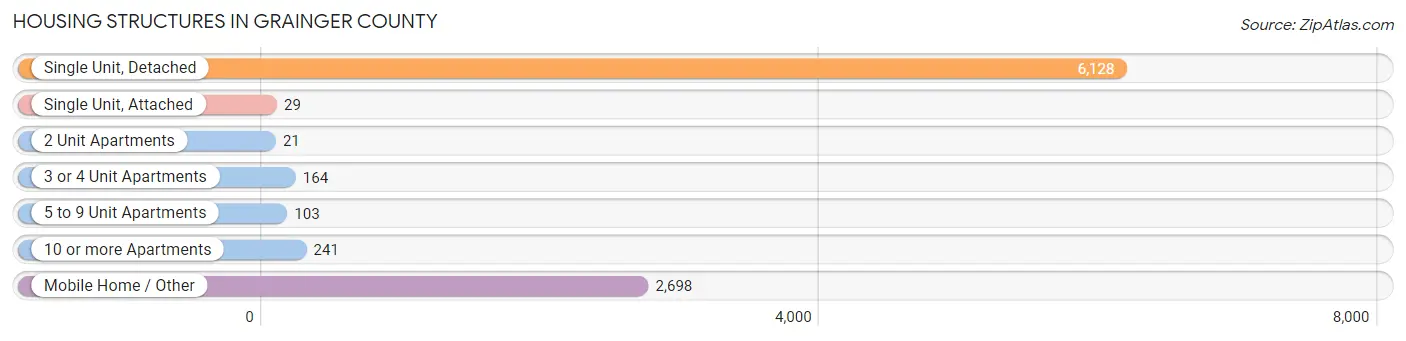
| Structure Type | # Housing Units | % Housing Units |
| Single Unit, Detached | 6,128 | 65.3% |
| Single Unit, Attached | 29 | 0.3% |
| 2 Unit Apartments | 21 | 0.2% |
| 3 or 4 Unit Apartments | 164 | 1.8% |
| 5 to 9 Unit Apartments | 103 | 1.1% |
| 10 or more Apartments | 241 | 2.6% |
| Mobile Home / Other | 2,698 | 28.7% |
| Total | 9,384 | 100.0% |
Housing Structures by Occupancy in Grainger County
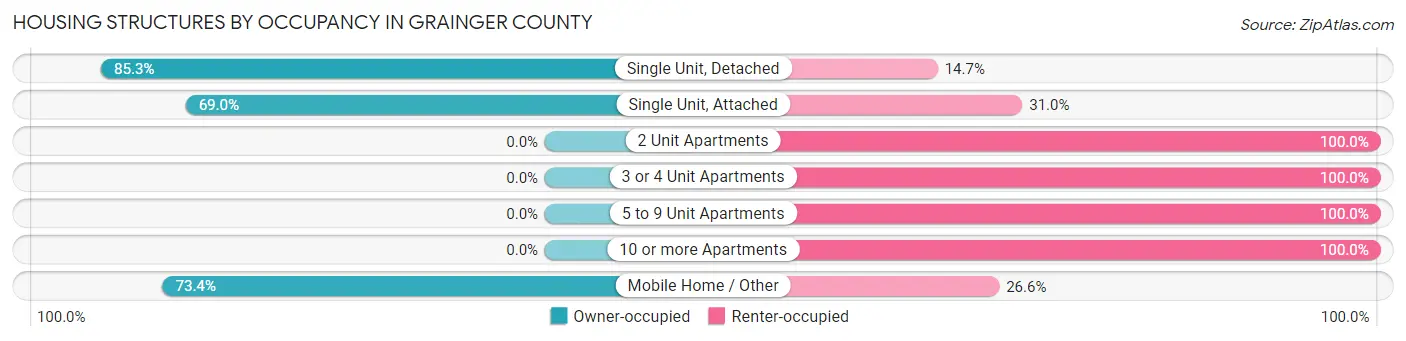
| Structure Type | Owner-occupied | Renter-occupied |
| Single Unit, Detached | 5,225 (85.3%) | 903 (14.7%) |
| Single Unit, Attached | 20 (69.0%) | 9 (31.0%) |
| 2 Unit Apartments | 0 (0.0%) | 21 (100.0%) |
| 3 or 4 Unit Apartments | 0 (0.0%) | 164 (100.0%) |
| 5 to 9 Unit Apartments | 0 (0.0%) | 103 (100.0%) |
| 10 or more Apartments | 0 (0.0%) | 241 (100.0%) |
| Mobile Home / Other | 1,981 (73.4%) | 717 (26.6%) |
| Total | 7,226 (77.0%) | 2,158 (23.0%) |
Housing Structures by Number of Rooms in Grainger County
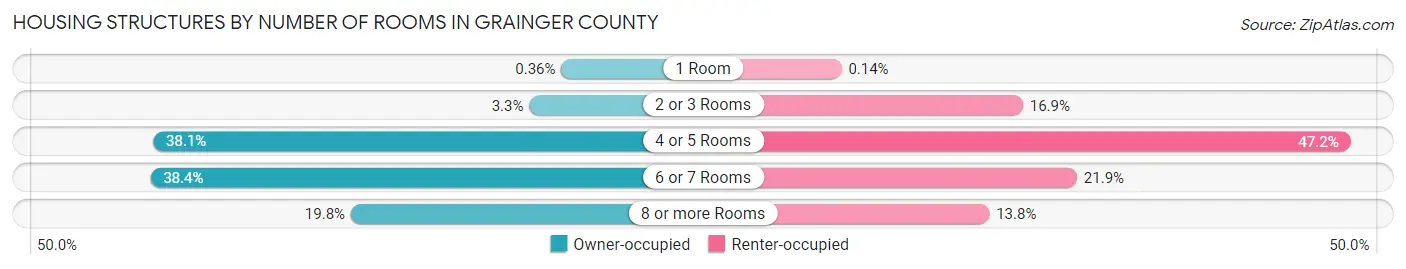
| Number of Rooms | Owner-occupied | Renter-occupied |
| 1 Room | 26 (0.4%) | 3 (0.1%) |
| 2 or 3 Rooms | 240 (3.3%) | 365 (16.9%) |
| 4 or 5 Rooms | 2,755 (38.1%) | 1,019 (47.2%) |
| 6 or 7 Rooms | 2,773 (38.4%) | 473 (21.9%) |
| 8 or more Rooms | 1,432 (19.8%) | 298 (13.8%) |
| Total | 7,226 (100.0%) | 2,158 (100.0%) |
Housing Structure by Heating Type in Grainger County
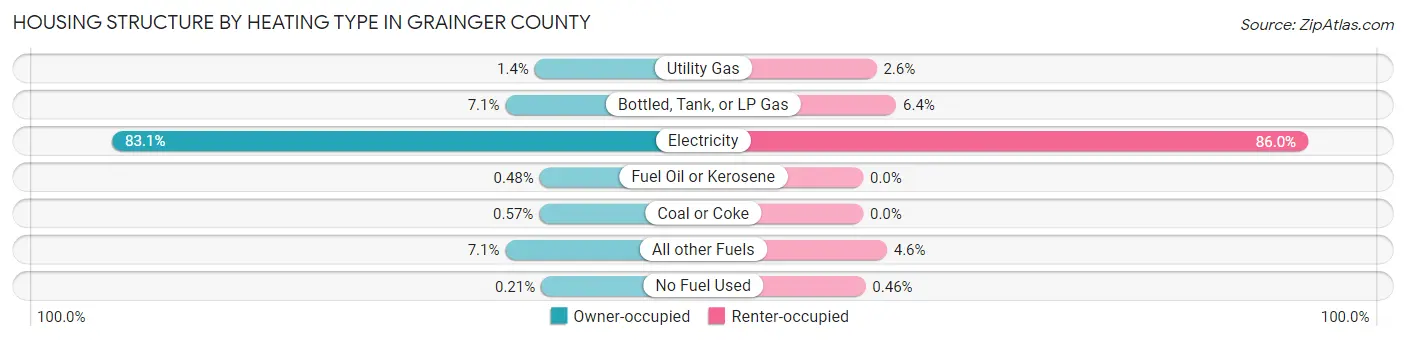
| Heating Type | Owner-occupied | Renter-occupied |
| Utility Gas | 103 (1.4%) | 56 (2.6%) |
| Bottled, Tank, or LP Gas | 514 (7.1%) | 138 (6.4%) |
| Electricity | 6,004 (83.1%) | 1,855 (86.0%) |
| Fuel Oil or Kerosene | 35 (0.5%) | 0 (0.0%) |
| Coal or Coke | 41 (0.6%) | 0 (0.0%) |
| All other Fuels | 514 (7.1%) | 99 (4.6%) |
| No Fuel Used | 15 (0.2%) | 10 (0.5%) |
| Total | 7,226 (100.0%) | 2,158 (100.0%) |
Household Vehicle Usage in Grainger County
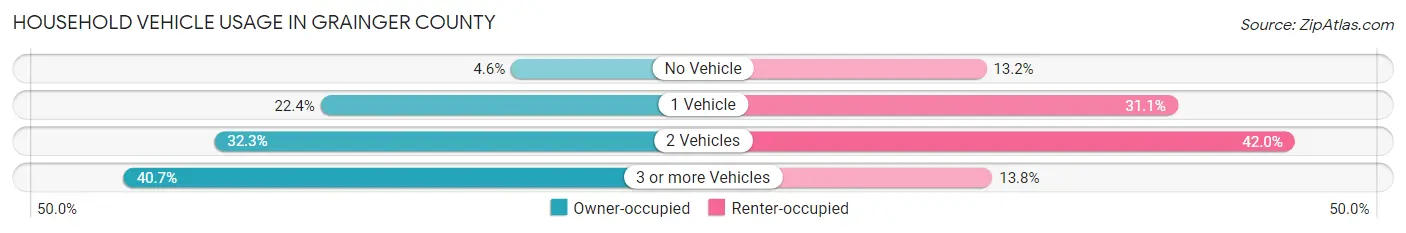
| Vehicles per Household | Owner-occupied | Renter-occupied |
| No Vehicle | 332 (4.6%) | 285 (13.2%) |
| 1 Vehicle | 1,617 (22.4%) | 670 (31.0%) |
| 2 Vehicles | 2,333 (32.3%) | 906 (42.0%) |
| 3 or more Vehicles | 2,944 (40.7%) | 297 (13.8%) |
| Total | 7,226 (100.0%) | 2,158 (100.0%) |
Real Estate & Mortgages in Grainger County
Real Estate and Mortgage Overview in Grainger County
| Characteristic | Without Mortgage | With Mortgage |
| Housing Units | 4,387 | 2,839 |
| Median Property Value | $121,500 | $193,200 |
| Median Household Income | $46,862 | $258 |
| Monthly Housing Costs | $332 | $10 |
| Real Estate Taxes | $625 | $136 |
Property Value by Mortgage Status in Grainger County
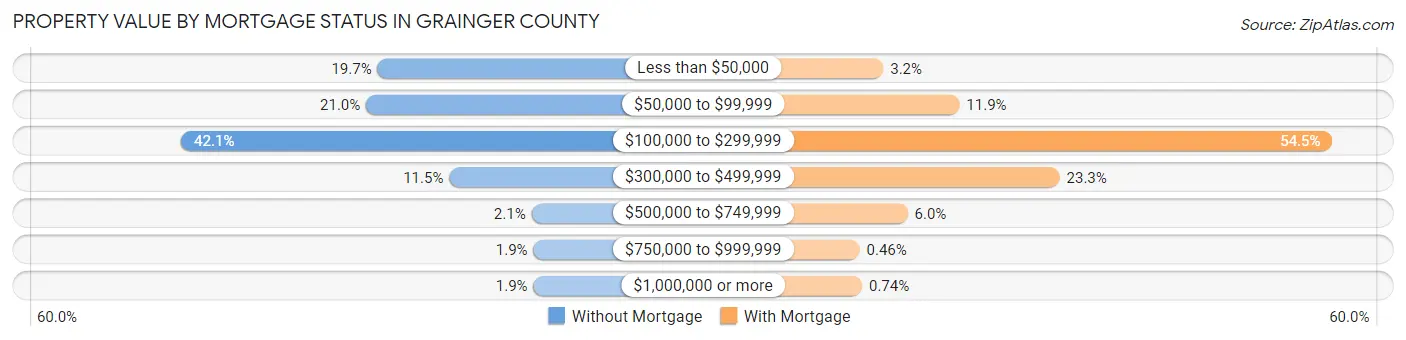
| Property Value | Without Mortgage | With Mortgage |
| Less than $50,000 | 863 (19.7%) | 90 (3.2%) |
| $50,000 to $99,999 | 920 (21.0%) | 337 (11.9%) |
| $100,000 to $299,999 | 1,848 (42.1%) | 1,547 (54.5%) |
| $300,000 to $499,999 | 503 (11.5%) | 662 (23.3%) |
| $500,000 to $749,999 | 91 (2.1%) | 169 (5.9%) |
| $750,000 to $999,999 | 81 (1.8%) | 13 (0.5%) |
| $1,000,000 or more | 81 (1.8%) | 21 (0.7%) |
| Total | 4,387 (100.0%) | 2,839 (100.0%) |
Household Income by Mortgage Status in Grainger County
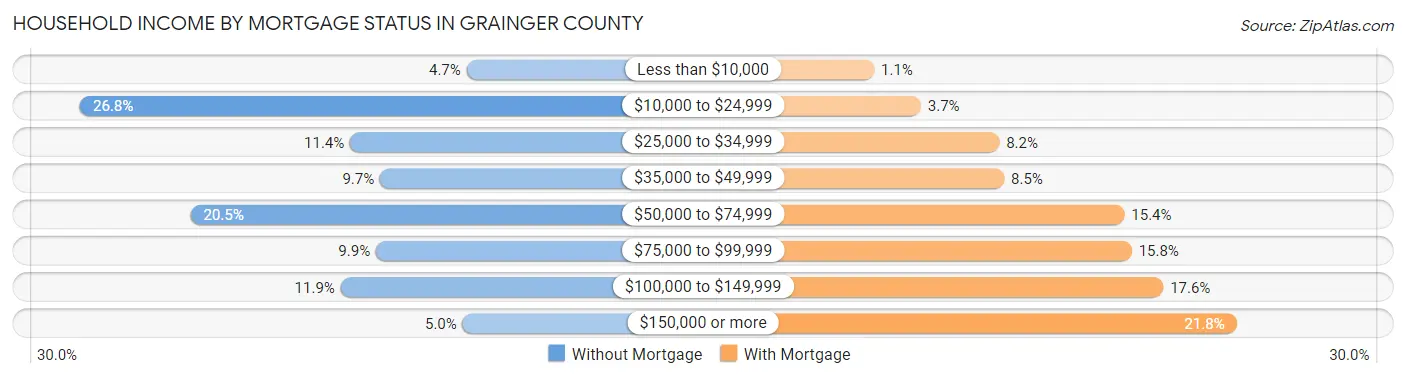
| Household Income | Without Mortgage | With Mortgage |
| Less than $10,000 | 208 (4.7%) | 30 (1.1%) |
| $10,000 to $24,999 | 1,177 (26.8%) | 106 (3.7%) |
| $25,000 to $34,999 | 500 (11.4%) | 233 (8.2%) |
| $35,000 to $49,999 | 425 (9.7%) | 241 (8.5%) |
| $50,000 to $74,999 | 900 (20.5%) | 436 (15.4%) |
| $75,000 to $99,999 | 435 (9.9%) | 448 (15.8%) |
| $100,000 to $149,999 | 524 (11.9%) | 499 (17.6%) |
| $150,000 or more | 218 (5.0%) | 618 (21.8%) |
| Total | 4,387 (100.0%) | 2,839 (100.0%) |
Property Value to Household Income Ratio in Grainger County
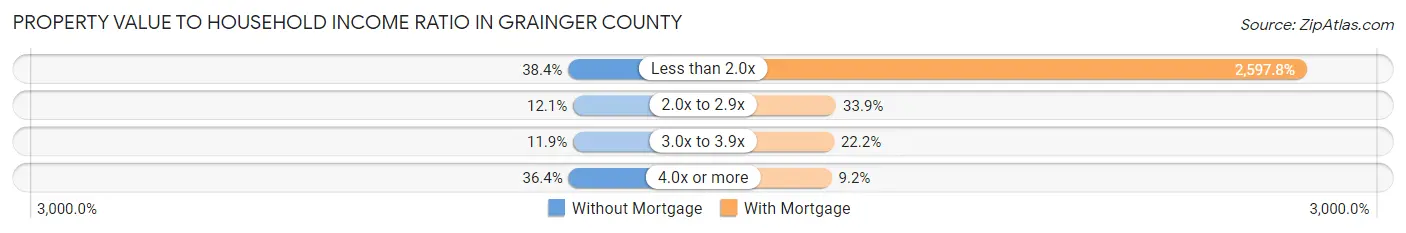
| Value-to-Income Ratio | Without Mortgage | With Mortgage |
| Less than 2.0x | 1,684 (38.4%) | 73,750 (2,597.7%) |
| 2.0x to 2.9x | 530 (12.1%) | 961 (33.9%) |
| 3.0x to 3.9x | 524 (11.9%) | 629 (22.2%) |
| 4.0x or more | 1,596 (36.4%) | 262 (9.2%) |
| Total | 4,387 (100.0%) | 2,839 (100.0%) |
Real Estate Taxes by Mortgage Status in Grainger County
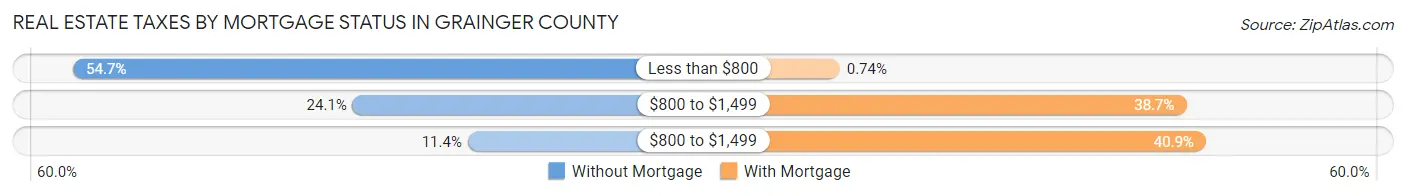
| Property Taxes | Without Mortgage | With Mortgage |
| Less than $800 | 2,399 (54.7%) | 21 (0.7%) |
| $800 to $1,499 | 1,055 (24.0%) | 1,099 (38.7%) |
| $800 to $1,499 | 502 (11.4%) | 1,160 (40.9%) |
| Total | 4,387 (100.0%) | 2,839 (100.0%) |
Health & Disability in Grainger County
Health Insurance Coverage by Age in Grainger County
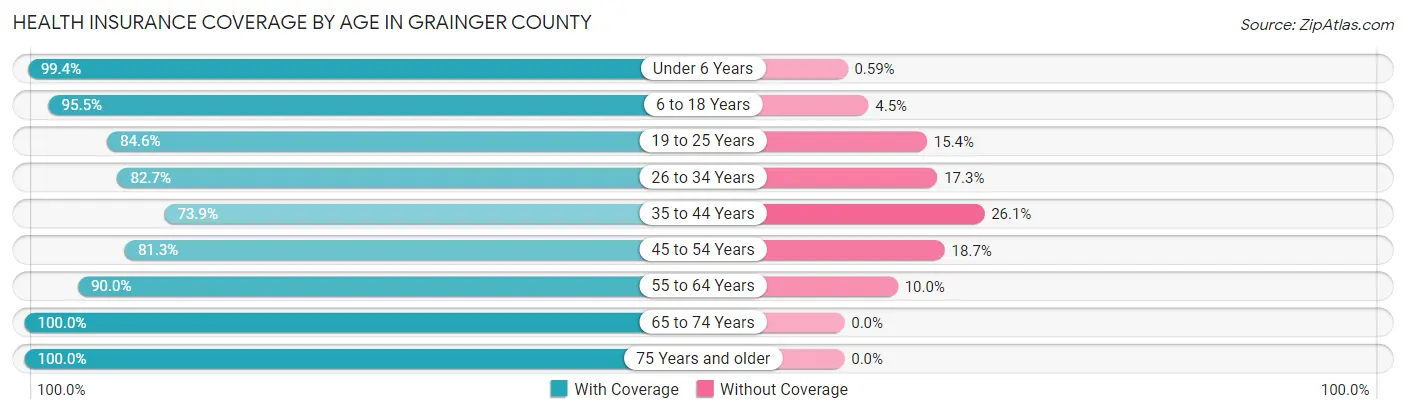
| Age Bracket | With Coverage | Without Coverage |
| Under 6 Years | 1,337 (99.4%) | 8 (0.6%) |
| 6 to 18 Years | 3,296 (95.5%) | 155 (4.5%) |
| 19 to 25 Years | 1,653 (84.6%) | 301 (15.4%) |
| 26 to 34 Years | 1,879 (82.7%) | 394 (17.3%) |
| 35 to 44 Years | 1,915 (73.9%) | 676 (26.1%) |
| 45 to 54 Years | 2,831 (81.3%) | 652 (18.7%) |
| 55 to 64 Years | 3,254 (90.0%) | 360 (10.0%) |
| 65 to 74 Years | 3,009 (100.0%) | 0 (0.0%) |
| 75 Years and older | 1,783 (100.0%) | 0 (0.0%) |
| Total | 20,957 (89.2%) | 2,546 (10.8%) |
Health Insurance Coverage by Citizenship Status in Grainger County
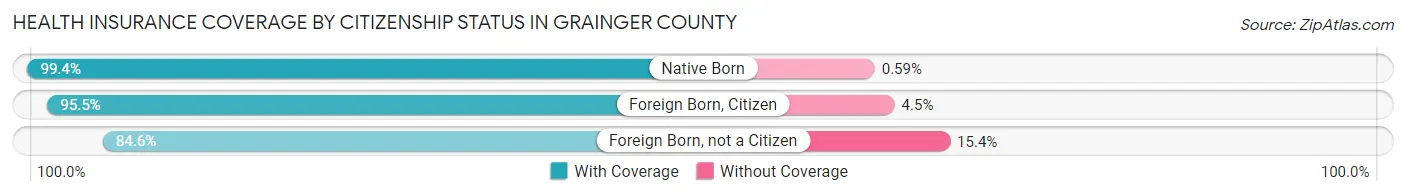
| Citizenship Status | With Coverage | Without Coverage |
| Native Born | 1,337 (99.4%) | 8 (0.6%) |
| Foreign Born, Citizen | 3,296 (95.5%) | 155 (4.5%) |
| Foreign Born, not a Citizen | 1,653 (84.6%) | 301 (15.4%) |
Health Insurance Coverage by Household Income in Grainger County
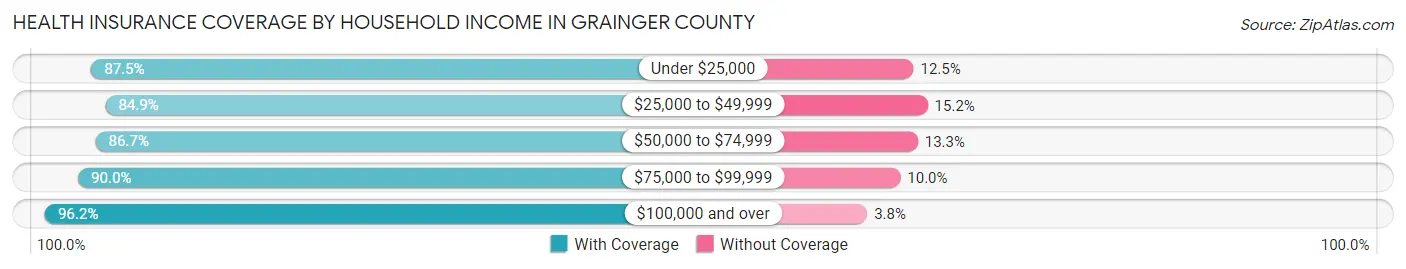
| Household Income | With Coverage | Without Coverage |
| Under $25,000 | 3,793 (87.5%) | 542 (12.5%) |
| $25,000 to $49,999 | 4,576 (84.9%) | 817 (15.1%) |
| $50,000 to $74,999 | 4,230 (86.7%) | 649 (13.3%) |
| $75,000 to $99,999 | 2,831 (90.0%) | 316 (10.0%) |
| $100,000 and over | 5,525 (96.2%) | 220 (3.8%) |
Public vs Private Health Insurance Coverage by Age in Grainger County
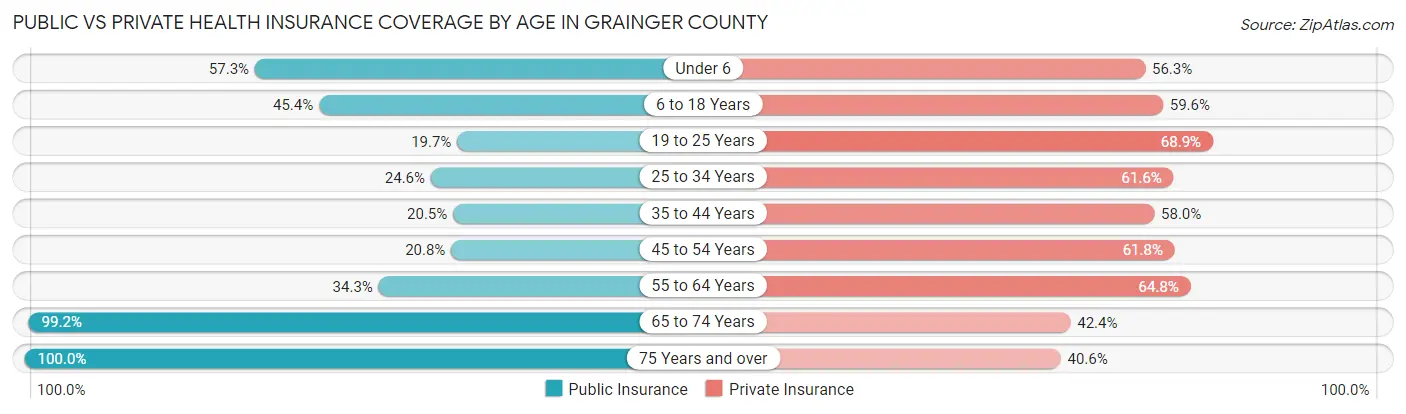
| Age Bracket | Public Insurance | Private Insurance |
| Under 6 | 770 (57.3%) | 757 (56.3%) |
| 6 to 18 Years | 1,565 (45.4%) | 2,056 (59.6%) |
| 19 to 25 Years | 385 (19.7%) | 1,346 (68.9%) |
| 25 to 34 Years | 559 (24.6%) | 1,400 (61.6%) |
| 35 to 44 Years | 530 (20.5%) | 1,502 (58.0%) |
| 45 to 54 Years | 725 (20.8%) | 2,152 (61.8%) |
| 55 to 64 Years | 1,239 (34.3%) | 2,340 (64.7%) |
| 65 to 74 Years | 2,986 (99.2%) | 1,276 (42.4%) |
| 75 Years and over | 1,783 (100.0%) | 724 (40.6%) |
| Total | 10,542 (44.9%) | 13,553 (57.7%) |
Disability Status by Sex by Age in Grainger County
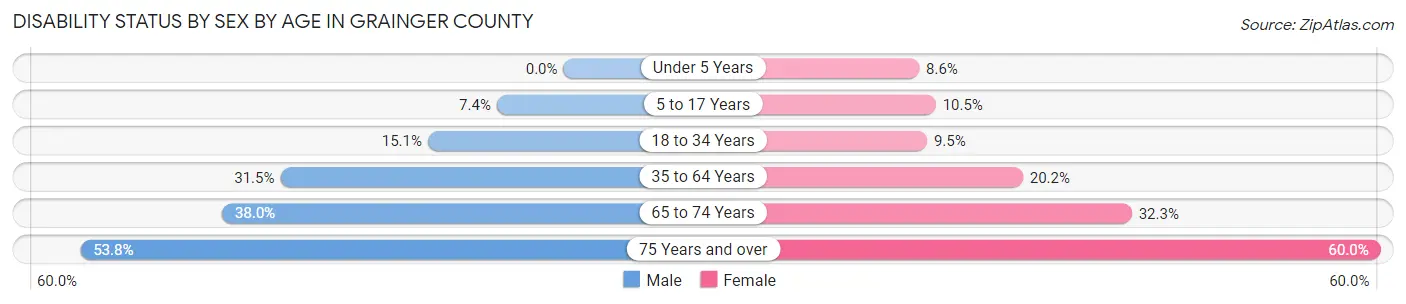
| Age Bracket | Male | Female |
| Under 5 Years | 0 (0.0%) | 46 (8.6%) |
| 5 to 17 Years | 143 (7.4%) | 169 (10.5%) |
| 18 to 34 Years | 341 (15.1%) | 204 (9.5%) |
| 35 to 64 Years | 1,532 (31.5%) | 973 (20.2%) |
| 65 to 74 Years | 573 (38.0%) | 485 (32.3%) |
| 75 Years and over | 432 (53.8%) | 588 (60.0%) |
Disability Class by Sex by Age in Grainger County
Disability Class: Hearing Difficulty
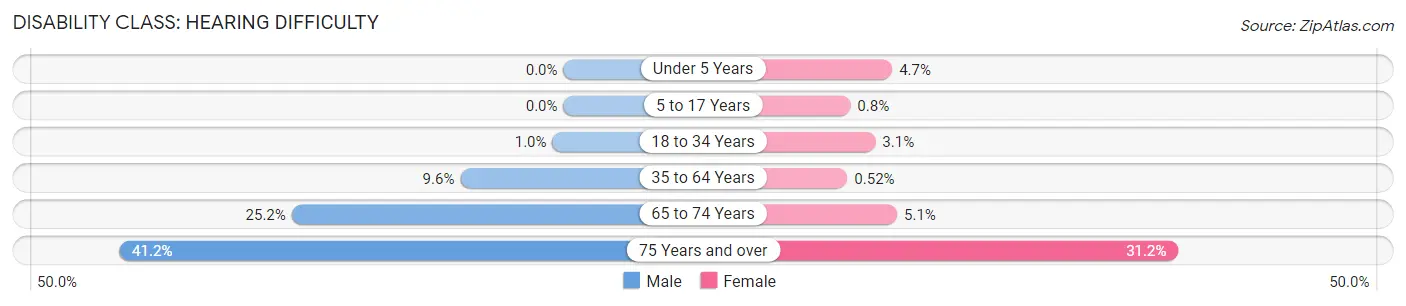
| Age Bracket | Male | Female |
| Under 5 Years | 0 (0.0%) | 25 (4.7%) |
| 5 to 17 Years | 0 (0.0%) | 13 (0.8%) |
| 18 to 34 Years | 23 (1.0%) | 67 (3.1%) |
| 35 to 64 Years | 465 (9.6%) | 25 (0.5%) |
| 65 to 74 Years | 380 (25.2%) | 77 (5.1%) |
| 75 Years and over | 331 (41.2%) | 306 (31.2%) |
Disability Class: Vision Difficulty
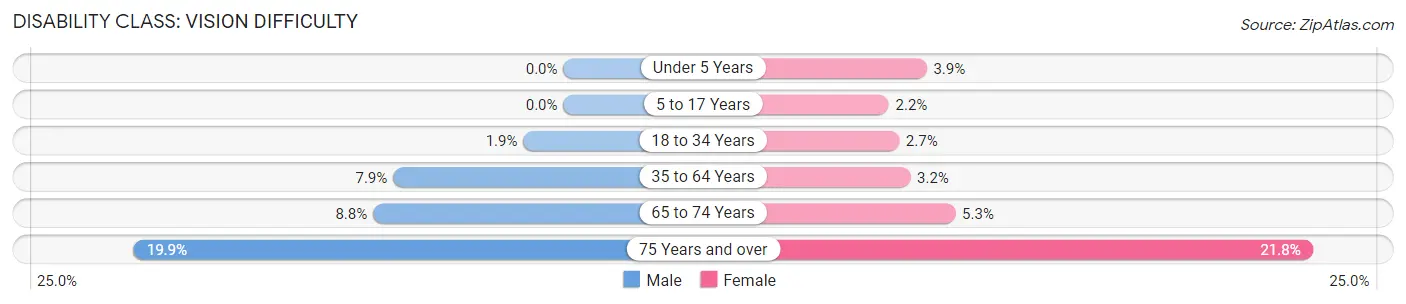
| Age Bracket | Male | Female |
| Under 5 Years | 0 (0.0%) | 21 (3.9%) |
| 5 to 17 Years | 0 (0.0%) | 35 (2.2%) |
| 18 to 34 Years | 42 (1.9%) | 57 (2.6%) |
| 35 to 64 Years | 384 (7.9%) | 153 (3.2%) |
| 65 to 74 Years | 133 (8.8%) | 79 (5.3%) |
| 75 Years and over | 160 (19.9%) | 214 (21.8%) |
Disability Class: Cognitive Difficulty
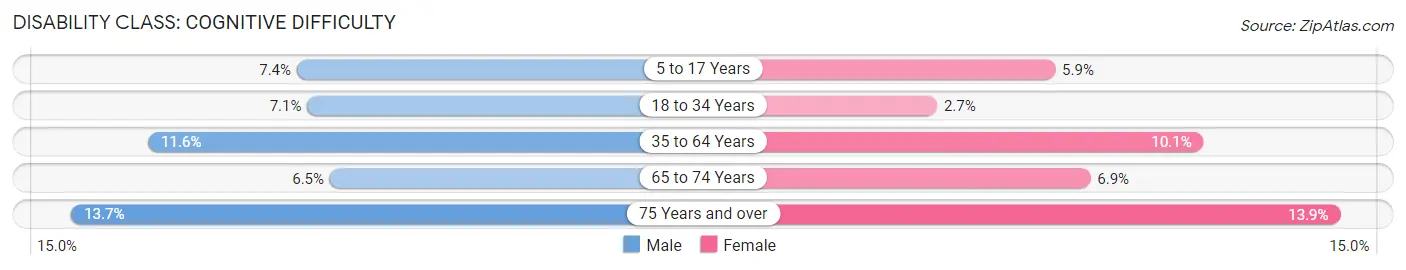
| Age Bracket | Male | Female |
| 5 to 17 Years | 143 (7.4%) | 96 (5.9%) |
| 18 to 34 Years | 161 (7.1%) | 57 (2.6%) |
| 35 to 64 Years | 562 (11.6%) | 486 (10.1%) |
| 65 to 74 Years | 98 (6.5%) | 104 (6.9%) |
| 75 Years and over | 110 (13.7%) | 136 (13.9%) |
Disability Class: Ambulatory Difficulty
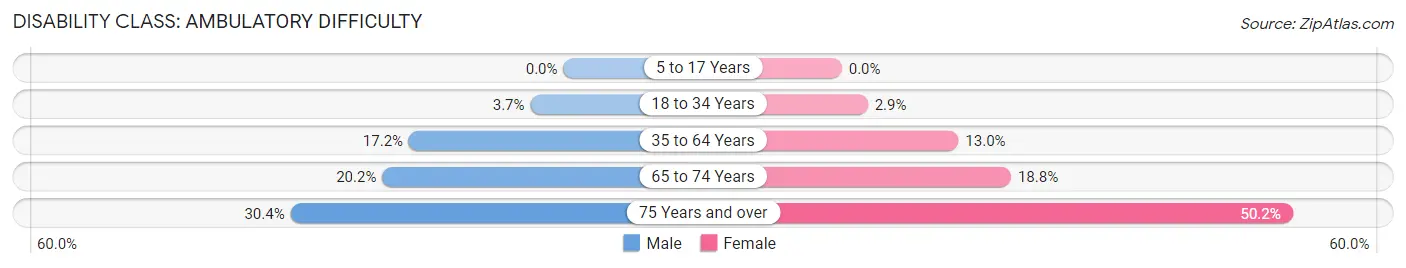
| Age Bracket | Male | Female |
| 5 to 17 Years | 0 (0.0%) | 0 (0.0%) |
| 18 to 34 Years | 83 (3.7%) | 62 (2.9%) |
| 35 to 64 Years | 836 (17.2%) | 627 (13.0%) |
| 65 to 74 Years | 304 (20.2%) | 283 (18.8%) |
| 75 Years and over | 244 (30.4%) | 492 (50.2%) |
Disability Class: Self-Care Difficulty
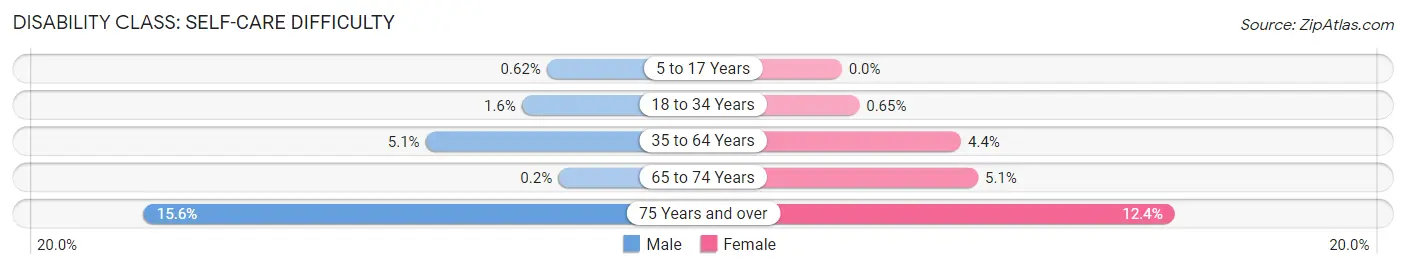
| Age Bracket | Male | Female |
| 5 to 17 Years | 12 (0.6%) | 0 (0.0%) |
| 18 to 34 Years | 35 (1.5%) | 14 (0.6%) |
| 35 to 64 Years | 249 (5.1%) | 214 (4.4%) |
| 65 to 74 Years | 3 (0.2%) | 76 (5.1%) |
| 75 Years and over | 125 (15.6%) | 121 (12.3%) |
Technology Access in Grainger County
Computing Device Access in Grainger County
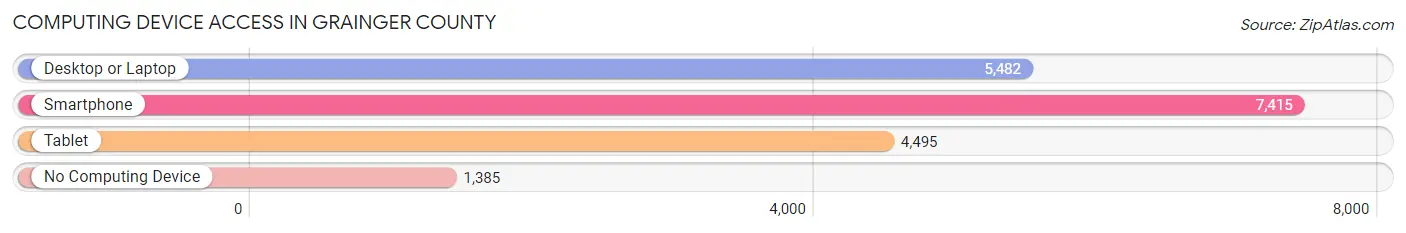
| Device Type | # Households | % Households |
| Desktop or Laptop | 5,482 | 58.4% |
| Smartphone | 7,415 | 79.0% |
| Tablet | 4,495 | 47.9% |
| No Computing Device | 1,385 | 14.8% |
| Total | 9,384 | 100.0% |
Internet Access in Grainger County
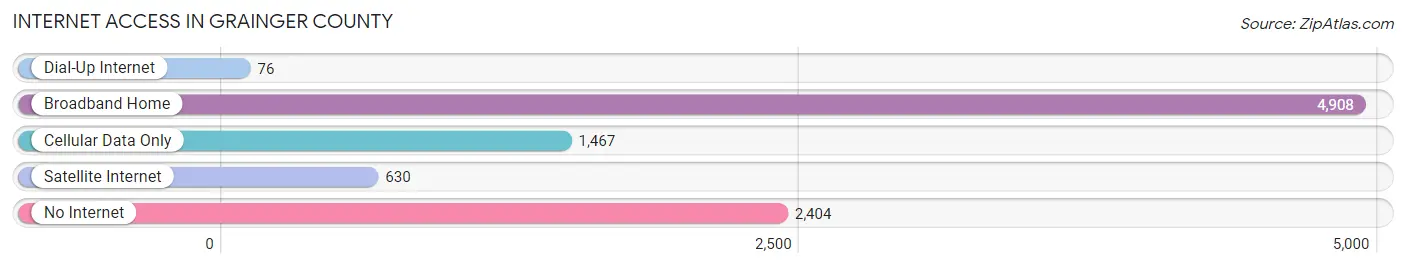
| Internet Type | # Households | % Households |
| Dial-Up Internet | 76 | 0.8% |
| Broadband Home | 4,908 | 52.3% |
| Cellular Data Only | 1,467 | 15.6% |
| Satellite Internet | 630 | 6.7% |
| No Internet | 2,404 | 25.6% |
| Total | 9,384 | 100.0% |
Grainger County Summary
Grainger County is located in the eastern part of Tennessee, in the Appalachian Mountains. It is bordered by Knox, Jefferson, Hamblen, Hawkins, and Union counties. The county seat is Rutledge, and the largest city is Bean Station. The county was established in 1796 and named for Mary Grainger Blount, the wife of William Blount, the first governor of Tennessee.
Geography
Grainger County is located in the Appalachian Mountains of East Tennessee. It is bordered by Knox, Jefferson, Hamblen, Hawkins, and Union counties. The county covers an area of 437 square miles, with a population of 22,657 as of the 2010 census. The terrain is mostly hilly, with elevations ranging from 800 to 1,800 feet above sea level. The Clinch River forms the northern border of the county, and the Holston River forms the eastern border. The county is home to several state parks, including Big Ridge State Park, Norris Dam State Park, and Panther Creek State Park.
Economy
The economy of Grainger County is largely based on agriculture and manufacturing. The county is home to several large farms, including the Grainger County Tomato Farm, which is the largest tomato farm in the United States. The county is also home to several manufacturing companies, including the Grainger County Chair Company, which produces wooden chairs, and the Grainger County Textile Company, which produces textiles.
Demographics
As of the 2010 census, the population of Grainger County was 22,657. The racial makeup of the county was 95.3% White, 2.2% African American, 0.3% Native American, 0.3% Asian, 0.1% Pacific Islander, 0.7% from other races, and 1.2% from two or more races. Hispanic or Latino of any race were 1.7% of the population.
The median income for a household in the county was $35,945, and the median income for a family was $41,945. The per capita income for the county was $17,845. About 15.2% of families and 18.2% of the population were below the poverty line, including 25.2% of those under age 18 and 14.2% of those age 65 or over.
Conclusion
Grainger County is a rural county located in the Appalachian Mountains of East Tennessee. It is home to several large farms and manufacturing companies, and its economy is largely based on agriculture and manufacturing. The population of the county is mostly white, with a small percentage of African Americans, Native Americans, Asians, and Pacific Islanders. The median income for a household in the county is lower than the national average, and the poverty rate is higher than the national average.
Common Questions
What is the Total Population of Grainger County?
Total Population of Grainger County is 23,648.
What is the Total Male Population of Grainger County?
Total Male Population of Grainger County is 11,960.
What is the Total Female Population of Grainger County?
Total Female Population of Grainger County is 11,688.
What is the Ratio of Males per 100 Females in Grainger County?
There are 102.33 Males per 100 Females in Grainger County.
What is the Ratio of Females per 100 Males in Grainger County?
There are 97.73 Females per 100 Males in Grainger County.
What is the Median Population Age in Grainger County?
Median Population Age in Grainger County is 45.6 Years.
What is the Average Family Size in Grainger County
Average Family Size in Grainger County is 3.1 People.
What is the Average Household Size in Grainger County
Average Household Size in Grainger County is 2.5 People.
What is Per Capita Income in Grainger County?
Per Capita income in Grainger County is $26,545.
What is the Median Family Income in Grainger County?
Median Family Income in Grainger County is $60,441.
What is the Median Household income in Grainger County?
Median Household Income in Grainger County is $47,098.
What is Income or Wage Gap in Grainger County?
Income or Wage Gap in Grainger County is 32.0%.
Women in Grainger County earn 68.0 cents for every dollar earned by a man.
What is Family Income Deficit in Grainger County?
Family Income Deficit in Grainger County is $8,998.
Families that are below poverty line in Grainger County earn $8,998 less on average than the poverty threshold level.
What is Inequality or Gini Index in Grainger County?
Inequality or Gini Index in Grainger County is 0.49.
How Large is the Labor Force in Grainger County?
There are 10,346 People in the Labor Forcein in Grainger County.
What is the Percentage of People in the Labor Force in Grainger County?
52.4% of People are in the Labor Force in Grainger County.
What is the Unemployment Rate in Grainger County?
Unemployment Rate in Grainger County is 5.8%.