Gibson County, TN
Gibson County Overview
50,455
TOTAL POPULATION
24,364
MALE POPULATION
26,091
FEMALE POPULATION
93.38
MALES / 100 FEMALES
107.09
FEMALES / 100 MALES
39.8
MEDIAN AGE
3.1
AVG FAMILY SIZE
2.5
AVG HOUSEHOLD SIZE
$27,742
PER CAPITA INCOME
$69,813
AVG FAMILY INCOME
$55,455
AVG HOUSEHOLD INCOME
23.3%
WAGE / INCOME GAP [ % ]
76.7¢/ $1
WAGE / INCOME GAP [ $ ]
$11,625
FAMILY INCOME DEFICIT
0.44
INEQUALITY / GINI INDEX
22,842
LABOR FORCE [ PEOPLE ]
57.7%
PERCENT IN LABOR FORCE
5.4%
UNEMPLOYMENT RATE
Gibson County Area Codes
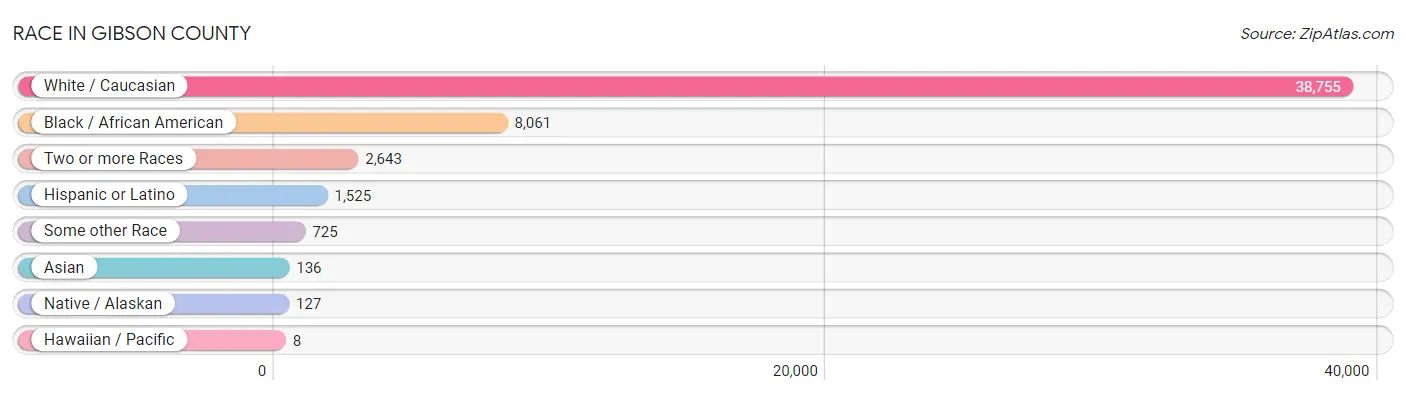
Race in Gibson County
The most populous races in Gibson County are White / Caucasian (38,755 | 76.8%), Black / African American (8,061 | 16.0%), and Two or more Races (2,643 | 5.2%).
| Race | # Population | % Population |
| Asian | 136 | 0.3% |
| Black / African American | 8,061 | 16.0% |
| Hawaiian / Pacific | 8 | 0.0% |
| Hispanic or Latino | 1,525 | 3.0% |
| Native / Alaskan | 127 | 0.3% |
| White / Caucasian | 38,755 | 76.8% |
| Two or more Races | 2,643 | 5.2% |
| Some other Race | 725 | 1.4% |
| Total | 50,455 | 100.0% |
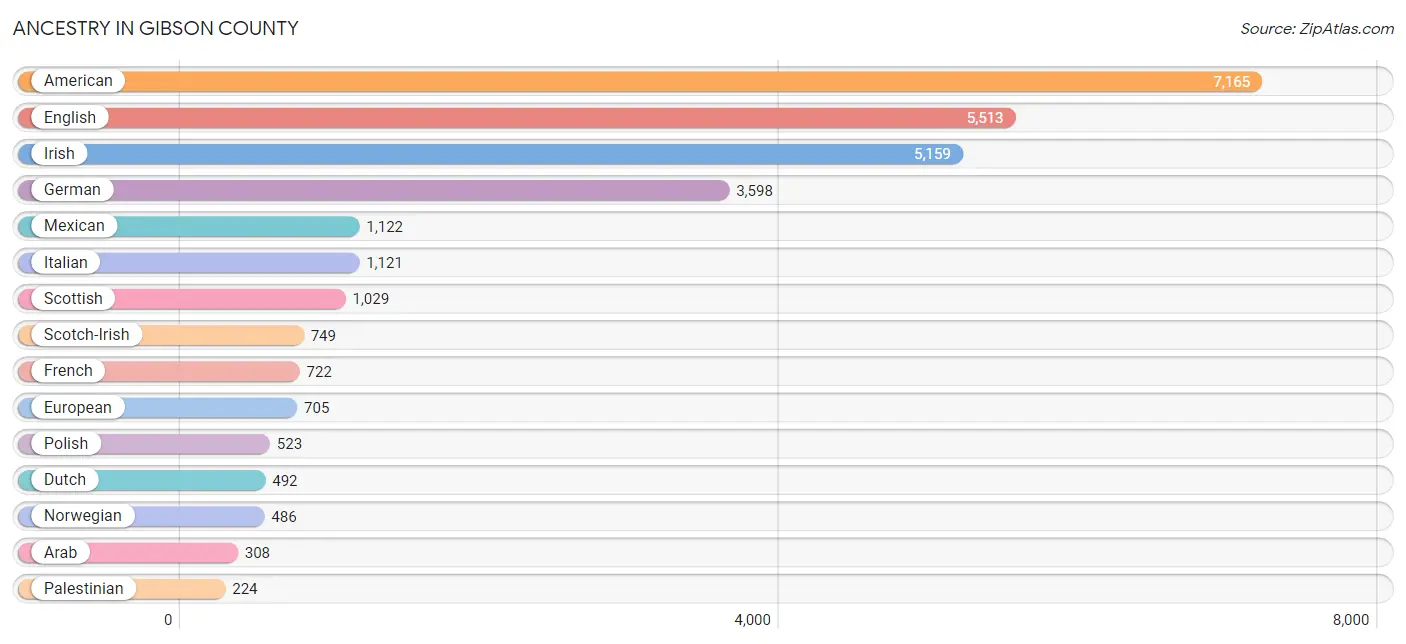
Ancestry in Gibson County
The most populous ancestries reported in Gibson County are American (7,165 | 14.2%), English (5,513 | 10.9%), Irish (5,159 | 10.2%), German (3,598 | 7.1%), and Mexican (1,122 | 2.2%), together accounting for 44.7% of all Gibson County residents.
| Ancestry | # Population | % Population |
| African | 42 | 0.1% |
| American | 7,165 | 14.2% |
| Apache | 18 | 0.0% |
| Arab | 308 | 0.6% |
| Argentinean | 11 | 0.0% |
| Austrian | 14 | 0.0% |
| Belizean | 10 | 0.0% |
| Bhutanese | 44 | 0.1% |
| Blackfeet | 15 | 0.0% |
| British | 100 | 0.2% |
| Burmese | 29 | 0.1% |
| Canadian | 80 | 0.2% |
| Central American | 156 | 0.3% |
| Cherokee | 205 | 0.4% |
| Choctaw | 11 | 0.0% |
| Cuban | 47 | 0.1% |
| Czech | 38 | 0.1% |
| Danish | 28 | 0.1% |
| Dominican | 7 | 0.0% |
| Dutch | 492 | 1.0% |
| Dutch West Indian | 29 | 0.1% |
| Eastern European | 39 | 0.1% |
| English | 5,513 | 10.9% |
| European | 705 | 1.4% |
| Finnish | 12 | 0.0% |
| French | 722 | 1.4% |
| French Canadian | 8 | 0.0% |
| German | 3,598 | 7.1% |
| Greek | 121 | 0.2% |
| Guamanian / Chamorro | 1 | 0.0% |
| Guatemalan | 90 | 0.2% |
| Haitian | 7 | 0.0% |
| Honduran | 2 | 0.0% |
| Houma | 2 | 0.0% |
| Hungarian | 34 | 0.1% |
| Indian (Asian) | 59 | 0.1% |
| Irish | 5,159 | 10.2% |
| Italian | 1,121 | 2.2% |
| Jamaican | 13 | 0.0% |
| Korean | 88 | 0.2% |
| Lebanese | 27 | 0.1% |
| Lithuanian | 17 | 0.0% |
| Malaysian | 16 | 0.0% |
| Mexican | 1,122 | 2.2% |
| Nigerian | 11 | 0.0% |
| Norwegian | 486 | 1.0% |
| Osage | 5 | 0.0% |
| Palestinian | 224 | 0.4% |
| Peruvian | 44 | 0.1% |
| Polish | 523 | 1.0% |
| Portuguese | 3 | 0.0% |
| Potawatomi | 1 | 0.0% |
| Puerto Rican | 25 | 0.1% |
| Russian | 13 | 0.0% |
| Salvadoran | 64 | 0.1% |
| Scandinavian | 136 | 0.3% |
| Scotch-Irish | 749 | 1.5% |
| Scottish | 1,029 | 2.0% |
| Seminole | 14 | 0.0% |
| Serbian | 10 | 0.0% |
| Sioux | 6 | 0.0% |
| Slavic | 10 | 0.0% |
| South American | 55 | 0.1% |
| Spaniard | 51 | 0.1% |
| Spanish | 41 | 0.1% |
| Subsaharan African | 53 | 0.1% |
| Swedish | 97 | 0.2% |
| Swiss | 75 | 0.2% |
| Thai | 12 | 0.0% |
| Vietnamese | 19 | 0.0% |
| Welsh | 135 | 0.3% | View All 71 Rows |
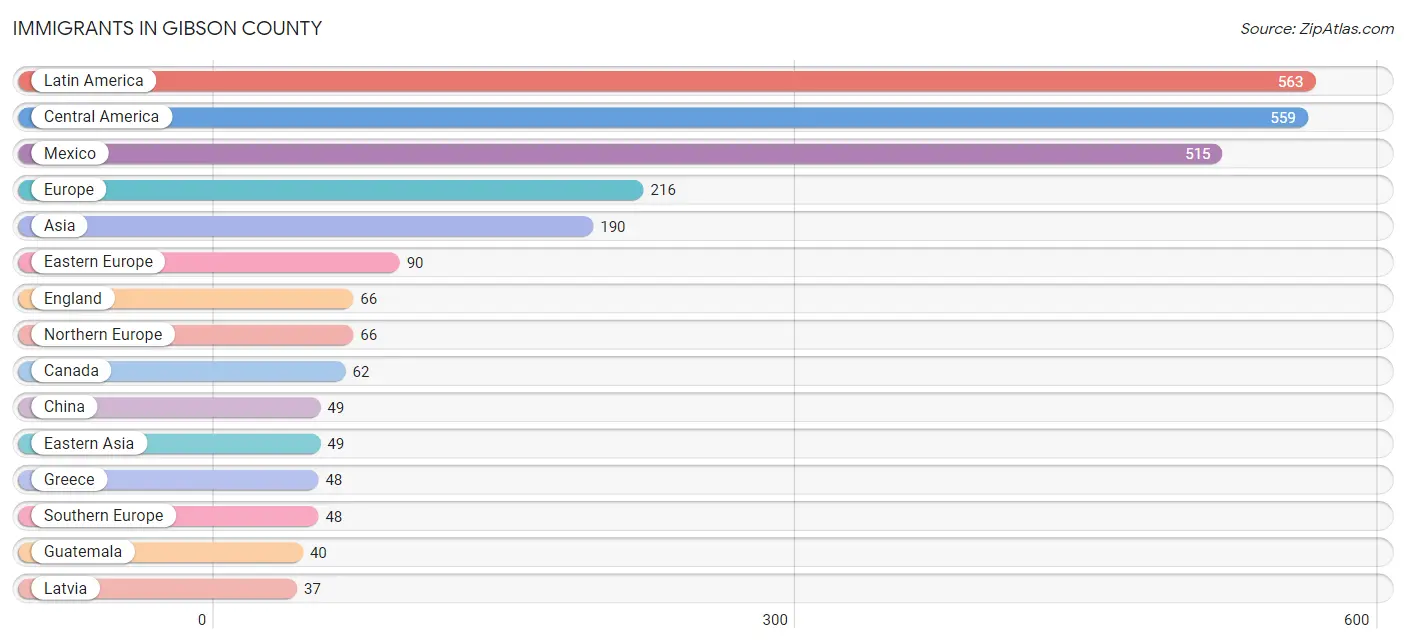
Immigrants in Gibson County
The most numerous immigrant groups reported in Gibson County came from Latin America (563 | 1.1%), Central America (559 | 1.1%), Mexico (515 | 1.0%), Europe (216 | 0.4%), and Asia (190 | 0.4%), together accounting for 4.1% of all Gibson County residents.
| Immigration Origin | # Population | % Population |
| Asia | 190 | 0.4% |
| Bangladesh | 19 | 0.0% |
| Canada | 62 | 0.1% |
| Caribbean | 1 | 0.0% |
| Central America | 559 | 1.1% |
| China | 49 | 0.1% |
| Costa Rica | 4 | 0.0% |
| Dominican Republic | 1 | 0.0% |
| Eastern Asia | 49 | 0.1% |
| Eastern Europe | 90 | 0.2% |
| England | 66 | 0.1% |
| Europe | 216 | 0.4% |
| Germany | 12 | 0.0% |
| Greece | 48 | 0.1% |
| Guatemala | 40 | 0.1% |
| India | 12 | 0.0% |
| Laos | 11 | 0.0% |
| Latin America | 563 | 1.1% |
| Latvia | 37 | 0.1% |
| Lithuania | 17 | 0.0% |
| Mexico | 515 | 1.0% |
| Micronesia | 1 | 0.0% |
| Northern Europe | 66 | 0.1% |
| Oceania | 1 | 0.0% |
| Peru | 3 | 0.0% |
| Philippines | 25 | 0.1% |
| Russia | 36 | 0.1% |
| South America | 3 | 0.0% |
| South Central Asia | 31 | 0.1% |
| South Eastern Asia | 36 | 0.1% |
| Southern Europe | 48 | 0.1% |
| Western Europe | 12 | 0.0% | View All 32 Rows |
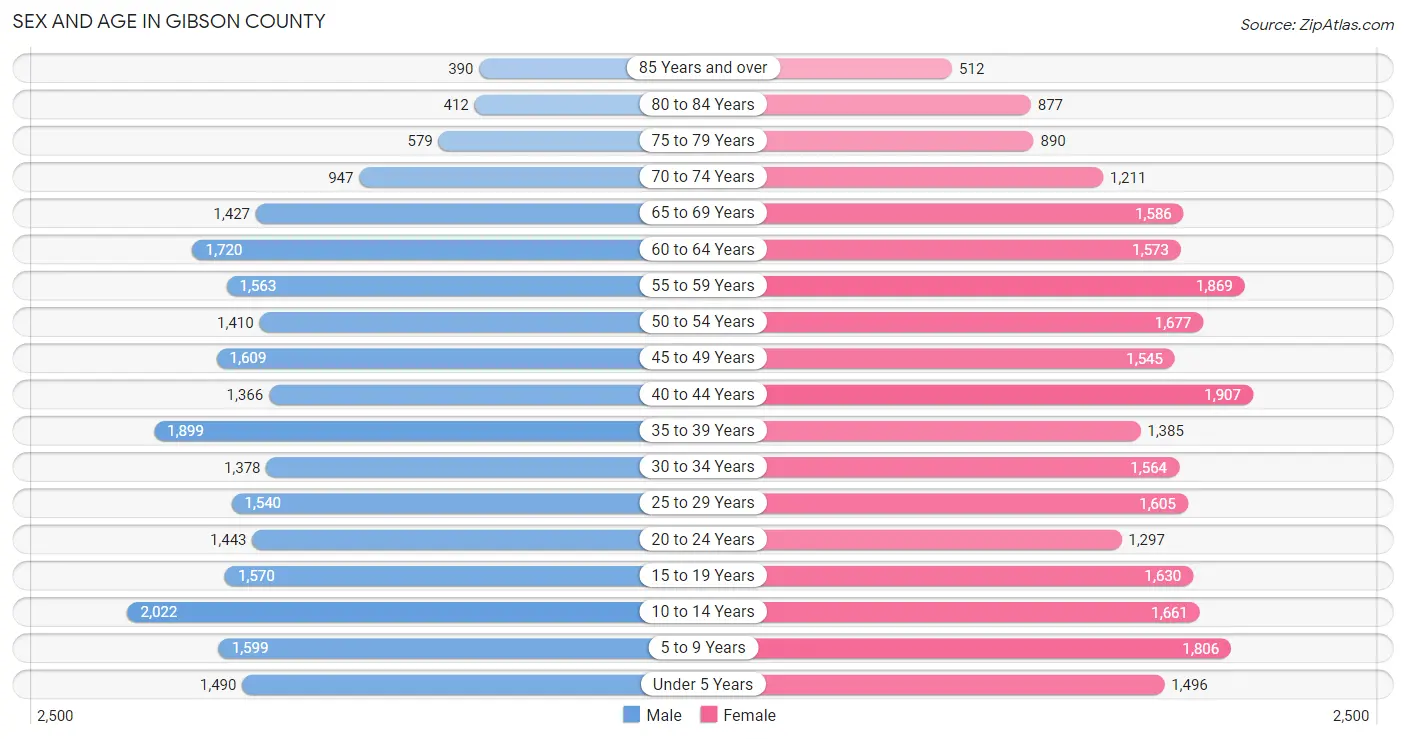
Sex and Age in Gibson County
Sex and Age in Gibson County
The most populous age groups in Gibson County are 10 to 14 Years (2,022 | 8.3%) for men and 40 to 44 Years (1,907 | 7.3%) for women.
| Age Bracket | Male | Female |
| Under 5 Years | 1,490 (6.1%) | 1,496 (5.7%) |
| 5 to 9 Years | 1,599 (6.6%) | 1,806 (6.9%) |
| 10 to 14 Years | 2,022 (8.3%) | 1,661 (6.4%) |
| 15 to 19 Years | 1,570 (6.4%) | 1,630 (6.2%) |
| 20 to 24 Years | 1,443 (5.9%) | 1,297 (5.0%) |
| 25 to 29 Years | 1,540 (6.3%) | 1,605 (6.1%) |
| 30 to 34 Years | 1,378 (5.7%) | 1,564 (6.0%) |
| 35 to 39 Years | 1,899 (7.8%) | 1,385 (5.3%) |
| 40 to 44 Years | 1,366 (5.6%) | 1,907 (7.3%) |
| 45 to 49 Years | 1,609 (6.6%) | 1,545 (5.9%) |
| 50 to 54 Years | 1,410 (5.8%) | 1,677 (6.4%) |
| 55 to 59 Years | 1,563 (6.4%) | 1,869 (7.2%) |
| 60 to 64 Years | 1,720 (7.1%) | 1,573 (6.0%) |
| 65 to 69 Years | 1,427 (5.9%) | 1,586 (6.1%) |
| 70 to 74 Years | 947 (3.9%) | 1,211 (4.6%) |
| 75 to 79 Years | 579 (2.4%) | 890 (3.4%) |
| 80 to 84 Years | 412 (1.7%) | 877 (3.4%) |
| 85 Years and over | 390 (1.6%) | 512 (2.0%) |
| Total | 24,364 (100.0%) | 26,091 (100.0%) |
Families and Households in Gibson County
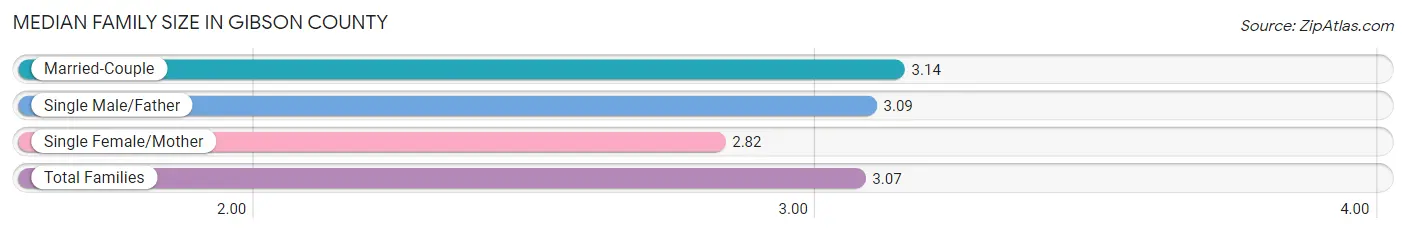
Median Family Size in Gibson County
The median family size in Gibson County is 3.07 persons per family, with married-couple families (9,778 | 73.6%) accounting for the largest median family size of 3.14 persons per family. On the other hand, single female/mother families (2,670 | 20.1%) represent the smallest median family size with 2.82 persons per family.
| Family Type | # Families | Family Size |
| Married-Couple | 9,778 (73.6%) | 3.14 |
| Single Male/Father | 838 (6.3%) | 3.09 |
| Single Female/Mother | 2,670 (20.1%) | 2.82 |
| Total Families | 13,286 (100.0%) | 3.07 |
Median Household Size in Gibson County
The median household size in Gibson County is 2.48 persons per household, with single male/father households (838 | 4.2%) accounting for the largest median household size of 3.19 persons per household. non-family households (6,662 | 33.4%) represent the smallest median household size with 1.16 persons per household.

| Household Type | # Households | Household Size |
| Married-Couple | 9,778 (49.0%) | 3.16 |
| Single Male/Father | 838 (4.2%) | 3.19 |
| Single Female/Mother | 2,670 (13.4%) | 3.04 |
| Non-family | 6,662 (33.4%) | 1.16 |
| Total Households | 19,948 (100.0%) | 2.48 |
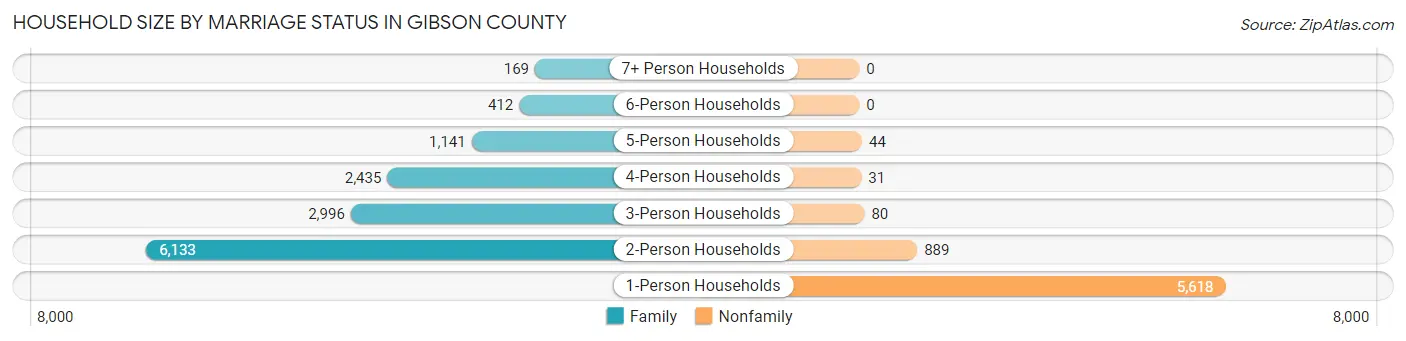
Household Size by Marriage Status in Gibson County
Out of a total of 19,948 households in Gibson County, 13,286 (66.6%) are family households, while 6,662 (33.4%) are nonfamily households. The most numerous type of family households are 2-person households, comprising 6,133, and the most common type of nonfamily households are 1-person households, comprising 5,618.
| Household Size | Family Households | Nonfamily Households |
| 1-Person Households | - | 5,618 (28.2%) |
| 2-Person Households | 6,133 (30.7%) | 889 (4.5%) |
| 3-Person Households | 2,996 (15.0%) | 80 (0.4%) |
| 4-Person Households | 2,435 (12.2%) | 31 (0.2%) |
| 5-Person Households | 1,141 (5.7%) | 44 (0.2%) |
| 6-Person Households | 412 (2.1%) | 0 (0.0%) |
| 7+ Person Households | 169 (0.9%) | 0 (0.0%) |
| Total | 13,286 (66.6%) | 6,662 (33.4%) |
Female Fertility in Gibson County
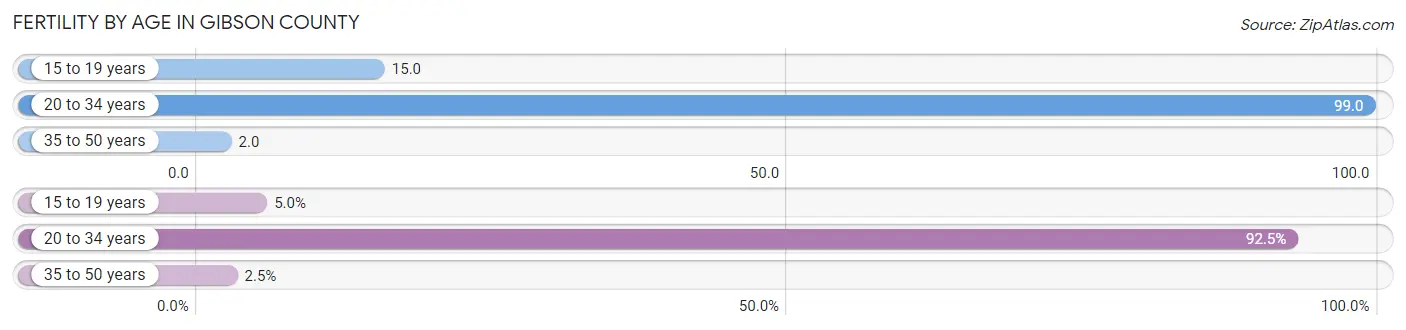
Fertility by Age in Gibson County
Average fertility rate in Gibson County is 42.0 births per 1,000 women. Women in the age bracket of 20 to 34 years have the highest fertility rate with 99.0 births per 1,000 women. Women in the age bracket of 20 to 34 years acount for 92.5% of all women with births.
| Age Bracket | Women with Births | Births / 1,000 Women |
| 15 to 19 years | 24 (5.0%) | 15.0 |
| 20 to 34 years | 442 (92.5%) | 99.0 |
| 35 to 50 years | 12 (2.5%) | 2.0 |
| Total | 478 (100.0%) | 42.0 |
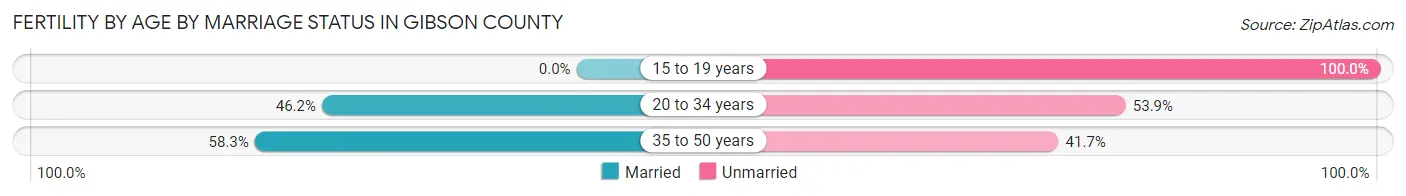
Fertility by Age by Marriage Status in Gibson County
44.1% of women with births (478) in Gibson County are married. The highest percentage of unmarried women with births falls into 15 to 19 years age bracket with 100.0% of them unmarried at the time of birth, while the lowest percentage of unmarried women with births belong to 35 to 50 years age bracket with 41.7% of them unmarried.
| Age Bracket | Married | Unmarried |
| 15 to 19 years | 0 (0.0%) | 24 (100.0%) |
| 20 to 34 years | 204 (46.2%) | 238 (53.8%) |
| 35 to 50 years | 7 (58.3%) | 5 (41.7%) |
| Total | 211 (44.1%) | 267 (55.9%) |
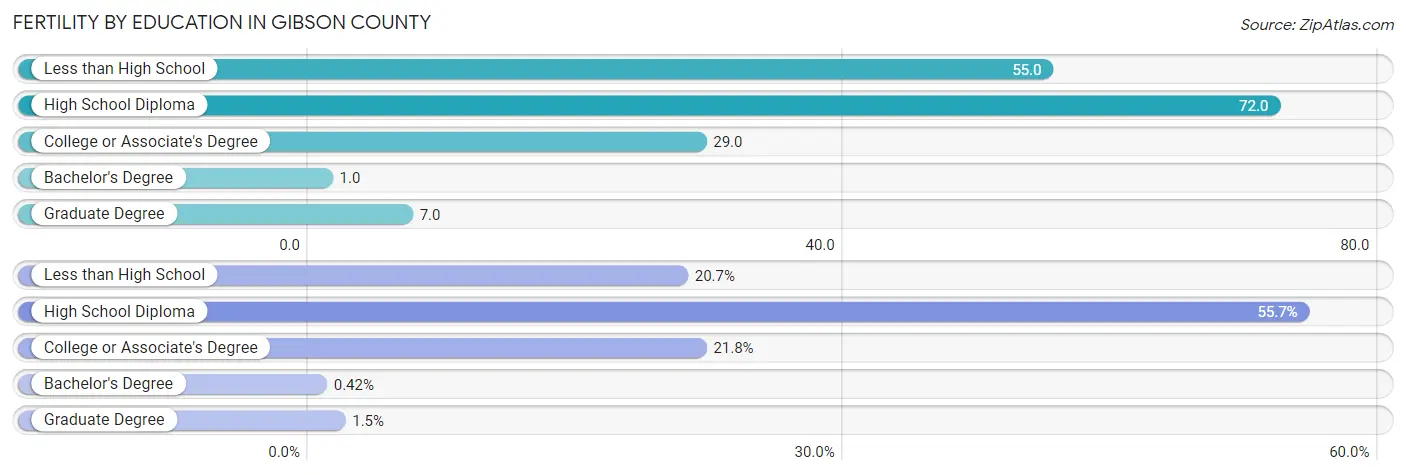
Fertility by Education in Gibson County
Average fertility rate in Gibson County is 42.0 births per 1,000 women. Women with the education attainment of high school diploma have the highest fertility rate of 72.0 births per 1,000 women, while women with the education attainment of bachelor's degree have the lowest fertility at 1.0 births per 1,000 women. Women with the education attainment of high school diploma represent 55.6% of all women with births.
| Educational Attainment | Women with Births | Births / 1,000 Women |
| Less than High School | 99 (20.7%) | 55.0 |
| High School Diploma | 266 (55.6%) | 72.0 |
| College or Associate's Degree | 104 (21.8%) | 29.0 |
| Bachelor's Degree | 2 (0.4%) | 1.0 |
| Graduate Degree | 7 (1.5%) | 7.0 |
| Total | 478 (100.0%) | 42.0 |
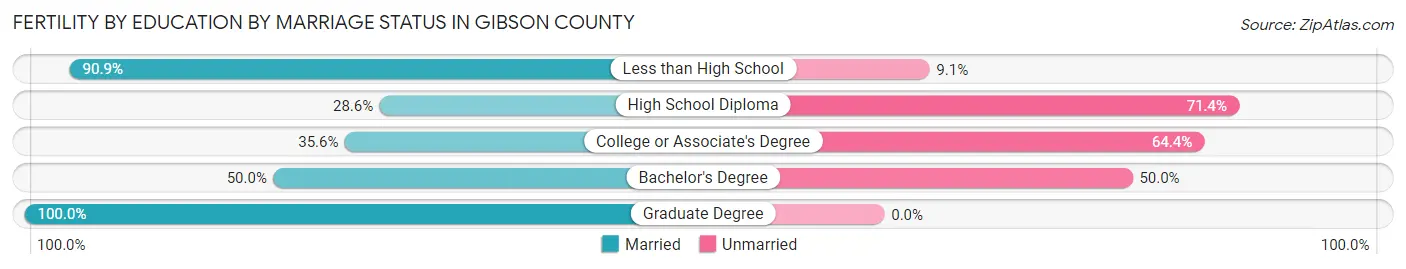
Fertility by Education by Marriage Status in Gibson County
55.9% of women with births in Gibson County are unmarried. Women with the educational attainment of graduate degree are most likely to be married with 100.0% of them married at childbirth, while women with the educational attainment of high school diploma are least likely to be married with 71.4% of them unmarried at childbirth.
| Educational Attainment | Married | Unmarried |
| Less than High School | 90 (90.9%) | 9 (9.1%) |
| High School Diploma | 76 (28.6%) | 190 (71.4%) |
| College or Associate's Degree | 37 (35.6%) | 67 (64.4%) |
| Bachelor's Degree | 1 (50.0%) | 1 (50.0%) |
| Graduate Degree | 7 (100.0%) | 0 (0.0%) |
| Total | 211 (44.1%) | 267 (55.9%) |
Income in Gibson County
Income Overview in Gibson County
Per Capita Income in Gibson County is $27,742, while median incomes of families and households are $69,813 and $55,455 respectively.
| Characteristic | Number | Measure |
| Per Capita Income | 50,455 | $27,742 |
| Median Family Income | 13,286 | $69,813 |
| Mean Family Income | 13,286 | $85,097 |
| Median Household Income | 19,948 | $55,455 |
| Mean Household Income | 19,948 | $69,347 |
| Income Deficit | 13,286 | $11,625 |
| Wage / Income Gap (%) | 50,455 | 23.31% |
| Wage / Income Gap ($) | 50,455 | 76.69¢ per $1 |
| Gini / Inequality Index | 50,455 | 0.44 |
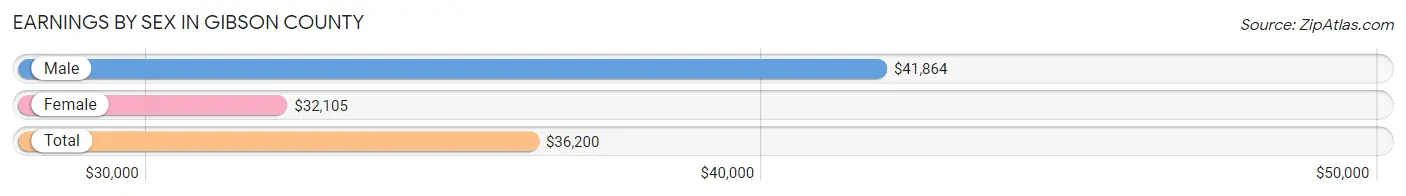
Earnings by Sex in Gibson County
Average Earnings in Gibson County are $36,200, $41,864 for men and $32,105 for women, a difference of 23.3%.
| Sex | Number | Average Earnings |
| Male | 12,494 (52.0%) | $41,864 |
| Female | 11,537 (48.0%) | $32,105 |
| Total | 24,031 (100.0%) | $36,200 |
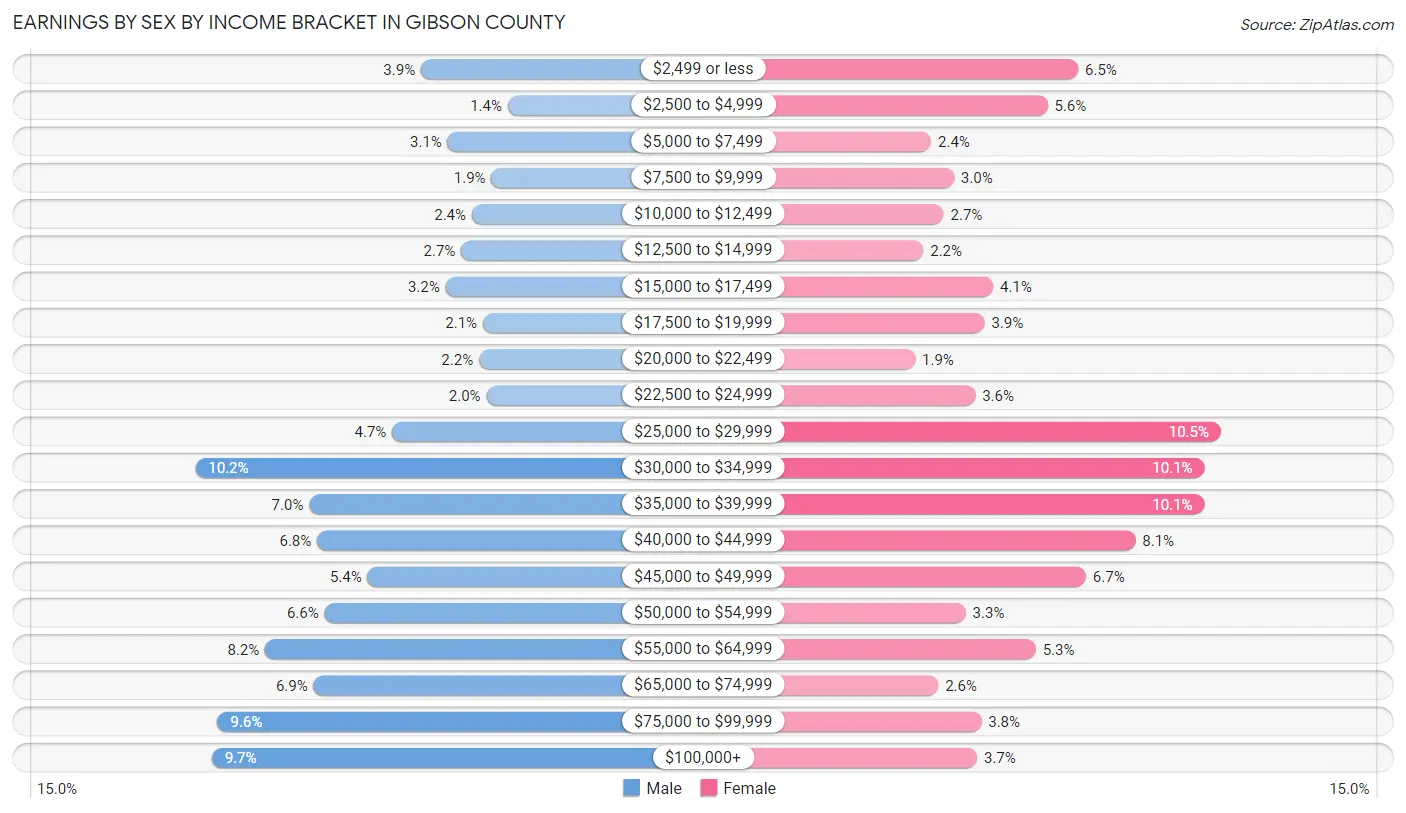
Earnings by Sex by Income Bracket in Gibson County
The most common earnings brackets in Gibson County are $30,000 to $34,999 for men (1,275 | 10.2%) and $25,000 to $29,999 for women (1,212 | 10.5%).
| Income | Male | Female |
| $2,499 or less | 482 (3.9%) | 750 (6.5%) |
| $2,500 to $4,999 | 178 (1.4%) | 651 (5.6%) |
| $5,000 to $7,499 | 389 (3.1%) | 274 (2.4%) |
| $7,500 to $9,999 | 235 (1.9%) | 347 (3.0%) |
| $10,000 to $12,499 | 304 (2.4%) | 314 (2.7%) |
| $12,500 to $14,999 | 341 (2.7%) | 248 (2.1%) |
| $15,000 to $17,499 | 396 (3.2%) | 474 (4.1%) |
| $17,500 to $19,999 | 265 (2.1%) | 447 (3.9%) |
| $20,000 to $22,499 | 278 (2.2%) | 222 (1.9%) |
| $22,500 to $24,999 | 253 (2.0%) | 417 (3.6%) |
| $25,000 to $29,999 | 584 (4.7%) | 1,212 (10.5%) |
| $30,000 to $34,999 | 1,275 (10.2%) | 1,159 (10.1%) |
| $35,000 to $39,999 | 874 (7.0%) | 1,159 (10.1%) |
| $40,000 to $44,999 | 847 (6.8%) | 936 (8.1%) |
| $45,000 to $49,999 | 670 (5.4%) | 775 (6.7%) |
| $50,000 to $54,999 | 821 (6.6%) | 385 (3.3%) |
| $55,000 to $64,999 | 1,029 (8.2%) | 613 (5.3%) |
| $65,000 to $74,999 | 859 (6.9%) | 296 (2.6%) |
| $75,000 to $99,999 | 1,197 (9.6%) | 436 (3.8%) |
| $100,000+ | 1,217 (9.7%) | 422 (3.7%) |
| Total | 12,494 (100.0%) | 11,537 (100.0%) |
Earnings by Sex by Educational Attainment in Gibson County
Average earnings in Gibson County are $45,299 for men and $34,783 for women, a difference of 23.2%. Men with an educational attainment of graduate degree enjoy the highest average annual earnings of $82,470, while those with less than high school education earn the least with $31,287. Women with an educational attainment of graduate degree earn the most with the average annual earnings of $53,005, while those with less than high school education have the smallest earnings of $25,550.
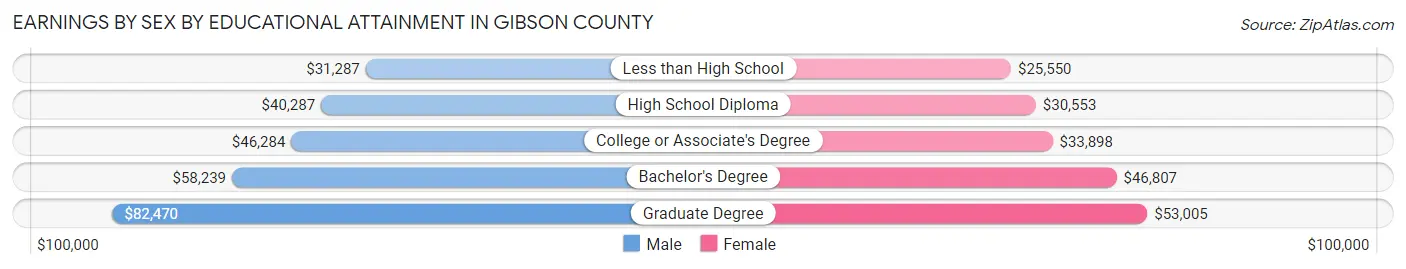
| Educational Attainment | Male Income | Female Income |
| Less than High School | $31,287 | $25,550 |
| High School Diploma | $40,287 | $30,553 |
| College or Associate's Degree | $46,284 | $33,898 |
| Bachelor's Degree | $58,239 | $46,807 |
| Graduate Degree | $82,470 | $53,005 |
| Total | $45,299 | $34,783 |
Family Income in Gibson County
Family Income Brackets in Gibson County
According to the Gibson County family income data, there are 2,724 families falling into the $100,000 to $149,999 income range, which is the most common income bracket and makes up 20.5% of all families. Conversely, the $10,000 to $14,999 income bracket is the least frequent group with only 146 families (1.1%) belonging to this category.
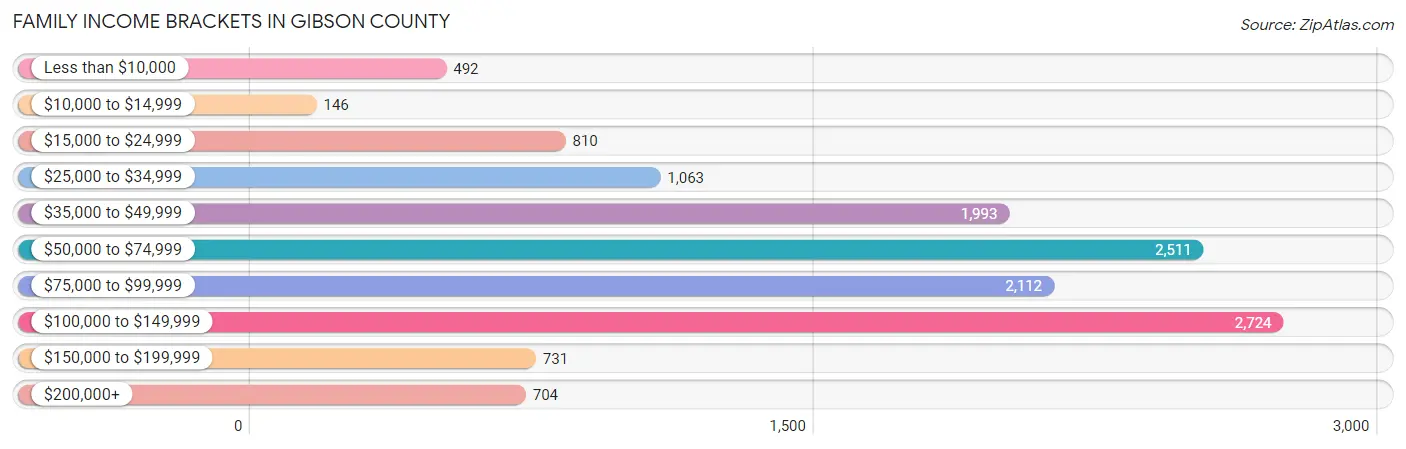
| Income Bracket | # Families | % Families |
| Less than $10,000 | 492 | 3.7% |
| $10,000 to $14,999 | 146 | 1.1% |
| $15,000 to $24,999 | 810 | 6.1% |
| $25,000 to $34,999 | 1,063 | 8.0% |
| $35,000 to $49,999 | 1,993 | 15.0% |
| $50,000 to $74,999 | 2,511 | 18.9% |
| $75,000 to $99,999 | 2,112 | 15.9% |
| $100,000 to $149,999 | 2,724 | 20.5% |
| $150,000 to $199,999 | 731 | 5.5% |
| $200,000+ | 704 | 5.3% |
Family Income by Famaliy Size in Gibson County
6-person families (399 | 3.0%) account for the highest median family income in Gibson County with $116,430 per family, while 2-person families (6,513 | 49.0%) have the highest median income of $31,324 per family member.
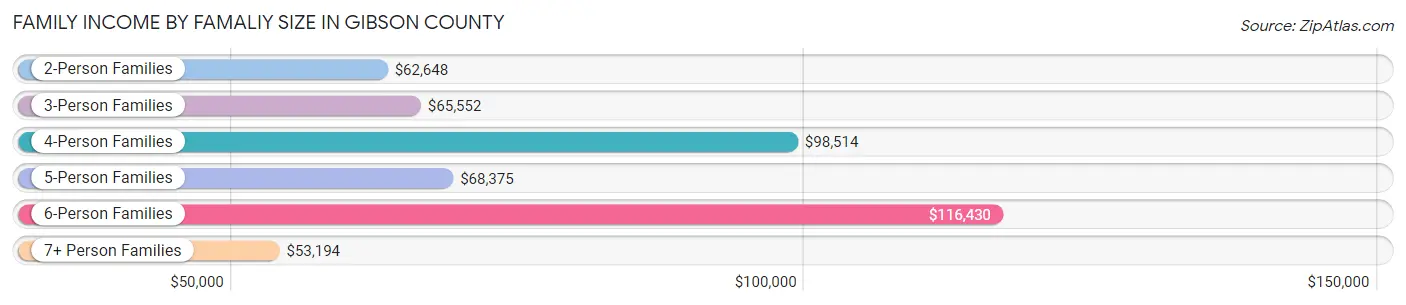
| Income Bracket | # Families | Median Income |
| 2-Person Families | 6,513 (49.0%) | $62,648 |
| 3-Person Families | 2,899 (21.8%) | $65,552 |
| 4-Person Families | 2,187 (16.5%) | $98,514 |
| 5-Person Families | 1,147 (8.6%) | $68,375 |
| 6-Person Families | 399 (3.0%) | $116,430 |
| 7+ Person Families | 141 (1.1%) | $53,194 |
| Total | 13,286 (100.0%) | $69,813 |
Family Income by Number of Earners in Gibson County
The median family income in Gibson County is $69,813, with families comprising 3+ earners (1,231) having the highest median family income of $120,262, while families with no earners (2,040) have the lowest median family income of $42,292, accounting for 9.3% and 15.3% of families, respectively.
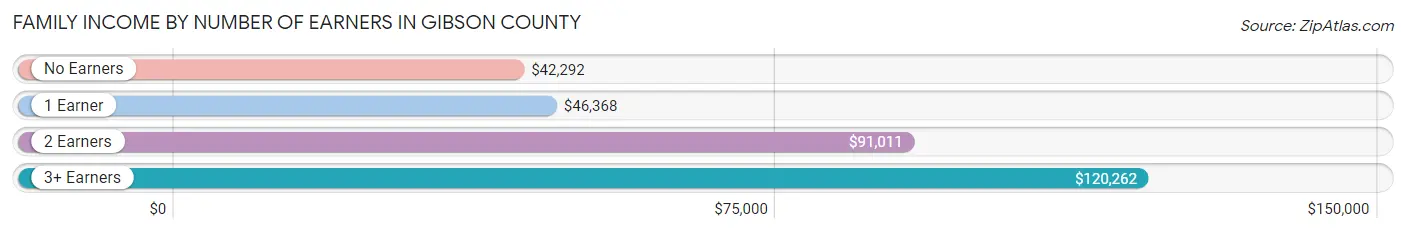
| Number of Earners | # Families | Median Income |
| No Earners | 2,040 (15.3%) | $42,292 |
| 1 Earner | 4,775 (35.9%) | $46,368 |
| 2 Earners | 5,240 (39.4%) | $91,011 |
| 3+ Earners | 1,231 (9.3%) | $120,262 |
| Total | 13,286 (100.0%) | $69,813 |
Household Income in Gibson County
Household Income Brackets in Gibson County
With 3,451 households falling in the category, the $50,000 to $74,999 income range is the most frequent in Gibson County, accounting for 17.3% of all households. In contrast, only 718 households (3.6%) fall into the $200,000+ income bracket, making it the least populous group.
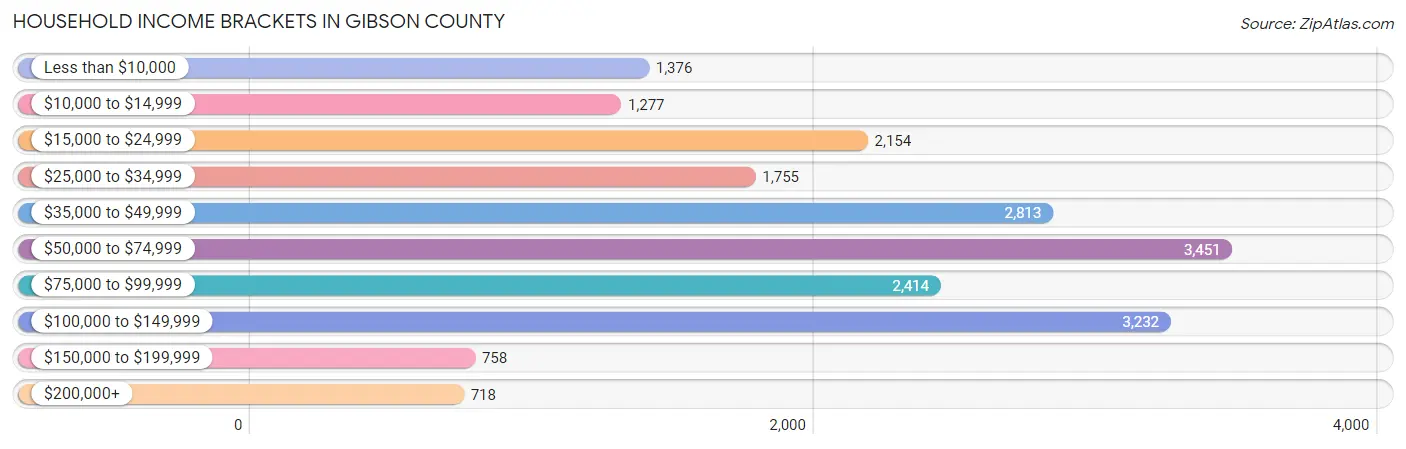
| Income Bracket | # Households | % Households |
| Less than $10,000 | 1,376 | 6.9% |
| $10,000 to $14,999 | 1,277 | 6.4% |
| $15,000 to $24,999 | 2,154 | 10.8% |
| $25,000 to $34,999 | 1,755 | 8.8% |
| $35,000 to $49,999 | 2,813 | 14.1% |
| $50,000 to $74,999 | 3,451 | 17.3% |
| $75,000 to $99,999 | 2,414 | 12.1% |
| $100,000 to $149,999 | 3,232 | 16.2% |
| $150,000 to $199,999 | 758 | 3.8% |
| $200,000+ | 718 | 3.6% |
Household Income by Householder Age in Gibson County
The median household income in Gibson County is $55,455, with the highest median household income of $60,971 found in the 25 to 44 years age bracket for the primary householder. A total of 6,379 households (32.0%) fall into this category. Meanwhile, the 65+ years age bracket for the primary householder has the lowest median household income of $41,705, with 5,381 households (27.0%) in this group.
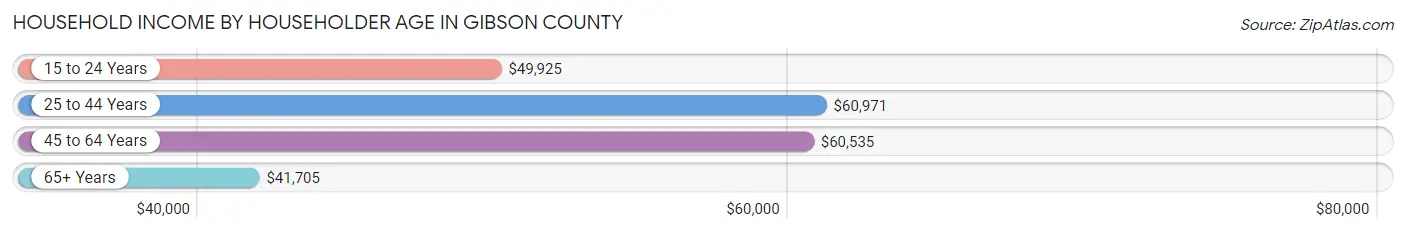
| Income Bracket | # Households | Median Income |
| 15 to 24 Years | 620 (3.1%) | $49,925 |
| 25 to 44 Years | 6,379 (32.0%) | $60,971 |
| 45 to 64 Years | 7,568 (37.9%) | $60,535 |
| 65+ Years | 5,381 (27.0%) | $41,705 |
| Total | 19,948 (100.0%) | $55,455 |
Poverty in Gibson County
Income Below Poverty by Sex and Age in Gibson County
With 13.5% poverty level for males and 14.3% for females among the residents of Gibson County, under 5 year old males and under 5 year old females are the most vulnerable to poverty, with 425 males (28.5%) and 303 females (20.3%) in their respective age groups living below the poverty level.
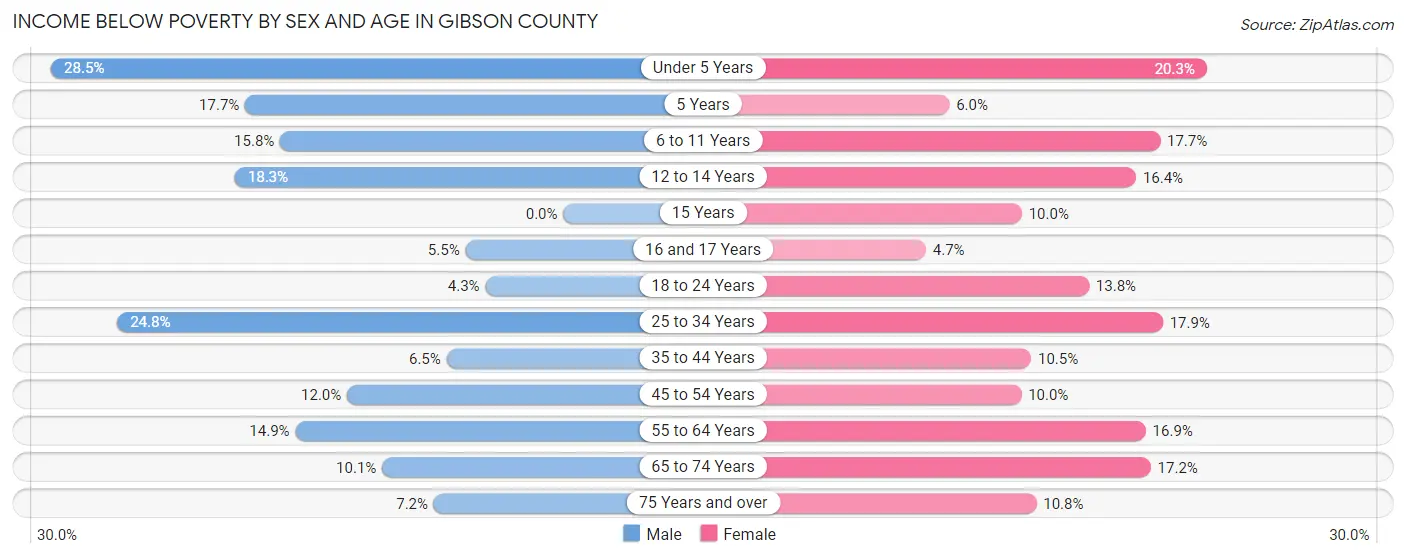
| Age Bracket | Male | Female |
| Under 5 Years | 425 (28.5%) | 303 (20.3%) |
| 5 Years | 59 (17.7%) | 29 (6.0%) |
| 6 to 11 Years | 333 (15.8%) | 361 (17.7%) |
| 12 to 14 Years | 199 (18.3%) | 141 (16.4%) |
| 15 Years | 0 (0.0%) | 42 (10.0%) |
| 16 and 17 Years | 36 (5.4%) | 31 (4.7%) |
| 18 to 24 Years | 84 (4.3%) | 252 (13.8%) |
| 25 to 34 Years | 708 (24.8%) | 563 (17.9%) |
| 35 to 44 Years | 207 (6.5%) | 345 (10.5%) |
| 45 to 54 Years | 356 (12.0%) | 319 (10.0%) |
| 55 to 64 Years | 486 (14.9%) | 579 (16.9%) |
| 65 to 74 Years | 234 (10.1%) | 466 (17.2%) |
| 75 Years and over | 86 (7.2%) | 220 (10.8%) |
| Total | 3,213 (13.5%) | 3,651 (14.3%) |
Income Above Poverty by Sex and Age in Gibson County
According to the poverty statistics in Gibson County, males aged 15 years and females aged 16 and 17 years are the age groups that are most secure financially, with 100.0% of males and 95.3% of females in these age groups living above the poverty line.
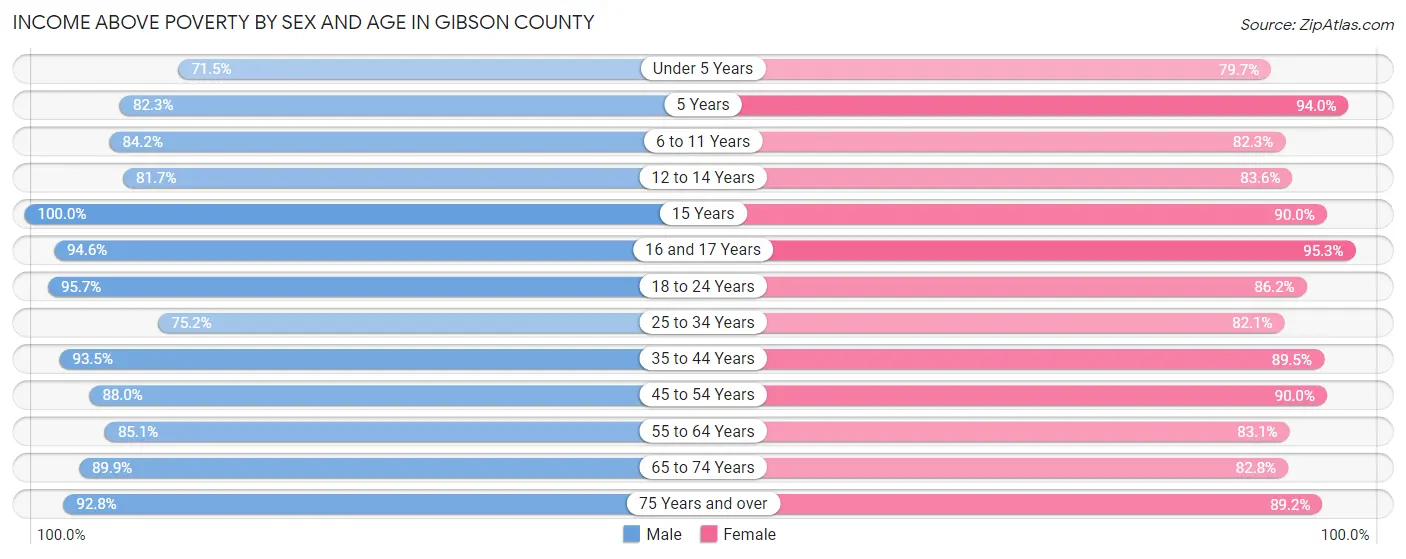
| Age Bracket | Male | Female |
| Under 5 Years | 1,065 (71.5%) | 1,188 (79.7%) |
| 5 Years | 274 (82.3%) | 456 (94.0%) |
| 6 to 11 Years | 1,778 (84.2%) | 1,676 (82.3%) |
| 12 to 14 Years | 889 (81.7%) | 720 (83.6%) |
| 15 Years | 374 (100.0%) | 377 (90.0%) |
| 16 and 17 Years | 624 (94.6%) | 631 (95.3%) |
| 18 to 24 Years | 1,853 (95.7%) | 1,580 (86.2%) |
| 25 to 34 Years | 2,142 (75.2%) | 2,587 (82.1%) |
| 35 to 44 Years | 2,980 (93.5%) | 2,929 (89.5%) |
| 45 to 54 Years | 2,601 (88.0%) | 2,875 (90.0%) |
| 55 to 64 Years | 2,772 (85.1%) | 2,843 (83.1%) |
| 65 to 74 Years | 2,085 (89.9%) | 2,243 (82.8%) |
| 75 Years and over | 1,107 (92.8%) | 1,812 (89.2%) |
| Total | 20,544 (86.5%) | 21,917 (85.7%) |
Income Below Poverty Among Married-Couple Families in Gibson County
The poverty statistics for married-couple families in Gibson County show that 4.9% or 475 of the total 9,778 families live below the poverty line. Families with 5 or more children have the highest poverty rate of 22.4%, comprising of 26 families. On the other hand, families with 1 or 2 children have the lowest poverty rate of 3.0%, which includes 92 families.
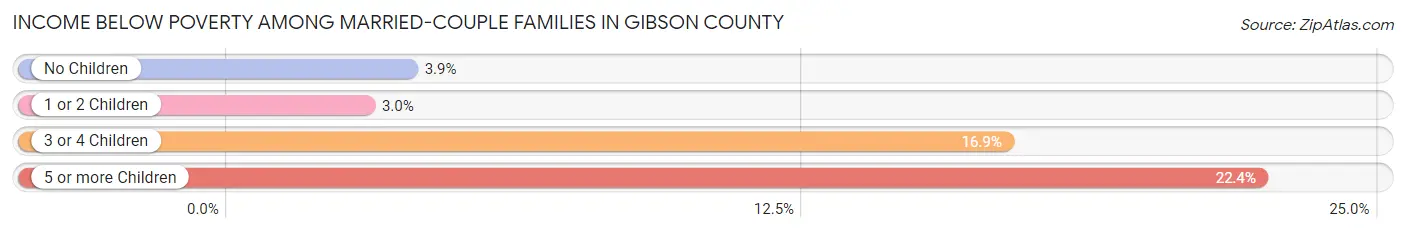
| Children | Above Poverty | Below Poverty |
| No Children | 5,573 (96.1%) | 227 (3.9%) |
| 1 or 2 Children | 3,000 (97.0%) | 92 (3.0%) |
| 3 or 4 Children | 640 (83.1%) | 130 (16.9%) |
| 5 or more Children | 90 (77.6%) | 26 (22.4%) |
| Total | 9,303 (95.1%) | 475 (4.9%) |
Income Below Poverty Among Single-Parent Households in Gibson County
According to the poverty data in Gibson County, 12.3% or 103 single-father households and 28.5% or 761 single-mother households are living below the poverty line. Among single-father households, those with 1 or 2 children have the highest poverty rate, with 95 households (18.7%) experiencing poverty. Likewise, among single-mother households, those with 5 or more children have the highest poverty rate, with 14 households (100.0%) falling below the poverty line.
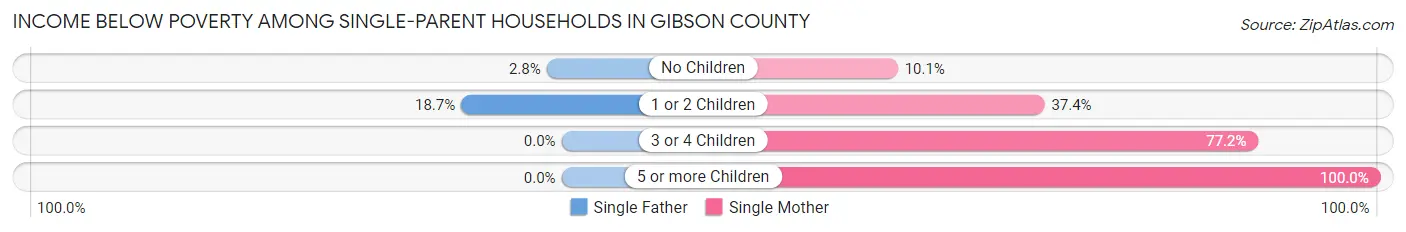
| Children | Single Father | Single Mother |
| No Children | 8 (2.8%) | 117 (10.1%) |
| 1 or 2 Children | 95 (18.7%) | 491 (37.4%) |
| 3 or 4 Children | 0 (0.0%) | 139 (77.2%) |
| 5 or more Children | 0 (0.0%) | 14 (100.0%) |
| Total | 103 (12.3%) | 761 (28.5%) |
Income Below Poverty Among Married-Couple vs Single-Parent Households in Gibson County
The poverty data for Gibson County shows that 475 of the married-couple family households (4.9%) and 864 of the single-parent households (24.6%) are living below the poverty level. Within the married-couple family households, those with 5 or more children have the highest poverty rate, with 26 households (22.4%) falling below the poverty line. Among the single-parent households, those with 5 or more children have the highest poverty rate, with 14 household (100.0%) living below poverty.
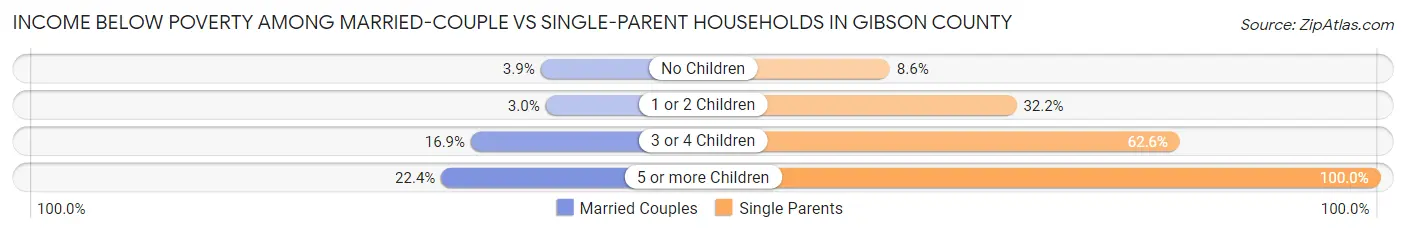
| Children | Married-Couple Families | Single-Parent Households |
| No Children | 227 (3.9%) | 125 (8.6%) |
| 1 or 2 Children | 92 (3.0%) | 586 (32.2%) |
| 3 or 4 Children | 130 (16.9%) | 139 (62.6%) |
| 5 or more Children | 26 (22.4%) | 14 (100.0%) |
| Total | 475 (4.9%) | 864 (24.6%) |
Employment Characteristics in Gibson County
Employment by Class of Employer in Gibson County
Among the 21,155 employed individuals in Gibson County, private company employees (14,680 | 69.4%), not-for-profit organizations (1,590 | 7.5%), and local government employees (1,547 | 7.3%) make up the most common classes of employment.
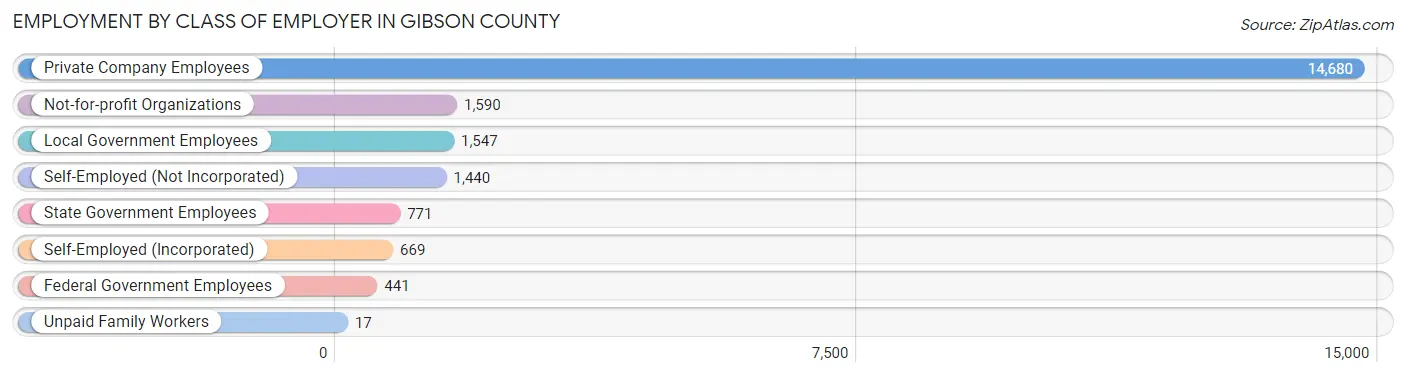
| Employer Class | # Employees | % Employees |
| Private Company Employees | 14,680 | 69.4% |
| Self-Employed (Incorporated) | 669 | 3.2% |
| Self-Employed (Not Incorporated) | 1,440 | 6.8% |
| Not-for-profit Organizations | 1,590 | 7.5% |
| Local Government Employees | 1,547 | 7.3% |
| State Government Employees | 771 | 3.6% |
| Federal Government Employees | 441 | 2.1% |
| Unpaid Family Workers | 17 | 0.1% |
| Total | 21,155 | 100.0% |
Employment Status by Age in Gibson County
According to the labor force statistics for Gibson County, out of the total population over 16 years of age (39,588), 57.7% or 22,842 individuals are in the labor force, with 5.4% or 1,233 of them unemployed. The age group with the highest labor force participation rate is 35 to 44 years, with 83.9% or 5,501 individuals in the labor force. Within the labor force, the 20 to 24 years age range has the highest percentage of unemployed individuals, with 13.5% or 251 of them being unemployed.
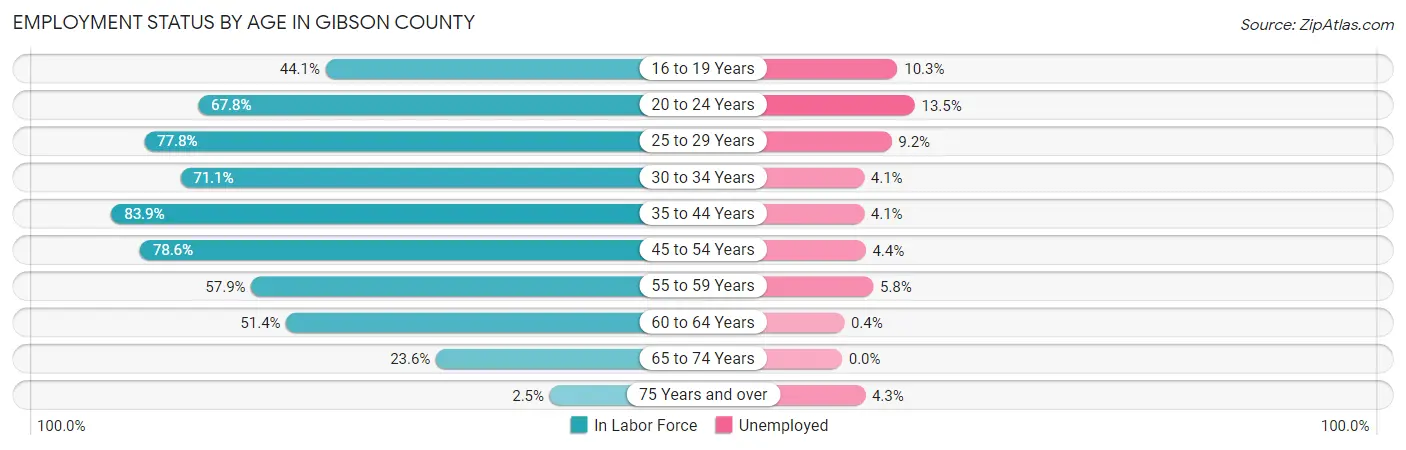
| Age Bracket | In Labor Force | Unemployed |
| 16 to 19 Years | 1,061 (44.1%) | 109 (10.3%) |
| 20 to 24 Years | 1,858 (67.8%) | 251 (13.5%) |
| 25 to 29 Years | 2,447 (77.8%) | 225 (9.2%) |
| 30 to 34 Years | 2,092 (71.1%) | 86 (4.1%) |
| 35 to 44 Years | 5,501 (83.9%) | 226 (4.1%) |
| 45 to 54 Years | 4,905 (78.6%) | 216 (4.4%) |
| 55 to 59 Years | 1,987 (57.9%) | 115 (5.8%) |
| 60 to 64 Years | 1,693 (51.4%) | 7 (0.4%) |
| 65 to 74 Years | 1,220 (23.6%) | 0 (0.0%) |
| 75 Years and over | 92 (2.5%) | 4 (4.3%) |
| Total | 22,842 (57.7%) | 1,233 (5.4%) |
Employment Status by Educational Attainment in Gibson County
According to labor force statistics for Gibson County, 72.7% of individuals (18,618) out of the total population between 25 and 64 years of age (25,610) are in the labor force, with 4.7% or 875 of them being unemployed. The group with the highest labor force participation rate are those with the educational attainment of bachelor's degree or higher, with 83.9% or 4,445 individuals in the labor force. Within the labor force, individuals with less than high school education have the highest percentage of unemployment, with 14.7% or 173 of them being unemployed.
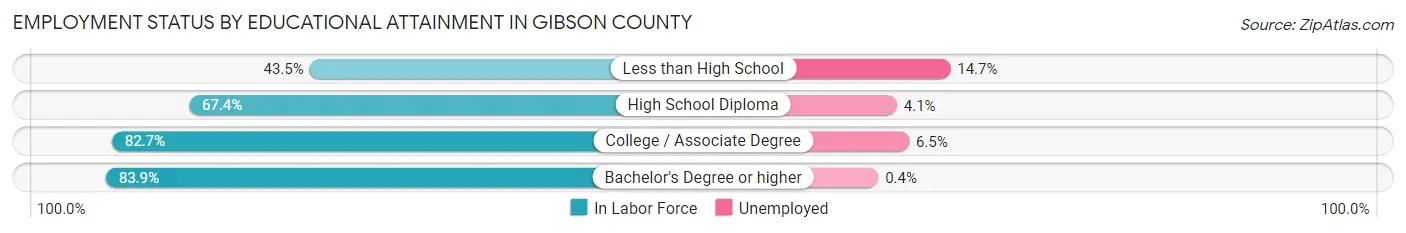
| Educational Attainment | In Labor Force | Unemployed |
| Less than High School | 1,179 (43.5%) | 399 (14.7%) |
| High School Diploma | 6,842 (67.4%) | 416 (4.1%) |
| College / Associate Degree | 6,161 (82.7%) | 484 (6.5%) |
| Bachelor's Degree or higher | 4,445 (83.9%) | 21 (0.4%) |
| Total | 18,618 (72.7%) | 1,204 (4.7%) |
Employment Occupations by Sex in Gibson County
Management, Business, Science and Arts Occupations
The most common Management, Business, Science and Arts occupations in Gibson County are Management (1,958 | 9.1%), Health Diagnosing & Treating (1,822 | 8.5%), Community & Social Service (1,576 | 7.3%), Education Instruction & Library (951 | 4.4%), and Health Technologists (878 | 4.1%).

Management, Business, Science and Arts Occupations by Sex
Within the Management, Business, Science and Arts occupations in Gibson County, the most male-oriented occupations are Life, Physical & Social Science (93.4%), Computers & Mathematics (91.6%), and Computers, Engineering & Science (89.7%), while the most female-oriented occupations are Legal Services & Support (95.2%), Health Diagnosing & Treating (83.8%), and Education Instruction & Library (80.3%).
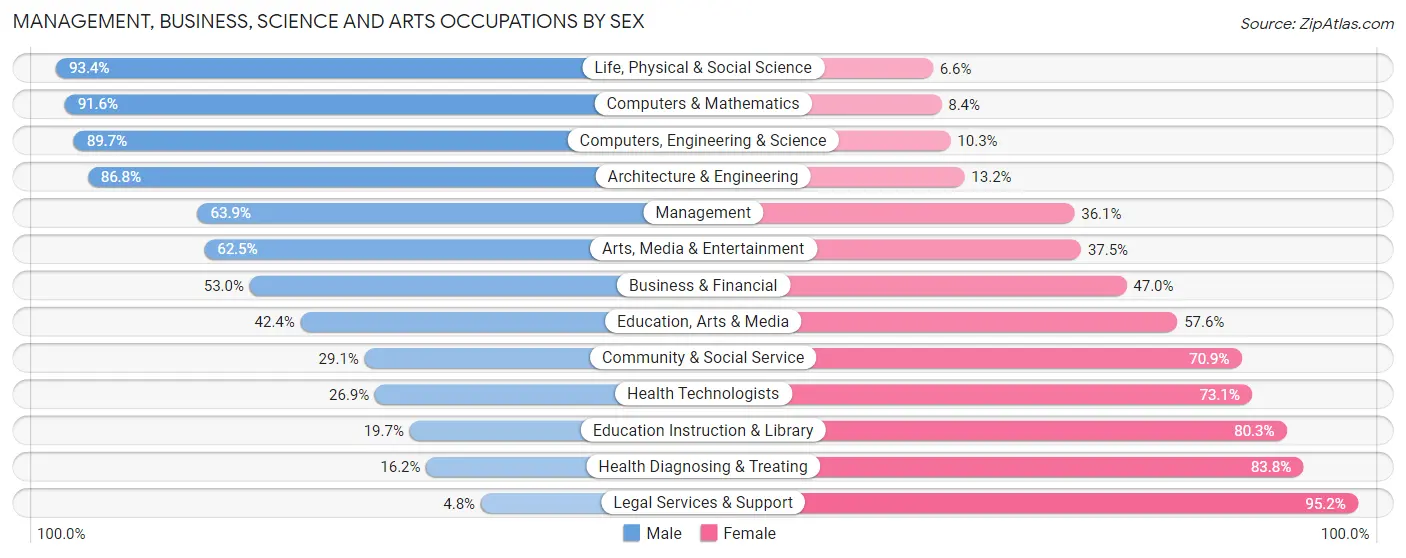
| Occupation | Male | Female |
| Management | 1,251 (63.9%) | 707 (36.1%) |
| Business & Financial | 350 (53.0%) | 310 (47.0%) |
| Computers, Engineering & Science | 472 (89.7%) | 54 (10.3%) |
| Computers & Mathematics | 197 (91.6%) | 18 (8.4%) |
| Architecture & Engineering | 204 (86.8%) | 31 (13.2%) |
| Life, Physical & Social Science | 71 (93.4%) | 5 (6.6%) |
| Community & Social Service | 458 (29.1%) | 1,118 (70.9%) |
| Education, Arts & Media | 126 (42.4%) | 171 (57.6%) |
| Legal Services & Support | 5 (4.8%) | 99 (95.2%) |
| Education Instruction & Library | 187 (19.7%) | 764 (80.3%) |
| Arts, Media & Entertainment | 140 (62.5%) | 84 (37.5%) |
| Health Diagnosing & Treating | 295 (16.2%) | 1,527 (83.8%) |
| Health Technologists | 236 (26.9%) | 642 (73.1%) |
| Total (Category) | 2,826 (43.2%) | 3,716 (56.8%) |
| Total (Overall) | 11,202 (52.0%) | 10,358 (48.0%) |
Services Occupations
The most common Services occupations in Gibson County are Food Preparation & Serving (1,198 | 5.6%), Cleaning & Maintenance (680 | 3.2%), Healthcare Support (672 | 3.1%), Personal Care & Service (288 | 1.3%), and Security & Protection (210 | 1.0%).
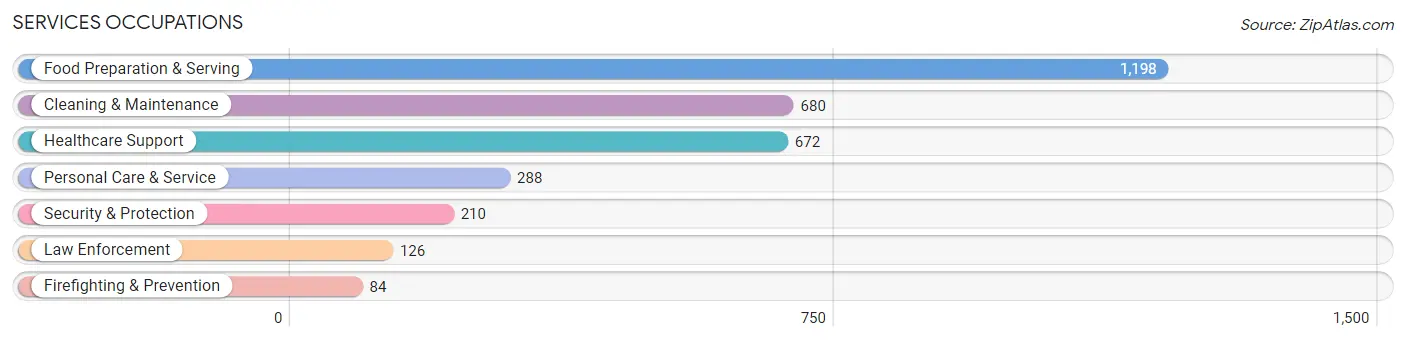
Services Occupations by Sex
Within the Services occupations in Gibson County, the most male-oriented occupations are Firefighting & Prevention (100.0%), Security & Protection (84.8%), and Law Enforcement (74.6%), while the most female-oriented occupations are Healthcare Support (91.5%), Personal Care & Service (90.6%), and Food Preparation & Serving (66.5%).

| Occupation | Male | Female |
| Healthcare Support | 57 (8.5%) | 615 (91.5%) |
| Security & Protection | 178 (84.8%) | 32 (15.2%) |
| Firefighting & Prevention | 84 (100.0%) | 0 (0.0%) |
| Law Enforcement | 94 (74.6%) | 32 (25.4%) |
| Food Preparation & Serving | 401 (33.5%) | 797 (66.5%) |
| Cleaning & Maintenance | 503 (74.0%) | 177 (26.0%) |
| Personal Care & Service | 27 (9.4%) | 261 (90.6%) |
| Total (Category) | 1,166 (38.3%) | 1,882 (61.8%) |
| Total (Overall) | 11,202 (52.0%) | 10,358 (48.0%) |
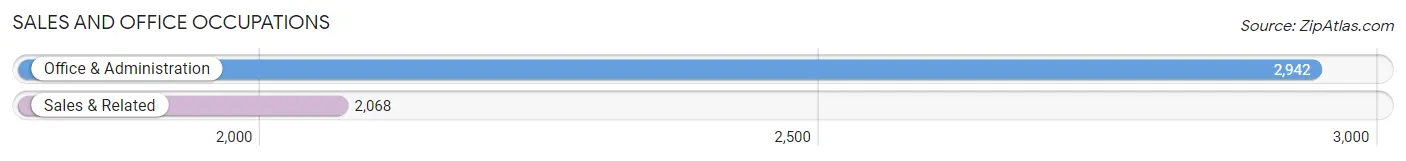
Sales and Office Occupations
The most common Sales and Office occupations in Gibson County are Office & Administration (2,942 | 13.7%), and Sales & Related (2,068 | 9.6%).
Sales and Office Occupations by Sex
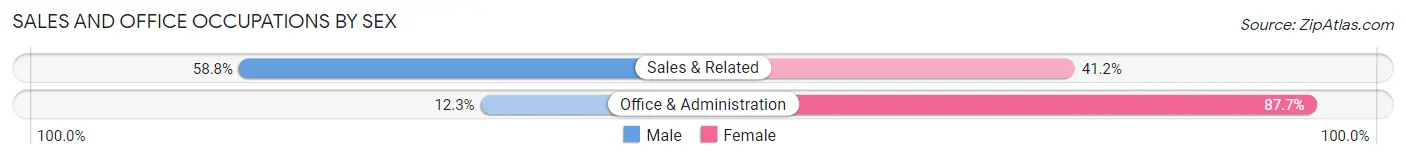
| Occupation | Male | Female |
| Sales & Related | 1,216 (58.8%) | 852 (41.2%) |
| Office & Administration | 363 (12.3%) | 2,579 (87.7%) |
| Total (Category) | 1,579 (31.5%) | 3,431 (68.5%) |
| Total (Overall) | 11,202 (52.0%) | 10,358 (48.0%) |
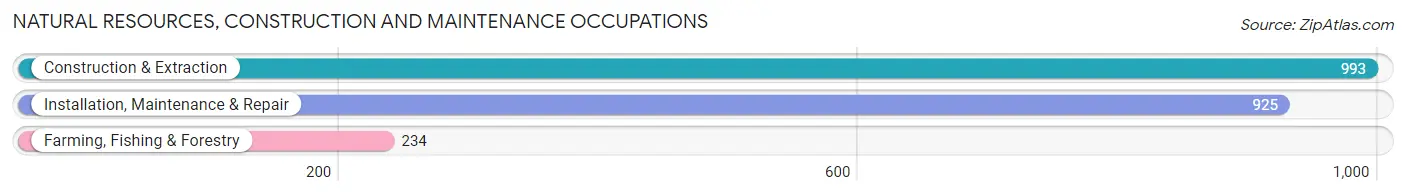
Natural Resources, Construction and Maintenance Occupations
The most common Natural Resources, Construction and Maintenance occupations in Gibson County are Construction & Extraction (993 | 4.6%), Installation, Maintenance & Repair (925 | 4.3%), and Farming, Fishing & Forestry (234 | 1.1%).
Natural Resources, Construction and Maintenance Occupations by Sex
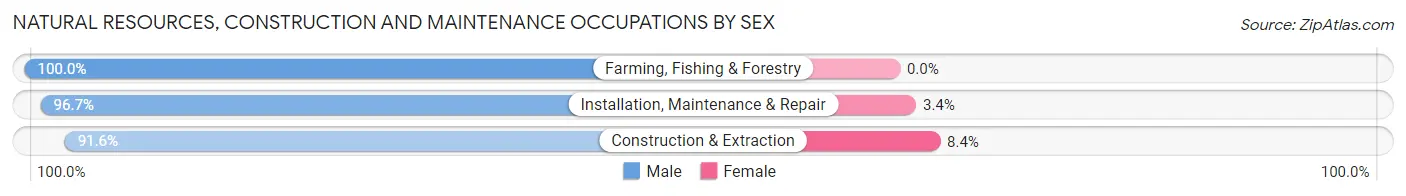
| Occupation | Male | Female |
| Farming, Fishing & Forestry | 234 (100.0%) | 0 (0.0%) |
| Construction & Extraction | 910 (91.6%) | 83 (8.4%) |
| Installation, Maintenance & Repair | 894 (96.7%) | 31 (3.4%) |
| Total (Category) | 2,038 (94.7%) | 114 (5.3%) |
| Total (Overall) | 11,202 (52.0%) | 10,358 (48.0%) |
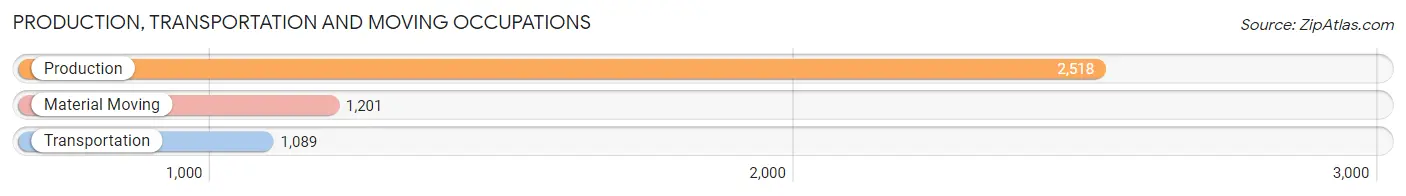
Production, Transportation and Moving Occupations
The most common Production, Transportation and Moving occupations in Gibson County are Production (2,518 | 11.7%), Material Moving (1,201 | 5.6%), and Transportation (1,089 | 5.1%).
Production, Transportation and Moving Occupations by Sex
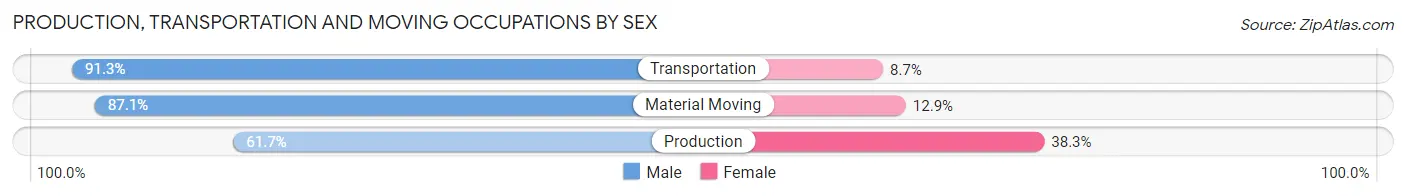
| Occupation | Male | Female |
| Production | 1,553 (61.7%) | 965 (38.3%) |
| Transportation | 994 (91.3%) | 95 (8.7%) |
| Material Moving | 1,046 (87.1%) | 155 (12.9%) |
| Total (Category) | 3,593 (74.7%) | 1,215 (25.3%) |
| Total (Overall) | 11,202 (52.0%) | 10,358 (48.0%) |
Employment Industries by Sex in Gibson County
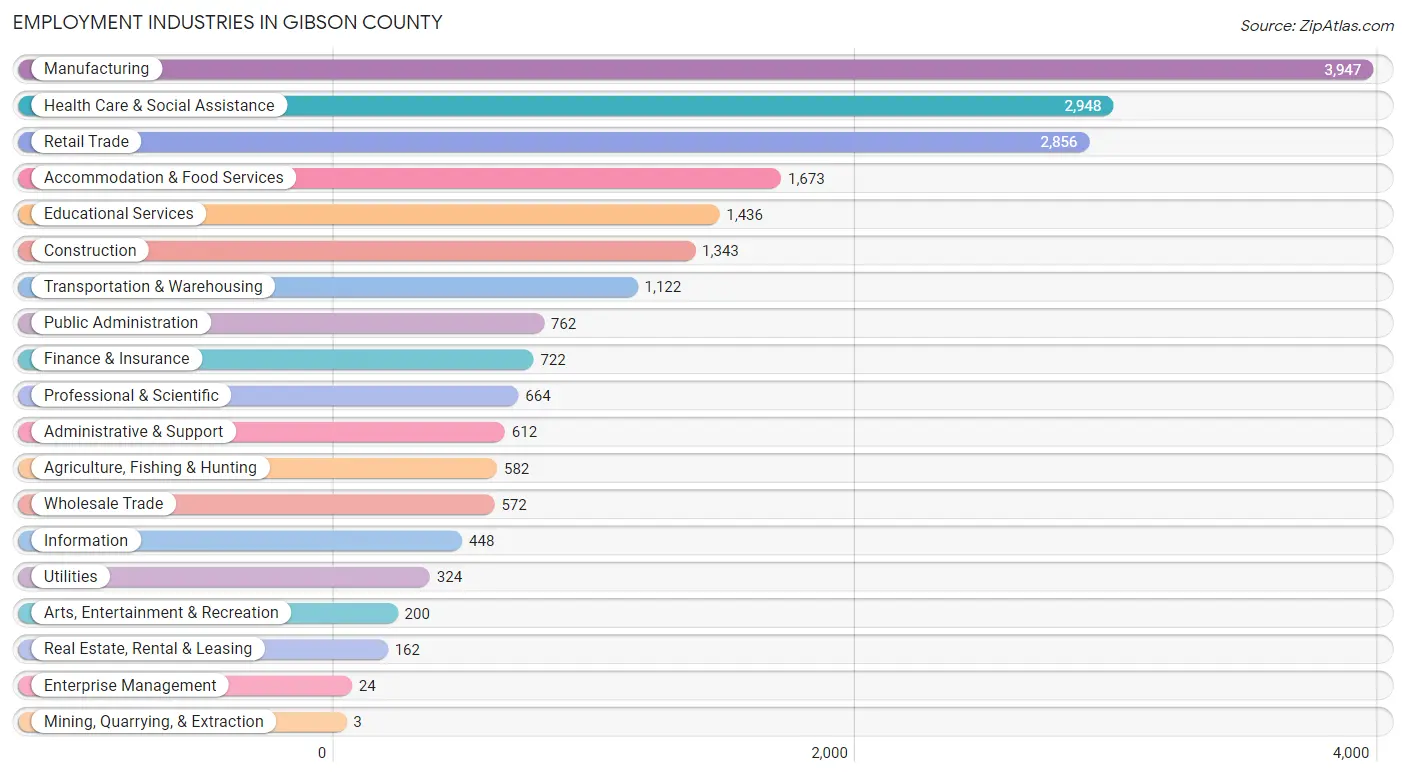
Employment Industries in Gibson County
The major employment industries in Gibson County include Manufacturing (3,947 | 18.3%), Health Care & Social Assistance (2,948 | 13.7%), Retail Trade (2,856 | 13.3%), Accommodation & Food Services (1,673 | 7.8%), and Educational Services (1,436 | 6.7%).
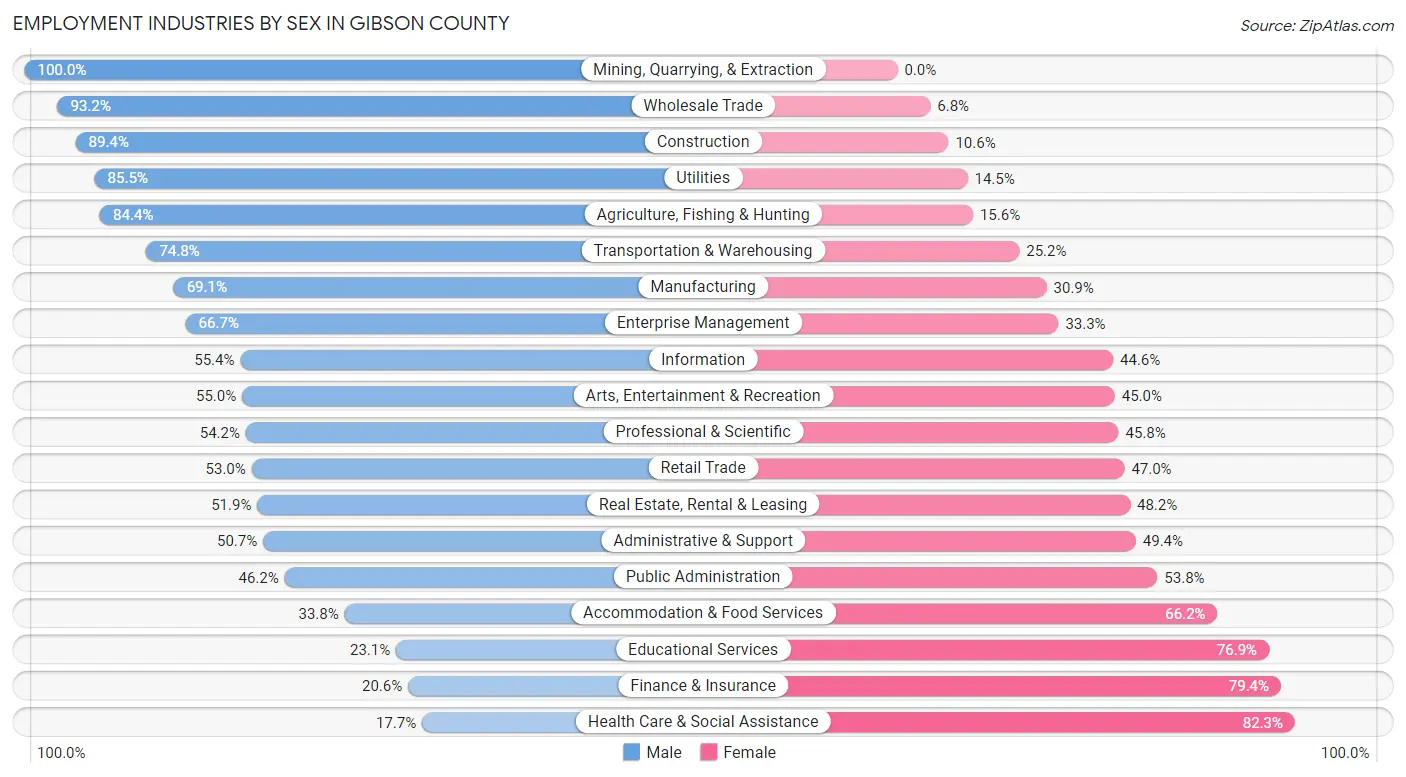
Employment Industries by Sex in Gibson County
The Gibson County industries that see more men than women are Mining, Quarrying, & Extraction (100.0%), Wholesale Trade (93.2%), and Construction (89.4%), whereas the industries that tend to have a higher number of women are Health Care & Social Assistance (82.3%), Finance & Insurance (79.4%), and Educational Services (76.9%).
| Industry | Male | Female |
| Agriculture, Fishing & Hunting | 491 (84.4%) | 91 (15.6%) |
| Mining, Quarrying, & Extraction | 3 (100.0%) | 0 (0.0%) |
| Construction | 1,201 (89.4%) | 142 (10.6%) |
| Manufacturing | 2,728 (69.1%) | 1,219 (30.9%) |
| Wholesale Trade | 533 (93.2%) | 39 (6.8%) |
| Retail Trade | 1,514 (53.0%) | 1,342 (47.0%) |
| Transportation & Warehousing | 839 (74.8%) | 283 (25.2%) |
| Utilities | 277 (85.5%) | 47 (14.5%) |
| Information | 248 (55.4%) | 200 (44.6%) |
| Finance & Insurance | 149 (20.6%) | 573 (79.4%) |
| Real Estate, Rental & Leasing | 84 (51.8%) | 78 (48.1%) |
| Professional & Scientific | 360 (54.2%) | 304 (45.8%) |
| Enterprise Management | 16 (66.7%) | 8 (33.3%) |
| Administrative & Support | 310 (50.6%) | 302 (49.3%) |
| Educational Services | 332 (23.1%) | 1,104 (76.9%) |
| Health Care & Social Assistance | 523 (17.7%) | 2,425 (82.3%) |
| Arts, Entertainment & Recreation | 110 (55.0%) | 90 (45.0%) |
| Accommodation & Food Services | 565 (33.8%) | 1,108 (66.2%) |
| Public Administration | 352 (46.2%) | 410 (53.8%) |
| Total | 11,202 (52.0%) | 10,358 (48.0%) |
Education in Gibson County
School Enrollment in Gibson County
The most common levels of schooling among the 11,096 students in Gibson County are elementary school (2,945 | 26.5%), high school (2,726 | 24.6%), and middle school (2,703 | 24.4%).
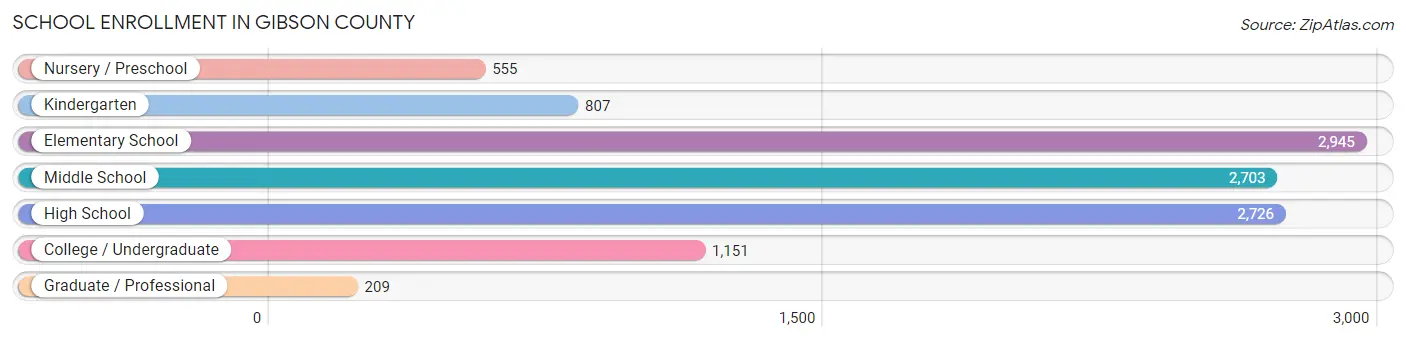
| School Level | # Students | % Students |
| Nursery / Preschool | 555 | 5.0% |
| Kindergarten | 807 | 7.3% |
| Elementary School | 2,945 | 26.5% |
| Middle School | 2,703 | 24.4% |
| High School | 2,726 | 24.6% |
| College / Undergraduate | 1,151 | 10.4% |
| Graduate / Professional | 209 | 1.9% |
| Total | 11,096 | 100.0% |
School Enrollment by Age by Funding Source in Gibson County
Out of a total of 11,096 students who are enrolled in schools in Gibson County, 1,598 (14.4%) attend a private institution, while the remaining 9,498 (85.6%) are enrolled in public schools. The age group of 3 to 4 year olds has the highest likelihood of being enrolled in private schools, with 169 (41.8% in the age bracket) enrolled. Conversely, the age group of 10 to 14 year olds has the lowest likelihood of being enrolled in a private school, with 3,369 (93.4% in the age bracket) attending a public institution.
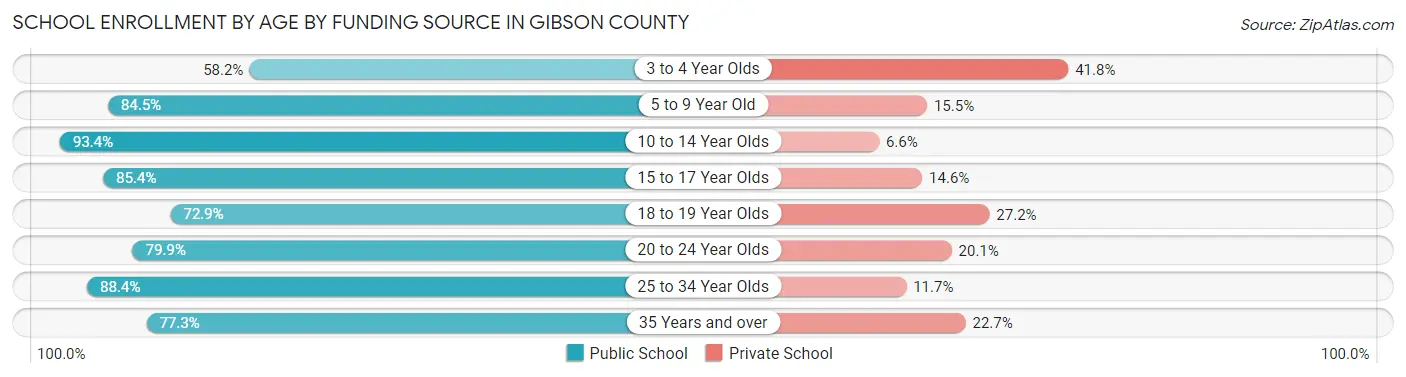
| Age Bracket | Public School | Private School |
| 3 to 4 Year Olds | 235 (58.2%) | 169 (41.8%) |
| 5 to 9 Year Old | 2,721 (84.5%) | 500 (15.5%) |
| 10 to 14 Year Olds | 3,369 (93.4%) | 237 (6.6%) |
| 15 to 17 Year Olds | 1,763 (85.4%) | 302 (14.6%) |
| 18 to 19 Year Olds | 475 (72.9%) | 177 (27.2%) |
| 20 to 24 Year Olds | 445 (79.9%) | 112 (20.1%) |
| 25 to 34 Year Olds | 273 (88.3%) | 36 (11.7%) |
| 35 Years and over | 218 (77.3%) | 64 (22.7%) |
| Total | 9,498 (85.6%) | 1,598 (14.4%) |
Educational Attainment by Field of Study in Gibson County
Business (1,845 | 27.5%), education (1,414 | 21.0%), science & technology (879 | 13.1%), bio, nature & agricultural (452 | 6.7%), and arts & humanities (433 | 6.5%) are the most common fields of study among 6,718 individuals in Gibson County who have obtained a bachelor's degree or higher.
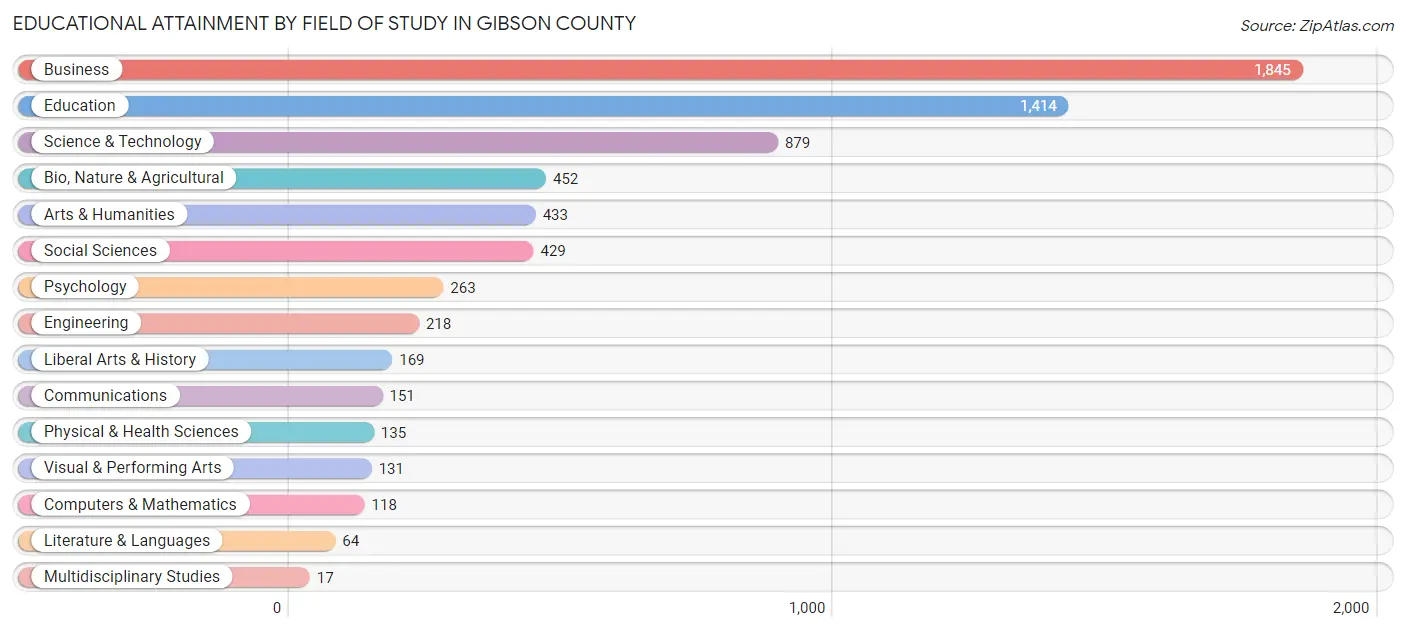
| Field of Study | # Graduates | % Graduates |
| Computers & Mathematics | 118 | 1.8% |
| Bio, Nature & Agricultural | 452 | 6.7% |
| Physical & Health Sciences | 135 | 2.0% |
| Psychology | 263 | 3.9% |
| Social Sciences | 429 | 6.4% |
| Engineering | 218 | 3.3% |
| Multidisciplinary Studies | 17 | 0.3% |
| Science & Technology | 879 | 13.1% |
| Business | 1,845 | 27.5% |
| Education | 1,414 | 21.0% |
| Literature & Languages | 64 | 0.9% |
| Liberal Arts & History | 169 | 2.5% |
| Visual & Performing Arts | 131 | 1.9% |
| Communications | 151 | 2.2% |
| Arts & Humanities | 433 | 6.5% |
| Total | 6,718 | 100.0% |
Transportation & Commute in Gibson County
Vehicle Availability by Sex in Gibson County
The most prevalent vehicle ownership categories in Gibson County are males with 2 vehicles (4,360, accounting for 39.5%) and females with 2 vehicles (3,803, making up 43.1%).
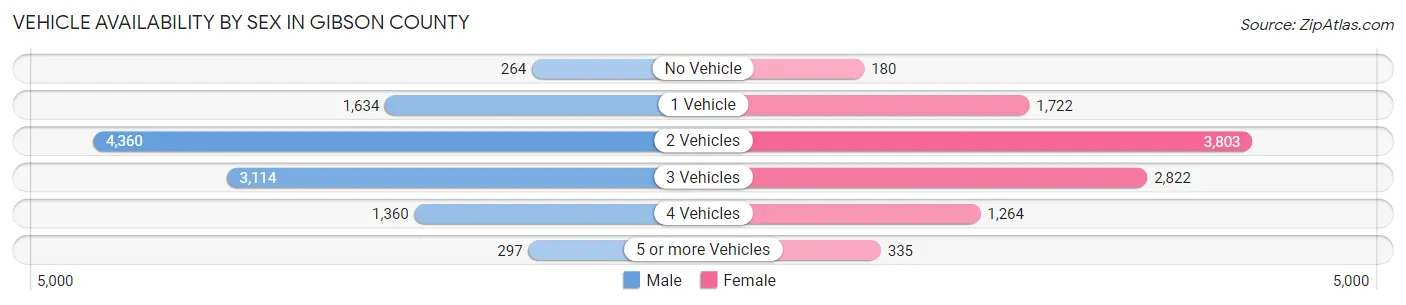
| Vehicles Available | Male | Female |
| No Vehicle | 264 (2.4%) | 180 (1.8%) |
| 1 Vehicle | 1,634 (14.8%) | 1,722 (17.0%) |
| 2 Vehicles | 4,360 (39.5%) | 3,803 (37.6%) |
| 3 Vehicles | 3,114 (28.2%) | 2,822 (27.9%) |
| 4 Vehicles | 1,360 (12.3%) | 1,264 (12.5%) |
| 5 or more Vehicles | 297 (2.7%) | 335 (3.3%) |
| Total | 11,029 (100.0%) | 10,126 (100.0%) |
Commute Time in Gibson County
The most frequently occuring commute durations in Gibson County are 30 to 34 minutes (2,971 commuters, 14.8%), 5 to 9 minutes (2,624 commuters, 13.1%), and 10 to 14 minutes (2,579 commuters, 12.9%).
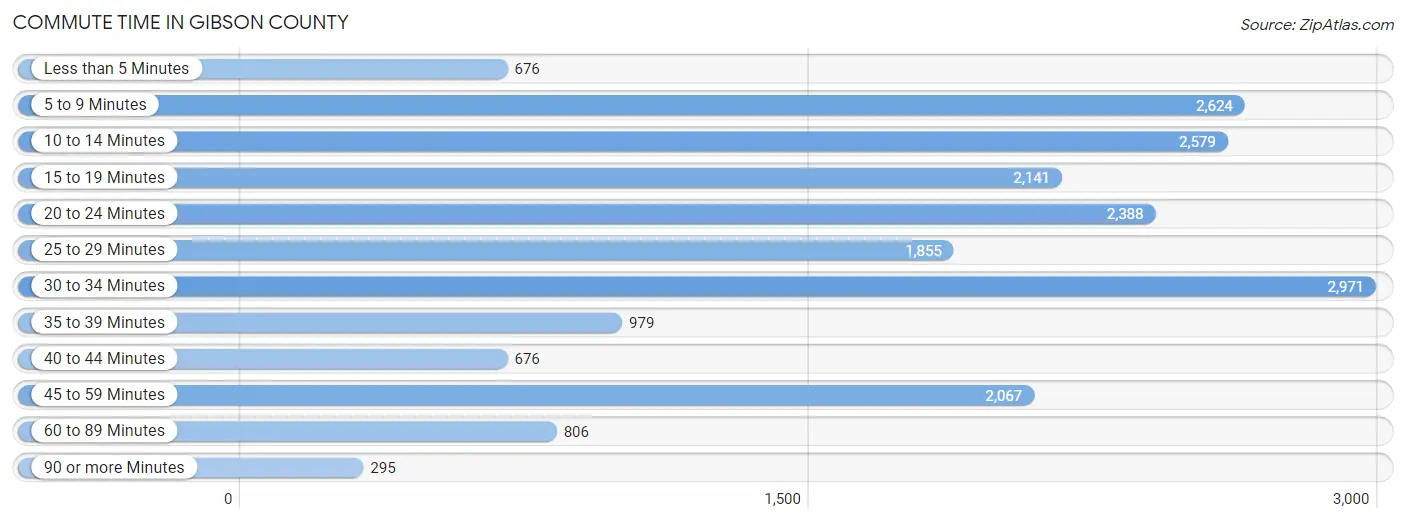
| Commute Time | # Commuters | % Commuters |
| Less than 5 Minutes | 676 | 3.4% |
| 5 to 9 Minutes | 2,624 | 13.1% |
| 10 to 14 Minutes | 2,579 | 12.9% |
| 15 to 19 Minutes | 2,141 | 10.7% |
| 20 to 24 Minutes | 2,388 | 11.9% |
| 25 to 29 Minutes | 1,855 | 9.2% |
| 30 to 34 Minutes | 2,971 | 14.8% |
| 35 to 39 Minutes | 979 | 4.9% |
| 40 to 44 Minutes | 676 | 3.4% |
| 45 to 59 Minutes | 2,067 | 10.3% |
| 60 to 89 Minutes | 806 | 4.0% |
| 90 or more Minutes | 295 | 1.5% |
Commute Time by Sex in Gibson County
The most common commute times in Gibson County are 10 to 14 minutes (1,462 commuters, 14.2%) for males and 30 to 34 minutes (1,550 commuters, 15.9%) for females.
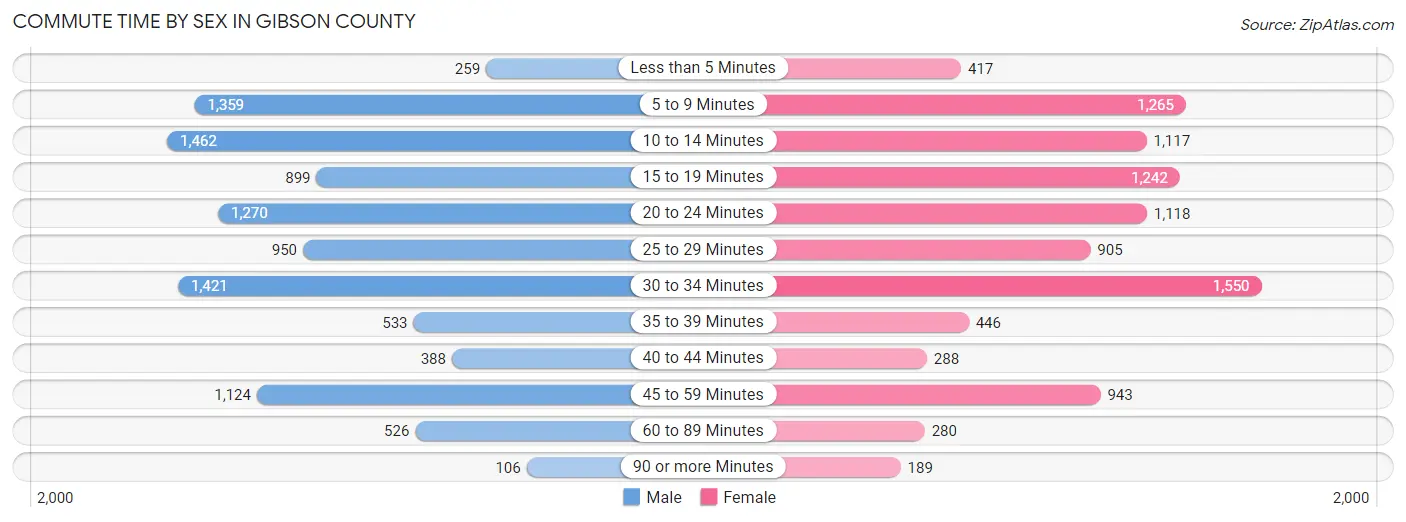
| Commute Time | Male | Female |
| Less than 5 Minutes | 259 (2.5%) | 417 (4.3%) |
| 5 to 9 Minutes | 1,359 (13.2%) | 1,265 (13.0%) |
| 10 to 14 Minutes | 1,462 (14.2%) | 1,117 (11.4%) |
| 15 to 19 Minutes | 899 (8.7%) | 1,242 (12.7%) |
| 20 to 24 Minutes | 1,270 (12.3%) | 1,118 (11.5%) |
| 25 to 29 Minutes | 950 (9.2%) | 905 (9.3%) |
| 30 to 34 Minutes | 1,421 (13.8%) | 1,550 (15.9%) |
| 35 to 39 Minutes | 533 (5.2%) | 446 (4.6%) |
| 40 to 44 Minutes | 388 (3.8%) | 288 (2.9%) |
| 45 to 59 Minutes | 1,124 (10.9%) | 943 (9.7%) |
| 60 to 89 Minutes | 526 (5.1%) | 280 (2.9%) |
| 90 or more Minutes | 106 (1.0%) | 189 (1.9%) |
Time of Departure to Work by Sex in Gibson County
The most frequent times of departure to work in Gibson County are 7:00 AM to 7:29 AM (1,566, 15.2%) for males and 7:00 AM to 7:29 AM (1,909, 19.6%) for females.
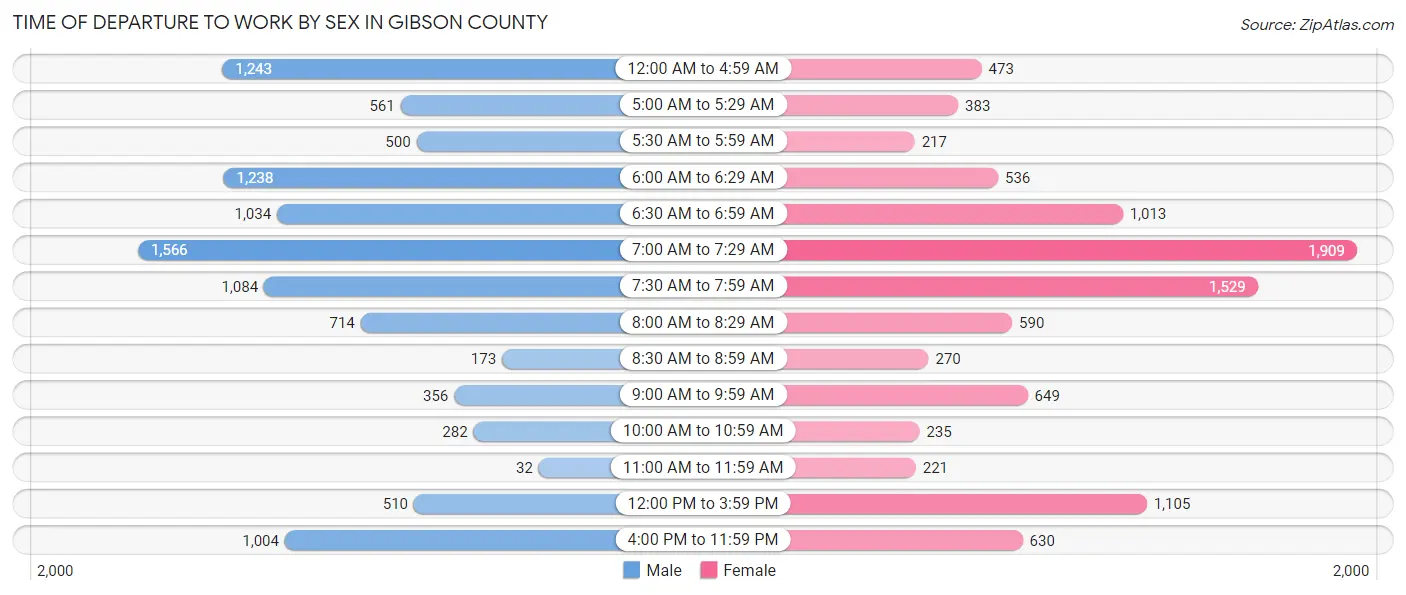
| Time of Departure | Male | Female |
| 12:00 AM to 4:59 AM | 1,243 (12.1%) | 473 (4.9%) |
| 5:00 AM to 5:29 AM | 561 (5.4%) | 383 (3.9%) |
| 5:30 AM to 5:59 AM | 500 (4.9%) | 217 (2.2%) |
| 6:00 AM to 6:29 AM | 1,238 (12.0%) | 536 (5.5%) |
| 6:30 AM to 6:59 AM | 1,034 (10.0%) | 1,013 (10.4%) |
| 7:00 AM to 7:29 AM | 1,566 (15.2%) | 1,909 (19.6%) |
| 7:30 AM to 7:59 AM | 1,084 (10.5%) | 1,529 (15.7%) |
| 8:00 AM to 8:29 AM | 714 (6.9%) | 590 (6.0%) |
| 8:30 AM to 8:59 AM | 173 (1.7%) | 270 (2.8%) |
| 9:00 AM to 9:59 AM | 356 (3.5%) | 649 (6.7%) |
| 10:00 AM to 10:59 AM | 282 (2.7%) | 235 (2.4%) |
| 11:00 AM to 11:59 AM | 32 (0.3%) | 221 (2.3%) |
| 12:00 PM to 3:59 PM | 510 (5.0%) | 1,105 (11.3%) |
| 4:00 PM to 11:59 PM | 1,004 (9.8%) | 630 (6.5%) |
| Total | 10,297 (100.0%) | 9,760 (100.0%) |
Housing Occupancy in Gibson County
Occupancy by Ownership in Gibson County
Of the total 19,948 dwellings in Gibson County, owner-occupied units account for 13,234 (66.3%), while renter-occupied units make up 6,714 (33.7%).
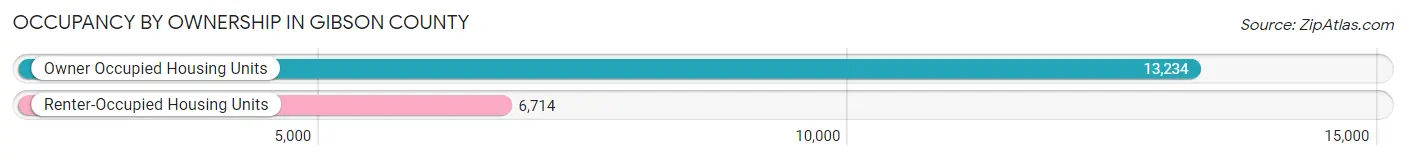
| Occupancy | # Housing Units | % Housing Units |
| Owner Occupied Housing Units | 13,234 | 66.3% |
| Renter-Occupied Housing Units | 6,714 | 33.7% |
| Total Occupied Housing Units | 19,948 | 100.0% |
Occupancy by Household Size in Gibson County
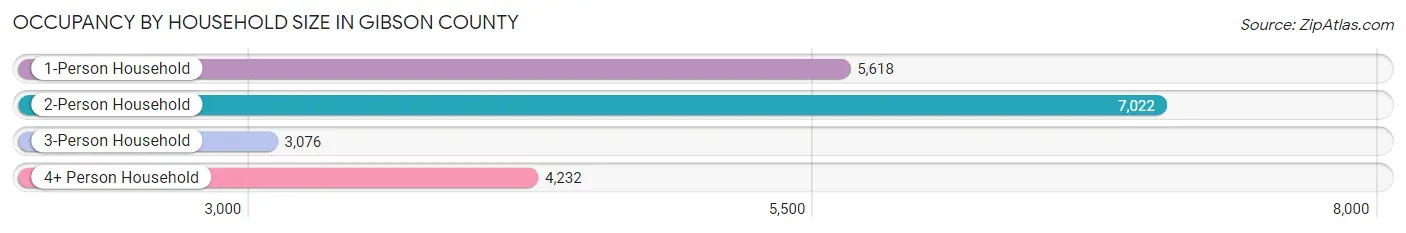
| Household Size | # Housing Units | % Housing Units |
| 1-Person Household | 5,618 | 28.2% |
| 2-Person Household | 7,022 | 35.2% |
| 3-Person Household | 3,076 | 15.4% |
| 4+ Person Household | 4,232 | 21.2% |
| Total Housing Units | 19,948 | 100.0% |
Occupancy by Ownership by Household Size in Gibson County
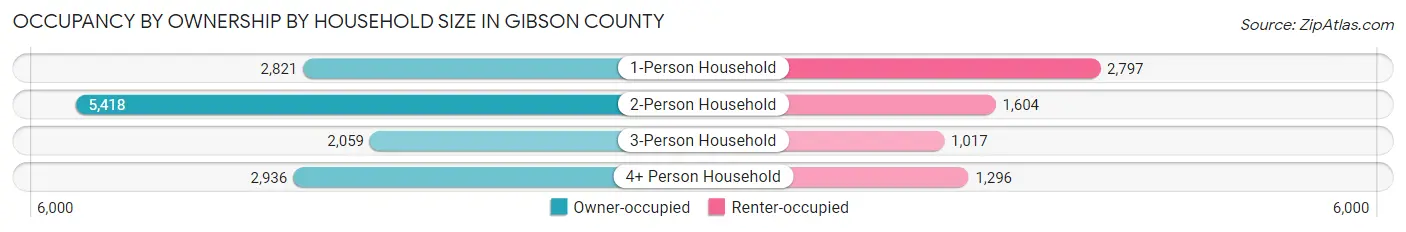
| Household Size | Owner-occupied | Renter-occupied |
| 1-Person Household | 2,821 (50.2%) | 2,797 (49.8%) |
| 2-Person Household | 5,418 (77.2%) | 1,604 (22.8%) |
| 3-Person Household | 2,059 (66.9%) | 1,017 (33.1%) |
| 4+ Person Household | 2,936 (69.4%) | 1,296 (30.6%) |
| Total Housing Units | 13,234 (66.3%) | 6,714 (33.7%) |
Occupancy by Educational Attainment in Gibson County
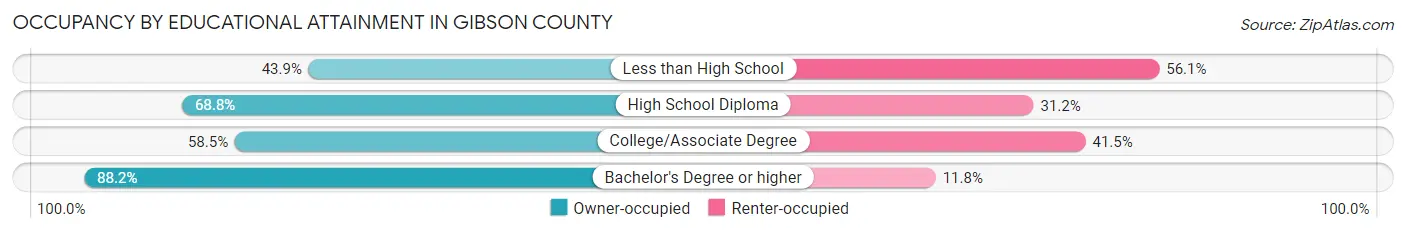
| Household Size | Owner-occupied | Renter-occupied |
| Less than High School | 997 (43.9%) | 1,276 (56.1%) |
| High School Diploma | 5,170 (68.8%) | 2,345 (31.2%) |
| College/Associate Degree | 3,728 (58.5%) | 2,646 (41.5%) |
| Bachelor's Degree or higher | 3,339 (88.2%) | 447 (11.8%) |
Occupancy by Age of Householder in Gibson County
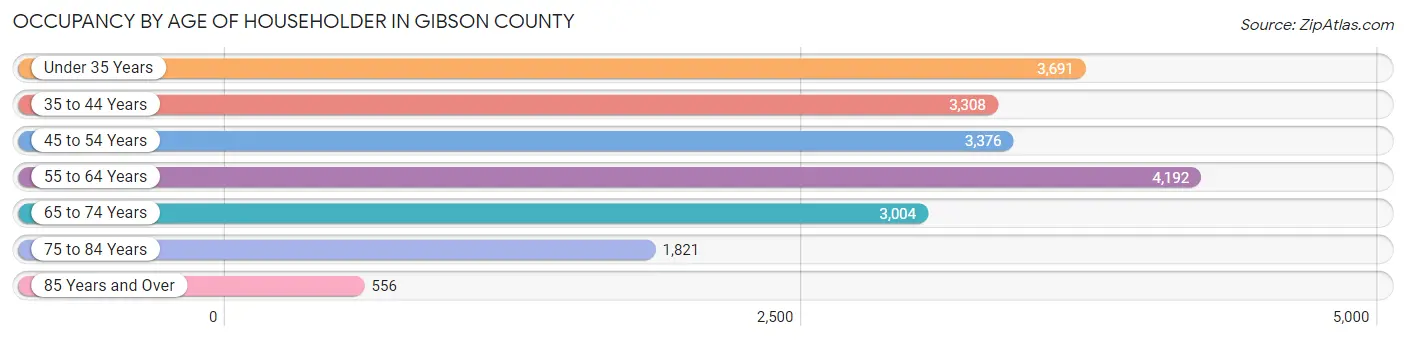
| Age Bracket | # Households | % Households |
| Under 35 Years | 3,691 | 18.5% |
| 35 to 44 Years | 3,308 | 16.6% |
| 45 to 54 Years | 3,376 | 16.9% |
| 55 to 64 Years | 4,192 | 21.0% |
| 65 to 74 Years | 3,004 | 15.1% |
| 75 to 84 Years | 1,821 | 9.1% |
| 85 Years and Over | 556 | 2.8% |
| Total | 19,948 | 100.0% |
Housing Finances in Gibson County
Median Income by Occupancy in Gibson County
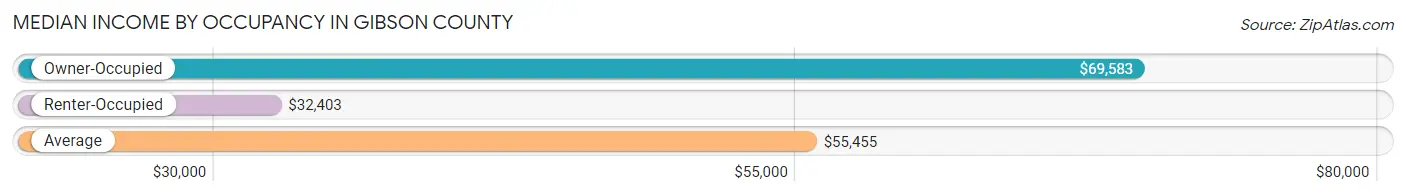
| Occupancy Type | # Households | Median Income |
| Owner-Occupied | 13,234 (66.3%) | $69,583 |
| Renter-Occupied | 6,714 (33.7%) | $32,403 |
| Average | 19,948 (100.0%) | $55,455 |
Occupancy by Householder Income Bracket in Gibson County
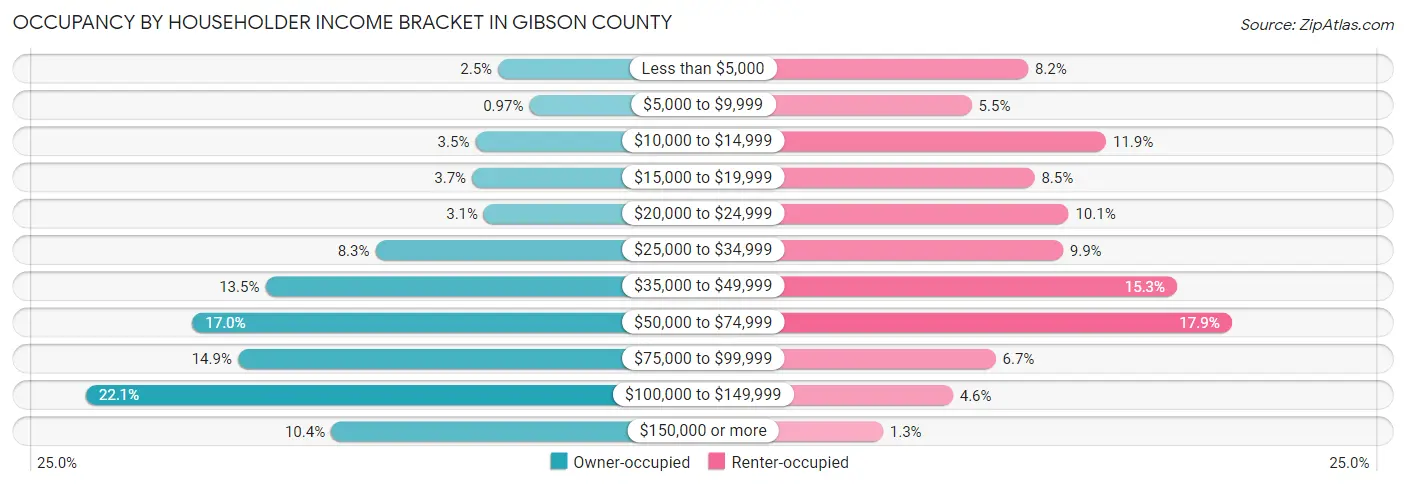
| Income Bracket | Owner-occupied | Renter-occupied |
| Less than $5,000 | 326 (2.5%) | 551 (8.2%) |
| $5,000 to $9,999 | 129 (1.0%) | 371 (5.5%) |
| $10,000 to $14,999 | 469 (3.5%) | 801 (11.9%) |
| $15,000 to $19,999 | 490 (3.7%) | 572 (8.5%) |
| $20,000 to $24,999 | 414 (3.1%) | 681 (10.1%) |
| $25,000 to $34,999 | 1,099 (8.3%) | 663 (9.9%) |
| $35,000 to $49,999 | 1,792 (13.5%) | 1,027 (15.3%) |
| $50,000 to $74,999 | 2,251 (17.0%) | 1,202 (17.9%) |
| $75,000 to $99,999 | 1,965 (14.8%) | 448 (6.7%) |
| $100,000 to $149,999 | 2,922 (22.1%) | 311 (4.6%) |
| $150,000 or more | 1,377 (10.4%) | 87 (1.3%) |
| Total | 13,234 (100.0%) | 6,714 (100.0%) |
Monthly Housing Cost Tiers in Gibson County
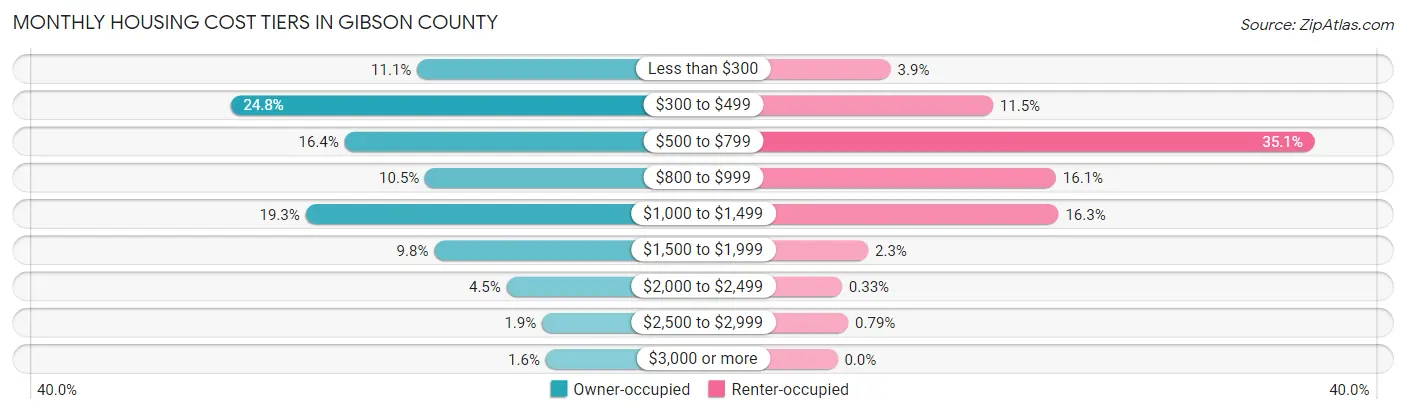
| Monthly Cost | Owner-occupied | Renter-occupied |
| Less than $300 | 1,468 (11.1%) | 263 (3.9%) |
| $300 to $499 | 3,287 (24.8%) | 769 (11.5%) |
| $500 to $799 | 2,174 (16.4%) | 2,359 (35.1%) |
| $800 to $999 | 1,389 (10.5%) | 1,080 (16.1%) |
| $1,000 to $1,499 | 2,556 (19.3%) | 1,093 (16.3%) |
| $1,500 to $1,999 | 1,301 (9.8%) | 152 (2.3%) |
| $2,000 to $2,499 | 595 (4.5%) | 22 (0.3%) |
| $2,500 to $2,999 | 250 (1.9%) | 53 (0.8%) |
| $3,000 or more | 214 (1.6%) | 0 (0.0%) |
| Total | 13,234 (100.0%) | 6,714 (100.0%) |
Physical Housing Characteristics in Gibson County
Housing Structures in Gibson County
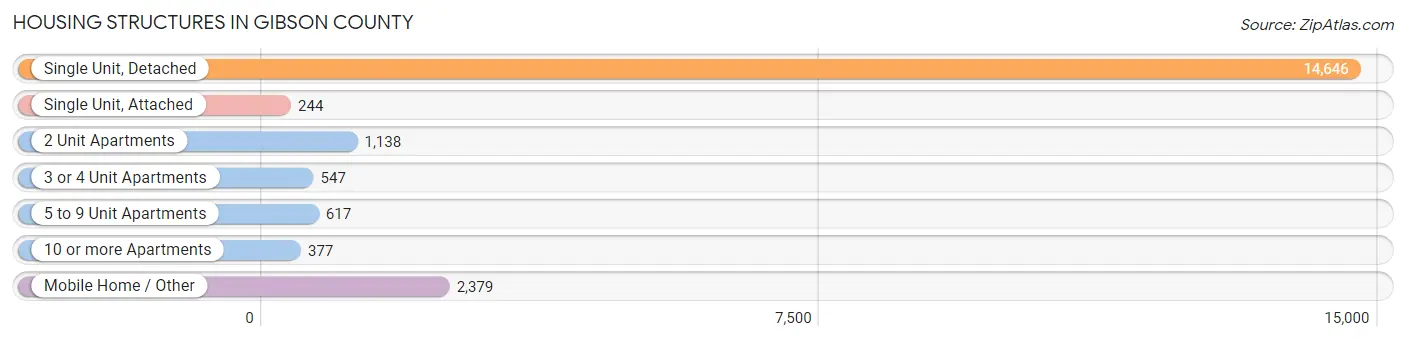
| Structure Type | # Housing Units | % Housing Units |
| Single Unit, Detached | 14,646 | 73.4% |
| Single Unit, Attached | 244 | 1.2% |
| 2 Unit Apartments | 1,138 | 5.7% |
| 3 or 4 Unit Apartments | 547 | 2.7% |
| 5 to 9 Unit Apartments | 617 | 3.1% |
| 10 or more Apartments | 377 | 1.9% |
| Mobile Home / Other | 2,379 | 11.9% |
| Total | 19,948 | 100.0% |
Housing Structures by Occupancy in Gibson County
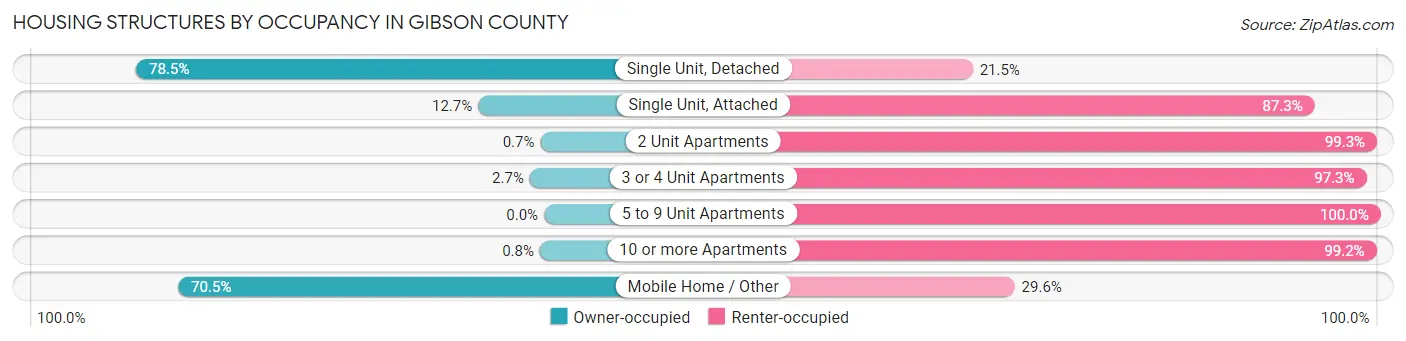
| Structure Type | Owner-occupied | Renter-occupied |
| Single Unit, Detached | 11,501 (78.5%) | 3,145 (21.5%) |
| Single Unit, Attached | 31 (12.7%) | 213 (87.3%) |
| 2 Unit Apartments | 8 (0.7%) | 1,130 (99.3%) |
| 3 or 4 Unit Apartments | 15 (2.7%) | 532 (97.3%) |
| 5 to 9 Unit Apartments | 0 (0.0%) | 617 (100.0%) |
| 10 or more Apartments | 3 (0.8%) | 374 (99.2%) |
| Mobile Home / Other | 1,676 (70.5%) | 703 (29.5%) |
| Total | 13,234 (66.3%) | 6,714 (33.7%) |
Housing Structures by Number of Rooms in Gibson County
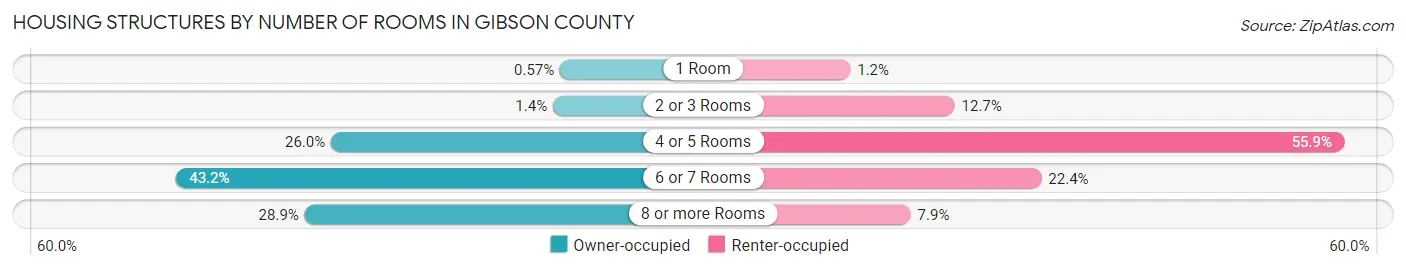
| Number of Rooms | Owner-occupied | Renter-occupied |
| 1 Room | 75 (0.6%) | 77 (1.1%) |
| 2 or 3 Rooms | 180 (1.4%) | 855 (12.7%) |
| 4 or 5 Rooms | 3,440 (26.0%) | 3,754 (55.9%) |
| 6 or 7 Rooms | 5,712 (43.2%) | 1,501 (22.4%) |
| 8 or more Rooms | 3,827 (28.9%) | 527 (7.9%) |
| Total | 13,234 (100.0%) | 6,714 (100.0%) |
Housing Structure by Heating Type in Gibson County
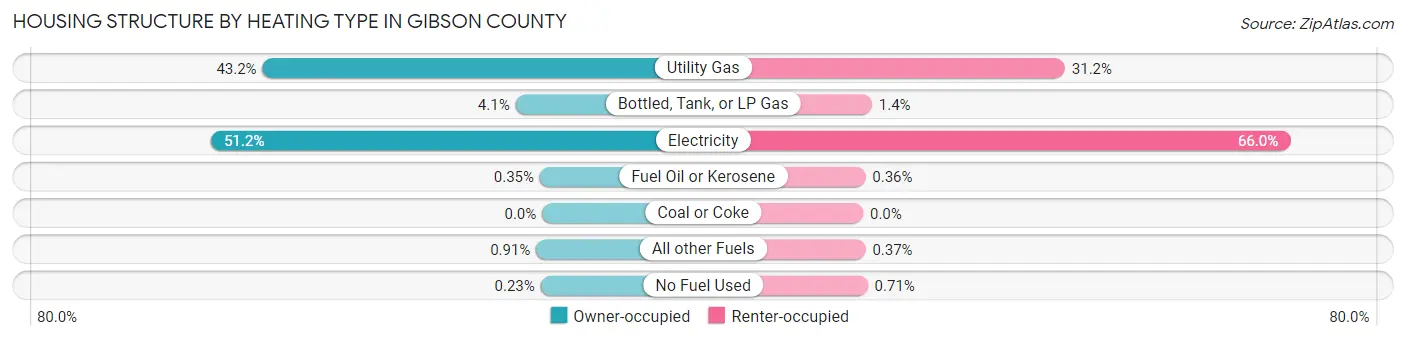
| Heating Type | Owner-occupied | Renter-occupied |
| Utility Gas | 5,721 (43.2%) | 2,095 (31.2%) |
| Bottled, Tank, or LP Gas | 544 (4.1%) | 91 (1.4%) |
| Electricity | 6,773 (51.2%) | 4,431 (66.0%) |
| Fuel Oil or Kerosene | 46 (0.4%) | 24 (0.4%) |
| Coal or Coke | 0 (0.0%) | 0 (0.0%) |
| All other Fuels | 120 (0.9%) | 25 (0.4%) |
| No Fuel Used | 30 (0.2%) | 48 (0.7%) |
| Total | 13,234 (100.0%) | 6,714 (100.0%) |
Household Vehicle Usage in Gibson County
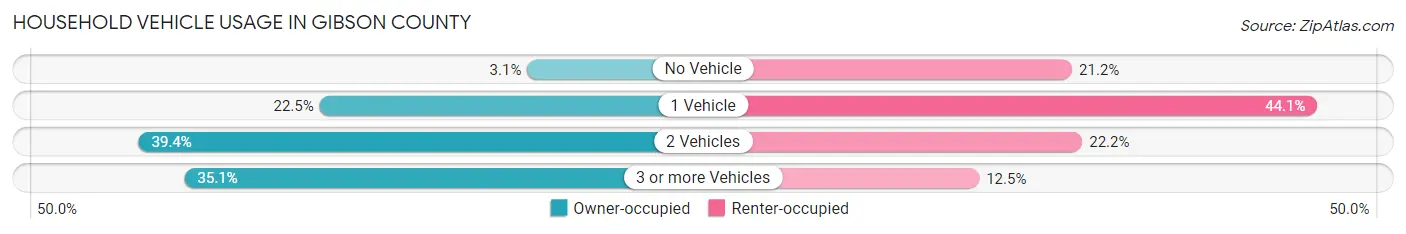
| Vehicles per Household | Owner-occupied | Renter-occupied |
| No Vehicle | 407 (3.1%) | 1,424 (21.2%) |
| 1 Vehicle | 2,974 (22.5%) | 2,960 (44.1%) |
| 2 Vehicles | 5,210 (39.4%) | 1,488 (22.2%) |
| 3 or more Vehicles | 4,643 (35.1%) | 842 (12.5%) |
| Total | 13,234 (100.0%) | 6,714 (100.0%) |
Real Estate & Mortgages in Gibson County
Real Estate and Mortgage Overview in Gibson County
| Characteristic | Without Mortgage | With Mortgage |
| Housing Units | 6,303 | 6,931 |
| Median Property Value | $94,900 | $165,200 |
| Median Household Income | $50,329 | $1,124 |
| Monthly Housing Costs | $406 | $201 |
| Real Estate Taxes | $827 | $267 |
Property Value by Mortgage Status in Gibson County
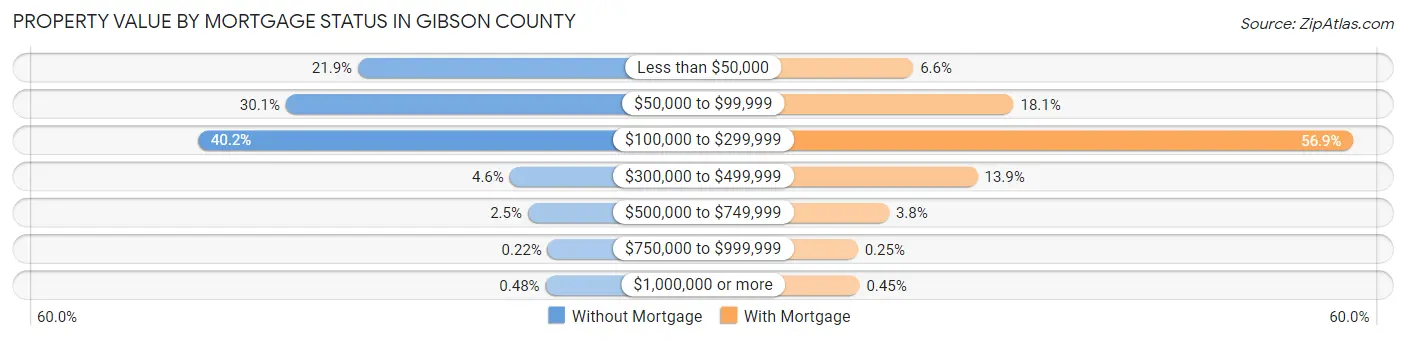
| Property Value | Without Mortgage | With Mortgage |
| Less than $50,000 | 1,381 (21.9%) | 457 (6.6%) |
| $50,000 to $99,999 | 1,900 (30.1%) | 1,252 (18.1%) |
| $100,000 to $299,999 | 2,533 (40.2%) | 3,943 (56.9%) |
| $300,000 to $499,999 | 288 (4.6%) | 966 (13.9%) |
| $500,000 to $749,999 | 157 (2.5%) | 265 (3.8%) |
| $750,000 to $999,999 | 14 (0.2%) | 17 (0.3%) |
| $1,000,000 or more | 30 (0.5%) | 31 (0.4%) |
| Total | 6,303 (100.0%) | 6,931 (100.0%) |
Household Income by Mortgage Status in Gibson County
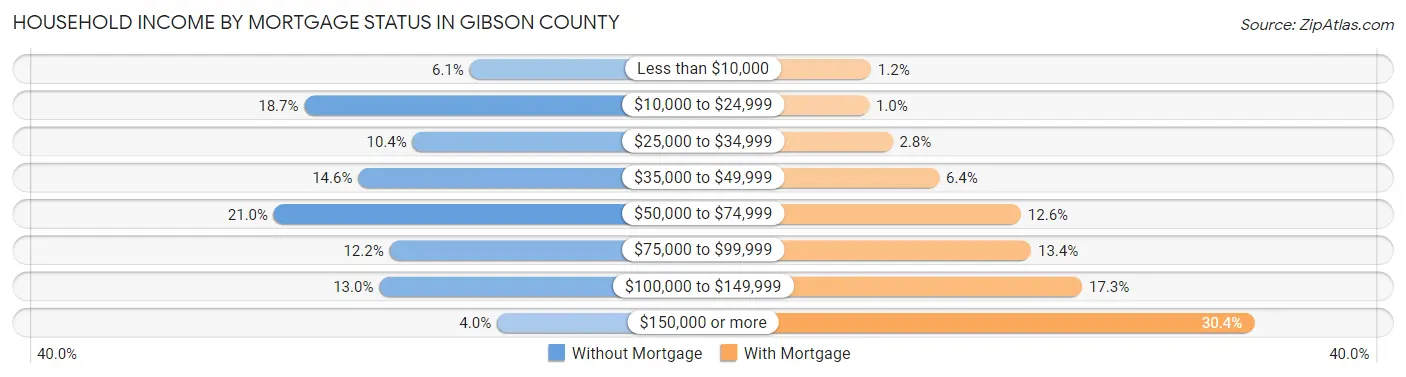
| Household Income | Without Mortgage | With Mortgage |
| Less than $10,000 | 384 (6.1%) | 81 (1.2%) |
| $10,000 to $24,999 | 1,178 (18.7%) | 71 (1.0%) |
| $25,000 to $34,999 | 658 (10.4%) | 195 (2.8%) |
| $35,000 to $49,999 | 919 (14.6%) | 441 (6.4%) |
| $50,000 to $74,999 | 1,324 (21.0%) | 873 (12.6%) |
| $75,000 to $99,999 | 769 (12.2%) | 927 (13.4%) |
| $100,000 to $149,999 | 818 (13.0%) | 1,196 (17.3%) |
| $150,000 or more | 253 (4.0%) | 2,104 (30.4%) |
| Total | 6,303 (100.0%) | 6,931 (100.0%) |
Property Value to Household Income Ratio in Gibson County
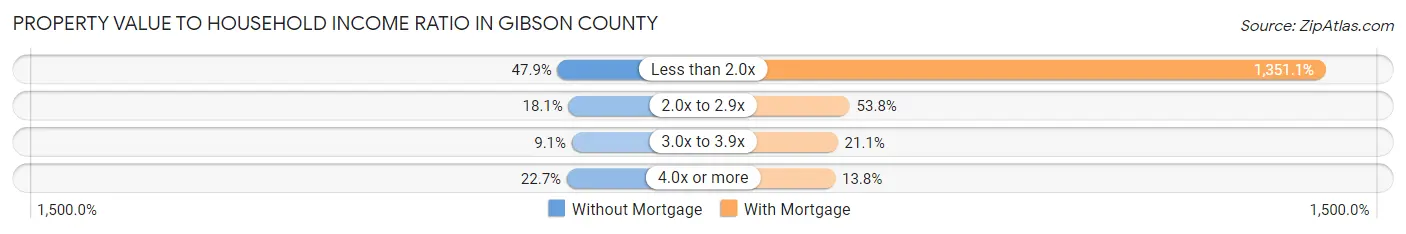
| Value-to-Income Ratio | Without Mortgage | With Mortgage |
| Less than 2.0x | 3,017 (47.9%) | 93,646 (1,351.1%) |
| 2.0x to 2.9x | 1,139 (18.1%) | 3,727 (53.8%) |
| 3.0x to 3.9x | 576 (9.1%) | 1,460 (21.1%) |
| 4.0x or more | 1,430 (22.7%) | 959 (13.8%) |
| Total | 6,303 (100.0%) | 6,931 (100.0%) |
Real Estate Taxes by Mortgage Status in Gibson County
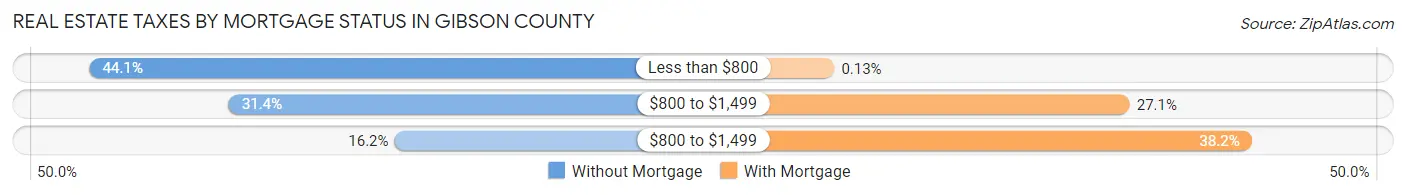
| Property Taxes | Without Mortgage | With Mortgage |
| Less than $800 | 2,778 (44.1%) | 9 (0.1%) |
| $800 to $1,499 | 1,976 (31.4%) | 1,878 (27.1%) |
| $800 to $1,499 | 1,023 (16.2%) | 2,649 (38.2%) |
| Total | 6,303 (100.0%) | 6,931 (100.0%) |
Health & Disability in Gibson County
Health Insurance Coverage by Age in Gibson County
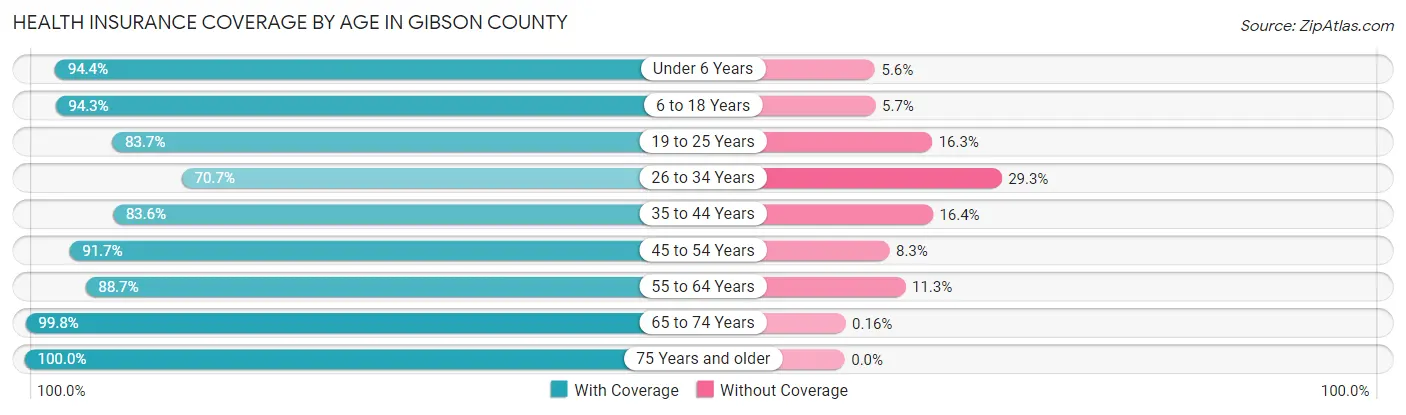
| Age Bracket | With Coverage | Without Coverage |
| Under 6 Years | 3,597 (94.4%) | 215 (5.6%) |
| 6 to 18 Years | 8,503 (94.3%) | 518 (5.7%) |
| 19 to 25 Years | 2,834 (83.7%) | 552 (16.3%) |
| 26 to 34 Years | 4,014 (70.7%) | 1,660 (29.3%) |
| 35 to 44 Years | 5,399 (83.6%) | 1,062 (16.4%) |
| 45 to 54 Years | 5,638 (91.7%) | 513 (8.3%) |
| 55 to 64 Years | 5,924 (88.7%) | 756 (11.3%) |
| 65 to 74 Years | 5,020 (99.8%) | 8 (0.2%) |
| 75 Years and older | 3,225 (100.0%) | 0 (0.0%) |
| Total | 44,154 (89.3%) | 5,284 (10.7%) |
Health Insurance Coverage by Citizenship Status in Gibson County
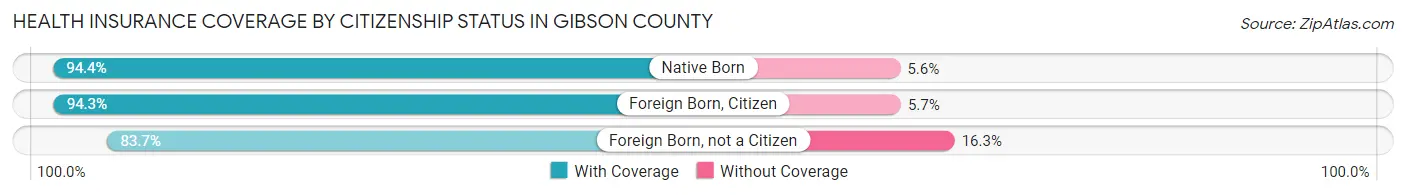
| Citizenship Status | With Coverage | Without Coverage |
| Native Born | 3,597 (94.4%) | 215 (5.6%) |
| Foreign Born, Citizen | 8,503 (94.3%) | 518 (5.7%) |
| Foreign Born, not a Citizen | 2,834 (83.7%) | 552 (16.3%) |
Health Insurance Coverage by Household Income in Gibson County
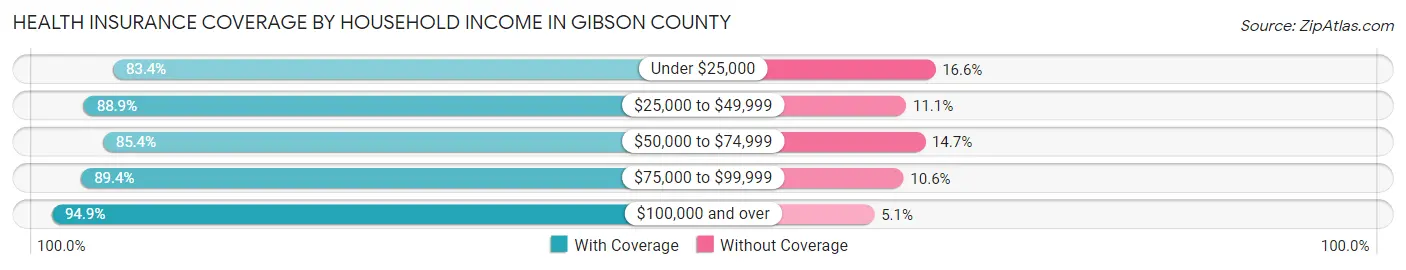
| Household Income | With Coverage | Without Coverage |
| Under $25,000 | 6,347 (83.4%) | 1,260 (16.6%) |
| $25,000 to $49,999 | 9,504 (88.9%) | 1,187 (11.1%) |
| $50,000 to $74,999 | 7,260 (85.4%) | 1,246 (14.6%) |
| $75,000 to $99,999 | 6,616 (89.4%) | 785 (10.6%) |
| $100,000 and over | 14,354 (94.9%) | 778 (5.1%) |
Public vs Private Health Insurance Coverage by Age in Gibson County
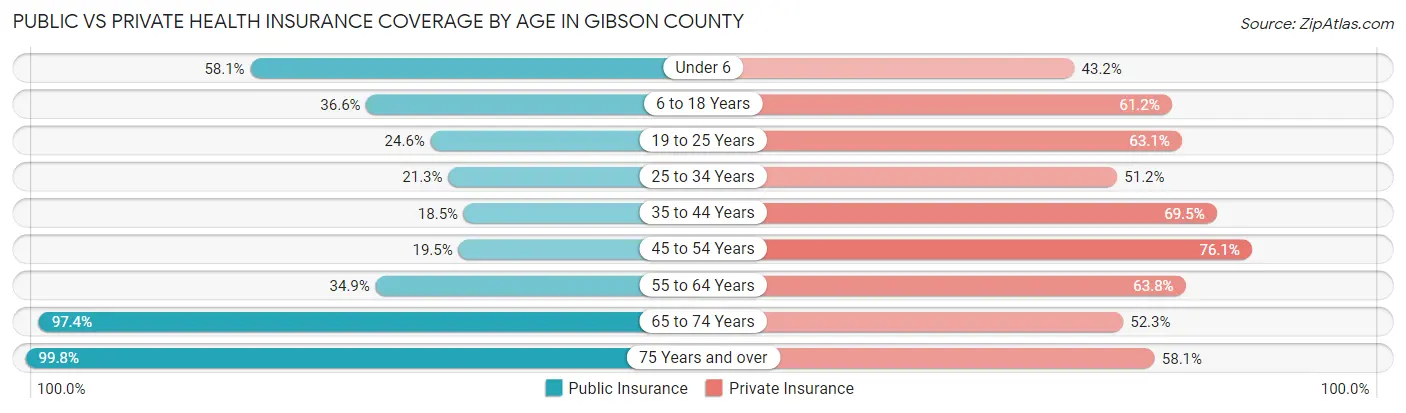
| Age Bracket | Public Insurance | Private Insurance |
| Under 6 | 2,214 (58.1%) | 1,647 (43.2%) |
| 6 to 18 Years | 3,298 (36.6%) | 5,521 (61.2%) |
| 19 to 25 Years | 834 (24.6%) | 2,136 (63.1%) |
| 25 to 34 Years | 1,211 (21.3%) | 2,902 (51.1%) |
| 35 to 44 Years | 1,193 (18.5%) | 4,493 (69.5%) |
| 45 to 54 Years | 1,197 (19.5%) | 4,679 (76.1%) |
| 55 to 64 Years | 2,328 (34.8%) | 4,260 (63.8%) |
| 65 to 74 Years | 4,895 (97.4%) | 2,627 (52.2%) |
| 75 Years and over | 3,219 (99.8%) | 1,874 (58.1%) |
| Total | 20,389 (41.2%) | 30,139 (61.0%) |
Disability Status by Sex by Age in Gibson County
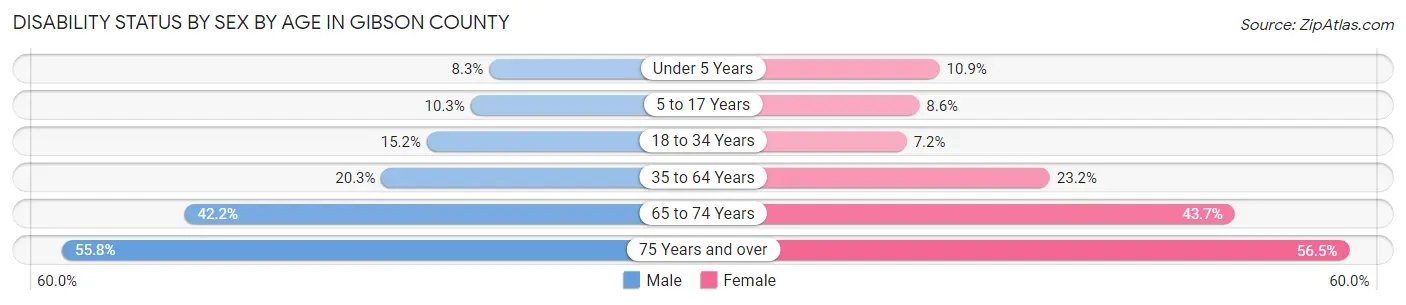
| Age Bracket | Male | Female |
| Under 5 Years | 123 (8.3%) | 163 (10.9%) |
| 5 to 17 Years | 481 (10.3%) | 393 (8.6%) |
| 18 to 34 Years | 718 (15.2%) | 360 (7.2%) |
| 35 to 64 Years | 1,906 (20.3%) | 2,292 (23.2%) |
| 65 to 74 Years | 978 (42.2%) | 1,185 (43.7%) |
| 75 Years and over | 666 (55.8%) | 1,148 (56.5%) |
Disability Class by Sex by Age in Gibson County
Disability Class: Hearing Difficulty
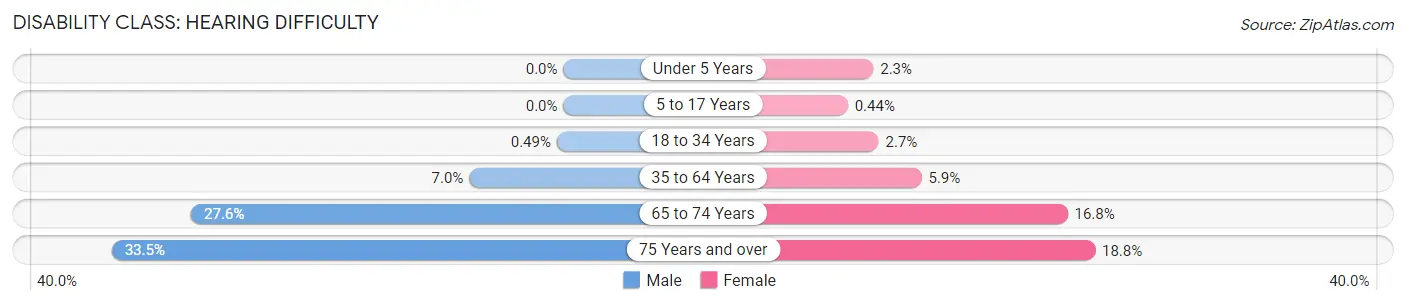
| Age Bracket | Male | Female |
| Under 5 Years | 0 (0.0%) | 35 (2.3%) |
| 5 to 17 Years | 0 (0.0%) | 20 (0.4%) |
| 18 to 34 Years | 23 (0.5%) | 136 (2.7%) |
| 35 to 64 Years | 657 (7.0%) | 585 (5.9%) |
| 65 to 74 Years | 641 (27.6%) | 454 (16.8%) |
| 75 Years and over | 400 (33.5%) | 382 (18.8%) |
Disability Class: Vision Difficulty
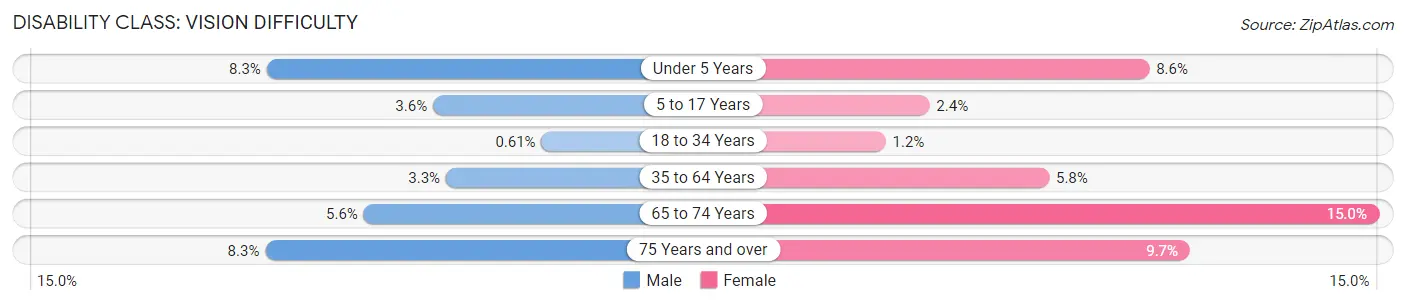
| Age Bracket | Male | Female |
| Under 5 Years | 123 (8.3%) | 128 (8.6%) |
| 5 to 17 Years | 169 (3.6%) | 111 (2.4%) |
| 18 to 34 Years | 29 (0.6%) | 61 (1.2%) |
| 35 to 64 Years | 307 (3.3%) | 571 (5.8%) |
| 65 to 74 Years | 129 (5.6%) | 405 (14.9%) |
| 75 Years and over | 99 (8.3%) | 197 (9.7%) |
Disability Class: Cognitive Difficulty
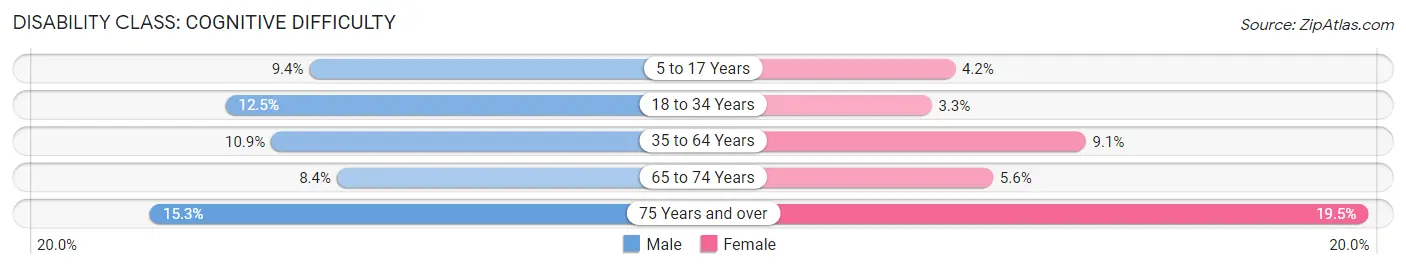
| Age Bracket | Male | Female |
| 5 to 17 Years | 439 (9.4%) | 191 (4.2%) |
| 18 to 34 Years | 592 (12.5%) | 166 (3.3%) |
| 35 to 64 Years | 1,020 (10.8%) | 895 (9.0%) |
| 65 to 74 Years | 195 (8.4%) | 152 (5.6%) |
| 75 Years and over | 183 (15.3%) | 397 (19.5%) |
Disability Class: Ambulatory Difficulty
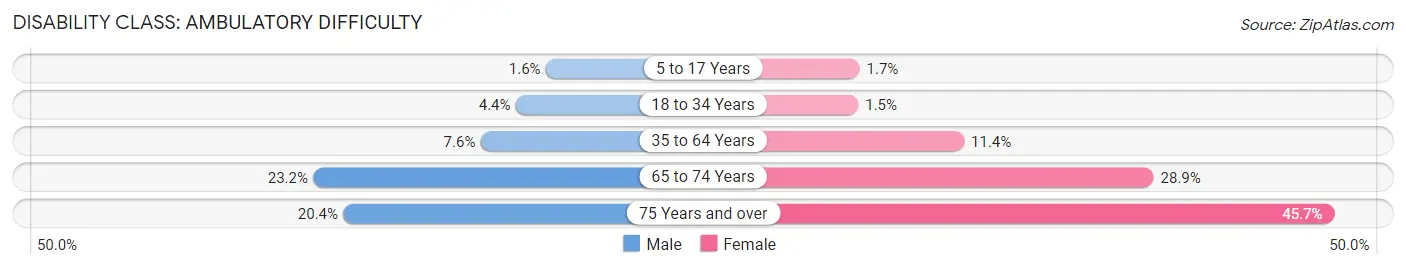
| Age Bracket | Male | Female |
| 5 to 17 Years | 73 (1.6%) | 75 (1.7%) |
| 18 to 34 Years | 206 (4.4%) | 76 (1.5%) |
| 35 to 64 Years | 716 (7.6%) | 1,123 (11.4%) |
| 65 to 74 Years | 537 (23.2%) | 784 (28.9%) |
| 75 Years and over | 243 (20.4%) | 929 (45.7%) |
Disability Class: Self-Care Difficulty
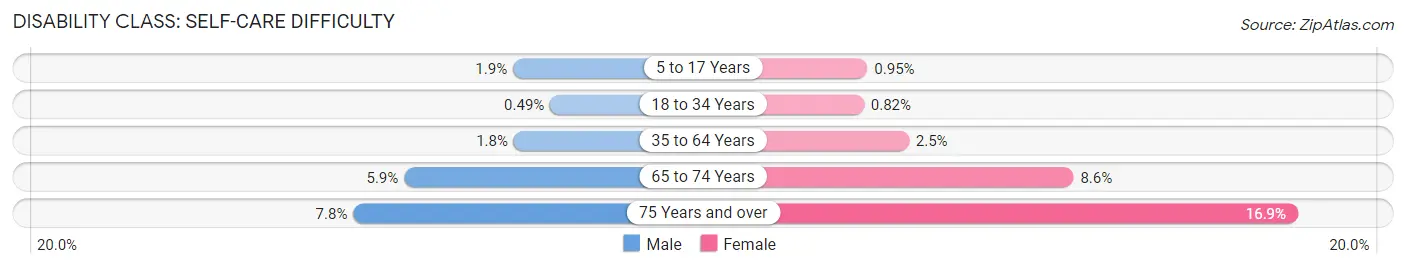
| Age Bracket | Male | Female |
| 5 to 17 Years | 87 (1.9%) | 43 (0.9%) |
| 18 to 34 Years | 23 (0.5%) | 41 (0.8%) |
| 35 to 64 Years | 173 (1.8%) | 246 (2.5%) |
| 65 to 74 Years | 137 (5.9%) | 233 (8.6%) |
| 75 Years and over | 93 (7.8%) | 344 (16.9%) |
Technology Access in Gibson County
Computing Device Access in Gibson County
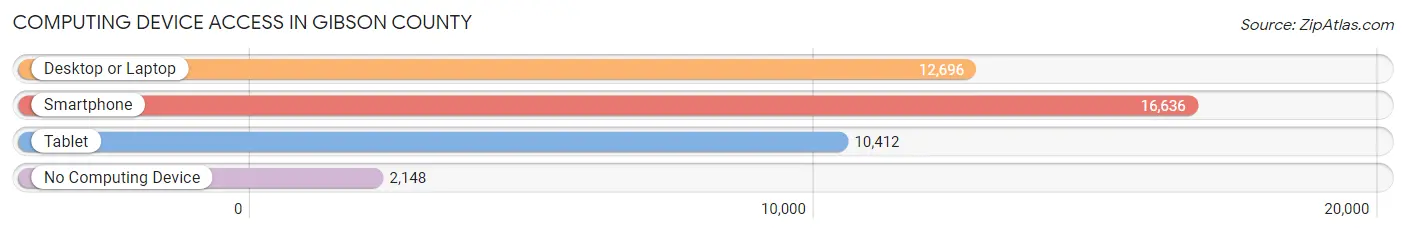
| Device Type | # Households | % Households |
| Desktop or Laptop | 12,696 | 63.6% |
| Smartphone | 16,636 | 83.4% |
| Tablet | 10,412 | 52.2% |
| No Computing Device | 2,148 | 10.8% |
| Total | 19,948 | 100.0% |
Internet Access in Gibson County
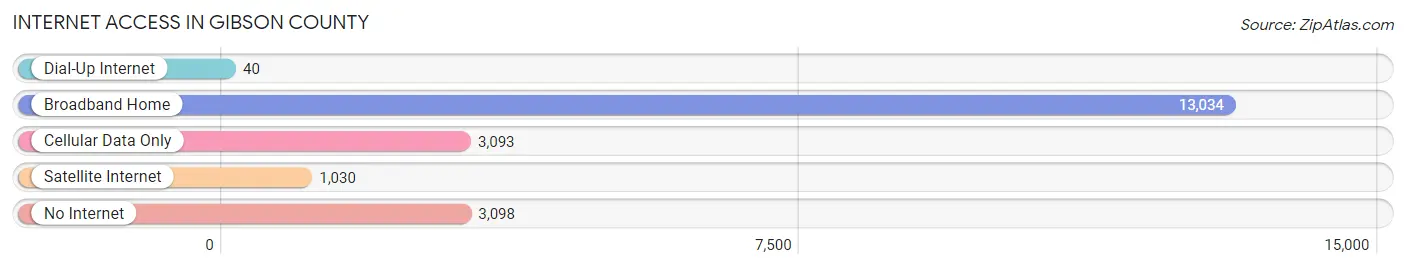
| Internet Type | # Households | % Households |
| Dial-Up Internet | 40 | 0.2% |
| Broadband Home | 13,034 | 65.3% |
| Cellular Data Only | 3,093 | 15.5% |
| Satellite Internet | 1,030 | 5.2% |
| No Internet | 3,098 | 15.5% |
| Total | 19,948 | 100.0% |
Gibson County Summary
Gibson County is located in the western part of the state of Tennessee, in the United States. It is bordered by Carroll County to the north, Madison County to the east, Crockett County to the south, and Dyer County to the west. The county seat is Trenton, and the largest city is Humboldt. The county was established in 1823 and named for John Gibson, a Revolutionary War veteran and early settler of the area.
Geography
Gibson County covers an area of 545 square miles, making it the 33rd largest county in Tennessee. It is located in the western part of the state, and is part of the Jackson Purchase region. The terrain is mostly flat, with some rolling hills in the northern part of the county. The county is drained by the South Fork of the Obion River, which flows through the center of the county. The county is also home to several small lakes, including Reelfoot Lake, which is located in the northern part of the county.
The climate of Gibson County is humid subtropical, with hot, humid summers and mild winters. The average annual temperature is around 63°F, and the average annual precipitation is around 45 inches.
Demographics
As of the 2010 census, there were 49,683 people, 19,845 households, and 14,072 families living in Gibson County. The population density was 91.2 people per square mile. The racial makeup of the county was 79.2% White, 17.7% African American, 0.3% Native American, 0.4% Asian, 0.1% Pacific Islander, 1.2% from other races, and 1.1% from two or more races. Hispanic or Latino of any race were 2.7% of the population.
The median income for a household in Gibson County was $37,845, and the median income for a family was $45,945. The per capita income for the county was $18,845. About 17.2% of families and 21.2% of the population were below the poverty line, including 28.2% of those under age 18 and 16.2% of those age 65 or over.
Economy
Gibson County is primarily an agricultural county, with the majority of the population employed in farming and related industries. The county is home to several large farms, including the Gibson County Farm Bureau, which is the largest farm in the county. Other major industries in the county include manufacturing, retail, and healthcare.
The county is also home to several large employers, including the Gibson County Special School District, Gibson County Utility District, and the Gibson County Sheriff's Office. The county is also home to several colleges and universities, including the University of Tennessee at Martin, Bethel University, and the University of Memphis.
Conclusion
Gibson County is a rural county located in the western part of Tennessee. It is home to a diverse population, with a strong agricultural economy. The county is home to several large employers, and is also home to several colleges and universities. The county has a humid subtropical climate, with hot, humid summers and mild winters. The median income for a household in Gibson County is $37,845, and the per capita income for the county is $18,845.
Common Questions
What is the Total Population of Gibson County?
Total Population of Gibson County is 50,455.
What is the Total Male Population of Gibson County?
Total Male Population of Gibson County is 24,364.
What is the Total Female Population of Gibson County?
Total Female Population of Gibson County is 26,091.
What is the Ratio of Males per 100 Females in Gibson County?
There are 93.38 Males per 100 Females in Gibson County.
What is the Ratio of Females per 100 Males in Gibson County?
There are 107.09 Females per 100 Males in Gibson County.
What is the Median Population Age in Gibson County?
Median Population Age in Gibson County is 39.8 Years.
What is the Average Family Size in Gibson County
Average Family Size in Gibson County is 3.1 People.
What is the Average Household Size in Gibson County
Average Household Size in Gibson County is 2.5 People.
What is Per Capita Income in Gibson County?
Per Capita income in Gibson County is $27,742.
What is the Median Family Income in Gibson County?
Median Family Income in Gibson County is $69,813.
What is the Median Household income in Gibson County?
Median Household Income in Gibson County is $55,455.
What is Income or Wage Gap in Gibson County?
Income or Wage Gap in Gibson County is 23.3%.
Women in Gibson County earn 76.7 cents for every dollar earned by a man.
What is Family Income Deficit in Gibson County?
Family Income Deficit in Gibson County is $11,625.
Families that are below poverty line in Gibson County earn $11,625 less on average than the poverty threshold level.
What is Inequality or Gini Index in Gibson County?
Inequality or Gini Index in Gibson County is 0.44.
How Large is the Labor Force in Gibson County?
There are 22,842 People in the Labor Forcein in Gibson County.
What is the Percentage of People in the Labor Force in Gibson County?
57.7% of People are in the Labor Force in Gibson County.
What is the Unemployment Rate in Gibson County?
Unemployment Rate in Gibson County is 5.4%.