Fayette County, TN
Fayette County Overview
42,228
TOTAL POPULATION
21,068
MALE POPULATION
21,160
FEMALE POPULATION
99.57
MALES / 100 FEMALES
100.44
FEMALES / 100 MALES
46.8
MEDIAN AGE
3.0
AVG FAMILY SIZE
2.5
AVG HOUSEHOLD SIZE
$40,613
PER CAPITA INCOME
$96,675
AVG FAMILY INCOME
$81,074
AVG HOUSEHOLD INCOME
32.3%
WAGE / INCOME GAP [ % ]
67.7¢/ $1
WAGE / INCOME GAP [ $ ]
$8,574
FAMILY INCOME DEFICIT
0.44
INEQUALITY / GINI INDEX
20,583
LABOR FORCE [ PEOPLE ]
58.1%
PERCENT IN LABOR FORCE
5.3%
UNEMPLOYMENT RATE
Fayette County Area Codes
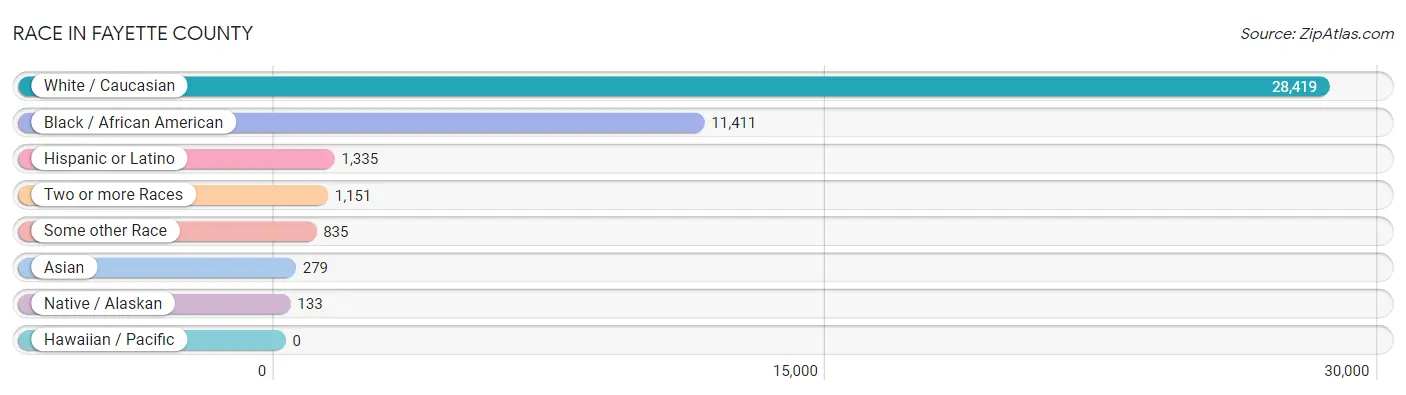
Race in Fayette County
The most populous races in Fayette County are White / Caucasian (28,419 | 67.3%), Black / African American (11,411 | 27.0%), and Hispanic or Latino (1,335 | 3.2%).
| Race | # Population | % Population |
| Asian | 279 | 0.7% |
| Black / African American | 11,411 | 27.0% |
| Hawaiian / Pacific | 0 | 0.0% |
| Hispanic or Latino | 1,335 | 3.2% |
| Native / Alaskan | 133 | 0.3% |
| White / Caucasian | 28,419 | 67.3% |
| Two or more Races | 1,151 | 2.7% |
| Some other Race | 835 | 2.0% |
| Total | 42,228 | 100.0% |
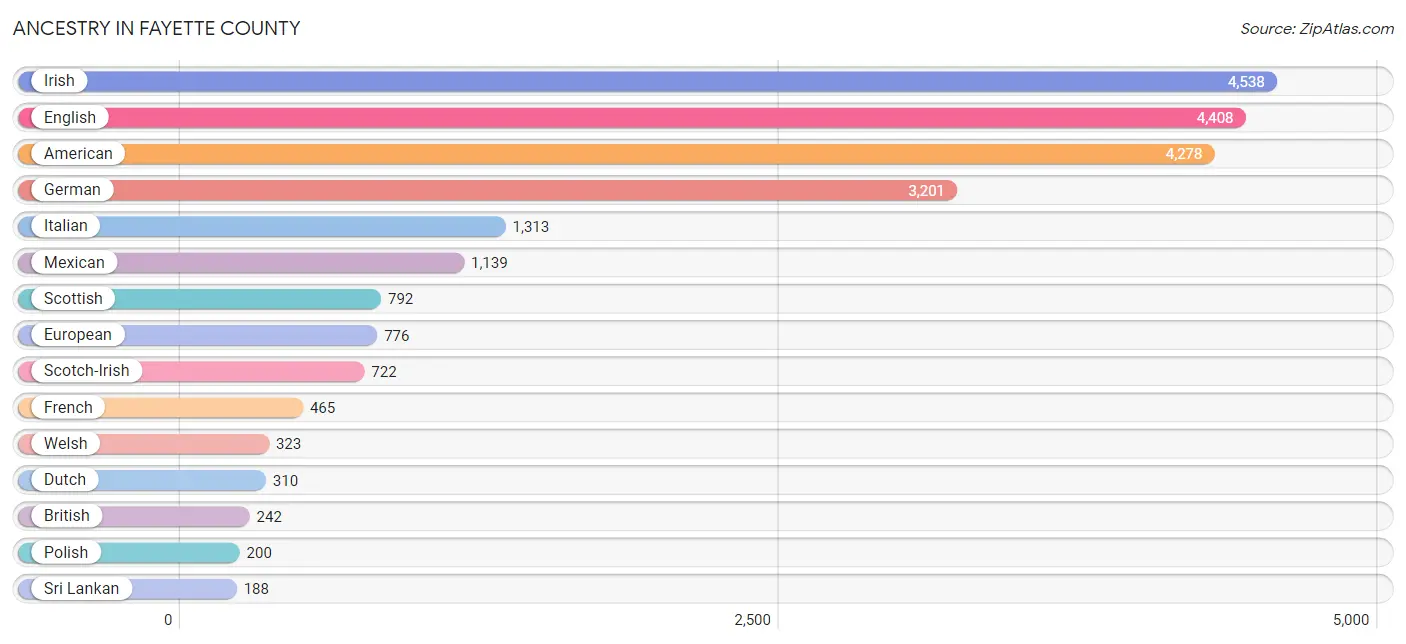
Ancestry in Fayette County
The most populous ancestries reported in Fayette County are Irish (4,538 | 10.7%), English (4,408 | 10.4%), American (4,278 | 10.1%), German (3,201 | 7.6%), and Italian (1,313 | 3.1%), together accounting for 42.0% of all Fayette County residents.
| Ancestry | # Population | % Population |
| African | 87 | 0.2% |
| American | 4,278 | 10.1% |
| Arab | 117 | 0.3% |
| Australian | 1 | 0.0% |
| Austrian | 31 | 0.1% |
| Belgian | 11 | 0.0% |
| Bhutanese | 28 | 0.1% |
| Brazilian | 3 | 0.0% |
| British | 242 | 0.6% |
| Burmese | 7 | 0.0% |
| Canadian | 67 | 0.2% |
| Central American | 31 | 0.1% |
| Cherokee | 151 | 0.4% |
| Chickasaw | 3 | 0.0% |
| Colombian | 8 | 0.0% |
| Costa Rican | 1 | 0.0% |
| Creek | 2 | 0.0% |
| Croatian | 12 | 0.0% |
| Cuban | 39 | 0.1% |
| Czech | 18 | 0.0% |
| Czechoslovakian | 15 | 0.0% |
| Danish | 32 | 0.1% |
| Dominican | 37 | 0.1% |
| Dutch | 310 | 0.7% |
| Dutch West Indian | 28 | 0.1% |
| Eastern European | 59 | 0.1% |
| English | 4,408 | 10.4% |
| European | 776 | 1.8% |
| Filipino | 1 | 0.0% |
| French | 465 | 1.1% |
| French Canadian | 30 | 0.1% |
| German | 3,201 | 7.6% |
| German Russian | 14 | 0.0% |
| Greek | 40 | 0.1% |
| Haitian | 26 | 0.1% |
| Honduran | 3 | 0.0% |
| Hungarian | 19 | 0.0% |
| Indian (Asian) | 56 | 0.1% |
| Indonesian | 36 | 0.1% |
| Inupiat | 1 | 0.0% |
| Iranian | 1 | 0.0% |
| Iraqi | 77 | 0.2% |
| Irish | 4,538 | 10.7% |
| Iroquois | 6 | 0.0% |
| Italian | 1,313 | 3.1% |
| Jamaican | 5 | 0.0% |
| Korean | 44 | 0.1% |
| Laotian | 6 | 0.0% |
| Lebanese | 28 | 0.1% |
| Lithuanian | 12 | 0.0% |
| Mexican | 1,139 | 2.7% |
| Nicaraguan | 17 | 0.0% |
| Northern European | 76 | 0.2% |
| Norwegian | 37 | 0.1% |
| Pakistani | 31 | 0.1% |
| Peruvian | 14 | 0.0% |
| Polish | 200 | 0.5% |
| Portuguese | 4 | 0.0% |
| Puerto Rican | 55 | 0.1% |
| Romanian | 12 | 0.0% |
| Russian | 49 | 0.1% |
| Salvadoran | 10 | 0.0% |
| Samoan | 10 | 0.0% |
| Scandinavian | 142 | 0.3% |
| Scotch-Irish | 722 | 1.7% |
| Scottish | 792 | 1.9% |
| Sioux | 23 | 0.1% |
| Slovak | 14 | 0.0% |
| South American | 26 | 0.1% |
| Spaniard | 5 | 0.0% |
| Sri Lankan | 188 | 0.4% |
| Subsaharan African | 87 | 0.2% |
| Swedish | 95 | 0.2% |
| Swiss | 20 | 0.1% |
| Thai | 6 | 0.0% |
| Ukrainian | 99 | 0.2% |
| Venezuelan | 4 | 0.0% |
| Welsh | 323 | 0.8% | View All 78 Rows |
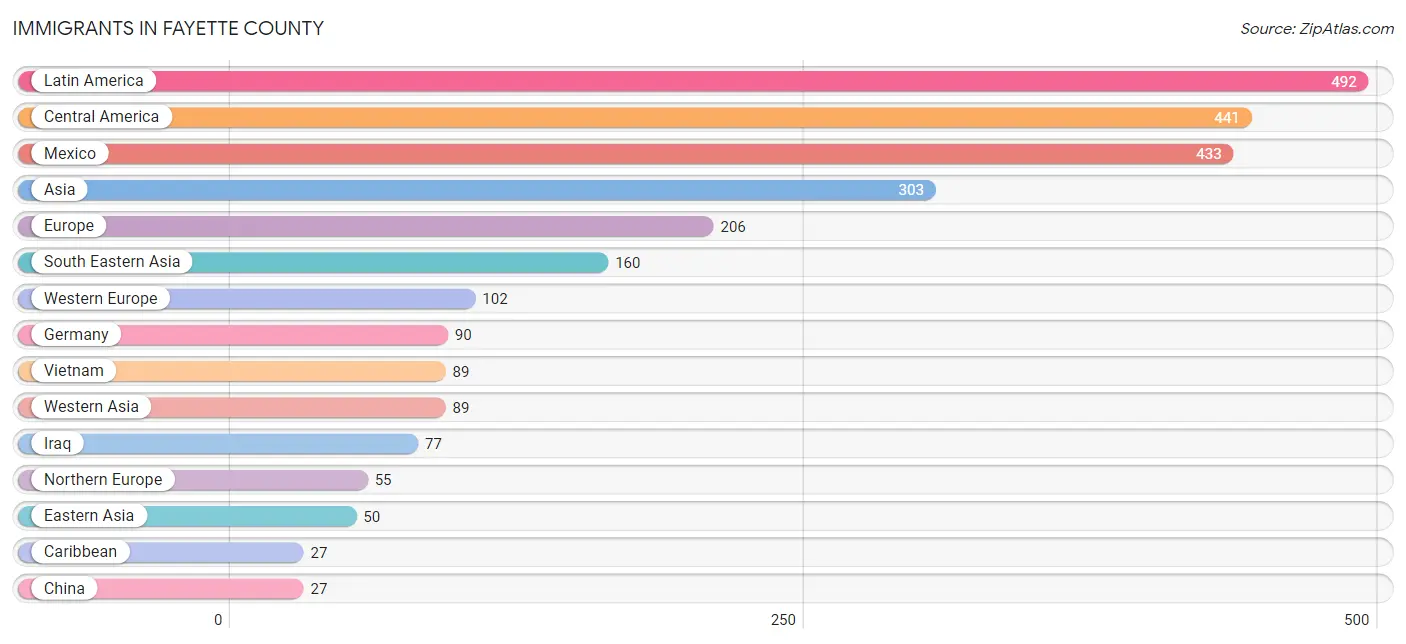
Immigrants in Fayette County
The most numerous immigrant groups reported in Fayette County came from Latin America (492 | 1.2%), Central America (441 | 1.0%), Mexico (433 | 1.0%), Asia (303 | 0.7%), and Europe (206 | 0.5%), together accounting for 4.4% of all Fayette County residents.
| Immigration Origin | # Population | % Population |
| Africa | 16 | 0.0% |
| Asia | 303 | 0.7% |
| Australia | 1 | 0.0% |
| Austria | 6 | 0.0% |
| Brazil | 3 | 0.0% |
| Cambodia | 5 | 0.0% |
| Canada | 13 | 0.0% |
| Caribbean | 27 | 0.1% |
| Central America | 441 | 1.0% |
| China | 27 | 0.1% |
| Colombia | 3 | 0.0% |
| Costa Rica | 1 | 0.0% |
| Czechoslovakia | 6 | 0.0% |
| Denmark | 10 | 0.0% |
| Dominican Republic | 27 | 0.1% |
| Eastern Africa | 16 | 0.0% |
| Eastern Asia | 50 | 0.1% |
| Eastern Europe | 27 | 0.1% |
| England | 15 | 0.0% |
| Europe | 206 | 0.5% |
| Germany | 90 | 0.2% |
| Honduras | 3 | 0.0% |
| Hong Kong | 3 | 0.0% |
| Iraq | 77 | 0.2% |
| Italy | 22 | 0.1% |
| Japan | 20 | 0.1% |
| Kenya | 16 | 0.0% |
| Korea | 3 | 0.0% |
| Latin America | 492 | 1.2% |
| Malaysia | 20 | 0.1% |
| Mexico | 433 | 1.0% |
| Nepal | 4 | 0.0% |
| Netherlands | 6 | 0.0% |
| Nicaragua | 4 | 0.0% |
| Northern Europe | 55 | 0.1% |
| Oceania | 1 | 0.0% |
| Peru | 14 | 0.0% |
| Philippines | 17 | 0.0% |
| Saudi Arabia | 12 | 0.0% |
| Scotland | 17 | 0.0% |
| Singapore | 5 | 0.0% |
| South America | 24 | 0.1% |
| South Central Asia | 4 | 0.0% |
| South Eastern Asia | 160 | 0.4% |
| Southern Europe | 22 | 0.1% |
| Taiwan | 8 | 0.0% |
| Ukraine | 21 | 0.1% |
| Venezuela | 4 | 0.0% |
| Vietnam | 89 | 0.2% |
| Western Asia | 89 | 0.2% |
| Western Europe | 102 | 0.2% | View All 51 Rows |
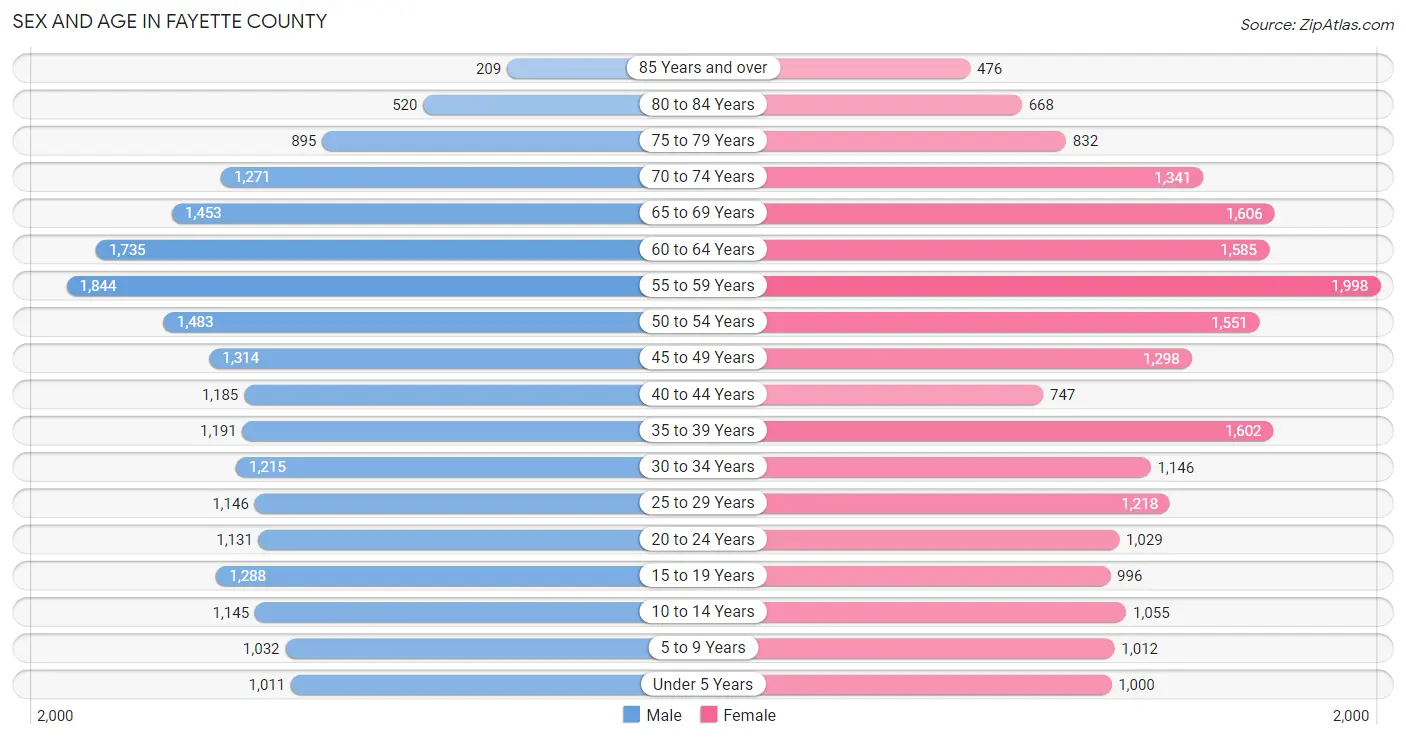
Sex and Age in Fayette County
Sex and Age in Fayette County
The most populous age groups in Fayette County are 55 to 59 Years (1,844 | 8.7%) for men and 55 to 59 Years (1,998 | 9.4%) for women.
| Age Bracket | Male | Female |
| Under 5 Years | 1,011 (4.8%) | 1,000 (4.7%) |
| 5 to 9 Years | 1,032 (4.9%) | 1,012 (4.8%) |
| 10 to 14 Years | 1,145 (5.4%) | 1,055 (5.0%) |
| 15 to 19 Years | 1,288 (6.1%) | 996 (4.7%) |
| 20 to 24 Years | 1,131 (5.4%) | 1,029 (4.9%) |
| 25 to 29 Years | 1,146 (5.4%) | 1,218 (5.8%) |
| 30 to 34 Years | 1,215 (5.8%) | 1,146 (5.4%) |
| 35 to 39 Years | 1,191 (5.7%) | 1,602 (7.6%) |
| 40 to 44 Years | 1,185 (5.6%) | 747 (3.5%) |
| 45 to 49 Years | 1,314 (6.2%) | 1,298 (6.1%) |
| 50 to 54 Years | 1,483 (7.0%) | 1,551 (7.3%) |
| 55 to 59 Years | 1,844 (8.7%) | 1,998 (9.4%) |
| 60 to 64 Years | 1,735 (8.2%) | 1,585 (7.5%) |
| 65 to 69 Years | 1,453 (6.9%) | 1,606 (7.6%) |
| 70 to 74 Years | 1,271 (6.0%) | 1,341 (6.3%) |
| 75 to 79 Years | 895 (4.3%) | 832 (3.9%) |
| 80 to 84 Years | 520 (2.5%) | 668 (3.2%) |
| 85 Years and over | 209 (1.0%) | 476 (2.2%) |
| Total | 21,068 (100.0%) | 21,160 (100.0%) |
Families and Households in Fayette County
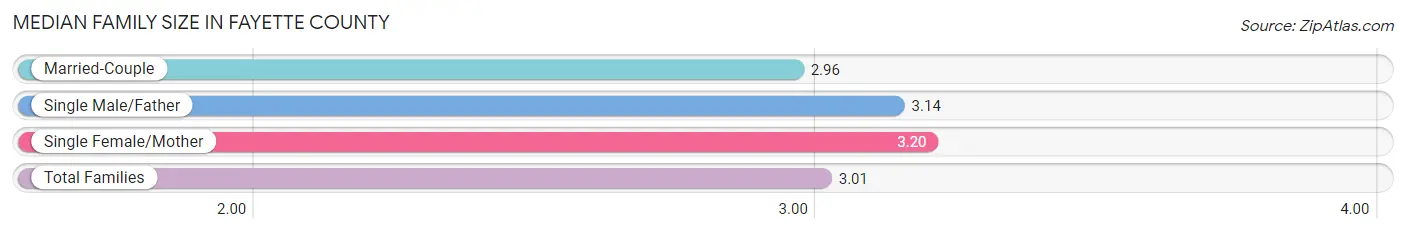
Median Family Size in Fayette County
The median family size in Fayette County is 3.01 persons per family, with single female/mother families (1,746 | 14.7%) accounting for the largest median family size of 3.2 persons per family. On the other hand, married-couple families (9,268 | 77.8%) represent the smallest median family size with 2.96 persons per family.
| Family Type | # Families | Family Size |
| Married-Couple | 9,268 (77.8%) | 2.96 |
| Single Male/Father | 893 (7.5%) | 3.14 |
| Single Female/Mother | 1,746 (14.7%) | 3.20 |
| Total Families | 11,907 (100.0%) | 3.01 |
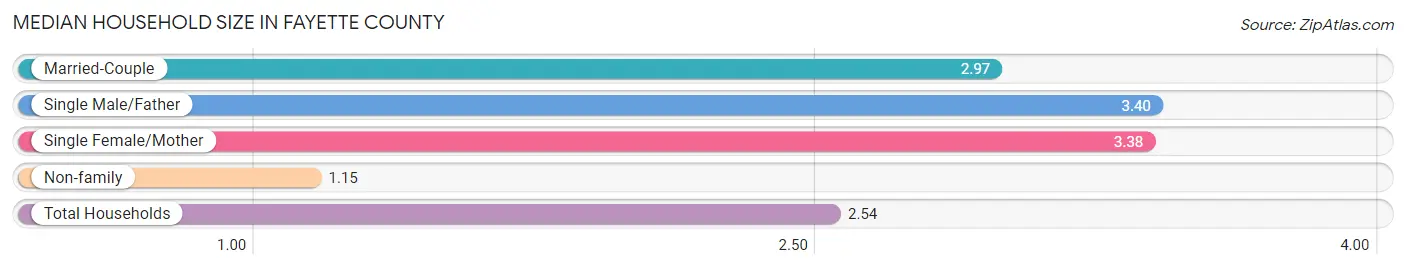
Median Household Size in Fayette County
The median household size in Fayette County is 2.54 persons per household, with single male/father households (893 | 5.4%) accounting for the largest median household size of 3.4 persons per household. non-family households (4,509 | 27.5%) represent the smallest median household size with 1.15 persons per household.
| Household Type | # Households | Household Size |
| Married-Couple | 9,268 (56.5%) | 2.97 |
| Single Male/Father | 893 (5.4%) | 3.40 |
| Single Female/Mother | 1,746 (10.6%) | 3.38 |
| Non-family | 4,509 (27.5%) | 1.15 |
| Total Households | 16,416 (100.0%) | 2.54 |
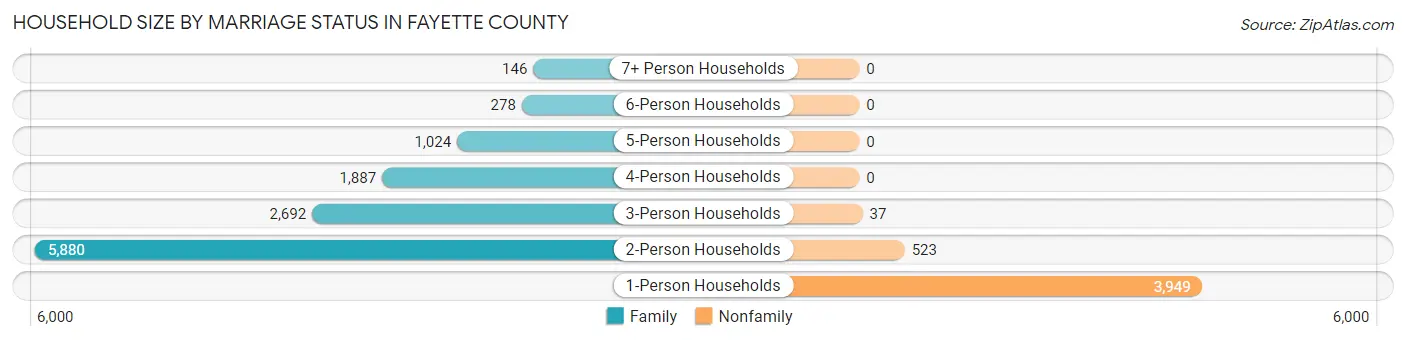
Household Size by Marriage Status in Fayette County
Out of a total of 16,416 households in Fayette County, 11,907 (72.5%) are family households, while 4,509 (27.5%) are nonfamily households. The most numerous type of family households are 2-person households, comprising 5,880, and the most common type of nonfamily households are 1-person households, comprising 3,949.
| Household Size | Family Households | Nonfamily Households |
| 1-Person Households | - | 3,949 (24.1%) |
| 2-Person Households | 5,880 (35.8%) | 523 (3.2%) |
| 3-Person Households | 2,692 (16.4%) | 37 (0.2%) |
| 4-Person Households | 1,887 (11.5%) | 0 (0.0%) |
| 5-Person Households | 1,024 (6.2%) | 0 (0.0%) |
| 6-Person Households | 278 (1.7%) | 0 (0.0%) |
| 7+ Person Households | 146 (0.9%) | 0 (0.0%) |
| Total | 11,907 (72.5%) | 4,509 (27.5%) |
Female Fertility in Fayette County
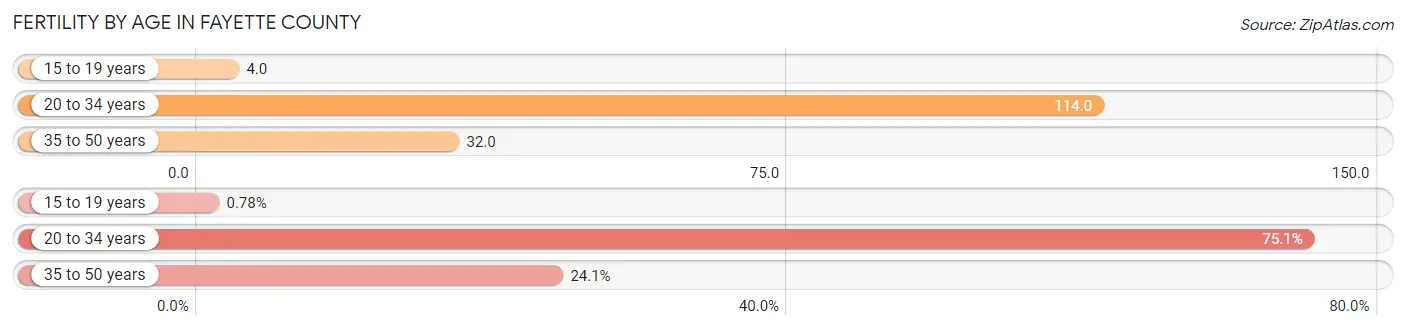
Fertility by Age in Fayette County
Average fertility rate in Fayette County is 62.0 births per 1,000 women. Women in the age bracket of 20 to 34 years have the highest fertility rate with 114.0 births per 1,000 women. Women in the age bracket of 20 to 34 years acount for 75.1% of all women with births.
| Age Bracket | Women with Births | Births / 1,000 Women |
| 15 to 19 years | 4 (0.8%) | 4.0 |
| 20 to 34 years | 386 (75.1%) | 114.0 |
| 35 to 50 years | 124 (24.1%) | 32.0 |
| Total | 514 (100.0%) | 62.0 |
Fertility by Age by Marriage Status in Fayette County
66.9% of women with births (514) in Fayette County are married. The highest percentage of unmarried women with births falls into 15 to 19 years age bracket with 100.0% of them unmarried at the time of birth, while the lowest percentage of unmarried women with births belong to 20 to 34 years age bracket with 30.8% of them unmarried.
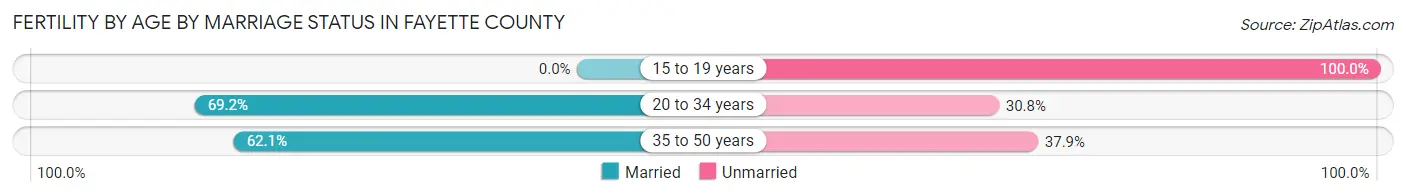
| Age Bracket | Married | Unmarried |
| 15 to 19 years | 0 (0.0%) | 4 (100.0%) |
| 20 to 34 years | 267 (69.2%) | 119 (30.8%) |
| 35 to 50 years | 77 (62.1%) | 47 (37.9%) |
| Total | 344 (66.9%) | 170 (33.1%) |
Fertility by Education in Fayette County
Average fertility rate in Fayette County is 62.0 births per 1,000 women. Women with the education attainment of bachelor's degree have the highest fertility rate of 106.0 births per 1,000 women, while women with the education attainment of less than high school have the lowest fertility at 6.0 births per 1,000 women. Women with the education attainment of college or associate's degree represent 39.7% of all women with births.
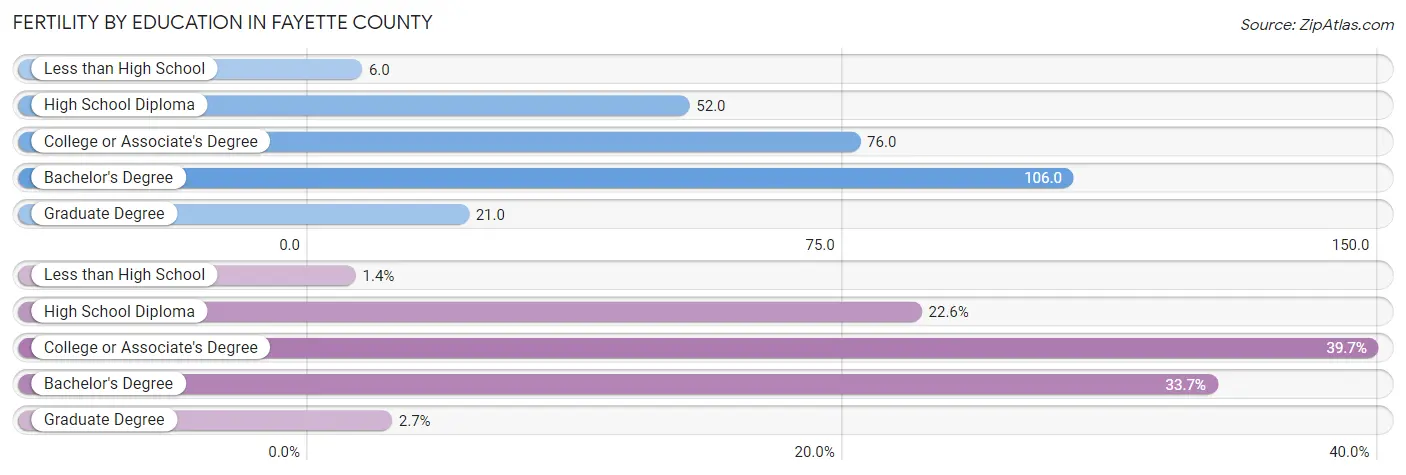
| Educational Attainment | Women with Births | Births / 1,000 Women |
| Less than High School | 7 (1.4%) | 6.0 |
| High School Diploma | 116 (22.6%) | 52.0 |
| College or Associate's Degree | 204 (39.7%) | 76.0 |
| Bachelor's Degree | 173 (33.7%) | 106.0 |
| Graduate Degree | 14 (2.7%) | 21.0 |
| Total | 514 (100.0%) | 62.0 |
Fertility by Education by Marriage Status in Fayette County
33.1% of women with births in Fayette County are unmarried. Women with the educational attainment of graduate degree are most likely to be married with 100.0% of them married at childbirth, while women with the educational attainment of college or associate's degree are least likely to be married with 46.6% of them unmarried at childbirth.
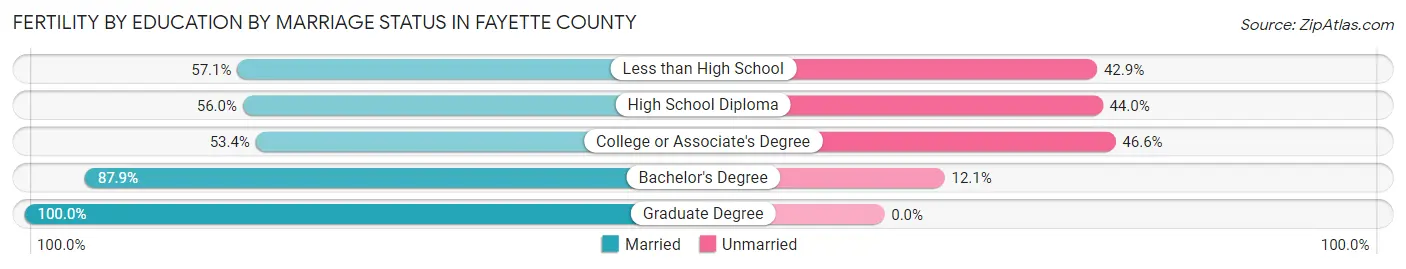
| Educational Attainment | Married | Unmarried |
| Less than High School | 4 (57.1%) | 3 (42.9%) |
| High School Diploma | 65 (56.0%) | 51 (44.0%) |
| College or Associate's Degree | 109 (53.4%) | 95 (46.6%) |
| Bachelor's Degree | 152 (87.9%) | 21 (12.1%) |
| Graduate Degree | 14 (100.0%) | 0 (0.0%) |
| Total | 344 (66.9%) | 170 (33.1%) |
Income in Fayette County
Income Overview in Fayette County
Per Capita Income in Fayette County is $40,613, while median incomes of families and households are $96,675 and $81,074 respectively.
| Characteristic | Number | Measure |
| Per Capita Income | 42,228 | $40,613 |
| Median Family Income | 11,907 | $96,675 |
| Mean Family Income | 11,907 | $118,017 |
| Median Household Income | 16,416 | $81,074 |
| Mean Household Income | 16,416 | $101,659 |
| Income Deficit | 11,907 | $8,574 |
| Wage / Income Gap (%) | 42,228 | 32.31% |
| Wage / Income Gap ($) | 42,228 | 67.69¢ per $1 |
| Gini / Inequality Index | 42,228 | 0.44 |
Earnings by Sex in Fayette County
Average Earnings in Fayette County are $42,253, $51,812 for men and $35,074 for women, a difference of 32.3%.
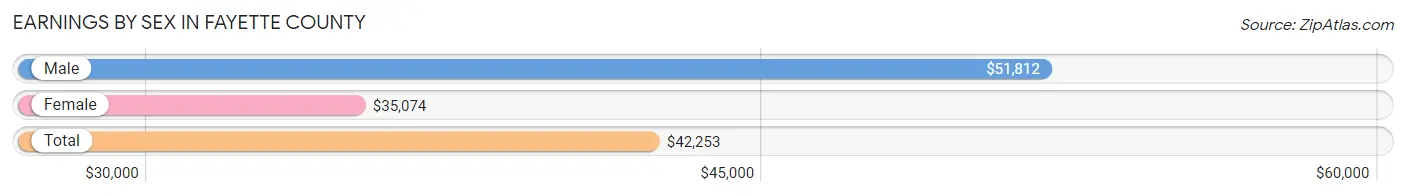
| Sex | Number | Average Earnings |
| Male | 11,550 (53.5%) | $51,812 |
| Female | 10,031 (46.5%) | $35,074 |
| Total | 21,581 (100.0%) | $42,253 |
Earnings by Sex by Income Bracket in Fayette County
The most common earnings brackets in Fayette County are $100,000+ for men (2,426 | 21.0%) and $35,000 to $39,999 for women (919 | 9.2%).
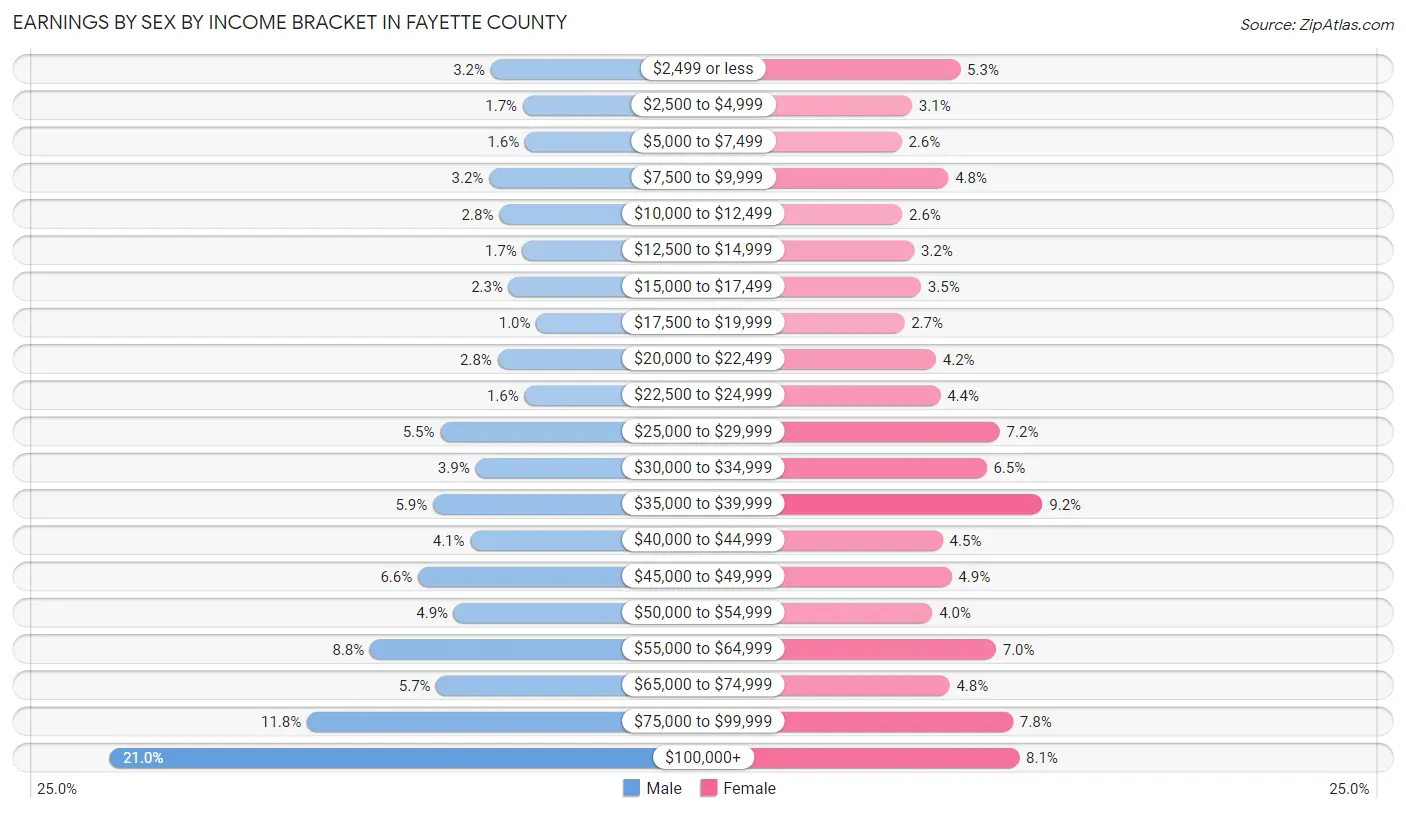
| Income | Male | Female |
| $2,499 or less | 365 (3.2%) | 533 (5.3%) |
| $2,500 to $4,999 | 192 (1.7%) | 306 (3.0%) |
| $5,000 to $7,499 | 180 (1.6%) | 257 (2.6%) |
| $7,500 to $9,999 | 374 (3.2%) | 476 (4.8%) |
| $10,000 to $12,499 | 320 (2.8%) | 260 (2.6%) |
| $12,500 to $14,999 | 193 (1.7%) | 316 (3.2%) |
| $15,000 to $17,499 | 268 (2.3%) | 348 (3.5%) |
| $17,500 to $19,999 | 119 (1.0%) | 270 (2.7%) |
| $20,000 to $22,499 | 328 (2.8%) | 418 (4.2%) |
| $22,500 to $24,999 | 183 (1.6%) | 439 (4.4%) |
| $25,000 to $29,999 | 639 (5.5%) | 718 (7.2%) |
| $30,000 to $34,999 | 448 (3.9%) | 656 (6.5%) |
| $35,000 to $39,999 | 678 (5.9%) | 919 (9.2%) |
| $40,000 to $44,999 | 476 (4.1%) | 450 (4.5%) |
| $45,000 to $49,999 | 759 (6.6%) | 492 (4.9%) |
| $50,000 to $54,999 | 565 (4.9%) | 401 (4.0%) |
| $55,000 to $64,999 | 1,019 (8.8%) | 700 (7.0%) |
| $65,000 to $74,999 | 659 (5.7%) | 482 (4.8%) |
| $75,000 to $99,999 | 1,359 (11.8%) | 780 (7.8%) |
| $100,000+ | 2,426 (21.0%) | 810 (8.1%) |
| Total | 11,550 (100.0%) | 10,031 (100.0%) |
Earnings by Sex by Educational Attainment in Fayette County
Average earnings in Fayette County are $57,600 for men and $36,851 for women, a difference of 36.0%. Men with an educational attainment of graduate degree enjoy the highest average annual earnings of $96,452, while those with high school diploma education earn the least with $45,958. Women with an educational attainment of graduate degree earn the most with the average annual earnings of $68,875, while those with less than high school education have the smallest earnings of $28,500.
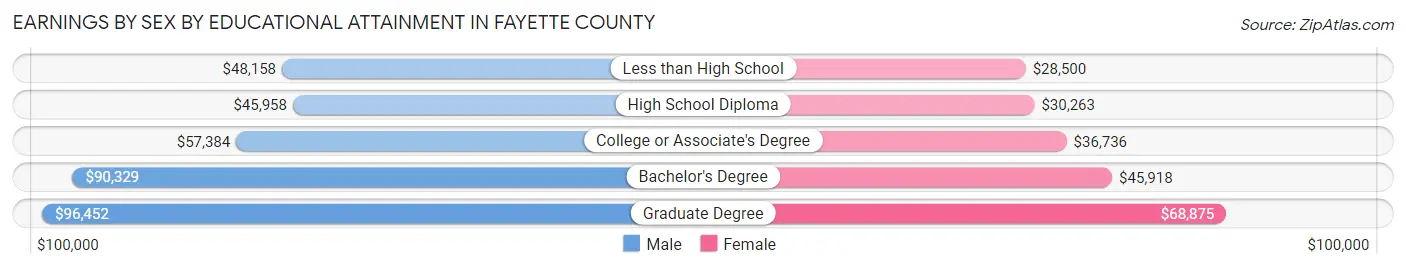
| Educational Attainment | Male Income | Female Income |
| Less than High School | $48,158 | $28,500 |
| High School Diploma | $45,958 | $30,263 |
| College or Associate's Degree | $57,384 | $36,736 |
| Bachelor's Degree | $90,329 | $45,918 |
| Graduate Degree | $96,452 | $68,875 |
| Total | $57,600 | $36,851 |
Family Income in Fayette County
Family Income Brackets in Fayette County
According to the Fayette County family income data, there are 2,822 families falling into the $100,000 to $149,999 income range, which is the most common income bracket and makes up 23.7% of all families. Conversely, the $10,000 to $14,999 income bracket is the least frequent group with only 107 families (0.9%) belonging to this category.
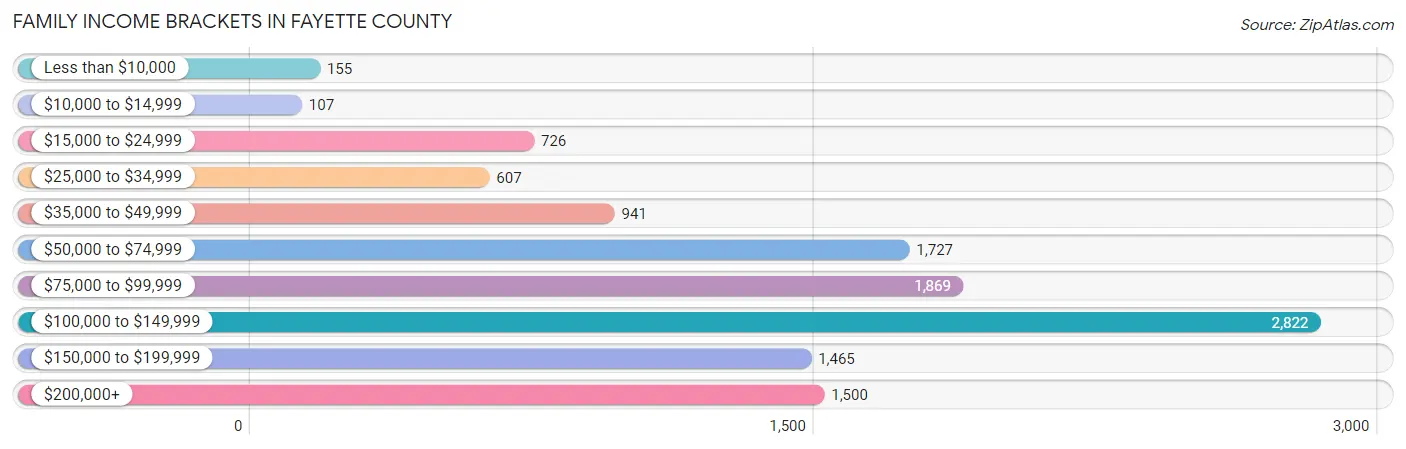
| Income Bracket | # Families | % Families |
| Less than $10,000 | 155 | 1.3% |
| $10,000 to $14,999 | 107 | 0.9% |
| $15,000 to $24,999 | 726 | 6.1% |
| $25,000 to $34,999 | 607 | 5.1% |
| $35,000 to $49,999 | 941 | 7.9% |
| $50,000 to $74,999 | 1,727 | 14.5% |
| $75,000 to $99,999 | 1,869 | 15.7% |
| $100,000 to $149,999 | 2,822 | 23.7% |
| $150,000 to $199,999 | 1,465 | 12.3% |
| $200,000+ | 1,500 | 12.6% |
Family Income by Famaliy Size in Fayette County
7+ person families (90 | 0.8%) account for the highest median family income in Fayette County with $167,700 per family, while 2-person families (6,066 | 50.9%) have the highest median income of $46,719 per family member.
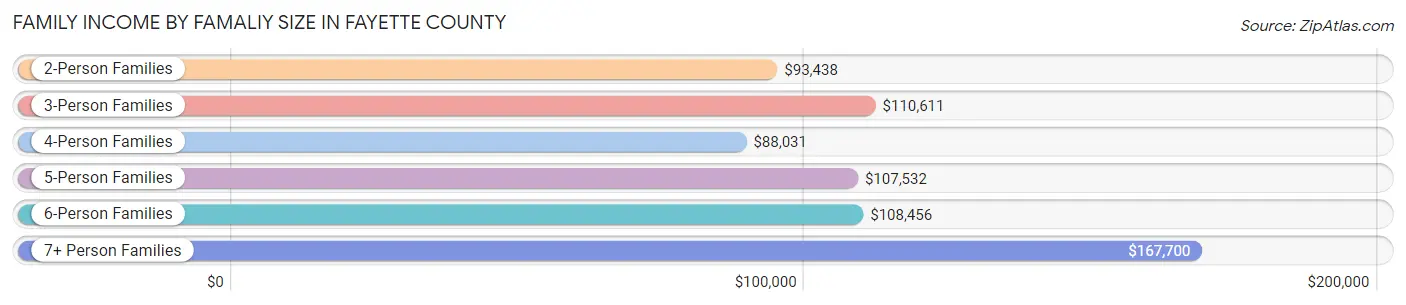
| Income Bracket | # Families | Median Income |
| 2-Person Families | 6,066 (50.9%) | $93,438 |
| 3-Person Families | 2,640 (22.2%) | $110,611 |
| 4-Person Families | 1,901 (16.0%) | $88,031 |
| 5-Person Families | 923 (7.7%) | $107,532 |
| 6-Person Families | 287 (2.4%) | $108,456 |
| 7+ Person Families | 90 (0.8%) | $167,700 |
| Total | 11,907 (100.0%) | $96,675 |
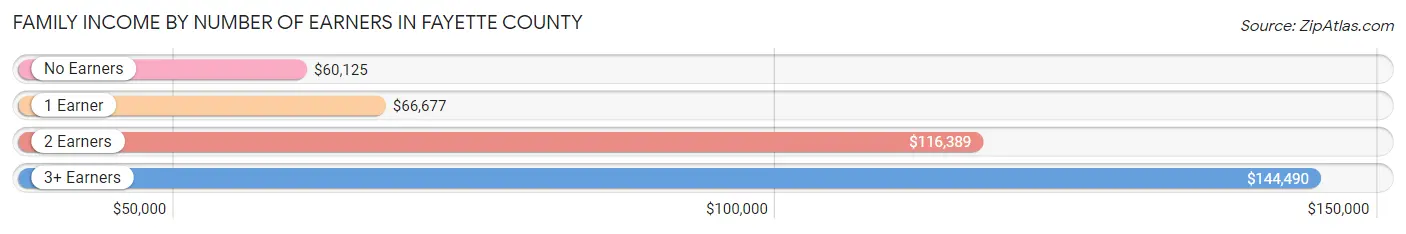
Family Income by Number of Earners in Fayette County
The median family income in Fayette County is $96,675, with families comprising 3+ earners (1,259) having the highest median family income of $144,490, while families with no earners (2,155) have the lowest median family income of $60,125, accounting for 10.6% and 18.1% of families, respectively.
| Number of Earners | # Families | Median Income |
| No Earners | 2,155 (18.1%) | $60,125 |
| 1 Earner | 3,849 (32.3%) | $66,677 |
| 2 Earners | 4,644 (39.0%) | $116,389 |
| 3+ Earners | 1,259 (10.6%) | $144,490 |
| Total | 11,907 (100.0%) | $96,675 |
Household Income in Fayette County
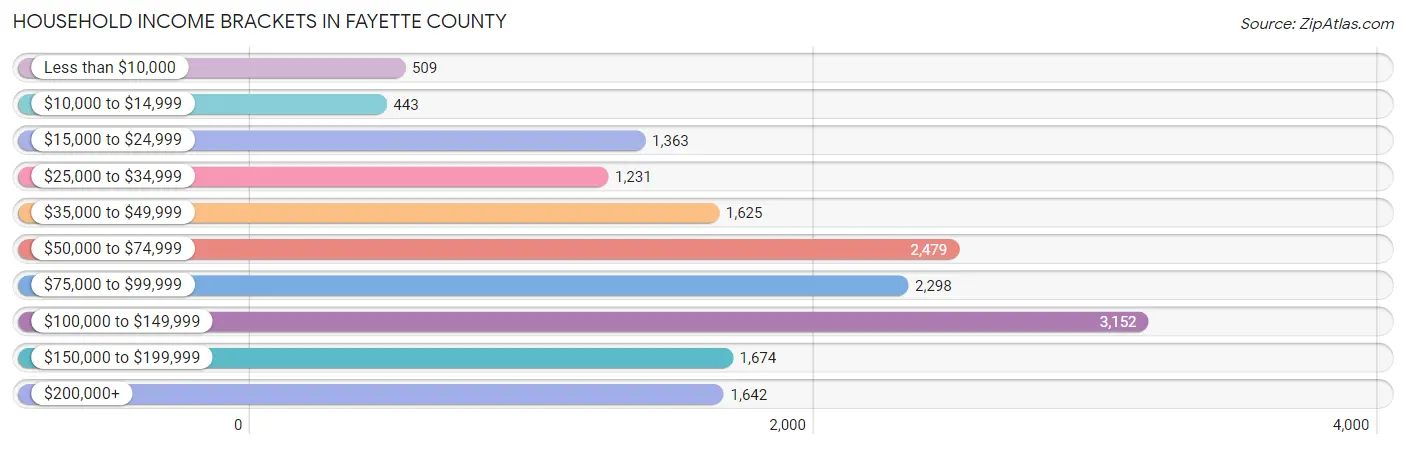
Household Income Brackets in Fayette County
With 3,152 households falling in the category, the $100,000 to $149,999 income range is the most frequent in Fayette County, accounting for 19.2% of all households. In contrast, only 443 households (2.7%) fall into the $10,000 to $14,999 income bracket, making it the least populous group.
| Income Bracket | # Households | % Households |
| Less than $10,000 | 509 | 3.1% |
| $10,000 to $14,999 | 443 | 2.7% |
| $15,000 to $24,999 | 1,363 | 8.3% |
| $25,000 to $34,999 | 1,231 | 7.5% |
| $35,000 to $49,999 | 1,625 | 9.9% |
| $50,000 to $74,999 | 2,479 | 15.1% |
| $75,000 to $99,999 | 2,298 | 14.0% |
| $100,000 to $149,999 | 3,152 | 19.2% |
| $150,000 to $199,999 | 1,674 | 10.2% |
| $200,000+ | 1,642 | 10.0% |
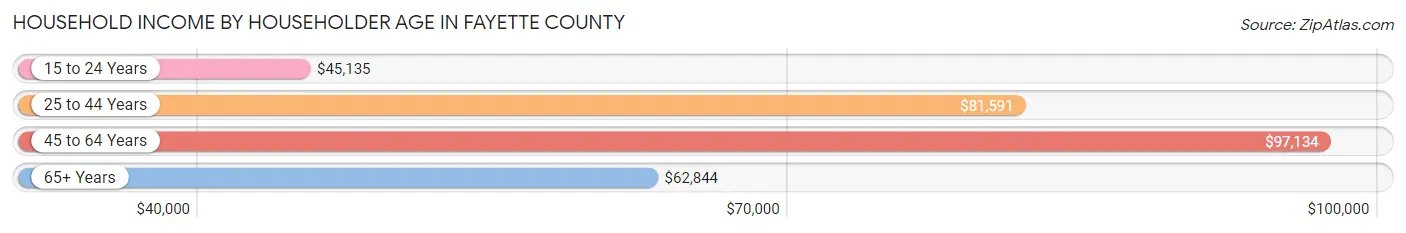
Household Income by Householder Age in Fayette County
The median household income in Fayette County is $81,074, with the highest median household income of $97,134 found in the 45 to 64 years age bracket for the primary householder. A total of 6,833 households (41.6%) fall into this category. Meanwhile, the 15 to 24 years age bracket for the primary householder has the lowest median household income of $45,135, with 224 households (1.4%) in this group.
| Income Bracket | # Households | Median Income |
| 15 to 24 Years | 224 (1.4%) | $45,135 |
| 25 to 44 Years | 3,896 (23.7%) | $81,591 |
| 45 to 64 Years | 6,833 (41.6%) | $97,134 |
| 65+ Years | 5,463 (33.3%) | $62,844 |
| Total | 16,416 (100.0%) | $81,074 |
Poverty in Fayette County
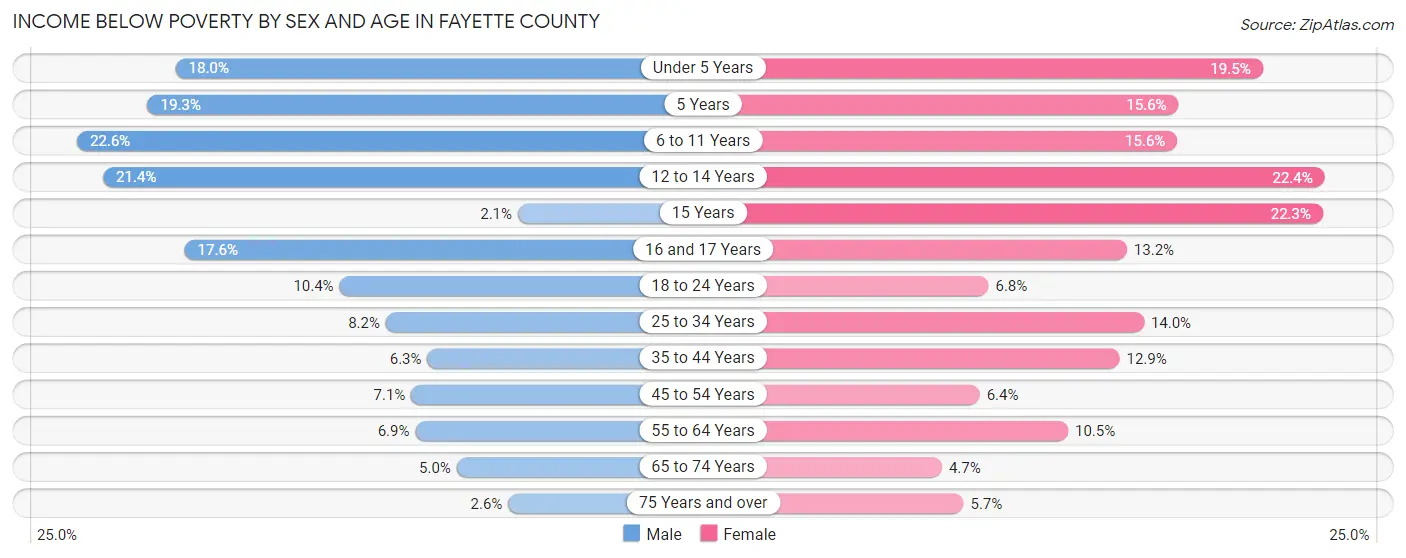
Income Below Poverty by Sex and Age in Fayette County
With 8.9% poverty level for males and 10.5% for females among the residents of Fayette County, 6 to 11 year old males and 12 to 14 year old females are the most vulnerable to poverty, with 244 males (22.6%) and 155 females (22.4%) in their respective age groups living below the poverty level.
| Age Bracket | Male | Female |
| Under 5 Years | 181 (18.0%) | 194 (19.5%) |
| 5 Years | 49 (19.3%) | 15 (15.6%) |
| 6 to 11 Years | 244 (22.6%) | 199 (15.6%) |
| 12 to 14 Years | 170 (21.4%) | 155 (22.4%) |
| 15 Years | 6 (2.1%) | 52 (22.3%) |
| 16 and 17 Years | 91 (17.6%) | 52 (13.2%) |
| 18 to 24 Years | 158 (10.4%) | 94 (6.8%) |
| 25 to 34 Years | 189 (8.2%) | 331 (14.0%) |
| 35 to 44 Years | 149 (6.3%) | 298 (12.9%) |
| 45 to 54 Years | 197 (7.1%) | 182 (6.4%) |
| 55 to 64 Years | 245 (6.9%) | 376 (10.5%) |
| 65 to 74 Years | 134 (5.0%) | 134 (4.6%) |
| 75 Years and over | 41 (2.6%) | 105 (5.7%) |
| Total | 1,854 (8.9%) | 2,187 (10.5%) |
Income Above Poverty by Sex and Age in Fayette County
According to the poverty statistics in Fayette County, males aged 15 years and females aged 65 to 74 years are the age groups that are most secure financially, with 97.9% of males and 95.4% of females in these age groups living above the poverty line.
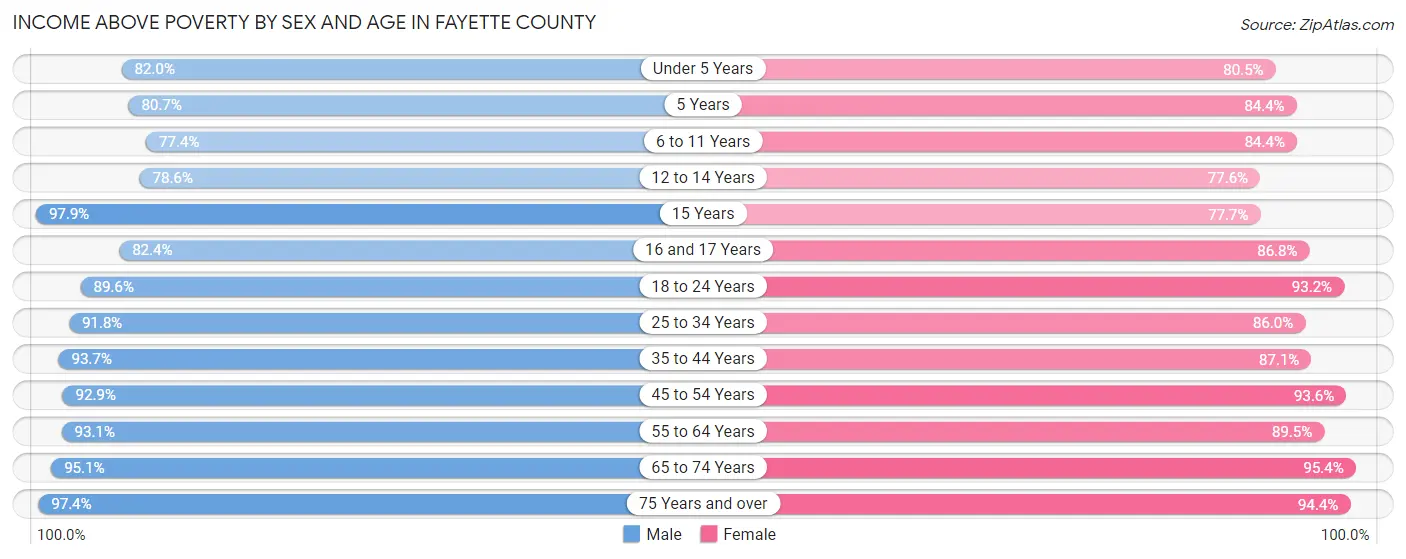
| Age Bracket | Male | Female |
| Under 5 Years | 825 (82.0%) | 800 (80.5%) |
| 5 Years | 205 (80.7%) | 81 (84.4%) |
| 6 to 11 Years | 837 (77.4%) | 1,080 (84.4%) |
| 12 to 14 Years | 626 (78.6%) | 537 (77.6%) |
| 15 Years | 278 (97.9%) | 181 (77.7%) |
| 16 and 17 Years | 427 (82.4%) | 341 (86.8%) |
| 18 to 24 Years | 1,363 (89.6%) | 1,287 (93.2%) |
| 25 to 34 Years | 2,105 (91.8%) | 2,030 (86.0%) |
| 35 to 44 Years | 2,212 (93.7%) | 2,013 (87.1%) |
| 45 to 54 Years | 2,593 (92.9%) | 2,663 (93.6%) |
| 55 to 64 Years | 3,323 (93.1%) | 3,206 (89.5%) |
| 65 to 74 Years | 2,573 (95.1%) | 2,750 (95.4%) |
| 75 Years and over | 1,562 (97.4%) | 1,754 (94.4%) |
| Total | 18,929 (91.1%) | 18,723 (89.5%) |
Income Below Poverty Among Married-Couple Families in Fayette County
The poverty statistics for married-couple families in Fayette County show that 2.2% or 204 of the total 9,268 families live below the poverty line. Families with 3 or 4 children have the highest poverty rate of 3.7%, comprising of 18 families. On the other hand, families with 5 or more children have the lowest poverty rate of 0.0%, which includes 0 families.
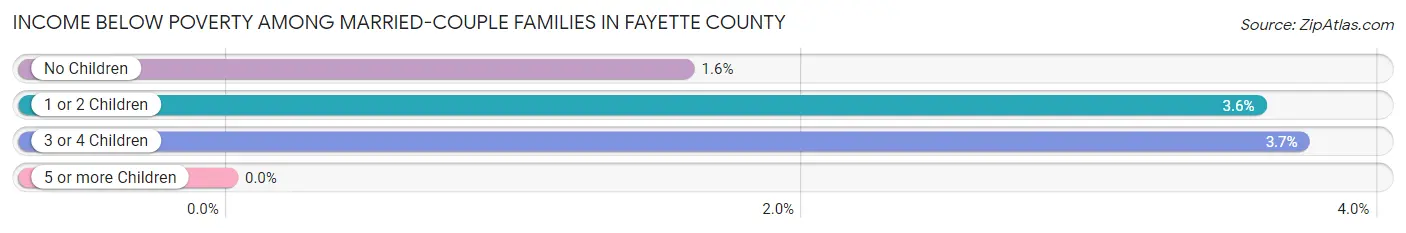
| Children | Above Poverty | Below Poverty |
| No Children | 6,270 (98.4%) | 101 (1.6%) |
| 1 or 2 Children | 2,292 (96.4%) | 85 (3.6%) |
| 3 or 4 Children | 465 (96.3%) | 18 (3.7%) |
| 5 or more Children | 37 (100.0%) | 0 (0.0%) |
| Total | 9,064 (97.8%) | 204 (2.2%) |
Income Below Poverty Among Single-Parent Households in Fayette County
According to the poverty data in Fayette County, 13.4% or 120 single-father households and 26.5% or 462 single-mother households are living below the poverty line. Among single-father households, those with 5 or more children have the highest poverty rate, with 5 households (100.0%) experiencing poverty. Likewise, among single-mother households, those with 3 or 4 children have the highest poverty rate, with 165 households (97.1%) falling below the poverty line.
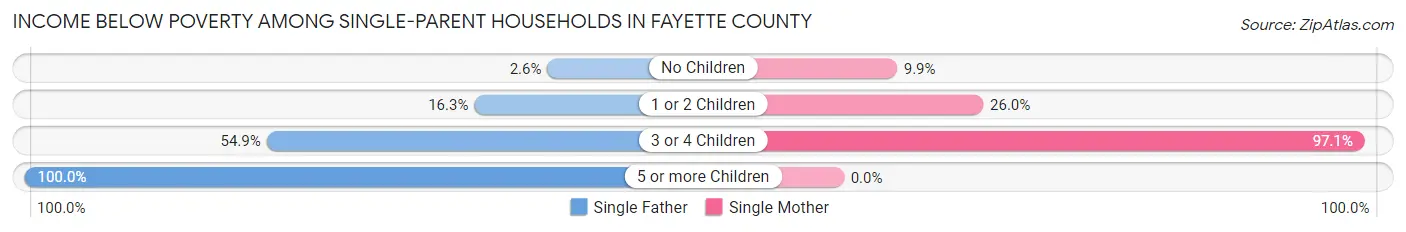
| Children | Single Father | Single Mother |
| No Children | 11 (2.6%) | 69 (9.9%) |
| 1 or 2 Children | 65 (16.3%) | 228 (26.0%) |
| 3 or 4 Children | 39 (54.9%) | 165 (97.1%) |
| 5 or more Children | 5 (100.0%) | 0 (0.0%) |
| Total | 120 (13.4%) | 462 (26.5%) |
Income Below Poverty Among Married-Couple vs Single-Parent Households in Fayette County
The poverty data for Fayette County shows that 204 of the married-couple family households (2.2%) and 582 of the single-parent households (22.1%) are living below the poverty level. Within the married-couple family households, those with 3 or 4 children have the highest poverty rate, with 18 households (3.7%) falling below the poverty line. Among the single-parent households, those with 5 or more children have the highest poverty rate, with 5 household (100.0%) living below poverty.
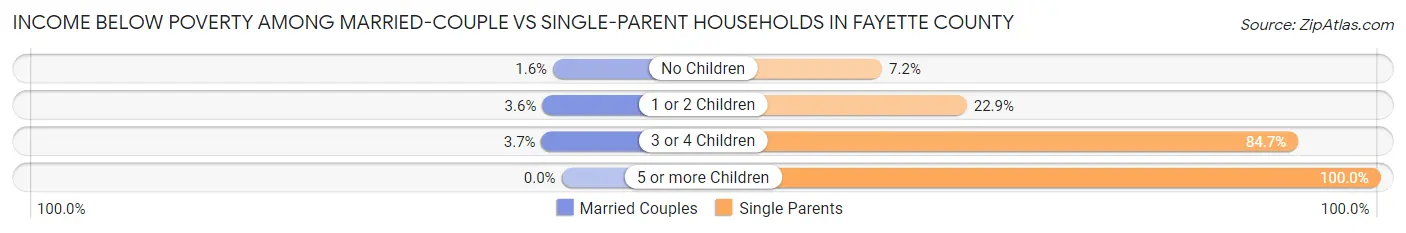
| Children | Married-Couple Families | Single-Parent Households |
| No Children | 101 (1.6%) | 80 (7.2%) |
| 1 or 2 Children | 85 (3.6%) | 293 (22.9%) |
| 3 or 4 Children | 18 (3.7%) | 204 (84.7%) |
| 5 or more Children | 0 (0.0%) | 5 (100.0%) |
| Total | 204 (2.2%) | 582 (22.1%) |
Employment Characteristics in Fayette County
Employment by Class of Employer in Fayette County
Among the 18,894 employed individuals in Fayette County, private company employees (12,865 | 68.1%), self-employed (not incorporated) (1,646 | 8.7%), and local government employees (1,475 | 7.8%) make up the most common classes of employment.
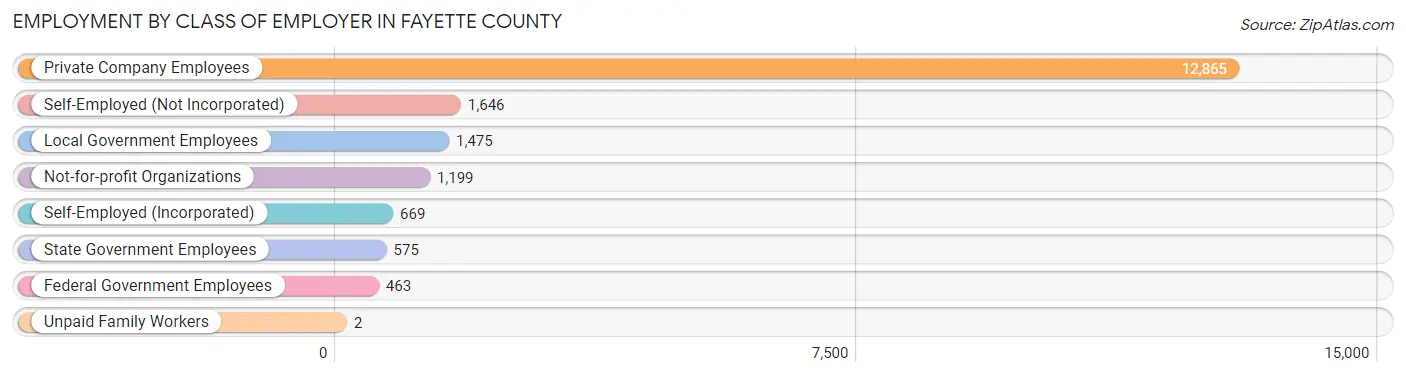
| Employer Class | # Employees | % Employees |
| Private Company Employees | 12,865 | 68.1% |
| Self-Employed (Incorporated) | 669 | 3.5% |
| Self-Employed (Not Incorporated) | 1,646 | 8.7% |
| Not-for-profit Organizations | 1,199 | 6.4% |
| Local Government Employees | 1,475 | 7.8% |
| State Government Employees | 575 | 3.0% |
| Federal Government Employees | 463 | 2.5% |
| Unpaid Family Workers | 2 | 0.0% |
| Total | 18,894 | 100.0% |
Employment Status by Age in Fayette County
According to the labor force statistics for Fayette County, out of the total population over 16 years of age (35,427), 58.1% or 20,583 individuals are in the labor force, with 5.3% or 1,091 of them unemployed. The age group with the highest labor force participation rate is 25 to 29 years, with 87.2% or 2,061 individuals in the labor force. Within the labor force, the 16 to 19 years age range has the highest percentage of unemployed individuals, with 18.2% or 96 of them being unemployed.
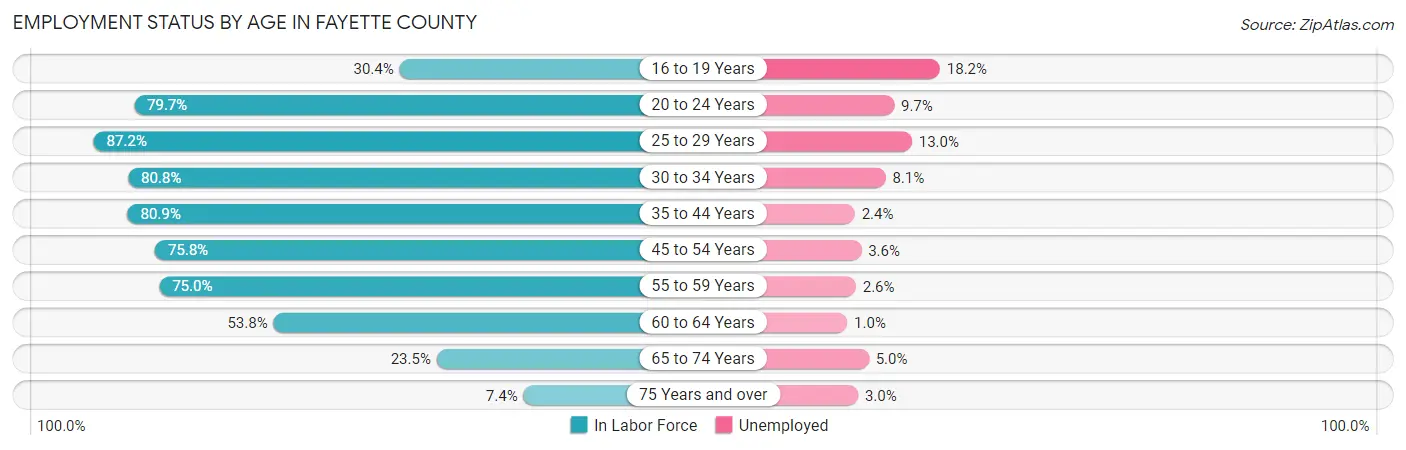
| Age Bracket | In Labor Force | Unemployed |
| 16 to 19 Years | 528 (30.4%) | 96 (18.2%) |
| 20 to 24 Years | 1,722 (79.7%) | 167 (9.7%) |
| 25 to 29 Years | 2,061 (87.2%) | 268 (13.0%) |
| 30 to 34 Years | 1,908 (80.8%) | 155 (8.1%) |
| 35 to 44 Years | 3,823 (80.9%) | 92 (2.4%) |
| 45 to 54 Years | 4,280 (75.8%) | 154 (3.6%) |
| 55 to 59 Years | 2,882 (75.0%) | 75 (2.6%) |
| 60 to 64 Years | 1,786 (53.8%) | 18 (1.0%) |
| 65 to 74 Years | 1,333 (23.5%) | 67 (5.0%) |
| 75 Years and over | 266 (7.4%) | 8 (3.0%) |
| Total | 20,583 (58.1%) | 1,091 (5.3%) |
Employment Status by Educational Attainment in Fayette County
According to labor force statistics for Fayette County, 75.2% of individuals (16,738) out of the total population between 25 and 64 years of age (22,258) are in the labor force, with 4.6% or 770 of them being unemployed. The group with the highest labor force participation rate are those with the educational attainment of bachelor's degree or higher, with 85.3% or 5,127 individuals in the labor force. Within the labor force, individuals with high school diploma education have the highest percentage of unemployment, with 7.2% or 355 of them being unemployed.
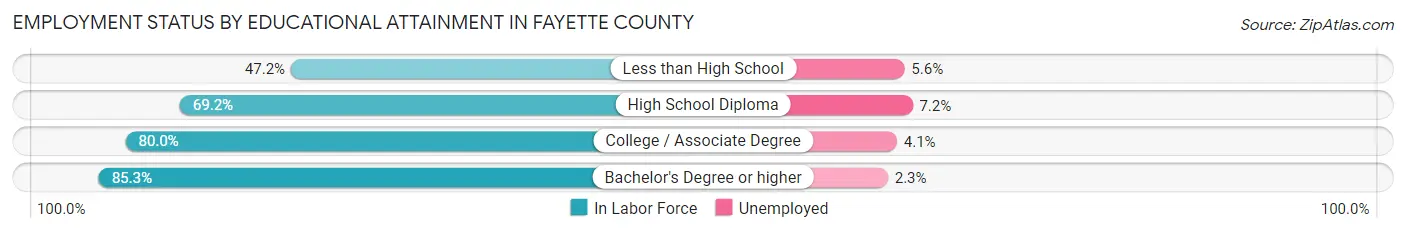
| Educational Attainment | In Labor Force | Unemployed |
| Less than High School | 880 (47.2%) | 104 (5.6%) |
| High School Diploma | 4,934 (69.2%) | 513 (7.2%) |
| College / Associate Degree | 5,802 (80.0%) | 297 (4.1%) |
| Bachelor's Degree or higher | 5,127 (85.3%) | 138 (2.3%) |
| Total | 16,738 (75.2%) | 1,024 (4.6%) |
Employment Occupations by Sex in Fayette County
Management, Business, Science and Arts Occupations
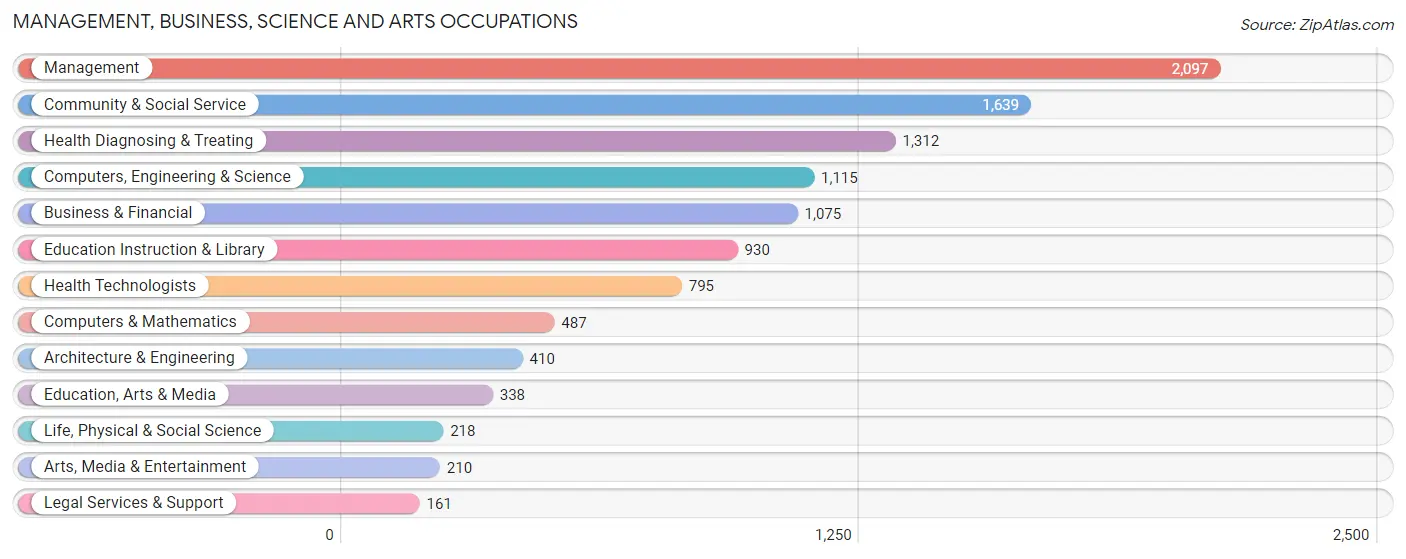
The most common Management, Business, Science and Arts occupations in Fayette County are Management (2,097 | 10.8%), Community & Social Service (1,639 | 8.4%), Health Diagnosing & Treating (1,312 | 6.7%), Computers, Engineering & Science (1,115 | 5.7%), and Business & Financial (1,075 | 5.5%).
Management, Business, Science and Arts Occupations by Sex
Within the Management, Business, Science and Arts occupations in Fayette County, the most male-oriented occupations are Architecture & Engineering (93.9%), Computers, Engineering & Science (71.7%), and Computers & Mathematics (68.6%), while the most female-oriented occupations are Health Technologists (83.3%), Health Diagnosing & Treating (81.0%), and Education Instruction & Library (74.1%).
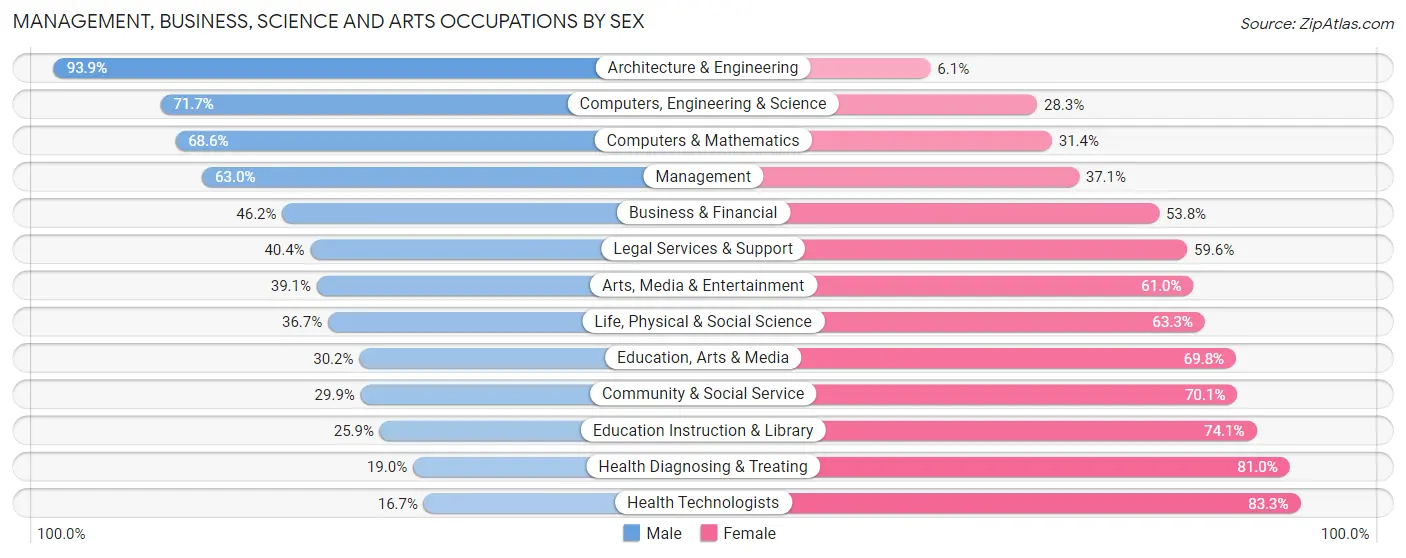
| Occupation | Male | Female |
| Management | 1,320 (62.9%) | 777 (37.0%) |
| Business & Financial | 497 (46.2%) | 578 (53.8%) |
| Computers, Engineering & Science | 799 (71.7%) | 316 (28.3%) |
| Computers & Mathematics | 334 (68.6%) | 153 (31.4%) |
| Architecture & Engineering | 385 (93.9%) | 25 (6.1%) |
| Life, Physical & Social Science | 80 (36.7%) | 138 (63.3%) |
| Community & Social Service | 490 (29.9%) | 1,149 (70.1%) |
| Education, Arts & Media | 102 (30.2%) | 236 (69.8%) |
| Legal Services & Support | 65 (40.4%) | 96 (59.6%) |
| Education Instruction & Library | 241 (25.9%) | 689 (74.1%) |
| Arts, Media & Entertainment | 82 (39.1%) | 128 (61.0%) |
| Health Diagnosing & Treating | 249 (19.0%) | 1,063 (81.0%) |
| Health Technologists | 133 (16.7%) | 662 (83.3%) |
| Total (Category) | 3,355 (46.4%) | 3,883 (53.6%) |
| Total (Overall) | 10,583 (54.4%) | 8,879 (45.6%) |
Services Occupations
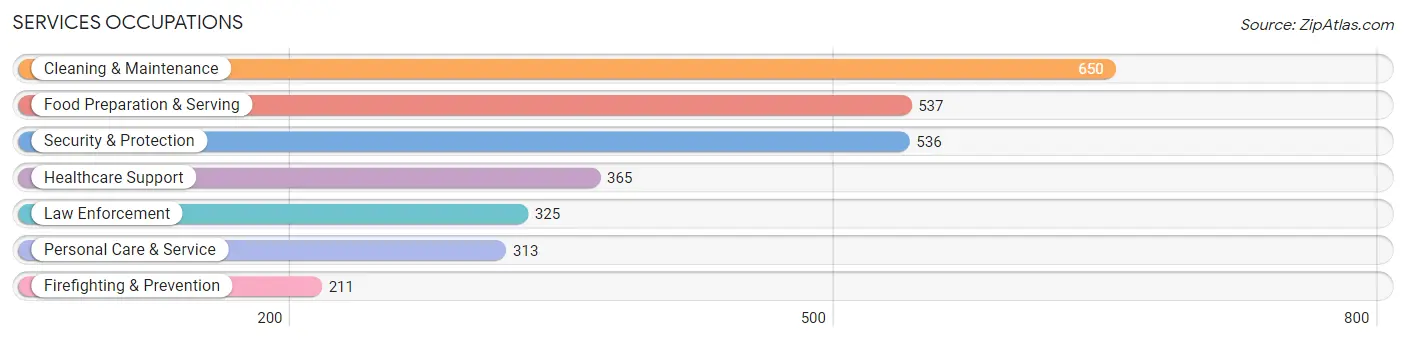
The most common Services occupations in Fayette County are Cleaning & Maintenance (650 | 3.3%), Food Preparation & Serving (537 | 2.8%), Security & Protection (536 | 2.8%), Healthcare Support (365 | 1.9%), and Law Enforcement (325 | 1.7%).
Services Occupations by Sex
Within the Services occupations in Fayette County, the most male-oriented occupations are Law Enforcement (86.8%), Security & Protection (84.3%), and Firefighting & Prevention (80.6%), while the most female-oriented occupations are Healthcare Support (90.4%), Personal Care & Service (81.1%), and Food Preparation & Serving (72.6%).
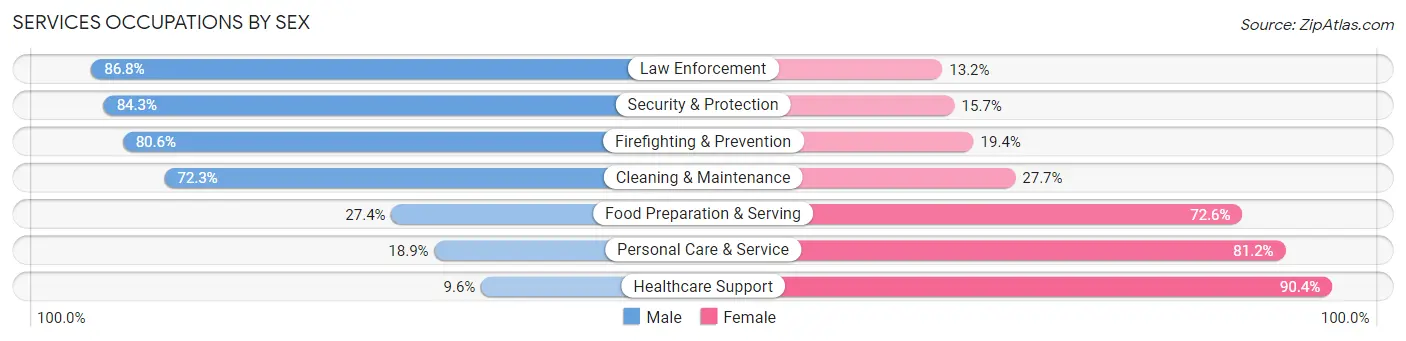
| Occupation | Male | Female |
| Healthcare Support | 35 (9.6%) | 330 (90.4%) |
| Security & Protection | 452 (84.3%) | 84 (15.7%) |
| Firefighting & Prevention | 170 (80.6%) | 41 (19.4%) |
| Law Enforcement | 282 (86.8%) | 43 (13.2%) |
| Food Preparation & Serving | 147 (27.4%) | 390 (72.6%) |
| Cleaning & Maintenance | 470 (72.3%) | 180 (27.7%) |
| Personal Care & Service | 59 (18.9%) | 254 (81.1%) |
| Total (Category) | 1,163 (48.4%) | 1,238 (51.6%) |
| Total (Overall) | 10,583 (54.4%) | 8,879 (45.6%) |
Sales and Office Occupations
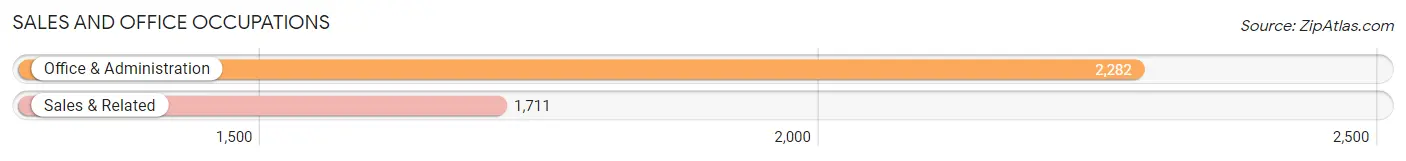
The most common Sales and Office occupations in Fayette County are Office & Administration (2,282 | 11.7%), and Sales & Related (1,711 | 8.8%).
Sales and Office Occupations by Sex

| Occupation | Male | Female |
| Sales & Related | 828 (48.4%) | 883 (51.6%) |
| Office & Administration | 441 (19.3%) | 1,841 (80.7%) |
| Total (Category) | 1,269 (31.8%) | 2,724 (68.2%) |
| Total (Overall) | 10,583 (54.4%) | 8,879 (45.6%) |
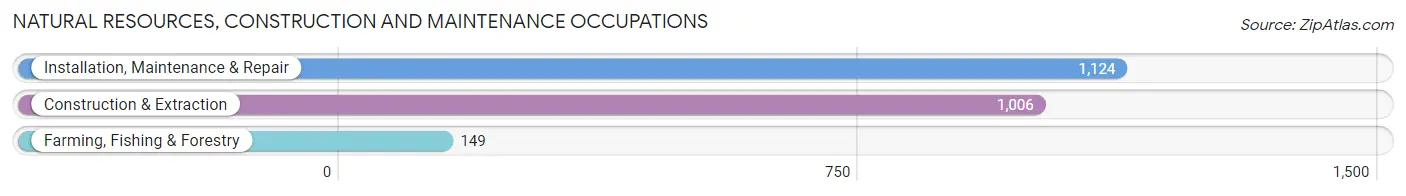
Natural Resources, Construction and Maintenance Occupations
The most common Natural Resources, Construction and Maintenance occupations in Fayette County are Installation, Maintenance & Repair (1,124 | 5.8%), Construction & Extraction (1,006 | 5.2%), and Farming, Fishing & Forestry (149 | 0.8%).
Natural Resources, Construction and Maintenance Occupations by Sex
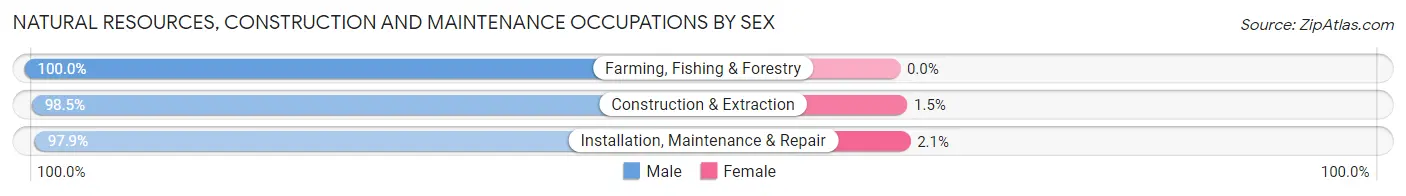
| Occupation | Male | Female |
| Farming, Fishing & Forestry | 149 (100.0%) | 0 (0.0%) |
| Construction & Extraction | 991 (98.5%) | 15 (1.5%) |
| Installation, Maintenance & Repair | 1,100 (97.9%) | 24 (2.1%) |
| Total (Category) | 2,240 (98.3%) | 39 (1.7%) |
| Total (Overall) | 10,583 (54.4%) | 8,879 (45.6%) |
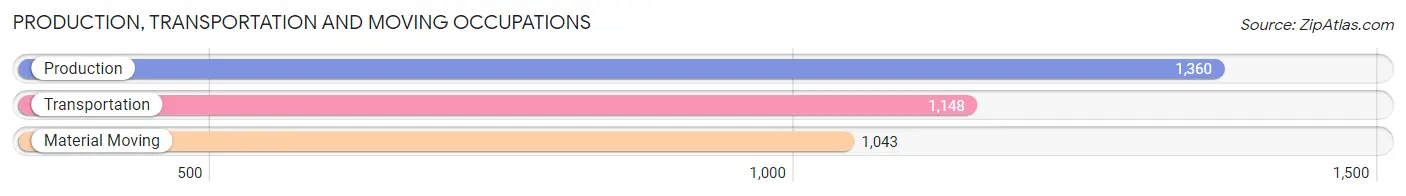
Production, Transportation and Moving Occupations
The most common Production, Transportation and Moving occupations in Fayette County are Production (1,360 | 7.0%), Transportation (1,148 | 5.9%), and Material Moving (1,043 | 5.4%).
Production, Transportation and Moving Occupations by Sex
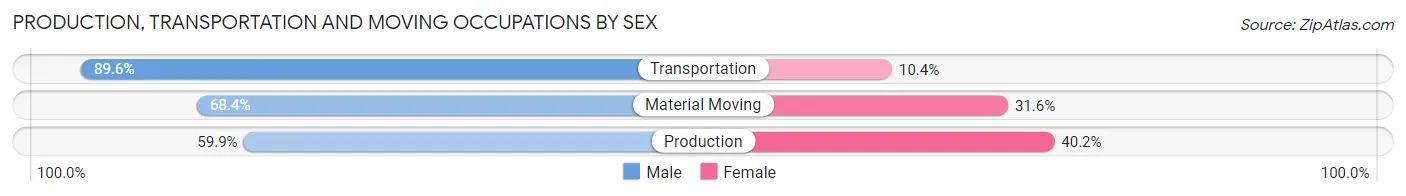
| Occupation | Male | Female |
| Production | 814 (59.9%) | 546 (40.2%) |
| Transportation | 1,029 (89.6%) | 119 (10.4%) |
| Material Moving | 713 (68.4%) | 330 (31.6%) |
| Total (Category) | 2,556 (72.0%) | 995 (28.0%) |
| Total (Overall) | 10,583 (54.4%) | 8,879 (45.6%) |
Employment Industries by Sex in Fayette County
Employment Industries in Fayette County
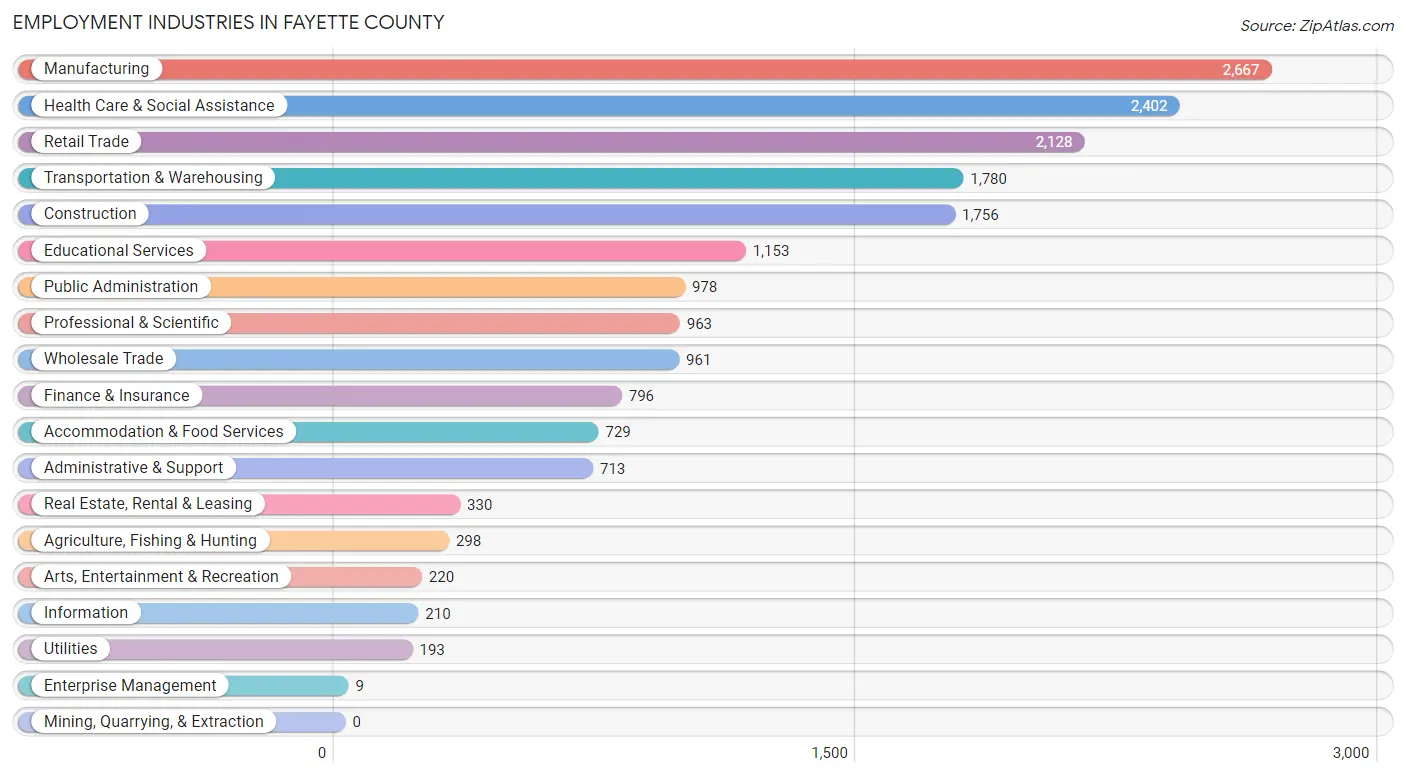
The major employment industries in Fayette County include Manufacturing (2,667 | 13.7%), Health Care & Social Assistance (2,402 | 12.3%), Retail Trade (2,128 | 10.9%), Transportation & Warehousing (1,780 | 9.1%), and Construction (1,756 | 9.0%).
Employment Industries by Sex in Fayette County
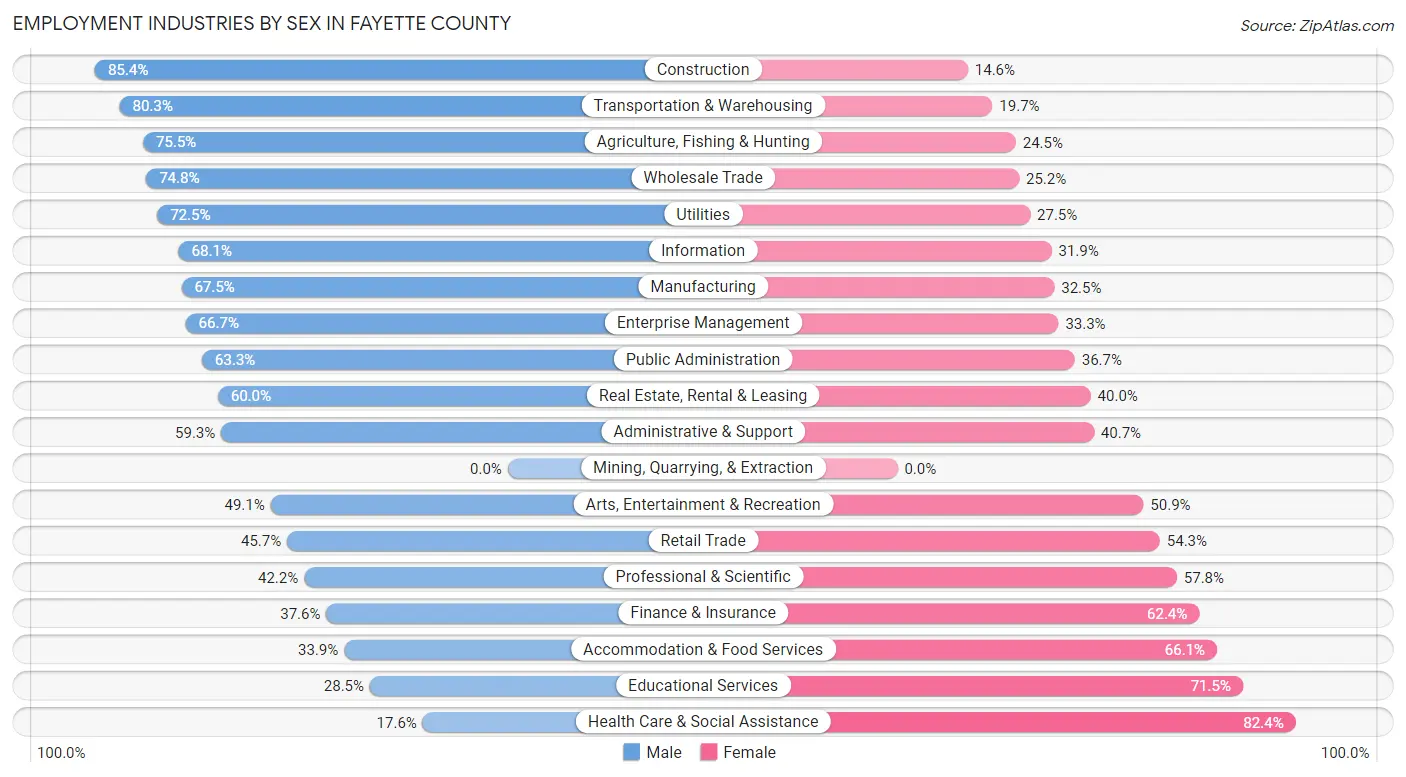
The Fayette County industries that see more men than women are Construction (85.4%), Transportation & Warehousing (80.3%), and Agriculture, Fishing & Hunting (75.5%), whereas the industries that tend to have a higher number of women are Health Care & Social Assistance (82.4%), Educational Services (71.5%), and Accommodation & Food Services (66.1%).
| Industry | Male | Female |
| Agriculture, Fishing & Hunting | 225 (75.5%) | 73 (24.5%) |
| Mining, Quarrying, & Extraction | 0 (0.0%) | 0 (0.0%) |
| Construction | 1,500 (85.4%) | 256 (14.6%) |
| Manufacturing | 1,801 (67.5%) | 866 (32.5%) |
| Wholesale Trade | 719 (74.8%) | 242 (25.2%) |
| Retail Trade | 972 (45.7%) | 1,156 (54.3%) |
| Transportation & Warehousing | 1,430 (80.3%) | 350 (19.7%) |
| Utilities | 140 (72.5%) | 53 (27.5%) |
| Information | 143 (68.1%) | 67 (31.9%) |
| Finance & Insurance | 299 (37.6%) | 497 (62.4%) |
| Real Estate, Rental & Leasing | 198 (60.0%) | 132 (40.0%) |
| Professional & Scientific | 406 (42.2%) | 557 (57.8%) |
| Enterprise Management | 6 (66.7%) | 3 (33.3%) |
| Administrative & Support | 423 (59.3%) | 290 (40.7%) |
| Educational Services | 329 (28.5%) | 824 (71.5%) |
| Health Care & Social Assistance | 423 (17.6%) | 1,979 (82.4%) |
| Arts, Entertainment & Recreation | 108 (49.1%) | 112 (50.9%) |
| Accommodation & Food Services | 247 (33.9%) | 482 (66.1%) |
| Public Administration | 619 (63.3%) | 359 (36.7%) |
| Total | 10,583 (54.4%) | 8,879 (45.6%) |
Education in Fayette County
School Enrollment in Fayette County
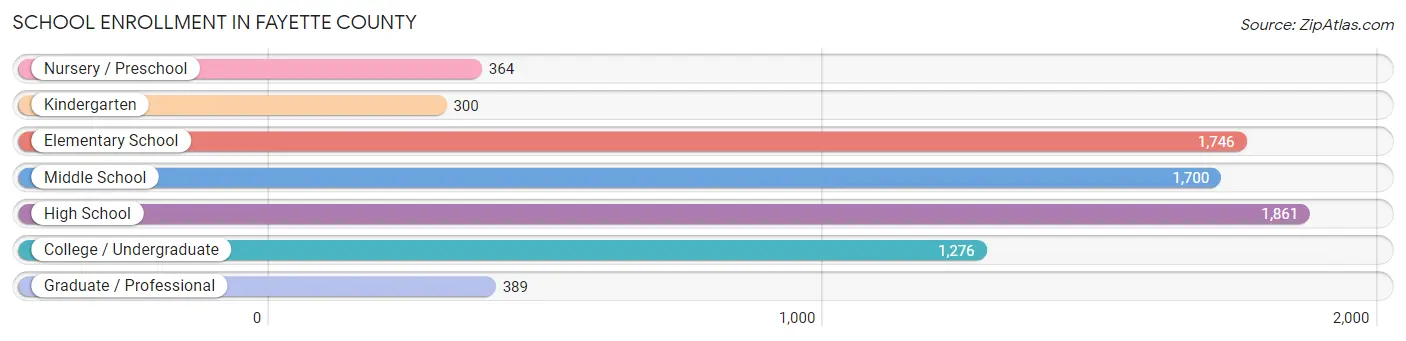
The most common levels of schooling among the 7,636 students in Fayette County are high school (1,861 | 24.4%), elementary school (1,746 | 22.9%), and middle school (1,700 | 22.3%).
| School Level | # Students | % Students |
| Nursery / Preschool | 364 | 4.8% |
| Kindergarten | 300 | 3.9% |
| Elementary School | 1,746 | 22.9% |
| Middle School | 1,700 | 22.3% |
| High School | 1,861 | 24.4% |
| College / Undergraduate | 1,276 | 16.7% |
| Graduate / Professional | 389 | 5.1% |
| Total | 7,636 | 100.0% |
School Enrollment by Age by Funding Source in Fayette County
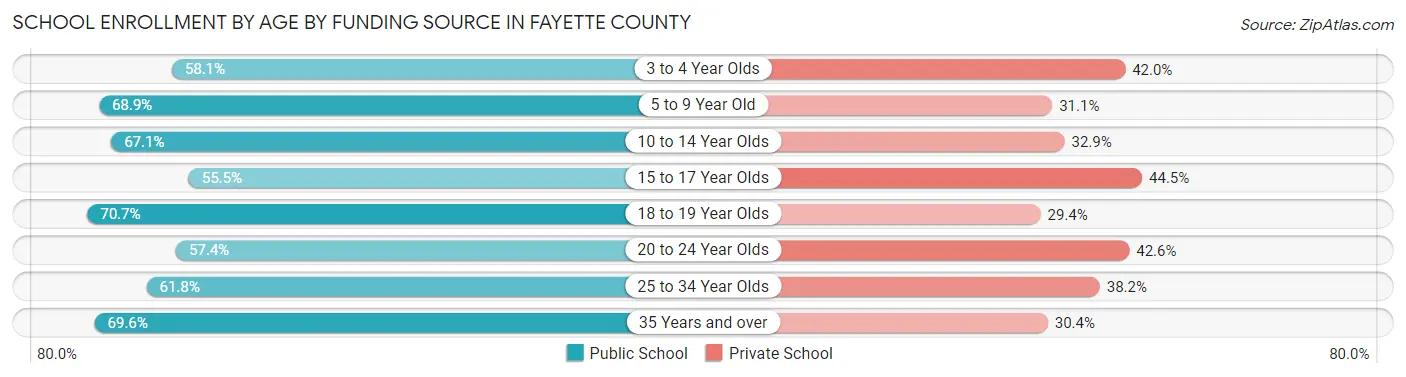
Out of a total of 7,636 students who are enrolled in schools in Fayette County, 2,696 (35.3%) attend a private institution, while the remaining 4,940 (64.7%) are enrolled in public schools. The age group of 15 to 17 year olds has the highest likelihood of being enrolled in private schools, with 639 (44.5% in the age bracket) enrolled. Conversely, the age group of 18 to 19 year olds has the lowest likelihood of being enrolled in a private school, with 361 (70.7% in the age bracket) attending a public institution.
| Age Bracket | Public School | Private School |
| 3 to 4 Year Olds | 155 (58.1%) | 112 (41.9%) |
| 5 to 9 Year Old | 1,306 (68.9%) | 589 (31.1%) |
| 10 to 14 Year Olds | 1,433 (67.1%) | 703 (32.9%) |
| 15 to 17 Year Olds | 798 (55.5%) | 639 (44.5%) |
| 18 to 19 Year Olds | 361 (70.7%) | 150 (29.3%) |
| 20 to 24 Year Olds | 305 (57.4%) | 226 (42.6%) |
| 25 to 34 Year Olds | 149 (61.8%) | 92 (38.2%) |
| 35 Years and over | 430 (69.6%) | 188 (30.4%) |
| Total | 4,940 (64.7%) | 2,696 (35.3%) |
Educational Attainment by Field of Study in Fayette County
Business (2,087 | 24.3%), education (1,314 | 15.3%), science & technology (867 | 10.1%), social sciences (732 | 8.5%), and engineering (659 | 7.7%) are the most common fields of study among 8,575 individuals in Fayette County who have obtained a bachelor's degree or higher.
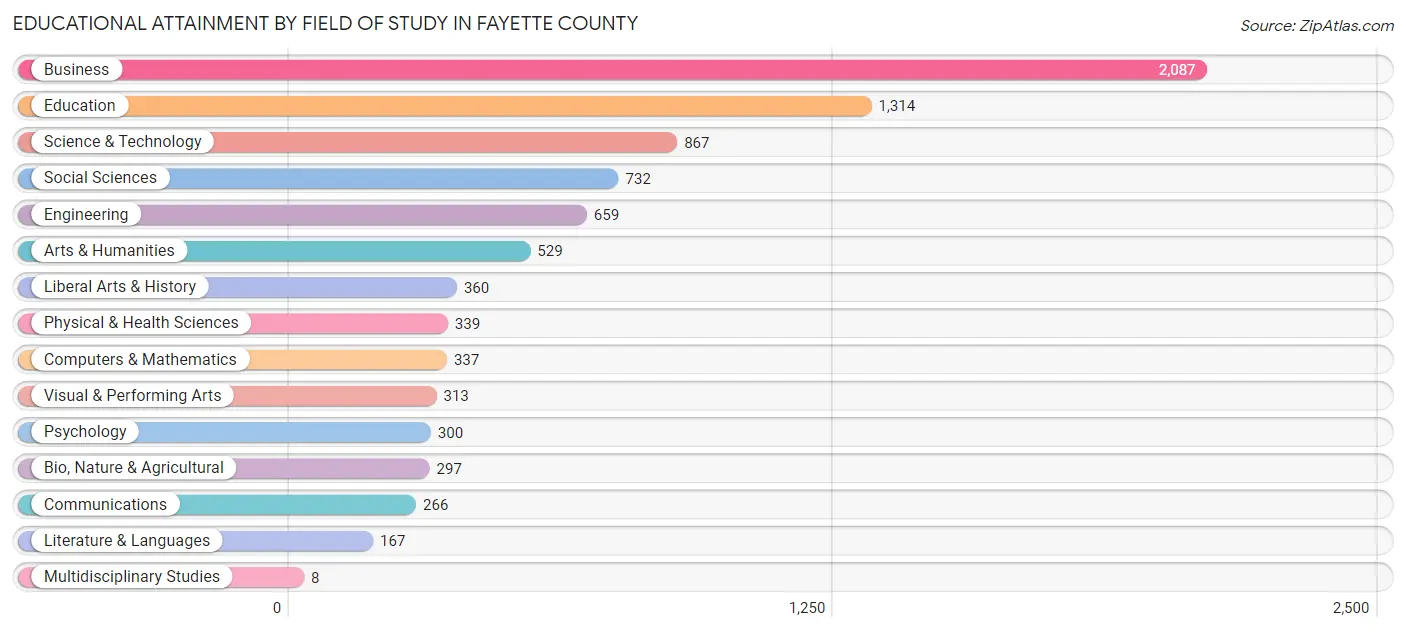
| Field of Study | # Graduates | % Graduates |
| Computers & Mathematics | 337 | 3.9% |
| Bio, Nature & Agricultural | 297 | 3.5% |
| Physical & Health Sciences | 339 | 4.0% |
| Psychology | 300 | 3.5% |
| Social Sciences | 732 | 8.5% |
| Engineering | 659 | 7.7% |
| Multidisciplinary Studies | 8 | 0.1% |
| Science & Technology | 867 | 10.1% |
| Business | 2,087 | 24.3% |
| Education | 1,314 | 15.3% |
| Literature & Languages | 167 | 1.9% |
| Liberal Arts & History | 360 | 4.2% |
| Visual & Performing Arts | 313 | 3.6% |
| Communications | 266 | 3.1% |
| Arts & Humanities | 529 | 6.2% |
| Total | 8,575 | 100.0% |
Transportation & Commute in Fayette County
Vehicle Availability by Sex in Fayette County
The most prevalent vehicle ownership categories in Fayette County are males with 2 vehicles (3,839, accounting for 37.5%) and females with 2 vehicles (2,979, making up 44.4%).
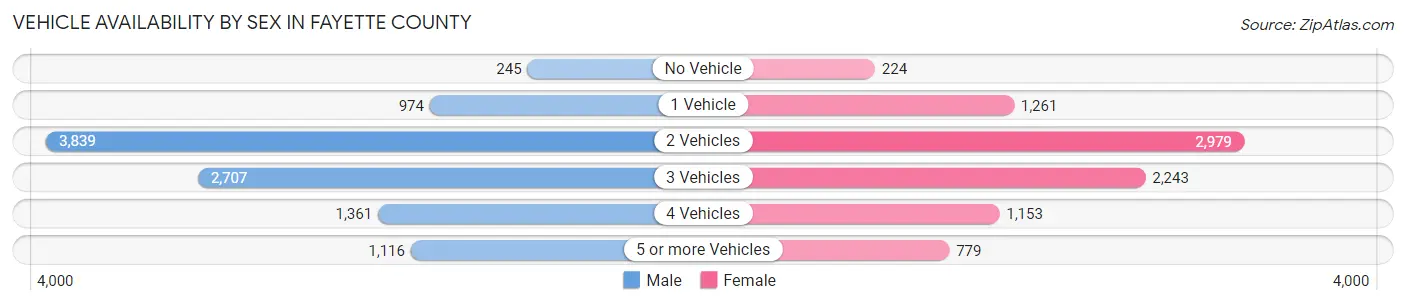
| Vehicles Available | Male | Female |
| No Vehicle | 245 (2.4%) | 224 (2.6%) |
| 1 Vehicle | 974 (9.5%) | 1,261 (14.6%) |
| 2 Vehicles | 3,839 (37.5%) | 2,979 (34.5%) |
| 3 Vehicles | 2,707 (26.4%) | 2,243 (26.0%) |
| 4 Vehicles | 1,361 (13.3%) | 1,153 (13.4%) |
| 5 or more Vehicles | 1,116 (10.9%) | 779 (9.0%) |
| Total | 10,242 (100.0%) | 8,639 (100.0%) |
Commute Time in Fayette County
The most frequently occuring commute durations in Fayette County are 45 to 59 minutes (4,128 commuters, 24.0%), 30 to 34 minutes (2,492 commuters, 14.5%), and 20 to 24 minutes (1,572 commuters, 9.1%).
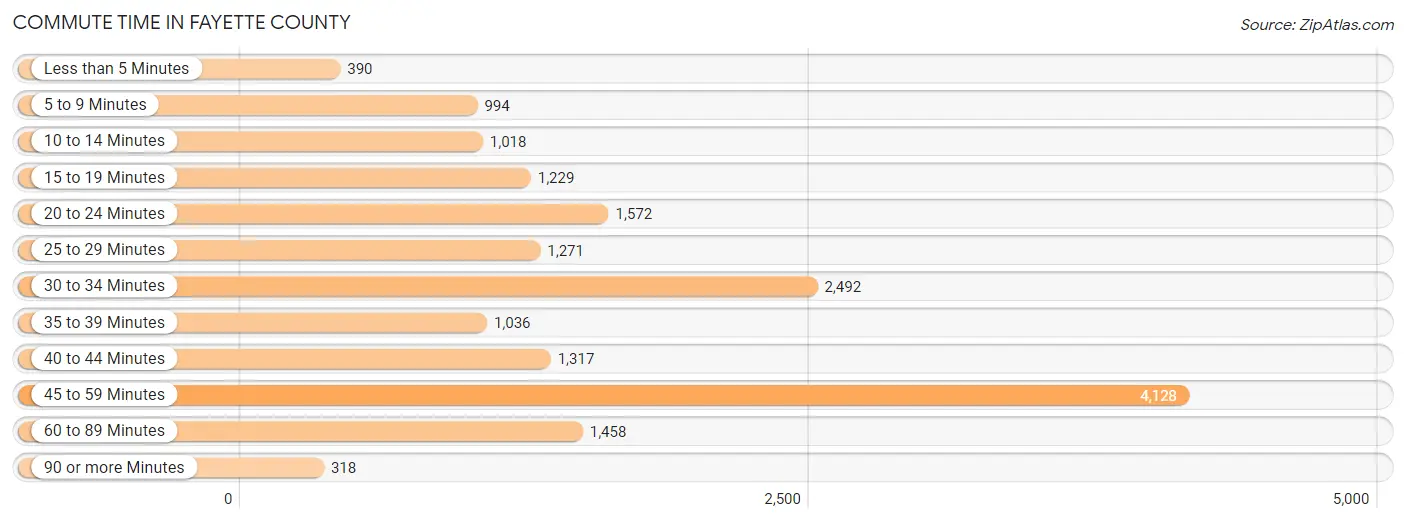
| Commute Time | # Commuters | % Commuters |
| Less than 5 Minutes | 390 | 2.3% |
| 5 to 9 Minutes | 994 | 5.8% |
| 10 to 14 Minutes | 1,018 | 5.9% |
| 15 to 19 Minutes | 1,229 | 7.1% |
| 20 to 24 Minutes | 1,572 | 9.1% |
| 25 to 29 Minutes | 1,271 | 7.4% |
| 30 to 34 Minutes | 2,492 | 14.5% |
| 35 to 39 Minutes | 1,036 | 6.0% |
| 40 to 44 Minutes | 1,317 | 7.6% |
| 45 to 59 Minutes | 4,128 | 24.0% |
| 60 to 89 Minutes | 1,458 | 8.5% |
| 90 or more Minutes | 318 | 1.8% |
Commute Time by Sex in Fayette County
The most common commute times in Fayette County are 45 to 59 minutes (2,237 commuters, 23.8%) for males and 45 to 59 minutes (1,891 commuters, 24.2%) for females.
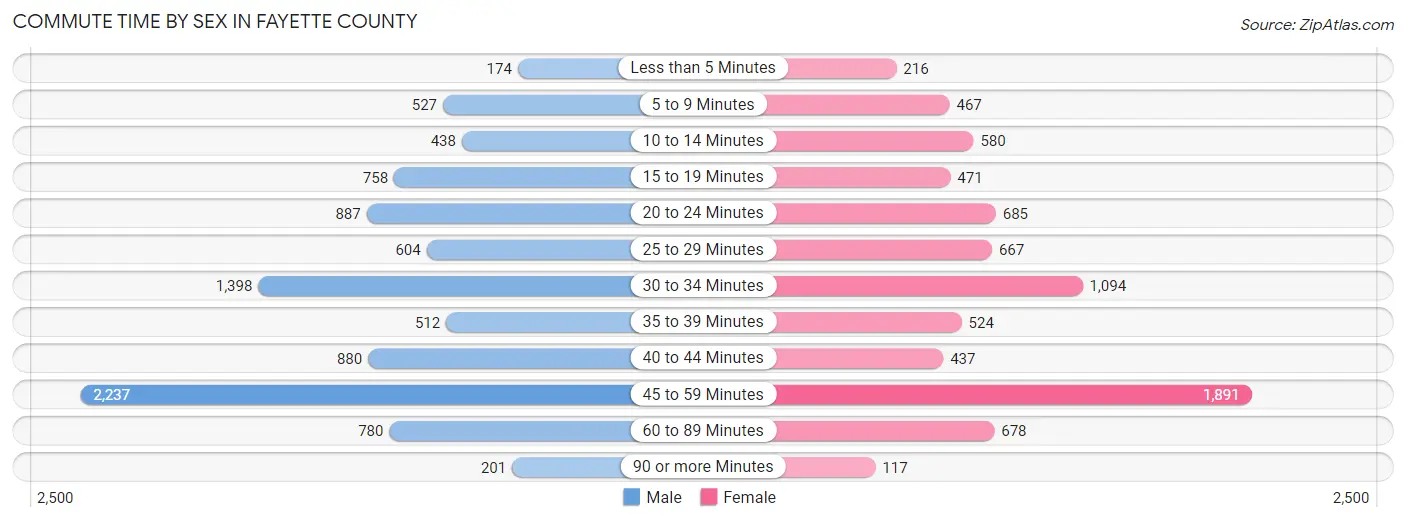
| Commute Time | Male | Female |
| Less than 5 Minutes | 174 (1.8%) | 216 (2.8%) |
| 5 to 9 Minutes | 527 (5.6%) | 467 (6.0%) |
| 10 to 14 Minutes | 438 (4.7%) | 580 (7.4%) |
| 15 to 19 Minutes | 758 (8.1%) | 471 (6.0%) |
| 20 to 24 Minutes | 887 (9.4%) | 685 (8.7%) |
| 25 to 29 Minutes | 604 (6.4%) | 667 (8.5%) |
| 30 to 34 Minutes | 1,398 (14.9%) | 1,094 (14.0%) |
| 35 to 39 Minutes | 512 (5.4%) | 524 (6.7%) |
| 40 to 44 Minutes | 880 (9.4%) | 437 (5.6%) |
| 45 to 59 Minutes | 2,237 (23.8%) | 1,891 (24.2%) |
| 60 to 89 Minutes | 780 (8.3%) | 678 (8.7%) |
| 90 or more Minutes | 201 (2.1%) | 117 (1.5%) |
Time of Departure to Work by Sex in Fayette County
The most frequent times of departure to work in Fayette County are 6:00 AM to 6:29 AM (1,579, 16.8%) for males and 7:00 AM to 7:29 AM (1,358, 17.3%) for females.
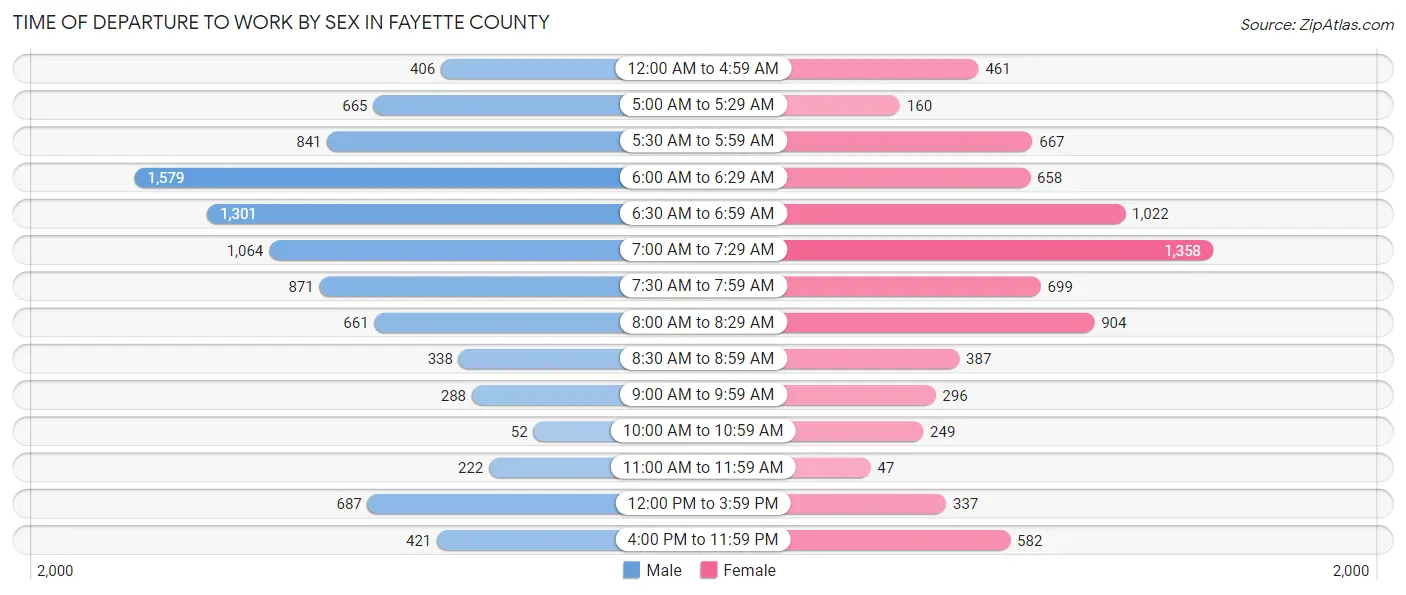
| Time of Departure | Male | Female |
| 12:00 AM to 4:59 AM | 406 (4.3%) | 461 (5.9%) |
| 5:00 AM to 5:29 AM | 665 (7.1%) | 160 (2.0%) |
| 5:30 AM to 5:59 AM | 841 (8.9%) | 667 (8.5%) |
| 6:00 AM to 6:29 AM | 1,579 (16.8%) | 658 (8.4%) |
| 6:30 AM to 6:59 AM | 1,301 (13.9%) | 1,022 (13.1%) |
| 7:00 AM to 7:29 AM | 1,064 (11.3%) | 1,358 (17.3%) |
| 7:30 AM to 7:59 AM | 871 (9.3%) | 699 (8.9%) |
| 8:00 AM to 8:29 AM | 661 (7.0%) | 904 (11.6%) |
| 8:30 AM to 8:59 AM | 338 (3.6%) | 387 (4.9%) |
| 9:00 AM to 9:59 AM | 288 (3.1%) | 296 (3.8%) |
| 10:00 AM to 10:59 AM | 52 (0.5%) | 249 (3.2%) |
| 11:00 AM to 11:59 AM | 222 (2.4%) | 47 (0.6%) |
| 12:00 PM to 3:59 PM | 687 (7.3%) | 337 (4.3%) |
| 4:00 PM to 11:59 PM | 421 (4.5%) | 582 (7.4%) |
| Total | 9,396 (100.0%) | 7,827 (100.0%) |
Housing Occupancy in Fayette County
Occupancy by Ownership in Fayette County
Of the total 16,416 dwellings in Fayette County, owner-occupied units account for 13,392 (81.6%), while renter-occupied units make up 3,024 (18.4%).
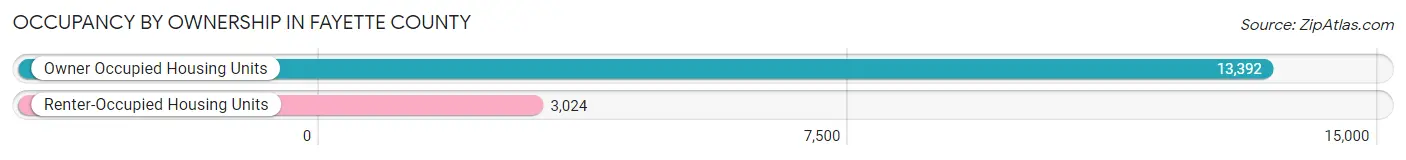
| Occupancy | # Housing Units | % Housing Units |
| Owner Occupied Housing Units | 13,392 | 81.6% |
| Renter-Occupied Housing Units | 3,024 | 18.4% |
| Total Occupied Housing Units | 16,416 | 100.0% |
Occupancy by Household Size in Fayette County
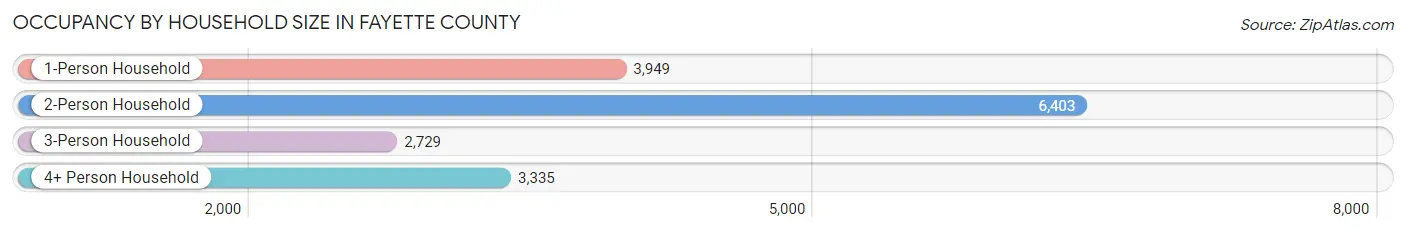
| Household Size | # Housing Units | % Housing Units |
| 1-Person Household | 3,949 | 24.1% |
| 2-Person Household | 6,403 | 39.0% |
| 3-Person Household | 2,729 | 16.6% |
| 4+ Person Household | 3,335 | 20.3% |
| Total Housing Units | 16,416 | 100.0% |
Occupancy by Ownership by Household Size in Fayette County
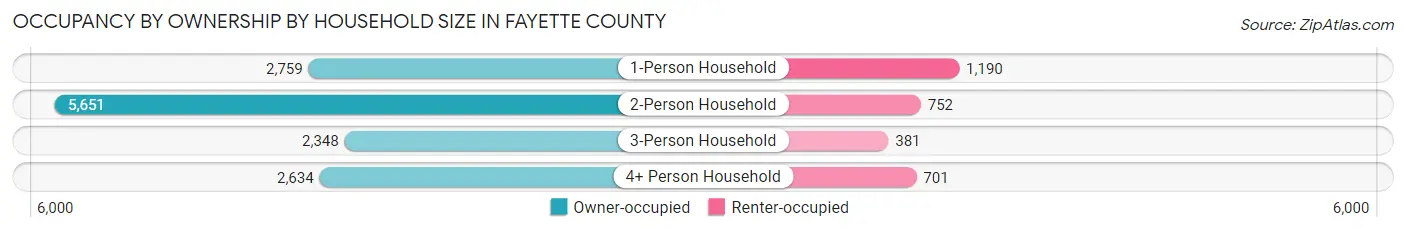
| Household Size | Owner-occupied | Renter-occupied |
| 1-Person Household | 2,759 (69.9%) | 1,190 (30.1%) |
| 2-Person Household | 5,651 (88.3%) | 752 (11.7%) |
| 3-Person Household | 2,348 (86.0%) | 381 (14.0%) |
| 4+ Person Household | 2,634 (79.0%) | 701 (21.0%) |
| Total Housing Units | 13,392 (81.6%) | 3,024 (18.4%) |
Occupancy by Educational Attainment in Fayette County
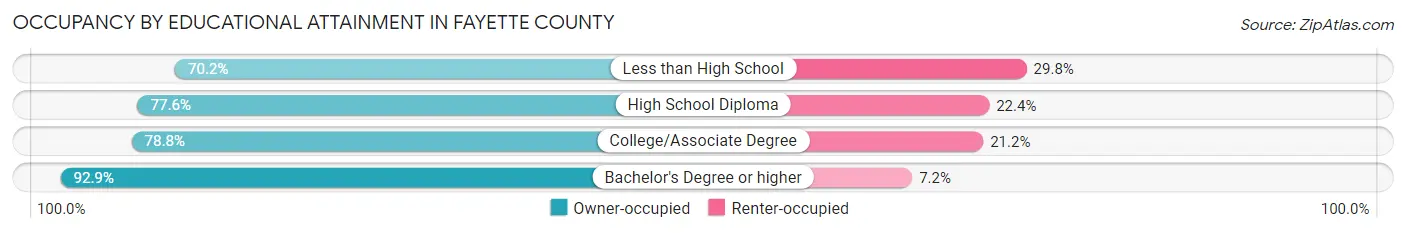
| Household Size | Owner-occupied | Renter-occupied |
| Less than High School | 1,079 (70.2%) | 459 (29.8%) |
| High School Diploma | 3,955 (77.6%) | 1,143 (22.4%) |
| College/Associate Degree | 4,045 (78.8%) | 1,090 (21.2%) |
| Bachelor's Degree or higher | 4,313 (92.8%) | 332 (7.1%) |
Occupancy by Age of Householder in Fayette County
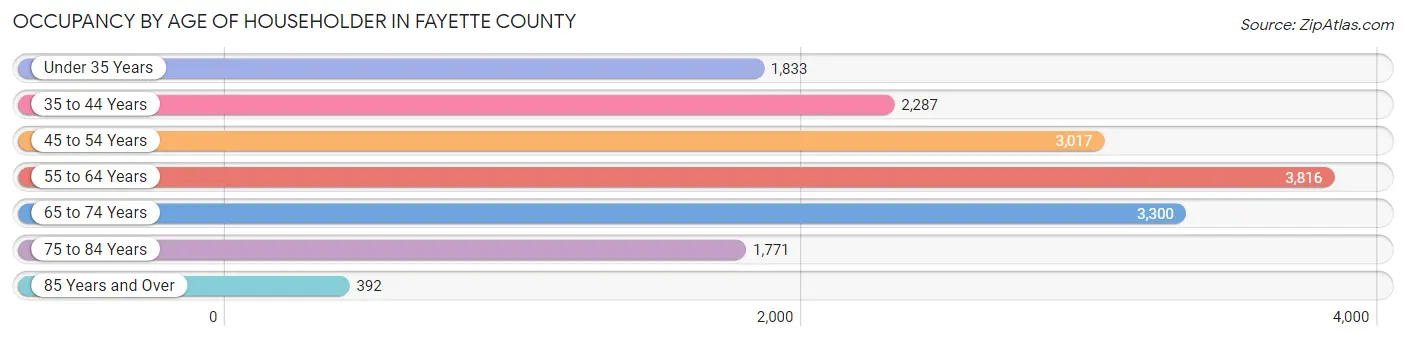
| Age Bracket | # Households | % Households |
| Under 35 Years | 1,833 | 11.2% |
| 35 to 44 Years | 2,287 | 13.9% |
| 45 to 54 Years | 3,017 | 18.4% |
| 55 to 64 Years | 3,816 | 23.3% |
| 65 to 74 Years | 3,300 | 20.1% |
| 75 to 84 Years | 1,771 | 10.8% |
| 85 Years and Over | 392 | 2.4% |
| Total | 16,416 | 100.0% |
Housing Finances in Fayette County
Median Income by Occupancy in Fayette County
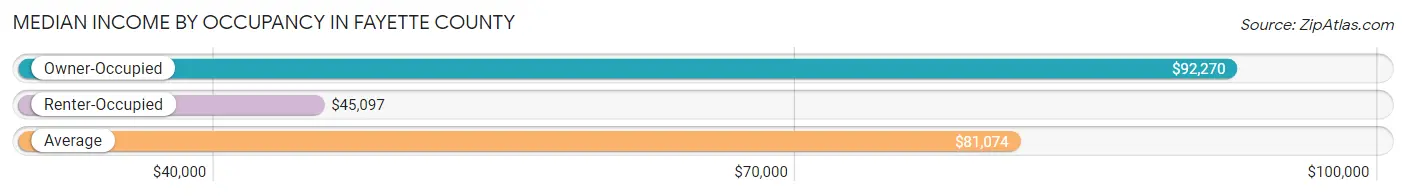
| Occupancy Type | # Households | Median Income |
| Owner-Occupied | 13,392 (81.6%) | $92,270 |
| Renter-Occupied | 3,024 (18.4%) | $45,097 |
| Average | 16,416 (100.0%) | $81,074 |
Occupancy by Householder Income Bracket in Fayette County
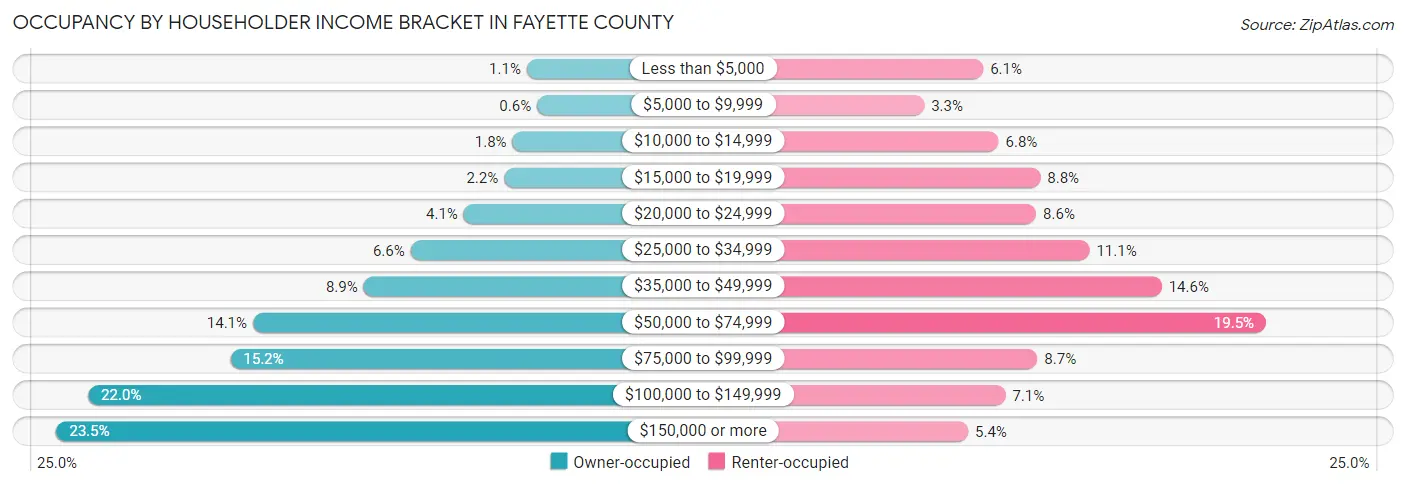
| Income Bracket | Owner-occupied | Renter-occupied |
| Less than $5,000 | 146 (1.1%) | 184 (6.1%) |
| $5,000 to $9,999 | 80 (0.6%) | 99 (3.3%) |
| $10,000 to $14,999 | 237 (1.8%) | 206 (6.8%) |
| $15,000 to $19,999 | 290 (2.2%) | 266 (8.8%) |
| $20,000 to $24,999 | 548 (4.1%) | 260 (8.6%) |
| $25,000 to $34,999 | 887 (6.6%) | 337 (11.1%) |
| $35,000 to $49,999 | 1,186 (8.9%) | 441 (14.6%) |
| $50,000 to $74,999 | 1,892 (14.1%) | 591 (19.5%) |
| $75,000 to $99,999 | 2,036 (15.2%) | 262 (8.7%) |
| $100,000 to $149,999 | 2,944 (22.0%) | 216 (7.1%) |
| $150,000 or more | 3,146 (23.5%) | 162 (5.4%) |
| Total | 13,392 (100.0%) | 3,024 (100.0%) |
Monthly Housing Cost Tiers in Fayette County
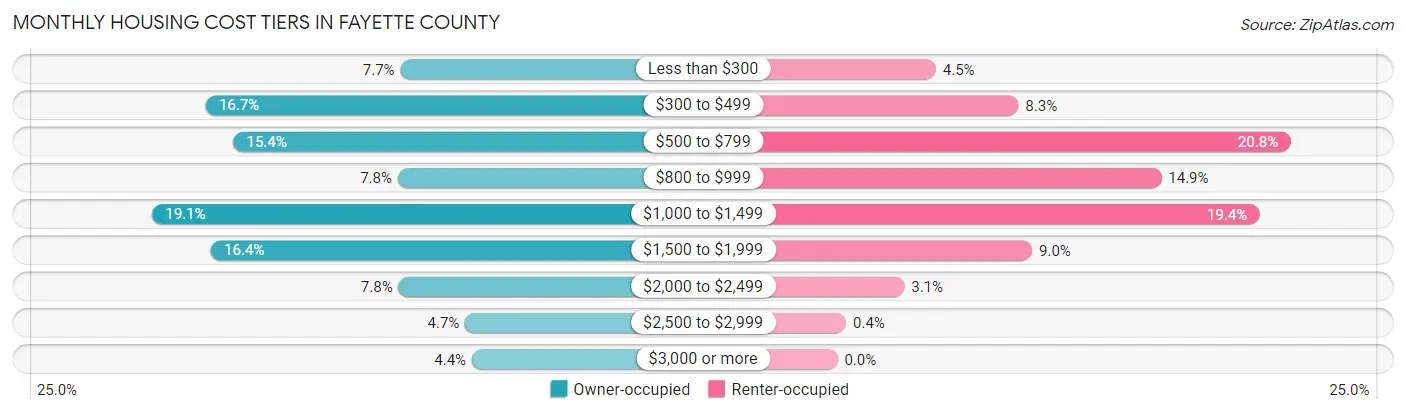
| Monthly Cost | Owner-occupied | Renter-occupied |
| Less than $300 | 1,031 (7.7%) | 137 (4.5%) |
| $300 to $499 | 2,230 (16.7%) | 252 (8.3%) |
| $500 to $799 | 2,060 (15.4%) | 630 (20.8%) |
| $800 to $999 | 1,047 (7.8%) | 451 (14.9%) |
| $1,000 to $1,499 | 2,560 (19.1%) | 587 (19.4%) |
| $1,500 to $1,999 | 2,198 (16.4%) | 271 (9.0%) |
| $2,000 to $2,499 | 1,043 (7.8%) | 93 (3.1%) |
| $2,500 to $2,999 | 632 (4.7%) | 12 (0.4%) |
| $3,000 or more | 591 (4.4%) | 0 (0.0%) |
| Total | 13,392 (100.0%) | 3,024 (100.0%) |
Physical Housing Characteristics in Fayette County
Housing Structures in Fayette County
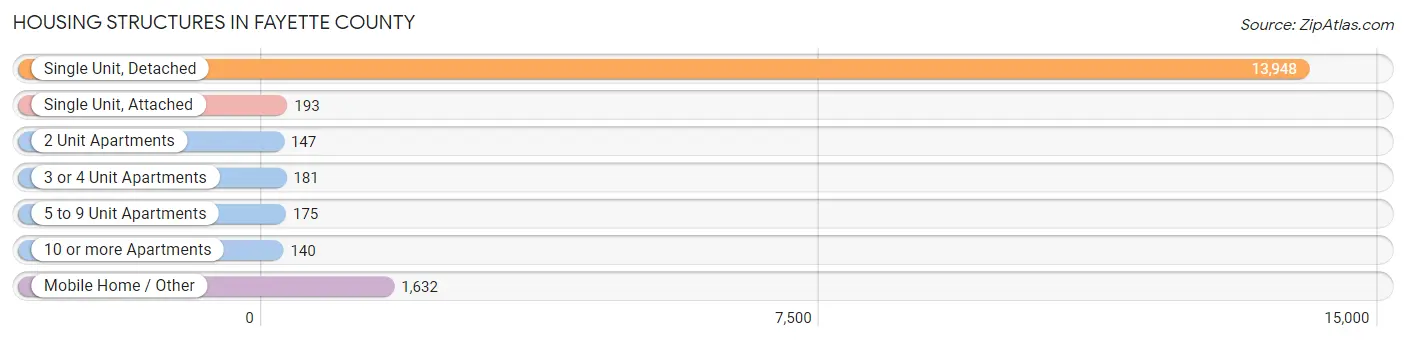
| Structure Type | # Housing Units | % Housing Units |
| Single Unit, Detached | 13,948 | 85.0% |
| Single Unit, Attached | 193 | 1.2% |
| 2 Unit Apartments | 147 | 0.9% |
| 3 or 4 Unit Apartments | 181 | 1.1% |
| 5 to 9 Unit Apartments | 175 | 1.1% |
| 10 or more Apartments | 140 | 0.9% |
| Mobile Home / Other | 1,632 | 9.9% |
| Total | 16,416 | 100.0% |
Housing Structures by Occupancy in Fayette County
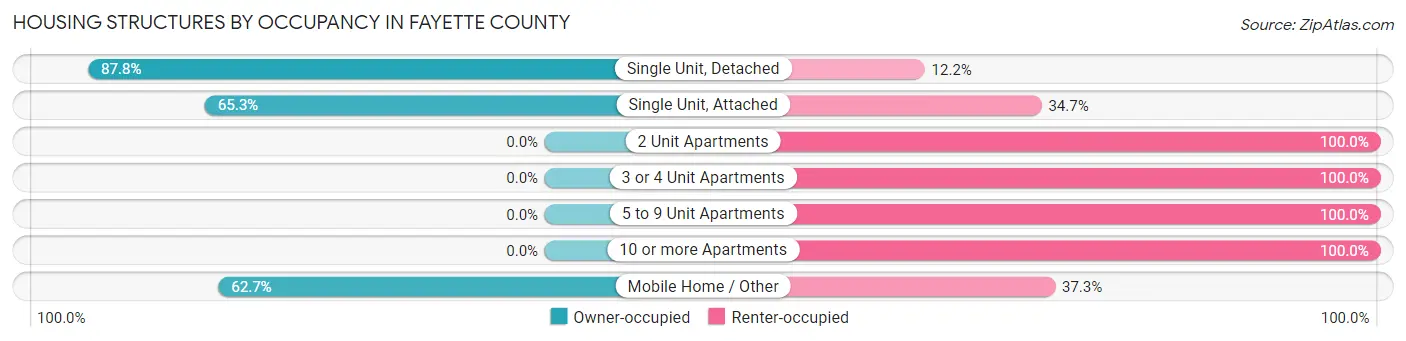
| Structure Type | Owner-occupied | Renter-occupied |
| Single Unit, Detached | 12,243 (87.8%) | 1,705 (12.2%) |
| Single Unit, Attached | 126 (65.3%) | 67 (34.7%) |
| 2 Unit Apartments | 0 (0.0%) | 147 (100.0%) |
| 3 or 4 Unit Apartments | 0 (0.0%) | 181 (100.0%) |
| 5 to 9 Unit Apartments | 0 (0.0%) | 175 (100.0%) |
| 10 or more Apartments | 0 (0.0%) | 140 (100.0%) |
| Mobile Home / Other | 1,023 (62.7%) | 609 (37.3%) |
| Total | 13,392 (81.6%) | 3,024 (18.4%) |
Housing Structures by Number of Rooms in Fayette County
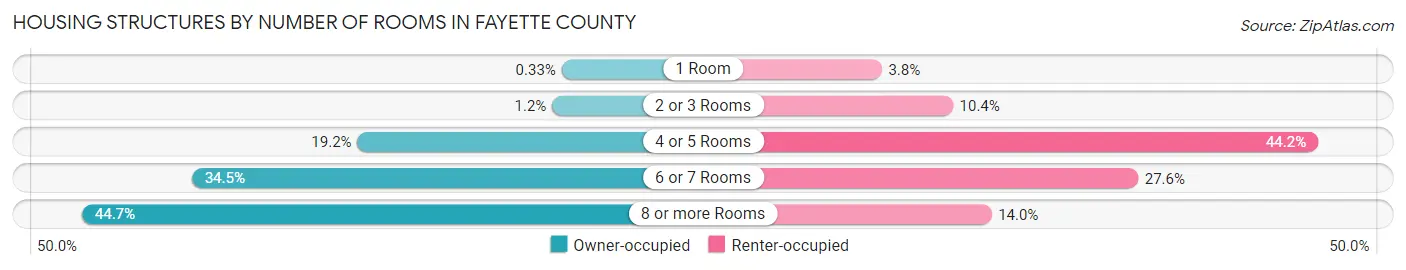
| Number of Rooms | Owner-occupied | Renter-occupied |
| 1 Room | 44 (0.3%) | 116 (3.8%) |
| 2 or 3 Rooms | 162 (1.2%) | 315 (10.4%) |
| 4 or 5 Rooms | 2,574 (19.2%) | 1,337 (44.2%) |
| 6 or 7 Rooms | 4,626 (34.5%) | 833 (27.6%) |
| 8 or more Rooms | 5,986 (44.7%) | 423 (14.0%) |
| Total | 13,392 (100.0%) | 3,024 (100.0%) |
Housing Structure by Heating Type in Fayette County
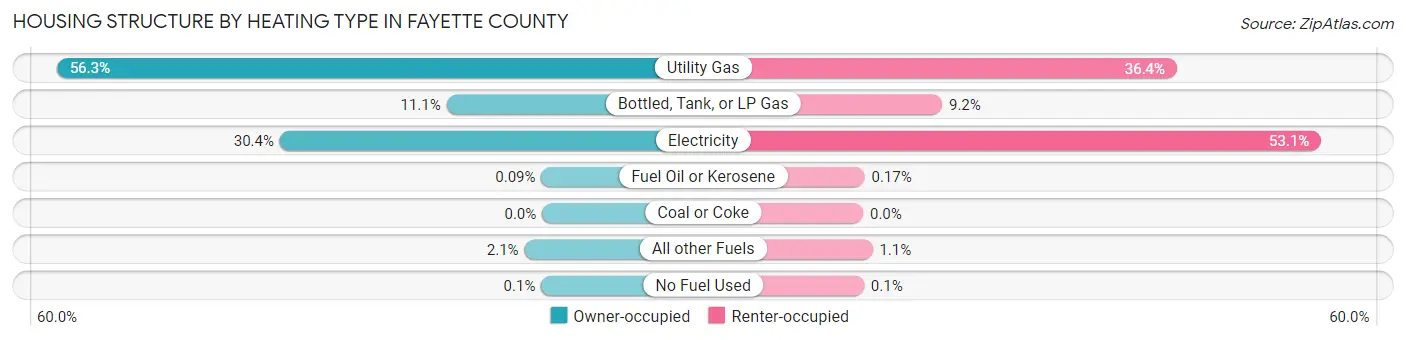
| Heating Type | Owner-occupied | Renter-occupied |
| Utility Gas | 7,536 (56.3%) | 1,100 (36.4%) |
| Bottled, Tank, or LP Gas | 1,484 (11.1%) | 277 (9.2%) |
| Electricity | 4,072 (30.4%) | 1,606 (53.1%) |
| Fuel Oil or Kerosene | 12 (0.1%) | 5 (0.2%) |
| Coal or Coke | 0 (0.0%) | 0 (0.0%) |
| All other Fuels | 274 (2.1%) | 33 (1.1%) |
| No Fuel Used | 14 (0.1%) | 3 (0.1%) |
| Total | 13,392 (100.0%) | 3,024 (100.0%) |
Household Vehicle Usage in Fayette County
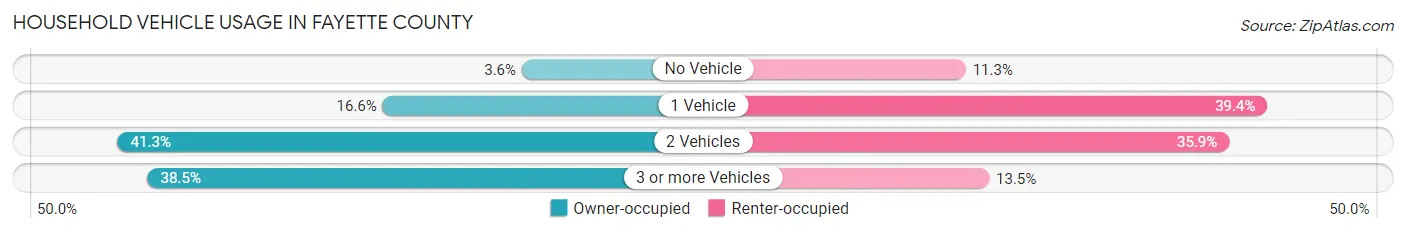
| Vehicles per Household | Owner-occupied | Renter-occupied |
| No Vehicle | 480 (3.6%) | 341 (11.3%) |
| 1 Vehicle | 2,221 (16.6%) | 1,192 (39.4%) |
| 2 Vehicles | 5,532 (41.3%) | 1,084 (35.8%) |
| 3 or more Vehicles | 5,159 (38.5%) | 407 (13.5%) |
| Total | 13,392 (100.0%) | 3,024 (100.0%) |
Real Estate & Mortgages in Fayette County
Real Estate and Mortgage Overview in Fayette County
| Characteristic | Without Mortgage | With Mortgage |
| Housing Units | 5,276 | 8,116 |
| Median Property Value | $256,400 | $296,200 |
| Median Household Income | $70,635 | $2,331 |
| Monthly Housing Costs | $447 | $591 |
| Real Estate Taxes | $888 | $141 |
Property Value by Mortgage Status in Fayette County
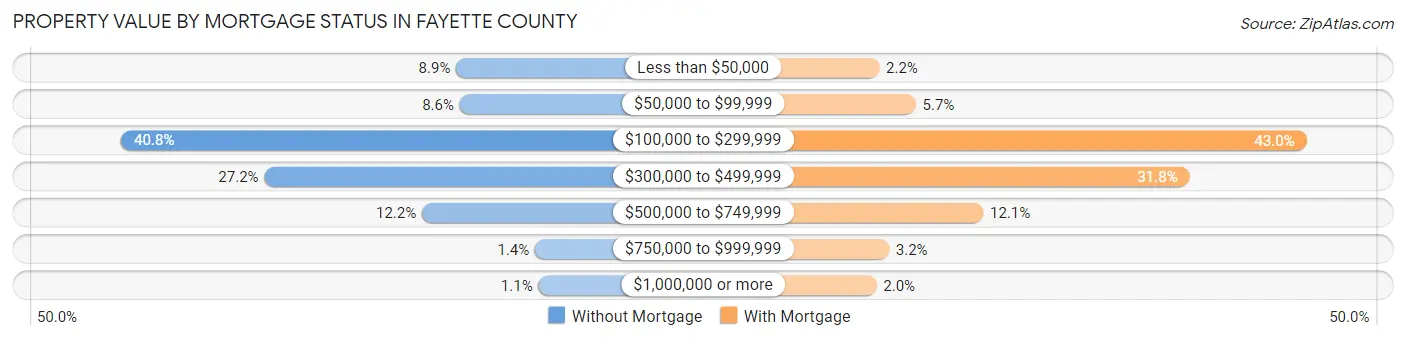
| Property Value | Without Mortgage | With Mortgage |
| Less than $50,000 | 469 (8.9%) | 182 (2.2%) |
| $50,000 to $99,999 | 451 (8.6%) | 464 (5.7%) |
| $100,000 to $299,999 | 2,153 (40.8%) | 3,486 (42.9%) |
| $300,000 to $499,999 | 1,433 (27.2%) | 2,581 (31.8%) |
| $500,000 to $749,999 | 641 (12.1%) | 985 (12.1%) |
| $750,000 to $999,999 | 73 (1.4%) | 257 (3.2%) |
| $1,000,000 or more | 56 (1.1%) | 161 (2.0%) |
| Total | 5,276 (100.0%) | 8,116 (100.0%) |
Household Income by Mortgage Status in Fayette County
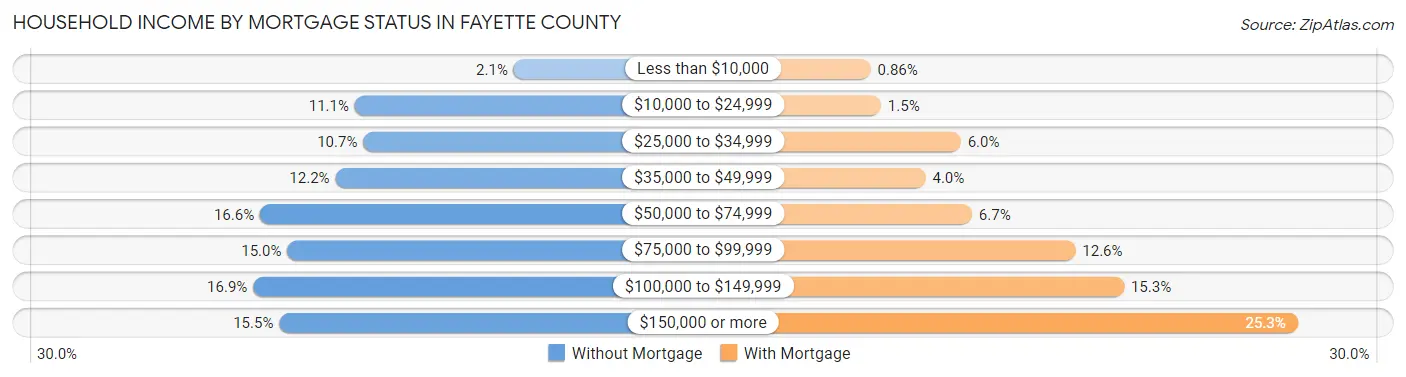
| Household Income | Without Mortgage | With Mortgage |
| Less than $10,000 | 108 (2.1%) | 70 (0.9%) |
| $10,000 to $24,999 | 587 (11.1%) | 118 (1.5%) |
| $25,000 to $34,999 | 562 (10.6%) | 488 (6.0%) |
| $35,000 to $49,999 | 646 (12.2%) | 325 (4.0%) |
| $50,000 to $74,999 | 873 (16.6%) | 540 (6.7%) |
| $75,000 to $99,999 | 791 (15.0%) | 1,019 (12.6%) |
| $100,000 to $149,999 | 894 (16.9%) | 1,245 (15.3%) |
| $150,000 or more | 815 (15.4%) | 2,050 (25.3%) |
| Total | 5,276 (100.0%) | 8,116 (100.0%) |
Property Value to Household Income Ratio in Fayette County
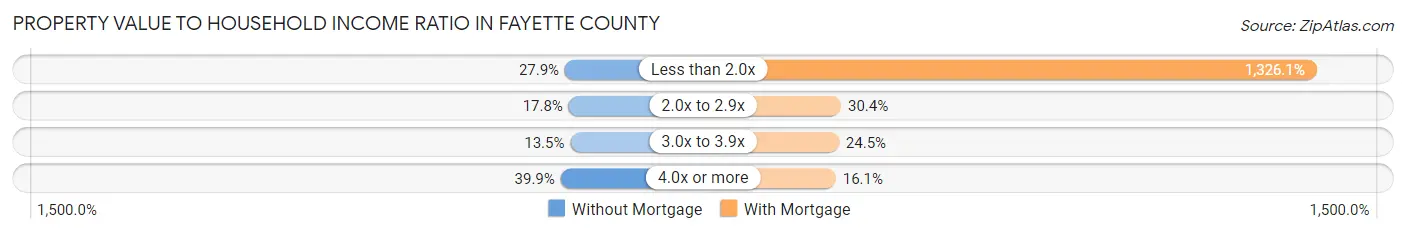
| Value-to-Income Ratio | Without Mortgage | With Mortgage |
| Less than 2.0x | 1,474 (27.9%) | 107,622 (1,326.1%) |
| 2.0x to 2.9x | 940 (17.8%) | 2,468 (30.4%) |
| 3.0x to 3.9x | 713 (13.5%) | 1,986 (24.5%) |
| 4.0x or more | 2,105 (39.9%) | 1,307 (16.1%) |
| Total | 5,276 (100.0%) | 8,116 (100.0%) |
Real Estate Taxes by Mortgage Status in Fayette County
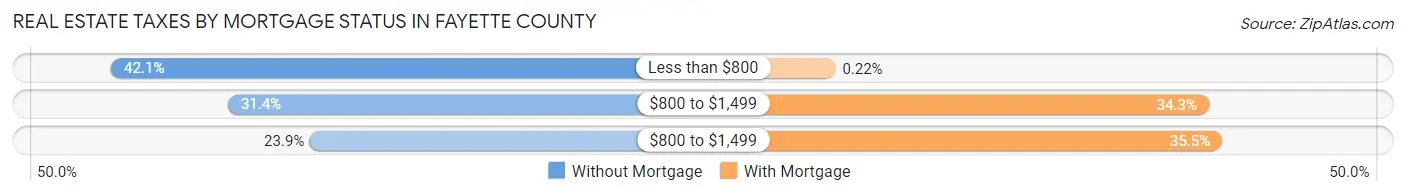
| Property Taxes | Without Mortgage | With Mortgage |
| Less than $800 | 2,221 (42.1%) | 18 (0.2%) |
| $800 to $1,499 | 1,658 (31.4%) | 2,785 (34.3%) |
| $800 to $1,499 | 1,262 (23.9%) | 2,883 (35.5%) |
| Total | 5,276 (100.0%) | 8,116 (100.0%) |
Health & Disability in Fayette County
Health Insurance Coverage by Age in Fayette County
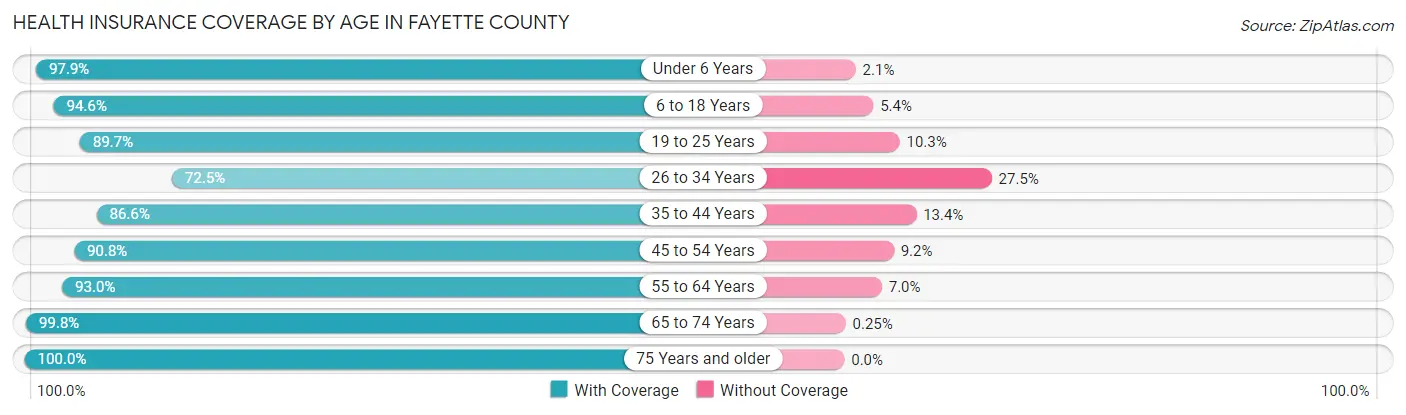
| Age Bracket | With Coverage | Without Coverage |
| Under 6 Years | 2,311 (97.9%) | 50 (2.1%) |
| 6 to 18 Years | 5,360 (94.6%) | 306 (5.4%) |
| 19 to 25 Years | 2,518 (89.7%) | 289 (10.3%) |
| 26 to 34 Years | 3,162 (72.5%) | 1,198 (27.5%) |
| 35 to 44 Years | 4,034 (86.6%) | 625 (13.4%) |
| 45 to 54 Years | 5,107 (90.8%) | 518 (9.2%) |
| 55 to 64 Years | 6,650 (93.0%) | 500 (7.0%) |
| 65 to 74 Years | 5,577 (99.8%) | 14 (0.3%) |
| 75 Years and older | 3,462 (100.0%) | 0 (0.0%) |
| Total | 38,181 (91.6%) | 3,500 (8.4%) |
Health Insurance Coverage by Citizenship Status in Fayette County
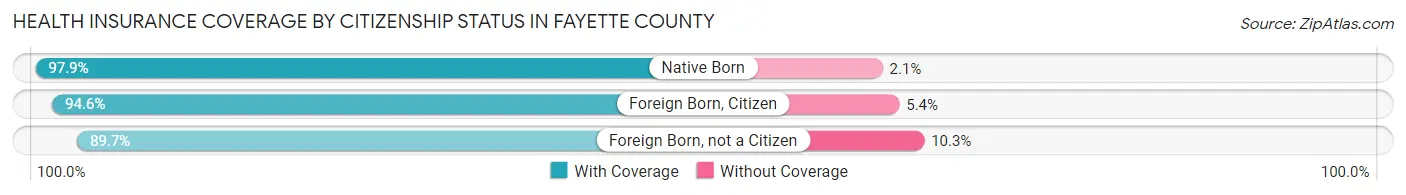
| Citizenship Status | With Coverage | Without Coverage |
| Native Born | 2,311 (97.9%) | 50 (2.1%) |
| Foreign Born, Citizen | 5,360 (94.6%) | 306 (5.4%) |
| Foreign Born, not a Citizen | 2,518 (89.7%) | 289 (10.3%) |
Health Insurance Coverage by Household Income in Fayette County
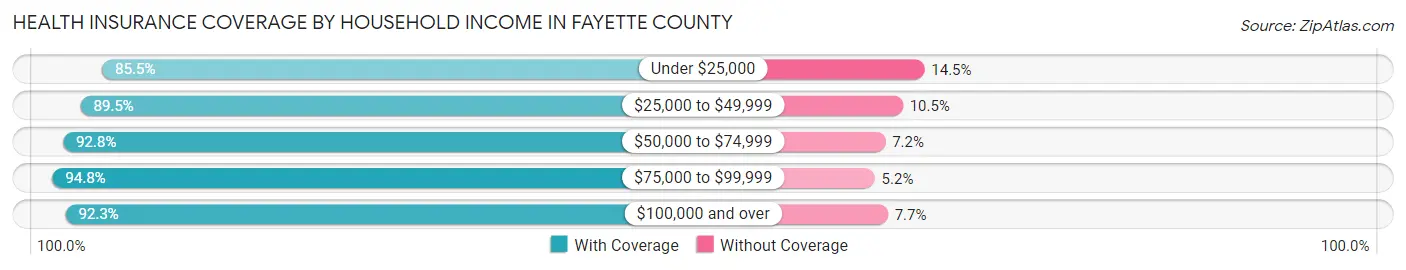
| Household Income | With Coverage | Without Coverage |
| Under $25,000 | 3,594 (85.5%) | 611 (14.5%) |
| $25,000 to $49,999 | 5,607 (89.5%) | 656 (10.5%) |
| $50,000 to $74,999 | 5,595 (92.8%) | 434 (7.2%) |
| $75,000 to $99,999 | 5,320 (94.8%) | 293 (5.2%) |
| $100,000 and over | 18,036 (92.3%) | 1,496 (7.7%) |
Public vs Private Health Insurance Coverage by Age in Fayette County
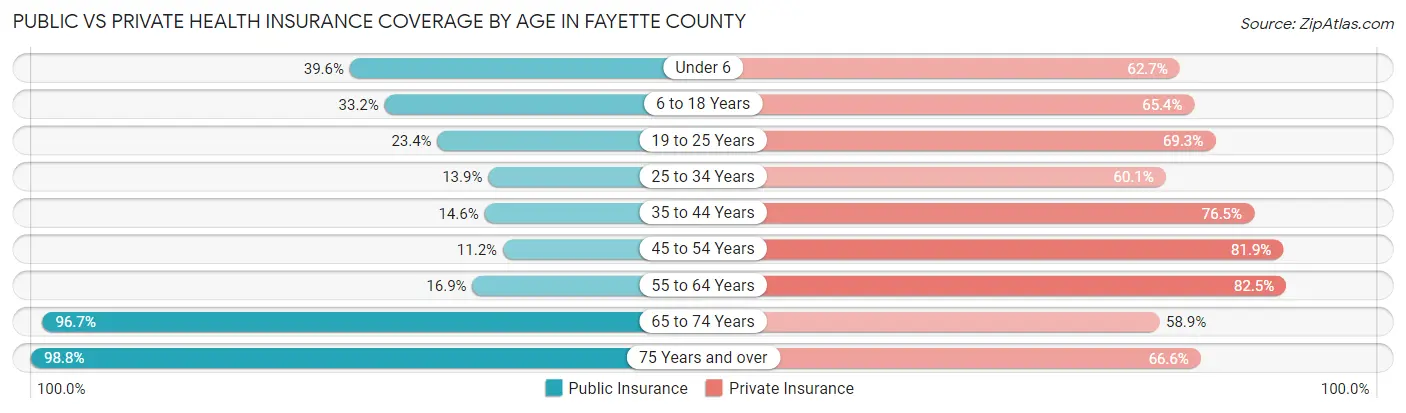
| Age Bracket | Public Insurance | Private Insurance |
| Under 6 | 936 (39.6%) | 1,480 (62.7%) |
| 6 to 18 Years | 1,880 (33.2%) | 3,707 (65.4%) |
| 19 to 25 Years | 656 (23.4%) | 1,945 (69.3%) |
| 25 to 34 Years | 608 (13.9%) | 2,621 (60.1%) |
| 35 to 44 Years | 682 (14.6%) | 3,563 (76.5%) |
| 45 to 54 Years | 631 (11.2%) | 4,608 (81.9%) |
| 55 to 64 Years | 1,207 (16.9%) | 5,895 (82.5%) |
| 65 to 74 Years | 5,405 (96.7%) | 3,292 (58.9%) |
| 75 Years and over | 3,420 (98.8%) | 2,306 (66.6%) |
| Total | 15,425 (37.0%) | 29,417 (70.6%) |
Disability Status by Sex by Age in Fayette County

| Age Bracket | Male | Female |
| Under 5 Years | 0 (0.0%) | 0 (0.0%) |
| 5 to 17 Years | 212 (7.2%) | 138 (5.1%) |
| 18 to 34 Years | 250 (6.6%) | 272 (7.3%) |
| 35 to 64 Years | 1,783 (20.5%) | 1,286 (14.7%) |
| 65 to 74 Years | 862 (31.8%) | 666 (23.1%) |
| 75 Years and over | 824 (51.4%) | 878 (47.2%) |
Disability Class by Sex by Age in Fayette County
Disability Class: Hearing Difficulty
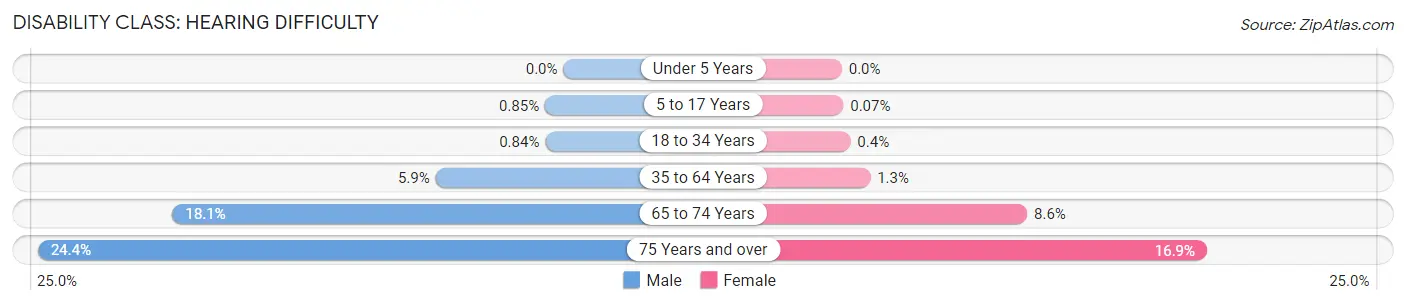
| Age Bracket | Male | Female |
| Under 5 Years | 0 (0.0%) | 0 (0.0%) |
| 5 to 17 Years | 25 (0.9%) | 2 (0.1%) |
| 18 to 34 Years | 32 (0.8%) | 15 (0.4%) |
| 35 to 64 Years | 516 (5.9%) | 115 (1.3%) |
| 65 to 74 Years | 491 (18.1%) | 248 (8.6%) |
| 75 Years and over | 391 (24.4%) | 315 (16.9%) |
Disability Class: Vision Difficulty
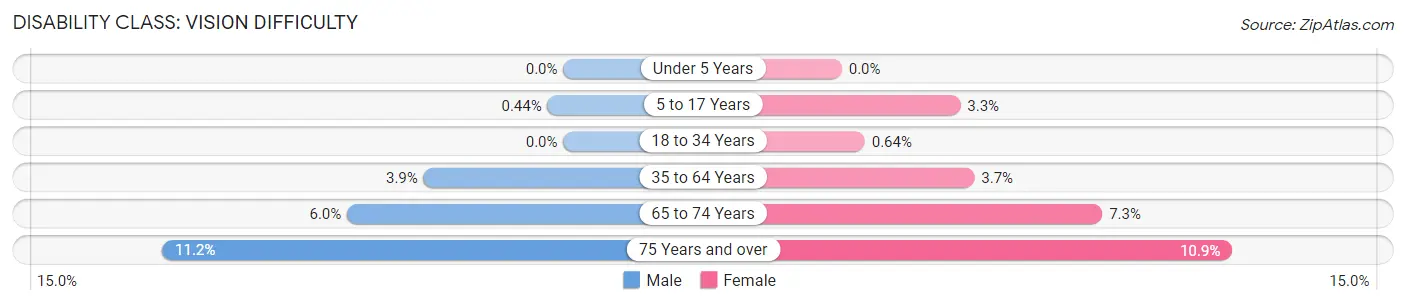
| Age Bracket | Male | Female |
| Under 5 Years | 0 (0.0%) | 0 (0.0%) |
| 5 to 17 Years | 13 (0.4%) | 89 (3.3%) |
| 18 to 34 Years | 0 (0.0%) | 24 (0.6%) |
| 35 to 64 Years | 338 (3.9%) | 322 (3.7%) |
| 65 to 74 Years | 163 (6.0%) | 209 (7.2%) |
| 75 Years and over | 179 (11.2%) | 202 (10.9%) |
Disability Class: Cognitive Difficulty
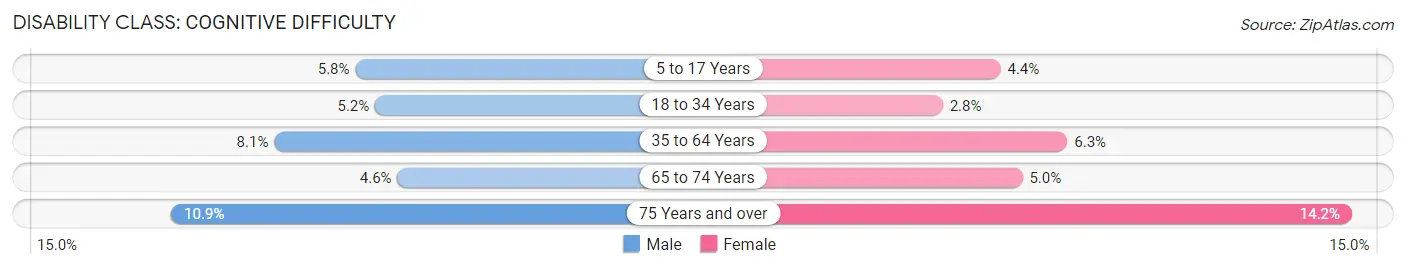
| Age Bracket | Male | Female |
| 5 to 17 Years | 170 (5.8%) | 119 (4.4%) |
| 18 to 34 Years | 200 (5.2%) | 105 (2.8%) |
| 35 to 64 Years | 700 (8.1%) | 549 (6.3%) |
| 65 to 74 Years | 125 (4.6%) | 145 (5.0%) |
| 75 Years and over | 175 (10.9%) | 264 (14.2%) |
Disability Class: Ambulatory Difficulty

| Age Bracket | Male | Female |
| 5 to 17 Years | 3 (0.1%) | 83 (3.1%) |
| 18 to 34 Years | 77 (2.0%) | 58 (1.5%) |
| 35 to 64 Years | 829 (9.5%) | 663 (7.6%) |
| 65 to 74 Years | 470 (17.4%) | 361 (12.5%) |
| 75 Years and over | 425 (26.5%) | 655 (35.2%) |
Disability Class: Self-Care Difficulty
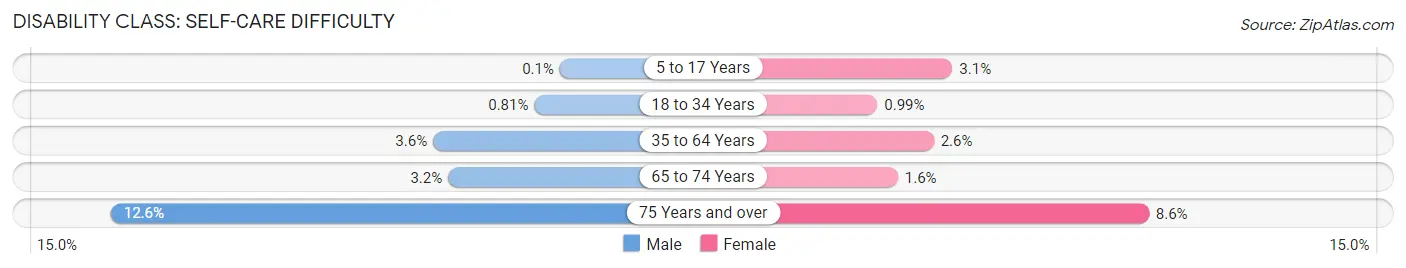
| Age Bracket | Male | Female |
| 5 to 17 Years | 3 (0.1%) | 83 (3.1%) |
| 18 to 34 Years | 31 (0.8%) | 37 (1.0%) |
| 35 to 64 Years | 316 (3.6%) | 224 (2.6%) |
| 65 to 74 Years | 87 (3.2%) | 45 (1.6%) |
| 75 Years and over | 202 (12.6%) | 159 (8.6%) |
Technology Access in Fayette County
Computing Device Access in Fayette County
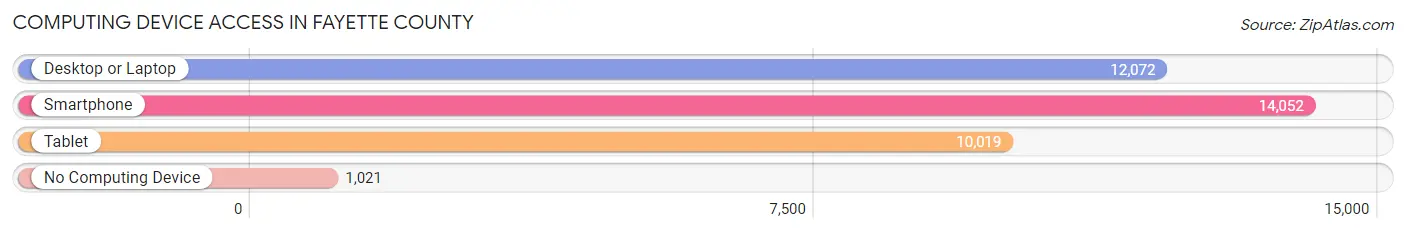
| Device Type | # Households | % Households |
| Desktop or Laptop | 12,072 | 73.5% |
| Smartphone | 14,052 | 85.6% |
| Tablet | 10,019 | 61.0% |
| No Computing Device | 1,021 | 6.2% |
| Total | 16,416 | 100.0% |
Internet Access in Fayette County
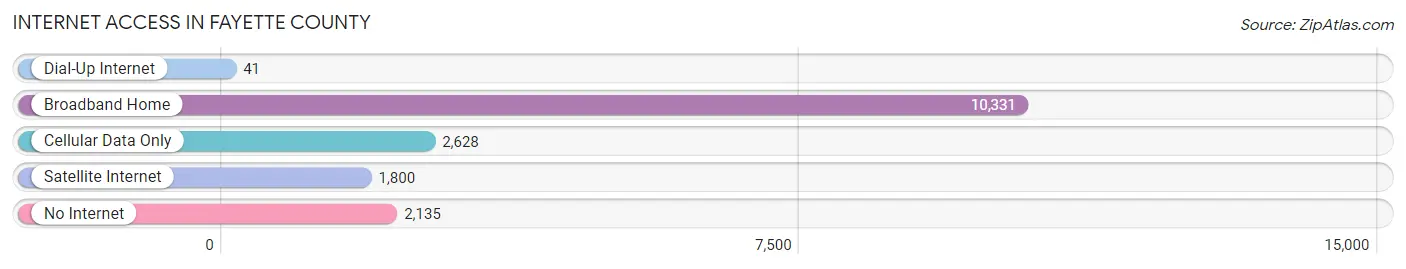
| Internet Type | # Households | % Households |
| Dial-Up Internet | 41 | 0.3% |
| Broadband Home | 10,331 | 62.9% |
| Cellular Data Only | 2,628 | 16.0% |
| Satellite Internet | 1,800 | 11.0% |
| No Internet | 2,135 | 13.0% |
| Total | 16,416 | 100.0% |
Fayette County Summary
Fayette County is located in the southwestern corner of Tennessee, and is part of the Memphis metropolitan area. It is bordered by Shelby County to the north, Tipton County to the east, Hardeman County to the south, and Marshall County, Mississippi to the west. The county seat is Somerville, and the largest city is Oakland. As of the 2010 census, the population of Fayette County was 38,413.
Geography
Fayette County covers an area of 545 square miles, making it the second-largest county in Tennessee by land area. The terrain is mostly flat, with some rolling hills in the northern part of the county. The Loosahatchie River runs through the county, and there are several small lakes and ponds scattered throughout. The county is mostly rural, with the majority of the population living in small towns and villages.
The climate of Fayette County is humid subtropical, with hot, humid summers and mild winters. The average annual temperature is around 63°F, and the average annual precipitation is around 45 inches.
History
Fayette County was established in 1824, and was named after the Marquis de Lafayette, a French military officer who fought in the American Revolutionary War. The county was originally part of Shelby County, but was split off due to its large size.
The county was largely agricultural in the 19th century, with cotton being the main crop. The Memphis and Charleston Railroad was built through the county in the 1850s, connecting Memphis to Chattanooga. This helped to spur economic growth in the area, and the county’s population began to grow.
In the early 20th century, the county’s economy shifted from agriculture to manufacturing. Several factories were built in the county, including a cotton mill, a furniture factory, and a shoe factory. The county’s population continued to grow throughout the 20th century, and by the 2000 census, it had reached 38,413.
Economy
Fayette County’s economy is largely based on manufacturing and agriculture. The county’s largest employers are the Somerville Manufacturing Company, which produces furniture, and the Fayette County Shoe Company, which produces shoes. Other major employers include the Fayette County Hospital, the Fayette County School System, and the Fayette County Government.
Agriculture is also an important part of the county’s economy. The main crops grown in the county are cotton, soybeans, corn, and wheat. Livestock production is also important, with cattle, hogs, and poultry being the main animals raised.
Demographics
As of the 2010 census, the population of Fayette County was 38,413. The population is mostly white (86.3%), with African Americans making up 10.3% of the population, and Hispanics making up 2.3%. The median household income is $41,945, and the median home value is $117,400.
The county is served by the Fayette County School System, which consists of 11 elementary schools, four middle schools, and two high schools. The county is also home to several colleges and universities, including the University of Memphis-Lambuth Campus, the University of Tennessee-Martin, and the University of Tennessee-Fayetteville.
Conclusion
Fayette County is a rural county located in the southwestern corner of Tennessee. It is part of the Memphis metropolitan area, and is bordered by Shelby County to the north, Tipton County to the east, Hardeman County to the south, and Marshall County, Mississippi to the west. The county has a population of 38,413, and its economy is largely based on manufacturing and agriculture. The county is served by the Fayette County School System, and is home to several colleges and universities.
Common Questions
What is the Total Population of Fayette County?
Total Population of Fayette County is 42,228.
What is the Total Male Population of Fayette County?
Total Male Population of Fayette County is 21,068.
What is the Total Female Population of Fayette County?
Total Female Population of Fayette County is 21,160.
What is the Ratio of Males per 100 Females in Fayette County?
There are 99.57 Males per 100 Females in Fayette County.
What is the Ratio of Females per 100 Males in Fayette County?
There are 100.44 Females per 100 Males in Fayette County.
What is the Median Population Age in Fayette County?
Median Population Age in Fayette County is 46.8 Years.
What is the Average Family Size in Fayette County
Average Family Size in Fayette County is 3.0 People.
What is the Average Household Size in Fayette County
Average Household Size in Fayette County is 2.5 People.
What is Per Capita Income in Fayette County?
Per Capita income in Fayette County is $40,613.
What is the Median Family Income in Fayette County?
Median Family Income in Fayette County is $96,675.
What is the Median Household income in Fayette County?
Median Household Income in Fayette County is $81,074.
What is Income or Wage Gap in Fayette County?
Income or Wage Gap in Fayette County is 32.3%.
Women in Fayette County earn 67.7 cents for every dollar earned by a man.
What is Family Income Deficit in Fayette County?
Family Income Deficit in Fayette County is $8,574.
Families that are below poverty line in Fayette County earn $8,574 less on average than the poverty threshold level.
What is Inequality or Gini Index in Fayette County?
Inequality or Gini Index in Fayette County is 0.44.
How Large is the Labor Force in Fayette County?
There are 20,583 People in the Labor Forcein in Fayette County.
What is the Percentage of People in the Labor Force in Fayette County?
58.1% of People are in the Labor Force in Fayette County.
What is the Unemployment Rate in Fayette County?
Unemployment Rate in Fayette County is 5.3%.