Dyer County, TN
Dyer County Overview
36,818
TOTAL POPULATION
17,679
MALE POPULATION
19,139
FEMALE POPULATION
92.37
MALES / 100 FEMALES
108.26
FEMALES / 100 MALES
40.5
MEDIAN AGE
3.1
AVG FAMILY SIZE
2.5
AVG HOUSEHOLD SIZE
$37,415
PER CAPITA INCOME
$66,250
AVG FAMILY INCOME
$53,150
AVG HOUSEHOLD INCOME
35.4%
WAGE / INCOME GAP [ % ]
64.6¢/ $1
WAGE / INCOME GAP [ $ ]
$10,729
FAMILY INCOME DEFICIT
0.59
INEQUALITY / GINI INDEX
16,750
LABOR FORCE [ PEOPLE ]
57.9%
PERCENT IN LABOR FORCE
4.5%
UNEMPLOYMENT RATE
Dyer County Area Codes
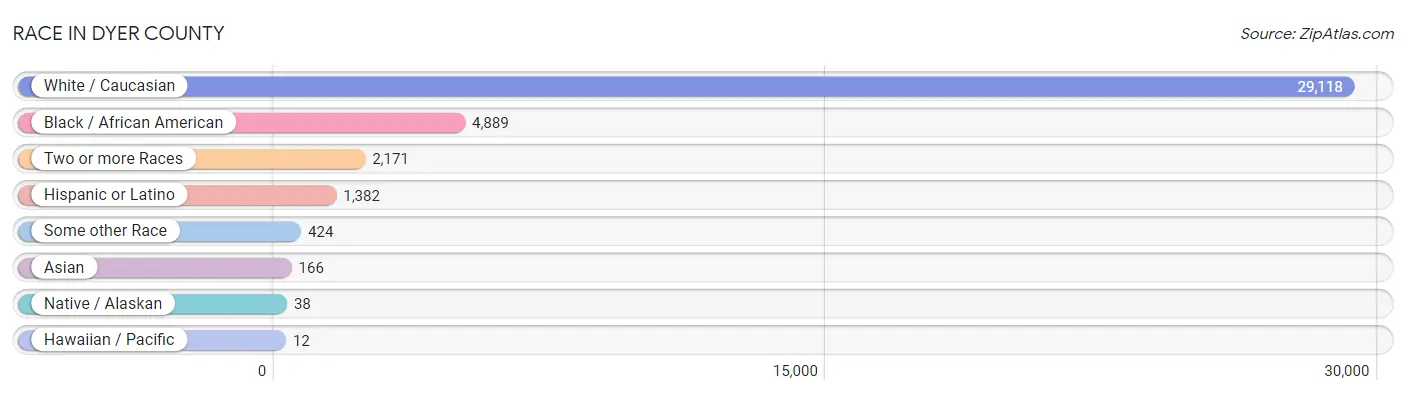
Race in Dyer County
The most populous races in Dyer County are White / Caucasian (29,118 | 79.1%), Black / African American (4,889 | 13.3%), and Two or more Races (2,171 | 5.9%).
| Race | # Population | % Population |
| Asian | 166 | 0.4% |
| Black / African American | 4,889 | 13.3% |
| Hawaiian / Pacific | 12 | 0.0% |
| Hispanic or Latino | 1,382 | 3.7% |
| Native / Alaskan | 38 | 0.1% |
| White / Caucasian | 29,118 | 79.1% |
| Two or more Races | 2,171 | 5.9% |
| Some other Race | 424 | 1.1% |
| Total | 36,818 | 100.0% |
Ancestry in Dyer County
The most populous ancestries reported in Dyer County are Irish (4,366 | 11.9%), American (4,138 | 11.2%), English (3,543 | 9.6%), German (2,866 | 7.8%), and Scotch-Irish (1,027 | 2.8%), together accounting for 43.3% of all Dyer County residents.

| Ancestry | # Population | % Population |
| African | 66 | 0.2% |
| American | 4,138 | 11.2% |
| Arab | 22 | 0.1% |
| Austrian | 12 | 0.0% |
| British | 115 | 0.3% |
| Burmese | 48 | 0.1% |
| Canadian | 13 | 0.0% |
| Central American | 74 | 0.2% |
| Central American Indian | 10 | 0.0% |
| Cherokee | 97 | 0.3% |
| Creek | 17 | 0.1% |
| Czech | 11 | 0.0% |
| Czechoslovakian | 28 | 0.1% |
| Dutch | 205 | 0.6% |
| Eastern European | 27 | 0.1% |
| Ecuadorian | 9 | 0.0% |
| English | 3,543 | 9.6% |
| European | 462 | 1.3% |
| French | 880 | 2.4% |
| French Canadian | 18 | 0.1% |
| German | 2,866 | 7.8% |
| Ghanaian | 24 | 0.1% |
| Honduran | 10 | 0.0% |
| Hungarian | 14 | 0.0% |
| Indian (Asian) | 34 | 0.1% |
| Irish | 4,366 | 11.9% |
| Iroquois | 17 | 0.1% |
| Italian | 712 | 1.9% |
| Korean | 66 | 0.2% |
| Laotian | 16 | 0.0% |
| Lithuanian | 53 | 0.1% |
| Mexican | 1,001 | 2.7% |
| Mexican American Indian | 10 | 0.0% |
| Native Hawaiian | 12 | 0.0% |
| Navajo | 9 | 0.0% |
| Northern European | 19 | 0.1% |
| Norwegian | 63 | 0.2% |
| Pakistani | 60 | 0.2% |
| Panamanian | 40 | 0.1% |
| Polish | 570 | 1.5% |
| Puerto Rican | 78 | 0.2% |
| Romanian | 9 | 0.0% |
| Russian | 43 | 0.1% |
| Salvadoran | 24 | 0.1% |
| Scandinavian | 131 | 0.4% |
| Scotch-Irish | 1,027 | 2.8% |
| Scottish | 431 | 1.2% |
| Slovak | 18 | 0.1% |
| Slovene | 13 | 0.0% |
| South American | 9 | 0.0% |
| South American Indian | 10 | 0.0% |
| Spaniard | 220 | 0.6% |
| Sri Lankan | 58 | 0.2% |
| Subsaharan African | 90 | 0.2% |
| Swedish | 241 | 0.6% |
| Swiss | 5 | 0.0% |
| Welsh | 74 | 0.2% | View All 57 Rows |
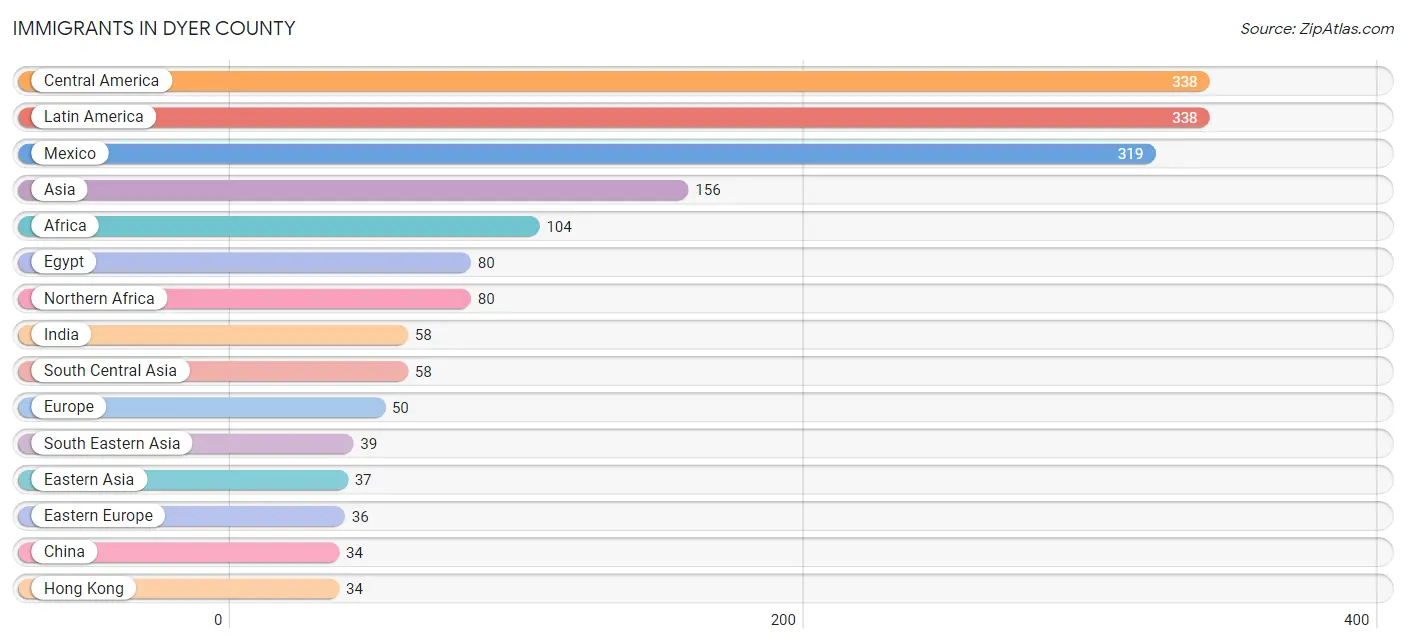
Immigrants in Dyer County
The most numerous immigrant groups reported in Dyer County came from Central America (338 | 0.9%), Latin America (338 | 0.9%), Mexico (319 | 0.9%), Asia (156 | 0.4%), and Africa (104 | 0.3%), together accounting for 3.4% of all Dyer County residents.
| Immigration Origin | # Population | % Population |
| Africa | 104 | 0.3% |
| Asia | 156 | 0.4% |
| Canada | 3 | 0.0% |
| Central America | 338 | 0.9% |
| China | 34 | 0.1% |
| Eastern Asia | 37 | 0.1% |
| Eastern Europe | 36 | 0.1% |
| Egypt | 80 | 0.2% |
| Europe | 50 | 0.1% |
| France | 12 | 0.0% |
| Germany | 2 | 0.0% |
| Ghana | 24 | 0.1% |
| Hong Kong | 34 | 0.1% |
| Hungary | 14 | 0.0% |
| India | 58 | 0.2% |
| Iraq | 22 | 0.1% |
| Korea | 3 | 0.0% |
| Latin America | 338 | 0.9% |
| Mexico | 319 | 0.9% |
| Northern Africa | 80 | 0.2% |
| Panama | 19 | 0.1% |
| Philippines | 13 | 0.0% |
| Romania | 9 | 0.0% |
| South Central Asia | 58 | 0.2% |
| South Eastern Asia | 39 | 0.1% |
| Thailand | 26 | 0.1% |
| Western Africa | 24 | 0.1% |
| Western Asia | 22 | 0.1% |
| Western Europe | 14 | 0.0% | View All 29 Rows |
Sex and Age in Dyer County
Sex and Age in Dyer County
The most populous age groups in Dyer County are 5 to 9 Years (1,298 | 7.3%) for men and 55 to 59 Years (1,608 | 8.4%) for women.

| Age Bracket | Male | Female |
| Under 5 Years | 1,055 (6.0%) | 1,161 (6.1%) |
| 5 to 9 Years | 1,298 (7.3%) | 1,044 (5.4%) |
| 10 to 14 Years | 1,286 (7.3%) | 1,348 (7.0%) |
| 15 to 19 Years | 1,195 (6.8%) | 1,104 (5.8%) |
| 20 to 24 Years | 1,177 (6.7%) | 1,131 (5.9%) |
| 25 to 29 Years | 1,017 (5.8%) | 1,247 (6.5%) |
| 30 to 34 Years | 1,058 (6.0%) | 1,030 (5.4%) |
| 35 to 39 Years | 827 (4.7%) | 1,142 (6.0%) |
| 40 to 44 Years | 1,149 (6.5%) | 1,233 (6.4%) |
| 45 to 49 Years | 1,208 (6.8%) | 1,297 (6.8%) |
| 50 to 54 Years | 1,180 (6.7%) | 1,121 (5.9%) |
| 55 to 59 Years | 1,262 (7.1%) | 1,608 (8.4%) |
| 60 to 64 Years | 1,145 (6.5%) | 1,019 (5.3%) |
| 65 to 69 Years | 943 (5.3%) | 1,172 (6.1%) |
| 70 to 74 Years | 799 (4.5%) | 957 (5.0%) |
| 75 to 79 Years | 508 (2.9%) | 783 (4.1%) |
| 80 to 84 Years | 362 (2.1%) | 407 (2.1%) |
| 85 Years and over | 210 (1.2%) | 335 (1.8%) |
| Total | 17,679 (100.0%) | 19,139 (100.0%) |
Families and Households in Dyer County
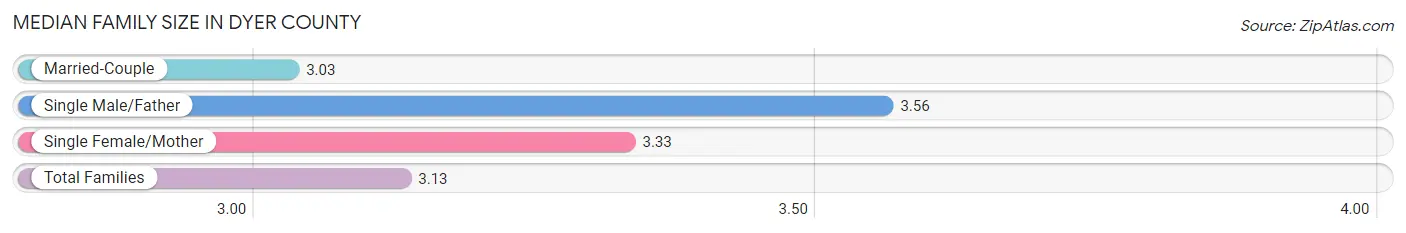
Median Family Size in Dyer County
The median family size in Dyer County is 3.13 persons per family, with single male/father families (631 | 6.8%) accounting for the largest median family size of 3.56 persons per family. On the other hand, married-couple families (6,635 | 71.7%) represent the smallest median family size with 3.03 persons per family.
| Family Type | # Families | Family Size |
| Married-Couple | 6,635 (71.7%) | 3.03 |
| Single Male/Father | 631 (6.8%) | 3.56 |
| Single Female/Mother | 1,991 (21.5%) | 3.33 |
| Total Families | 9,257 (100.0%) | 3.13 |
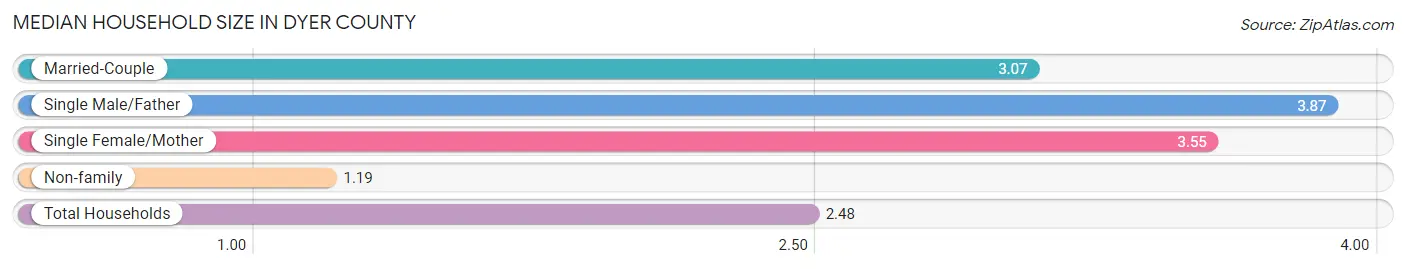
Median Household Size in Dyer County
The median household size in Dyer County is 2.48 persons per household, with single male/father households (631 | 4.3%) accounting for the largest median household size of 3.87 persons per household. non-family households (5,383 | 36.8%) represent the smallest median household size with 1.19 persons per household.
| Household Type | # Households | Household Size |
| Married-Couple | 6,635 (45.3%) | 3.07 |
| Single Male/Father | 631 (4.3%) | 3.87 |
| Single Female/Mother | 1,991 (13.6%) | 3.55 |
| Non-family | 5,383 (36.8%) | 1.19 |
| Total Households | 14,640 (100.0%) | 2.48 |
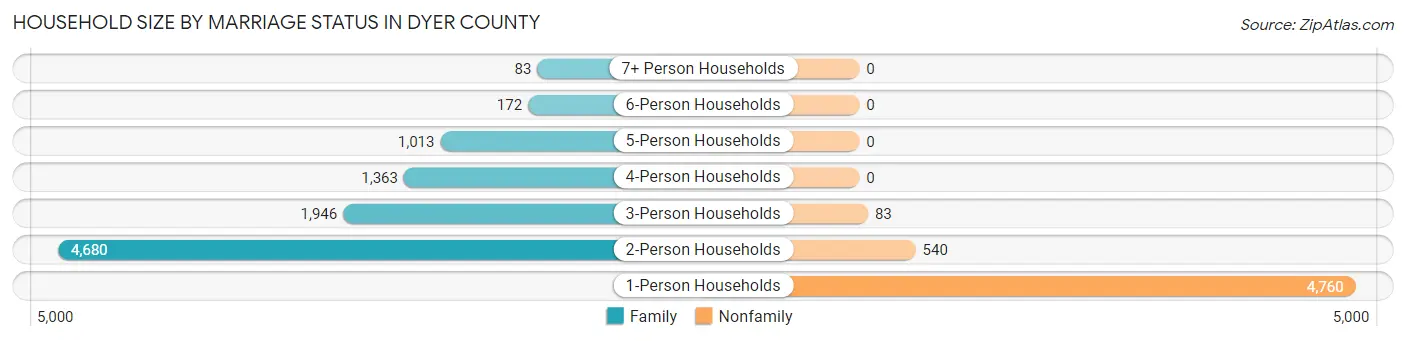
Household Size by Marriage Status in Dyer County
Out of a total of 14,640 households in Dyer County, 9,257 (63.2%) are family households, while 5,383 (36.8%) are nonfamily households. The most numerous type of family households are 2-person households, comprising 4,680, and the most common type of nonfamily households are 1-person households, comprising 4,760.
| Household Size | Family Households | Nonfamily Households |
| 1-Person Households | - | 4,760 (32.5%) |
| 2-Person Households | 4,680 (32.0%) | 540 (3.7%) |
| 3-Person Households | 1,946 (13.3%) | 83 (0.6%) |
| 4-Person Households | 1,363 (9.3%) | 0 (0.0%) |
| 5-Person Households | 1,013 (6.9%) | 0 (0.0%) |
| 6-Person Households | 172 (1.2%) | 0 (0.0%) |
| 7+ Person Households | 83 (0.6%) | 0 (0.0%) |
| Total | 9,257 (63.2%) | 5,383 (36.8%) |
Female Fertility in Dyer County
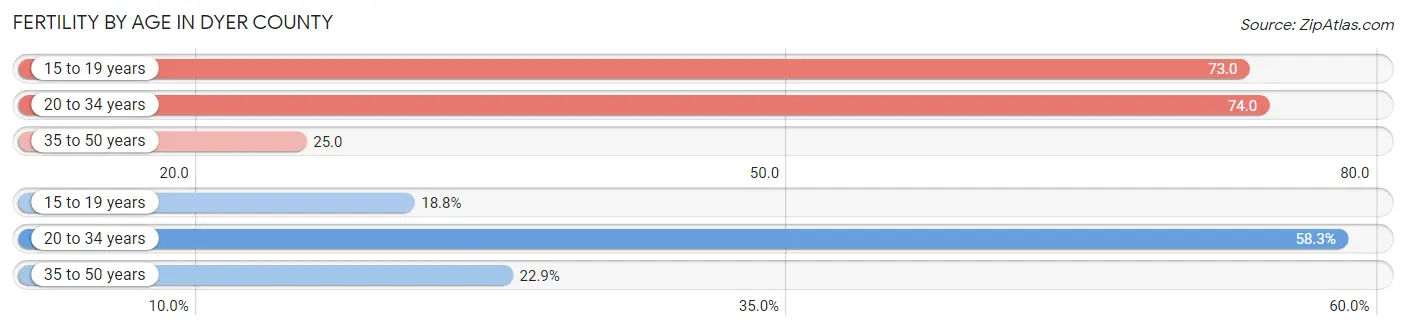
Fertility by Age in Dyer County
Average fertility rate in Dyer County is 51.0 births per 1,000 women. Women in the age bracket of 20 to 34 years have the highest fertility rate with 74.0 births per 1,000 women. Women in the age bracket of 20 to 34 years acount for 58.3% of all women with births.
| Age Bracket | Women with Births | Births / 1,000 Women |
| 15 to 19 years | 81 (18.8%) | 73.0 |
| 20 to 34 years | 252 (58.3%) | 74.0 |
| 35 to 50 years | 99 (22.9%) | 25.0 |
| Total | 432 (100.0%) | 51.0 |
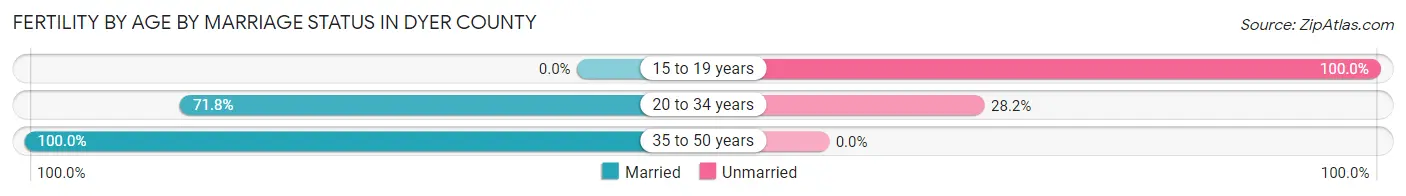
Fertility by Age by Marriage Status in Dyer County
64.8% of women with births (432) in Dyer County are married. The highest percentage of unmarried women with births falls into 15 to 19 years age bracket with 100.0% of them unmarried at the time of birth, while the lowest percentage of unmarried women with births belong to 35 to 50 years age bracket with 0.0% of them unmarried.
| Age Bracket | Married | Unmarried |
| 15 to 19 years | 0 (0.0%) | 81 (100.0%) |
| 20 to 34 years | 181 (71.8%) | 71 (28.2%) |
| 35 to 50 years | 99 (100.0%) | 0 (0.0%) |
| Total | 280 (64.8%) | 152 (35.2%) |
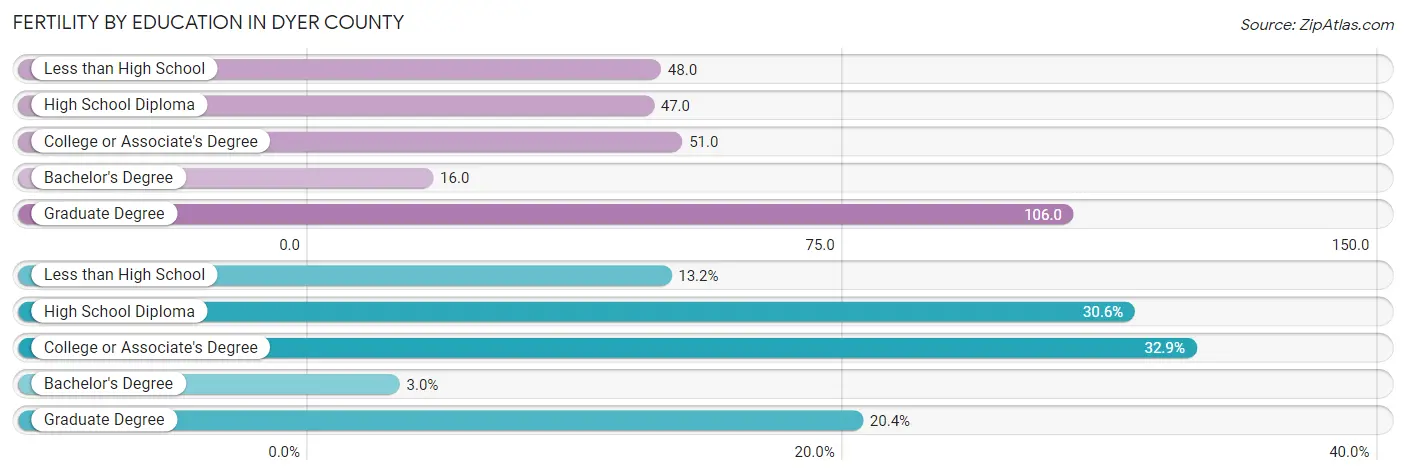
Fertility by Education in Dyer County
Average fertility rate in Dyer County is 51.0 births per 1,000 women. Women with the education attainment of graduate degree have the highest fertility rate of 106.0 births per 1,000 women, while women with the education attainment of bachelor's degree have the lowest fertility at 16.0 births per 1,000 women. Women with the education attainment of college or associate's degree represent 32.9% of all women with births.
| Educational Attainment | Women with Births | Births / 1,000 Women |
| Less than High School | 57 (13.2%) | 48.0 |
| High School Diploma | 132 (30.6%) | 47.0 |
| College or Associate's Degree | 142 (32.9%) | 51.0 |
| Bachelor's Degree | 13 (3.0%) | 16.0 |
| Graduate Degree | 88 (20.4%) | 106.0 |
| Total | 432 (100.0%) | 51.0 |
Fertility by Education by Marriage Status in Dyer County
35.2% of women with births in Dyer County are unmarried. Women with the educational attainment of bachelor's degree are most likely to be married with 100.0% of them married at childbirth, while women with the educational attainment of less than high school are least likely to be married with 100.0% of them unmarried at childbirth.
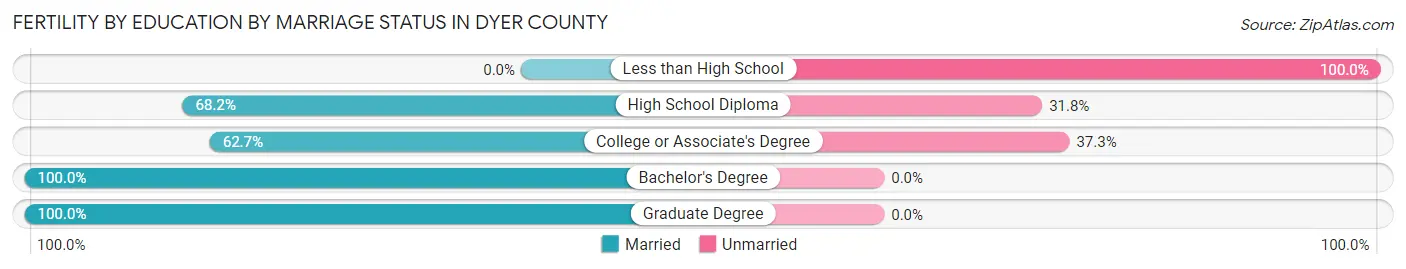
| Educational Attainment | Married | Unmarried |
| Less than High School | 0 (0.0%) | 57 (100.0%) |
| High School Diploma | 90 (68.2%) | 42 (31.8%) |
| College or Associate's Degree | 89 (62.7%) | 53 (37.3%) |
| Bachelor's Degree | 13 (100.0%) | 0 (0.0%) |
| Graduate Degree | 88 (100.0%) | 0 (0.0%) |
| Total | 280 (64.8%) | 152 (35.2%) |
Income in Dyer County
Income Overview in Dyer County
Per Capita Income in Dyer County is $37,415, while median incomes of families and households are $66,250 and $53,150 respectively.
| Characteristic | Number | Measure |
| Per Capita Income | 36,818 | $37,415 |
| Median Family Income | 9,257 | $66,250 |
| Mean Family Income | 9,257 | $120,448 |
| Median Household Income | 14,640 | $53,150 |
| Mean Household Income | 14,640 | $92,632 |
| Income Deficit | 9,257 | $10,729 |
| Wage / Income Gap (%) | 36,818 | 35.37% |
| Wage / Income Gap ($) | 36,818 | 64.63¢ per $1 |
| Gini / Inequality Index | 36,818 | 0.59 |
Earnings by Sex in Dyer County
Average Earnings in Dyer County are $36,852, $46,398 for men and $29,986 for women, a difference of 35.4%.
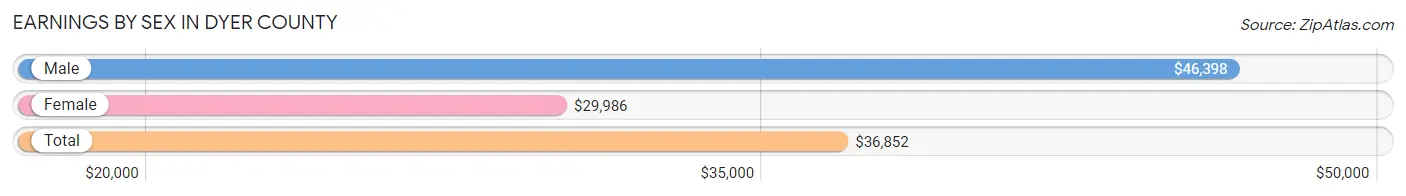
| Sex | Number | Average Earnings |
| Male | 9,291 (52.4%) | $46,398 |
| Female | 8,427 (47.6%) | $29,986 |
| Total | 17,718 (100.0%) | $36,852 |
Earnings by Sex by Income Bracket in Dyer County
The most common earnings brackets in Dyer County are $100,000+ for men (1,024 | 11.0%) and $55,000 to $64,999 for women (765 | 9.1%).
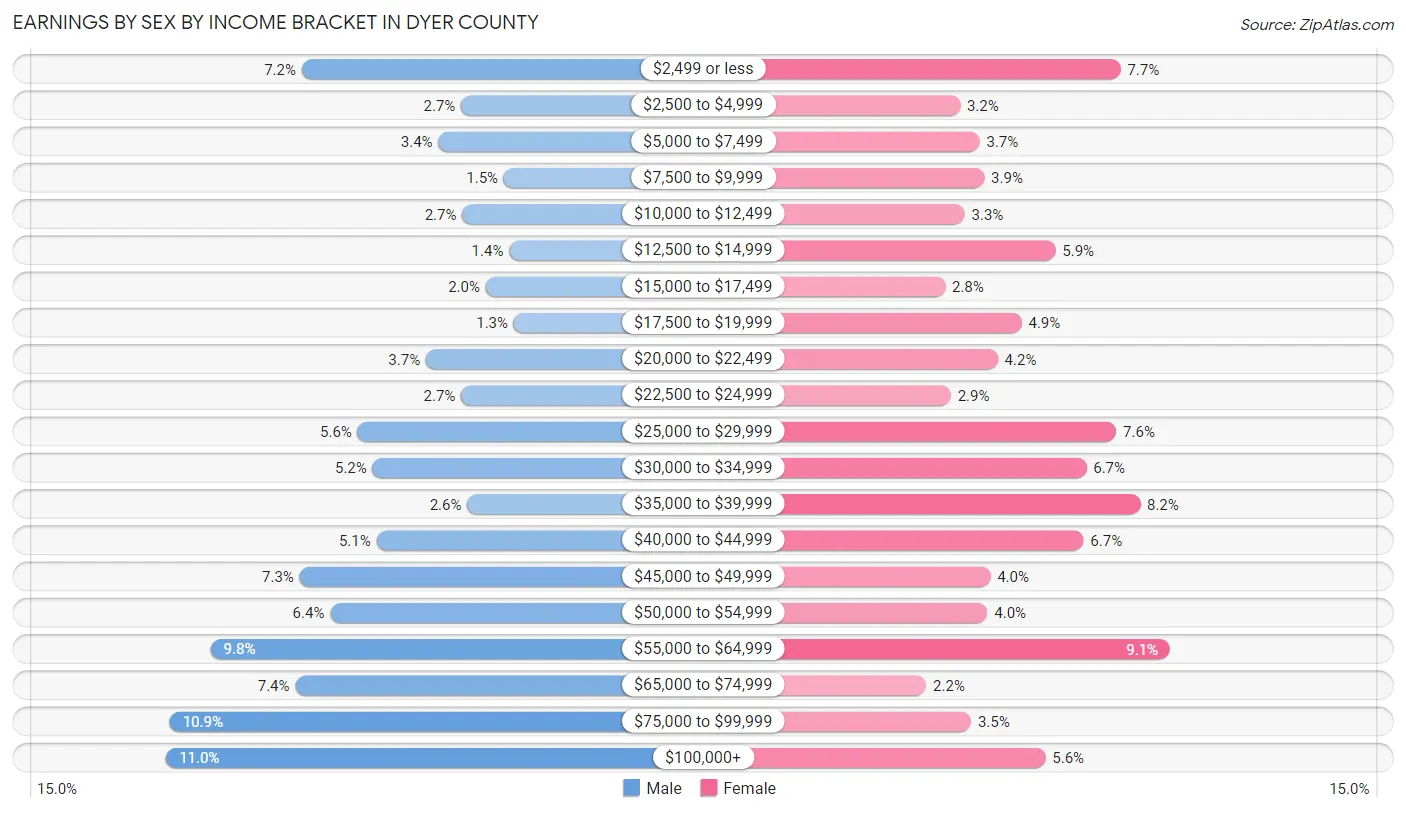
| Income | Male | Female |
| $2,499 or less | 670 (7.2%) | 648 (7.7%) |
| $2,500 to $4,999 | 254 (2.7%) | 268 (3.2%) |
| $5,000 to $7,499 | 313 (3.4%) | 314 (3.7%) |
| $7,500 to $9,999 | 142 (1.5%) | 325 (3.9%) |
| $10,000 to $12,499 | 251 (2.7%) | 279 (3.3%) |
| $12,500 to $14,999 | 128 (1.4%) | 494 (5.9%) |
| $15,000 to $17,499 | 190 (2.0%) | 233 (2.8%) |
| $17,500 to $19,999 | 116 (1.3%) | 414 (4.9%) |
| $20,000 to $22,499 | 346 (3.7%) | 357 (4.2%) |
| $22,500 to $24,999 | 254 (2.7%) | 246 (2.9%) |
| $25,000 to $29,999 | 524 (5.6%) | 638 (7.6%) |
| $30,000 to $34,999 | 485 (5.2%) | 567 (6.7%) |
| $35,000 to $39,999 | 238 (2.6%) | 694 (8.2%) |
| $40,000 to $44,999 | 475 (5.1%) | 560 (6.7%) |
| $45,000 to $49,999 | 675 (7.3%) | 340 (4.0%) |
| $50,000 to $54,999 | 596 (6.4%) | 333 (4.0%) |
| $55,000 to $64,999 | 908 (9.8%) | 765 (9.1%) |
| $65,000 to $74,999 | 687 (7.4%) | 188 (2.2%) |
| $75,000 to $99,999 | 1,015 (10.9%) | 294 (3.5%) |
| $100,000+ | 1,024 (11.0%) | 470 (5.6%) |
| Total | 9,291 (100.0%) | 8,427 (100.0%) |
Earnings by Sex by Educational Attainment in Dyer County
Average earnings in Dyer County are $52,085 for men and $35,623 for women, a difference of 31.6%. Men with an educational attainment of graduate degree enjoy the highest average annual earnings of $89,631, while those with less than high school education earn the least with $34,728. Women with an educational attainment of graduate degree earn the most with the average annual earnings of $57,230, while those with high school diploma education have the smallest earnings of $29,241.
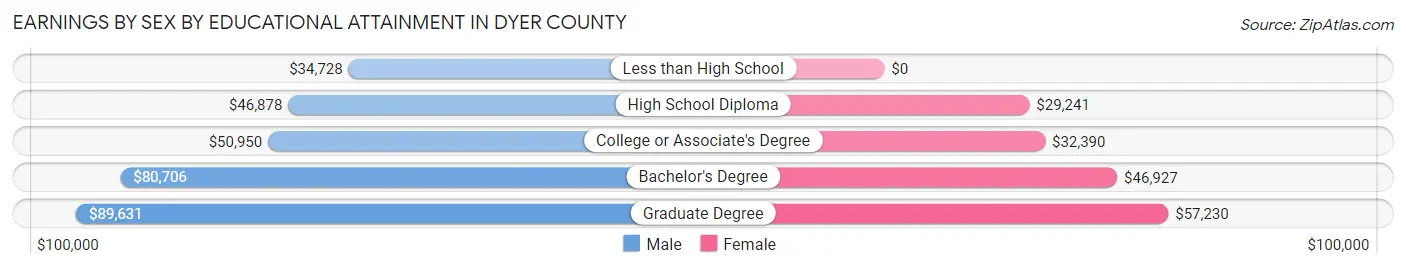
| Educational Attainment | Male Income | Female Income |
| Less than High School | $34,728 | $0 |
| High School Diploma | $46,878 | $29,241 |
| College or Associate's Degree | $50,950 | $32,390 |
| Bachelor's Degree | $80,706 | $46,927 |
| Graduate Degree | $89,631 | $57,230 |
| Total | $52,085 | $35,623 |
Family Income in Dyer County
Family Income Brackets in Dyer County
According to the Dyer County family income data, there are 2,240 families falling into the $50,000 to $74,999 income range, which is the most common income bracket and makes up 24.2% of all families. Conversely, the $10,000 to $14,999 income bracket is the least frequent group with only 167 families (1.8%) belonging to this category.
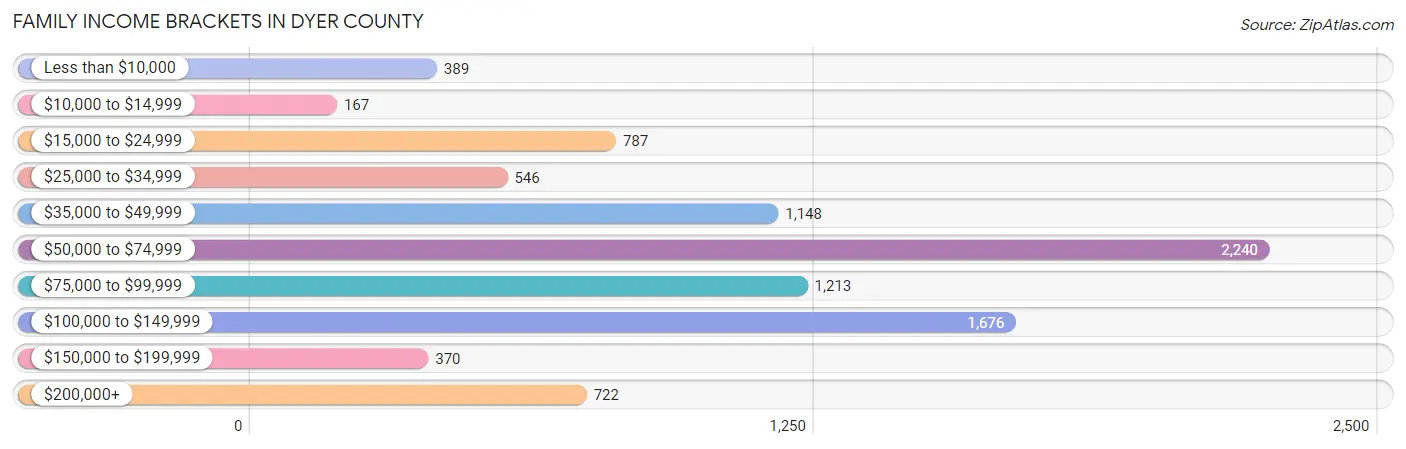
| Income Bracket | # Families | % Families |
| Less than $10,000 | 389 | 4.2% |
| $10,000 to $14,999 | 167 | 1.8% |
| $15,000 to $24,999 | 787 | 8.5% |
| $25,000 to $34,999 | 546 | 5.9% |
| $35,000 to $49,999 | 1,148 | 12.4% |
| $50,000 to $74,999 | 2,240 | 24.2% |
| $75,000 to $99,999 | 1,213 | 13.1% |
| $100,000 to $149,999 | 1,676 | 18.1% |
| $150,000 to $199,999 | 370 | 4.0% |
| $200,000+ | 722 | 7.8% |
Family Income by Famaliy Size in Dyer County
6-person families (147 | 1.6%) account for the highest median family income in Dyer County with $98,350 per family, while 2-person families (4,909 | 53.0%) have the highest median income of $29,862 per family member.
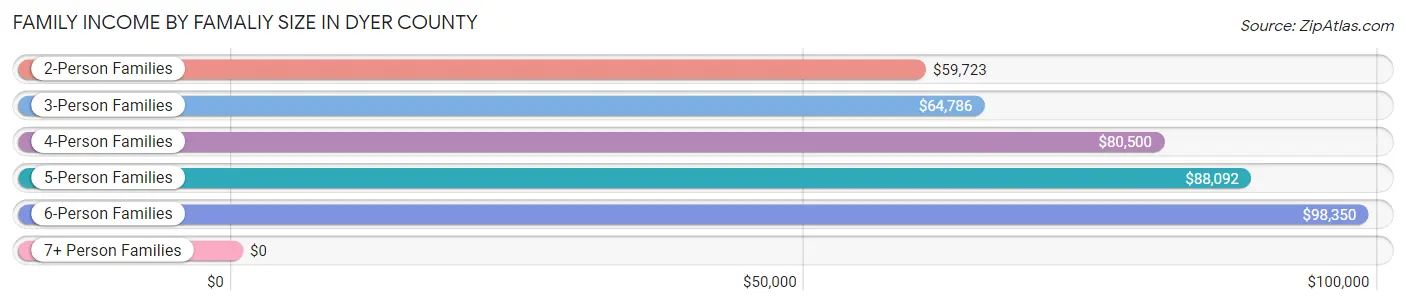
| Income Bracket | # Families | Median Income |
| 2-Person Families | 4,909 (53.0%) | $59,723 |
| 3-Person Families | 1,814 (19.6%) | $64,786 |
| 4-Person Families | 1,418 (15.3%) | $80,500 |
| 5-Person Families | 899 (9.7%) | $88,092 |
| 6-Person Families | 147 (1.6%) | $98,350 |
| 7+ Person Families | 70 (0.8%) | $0 |
| Total | 9,257 (100.0%) | $66,250 |
Family Income by Number of Earners in Dyer County
The median family income in Dyer County is $66,250, with families comprising 3+ earners (745) having the highest median family income of $129,150, while families with no earners (1,635) have the lowest median family income of $31,696, accounting for 8.1% and 17.7% of families, respectively.
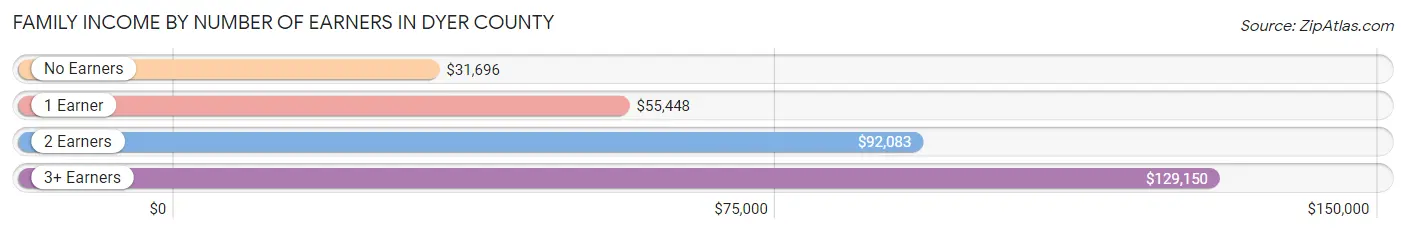
| Number of Earners | # Families | Median Income |
| No Earners | 1,635 (17.7%) | $31,696 |
| 1 Earner | 3,362 (36.3%) | $55,448 |
| 2 Earners | 3,515 (38.0%) | $92,083 |
| 3+ Earners | 745 (8.1%) | $129,150 |
| Total | 9,257 (100.0%) | $66,250 |
Household Income in Dyer County
Household Income Brackets in Dyer County
With 3,279 households falling in the category, the $50,000 to $74,999 income range is the most frequent in Dyer County, accounting for 22.4% of all households. In contrast, only 381 households (2.6%) fall into the $150,000 to $199,999 income bracket, making it the least populous group.
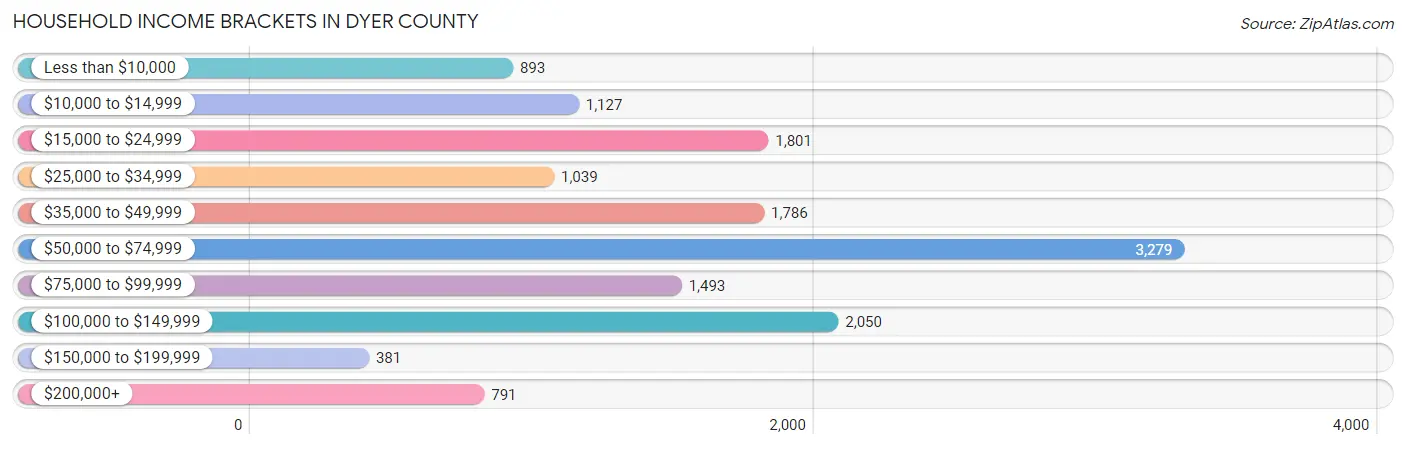
| Income Bracket | # Households | % Households |
| Less than $10,000 | 893 | 6.1% |
| $10,000 to $14,999 | 1,127 | 7.7% |
| $15,000 to $24,999 | 1,801 | 12.3% |
| $25,000 to $34,999 | 1,039 | 7.1% |
| $35,000 to $49,999 | 1,786 | 12.2% |
| $50,000 to $74,999 | 3,279 | 22.4% |
| $75,000 to $99,999 | 1,493 | 10.2% |
| $100,000 to $149,999 | 2,050 | 14.0% |
| $150,000 to $199,999 | 381 | 2.6% |
| $200,000+ | 791 | 5.4% |
Household Income by Householder Age in Dyer County
The median household income in Dyer County is $53,150, with the highest median household income of $58,864 found in the 45 to 64 years age bracket for the primary householder. A total of 5,572 households (38.1%) fall into this category. Meanwhile, the 65+ years age bracket for the primary householder has the lowest median household income of $42,512, with 4,066 households (27.8%) in this group.
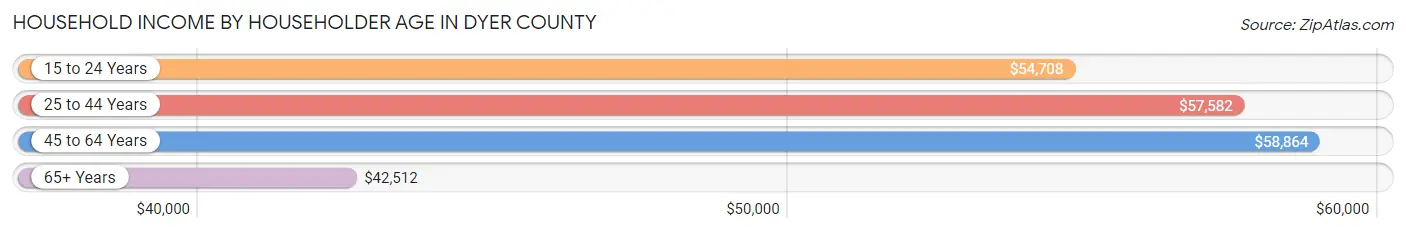
| Income Bracket | # Households | Median Income |
| 15 to 24 Years | 451 (3.1%) | $54,708 |
| 25 to 44 Years | 4,551 (31.1%) | $57,582 |
| 45 to 64 Years | 5,572 (38.1%) | $58,864 |
| 65+ Years | 4,066 (27.8%) | $42,512 |
| Total | 14,640 (100.0%) | $53,150 |
Poverty in Dyer County
Income Below Poverty by Sex and Age in Dyer County
With 14.8% poverty level for males and 17.7% for females among the residents of Dyer County, 75 year old and over males and 45 to 54 year old females are the most vulnerable to poverty, with 239 males (23.8%) and 580 females (24.1%) in their respective age groups living below the poverty level.

| Age Bracket | Male | Female |
| Under 5 Years | 161 (15.8%) | 137 (12.1%) |
| 5 Years | 45 (17.3%) | 48 (19.8%) |
| 6 to 11 Years | 323 (19.7%) | 235 (17.1%) |
| 12 to 14 Years | 63 (9.4%) | 109 (14.4%) |
| 15 Years | 31 (9.3%) | 25 (6.9%) |
| 16 and 17 Years | 64 (16.3%) | 83 (19.7%) |
| 18 to 24 Years | 302 (18.6%) | 239 (16.5%) |
| 25 to 34 Years | 365 (18.0%) | 484 (21.5%) |
| 35 to 44 Years | 235 (12.3%) | 439 (18.6%) |
| 45 to 54 Years | 202 (8.6%) | 580 (24.1%) |
| 55 to 64 Years | 406 (17.2%) | 606 (23.2%) |
| 65 to 74 Years | 130 (7.6%) | 175 (8.3%) |
| 75 Years and over | 239 (23.8%) | 190 (13.1%) |
| Total | 2,566 (14.8%) | 3,350 (17.7%) |
Income Above Poverty by Sex and Age in Dyer County
According to the poverty statistics in Dyer County, males aged 65 to 74 years and females aged 15 years are the age groups that are most secure financially, with 92.3% of males and 93.1% of females in these age groups living above the poverty line.
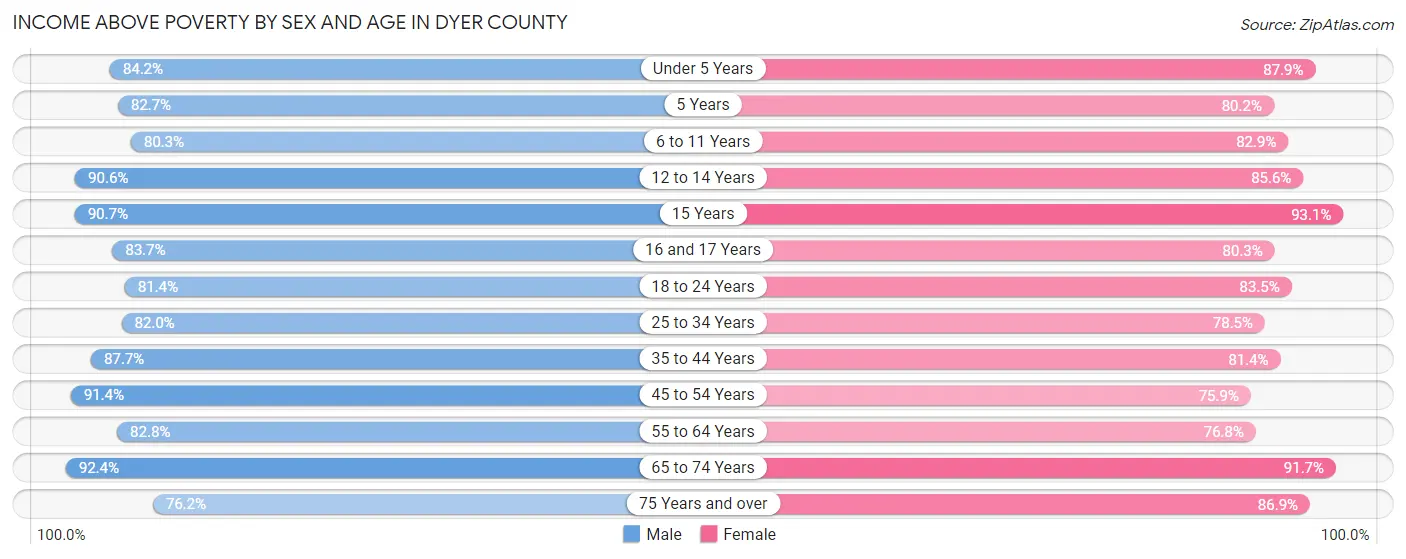
| Age Bracket | Male | Female |
| Under 5 Years | 856 (84.2%) | 993 (87.9%) |
| 5 Years | 215 (82.7%) | 194 (80.2%) |
| 6 to 11 Years | 1,315 (80.3%) | 1,136 (82.9%) |
| 12 to 14 Years | 608 (90.6%) | 650 (85.6%) |
| 15 Years | 302 (90.7%) | 336 (93.1%) |
| 16 and 17 Years | 329 (83.7%) | 339 (80.3%) |
| 18 to 24 Years | 1,322 (81.4%) | 1,208 (83.5%) |
| 25 to 34 Years | 1,665 (82.0%) | 1,769 (78.5%) |
| 35 to 44 Years | 1,672 (87.7%) | 1,923 (81.4%) |
| 45 to 54 Years | 2,151 (91.4%) | 1,827 (75.9%) |
| 55 to 64 Years | 1,956 (82.8%) | 2,011 (76.8%) |
| 65 to 74 Years | 1,569 (92.3%) | 1,934 (91.7%) |
| 75 Years and over | 765 (76.2%) | 1,258 (86.9%) |
| Total | 14,725 (85.2%) | 15,578 (82.3%) |
Income Below Poverty Among Married-Couple Families in Dyer County
The poverty statistics for married-couple families in Dyer County show that 6.2% or 410 of the total 6,635 families live below the poverty line. Families with no children have the highest poverty rate of 6.9%, comprising of 267 families. On the other hand, families with 5 or more children have the lowest poverty rate of 0.0%, which includes 0 families.
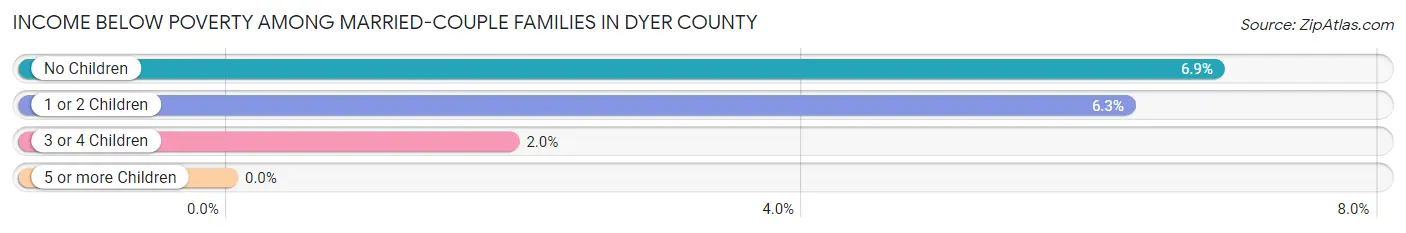
| Children | Above Poverty | Below Poverty |
| No Children | 3,617 (93.1%) | 267 (6.9%) |
| 1 or 2 Children | 1,950 (93.8%) | 130 (6.2%) |
| 3 or 4 Children | 650 (98.0%) | 13 (2.0%) |
| 5 or more Children | 8 (100.0%) | 0 (0.0%) |
| Total | 6,225 (93.8%) | 410 (6.2%) |
Income Below Poverty Among Single-Parent Households in Dyer County
According to the poverty data in Dyer County, 9.0% or 57 single-father households and 24.6% or 489 single-mother households are living below the poverty line. Among single-father households, those with no children have the highest poverty rate, with 23 households (10.4%) experiencing poverty. Likewise, among single-mother households, those with 5 or more children have the highest poverty rate, with 32 households (69.6%) falling below the poverty line.
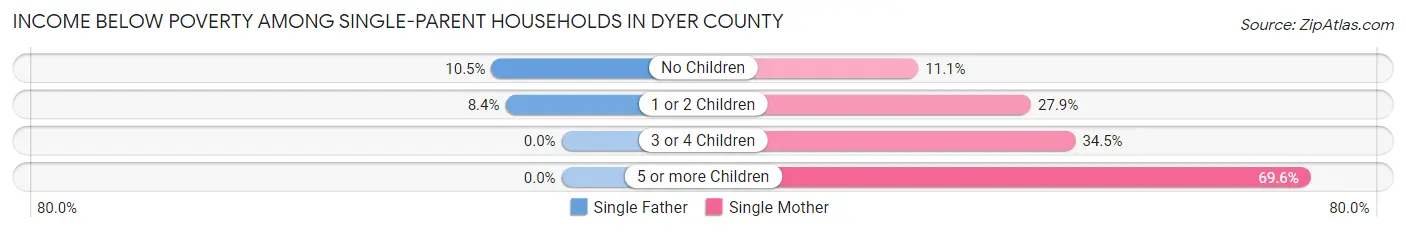
| Children | Single Father | Single Mother |
| No Children | 23 (10.4%) | 68 (11.1%) |
| 1 or 2 Children | 34 (8.4%) | 303 (27.9%) |
| 3 or 4 Children | 0 (0.0%) | 86 (34.5%) |
| 5 or more Children | 0 (0.0%) | 32 (69.6%) |
| Total | 57 (9.0%) | 489 (24.6%) |
Income Below Poverty Among Married-Couple vs Single-Parent Households in Dyer County
The poverty data for Dyer County shows that 410 of the married-couple family households (6.2%) and 546 of the single-parent households (20.8%) are living below the poverty level. Within the married-couple family households, those with no children have the highest poverty rate, with 267 households (6.9%) falling below the poverty line. Among the single-parent households, those with 5 or more children have the highest poverty rate, with 32 household (69.6%) living below poverty.
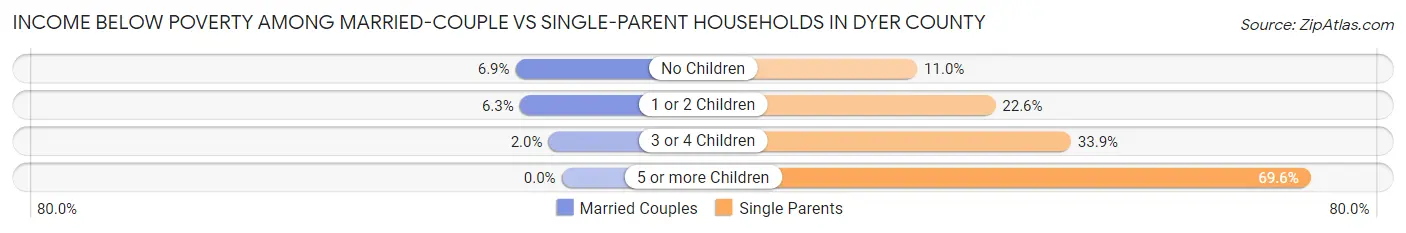
| Children | Married-Couple Families | Single-Parent Households |
| No Children | 267 (6.9%) | 91 (11.0%) |
| 1 or 2 Children | 130 (6.2%) | 337 (22.6%) |
| 3 or 4 Children | 13 (2.0%) | 86 (33.9%) |
| 5 or more Children | 0 (0.0%) | 32 (69.6%) |
| Total | 410 (6.2%) | 546 (20.8%) |
Employment Characteristics in Dyer County
Employment by Class of Employer in Dyer County
Among the 15,817 employed individuals in Dyer County, private company employees (11,016 | 69.7%), self-employed (not incorporated) (1,094 | 6.9%), and local government employees (1,054 | 6.7%) make up the most common classes of employment.
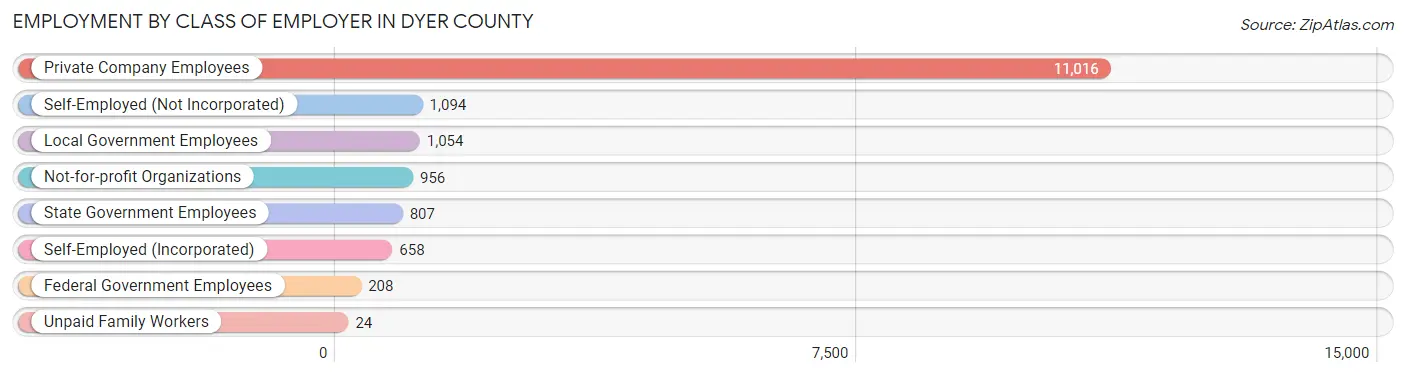
| Employer Class | # Employees | % Employees |
| Private Company Employees | 11,016 | 69.7% |
| Self-Employed (Incorporated) | 658 | 4.2% |
| Self-Employed (Not Incorporated) | 1,094 | 6.9% |
| Not-for-profit Organizations | 956 | 6.0% |
| Local Government Employees | 1,054 | 6.7% |
| State Government Employees | 807 | 5.1% |
| Federal Government Employees | 208 | 1.3% |
| Unpaid Family Workers | 24 | 0.2% |
| Total | 15,817 | 100.0% |
Employment Status by Age in Dyer County
According to the labor force statistics for Dyer County, out of the total population over 16 years of age (28,929), 57.9% or 16,750 individuals are in the labor force, with 4.5% or 754 of them unemployed. The age group with the highest labor force participation rate is 20 to 24 years, with 80.6% or 1,860 individuals in the labor force. Within the labor force, the 16 to 19 years age range has the highest percentage of unemployed individuals, with 19.0% or 153 of them being unemployed.
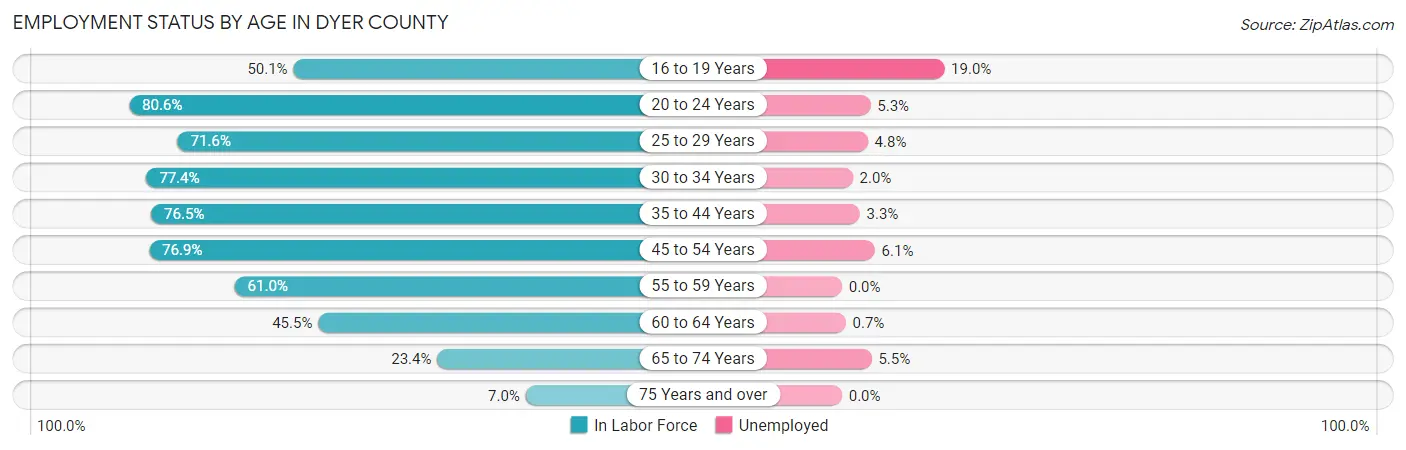
| Age Bracket | In Labor Force | Unemployed |
| 16 to 19 Years | 803 (50.1%) | 153 (19.0%) |
| 20 to 24 Years | 1,860 (80.6%) | 99 (5.3%) |
| 25 to 29 Years | 1,621 (71.6%) | 78 (4.8%) |
| 30 to 34 Years | 1,616 (77.4%) | 32 (2.0%) |
| 35 to 44 Years | 3,329 (76.5%) | 110 (3.3%) |
| 45 to 54 Years | 3,696 (76.9%) | 225 (6.1%) |
| 55 to 59 Years | 1,751 (61.0%) | 0 (0.0%) |
| 60 to 64 Years | 985 (45.5%) | 7 (0.7%) |
| 65 to 74 Years | 906 (23.4%) | 50 (5.5%) |
| 75 Years and over | 182 (7.0%) | 0 (0.0%) |
| Total | 16,750 (57.9%) | 754 (4.5%) |
Employment Status by Educational Attainment in Dyer County
According to labor force statistics for Dyer County, 70.1% of individuals (12,999) out of the total population between 25 and 64 years of age (18,543) are in the labor force, with 3.5% or 455 of them being unemployed. The group with the highest labor force participation rate are those with the educational attainment of bachelor's degree or higher, with 85.4% or 3,489 individuals in the labor force. Within the labor force, individuals with less than high school education have the highest percentage of unemployment, with 13.0% or 90 of them being unemployed.
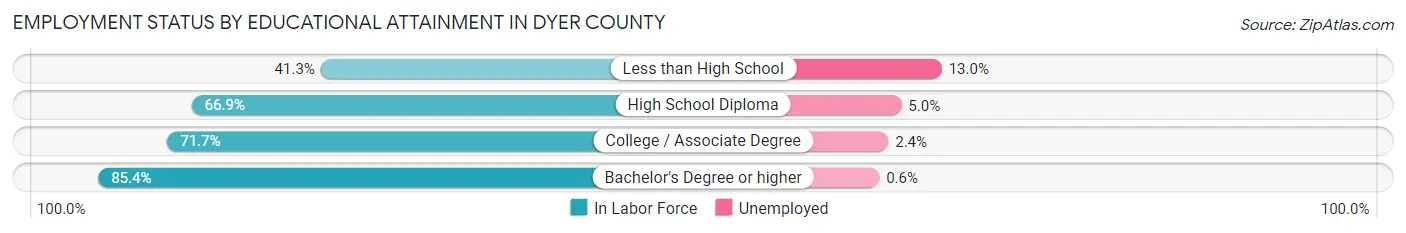
| Educational Attainment | In Labor Force | Unemployed |
| Less than High School | 691 (41.3%) | 217 (13.0%) |
| High School Diploma | 4,906 (66.9%) | 367 (5.0%) |
| College / Associate Degree | 3,909 (71.7%) | 131 (2.4%) |
| Bachelor's Degree or higher | 3,489 (85.4%) | 25 (0.6%) |
| Total | 12,999 (70.1%) | 649 (3.5%) |
Employment Occupations by Sex in Dyer County
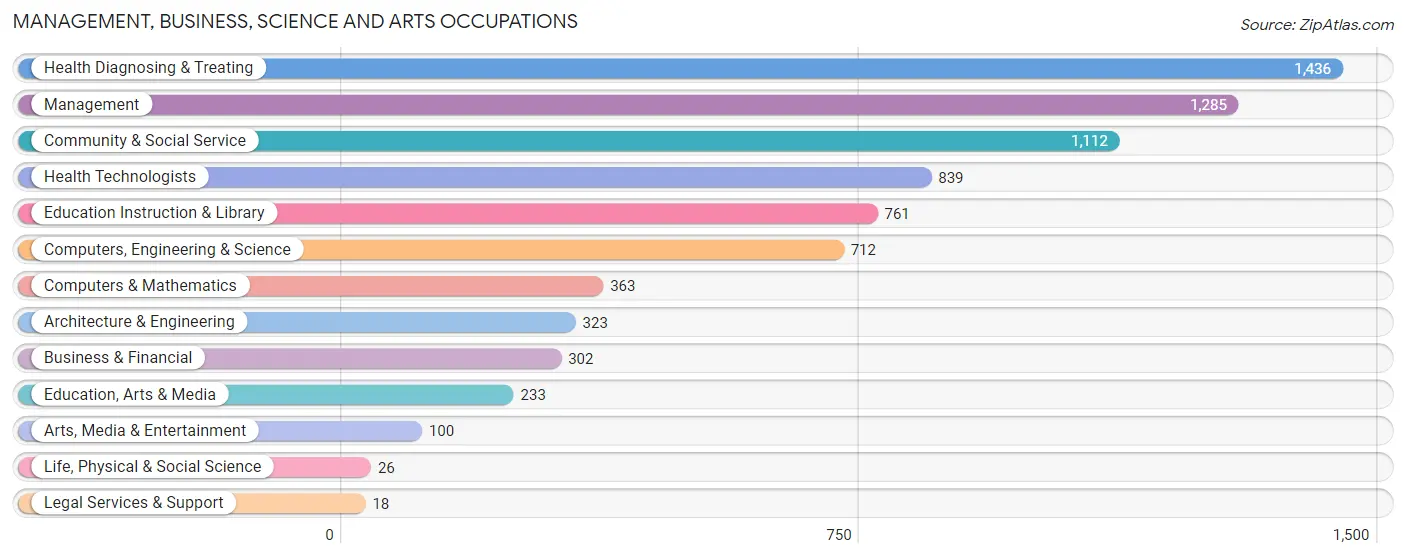
Management, Business, Science and Arts Occupations
The most common Management, Business, Science and Arts occupations in Dyer County are Health Diagnosing & Treating (1,436 | 9.0%), Management (1,285 | 8.1%), Community & Social Service (1,112 | 7.0%), Health Technologists (839 | 5.2%), and Education Instruction & Library (761 | 4.8%).
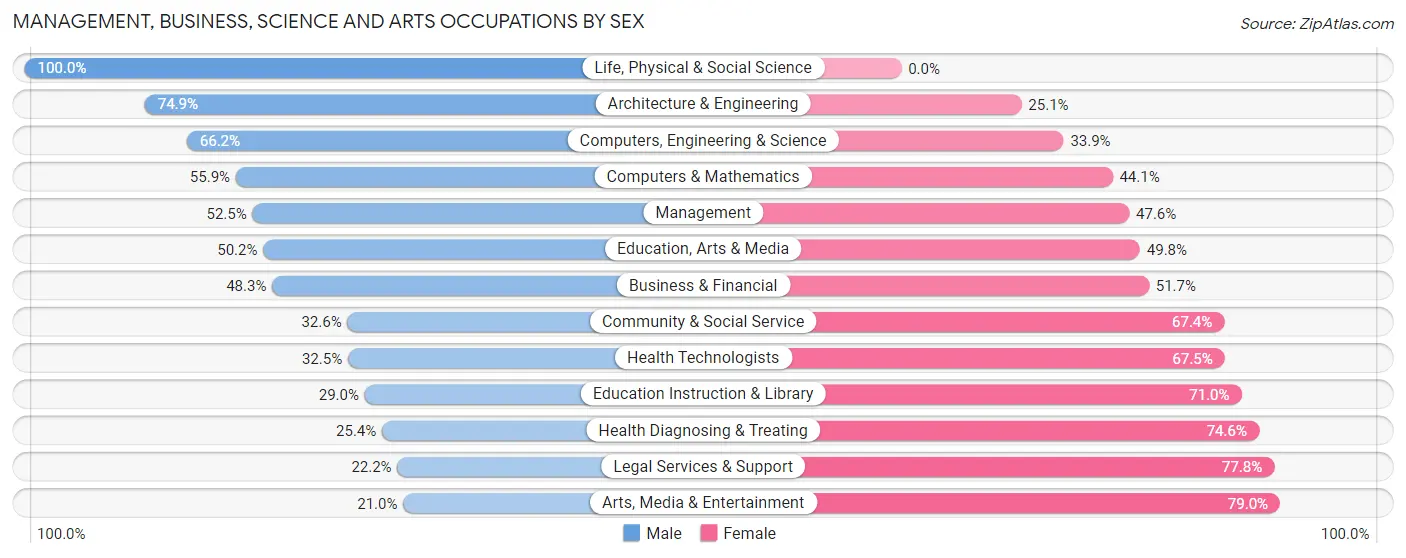
Management, Business, Science and Arts Occupations by Sex
Within the Management, Business, Science and Arts occupations in Dyer County, the most male-oriented occupations are Life, Physical & Social Science (100.0%), Architecture & Engineering (74.9%), and Computers, Engineering & Science (66.1%), while the most female-oriented occupations are Arts, Media & Entertainment (79.0%), Legal Services & Support (77.8%), and Health Diagnosing & Treating (74.6%).
| Occupation | Male | Female |
| Management | 674 (52.4%) | 611 (47.5%) |
| Business & Financial | 146 (48.3%) | 156 (51.7%) |
| Computers, Engineering & Science | 471 (66.1%) | 241 (33.9%) |
| Computers & Mathematics | 203 (55.9%) | 160 (44.1%) |
| Architecture & Engineering | 242 (74.9%) | 81 (25.1%) |
| Life, Physical & Social Science | 26 (100.0%) | 0 (0.0%) |
| Community & Social Service | 363 (32.6%) | 749 (67.4%) |
| Education, Arts & Media | 117 (50.2%) | 116 (49.8%) |
| Legal Services & Support | 4 (22.2%) | 14 (77.8%) |
| Education Instruction & Library | 221 (29.0%) | 540 (71.0%) |
| Arts, Media & Entertainment | 21 (21.0%) | 79 (79.0%) |
| Health Diagnosing & Treating | 365 (25.4%) | 1,071 (74.6%) |
| Health Technologists | 273 (32.5%) | 566 (67.5%) |
| Total (Category) | 2,019 (41.6%) | 2,828 (58.4%) |
| Total (Overall) | 8,264 (51.8%) | 7,703 (48.2%) |
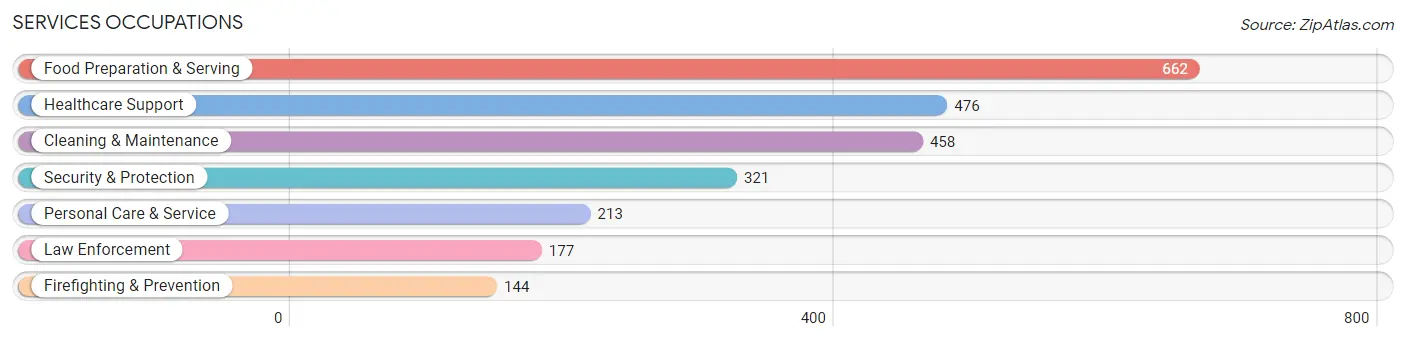
Services Occupations
The most common Services occupations in Dyer County are Food Preparation & Serving (662 | 4.2%), Healthcare Support (476 | 3.0%), Cleaning & Maintenance (458 | 2.9%), Security & Protection (321 | 2.0%), and Personal Care & Service (213 | 1.3%).
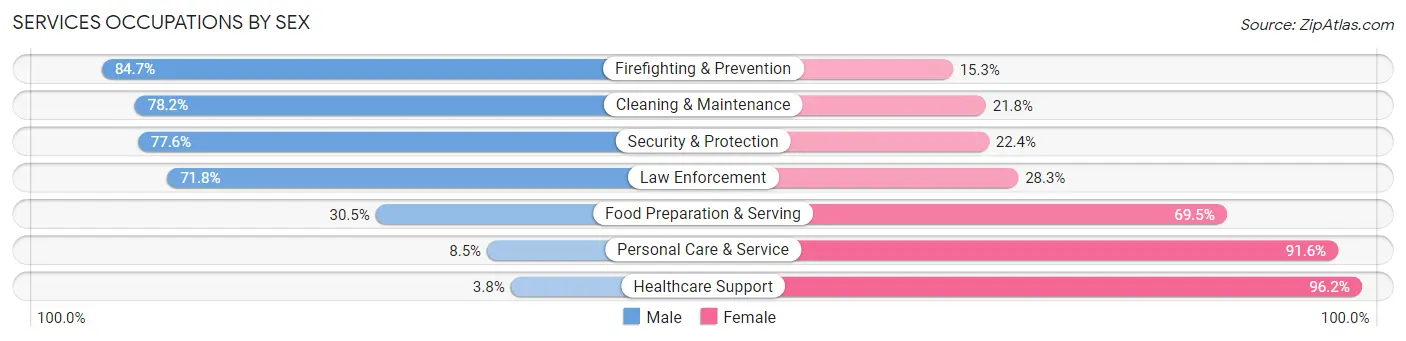
Services Occupations by Sex
Within the Services occupations in Dyer County, the most male-oriented occupations are Firefighting & Prevention (84.7%), Cleaning & Maintenance (78.2%), and Security & Protection (77.6%), while the most female-oriented occupations are Healthcare Support (96.2%), Personal Care & Service (91.5%), and Food Preparation & Serving (69.5%).
| Occupation | Male | Female |
| Healthcare Support | 18 (3.8%) | 458 (96.2%) |
| Security & Protection | 249 (77.6%) | 72 (22.4%) |
| Firefighting & Prevention | 122 (84.7%) | 22 (15.3%) |
| Law Enforcement | 127 (71.8%) | 50 (28.2%) |
| Food Preparation & Serving | 202 (30.5%) | 460 (69.5%) |
| Cleaning & Maintenance | 358 (78.2%) | 100 (21.8%) |
| Personal Care & Service | 18 (8.5%) | 195 (91.5%) |
| Total (Category) | 845 (39.7%) | 1,285 (60.3%) |
| Total (Overall) | 8,264 (51.8%) | 7,703 (48.2%) |
Sales and Office Occupations
The most common Sales and Office occupations in Dyer County are Sales & Related (1,942 | 12.2%), and Office & Administration (1,654 | 10.4%).

Sales and Office Occupations by Sex
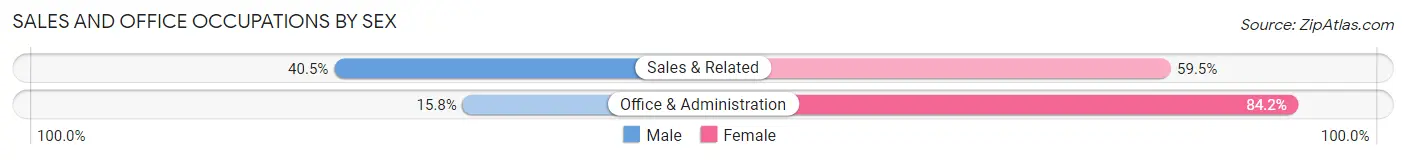
| Occupation | Male | Female |
| Sales & Related | 786 (40.5%) | 1,156 (59.5%) |
| Office & Administration | 261 (15.8%) | 1,393 (84.2%) |
| Total (Category) | 1,047 (29.1%) | 2,549 (70.9%) |
| Total (Overall) | 8,264 (51.8%) | 7,703 (48.2%) |
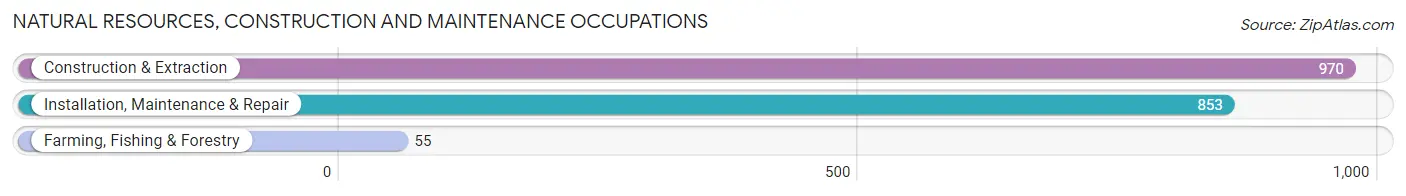
Natural Resources, Construction and Maintenance Occupations
The most common Natural Resources, Construction and Maintenance occupations in Dyer County are Construction & Extraction (970 | 6.1%), Installation, Maintenance & Repair (853 | 5.3%), and Farming, Fishing & Forestry (55 | 0.3%).
Natural Resources, Construction and Maintenance Occupations by Sex
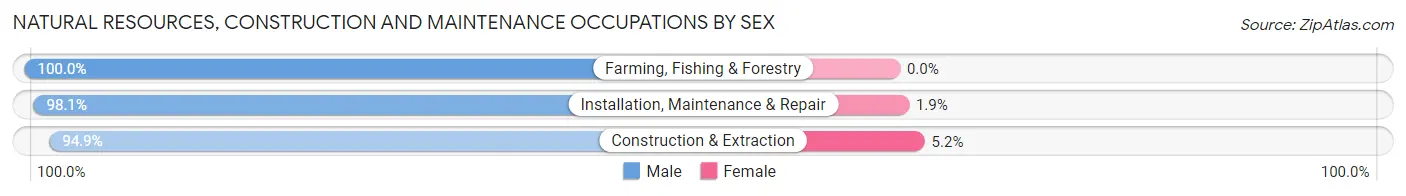
| Occupation | Male | Female |
| Farming, Fishing & Forestry | 55 (100.0%) | 0 (0.0%) |
| Construction & Extraction | 920 (94.9%) | 50 (5.1%) |
| Installation, Maintenance & Repair | 837 (98.1%) | 16 (1.9%) |
| Total (Category) | 1,812 (96.5%) | 66 (3.5%) |
| Total (Overall) | 8,264 (51.8%) | 7,703 (48.2%) |
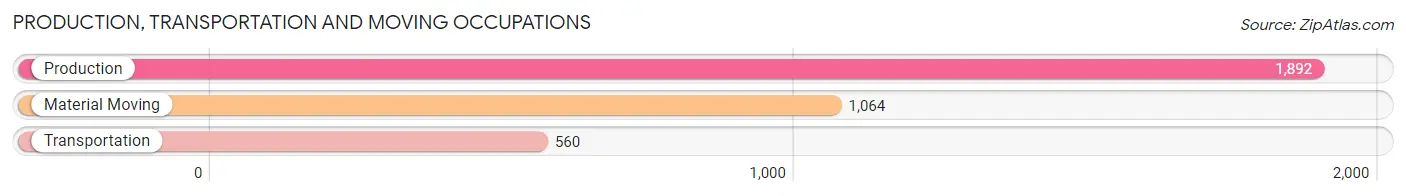
Production, Transportation and Moving Occupations
The most common Production, Transportation and Moving occupations in Dyer County are Production (1,892 | 11.8%), Material Moving (1,064 | 6.7%), and Transportation (560 | 3.5%).
Production, Transportation and Moving Occupations by Sex
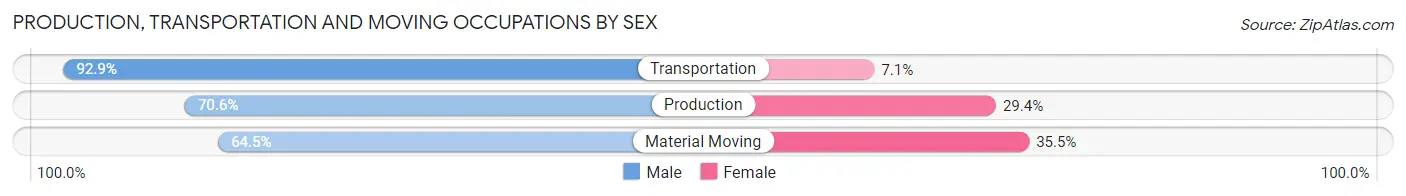
| Occupation | Male | Female |
| Production | 1,335 (70.6%) | 557 (29.4%) |
| Transportation | 520 (92.9%) | 40 (7.1%) |
| Material Moving | 686 (64.5%) | 378 (35.5%) |
| Total (Category) | 2,541 (72.3%) | 975 (27.7%) |
| Total (Overall) | 8,264 (51.8%) | 7,703 (48.2%) |
Employment Industries by Sex in Dyer County
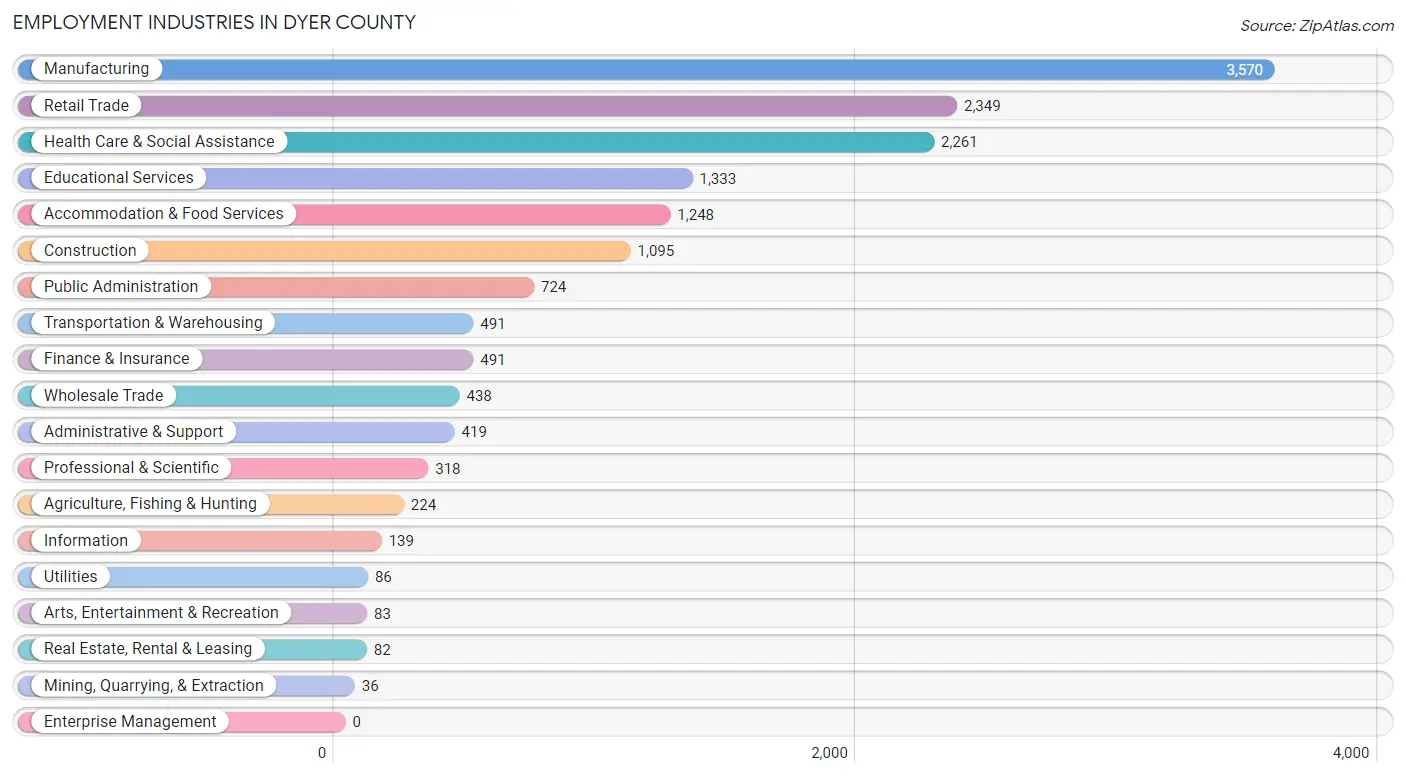
Employment Industries in Dyer County
The major employment industries in Dyer County include Manufacturing (3,570 | 22.4%), Retail Trade (2,349 | 14.7%), Health Care & Social Assistance (2,261 | 14.2%), Educational Services (1,333 | 8.4%), and Accommodation & Food Services (1,248 | 7.8%).
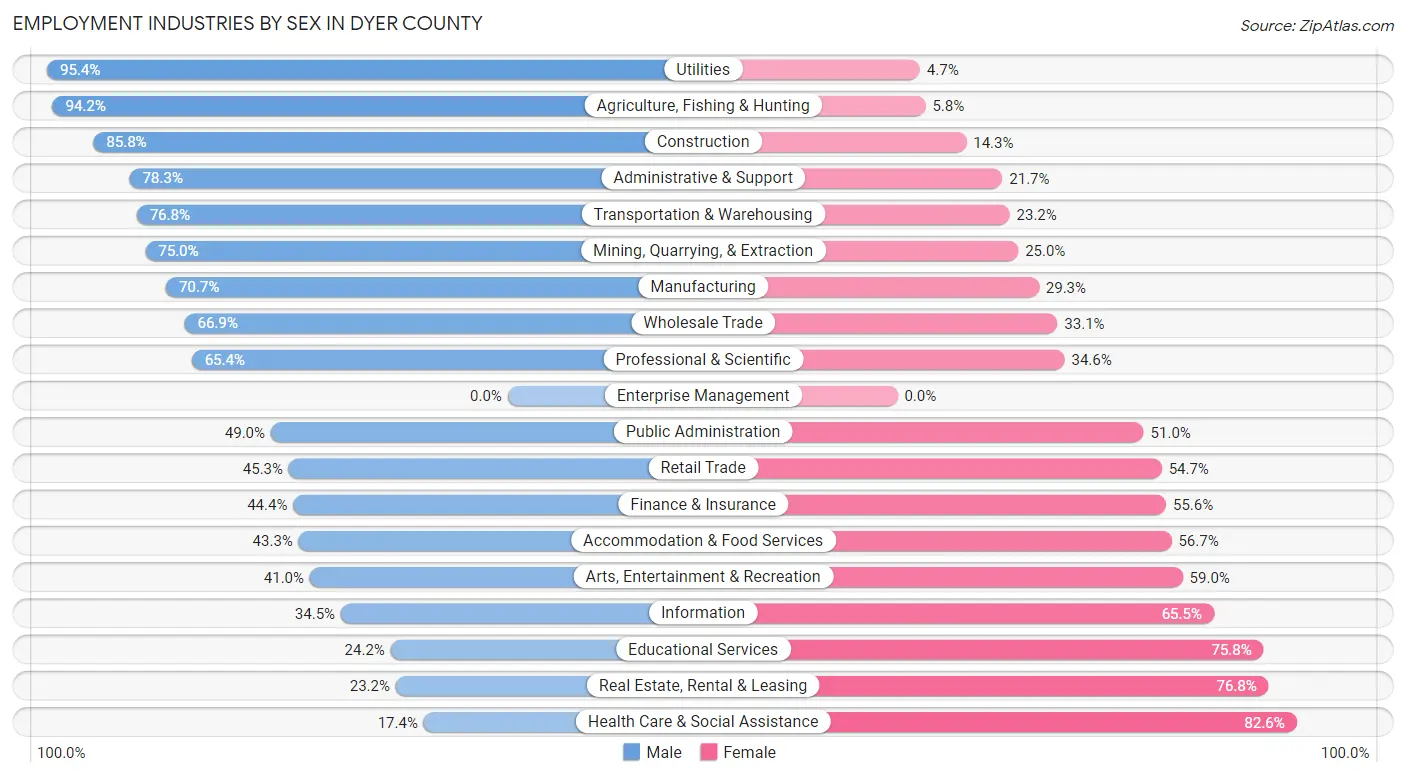
Employment Industries by Sex in Dyer County
The Dyer County industries that see more men than women are Utilities (95.4%), Agriculture, Fishing & Hunting (94.2%), and Construction (85.8%), whereas the industries that tend to have a higher number of women are Health Care & Social Assistance (82.6%), Real Estate, Rental & Leasing (76.8%), and Educational Services (75.8%).
| Industry | Male | Female |
| Agriculture, Fishing & Hunting | 211 (94.2%) | 13 (5.8%) |
| Mining, Quarrying, & Extraction | 27 (75.0%) | 9 (25.0%) |
| Construction | 939 (85.8%) | 156 (14.2%) |
| Manufacturing | 2,525 (70.7%) | 1,045 (29.3%) |
| Wholesale Trade | 293 (66.9%) | 145 (33.1%) |
| Retail Trade | 1,064 (45.3%) | 1,285 (54.7%) |
| Transportation & Warehousing | 377 (76.8%) | 114 (23.2%) |
| Utilities | 82 (95.4%) | 4 (4.6%) |
| Information | 48 (34.5%) | 91 (65.5%) |
| Finance & Insurance | 218 (44.4%) | 273 (55.6%) |
| Real Estate, Rental & Leasing | 19 (23.2%) | 63 (76.8%) |
| Professional & Scientific | 208 (65.4%) | 110 (34.6%) |
| Enterprise Management | 0 (0.0%) | 0 (0.0%) |
| Administrative & Support | 328 (78.3%) | 91 (21.7%) |
| Educational Services | 323 (24.2%) | 1,010 (75.8%) |
| Health Care & Social Assistance | 393 (17.4%) | 1,868 (82.6%) |
| Arts, Entertainment & Recreation | 34 (41.0%) | 49 (59.0%) |
| Accommodation & Food Services | 540 (43.3%) | 708 (56.7%) |
| Public Administration | 355 (49.0%) | 369 (51.0%) |
| Total | 8,264 (51.8%) | 7,703 (48.2%) |
Education in Dyer County
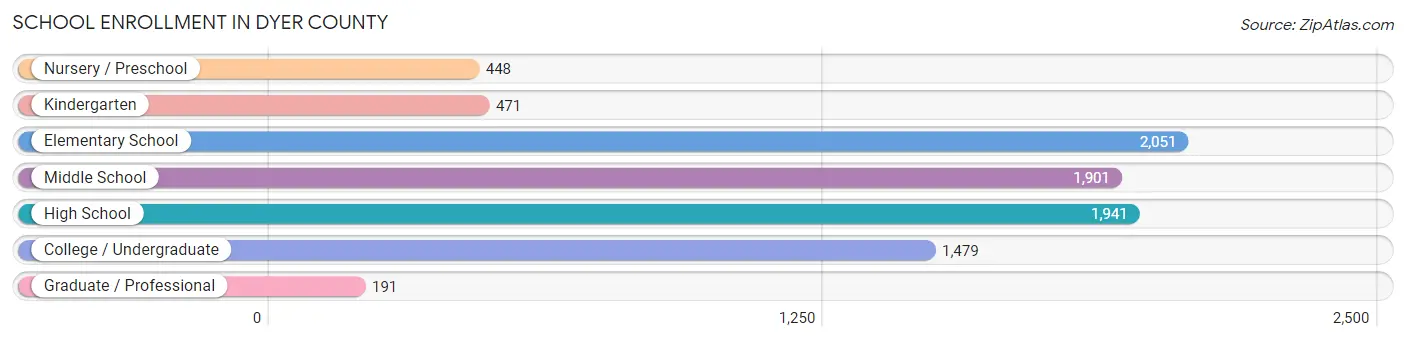
School Enrollment in Dyer County
The most common levels of schooling among the 8,482 students in Dyer County are elementary school (2,051 | 24.2%), high school (1,941 | 22.9%), and middle school (1,901 | 22.4%).
| School Level | # Students | % Students |
| Nursery / Preschool | 448 | 5.3% |
| Kindergarten | 471 | 5.6% |
| Elementary School | 2,051 | 24.2% |
| Middle School | 1,901 | 22.4% |
| High School | 1,941 | 22.9% |
| College / Undergraduate | 1,479 | 17.4% |
| Graduate / Professional | 191 | 2.2% |
| Total | 8,482 | 100.0% |
School Enrollment by Age by Funding Source in Dyer County
Out of a total of 8,482 students who are enrolled in schools in Dyer County, 1,289 (15.2%) attend a private institution, while the remaining 7,193 (84.8%) are enrolled in public schools. The age group of 3 to 4 year olds has the highest likelihood of being enrolled in private schools, with 138 (36.6% in the age bracket) enrolled. Conversely, the age group of 18 to 19 year olds has the lowest likelihood of being enrolled in a private school, with 467 (92.3% in the age bracket) attending a public institution.
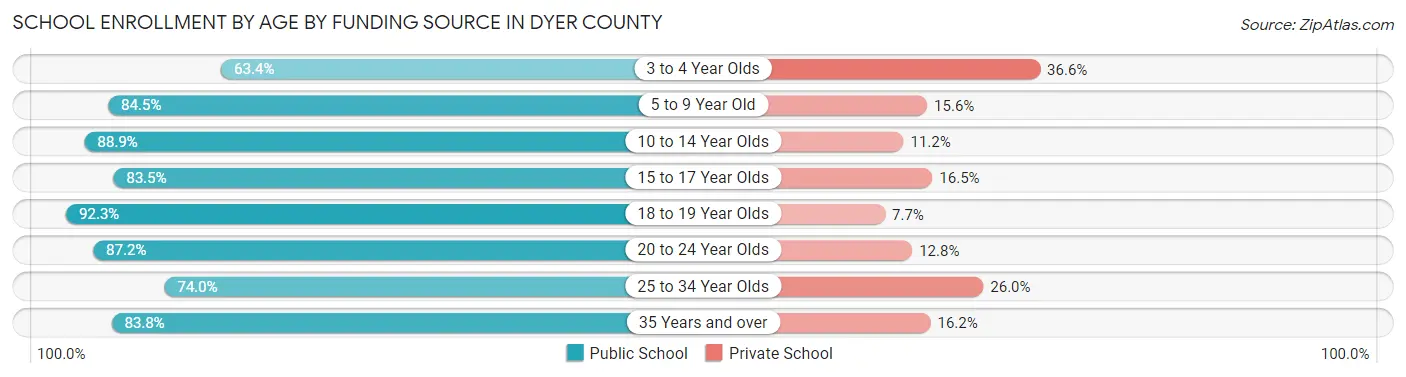
| Age Bracket | Public School | Private School |
| 3 to 4 Year Olds | 239 (63.4%) | 138 (36.6%) |
| 5 to 9 Year Old | 1,771 (84.5%) | 326 (15.5%) |
| 10 to 14 Year Olds | 2,311 (88.8%) | 290 (11.2%) |
| 15 to 17 Year Olds | 1,267 (83.5%) | 251 (16.5%) |
| 18 to 19 Year Olds | 467 (92.3%) | 39 (7.7%) |
| 20 to 24 Year Olds | 410 (87.2%) | 60 (12.8%) |
| 25 to 34 Year Olds | 273 (74.0%) | 96 (26.0%) |
| 35 Years and over | 456 (83.8%) | 88 (16.2%) |
| Total | 7,193 (84.8%) | 1,289 (15.2%) |
Educational Attainment by Field of Study in Dyer County
Business (1,832 | 31.0%), education (780 | 13.2%), science & technology (753 | 12.8%), bio, nature & agricultural (677 | 11.5%), and arts & humanities (282 | 4.8%) are the most common fields of study among 5,907 individuals in Dyer County who have obtained a bachelor's degree or higher.
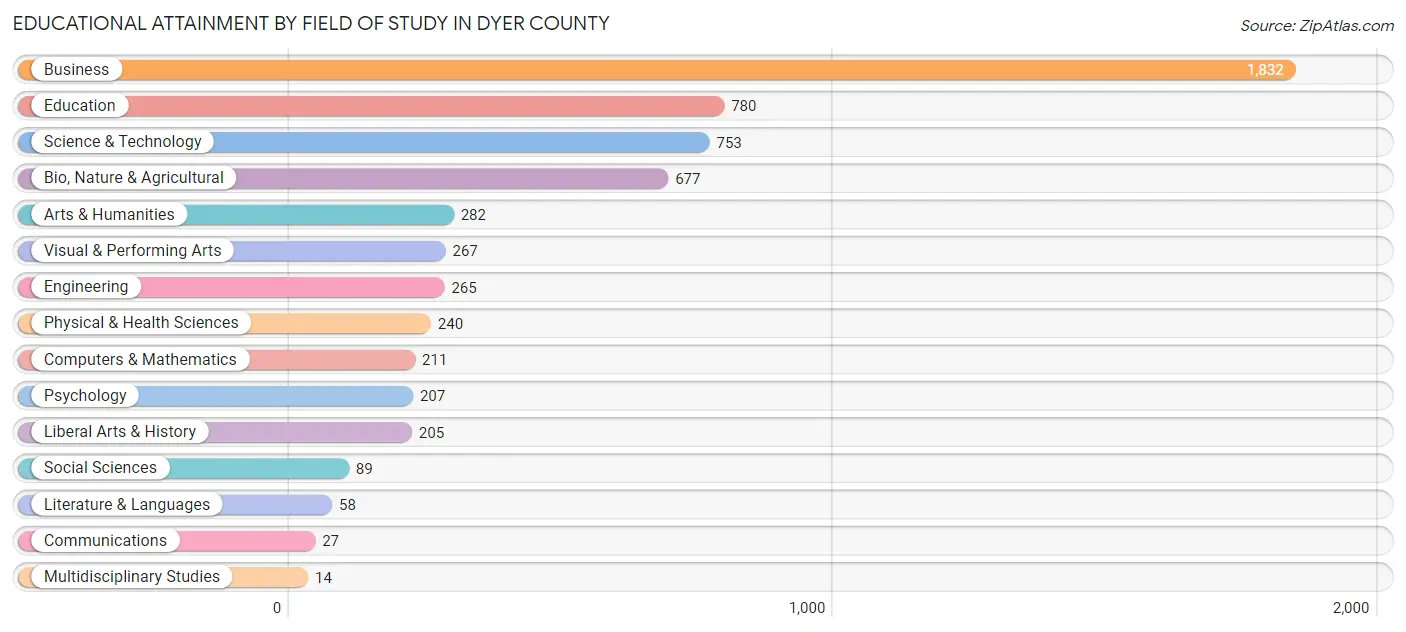
| Field of Study | # Graduates | % Graduates |
| Computers & Mathematics | 211 | 3.6% |
| Bio, Nature & Agricultural | 677 | 11.5% |
| Physical & Health Sciences | 240 | 4.1% |
| Psychology | 207 | 3.5% |
| Social Sciences | 89 | 1.5% |
| Engineering | 265 | 4.5% |
| Multidisciplinary Studies | 14 | 0.2% |
| Science & Technology | 753 | 12.8% |
| Business | 1,832 | 31.0% |
| Education | 780 | 13.2% |
| Literature & Languages | 58 | 1.0% |
| Liberal Arts & History | 205 | 3.5% |
| Visual & Performing Arts | 267 | 4.5% |
| Communications | 27 | 0.5% |
| Arts & Humanities | 282 | 4.8% |
| Total | 5,907 | 100.0% |
Transportation & Commute in Dyer County
Vehicle Availability by Sex in Dyer County
The most prevalent vehicle ownership categories in Dyer County are males with 2 vehicles (3,764, accounting for 45.7%) and females with 2 vehicles (3,485, making up 49.7%).
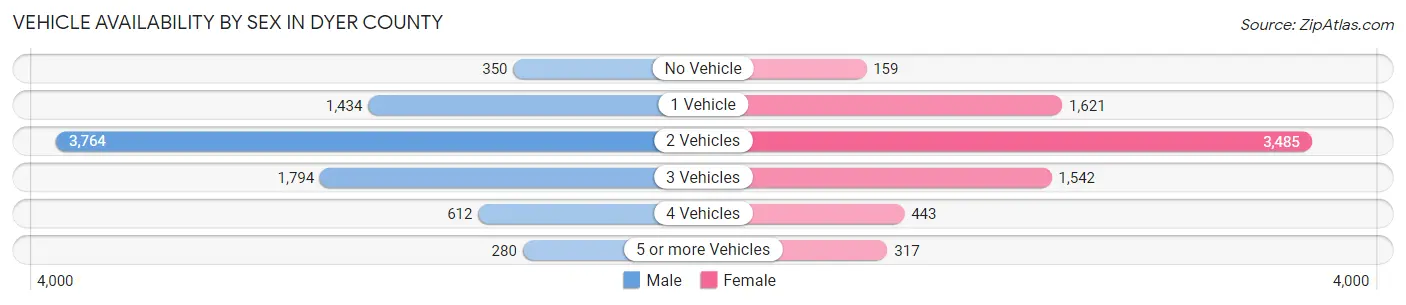
| Vehicles Available | Male | Female |
| No Vehicle | 350 (4.3%) | 159 (2.1%) |
| 1 Vehicle | 1,434 (17.4%) | 1,621 (21.4%) |
| 2 Vehicles | 3,764 (45.7%) | 3,485 (46.1%) |
| 3 Vehicles | 1,794 (21.8%) | 1,542 (20.4%) |
| 4 Vehicles | 612 (7.4%) | 443 (5.9%) |
| 5 or more Vehicles | 280 (3.4%) | 317 (4.2%) |
| Total | 8,234 (100.0%) | 7,567 (100.0%) |
Commute Time in Dyer County
The most frequently occuring commute durations in Dyer County are 10 to 14 minutes (3,297 commuters, 21.7%), 15 to 19 minutes (2,748 commuters, 18.1%), and 5 to 9 minutes (2,615 commuters, 17.2%).
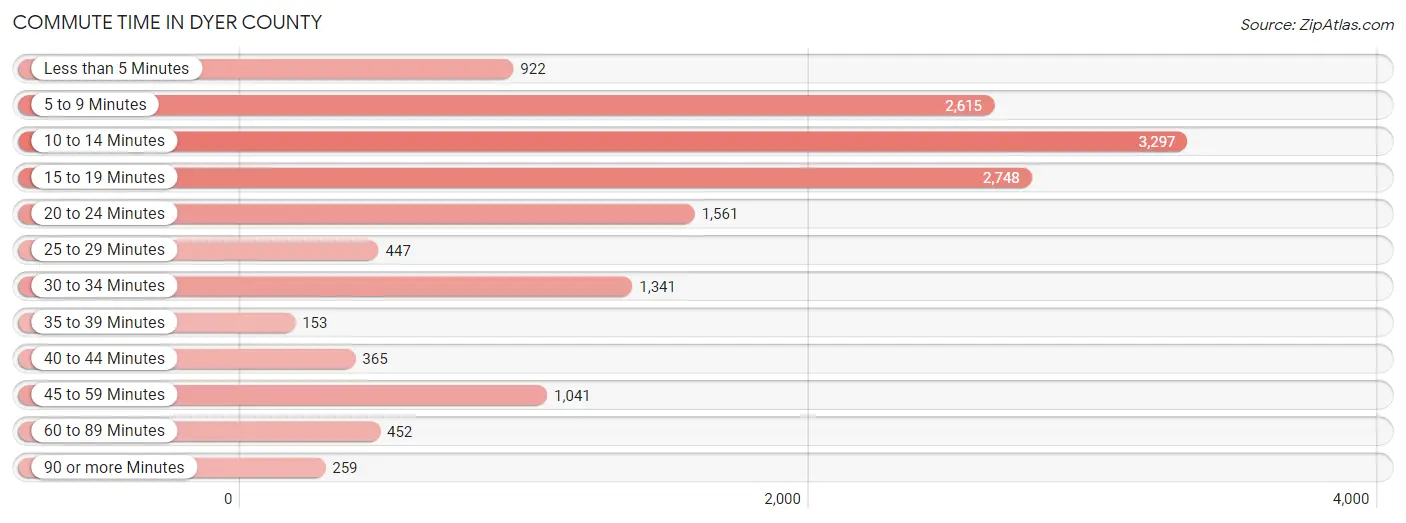
| Commute Time | # Commuters | % Commuters |
| Less than 5 Minutes | 922 | 6.1% |
| 5 to 9 Minutes | 2,615 | 17.2% |
| 10 to 14 Minutes | 3,297 | 21.7% |
| 15 to 19 Minutes | 2,748 | 18.1% |
| 20 to 24 Minutes | 1,561 | 10.3% |
| 25 to 29 Minutes | 447 | 2.9% |
| 30 to 34 Minutes | 1,341 | 8.8% |
| 35 to 39 Minutes | 153 | 1.0% |
| 40 to 44 Minutes | 365 | 2.4% |
| 45 to 59 Minutes | 1,041 | 6.9% |
| 60 to 89 Minutes | 452 | 3.0% |
| 90 or more Minutes | 259 | 1.7% |
Commute Time by Sex in Dyer County
The most common commute times in Dyer County are 15 to 19 minutes (1,539 commuters, 19.3%) for males and 10 to 14 minutes (1,818 commuters, 25.2%) for females.
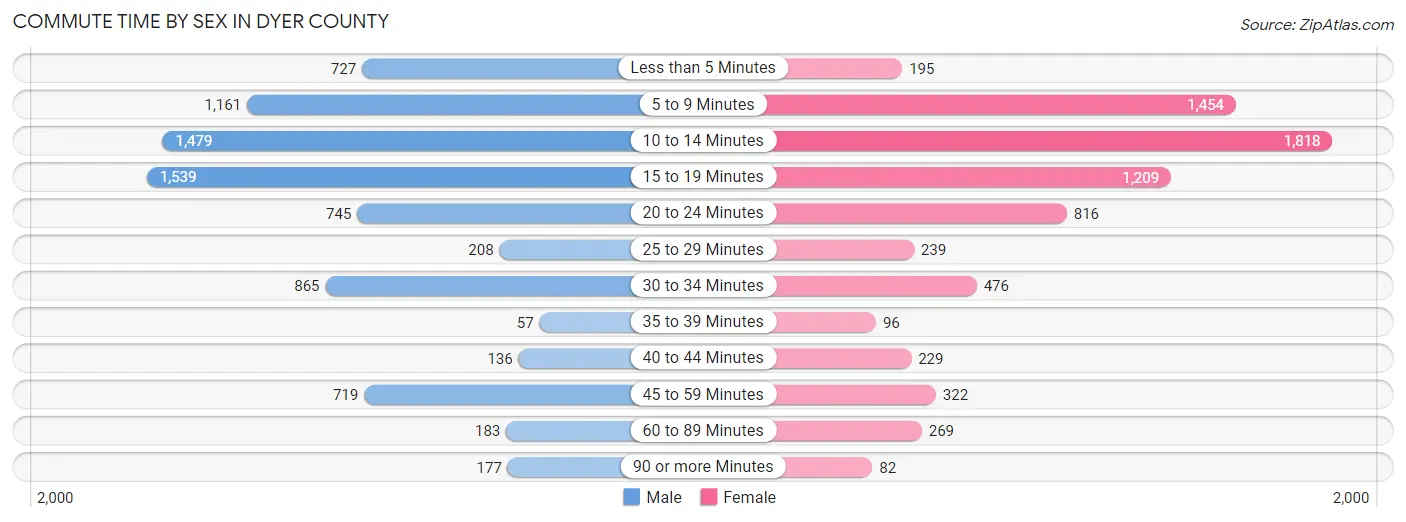
| Commute Time | Male | Female |
| Less than 5 Minutes | 727 (9.1%) | 195 (2.7%) |
| 5 to 9 Minutes | 1,161 (14.5%) | 1,454 (20.2%) |
| 10 to 14 Minutes | 1,479 (18.5%) | 1,818 (25.2%) |
| 15 to 19 Minutes | 1,539 (19.3%) | 1,209 (16.8%) |
| 20 to 24 Minutes | 745 (9.3%) | 816 (11.3%) |
| 25 to 29 Minutes | 208 (2.6%) | 239 (3.3%) |
| 30 to 34 Minutes | 865 (10.8%) | 476 (6.6%) |
| 35 to 39 Minutes | 57 (0.7%) | 96 (1.3%) |
| 40 to 44 Minutes | 136 (1.7%) | 229 (3.2%) |
| 45 to 59 Minutes | 719 (9.0%) | 322 (4.5%) |
| 60 to 89 Minutes | 183 (2.3%) | 269 (3.7%) |
| 90 or more Minutes | 177 (2.2%) | 82 (1.1%) |
Time of Departure to Work by Sex in Dyer County
The most frequent times of departure to work in Dyer County are 4:00 PM to 11:59 PM (1,345, 16.8%) for males and 7:00 AM to 7:29 AM (1,473, 20.4%) for females.
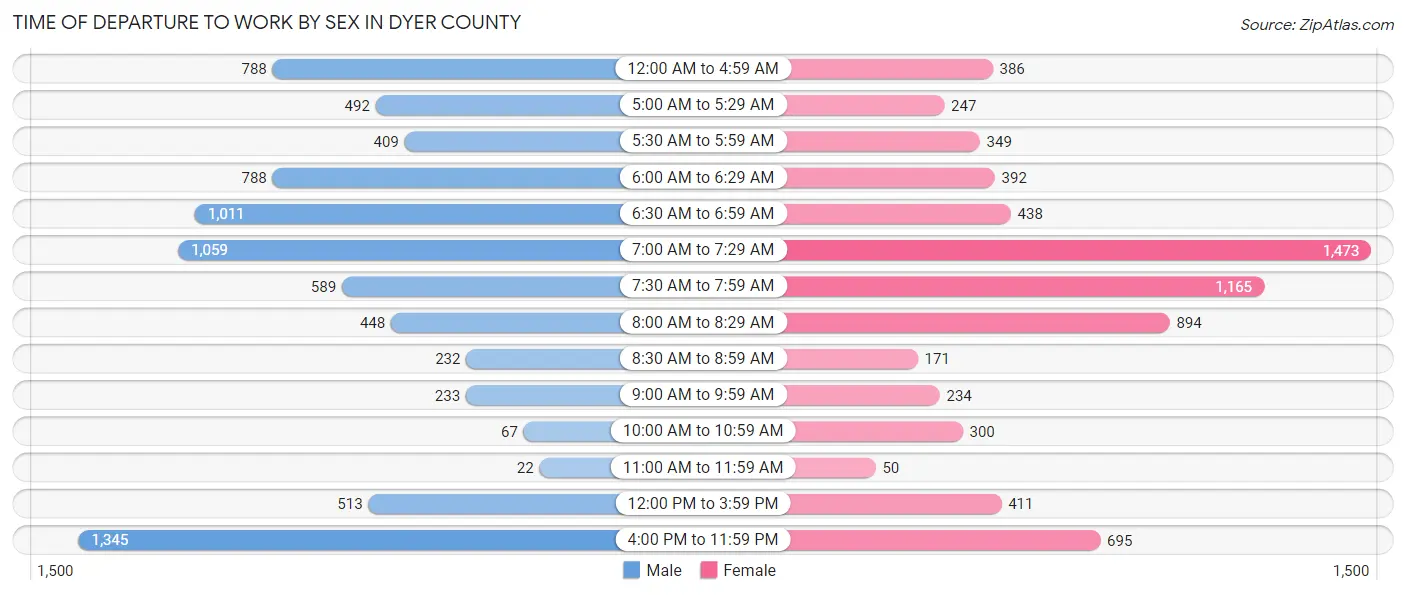
| Time of Departure | Male | Female |
| 12:00 AM to 4:59 AM | 788 (9.9%) | 386 (5.4%) |
| 5:00 AM to 5:29 AM | 492 (6.1%) | 247 (3.4%) |
| 5:30 AM to 5:59 AM | 409 (5.1%) | 349 (4.8%) |
| 6:00 AM to 6:29 AM | 788 (9.9%) | 392 (5.4%) |
| 6:30 AM to 6:59 AM | 1,011 (12.6%) | 438 (6.1%) |
| 7:00 AM to 7:29 AM | 1,059 (13.2%) | 1,473 (20.4%) |
| 7:30 AM to 7:59 AM | 589 (7.4%) | 1,165 (16.2%) |
| 8:00 AM to 8:29 AM | 448 (5.6%) | 894 (12.4%) |
| 8:30 AM to 8:59 AM | 232 (2.9%) | 171 (2.4%) |
| 9:00 AM to 9:59 AM | 233 (2.9%) | 234 (3.3%) |
| 10:00 AM to 10:59 AM | 67 (0.8%) | 300 (4.2%) |
| 11:00 AM to 11:59 AM | 22 (0.3%) | 50 (0.7%) |
| 12:00 PM to 3:59 PM | 513 (6.4%) | 411 (5.7%) |
| 4:00 PM to 11:59 PM | 1,345 (16.8%) | 695 (9.7%) |
| Total | 7,996 (100.0%) | 7,205 (100.0%) |
Housing Occupancy in Dyer County
Occupancy by Ownership in Dyer County
Of the total 14,640 dwellings in Dyer County, owner-occupied units account for 9,263 (63.3%), while renter-occupied units make up 5,377 (36.7%).
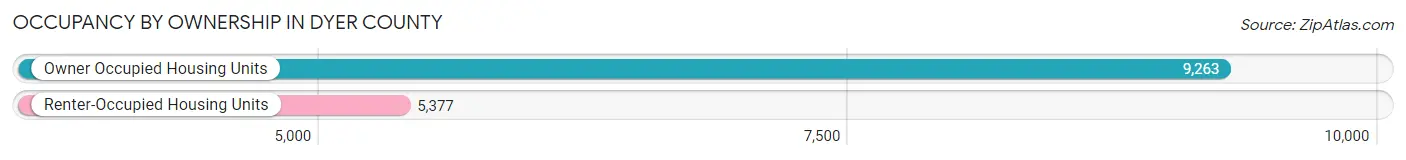
| Occupancy | # Housing Units | % Housing Units |
| Owner Occupied Housing Units | 9,263 | 63.3% |
| Renter-Occupied Housing Units | 5,377 | 36.7% |
| Total Occupied Housing Units | 14,640 | 100.0% |
Occupancy by Household Size in Dyer County
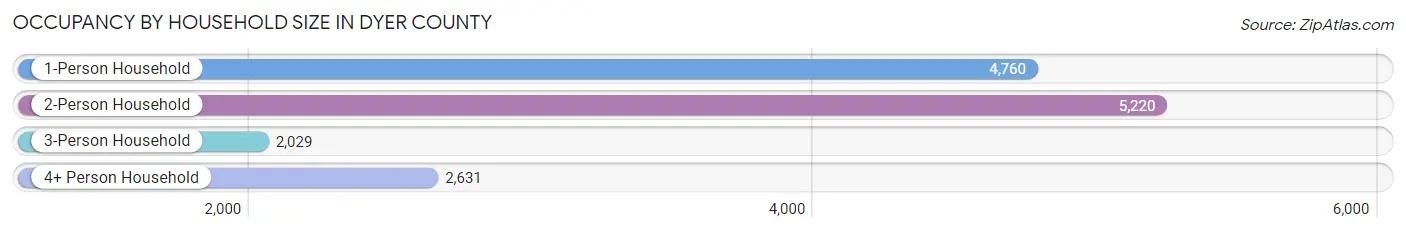
| Household Size | # Housing Units | % Housing Units |
| 1-Person Household | 4,760 | 32.5% |
| 2-Person Household | 5,220 | 35.7% |
| 3-Person Household | 2,029 | 13.9% |
| 4+ Person Household | 2,631 | 18.0% |
| Total Housing Units | 14,640 | 100.0% |
Occupancy by Ownership by Household Size in Dyer County
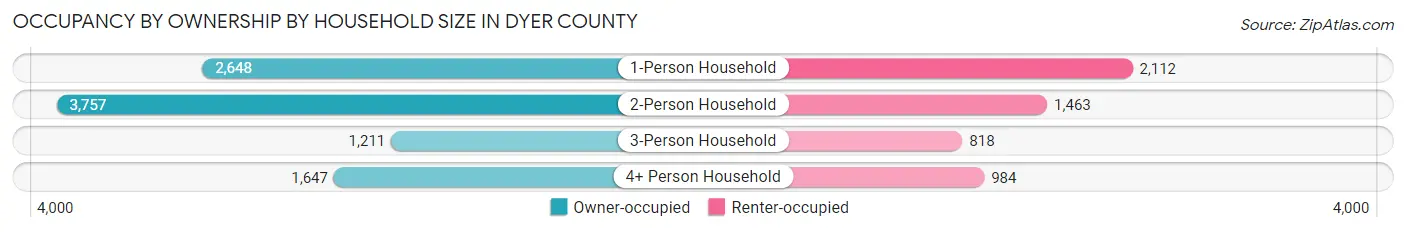
| Household Size | Owner-occupied | Renter-occupied |
| 1-Person Household | 2,648 (55.6%) | 2,112 (44.4%) |
| 2-Person Household | 3,757 (72.0%) | 1,463 (28.0%) |
| 3-Person Household | 1,211 (59.7%) | 818 (40.3%) |
| 4+ Person Household | 1,647 (62.6%) | 984 (37.4%) |
| Total Housing Units | 9,263 (63.3%) | 5,377 (36.7%) |
Occupancy by Educational Attainment in Dyer County
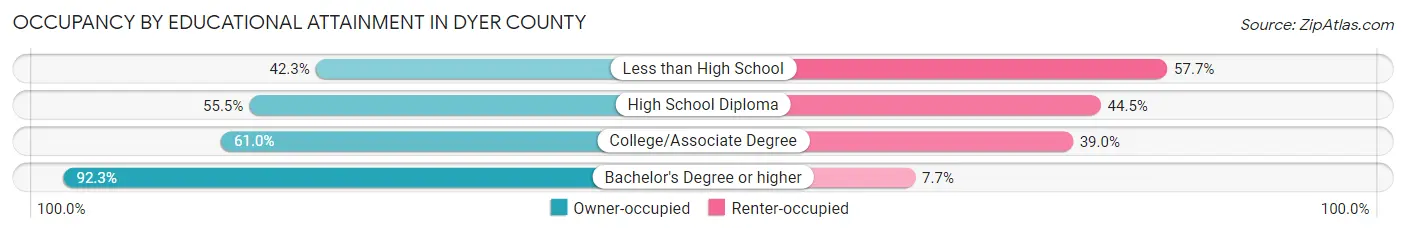
| Household Size | Owner-occupied | Renter-occupied |
| Less than High School | 734 (42.3%) | 1,001 (57.7%) |
| High School Diploma | 2,892 (55.5%) | 2,320 (44.5%) |
| College/Associate Degree | 2,855 (61.0%) | 1,823 (39.0%) |
| Bachelor's Degree or higher | 2,782 (92.3%) | 233 (7.7%) |
Occupancy by Age of Householder in Dyer County
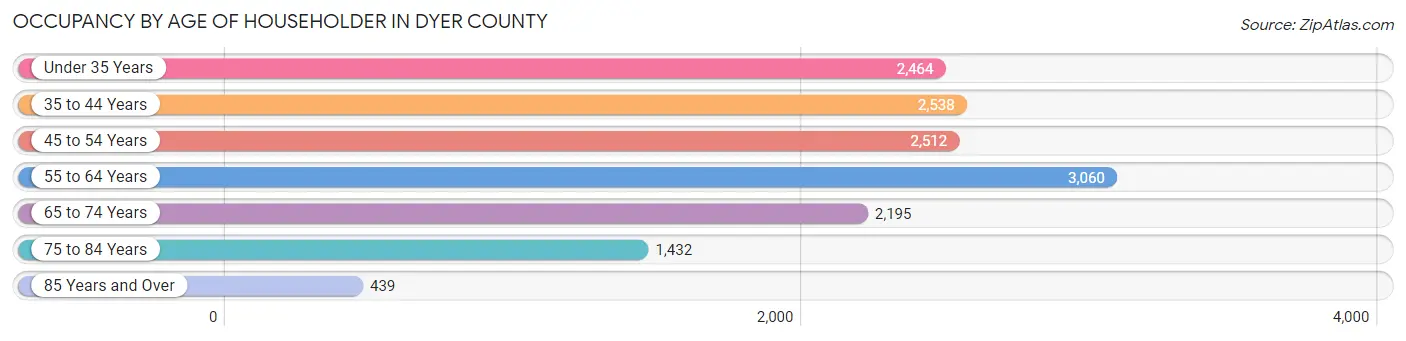
| Age Bracket | # Households | % Households |
| Under 35 Years | 2,464 | 16.8% |
| 35 to 44 Years | 2,538 | 17.3% |
| 45 to 54 Years | 2,512 | 17.2% |
| 55 to 64 Years | 3,060 | 20.9% |
| 65 to 74 Years | 2,195 | 15.0% |
| 75 to 84 Years | 1,432 | 9.8% |
| 85 Years and Over | 439 | 3.0% |
| Total | 14,640 | 100.0% |
Housing Finances in Dyer County
Median Income by Occupancy in Dyer County
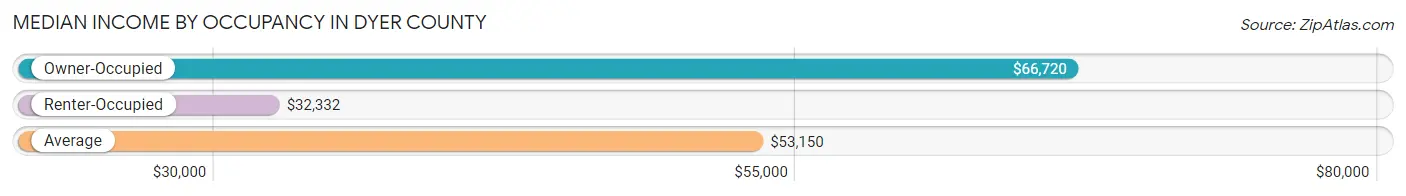
| Occupancy Type | # Households | Median Income |
| Owner-Occupied | 9,263 (63.3%) | $66,720 |
| Renter-Occupied | 5,377 (36.7%) | $32,332 |
| Average | 14,640 (100.0%) | $53,150 |
Occupancy by Householder Income Bracket in Dyer County
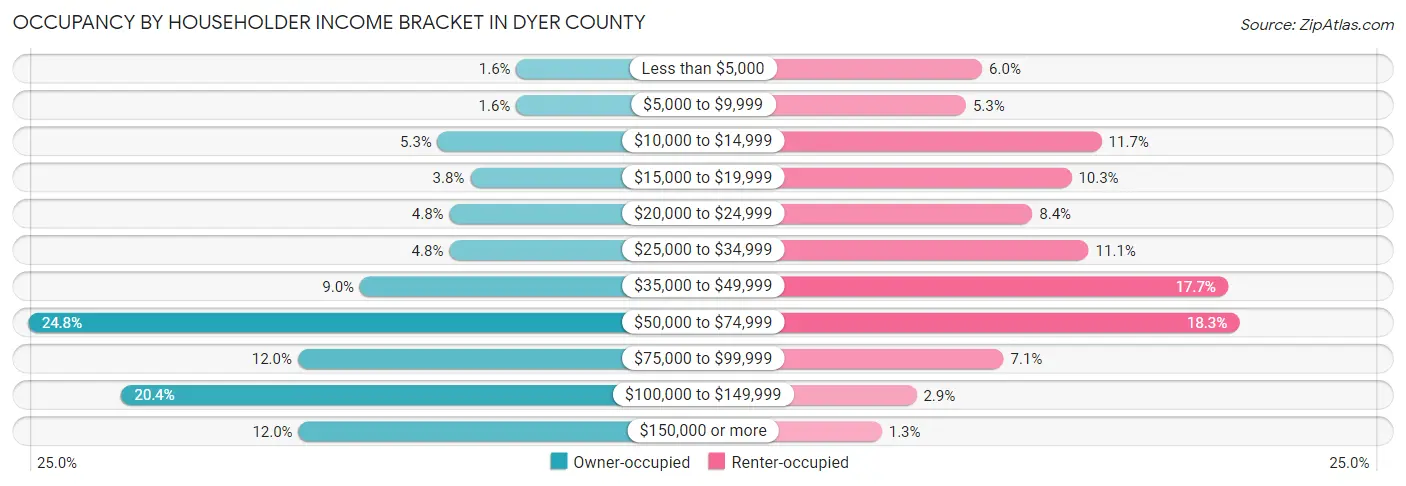
| Income Bracket | Owner-occupied | Renter-occupied |
| Less than $5,000 | 146 (1.6%) | 324 (6.0%) |
| $5,000 to $9,999 | 147 (1.6%) | 283 (5.3%) |
| $10,000 to $14,999 | 494 (5.3%) | 630 (11.7%) |
| $15,000 to $19,999 | 350 (3.8%) | 553 (10.3%) |
| $20,000 to $24,999 | 442 (4.8%) | 453 (8.4%) |
| $25,000 to $34,999 | 443 (4.8%) | 597 (11.1%) |
| $35,000 to $49,999 | 836 (9.0%) | 953 (17.7%) |
| $50,000 to $74,999 | 2,297 (24.8%) | 982 (18.3%) |
| $75,000 to $99,999 | 1,111 (12.0%) | 379 (7.0%) |
| $100,000 to $149,999 | 1,889 (20.4%) | 156 (2.9%) |
| $150,000 or more | 1,108 (12.0%) | 67 (1.3%) |
| Total | 9,263 (100.0%) | 5,377 (100.0%) |
Monthly Housing Cost Tiers in Dyer County
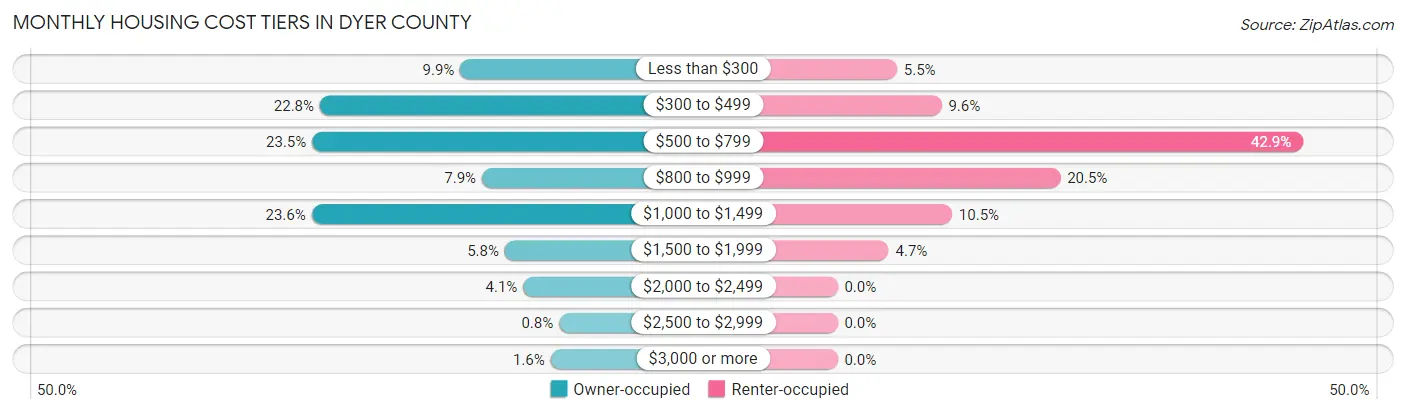
| Monthly Cost | Owner-occupied | Renter-occupied |
| Less than $300 | 917 (9.9%) | 294 (5.5%) |
| $300 to $499 | 2,114 (22.8%) | 515 (9.6%) |
| $500 to $799 | 2,180 (23.5%) | 2,305 (42.9%) |
| $800 to $999 | 732 (7.9%) | 1,103 (20.5%) |
| $1,000 to $1,499 | 2,184 (23.6%) | 567 (10.5%) |
| $1,500 to $1,999 | 536 (5.8%) | 253 (4.7%) |
| $2,000 to $2,499 | 380 (4.1%) | 0 (0.0%) |
| $2,500 to $2,999 | 74 (0.8%) | 0 (0.0%) |
| $3,000 or more | 146 (1.6%) | 0 (0.0%) |
| Total | 9,263 (100.0%) | 5,377 (100.0%) |
Physical Housing Characteristics in Dyer County
Housing Structures in Dyer County
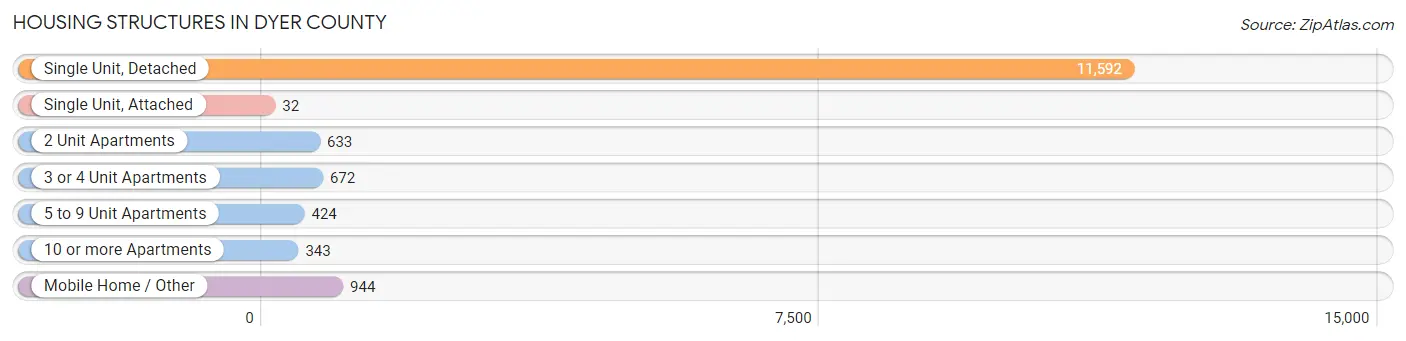
| Structure Type | # Housing Units | % Housing Units |
| Single Unit, Detached | 11,592 | 79.2% |
| Single Unit, Attached | 32 | 0.2% |
| 2 Unit Apartments | 633 | 4.3% |
| 3 or 4 Unit Apartments | 672 | 4.6% |
| 5 to 9 Unit Apartments | 424 | 2.9% |
| 10 or more Apartments | 343 | 2.3% |
| Mobile Home / Other | 944 | 6.5% |
| Total | 14,640 | 100.0% |
Housing Structures by Occupancy in Dyer County
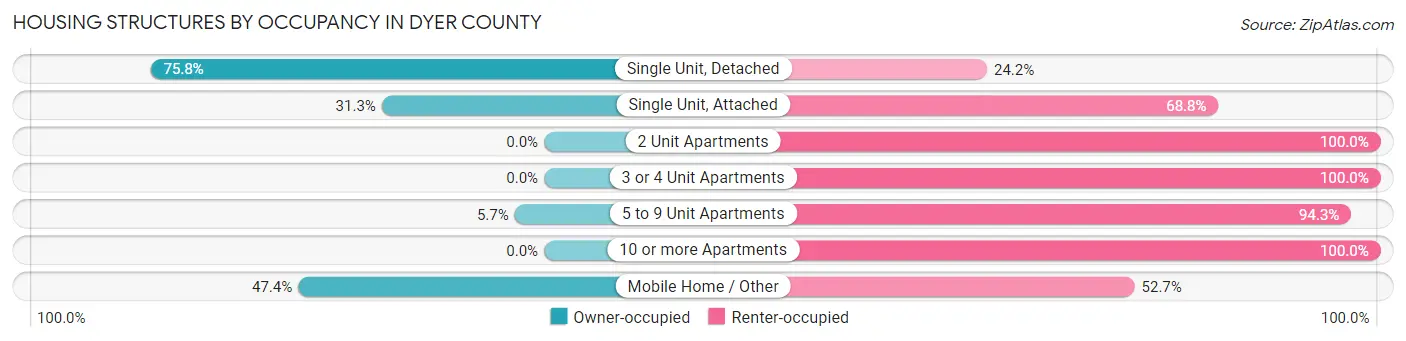
| Structure Type | Owner-occupied | Renter-occupied |
| Single Unit, Detached | 8,782 (75.8%) | 2,810 (24.2%) |
| Single Unit, Attached | 10 (31.2%) | 22 (68.8%) |
| 2 Unit Apartments | 0 (0.0%) | 633 (100.0%) |
| 3 or 4 Unit Apartments | 0 (0.0%) | 672 (100.0%) |
| 5 to 9 Unit Apartments | 24 (5.7%) | 400 (94.3%) |
| 10 or more Apartments | 0 (0.0%) | 343 (100.0%) |
| Mobile Home / Other | 447 (47.3%) | 497 (52.6%) |
| Total | 9,263 (63.3%) | 5,377 (36.7%) |
Housing Structures by Number of Rooms in Dyer County
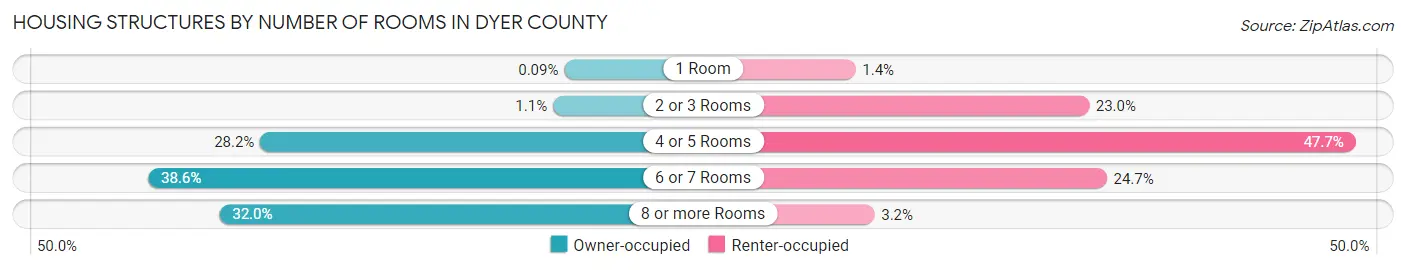
| Number of Rooms | Owner-occupied | Renter-occupied |
| 1 Room | 8 (0.1%) | 77 (1.4%) |
| 2 or 3 Rooms | 105 (1.1%) | 1,238 (23.0%) |
| 4 or 5 Rooms | 2,613 (28.2%) | 2,565 (47.7%) |
| 6 or 7 Rooms | 3,574 (38.6%) | 1,326 (24.7%) |
| 8 or more Rooms | 2,963 (32.0%) | 171 (3.2%) |
| Total | 9,263 (100.0%) | 5,377 (100.0%) |
Housing Structure by Heating Type in Dyer County
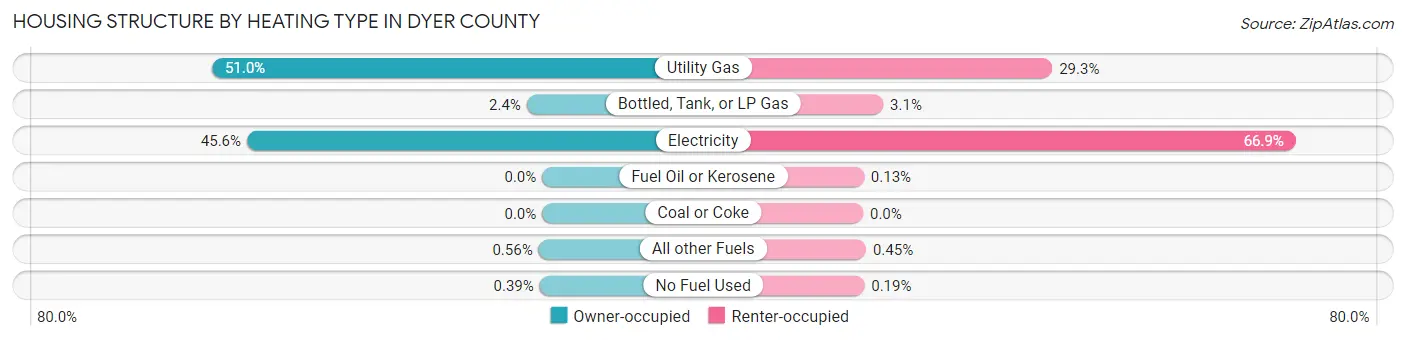
| Heating Type | Owner-occupied | Renter-occupied |
| Utility Gas | 4,727 (51.0%) | 1,573 (29.2%) |
| Bottled, Tank, or LP Gas | 220 (2.4%) | 167 (3.1%) |
| Electricity | 4,228 (45.6%) | 3,596 (66.9%) |
| Fuel Oil or Kerosene | 0 (0.0%) | 7 (0.1%) |
| Coal or Coke | 0 (0.0%) | 0 (0.0%) |
| All other Fuels | 52 (0.6%) | 24 (0.4%) |
| No Fuel Used | 36 (0.4%) | 10 (0.2%) |
| Total | 9,263 (100.0%) | 5,377 (100.0%) |
Household Vehicle Usage in Dyer County
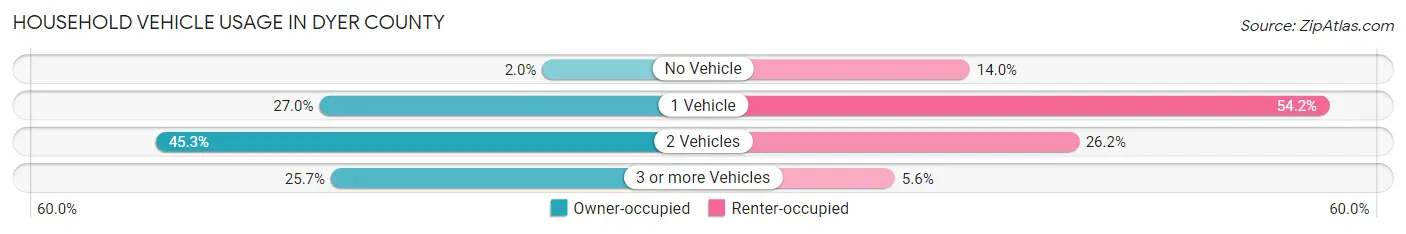
| Vehicles per Household | Owner-occupied | Renter-occupied |
| No Vehicle | 186 (2.0%) | 753 (14.0%) |
| 1 Vehicle | 2,500 (27.0%) | 2,915 (54.2%) |
| 2 Vehicles | 4,197 (45.3%) | 1,408 (26.2%) |
| 3 or more Vehicles | 2,380 (25.7%) | 301 (5.6%) |
| Total | 9,263 (100.0%) | 5,377 (100.0%) |
Real Estate & Mortgages in Dyer County
Real Estate and Mortgage Overview in Dyer County
| Characteristic | Without Mortgage | With Mortgage |
| Housing Units | 4,676 | 4,587 |
| Median Property Value | $134,300 | $157,700 |
| Median Household Income | $53,068 | $569 |
| Monthly Housing Costs | $435 | $137 |
| Real Estate Taxes | $962 | $297 |
Property Value by Mortgage Status in Dyer County
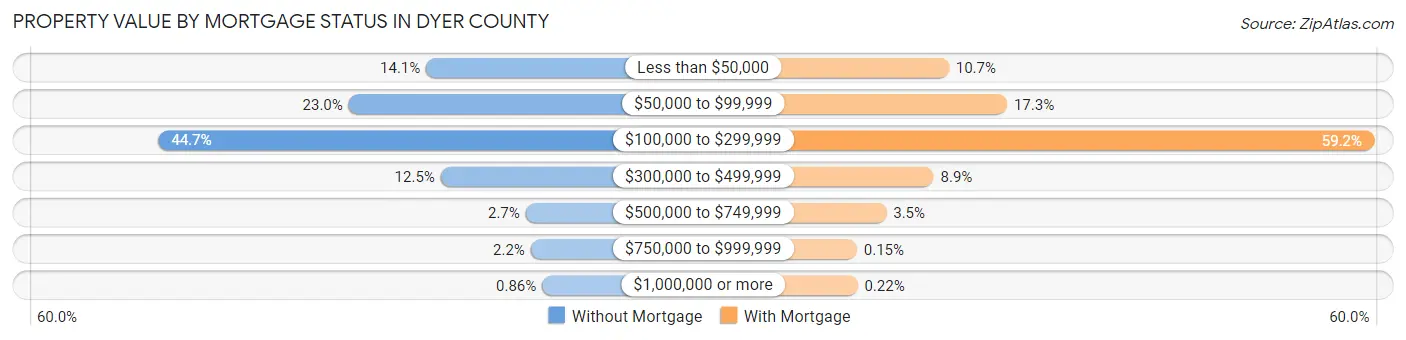
| Property Value | Without Mortgage | With Mortgage |
| Less than $50,000 | 660 (14.1%) | 489 (10.7%) |
| $50,000 to $99,999 | 1,074 (23.0%) | 794 (17.3%) |
| $100,000 to $299,999 | 2,091 (44.7%) | 2,717 (59.2%) |
| $300,000 to $499,999 | 582 (12.4%) | 409 (8.9%) |
| $500,000 to $749,999 | 128 (2.7%) | 161 (3.5%) |
| $750,000 to $999,999 | 101 (2.2%) | 7 (0.2%) |
| $1,000,000 or more | 40 (0.9%) | 10 (0.2%) |
| Total | 4,676 (100.0%) | 4,587 (100.0%) |
Household Income by Mortgage Status in Dyer County
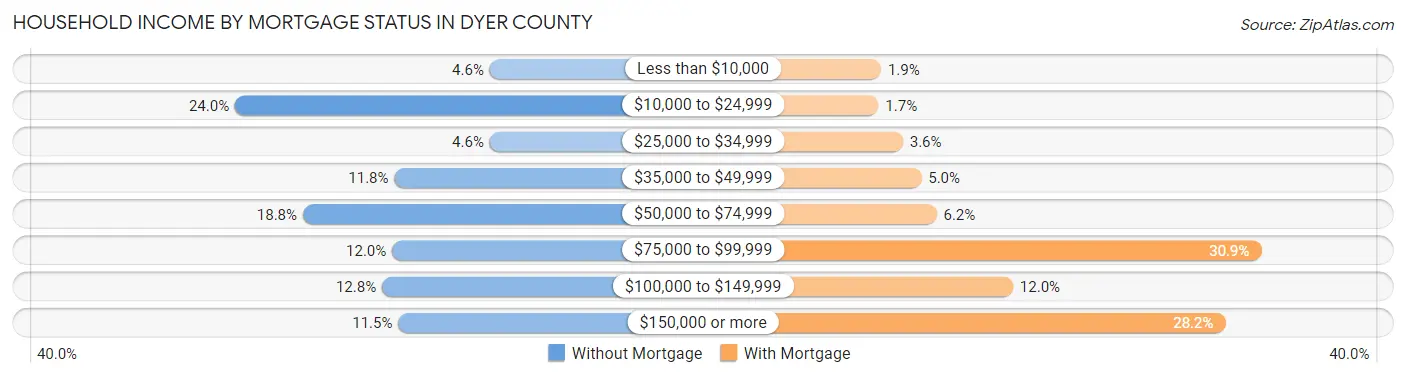
| Household Income | Without Mortgage | With Mortgage |
| Less than $10,000 | 213 (4.6%) | 89 (1.9%) |
| $10,000 to $24,999 | 1,121 (24.0%) | 80 (1.7%) |
| $25,000 to $34,999 | 213 (4.6%) | 165 (3.6%) |
| $35,000 to $49,999 | 553 (11.8%) | 230 (5.0%) |
| $50,000 to $74,999 | 879 (18.8%) | 283 (6.2%) |
| $75,000 to $99,999 | 561 (12.0%) | 1,418 (30.9%) |
| $100,000 to $149,999 | 597 (12.8%) | 550 (12.0%) |
| $150,000 or more | 539 (11.5%) | 1,292 (28.2%) |
| Total | 4,676 (100.0%) | 4,587 (100.0%) |
Property Value to Household Income Ratio in Dyer County
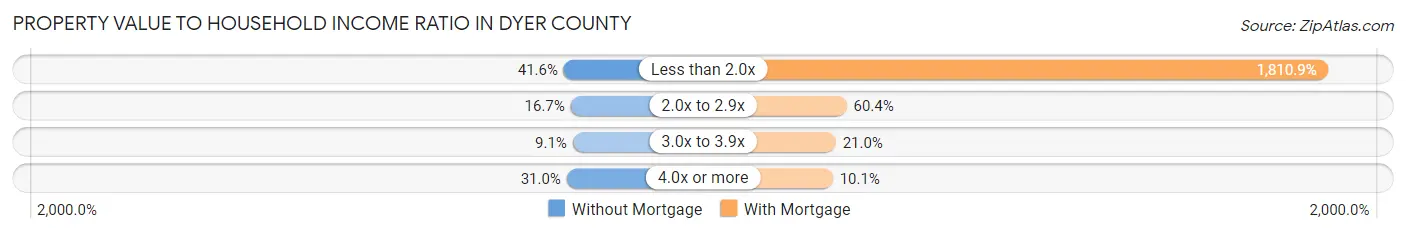
| Value-to-Income Ratio | Without Mortgage | With Mortgage |
| Less than 2.0x | 1,944 (41.6%) | 83,067 (1,810.9%) |
| 2.0x to 2.9x | 781 (16.7%) | 2,772 (60.4%) |
| 3.0x to 3.9x | 426 (9.1%) | 961 (20.9%) |
| 4.0x or more | 1,447 (30.9%) | 462 (10.1%) |
| Total | 4,676 (100.0%) | 4,587 (100.0%) |
Real Estate Taxes by Mortgage Status in Dyer County
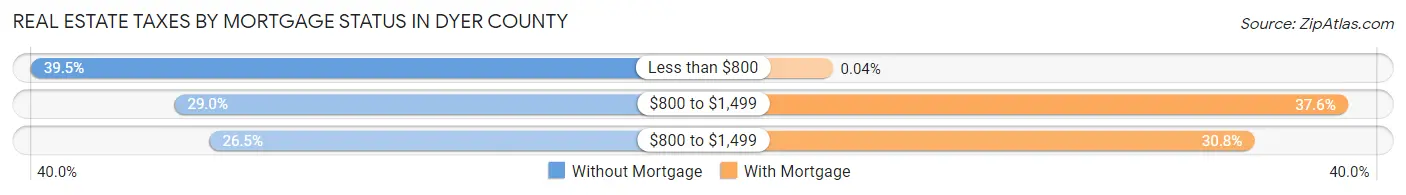
| Property Taxes | Without Mortgage | With Mortgage |
| Less than $800 | 1,849 (39.5%) | 2 (0.0%) |
| $800 to $1,499 | 1,358 (29.0%) | 1,724 (37.6%) |
| $800 to $1,499 | 1,238 (26.5%) | 1,411 (30.8%) |
| Total | 4,676 (100.0%) | 4,587 (100.0%) |
Health & Disability in Dyer County
Health Insurance Coverage by Age in Dyer County
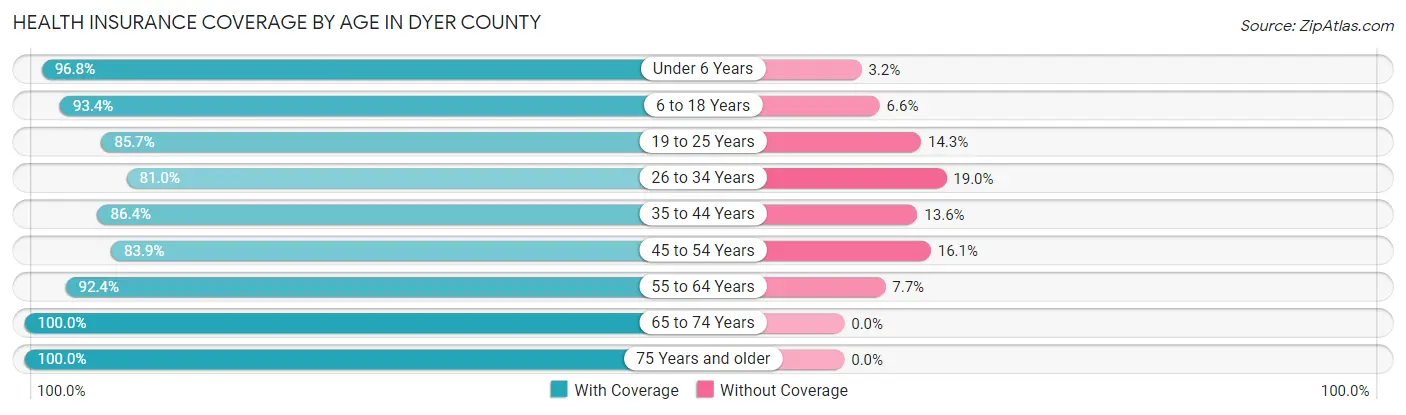
| Age Bracket | With Coverage | Without Coverage |
| Under 6 Years | 2,631 (96.8%) | 87 (3.2%) |
| 6 to 18 Years | 5,964 (93.4%) | 421 (6.6%) |
| 19 to 25 Years | 2,837 (85.7%) | 474 (14.3%) |
| 26 to 34 Years | 2,940 (81.0%) | 691 (19.0%) |
| 35 to 44 Years | 3,669 (86.4%) | 579 (13.6%) |
| 45 to 54 Years | 3,988 (83.9%) | 767 (16.1%) |
| 55 to 64 Years | 4,598 (92.3%) | 381 (7.6%) |
| 65 to 74 Years | 3,808 (100.0%) | 0 (0.0%) |
| 75 Years and older | 2,452 (100.0%) | 0 (0.0%) |
| Total | 32,887 (90.6%) | 3,400 (9.4%) |
Health Insurance Coverage by Citizenship Status in Dyer County
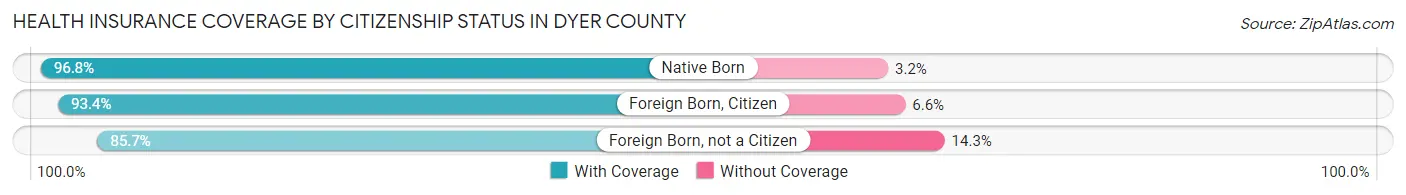
| Citizenship Status | With Coverage | Without Coverage |
| Native Born | 2,631 (96.8%) | 87 (3.2%) |
| Foreign Born, Citizen | 5,964 (93.4%) | 421 (6.6%) |
| Foreign Born, not a Citizen | 2,837 (85.7%) | 474 (14.3%) |
Health Insurance Coverage by Household Income in Dyer County
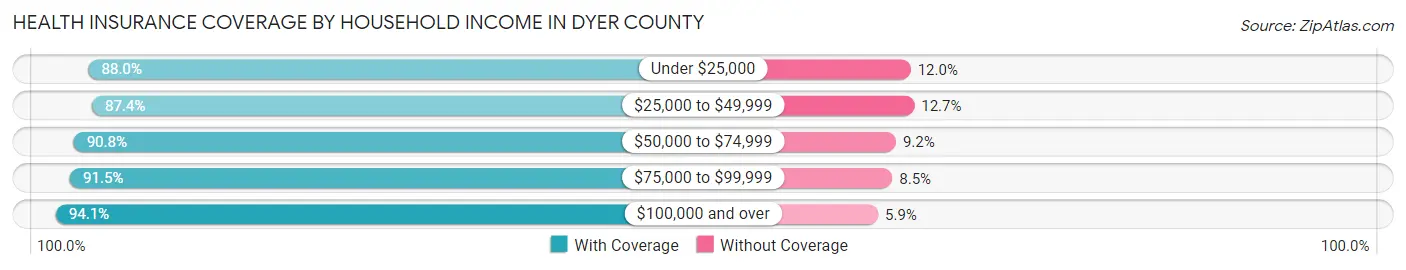
| Household Income | With Coverage | Without Coverage |
| Under $25,000 | 6,052 (88.0%) | 824 (12.0%) |
| $25,000 to $49,999 | 5,532 (87.4%) | 801 (12.7%) |
| $50,000 to $74,999 | 7,872 (90.8%) | 799 (9.2%) |
| $75,000 to $99,999 | 3,575 (91.5%) | 334 (8.5%) |
| $100,000 and over | 9,824 (94.1%) | 613 (5.9%) |
Public vs Private Health Insurance Coverage by Age in Dyer County
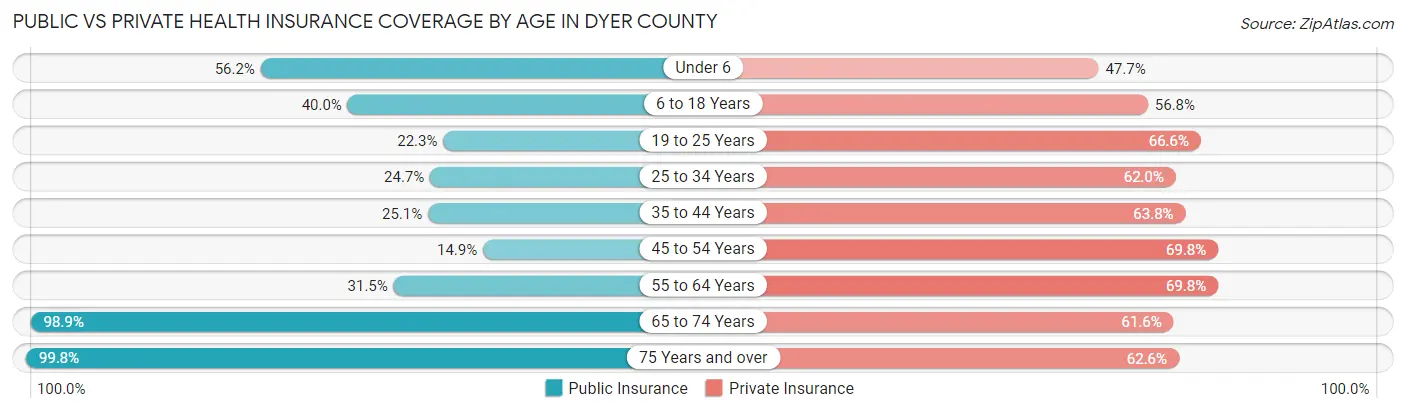
| Age Bracket | Public Insurance | Private Insurance |
| Under 6 | 1,527 (56.2%) | 1,295 (47.6%) |
| 6 to 18 Years | 2,556 (40.0%) | 3,627 (56.8%) |
| 19 to 25 Years | 738 (22.3%) | 2,206 (66.6%) |
| 25 to 34 Years | 898 (24.7%) | 2,251 (62.0%) |
| 35 to 44 Years | 1,067 (25.1%) | 2,709 (63.8%) |
| 45 to 54 Years | 709 (14.9%) | 3,321 (69.8%) |
| 55 to 64 Years | 1,569 (31.5%) | 3,477 (69.8%) |
| 65 to 74 Years | 3,766 (98.9%) | 2,345 (61.6%) |
| 75 Years and over | 2,446 (99.8%) | 1,534 (62.6%) |
| Total | 15,276 (42.1%) | 22,765 (62.7%) |
Disability Status by Sex by Age in Dyer County
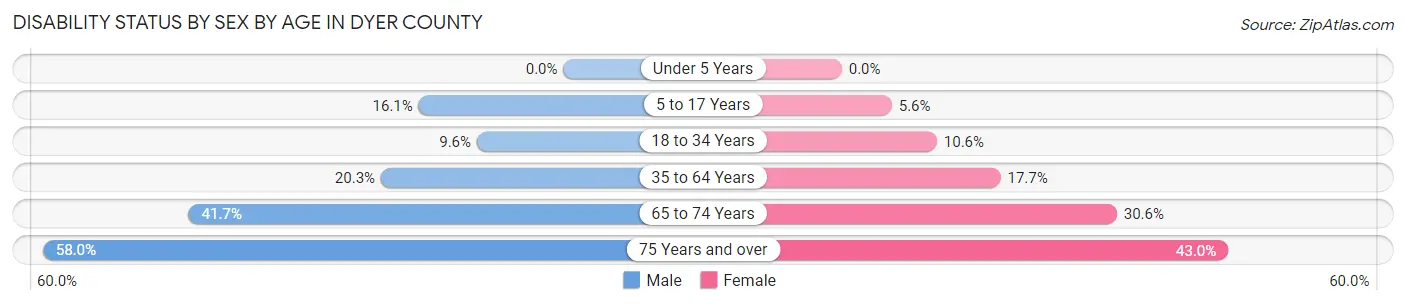
| Age Bracket | Male | Female |
| Under 5 Years | 0 (0.0%) | 0 (0.0%) |
| 5 to 17 Years | 532 (16.1%) | 177 (5.6%) |
| 18 to 34 Years | 352 (9.6%) | 392 (10.6%) |
| 35 to 64 Years | 1,340 (20.3%) | 1,306 (17.7%) |
| 65 to 74 Years | 709 (41.7%) | 646 (30.6%) |
| 75 Years and over | 582 (58.0%) | 623 (43.0%) |
Disability Class by Sex by Age in Dyer County
Disability Class: Hearing Difficulty
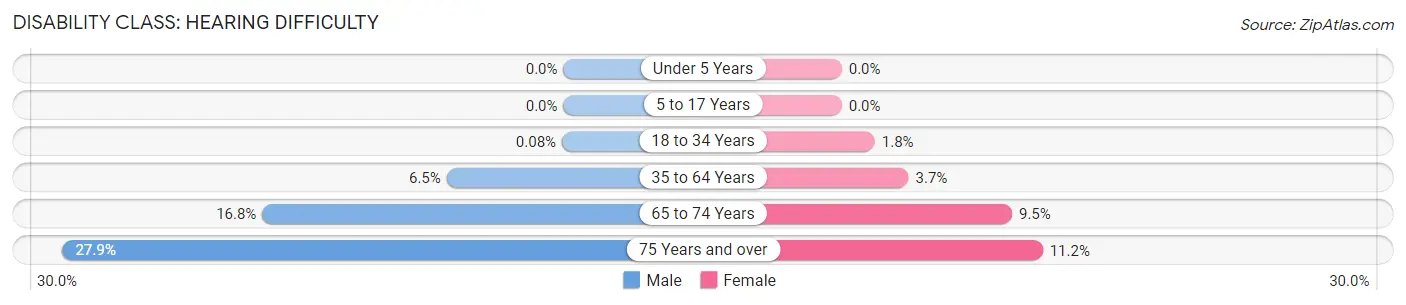
| Age Bracket | Male | Female |
| Under 5 Years | 0 (0.0%) | 0 (0.0%) |
| 5 to 17 Years | 0 (0.0%) | 0 (0.0%) |
| 18 to 34 Years | 3 (0.1%) | 68 (1.8%) |
| 35 to 64 Years | 429 (6.5%) | 275 (3.7%) |
| 65 to 74 Years | 285 (16.8%) | 200 (9.5%) |
| 75 Years and over | 280 (27.9%) | 162 (11.2%) |
Disability Class: Vision Difficulty

| Age Bracket | Male | Female |
| Under 5 Years | 0 (0.0%) | 0 (0.0%) |
| 5 to 17 Years | 90 (2.7%) | 24 (0.8%) |
| 18 to 34 Years | 89 (2.4%) | 55 (1.5%) |
| 35 to 64 Years | 194 (2.9%) | 299 (4.1%) |
| 65 to 74 Years | 105 (6.2%) | 140 (6.6%) |
| 75 Years and over | 209 (20.8%) | 104 (7.2%) |
Disability Class: Cognitive Difficulty
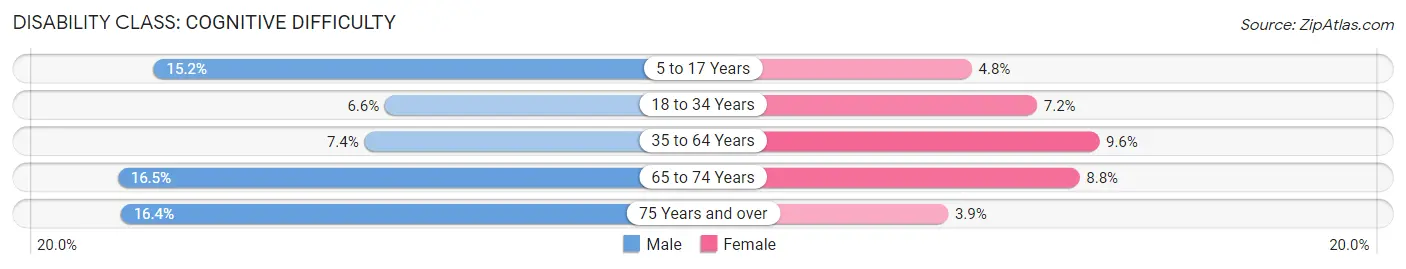
| Age Bracket | Male | Female |
| 5 to 17 Years | 502 (15.2%) | 153 (4.8%) |
| 18 to 34 Years | 242 (6.6%) | 268 (7.2%) |
| 35 to 64 Years | 487 (7.4%) | 705 (9.6%) |
| 65 to 74 Years | 281 (16.5%) | 186 (8.8%) |
| 75 Years and over | 165 (16.4%) | 57 (3.9%) |
Disability Class: Ambulatory Difficulty
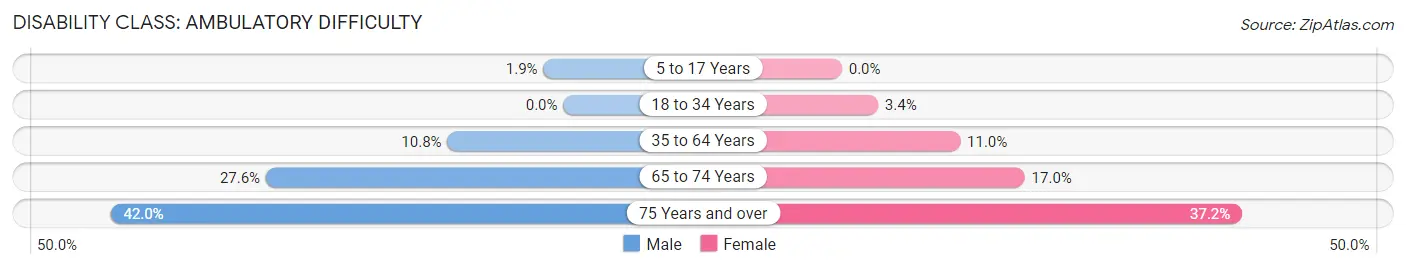
| Age Bracket | Male | Female |
| 5 to 17 Years | 61 (1.8%) | 0 (0.0%) |
| 18 to 34 Years | 0 (0.0%) | 124 (3.4%) |
| 35 to 64 Years | 710 (10.8%) | 811 (11.0%) |
| 65 to 74 Years | 469 (27.6%) | 358 (17.0%) |
| 75 Years and over | 422 (42.0%) | 538 (37.1%) |
Disability Class: Self-Care Difficulty
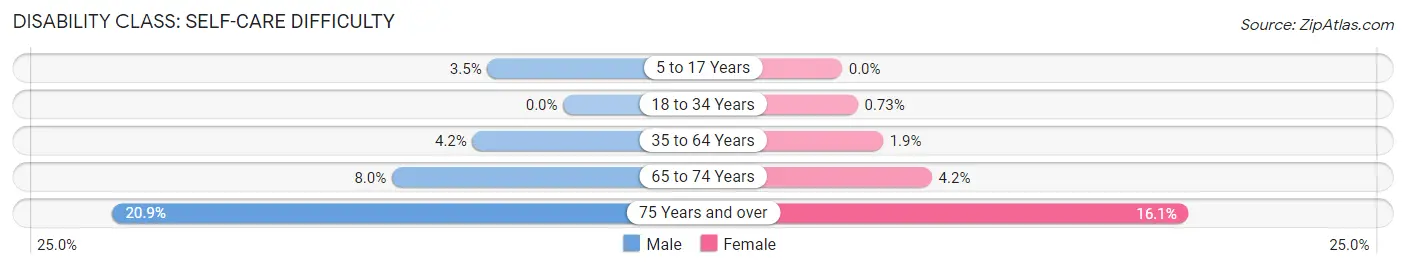
| Age Bracket | Male | Female |
| 5 to 17 Years | 116 (3.5%) | 0 (0.0%) |
| 18 to 34 Years | 0 (0.0%) | 27 (0.7%) |
| 35 to 64 Years | 278 (4.2%) | 140 (1.9%) |
| 65 to 74 Years | 135 (8.0%) | 88 (4.2%) |
| 75 Years and over | 210 (20.9%) | 233 (16.1%) |
Technology Access in Dyer County
Computing Device Access in Dyer County
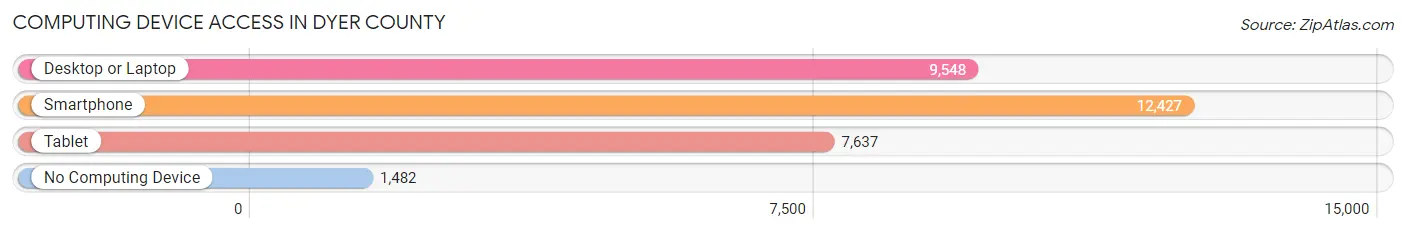
| Device Type | # Households | % Households |
| Desktop or Laptop | 9,548 | 65.2% |
| Smartphone | 12,427 | 84.9% |
| Tablet | 7,637 | 52.2% |
| No Computing Device | 1,482 | 10.1% |
| Total | 14,640 | 100.0% |
Internet Access in Dyer County
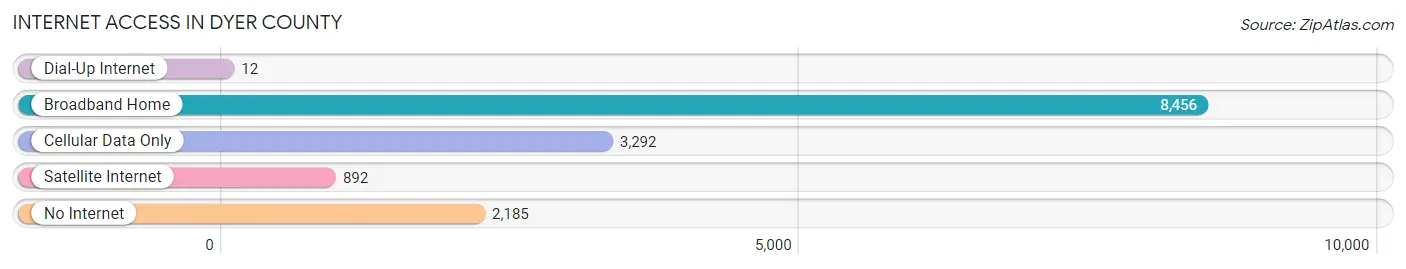
| Internet Type | # Households | % Households |
| Dial-Up Internet | 12 | 0.1% |
| Broadband Home | 8,456 | 57.8% |
| Cellular Data Only | 3,292 | 22.5% |
| Satellite Internet | 892 | 6.1% |
| No Internet | 2,185 | 14.9% |
| Total | 14,640 | 100.0% |
Dyer County Summary
Dyer County is located in the northwest corner of Tennessee, and is part of the Jackson, Tennessee Metropolitan Statistical Area. The county was established in 1823 and named after Robert Henry Dyer, a veteran of the War of 1812. As of the 2010 census, the population was 38,335.
Geography
Dyer County is located in the northwest corner of Tennessee, and is bordered by Lake County to the north, Obion County to the east, Gibson County to the south, and Lauderdale County, Mississippi to the west. The county has a total area of 545 square miles, of which 537 square miles is land and 8 square miles (1.5%) is water. The county is located in the New Madrid Seismic Zone, an area with a high risk of earthquakes.
The county is divided into two distinct regions. The western half is part of the Mississippi Delta, and is characterized by flat, fertile farmland. The eastern half is part of the Western Highland Rim, and is characterized by rolling hills and forests. The highest point in the county is located in the eastern part, at an elevation of 590 feet.
The county is home to several rivers and streams, including the Obion River, the Hatchie River, and the South Fork of the Forked Deer River. The county also contains several lakes, including Reelfoot Lake, which is a popular destination for fishing and boating.
Demographics
As of the 2010 census, there were 38,335 people, 14,845 households, and 10,717 families residing in the county. The population density was 71 people per square mile. There were 16,845 housing units at an average density of 31 per square mile. The racial makeup of the county was 87.3% White, 9.7% Black or African American, 0.3% Native American, 0.3% Asian, 0.2% Pacific Islander, 1.2% from other races, and 1.2% from two or more races. 2.7% of the population were Hispanic or Latino of any race.
There were 14,845 households, out of which 32.2% had children under the age of 18 living with them, 54.2% were married couples living together, 13.2% had a female householder with no husband present, and 28.2% were non-families. 24.3% of all households were made up of individuals, and 10.2% had someone living alone who was 65 years of age or older. The average household size was 2.54 and the average family size was 3.00.
The median age in the county was 38.3 years. 24.7% of residents were under the age of 18; 8.3% were between the ages of 18 and 24; 25.2% were from 25 to 44; 27.2% were from 45 to 64; and 14.6% were 65 years of age or older. The gender makeup of the county was 48.3% male and 51.7% female.
Economy
Dyer County has a diverse economy, with a mix of manufacturing, agriculture, and service industries. The county is home to several large manufacturing companies, including Goodyear Tire and Rubber Company, which has a plant in Dyersburg. Other major employers include Tyson Foods, Dyersburg State Community College, and the Dyersburg Regional Medical Center.
Agriculture is also an important part of the county's economy. The county is home to several large farms, and is a major producer of soybeans, cotton, corn, and wheat.
The county also has a thriving tourism industry, with several popular attractions, including Reelfoot Lake, the Dyersburg State Park, and the Dyer County Museum.
Conclusion
Dyer County is a diverse and vibrant county located in the northwest corner of Tennessee. The county has a mix of manufacturing, agriculture, and service industries, and is home to several large employers. The county is also home to several popular attractions, including Reelfoot Lake, the Dyersburg State Park, and the Dyer County Museum. With its diverse economy and attractions, Dyer County is an ideal place to live, work, and visit.
Common Questions
What is the Total Population of Dyer County?
Total Population of Dyer County is 36,818.
What is the Total Male Population of Dyer County?
Total Male Population of Dyer County is 17,679.
What is the Total Female Population of Dyer County?
Total Female Population of Dyer County is 19,139.
What is the Ratio of Males per 100 Females in Dyer County?
There are 92.37 Males per 100 Females in Dyer County.
What is the Ratio of Females per 100 Males in Dyer County?
There are 108.26 Females per 100 Males in Dyer County.
What is the Median Population Age in Dyer County?
Median Population Age in Dyer County is 40.5 Years.
What is the Average Family Size in Dyer County
Average Family Size in Dyer County is 3.1 People.
What is the Average Household Size in Dyer County
Average Household Size in Dyer County is 2.5 People.
What is Per Capita Income in Dyer County?
Per Capita income in Dyer County is $37,415.
What is the Median Family Income in Dyer County?
Median Family Income in Dyer County is $66,250.
What is the Median Household income in Dyer County?
Median Household Income in Dyer County is $53,150.
What is Income or Wage Gap in Dyer County?
Income or Wage Gap in Dyer County is 35.4%.
Women in Dyer County earn 64.6 cents for every dollar earned by a man.
What is Family Income Deficit in Dyer County?
Family Income Deficit in Dyer County is $10,729.
Families that are below poverty line in Dyer County earn $10,729 less on average than the poverty threshold level.
What is Inequality or Gini Index in Dyer County?
Inequality or Gini Index in Dyer County is 0.59.
How Large is the Labor Force in Dyer County?
There are 16,750 People in the Labor Forcein in Dyer County.
What is the Percentage of People in the Labor Force in Dyer County?
57.9% of People are in the Labor Force in Dyer County.
What is the Unemployment Rate in Dyer County?
Unemployment Rate in Dyer County is 4.5%.