Dickson County, TN
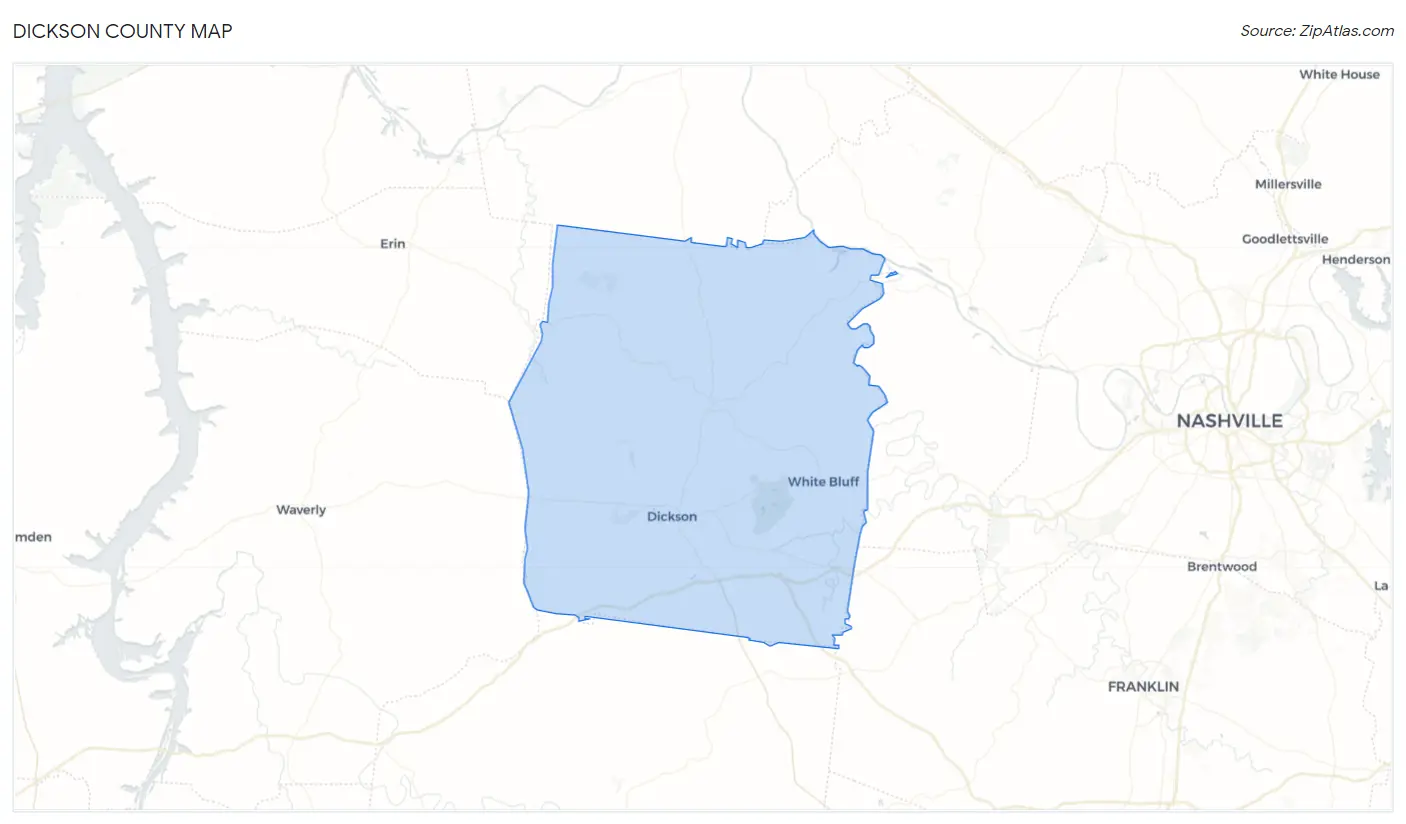
Dickson County Map
Dickson County Overview
54,563
TOTAL POPULATION
26,899
MALE POPULATION
27,664
FEMALE POPULATION
97.23
MALES / 100 FEMALES
102.84
FEMALES / 100 MALES
39.2
MEDIAN AGE
3.1
AVG FAMILY SIZE
2.6
AVG HOUSEHOLD SIZE
$33,582
PER CAPITA INCOME
$80,709
AVG FAMILY INCOME
$68,492
AVG HOUSEHOLD INCOME
26.7%
WAGE / INCOME GAP [ % ]
73.3¢/ $1
WAGE / INCOME GAP [ $ ]
$9,605
FAMILY INCOME DEFICIT
0.41
INEQUALITY / GINI INDEX
27,112
LABOR FORCE [ PEOPLE ]
62.3%
PERCENT IN LABOR FORCE
3.8%
UNEMPLOYMENT RATE
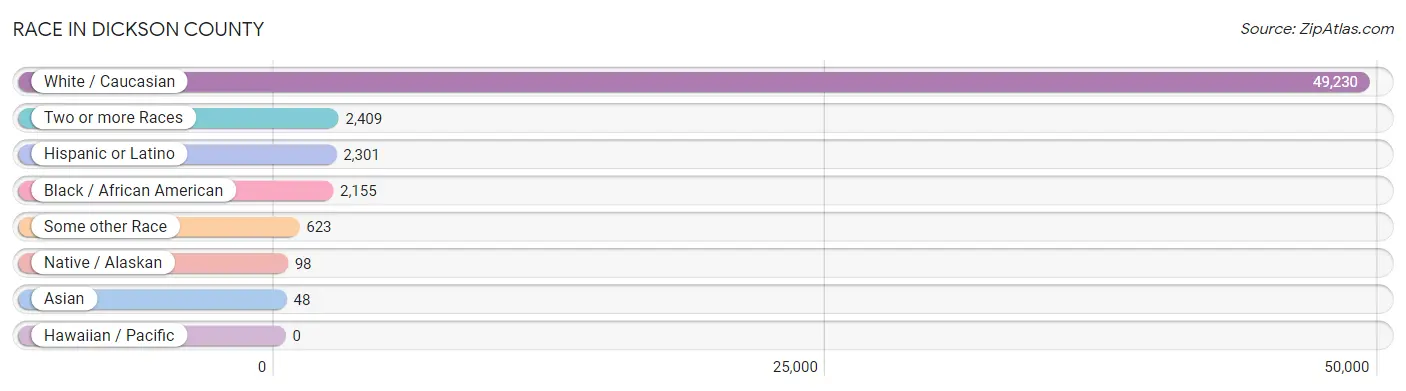
Race in Dickson County
The most populous races in Dickson County are White / Caucasian (49,230 | 90.2%), Two or more Races (2,409 | 4.4%), and Hispanic or Latino (2,301 | 4.2%).
| Race | # Population | % Population |
| Asian | 48 | 0.1% |
| Black / African American | 2,155 | 4.0% |
| Hawaiian / Pacific | 0 | 0.0% |
| Hispanic or Latino | 2,301 | 4.2% |
| Native / Alaskan | 98 | 0.2% |
| White / Caucasian | 49,230 | 90.2% |
| Two or more Races | 2,409 | 4.4% |
| Some other Race | 623 | 1.1% |
| Total | 54,563 | 100.0% |
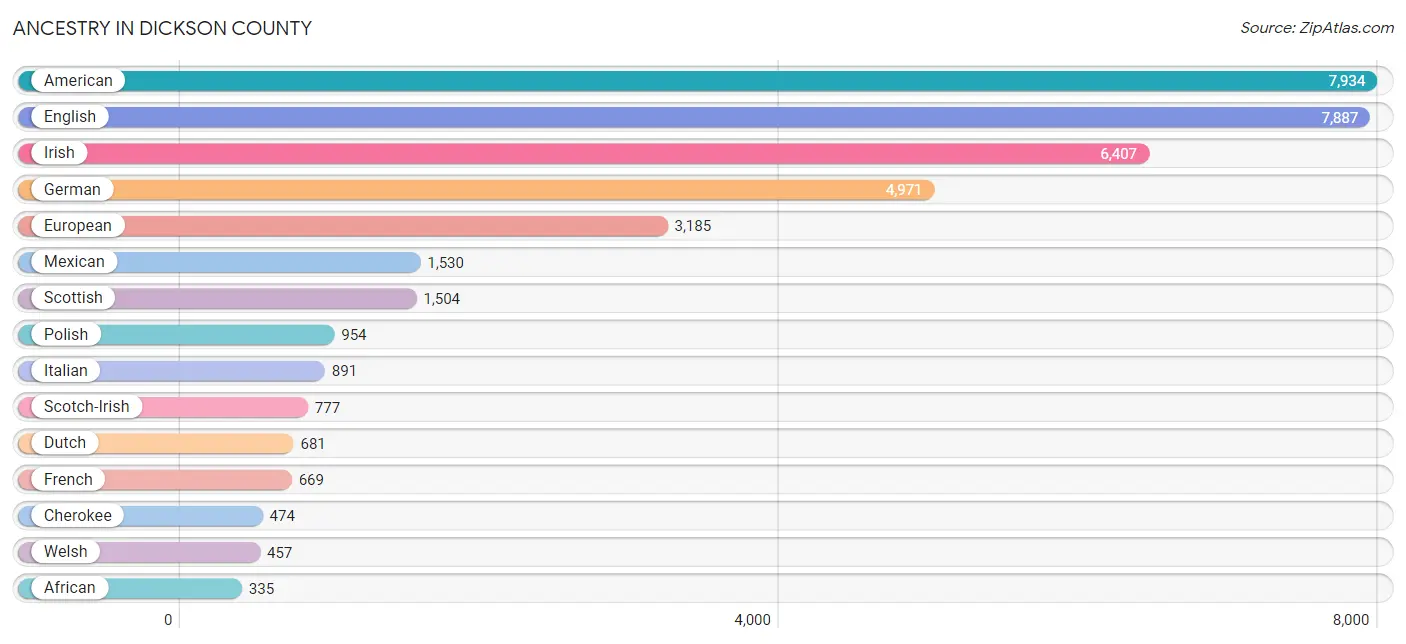
Ancestry in Dickson County
The most populous ancestries reported in Dickson County are American (7,934 | 14.5%), English (7,887 | 14.4%), Irish (6,407 | 11.7%), German (4,971 | 9.1%), and European (3,185 | 5.8%), together accounting for 55.7% of all Dickson County residents.
| Ancestry | # Population | % Population |
| African | 335 | 0.6% |
| Alsatian | 6 | 0.0% |
| American | 7,934 | 14.5% |
| Apache | 7 | 0.0% |
| Arab | 57 | 0.1% |
| Austrian | 27 | 0.1% |
| Bahamian | 22 | 0.0% |
| Bhutanese | 6 | 0.0% |
| Blackfeet | 14 | 0.0% |
| British | 239 | 0.4% |
| Canadian | 38 | 0.1% |
| Central American | 183 | 0.3% |
| Cherokee | 474 | 0.9% |
| Chickasaw | 11 | 0.0% |
| Chippewa | 3 | 0.0% |
| Choctaw | 26 | 0.1% |
| Colombian | 150 | 0.3% |
| Croatian | 5 | 0.0% |
| Cuban | 156 | 0.3% |
| Czech | 7 | 0.0% |
| Czechoslovakian | 10 | 0.0% |
| Danish | 189 | 0.4% |
| Dutch | 681 | 1.3% |
| Eastern European | 185 | 0.3% |
| English | 7,887 | 14.4% |
| European | 3,185 | 5.8% |
| French | 669 | 1.2% |
| French Canadian | 162 | 0.3% |
| German | 4,971 | 9.1% |
| Guamanian / Chamorro | 40 | 0.1% |
| Guatemalan | 100 | 0.2% |
| Hungarian | 199 | 0.4% |
| Indian (Asian) | 18 | 0.0% |
| Iranian | 20 | 0.0% |
| Irish | 6,407 | 11.7% |
| Italian | 891 | 1.6% |
| Korean | 55 | 0.1% |
| Lebanese | 43 | 0.1% |
| Lithuanian | 5 | 0.0% |
| Lumbee | 16 | 0.0% |
| Mexican | 1,530 | 2.8% |
| Navajo | 20 | 0.0% |
| Northern European | 52 | 0.1% |
| Norwegian | 261 | 0.5% |
| Pakistani | 13 | 0.0% |
| Pennsylvania German | 26 | 0.1% |
| Peruvian | 33 | 0.1% |
| Polish | 954 | 1.8% |
| Portuguese | 41 | 0.1% |
| Pueblo | 16 | 0.0% |
| Puerto Rican | 213 | 0.4% |
| Russian | 7 | 0.0% |
| Salvadoran | 83 | 0.2% |
| Scandinavian | 144 | 0.3% |
| Scotch-Irish | 777 | 1.4% |
| Scottish | 1,504 | 2.8% |
| Seminole | 12 | 0.0% |
| Serbian | 11 | 0.0% |
| Sioux | 10 | 0.0% |
| Slavic | 42 | 0.1% |
| Slovak | 11 | 0.0% |
| Slovene | 7 | 0.0% |
| South American | 190 | 0.4% |
| Spaniard | 7 | 0.0% |
| Spanish | 14 | 0.0% |
| Sri Lankan | 24 | 0.0% |
| Subsaharan African | 335 | 0.6% |
| Swedish | 236 | 0.4% |
| Swiss | 63 | 0.1% |
| Venezuelan | 7 | 0.0% |
| Welsh | 457 | 0.8% | View All 71 Rows |
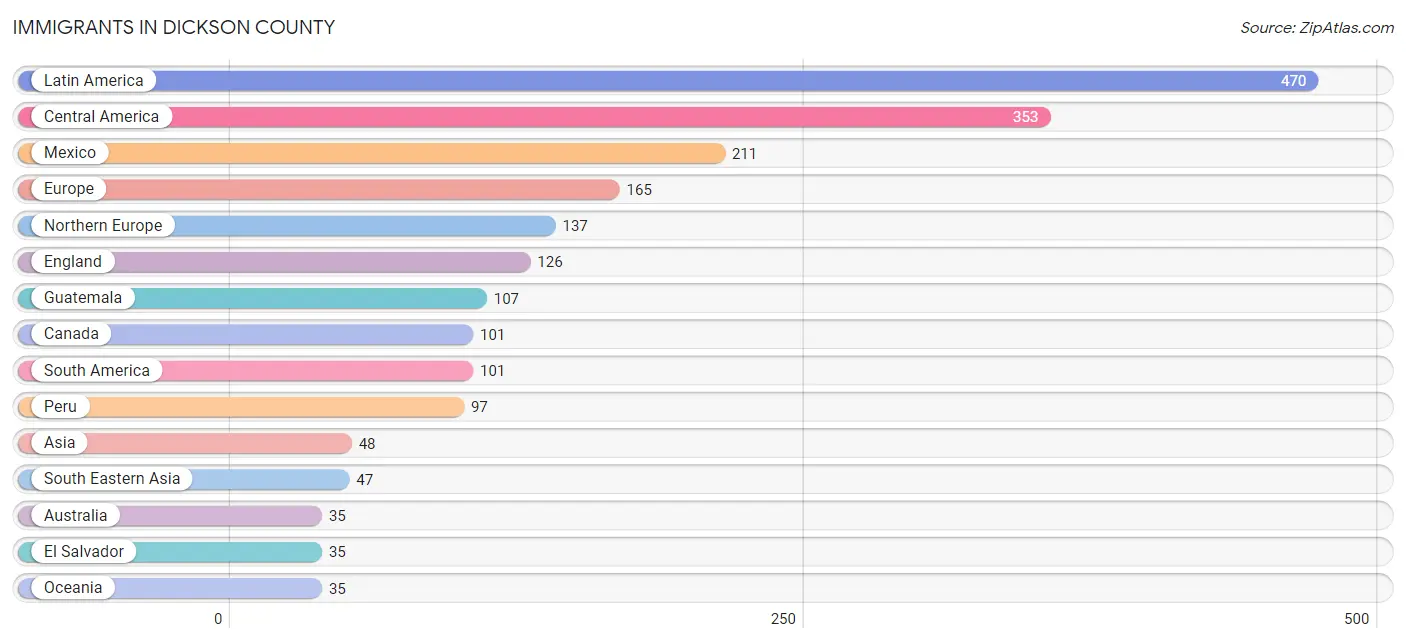
Immigrants in Dickson County
The most numerous immigrant groups reported in Dickson County came from Latin America (470 | 0.9%), Central America (353 | 0.6%), Mexico (211 | 0.4%), Europe (165 | 0.3%), and Northern Europe (137 | 0.3%), together accounting for 2.4% of all Dickson County residents.
| Immigration Origin | # Population | % Population |
| Africa | 22 | 0.0% |
| Asia | 48 | 0.1% |
| Australia | 35 | 0.1% |
| Cameroon | 22 | 0.0% |
| Canada | 101 | 0.2% |
| Caribbean | 16 | 0.0% |
| Central America | 353 | 0.6% |
| China | 1 | 0.0% |
| Croatia | 5 | 0.0% |
| Cuba | 16 | 0.0% |
| Eastern Asia | 1 | 0.0% |
| Eastern Europe | 5 | 0.0% |
| El Salvador | 35 | 0.1% |
| England | 126 | 0.2% |
| Europe | 165 | 0.3% |
| Germany | 11 | 0.0% |
| Guatemala | 107 | 0.2% |
| Latin America | 470 | 0.9% |
| Mexico | 211 | 0.4% |
| Middle Africa | 22 | 0.0% |
| Northern Europe | 137 | 0.3% |
| Oceania | 35 | 0.1% |
| Peru | 97 | 0.2% |
| Philippines | 23 | 0.0% |
| South America | 101 | 0.2% |
| South Eastern Asia | 47 | 0.1% |
| Sweden | 11 | 0.0% |
| Venezuela | 4 | 0.0% |
| Vietnam | 24 | 0.0% |
| Western Europe | 11 | 0.0% | View All 30 Rows |
Sex and Age in Dickson County
Sex and Age in Dickson County
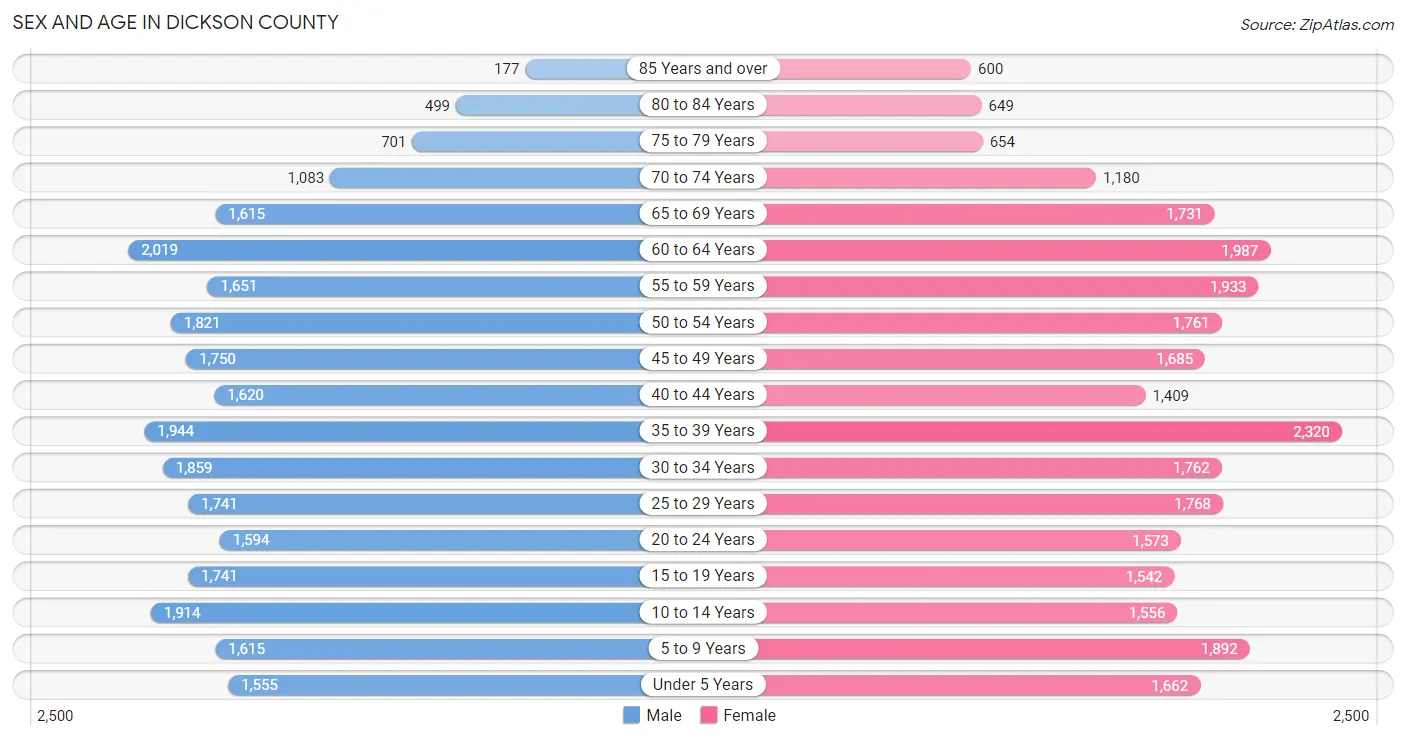
The most populous age groups in Dickson County are 60 to 64 Years (2,019 | 7.5%) for men and 35 to 39 Years (2,320 | 8.4%) for women.
| Age Bracket | Male | Female |
| Under 5 Years | 1,555 (5.8%) | 1,662 (6.0%) |
| 5 to 9 Years | 1,615 (6.0%) | 1,892 (6.8%) |
| 10 to 14 Years | 1,914 (7.1%) | 1,556 (5.6%) |
| 15 to 19 Years | 1,741 (6.5%) | 1,542 (5.6%) |
| 20 to 24 Years | 1,594 (5.9%) | 1,573 (5.7%) |
| 25 to 29 Years | 1,741 (6.5%) | 1,768 (6.4%) |
| 30 to 34 Years | 1,859 (6.9%) | 1,762 (6.4%) |
| 35 to 39 Years | 1,944 (7.2%) | 2,320 (8.4%) |
| 40 to 44 Years | 1,620 (6.0%) | 1,409 (5.1%) |
| 45 to 49 Years | 1,750 (6.5%) | 1,685 (6.1%) |
| 50 to 54 Years | 1,821 (6.8%) | 1,761 (6.4%) |
| 55 to 59 Years | 1,651 (6.1%) | 1,933 (7.0%) |
| 60 to 64 Years | 2,019 (7.5%) | 1,987 (7.2%) |
| 65 to 69 Years | 1,615 (6.0%) | 1,731 (6.3%) |
| 70 to 74 Years | 1,083 (4.0%) | 1,180 (4.3%) |
| 75 to 79 Years | 701 (2.6%) | 654 (2.4%) |
| 80 to 84 Years | 499 (1.9%) | 649 (2.4%) |
| 85 Years and over | 177 (0.7%) | 600 (2.2%) |
| Total | 26,899 (100.0%) | 27,664 (100.0%) |
Families and Households in Dickson County
Median Family Size in Dickson County
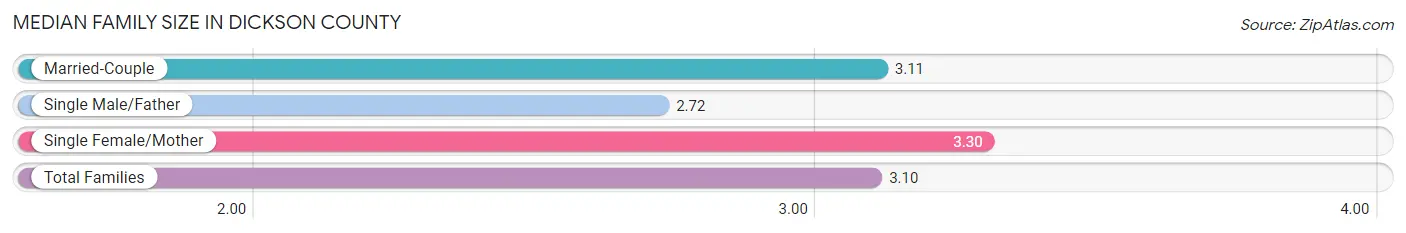
The median family size in Dickson County is 3.10 persons per family, with single female/mother families (1,980 | 13.9%) accounting for the largest median family size of 3.3 persons per family. On the other hand, single male/father families (1,286 | 9.0%) represent the smallest median family size with 2.72 persons per family.
| Family Type | # Families | Family Size |
| Married-Couple | 11,009 (77.1%) | 3.11 |
| Single Male/Father | 1,286 (9.0%) | 2.72 |
| Single Female/Mother | 1,980 (13.9%) | 3.30 |
| Total Families | 14,275 (100.0%) | 3.10 |
Median Household Size in Dickson County
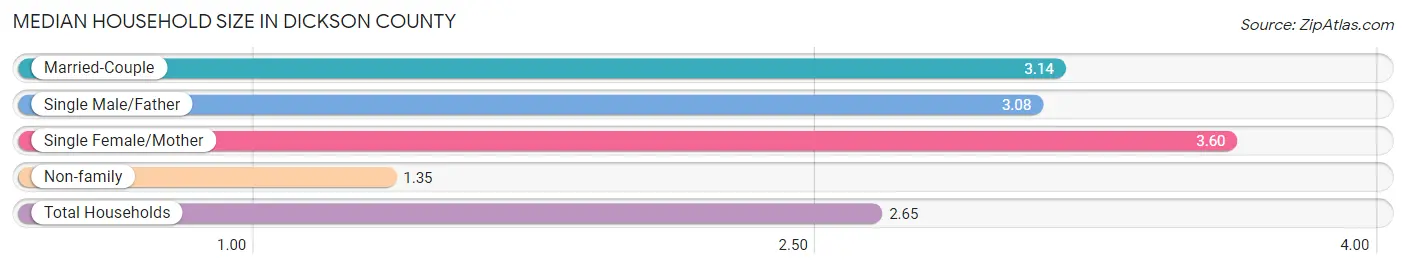
The median household size in Dickson County is 2.65 persons per household, with single female/mother households (1,980 | 9.7%) accounting for the largest median household size of 3.6 persons per household. non-family households (6,054 | 29.8%) represent the smallest median household size with 1.35 persons per household.
| Household Type | # Households | Household Size |
| Married-Couple | 11,009 (54.1%) | 3.14 |
| Single Male/Father | 1,286 (6.3%) | 3.08 |
| Single Female/Mother | 1,980 (9.7%) | 3.60 |
| Non-family | 6,054 (29.8%) | 1.35 |
| Total Households | 20,329 (100.0%) | 2.65 |
Household Size by Marriage Status in Dickson County
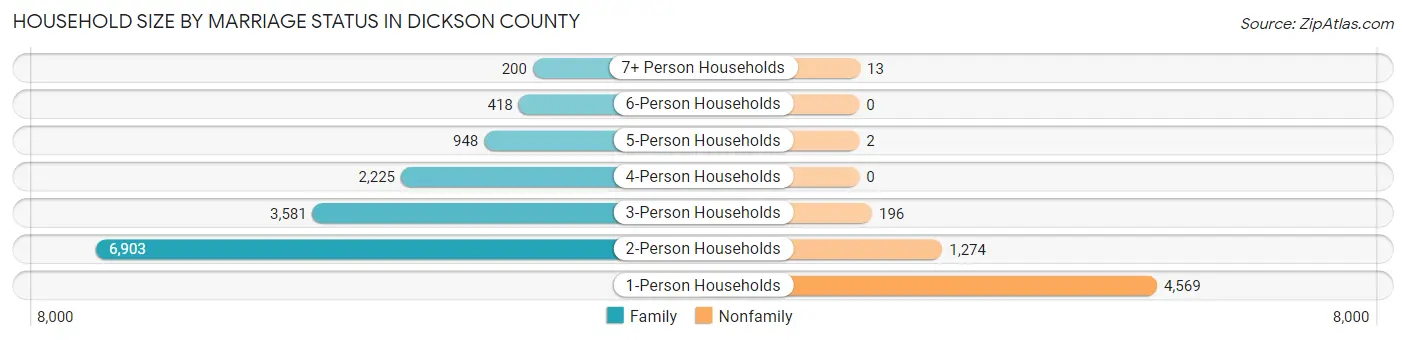
Out of a total of 20,329 households in Dickson County, 14,275 (70.2%) are family households, while 6,054 (29.8%) are nonfamily households. The most numerous type of family households are 2-person households, comprising 6,903, and the most common type of nonfamily households are 1-person households, comprising 4,569.
| Household Size | Family Households | Nonfamily Households |
| 1-Person Households | - | 4,569 (22.5%) |
| 2-Person Households | 6,903 (34.0%) | 1,274 (6.3%) |
| 3-Person Households | 3,581 (17.6%) | 196 (1.0%) |
| 4-Person Households | 2,225 (10.9%) | 0 (0.0%) |
| 5-Person Households | 948 (4.7%) | 2 (0.0%) |
| 6-Person Households | 418 (2.1%) | 0 (0.0%) |
| 7+ Person Households | 200 (1.0%) | 13 (0.1%) |
| Total | 14,275 (70.2%) | 6,054 (29.8%) |
Female Fertility in Dickson County
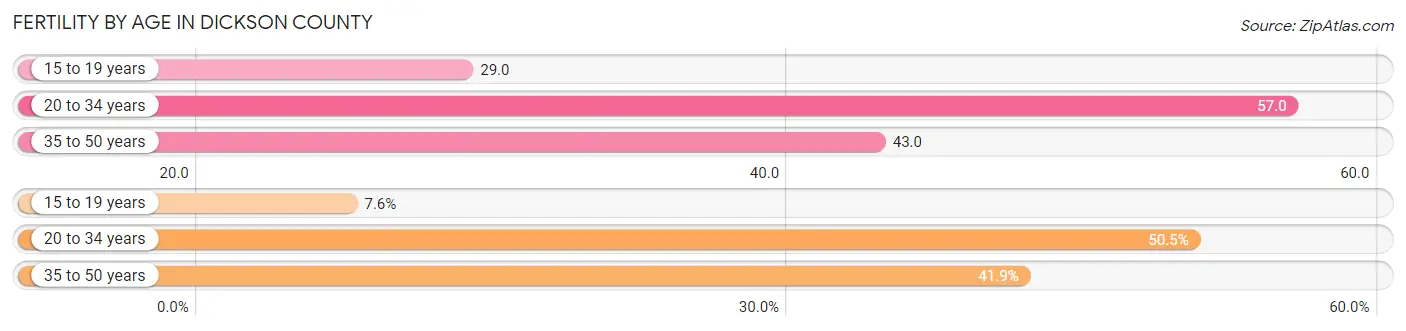
Fertility by Age in Dickson County
Average fertility rate in Dickson County is 47.0 births per 1,000 women. Women in the age bracket of 20 to 34 years have the highest fertility rate with 57.0 births per 1,000 women. Women in the age bracket of 20 to 34 years acount for 50.5% of all women with births.
| Age Bracket | Women with Births | Births / 1,000 Women |
| 15 to 19 years | 44 (7.6%) | 29.0 |
| 20 to 34 years | 292 (50.5%) | 57.0 |
| 35 to 50 years | 242 (41.9%) | 43.0 |
| Total | 578 (100.0%) | 47.0 |
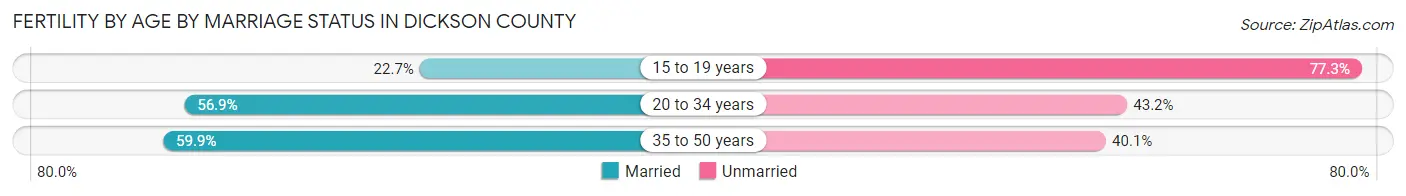
Fertility by Age by Marriage Status in Dickson County
55.5% of women with births (578) in Dickson County are married. The highest percentage of unmarried women with births falls into 15 to 19 years age bracket with 77.3% of them unmarried at the time of birth, while the lowest percentage of unmarried women with births belong to 35 to 50 years age bracket with 40.1% of them unmarried.
| Age Bracket | Married | Unmarried |
| 15 to 19 years | 10 (22.7%) | 34 (77.3%) |
| 20 to 34 years | 166 (56.9%) | 126 (43.1%) |
| 35 to 50 years | 145 (59.9%) | 97 (40.1%) |
| Total | 321 (55.5%) | 257 (44.5%) |
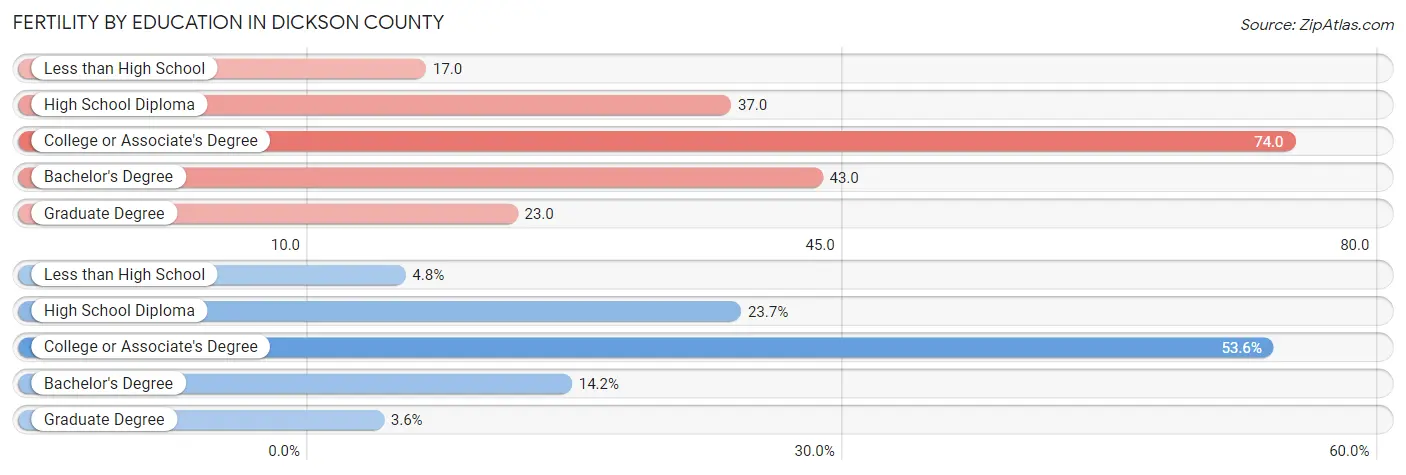
Fertility by Education in Dickson County
Average fertility rate in Dickson County is 47.0 births per 1,000 women. Women with the education attainment of college or associate's degree have the highest fertility rate of 74.0 births per 1,000 women, while women with the education attainment of less than high school have the lowest fertility at 17.0 births per 1,000 women. Women with the education attainment of college or associate's degree represent 53.6% of all women with births.
| Educational Attainment | Women with Births | Births / 1,000 Women |
| Less than High School | 28 (4.8%) | 17.0 |
| High School Diploma | 137 (23.7%) | 37.0 |
| College or Associate's Degree | 310 (53.6%) | 74.0 |
| Bachelor's Degree | 82 (14.2%) | 43.0 |
| Graduate Degree | 21 (3.6%) | 23.0 |
| Total | 578 (100.0%) | 47.0 |
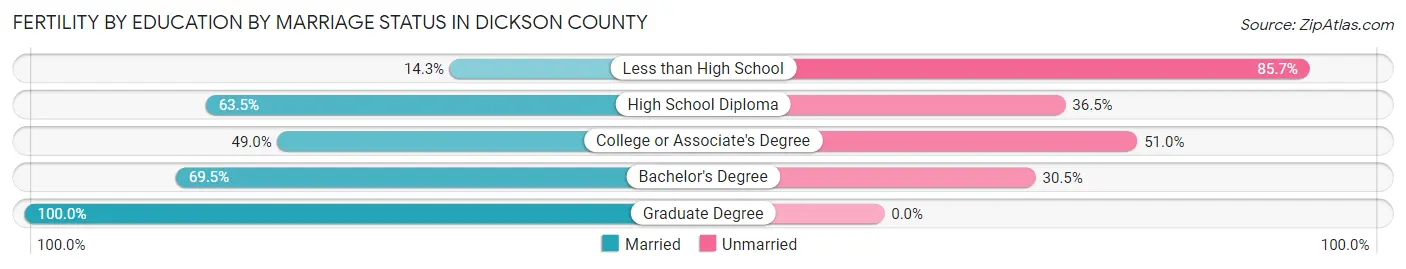
Fertility by Education by Marriage Status in Dickson County
44.5% of women with births in Dickson County are unmarried. Women with the educational attainment of graduate degree are most likely to be married with 100.0% of them married at childbirth, while women with the educational attainment of less than high school are least likely to be married with 85.7% of them unmarried at childbirth.
| Educational Attainment | Married | Unmarried |
| Less than High School | 4 (14.3%) | 24 (85.7%) |
| High School Diploma | 87 (63.5%) | 50 (36.5%) |
| College or Associate's Degree | 152 (49.0%) | 158 (51.0%) |
| Bachelor's Degree | 57 (69.5%) | 25 (30.5%) |
| Graduate Degree | 21 (100.0%) | 0 (0.0%) |
| Total | 321 (55.5%) | 257 (44.5%) |
Income in Dickson County
Income Overview in Dickson County
Per Capita Income in Dickson County is $33,582, while median incomes of families and households are $80,709 and $68,492 respectively.
| Characteristic | Number | Measure |
| Per Capita Income | 54,563 | $33,582 |
| Median Family Income | 14,275 | $80,709 |
| Mean Family Income | 14,275 | $97,798 |
| Median Household Income | 20,329 | $68,492 |
| Mean Household Income | 20,329 | $86,922 |
| Income Deficit | 14,275 | $9,605 |
| Wage / Income Gap (%) | 54,563 | 26.73% |
| Wage / Income Gap ($) | 54,563 | 73.27¢ per $1 |
| Gini / Inequality Index | 54,563 | 0.41 |
Earnings by Sex in Dickson County
Average Earnings in Dickson County are $41,151, $46,598 for men and $34,141 for women, a difference of 26.7%.
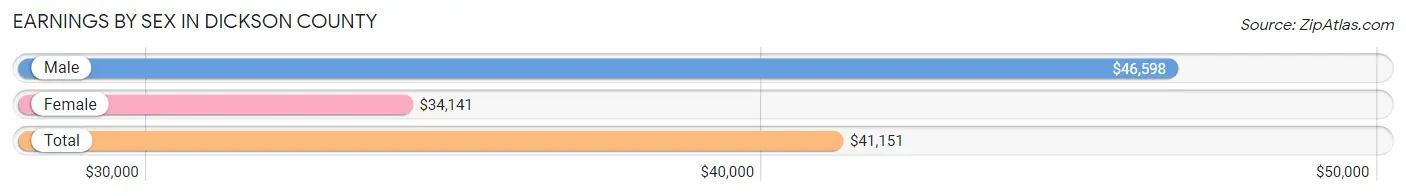
| Sex | Number | Average Earnings |
| Male | 15,109 (53.4%) | $46,598 |
| Female | 13,203 (46.6%) | $34,141 |
| Total | 28,312 (100.0%) | $41,151 |
Earnings by Sex by Income Bracket in Dickson County
The most common earnings brackets in Dickson County are $75,000 to $99,999 for men (1,762 | 11.7%) and $30,000 to $34,999 for women (1,384 | 10.5%).
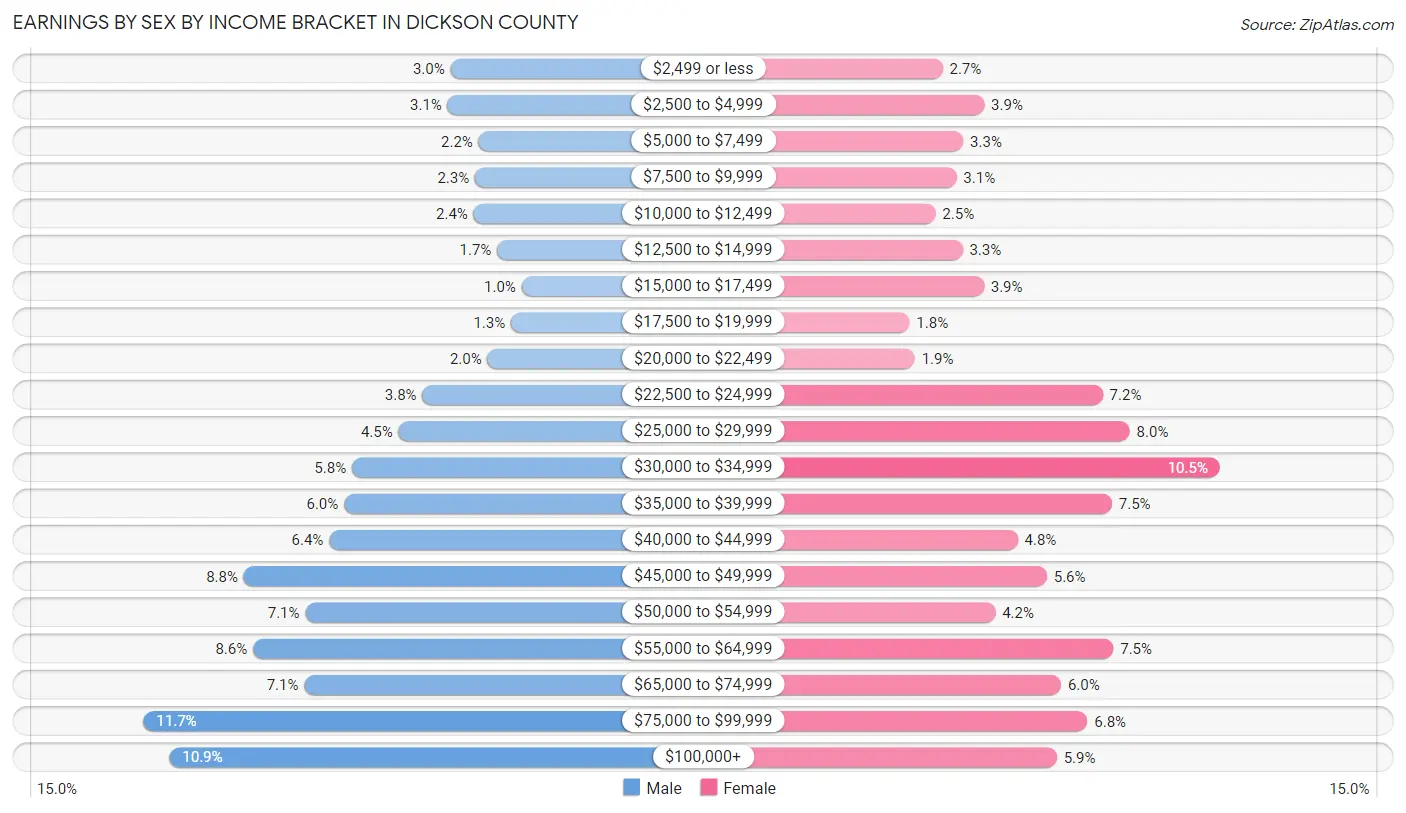
| Income | Male | Female |
| $2,499 or less | 458 (3.0%) | 355 (2.7%) |
| $2,500 to $4,999 | 470 (3.1%) | 510 (3.9%) |
| $5,000 to $7,499 | 339 (2.2%) | 432 (3.3%) |
| $7,500 to $9,999 | 354 (2.3%) | 407 (3.1%) |
| $10,000 to $12,499 | 359 (2.4%) | 329 (2.5%) |
| $12,500 to $14,999 | 260 (1.7%) | 429 (3.3%) |
| $15,000 to $17,499 | 155 (1.0%) | 508 (3.8%) |
| $17,500 to $19,999 | 201 (1.3%) | 233 (1.8%) |
| $20,000 to $22,499 | 300 (2.0%) | 252 (1.9%) |
| $22,500 to $24,999 | 577 (3.8%) | 949 (7.2%) |
| $25,000 to $29,999 | 679 (4.5%) | 1,050 (8.0%) |
| $30,000 to $34,999 | 877 (5.8%) | 1,384 (10.5%) |
| $35,000 to $39,999 | 909 (6.0%) | 983 (7.4%) |
| $40,000 to $44,999 | 973 (6.4%) | 634 (4.8%) |
| $45,000 to $49,999 | 1,335 (8.8%) | 742 (5.6%) |
| $50,000 to $54,999 | 1,074 (7.1%) | 550 (4.2%) |
| $55,000 to $64,999 | 1,296 (8.6%) | 989 (7.5%) |
| $65,000 to $74,999 | 1,079 (7.1%) | 795 (6.0%) |
| $75,000 to $99,999 | 1,762 (11.7%) | 893 (6.8%) |
| $100,000+ | 1,652 (10.9%) | 779 (5.9%) |
| Total | 15,109 (100.0%) | 13,203 (100.0%) |
Earnings by Sex by Educational Attainment in Dickson County
Average earnings in Dickson County are $50,637 for men and $37,625 for women, a difference of 25.7%. Men with an educational attainment of bachelor's degree enjoy the highest average annual earnings of $70,292, while those with less than high school education earn the least with $31,790. Women with an educational attainment of graduate degree earn the most with the average annual earnings of $76,250, while those with less than high school education have the smallest earnings of $31,549.
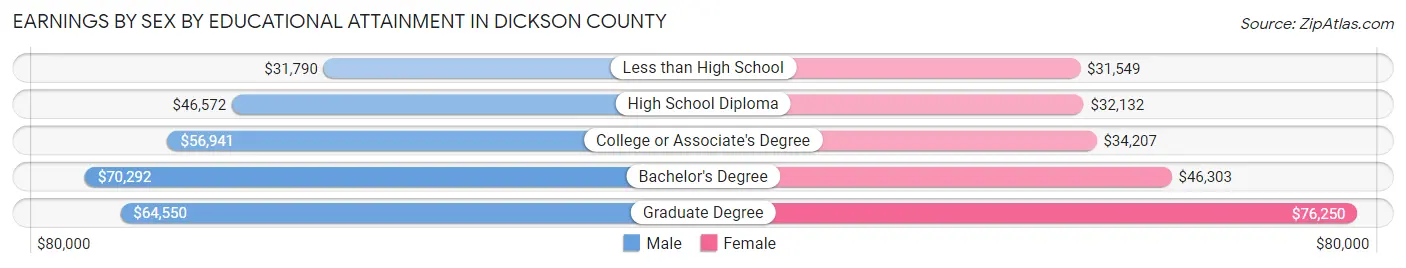
| Educational Attainment | Male Income | Female Income |
| Less than High School | $31,790 | $31,549 |
| High School Diploma | $46,572 | $32,132 |
| College or Associate's Degree | $56,941 | $34,207 |
| Bachelor's Degree | $70,292 | $46,303 |
| Graduate Degree | $64,550 | $76,250 |
| Total | $50,637 | $37,625 |
Family Income in Dickson County
Family Income Brackets in Dickson County
According to the Dickson County family income data, there are 3,540 families falling into the $50,000 to $74,999 income range, which is the most common income bracket and makes up 24.8% of all families. Conversely, the $10,000 to $14,999 income bracket is the least frequent group with only 300 families (2.1%) belonging to this category.
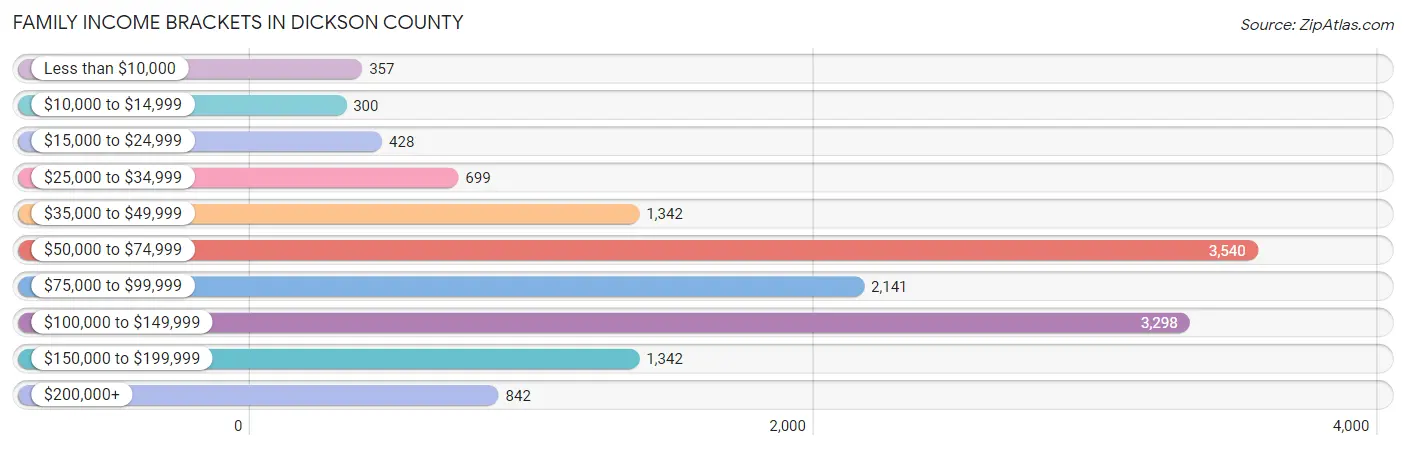
| Income Bracket | # Families | % Families |
| Less than $10,000 | 357 | 2.5% |
| $10,000 to $14,999 | 300 | 2.1% |
| $15,000 to $24,999 | 428 | 3.0% |
| $25,000 to $34,999 | 699 | 4.9% |
| $35,000 to $49,999 | 1,342 | 9.4% |
| $50,000 to $74,999 | 3,540 | 24.8% |
| $75,000 to $99,999 | 2,141 | 15.0% |
| $100,000 to $149,999 | 3,298 | 23.1% |
| $150,000 to $199,999 | 1,342 | 9.4% |
| $200,000+ | 842 | 5.9% |
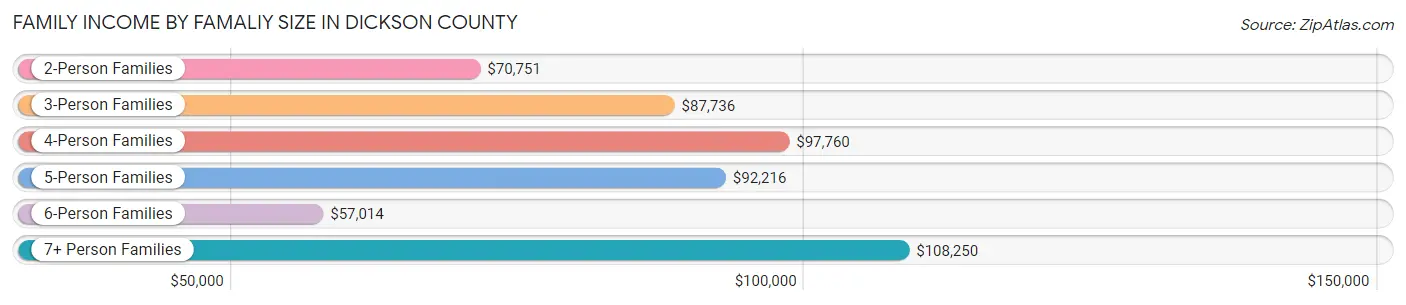
Family Income by Famaliy Size in Dickson County
7+ person families (190 | 1.3%) account for the highest median family income in Dickson County with $108,250 per family, while 2-person families (7,478 | 52.4%) have the highest median income of $35,376 per family member.
| Income Bracket | # Families | Median Income |
| 2-Person Families | 7,478 (52.4%) | $70,751 |
| 3-Person Families | 3,358 (23.5%) | $87,736 |
| 4-Person Families | 1,978 (13.9%) | $97,760 |
| 5-Person Families | 967 (6.8%) | $92,216 |
| 6-Person Families | 304 (2.1%) | $57,014 |
| 7+ Person Families | 190 (1.3%) | $108,250 |
| Total | 14,275 (100.0%) | $80,709 |
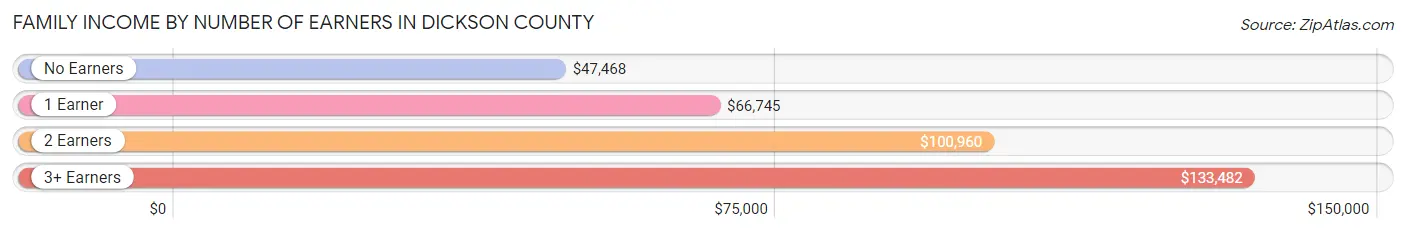
Family Income by Number of Earners in Dickson County
The median family income in Dickson County is $80,709, with families comprising 3+ earners (1,265) having the highest median family income of $133,482, while families with no earners (2,144) have the lowest median family income of $47,468, accounting for 8.9% and 15.0% of families, respectively.
| Number of Earners | # Families | Median Income |
| No Earners | 2,144 (15.0%) | $47,468 |
| 1 Earner | 4,577 (32.1%) | $66,745 |
| 2 Earners | 6,289 (44.1%) | $100,960 |
| 3+ Earners | 1,265 (8.9%) | $133,482 |
| Total | 14,275 (100.0%) | $80,709 |
Household Income in Dickson County
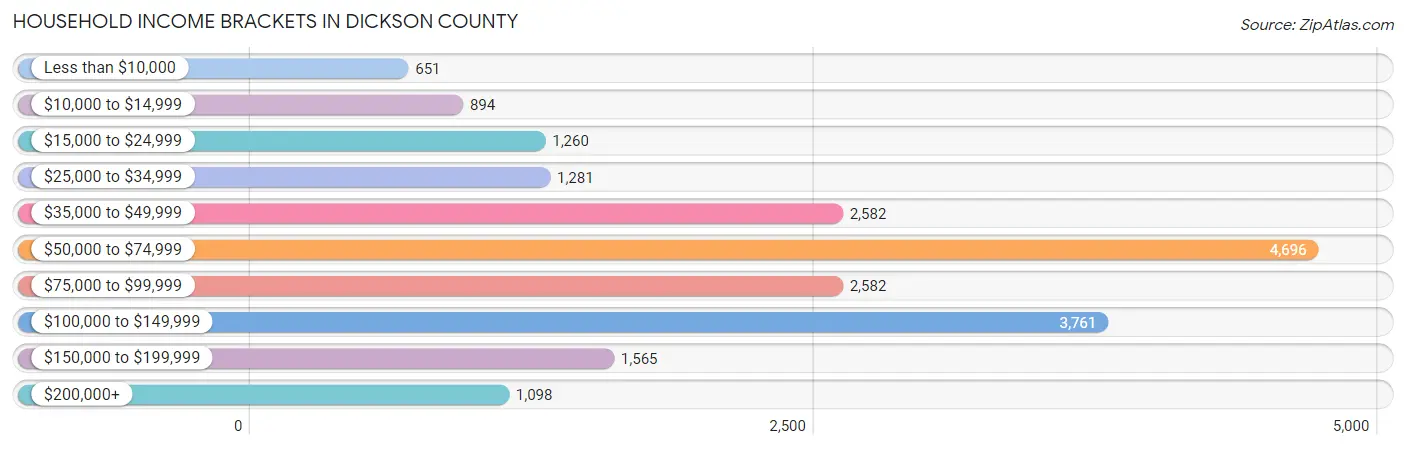
Household Income Brackets in Dickson County
With 4,696 households falling in the category, the $50,000 to $74,999 income range is the most frequent in Dickson County, accounting for 23.1% of all households. In contrast, only 651 households (3.2%) fall into the less than $10,000 income bracket, making it the least populous group.
| Income Bracket | # Households | % Households |
| Less than $10,000 | 651 | 3.2% |
| $10,000 to $14,999 | 894 | 4.4% |
| $15,000 to $24,999 | 1,260 | 6.2% |
| $25,000 to $34,999 | 1,281 | 6.3% |
| $35,000 to $49,999 | 2,582 | 12.7% |
| $50,000 to $74,999 | 4,696 | 23.1% |
| $75,000 to $99,999 | 2,582 | 12.7% |
| $100,000 to $149,999 | 3,761 | 18.5% |
| $150,000 to $199,999 | 1,565 | 7.7% |
| $200,000+ | 1,098 | 5.4% |
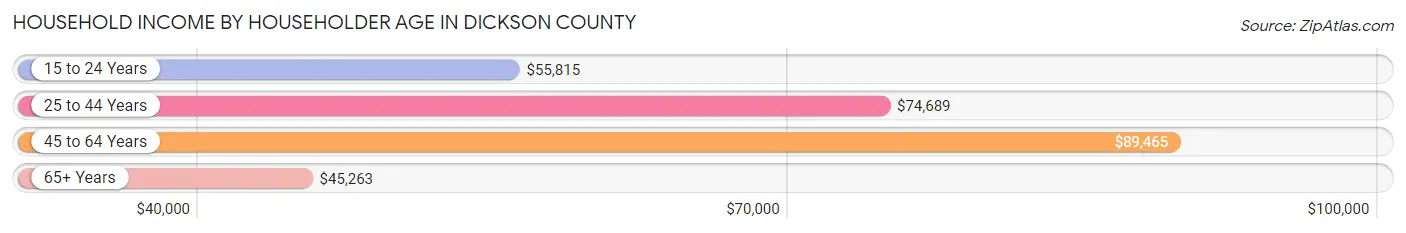
Household Income by Householder Age in Dickson County
The median household income in Dickson County is $68,492, with the highest median household income of $89,465 found in the 45 to 64 years age bracket for the primary householder. A total of 8,075 households (39.7%) fall into this category. Meanwhile, the 65+ years age bracket for the primary householder has the lowest median household income of $45,263, with 5,412 households (26.6%) in this group.
| Income Bracket | # Households | Median Income |
| 15 to 24 Years | 485 (2.4%) | $55,815 |
| 25 to 44 Years | 6,357 (31.3%) | $74,689 |
| 45 to 64 Years | 8,075 (39.7%) | $89,465 |
| 65+ Years | 5,412 (26.6%) | $45,263 |
| Total | 20,329 (100.0%) | $68,492 |
Poverty in Dickson County
Income Below Poverty by Sex and Age in Dickson County
With 9.4% poverty level for males and 12.2% for females among the residents of Dickson County, 5 year old males and 5 year old females are the most vulnerable to poverty, with 49 males (28.0%) and 128 females (29.8%) in their respective age groups living below the poverty level.
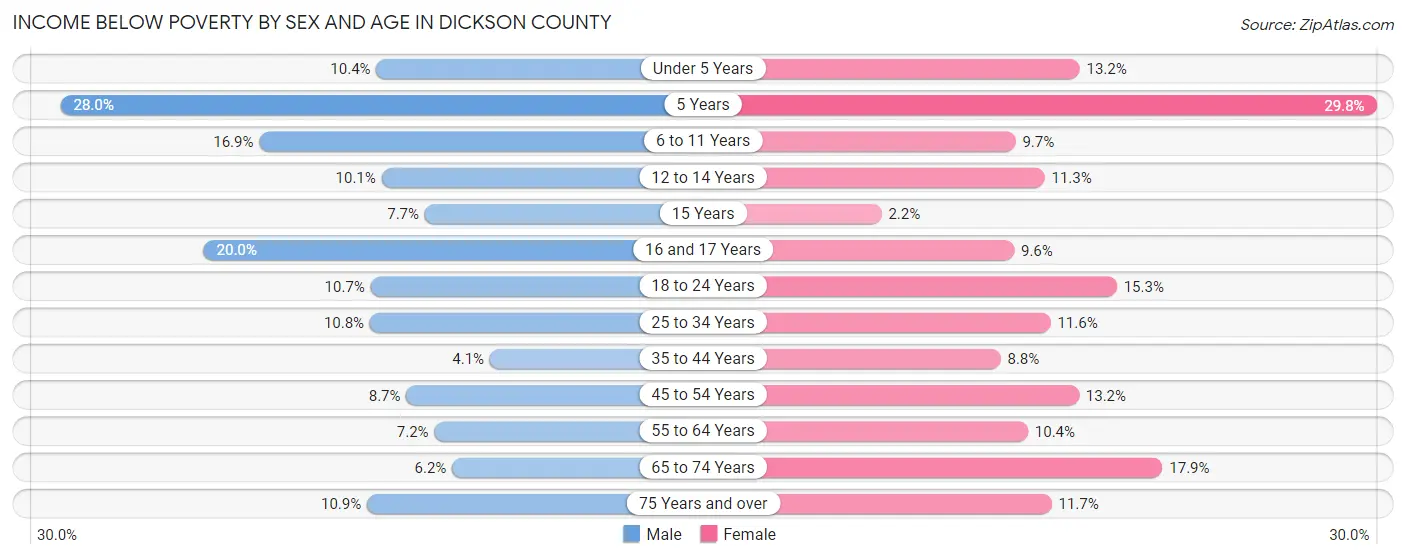
| Age Bracket | Male | Female |
| Under 5 Years | 152 (10.4%) | 214 (13.2%) |
| 5 Years | 49 (28.0%) | 128 (29.8%) |
| 6 to 11 Years | 384 (16.9%) | 202 (9.7%) |
| 12 to 14 Years | 102 (10.1%) | 91 (11.3%) |
| 15 Years | 34 (7.7%) | 9 (2.2%) |
| 16 and 17 Years | 129 (20.0%) | 65 (9.6%) |
| 18 to 24 Years | 236 (10.7%) | 309 (15.3%) |
| 25 to 34 Years | 384 (10.8%) | 405 (11.6%) |
| 35 to 44 Years | 143 (4.1%) | 327 (8.8%) |
| 45 to 54 Years | 311 (8.7%) | 455 (13.2%) |
| 55 to 64 Years | 262 (7.2%) | 405 (10.4%) |
| 65 to 74 Years | 166 (6.2%) | 519 (17.8%) |
| 75 Years and over | 148 (10.9%) | 220 (11.7%) |
| Total | 2,500 (9.4%) | 3,349 (12.2%) |
Income Above Poverty by Sex and Age in Dickson County
According to the poverty statistics in Dickson County, males aged 35 to 44 years and females aged 15 years are the age groups that are most secure financially, with 95.9% of males and 97.8% of females in these age groups living above the poverty line.
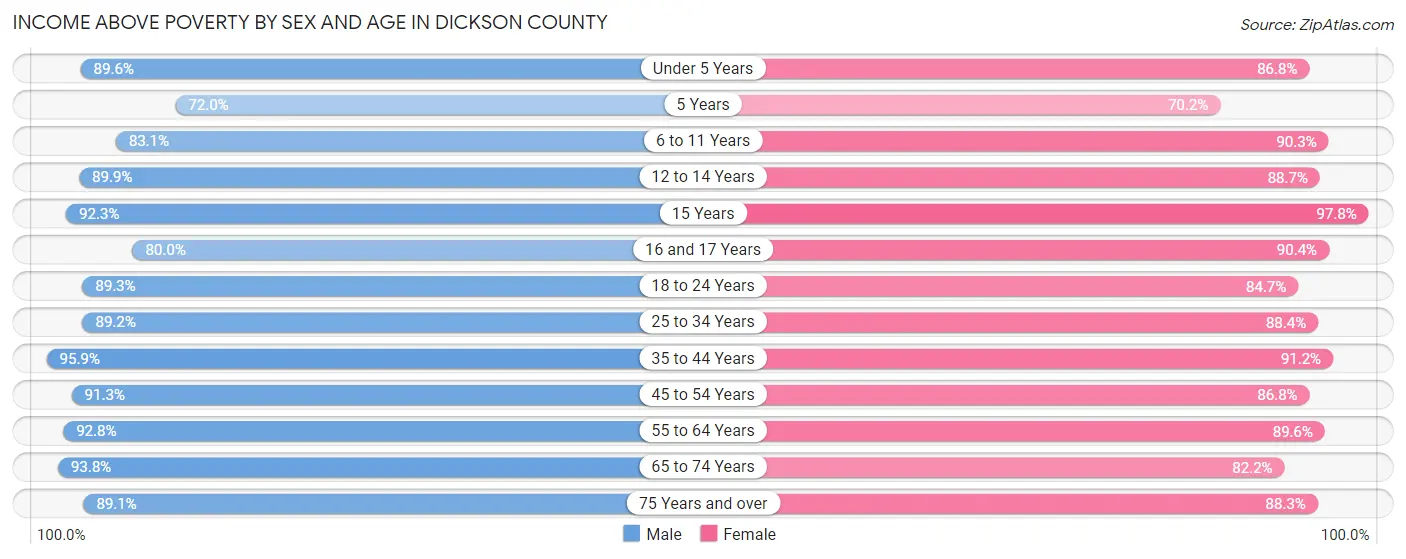
| Age Bracket | Male | Female |
| Under 5 Years | 1,308 (89.6%) | 1,402 (86.8%) |
| 5 Years | 126 (72.0%) | 302 (70.2%) |
| 6 to 11 Years | 1,884 (83.1%) | 1,887 (90.3%) |
| 12 to 14 Years | 906 (89.9%) | 715 (88.7%) |
| 15 Years | 407 (92.3%) | 398 (97.8%) |
| 16 and 17 Years | 515 (80.0%) | 613 (90.4%) |
| 18 to 24 Years | 1,964 (89.3%) | 1,709 (84.7%) |
| 25 to 34 Years | 3,181 (89.2%) | 3,081 (88.4%) |
| 35 to 44 Years | 3,353 (95.9%) | 3,374 (91.2%) |
| 45 to 54 Years | 3,246 (91.3%) | 2,991 (86.8%) |
| 55 to 64 Years | 3,385 (92.8%) | 3,504 (89.6%) |
| 65 to 74 Years | 2,515 (93.8%) | 2,388 (82.2%) |
| 75 Years and over | 1,206 (89.1%) | 1,664 (88.3%) |
| Total | 23,996 (90.6%) | 24,028 (87.8%) |
Income Below Poverty Among Married-Couple Families in Dickson County
The poverty statistics for married-couple families in Dickson County show that 5.2% or 568 of the total 11,009 families live below the poverty line. Families with 3 or 4 children have the highest poverty rate of 16.6%, comprising of 101 families. On the other hand, families with 5 or more children have the lowest poverty rate of 0.0%, which includes 0 families.
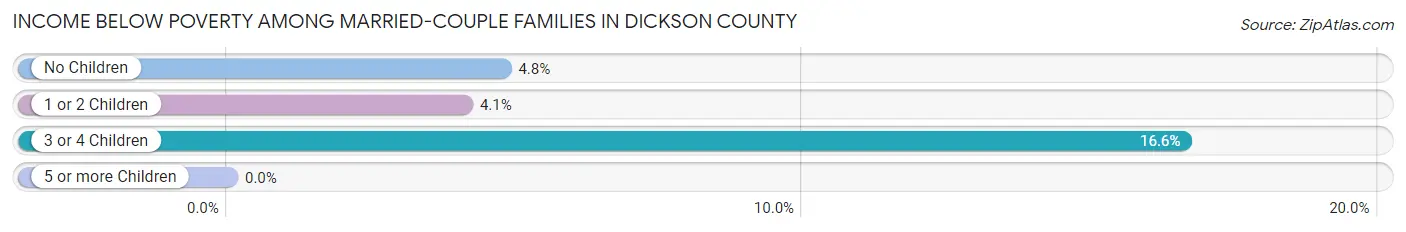
| Children | Above Poverty | Below Poverty |
| No Children | 6,324 (95.2%) | 316 (4.8%) |
| 1 or 2 Children | 3,537 (95.9%) | 151 (4.1%) |
| 3 or 4 Children | 507 (83.4%) | 101 (16.6%) |
| 5 or more Children | 73 (100.0%) | 0 (0.0%) |
| Total | 10,441 (94.8%) | 568 (5.2%) |
Income Below Poverty Among Single-Parent Households in Dickson County
According to the poverty data in Dickson County, 5.8% or 74 single-father households and 23.0% or 455 single-mother households are living below the poverty line. Among single-father households, those with 1 or 2 children have the highest poverty rate, with 38 households (6.5%) experiencing poverty. Likewise, among single-mother households, those with 3 or 4 children have the highest poverty rate, with 79 households (54.5%) falling below the poverty line.
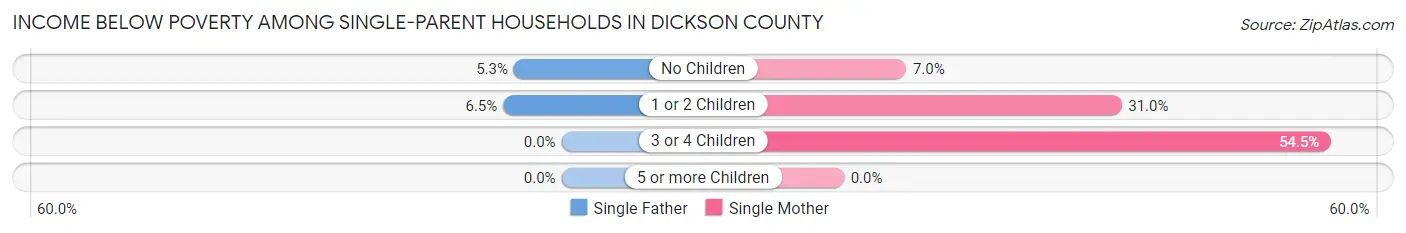
| Children | Single Father | Single Mother |
| No Children | 36 (5.3%) | 53 (7.0%) |
| 1 or 2 Children | 38 (6.5%) | 323 (31.0%) |
| 3 or 4 Children | 0 (0.0%) | 79 (54.5%) |
| 5 or more Children | 0 (0.0%) | 0 (0.0%) |
| Total | 74 (5.8%) | 455 (23.0%) |
Income Below Poverty Among Married-Couple vs Single-Parent Households in Dickson County
The poverty data for Dickson County shows that 568 of the married-couple family households (5.2%) and 529 of the single-parent households (16.2%) are living below the poverty level. Within the married-couple family households, those with 3 or 4 children have the highest poverty rate, with 101 households (16.6%) falling below the poverty line. Among the single-parent households, those with 3 or 4 children have the highest poverty rate, with 79 household (45.9%) living below poverty.
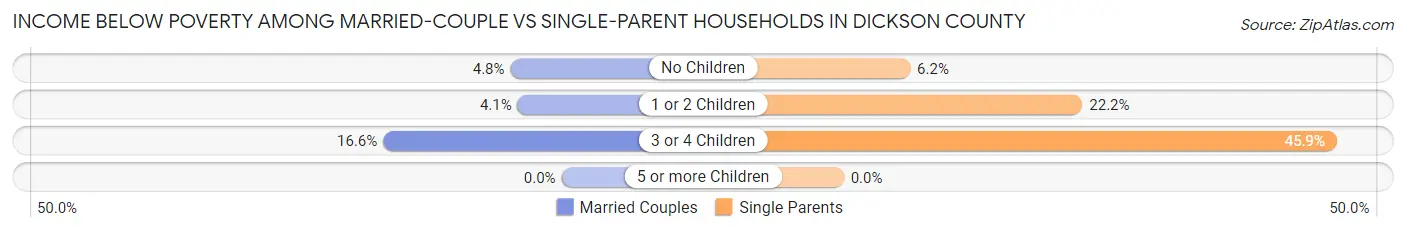
| Children | Married-Couple Families | Single-Parent Households |
| No Children | 316 (4.8%) | 89 (6.2%) |
| 1 or 2 Children | 151 (4.1%) | 361 (22.2%) |
| 3 or 4 Children | 101 (16.6%) | 79 (45.9%) |
| 5 or more Children | 0 (0.0%) | 0 (0.0%) |
| Total | 568 (5.2%) | 529 (16.2%) |
Employment Characteristics in Dickson County
Employment by Class of Employer in Dickson County
Among the 25,497 employed individuals in Dickson County, private company employees (18,236 | 71.5%), self-employed (not incorporated) (1,826 | 7.2%), and local government employees (1,720 | 6.8%) make up the most common classes of employment.
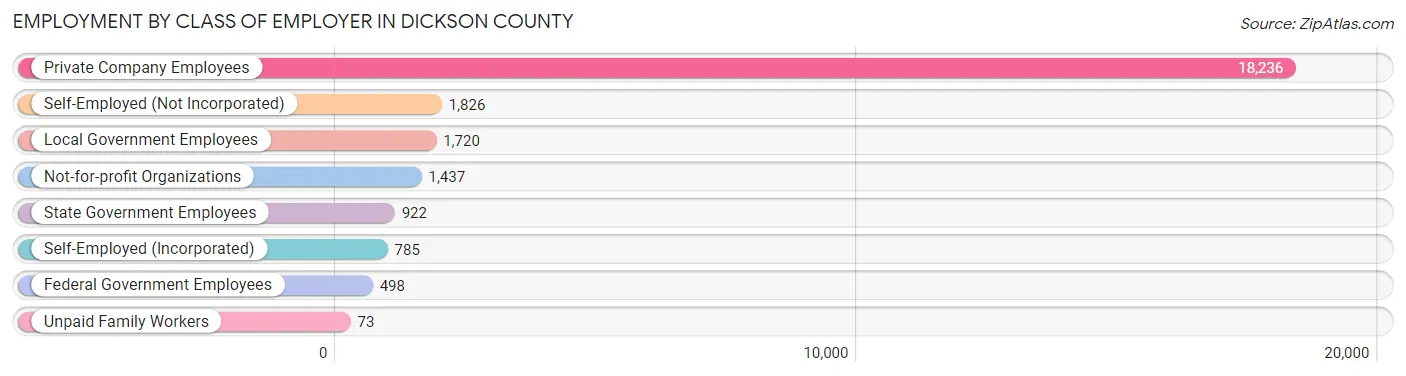
| Employer Class | # Employees | % Employees |
| Private Company Employees | 18,236 | 71.5% |
| Self-Employed (Incorporated) | 785 | 3.1% |
| Self-Employed (Not Incorporated) | 1,826 | 7.2% |
| Not-for-profit Organizations | 1,437 | 5.6% |
| Local Government Employees | 1,720 | 6.8% |
| State Government Employees | 922 | 3.6% |
| Federal Government Employees | 498 | 1.9% |
| Unpaid Family Workers | 73 | 0.3% |
| Total | 25,497 | 100.0% |
Employment Status by Age in Dickson County
According to the labor force statistics for Dickson County, out of the total population over 16 years of age (43,519), 62.3% or 27,112 individuals are in the labor force, with 3.8% or 1,030 of them unemployed. The age group with the highest labor force participation rate is 25 to 29 years, with 85.6% or 3,004 individuals in the labor force. Within the labor force, the 16 to 19 years age range has the highest percentage of unemployed individuals, with 12.4% or 122 of them being unemployed.
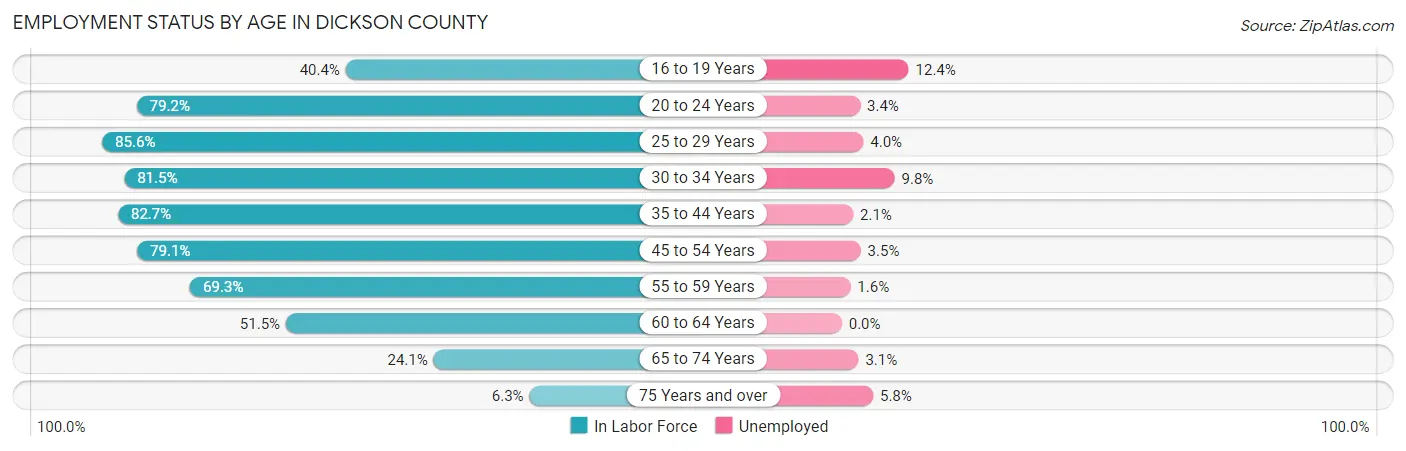
| Age Bracket | In Labor Force | Unemployed |
| 16 to 19 Years | 983 (40.4%) | 122 (12.4%) |
| 20 to 24 Years | 2,508 (79.2%) | 85 (3.4%) |
| 25 to 29 Years | 3,004 (85.6%) | 120 (4.0%) |
| 30 to 34 Years | 2,951 (81.5%) | 289 (9.8%) |
| 35 to 44 Years | 6,031 (82.7%) | 127 (2.1%) |
| 45 to 54 Years | 5,550 (79.1%) | 194 (3.5%) |
| 55 to 59 Years | 2,484 (69.3%) | 40 (1.6%) |
| 60 to 64 Years | 2,063 (51.5%) | 0 (0.0%) |
| 65 to 74 Years | 1,352 (24.1%) | 42 (3.1%) |
| 75 Years and over | 207 (6.3%) | 12 (5.8%) |
| Total | 27,112 (62.3%) | 1,030 (3.8%) |
Employment Status by Educational Attainment in Dickson County
According to labor force statistics for Dickson County, 76.1% of individuals (22,092) out of the total population between 25 and 64 years of age (29,030) are in the labor force, with 3.5% or 773 of them being unemployed. The group with the highest labor force participation rate are those with the educational attainment of bachelor's degree or higher, with 84.2% or 4,997 individuals in the labor force. Within the labor force, individuals with college / associate degree education have the highest percentage of unemployment, with 4.9% or 386 of them being unemployed.
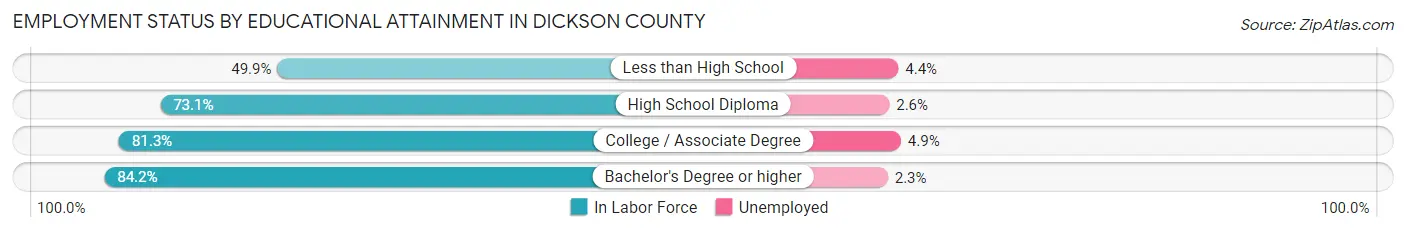
| Educational Attainment | In Labor Force | Unemployed |
| Less than High School | 1,280 (49.9%) | 113 (4.4%) |
| High School Diploma | 7,927 (73.1%) | 282 (2.6%) |
| College / Associate Degree | 7,875 (81.3%) | 475 (4.9%) |
| Bachelor's Degree or higher | 4,997 (84.2%) | 137 (2.3%) |
| Total | 22,092 (76.1%) | 1,016 (3.5%) |
Employment Occupations by Sex in Dickson County
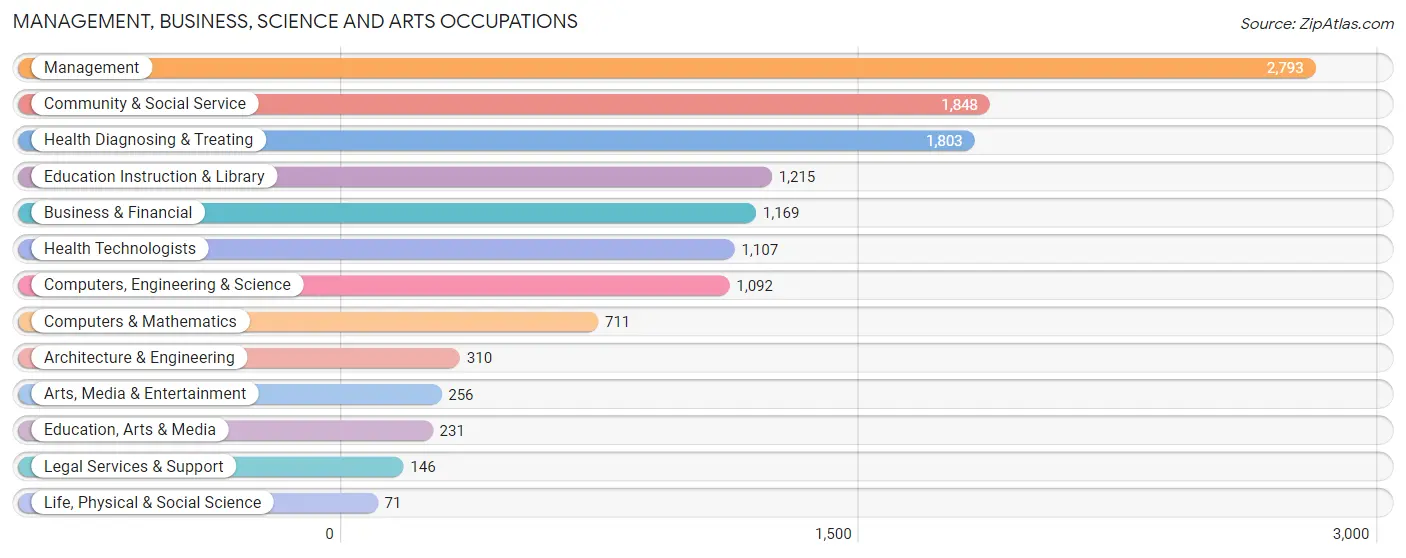
Management, Business, Science and Arts Occupations
The most common Management, Business, Science and Arts occupations in Dickson County are Management (2,793 | 10.7%), Community & Social Service (1,848 | 7.1%), Health Diagnosing & Treating (1,803 | 6.9%), Education Instruction & Library (1,215 | 4.7%), and Business & Financial (1,169 | 4.5%).
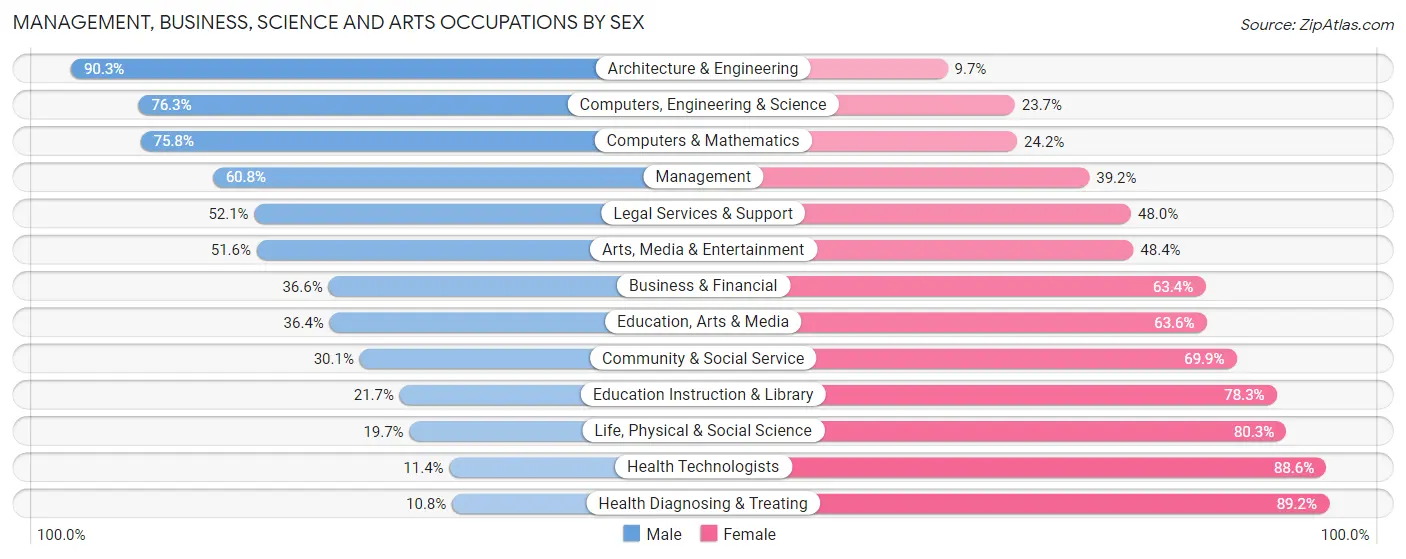
Management, Business, Science and Arts Occupations by Sex
Within the Management, Business, Science and Arts occupations in Dickson County, the most male-oriented occupations are Architecture & Engineering (90.3%), Computers, Engineering & Science (76.3%), and Computers & Mathematics (75.8%), while the most female-oriented occupations are Health Diagnosing & Treating (89.2%), Health Technologists (88.6%), and Life, Physical & Social Science (80.3%).
| Occupation | Male | Female |
| Management | 1,697 (60.8%) | 1,096 (39.2%) |
| Business & Financial | 428 (36.6%) | 741 (63.4%) |
| Computers, Engineering & Science | 833 (76.3%) | 259 (23.7%) |
| Computers & Mathematics | 539 (75.8%) | 172 (24.2%) |
| Architecture & Engineering | 280 (90.3%) | 30 (9.7%) |
| Life, Physical & Social Science | 14 (19.7%) | 57 (80.3%) |
| Community & Social Service | 556 (30.1%) | 1,292 (69.9%) |
| Education, Arts & Media | 84 (36.4%) | 147 (63.6%) |
| Legal Services & Support | 76 (52.0%) | 70 (47.9%) |
| Education Instruction & Library | 264 (21.7%) | 951 (78.3%) |
| Arts, Media & Entertainment | 132 (51.6%) | 124 (48.4%) |
| Health Diagnosing & Treating | 195 (10.8%) | 1,608 (89.2%) |
| Health Technologists | 126 (11.4%) | 981 (88.6%) |
| Total (Category) | 3,709 (42.6%) | 4,996 (57.4%) |
| Total (Overall) | 13,879 (53.2%) | 12,199 (46.8%) |
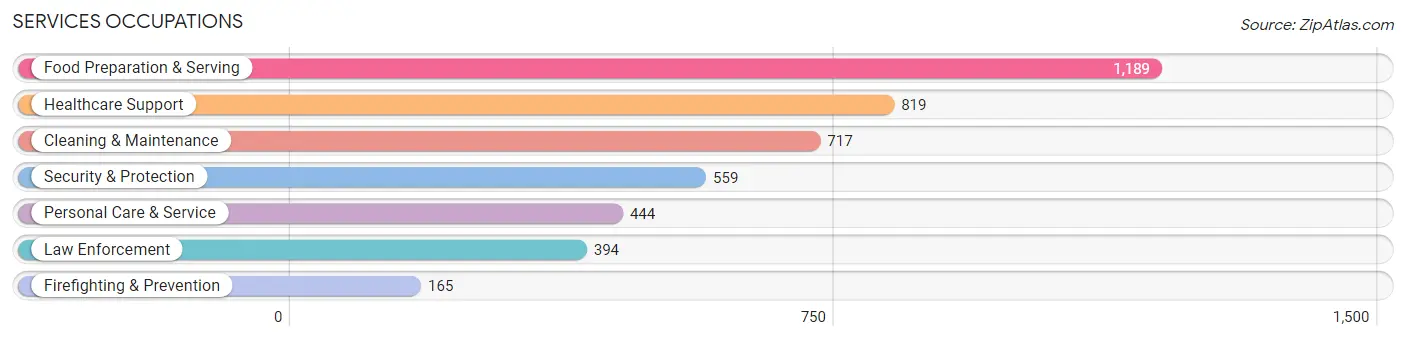
Services Occupations
The most common Services occupations in Dickson County are Food Preparation & Serving (1,189 | 4.6%), Healthcare Support (819 | 3.1%), Cleaning & Maintenance (717 | 2.8%), Security & Protection (559 | 2.1%), and Personal Care & Service (444 | 1.7%).
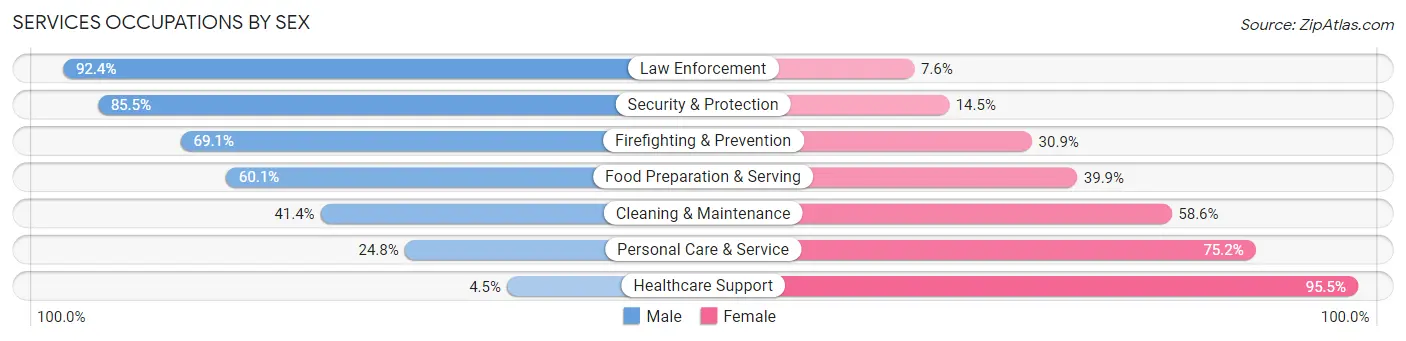
Services Occupations by Sex
Within the Services occupations in Dickson County, the most male-oriented occupations are Law Enforcement (92.4%), Security & Protection (85.5%), and Firefighting & Prevention (69.1%), while the most female-oriented occupations are Healthcare Support (95.5%), Personal Care & Service (75.2%), and Cleaning & Maintenance (58.6%).
| Occupation | Male | Female |
| Healthcare Support | 37 (4.5%) | 782 (95.5%) |
| Security & Protection | 478 (85.5%) | 81 (14.5%) |
| Firefighting & Prevention | 114 (69.1%) | 51 (30.9%) |
| Law Enforcement | 364 (92.4%) | 30 (7.6%) |
| Food Preparation & Serving | 715 (60.1%) | 474 (39.9%) |
| Cleaning & Maintenance | 297 (41.4%) | 420 (58.6%) |
| Personal Care & Service | 110 (24.8%) | 334 (75.2%) |
| Total (Category) | 1,637 (43.9%) | 2,091 (56.1%) |
| Total (Overall) | 13,879 (53.2%) | 12,199 (46.8%) |
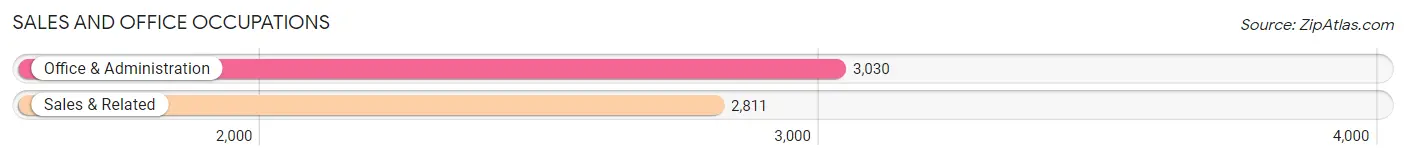
Sales and Office Occupations
The most common Sales and Office occupations in Dickson County are Office & Administration (3,030 | 11.6%), and Sales & Related (2,811 | 10.8%).
Sales and Office Occupations by Sex
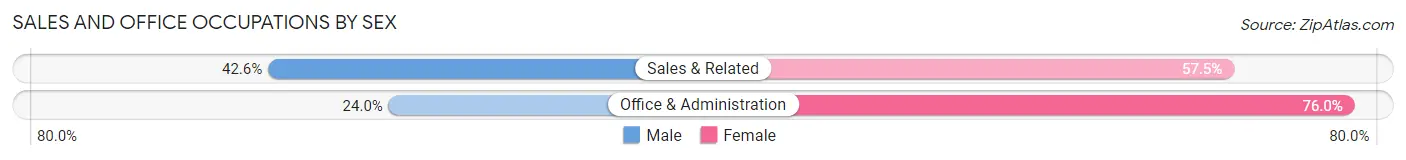
| Occupation | Male | Female |
| Sales & Related | 1,196 (42.5%) | 1,615 (57.5%) |
| Office & Administration | 727 (24.0%) | 2,303 (76.0%) |
| Total (Category) | 1,923 (32.9%) | 3,918 (67.1%) |
| Total (Overall) | 13,879 (53.2%) | 12,199 (46.8%) |
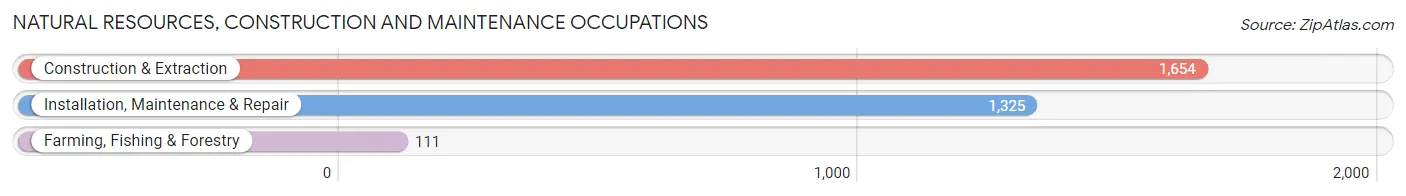
Natural Resources, Construction and Maintenance Occupations
The most common Natural Resources, Construction and Maintenance occupations in Dickson County are Construction & Extraction (1,654 | 6.3%), Installation, Maintenance & Repair (1,325 | 5.1%), and Farming, Fishing & Forestry (111 | 0.4%).
Natural Resources, Construction and Maintenance Occupations by Sex
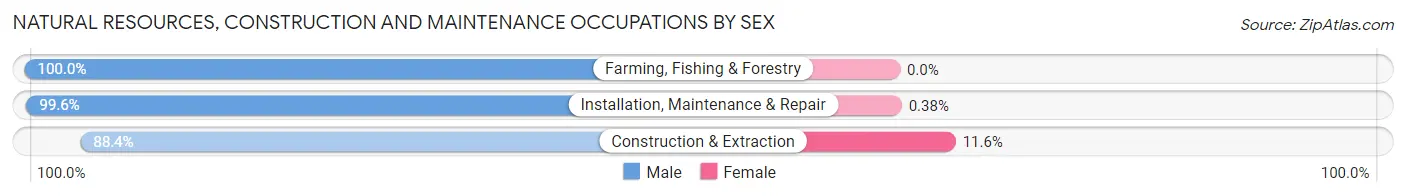
| Occupation | Male | Female |
| Farming, Fishing & Forestry | 111 (100.0%) | 0 (0.0%) |
| Construction & Extraction | 1,462 (88.4%) | 192 (11.6%) |
| Installation, Maintenance & Repair | 1,320 (99.6%) | 5 (0.4%) |
| Total (Category) | 2,893 (93.6%) | 197 (6.4%) |
| Total (Overall) | 13,879 (53.2%) | 12,199 (46.8%) |
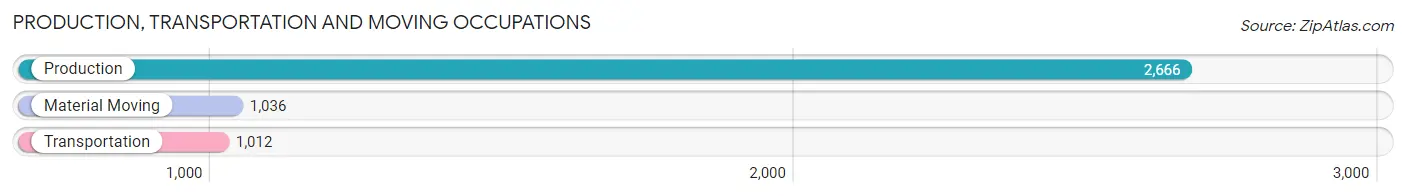
Production, Transportation and Moving Occupations
The most common Production, Transportation and Moving occupations in Dickson County are Production (2,666 | 10.2%), Material Moving (1,036 | 4.0%), and Transportation (1,012 | 3.9%).
Production, Transportation and Moving Occupations by Sex
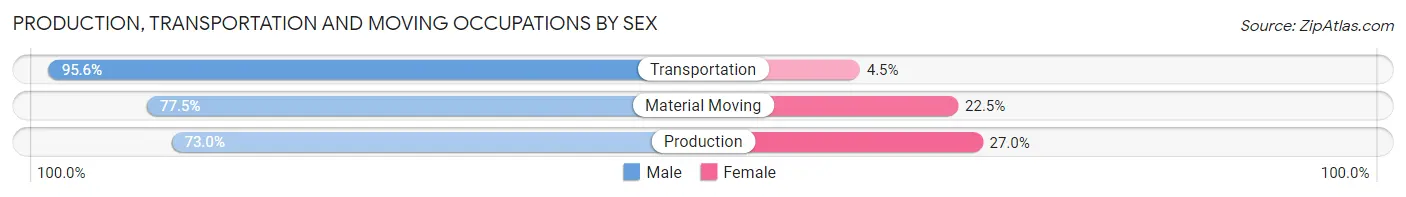
| Occupation | Male | Female |
| Production | 1,947 (73.0%) | 719 (27.0%) |
| Transportation | 967 (95.6%) | 45 (4.4%) |
| Material Moving | 803 (77.5%) | 233 (22.5%) |
| Total (Category) | 3,717 (78.8%) | 997 (21.1%) |
| Total (Overall) | 13,879 (53.2%) | 12,199 (46.8%) |
Employment Industries by Sex in Dickson County
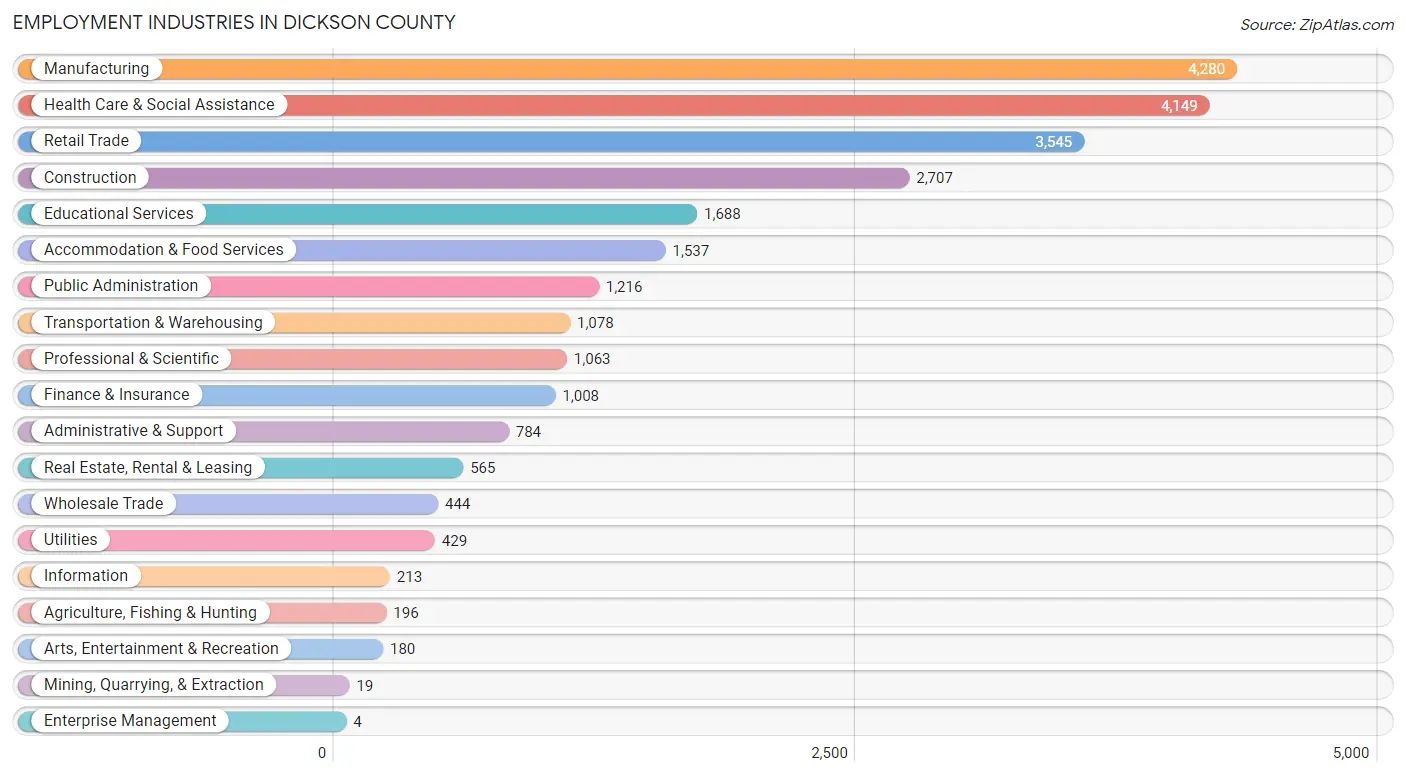
Employment Industries in Dickson County
The major employment industries in Dickson County include Manufacturing (4,280 | 16.4%), Health Care & Social Assistance (4,149 | 15.9%), Retail Trade (3,545 | 13.6%), Construction (2,707 | 10.4%), and Educational Services (1,688 | 6.5%).
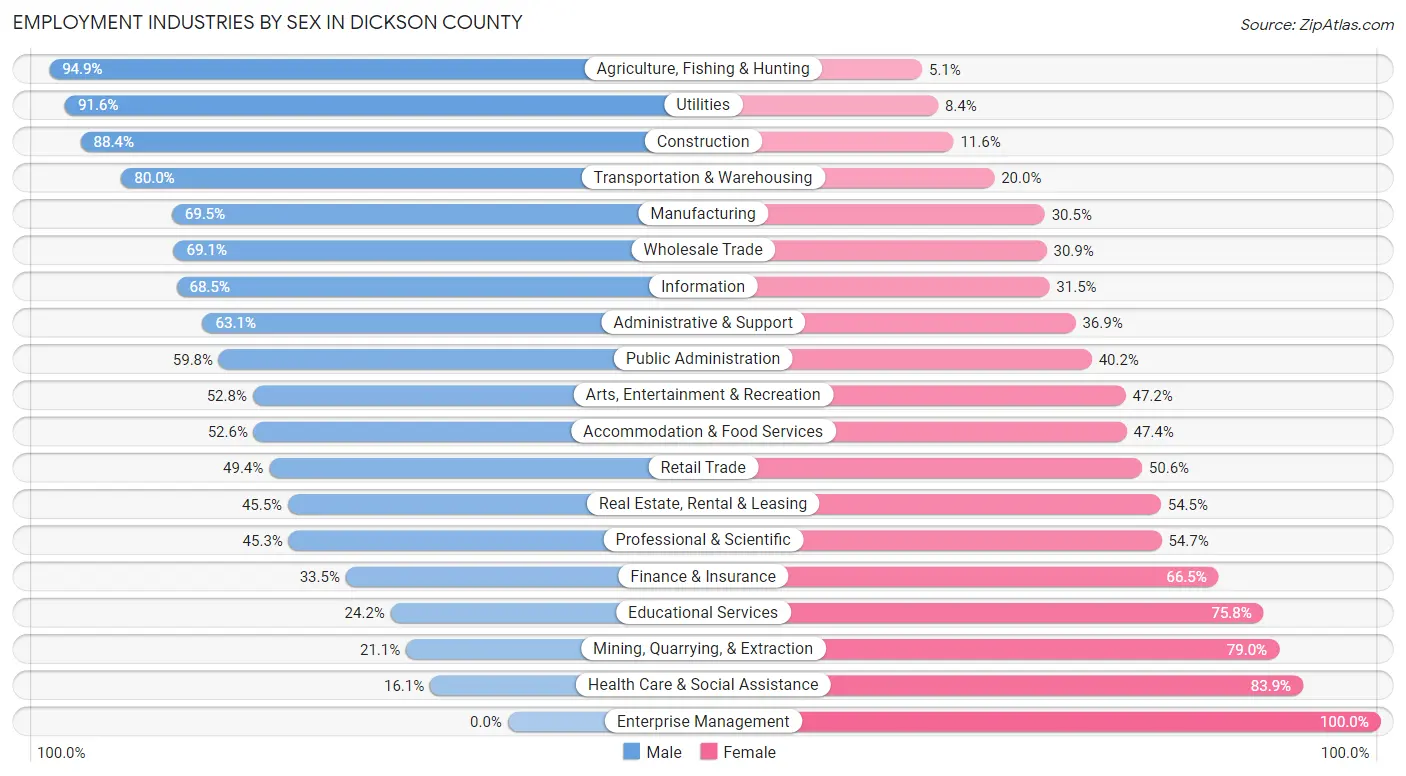
Employment Industries by Sex in Dickson County
The Dickson County industries that see more men than women are Agriculture, Fishing & Hunting (94.9%), Utilities (91.6%), and Construction (88.4%), whereas the industries that tend to have a higher number of women are Enterprise Management (100.0%), Health Care & Social Assistance (83.9%), and Mining, Quarrying, & Extraction (78.9%).
| Industry | Male | Female |
| Agriculture, Fishing & Hunting | 186 (94.9%) | 10 (5.1%) |
| Mining, Quarrying, & Extraction | 4 (21.0%) | 15 (78.9%) |
| Construction | 2,393 (88.4%) | 314 (11.6%) |
| Manufacturing | 2,975 (69.5%) | 1,305 (30.5%) |
| Wholesale Trade | 307 (69.1%) | 137 (30.9%) |
| Retail Trade | 1,751 (49.4%) | 1,794 (50.6%) |
| Transportation & Warehousing | 862 (80.0%) | 216 (20.0%) |
| Utilities | 393 (91.6%) | 36 (8.4%) |
| Information | 146 (68.5%) | 67 (31.5%) |
| Finance & Insurance | 338 (33.5%) | 670 (66.5%) |
| Real Estate, Rental & Leasing | 257 (45.5%) | 308 (54.5%) |
| Professional & Scientific | 482 (45.3%) | 581 (54.7%) |
| Enterprise Management | 0 (0.0%) | 4 (100.0%) |
| Administrative & Support | 495 (63.1%) | 289 (36.9%) |
| Educational Services | 409 (24.2%) | 1,279 (75.8%) |
| Health Care & Social Assistance | 667 (16.1%) | 3,482 (83.9%) |
| Arts, Entertainment & Recreation | 95 (52.8%) | 85 (47.2%) |
| Accommodation & Food Services | 808 (52.6%) | 729 (47.4%) |
| Public Administration | 727 (59.8%) | 489 (40.2%) |
| Total | 13,879 (53.2%) | 12,199 (46.8%) |
Education in Dickson County
School Enrollment in Dickson County
The most common levels of schooling among the 11,579 students in Dickson County are high school (3,061 | 26.4%), middle school (2,806 | 24.2%), and elementary school (2,748 | 23.7%).
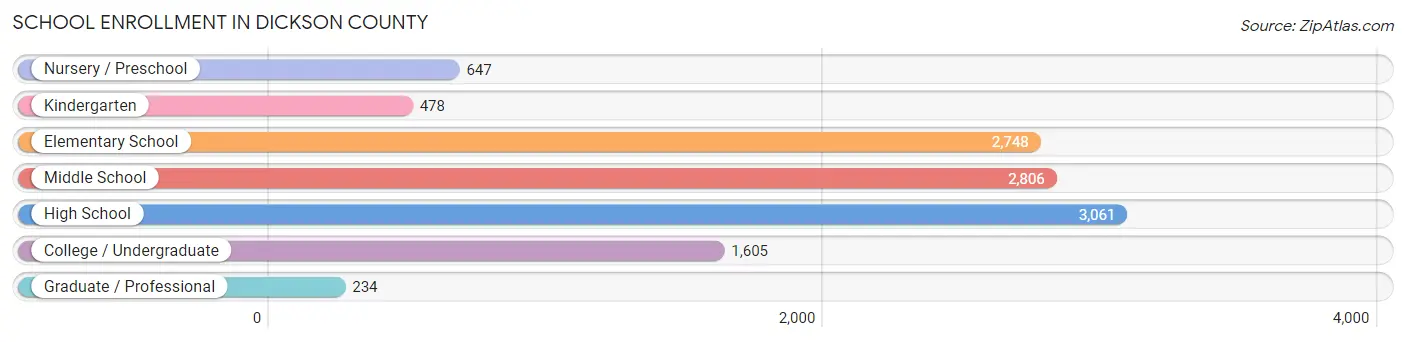
| School Level | # Students | % Students |
| Nursery / Preschool | 647 | 5.6% |
| Kindergarten | 478 | 4.1% |
| Elementary School | 2,748 | 23.7% |
| Middle School | 2,806 | 24.2% |
| High School | 3,061 | 26.4% |
| College / Undergraduate | 1,605 | 13.9% |
| Graduate / Professional | 234 | 2.0% |
| Total | 11,579 | 100.0% |
School Enrollment by Age by Funding Source in Dickson County
Out of a total of 11,579 students who are enrolled in schools in Dickson County, 2,084 (18.0%) attend a private institution, while the remaining 9,495 (82.0%) are enrolled in public schools. The age group of 35 years and over has the highest likelihood of being enrolled in private schools, with 173 (36.8% in the age bracket) enrolled. Conversely, the age group of 20 to 24 year olds has the lowest likelihood of being enrolled in a private school, with 564 (87.8% in the age bracket) attending a public institution.
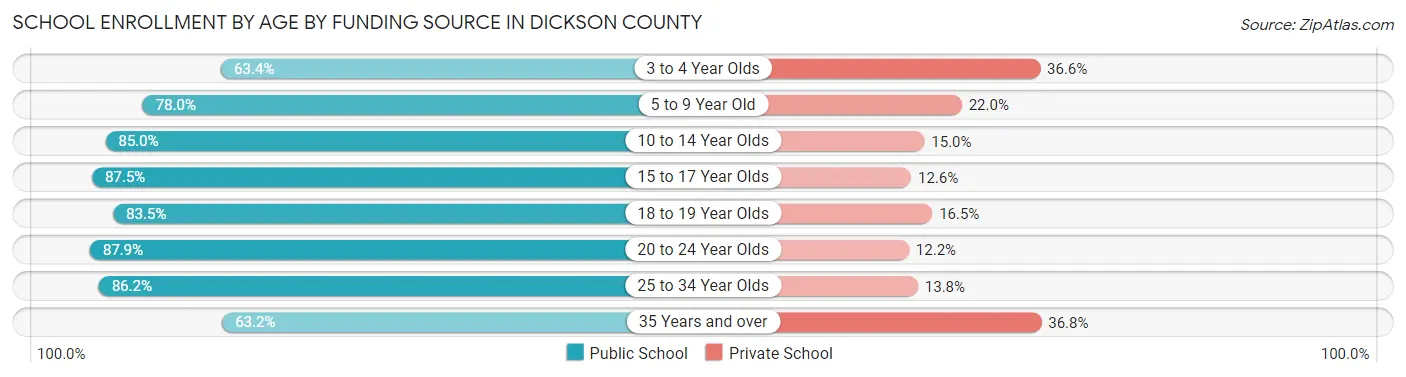
| Age Bracket | Public School | Private School |
| 3 to 4 Year Olds | 260 (63.4%) | 150 (36.6%) |
| 5 to 9 Year Old | 2,533 (78.0%) | 714 (22.0%) |
| 10 to 14 Year Olds | 2,850 (85.0%) | 504 (15.0%) |
| 15 to 17 Year Olds | 1,868 (87.5%) | 268 (12.6%) |
| 18 to 19 Year Olds | 643 (83.5%) | 127 (16.5%) |
| 20 to 24 Year Olds | 564 (87.8%) | 78 (12.1%) |
| 25 to 34 Year Olds | 474 (86.2%) | 76 (13.8%) |
| 35 Years and over | 297 (63.2%) | 173 (36.8%) |
| Total | 9,495 (82.0%) | 2,084 (18.0%) |
Educational Attainment by Field of Study in Dickson County
Business (1,541 | 19.0%), education (1,157 | 14.3%), science & technology (971 | 12.0%), liberal arts & history (722 | 8.9%), and arts & humanities (628 | 7.7%) are the most common fields of study among 8,109 individuals in Dickson County who have obtained a bachelor's degree or higher.
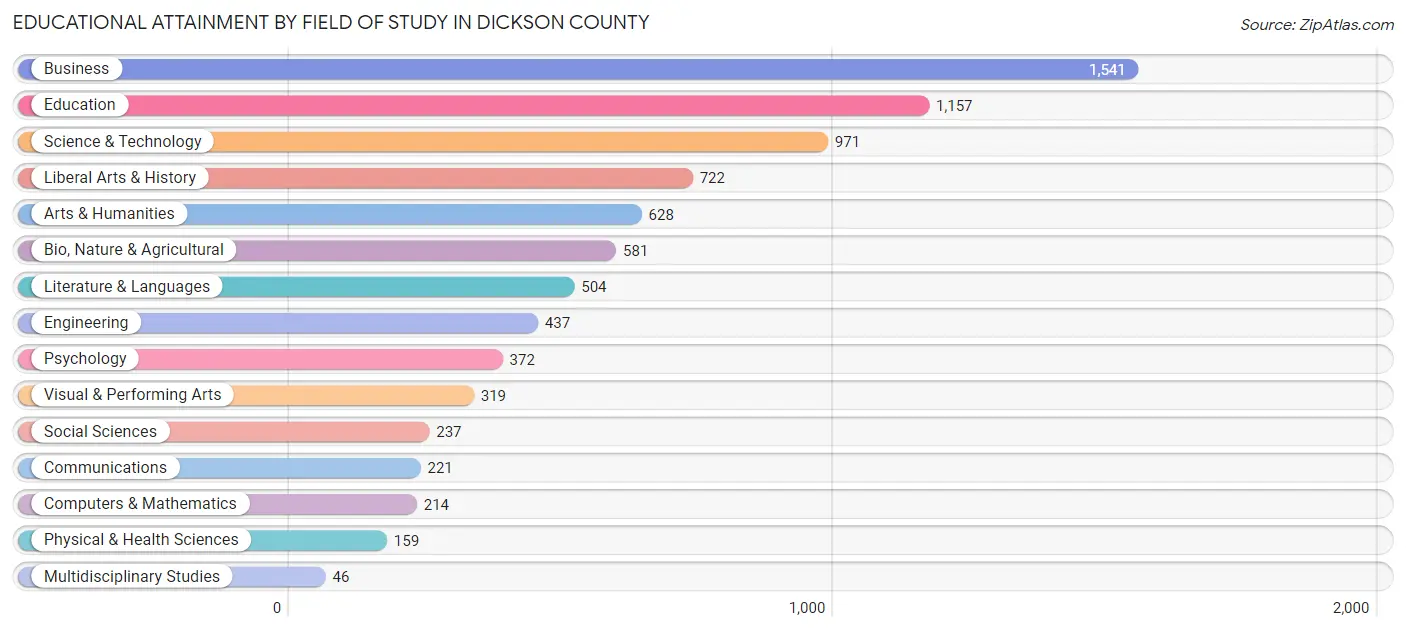
| Field of Study | # Graduates | % Graduates |
| Computers & Mathematics | 214 | 2.6% |
| Bio, Nature & Agricultural | 581 | 7.2% |
| Physical & Health Sciences | 159 | 2.0% |
| Psychology | 372 | 4.6% |
| Social Sciences | 237 | 2.9% |
| Engineering | 437 | 5.4% |
| Multidisciplinary Studies | 46 | 0.6% |
| Science & Technology | 971 | 12.0% |
| Business | 1,541 | 19.0% |
| Education | 1,157 | 14.3% |
| Literature & Languages | 504 | 6.2% |
| Liberal Arts & History | 722 | 8.9% |
| Visual & Performing Arts | 319 | 3.9% |
| Communications | 221 | 2.7% |
| Arts & Humanities | 628 | 7.7% |
| Total | 8,109 | 100.0% |
Transportation & Commute in Dickson County
Vehicle Availability by Sex in Dickson County
The most prevalent vehicle ownership categories in Dickson County are males with 2 vehicles (5,330, accounting for 39.0%) and females with 2 vehicles (4,177, making up 45.2%).

| Vehicles Available | Male | Female |
| No Vehicle | 90 (0.7%) | 103 (0.9%) |
| 1 Vehicle | 1,064 (7.8%) | 1,753 (14.9%) |
| 2 Vehicles | 5,330 (39.0%) | 4,177 (35.4%) |
| 3 Vehicles | 4,195 (30.7%) | 3,503 (29.7%) |
| 4 Vehicles | 1,814 (13.3%) | 1,249 (10.6%) |
| 5 or more Vehicles | 1,188 (8.7%) | 1,003 (8.5%) |
| Total | 13,681 (100.0%) | 11,788 (100.0%) |
Commute Time in Dickson County
The most frequently occuring commute durations in Dickson County are 60 to 89 minutes (4,166 commuters, 17.4%), 45 to 59 minutes (4,022 commuters, 16.8%), and 10 to 14 minutes (3,070 commuters, 12.9%).
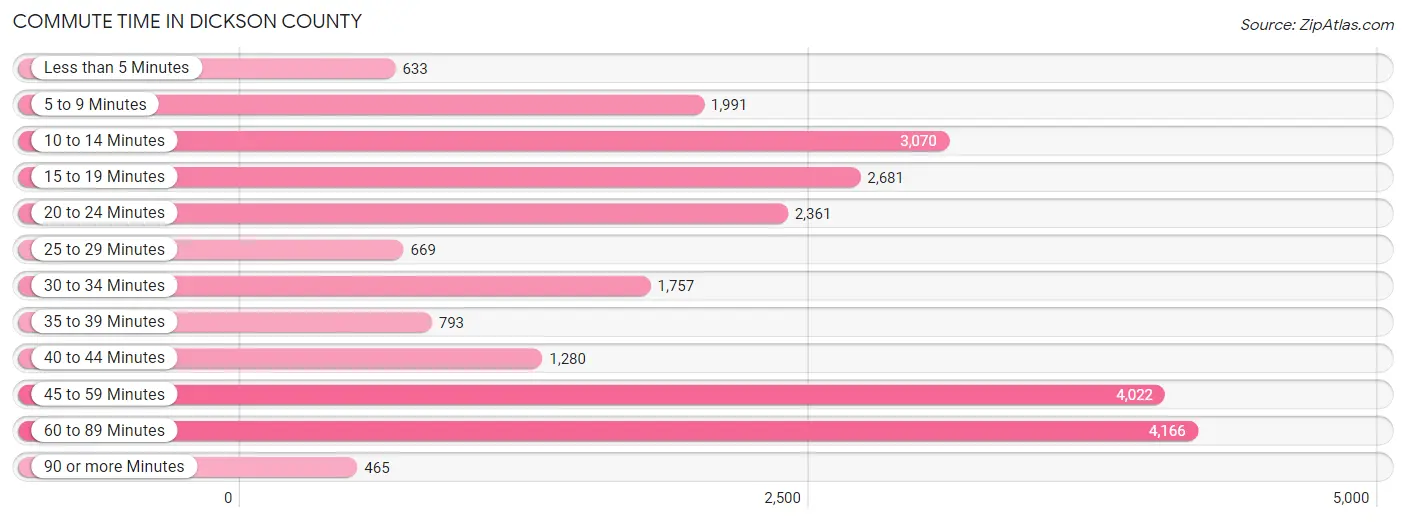
| Commute Time | # Commuters | % Commuters |
| Less than 5 Minutes | 633 | 2.6% |
| 5 to 9 Minutes | 1,991 | 8.3% |
| 10 to 14 Minutes | 3,070 | 12.9% |
| 15 to 19 Minutes | 2,681 | 11.2% |
| 20 to 24 Minutes | 2,361 | 9.9% |
| 25 to 29 Minutes | 669 | 2.8% |
| 30 to 34 Minutes | 1,757 | 7.4% |
| 35 to 39 Minutes | 793 | 3.3% |
| 40 to 44 Minutes | 1,280 | 5.4% |
| 45 to 59 Minutes | 4,022 | 16.8% |
| 60 to 89 Minutes | 4,166 | 17.4% |
| 90 or more Minutes | 465 | 1.9% |
Commute Time by Sex in Dickson County
The most common commute times in Dickson County are 60 to 89 minutes (2,322 commuters, 17.7%) for males and 45 to 59 minutes (1,989 commuters, 18.4%) for females.
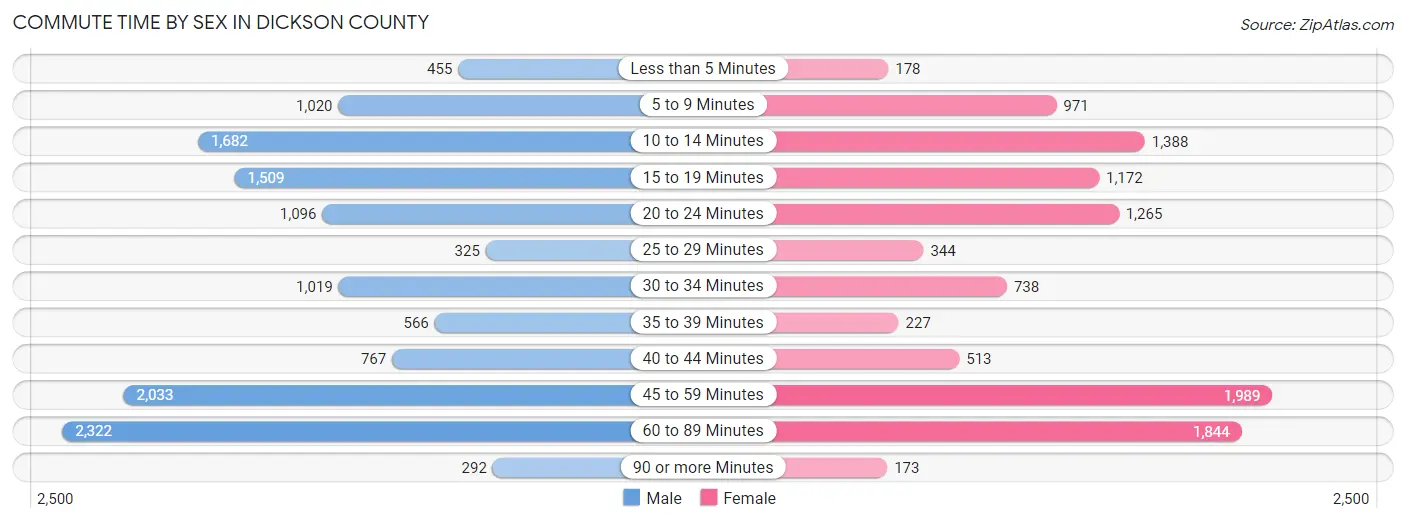
| Commute Time | Male | Female |
| Less than 5 Minutes | 455 (3.5%) | 178 (1.7%) |
| 5 to 9 Minutes | 1,020 (7.8%) | 971 (9.0%) |
| 10 to 14 Minutes | 1,682 (12.9%) | 1,388 (12.9%) |
| 15 to 19 Minutes | 1,509 (11.5%) | 1,172 (10.8%) |
| 20 to 24 Minutes | 1,096 (8.4%) | 1,265 (11.7%) |
| 25 to 29 Minutes | 325 (2.5%) | 344 (3.2%) |
| 30 to 34 Minutes | 1,019 (7.8%) | 738 (6.8%) |
| 35 to 39 Minutes | 566 (4.3%) | 227 (2.1%) |
| 40 to 44 Minutes | 767 (5.9%) | 513 (4.8%) |
| 45 to 59 Minutes | 2,033 (15.5%) | 1,989 (18.4%) |
| 60 to 89 Minutes | 2,322 (17.7%) | 1,844 (17.1%) |
| 90 or more Minutes | 292 (2.2%) | 173 (1.6%) |
Time of Departure to Work by Sex in Dickson County
The most frequent times of departure to work in Dickson County are 6:00 AM to 6:29 AM (2,512, 19.2%) for males and 7:00 AM to 7:29 AM (2,222, 20.6%) for females.
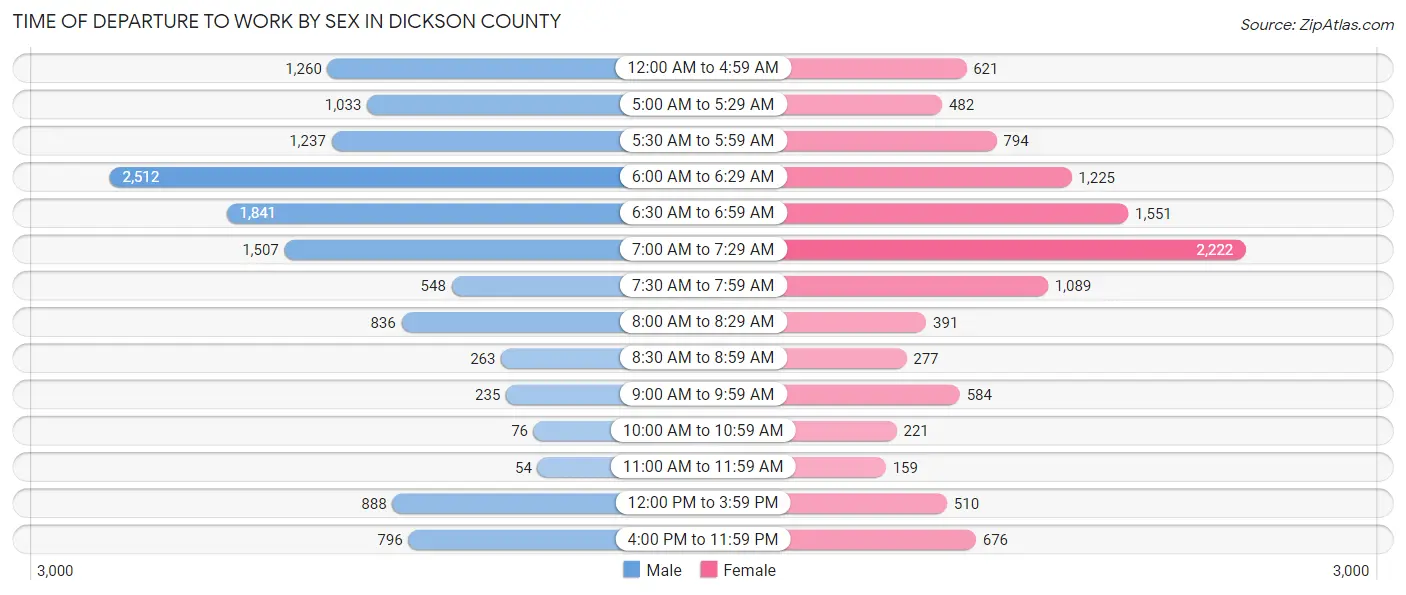
| Time of Departure | Male | Female |
| 12:00 AM to 4:59 AM | 1,260 (9.6%) | 621 (5.8%) |
| 5:00 AM to 5:29 AM | 1,033 (7.9%) | 482 (4.5%) |
| 5:30 AM to 5:59 AM | 1,237 (9.5%) | 794 (7.3%) |
| 6:00 AM to 6:29 AM | 2,512 (19.2%) | 1,225 (11.3%) |
| 6:30 AM to 6:59 AM | 1,841 (14.1%) | 1,551 (14.4%) |
| 7:00 AM to 7:29 AM | 1,507 (11.5%) | 2,222 (20.6%) |
| 7:30 AM to 7:59 AM | 548 (4.2%) | 1,089 (10.1%) |
| 8:00 AM to 8:29 AM | 836 (6.4%) | 391 (3.6%) |
| 8:30 AM to 8:59 AM | 263 (2.0%) | 277 (2.6%) |
| 9:00 AM to 9:59 AM | 235 (1.8%) | 584 (5.4%) |
| 10:00 AM to 10:59 AM | 76 (0.6%) | 221 (2.1%) |
| 11:00 AM to 11:59 AM | 54 (0.4%) | 159 (1.5%) |
| 12:00 PM to 3:59 PM | 888 (6.8%) | 510 (4.7%) |
| 4:00 PM to 11:59 PM | 796 (6.1%) | 676 (6.3%) |
| Total | 13,086 (100.0%) | 10,802 (100.0%) |
Housing Occupancy in Dickson County
Occupancy by Ownership in Dickson County
Of the total 20,329 dwellings in Dickson County, owner-occupied units account for 16,224 (79.8%), while renter-occupied units make up 4,105 (20.2%).
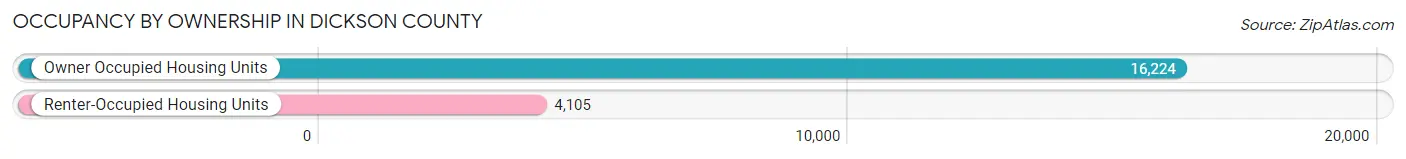
| Occupancy | # Housing Units | % Housing Units |
| Owner Occupied Housing Units | 16,224 | 79.8% |
| Renter-Occupied Housing Units | 4,105 | 20.2% |
| Total Occupied Housing Units | 20,329 | 100.0% |
Occupancy by Household Size in Dickson County
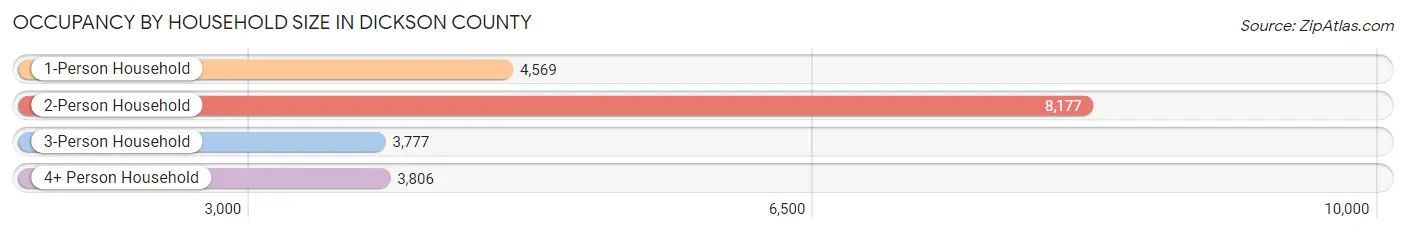
| Household Size | # Housing Units | % Housing Units |
| 1-Person Household | 4,569 | 22.5% |
| 2-Person Household | 8,177 | 40.2% |
| 3-Person Household | 3,777 | 18.6% |
| 4+ Person Household | 3,806 | 18.7% |
| Total Housing Units | 20,329 | 100.0% |
Occupancy by Ownership by Household Size in Dickson County
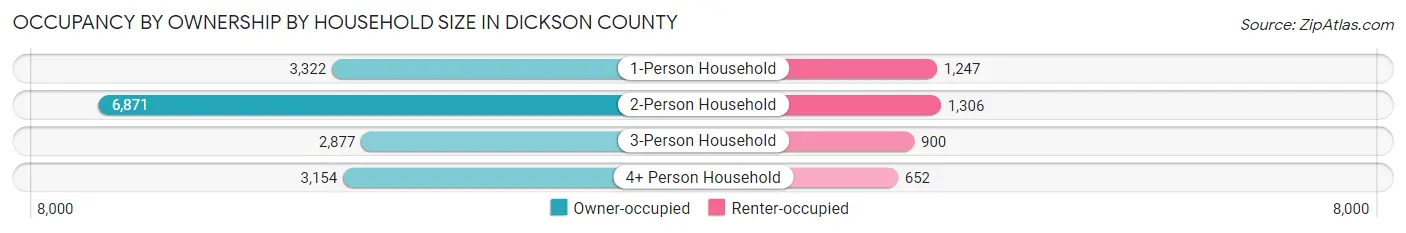
| Household Size | Owner-occupied | Renter-occupied |
| 1-Person Household | 3,322 (72.7%) | 1,247 (27.3%) |
| 2-Person Household | 6,871 (84.0%) | 1,306 (16.0%) |
| 3-Person Household | 2,877 (76.2%) | 900 (23.8%) |
| 4+ Person Household | 3,154 (82.9%) | 652 (17.1%) |
| Total Housing Units | 16,224 (79.8%) | 4,105 (20.2%) |
Occupancy by Educational Attainment in Dickson County
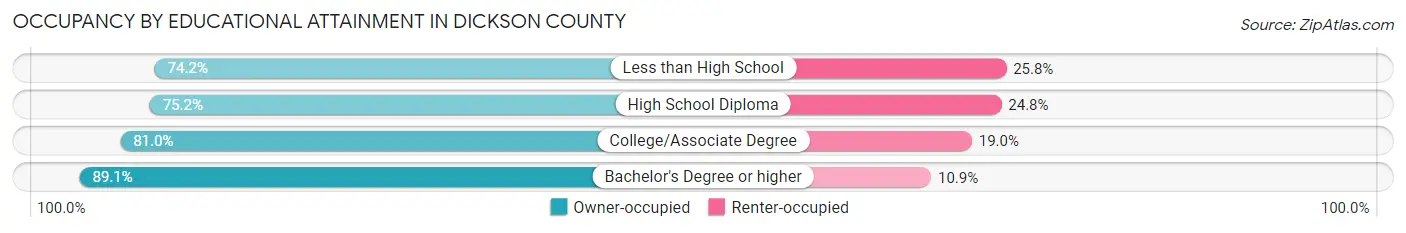
| Household Size | Owner-occupied | Renter-occupied |
| Less than High School | 1,419 (74.2%) | 493 (25.8%) |
| High School Diploma | 6,168 (75.2%) | 2,036 (24.8%) |
| College/Associate Degree | 4,663 (81.0%) | 1,091 (19.0%) |
| Bachelor's Degree or higher | 3,974 (89.1%) | 485 (10.9%) |
Occupancy by Age of Householder in Dickson County
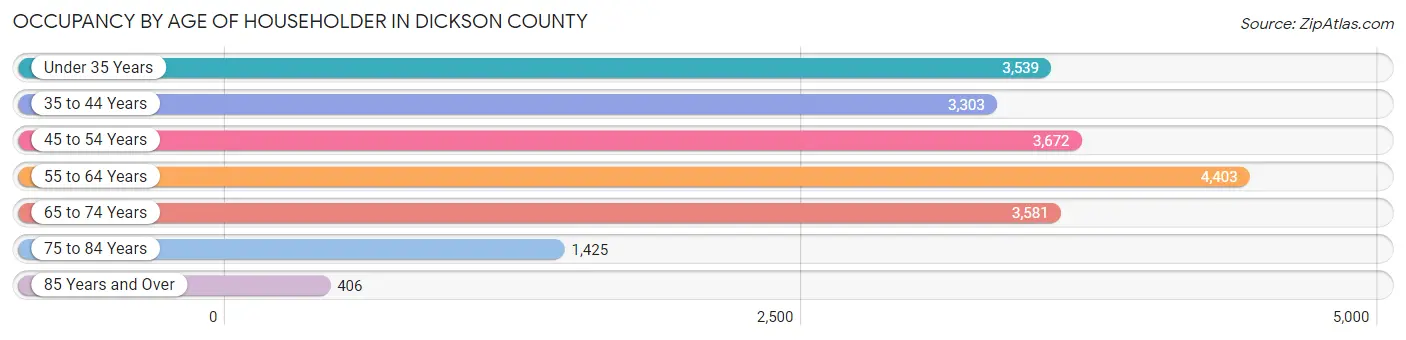
| Age Bracket | # Households | % Households |
| Under 35 Years | 3,539 | 17.4% |
| 35 to 44 Years | 3,303 | 16.3% |
| 45 to 54 Years | 3,672 | 18.1% |
| 55 to 64 Years | 4,403 | 21.7% |
| 65 to 74 Years | 3,581 | 17.6% |
| 75 to 84 Years | 1,425 | 7.0% |
| 85 Years and Over | 406 | 2.0% |
| Total | 20,329 | 100.0% |
Housing Finances in Dickson County
Median Income by Occupancy in Dickson County
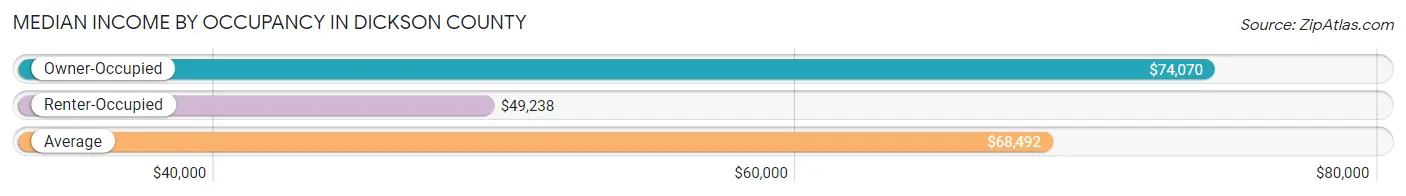
| Occupancy Type | # Households | Median Income |
| Owner-Occupied | 16,224 (79.8%) | $74,070 |
| Renter-Occupied | 4,105 (20.2%) | $49,238 |
| Average | 20,329 (100.0%) | $68,492 |
Occupancy by Householder Income Bracket in Dickson County
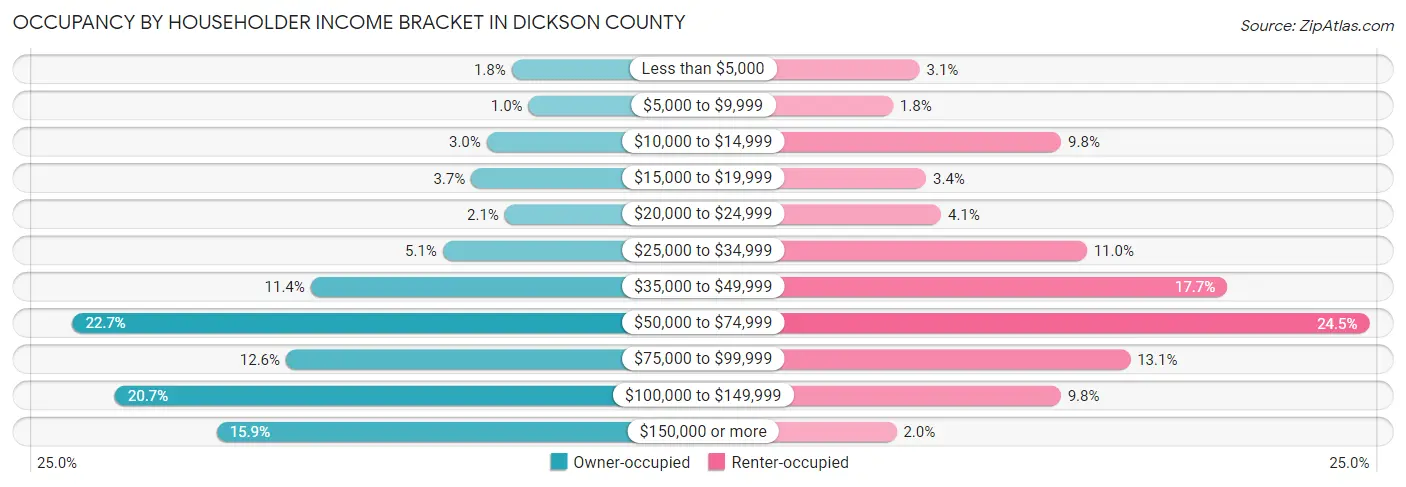
| Income Bracket | Owner-occupied | Renter-occupied |
| Less than $5,000 | 293 (1.8%) | 125 (3.0%) |
| $5,000 to $9,999 | 164 (1.0%) | 73 (1.8%) |
| $10,000 to $14,999 | 486 (3.0%) | 402 (9.8%) |
| $15,000 to $19,999 | 607 (3.7%) | 138 (3.4%) |
| $20,000 to $24,999 | 348 (2.1%) | 167 (4.1%) |
| $25,000 to $34,999 | 826 (5.1%) | 452 (11.0%) |
| $35,000 to $49,999 | 1,846 (11.4%) | 726 (17.7%) |
| $50,000 to $74,999 | 3,686 (22.7%) | 1,004 (24.5%) |
| $75,000 to $99,999 | 2,037 (12.6%) | 537 (13.1%) |
| $100,000 to $149,999 | 3,359 (20.7%) | 401 (9.8%) |
| $150,000 or more | 2,572 (15.9%) | 80 (1.9%) |
| Total | 16,224 (100.0%) | 4,105 (100.0%) |
Monthly Housing Cost Tiers in Dickson County
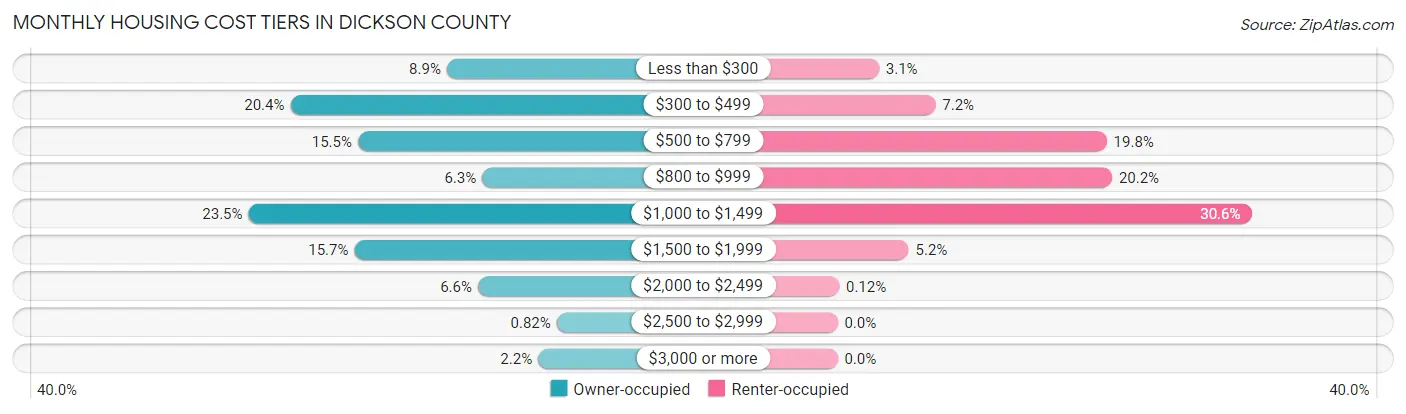
| Monthly Cost | Owner-occupied | Renter-occupied |
| Less than $300 | 1,446 (8.9%) | 125 (3.0%) |
| $300 to $499 | 3,315 (20.4%) | 296 (7.2%) |
| $500 to $799 | 2,509 (15.5%) | 814 (19.8%) |
| $800 to $999 | 1,024 (6.3%) | 830 (20.2%) |
| $1,000 to $1,499 | 3,816 (23.5%) | 1,254 (30.5%) |
| $1,500 to $1,999 | 2,551 (15.7%) | 215 (5.2%) |
| $2,000 to $2,499 | 1,074 (6.6%) | 5 (0.1%) |
| $2,500 to $2,999 | 133 (0.8%) | 0 (0.0%) |
| $3,000 or more | 356 (2.2%) | 0 (0.0%) |
| Total | 16,224 (100.0%) | 4,105 (100.0%) |
Physical Housing Characteristics in Dickson County
Housing Structures in Dickson County
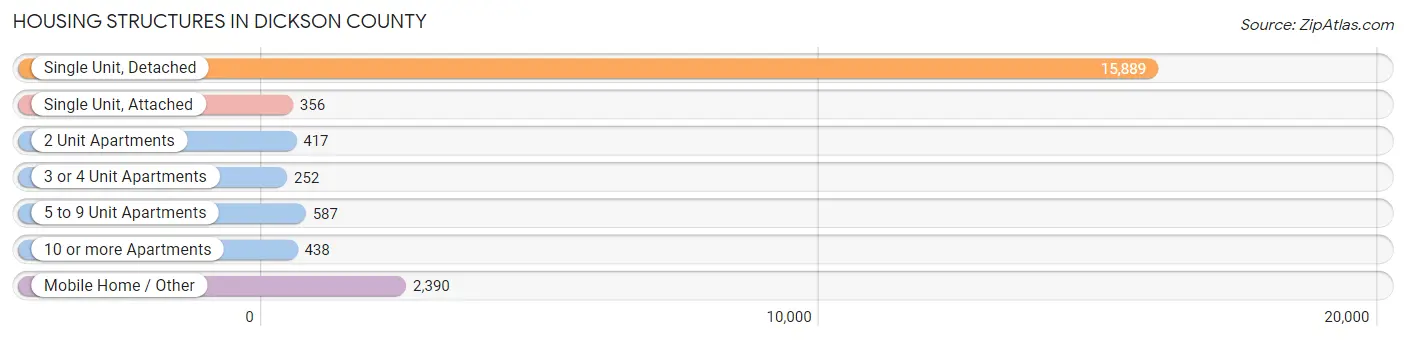
| Structure Type | # Housing Units | % Housing Units |
| Single Unit, Detached | 15,889 | 78.2% |
| Single Unit, Attached | 356 | 1.8% |
| 2 Unit Apartments | 417 | 2.1% |
| 3 or 4 Unit Apartments | 252 | 1.2% |
| 5 to 9 Unit Apartments | 587 | 2.9% |
| 10 or more Apartments | 438 | 2.1% |
| Mobile Home / Other | 2,390 | 11.8% |
| Total | 20,329 | 100.0% |
Housing Structures by Occupancy in Dickson County
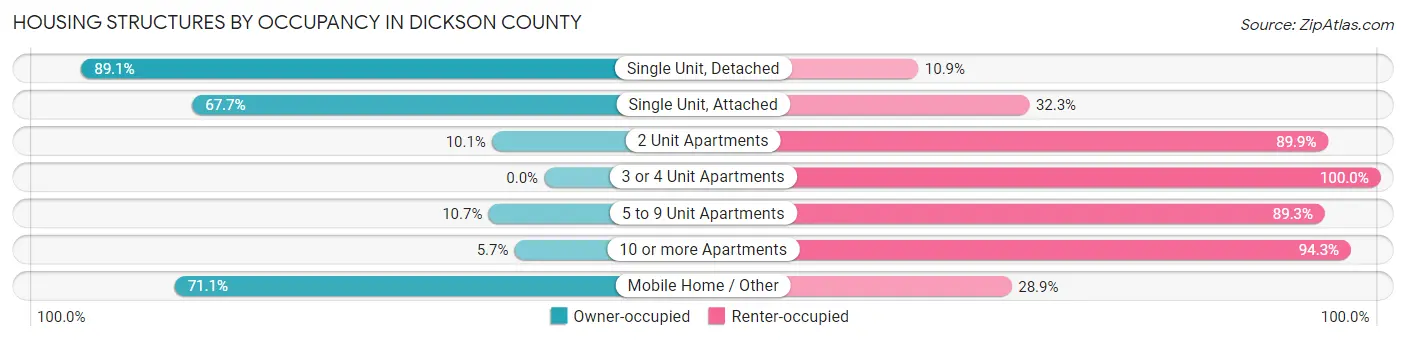
| Structure Type | Owner-occupied | Renter-occupied |
| Single Unit, Detached | 14,154 (89.1%) | 1,735 (10.9%) |
| Single Unit, Attached | 241 (67.7%) | 115 (32.3%) |
| 2 Unit Apartments | 42 (10.1%) | 375 (89.9%) |
| 3 or 4 Unit Apartments | 0 (0.0%) | 252 (100.0%) |
| 5 to 9 Unit Apartments | 63 (10.7%) | 524 (89.3%) |
| 10 or more Apartments | 25 (5.7%) | 413 (94.3%) |
| Mobile Home / Other | 1,699 (71.1%) | 691 (28.9%) |
| Total | 16,224 (79.8%) | 4,105 (20.2%) |
Housing Structures by Number of Rooms in Dickson County
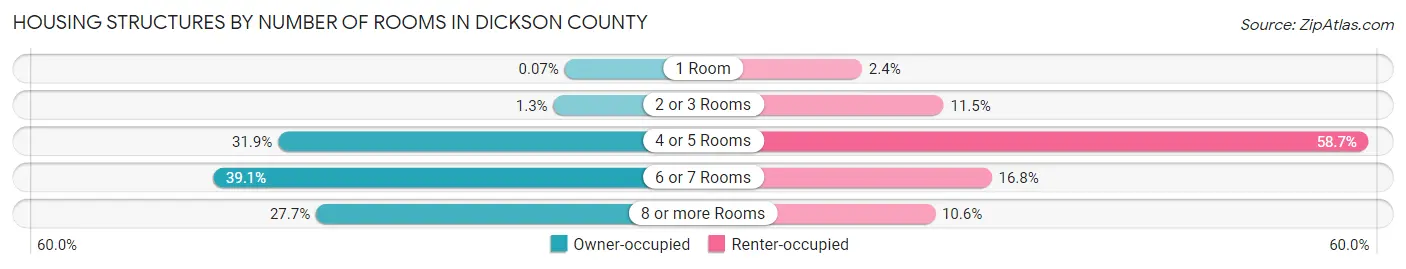
| Number of Rooms | Owner-occupied | Renter-occupied |
| 1 Room | 11 (0.1%) | 100 (2.4%) |
| 2 or 3 Rooms | 212 (1.3%) | 472 (11.5%) |
| 4 or 5 Rooms | 5,171 (31.9%) | 2,409 (58.7%) |
| 6 or 7 Rooms | 6,343 (39.1%) | 691 (16.8%) |
| 8 or more Rooms | 4,487 (27.7%) | 433 (10.5%) |
| Total | 16,224 (100.0%) | 4,105 (100.0%) |
Housing Structure by Heating Type in Dickson County
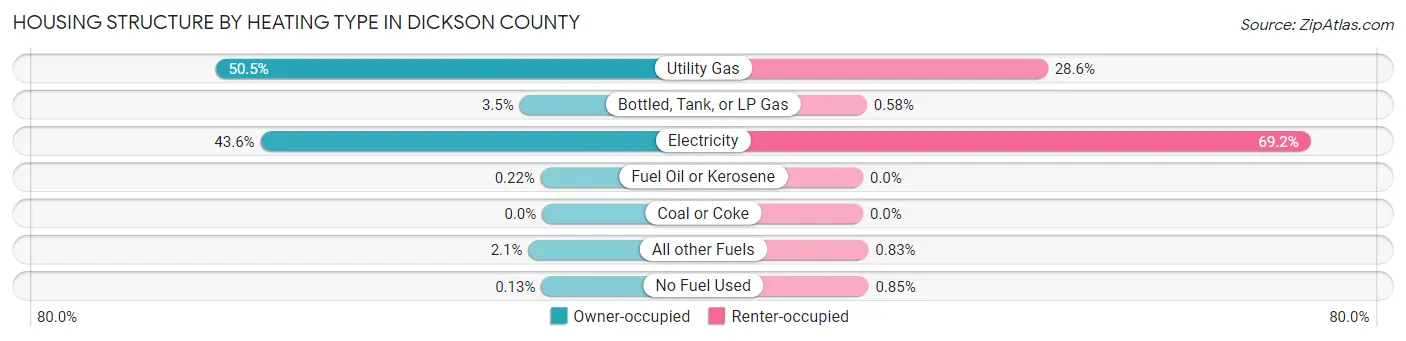
| Heating Type | Owner-occupied | Renter-occupied |
| Utility Gas | 8,191 (50.5%) | 1,172 (28.5%) |
| Bottled, Tank, or LP Gas | 566 (3.5%) | 24 (0.6%) |
| Electricity | 7,066 (43.5%) | 2,840 (69.2%) |
| Fuel Oil or Kerosene | 35 (0.2%) | 0 (0.0%) |
| Coal or Coke | 0 (0.0%) | 0 (0.0%) |
| All other Fuels | 345 (2.1%) | 34 (0.8%) |
| No Fuel Used | 21 (0.1%) | 35 (0.9%) |
| Total | 16,224 (100.0%) | 4,105 (100.0%) |
Household Vehicle Usage in Dickson County
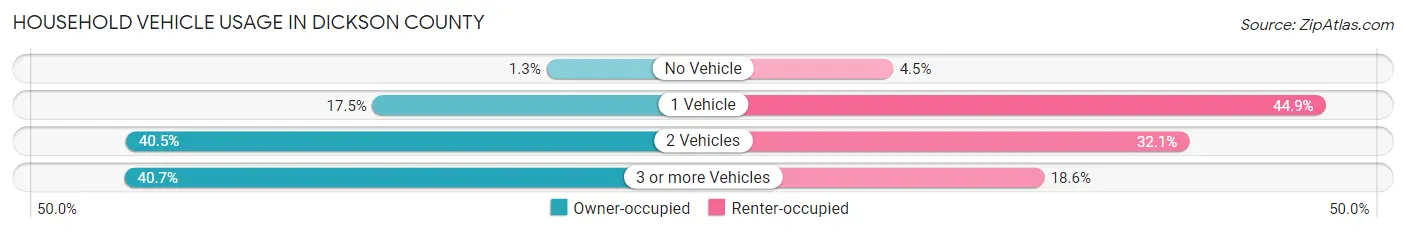
| Vehicles per Household | Owner-occupied | Renter-occupied |
| No Vehicle | 208 (1.3%) | 183 (4.5%) |
| 1 Vehicle | 2,841 (17.5%) | 1,841 (44.9%) |
| 2 Vehicles | 6,578 (40.5%) | 1,319 (32.1%) |
| 3 or more Vehicles | 6,597 (40.7%) | 762 (18.6%) |
| Total | 16,224 (100.0%) | 4,105 (100.0%) |
Real Estate & Mortgages in Dickson County
Real Estate and Mortgage Overview in Dickson County
| Characteristic | Without Mortgage | With Mortgage |
| Housing Units | 6,879 | 9,345 |
| Median Property Value | $223,900 | $255,100 |
| Median Household Income | $60,332 | $1,815 |
| Monthly Housing Costs | $434 | $356 |
| Real Estate Taxes | $1,204 | $232 |
Property Value by Mortgage Status in Dickson County
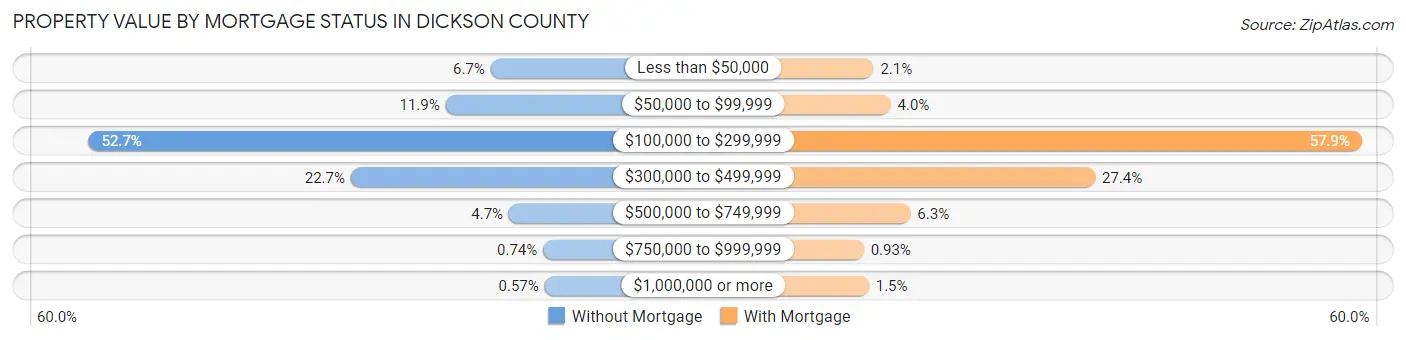
| Property Value | Without Mortgage | With Mortgage |
| Less than $50,000 | 463 (6.7%) | 192 (2.1%) |
| $50,000 to $99,999 | 818 (11.9%) | 375 (4.0%) |
| $100,000 to $299,999 | 3,625 (52.7%) | 5,406 (57.9%) |
| $300,000 to $499,999 | 1,563 (22.7%) | 2,558 (27.4%) |
| $500,000 to $749,999 | 320 (4.6%) | 586 (6.3%) |
| $750,000 to $999,999 | 51 (0.7%) | 87 (0.9%) |
| $1,000,000 or more | 39 (0.6%) | 141 (1.5%) |
| Total | 6,879 (100.0%) | 9,345 (100.0%) |
Household Income by Mortgage Status in Dickson County
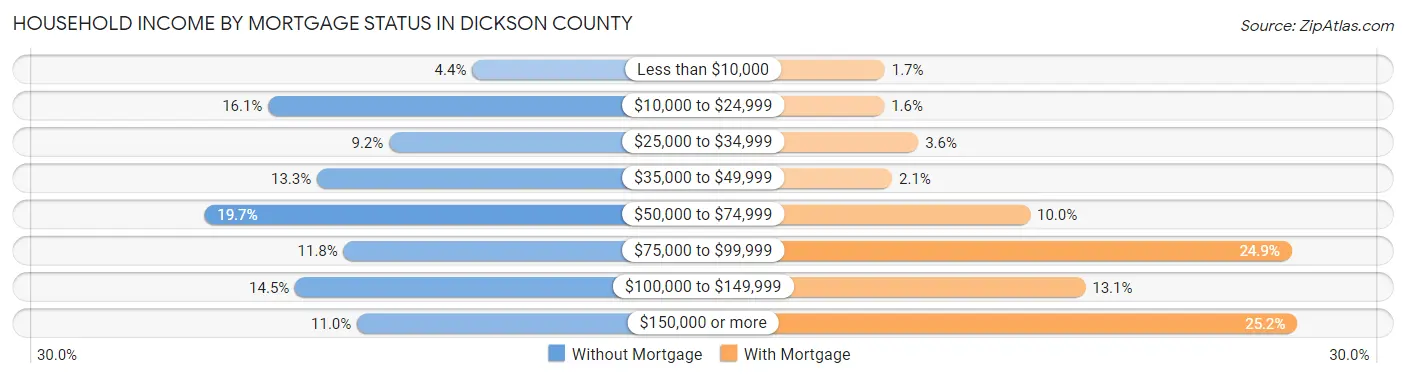
| Household Income | Without Mortgage | With Mortgage |
| Less than $10,000 | 304 (4.4%) | 156 (1.7%) |
| $10,000 to $24,999 | 1,106 (16.1%) | 153 (1.6%) |
| $25,000 to $34,999 | 631 (9.2%) | 335 (3.6%) |
| $35,000 to $49,999 | 914 (13.3%) | 195 (2.1%) |
| $50,000 to $74,999 | 1,357 (19.7%) | 932 (10.0%) |
| $75,000 to $99,999 | 810 (11.8%) | 2,329 (24.9%) |
| $100,000 to $149,999 | 1,000 (14.5%) | 1,227 (13.1%) |
| $150,000 or more | 757 (11.0%) | 2,359 (25.2%) |
| Total | 6,879 (100.0%) | 9,345 (100.0%) |
Property Value to Household Income Ratio in Dickson County
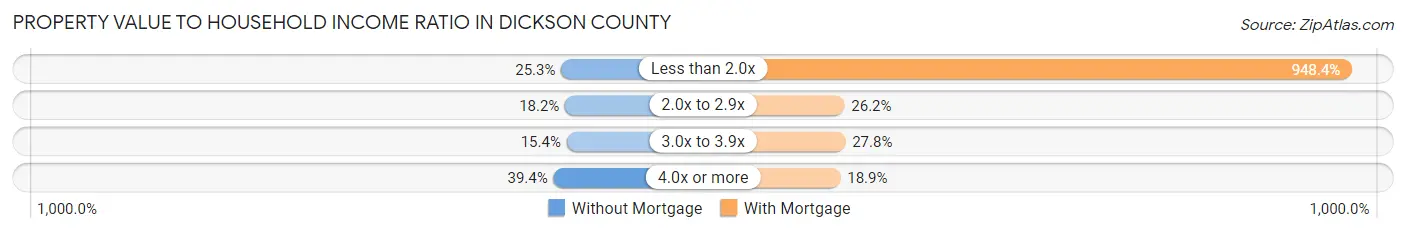
| Value-to-Income Ratio | Without Mortgage | With Mortgage |
| Less than 2.0x | 1,737 (25.3%) | 88,631 (948.4%) |
| 2.0x to 2.9x | 1,254 (18.2%) | 2,449 (26.2%) |
| 3.0x to 3.9x | 1,060 (15.4%) | 2,598 (27.8%) |
| 4.0x or more | 2,713 (39.4%) | 1,766 (18.9%) |
| Total | 6,879 (100.0%) | 9,345 (100.0%) |
Real Estate Taxes by Mortgage Status in Dickson County
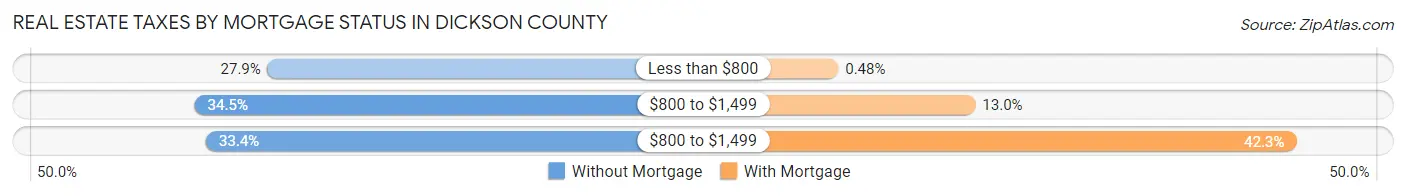
| Property Taxes | Without Mortgage | With Mortgage |
| Less than $800 | 1,919 (27.9%) | 45 (0.5%) |
| $800 to $1,499 | 2,371 (34.5%) | 1,215 (13.0%) |
| $800 to $1,499 | 2,300 (33.4%) | 3,954 (42.3%) |
| Total | 6,879 (100.0%) | 9,345 (100.0%) |
Health & Disability in Dickson County
Health Insurance Coverage by Age in Dickson County
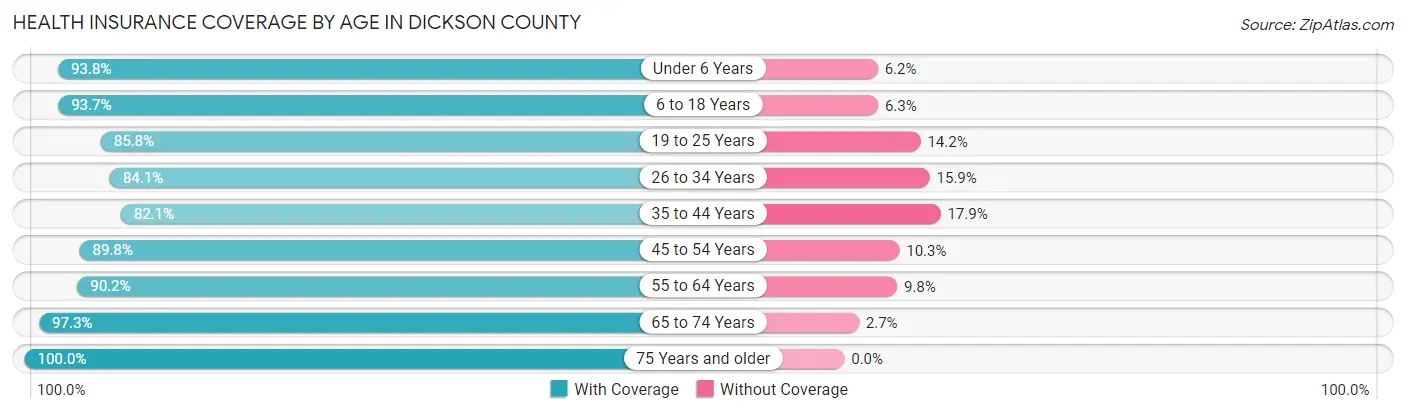
| Age Bracket | With Coverage | Without Coverage |
| Under 6 Years | 3,584 (93.8%) | 238 (6.2%) |
| 6 to 18 Years | 8,631 (93.7%) | 578 (6.3%) |
| 19 to 25 Years | 3,615 (85.8%) | 599 (14.2%) |
| 26 to 34 Years | 5,370 (84.1%) | 1,016 (15.9%) |
| 35 to 44 Years | 5,906 (82.1%) | 1,291 (17.9%) |
| 45 to 54 Years | 6,264 (89.7%) | 715 (10.2%) |
| 55 to 64 Years | 6,813 (90.2%) | 743 (9.8%) |
| 65 to 74 Years | 5,436 (97.3%) | 152 (2.7%) |
| 75 Years and older | 3,238 (100.0%) | 0 (0.0%) |
| Total | 48,857 (90.2%) | 5,332 (9.8%) |
Health Insurance Coverage by Citizenship Status in Dickson County
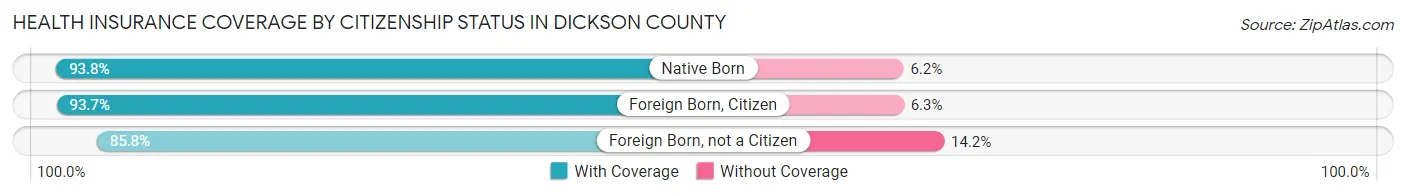
| Citizenship Status | With Coverage | Without Coverage |
| Native Born | 3,584 (93.8%) | 238 (6.2%) |
| Foreign Born, Citizen | 8,631 (93.7%) | 578 (6.3%) |
| Foreign Born, not a Citizen | 3,615 (85.8%) | 599 (14.2%) |
Health Insurance Coverage by Household Income in Dickson County
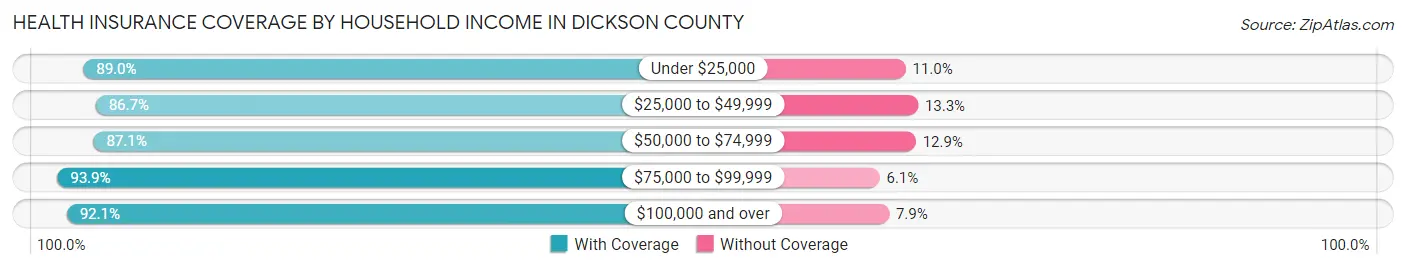
| Household Income | With Coverage | Without Coverage |
| Under $25,000 | 4,307 (89.0%) | 533 (11.0%) |
| $25,000 to $49,999 | 7,099 (86.7%) | 1,092 (13.3%) |
| $50,000 to $74,999 | 10,776 (87.1%) | 1,598 (12.9%) |
| $75,000 to $99,999 | 7,387 (93.9%) | 482 (6.1%) |
| $100,000 and over | 18,914 (92.1%) | 1,622 (7.9%) |
Public vs Private Health Insurance Coverage by Age in Dickson County
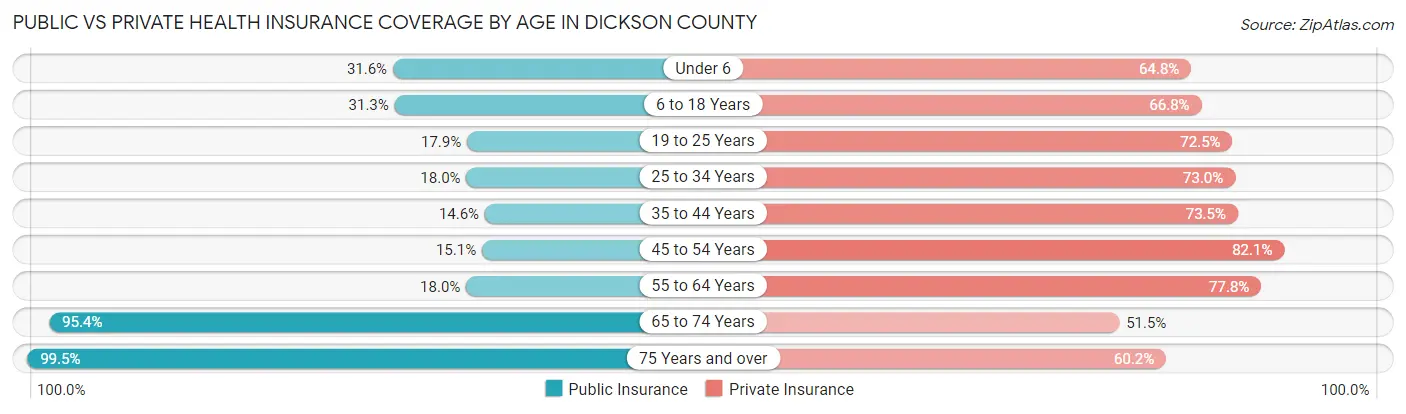
| Age Bracket | Public Insurance | Private Insurance |
| Under 6 | 1,209 (31.6%) | 2,478 (64.8%) |
| 6 to 18 Years | 2,884 (31.3%) | 6,147 (66.7%) |
| 19 to 25 Years | 753 (17.9%) | 3,055 (72.5%) |
| 25 to 34 Years | 1,149 (18.0%) | 4,662 (73.0%) |
| 35 to 44 Years | 1,047 (14.5%) | 5,290 (73.5%) |
| 45 to 54 Years | 1,054 (15.1%) | 5,731 (82.1%) |
| 55 to 64 Years | 1,363 (18.0%) | 5,881 (77.8%) |
| 65 to 74 Years | 5,333 (95.4%) | 2,877 (51.5%) |
| 75 Years and over | 3,222 (99.5%) | 1,949 (60.2%) |
| Total | 18,014 (33.2%) | 38,070 (70.3%) |
Disability Status by Sex by Age in Dickson County
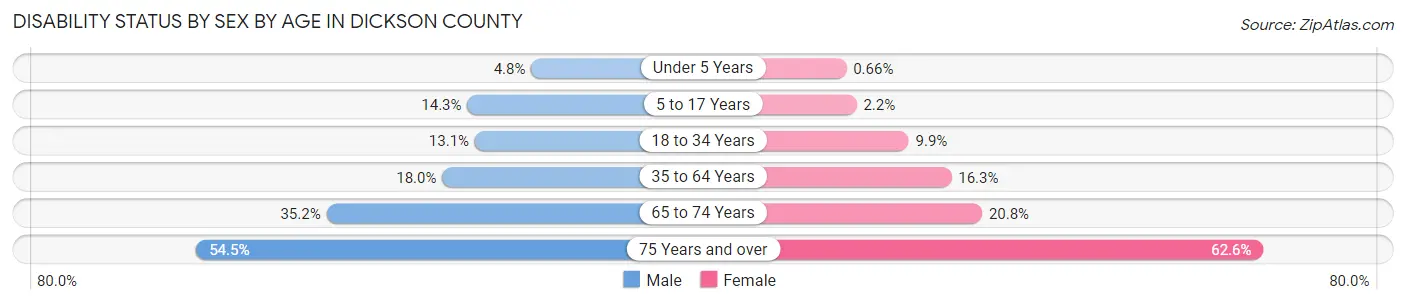
| Age Bracket | Male | Female |
| Under 5 Years | 74 (4.8%) | 11 (0.7%) |
| 5 to 17 Years | 657 (14.2%) | 99 (2.2%) |
| 18 to 34 Years | 757 (13.1%) | 546 (9.9%) |
| 35 to 64 Years | 1,918 (18.0%) | 1,798 (16.3%) |
| 65 to 74 Years | 943 (35.2%) | 605 (20.8%) |
| 75 Years and over | 738 (54.5%) | 1,179 (62.6%) |
Disability Class by Sex by Age in Dickson County
Disability Class: Hearing Difficulty
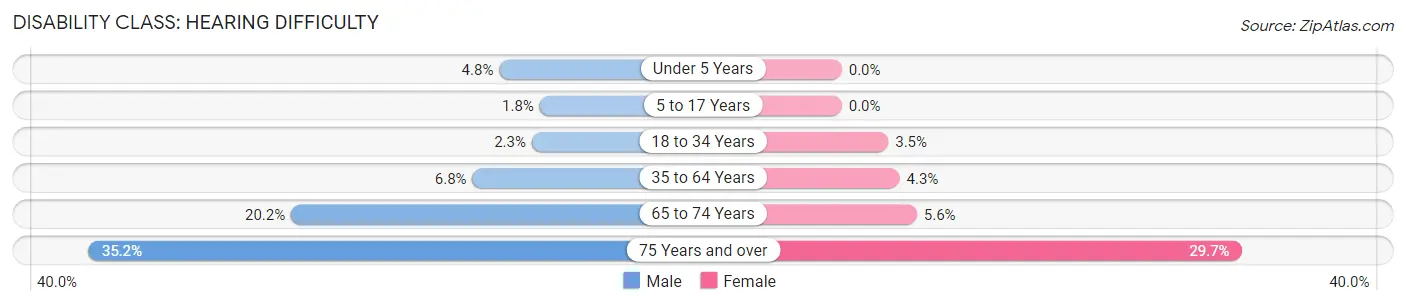
| Age Bracket | Male | Female |
| Under 5 Years | 74 (4.8%) | 0 (0.0%) |
| 5 to 17 Years | 81 (1.8%) | 0 (0.0%) |
| 18 to 34 Years | 135 (2.3%) | 190 (3.5%) |
| 35 to 64 Years | 721 (6.8%) | 474 (4.3%) |
| 65 to 74 Years | 542 (20.2%) | 162 (5.6%) |
| 75 Years and over | 477 (35.2%) | 559 (29.7%) |
Disability Class: Vision Difficulty
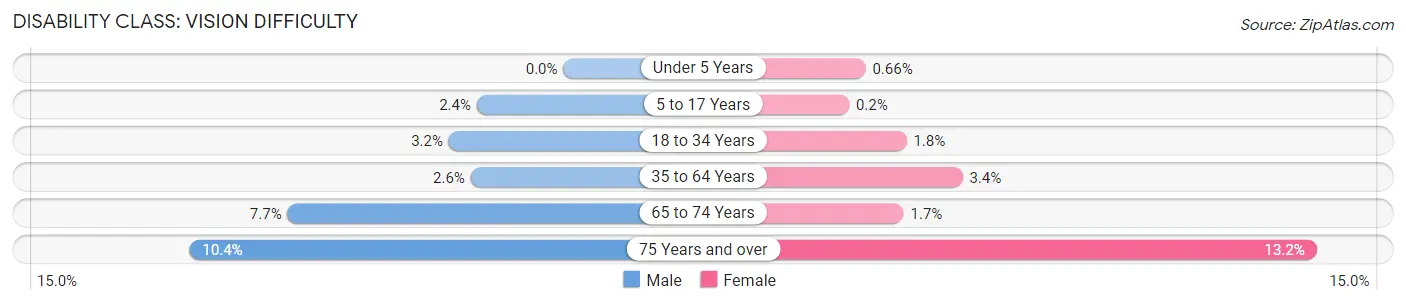
| Age Bracket | Male | Female |
| Under 5 Years | 0 (0.0%) | 11 (0.7%) |
| 5 to 17 Years | 111 (2.4%) | 9 (0.2%) |
| 18 to 34 Years | 184 (3.2%) | 99 (1.8%) |
| 35 to 64 Years | 275 (2.6%) | 372 (3.4%) |
| 65 to 74 Years | 206 (7.7%) | 50 (1.7%) |
| 75 Years and over | 141 (10.4%) | 249 (13.2%) |
Disability Class: Cognitive Difficulty
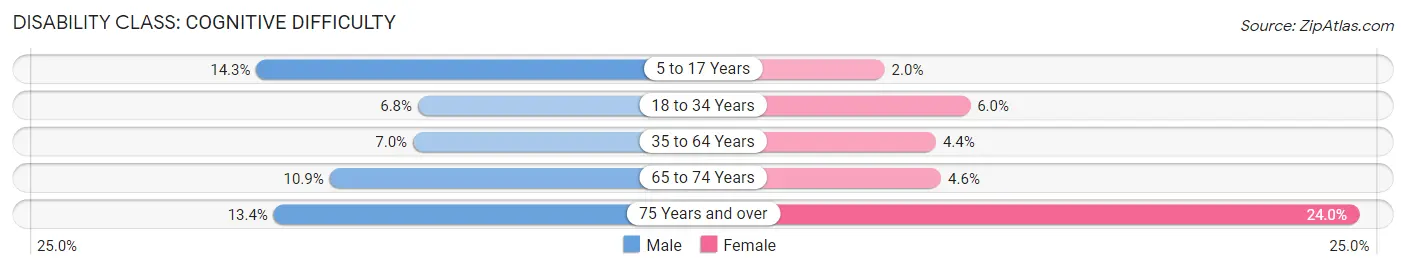
| Age Bracket | Male | Female |
| 5 to 17 Years | 657 (14.2%) | 90 (2.0%) |
| 18 to 34 Years | 389 (6.8%) | 328 (6.0%) |
| 35 to 64 Years | 745 (7.0%) | 483 (4.4%) |
| 65 to 74 Years | 291 (10.8%) | 134 (4.6%) |
| 75 Years and over | 182 (13.4%) | 452 (24.0%) |
Disability Class: Ambulatory Difficulty
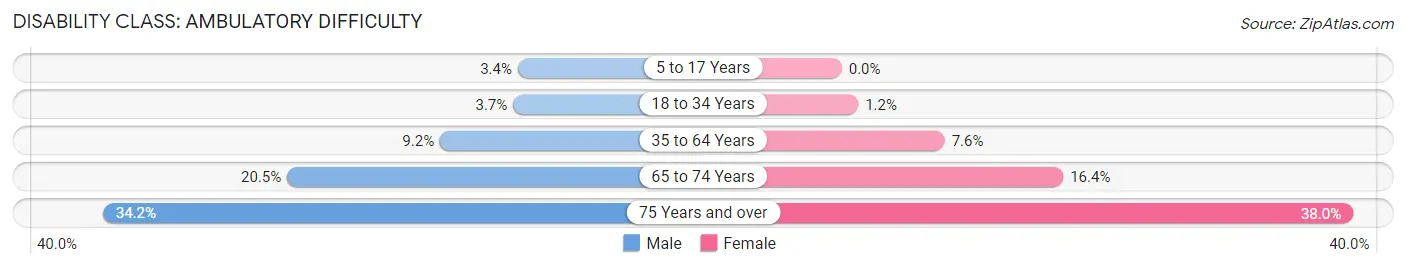
| Age Bracket | Male | Female |
| 5 to 17 Years | 156 (3.4%) | 0 (0.0%) |
| 18 to 34 Years | 215 (3.7%) | 67 (1.2%) |
| 35 to 64 Years | 978 (9.2%) | 845 (7.6%) |
| 65 to 74 Years | 550 (20.5%) | 478 (16.4%) |
| 75 Years and over | 463 (34.2%) | 715 (38.0%) |
Disability Class: Self-Care Difficulty
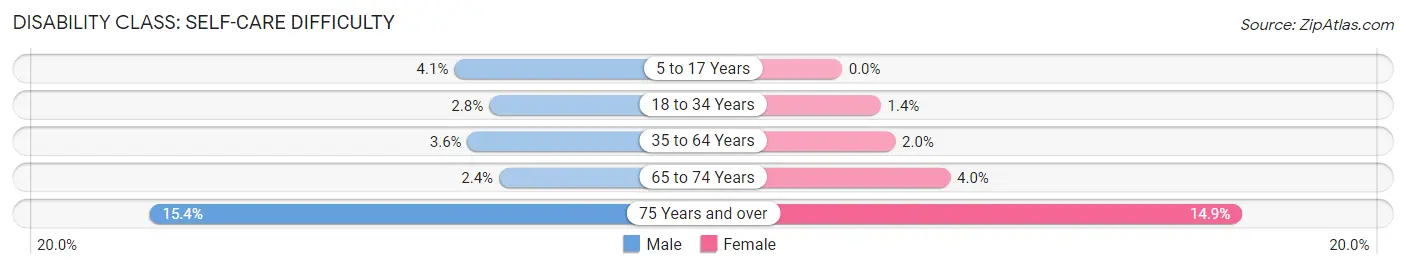
| Age Bracket | Male | Female |
| 5 to 17 Years | 187 (4.1%) | 0 (0.0%) |
| 18 to 34 Years | 159 (2.8%) | 79 (1.4%) |
| 35 to 64 Years | 380 (3.6%) | 219 (2.0%) |
| 65 to 74 Years | 64 (2.4%) | 117 (4.0%) |
| 75 Years and over | 208 (15.4%) | 280 (14.9%) |
Technology Access in Dickson County
Computing Device Access in Dickson County
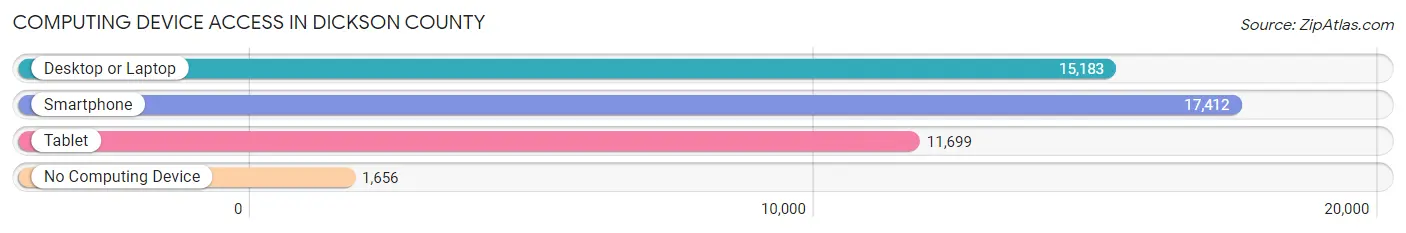
| Device Type | # Households | % Households |
| Desktop or Laptop | 15,183 | 74.7% |
| Smartphone | 17,412 | 85.7% |
| Tablet | 11,699 | 57.6% |
| No Computing Device | 1,656 | 8.2% |
| Total | 20,329 | 100.0% |
Internet Access in Dickson County
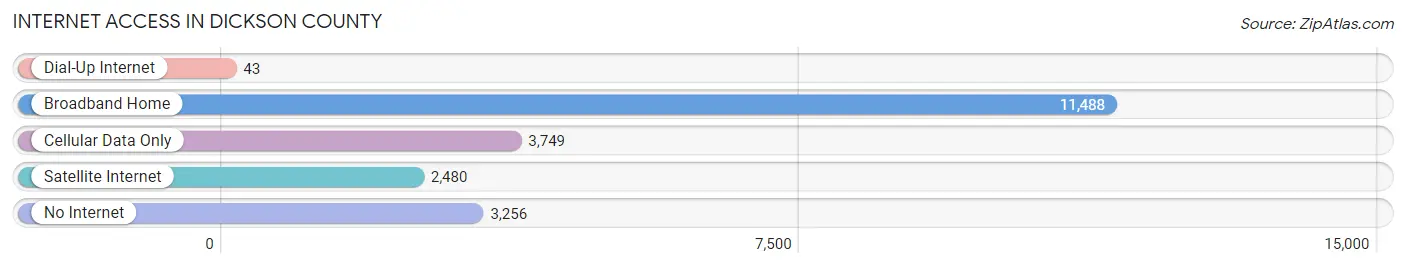
| Internet Type | # Households | % Households |
| Dial-Up Internet | 43 | 0.2% |
| Broadband Home | 11,488 | 56.5% |
| Cellular Data Only | 3,749 | 18.4% |
| Satellite Internet | 2,480 | 12.2% |
| No Internet | 3,256 | 16.0% |
| Total | 20,329 | 100.0% |
Dickson County Summary
Dickson County is located in the state of Tennessee in the United States. It is part of the Nashville-Davidson-Murfreesboro-Franklin Metropolitan Statistical Area. The county was established in 1803 and named after William Dickson, a Revolutionary War veteran and state legislator. As of the 2010 census, the population was 49,666.
Geography
Dickson County is located in Middle Tennessee, approximately 50 miles west of Nashville. It is bordered by Cheatham County to the north, Hickman County to the east, Humphreys County to the south, and Houston and Montgomery counties to the west. The county covers an area of 517 square miles, of which 514 square miles is land and 3 square miles is water. The county is located in the Central Basin of Tennessee, which is characterized by rolling hills and valleys. The county is drained by the Cumberland River and its tributaries, including the Harpeth River, Big Sandy Creek, and Sycamore Creek.
Demographics
As of the 2010 census, there were 49,666 people, 18,945 households, and 13,845 families residing in the county. The population density was 96.7 people per square mile. The racial makeup of the county was 92.2% White, 4.7% African American, 0.4% Native American, 0.7% Asian, 0.2% Pacific Islander, 0.7% from other races, and 1.2% from two or more races. Hispanic or Latino of any race were 2.2% of the population.
The median income for a household in the county was $45,837, and the median income for a family was $54,837. The per capita income for the county was $21,945. About 8.7% of families and 11.2% of the population were below the poverty line, including 15.2% of those under age 18 and 10.2% of those age 65 or over.
Economy
Dickson County is home to a variety of industries, including manufacturing, healthcare, retail, and tourism. The county is home to several large employers, including Dickson County Medical Center, Dickson County Schools, and Dickson County Government. The county is also home to several smaller businesses, including restaurants, retail stores, and service providers.
The county is home to several tourist attractions, including the Dickson County Historical Museum, the Dickson County Fairgrounds, and the Dickson County Courthouse. The county is also home to several parks, including the Dickson County Park, the Dickson County Nature Center, and the Dickson County Recreation Center.
The county is served by several major highways, including Interstate 40, U.S. Route 70, and U.S. Route 46. The county is also served by several airports, including the Dickson County Airport, the Nashville International Airport, and the Murfreesboro Municipal Airport.
Conclusion
Dickson County is a vibrant and diverse county located in Middle Tennessee. It is home to a variety of industries, including manufacturing, healthcare, retail, and tourism. The county is served by several major highways and airports, making it an ideal location for businesses and tourists alike. The county is also home to several tourist attractions, parks, and other recreational activities. With its strong economy and diverse population, Dickson County is an ideal place to live, work, and play.
Common Questions
What is the Total Population of Dickson County?
Total Population of Dickson County is 54,563.
What is the Total Male Population of Dickson County?
Total Male Population of Dickson County is 26,899.
What is the Total Female Population of Dickson County?
Total Female Population of Dickson County is 27,664.
What is the Ratio of Males per 100 Females in Dickson County?
There are 97.23 Males per 100 Females in Dickson County.
What is the Ratio of Females per 100 Males in Dickson County?
There are 102.84 Females per 100 Males in Dickson County.
What is the Median Population Age in Dickson County?
Median Population Age in Dickson County is 39.2 Years.
What is the Average Family Size in Dickson County
Average Family Size in Dickson County is 3.1 People.
What is the Average Household Size in Dickson County
Average Household Size in Dickson County is 2.6 People.
What is Per Capita Income in Dickson County?
Per Capita income in Dickson County is $33,582.
What is the Median Family Income in Dickson County?
Median Family Income in Dickson County is $80,709.
What is the Median Household income in Dickson County?
Median Household Income in Dickson County is $68,492.
What is Income or Wage Gap in Dickson County?
Income or Wage Gap in Dickson County is 26.7%.
Women in Dickson County earn 73.3 cents for every dollar earned by a man.
What is Family Income Deficit in Dickson County?
Family Income Deficit in Dickson County is $9,605.
Families that are below poverty line in Dickson County earn $9,605 less on average than the poverty threshold level.
What is Inequality or Gini Index in Dickson County?
Inequality or Gini Index in Dickson County is 0.41.
How Large is the Labor Force in Dickson County?
There are 27,112 People in the Labor Forcein in Dickson County.
What is the Percentage of People in the Labor Force in Dickson County?
62.3% of People are in the Labor Force in Dickson County.
What is the Unemployment Rate in Dickson County?
Unemployment Rate in Dickson County is 3.8%.