Davidson County, TN
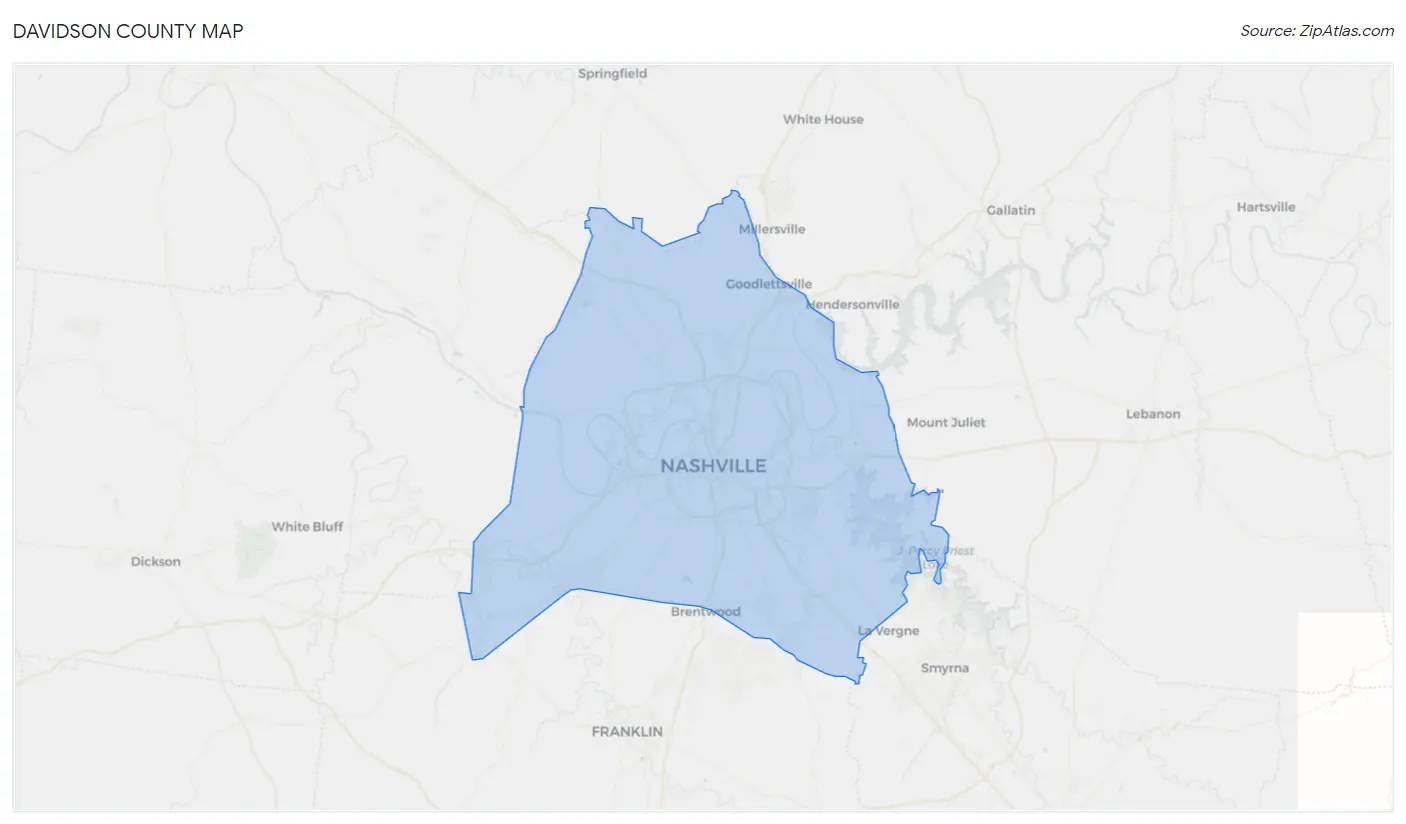
Davidson County Map
Davidson County Overview
709,786
TOTAL POPULATION
343,836
MALE POPULATION
365,950
FEMALE POPULATION
93.96
MALES / 100 FEMALES
106.43
FEMALES / 100 MALES
34.7
MEDIAN AGE
3.0
AVG FAMILY SIZE
2.3
AVG HOUSEHOLD SIZE
$45,951
PER CAPITA INCOME
$91,346
AVG FAMILY INCOME
$71,863
AVG HOUSEHOLD INCOME
14.6%
WAGE / INCOME GAP [ % ]
85.4¢/ $1
WAGE / INCOME GAP [ $ ]
$11,805
FAMILY INCOME DEFICIT
0.49
INEQUALITY / GINI INDEX
415,671
LABOR FORCE [ PEOPLE ]
71.7%
PERCENT IN LABOR FORCE
4.6%
UNEMPLOYMENT RATE
Davidson County Area Codes
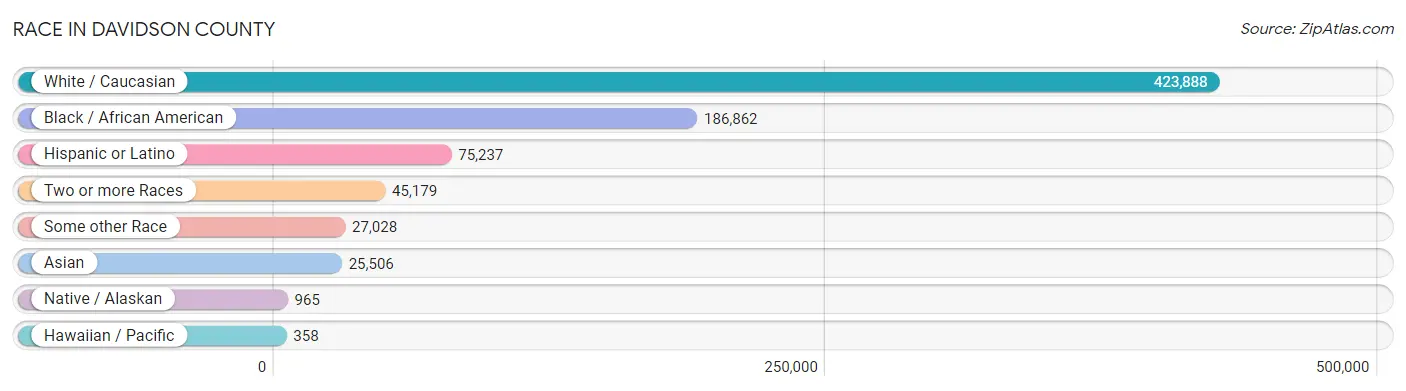
Race in Davidson County
The most populous races in Davidson County are White / Caucasian (423,888 | 59.7%), Black / African American (186,862 | 26.3%), and Hispanic or Latino (75,237 | 10.6%).
| Race | # Population | % Population |
| Asian | 25,506 | 3.6% |
| Black / African American | 186,862 | 26.3% |
| Hawaiian / Pacific | 358 | 0.1% |
| Hispanic or Latino | 75,237 | 10.6% |
| Native / Alaskan | 965 | 0.1% |
| White / Caucasian | 423,888 | 59.7% |
| Two or more Races | 45,179 | 6.4% |
| Some other Race | 27,028 | 3.8% |
| Total | 709,786 | 100.0% |
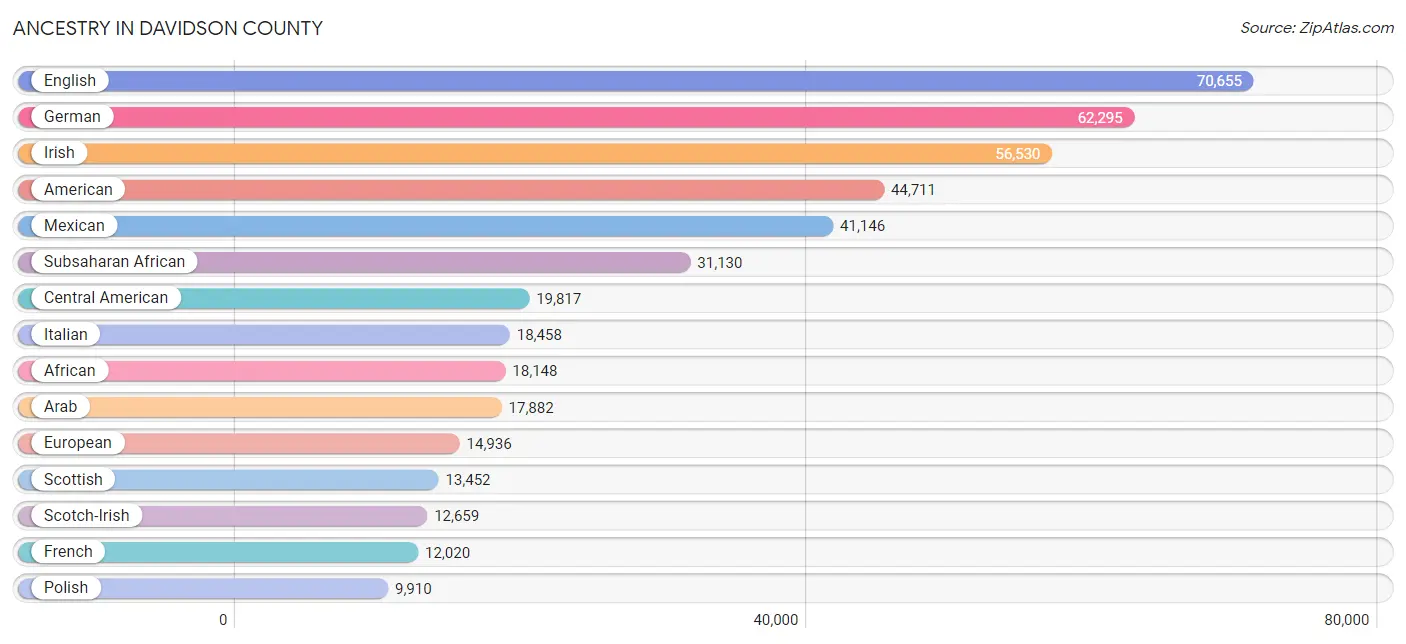
Ancestry in Davidson County
The most populous ancestries reported in Davidson County are English (70,655 | 10.0%), German (62,295 | 8.8%), Irish (56,530 | 8.0%), American (44,711 | 6.3%), and Mexican (41,146 | 5.8%), together accounting for 38.8% of all Davidson County residents.
| Ancestry | # Population | % Population |
| Afghan | 1,238 | 0.2% |
| African | 18,148 | 2.6% |
| Alaska Native | 93 | 0.0% |
| Albanian | 947 | 0.1% |
| American | 44,711 | 6.3% |
| Apache | 202 | 0.0% |
| Arab | 17,882 | 2.5% |
| Argentinean | 288 | 0.0% |
| Armenian | 463 | 0.1% |
| Australian | 292 | 0.0% |
| Austrian | 1,566 | 0.2% |
| Bahamian | 86 | 0.0% |
| Barbadian | 10 | 0.0% |
| Basque | 45 | 0.0% |
| Belgian | 359 | 0.1% |
| Belizean | 244 | 0.0% |
| Bhutanese | 1,204 | 0.2% |
| Blackfeet | 319 | 0.0% |
| Bolivian | 114 | 0.0% |
| Brazilian | 888 | 0.1% |
| British | 5,215 | 0.7% |
| British West Indian | 346 | 0.1% |
| Bulgarian | 246 | 0.0% |
| Burmese | 3,292 | 0.5% |
| Cajun | 187 | 0.0% |
| Cambodian | 11 | 0.0% |
| Canadian | 949 | 0.1% |
| Cape Verdean | 24 | 0.0% |
| Carpatho Rusyn | 26 | 0.0% |
| Celtic | 76 | 0.0% |
| Central American | 19,817 | 2.8% |
| Central American Indian | 282 | 0.0% |
| Cherokee | 2,122 | 0.3% |
| Chickasaw | 50 | 0.0% |
| Chilean | 321 | 0.1% |
| Chippewa | 169 | 0.0% |
| Choctaw | 170 | 0.0% |
| Colombian | 1,024 | 0.1% |
| Comanche | 73 | 0.0% |
| Costa Rican | 336 | 0.1% |
| Creek | 87 | 0.0% |
| Croatian | 679 | 0.1% |
| Crow | 25 | 0.0% |
| Cuban | 3,254 | 0.5% |
| Czech | 1,071 | 0.2% |
| Czechoslovakian | 259 | 0.0% |
| Danish | 1,095 | 0.2% |
| Delaware | 19 | 0.0% |
| Dominican | 272 | 0.0% |
| Dutch | 4,610 | 0.6% |
| Eastern European | 2,115 | 0.3% |
| Ecuadorian | 539 | 0.1% |
| Egyptian | 7,167 | 1.0% |
| English | 70,655 | 10.0% |
| Ethiopian | 2,703 | 0.4% |
| European | 14,936 | 2.1% |
| Fijian | 41 | 0.0% |
| Filipino | 124 | 0.0% |
| Finnish | 552 | 0.1% |
| French | 12,020 | 1.7% |
| French Canadian | 1,614 | 0.2% |
| German | 62,295 | 8.8% |
| German Russian | 35 | 0.0% |
| Ghanaian | 673 | 0.1% |
| Greek | 1,839 | 0.3% |
| Guamanian / Chamorro | 65 | 0.0% |
| Guatemalan | 5,359 | 0.8% |
| Guyanese | 128 | 0.0% |
| Haitian | 1,029 | 0.1% |
| Honduran | 7,948 | 1.1% |
| Hungarian | 1,139 | 0.2% |
| Icelander | 51 | 0.0% |
| Indian (Asian) | 4,960 | 0.7% |
| Indonesian | 2,166 | 0.3% |
| Inupiat | 87 | 0.0% |
| Iranian | 1,065 | 0.2% |
| Iraqi | 2,025 | 0.3% |
| Irish | 56,530 | 8.0% |
| Iroquois | 121 | 0.0% |
| Israeli | 86 | 0.0% |
| Italian | 18,458 | 2.6% |
| Jamaican | 1,480 | 0.2% |
| Japanese | 942 | 0.1% |
| Jordanian | 115 | 0.0% |
| Kenyan | 292 | 0.0% |
| Korean | 3,199 | 0.4% |
| Laotian | 190 | 0.0% |
| Latvian | 194 | 0.0% |
| Lebanese | 959 | 0.1% |
| Liberian | 228 | 0.0% |
| Lithuanian | 710 | 0.1% |
| Lumbee | 32 | 0.0% |
| Luxembourger | 38 | 0.0% |
| Macedonian | 32 | 0.0% |
| Malaysian | 1,515 | 0.2% |
| Mexican | 41,146 | 5.8% |
| Mexican American Indian | 305 | 0.0% |
| Mongolian | 274 | 0.0% |
| Moroccan | 203 | 0.0% |
| Native Hawaiian | 455 | 0.1% |
| Navajo | 168 | 0.0% |
| New Zealander | 39 | 0.0% |
| Nicaraguan | 304 | 0.0% |
| Nigerian | 2,903 | 0.4% |
| Northern European | 723 | 0.1% |
| Norwegian | 4,165 | 0.6% |
| Osage | 19 | 0.0% |
| Ottawa | 3 | 0.0% |
| Pakistani | 821 | 0.1% |
| Palestinian | 379 | 0.1% |
| Panamanian | 424 | 0.1% |
| Paraguayan | 7 | 0.0% |
| Pennsylvania German | 14 | 0.0% |
| Peruvian | 635 | 0.1% |
| Polish | 9,910 | 1.4% |
| Portuguese | 668 | 0.1% |
| Potawatomi | 75 | 0.0% |
| Pueblo | 10 | 0.0% |
| Puerto Rican | 3,599 | 0.5% |
| Romanian | 634 | 0.1% |
| Russian | 3,504 | 0.5% |
| Salvadoran | 5,391 | 0.8% |
| Samoan | 435 | 0.1% |
| Scandinavian | 2,342 | 0.3% |
| Scotch-Irish | 12,659 | 1.8% |
| Scottish | 13,452 | 1.9% |
| Seminole | 28 | 0.0% |
| Senegalese | 155 | 0.0% |
| Serbian | 376 | 0.1% |
| Shoshone | 16 | 0.0% |
| Sierra Leonean | 11 | 0.0% |
| Sioux | 73 | 0.0% |
| Slavic | 103 | 0.0% |
| Slovak | 363 | 0.1% |
| Slovene | 201 | 0.0% |
| Somali | 1,127 | 0.2% |
| South African | 239 | 0.0% |
| South American | 3,506 | 0.5% |
| South American Indian | 60 | 0.0% |
| Spaniard | 527 | 0.1% |
| Spanish | 869 | 0.1% |
| Spanish American | 24 | 0.0% |
| Sri Lankan | 2,895 | 0.4% |
| Subsaharan African | 31,130 | 4.4% |
| Sudanese | 2,316 | 0.3% |
| Swedish | 3,943 | 0.6% |
| Swiss | 1,591 | 0.2% |
| Syrian | 219 | 0.0% |
| Thai | 5,545 | 0.8% |
| Tongan | 39 | 0.0% |
| Trinidadian and Tobagonian | 232 | 0.0% |
| Turkish | 463 | 0.1% |
| U.S. Virgin Islander | 75 | 0.0% |
| Ugandan | 107 | 0.0% |
| Ukrainian | 1,229 | 0.2% |
| Uruguayan | 104 | 0.0% |
| Venezuelan | 462 | 0.1% |
| Vietnamese | 301 | 0.0% |
| Welsh | 3,626 | 0.5% |
| West Indian | 473 | 0.1% |
| Yaqui | 101 | 0.0% |
| Yugoslavian | 296 | 0.0% |
| Zimbabwean | 29 | 0.0% | View All 163 Rows |
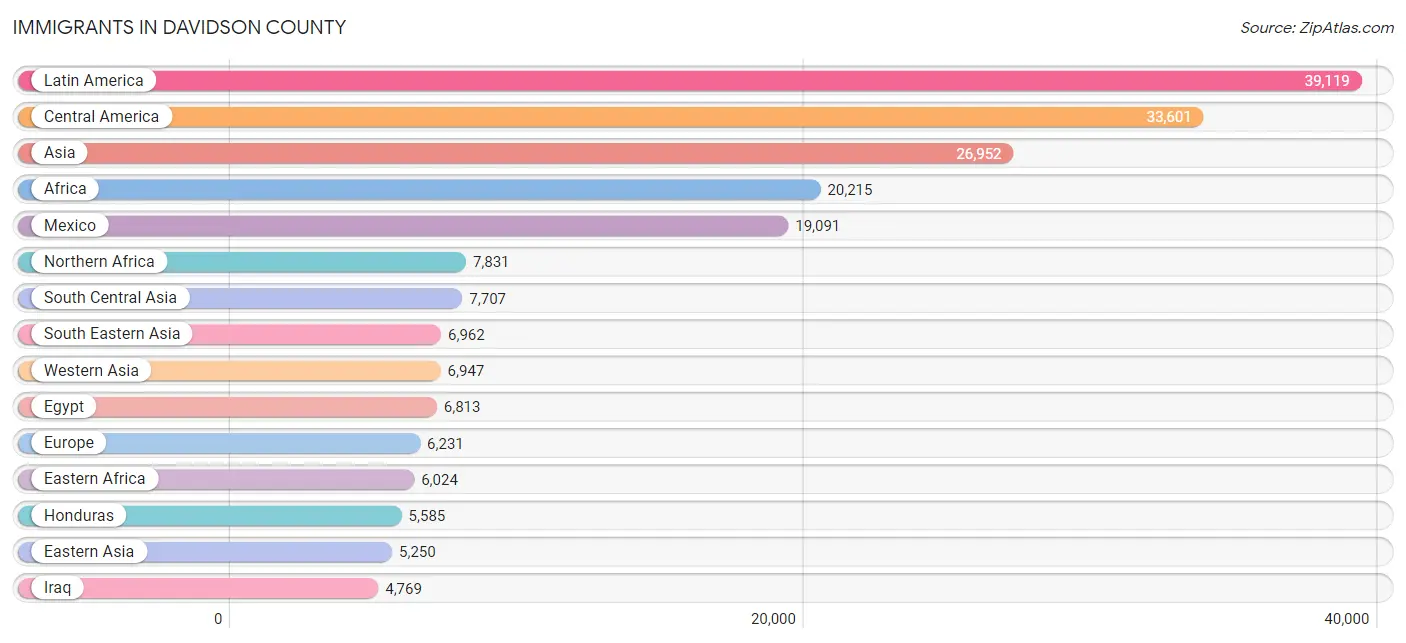
Immigrants in Davidson County
The most numerous immigrant groups reported in Davidson County came from Latin America (39,119 | 5.5%), Central America (33,601 | 4.7%), Asia (26,952 | 3.8%), Africa (20,215 | 2.9%), and Mexico (19,091 | 2.7%), together accounting for 19.6% of all Davidson County residents.
| Immigration Origin | # Population | % Population |
| Afghanistan | 1,091 | 0.2% |
| Africa | 20,215 | 2.9% |
| Albania | 308 | 0.0% |
| Argentina | 59 | 0.0% |
| Armenia | 1 | 0.0% |
| Asia | 26,952 | 3.8% |
| Australia | 253 | 0.0% |
| Austria | 74 | 0.0% |
| Bahamas | 44 | 0.0% |
| Bangladesh | 393 | 0.1% |
| Belarus | 63 | 0.0% |
| Belgium | 27 | 0.0% |
| Belize | 144 | 0.0% |
| Bolivia | 71 | 0.0% |
| Bosnia and Herzegovina | 192 | 0.0% |
| Brazil | 248 | 0.0% |
| Bulgaria | 114 | 0.0% |
| Cambodia | 264 | 0.0% |
| Cameroon | 156 | 0.0% |
| Canada | 2,161 | 0.3% |
| Caribbean | 3,267 | 0.5% |
| Central America | 33,601 | 4.7% |
| Chile | 181 | 0.0% |
| China | 2,864 | 0.4% |
| Colombia | 614 | 0.1% |
| Congo | 529 | 0.1% |
| Costa Rica | 192 | 0.0% |
| Croatia | 96 | 0.0% |
| Cuba | 1,728 | 0.2% |
| Czechoslovakia | 37 | 0.0% |
| Denmark | 30 | 0.0% |
| Dominica | 29 | 0.0% |
| Dominican Republic | 153 | 0.0% |
| Eastern Africa | 6,024 | 0.9% |
| Eastern Asia | 5,250 | 0.7% |
| Eastern Europe | 2,458 | 0.4% |
| Ecuador | 132 | 0.0% |
| Egypt | 6,813 | 1.0% |
| El Salvador | 3,726 | 0.5% |
| England | 477 | 0.1% |
| Eritrea | 255 | 0.0% |
| Ethiopia | 2,887 | 0.4% |
| Europe | 6,231 | 0.9% |
| Fiji | 15 | 0.0% |
| France | 273 | 0.0% |
| Germany | 845 | 0.1% |
| Ghana | 727 | 0.1% |
| Greece | 149 | 0.0% |
| Grenada | 56 | 0.0% |
| Guatemala | 4,660 | 0.7% |
| Guyana | 175 | 0.0% |
| Haiti | 317 | 0.0% |
| Honduras | 5,585 | 0.8% |
| Hong Kong | 15 | 0.0% |
| Hungary | 14 | 0.0% |
| India | 2,866 | 0.4% |
| Indonesia | 100 | 0.0% |
| Iran | 803 | 0.1% |
| Iraq | 4,769 | 0.7% |
| Ireland | 224 | 0.0% |
| Israel | 237 | 0.0% |
| Italy | 297 | 0.0% |
| Jamaica | 493 | 0.1% |
| Japan | 469 | 0.1% |
| Jordan | 271 | 0.0% |
| Kazakhstan | 63 | 0.0% |
| Kenya | 302 | 0.0% |
| Korea | 1,906 | 0.3% |
| Kuwait | 317 | 0.0% |
| Laos | 833 | 0.1% |
| Latin America | 39,119 | 5.5% |
| Lebanon | 120 | 0.0% |
| Liberia | 267 | 0.0% |
| Malaysia | 467 | 0.1% |
| Mexico | 19,091 | 2.7% |
| Middle Africa | 2,063 | 0.3% |
| Moldova | 26 | 0.0% |
| Morocco | 174 | 0.0% |
| Nepal | 722 | 0.1% |
| Netherlands | 37 | 0.0% |
| Nicaragua | 150 | 0.0% |
| Nigeria | 1,407 | 0.2% |
| North Macedonia | 8 | 0.0% |
| Northern Africa | 7,831 | 1.1% |
| Northern Europe | 1,874 | 0.3% |
| Oceania | 432 | 0.1% |
| Pakistan | 287 | 0.0% |
| Panama | 53 | 0.0% |
| Peru | 330 | 0.1% |
| Philippines | 1,452 | 0.2% |
| Poland | 300 | 0.0% |
| Romania | 146 | 0.0% |
| Russia | 339 | 0.1% |
| Saudi Arabia | 64 | 0.0% |
| Scotland | 145 | 0.0% |
| Senegal | 111 | 0.0% |
| Serbia | 43 | 0.0% |
| Sierra Leone | 45 | 0.0% |
| Singapore | 37 | 0.0% |
| Somalia | 1,277 | 0.2% |
| South Africa | 509 | 0.1% |
| South America | 2,251 | 0.3% |
| South Central Asia | 7,707 | 1.1% |
| South Eastern Asia | 6,962 | 1.0% |
| Southern Europe | 600 | 0.1% |
| Spain | 154 | 0.0% |
| Sri Lanka | 48 | 0.0% |
| Sudan | 745 | 0.1% |
| Sweden | 80 | 0.0% |
| Switzerland | 35 | 0.0% |
| Syria | 159 | 0.0% |
| Taiwan | 75 | 0.0% |
| Thailand | 792 | 0.1% |
| Trinidad and Tobago | 323 | 0.1% |
| Turkey | 416 | 0.1% |
| Uganda | 96 | 0.0% |
| Ukraine | 270 | 0.0% |
| Uruguay | 66 | 0.0% |
| Uzbekistan | 609 | 0.1% |
| Venezuela | 368 | 0.1% |
| Vietnam | 1,468 | 0.2% |
| West Indies | 11 | 0.0% |
| Western Africa | 2,746 | 0.4% |
| Western Asia | 6,947 | 1.0% |
| Western Europe | 1,291 | 0.2% |
| Yemen | 401 | 0.1% |
| Zaire | 1,315 | 0.2% |
| Zimbabwe | 55 | 0.0% | View All 128 Rows |
Sex and Age in Davidson County
Sex and Age in Davidson County
The most populous age groups in Davidson County are 25 to 29 Years (34,811 | 10.1%) for men and 25 to 29 Years (38,586 | 10.5%) for women.
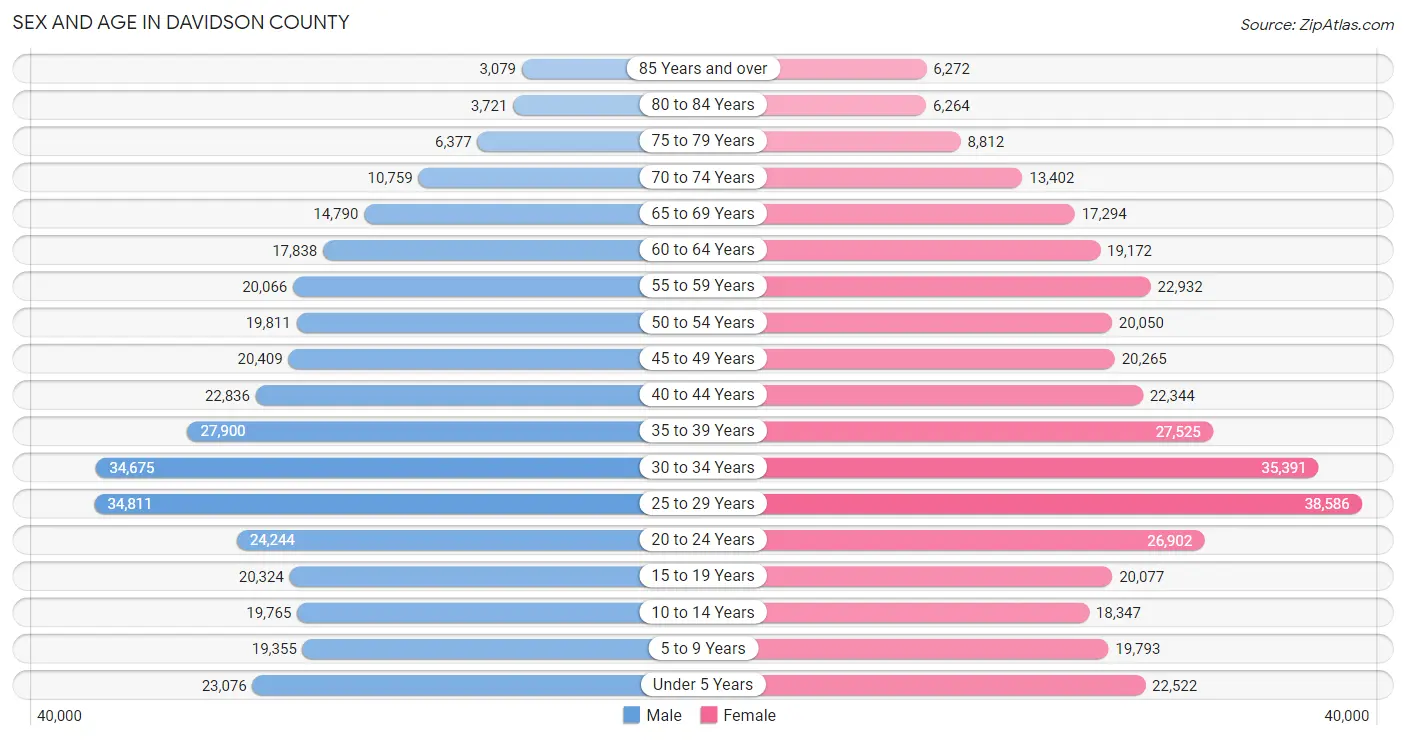
| Age Bracket | Male | Female |
| Under 5 Years | 23,076 (6.7%) | 22,522 (6.1%) |
| 5 to 9 Years | 19,355 (5.6%) | 19,793 (5.4%) |
| 10 to 14 Years | 19,765 (5.8%) | 18,347 (5.0%) |
| 15 to 19 Years | 20,324 (5.9%) | 20,077 (5.5%) |
| 20 to 24 Years | 24,244 (7.0%) | 26,902 (7.3%) |
| 25 to 29 Years | 34,811 (10.1%) | 38,586 (10.5%) |
| 30 to 34 Years | 34,675 (10.1%) | 35,391 (9.7%) |
| 35 to 39 Years | 27,900 (8.1%) | 27,525 (7.5%) |
| 40 to 44 Years | 22,836 (6.6%) | 22,344 (6.1%) |
| 45 to 49 Years | 20,409 (5.9%) | 20,265 (5.5%) |
| 50 to 54 Years | 19,811 (5.8%) | 20,050 (5.5%) |
| 55 to 59 Years | 20,066 (5.8%) | 22,932 (6.3%) |
| 60 to 64 Years | 17,838 (5.2%) | 19,172 (5.2%) |
| 65 to 69 Years | 14,790 (4.3%) | 17,294 (4.7%) |
| 70 to 74 Years | 10,759 (3.1%) | 13,402 (3.7%) |
| 75 to 79 Years | 6,377 (1.8%) | 8,812 (2.4%) |
| 80 to 84 Years | 3,721 (1.1%) | 6,264 (1.7%) |
| 85 Years and over | 3,079 (0.9%) | 6,272 (1.7%) |
| Total | 343,836 (100.0%) | 365,950 (100.0%) |
Families and Households in Davidson County
Median Family Size in Davidson County
The median family size in Davidson County is 3.04 persons per family, with single female/mother families (37,233 | 23.5%) accounting for the largest median family size of 3.06 persons per family. On the other hand, single male/father families (12,134 | 7.6%) represent the smallest median family size with 2.90 persons per family.
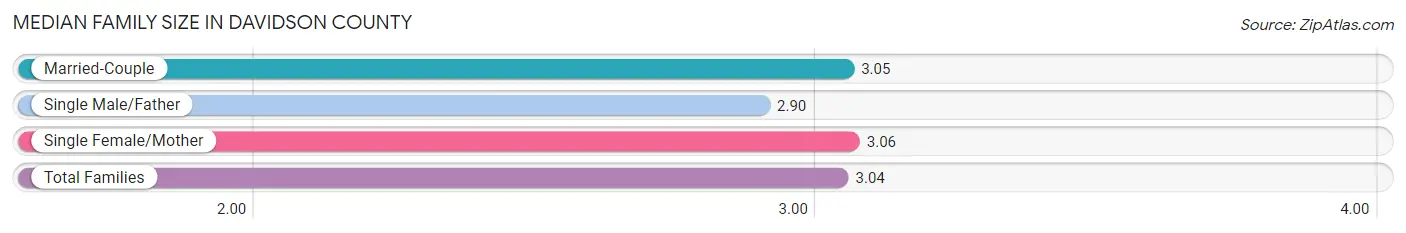
| Family Type | # Families | Family Size |
| Married-Couple | 109,156 (68.9%) | 3.05 |
| Single Male/Father | 12,134 (7.6%) | 2.90 |
| Single Female/Mother | 37,233 (23.5%) | 3.06 |
| Total Families | 158,523 (100.0%) | 3.04 |
Median Household Size in Davidson County
The median household size in Davidson County is 2.28 persons per household, with single male/father households (12,134 | 4.0%) accounting for the largest median household size of 3.26 persons per household. non-family households (144,140 | 47.6%) represent the smallest median household size with 1.34 persons per household.
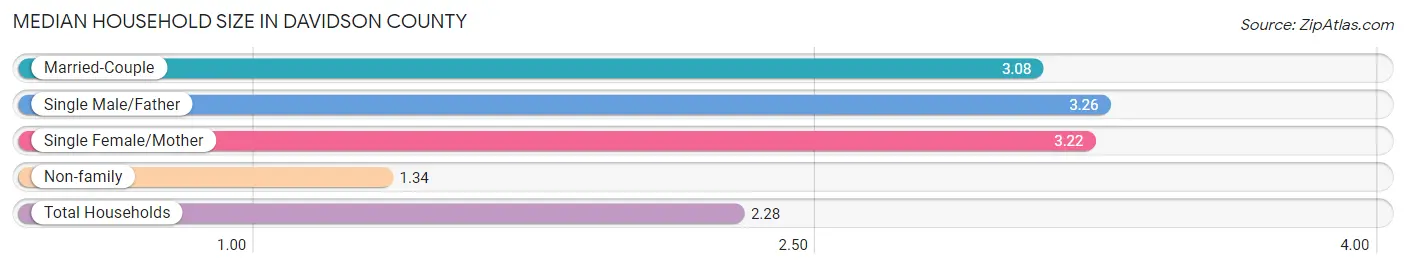
| Household Type | # Households | Household Size |
| Married-Couple | 109,156 (36.1%) | 3.08 |
| Single Male/Father | 12,134 (4.0%) | 3.26 |
| Single Female/Mother | 37,233 (12.3%) | 3.22 |
| Non-family | 144,140 (47.6%) | 1.34 |
| Total Households | 302,663 (100.0%) | 2.28 |
Household Size by Marriage Status in Davidson County
Out of a total of 302,663 households in Davidson County, 158,523 (52.4%) are family households, while 144,140 (47.6%) are nonfamily households. The most numerous type of family households are 2-person households, comprising 73,887, and the most common type of nonfamily households are 1-person households, comprising 109,517.
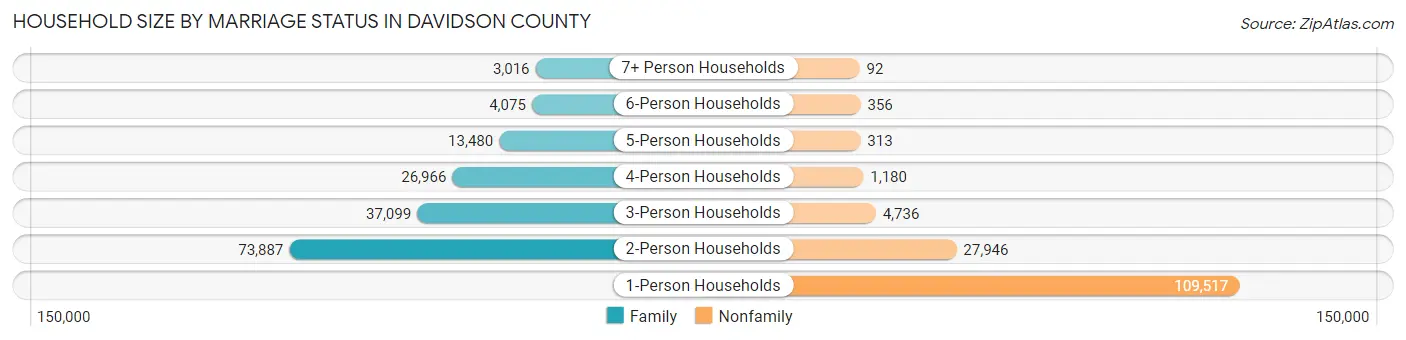
| Household Size | Family Households | Nonfamily Households |
| 1-Person Households | - | 109,517 (36.2%) |
| 2-Person Households | 73,887 (24.4%) | 27,946 (9.2%) |
| 3-Person Households | 37,099 (12.3%) | 4,736 (1.6%) |
| 4-Person Households | 26,966 (8.9%) | 1,180 (0.4%) |
| 5-Person Households | 13,480 (4.4%) | 313 (0.1%) |
| 6-Person Households | 4,075 (1.3%) | 356 (0.1%) |
| 7+ Person Households | 3,016 (1.0%) | 92 (0.0%) |
| Total | 158,523 (52.4%) | 144,140 (47.6%) |
Female Fertility in Davidson County
Fertility by Age in Davidson County
Average fertility rate in Davidson County is 56.0 births per 1,000 women. Women in the age bracket of 20 to 34 years have the highest fertility rate with 77.0 births per 1,000 women. Women in the age bracket of 20 to 34 years acount for 71.1% of all women with births.
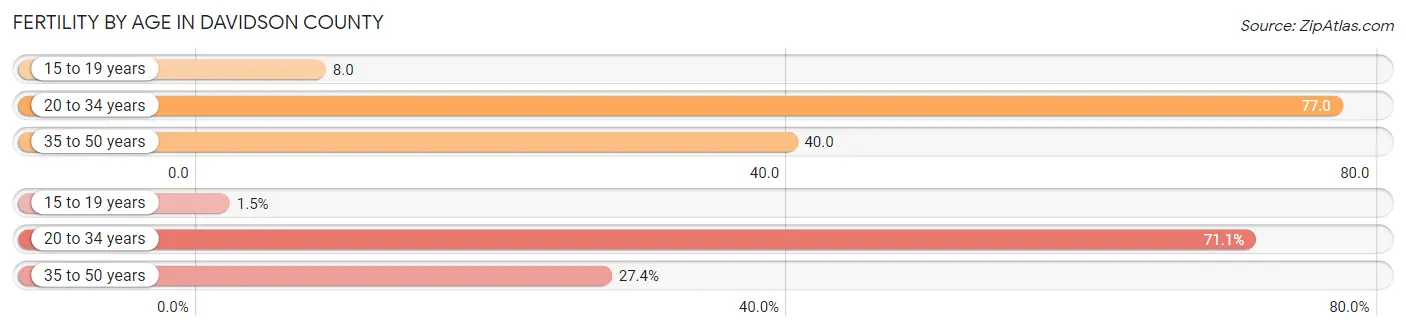
| Age Bracket | Women with Births | Births / 1,000 Women |
| 15 to 19 years | 161 (1.5%) | 8.0 |
| 20 to 34 years | 7,742 (71.1%) | 77.0 |
| 35 to 50 years | 2,983 (27.4%) | 40.0 |
| Total | 10,886 (100.0%) | 56.0 |
Fertility by Age by Marriage Status in Davidson County
67.1% of women with births (10,886) in Davidson County are married. The highest percentage of unmarried women with births falls into 15 to 19 years age bracket with 100.0% of them unmarried at the time of birth, while the lowest percentage of unmarried women with births belong to 35 to 50 years age bracket with 29.3% of them unmarried.
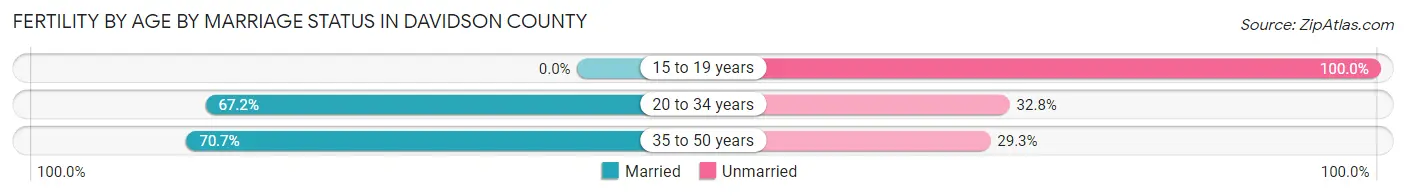
| Age Bracket | Married | Unmarried |
| 15 to 19 years | 0 (0.0%) | 161 (100.0%) |
| 20 to 34 years | 5,203 (67.2%) | 2,539 (32.8%) |
| 35 to 50 years | 2,109 (70.7%) | 874 (29.3%) |
| Total | 7,305 (67.1%) | 3,581 (32.9%) |
Fertility by Education in Davidson County
Average fertility rate in Davidson County is 56.0 births per 1,000 women. Women with the education attainment of graduate degree have the highest fertility rate of 71.0 births per 1,000 women, while women with the education attainment of less than high school have the lowest fertility at 44.0 births per 1,000 women. Women with the education attainment of bachelor's degree represent 26.3% of all women with births.
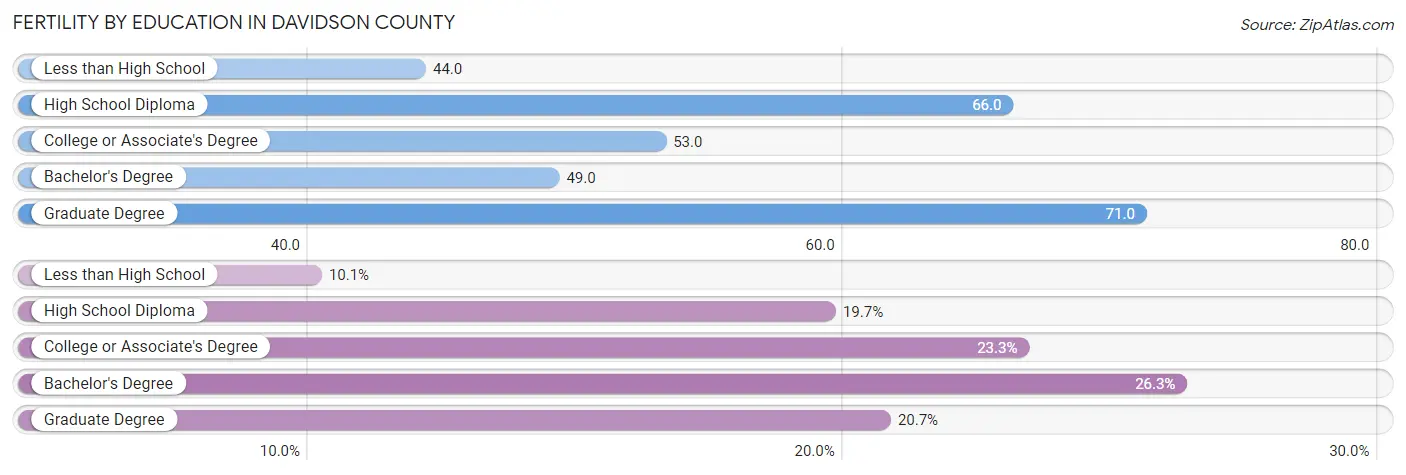
| Educational Attainment | Women with Births | Births / 1,000 Women |
| Less than High School | 1,094 (10.1%) | 44.0 |
| High School Diploma | 2,142 (19.7%) | 66.0 |
| College or Associate's Degree | 2,536 (23.3%) | 53.0 |
| Bachelor's Degree | 2,859 (26.3%) | 49.0 |
| Graduate Degree | 2,255 (20.7%) | 71.0 |
| Total | 10,886 (100.0%) | 56.0 |
Fertility by Education by Marriage Status in Davidson County
32.9% of women with births in Davidson County are unmarried. Women with the educational attainment of graduate degree are most likely to be married with 92.0% of them married at childbirth, while women with the educational attainment of high school diploma are least likely to be married with 54.6% of them unmarried at childbirth.
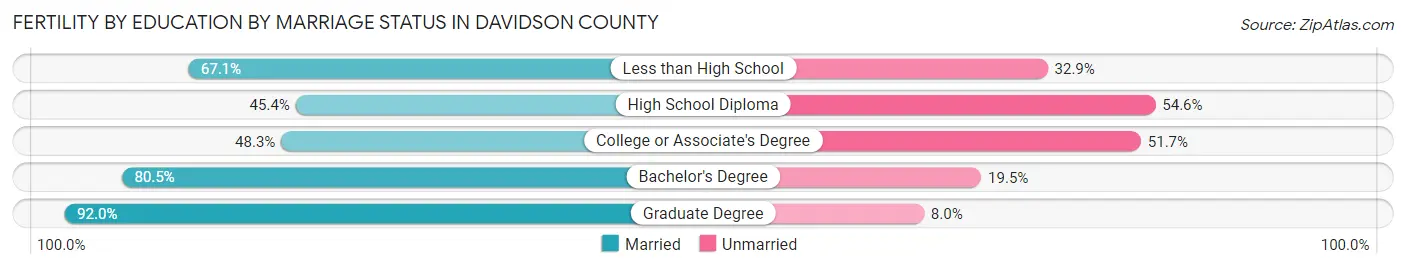
| Educational Attainment | Married | Unmarried |
| Less than High School | 734 (67.1%) | 360 (32.9%) |
| High School Diploma | 972 (45.4%) | 1,170 (54.6%) |
| College or Associate's Degree | 1,225 (48.3%) | 1,311 (51.7%) |
| Bachelor's Degree | 2,301 (80.5%) | 558 (19.5%) |
| Graduate Degree | 2,075 (92.0%) | 180 (8.0%) |
| Total | 7,305 (67.1%) | 3,581 (32.9%) |
Income in Davidson County
Income Overview in Davidson County
Per Capita Income in Davidson County is $45,951, while median incomes of families and households are $91,346 and $71,863 respectively.
| Characteristic | Number | Measure |
| Per Capita Income | 709,786 | $45,951 |
| Median Family Income | 158,523 | $91,346 |
| Mean Family Income | 158,523 | $128,581 |
| Median Household Income | 302,663 | $71,863 |
| Mean Household Income | 302,663 | $105,799 |
| Income Deficit | 158,523 | $11,805 |
| Wage / Income Gap (%) | 709,786 | 14.60% |
| Wage / Income Gap ($) | 709,786 | 85.40¢ per $1 |
| Gini / Inequality Index | 709,786 | 0.49 |
Earnings by Sex in Davidson County
Average Earnings in Davidson County are $43,114, $46,668 for men and $39,854 for women, a difference of 14.6%.
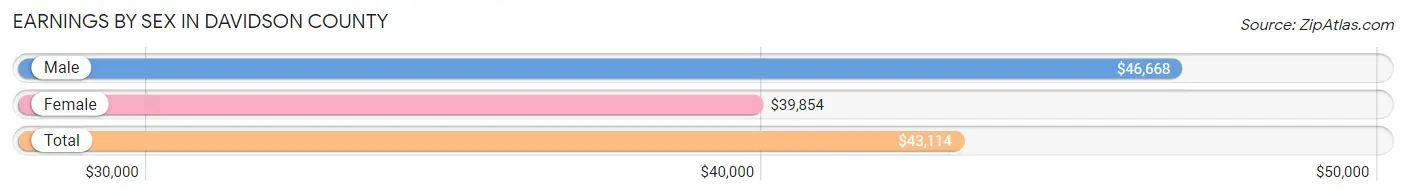
| Sex | Number | Average Earnings |
| Male | 222,122 (51.0%) | $46,668 |
| Female | 213,340 (49.0%) | $39,854 |
| Total | 435,462 (100.0%) | $43,114 |
Earnings by Sex by Income Bracket in Davidson County
The most common earnings brackets in Davidson County are $100,000+ for men (39,587 | 17.8%) and $100,000+ for women (20,854 | 9.8%).
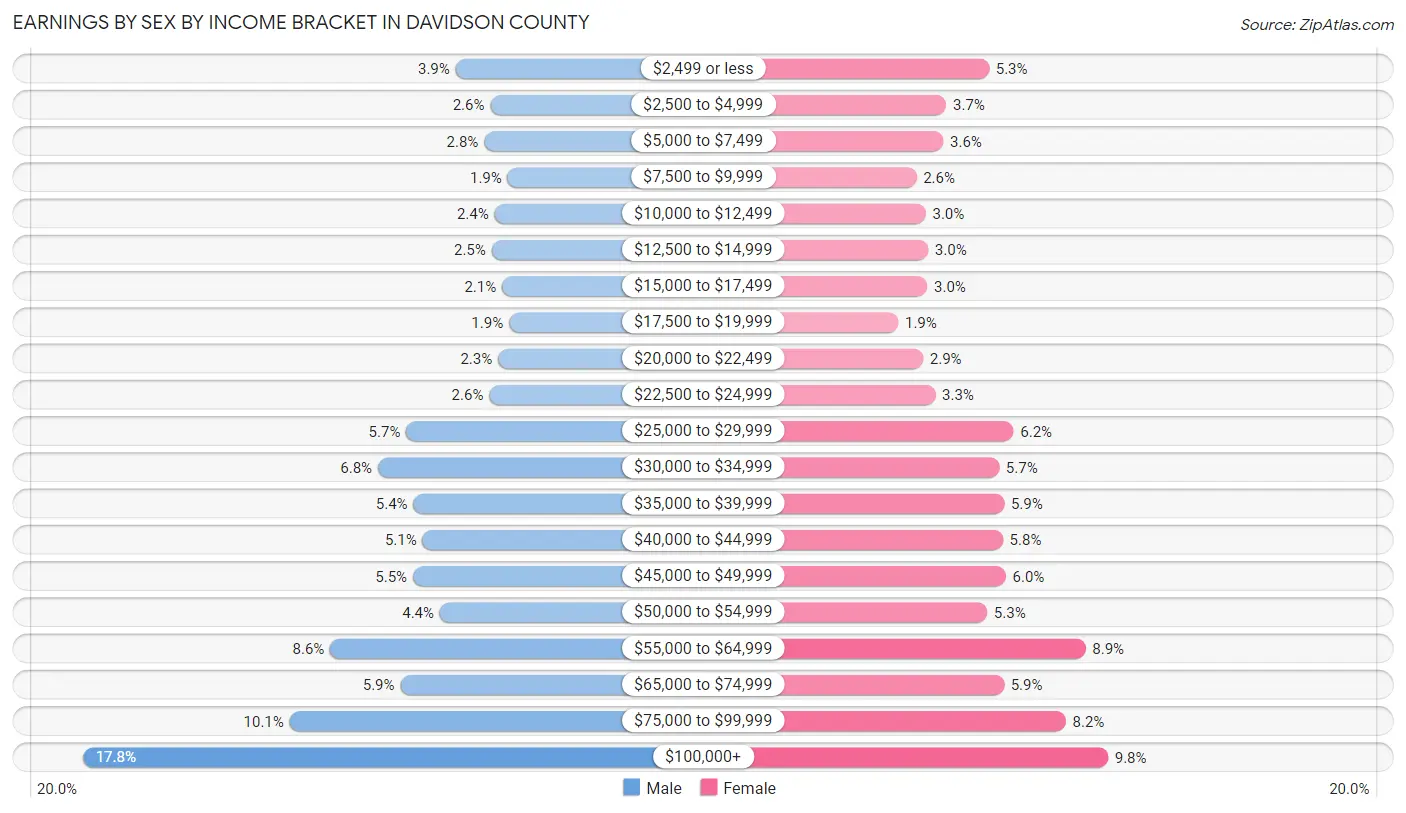
| Income | Male | Female |
| $2,499 or less | 8,548 (3.8%) | 11,351 (5.3%) |
| $2,500 to $4,999 | 5,671 (2.5%) | 7,931 (3.7%) |
| $5,000 to $7,499 | 6,172 (2.8%) | 7,710 (3.6%) |
| $7,500 to $9,999 | 4,214 (1.9%) | 5,551 (2.6%) |
| $10,000 to $12,499 | 5,311 (2.4%) | 6,299 (2.9%) |
| $12,500 to $14,999 | 5,552 (2.5%) | 6,477 (3.0%) |
| $15,000 to $17,499 | 4,681 (2.1%) | 6,412 (3.0%) |
| $17,500 to $19,999 | 4,101 (1.8%) | 4,101 (1.9%) |
| $20,000 to $22,499 | 5,027 (2.3%) | 6,090 (2.9%) |
| $22,500 to $24,999 | 5,754 (2.6%) | 7,056 (3.3%) |
| $25,000 to $29,999 | 12,650 (5.7%) | 13,317 (6.2%) |
| $30,000 to $34,999 | 15,019 (6.8%) | 12,165 (5.7%) |
| $35,000 to $39,999 | 12,058 (5.4%) | 12,560 (5.9%) |
| $40,000 to $44,999 | 11,303 (5.1%) | 12,469 (5.8%) |
| $45,000 to $49,999 | 12,111 (5.4%) | 12,697 (5.9%) |
| $50,000 to $54,999 | 9,854 (4.4%) | 11,199 (5.2%) |
| $55,000 to $64,999 | 18,988 (8.6%) | 19,068 (8.9%) |
| $65,000 to $74,999 | 13,160 (5.9%) | 12,549 (5.9%) |
| $75,000 to $99,999 | 22,361 (10.1%) | 17,484 (8.2%) |
| $100,000+ | 39,587 (17.8%) | 20,854 (9.8%) |
| Total | 222,122 (100.0%) | 213,340 (100.0%) |
Earnings by Sex by Educational Attainment in Davidson County
Average earnings in Davidson County are $52,930 for men and $45,488 for women, a difference of 14.1%. Men with an educational attainment of graduate degree enjoy the highest average annual earnings of $87,020, while those with less than high school education earn the least with $33,930. Women with an educational attainment of graduate degree earn the most with the average annual earnings of $64,924, while those with less than high school education have the smallest earnings of $24,435.
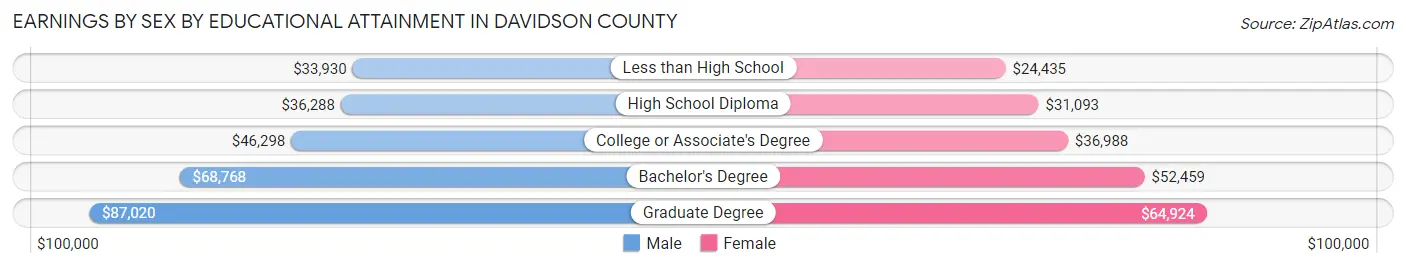
| Educational Attainment | Male Income | Female Income |
| Less than High School | $33,930 | $24,435 |
| High School Diploma | $36,288 | $31,093 |
| College or Associate's Degree | $46,298 | $36,988 |
| Bachelor's Degree | $68,768 | $52,459 |
| Graduate Degree | $87,020 | $64,924 |
| Total | $52,930 | $45,488 |
Family Income in Davidson County
Family Income Brackets in Davidson County
According to the Davidson County family income data, there are 31,071 families falling into the $100,000 to $149,999 income range, which is the most common income bracket and makes up 19.6% of all families. Conversely, the $10,000 to $14,999 income bracket is the least frequent group with only 2,536 families (1.6%) belonging to this category.
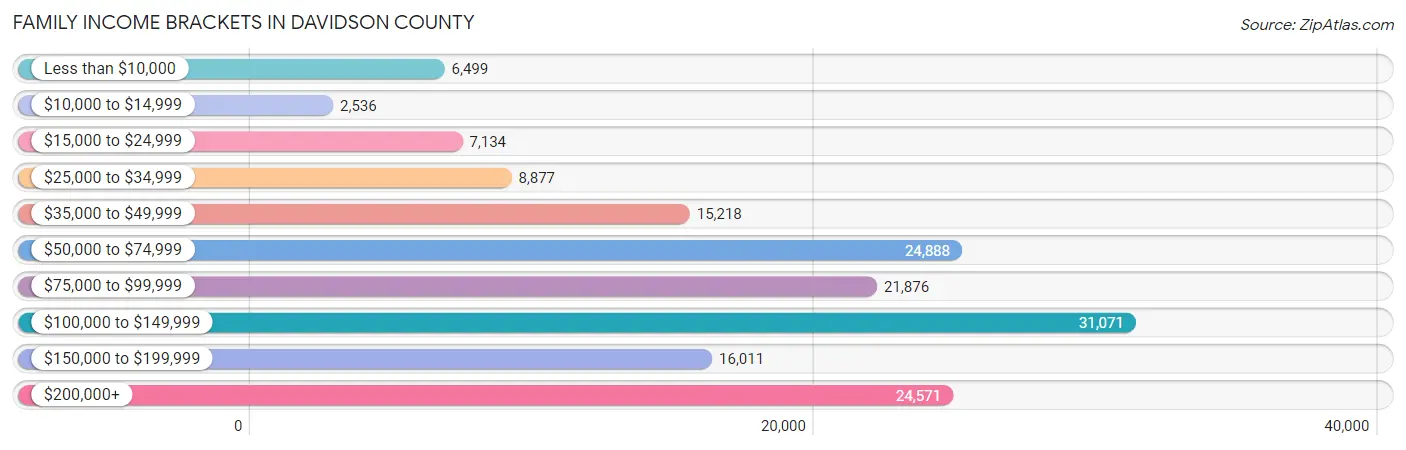
| Income Bracket | # Families | % Families |
| Less than $10,000 | 6,499 | 4.1% |
| $10,000 to $14,999 | 2,536 | 1.6% |
| $15,000 to $24,999 | 7,134 | 4.5% |
| $25,000 to $34,999 | 8,877 | 5.6% |
| $35,000 to $49,999 | 15,218 | 9.6% |
| $50,000 to $74,999 | 24,888 | 15.7% |
| $75,000 to $99,999 | 21,876 | 13.8% |
| $100,000 to $149,999 | 31,071 | 19.6% |
| $150,000 to $199,999 | 16,011 | 10.1% |
| $200,000+ | 24,571 | 15.5% |
Family Income by Famaliy Size in Davidson County
4-person families (25,843 | 16.3%) account for the highest median family income in Davidson County with $98,397 per family, while 2-person families (78,888 | 49.8%) have the highest median income of $44,273 per family member.
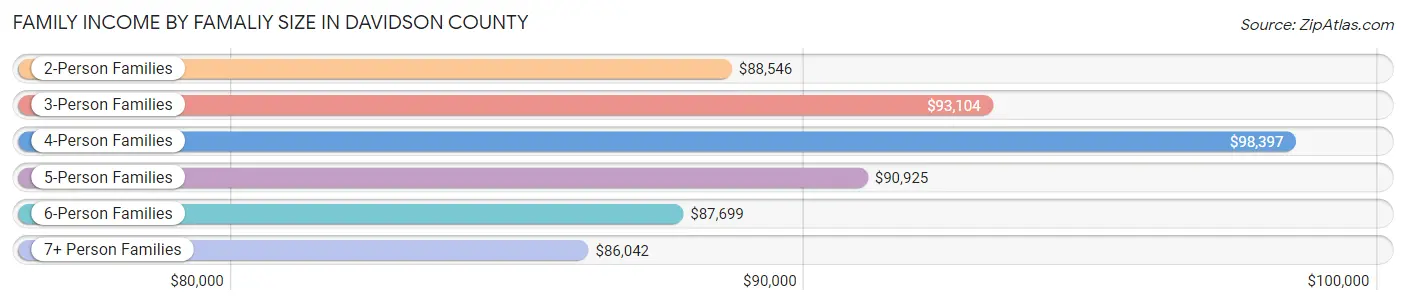
| Income Bracket | # Families | Median Income |
| 2-Person Families | 78,888 (49.8%) | $88,546 |
| 3-Person Families | 35,747 (22.6%) | $93,104 |
| 4-Person Families | 25,843 (16.3%) | $98,397 |
| 5-Person Families | 12,114 (7.6%) | $90,925 |
| 6-Person Families | 3,491 (2.2%) | $87,699 |
| 7+ Person Families | 2,440 (1.5%) | $86,042 |
| Total | 158,523 (100.0%) | $91,346 |
Family Income by Number of Earners in Davidson County
The median family income in Davidson County is $91,346, with families comprising 3+ earners (16,656) having the highest median family income of $126,416, while families with no earners (16,324) have the lowest median family income of $47,116, accounting for 10.5% and 10.3% of families, respectively.
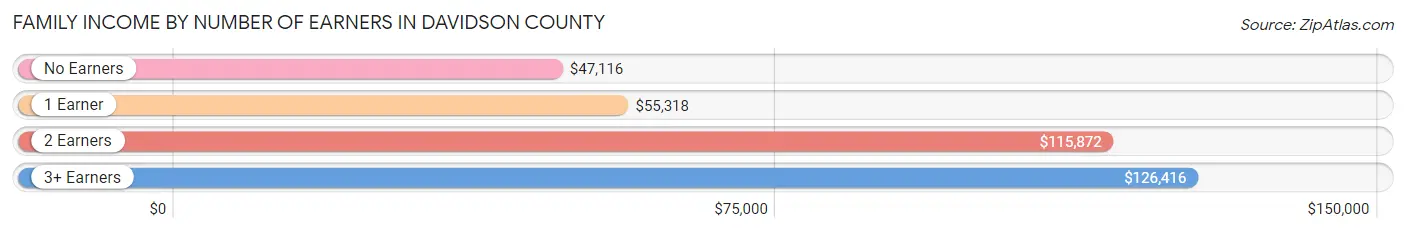
| Number of Earners | # Families | Median Income |
| No Earners | 16,324 (10.3%) | $47,116 |
| 1 Earner | 50,295 (31.7%) | $55,318 |
| 2 Earners | 75,248 (47.5%) | $115,872 |
| 3+ Earners | 16,656 (10.5%) | $126,416 |
| Total | 158,523 (100.0%) | $91,346 |
Household Income in Davidson County
Household Income Brackets in Davidson County
With 54,479 households falling in the category, the $50,000 to $74,999 income range is the most frequent in Davidson County, accounting for 18.0% of all households. In contrast, only 9,383 households (3.1%) fall into the $10,000 to $14,999 income bracket, making it the least populous group.
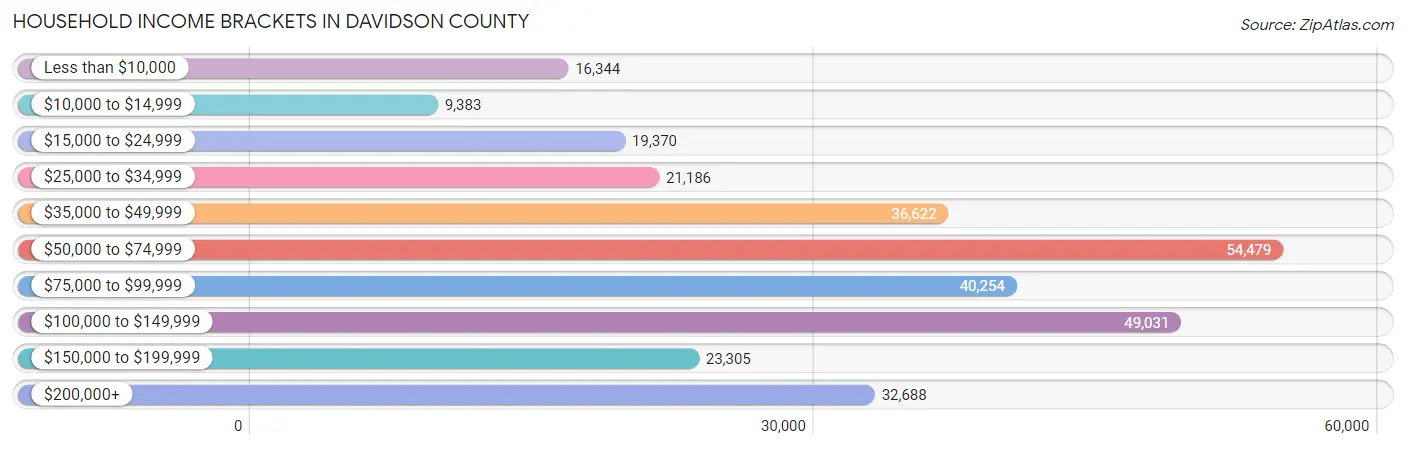
| Income Bracket | # Households | % Households |
| Less than $10,000 | 16,344 | 5.4% |
| $10,000 to $14,999 | 9,383 | 3.1% |
| $15,000 to $24,999 | 19,370 | 6.4% |
| $25,000 to $34,999 | 21,186 | 7.0% |
| $35,000 to $49,999 | 36,622 | 12.1% |
| $50,000 to $74,999 | 54,479 | 18.0% |
| $75,000 to $99,999 | 40,254 | 13.3% |
| $100,000 to $149,999 | 49,031 | 16.2% |
| $150,000 to $199,999 | 23,305 | 7.7% |
| $200,000+ | 32,688 | 10.8% |
Household Income by Householder Age in Davidson County
The median household income in Davidson County is $71,863, with the highest median household income of $81,924 found in the 45 to 64 years age bracket for the primary householder. A total of 94,697 households (31.3%) fall into this category. Meanwhile, the 15 to 24 years age bracket for the primary householder has the lowest median household income of $42,377, with 15,729 households (5.2%) in this group.
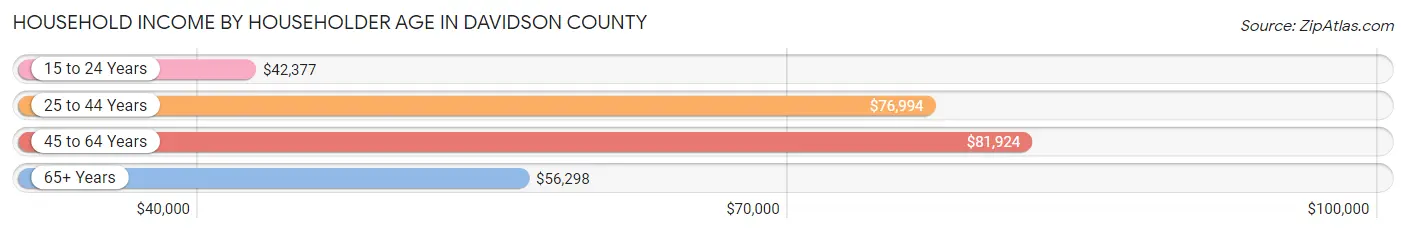
| Income Bracket | # Households | Median Income |
| 15 to 24 Years | 15,729 (5.2%) | $42,377 |
| 25 to 44 Years | 132,186 (43.7%) | $76,994 |
| 45 to 64 Years | 94,697 (31.3%) | $81,924 |
| 65+ Years | 60,051 (19.8%) | $56,298 |
| Total | 302,663 (100.0%) | $71,863 |
Poverty in Davidson County
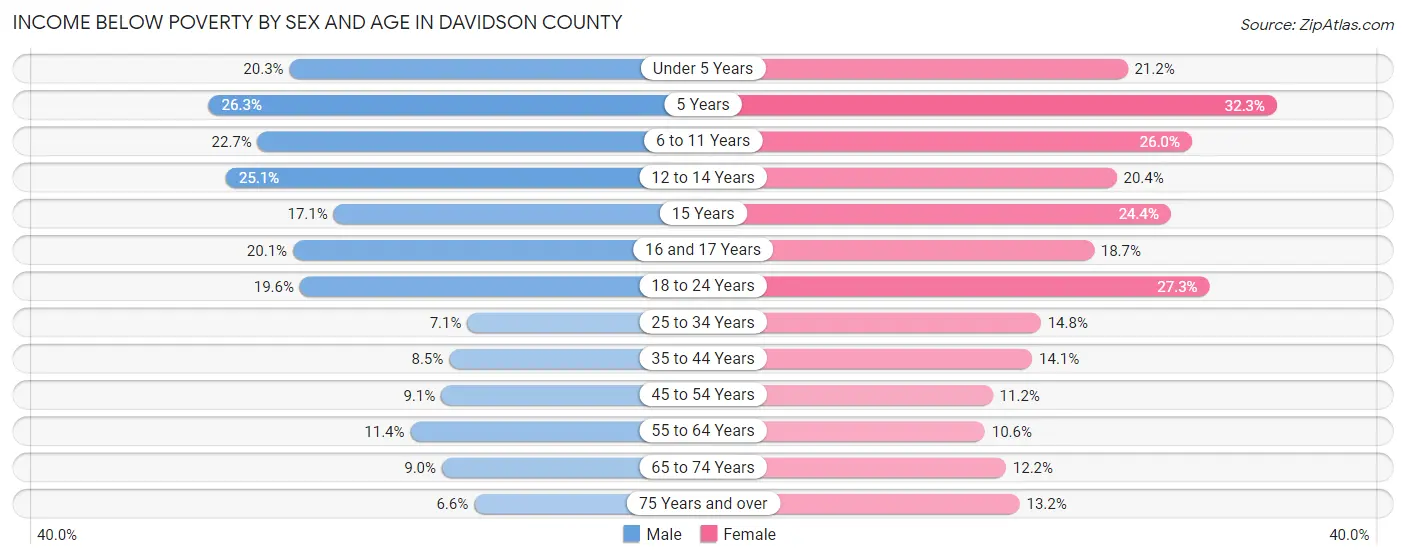
Income Below Poverty by Sex and Age in Davidson County
With 12.4% poverty level for males and 16.2% for females among the residents of Davidson County, 5 year old males and 5 year old females are the most vulnerable to poverty, with 1,018 males (26.3%) and 1,616 females (32.3%) in their respective age groups living below the poverty level.
| Age Bracket | Male | Female |
| Under 5 Years | 4,605 (20.3%) | 4,629 (21.2%) |
| 5 Years | 1,018 (26.3%) | 1,616 (32.3%) |
| 6 to 11 Years | 5,229 (22.7%) | 5,744 (26.0%) |
| 12 to 14 Years | 2,783 (25.1%) | 2,119 (20.4%) |
| 15 Years | 553 (17.1%) | 952 (24.4%) |
| 16 and 17 Years | 1,534 (20.1%) | 1,226 (18.7%) |
| 18 to 24 Years | 5,477 (19.6%) | 7,783 (27.3%) |
| 25 to 34 Years | 4,895 (7.1%) | 10,890 (14.8%) |
| 35 to 44 Years | 4,234 (8.5%) | 7,021 (14.1%) |
| 45 to 54 Years | 3,612 (9.1%) | 4,499 (11.2%) |
| 55 to 64 Years | 4,269 (11.4%) | 4,446 (10.6%) |
| 65 to 74 Years | 2,286 (9.0%) | 3,701 (12.2%) |
| 75 Years and over | 855 (6.6%) | 2,720 (13.2%) |
| Total | 41,350 (12.4%) | 57,346 (16.2%) |
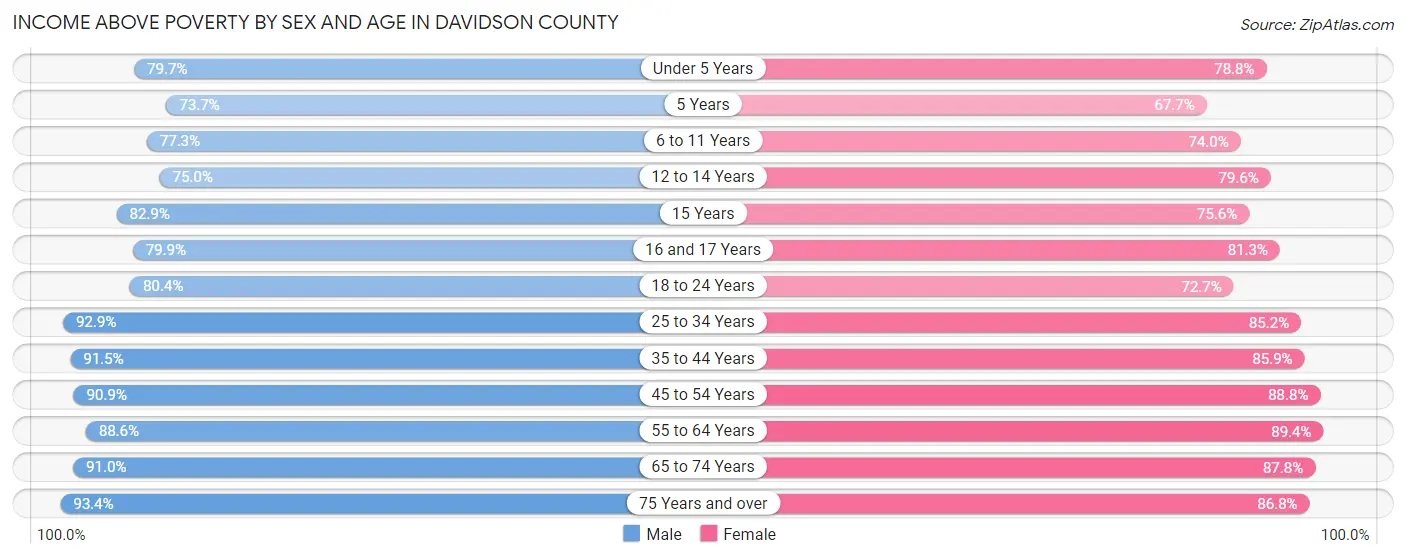
Income Above Poverty by Sex and Age in Davidson County
According to the poverty statistics in Davidson County, males aged 75 years and over and females aged 55 to 64 years are the age groups that are most secure financially, with 93.4% of males and 89.4% of females in these age groups living above the poverty line.
| Age Bracket | Male | Female |
| Under 5 Years | 18,040 (79.7%) | 17,198 (78.8%) |
| 5 Years | 2,848 (73.7%) | 3,387 (67.7%) |
| 6 to 11 Years | 17,805 (77.3%) | 16,360 (74.0%) |
| 12 to 14 Years | 8,327 (75.0%) | 8,270 (79.6%) |
| 15 Years | 2,688 (82.9%) | 2,947 (75.6%) |
| 16 and 17 Years | 6,104 (79.9%) | 5,327 (81.3%) |
| 18 to 24 Years | 22,508 (80.4%) | 20,733 (72.7%) |
| 25 to 34 Years | 63,769 (92.9%) | 62,849 (85.2%) |
| 35 to 44 Years | 45,701 (91.5%) | 42,654 (85.9%) |
| 45 to 54 Years | 36,163 (90.9%) | 35,684 (88.8%) |
| 55 to 64 Years | 33,307 (88.6%) | 37,436 (89.4%) |
| 65 to 74 Years | 23,053 (91.0%) | 26,680 (87.8%) |
| 75 Years and over | 12,047 (93.4%) | 17,893 (86.8%) |
| Total | 292,360 (87.6%) | 297,418 (83.8%) |
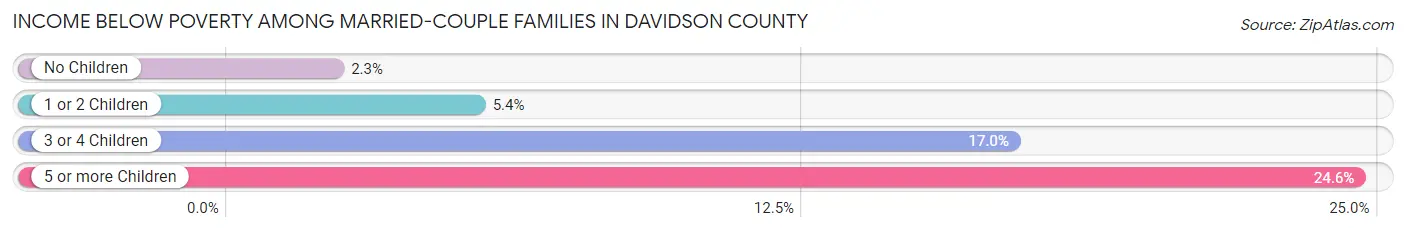
Income Below Poverty Among Married-Couple Families in Davidson County
The poverty statistics for married-couple families in Davidson County show that 4.6% or 4,974 of the total 109,156 families live below the poverty line. Families with 5 or more children have the highest poverty rate of 24.5%, comprising of 192 families. On the other hand, families with no children have the lowest poverty rate of 2.3%, which includes 1,477 families.
| Children | Above Poverty | Below Poverty |
| No Children | 62,548 (97.7%) | 1,477 (2.3%) |
| 1 or 2 Children | 34,519 (94.6%) | 1,966 (5.4%) |
| 3 or 4 Children | 6,525 (83.0%) | 1,339 (17.0%) |
| 5 or more Children | 590 (75.4%) | 192 (24.5%) |
| Total | 104,182 (95.4%) | 4,974 (4.6%) |
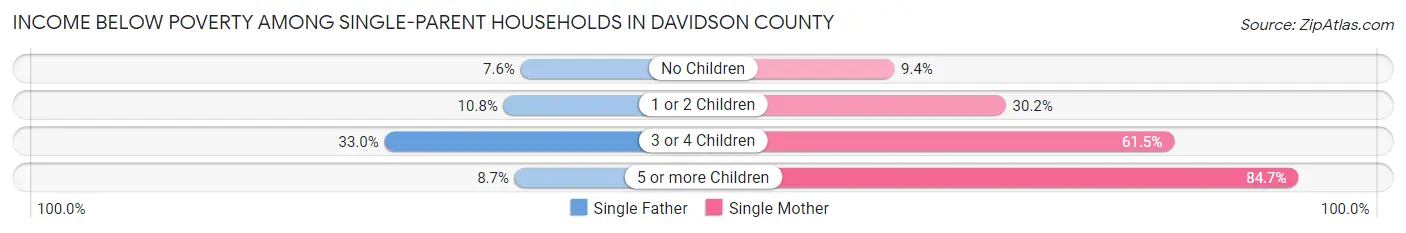
Income Below Poverty Among Single-Parent Households in Davidson County
According to the poverty data in Davidson County, 10.7% or 1,299 single-father households and 27.5% or 10,246 single-mother households are living below the poverty line. Among single-father households, those with 3 or 4 children have the highest poverty rate, with 292 households (33.0%) experiencing poverty. Likewise, among single-mother households, those with 5 or more children have the highest poverty rate, with 254 households (84.7%) falling below the poverty line.
| Children | Single Father | Single Mother |
| No Children | 484 (7.6%) | 1,200 (9.4%) |
| 1 or 2 Children | 515 (10.8%) | 5,841 (30.2%) |
| 3 or 4 Children | 292 (33.0%) | 2,951 (61.5%) |
| 5 or more Children | 8 (8.7%) | 254 (84.7%) |
| Total | 1,299 (10.7%) | 10,246 (27.5%) |
Income Below Poverty Among Married-Couple vs Single-Parent Households in Davidson County
The poverty data for Davidson County shows that 4,974 of the married-couple family households (4.6%) and 11,545 of the single-parent households (23.4%) are living below the poverty level. Within the married-couple family households, those with 5 or more children have the highest poverty rate, with 192 households (24.5%) falling below the poverty line. Among the single-parent households, those with 5 or more children have the highest poverty rate, with 262 household (66.8%) living below poverty.
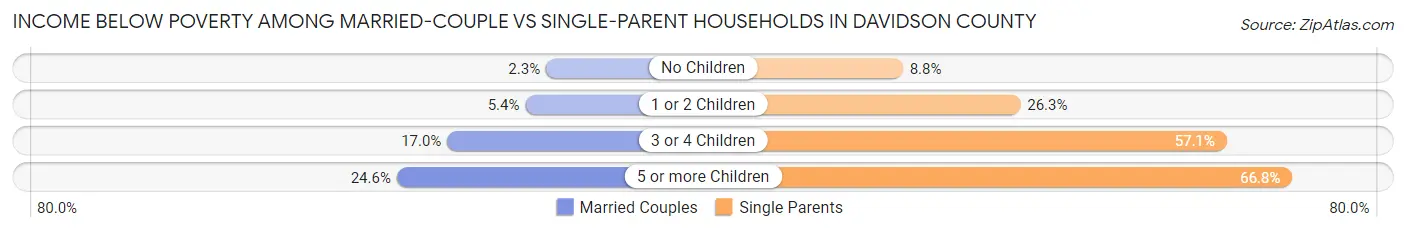
| Children | Married-Couple Families | Single-Parent Households |
| No Children | 1,477 (2.3%) | 1,684 (8.8%) |
| 1 or 2 Children | 1,966 (5.4%) | 6,356 (26.3%) |
| 3 or 4 Children | 1,339 (17.0%) | 3,243 (57.1%) |
| 5 or more Children | 192 (24.5%) | 262 (66.8%) |
| Total | 4,974 (4.6%) | 11,545 (23.4%) |
Employment Characteristics in Davidson County
Employment by Class of Employer in Davidson County
Among the 390,556 employed individuals in Davidson County, private company employees (266,301 | 68.2%), not-for-profit organizations (40,774 | 10.4%), and self-employed (not incorporated) (29,135 | 7.5%) make up the most common classes of employment.
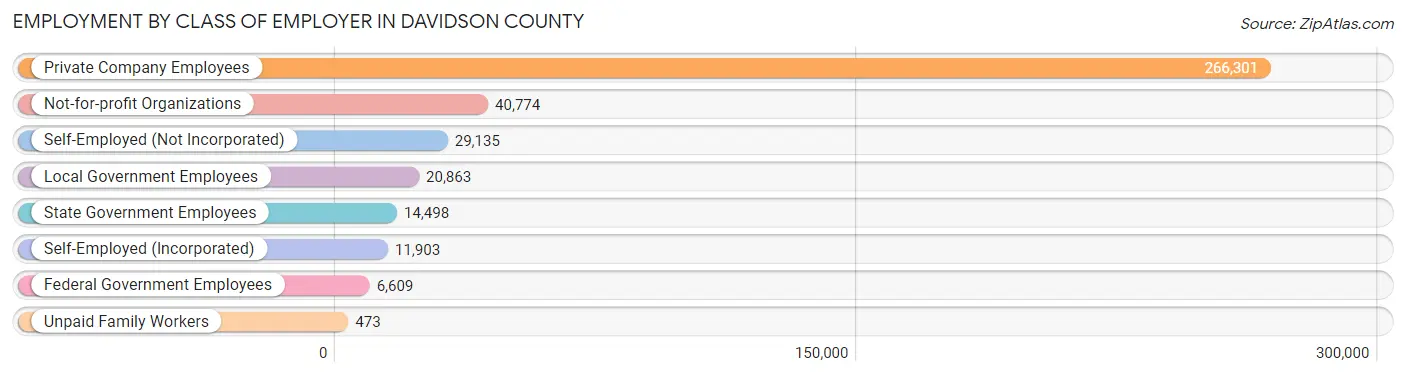
| Employer Class | # Employees | % Employees |
| Private Company Employees | 266,301 | 68.2% |
| Self-Employed (Incorporated) | 11,903 | 3.0% |
| Self-Employed (Not Incorporated) | 29,135 | 7.5% |
| Not-for-profit Organizations | 40,774 | 10.4% |
| Local Government Employees | 20,863 | 5.3% |
| State Government Employees | 14,498 | 3.7% |
| Federal Government Employees | 6,609 | 1.7% |
| Unpaid Family Workers | 473 | 0.1% |
| Total | 390,556 | 100.0% |
Employment Status by Age in Davidson County
According to the labor force statistics for Davidson County, out of the total population over 16 years of age (579,736), 71.7% or 415,671 individuals are in the labor force, with 4.6% or 19,121 of them unemployed. The age group with the highest labor force participation rate is 30 to 34 years, with 89.1% or 62,429 individuals in the labor force. Within the labor force, the 16 to 19 years age range has the highest percentage of unemployed individuals, with 15.2% or 2,282 of them being unemployed.
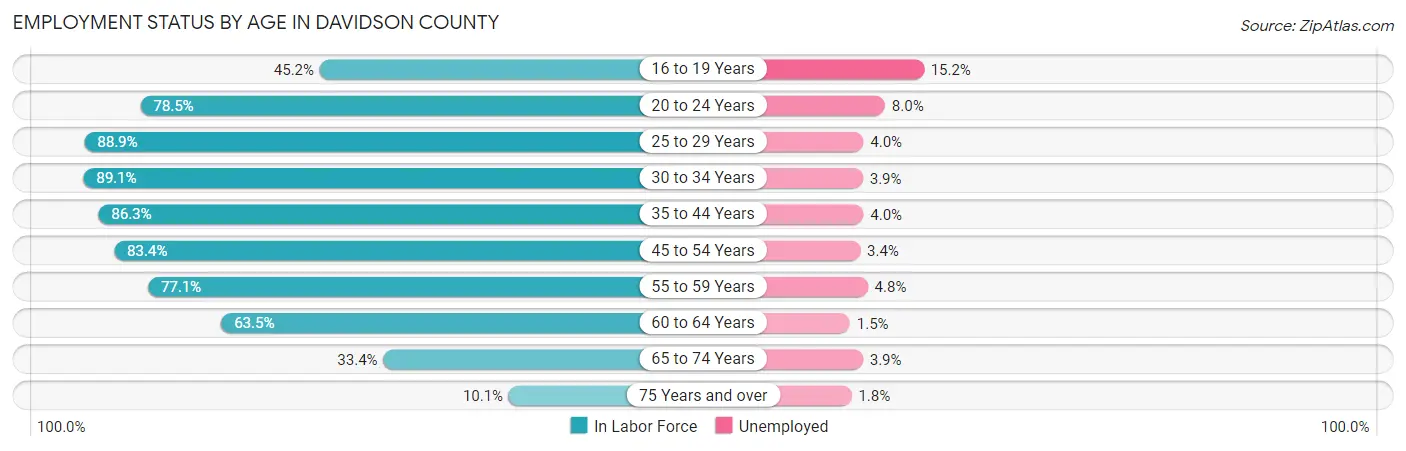
| Age Bracket | In Labor Force | Unemployed |
| 16 to 19 Years | 15,010 (45.2%) | 2,282 (15.2%) |
| 20 to 24 Years | 40,150 (78.5%) | 3,212 (8.0%) |
| 25 to 29 Years | 65,250 (88.9%) | 2,610 (4.0%) |
| 30 to 34 Years | 62,429 (89.1%) | 2,435 (3.9%) |
| 35 to 44 Years | 86,822 (86.3%) | 3,473 (4.0%) |
| 45 to 54 Years | 67,166 (83.4%) | 2,284 (3.4%) |
| 55 to 59 Years | 33,151 (77.1%) | 1,591 (4.8%) |
| 60 to 64 Years | 23,501 (63.5%) | 353 (1.5%) |
| 65 to 74 Years | 18,786 (33.4%) | 733 (3.9%) |
| 75 Years and over | 3,487 (10.1%) | 63 (1.8%) |
| Total | 415,671 (71.7%) | 19,121 (4.6%) |
Employment Status by Educational Attainment in Davidson County
According to labor force statistics for Davidson County, 83.6% of individuals (338,255) out of the total population between 25 and 64 years of age (404,611) are in the labor force, with 3.8% or 12,854 of them being unemployed. The group with the highest labor force participation rate are those with the educational attainment of bachelor's degree or higher, with 90.6% or 176,363 individuals in the labor force. Within the labor force, individuals with less than high school education have the highest percentage of unemployment, with 7.1% or 1,712 of them being unemployed.
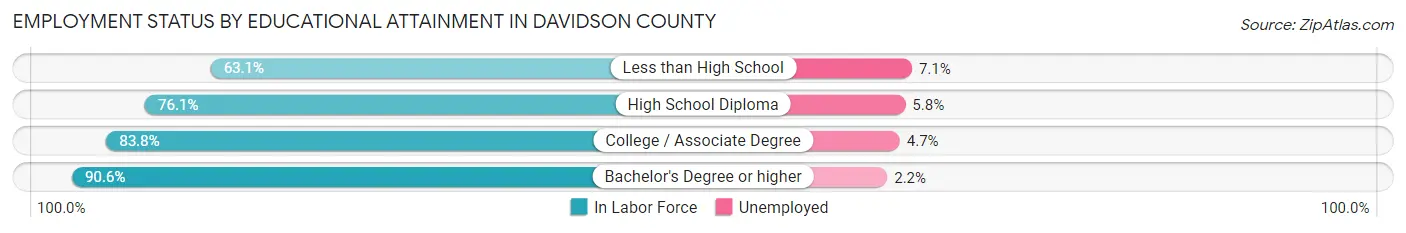
| Educational Attainment | In Labor Force | Unemployed |
| Less than High School | 24,117 (63.1%) | 2,714 (7.1%) |
| High School Diploma | 59,853 (76.1%) | 4,562 (5.8%) |
| College / Associate Degree | 78,000 (83.8%) | 4,375 (4.7%) |
| Bachelor's Degree or higher | 176,363 (90.6%) | 4,283 (2.2%) |
| Total | 338,255 (83.6%) | 15,375 (3.8%) |
Employment Occupations by Sex in Davidson County
Management, Business, Science and Arts Occupations
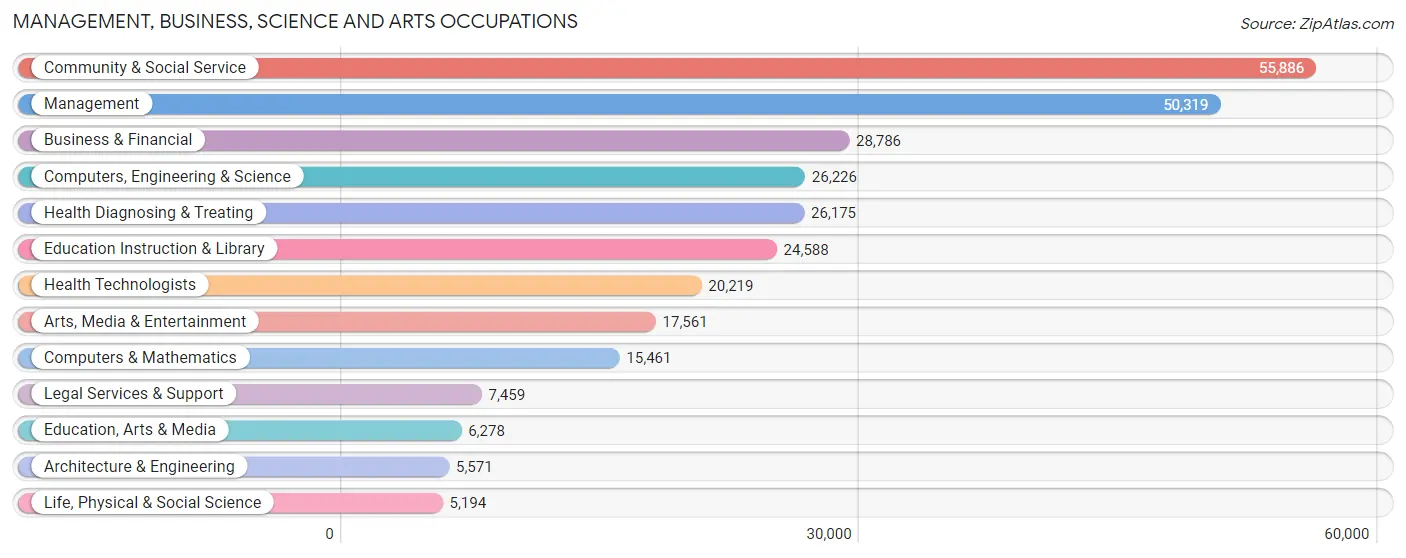
The most common Management, Business, Science and Arts occupations in Davidson County are Community & Social Service (55,886 | 14.1%), Management (50,319 | 12.7%), Business & Financial (28,786 | 7.3%), Computers, Engineering & Science (26,226 | 6.6%), and Health Diagnosing & Treating (26,175 | 6.6%).
Management, Business, Science and Arts Occupations by Sex
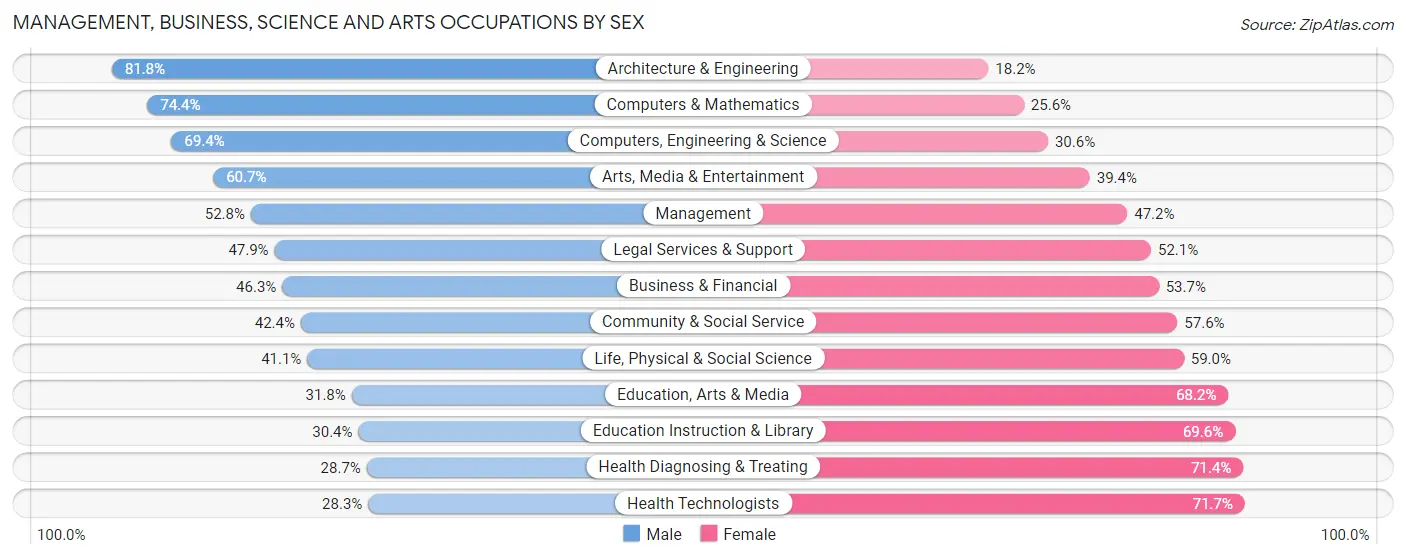
Within the Management, Business, Science and Arts occupations in Davidson County, the most male-oriented occupations are Architecture & Engineering (81.8%), Computers & Mathematics (74.4%), and Computers, Engineering & Science (69.4%), while the most female-oriented occupations are Health Technologists (71.7%), Health Diagnosing & Treating (71.4%), and Education Instruction & Library (69.6%).
| Occupation | Male | Female |
| Management | 26,576 (52.8%) | 23,743 (47.2%) |
| Business & Financial | 13,320 (46.3%) | 15,466 (53.7%) |
| Computers, Engineering & Science | 18,192 (69.4%) | 8,034 (30.6%) |
| Computers & Mathematics | 11,503 (74.4%) | 3,958 (25.6%) |
| Architecture & Engineering | 4,557 (81.8%) | 1,014 (18.2%) |
| Life, Physical & Social Science | 2,132 (41.0%) | 3,062 (59.0%) |
| Community & Social Service | 23,685 (42.4%) | 32,201 (57.6%) |
| Education, Arts & Media | 1,995 (31.8%) | 4,283 (68.2%) |
| Legal Services & Support | 3,571 (47.9%) | 3,888 (52.1%) |
| Education Instruction & Library | 7,468 (30.4%) | 17,120 (69.6%) |
| Arts, Media & Entertainment | 10,651 (60.7%) | 6,910 (39.4%) |
| Health Diagnosing & Treating | 7,499 (28.6%) | 18,676 (71.4%) |
| Health Technologists | 5,729 (28.3%) | 14,490 (71.7%) |
| Total (Category) | 89,272 (47.6%) | 98,120 (52.4%) |
| Total (Overall) | 203,985 (51.5%) | 192,147 (48.5%) |
Services Occupations
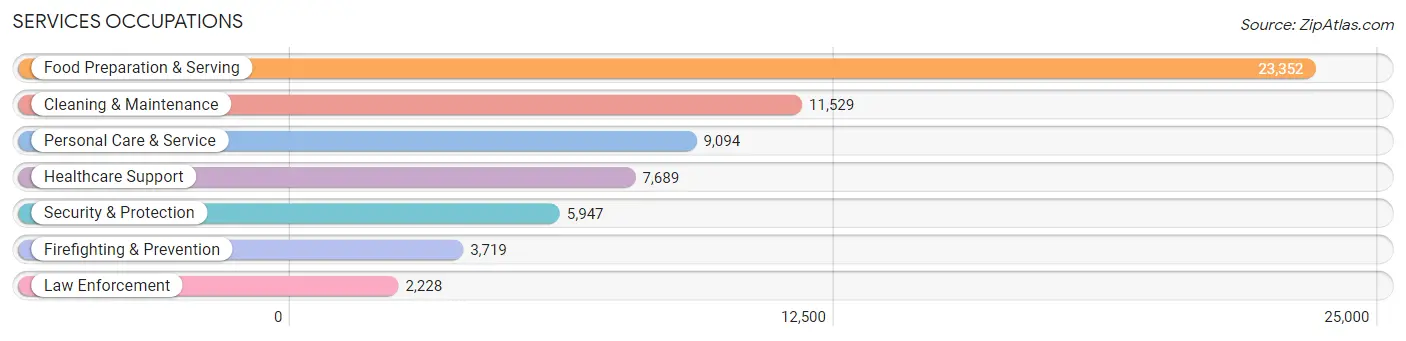
The most common Services occupations in Davidson County are Food Preparation & Serving (23,352 | 5.9%), Cleaning & Maintenance (11,529 | 2.9%), Personal Care & Service (9,094 | 2.3%), Healthcare Support (7,689 | 1.9%), and Security & Protection (5,947 | 1.5%).
Services Occupations by Sex
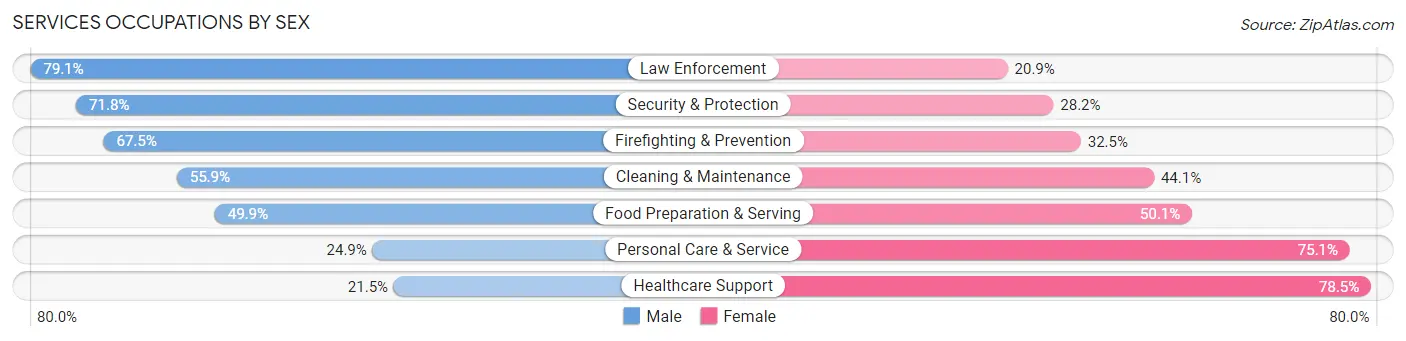
Within the Services occupations in Davidson County, the most male-oriented occupations are Law Enforcement (79.1%), Security & Protection (71.8%), and Firefighting & Prevention (67.5%), while the most female-oriented occupations are Healthcare Support (78.5%), Personal Care & Service (75.1%), and Food Preparation & Serving (50.1%).
| Occupation | Male | Female |
| Healthcare Support | 1,653 (21.5%) | 6,036 (78.5%) |
| Security & Protection | 4,272 (71.8%) | 1,675 (28.2%) |
| Firefighting & Prevention | 2,510 (67.5%) | 1,209 (32.5%) |
| Law Enforcement | 1,762 (79.1%) | 466 (20.9%) |
| Food Preparation & Serving | 11,643 (49.9%) | 11,709 (50.1%) |
| Cleaning & Maintenance | 6,443 (55.9%) | 5,086 (44.1%) |
| Personal Care & Service | 2,262 (24.9%) | 6,832 (75.1%) |
| Total (Category) | 26,273 (45.6%) | 31,338 (54.4%) |
| Total (Overall) | 203,985 (51.5%) | 192,147 (48.5%) |
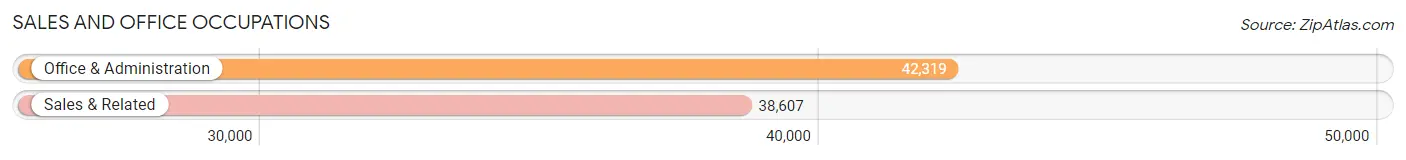
Sales and Office Occupations
The most common Sales and Office occupations in Davidson County are Office & Administration (42,319 | 10.7%), and Sales & Related (38,607 | 9.8%).
Sales and Office Occupations by Sex
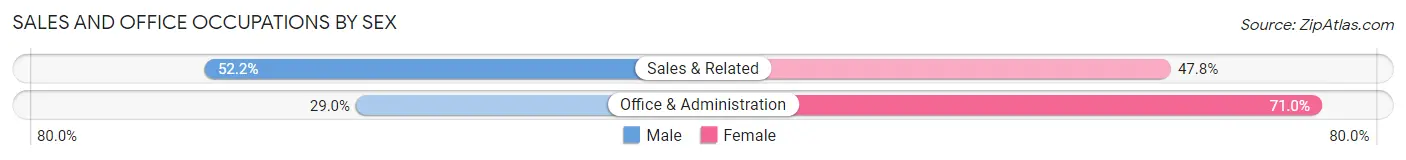
| Occupation | Male | Female |
| Sales & Related | 20,169 (52.2%) | 18,438 (47.8%) |
| Office & Administration | 12,290 (29.0%) | 30,029 (71.0%) |
| Total (Category) | 32,459 (40.1%) | 48,467 (59.9%) |
| Total (Overall) | 203,985 (51.5%) | 192,147 (48.5%) |
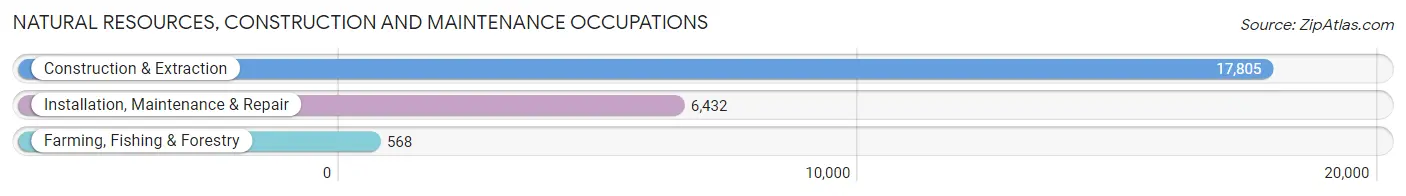
Natural Resources, Construction and Maintenance Occupations
The most common Natural Resources, Construction and Maintenance occupations in Davidson County are Construction & Extraction (17,805 | 4.5%), Installation, Maintenance & Repair (6,432 | 1.6%), and Farming, Fishing & Forestry (568 | 0.1%).
Natural Resources, Construction and Maintenance Occupations by Sex
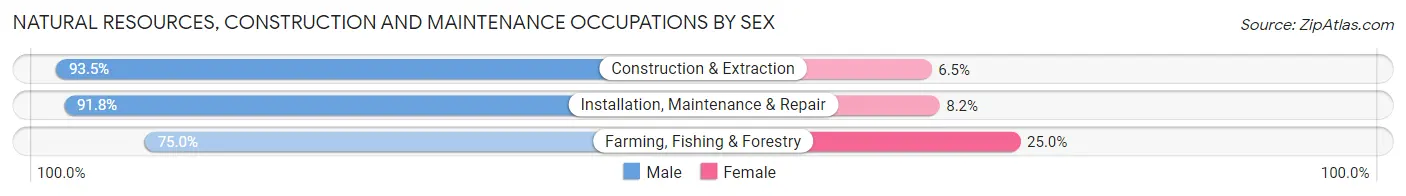
| Occupation | Male | Female |
| Farming, Fishing & Forestry | 426 (75.0%) | 142 (25.0%) |
| Construction & Extraction | 16,643 (93.5%) | 1,162 (6.5%) |
| Installation, Maintenance & Repair | 5,905 (91.8%) | 527 (8.2%) |
| Total (Category) | 22,974 (92.6%) | 1,831 (7.4%) |
| Total (Overall) | 203,985 (51.5%) | 192,147 (48.5%) |
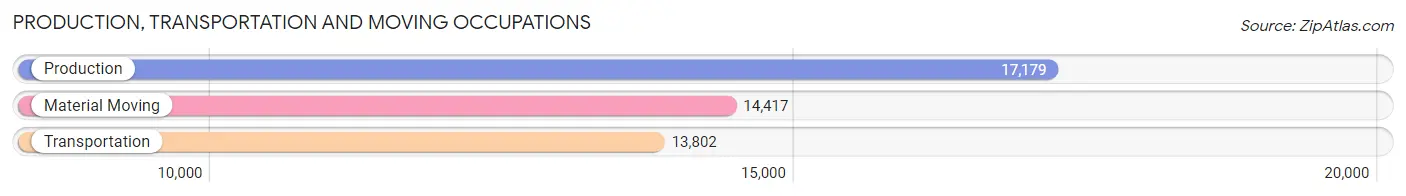
Production, Transportation and Moving Occupations
The most common Production, Transportation and Moving occupations in Davidson County are Production (17,179 | 4.3%), Material Moving (14,417 | 3.6%), and Transportation (13,802 | 3.5%).
Production, Transportation and Moving Occupations by Sex
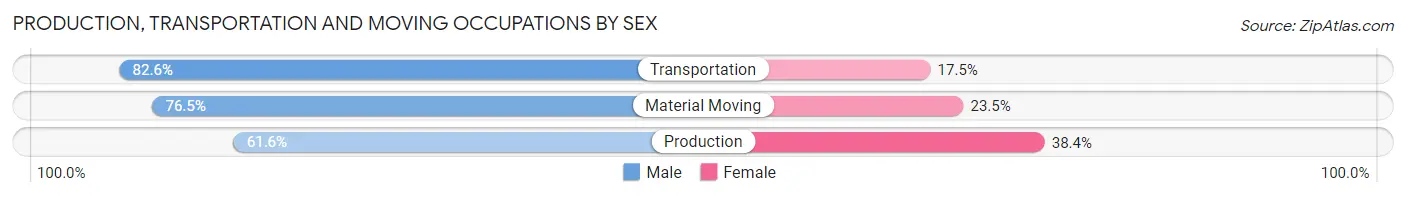
| Occupation | Male | Female |
| Production | 10,582 (61.6%) | 6,597 (38.4%) |
| Transportation | 11,394 (82.6%) | 2,408 (17.4%) |
| Material Moving | 11,031 (76.5%) | 3,386 (23.5%) |
| Total (Category) | 33,007 (72.7%) | 12,391 (27.3%) |
| Total (Overall) | 203,985 (51.5%) | 192,147 (48.5%) |
Employment Industries by Sex in Davidson County
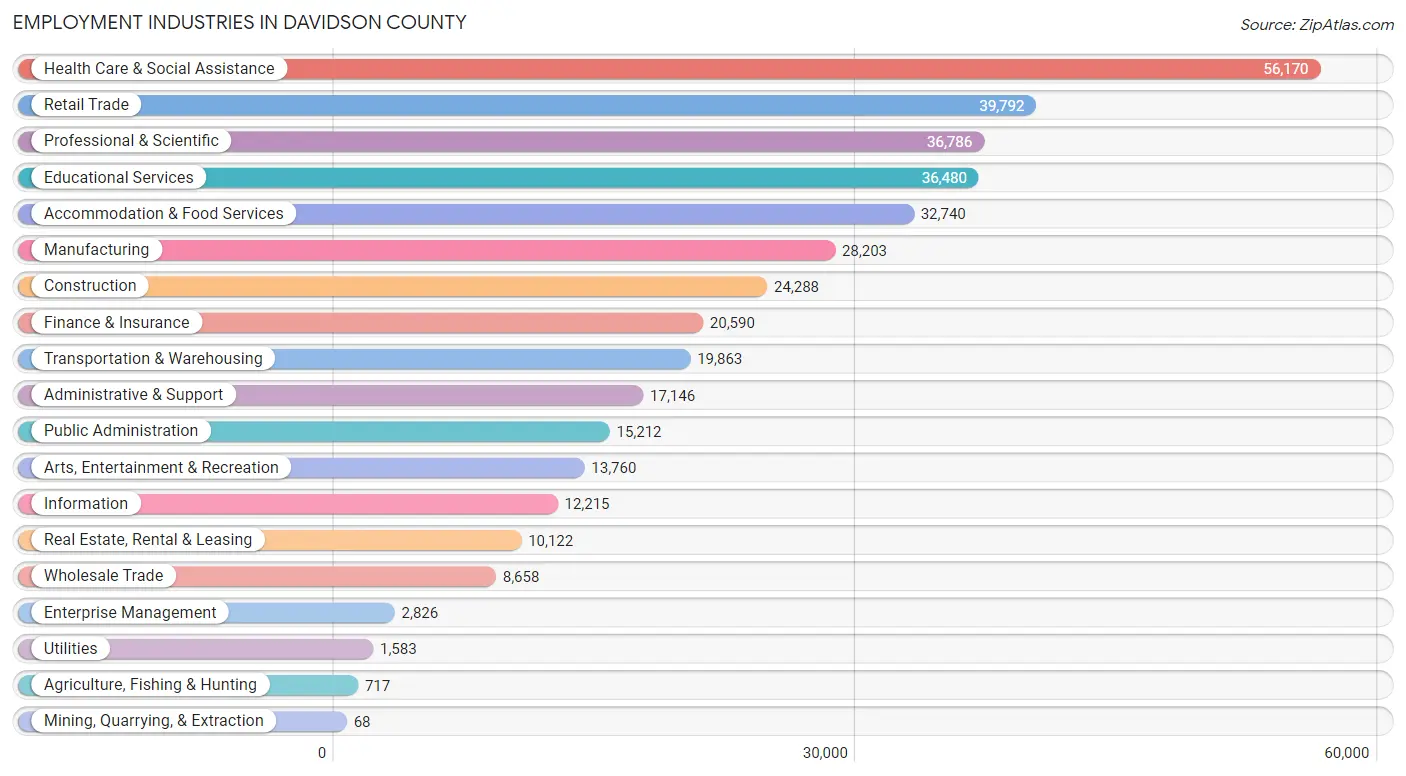
Employment Industries in Davidson County
The major employment industries in Davidson County include Health Care & Social Assistance (56,170 | 14.2%), Retail Trade (39,792 | 10.1%), Professional & Scientific (36,786 | 9.3%), Educational Services (36,480 | 9.2%), and Accommodation & Food Services (32,740 | 8.3%).
Employment Industries by Sex in Davidson County
The Davidson County industries that see more men than women are Construction (88.7%), Agriculture, Fishing & Hunting (84.7%), and Transportation & Warehousing (73.2%), whereas the industries that tend to have a higher number of women are Mining, Quarrying, & Extraction (77.9%), Health Care & Social Assistance (69.9%), and Educational Services (65.5%).
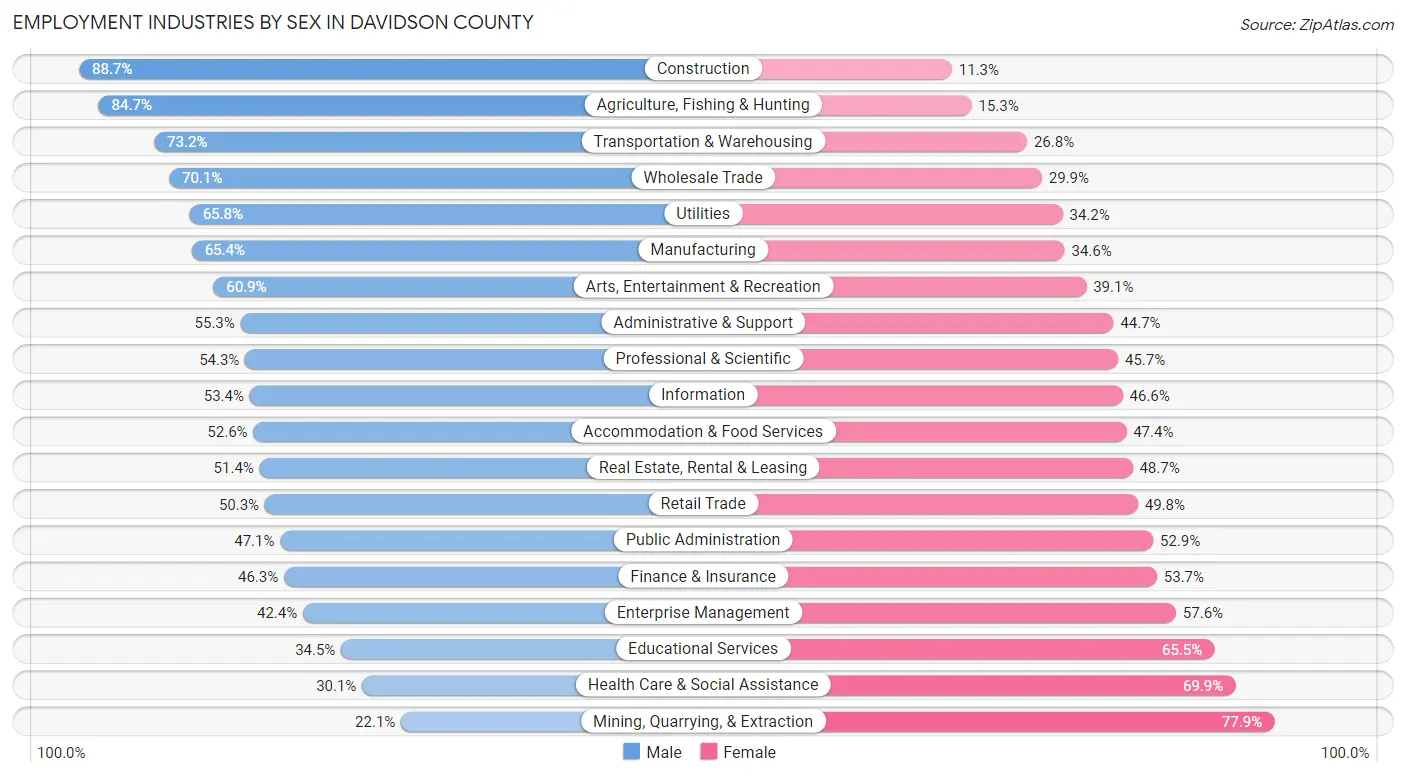
| Industry | Male | Female |
| Agriculture, Fishing & Hunting | 607 (84.7%) | 110 (15.3%) |
| Mining, Quarrying, & Extraction | 15 (22.1%) | 53 (77.9%) |
| Construction | 21,551 (88.7%) | 2,737 (11.3%) |
| Manufacturing | 18,447 (65.4%) | 9,756 (34.6%) |
| Wholesale Trade | 6,069 (70.1%) | 2,589 (29.9%) |
| Retail Trade | 19,995 (50.2%) | 19,797 (49.7%) |
| Transportation & Warehousing | 14,536 (73.2%) | 5,327 (26.8%) |
| Utilities | 1,042 (65.8%) | 541 (34.2%) |
| Information | 6,522 (53.4%) | 5,693 (46.6%) |
| Finance & Insurance | 9,534 (46.3%) | 11,056 (53.7%) |
| Real Estate, Rental & Leasing | 5,198 (51.3%) | 4,924 (48.6%) |
| Professional & Scientific | 19,991 (54.3%) | 16,795 (45.7%) |
| Enterprise Management | 1,197 (42.4%) | 1,629 (57.6%) |
| Administrative & Support | 9,480 (55.3%) | 7,666 (44.7%) |
| Educational Services | 12,574 (34.5%) | 23,906 (65.5%) |
| Health Care & Social Assistance | 16,921 (30.1%) | 39,249 (69.9%) |
| Arts, Entertainment & Recreation | 8,382 (60.9%) | 5,378 (39.1%) |
| Accommodation & Food Services | 17,233 (52.6%) | 15,507 (47.4%) |
| Public Administration | 7,160 (47.1%) | 8,052 (52.9%) |
| Total | 203,985 (51.5%) | 192,147 (48.5%) |
Education in Davidson County
School Enrollment in Davidson County
The most common levels of schooling among the 159,494 students in Davidson County are college / undergraduate (37,954 | 23.8%), middle school (29,966 | 18.8%), and elementary school (29,056 | 18.2%).
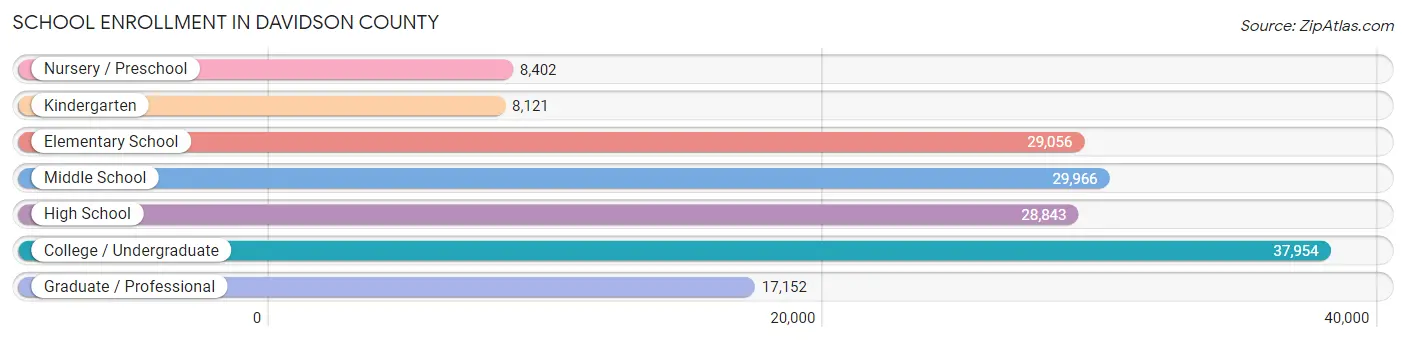
| School Level | # Students | % Students |
| Nursery / Preschool | 8,402 | 5.3% |
| Kindergarten | 8,121 | 5.1% |
| Elementary School | 29,056 | 18.2% |
| Middle School | 29,966 | 18.8% |
| High School | 28,843 | 18.1% |
| College / Undergraduate | 37,954 | 23.8% |
| Graduate / Professional | 17,152 | 10.7% |
| Total | 159,494 | 100.0% |
School Enrollment by Age by Funding Source in Davidson County
Out of a total of 159,494 students who are enrolled in schools in Davidson County, 52,952 (33.2%) attend a private institution, while the remaining 106,542 (66.8%) are enrolled in public schools. The age group of 20 to 24 year olds has the highest likelihood of being enrolled in private schools, with 11,829 (58.3% in the age bracket) enrolled. Conversely, the age group of 5 to 9 year old has the lowest likelihood of being enrolled in a private school, with 29,227 (80.9% in the age bracket) attending a public institution.
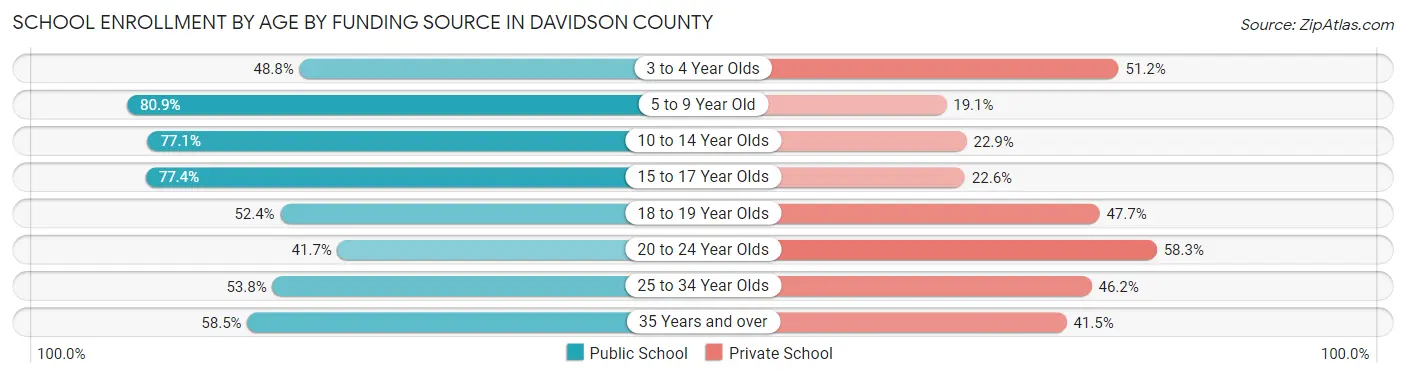
| Age Bracket | Public School | Private School |
| 3 to 4 Year Olds | 3,071 (48.8%) | 3,223 (51.2%) |
| 5 to 9 Year Old | 29,227 (80.9%) | 6,904 (19.1%) |
| 10 to 14 Year Olds | 28,220 (77.1%) | 8,378 (22.9%) |
| 15 to 17 Year Olds | 15,991 (77.4%) | 4,663 (22.6%) |
| 18 to 19 Year Olds | 7,603 (52.3%) | 6,920 (47.6%) |
| 20 to 24 Year Olds | 8,458 (41.7%) | 11,829 (58.3%) |
| 25 to 34 Year Olds | 8,210 (53.8%) | 7,041 (46.2%) |
| 35 Years and over | 5,707 (58.5%) | 4,049 (41.5%) |
| Total | 106,542 (66.8%) | 52,952 (33.2%) |
Educational Attainment by Field of Study in Davidson County
Business (53,211 | 21.3%), science & technology (22,898 | 9.2%), education (19,873 | 8.0%), social sciences (18,025 | 7.2%), and visual & performing arts (17,717 | 7.1%) are the most common fields of study among 249,557 individuals in Davidson County who have obtained a bachelor's degree or higher.
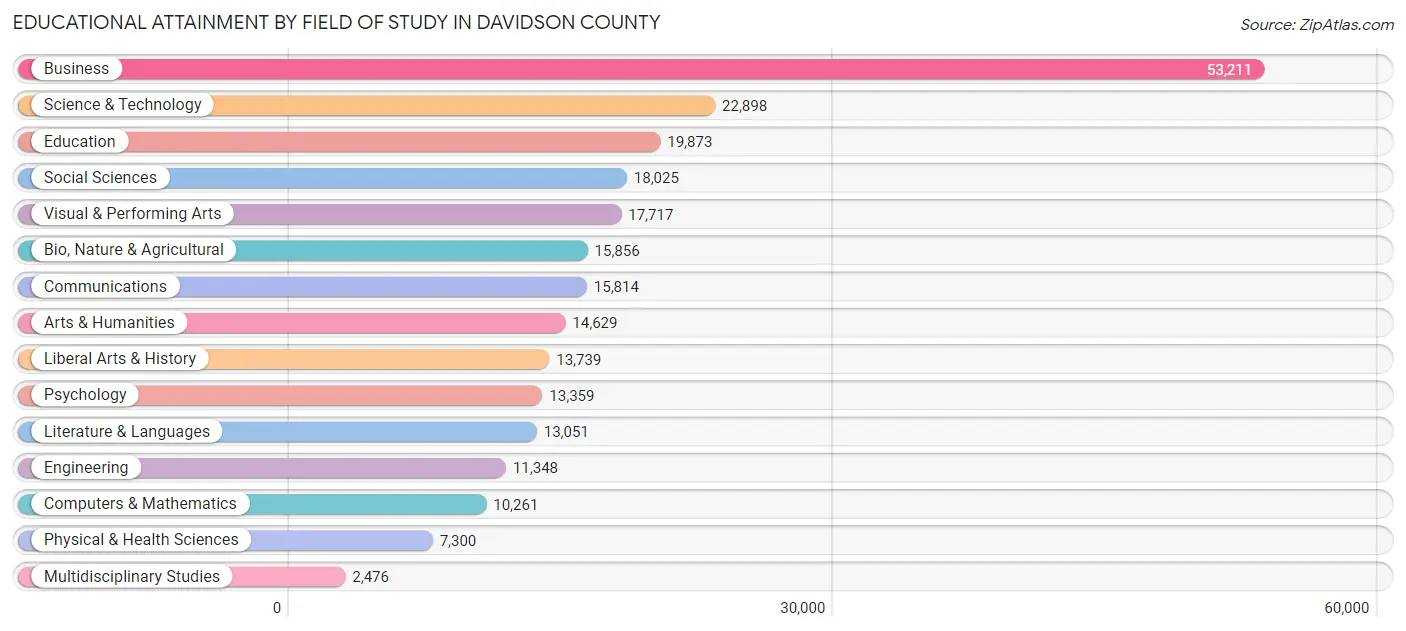
| Field of Study | # Graduates | % Graduates |
| Computers & Mathematics | 10,261 | 4.1% |
| Bio, Nature & Agricultural | 15,856 | 6.4% |
| Physical & Health Sciences | 7,300 | 2.9% |
| Psychology | 13,359 | 5.3% |
| Social Sciences | 18,025 | 7.2% |
| Engineering | 11,348 | 4.5% |
| Multidisciplinary Studies | 2,476 | 1.0% |
| Science & Technology | 22,898 | 9.2% |
| Business | 53,211 | 21.3% |
| Education | 19,873 | 8.0% |
| Literature & Languages | 13,051 | 5.2% |
| Liberal Arts & History | 13,739 | 5.5% |
| Visual & Performing Arts | 17,717 | 7.1% |
| Communications | 15,814 | 6.3% |
| Arts & Humanities | 14,629 | 5.9% |
| Total | 249,557 | 100.0% |
Transportation & Commute in Davidson County
Vehicle Availability by Sex in Davidson County
The most prevalent vehicle ownership categories in Davidson County are males with 2 vehicles (88,724, accounting for 44.3%) and females with 2 vehicles (77,349, making up 48.1%).
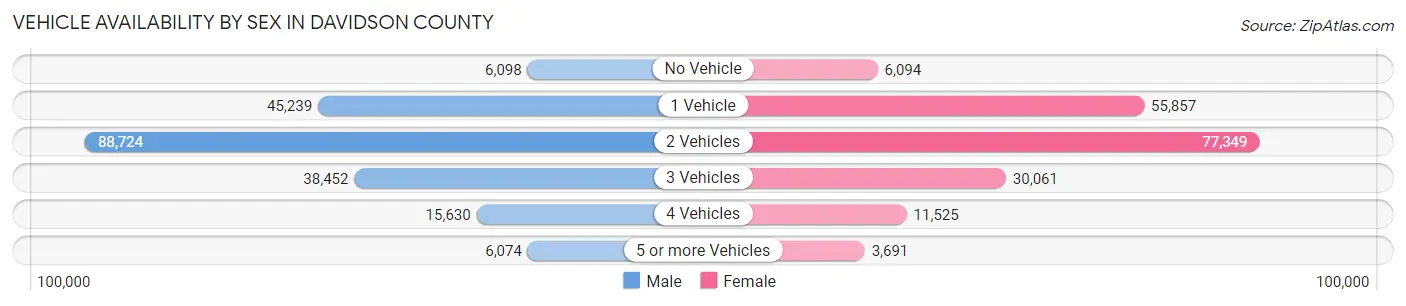
| Vehicles Available | Male | Female |
| No Vehicle | 6,098 (3.0%) | 6,094 (3.3%) |
| 1 Vehicle | 45,239 (22.6%) | 55,857 (30.3%) |
| 2 Vehicles | 88,724 (44.3%) | 77,349 (41.9%) |
| 3 Vehicles | 38,452 (19.2%) | 30,061 (16.3%) |
| 4 Vehicles | 15,630 (7.8%) | 11,525 (6.2%) |
| 5 or more Vehicles | 6,074 (3.0%) | 3,691 (2.0%) |
| Total | 200,217 (100.0%) | 184,577 (100.0%) |
Commute Time in Davidson County
The most frequently occuring commute durations in Davidson County are 20 to 24 minutes (59,805 commuters, 18.1%), 15 to 19 minutes (56,206 commuters, 17.0%), and 30 to 34 minutes (52,680 commuters, 16.0%).
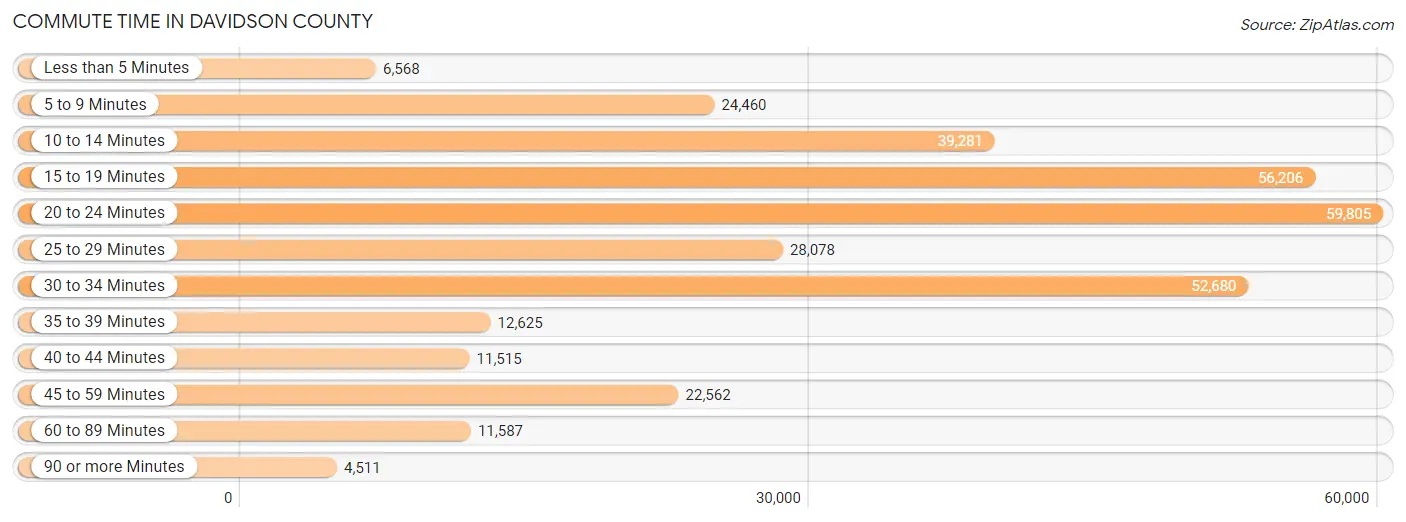
| Commute Time | # Commuters | % Commuters |
| Less than 5 Minutes | 6,568 | 2.0% |
| 5 to 9 Minutes | 24,460 | 7.4% |
| 10 to 14 Minutes | 39,281 | 11.9% |
| 15 to 19 Minutes | 56,206 | 17.0% |
| 20 to 24 Minutes | 59,805 | 18.1% |
| 25 to 29 Minutes | 28,078 | 8.5% |
| 30 to 34 Minutes | 52,680 | 16.0% |
| 35 to 39 Minutes | 12,625 | 3.8% |
| 40 to 44 Minutes | 11,515 | 3.5% |
| 45 to 59 Minutes | 22,562 | 6.8% |
| 60 to 89 Minutes | 11,587 | 3.5% |
| 90 or more Minutes | 4,511 | 1.4% |
Commute Time by Sex in Davidson County
The most common commute times in Davidson County are 20 to 24 minutes (33,264 commuters, 19.2%) for males and 15 to 19 minutes (26,869 commuters, 17.2%) for females.
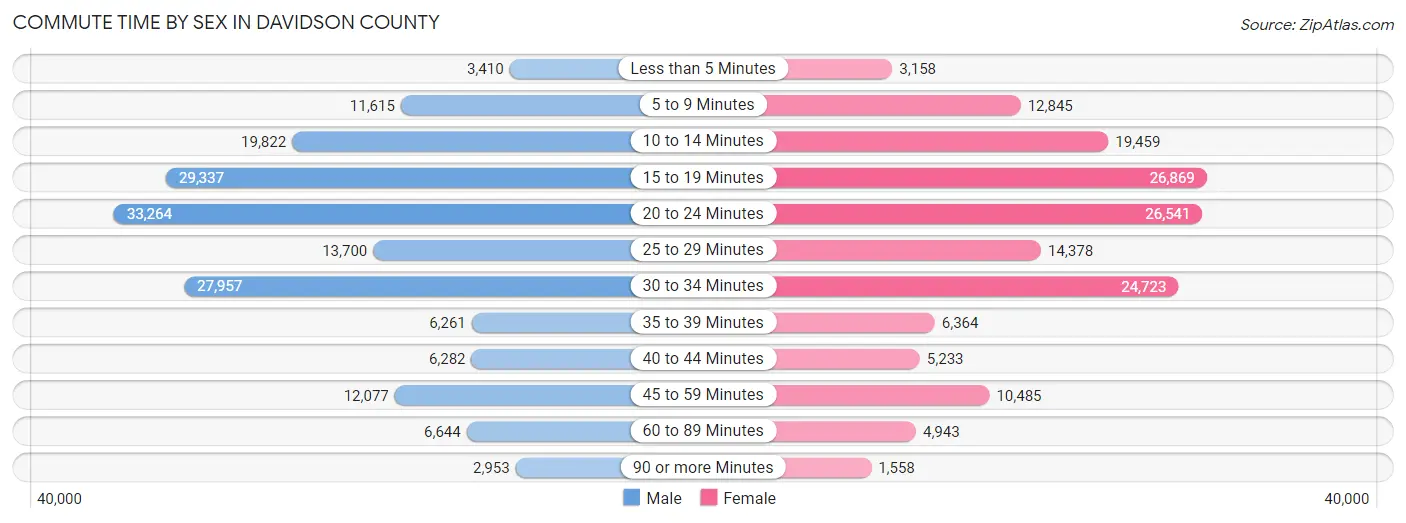
| Commute Time | Male | Female |
| Less than 5 Minutes | 3,410 (2.0%) | 3,158 (2.0%) |
| 5 to 9 Minutes | 11,615 (6.7%) | 12,845 (8.2%) |
| 10 to 14 Minutes | 19,822 (11.4%) | 19,459 (12.4%) |
| 15 to 19 Minutes | 29,337 (16.9%) | 26,869 (17.2%) |
| 20 to 24 Minutes | 33,264 (19.2%) | 26,541 (17.0%) |
| 25 to 29 Minutes | 13,700 (7.9%) | 14,378 (9.2%) |
| 30 to 34 Minutes | 27,957 (16.1%) | 24,723 (15.8%) |
| 35 to 39 Minutes | 6,261 (3.6%) | 6,364 (4.1%) |
| 40 to 44 Minutes | 6,282 (3.6%) | 5,233 (3.3%) |
| 45 to 59 Minutes | 12,077 (7.0%) | 10,485 (6.7%) |
| 60 to 89 Minutes | 6,644 (3.8%) | 4,943 (3.2%) |
| 90 or more Minutes | 2,953 (1.7%) | 1,558 (1.0%) |
Time of Departure to Work by Sex in Davidson County
The most frequent times of departure to work in Davidson County are 7:00 AM to 7:29 AM (24,259, 14.0%) for males and 7:00 AM to 7:29 AM (23,143, 14.8%) for females.
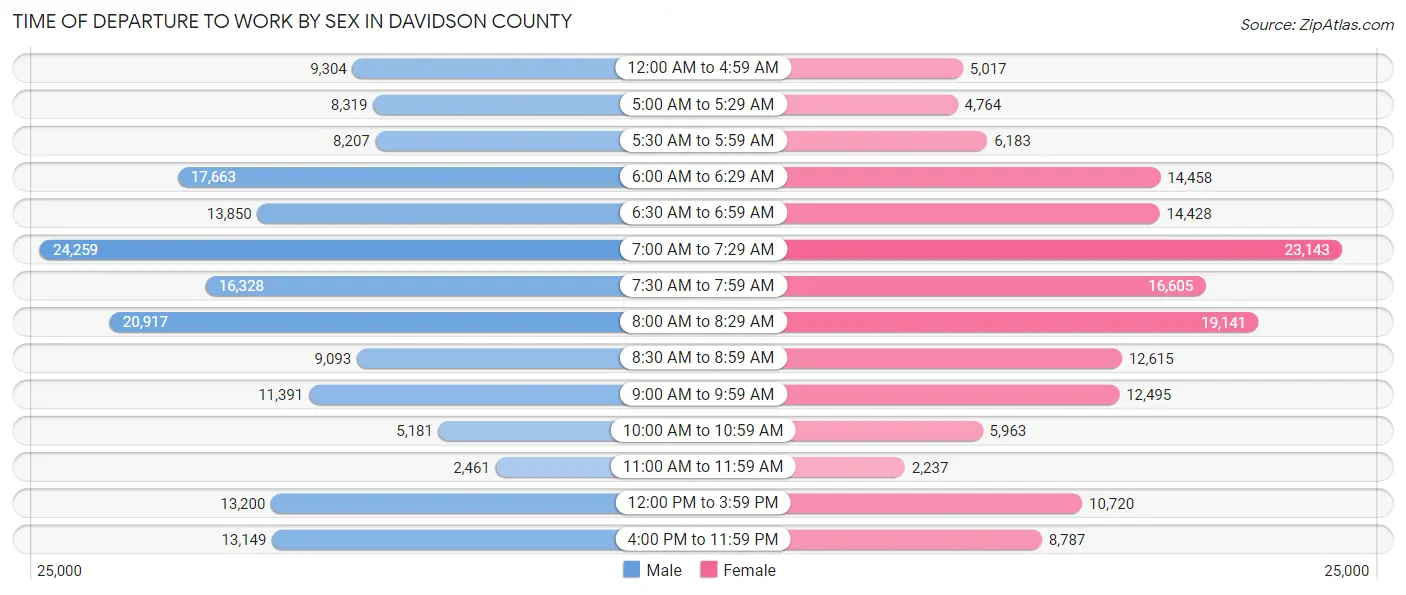
| Time of Departure | Male | Female |
| 12:00 AM to 4:59 AM | 9,304 (5.4%) | 5,017 (3.2%) |
| 5:00 AM to 5:29 AM | 8,319 (4.8%) | 4,764 (3.0%) |
| 5:30 AM to 5:59 AM | 8,207 (4.7%) | 6,183 (4.0%) |
| 6:00 AM to 6:29 AM | 17,663 (10.2%) | 14,458 (9.2%) |
| 6:30 AM to 6:59 AM | 13,850 (8.0%) | 14,428 (9.2%) |
| 7:00 AM to 7:29 AM | 24,259 (14.0%) | 23,143 (14.8%) |
| 7:30 AM to 7:59 AM | 16,328 (9.4%) | 16,605 (10.6%) |
| 8:00 AM to 8:29 AM | 20,917 (12.1%) | 19,141 (12.2%) |
| 8:30 AM to 8:59 AM | 9,093 (5.2%) | 12,615 (8.1%) |
| 9:00 AM to 9:59 AM | 11,391 (6.6%) | 12,495 (8.0%) |
| 10:00 AM to 10:59 AM | 5,181 (3.0%) | 5,963 (3.8%) |
| 11:00 AM to 11:59 AM | 2,461 (1.4%) | 2,237 (1.4%) |
| 12:00 PM to 3:59 PM | 13,200 (7.6%) | 10,720 (6.9%) |
| 4:00 PM to 11:59 PM | 13,149 (7.6%) | 8,787 (5.6%) |
| Total | 173,322 (100.0%) | 156,556 (100.0%) |
Housing Occupancy in Davidson County
Occupancy by Ownership in Davidson County
Of the total 302,663 dwellings in Davidson County, owner-occupied units account for 163,993 (54.2%), while renter-occupied units make up 138,670 (45.8%).
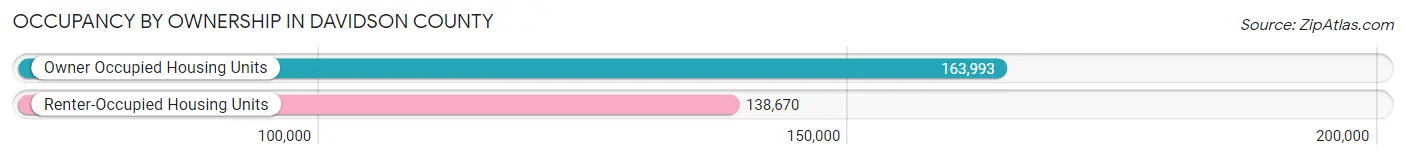
| Occupancy | # Housing Units | % Housing Units |
| Owner Occupied Housing Units | 163,993 | 54.2% |
| Renter-Occupied Housing Units | 138,670 | 45.8% |
| Total Occupied Housing Units | 302,663 | 100.0% |
Occupancy by Household Size in Davidson County
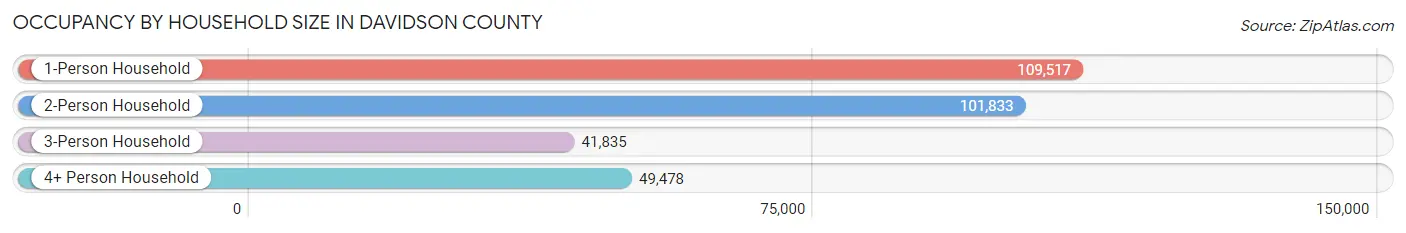
| Household Size | # Housing Units | % Housing Units |
| 1-Person Household | 109,517 | 36.2% |
| 2-Person Household | 101,833 | 33.7% |
| 3-Person Household | 41,835 | 13.8% |
| 4+ Person Household | 49,478 | 16.4% |
| Total Housing Units | 302,663 | 100.0% |
Occupancy by Ownership by Household Size in Davidson County
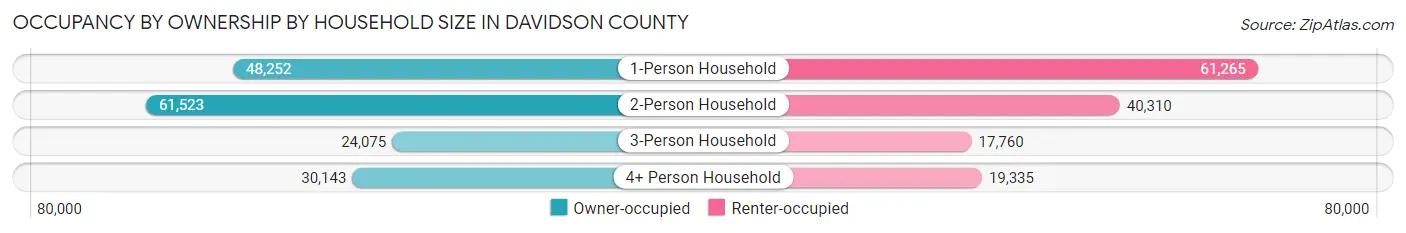
| Household Size | Owner-occupied | Renter-occupied |
| 1-Person Household | 48,252 (44.1%) | 61,265 (55.9%) |
| 2-Person Household | 61,523 (60.4%) | 40,310 (39.6%) |
| 3-Person Household | 24,075 (57.6%) | 17,760 (42.4%) |
| 4+ Person Household | 30,143 (60.9%) | 19,335 (39.1%) |
| Total Housing Units | 163,993 (54.2%) | 138,670 (45.8%) |
Occupancy by Educational Attainment in Davidson County
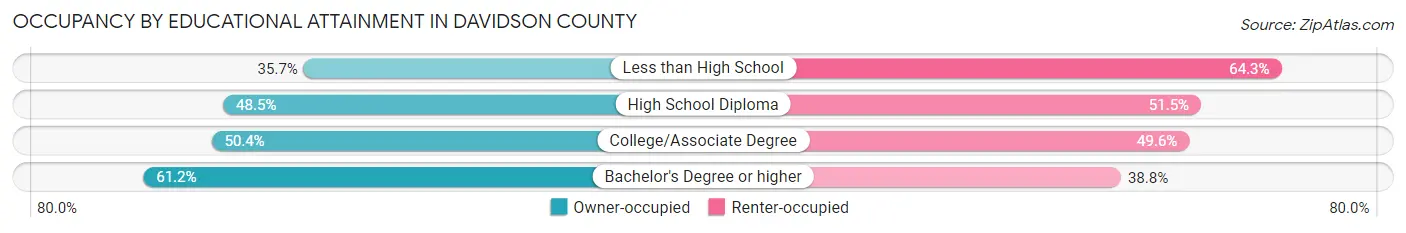
| Household Size | Owner-occupied | Renter-occupied |
| Less than High School | 8,226 (35.7%) | 14,789 (64.3%) |
| High School Diploma | 26,854 (48.5%) | 28,520 (51.5%) |
| College/Associate Degree | 38,584 (50.4%) | 38,028 (49.6%) |
| Bachelor's Degree or higher | 90,329 (61.2%) | 57,333 (38.8%) |
Occupancy by Age of Householder in Davidson County
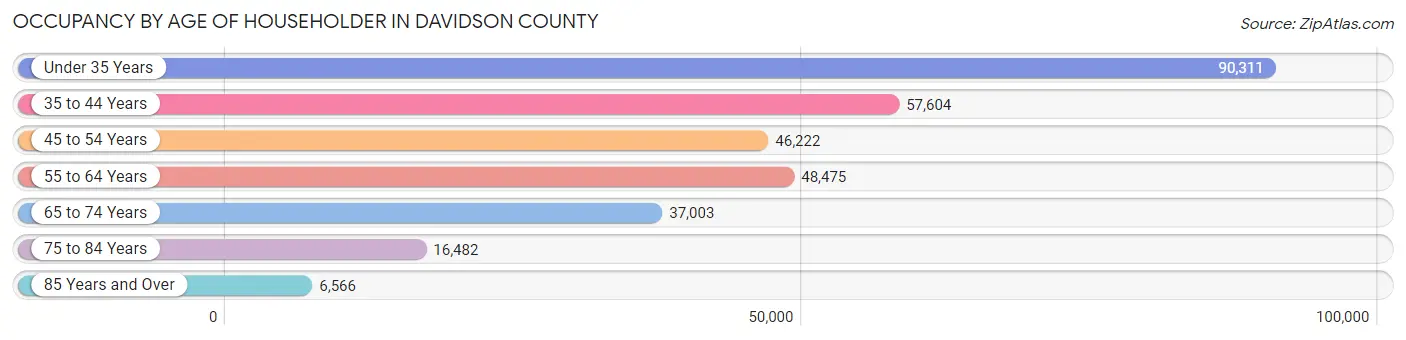
| Age Bracket | # Households | % Households |
| Under 35 Years | 90,311 | 29.8% |
| 35 to 44 Years | 57,604 | 19.0% |
| 45 to 54 Years | 46,222 | 15.3% |
| 55 to 64 Years | 48,475 | 16.0% |
| 65 to 74 Years | 37,003 | 12.2% |
| 75 to 84 Years | 16,482 | 5.4% |
| 85 Years and Over | 6,566 | 2.2% |
| Total | 302,663 | 100.0% |
Housing Finances in Davidson County
Median Income by Occupancy in Davidson County
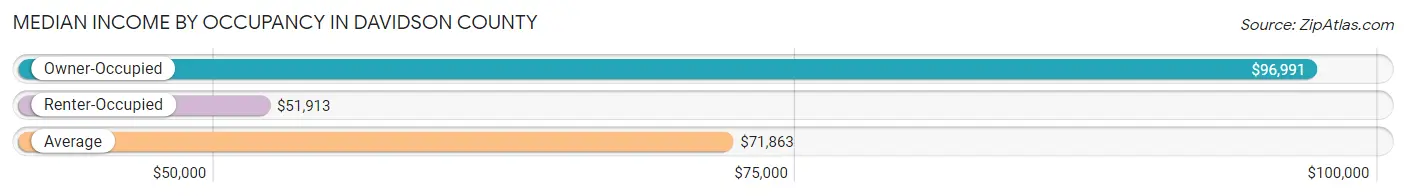
| Occupancy Type | # Households | Median Income |
| Owner-Occupied | 163,993 (54.2%) | $96,991 |
| Renter-Occupied | 138,670 (45.8%) | $51,913 |
| Average | 302,663 (100.0%) | $71,863 |
Occupancy by Householder Income Bracket in Davidson County
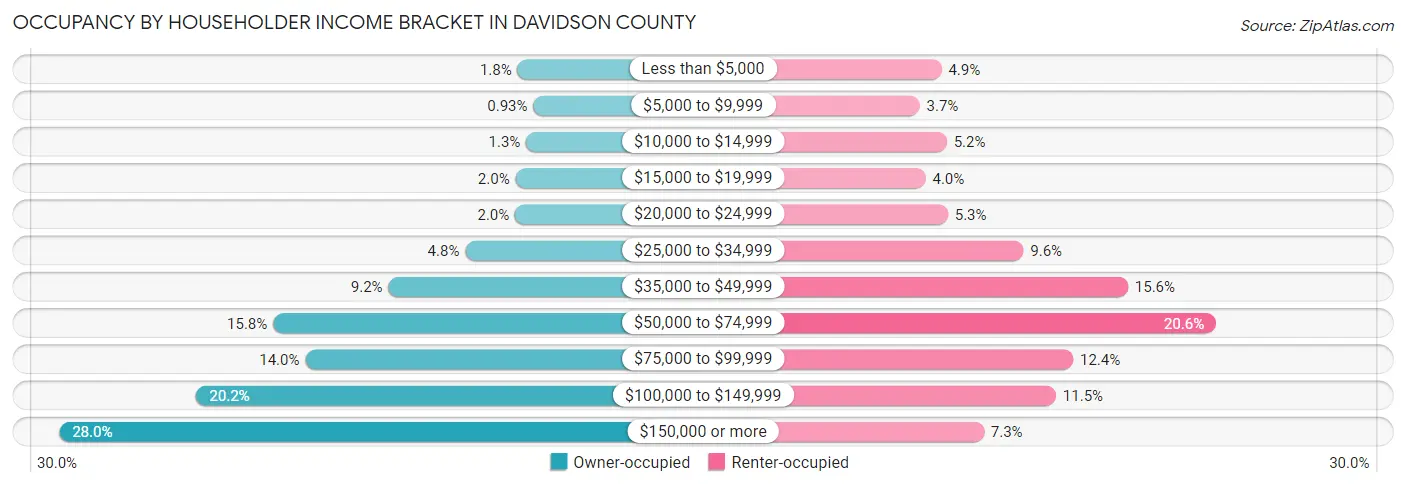
| Income Bracket | Owner-occupied | Renter-occupied |
| Less than $5,000 | 2,999 (1.8%) | 6,810 (4.9%) |
| $5,000 to $9,999 | 1,533 (0.9%) | 5,070 (3.7%) |
| $10,000 to $14,999 | 2,197 (1.3%) | 7,221 (5.2%) |
| $15,000 to $19,999 | 3,193 (1.9%) | 5,545 (4.0%) |
| $20,000 to $24,999 | 3,229 (2.0%) | 7,304 (5.3%) |
| $25,000 to $34,999 | 7,898 (4.8%) | 13,296 (9.6%) |
| $35,000 to $49,999 | 15,100 (9.2%) | 21,578 (15.6%) |
| $50,000 to $74,999 | 25,905 (15.8%) | 28,564 (20.6%) |
| $75,000 to $99,999 | 22,896 (14.0%) | 17,232 (12.4%) |
| $100,000 to $149,999 | 33,087 (20.2%) | 15,883 (11.5%) |
| $150,000 or more | 45,956 (28.0%) | 10,167 (7.3%) |
| Total | 163,993 (100.0%) | 138,670 (100.0%) |
Monthly Housing Cost Tiers in Davidson County
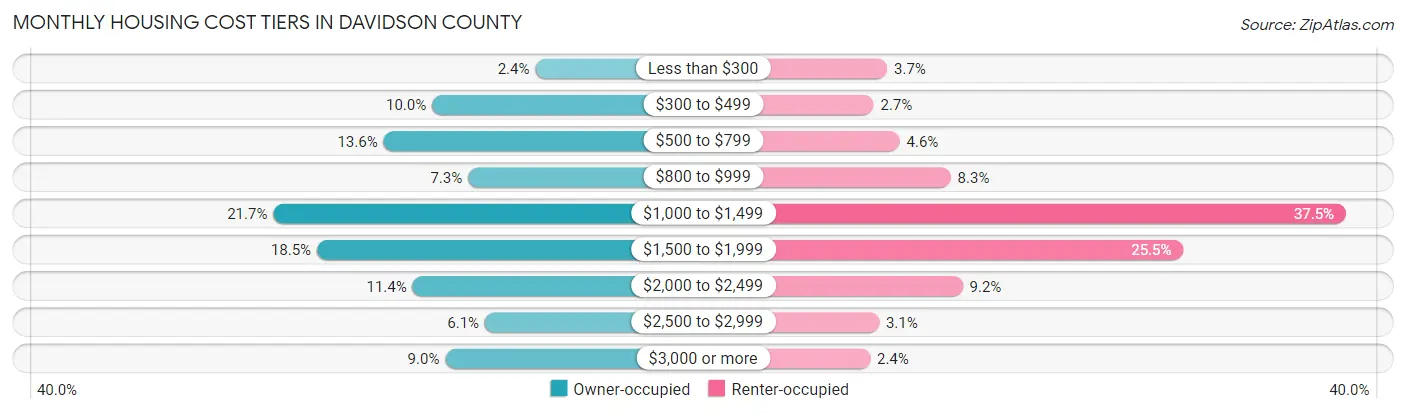
| Monthly Cost | Owner-occupied | Renter-occupied |
| Less than $300 | 3,915 (2.4%) | 5,071 (3.7%) |
| $300 to $499 | 16,378 (10.0%) | 3,695 (2.7%) |
| $500 to $799 | 22,258 (13.6%) | 6,348 (4.6%) |
| $800 to $999 | 12,036 (7.3%) | 11,572 (8.3%) |
| $1,000 to $1,499 | 35,574 (21.7%) | 51,937 (37.4%) |
| $1,500 to $1,999 | 30,283 (18.5%) | 35,320 (25.5%) |
| $2,000 to $2,499 | 18,752 (11.4%) | 12,779 (9.2%) |
| $2,500 to $2,999 | 9,999 (6.1%) | 4,241 (3.1%) |
| $3,000 or more | 14,798 (9.0%) | 3,325 (2.4%) |
| Total | 163,993 (100.0%) | 138,670 (100.0%) |
Physical Housing Characteristics in Davidson County
Housing Structures in Davidson County
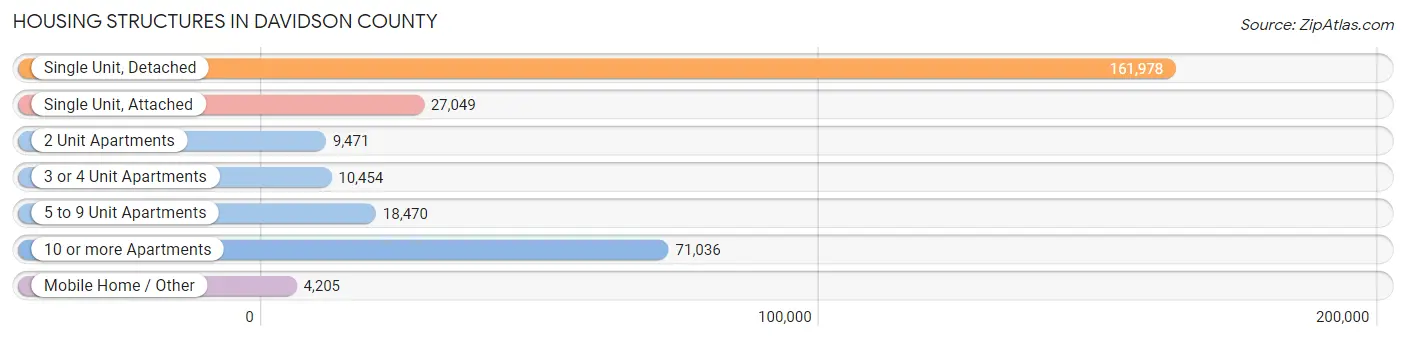
| Structure Type | # Housing Units | % Housing Units |
| Single Unit, Detached | 161,978 | 53.5% |
| Single Unit, Attached | 27,049 | 8.9% |
| 2 Unit Apartments | 9,471 | 3.1% |
| 3 or 4 Unit Apartments | 10,454 | 3.5% |
| 5 to 9 Unit Apartments | 18,470 | 6.1% |
| 10 or more Apartments | 71,036 | 23.5% |
| Mobile Home / Other | 4,205 | 1.4% |
| Total | 302,663 | 100.0% |
Housing Structures by Occupancy in Davidson County
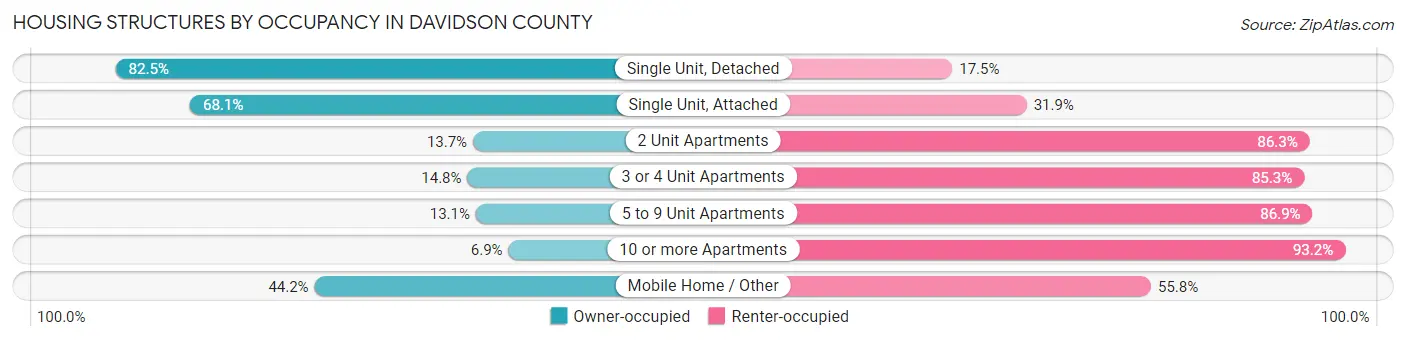
| Structure Type | Owner-occupied | Renter-occupied |
| Single Unit, Detached | 133,575 (82.5%) | 28,403 (17.5%) |
| Single Unit, Attached | 18,429 (68.1%) | 8,620 (31.9%) |
| 2 Unit Apartments | 1,296 (13.7%) | 8,175 (86.3%) |
| 3 or 4 Unit Apartments | 1,542 (14.7%) | 8,912 (85.3%) |
| 5 to 9 Unit Apartments | 2,426 (13.1%) | 16,044 (86.9%) |
| 10 or more Apartments | 4,867 (6.9%) | 66,169 (93.1%) |
| Mobile Home / Other | 1,858 (44.2%) | 2,347 (55.8%) |
| Total | 163,993 (54.2%) | 138,670 (45.8%) |
Housing Structures by Number of Rooms in Davidson County
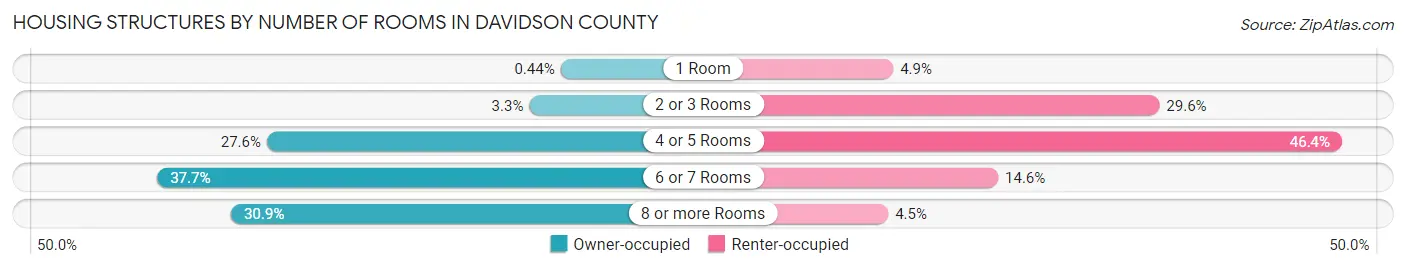
| Number of Rooms | Owner-occupied | Renter-occupied |
| 1 Room | 717 (0.4%) | 6,842 (4.9%) |
| 2 or 3 Rooms | 5,453 (3.3%) | 40,980 (29.5%) |
| 4 or 5 Rooms | 45,265 (27.6%) | 64,366 (46.4%) |
| 6 or 7 Rooms | 61,869 (37.7%) | 20,289 (14.6%) |
| 8 or more Rooms | 50,689 (30.9%) | 6,193 (4.5%) |
| Total | 163,993 (100.0%) | 138,670 (100.0%) |
Housing Structure by Heating Type in Davidson County
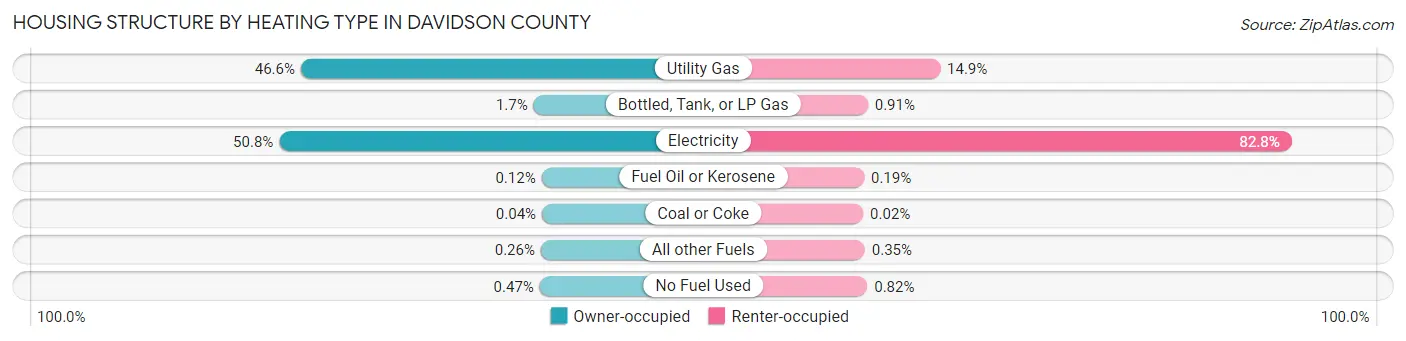
| Heating Type | Owner-occupied | Renter-occupied |
| Utility Gas | 76,476 (46.6%) | 20,642 (14.9%) |
| Bottled, Tank, or LP Gas | 2,712 (1.7%) | 1,263 (0.9%) |
| Electricity | 83,328 (50.8%) | 114,833 (82.8%) |
| Fuel Oil or Kerosene | 204 (0.1%) | 267 (0.2%) |
| Coal or Coke | 69 (0.0%) | 32 (0.0%) |
| All other Fuels | 429 (0.3%) | 490 (0.4%) |
| No Fuel Used | 775 (0.5%) | 1,143 (0.8%) |
| Total | 163,993 (100.0%) | 138,670 (100.0%) |
Household Vehicle Usage in Davidson County
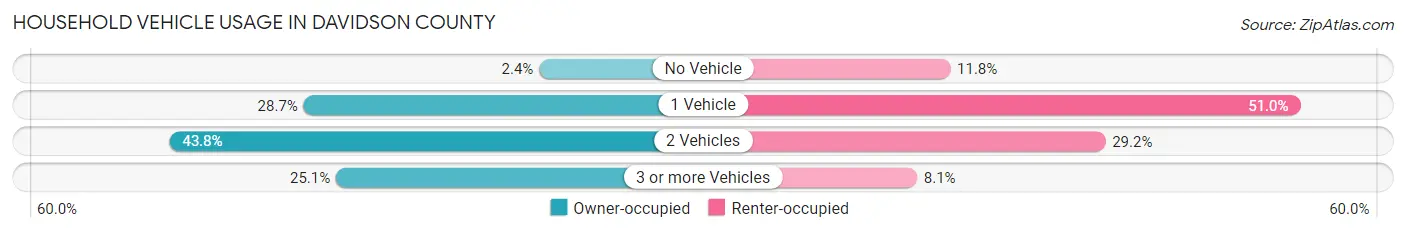
| Vehicles per Household | Owner-occupied | Renter-occupied |
| No Vehicle | 3,867 (2.4%) | 16,335 (11.8%) |
| 1 Vehicle | 47,134 (28.7%) | 70,733 (51.0%) |
| 2 Vehicles | 71,807 (43.8%) | 40,430 (29.2%) |
| 3 or more Vehicles | 41,185 (25.1%) | 11,172 (8.1%) |
| Total | 163,993 (100.0%) | 138,670 (100.0%) |
Real Estate & Mortgages in Davidson County
Real Estate and Mortgage Overview in Davidson County
| Characteristic | Without Mortgage | With Mortgage |
| Housing Units | 51,565 | 112,428 |
| Median Property Value | $346,300 | $358,400 |
| Median Household Income | $76,663 | $34,475 |
| Monthly Housing Costs | $584 | $14,322 |
| Real Estate Taxes | $2,256 | $3,671 |
Property Value by Mortgage Status in Davidson County
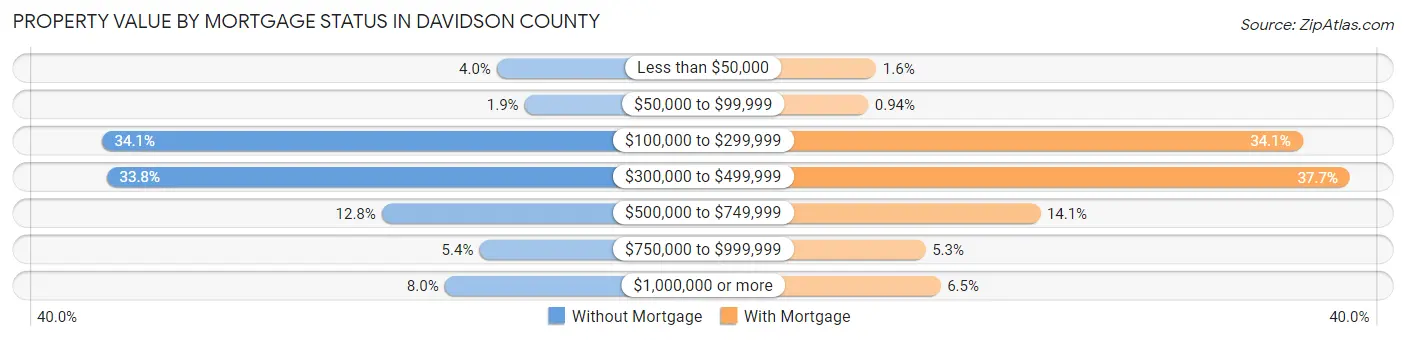
| Property Value | Without Mortgage | With Mortgage |
| Less than $50,000 | 2,080 (4.0%) | 1,743 (1.5%) |
| $50,000 to $99,999 | 989 (1.9%) | 1,057 (0.9%) |
| $100,000 to $299,999 | 17,599 (34.1%) | 38,286 (34.1%) |
| $300,000 to $499,999 | 17,402 (33.8%) | 42,325 (37.7%) |
| $500,000 to $749,999 | 6,601 (12.8%) | 15,794 (14.1%) |
| $750,000 to $999,999 | 2,765 (5.4%) | 5,975 (5.3%) |
| $1,000,000 or more | 4,129 (8.0%) | 7,248 (6.5%) |
| Total | 51,565 (100.0%) | 112,428 (100.0%) |
Household Income by Mortgage Status in Davidson County
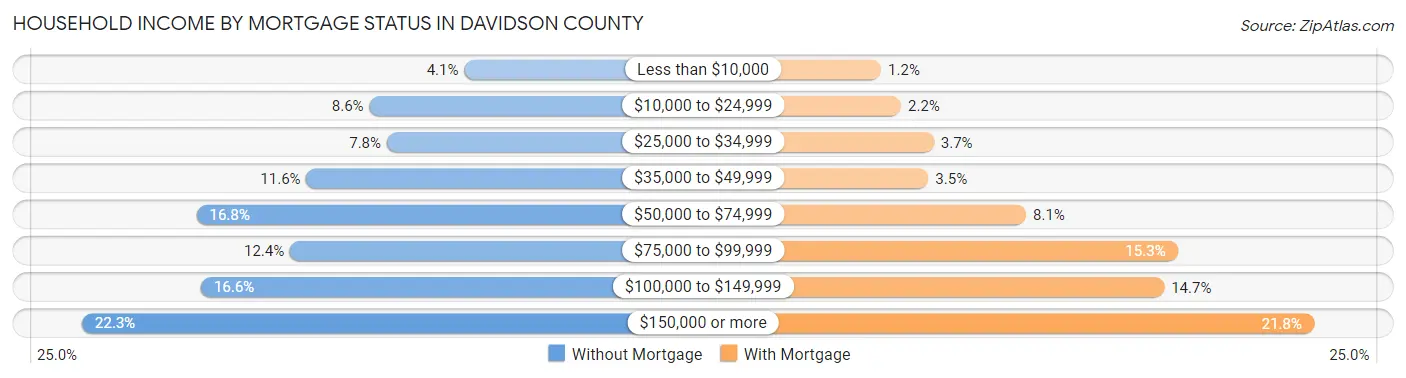
| Household Income | Without Mortgage | With Mortgage |
| Less than $10,000 | 2,093 (4.1%) | 1,370 (1.2%) |
| $10,000 to $24,999 | 4,422 (8.6%) | 2,439 (2.2%) |
| $25,000 to $34,999 | 3,997 (7.7%) | 4,197 (3.7%) |
| $35,000 to $49,999 | 5,972 (11.6%) | 3,901 (3.5%) |
| $50,000 to $74,999 | 8,670 (16.8%) | 9,128 (8.1%) |
| $75,000 to $99,999 | 6,371 (12.4%) | 17,235 (15.3%) |
| $100,000 to $149,999 | 8,559 (16.6%) | 16,525 (14.7%) |
| $150,000 or more | 11,481 (22.3%) | 24,528 (21.8%) |
| Total | 51,565 (100.0%) | 112,428 (100.0%) |
Property Value to Household Income Ratio in Davidson County
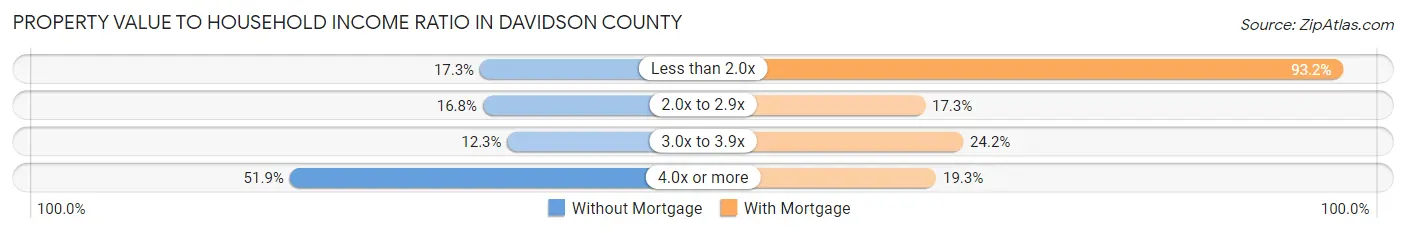
| Value-to-Income Ratio | Without Mortgage | With Mortgage |
| Less than 2.0x | 8,920 (17.3%) | 104,829 (93.2%) |
| 2.0x to 2.9x | 8,654 (16.8%) | 19,419 (17.3%) |
| 3.0x to 3.9x | 6,352 (12.3%) | 27,205 (24.2%) |
| 4.0x or more | 26,740 (51.9%) | 21,681 (19.3%) |
| Total | 51,565 (100.0%) | 112,428 (100.0%) |
Real Estate Taxes by Mortgage Status in Davidson County
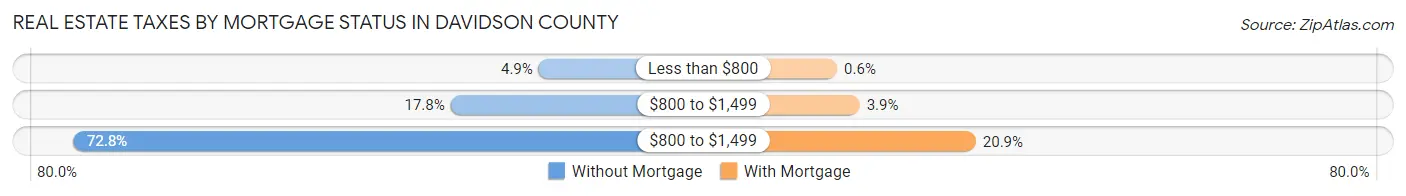
| Property Taxes | Without Mortgage | With Mortgage |
| Less than $800 | 2,524 (4.9%) | 674 (0.6%) |
| $800 to $1,499 | 9,160 (17.8%) | 4,384 (3.9%) |
| $800 to $1,499 | 37,532 (72.8%) | 23,465 (20.9%) |
| Total | 51,565 (100.0%) | 112,428 (100.0%) |
Health & Disability in Davidson County
Health Insurance Coverage by Age in Davidson County
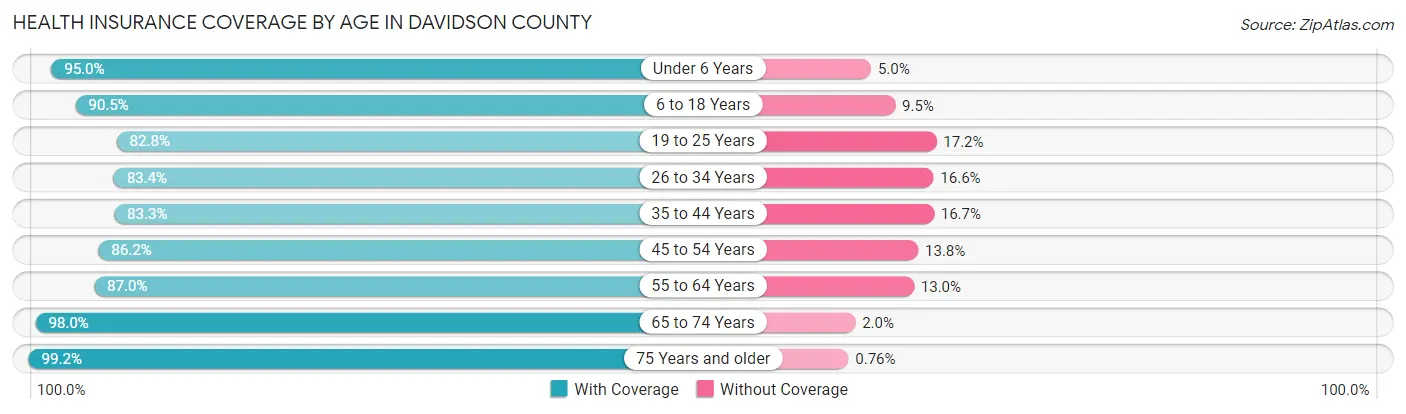
| Age Bracket | With Coverage | Without Coverage |
| Under 6 Years | 51,852 (95.0%) | 2,719 (5.0%) |
| 6 to 18 Years | 89,689 (90.5%) | 9,391 (9.5%) |
| 19 to 25 Years | 62,299 (82.8%) | 12,917 (17.2%) |
| 26 to 34 Years | 105,576 (83.4%) | 21,048 (16.6%) |
| 35 to 44 Years | 82,936 (83.3%) | 16,611 (16.7%) |
| 45 to 54 Years | 68,886 (86.2%) | 10,999 (13.8%) |
| 55 to 64 Years | 69,148 (87.0%) | 10,302 (13.0%) |
| 65 to 74 Years | 54,589 (98.0%) | 1,131 (2.0%) |
| 75 Years and older | 33,259 (99.2%) | 256 (0.8%) |
| Total | 618,234 (87.9%) | 85,374 (12.1%) |
Health Insurance Coverage by Citizenship Status in Davidson County
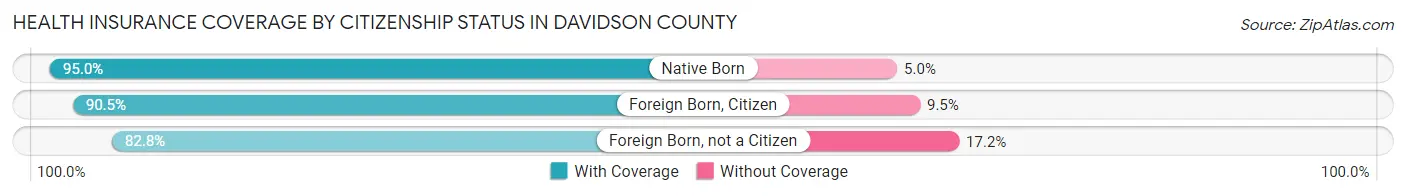
| Citizenship Status | With Coverage | Without Coverage |
| Native Born | 51,852 (95.0%) | 2,719 (5.0%) |
| Foreign Born, Citizen | 89,689 (90.5%) | 9,391 (9.5%) |
| Foreign Born, not a Citizen | 62,299 (82.8%) | 12,917 (17.2%) |
Health Insurance Coverage by Household Income in Davidson County
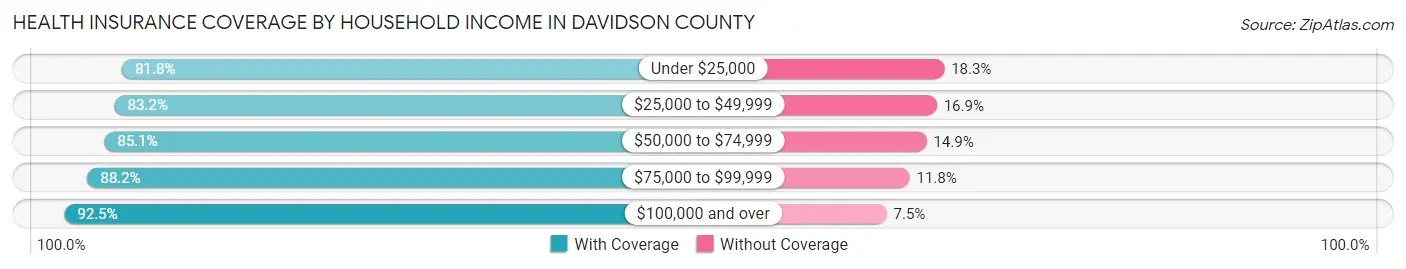
| Household Income | With Coverage | Without Coverage |
| Under $25,000 | 67,387 (81.8%) | 15,041 (18.2%) |
| $25,000 to $49,999 | 93,460 (83.2%) | 18,938 (16.9%) |
| $50,000 to $74,999 | 97,359 (85.1%) | 17,083 (14.9%) |
| $75,000 to $99,999 | 84,459 (88.2%) | 11,257 (11.8%) |
| $100,000 and over | 262,091 (92.5%) | 21,129 (7.5%) |
Public vs Private Health Insurance Coverage by Age in Davidson County
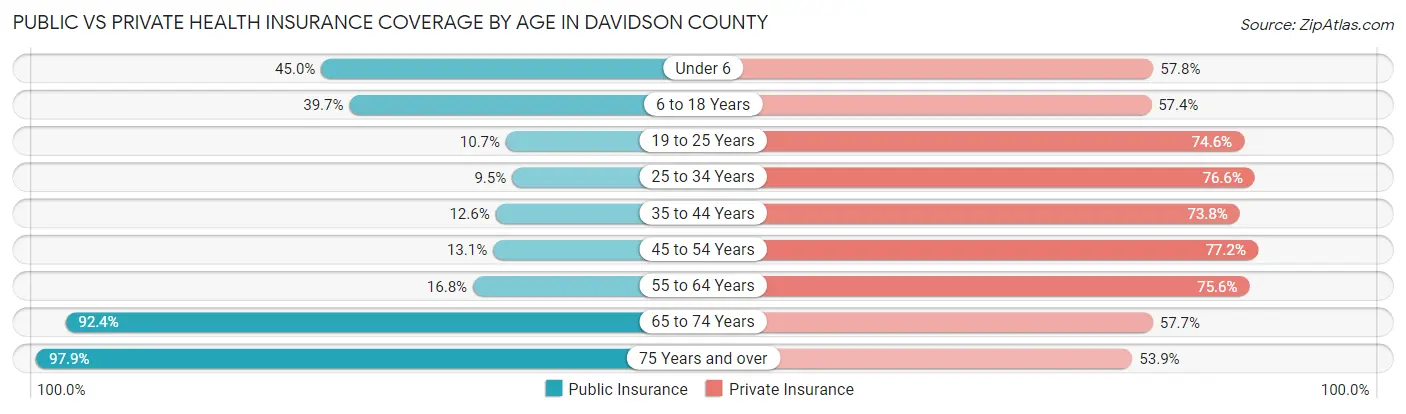
| Age Bracket | Public Insurance | Private Insurance |
| Under 6 | 24,529 (45.0%) | 31,551 (57.8%) |
| 6 to 18 Years | 39,373 (39.7%) | 56,897 (57.4%) |
| 19 to 25 Years | 8,023 (10.7%) | 56,135 (74.6%) |
| 25 to 34 Years | 12,067 (9.5%) | 97,044 (76.6%) |
| 35 to 44 Years | 12,543 (12.6%) | 73,505 (73.8%) |
| 45 to 54 Years | 10,436 (13.1%) | 61,670 (77.2%) |
| 55 to 64 Years | 13,336 (16.8%) | 60,085 (75.6%) |
| 65 to 74 Years | 51,501 (92.4%) | 32,167 (57.7%) |
| 75 Years and over | 32,793 (97.9%) | 18,078 (53.9%) |
| Total | 204,601 (29.1%) | 487,132 (69.2%) |
Disability Status by Sex by Age in Davidson County
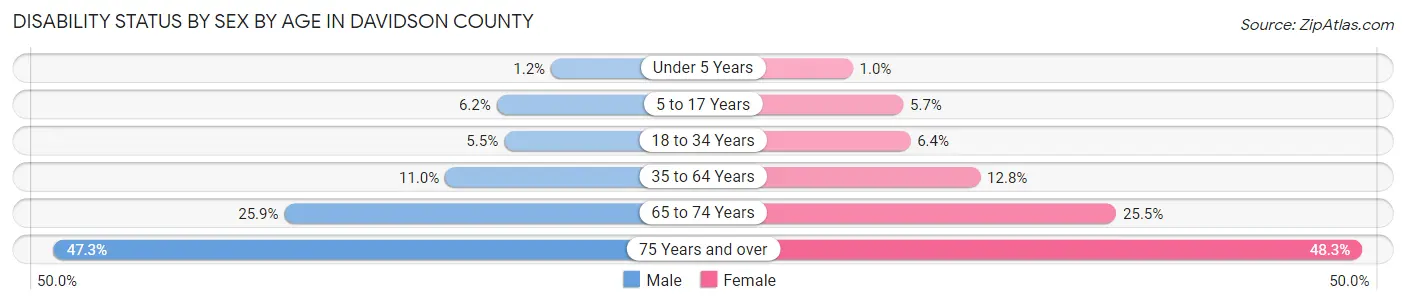
| Age Bracket | Male | Female |
| Under 5 Years | 265 (1.1%) | 225 (1.0%) |
| 5 to 17 Years | 3,099 (6.2%) | 2,770 (5.7%) |
| 18 to 34 Years | 5,592 (5.5%) | 6,971 (6.4%) |
| 35 to 64 Years | 13,964 (11.0%) | 16,906 (12.8%) |
| 65 to 74 Years | 6,564 (25.9%) | 7,734 (25.5%) |
| 75 Years and over | 6,101 (47.3%) | 9,951 (48.3%) |
Disability Class by Sex by Age in Davidson County
Disability Class: Hearing Difficulty
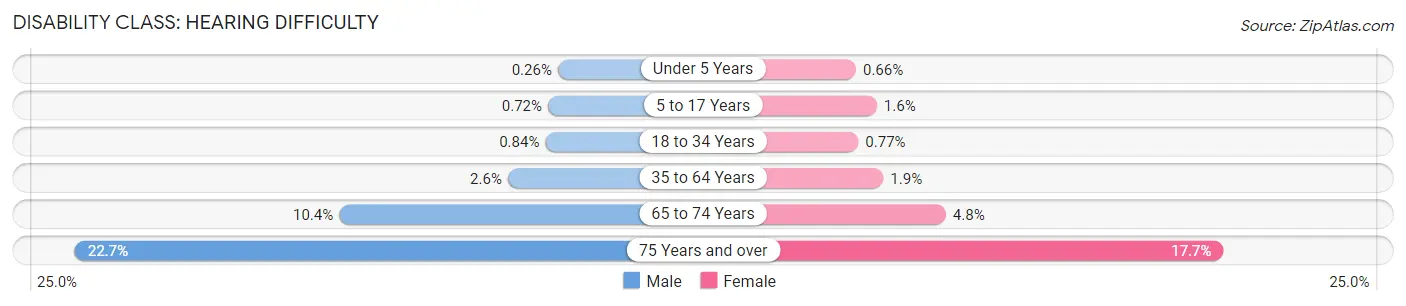
| Age Bracket | Male | Female |
| Under 5 Years | 61 (0.3%) | 149 (0.7%) |
| 5 to 17 Years | 360 (0.7%) | 793 (1.6%) |
| 18 to 34 Years | 855 (0.8%) | 848 (0.8%) |
| 35 to 64 Years | 3,278 (2.6%) | 2,541 (1.9%) |
| 65 to 74 Years | 2,639 (10.4%) | 1,466 (4.8%) |
| 75 Years and over | 2,925 (22.7%) | 3,649 (17.7%) |
Disability Class: Vision Difficulty
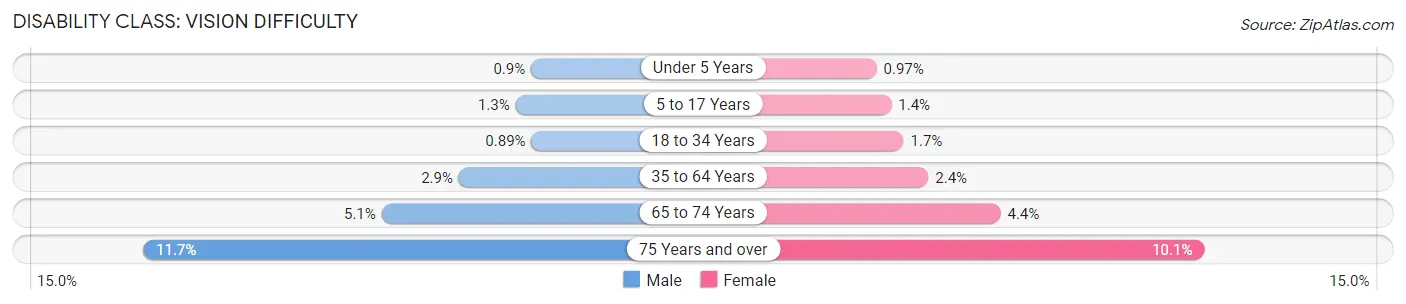
| Age Bracket | Male | Female |
| Under 5 Years | 207 (0.9%) | 219 (1.0%) |
| 5 to 17 Years | 663 (1.3%) | 671 (1.4%) |
| 18 to 34 Years | 899 (0.9%) | 1,882 (1.7%) |
| 35 to 64 Years | 3,700 (2.9%) | 3,175 (2.4%) |
| 65 to 74 Years | 1,281 (5.1%) | 1,343 (4.4%) |
| 75 Years and over | 1,510 (11.7%) | 2,079 (10.1%) |
Disability Class: Cognitive Difficulty
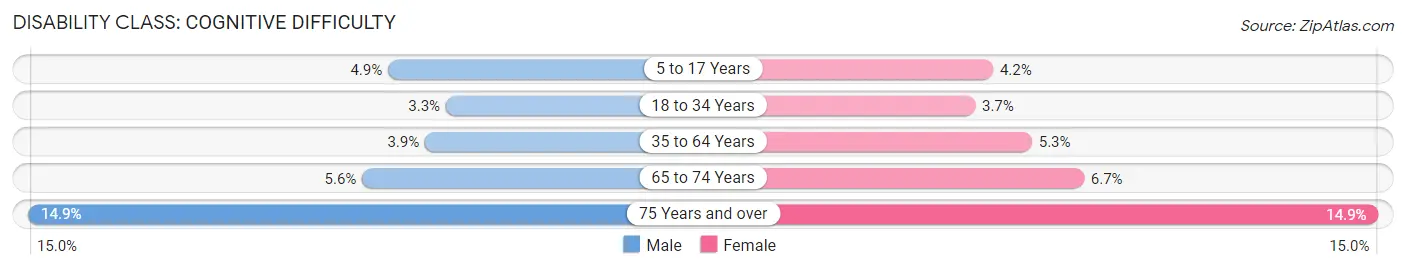
| Age Bracket | Male | Female |
| 5 to 17 Years | 2,441 (4.9%) | 2,049 (4.2%) |
| 18 to 34 Years | 3,318 (3.3%) | 4,070 (3.7%) |
| 35 to 64 Years | 4,892 (3.8%) | 6,962 (5.3%) |
| 65 to 74 Years | 1,419 (5.6%) | 2,048 (6.7%) |
| 75 Years and over | 1,922 (14.9%) | 3,080 (14.9%) |
Disability Class: Ambulatory Difficulty
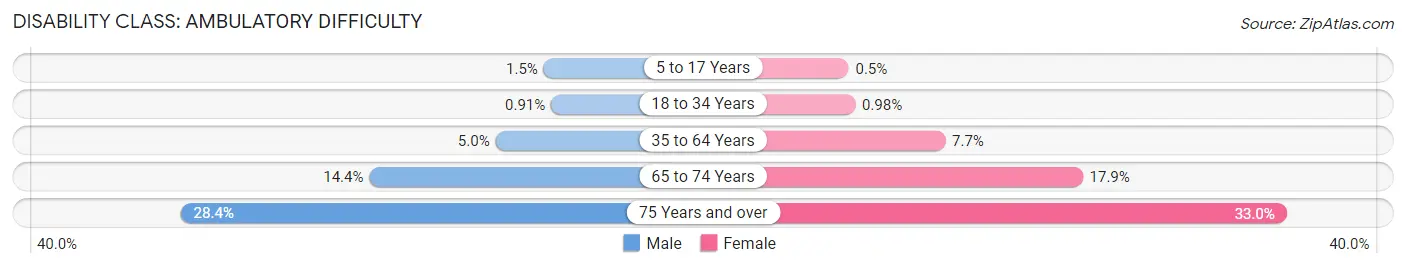
| Age Bracket | Male | Female |
| 5 to 17 Years | 729 (1.5%) | 243 (0.5%) |
| 18 to 34 Years | 923 (0.9%) | 1,078 (1.0%) |
| 35 to 64 Years | 6,407 (5.0%) | 10,101 (7.7%) |
| 65 to 74 Years | 3,652 (14.4%) | 5,433 (17.9%) |
| 75 Years and over | 3,666 (28.4%) | 6,809 (33.0%) |
Disability Class: Self-Care Difficulty
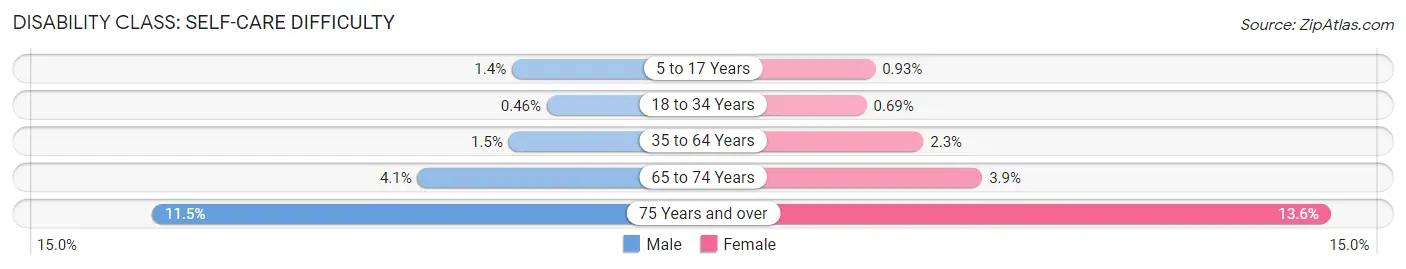
| Age Bracket | Male | Female |
| 5 to 17 Years | 717 (1.4%) | 454 (0.9%) |
| 18 to 34 Years | 464 (0.5%) | 758 (0.7%) |
| 35 to 64 Years | 1,927 (1.5%) | 2,988 (2.3%) |
| 65 to 74 Years | 1,030 (4.1%) | 1,188 (3.9%) |
| 75 Years and over | 1,477 (11.5%) | 2,806 (13.6%) |
Technology Access in Davidson County
Computing Device Access in Davidson County
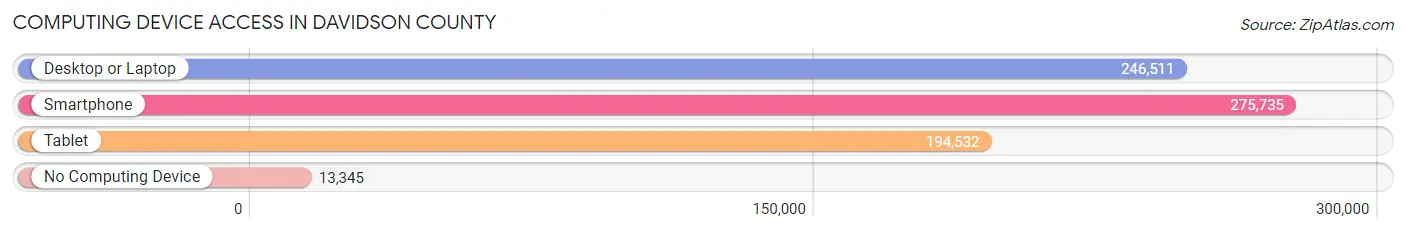
| Device Type | # Households | % Households |
| Desktop or Laptop | 246,511 | 81.5% |
| Smartphone | 275,735 | 91.1% |
| Tablet | 194,532 | 64.3% |
| No Computing Device | 13,345 | 4.4% |
| Total | 302,663 | 100.0% |
Internet Access in Davidson County
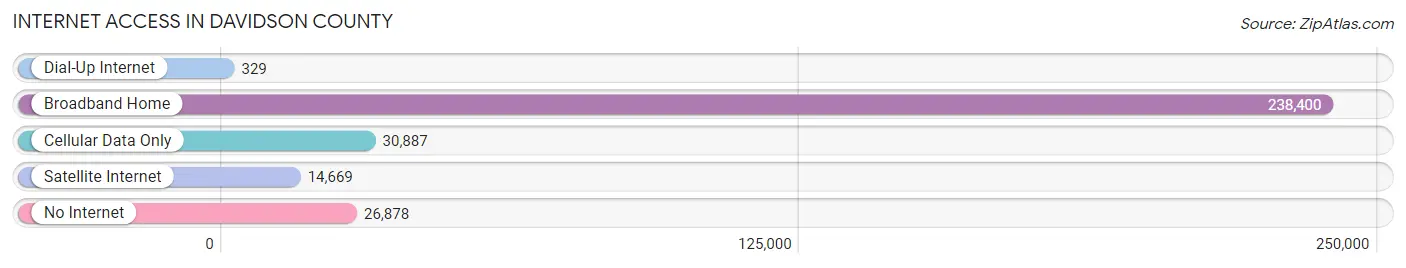
| Internet Type | # Households | % Households |
| Dial-Up Internet | 329 | 0.1% |
| Broadband Home | 238,400 | 78.8% |
| Cellular Data Only | 30,887 | 10.2% |
| Satellite Internet | 14,669 | 4.9% |
| No Internet | 26,878 | 8.9% |
| Total | 302,663 | 100.0% |
Davidson County Summary
Davidson County, Tennessee is located in the central part of the state and is the second most populous county in the state. It is home to the state capital, Nashville, and is part of the Nashville-Davidson-Murfreesboro-Franklin Metropolitan Statistical Area. The county was established in 1783 and named after William Lee Davidson, a Revolutionary War general.
Geography
Davidson County is located in the central part of Tennessee and is bordered by Williamson County to the south, Rutherford County to the east, Wilson County to the west, and Cheatham County to the north. The county covers an area of 526 square miles and is divided into twelve townships. The terrain is mostly rolling hills and is part of the Nashville Basin. The Cumberland River forms the northern border of the county and the Harpeth River forms the western border. The county is home to several parks, including Radnor Lake State Park, Beaman Park, and Percy Warner Park.
Economy
The economy of Davidson County is largely driven by the city of Nashville, which is the state capital and home to many large corporations. The county is home to several Fortune 500 companies, including Bridgestone, Dollar General, and HCA Healthcare. The county is also home to several universities, including Vanderbilt University, Belmont University, and Tennessee State University. Tourism is also a major industry in the county, with many visitors coming to experience the city’s music and culture.
Demographics
As of the 2010 census, the population of Davidson County was 626,681. The population is racially diverse, with the largest racial group being white (63.3%), followed by African American (27.2%), Hispanic or Latino (5.2%), and Asian (2.7%). The median household income is $50,835 and the median age is 36.7.
History
Davidson County was established in 1783 and named after William Lee Davidson, a Revolutionary War general. The county was originally part of North Carolina and was ceded to the state of Tennessee in 1790. The county was home to several Native American tribes, including the Cherokee, Chickasaw, and Shawnee. The first settlers arrived in the area in the late 1700s and the county was officially organized in 1806.
The county was home to several important events in the Civil War, including the Battle of Nashville in December 1864. The city of Nashville was occupied by Union forces and the county was the site of several skirmishes. After the war, the county experienced a period of growth and development, with the city of Nashville becoming an important center of commerce and industry. The county has continued to grow and develop in the years since, becoming an important part of the state of Tennessee.
Common Questions
What is the Total Population of Davidson County?
Total Population of Davidson County is 709,786.
What is the Total Male Population of Davidson County?
Total Male Population of Davidson County is 343,836.
What is the Total Female Population of Davidson County?
Total Female Population of Davidson County is 365,950.
What is the Ratio of Males per 100 Females in Davidson County?
There are 93.96 Males per 100 Females in Davidson County.
What is the Ratio of Females per 100 Males in Davidson County?
There are 106.43 Females per 100 Males in Davidson County.
What is the Median Population Age in Davidson County?
Median Population Age in Davidson County is 34.7 Years.
What is the Average Family Size in Davidson County
Average Family Size in Davidson County is 3.0 People.
What is the Average Household Size in Davidson County
Average Household Size in Davidson County is 2.3 People.
What is Per Capita Income in Davidson County?
Per Capita income in Davidson County is $45,951.
What is the Median Family Income in Davidson County?
Median Family Income in Davidson County is $91,346.
What is the Median Household income in Davidson County?
Median Household Income in Davidson County is $71,863.
What is Income or Wage Gap in Davidson County?
Income or Wage Gap in Davidson County is 14.6%.
Women in Davidson County earn 85.4 cents for every dollar earned by a man.
What is Family Income Deficit in Davidson County?
Family Income Deficit in Davidson County is $11,805.
Families that are below poverty line in Davidson County earn $11,805 less on average than the poverty threshold level.
What is Inequality or Gini Index in Davidson County?
Inequality or Gini Index in Davidson County is 0.49.
How Large is the Labor Force in Davidson County?
There are 415,671 People in the Labor Forcein in Davidson County.
What is the Percentage of People in the Labor Force in Davidson County?
71.7% of People are in the Labor Force in Davidson County.
What is the Unemployment Rate in Davidson County?
Unemployment Rate in Davidson County is 4.6%.