Coffee County, TN
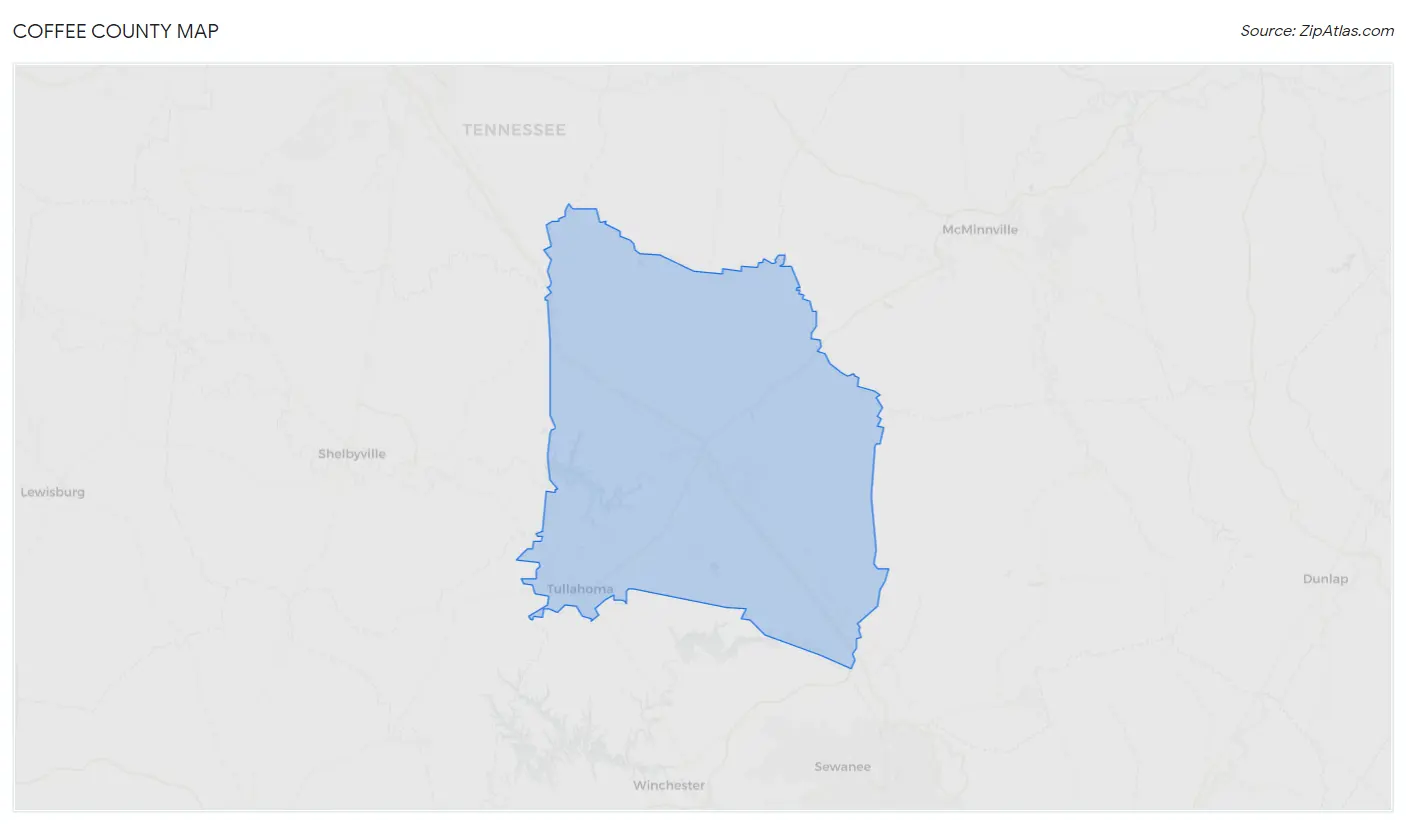
Coffee County Map
Coffee County Overview
58,080
TOTAL POPULATION
28,682
MALE POPULATION
29,398
FEMALE POPULATION
97.56
MALES / 100 FEMALES
102.50
FEMALES / 100 MALES
39.3
MEDIAN AGE
3.1
AVG FAMILY SIZE
2.5
AVG HOUSEHOLD SIZE
$29,277
PER CAPITA INCOME
$68,587
AVG FAMILY INCOME
$57,424
AVG HOUSEHOLD INCOME
32.9%
WAGE / INCOME GAP [ % ]
67.1¢/ $1
WAGE / INCOME GAP [ $ ]
$9,532
FAMILY INCOME DEFICIT
0.43
INEQUALITY / GINI INDEX
27,140
LABOR FORCE [ PEOPLE ]
59.2%
PERCENT IN LABOR FORCE
4.6%
UNEMPLOYMENT RATE
Coffee County Area Codes
Race in Coffee County
The most populous races in Coffee County are White / Caucasian (51,466 | 88.6%), Hispanic or Latino (3,030 | 5.2%), and Two or more Races (2,520 | 4.3%).
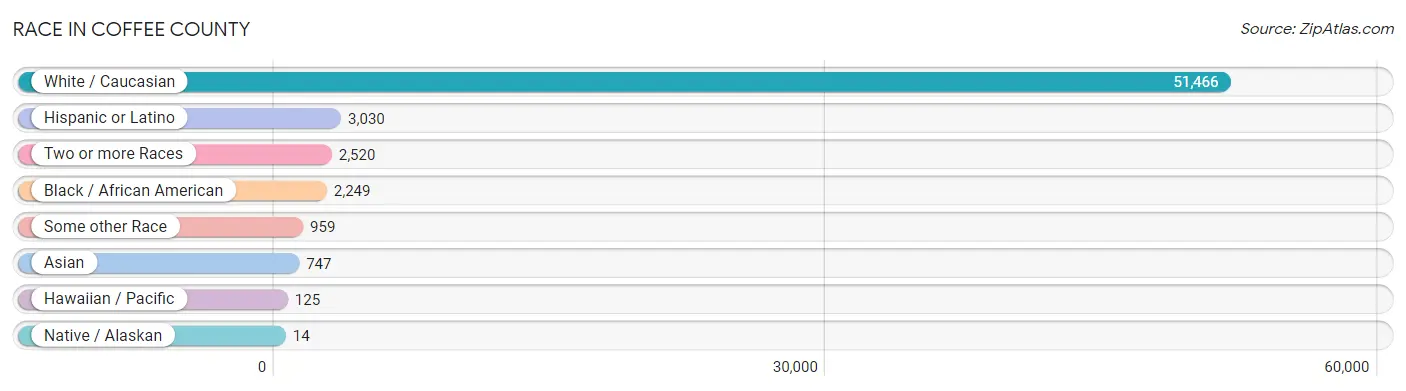
| Race | # Population | % Population |
| Asian | 747 | 1.3% |
| Black / African American | 2,249 | 3.9% |
| Hawaiian / Pacific | 125 | 0.2% |
| Hispanic or Latino | 3,030 | 5.2% |
| Native / Alaskan | 14 | 0.0% |
| White / Caucasian | 51,466 | 88.6% |
| Two or more Races | 2,520 | 4.3% |
| Some other Race | 959 | 1.7% |
| Total | 58,080 | 100.0% |
Ancestry in Coffee County
The most populous ancestries reported in Coffee County are American (8,428 | 14.5%), English (5,563 | 9.6%), Irish (5,149 | 8.9%), German (5,021 | 8.6%), and Mexican (1,879 | 3.2%), together accounting for 44.8% of all Coffee County residents.
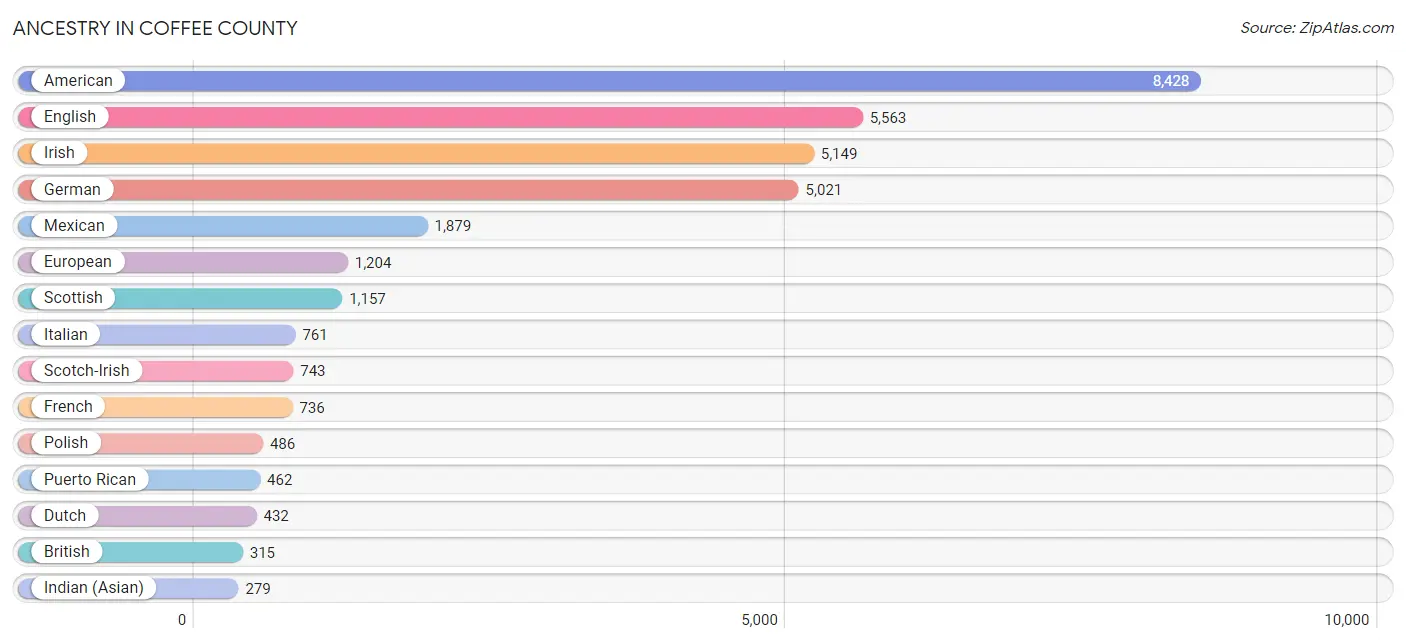
| Ancestry | # Population | % Population |
| African | 69 | 0.1% |
| American | 8,428 | 14.5% |
| Arab | 58 | 0.1% |
| Bangladeshi | 59 | 0.1% |
| Belgian | 35 | 0.1% |
| Bhutanese | 160 | 0.3% |
| British | 315 | 0.5% |
| Burmese | 11 | 0.0% |
| Canadian | 90 | 0.2% |
| Central American | 262 | 0.4% |
| Central American Indian | 5 | 0.0% |
| Cherokee | 132 | 0.2% |
| Choctaw | 17 | 0.0% |
| Colombian | 1 | 0.0% |
| Cuban | 146 | 0.3% |
| Czech | 70 | 0.1% |
| Czechoslovakian | 25 | 0.0% |
| Dutch | 432 | 0.7% |
| Eastern European | 41 | 0.1% |
| English | 5,563 | 9.6% |
| Ethiopian | 20 | 0.0% |
| European | 1,204 | 2.1% |
| Fijian | 101 | 0.2% |
| Finnish | 6 | 0.0% |
| French | 736 | 1.3% |
| French American Indian | 15 | 0.0% |
| French Canadian | 118 | 0.2% |
| German | 5,021 | 8.6% |
| Greek | 20 | 0.0% |
| Guatemalan | 129 | 0.2% |
| Haitian | 9 | 0.0% |
| Honduran | 28 | 0.1% |
| Hungarian | 70 | 0.1% |
| Indian (Asian) | 279 | 0.5% |
| Indonesian | 22 | 0.0% |
| Irish | 5,149 | 8.9% |
| Italian | 761 | 1.3% |
| Jamaican | 33 | 0.1% |
| Korean | 125 | 0.2% |
| Latvian | 15 | 0.0% |
| Luxembourger | 10 | 0.0% |
| Malaysian | 58 | 0.1% |
| Maltese | 44 | 0.1% |
| Mexican | 1,879 | 3.2% |
| Mexican American Indian | 17 | 0.0% |
| Native Hawaiian | 31 | 0.1% |
| Northern European | 150 | 0.3% |
| Norwegian | 265 | 0.5% |
| Polish | 486 | 0.8% |
| Portuguese | 20 | 0.0% |
| Puerto Rican | 462 | 0.8% |
| Russian | 92 | 0.2% |
| Salvadoran | 105 | 0.2% |
| Samoan | 13 | 0.0% |
| Scandinavian | 118 | 0.2% |
| Scotch-Irish | 743 | 1.3% |
| Scottish | 1,157 | 2.0% |
| Slovak | 20 | 0.0% |
| Slovene | 8 | 0.0% |
| South American | 32 | 0.1% |
| Spaniard | 5 | 0.0% |
| Spanish | 173 | 0.3% |
| Sri Lankan | 97 | 0.2% |
| Subsaharan African | 135 | 0.2% |
| Swedish | 149 | 0.3% |
| Swiss | 73 | 0.1% |
| Thai | 74 | 0.1% |
| Ukrainian | 90 | 0.2% |
| Venezuelan | 31 | 0.1% |
| Welsh | 195 | 0.3% |
| Yugoslavian | 74 | 0.1% | View All 71 Rows |
Immigrants in Coffee County
The most numerous immigrant groups reported in Coffee County came from Central America (1,015 | 1.8%), Latin America (1,015 | 1.8%), Mexico (942 | 1.6%), Asia (556 | 1.0%), and Eastern Asia (309 | 0.5%), together accounting for 6.6% of all Coffee County residents.

| Immigration Origin | # Population | % Population |
| Africa | 80 | 0.1% |
| Asia | 556 | 1.0% |
| Canada | 59 | 0.1% |
| Central America | 1,015 | 1.8% |
| China | 139 | 0.2% |
| Eastern Africa | 34 | 0.1% |
| Eastern Asia | 309 | 0.5% |
| Eastern Europe | 60 | 0.1% |
| El Salvador | 73 | 0.1% |
| England | 15 | 0.0% |
| Ethiopia | 20 | 0.0% |
| Europe | 139 | 0.2% |
| Germany | 32 | 0.1% |
| India | 66 | 0.1% |
| Indonesia | 1 | 0.0% |
| Japan | 140 | 0.2% |
| Jordan | 30 | 0.1% |
| Korea | 30 | 0.1% |
| Latin America | 1,015 | 1.8% |
| Malaysia | 2 | 0.0% |
| Mexico | 942 | 1.6% |
| Middle Africa | 46 | 0.1% |
| Northern Europe | 47 | 0.1% |
| Oceania | 101 | 0.2% |
| Philippines | 33 | 0.1% |
| Poland | 20 | 0.0% |
| Russia | 17 | 0.0% |
| South Central Asia | 90 | 0.2% |
| South Eastern Asia | 127 | 0.2% |
| Thailand | 19 | 0.0% |
| Uganda | 14 | 0.0% |
| Ukraine | 23 | 0.0% |
| Uzbekistan | 24 | 0.0% |
| Vietnam | 57 | 0.1% |
| Western Asia | 30 | 0.1% |
| Western Europe | 32 | 0.1% |
| Zaire | 46 | 0.1% | View All 37 Rows |
Sex and Age in Coffee County
Sex and Age in Coffee County
The most populous age groups in Coffee County are 5 to 9 Years (2,267 | 7.9%) for men and 10 to 14 Years (2,013 | 6.9%) for women.
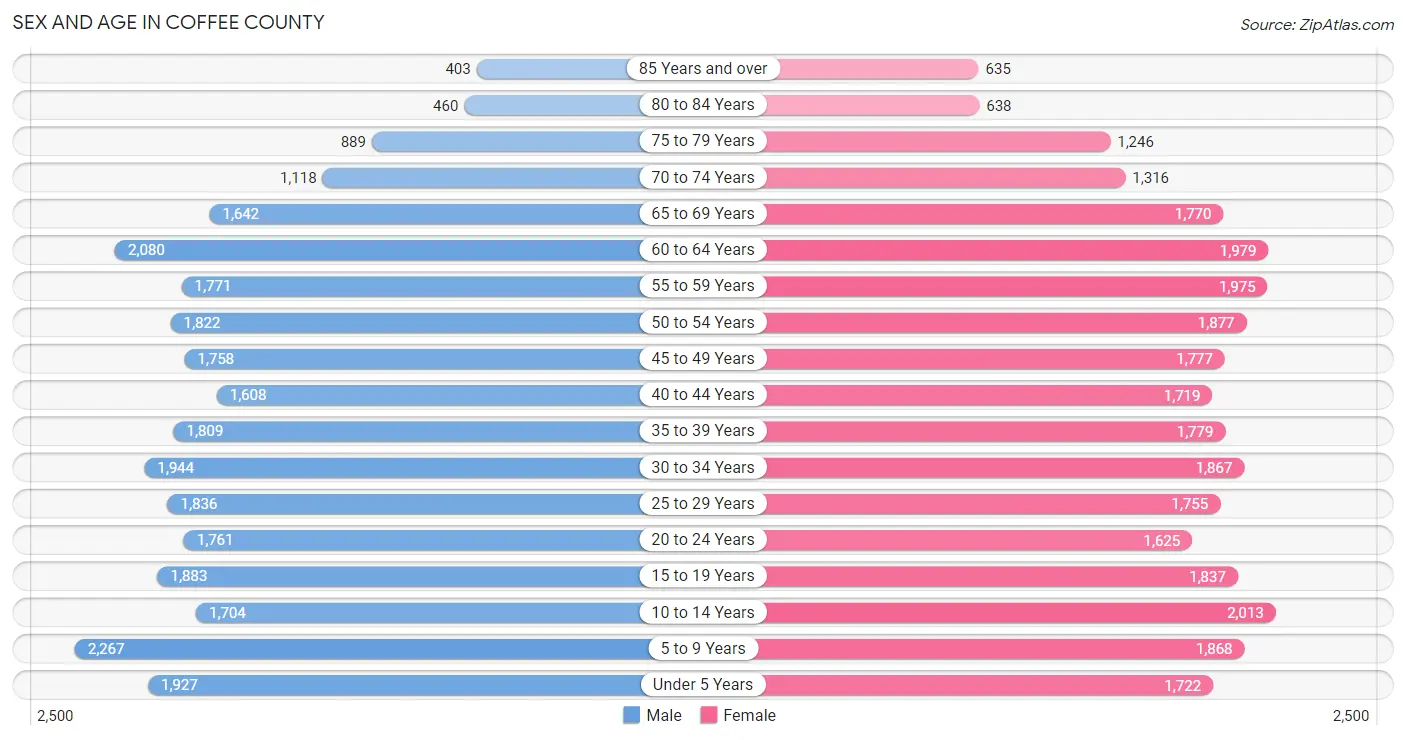
| Age Bracket | Male | Female |
| Under 5 Years | 1,927 (6.7%) | 1,722 (5.9%) |
| 5 to 9 Years | 2,267 (7.9%) | 1,868 (6.4%) |
| 10 to 14 Years | 1,704 (5.9%) | 2,013 (6.9%) |
| 15 to 19 Years | 1,883 (6.6%) | 1,837 (6.2%) |
| 20 to 24 Years | 1,761 (6.1%) | 1,625 (5.5%) |
| 25 to 29 Years | 1,836 (6.4%) | 1,755 (6.0%) |
| 30 to 34 Years | 1,944 (6.8%) | 1,867 (6.4%) |
| 35 to 39 Years | 1,809 (6.3%) | 1,779 (6.0%) |
| 40 to 44 Years | 1,608 (5.6%) | 1,719 (5.9%) |
| 45 to 49 Years | 1,758 (6.1%) | 1,777 (6.0%) |
| 50 to 54 Years | 1,822 (6.4%) | 1,877 (6.4%) |
| 55 to 59 Years | 1,771 (6.2%) | 1,975 (6.7%) |
| 60 to 64 Years | 2,080 (7.2%) | 1,979 (6.7%) |
| 65 to 69 Years | 1,642 (5.7%) | 1,770 (6.0%) |
| 70 to 74 Years | 1,118 (3.9%) | 1,316 (4.5%) |
| 75 to 79 Years | 889 (3.1%) | 1,246 (4.2%) |
| 80 to 84 Years | 460 (1.6%) | 638 (2.2%) |
| 85 Years and over | 403 (1.4%) | 635 (2.2%) |
| Total | 28,682 (100.0%) | 29,398 (100.0%) |
Families and Households in Coffee County
Median Family Size in Coffee County
The median family size in Coffee County is 3.09 persons per family, with married-couple families (10,897 | 73.3%) accounting for the largest median family size of 3.12 persons per family. On the other hand, single male/father families (1,403 | 9.4%) represent the smallest median family size with 2.98 persons per family.
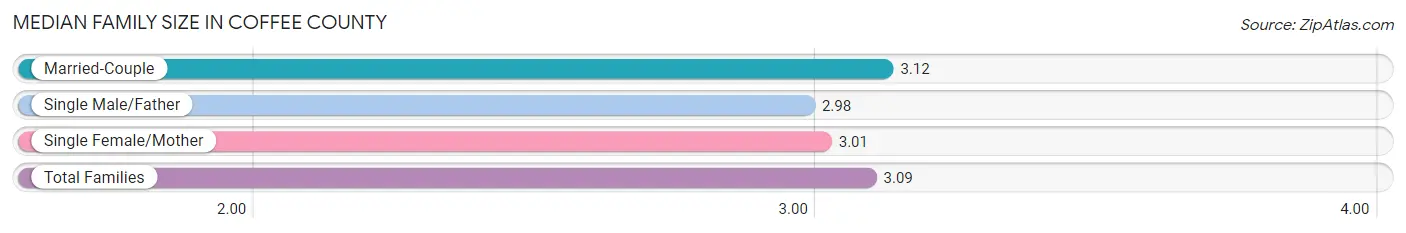
| Family Type | # Families | Family Size |
| Married-Couple | 10,897 (73.3%) | 3.12 |
| Single Male/Father | 1,403 (9.4%) | 2.98 |
| Single Female/Mother | 2,564 (17.2%) | 3.01 |
| Total Families | 14,864 (100.0%) | 3.09 |
Median Household Size in Coffee County
The median household size in Coffee County is 2.53 persons per household, with single male/father households (1,403 | 6.2%) accounting for the largest median household size of 3.39 persons per household. non-family households (7,825 | 34.5%) represent the smallest median household size with 1.23 persons per household.
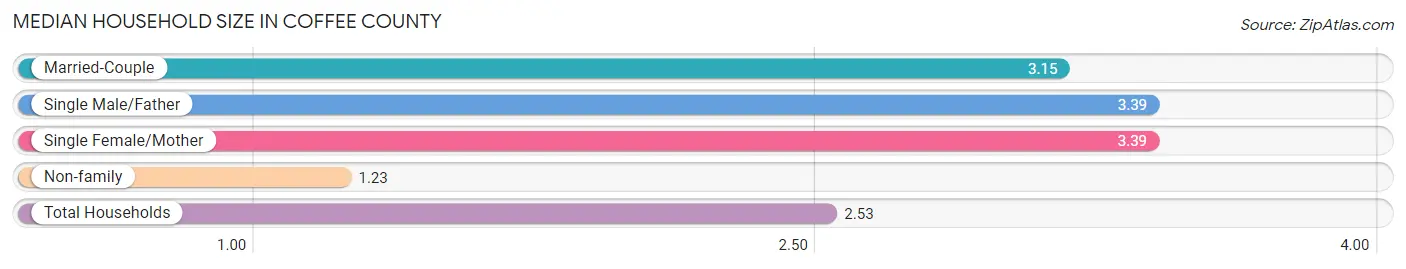
| Household Type | # Households | Household Size |
| Married-Couple | 10,897 (48.0%) | 3.15 |
| Single Male/Father | 1,403 (6.2%) | 3.39 |
| Single Female/Mother | 2,564 (11.3%) | 3.39 |
| Non-family | 7,825 (34.5%) | 1.23 |
| Total Households | 22,689 (100.0%) | 2.53 |
Household Size by Marriage Status in Coffee County
Out of a total of 22,689 households in Coffee County, 14,864 (65.5%) are family households, while 7,825 (34.5%) are nonfamily households. The most numerous type of family households are 2-person households, comprising 7,432, and the most common type of nonfamily households are 1-person households, comprising 6,536.
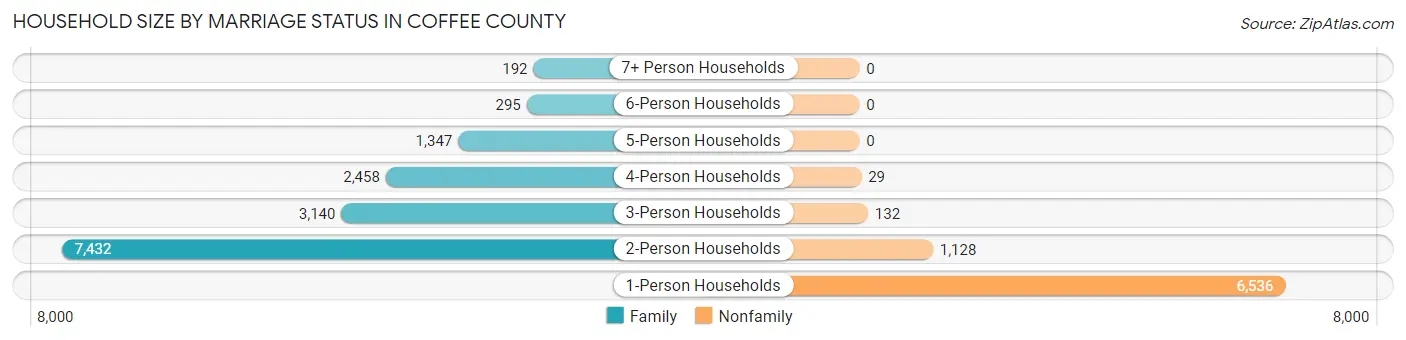
| Household Size | Family Households | Nonfamily Households |
| 1-Person Households | - | 6,536 (28.8%) |
| 2-Person Households | 7,432 (32.8%) | 1,128 (5.0%) |
| 3-Person Households | 3,140 (13.8%) | 132 (0.6%) |
| 4-Person Households | 2,458 (10.8%) | 29 (0.1%) |
| 5-Person Households | 1,347 (5.9%) | 0 (0.0%) |
| 6-Person Households | 295 (1.3%) | 0 (0.0%) |
| 7+ Person Households | 192 (0.9%) | 0 (0.0%) |
| Total | 14,864 (65.5%) | 7,825 (34.5%) |
Female Fertility in Coffee County
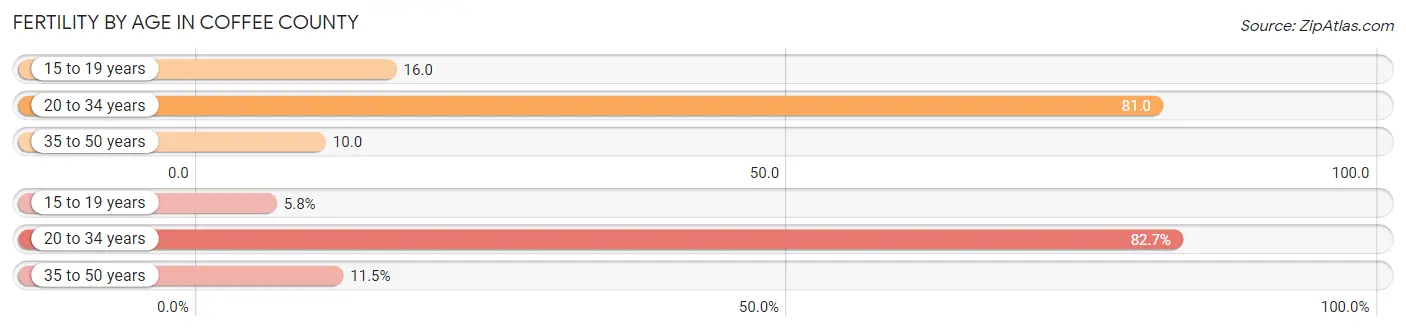
Fertility by Age in Coffee County
Average fertility rate in Coffee County is 40.0 births per 1,000 women. Women in the age bracket of 20 to 34 years have the highest fertility rate with 81.0 births per 1,000 women. Women in the age bracket of 20 to 34 years acount for 82.7% of all women with births.
| Age Bracket | Women with Births | Births / 1,000 Women |
| 15 to 19 years | 30 (5.8%) | 16.0 |
| 20 to 34 years | 425 (82.7%) | 81.0 |
| 35 to 50 years | 59 (11.5%) | 10.0 |
| Total | 514 (100.0%) | 40.0 |
Fertility by Age by Marriage Status in Coffee County
45.5% of women with births (514) in Coffee County are married. The highest percentage of unmarried women with births falls into 15 to 19 years age bracket with 100.0% of them unmarried at the time of birth, while the lowest percentage of unmarried women with births belong to 35 to 50 years age bracket with 47.5% of them unmarried.
| Age Bracket | Married | Unmarried |
| 15 to 19 years | 0 (0.0%) | 30 (100.0%) |
| 20 to 34 years | 203 (47.8%) | 222 (52.2%) |
| 35 to 50 years | 31 (52.5%) | 28 (47.5%) |
| Total | 234 (45.5%) | 280 (54.5%) |
Fertility by Education in Coffee County
Average fertility rate in Coffee County is 40.0 births per 1,000 women. Women with the education attainment of bachelor's degree have the highest fertility rate of 68.0 births per 1,000 women, while women with the education attainment of less than high school have the lowest fertility at 24.0 births per 1,000 women. Women with the education attainment of college or associate's degree represent 37.2% of all women with births.
| Educational Attainment | Women with Births | Births / 1,000 Women |
| Less than High School | 52 (10.1%) | 24.0 |
| High School Diploma | 114 (22.2%) | 26.0 |
| College or Associate's Degree | 191 (37.2%) | 55.0 |
| Bachelor's Degree | 120 (23.4%) | 68.0 |
| Graduate Degree | 37 (7.2%) | 41.0 |
| Total | 514 (100.0%) | 40.0 |
Fertility by Education by Marriage Status in Coffee County
54.5% of women with births in Coffee County are unmarried. Women with the educational attainment of graduate degree are most likely to be married with 100.0% of them married at childbirth, while women with the educational attainment of less than high school are least likely to be married with 100.0% of them unmarried at childbirth.
| Educational Attainment | Married | Unmarried |
| Less than High School | 0 (0.0%) | 52 (100.0%) |
| High School Diploma | 40 (35.1%) | 74 (64.9%) |
| College or Associate's Degree | 72 (37.7%) | 119 (62.3%) |
| Bachelor's Degree | 85 (70.8%) | 35 (29.2%) |
| Graduate Degree | 37 (100.0%) | 0 (0.0%) |
| Total | 234 (45.5%) | 280 (54.5%) |
Income in Coffee County
Income Overview in Coffee County
Per Capita Income in Coffee County is $29,277, while median incomes of families and households are $68,587 and $57,424 respectively.
| Characteristic | Number | Measure |
| Per Capita Income | 58,080 | $29,277 |
| Median Family Income | 14,864 | $68,587 |
| Mean Family Income | 14,864 | $83,605 |
| Median Household Income | 22,689 | $57,424 |
| Mean Household Income | 22,689 | $72,491 |
| Income Deficit | 14,864 | $9,532 |
| Wage / Income Gap (%) | 58,080 | 32.90% |
| Wage / Income Gap ($) | 58,080 | 67.10¢ per $1 |
| Gini / Inequality Index | 58,080 | 0.43 |
Earnings by Sex in Coffee County
Average Earnings in Coffee County are $34,033, $41,503 for men and $27,850 for women, a difference of 32.9%.
| Sex | Number | Average Earnings |
| Male | 14,921 (53.0%) | $41,503 |
| Female | 13,227 (47.0%) | $27,850 |
| Total | 28,148 (100.0%) | $34,033 |
Earnings by Sex by Income Bracket in Coffee County
The most common earnings brackets in Coffee County are $100,000+ for men (1,708 | 11.5%) and $25,000 to $29,999 for women (1,230 | 9.3%).
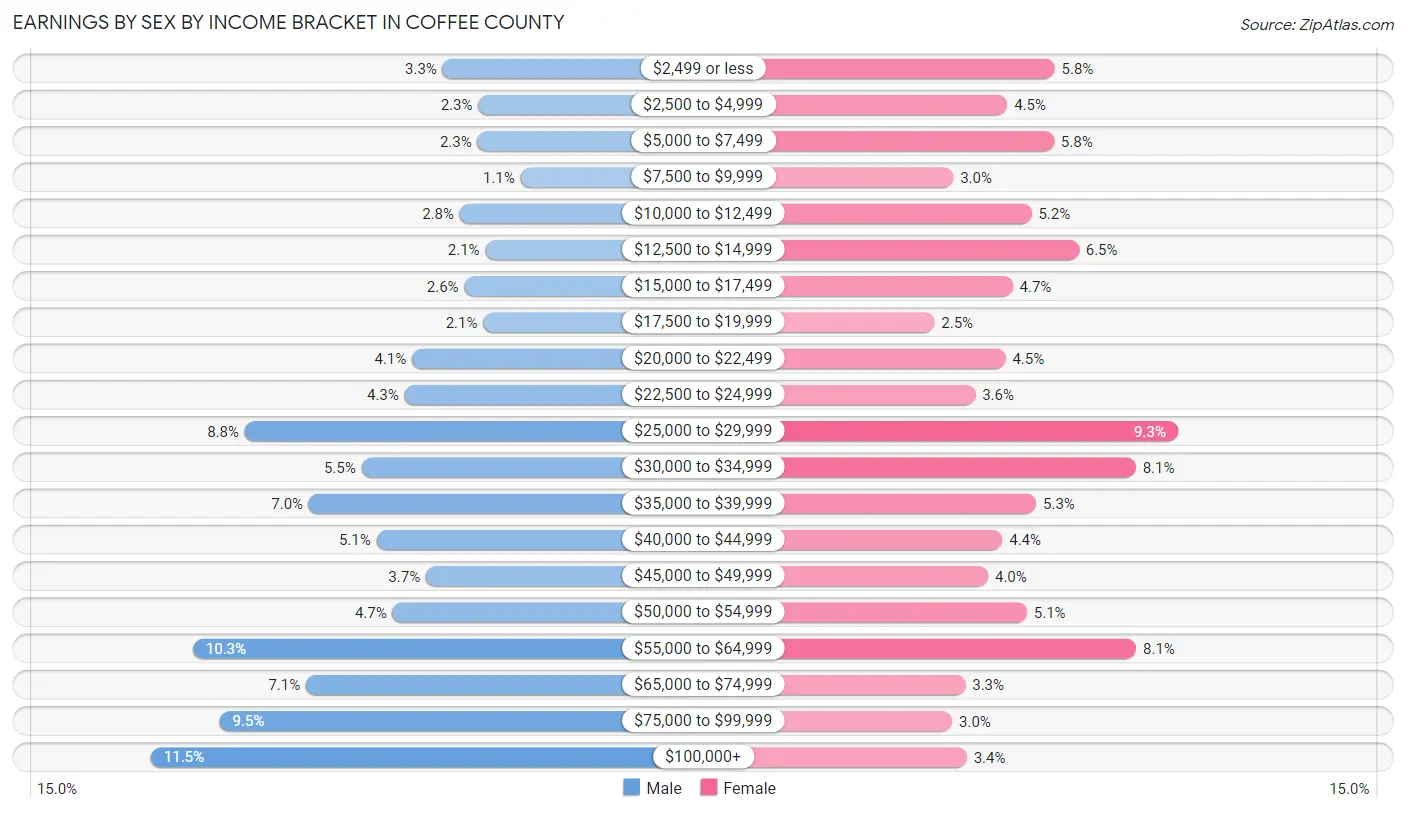
| Income | Male | Female |
| $2,499 or less | 485 (3.3%) | 773 (5.8%) |
| $2,500 to $4,999 | 336 (2.2%) | 597 (4.5%) |
| $5,000 to $7,499 | 339 (2.3%) | 770 (5.8%) |
| $7,500 to $9,999 | 158 (1.1%) | 395 (3.0%) |
| $10,000 to $12,499 | 413 (2.8%) | 687 (5.2%) |
| $12,500 to $14,999 | 306 (2.1%) | 863 (6.5%) |
| $15,000 to $17,499 | 394 (2.6%) | 616 (4.7%) |
| $17,500 to $19,999 | 315 (2.1%) | 325 (2.5%) |
| $20,000 to $22,499 | 613 (4.1%) | 590 (4.5%) |
| $22,500 to $24,999 | 645 (4.3%) | 478 (3.6%) |
| $25,000 to $29,999 | 1,315 (8.8%) | 1,230 (9.3%) |
| $30,000 to $34,999 | 825 (5.5%) | 1,074 (8.1%) |
| $35,000 to $39,999 | 1,046 (7.0%) | 704 (5.3%) |
| $40,000 to $44,999 | 763 (5.1%) | 578 (4.4%) |
| $45,000 to $49,999 | 555 (3.7%) | 525 (4.0%) |
| $50,000 to $54,999 | 695 (4.7%) | 669 (5.1%) |
| $55,000 to $64,999 | 1,532 (10.3%) | 1,075 (8.1%) |
| $65,000 to $74,999 | 1,058 (7.1%) | 440 (3.3%) |
| $75,000 to $99,999 | 1,420 (9.5%) | 392 (3.0%) |
| $100,000+ | 1,708 (11.5%) | 446 (3.4%) |
| Total | 14,921 (100.0%) | 13,227 (100.0%) |
Earnings by Sex by Educational Attainment in Coffee County
Average earnings in Coffee County are $46,950 for men and $30,805 for women, a difference of 34.4%. Men with an educational attainment of graduate degree enjoy the highest average annual earnings of $71,563, while those with less than high school education earn the least with $28,095. Women with an educational attainment of graduate degree earn the most with the average annual earnings of $56,131, while those with high school diploma education have the smallest earnings of $21,266.
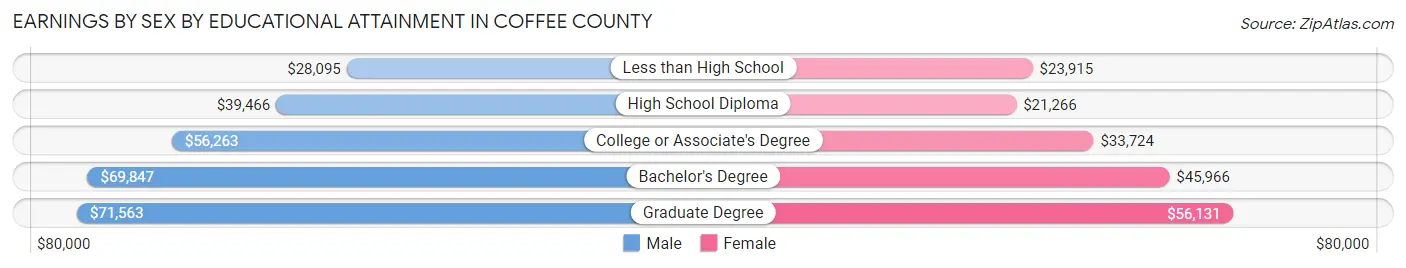
| Educational Attainment | Male Income | Female Income |
| Less than High School | $28,095 | $23,915 |
| High School Diploma | $39,466 | $21,266 |
| College or Associate's Degree | $56,263 | $33,724 |
| Bachelor's Degree | $69,847 | $45,966 |
| Graduate Degree | $71,563 | $56,131 |
| Total | $46,950 | $30,805 |
Family Income in Coffee County
Family Income Brackets in Coffee County
According to the Coffee County family income data, there are 3,136 families falling into the $100,000 to $149,999 income range, which is the most common income bracket and makes up 21.1% of all families. Conversely, the $10,000 to $14,999 income bracket is the least frequent group with only 491 families (3.3%) belonging to this category.
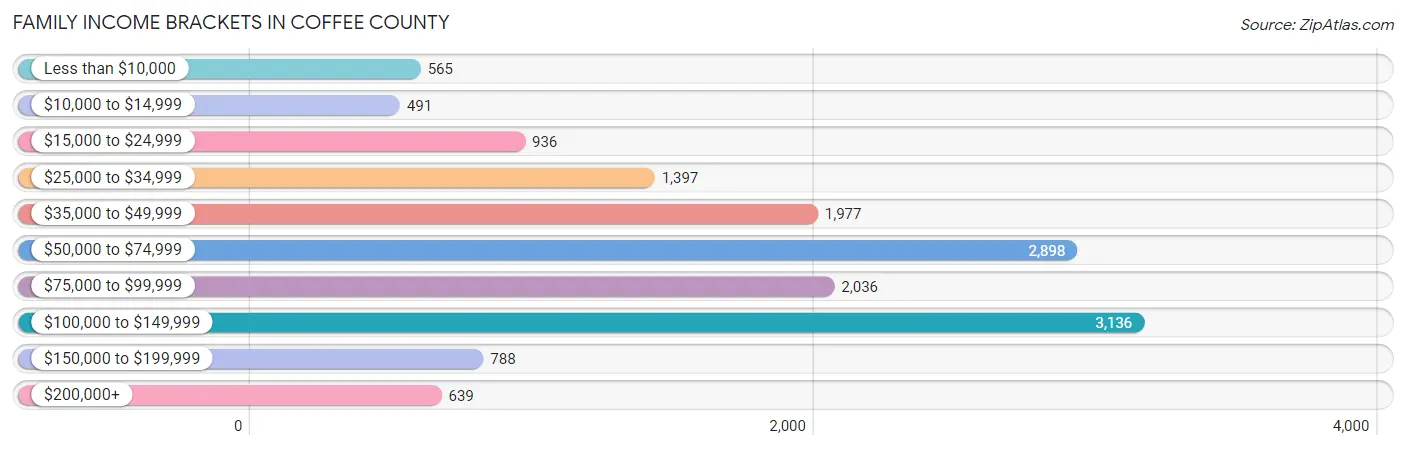
| Income Bracket | # Families | % Families |
| Less than $10,000 | 565 | 3.8% |
| $10,000 to $14,999 | 491 | 3.3% |
| $15,000 to $24,999 | 936 | 6.3% |
| $25,000 to $34,999 | 1,397 | 9.4% |
| $35,000 to $49,999 | 1,977 | 13.3% |
| $50,000 to $74,999 | 2,898 | 19.5% |
| $75,000 to $99,999 | 2,036 | 13.7% |
| $100,000 to $149,999 | 3,136 | 21.1% |
| $150,000 to $199,999 | 788 | 5.3% |
| $200,000+ | 639 | 4.3% |
Family Income by Famaliy Size in Coffee County
7+ person families (174 | 1.2%) account for the highest median family income in Coffee County with $103,276 per family, while 2-person families (8,110 | 54.6%) have the highest median income of $28,720 per family member.
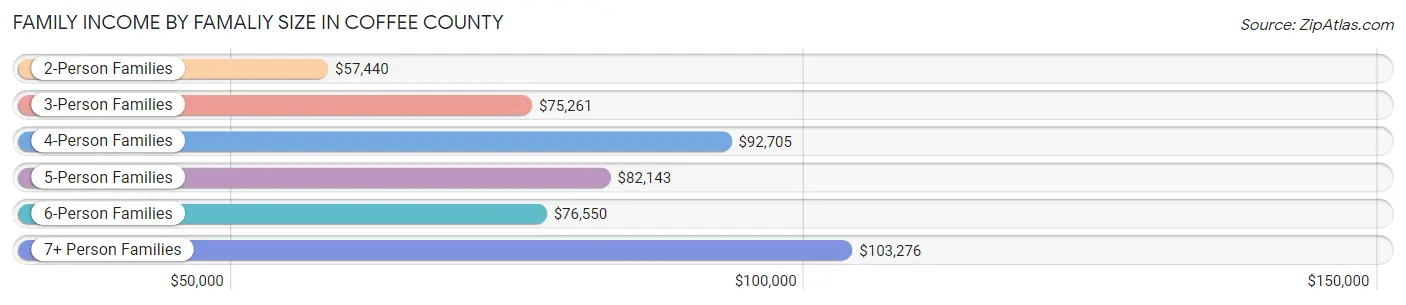
| Income Bracket | # Families | Median Income |
| 2-Person Families | 8,110 (54.6%) | $57,440 |
| 3-Person Families | 2,940 (19.8%) | $75,261 |
| 4-Person Families | 2,213 (14.9%) | $92,705 |
| 5-Person Families | 1,180 (7.9%) | $82,143 |
| 6-Person Families | 247 (1.7%) | $76,550 |
| 7+ Person Families | 174 (1.2%) | $103,276 |
| Total | 14,864 (100.0%) | $68,587 |
Family Income by Number of Earners in Coffee County
The median family income in Coffee County is $68,587, with families comprising 3+ earners (1,268) having the highest median family income of $118,224, while families with no earners (3,028) have the lowest median family income of $40,048, accounting for 8.5% and 20.4% of families, respectively.
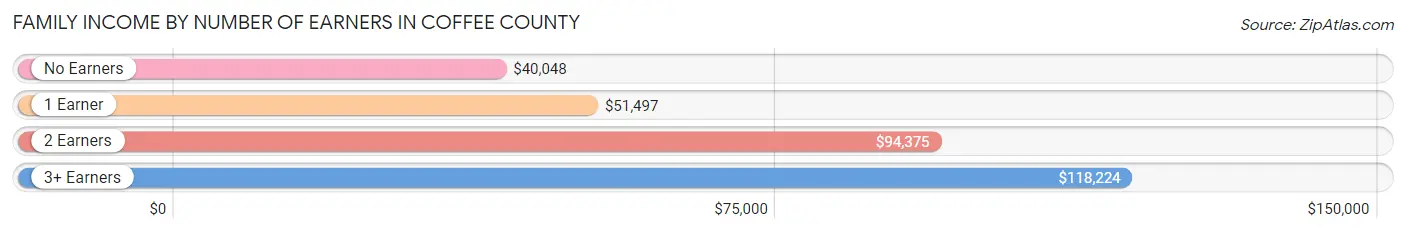
| Number of Earners | # Families | Median Income |
| No Earners | 3,028 (20.4%) | $40,048 |
| 1 Earner | 5,070 (34.1%) | $51,497 |
| 2 Earners | 5,498 (37.0%) | $94,375 |
| 3+ Earners | 1,268 (8.5%) | $118,224 |
| Total | 14,864 (100.0%) | $68,587 |
Household Income in Coffee County
Household Income Brackets in Coffee County
With 4,538 households falling in the category, the $50,000 to $74,999 income range is the most frequent in Coffee County, accounting for 20.0% of all households. In contrast, only 703 households (3.1%) fall into the $200,000+ income bracket, making it the least populous group.
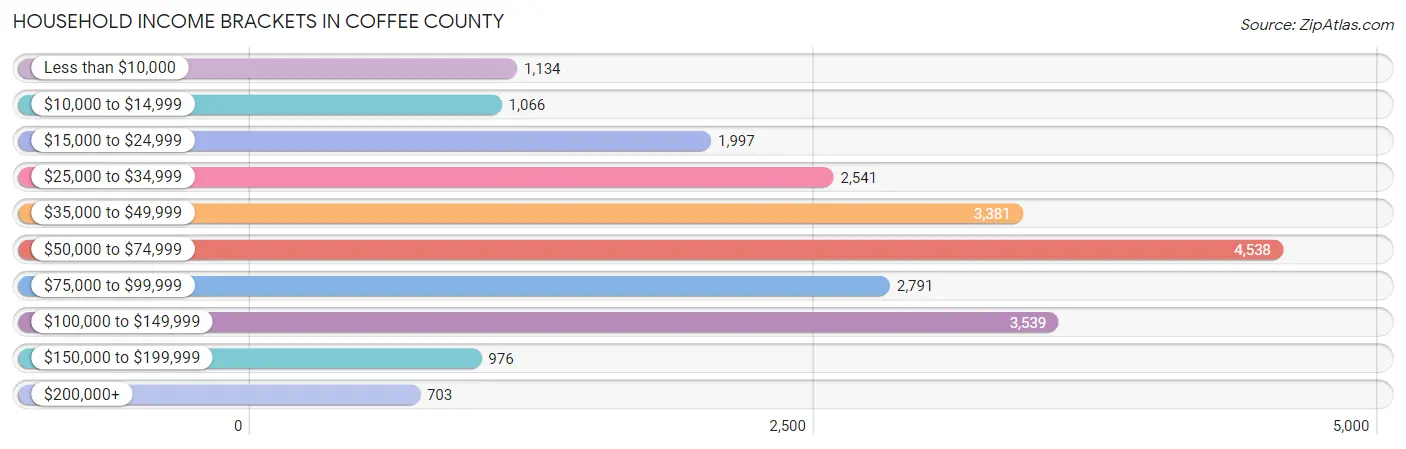
| Income Bracket | # Households | % Households |
| Less than $10,000 | 1,134 | 5.0% |
| $10,000 to $14,999 | 1,066 | 4.7% |
| $15,000 to $24,999 | 1,997 | 8.8% |
| $25,000 to $34,999 | 2,541 | 11.2% |
| $35,000 to $49,999 | 3,381 | 14.9% |
| $50,000 to $74,999 | 4,538 | 20.0% |
| $75,000 to $99,999 | 2,791 | 12.3% |
| $100,000 to $149,999 | 3,539 | 15.6% |
| $150,000 to $199,999 | 976 | 4.3% |
| $200,000+ | 703 | 3.1% |
Household Income by Householder Age in Coffee County
The median household income in Coffee County is $57,424, with the highest median household income of $68,942 found in the 25 to 44 years age bracket for the primary householder. A total of 6,763 households (29.8%) fall into this category. Meanwhile, the 15 to 24 years age bracket for the primary householder has the lowest median household income of $34,838, with 903 households (4.0%) in this group.
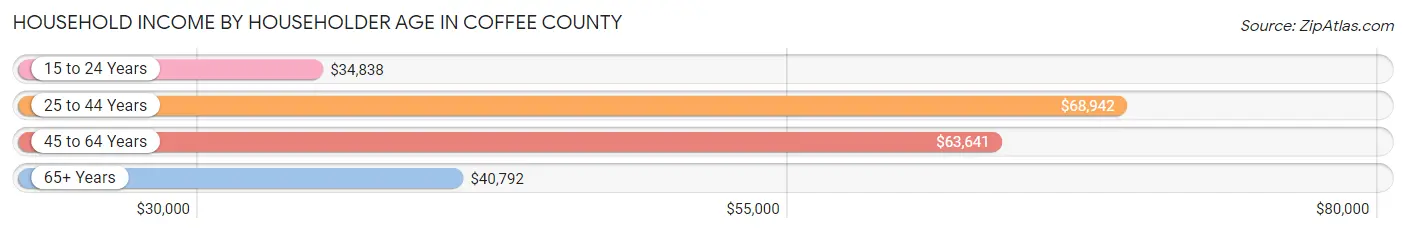
| Income Bracket | # Households | Median Income |
| 15 to 24 Years | 903 (4.0%) | $34,838 |
| 25 to 44 Years | 6,763 (29.8%) | $68,942 |
| 45 to 64 Years | 8,472 (37.3%) | $63,641 |
| 65+ Years | 6,551 (28.9%) | $40,792 |
| Total | 22,689 (100.0%) | $57,424 |
Poverty in Coffee County
Income Below Poverty by Sex and Age in Coffee County
With 15.7% poverty level for males and 18.1% for females among the residents of Coffee County, 6 to 11 year old males and 6 to 11 year old females are the most vulnerable to poverty, with 698 males (28.7%) and 823 females (37.4%) in their respective age groups living below the poverty level.
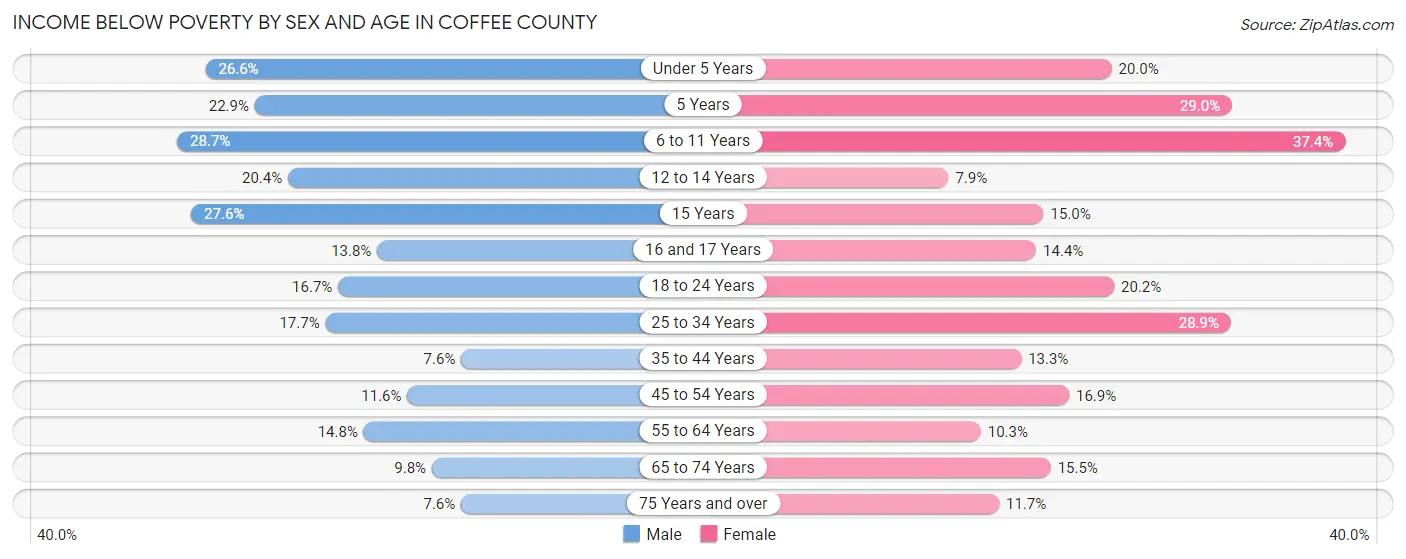
| Age Bracket | Male | Female |
| Under 5 Years | 512 (26.6%) | 345 (20.0%) |
| 5 Years | 140 (22.9%) | 84 (29.0%) |
| 6 to 11 Years | 698 (28.7%) | 823 (37.4%) |
| 12 to 14 Years | 176 (20.4%) | 105 (7.9%) |
| 15 Years | 118 (27.6%) | 46 (15.0%) |
| 16 and 17 Years | 119 (13.8%) | 125 (14.4%) |
| 18 to 24 Years | 387 (16.7%) | 462 (20.2%) |
| 25 to 34 Years | 653 (17.7%) | 1,042 (28.9%) |
| 35 to 44 Years | 255 (7.6%) | 464 (13.3%) |
| 45 to 54 Years | 412 (11.6%) | 613 (16.9%) |
| 55 to 64 Years | 569 (14.8%) | 407 (10.3%) |
| 65 to 74 Years | 267 (9.8%) | 474 (15.5%) |
| 75 Years and over | 129 (7.6%) | 275 (11.7%) |
| Total | 4,435 (15.7%) | 5,265 (18.1%) |
Income Above Poverty by Sex and Age in Coffee County
According to the poverty statistics in Coffee County, males aged 35 to 44 years and females aged 12 to 14 years are the age groups that are most secure financially, with 92.4% of males and 92.1% of females in these age groups living above the poverty line.
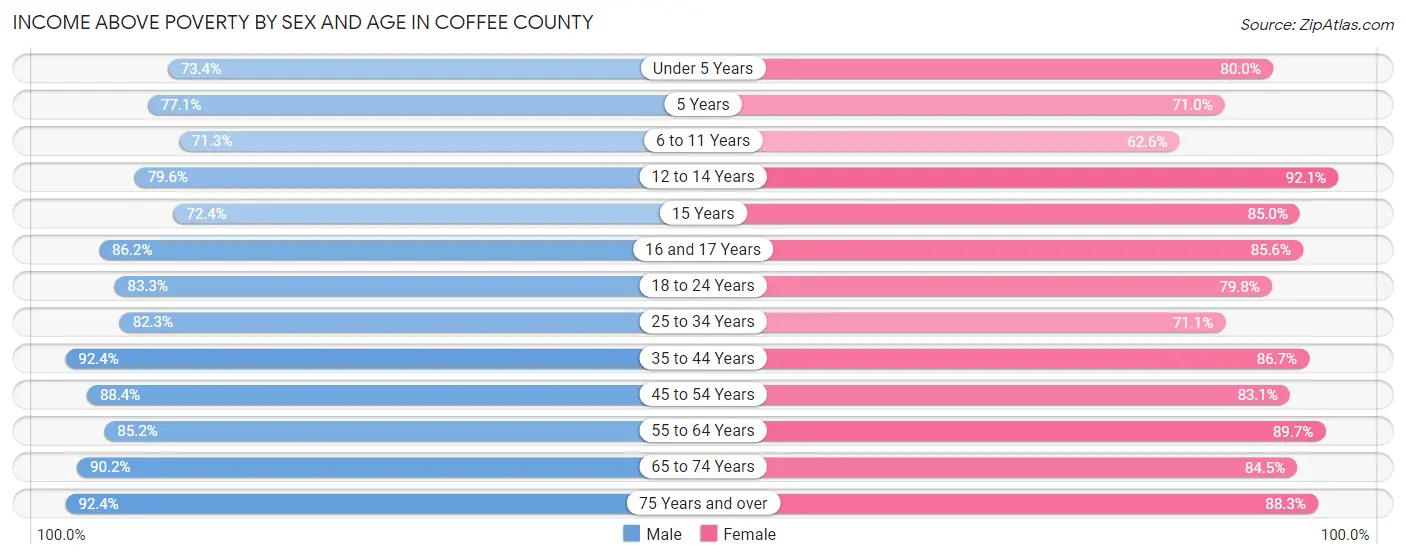
| Age Bracket | Male | Female |
| Under 5 Years | 1,415 (73.4%) | 1,377 (80.0%) |
| 5 Years | 471 (77.1%) | 206 (71.0%) |
| 6 to 11 Years | 1,737 (71.3%) | 1,380 (62.6%) |
| 12 to 14 Years | 685 (79.6%) | 1,221 (92.1%) |
| 15 Years | 309 (72.4%) | 261 (85.0%) |
| 16 and 17 Years | 742 (86.2%) | 741 (85.6%) |
| 18 to 24 Years | 1,927 (83.3%) | 1,823 (79.8%) |
| 25 to 34 Years | 3,045 (82.3%) | 2,566 (71.1%) |
| 35 to 44 Years | 3,108 (92.4%) | 3,019 (86.7%) |
| 45 to 54 Years | 3,145 (88.4%) | 3,021 (83.1%) |
| 55 to 64 Years | 3,271 (85.2%) | 3,537 (89.7%) |
| 65 to 74 Years | 2,470 (90.2%) | 2,582 (84.5%) |
| 75 Years and over | 1,571 (92.4%) | 2,080 (88.3%) |
| Total | 23,896 (84.4%) | 23,814 (81.9%) |
Income Below Poverty Among Married-Couple Families in Coffee County
The poverty statistics for married-couple families in Coffee County show that 4.9% or 531 of the total 10,897 families live below the poverty line. Families with 3 or 4 children have the highest poverty rate of 16.3%, comprising of 162 families. On the other hand, families with no children have the lowest poverty rate of 3.3%, which includes 224 families.
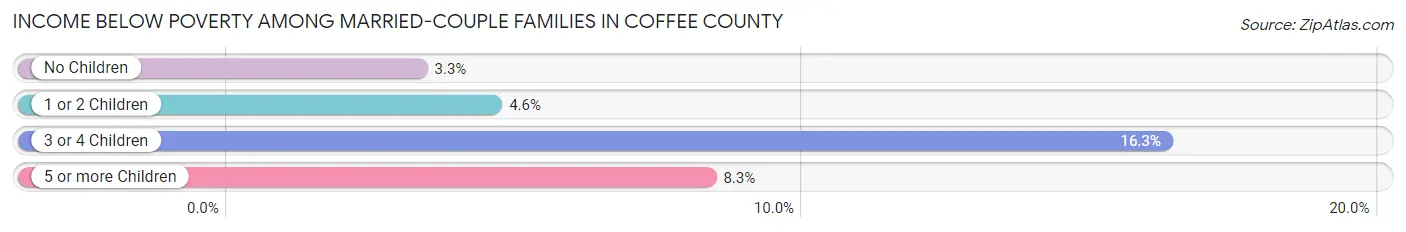
| Children | Above Poverty | Below Poverty |
| No Children | 6,561 (96.7%) | 224 (3.3%) |
| 1 or 2 Children | 2,927 (95.4%) | 141 (4.6%) |
| 3 or 4 Children | 834 (83.7%) | 162 (16.3%) |
| 5 or more Children | 44 (91.7%) | 4 (8.3%) |
| Total | 10,366 (95.1%) | 531 (4.9%) |
Income Below Poverty Among Single-Parent Households in Coffee County
According to the poverty data in Coffee County, 22.3% or 313 single-father households and 40.5% or 1,038 single-mother households are living below the poverty line. Among single-father households, those with 3 or 4 children have the highest poverty rate, with 114 households (65.5%) experiencing poverty. Likewise, among single-mother households, those with 3 or 4 children have the highest poverty rate, with 115 households (77.2%) falling below the poverty line.
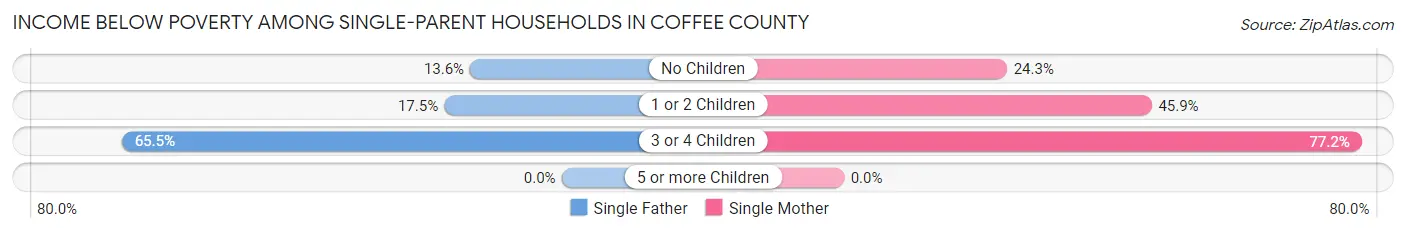
| Children | Single Father | Single Mother |
| No Children | 57 (13.6%) | 208 (24.3%) |
| 1 or 2 Children | 142 (17.5%) | 715 (45.9%) |
| 3 or 4 Children | 114 (65.5%) | 115 (77.2%) |
| 5 or more Children | 0 (0.0%) | 0 (0.0%) |
| Total | 313 (22.3%) | 1,038 (40.5%) |
Income Below Poverty Among Married-Couple vs Single-Parent Households in Coffee County
The poverty data for Coffee County shows that 531 of the married-couple family households (4.9%) and 1,351 of the single-parent households (34.1%) are living below the poverty level. Within the married-couple family households, those with 3 or 4 children have the highest poverty rate, with 162 households (16.3%) falling below the poverty line. Among the single-parent households, those with 3 or 4 children have the highest poverty rate, with 229 household (70.9%) living below poverty.
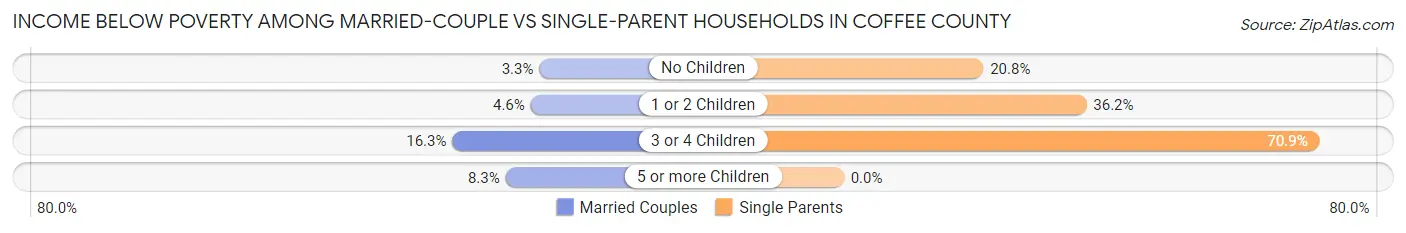
| Children | Married-Couple Families | Single-Parent Households |
| No Children | 224 (3.3%) | 265 (20.8%) |
| 1 or 2 Children | 141 (4.6%) | 857 (36.2%) |
| 3 or 4 Children | 162 (16.3%) | 229 (70.9%) |
| 5 or more Children | 4 (8.3%) | 0 (0.0%) |
| Total | 531 (4.9%) | 1,351 (34.1%) |
Employment Characteristics in Coffee County
Employment by Class of Employer in Coffee County
Among the 25,023 employed individuals in Coffee County, private company employees (17,856 | 71.4%), local government employees (2,257 | 9.0%), and self-employed (not incorporated) (2,158 | 8.6%) make up the most common classes of employment.
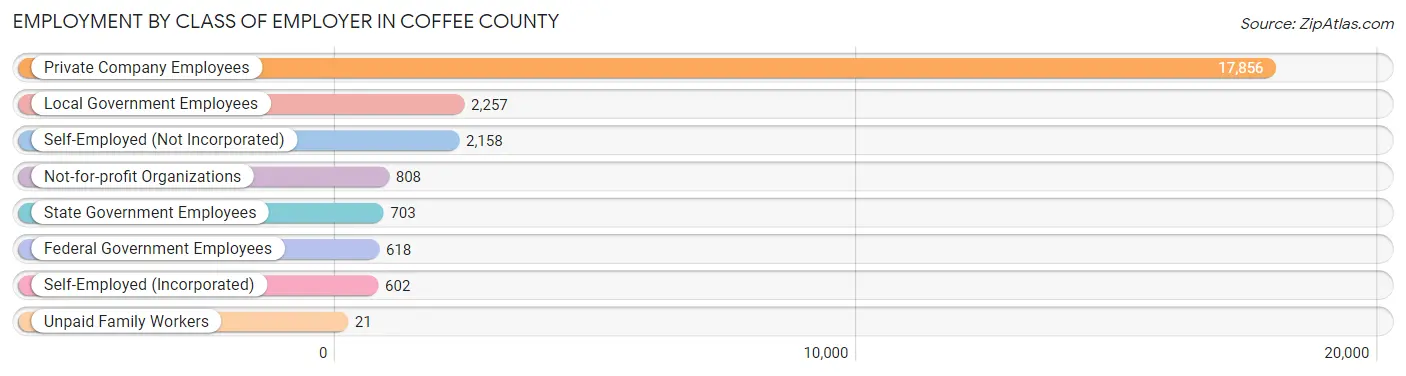
| Employer Class | # Employees | % Employees |
| Private Company Employees | 17,856 | 71.4% |
| Self-Employed (Incorporated) | 602 | 2.4% |
| Self-Employed (Not Incorporated) | 2,158 | 8.6% |
| Not-for-profit Organizations | 808 | 3.2% |
| Local Government Employees | 2,257 | 9.0% |
| State Government Employees | 703 | 2.8% |
| Federal Government Employees | 618 | 2.5% |
| Unpaid Family Workers | 21 | 0.1% |
| Total | 25,023 | 100.0% |
Employment Status by Age in Coffee County
According to the labor force statistics for Coffee County, out of the total population over 16 years of age (45,845), 59.2% or 27,140 individuals are in the labor force, with 4.6% or 1,248 of them unemployed. The age group with the highest labor force participation rate is 25 to 29 years, with 84.5% or 3,034 individuals in the labor force. Within the labor force, the 16 to 19 years age range has the highest percentage of unemployed individuals, with 12.7% or 160 of them being unemployed.
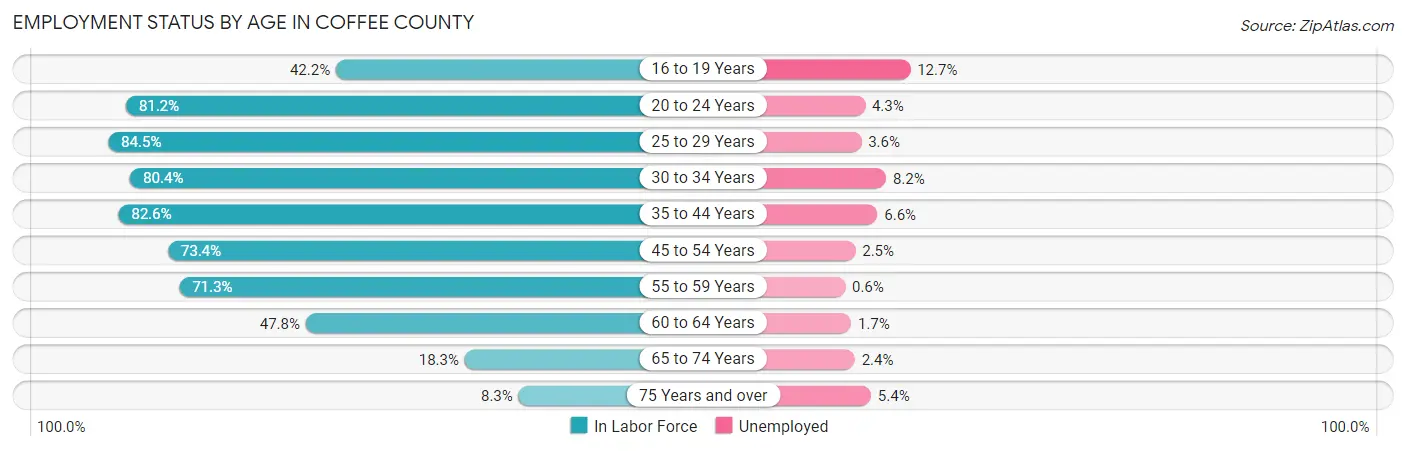
| Age Bracket | In Labor Force | Unemployed |
| 16 to 19 Years | 1,260 (42.2%) | 160 (12.7%) |
| 20 to 24 Years | 2,749 (81.2%) | 118 (4.3%) |
| 25 to 29 Years | 3,034 (84.5%) | 109 (3.6%) |
| 30 to 34 Years | 3,064 (80.4%) | 251 (8.2%) |
| 35 to 44 Years | 5,712 (82.6%) | 377 (6.6%) |
| 45 to 54 Years | 5,310 (73.4%) | 133 (2.5%) |
| 55 to 59 Years | 2,671 (71.3%) | 16 (0.6%) |
| 60 to 64 Years | 1,940 (47.8%) | 33 (1.7%) |
| 65 to 74 Years | 1,070 (18.3%) | 26 (2.4%) |
| 75 Years and over | 354 (8.3%) | 19 (5.4%) |
| Total | 27,140 (59.2%) | 1,248 (4.6%) |
Employment Status by Educational Attainment in Coffee County
According to labor force statistics for Coffee County, 74.0% of individuals (21,723) out of the total population between 25 and 64 years of age (29,356) are in the labor force, with 4.2% or 912 of them being unemployed. The group with the highest labor force participation rate are those with the educational attainment of bachelor's degree or higher, with 85.3% or 5,656 individuals in the labor force. Within the labor force, individuals with high school diploma education have the highest percentage of unemployment, with 6.7% or 553 of them being unemployed.
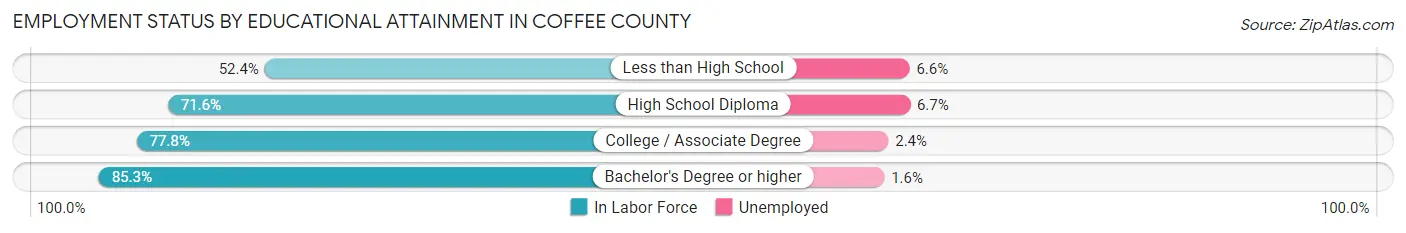
| Educational Attainment | In Labor Force | Unemployed |
| Less than High School | 1,830 (52.4%) | 231 (6.6%) |
| High School Diploma | 8,250 (71.6%) | 772 (6.7%) |
| College / Associate Degree | 5,998 (77.8%) | 185 (2.4%) |
| Bachelor's Degree or higher | 5,656 (85.3%) | 106 (1.6%) |
| Total | 21,723 (74.0%) | 1,233 (4.2%) |
Employment Occupations by Sex in Coffee County
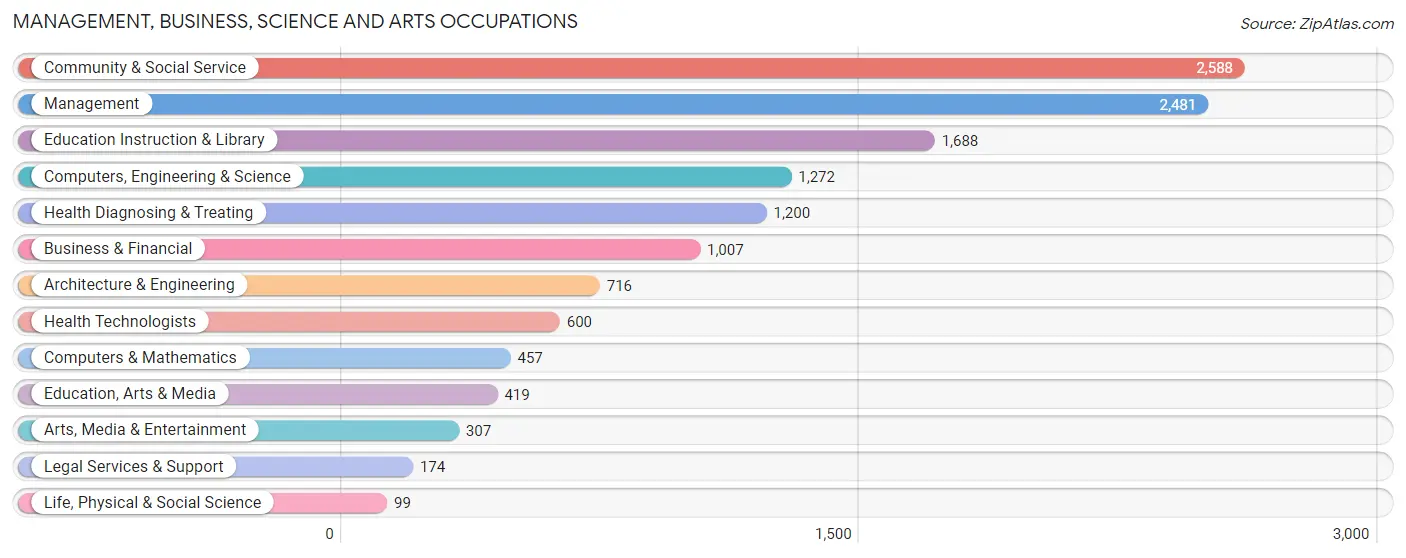
Management, Business, Science and Arts Occupations
The most common Management, Business, Science and Arts occupations in Coffee County are Community & Social Service (2,588 | 10.0%), Management (2,481 | 9.6%), Education Instruction & Library (1,688 | 6.5%), Computers, Engineering & Science (1,272 | 4.9%), and Health Diagnosing & Treating (1,200 | 4.6%).
Management, Business, Science and Arts Occupations by Sex
Within the Management, Business, Science and Arts occupations in Coffee County, the most male-oriented occupations are Architecture & Engineering (95.4%), Computers, Engineering & Science (87.1%), and Computers & Mathematics (83.8%), while the most female-oriented occupations are Health Diagnosing & Treating (83.3%), Education Instruction & Library (80.9%), and Education, Arts & Media (80.4%).
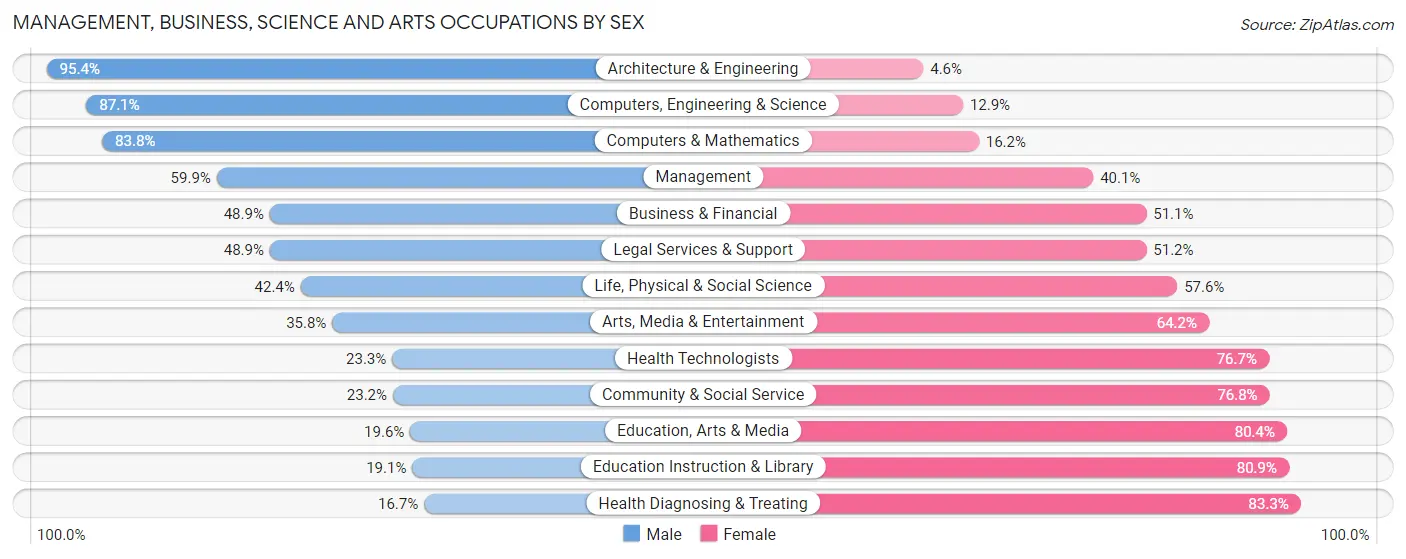
| Occupation | Male | Female |
| Management | 1,487 (59.9%) | 994 (40.1%) |
| Business & Financial | 492 (48.9%) | 515 (51.1%) |
| Computers, Engineering & Science | 1,108 (87.1%) | 164 (12.9%) |
| Computers & Mathematics | 383 (83.8%) | 74 (16.2%) |
| Architecture & Engineering | 683 (95.4%) | 33 (4.6%) |
| Life, Physical & Social Science | 42 (42.4%) | 57 (57.6%) |
| Community & Social Service | 600 (23.2%) | 1,988 (76.8%) |
| Education, Arts & Media | 82 (19.6%) | 337 (80.4%) |
| Legal Services & Support | 85 (48.8%) | 89 (51.1%) |
| Education Instruction & Library | 323 (19.1%) | 1,365 (80.9%) |
| Arts, Media & Entertainment | 110 (35.8%) | 197 (64.2%) |
| Health Diagnosing & Treating | 200 (16.7%) | 1,000 (83.3%) |
| Health Technologists | 140 (23.3%) | 460 (76.7%) |
| Total (Category) | 3,887 (45.5%) | 4,661 (54.5%) |
| Total (Overall) | 13,861 (53.6%) | 12,011 (46.4%) |
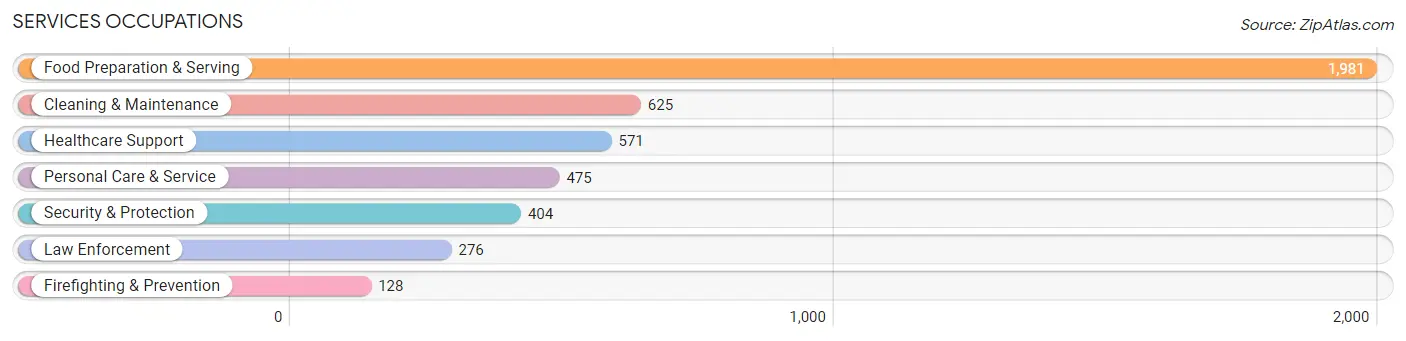
Services Occupations
The most common Services occupations in Coffee County are Food Preparation & Serving (1,981 | 7.7%), Cleaning & Maintenance (625 | 2.4%), Healthcare Support (571 | 2.2%), Personal Care & Service (475 | 1.8%), and Security & Protection (404 | 1.6%).
Services Occupations by Sex
Within the Services occupations in Coffee County, the most male-oriented occupations are Firefighting & Prevention (84.4%), Security & Protection (83.4%), and Law Enforcement (83.0%), while the most female-oriented occupations are Healthcare Support (82.8%), Food Preparation & Serving (76.6%), and Personal Care & Service (74.3%).
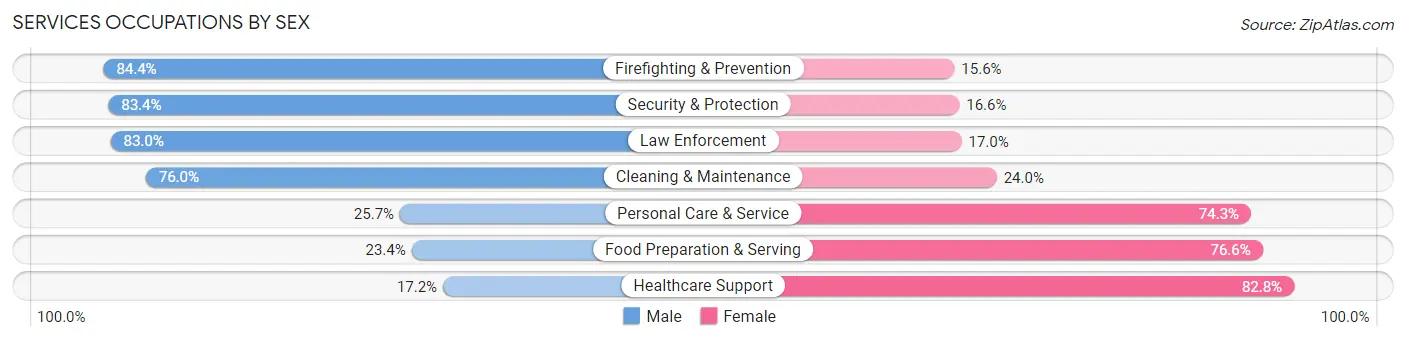
| Occupation | Male | Female |
| Healthcare Support | 98 (17.2%) | 473 (82.8%) |
| Security & Protection | 337 (83.4%) | 67 (16.6%) |
| Firefighting & Prevention | 108 (84.4%) | 20 (15.6%) |
| Law Enforcement | 229 (83.0%) | 47 (17.0%) |
| Food Preparation & Serving | 463 (23.4%) | 1,518 (76.6%) |
| Cleaning & Maintenance | 475 (76.0%) | 150 (24.0%) |
| Personal Care & Service | 122 (25.7%) | 353 (74.3%) |
| Total (Category) | 1,495 (36.9%) | 2,561 (63.1%) |
| Total (Overall) | 13,861 (53.6%) | 12,011 (46.4%) |
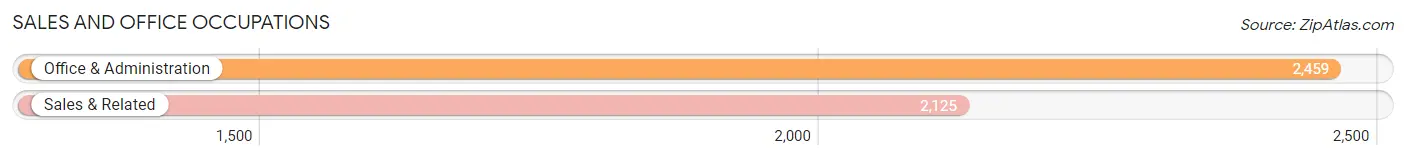
Sales and Office Occupations
The most common Sales and Office occupations in Coffee County are Office & Administration (2,459 | 9.5%), and Sales & Related (2,125 | 8.2%).
Sales and Office Occupations by Sex
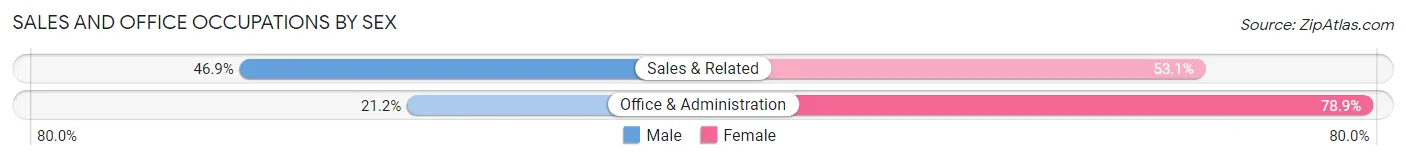
| Occupation | Male | Female |
| Sales & Related | 997 (46.9%) | 1,128 (53.1%) |
| Office & Administration | 520 (21.1%) | 1,939 (78.8%) |
| Total (Category) | 1,517 (33.1%) | 3,067 (66.9%) |
| Total (Overall) | 13,861 (53.6%) | 12,011 (46.4%) |
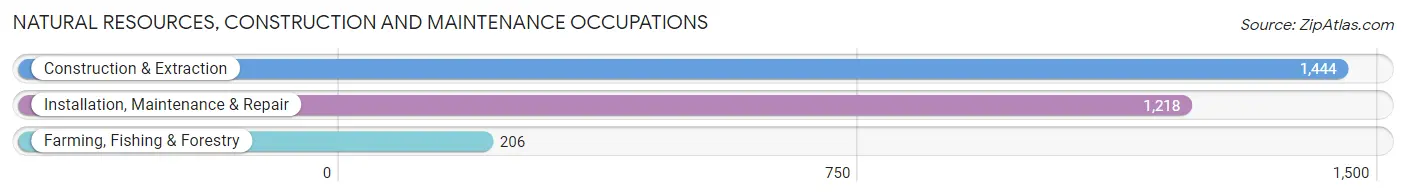
Natural Resources, Construction and Maintenance Occupations
The most common Natural Resources, Construction and Maintenance occupations in Coffee County are Construction & Extraction (1,444 | 5.6%), Installation, Maintenance & Repair (1,218 | 4.7%), and Farming, Fishing & Forestry (206 | 0.8%).
Natural Resources, Construction and Maintenance Occupations by Sex
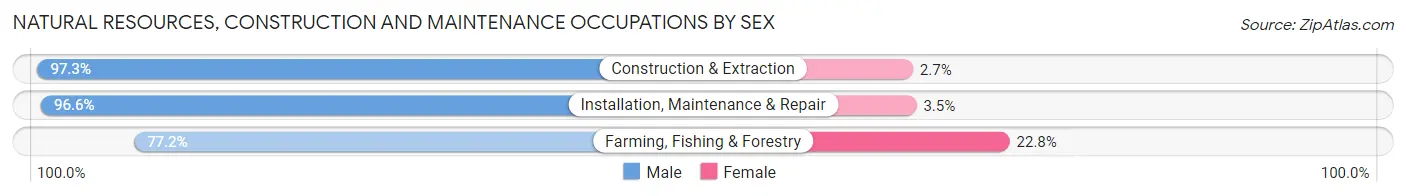
| Occupation | Male | Female |
| Farming, Fishing & Forestry | 159 (77.2%) | 47 (22.8%) |
| Construction & Extraction | 1,405 (97.3%) | 39 (2.7%) |
| Installation, Maintenance & Repair | 1,176 (96.6%) | 42 (3.5%) |
| Total (Category) | 2,740 (95.5%) | 128 (4.5%) |
| Total (Overall) | 13,861 (53.6%) | 12,011 (46.4%) |
Production, Transportation and Moving Occupations
The most common Production, Transportation and Moving occupations in Coffee County are Production (3,826 | 14.8%), Material Moving (1,242 | 4.8%), and Transportation (748 | 2.9%).
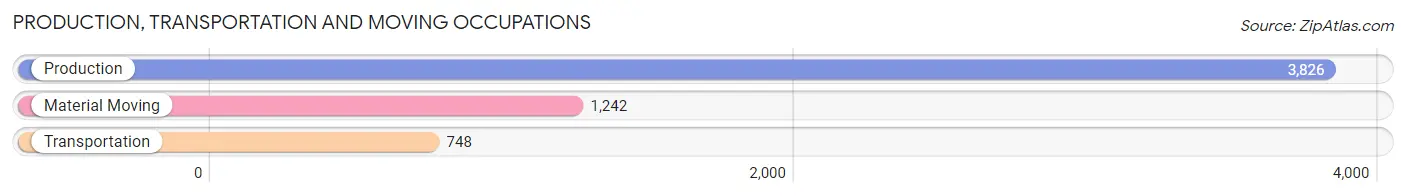
Production, Transportation and Moving Occupations by Sex
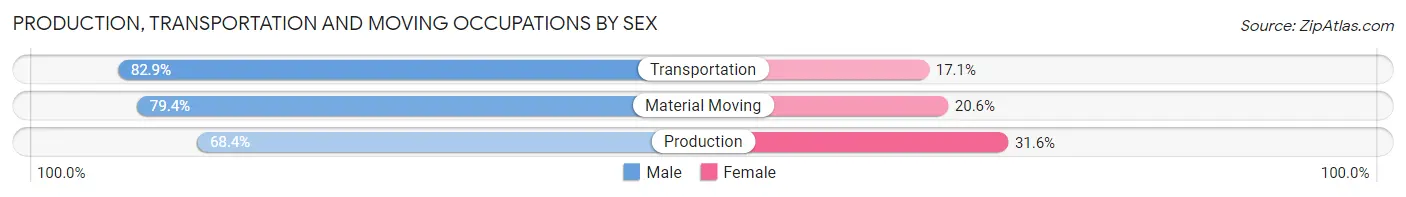
| Occupation | Male | Female |
| Production | 2,616 (68.4%) | 1,210 (31.6%) |
| Transportation | 620 (82.9%) | 128 (17.1%) |
| Material Moving | 986 (79.4%) | 256 (20.6%) |
| Total (Category) | 4,222 (72.6%) | 1,594 (27.4%) |
| Total (Overall) | 13,861 (53.6%) | 12,011 (46.4%) |
Employment Industries by Sex in Coffee County
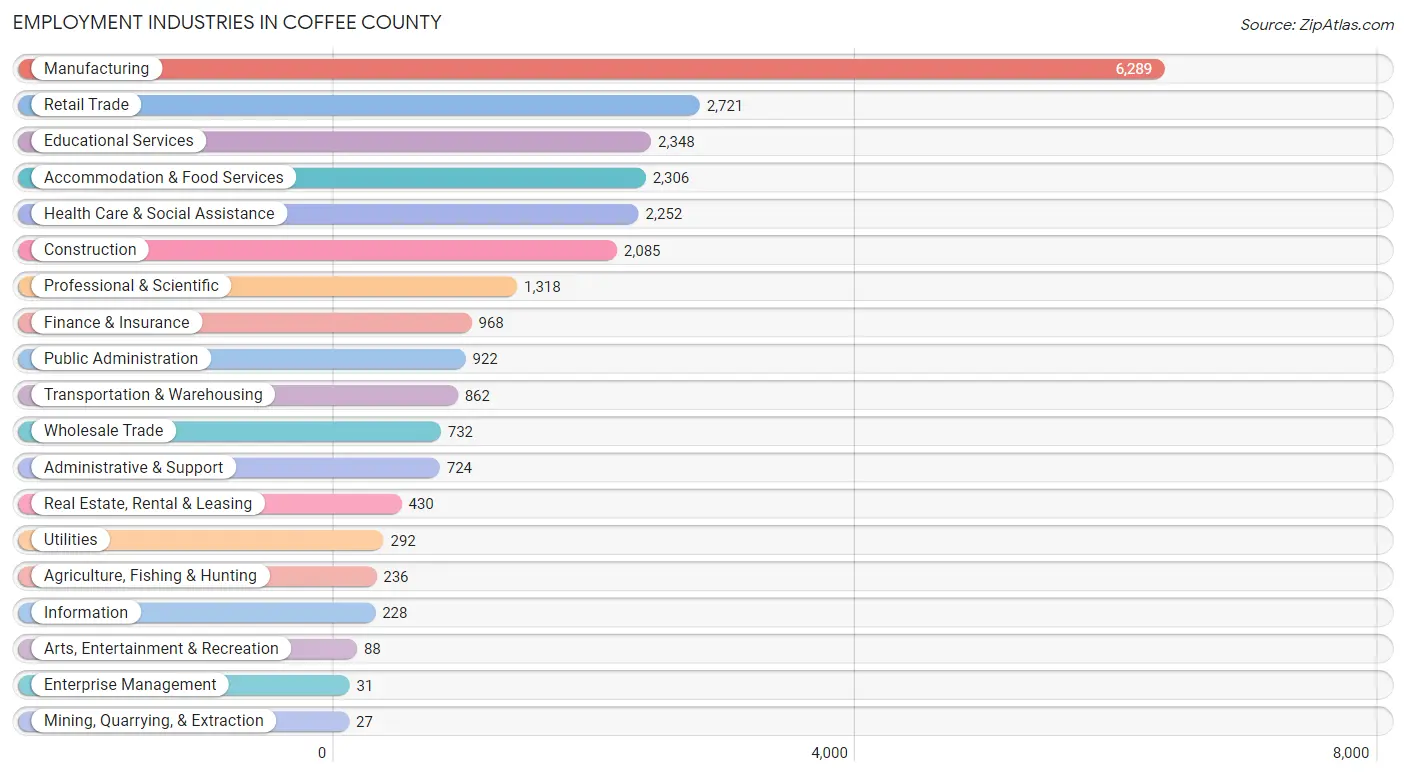
Employment Industries in Coffee County
The major employment industries in Coffee County include Manufacturing (6,289 | 24.3%), Retail Trade (2,721 | 10.5%), Educational Services (2,348 | 9.1%), Accommodation & Food Services (2,306 | 8.9%), and Health Care & Social Assistance (2,252 | 8.7%).
Employment Industries by Sex in Coffee County
The Coffee County industries that see more men than women are Mining, Quarrying, & Extraction (100.0%), Construction (95.4%), and Transportation & Warehousing (86.1%), whereas the industries that tend to have a higher number of women are Health Care & Social Assistance (86.0%), Educational Services (80.8%), and Accommodation & Food Services (70.8%).
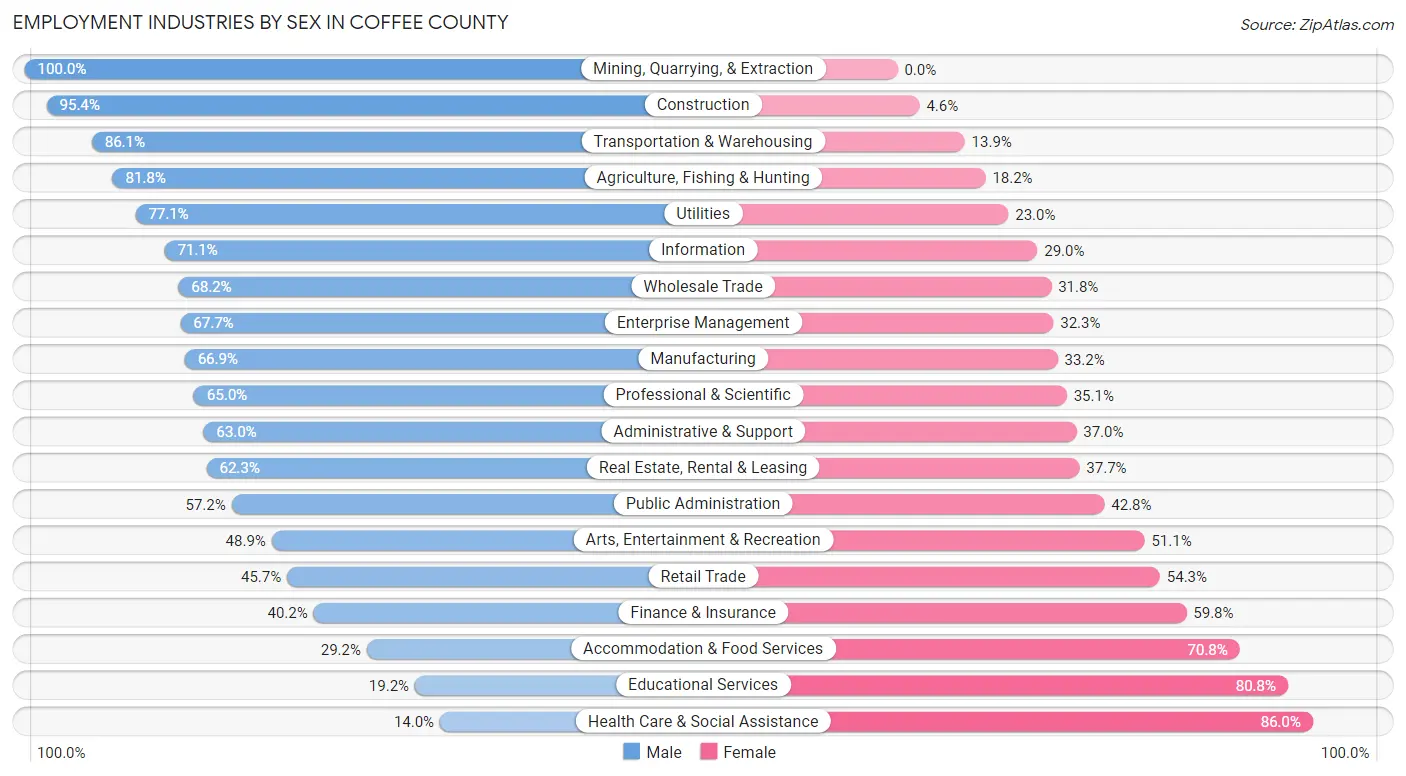
| Industry | Male | Female |
| Agriculture, Fishing & Hunting | 193 (81.8%) | 43 (18.2%) |
| Mining, Quarrying, & Extraction | 27 (100.0%) | 0 (0.0%) |
| Construction | 1,990 (95.4%) | 95 (4.6%) |
| Manufacturing | 4,204 (66.8%) | 2,085 (33.2%) |
| Wholesale Trade | 499 (68.2%) | 233 (31.8%) |
| Retail Trade | 1,243 (45.7%) | 1,478 (54.3%) |
| Transportation & Warehousing | 742 (86.1%) | 120 (13.9%) |
| Utilities | 225 (77.0%) | 67 (23.0%) |
| Information | 162 (71.1%) | 66 (28.9%) |
| Finance & Insurance | 389 (40.2%) | 579 (59.8%) |
| Real Estate, Rental & Leasing | 268 (62.3%) | 162 (37.7%) |
| Professional & Scientific | 856 (64.9%) | 462 (35.0%) |
| Enterprise Management | 21 (67.7%) | 10 (32.3%) |
| Administrative & Support | 456 (63.0%) | 268 (37.0%) |
| Educational Services | 451 (19.2%) | 1,897 (80.8%) |
| Health Care & Social Assistance | 316 (14.0%) | 1,936 (86.0%) |
| Arts, Entertainment & Recreation | 43 (48.9%) | 45 (51.1%) |
| Accommodation & Food Services | 673 (29.2%) | 1,633 (70.8%) |
| Public Administration | 527 (57.2%) | 395 (42.8%) |
| Total | 13,861 (53.6%) | 12,011 (46.4%) |
Education in Coffee County
School Enrollment in Coffee County
The most common levels of schooling among the 12,897 students in Coffee County are high school (3,282 | 25.5%), elementary school (3,075 | 23.8%), and middle school (2,794 | 21.7%).
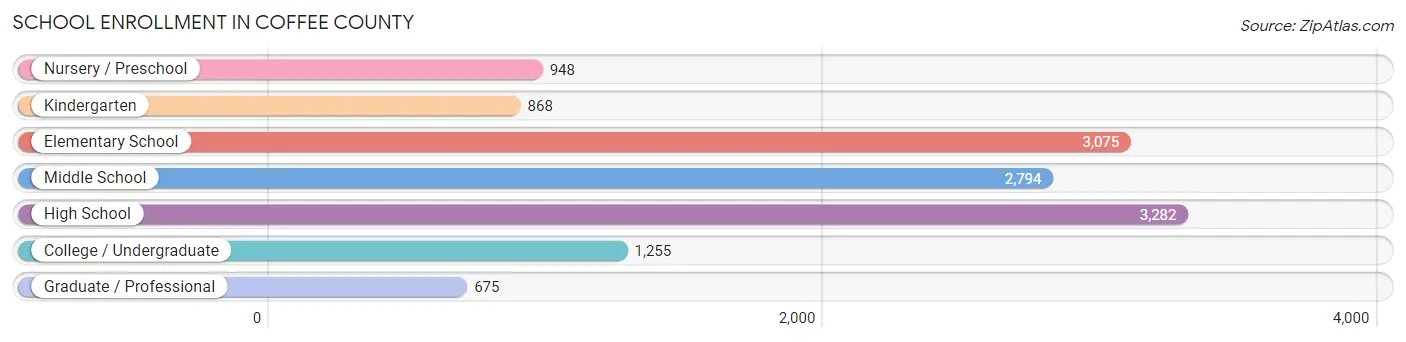
| School Level | # Students | % Students |
| Nursery / Preschool | 948 | 7.3% |
| Kindergarten | 868 | 6.7% |
| Elementary School | 3,075 | 23.8% |
| Middle School | 2,794 | 21.7% |
| High School | 3,282 | 25.5% |
| College / Undergraduate | 1,255 | 9.7% |
| Graduate / Professional | 675 | 5.2% |
| Total | 12,897 | 100.0% |
School Enrollment by Age by Funding Source in Coffee County
Out of a total of 12,897 students who are enrolled in schools in Coffee County, 1,561 (12.1%) attend a private institution, while the remaining 11,336 (87.9%) are enrolled in public schools. The age group of 35 years and over has the highest likelihood of being enrolled in private schools, with 202 (39.8% in the age bracket) enrolled. Conversely, the age group of 18 to 19 year olds has the lowest likelihood of being enrolled in a private school, with 765 (97.2% in the age bracket) attending a public institution.
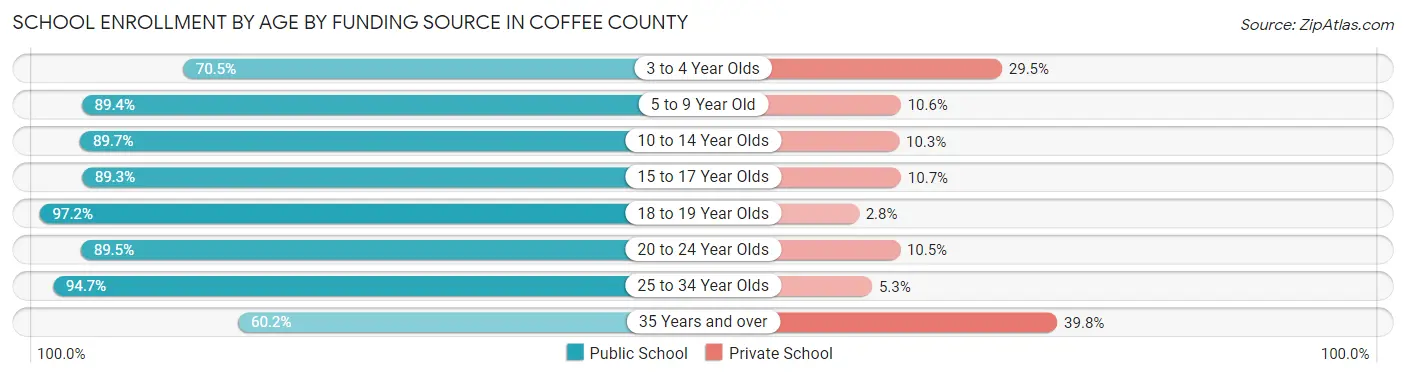
| Age Bracket | Public School | Private School |
| 3 to 4 Year Olds | 505 (70.5%) | 211 (29.5%) |
| 5 to 9 Year Old | 3,307 (89.4%) | 393 (10.6%) |
| 10 to 14 Year Olds | 3,233 (89.7%) | 372 (10.3%) |
| 15 to 17 Year Olds | 2,196 (89.3%) | 262 (10.7%) |
| 18 to 19 Year Olds | 765 (97.2%) | 22 (2.8%) |
| 20 to 24 Year Olds | 598 (89.5%) | 70 (10.5%) |
| 25 to 34 Year Olds | 431 (94.7%) | 24 (5.3%) |
| 35 Years and over | 306 (60.2%) | 202 (39.8%) |
| Total | 11,336 (87.9%) | 1,561 (12.1%) |
Educational Attainment by Field of Study in Coffee County
Education (1,985 | 19.5%), business (1,528 | 15.0%), engineering (1,233 | 12.1%), science & technology (955 | 9.4%), and social sciences (756 | 7.4%) are the most common fields of study among 10,166 individuals in Coffee County who have obtained a bachelor's degree or higher.
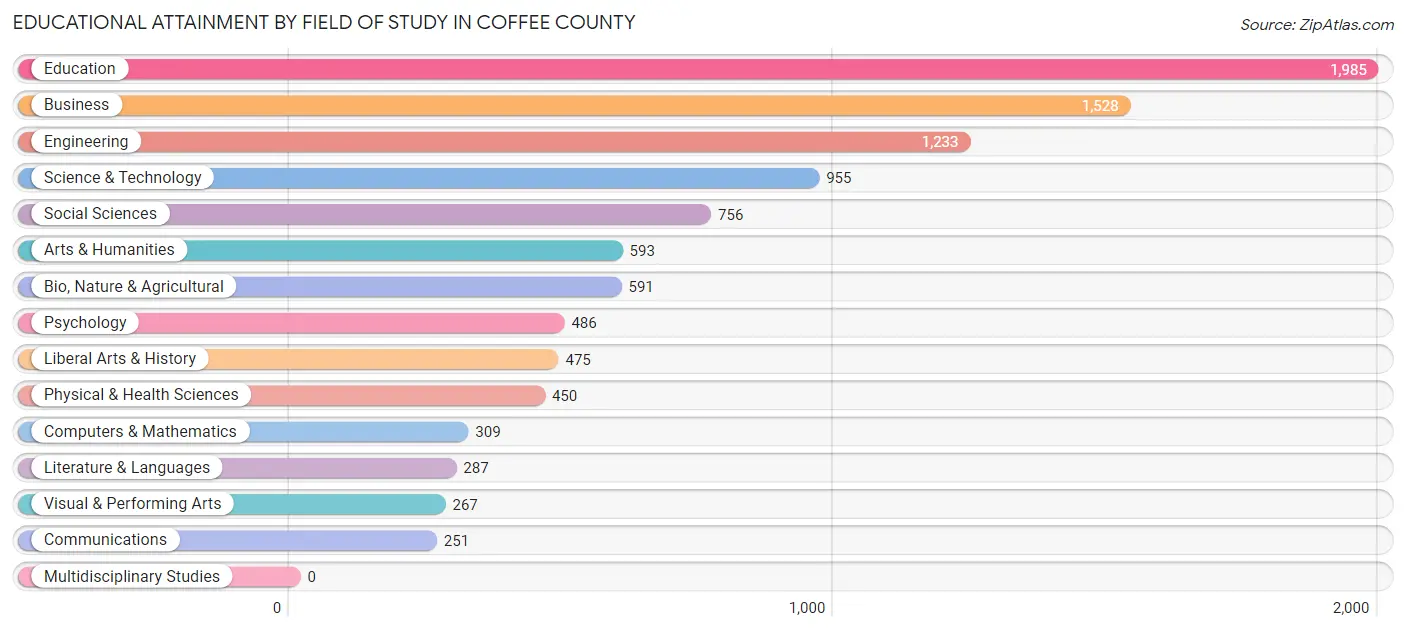
| Field of Study | # Graduates | % Graduates |
| Computers & Mathematics | 309 | 3.0% |
| Bio, Nature & Agricultural | 591 | 5.8% |
| Physical & Health Sciences | 450 | 4.4% |
| Psychology | 486 | 4.8% |
| Social Sciences | 756 | 7.4% |
| Engineering | 1,233 | 12.1% |
| Multidisciplinary Studies | 0 | 0.0% |
| Science & Technology | 955 | 9.4% |
| Business | 1,528 | 15.0% |
| Education | 1,985 | 19.5% |
| Literature & Languages | 287 | 2.8% |
| Liberal Arts & History | 475 | 4.7% |
| Visual & Performing Arts | 267 | 2.6% |
| Communications | 251 | 2.5% |
| Arts & Humanities | 593 | 5.8% |
| Total | 10,166 | 100.0% |
Transportation & Commute in Coffee County
Vehicle Availability by Sex in Coffee County
The most prevalent vehicle ownership categories in Coffee County are males with 2 vehicles (6,113, accounting for 46.0%) and females with 2 vehicles (5,247, making up 52.5%).
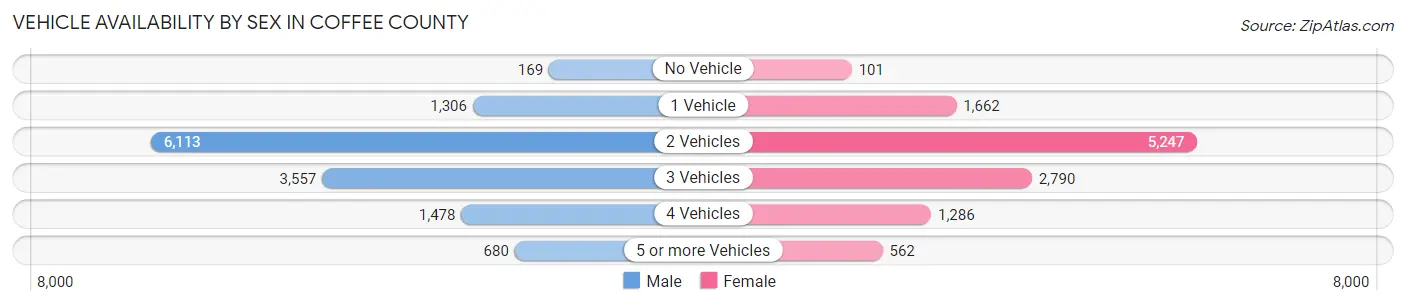
| Vehicles Available | Male | Female |
| No Vehicle | 169 (1.3%) | 101 (0.9%) |
| 1 Vehicle | 1,306 (9.8%) | 1,662 (14.3%) |
| 2 Vehicles | 6,113 (46.0%) | 5,247 (45.1%) |
| 3 Vehicles | 3,557 (26.7%) | 2,790 (23.9%) |
| 4 Vehicles | 1,478 (11.1%) | 1,286 (11.0%) |
| 5 or more Vehicles | 680 (5.1%) | 562 (4.8%) |
| Total | 13,303 (100.0%) | 11,648 (100.0%) |
Commute Time in Coffee County
The most frequently occuring commute durations in Coffee County are 10 to 14 minutes (3,512 commuters, 15.2%), 30 to 34 minutes (3,338 commuters, 14.4%), and 5 to 9 minutes (3,233 commuters, 14.0%).
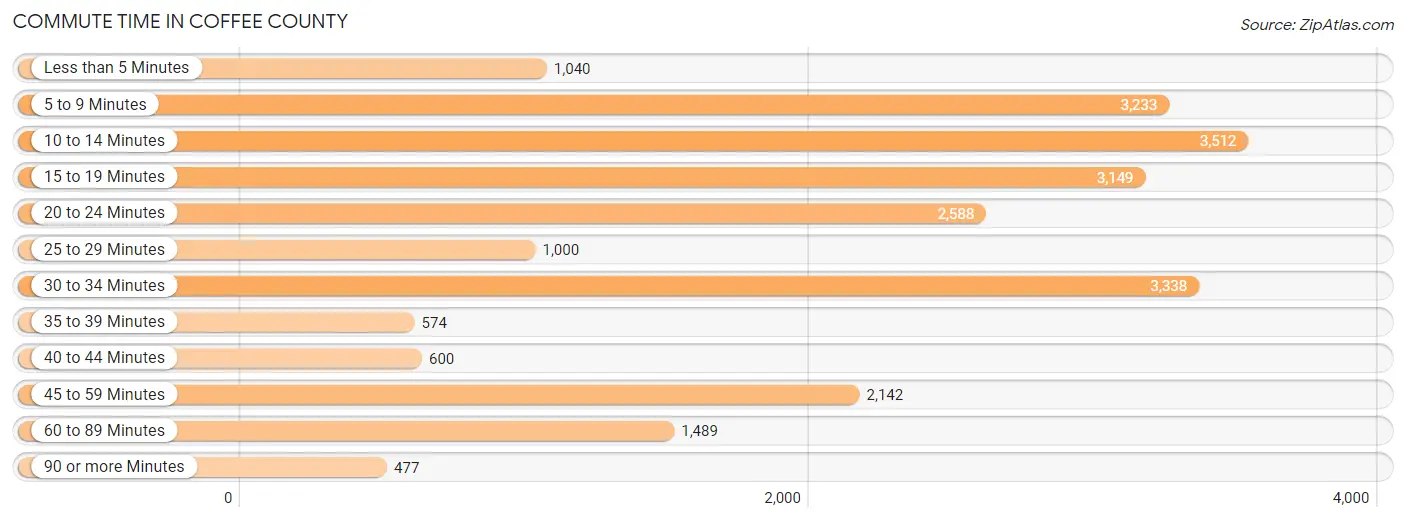
| Commute Time | # Commuters | % Commuters |
| Less than 5 Minutes | 1,040 | 4.5% |
| 5 to 9 Minutes | 3,233 | 14.0% |
| 10 to 14 Minutes | 3,512 | 15.2% |
| 15 to 19 Minutes | 3,149 | 13.6% |
| 20 to 24 Minutes | 2,588 | 11.2% |
| 25 to 29 Minutes | 1,000 | 4.3% |
| 30 to 34 Minutes | 3,338 | 14.4% |
| 35 to 39 Minutes | 574 | 2.5% |
| 40 to 44 Minutes | 600 | 2.6% |
| 45 to 59 Minutes | 2,142 | 9.3% |
| 60 to 89 Minutes | 1,489 | 6.4% |
| 90 or more Minutes | 477 | 2.1% |
Commute Time by Sex in Coffee County
The most common commute times in Coffee County are 10 to 14 minutes (1,959 commuters, 15.3%) for males and 5 to 9 minutes (1,845 commuters, 17.8%) for females.
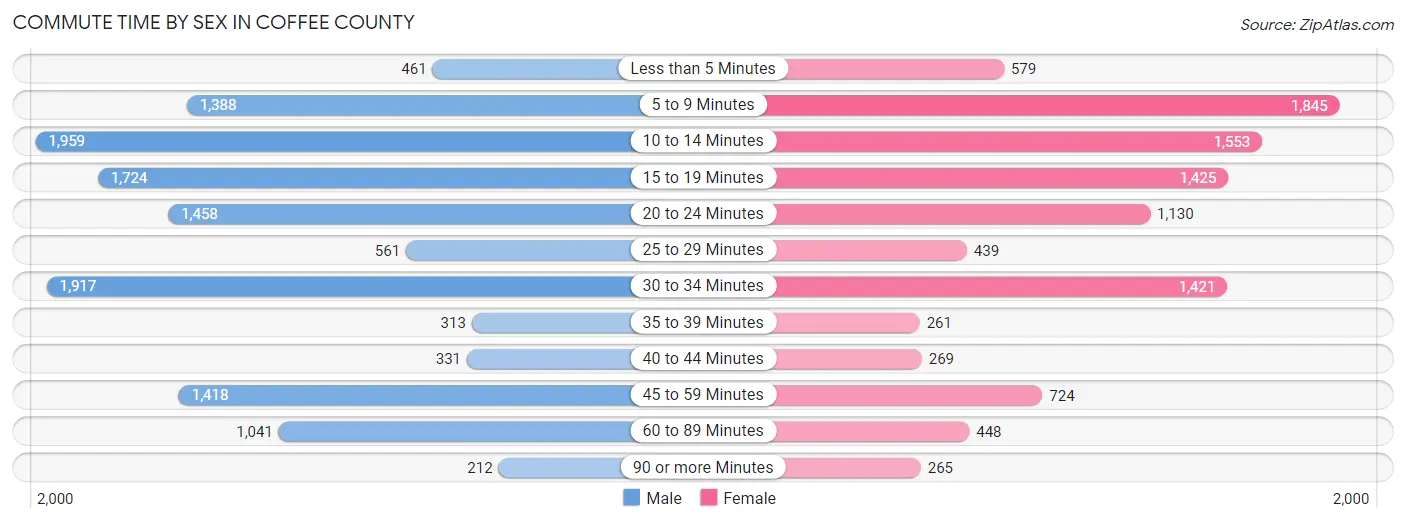
| Commute Time | Male | Female |
| Less than 5 Minutes | 461 (3.6%) | 579 (5.6%) |
| 5 to 9 Minutes | 1,388 (10.9%) | 1,845 (17.8%) |
| 10 to 14 Minutes | 1,959 (15.3%) | 1,553 (15.0%) |
| 15 to 19 Minutes | 1,724 (13.5%) | 1,425 (13.8%) |
| 20 to 24 Minutes | 1,458 (11.4%) | 1,130 (10.9%) |
| 25 to 29 Minutes | 561 (4.4%) | 439 (4.2%) |
| 30 to 34 Minutes | 1,917 (15.0%) | 1,421 (13.7%) |
| 35 to 39 Minutes | 313 (2.5%) | 261 (2.5%) |
| 40 to 44 Minutes | 331 (2.6%) | 269 (2.6%) |
| 45 to 59 Minutes | 1,418 (11.1%) | 724 (7.0%) |
| 60 to 89 Minutes | 1,041 (8.1%) | 448 (4.3%) |
| 90 or more Minutes | 212 (1.7%) | 265 (2.6%) |
Time of Departure to Work by Sex in Coffee County
The most frequent times of departure to work in Coffee County are 6:30 AM to 6:59 AM (1,796, 14.1%) for males and 7:00 AM to 7:29 AM (2,144, 20.7%) for females.
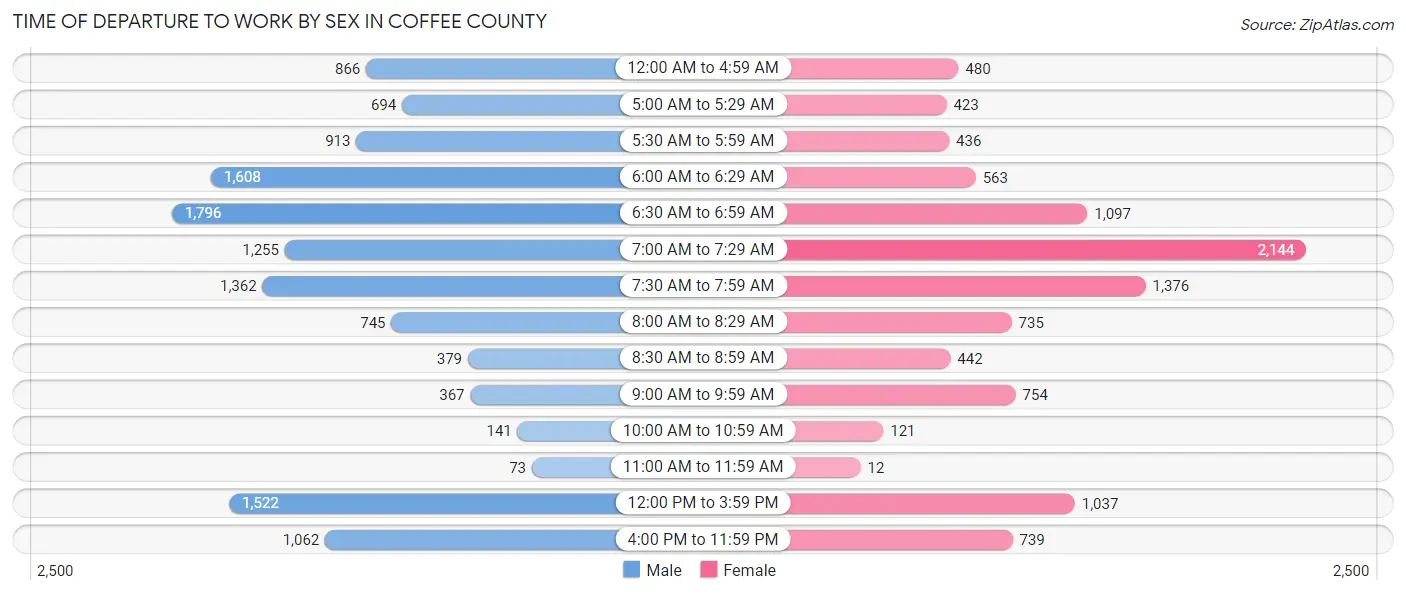
| Time of Departure | Male | Female |
| 12:00 AM to 4:59 AM | 866 (6.8%) | 480 (4.6%) |
| 5:00 AM to 5:29 AM | 694 (5.4%) | 423 (4.1%) |
| 5:30 AM to 5:59 AM | 913 (7.1%) | 436 (4.2%) |
| 6:00 AM to 6:29 AM | 1,608 (12.6%) | 563 (5.4%) |
| 6:30 AM to 6:59 AM | 1,796 (14.1%) | 1,097 (10.6%) |
| 7:00 AM to 7:29 AM | 1,255 (9.8%) | 2,144 (20.7%) |
| 7:30 AM to 7:59 AM | 1,362 (10.6%) | 1,376 (13.3%) |
| 8:00 AM to 8:29 AM | 745 (5.8%) | 735 (7.1%) |
| 8:30 AM to 8:59 AM | 379 (3.0%) | 442 (4.3%) |
| 9:00 AM to 9:59 AM | 367 (2.9%) | 754 (7.3%) |
| 10:00 AM to 10:59 AM | 141 (1.1%) | 121 (1.2%) |
| 11:00 AM to 11:59 AM | 73 (0.6%) | 12 (0.1%) |
| 12:00 PM to 3:59 PM | 1,522 (11.9%) | 1,037 (10.0%) |
| 4:00 PM to 11:59 PM | 1,062 (8.3%) | 739 (7.1%) |
| Total | 12,783 (100.0%) | 10,359 (100.0%) |
Housing Occupancy in Coffee County
Occupancy by Ownership in Coffee County
Of the total 22,689 dwellings in Coffee County, owner-occupied units account for 15,660 (69.0%), while renter-occupied units make up 7,029 (31.0%).
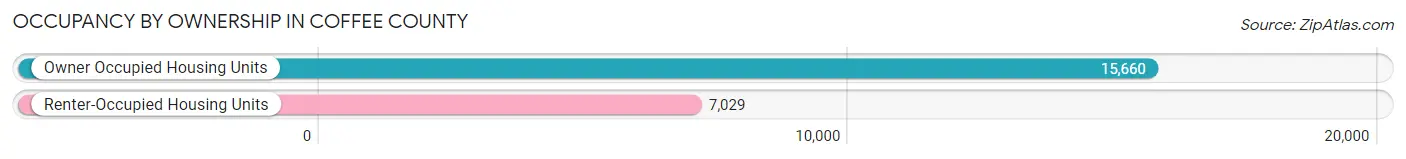
| Occupancy | # Housing Units | % Housing Units |
| Owner Occupied Housing Units | 15,660 | 69.0% |
| Renter-Occupied Housing Units | 7,029 | 31.0% |
| Total Occupied Housing Units | 22,689 | 100.0% |
Occupancy by Household Size in Coffee County
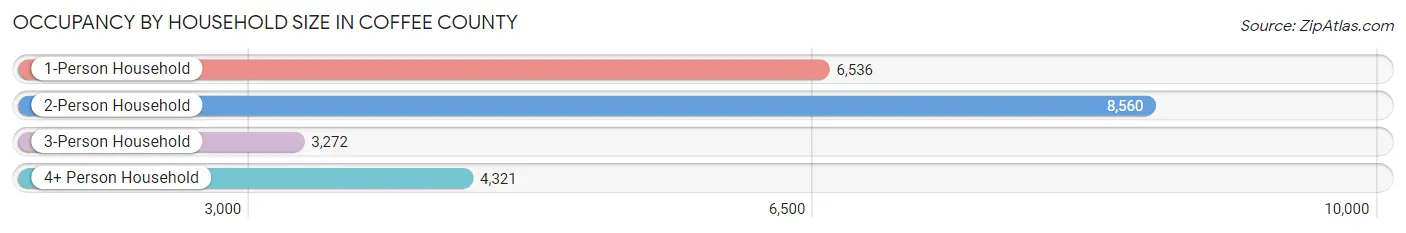
| Household Size | # Housing Units | % Housing Units |
| 1-Person Household | 6,536 | 28.8% |
| 2-Person Household | 8,560 | 37.7% |
| 3-Person Household | 3,272 | 14.4% |
| 4+ Person Household | 4,321 | 19.0% |
| Total Housing Units | 22,689 | 100.0% |
Occupancy by Ownership by Household Size in Coffee County
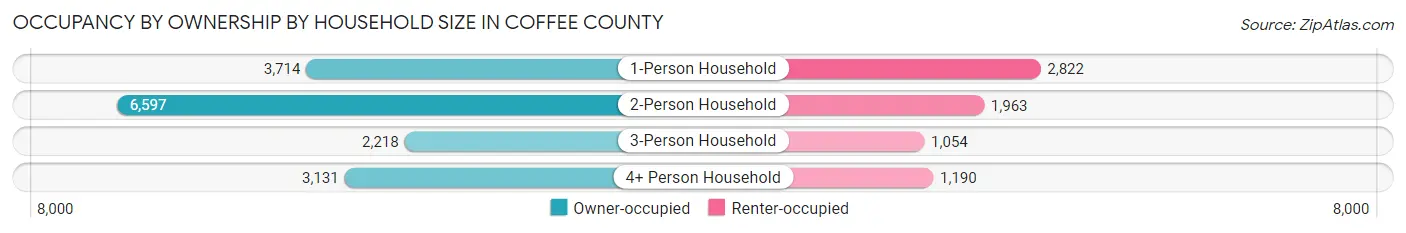
| Household Size | Owner-occupied | Renter-occupied |
| 1-Person Household | 3,714 (56.8%) | 2,822 (43.2%) |
| 2-Person Household | 6,597 (77.1%) | 1,963 (22.9%) |
| 3-Person Household | 2,218 (67.8%) | 1,054 (32.2%) |
| 4+ Person Household | 3,131 (72.5%) | 1,190 (27.5%) |
| Total Housing Units | 15,660 (69.0%) | 7,029 (31.0%) |
Occupancy by Educational Attainment in Coffee County
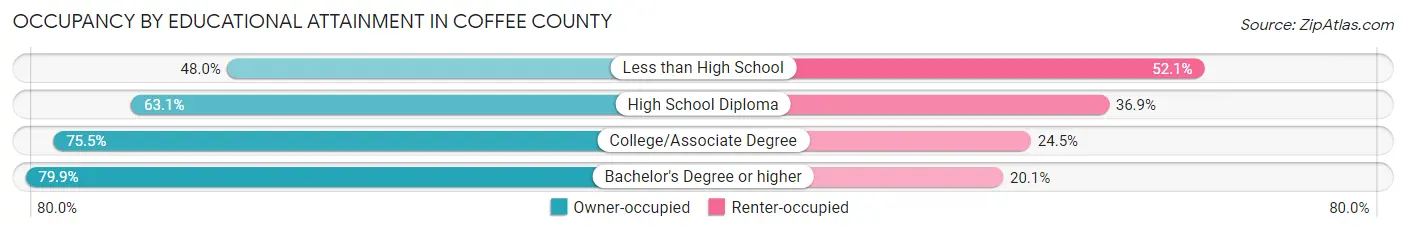
| Household Size | Owner-occupied | Renter-occupied |
| Less than High School | 1,322 (47.9%) | 1,435 (52.0%) |
| High School Diploma | 4,916 (63.1%) | 2,875 (36.9%) |
| College/Associate Degree | 4,724 (75.5%) | 1,536 (24.5%) |
| Bachelor's Degree or higher | 4,698 (79.9%) | 1,183 (20.1%) |
Occupancy by Age of Householder in Coffee County
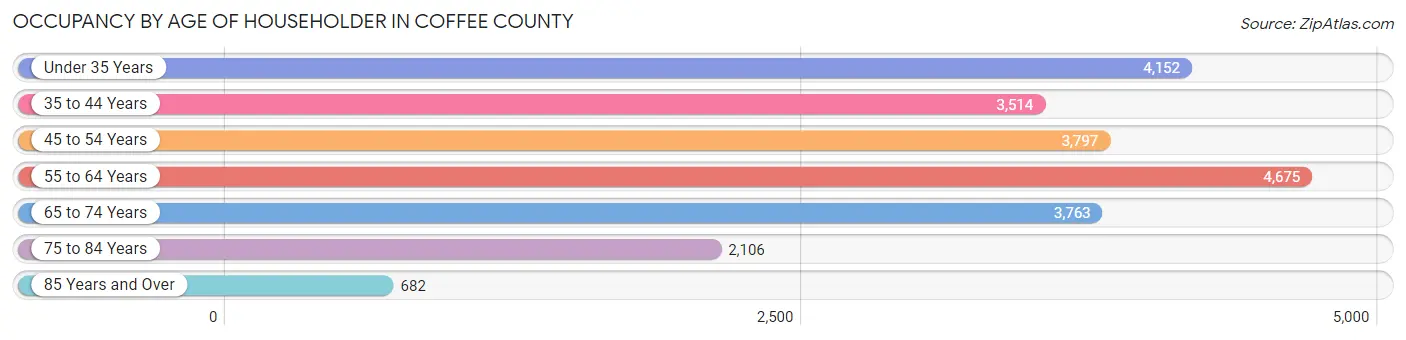
| Age Bracket | # Households | % Households |
| Under 35 Years | 4,152 | 18.3% |
| 35 to 44 Years | 3,514 | 15.5% |
| 45 to 54 Years | 3,797 | 16.7% |
| 55 to 64 Years | 4,675 | 20.6% |
| 65 to 74 Years | 3,763 | 16.6% |
| 75 to 84 Years | 2,106 | 9.3% |
| 85 Years and Over | 682 | 3.0% |
| Total | 22,689 | 100.0% |
Housing Finances in Coffee County
Median Income by Occupancy in Coffee County
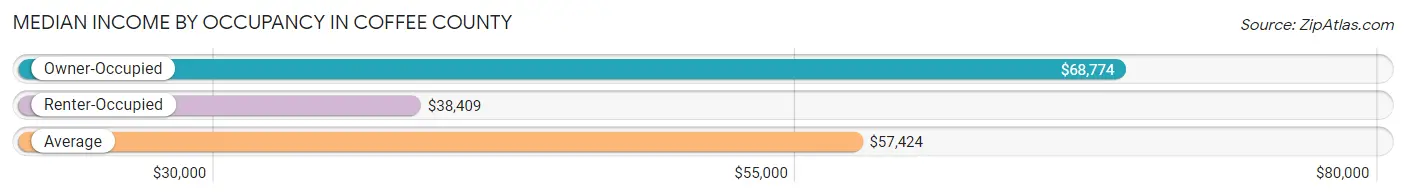
| Occupancy Type | # Households | Median Income |
| Owner-Occupied | 15,660 (69.0%) | $68,774 |
| Renter-Occupied | 7,029 (31.0%) | $38,409 |
| Average | 22,689 (100.0%) | $57,424 |
Occupancy by Householder Income Bracket in Coffee County
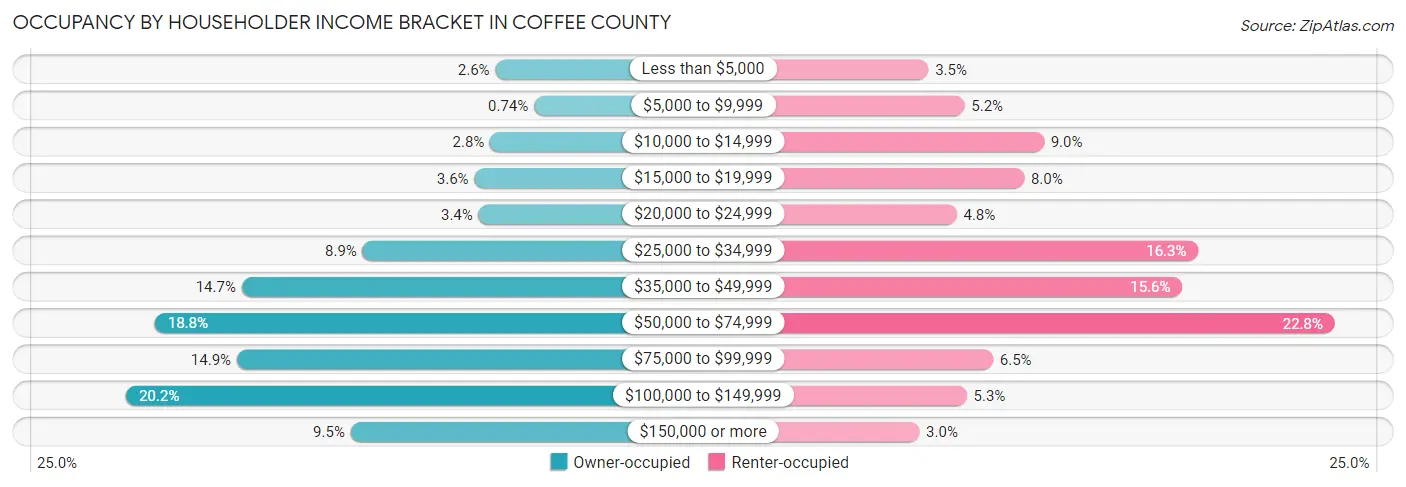
| Income Bracket | Owner-occupied | Renter-occupied |
| Less than $5,000 | 404 (2.6%) | 243 (3.5%) |
| $5,000 to $9,999 | 116 (0.7%) | 364 (5.2%) |
| $10,000 to $14,999 | 443 (2.8%) | 630 (9.0%) |
| $15,000 to $19,999 | 561 (3.6%) | 564 (8.0%) |
| $20,000 to $24,999 | 529 (3.4%) | 338 (4.8%) |
| $25,000 to $34,999 | 1,393 (8.9%) | 1,147 (16.3%) |
| $35,000 to $49,999 | 2,296 (14.7%) | 1,094 (15.6%) |
| $50,000 to $74,999 | 2,944 (18.8%) | 1,604 (22.8%) |
| $75,000 to $99,999 | 2,332 (14.9%) | 460 (6.5%) |
| $100,000 to $149,999 | 3,159 (20.2%) | 372 (5.3%) |
| $150,000 or more | 1,483 (9.5%) | 213 (3.0%) |
| Total | 15,660 (100.0%) | 7,029 (100.0%) |
Monthly Housing Cost Tiers in Coffee County
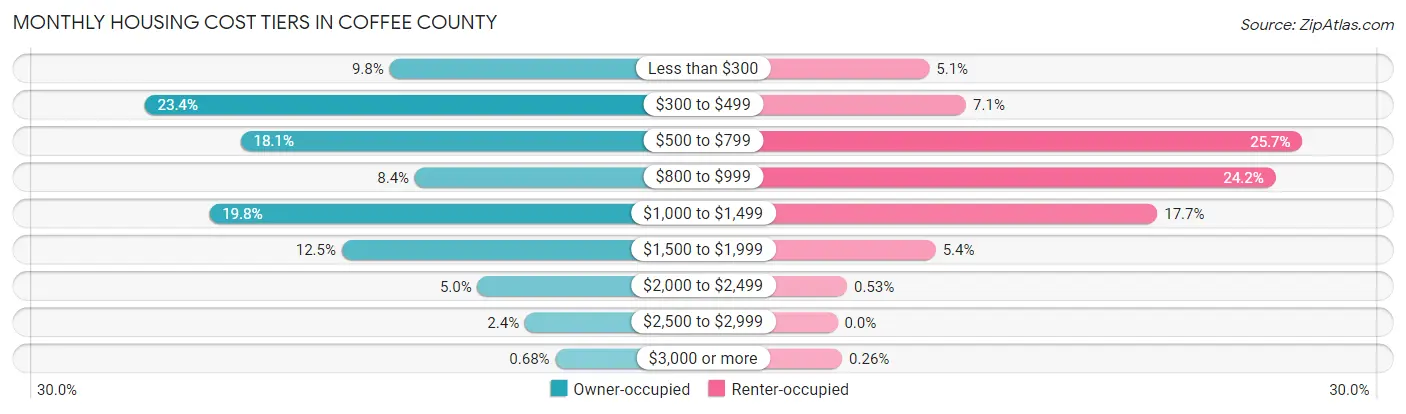
| Monthly Cost | Owner-occupied | Renter-occupied |
| Less than $300 | 1,541 (9.8%) | 357 (5.1%) |
| $300 to $499 | 3,659 (23.4%) | 500 (7.1%) |
| $500 to $799 | 2,829 (18.1%) | 1,805 (25.7%) |
| $800 to $999 | 1,321 (8.4%) | 1,701 (24.2%) |
| $1,000 to $1,499 | 3,100 (19.8%) | 1,242 (17.7%) |
| $1,500 to $1,999 | 1,955 (12.5%) | 382 (5.4%) |
| $2,000 to $2,499 | 780 (5.0%) | 37 (0.5%) |
| $2,500 to $2,999 | 369 (2.4%) | 0 (0.0%) |
| $3,000 or more | 106 (0.7%) | 18 (0.3%) |
| Total | 15,660 (100.0%) | 7,029 (100.0%) |
Physical Housing Characteristics in Coffee County
Housing Structures in Coffee County

| Structure Type | # Housing Units | % Housing Units |
| Single Unit, Detached | 16,592 | 73.1% |
| Single Unit, Attached | 422 | 1.9% |
| 2 Unit Apartments | 865 | 3.8% |
| 3 or 4 Unit Apartments | 304 | 1.3% |
| 5 to 9 Unit Apartments | 1,016 | 4.5% |
| 10 or more Apartments | 838 | 3.7% |
| Mobile Home / Other | 2,652 | 11.7% |
| Total | 22,689 | 100.0% |
Housing Structures by Occupancy in Coffee County
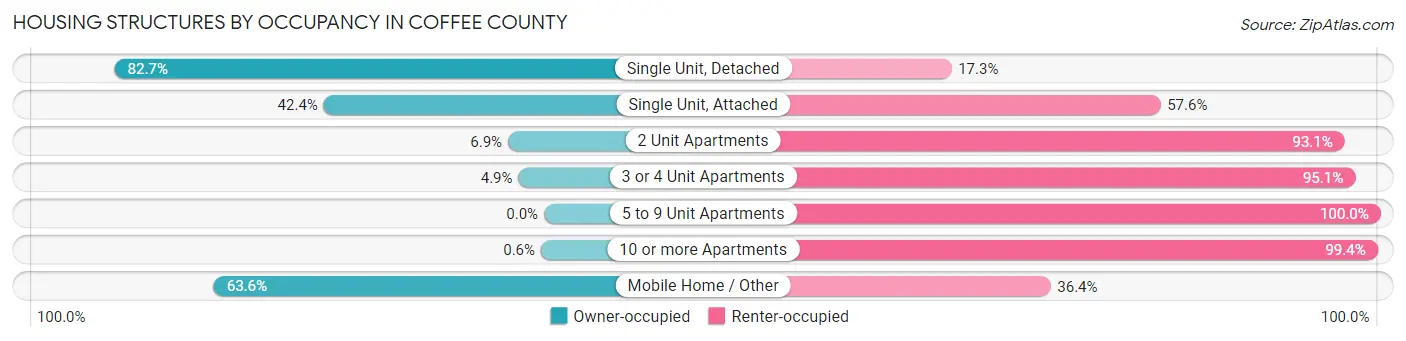
| Structure Type | Owner-occupied | Renter-occupied |
| Single Unit, Detached | 13,715 (82.7%) | 2,877 (17.3%) |
| Single Unit, Attached | 179 (42.4%) | 243 (57.6%) |
| 2 Unit Apartments | 60 (6.9%) | 805 (93.1%) |
| 3 or 4 Unit Apartments | 15 (4.9%) | 289 (95.1%) |
| 5 to 9 Unit Apartments | 0 (0.0%) | 1,016 (100.0%) |
| 10 or more Apartments | 5 (0.6%) | 833 (99.4%) |
| Mobile Home / Other | 1,686 (63.6%) | 966 (36.4%) |
| Total | 15,660 (69.0%) | 7,029 (31.0%) |
Housing Structures by Number of Rooms in Coffee County
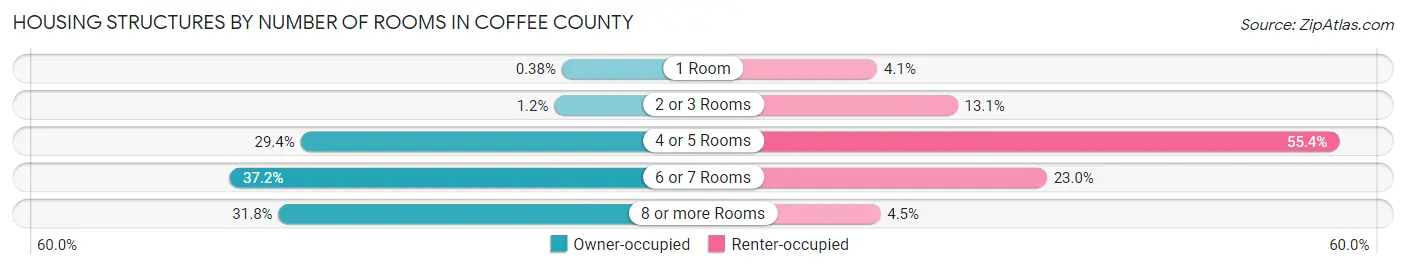
| Number of Rooms | Owner-occupied | Renter-occupied |
| 1 Room | 60 (0.4%) | 290 (4.1%) |
| 2 or 3 Rooms | 189 (1.2%) | 917 (13.1%) |
| 4 or 5 Rooms | 4,601 (29.4%) | 3,894 (55.4%) |
| 6 or 7 Rooms | 5,825 (37.2%) | 1,613 (23.0%) |
| 8 or more Rooms | 4,985 (31.8%) | 315 (4.5%) |
| Total | 15,660 (100.0%) | 7,029 (100.0%) |
Housing Structure by Heating Type in Coffee County
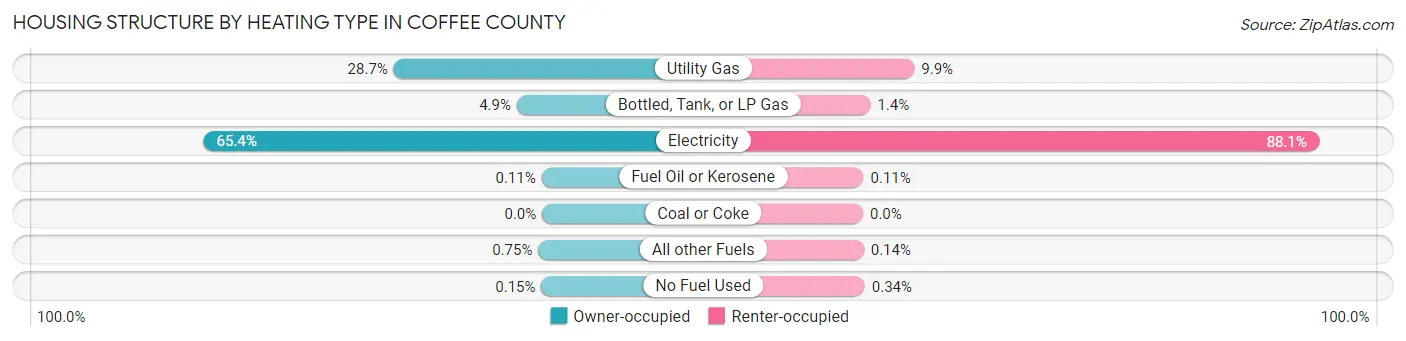
| Heating Type | Owner-occupied | Renter-occupied |
| Utility Gas | 4,492 (28.7%) | 697 (9.9%) |
| Bottled, Tank, or LP Gas | 766 (4.9%) | 101 (1.4%) |
| Electricity | 10,243 (65.4%) | 6,189 (88.0%) |
| Fuel Oil or Kerosene | 18 (0.1%) | 8 (0.1%) |
| Coal or Coke | 0 (0.0%) | 0 (0.0%) |
| All other Fuels | 117 (0.7%) | 10 (0.1%) |
| No Fuel Used | 24 (0.2%) | 24 (0.3%) |
| Total | 15,660 (100.0%) | 7,029 (100.0%) |
Household Vehicle Usage in Coffee County
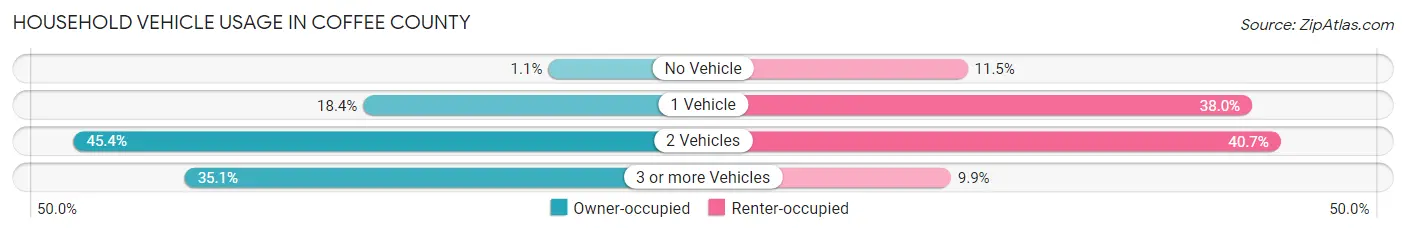
| Vehicles per Household | Owner-occupied | Renter-occupied |
| No Vehicle | 175 (1.1%) | 805 (11.5%) |
| 1 Vehicle | 2,881 (18.4%) | 2,670 (38.0%) |
| 2 Vehicles | 7,115 (45.4%) | 2,859 (40.7%) |
| 3 or more Vehicles | 5,489 (35.0%) | 695 (9.9%) |
| Total | 15,660 (100.0%) | 7,029 (100.0%) |
Real Estate & Mortgages in Coffee County
Real Estate and Mortgage Overview in Coffee County
| Characteristic | Without Mortgage | With Mortgage |
| Housing Units | 7,478 | 8,182 |
| Median Property Value | $189,700 | $220,800 |
| Median Household Income | $49,643 | $947 |
| Monthly Housing Costs | $421 | $106 |
| Real Estate Taxes | $1,252 | $299 |
Property Value by Mortgage Status in Coffee County
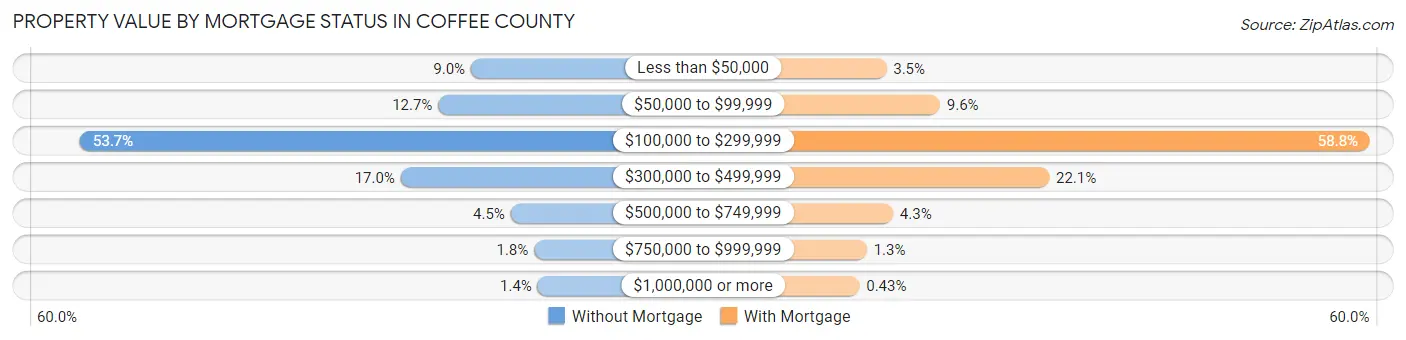
| Property Value | Without Mortgage | With Mortgage |
| Less than $50,000 | 672 (9.0%) | 287 (3.5%) |
| $50,000 to $99,999 | 952 (12.7%) | 788 (9.6%) |
| $100,000 to $299,999 | 4,014 (53.7%) | 4,809 (58.8%) |
| $300,000 to $499,999 | 1,273 (17.0%) | 1,809 (22.1%) |
| $500,000 to $749,999 | 333 (4.4%) | 349 (4.3%) |
| $750,000 to $999,999 | 132 (1.8%) | 105 (1.3%) |
| $1,000,000 or more | 102 (1.4%) | 35 (0.4%) |
| Total | 7,478 (100.0%) | 8,182 (100.0%) |
Household Income by Mortgage Status in Coffee County
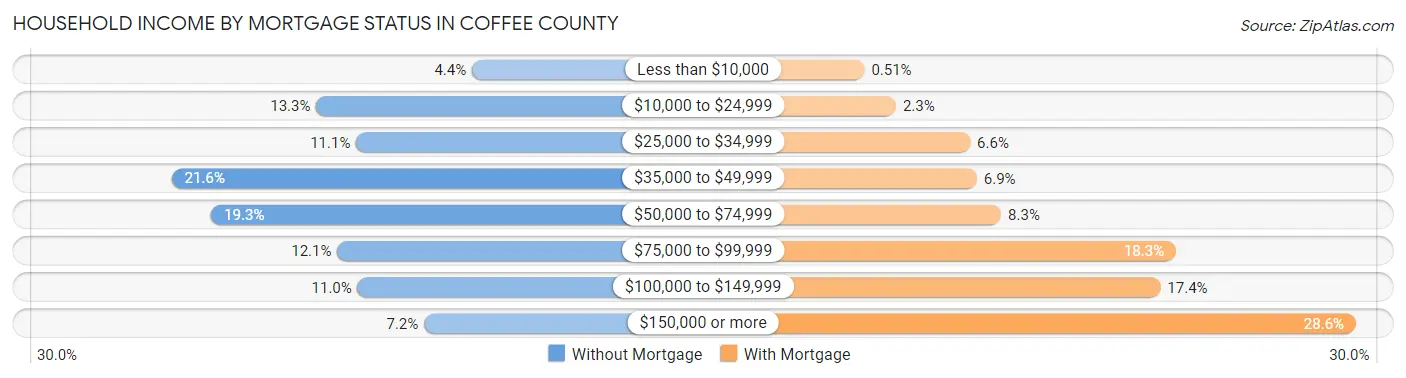
| Household Income | Without Mortgage | With Mortgage |
| Less than $10,000 | 331 (4.4%) | 42 (0.5%) |
| $10,000 to $24,999 | 997 (13.3%) | 189 (2.3%) |
| $25,000 to $34,999 | 826 (11.1%) | 536 (6.6%) |
| $35,000 to $49,999 | 1,615 (21.6%) | 567 (6.9%) |
| $50,000 to $74,999 | 1,446 (19.3%) | 681 (8.3%) |
| $75,000 to $99,999 | 907 (12.1%) | 1,498 (18.3%) |
| $100,000 to $149,999 | 820 (11.0%) | 1,425 (17.4%) |
| $150,000 or more | 536 (7.2%) | 2,339 (28.6%) |
| Total | 7,478 (100.0%) | 8,182 (100.0%) |
Property Value to Household Income Ratio in Coffee County
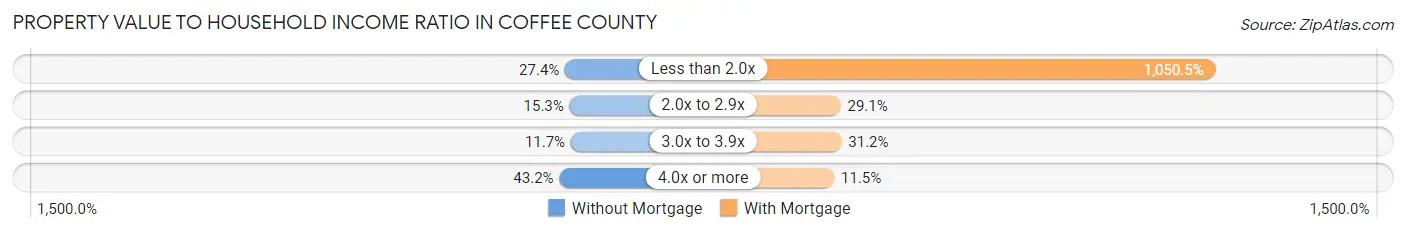
| Value-to-Income Ratio | Without Mortgage | With Mortgage |
| Less than 2.0x | 2,048 (27.4%) | 85,948 (1,050.5%) |
| 2.0x to 2.9x | 1,141 (15.3%) | 2,377 (29.0%) |
| 3.0x to 3.9x | 874 (11.7%) | 2,549 (31.1%) |
| 4.0x or more | 3,227 (43.1%) | 940 (11.5%) |
| Total | 7,478 (100.0%) | 8,182 (100.0%) |
Real Estate Taxes by Mortgage Status in Coffee County
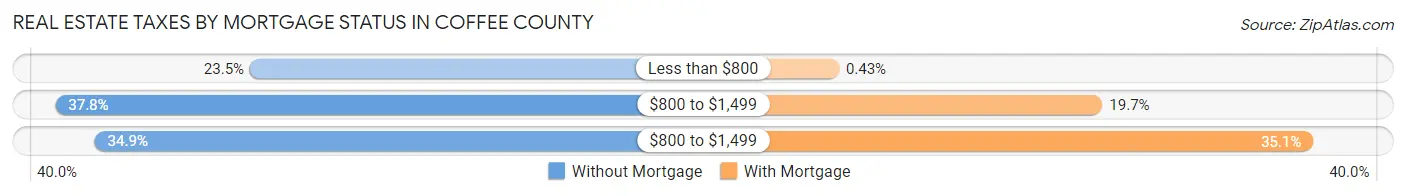
| Property Taxes | Without Mortgage | With Mortgage |
| Less than $800 | 1,760 (23.5%) | 35 (0.4%) |
| $800 to $1,499 | 2,823 (37.8%) | 1,610 (19.7%) |
| $800 to $1,499 | 2,608 (34.9%) | 2,870 (35.1%) |
| Total | 7,478 (100.0%) | 8,182 (100.0%) |
Health & Disability in Coffee County
Health Insurance Coverage by Age in Coffee County
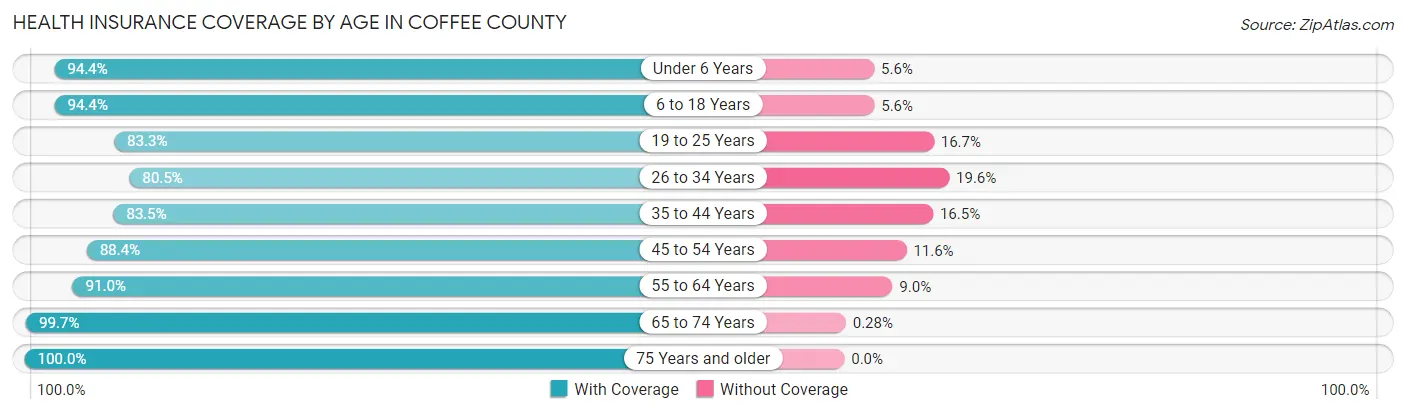
| Age Bracket | With Coverage | Without Coverage |
| Under 6 Years | 4,297 (94.4%) | 253 (5.6%) |
| 6 to 18 Years | 9,489 (94.4%) | 562 (5.6%) |
| 19 to 25 Years | 3,943 (83.3%) | 790 (16.7%) |
| 26 to 34 Years | 5,256 (80.4%) | 1,277 (19.6%) |
| 35 to 44 Years | 5,690 (83.5%) | 1,128 (16.5%) |
| 45 to 54 Years | 6,352 (88.4%) | 833 (11.6%) |
| 55 to 64 Years | 7,086 (91.0%) | 698 (9.0%) |
| 65 to 74 Years | 5,777 (99.7%) | 16 (0.3%) |
| 75 Years and older | 4,055 (100.0%) | 0 (0.0%) |
| Total | 51,945 (90.3%) | 5,557 (9.7%) |
Health Insurance Coverage by Citizenship Status in Coffee County
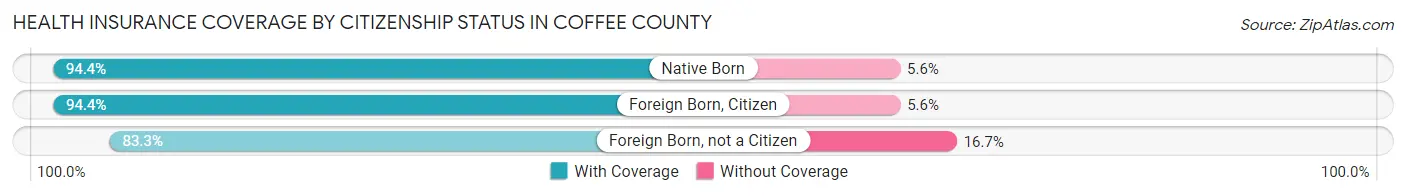
| Citizenship Status | With Coverage | Without Coverage |
| Native Born | 4,297 (94.4%) | 253 (5.6%) |
| Foreign Born, Citizen | 9,489 (94.4%) | 562 (5.6%) |
| Foreign Born, not a Citizen | 3,943 (83.3%) | 790 (16.7%) |
Health Insurance Coverage by Household Income in Coffee County
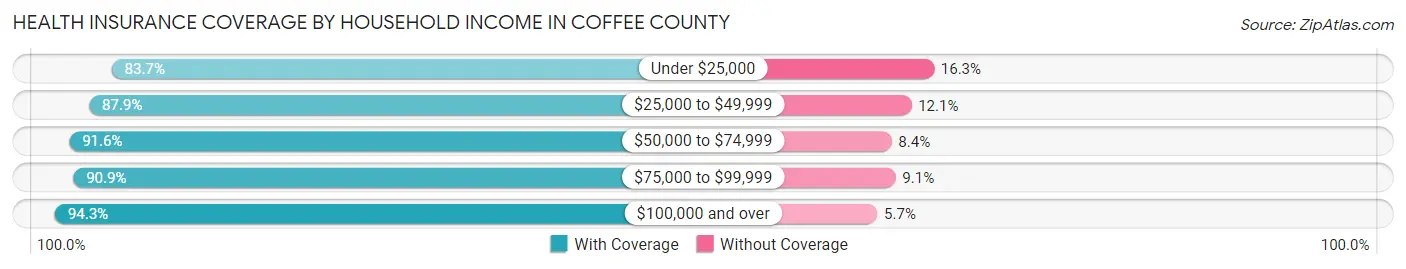
| Household Income | With Coverage | Without Coverage |
| Under $25,000 | 6,640 (83.7%) | 1,294 (16.3%) |
| $25,000 to $49,999 | 11,144 (87.9%) | 1,529 (12.1%) |
| $50,000 to $74,999 | 10,699 (91.6%) | 976 (8.4%) |
| $75,000 to $99,999 | 7,602 (90.9%) | 762 (9.1%) |
| $100,000 and over | 15,766 (94.3%) | 952 (5.7%) |
Public vs Private Health Insurance Coverage by Age in Coffee County
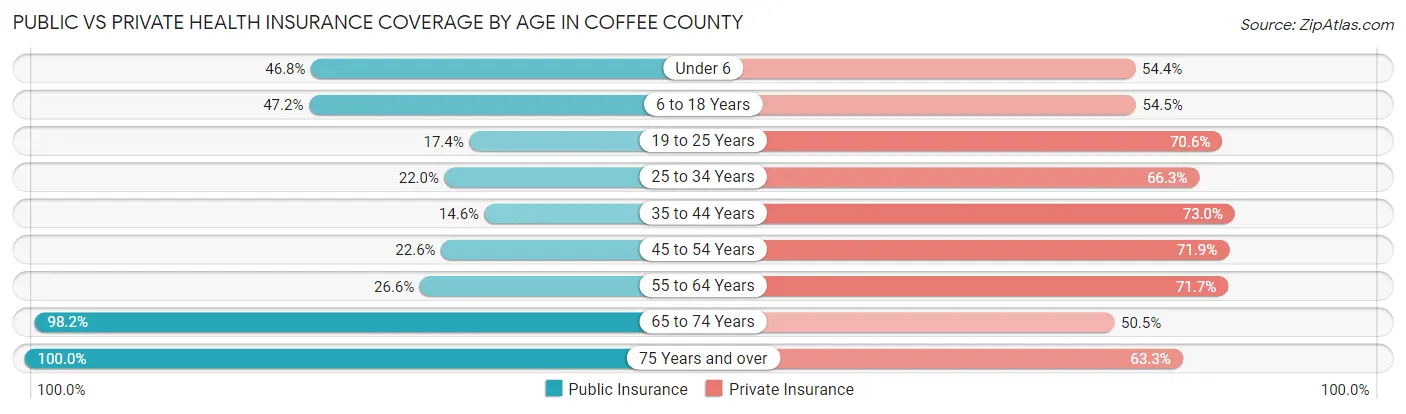
| Age Bracket | Public Insurance | Private Insurance |
| Under 6 | 2,128 (46.8%) | 2,477 (54.4%) |
| 6 to 18 Years | 4,741 (47.2%) | 5,481 (54.5%) |
| 19 to 25 Years | 824 (17.4%) | 3,342 (70.6%) |
| 25 to 34 Years | 1,437 (22.0%) | 4,334 (66.3%) |
| 35 to 44 Years | 993 (14.6%) | 4,974 (73.0%) |
| 45 to 54 Years | 1,626 (22.6%) | 5,163 (71.9%) |
| 55 to 64 Years | 2,070 (26.6%) | 5,580 (71.7%) |
| 65 to 74 Years | 5,686 (98.2%) | 2,928 (50.5%) |
| 75 Years and over | 4,055 (100.0%) | 2,565 (63.3%) |
| Total | 23,560 (41.0%) | 36,844 (64.1%) |
Disability Status by Sex by Age in Coffee County
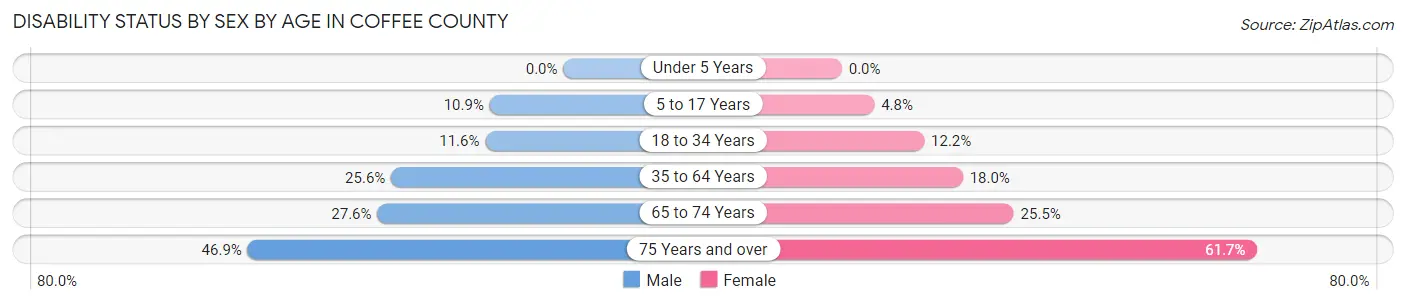
| Age Bracket | Male | Female |
| Under 5 Years | 0 (0.0%) | 0 (0.0%) |
| 5 to 17 Years | 575 (10.9%) | 243 (4.8%) |
| 18 to 34 Years | 697 (11.6%) | 720 (12.2%) |
| 35 to 64 Years | 2,743 (25.6%) | 1,986 (17.9%) |
| 65 to 74 Years | 756 (27.6%) | 780 (25.5%) |
| 75 Years and over | 797 (46.9%) | 1,453 (61.7%) |
Disability Class by Sex by Age in Coffee County
Disability Class: Hearing Difficulty
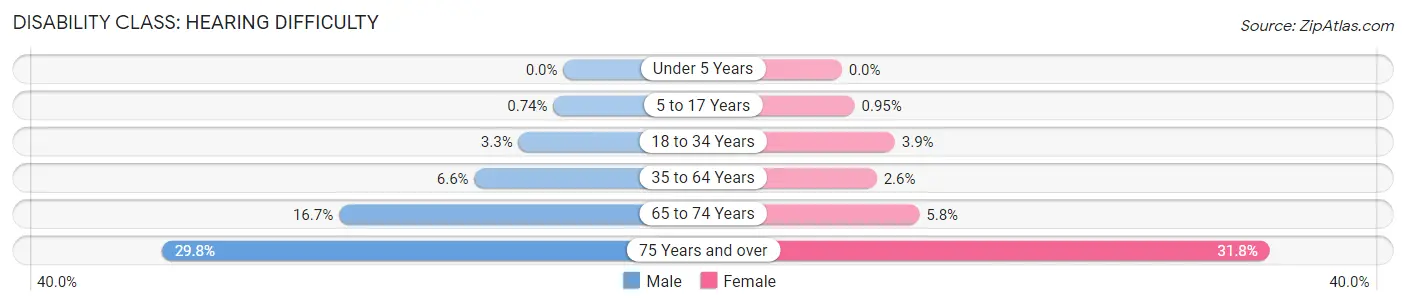
| Age Bracket | Male | Female |
| Under 5 Years | 0 (0.0%) | 0 (0.0%) |
| 5 to 17 Years | 39 (0.7%) | 48 (0.9%) |
| 18 to 34 Years | 200 (3.3%) | 232 (3.9%) |
| 35 to 64 Years | 708 (6.6%) | 287 (2.6%) |
| 65 to 74 Years | 456 (16.7%) | 176 (5.8%) |
| 75 Years and over | 507 (29.8%) | 748 (31.8%) |
Disability Class: Vision Difficulty
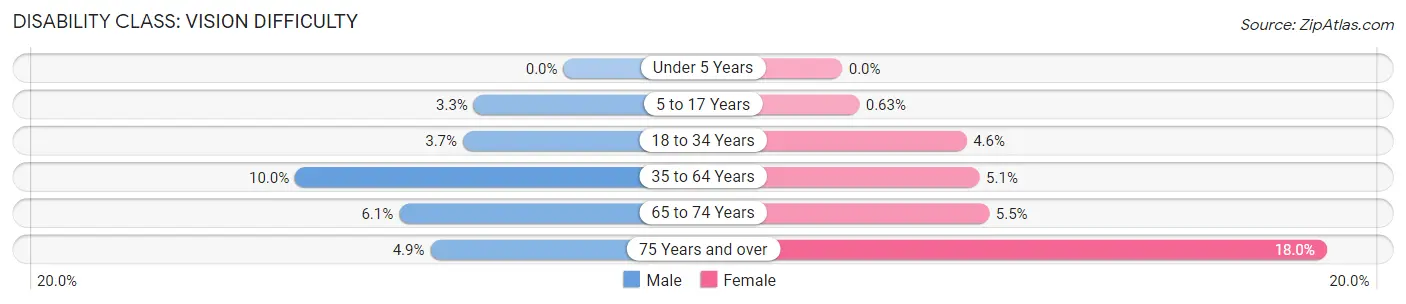
| Age Bracket | Male | Female |
| Under 5 Years | 0 (0.0%) | 0 (0.0%) |
| 5 to 17 Years | 175 (3.3%) | 32 (0.6%) |
| 18 to 34 Years | 224 (3.7%) | 272 (4.6%) |
| 35 to 64 Years | 1,068 (10.0%) | 564 (5.1%) |
| 65 to 74 Years | 167 (6.1%) | 167 (5.5%) |
| 75 Years and over | 84 (4.9%) | 424 (18.0%) |
Disability Class: Cognitive Difficulty
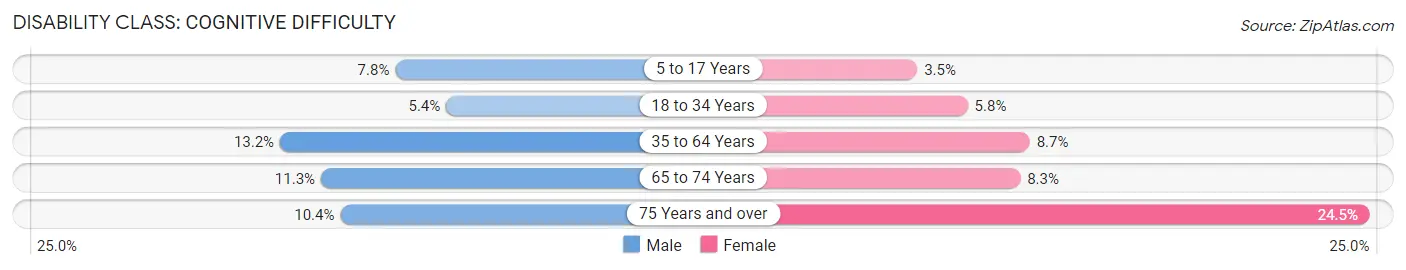
| Age Bracket | Male | Female |
| 5 to 17 Years | 410 (7.8%) | 177 (3.5%) |
| 18 to 34 Years | 327 (5.4%) | 344 (5.8%) |
| 35 to 64 Years | 1,411 (13.2%) | 965 (8.7%) |
| 65 to 74 Years | 308 (11.3%) | 253 (8.3%) |
| 75 Years and over | 176 (10.3%) | 577 (24.5%) |
Disability Class: Ambulatory Difficulty
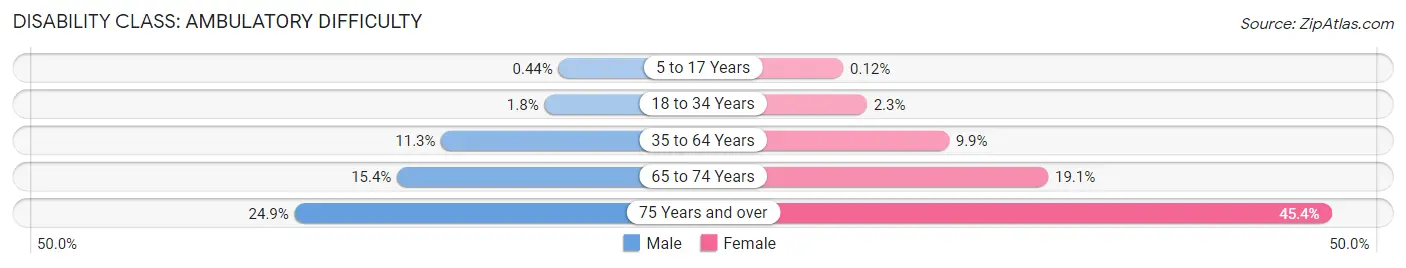
| Age Bracket | Male | Female |
| 5 to 17 Years | 23 (0.4%) | 6 (0.1%) |
| 18 to 34 Years | 105 (1.8%) | 136 (2.3%) |
| 35 to 64 Years | 1,214 (11.3%) | 1,098 (9.9%) |
| 65 to 74 Years | 422 (15.4%) | 585 (19.1%) |
| 75 Years and over | 424 (24.9%) | 1,070 (45.4%) |
Disability Class: Self-Care Difficulty
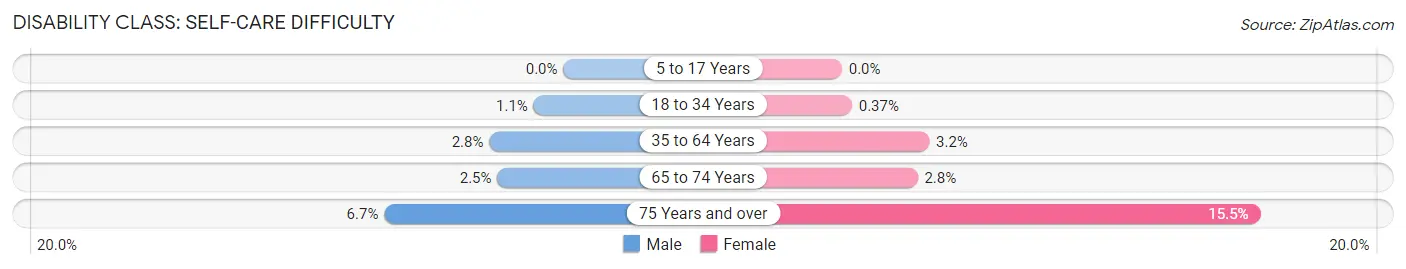
| Age Bracket | Male | Female |
| 5 to 17 Years | 0 (0.0%) | 0 (0.0%) |
| 18 to 34 Years | 66 (1.1%) | 22 (0.4%) |
| 35 to 64 Years | 295 (2.8%) | 358 (3.2%) |
| 65 to 74 Years | 67 (2.5%) | 86 (2.8%) |
| 75 Years and over | 113 (6.7%) | 366 (15.5%) |
Technology Access in Coffee County
Computing Device Access in Coffee County
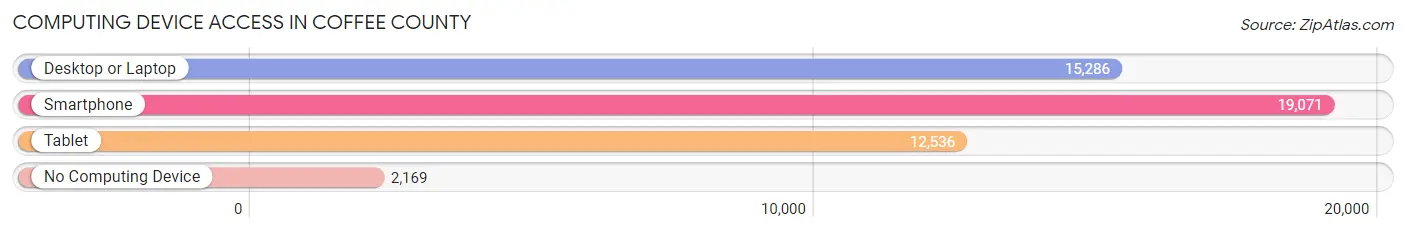
| Device Type | # Households | % Households |
| Desktop or Laptop | 15,286 | 67.4% |
| Smartphone | 19,071 | 84.1% |
| Tablet | 12,536 | 55.2% |
| No Computing Device | 2,169 | 9.6% |
| Total | 22,689 | 100.0% |
Internet Access in Coffee County
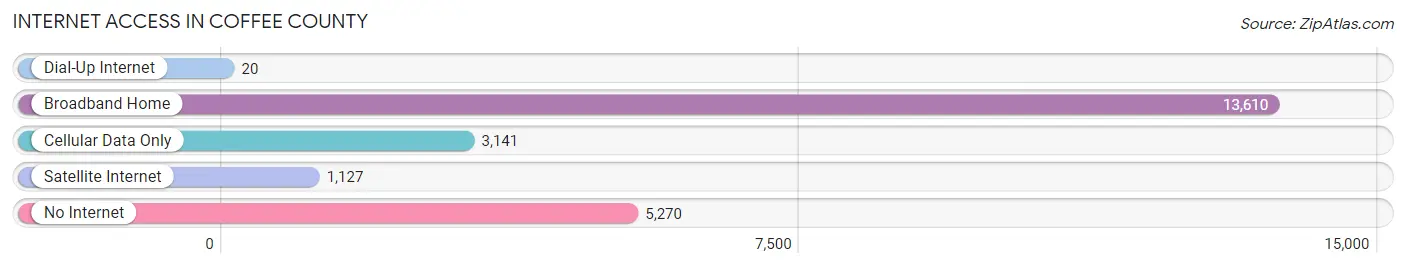
| Internet Type | # Households | % Households |
| Dial-Up Internet | 20 | 0.1% |
| Broadband Home | 13,610 | 60.0% |
| Cellular Data Only | 3,141 | 13.8% |
| Satellite Internet | 1,127 | 5.0% |
| No Internet | 5,270 | 23.2% |
| Total | 22,689 | 100.0% |
Coffee County Summary
Coffee County is located in the southeastern part of Tennessee, and is bordered by Franklin, Moore, Bedford, Warren, Grundy, and Franklin counties. It is part of the Tullahoma-Manchester, TN Metropolitan Statistical Area. The county was created in 1836 from parts of Bedford, Warren, and Franklin counties, and was named for John Coffee, a Revolutionary War hero and early settler of the area. The county seat is Manchester, and the largest city is Tullahoma.
Geography
Coffee County covers an area of 517 square miles, and is located in the Highland Rim region of Tennessee. The county is mostly hilly, with elevations ranging from 800 to 1,000 feet above sea level. The Duck River runs through the county, and is the longest river in the state. The county is also home to several lakes, including Woods Reservoir, Normandy Lake, and Tims Ford Lake.
The climate of Coffee County is humid subtropical, with hot, humid summers and mild winters. The average annual temperature is around 62°F, and the average annual precipitation is around 45 inches.
Economy
The economy of Coffee County is largely based on manufacturing and agriculture. The county is home to several large manufacturing companies, including A.O. Smith, which produces water heaters and boilers, and the Tullahoma-based Arnold Engineering Development Complex, which is the largest complex of flight simulation test facilities in the world.
Agriculture is also an important part of the economy, with the county producing a variety of crops, including corn, soybeans, wheat, hay, and tobacco. Livestock production is also important, with the county producing beef cattle, dairy cattle, hogs, and poultry.
Demographics
As of the 2010 census, Coffee County had a population of 52,796. The racial makeup of the county was 90.2% White, 6.2% African American, 0.7% Native American, 0.5% Asian, 0.2% Pacific Islander, 1.2% from other races, and 1.2% from two or more races. Hispanic or Latino of any race were 2.7% of the population.
The median household income in Coffee County was $41,945, and the median family income was $50,945. The per capita income was $20,945. About 11.2% of the population was below the poverty line.
Education
Coffee County is served by the Coffee County School System, which consists of 15 elementary schools, five middle schools, and four high schools. The county is also home to Motlow State Community College, which is a two-year public college located in Tullahoma.
Common Questions
What is the Total Population of Coffee County?
Total Population of Coffee County is 58,080.
What is the Total Male Population of Coffee County?
Total Male Population of Coffee County is 28,682.
What is the Total Female Population of Coffee County?
Total Female Population of Coffee County is 29,398.
What is the Ratio of Males per 100 Females in Coffee County?
There are 97.56 Males per 100 Females in Coffee County.
What is the Ratio of Females per 100 Males in Coffee County?
There are 102.50 Females per 100 Males in Coffee County.
What is the Median Population Age in Coffee County?
Median Population Age in Coffee County is 39.3 Years.
What is the Average Family Size in Coffee County
Average Family Size in Coffee County is 3.1 People.
What is the Average Household Size in Coffee County
Average Household Size in Coffee County is 2.5 People.
What is Per Capita Income in Coffee County?
Per Capita income in Coffee County is $29,277.
What is the Median Family Income in Coffee County?
Median Family Income in Coffee County is $68,587.
What is the Median Household income in Coffee County?
Median Household Income in Coffee County is $57,424.
What is Income or Wage Gap in Coffee County?
Income or Wage Gap in Coffee County is 32.9%.
Women in Coffee County earn 67.1 cents for every dollar earned by a man.
What is Family Income Deficit in Coffee County?
Family Income Deficit in Coffee County is $9,532.
Families that are below poverty line in Coffee County earn $9,532 less on average than the poverty threshold level.
What is Inequality or Gini Index in Coffee County?
Inequality or Gini Index in Coffee County is 0.43.
How Large is the Labor Force in Coffee County?
There are 27,140 People in the Labor Forcein in Coffee County.
What is the Percentage of People in the Labor Force in Coffee County?
59.2% of People are in the Labor Force in Coffee County.
What is the Unemployment Rate in Coffee County?
Unemployment Rate in Coffee County is 4.6%.